Zip Codes with the Highest Percentage of Population Employed in Agriculture, Fishing & Hunting in Belleville, IL
RELATED REPORTS & OPTIONS
Agriculture, Fishing & Hunting
Belleville
Compare Zip Codes
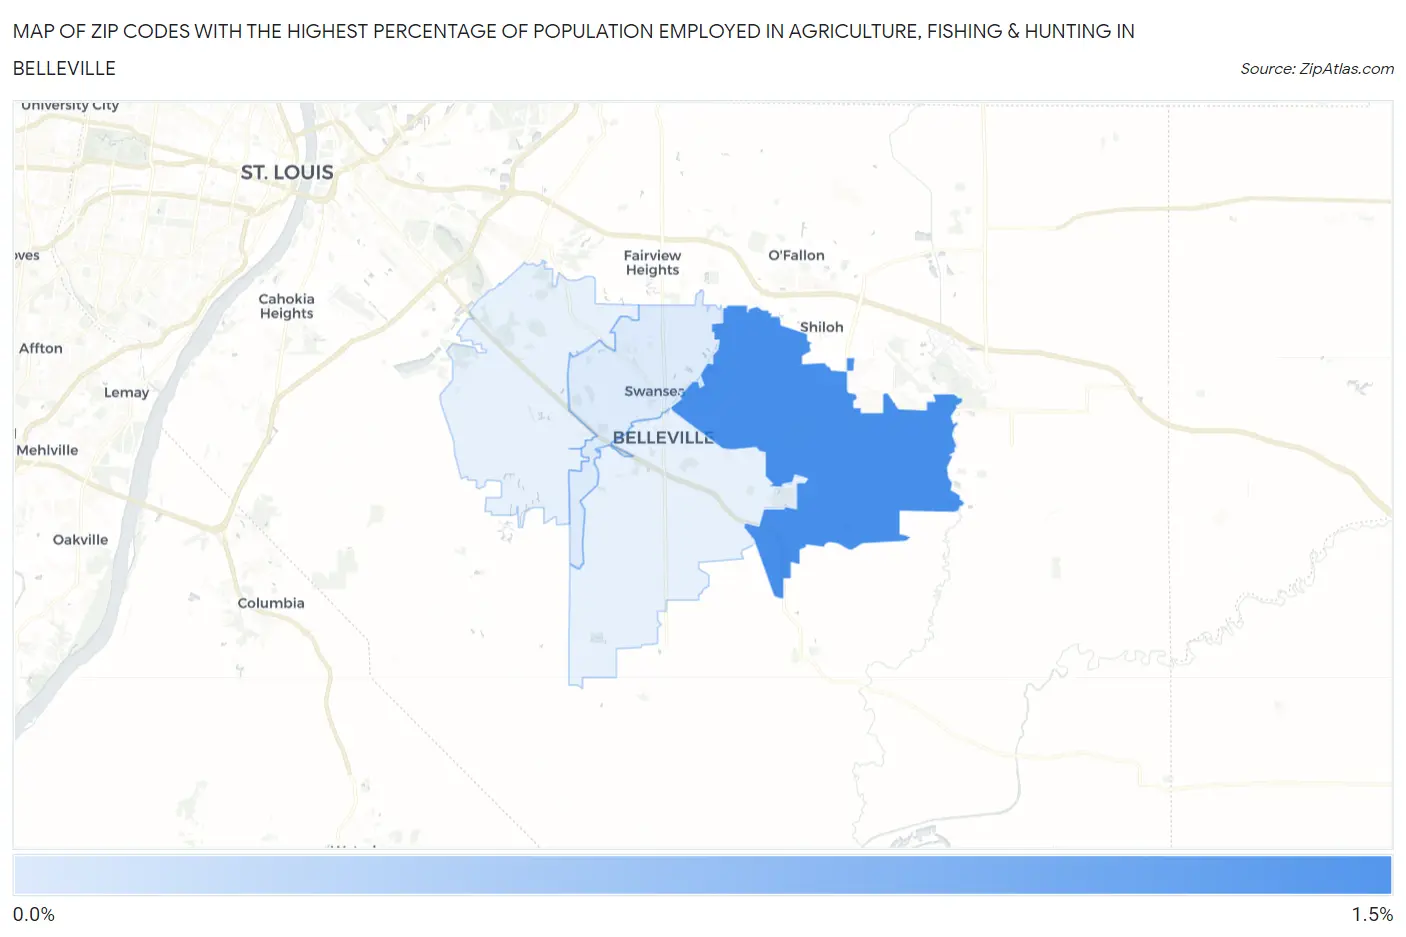
Map of Zip Codes with the Highest Percentage of Population Employed in Agriculture, Fishing & Hunting in Belleville
0.0%
1.5%
Zip Codes with the Highest Percentage of Population Employed in Agriculture, Fishing & Hunting in Belleville, IL
| Zip Code | % Employed | vs State | vs National | |
| 1. | 62221 | 1.4% | 0.88%(+0.571)#757 | 1.2%(+0.249)#14,480 |
| 2. | 62226 | 0.29% | 0.88%(-0.583)#981 | 1.2%(-0.905)#21,232 |
1
Common Questions
What are the Top 3 Zip Codes with the Highest Percentage of Population Employed in Agriculture, Fishing & Hunting in Belleville, IL?
Top 3 Zip Codes with the Highest Percentage of Population Employed in Agriculture, Fishing & Hunting in Belleville, IL are:
What zip code has the Highest Percentage of Population Employed in Agriculture, Fishing & Hunting in Belleville, IL?
62221 has the Highest Percentage of Population Employed in Agriculture, Fishing & Hunting in Belleville, IL with 1.4%.
What is the Percentage of Population Employed in Agriculture, Fishing & Hunting in Belleville, IL?
Percentage of Population Employed in Agriculture, Fishing & Hunting in Belleville is 0.24%.
What is the Percentage of Population Employed in Agriculture, Fishing & Hunting in Illinois?
Percentage of Population Employed in Agriculture, Fishing & Hunting in Illinois is 0.88%.
What is the Percentage of Population Employed in Agriculture, Fishing & Hunting in the United States?
Percentage of Population Employed in Agriculture, Fishing & Hunting in the United States is 1.2%.