Zip Codes with the Highest Percentage of Population Employed in Professional & Scientific Services in Nampa, ID
RELATED REPORTS & OPTIONS
Professional & Scientific Services
Nampa
Compare Zip Codes
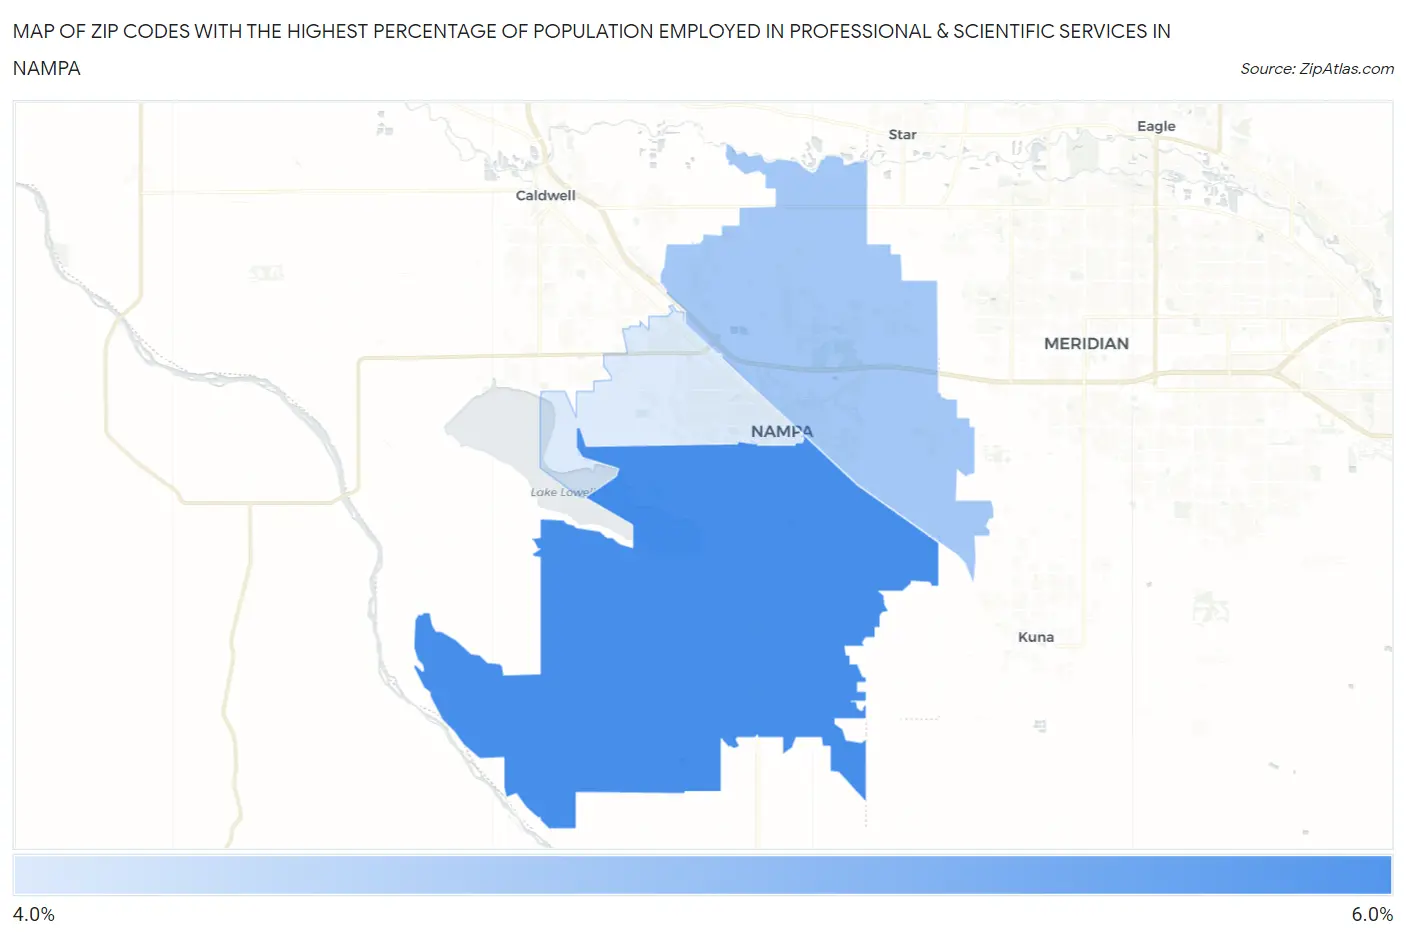
Map of Zip Codes with the Highest Percentage of Population Employed in Professional & Scientific Services in Nampa
0.0%
6.0%
Zip Codes with the Highest Percentage of Population Employed in Professional & Scientific Services in Nampa, ID
| Zip Code | % Employed | vs State | vs National | |
| 1. | 83686 | 5.2% | 6.2%(-1.07)#92 | 7.8%(-2.68)#11,902 |
| 2. | 83687 | 4.8% | 6.2%(-1.46)#102 | 7.8%(-3.07)#12,893 |
| 3. | 83651 | 4.5% | 6.2%(-1.71)#110 | 7.8%(-3.32)#13,584 |
1
Common Questions
What are the Top Zip Codes with the Highest Percentage of Population Employed in Professional & Scientific Services in Nampa, ID?
Top Zip Codes with the Highest Percentage of Population Employed in Professional & Scientific Services in Nampa, ID are:
What zip code has the Highest Percentage of Population Employed in Professional & Scientific Services in Nampa, ID?
83686 has the Highest Percentage of Population Employed in Professional & Scientific Services in Nampa, ID with 5.2%.
What is the Percentage of Population Employed in Professional & Scientific Services in Nampa, ID?
Percentage of Population Employed in Professional & Scientific Services in Nampa is 3.7%.
What is the Percentage of Population Employed in Professional & Scientific Services in Idaho?
Percentage of Population Employed in Professional & Scientific Services in Idaho is 6.2%.
What is the Percentage of Population Employed in Professional & Scientific Services in the United States?
Percentage of Population Employed in Professional & Scientific Services in the United States is 7.8%.