Zip Codes with the Highest Percentage of Population Employed in Agriculture, Fishing & Hunting in Nampa, ID
RELATED REPORTS & OPTIONS
Agriculture, Fishing & Hunting
Nampa
Compare Zip Codes
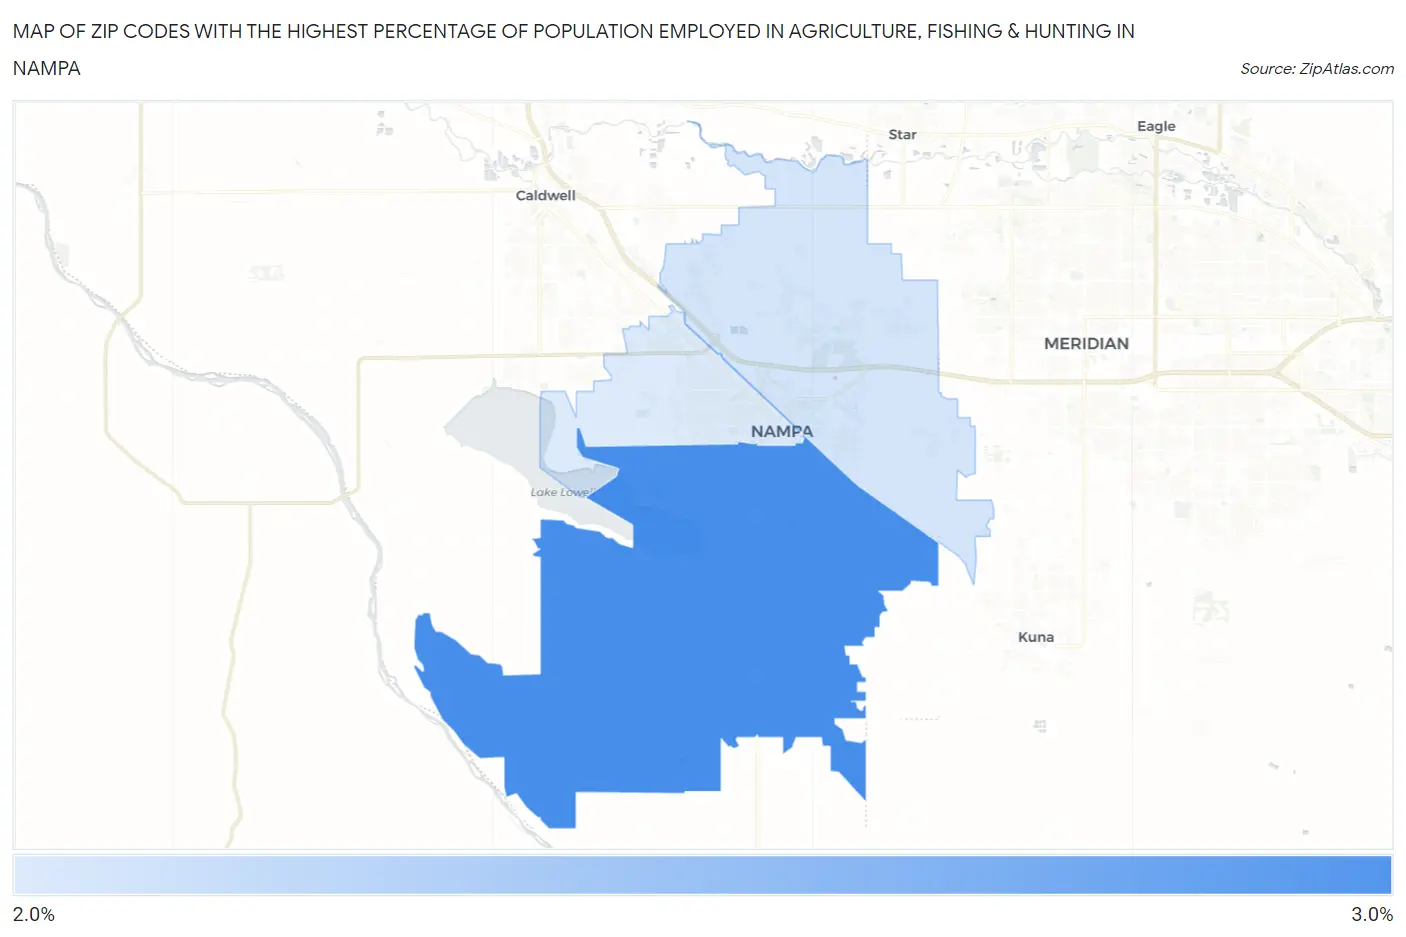
Map of Zip Codes with the Highest Percentage of Population Employed in Agriculture, Fishing & Hunting in Nampa
0.0%
3.0%
Zip Codes with the Highest Percentage of Population Employed in Agriculture, Fishing & Hunting in Nampa, ID
| Zip Code | % Employed | vs State | vs National | |
| 1. | 83686 | 2.7% | 3.9%(-1.24)#173 | 1.2%(+1.46)#11,213 |
| 2. | 83687 | 2.5% | 3.9%(-1.45)#177 | 1.2%(+1.26)#11,659 |
| 3. | 83651 | 2.4% | 3.9%(-1.47)#178 | 1.2%(+1.24)#11,697 |
1
Common Questions
What are the Top Zip Codes with the Highest Percentage of Population Employed in Agriculture, Fishing & Hunting in Nampa, ID?
Top Zip Codes with the Highest Percentage of Population Employed in Agriculture, Fishing & Hunting in Nampa, ID are:
What zip code has the Highest Percentage of Population Employed in Agriculture, Fishing & Hunting in Nampa, ID?
83686 has the Highest Percentage of Population Employed in Agriculture, Fishing & Hunting in Nampa, ID with 2.7%.
What is the Percentage of Population Employed in Agriculture, Fishing & Hunting in Nampa, ID?
Percentage of Population Employed in Agriculture, Fishing & Hunting in Nampa is 2.0%.
What is the Percentage of Population Employed in Agriculture, Fishing & Hunting in Idaho?
Percentage of Population Employed in Agriculture, Fishing & Hunting in Idaho is 3.9%.
What is the Percentage of Population Employed in Agriculture, Fishing & Hunting in the United States?
Percentage of Population Employed in Agriculture, Fishing & Hunting in the United States is 1.2%.