Williamsburg, IA Map & Demographics
Williamsburg Map
Williamsburg Overview
$45,923
PER CAPITA INCOME
$105,964
AVG FAMILY INCOME
$78,861
AVG HOUSEHOLD INCOME
30.1%
WAGE / INCOME GAP [ % ]
69.9¢/ $1
WAGE / INCOME GAP [ $ ]
0.46
INEQUALITY / GINI INDEX
3,332
TOTAL POPULATION
1,684
MALE POPULATION
1,648
FEMALE POPULATION
102.18
MALES / 100 FEMALES
97.86
FEMALES / 100 MALES
37.8
MEDIAN AGE
2.9
AVG FAMILY SIZE
2.2
AVG HOUSEHOLD SIZE
2,015
LABOR FORCE [ PEOPLE ]
76.4%
PERCENT IN LABOR FORCE
5.4%
UNEMPLOYMENT RATE
Williamsburg Zip Codes
Williamsburg Area Codes
Income in Williamsburg
Income Overview in Williamsburg
Per Capita Income in Williamsburg is $45,923, while median incomes of families and households are $105,964 and $78,861 respectively.
| Characteristic | Number | Measure |
| Per Capita Income | 3,332 | $45,923 |
| Median Family Income | 833 | $105,964 |
| Mean Family Income | 833 | $145,071 |
| Median Household Income | 1,475 | $78,861 |
| Mean Household Income | 1,475 | $106,255 |
| Income Deficit | 833 | $0 |
| Wage / Income Gap (%) | 3,332 | 30.10% |
| Wage / Income Gap ($) | 3,332 | 69.90¢ per $1 |
| Gini / Inequality Index | 3,332 | 0.46 |
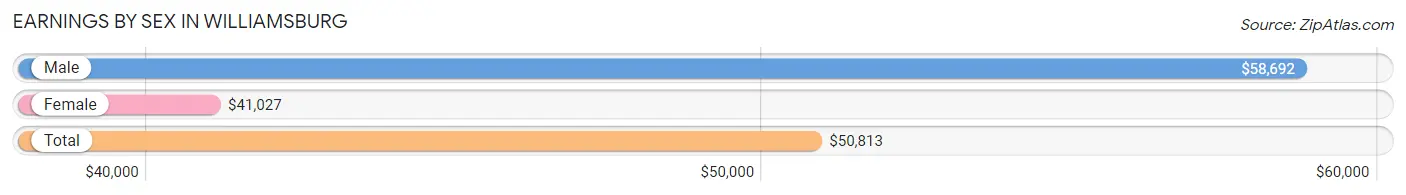
Earnings by Sex in Williamsburg
Average Earnings in Williamsburg are $50,813, $58,692 for men and $41,027 for women, a difference of 30.1%.
| Sex | Number | Average Earnings |
| Male | 1,118 (54.1%) | $58,692 |
| Female | 949 (45.9%) | $41,027 |
| Total | 2,067 (100.0%) | $50,813 |
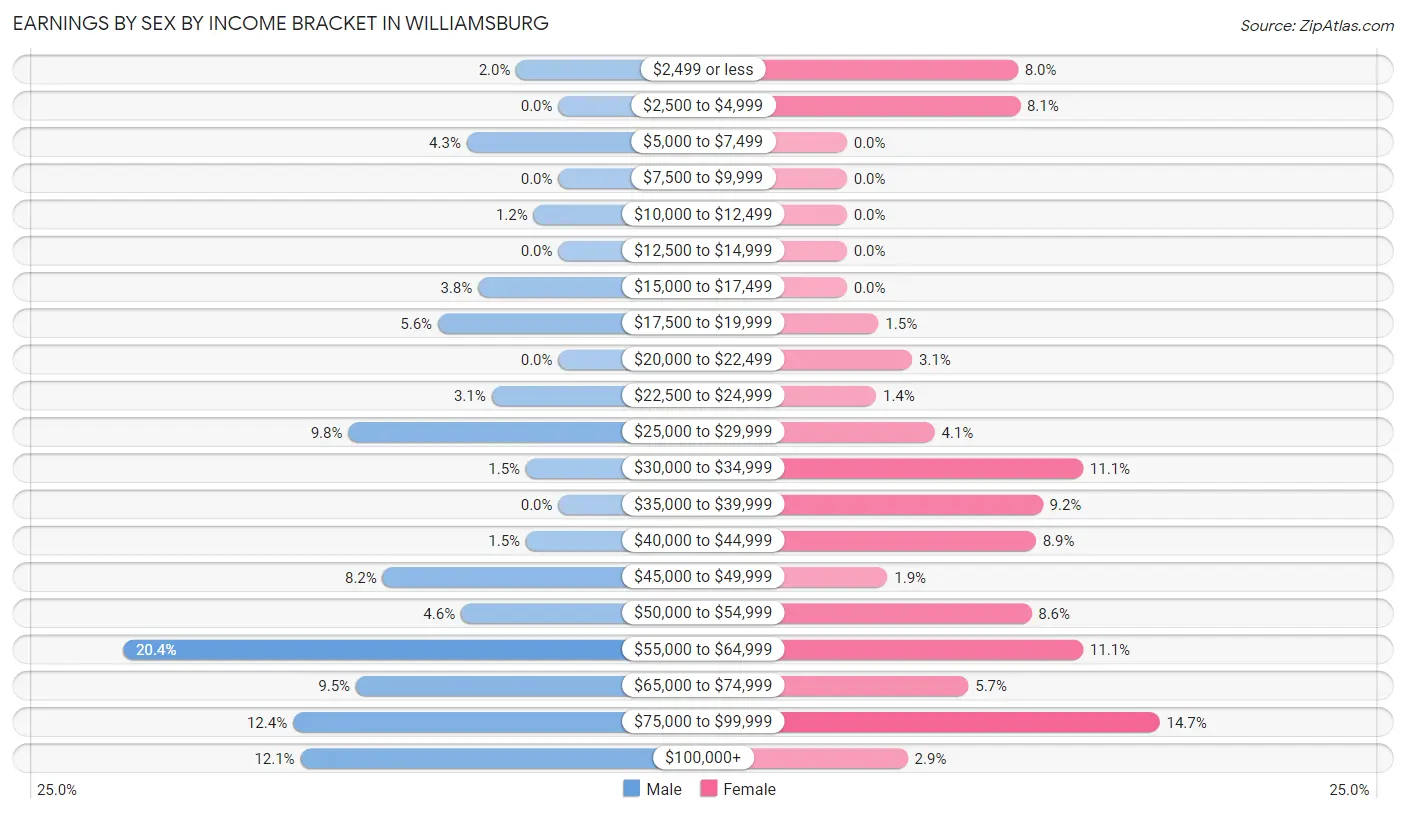
Earnings by Sex by Income Bracket in Williamsburg
The most common earnings brackets in Williamsburg are $55,000 to $64,999 for men (228 | 20.4%) and $75,000 to $99,999 for women (139 | 14.6%).
| Income | Male | Female |
| $2,499 or less | 22 (2.0%) | 76 (8.0%) |
| $2,500 to $4,999 | 0 (0.0%) | 77 (8.1%) |
| $5,000 to $7,499 | 48 (4.3%) | 0 (0.0%) |
| $7,500 to $9,999 | 0 (0.0%) | 0 (0.0%) |
| $10,000 to $12,499 | 13 (1.2%) | 0 (0.0%) |
| $12,500 to $14,999 | 0 (0.0%) | 0 (0.0%) |
| $15,000 to $17,499 | 42 (3.8%) | 0 (0.0%) |
| $17,500 to $19,999 | 63 (5.6%) | 14 (1.5%) |
| $20,000 to $22,499 | 0 (0.0%) | 29 (3.1%) |
| $22,500 to $24,999 | 35 (3.1%) | 13 (1.4%) |
| $25,000 to $29,999 | 110 (9.8%) | 39 (4.1%) |
| $30,000 to $34,999 | 17 (1.5%) | 105 (11.1%) |
| $35,000 to $39,999 | 0 (0.0%) | 87 (9.2%) |
| $40,000 to $44,999 | 17 (1.5%) | 84 (8.8%) |
| $45,000 to $49,999 | 92 (8.2%) | 18 (1.9%) |
| $50,000 to $54,999 | 51 (4.6%) | 82 (8.6%) |
| $55,000 to $64,999 | 228 (20.4%) | 105 (11.1%) |
| $65,000 to $74,999 | 106 (9.5%) | 54 (5.7%) |
| $75,000 to $99,999 | 139 (12.4%) | 139 (14.6%) |
| $100,000+ | 135 (12.1%) | 27 (2.9%) |
| Total | 1,118 (100.0%) | 949 (100.0%) |
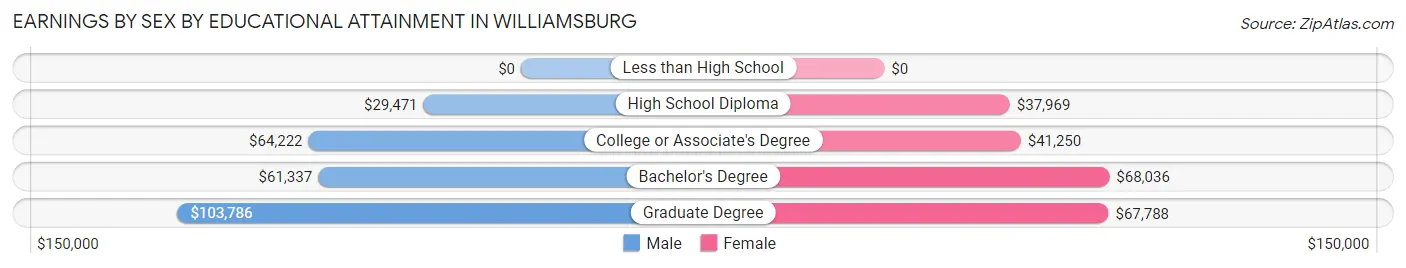
Earnings by Sex by Educational Attainment in Williamsburg
Average earnings in Williamsburg are $60,576 for men and $52,500 for women, a difference of 13.3%. Men with an educational attainment of graduate degree enjoy the highest average annual earnings of $103,786, while those with high school diploma education earn the least with $29,471. Women with an educational attainment of bachelor's degree earn the most with the average annual earnings of $68,036, while those with high school diploma education have the smallest earnings of $37,969.
| Educational Attainment | Male Income | Female Income |
| Less than High School | - | - |
| High School Diploma | $29,471 | $37,969 |
| College or Associate's Degree | $64,222 | $41,250 |
| Bachelor's Degree | $61,337 | $68,036 |
| Graduate Degree | $103,786 | $67,788 |
| Total | $60,576 | $52,500 |
Family Income in Williamsburg
Family Income Brackets in Williamsburg
According to the Williamsburg family income data, there are 236 families falling into the $100,000 to $149,999 income range, which is the most common income bracket and makes up 28.3% of all families.
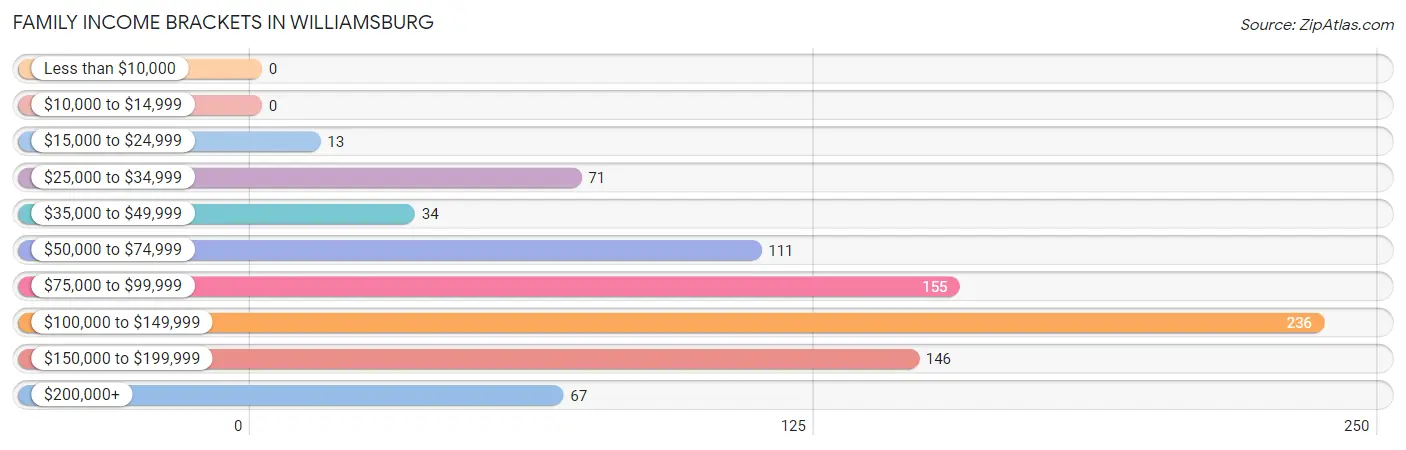
| Income Bracket | # Families | % Families |
| Less than $10,000 | 0 | 0.0% |
| $10,000 to $14,999 | 0 | 0.0% |
| $15,000 to $24,999 | 13 | 1.6% |
| $25,000 to $34,999 | 71 | 8.5% |
| $35,000 to $49,999 | 34 | 4.1% |
| $50,000 to $74,999 | 111 | 13.3% |
| $75,000 to $99,999 | 155 | 18.6% |
| $100,000 to $149,999 | 236 | 28.3% |
| $150,000 to $199,999 | 146 | 17.5% |
| $200,000+ | 67 | 8.0% |
Family Income by Famaliy Size in Williamsburg
4-person families (216 | 25.9%) account for the highest median family income in Williamsburg with $168,182 per family, while 2-person families (336 | 40.3%) have the highest median income of $49,532 per family member.
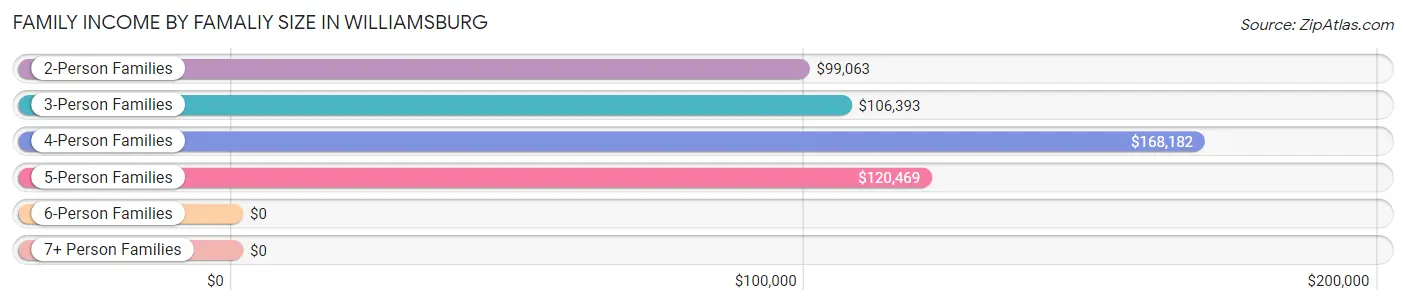
| Income Bracket | # Families | Median Income |
| 2-Person Families | 336 (40.3%) | $99,063 |
| 3-Person Families | 189 (22.7%) | $106,393 |
| 4-Person Families | 216 (25.9%) | $168,182 |
| 5-Person Families | 79 (9.5%) | $120,469 |
| 6-Person Families | 0 (0.0%) | $0 |
| 7+ Person Families | 13 (1.6%) | $0 |
| Total | 833 (100.0%) | $105,964 |
Family Income by Number of Earners in Williamsburg
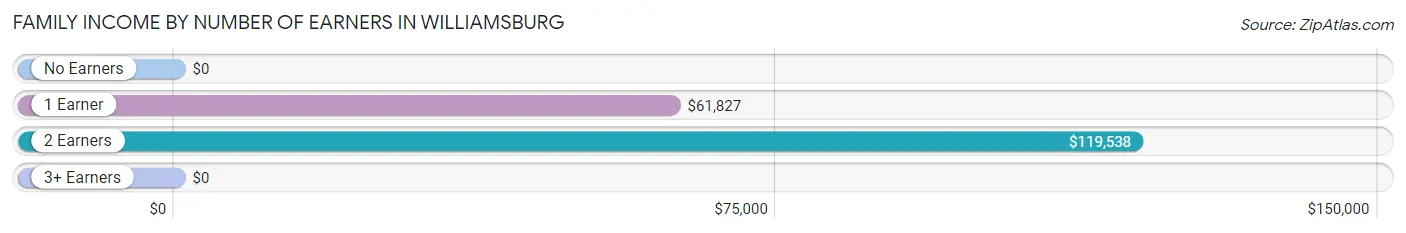
| Number of Earners | # Families | Median Income |
| No Earners | 69 (8.3%) | $0 |
| 1 Earner | 191 (22.9%) | $61,827 |
| 2 Earners | 476 (57.1%) | $119,538 |
| 3+ Earners | 97 (11.6%) | $0 |
| Total | 833 (100.0%) | $105,964 |
Household Income in Williamsburg
Household Income Brackets in Williamsburg
With 291 households falling in the category, the $100,000 to $149,999 income range is the most frequent in Williamsburg, accounting for 19.7% of all households. In contrast, only 24 households (1.6%) fall into the $10,000 to $14,999 income bracket, making it the least populous group.
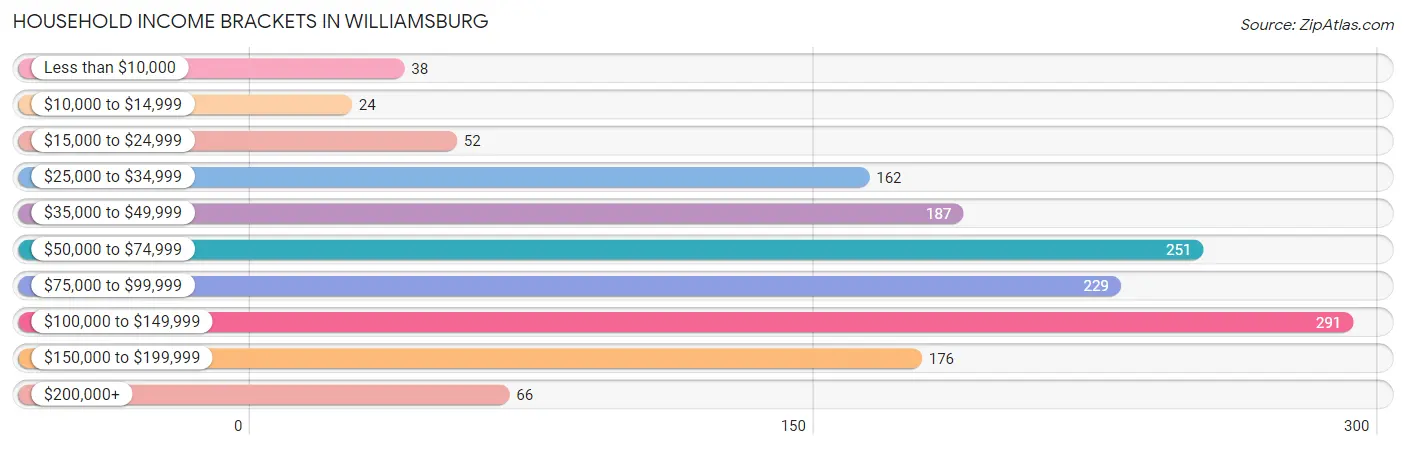
| Income Bracket | # Households | % Households |
| Less than $10,000 | 38 | 2.6% |
| $10,000 to $14,999 | 24 | 1.6% |
| $15,000 to $24,999 | 52 | 3.5% |
| $25,000 to $34,999 | 162 | 11.0% |
| $35,000 to $49,999 | 187 | 12.7% |
| $50,000 to $74,999 | 251 | 17.0% |
| $75,000 to $99,999 | 229 | 15.5% |
| $100,000 to $149,999 | 291 | 19.7% |
| $150,000 to $199,999 | 176 | 11.9% |
| $200,000+ | 66 | 4.5% |
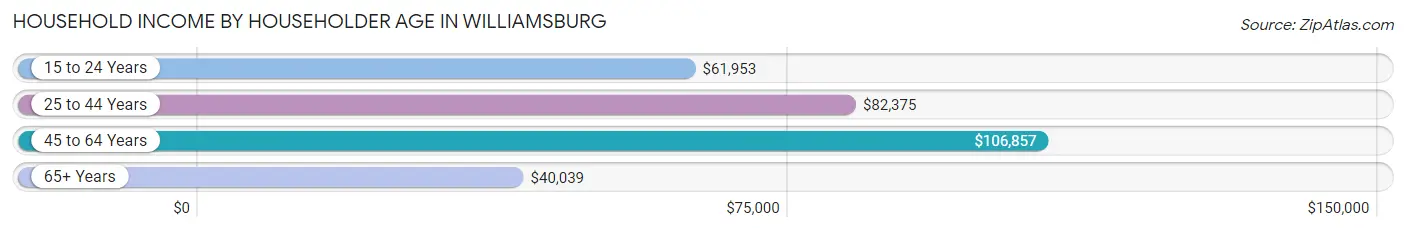
Household Income by Householder Age in Williamsburg
The median household income in Williamsburg is $78,861, with the highest median household income of $106,857 found in the 45 to 64 years age bracket for the primary householder. A total of 588 households (39.9%) fall into this category. Meanwhile, the 65+ years age bracket for the primary householder has the lowest median household income of $40,039, with 255 households (17.3%) in this group.
| Income Bracket | # Households | Median Income |
| 15 to 24 Years | 157 (10.6%) | $61,953 |
| 25 to 44 Years | 475 (32.2%) | $82,375 |
| 45 to 64 Years | 588 (39.9%) | $106,857 |
| 65+ Years | 255 (17.3%) | $40,039 |
| Total | 1,475 (100.0%) | $78,861 |
Poverty in Williamsburg
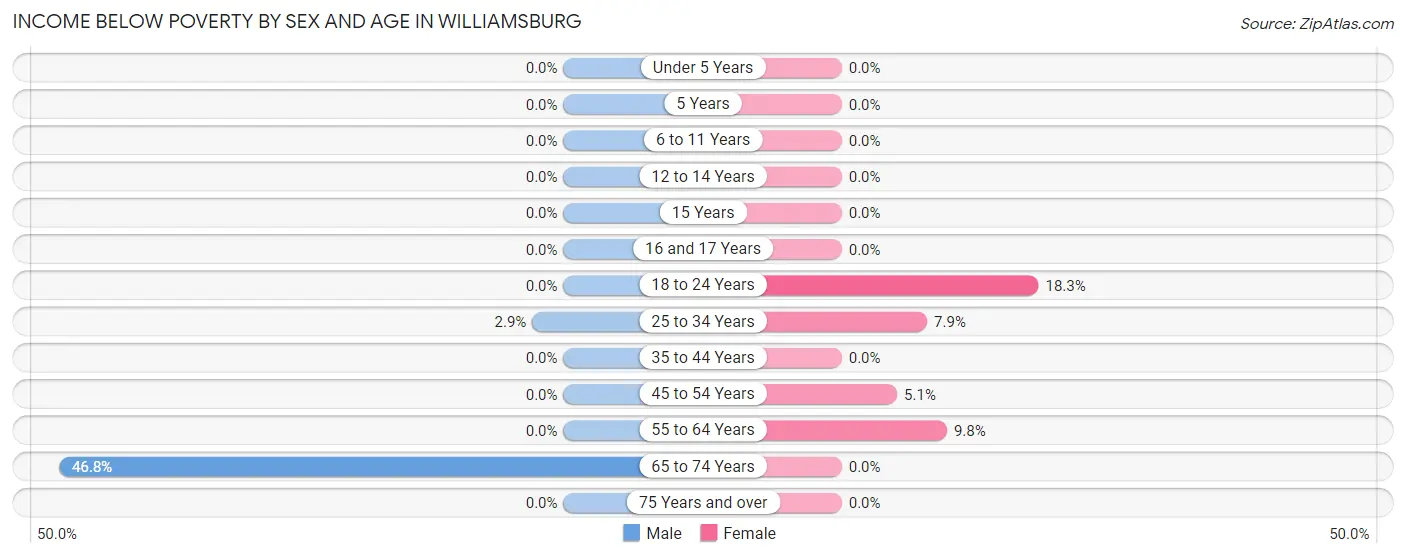
Income Below Poverty by Sex and Age in Williamsburg
With 1.8% poverty level for males and 5.4% for females among the residents of Williamsburg, 65 to 74 year old males and 18 to 24 year old females are the most vulnerable to poverty, with 22 males (46.8%) and 44 females (18.3%) in their respective age groups living below the poverty level.
| Age Bracket | Male | Female |
| Under 5 Years | 0 (0.0%) | 0 (0.0%) |
| 5 Years | 0 (0.0%) | 0 (0.0%) |
| 6 to 11 Years | 0 (0.0%) | 0 (0.0%) |
| 12 to 14 Years | 0 (0.0%) | 0 (0.0%) |
| 15 Years | 0 (0.0%) | 0 (0.0%) |
| 16 and 17 Years | 0 (0.0%) | 0 (0.0%) |
| 18 to 24 Years | 0 (0.0%) | 44 (18.3%) |
| 25 to 34 Years | 8 (2.9%) | 16 (7.9%) |
| 35 to 44 Years | 0 (0.0%) | 0 (0.0%) |
| 45 to 54 Years | 0 (0.0%) | 11 (5.1%) |
| 55 to 64 Years | 0 (0.0%) | 16 (9.8%) |
| 65 to 74 Years | 22 (46.8%) | 0 (0.0%) |
| 75 Years and over | 0 (0.0%) | 0 (0.0%) |
| Total | 30 (1.8%) | 87 (5.4%) |
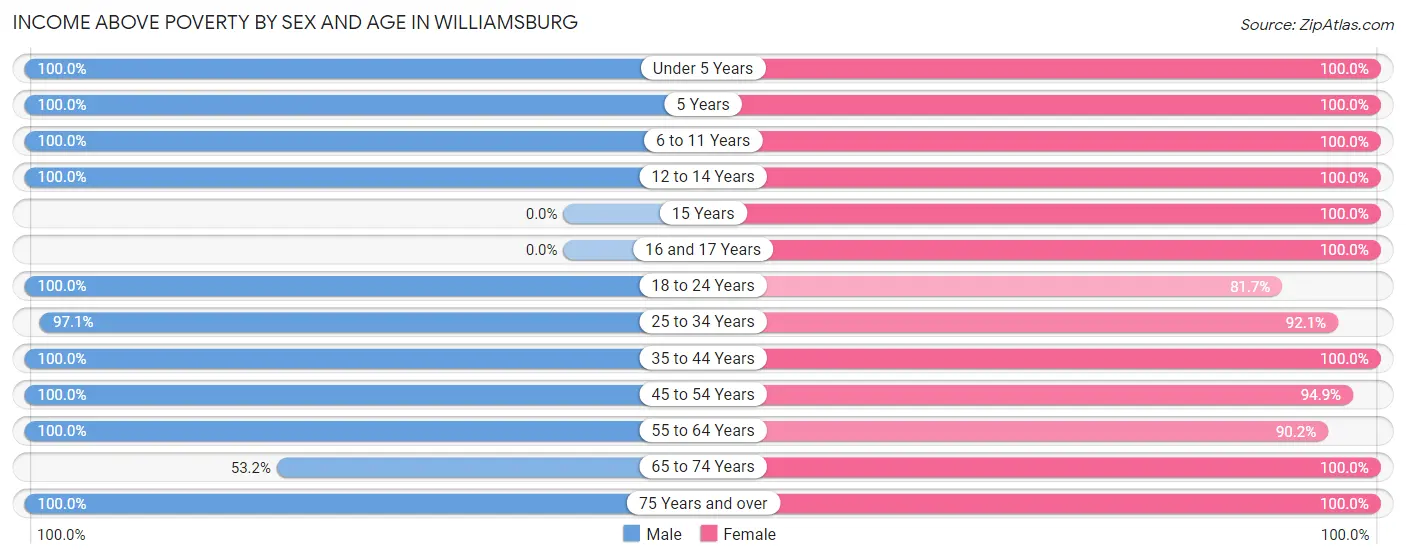
Income Above Poverty by Sex and Age in Williamsburg
According to the poverty statistics in Williamsburg, males aged under 5 years and females aged under 5 years are the age groups that are most secure financially, with 100.0% of males and 100.0% of females in these age groups living above the poverty line.
| Age Bracket | Male | Female |
| Under 5 Years | 107 (100.0%) | 61 (100.0%) |
| 5 Years | 46 (100.0%) | 12 (100.0%) |
| 6 to 11 Years | 157 (100.0%) | 111 (100.0%) |
| 12 to 14 Years | 86 (100.0%) | 62 (100.0%) |
| 15 Years | 0 (0.0%) | 52 (100.0%) |
| 16 and 17 Years | 0 (0.0%) | 68 (100.0%) |
| 18 to 24 Years | 131 (100.0%) | 197 (81.7%) |
| 25 to 34 Years | 269 (97.1%) | 186 (92.1%) |
| 35 to 44 Years | 184 (100.0%) | 174 (100.0%) |
| 45 to 54 Years | 338 (100.0%) | 203 (94.9%) |
| 55 to 64 Years | 231 (100.0%) | 148 (90.2%) |
| 65 to 74 Years | 25 (53.2%) | 95 (100.0%) |
| 75 Years and over | 67 (100.0%) | 150 (100.0%) |
| Total | 1,641 (98.2%) | 1,519 (94.6%) |
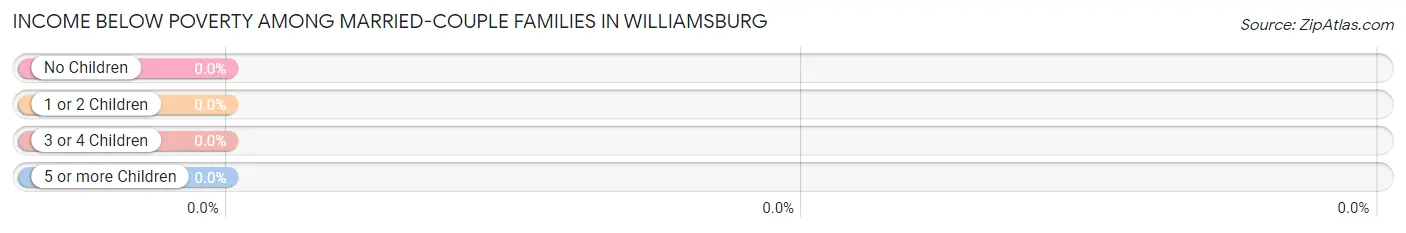
Income Below Poverty Among Married-Couple Families in Williamsburg
| Children | Above Poverty | Below Poverty |
| No Children | 346 (100.0%) | 0 (0.0%) |
| 1 or 2 Children | 207 (100.0%) | 0 (0.0%) |
| 3 or 4 Children | 41 (100.0%) | 0 (0.0%) |
| 5 or more Children | 13 (100.0%) | 0 (0.0%) |
| Total | 607 (100.0%) | 0 (0.0%) |
Income Below Poverty Among Single-Parent Households in Williamsburg
| Children | Single Father | Single Mother |
| No Children | 0 (0.0%) | 0 (0.0%) |
| 1 or 2 Children | 0 (0.0%) | 0 (0.0%) |
| 3 or 4 Children | 0 (0.0%) | 0 (0.0%) |
| 5 or more Children | 0 (0.0%) | 0 (0.0%) |
| Total | 0 (0.0%) | 0 (0.0%) |
Income Below Poverty Among Married-Couple vs Single-Parent Households in Williamsburg
| Children | Married-Couple Families | Single-Parent Households |
| No Children | 0 (0.0%) | 0 (0.0%) |
| 1 or 2 Children | 0 (0.0%) | 0 (0.0%) |
| 3 or 4 Children | 0 (0.0%) | 0 (0.0%) |
| 5 or more Children | 0 (0.0%) | 0 (0.0%) |
| Total | 0 (0.0%) | 0 (0.0%) |
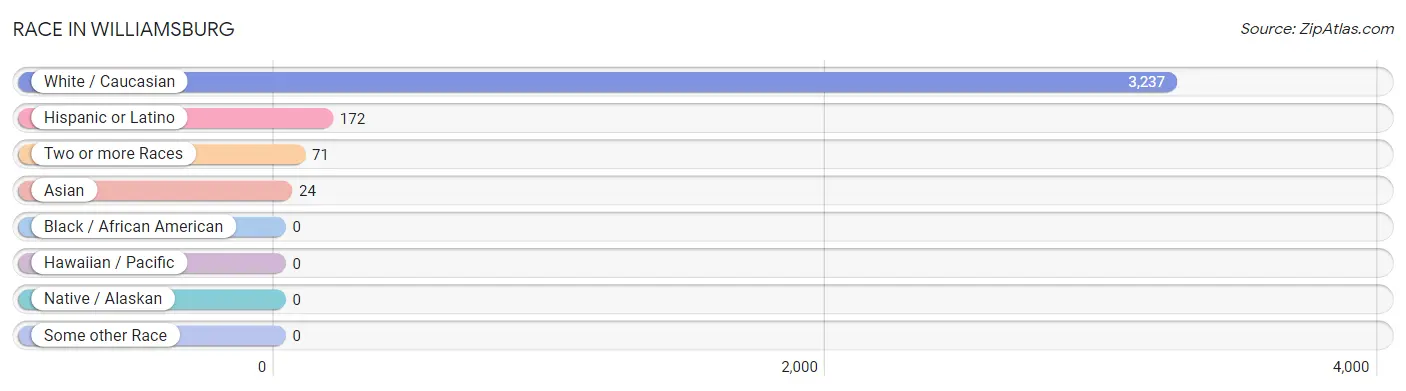
Race in Williamsburg
The most populous races in Williamsburg are White / Caucasian (3,237 | 97.2%), Hispanic or Latino (172 | 5.2%), and Two or more Races (71 | 2.1%).
| Race | # Population | % Population |
| Asian | 24 | 0.7% |
| Black / African American | 0 | 0.0% |
| Hawaiian / Pacific | 0 | 0.0% |
| Hispanic or Latino | 172 | 5.2% |
| Native / Alaskan | 0 | 0.0% |
| White / Caucasian | 3,237 | 97.2% |
| Two or more Races | 71 | 2.1% |
| Some other Race | 0 | 0.0% |
| Total | 3,332 | 100.0% |
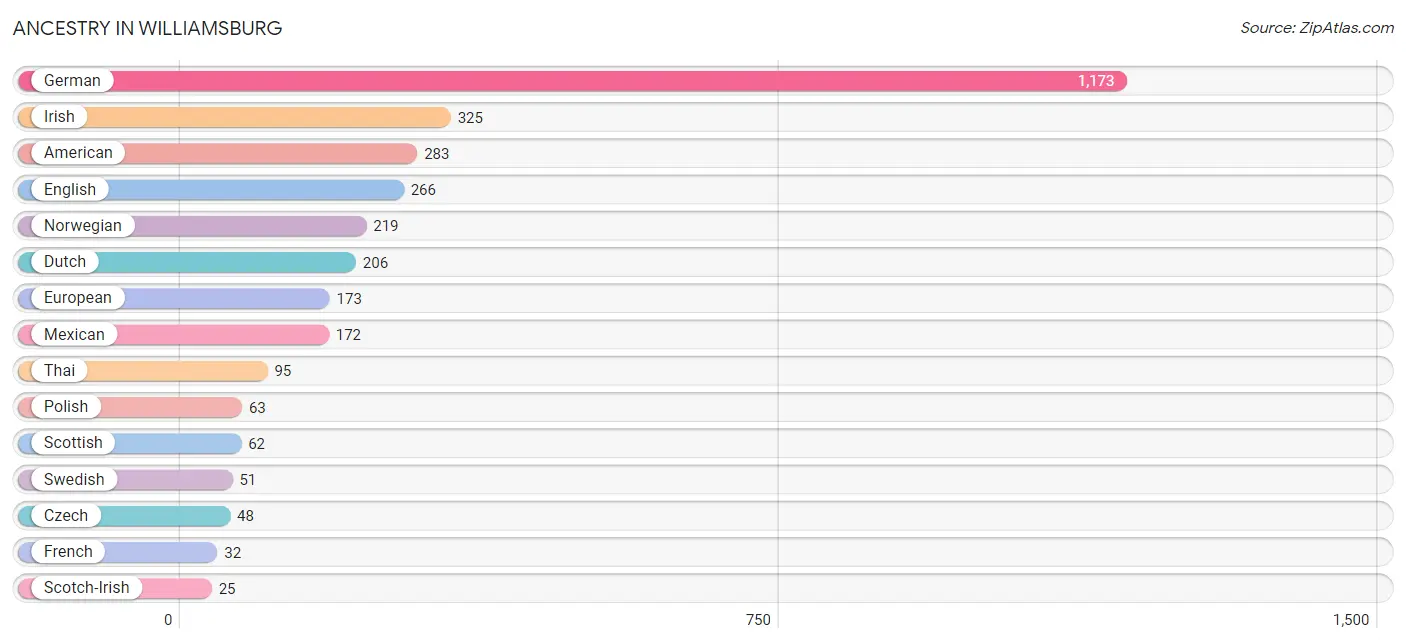
Ancestry in Williamsburg
The most populous ancestries reported in Williamsburg are German (1,173 | 35.2%), Irish (325 | 9.8%), American (283 | 8.5%), English (266 | 8.0%), and Norwegian (219 | 6.6%), together accounting for 68.0% of all Williamsburg residents.
| Ancestry | # Population | % Population |
| American | 283 | 8.5% |
| Austrian | 16 | 0.5% |
| Czech | 48 | 1.4% |
| Czechoslovakian | 18 | 0.5% |
| Danish | 7 | 0.2% |
| Dutch | 206 | 6.2% |
| Eastern European | 22 | 0.7% |
| English | 266 | 8.0% |
| European | 173 | 5.2% |
| French | 32 | 1.0% |
| German | 1,173 | 35.2% |
| Irish | 325 | 9.8% |
| Mexican | 172 | 5.2% |
| Norwegian | 219 | 6.6% |
| Polish | 63 | 1.9% |
| Scandinavian | 9 | 0.3% |
| Scotch-Irish | 25 | 0.7% |
| Scottish | 62 | 1.9% |
| Swedish | 51 | 1.5% |
| Swiss | 11 | 0.3% |
| Thai | 95 | 2.9% |
| Welsh | 24 | 0.7% | View All 22 Rows |
Immigrants in Williamsburg
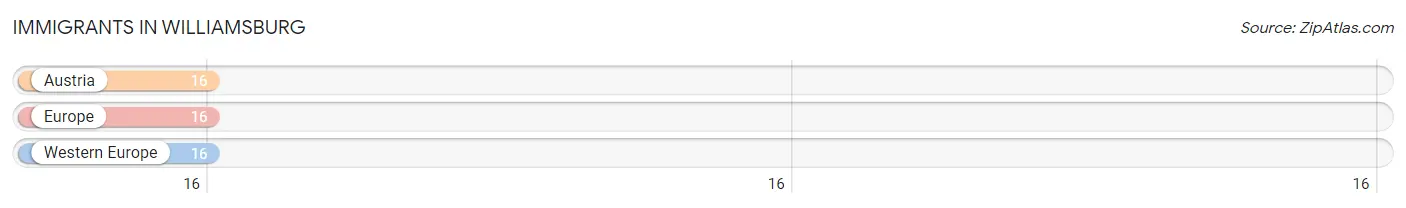
The most numerous immigrant groups reported in Williamsburg came from Austria (16 | 0.5%), Europe (16 | 0.5%), and Western Europe (16 | 0.5%), together accounting for 1.4% of all Williamsburg residents.
| Immigration Origin | # Population | % Population |
| Austria | 16 | 0.5% |
| Europe | 16 | 0.5% |
| Western Europe | 16 | 0.5% | View All 3 Rows |
Sex and Age in Williamsburg
Sex and Age in Williamsburg
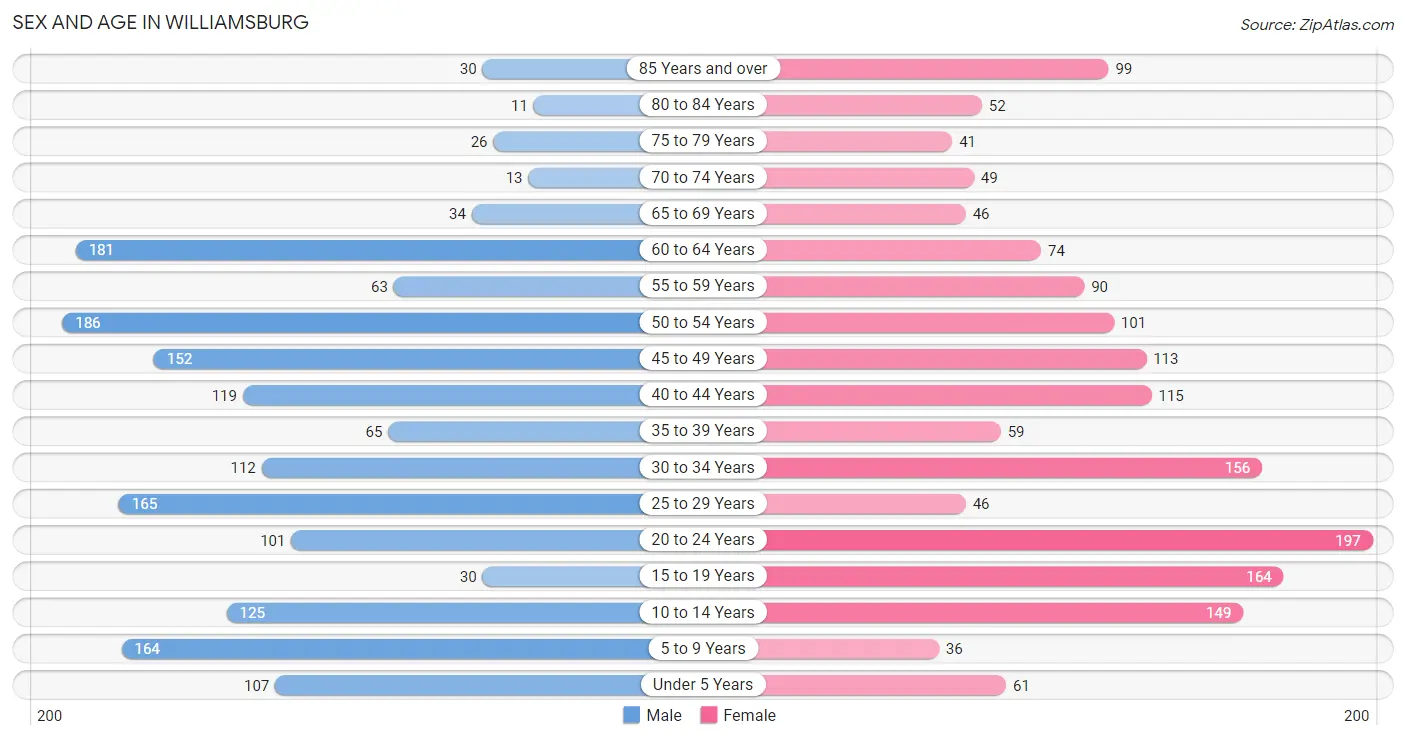
The most populous age groups in Williamsburg are 50 to 54 Years (186 | 11.1%) for men and 20 to 24 Years (197 | 11.9%) for women.
| Age Bracket | Male | Female |
| Under 5 Years | 107 (6.4%) | 61 (3.7%) |
| 5 to 9 Years | 164 (9.7%) | 36 (2.2%) |
| 10 to 14 Years | 125 (7.4%) | 149 (9.0%) |
| 15 to 19 Years | 30 (1.8%) | 164 (10.0%) |
| 20 to 24 Years | 101 (6.0%) | 197 (11.9%) |
| 25 to 29 Years | 165 (9.8%) | 46 (2.8%) |
| 30 to 34 Years | 112 (6.7%) | 156 (9.5%) |
| 35 to 39 Years | 65 (3.9%) | 59 (3.6%) |
| 40 to 44 Years | 119 (7.1%) | 115 (7.0%) |
| 45 to 49 Years | 152 (9.0%) | 113 (6.9%) |
| 50 to 54 Years | 186 (11.1%) | 101 (6.1%) |
| 55 to 59 Years | 63 (3.7%) | 90 (5.5%) |
| 60 to 64 Years | 181 (10.7%) | 74 (4.5%) |
| 65 to 69 Years | 34 (2.0%) | 46 (2.8%) |
| 70 to 74 Years | 13 (0.8%) | 49 (3.0%) |
| 75 to 79 Years | 26 (1.5%) | 41 (2.5%) |
| 80 to 84 Years | 11 (0.6%) | 52 (3.2%) |
| 85 Years and over | 30 (1.8%) | 99 (6.0%) |
| Total | 1,684 (100.0%) | 1,648 (100.0%) |
Families and Households in Williamsburg
Median Family Size in Williamsburg
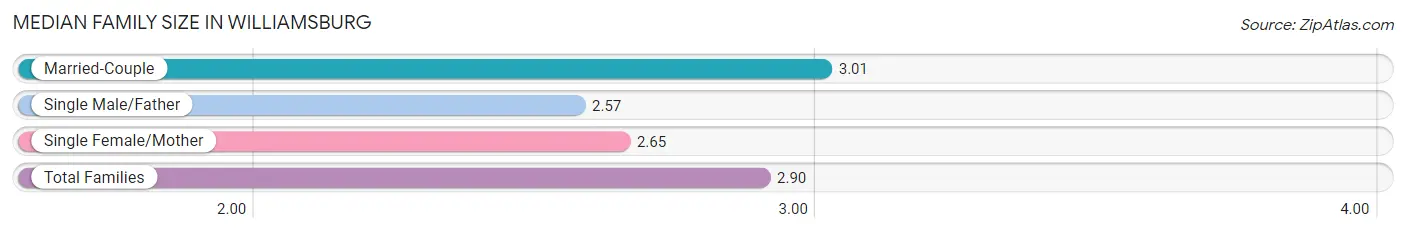
The median family size in Williamsburg is 2.90 persons per family, with married-couple families (607 | 72.9%) accounting for the largest median family size of 3.01 persons per family. On the other hand, single male/father families (90 | 10.8%) represent the smallest median family size with 2.57 persons per family.
| Family Type | # Families | Family Size |
| Married-Couple | 607 (72.9%) | 3.01 |
| Single Male/Father | 90 (10.8%) | 2.57 |
| Single Female/Mother | 136 (16.3%) | 2.65 |
| Total Families | 833 (100.0%) | 2.90 |
Median Household Size in Williamsburg
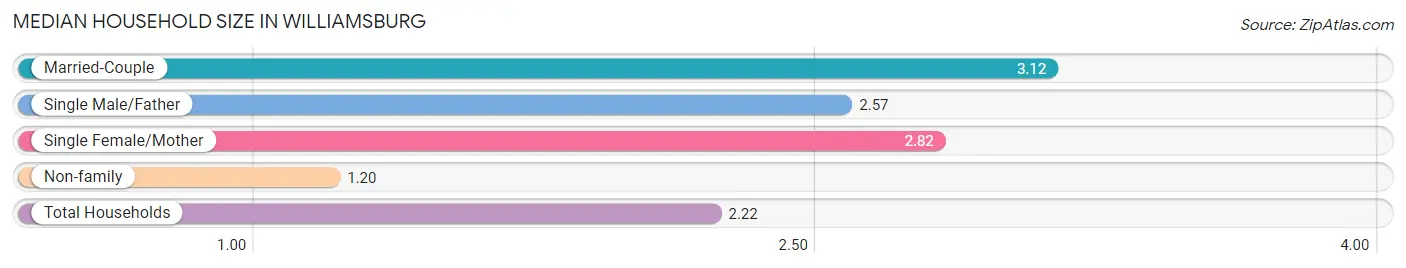
The median household size in Williamsburg is 2.22 persons per household, with married-couple households (607 | 41.1%) accounting for the largest median household size of 3.12 persons per household. non-family households (642 | 43.5%) represent the smallest median household size with 1.20 persons per household.
| Household Type | # Households | Household Size |
| Married-Couple | 607 (41.1%) | 3.12 |
| Single Male/Father | 90 (6.1%) | 2.57 |
| Single Female/Mother | 136 (9.2%) | 2.82 |
| Non-family | 642 (43.5%) | 1.20 |
| Total Households | 1,475 (100.0%) | 2.22 |
Household Size by Marriage Status in Williamsburg
Out of a total of 1,475 households in Williamsburg, 833 (56.5%) are family households, while 642 (43.5%) are nonfamily households. The most numerous type of family households are 2-person households, comprising 323, and the most common type of nonfamily households are 1-person households, comprising 501.
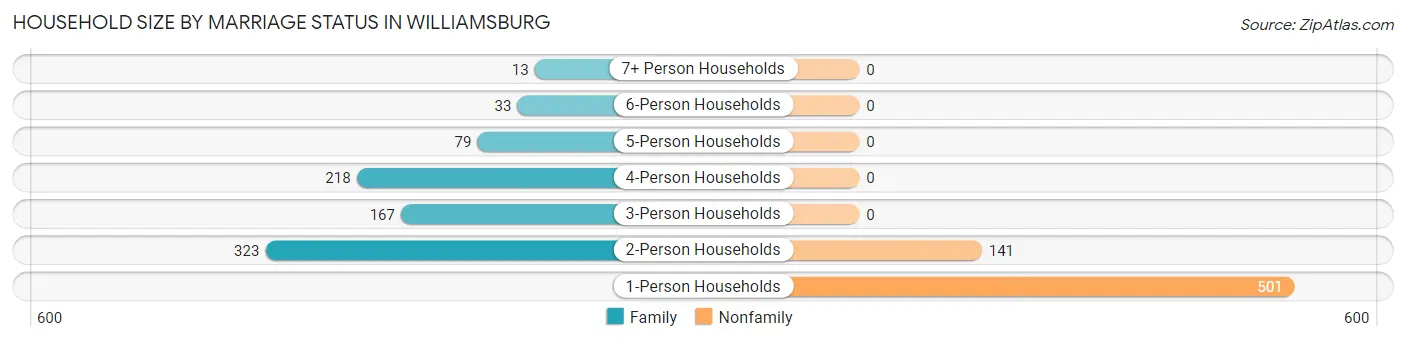
| Household Size | Family Households | Nonfamily Households |
| 1-Person Households | - | 501 (34.0%) |
| 2-Person Households | 323 (21.9%) | 141 (9.6%) |
| 3-Person Households | 167 (11.3%) | 0 (0.0%) |
| 4-Person Households | 218 (14.8%) | 0 (0.0%) |
| 5-Person Households | 79 (5.4%) | 0 (0.0%) |
| 6-Person Households | 33 (2.2%) | 0 (0.0%) |
| 7+ Person Households | 13 (0.9%) | 0 (0.0%) |
| Total | 833 (56.5%) | 642 (43.5%) |
Female Fertility in Williamsburg
Fertility by Age in Williamsburg
Average fertility rate in Williamsburg is 43.0 births per 1,000 women. Women in the age bracket of 35 to 50 years have the highest fertility rate with 73.0 births per 1,000 women. Women in the age bracket of 35 to 50 years acount for 59.5% of all women with births.
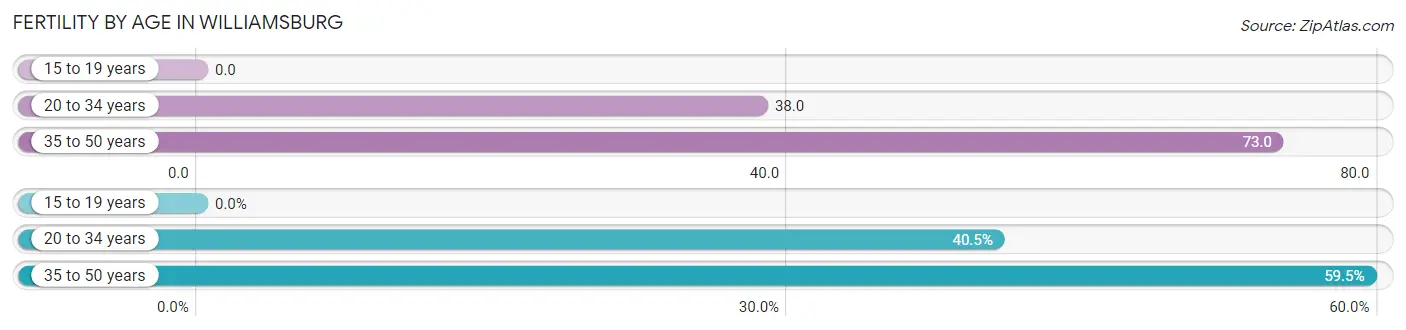
| Age Bracket | Women with Births | Births / 1,000 Women |
| 15 to 19 years | 0 (0.0%) | 0.0 |
| 20 to 34 years | 15 (40.5%) | 38.0 |
| 35 to 50 years | 22 (59.5%) | 73.0 |
| Total | 37 (100.0%) | 43.0 |
Fertility by Age by Marriage Status in Williamsburg
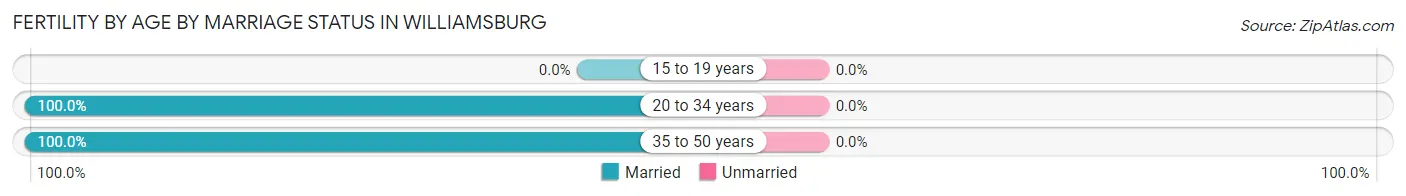
| Age Bracket | Married | Unmarried |
| 15 to 19 years | 0 (0.0%) | 0 (0.0%) |
| 20 to 34 years | 15 (100.0%) | 0 (0.0%) |
| 35 to 50 years | 22 (100.0%) | 0 (0.0%) |
| Total | 37 (100.0%) | 0 (0.0%) |
Fertility by Education in Williamsburg
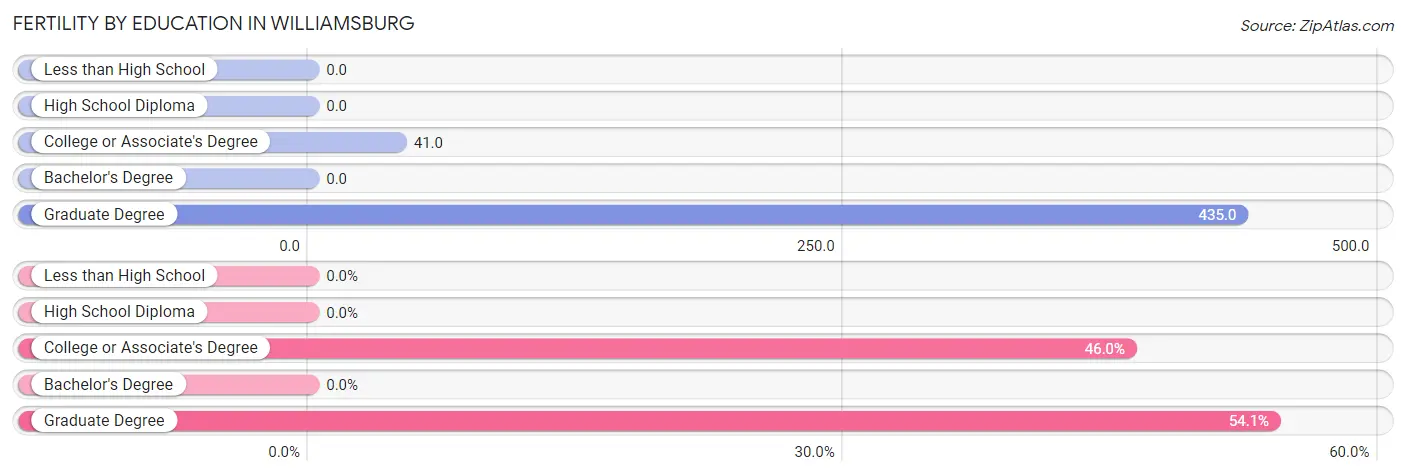
| Educational Attainment | Women with Births | Births / 1,000 Women |
| Less than High School | 0 (0.0%) | 0.0 |
| High School Diploma | 0 (0.0%) | 0.0 |
| College or Associate's Degree | 17 (46.0%) | 41.0 |
| Bachelor's Degree | 0 (0.0%) | 0.0 |
| Graduate Degree | 20 (54.0%) | 435.0 |
| Total | 37 (100.0%) | 43.0 |
Fertility by Education by Marriage Status in Williamsburg
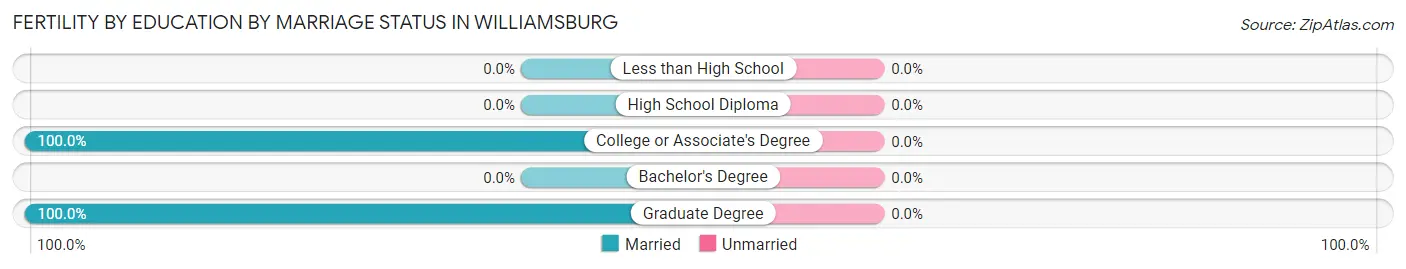
| Educational Attainment | Married | Unmarried |
| Less than High School | 0 (0.0%) | 0 (0.0%) |
| High School Diploma | 0 (0.0%) | 0 (0.0%) |
| College or Associate's Degree | 17 (100.0%) | 0 (0.0%) |
| Bachelor's Degree | 0 (0.0%) | 0 (0.0%) |
| Graduate Degree | 20 (100.0%) | 0 (0.0%) |
| Total | 37 (100.0%) | 0 (0.0%) |
Employment Characteristics in Williamsburg
Employment by Class of Employer in Williamsburg
Among the 1,908 employed individuals in Williamsburg, private company employees (1,165 | 61.1%), state government employees (229 | 12.0%), and local government employees (226 | 11.8%) make up the most common classes of employment.
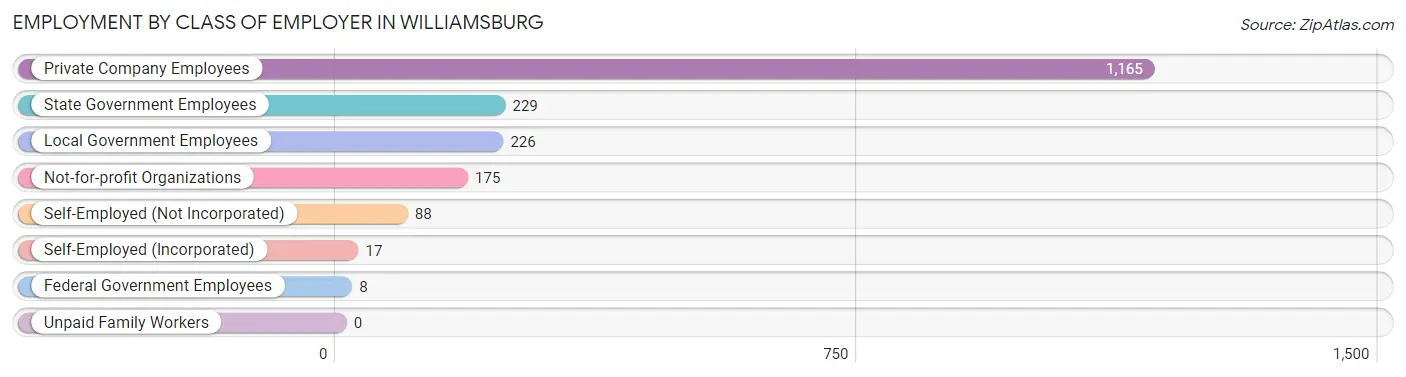
| Employer Class | # Employees | % Employees |
| Private Company Employees | 1,165 | 61.1% |
| Self-Employed (Incorporated) | 17 | 0.9% |
| Self-Employed (Not Incorporated) | 88 | 4.6% |
| Not-for-profit Organizations | 175 | 9.2% |
| Local Government Employees | 226 | 11.8% |
| State Government Employees | 229 | 12.0% |
| Federal Government Employees | 8 | 0.4% |
| Unpaid Family Workers | 0 | 0.0% |
| Total | 1,908 | 100.0% |
Employment Status by Age in Williamsburg
According to the labor force statistics for Williamsburg, out of the total population over 16 years of age (2,638), 76.4% or 2,015 individuals are in the labor force, with 5.4% or 109 of them unemployed. The age group with the highest labor force participation rate is 25 to 29 years, with 100.0% or 211 individuals in the labor force. Within the labor force, the 16 to 19 years age range has the highest percentage of unemployed individuals, with 46.8% or 59 of them being unemployed.
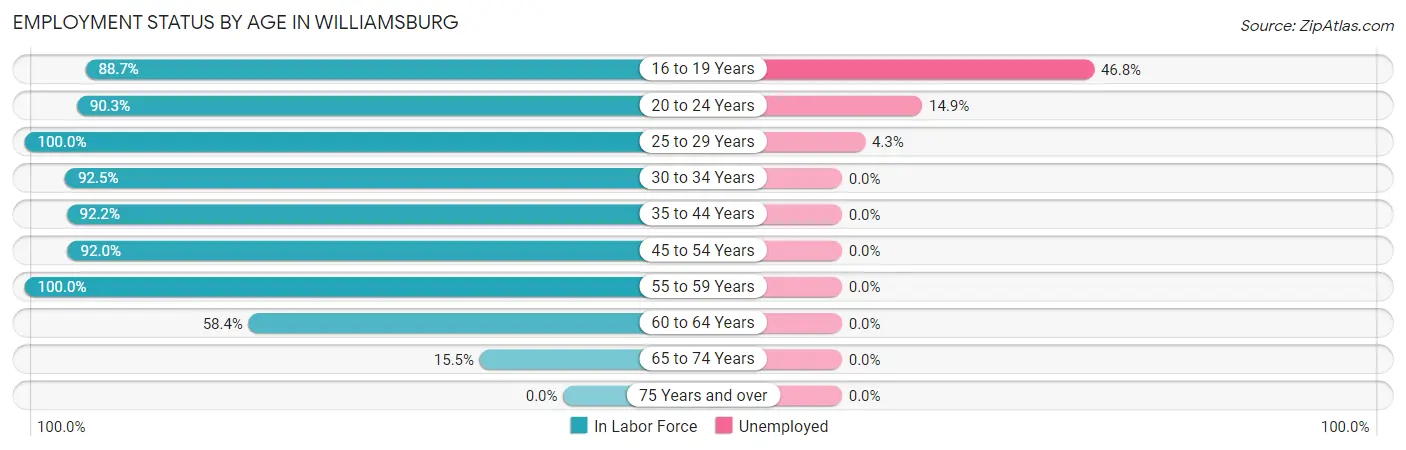
| Age Bracket | In Labor Force | Unemployed |
| 16 to 19 Years | 126 (88.7%) | 59 (46.8%) |
| 20 to 24 Years | 269 (90.3%) | 40 (14.9%) |
| 25 to 29 Years | 211 (100.0%) | 9 (4.3%) |
| 30 to 34 Years | 248 (92.5%) | 0 (0.0%) |
| 35 to 44 Years | 330 (92.2%) | 0 (0.0%) |
| 45 to 54 Years | 508 (92.0%) | 0 (0.0%) |
| 55 to 59 Years | 153 (100.0%) | 0 (0.0%) |
| 60 to 64 Years | 149 (58.4%) | 0 (0.0%) |
| 65 to 74 Years | 22 (15.5%) | 0 (0.0%) |
| 75 Years and over | 0 (0.0%) | 0 (0.0%) |
| Total | 2,015 (76.4%) | 109 (5.4%) |
Employment Status by Educational Attainment in Williamsburg
According to labor force statistics for Williamsburg, 89.0% of individuals (1,599) out of the total population between 25 and 64 years of age (1,797) are in the labor force, with 0.6% or 10 of them being unemployed. The group with the highest labor force participation rate are those with the educational attainment of bachelor's degree or higher, with 95.8% or 685 individuals in the labor force. Within the labor force, individuals with college / associate degree education have the highest percentage of unemployment, with 1.6% or 9 of them being unemployed.
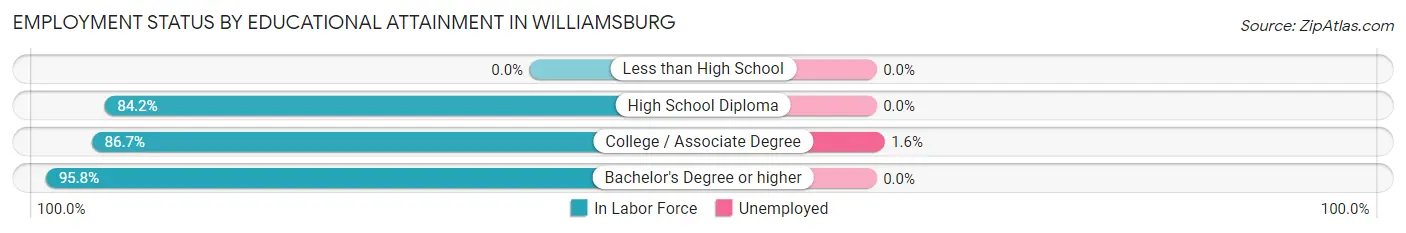
| Educational Attainment | In Labor Force | Unemployed |
| Less than High School | 0 (0.0%) | 0 (0.0%) |
| High School Diploma | 358 (84.2%) | 0 (0.0%) |
| College / Associate Degree | 556 (86.7%) | 10 (1.6%) |
| Bachelor's Degree or higher | 685 (95.8%) | 0 (0.0%) |
| Total | 1,599 (89.0%) | 11 (0.6%) |
Employment Occupations by Sex in Williamsburg
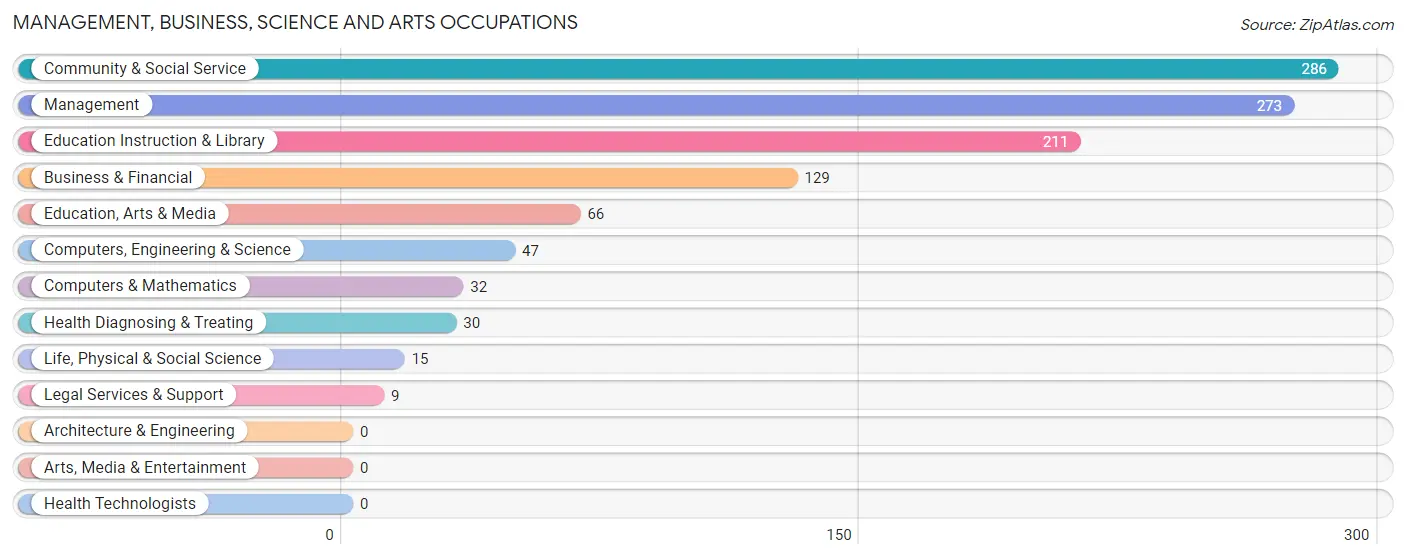
Management, Business, Science and Arts Occupations
The most common Management, Business, Science and Arts occupations in Williamsburg are Community & Social Service (286 | 15.0%), Management (273 | 14.4%), Education Instruction & Library (211 | 11.1%), Business & Financial (129 | 6.8%), and Education, Arts & Media (66 | 3.5%).
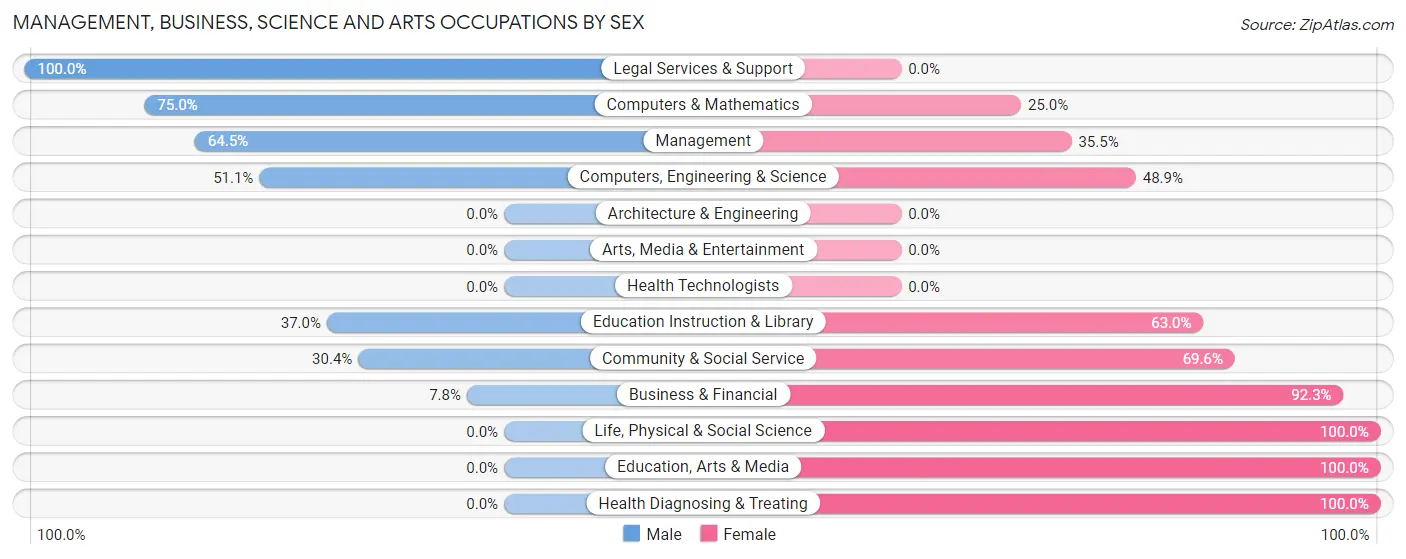
Management, Business, Science and Arts Occupations by Sex
Within the Management, Business, Science and Arts occupations in Williamsburg, the most male-oriented occupations are Legal Services & Support (100.0%), Computers & Mathematics (75.0%), and Management (64.5%), while the most female-oriented occupations are Life, Physical & Social Science (100.0%), Education, Arts & Media (100.0%), and Health Diagnosing & Treating (100.0%).
| Occupation | Male | Female |
| Management | 176 (64.5%) | 97 (35.5%) |
| Business & Financial | 10 (7.7%) | 119 (92.2%) |
| Computers, Engineering & Science | 24 (51.1%) | 23 (48.9%) |
| Computers & Mathematics | 24 (75.0%) | 8 (25.0%) |
| Architecture & Engineering | 0 (0.0%) | 0 (0.0%) |
| Life, Physical & Social Science | 0 (0.0%) | 15 (100.0%) |
| Community & Social Service | 87 (30.4%) | 199 (69.6%) |
| Education, Arts & Media | 0 (0.0%) | 66 (100.0%) |
| Legal Services & Support | 9 (100.0%) | 0 (0.0%) |
| Education Instruction & Library | 78 (37.0%) | 133 (63.0%) |
| Arts, Media & Entertainment | 0 (0.0%) | 0 (0.0%) |
| Health Diagnosing & Treating | 0 (0.0%) | 30 (100.0%) |
| Health Technologists | 0 (0.0%) | 0 (0.0%) |
| Total (Category) | 297 (38.8%) | 468 (61.2%) |
| Total (Overall) | 1,086 (57.1%) | 815 (42.9%) |
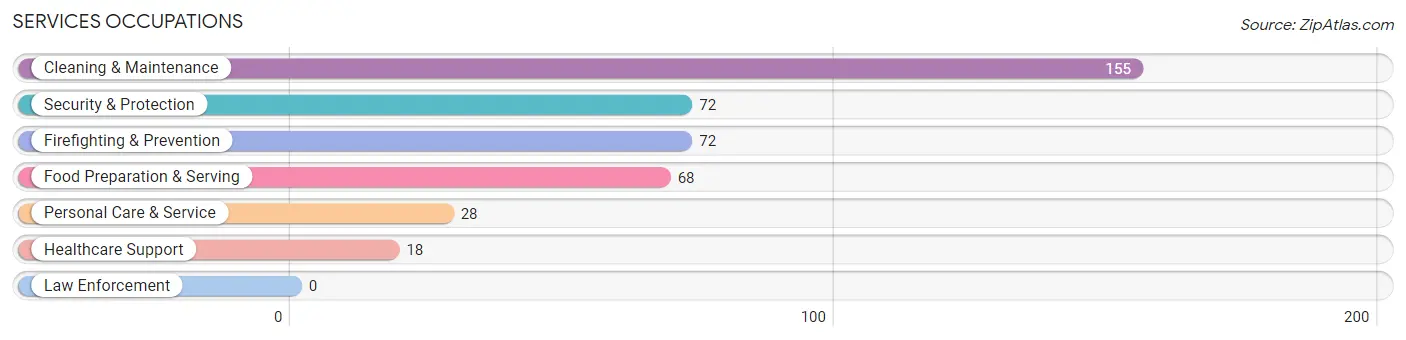
Services Occupations
The most common Services occupations in Williamsburg are Cleaning & Maintenance (155 | 8.2%), Security & Protection (72 | 3.8%), Firefighting & Prevention (72 | 3.8%), Food Preparation & Serving (68 | 3.6%), and Personal Care & Service (28 | 1.5%).
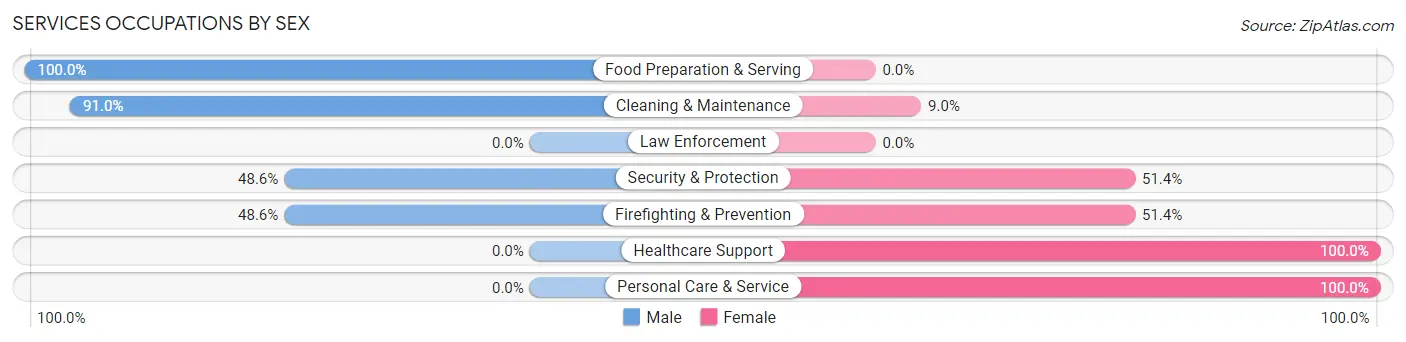
Services Occupations by Sex
Within the Services occupations in Williamsburg, the most male-oriented occupations are Food Preparation & Serving (100.0%), Cleaning & Maintenance (91.0%), and Security & Protection (48.6%), while the most female-oriented occupations are Healthcare Support (100.0%), Personal Care & Service (100.0%), and Security & Protection (51.4%).
| Occupation | Male | Female |
| Healthcare Support | 0 (0.0%) | 18 (100.0%) |
| Security & Protection | 35 (48.6%) | 37 (51.4%) |
| Firefighting & Prevention | 35 (48.6%) | 37 (51.4%) |
| Law Enforcement | 0 (0.0%) | 0 (0.0%) |
| Food Preparation & Serving | 68 (100.0%) | 0 (0.0%) |
| Cleaning & Maintenance | 141 (91.0%) | 14 (9.0%) |
| Personal Care & Service | 0 (0.0%) | 28 (100.0%) |
| Total (Category) | 244 (71.6%) | 97 (28.4%) |
| Total (Overall) | 1,086 (57.1%) | 815 (42.9%) |
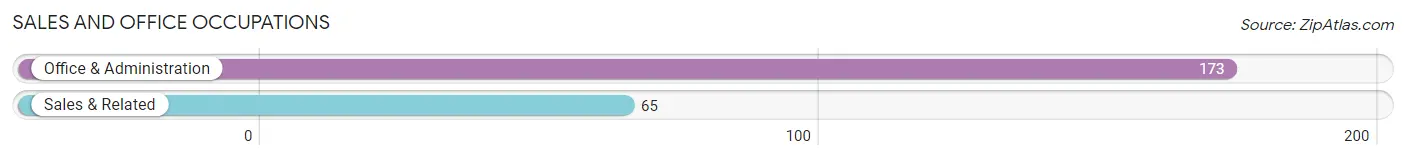
Sales and Office Occupations
The most common Sales and Office occupations in Williamsburg are Office & Administration (173 | 9.1%), and Sales & Related (65 | 3.4%).
Sales and Office Occupations by Sex
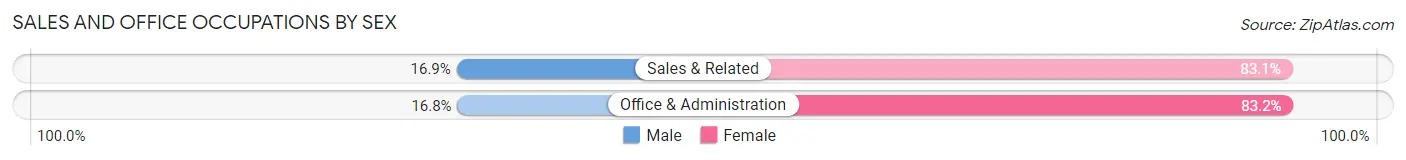
| Occupation | Male | Female |
| Sales & Related | 11 (16.9%) | 54 (83.1%) |
| Office & Administration | 29 (16.8%) | 144 (83.2%) |
| Total (Category) | 40 (16.8%) | 198 (83.2%) |
| Total (Overall) | 1,086 (57.1%) | 815 (42.9%) |
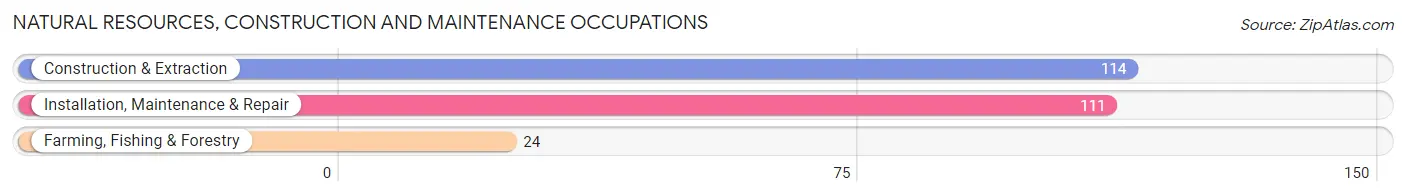
Natural Resources, Construction and Maintenance Occupations
The most common Natural Resources, Construction and Maintenance occupations in Williamsburg are Construction & Extraction (114 | 6.0%), Installation, Maintenance & Repair (111 | 5.8%), and Farming, Fishing & Forestry (24 | 1.3%).
Natural Resources, Construction and Maintenance Occupations by Sex
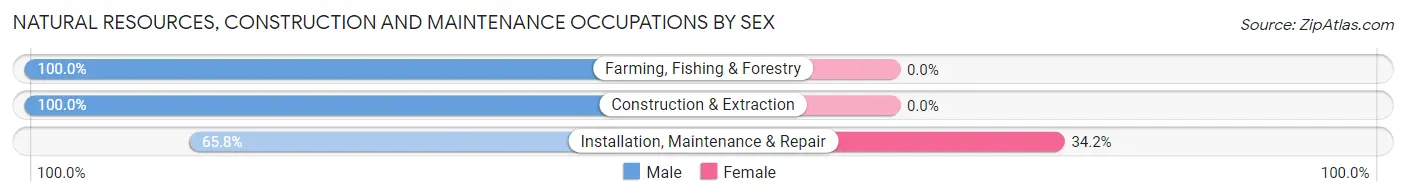
| Occupation | Male | Female |
| Farming, Fishing & Forestry | 24 (100.0%) | 0 (0.0%) |
| Construction & Extraction | 114 (100.0%) | 0 (0.0%) |
| Installation, Maintenance & Repair | 73 (65.8%) | 38 (34.2%) |
| Total (Category) | 211 (84.7%) | 38 (15.3%) |
| Total (Overall) | 1,086 (57.1%) | 815 (42.9%) |
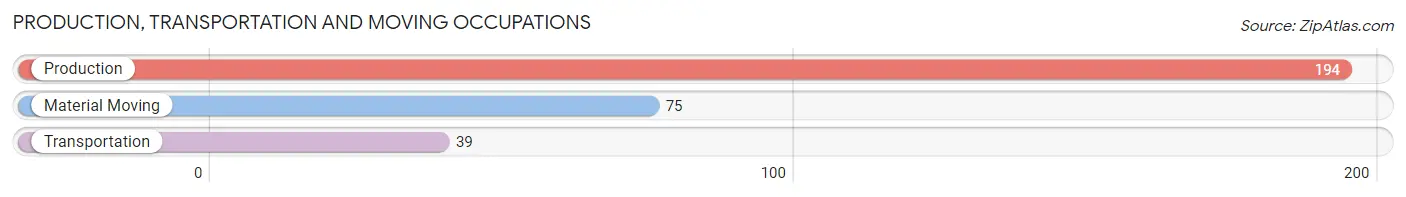
Production, Transportation and Moving Occupations
The most common Production, Transportation and Moving occupations in Williamsburg are Production (194 | 10.2%), Material Moving (75 | 4.0%), and Transportation (39 | 2.1%).
Production, Transportation and Moving Occupations by Sex
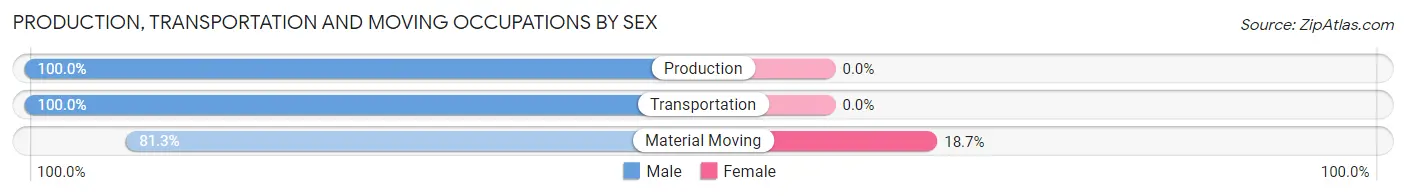
| Occupation | Male | Female |
| Production | 194 (100.0%) | 0 (0.0%) |
| Transportation | 39 (100.0%) | 0 (0.0%) |
| Material Moving | 61 (81.3%) | 14 (18.7%) |
| Total (Category) | 294 (95.5%) | 14 (4.5%) |
| Total (Overall) | 1,086 (57.1%) | 815 (42.9%) |
Employment Industries by Sex in Williamsburg
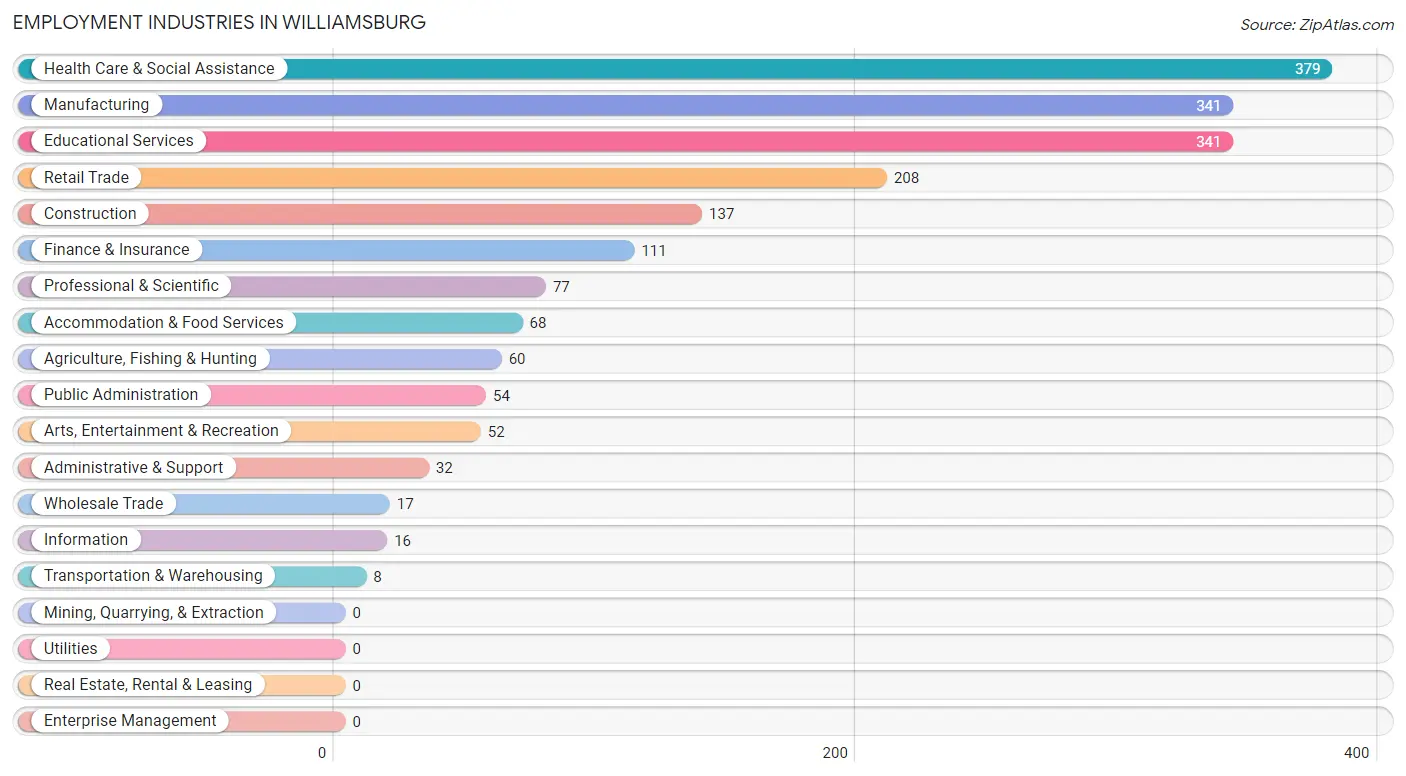
Employment Industries in Williamsburg
The major employment industries in Williamsburg include Health Care & Social Assistance (379 | 19.9%), Manufacturing (341 | 17.9%), Educational Services (341 | 17.9%), Retail Trade (208 | 10.9%), and Construction (137 | 7.2%).
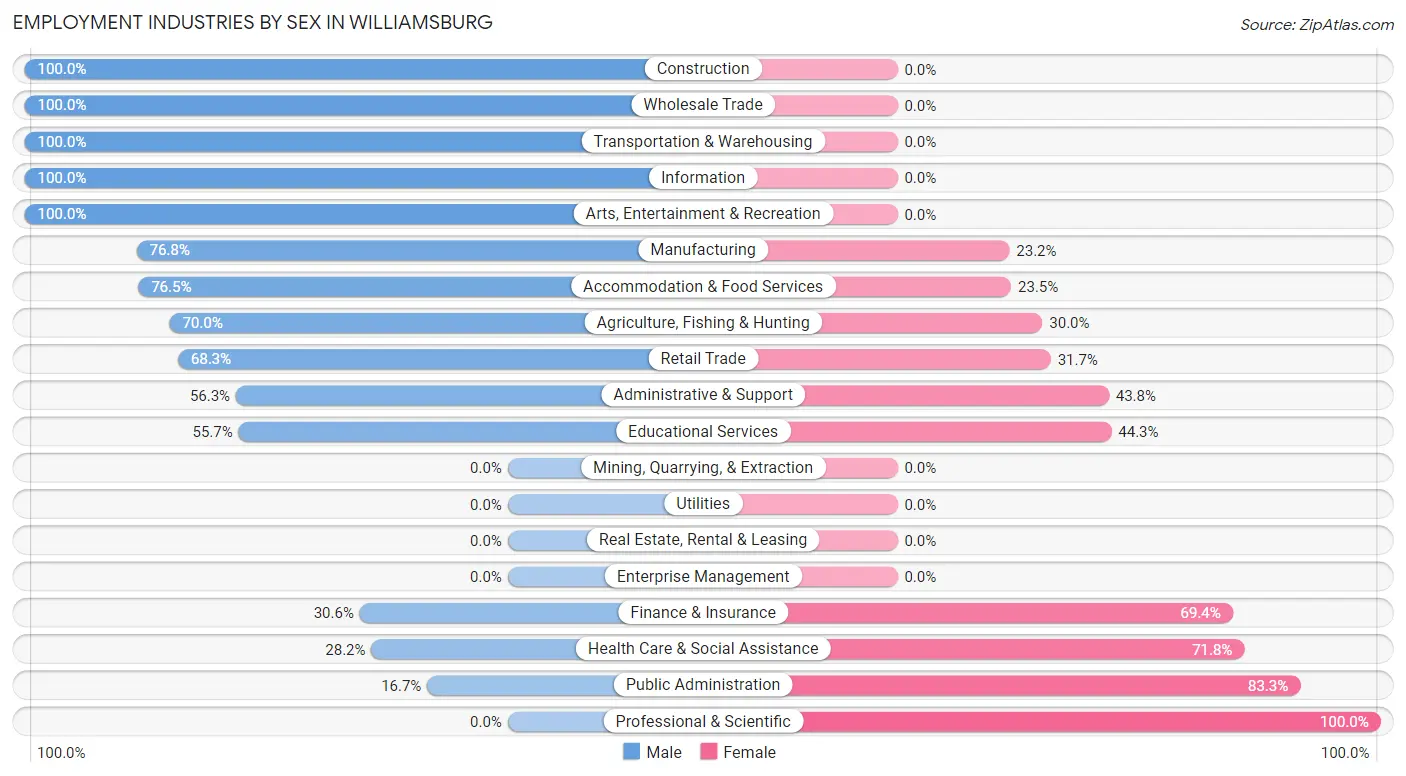
Employment Industries by Sex in Williamsburg
The Williamsburg industries that see more men than women are Construction (100.0%), Wholesale Trade (100.0%), and Transportation & Warehousing (100.0%), whereas the industries that tend to have a higher number of women are Professional & Scientific (100.0%), Public Administration (83.3%), and Health Care & Social Assistance (71.8%).
| Industry | Male | Female |
| Agriculture, Fishing & Hunting | 42 (70.0%) | 18 (30.0%) |
| Mining, Quarrying, & Extraction | 0 (0.0%) | 0 (0.0%) |
| Construction | 137 (100.0%) | 0 (0.0%) |
| Manufacturing | 262 (76.8%) | 79 (23.2%) |
| Wholesale Trade | 17 (100.0%) | 0 (0.0%) |
| Retail Trade | 142 (68.3%) | 66 (31.7%) |
| Transportation & Warehousing | 8 (100.0%) | 0 (0.0%) |
| Utilities | 0 (0.0%) | 0 (0.0%) |
| Information | 16 (100.0%) | 0 (0.0%) |
| Finance & Insurance | 34 (30.6%) | 77 (69.4%) |
| Real Estate, Rental & Leasing | 0 (0.0%) | 0 (0.0%) |
| Professional & Scientific | 0 (0.0%) | 77 (100.0%) |
| Enterprise Management | 0 (0.0%) | 0 (0.0%) |
| Administrative & Support | 18 (56.2%) | 14 (43.8%) |
| Educational Services | 190 (55.7%) | 151 (44.3%) |
| Health Care & Social Assistance | 107 (28.2%) | 272 (71.8%) |
| Arts, Entertainment & Recreation | 52 (100.0%) | 0 (0.0%) |
| Accommodation & Food Services | 52 (76.5%) | 16 (23.5%) |
| Public Administration | 9 (16.7%) | 45 (83.3%) |
| Total | 1,086 (57.1%) | 815 (42.9%) |
Education in Williamsburg
School Enrollment in Williamsburg
The most common levels of schooling among the 752 students in Williamsburg are middle school (274 | 36.4%), high school (148 | 19.7%), and college / undergraduate (104 | 13.8%).
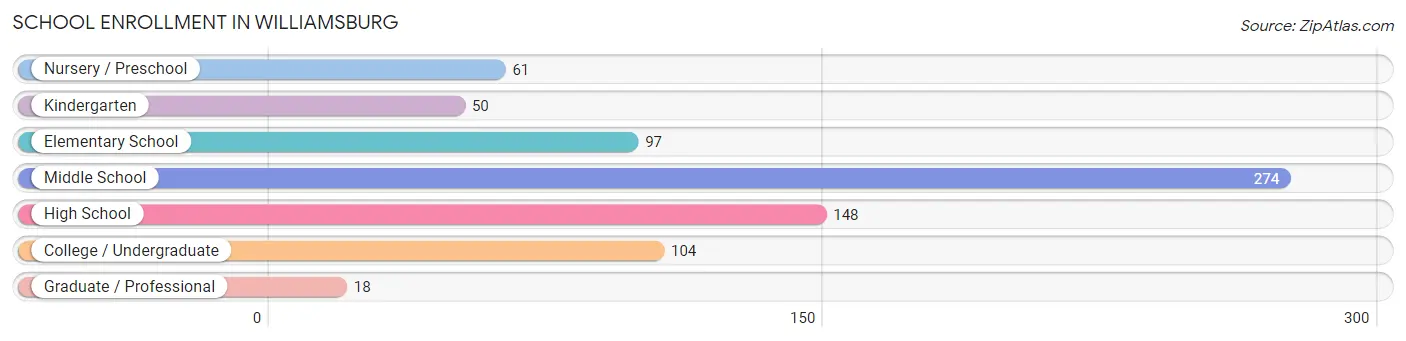
| School Level | # Students | % Students |
| Nursery / Preschool | 61 | 8.1% |
| Kindergarten | 50 | 6.7% |
| Elementary School | 97 | 12.9% |
| Middle School | 274 | 36.4% |
| High School | 148 | 19.7% |
| College / Undergraduate | 104 | 13.8% |
| Graduate / Professional | 18 | 2.4% |
| Total | 752 | 100.0% |
School Enrollment by Age by Funding Source in Williamsburg
Out of a total of 752 students who are enrolled in schools in Williamsburg, 64 (8.5%) attend a private institution, while the remaining 688 (91.5%) are enrolled in public schools. The age group of 5 to 9 year old has the highest likelihood of being enrolled in private schools, with 40 (20.0% in the age bracket) enrolled. Conversely, the age group of 3 to 4 year olds has the lowest likelihood of being enrolled in a private school, with 8 (100.0% in the age bracket) attending a public institution.
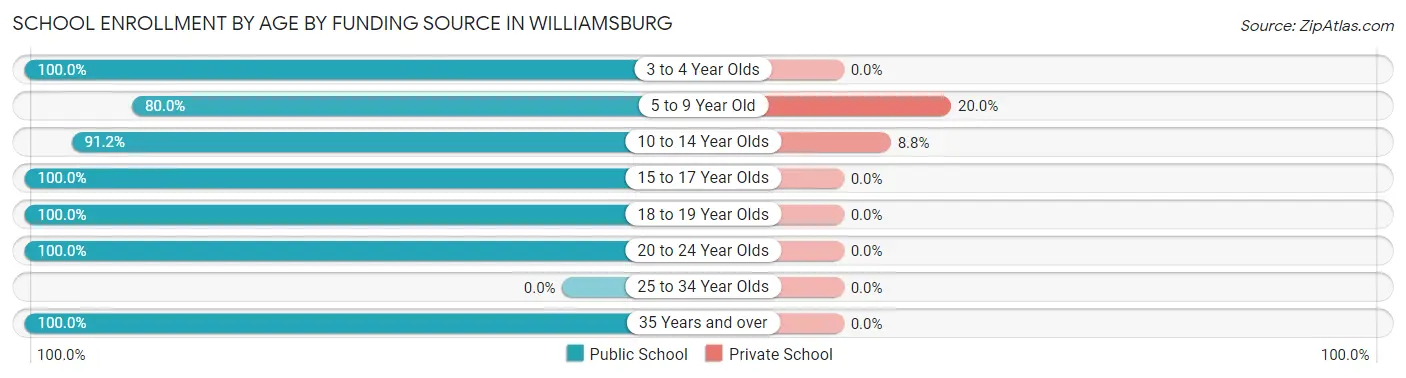
| Age Bracket | Public School | Private School |
| 3 to 4 Year Olds | 8 (100.0%) | 0 (0.0%) |
| 5 to 9 Year Old | 160 (80.0%) | 40 (20.0%) |
| 10 to 14 Year Olds | 250 (91.2%) | 24 (8.8%) |
| 15 to 17 Year Olds | 120 (100.0%) | 0 (0.0%) |
| 18 to 19 Year Olds | 25 (100.0%) | 0 (0.0%) |
| 20 to 24 Year Olds | 79 (100.0%) | 0 (0.0%) |
| 25 to 34 Year Olds | 0 (0.0%) | 0 (0.0%) |
| 35 Years and over | 46 (100.0%) | 0 (0.0%) |
| Total | 688 (91.5%) | 64 (8.5%) |
Educational Attainment by Field of Study in Williamsburg
Education (252 | 27.6%), bio, nature & agricultural (197 | 21.5%), physical & health sciences (128 | 14.0%), business (122 | 13.4%), and arts & humanities (56 | 6.1%) are the most common fields of study among 914 individuals in Williamsburg who have obtained a bachelor's degree or higher.
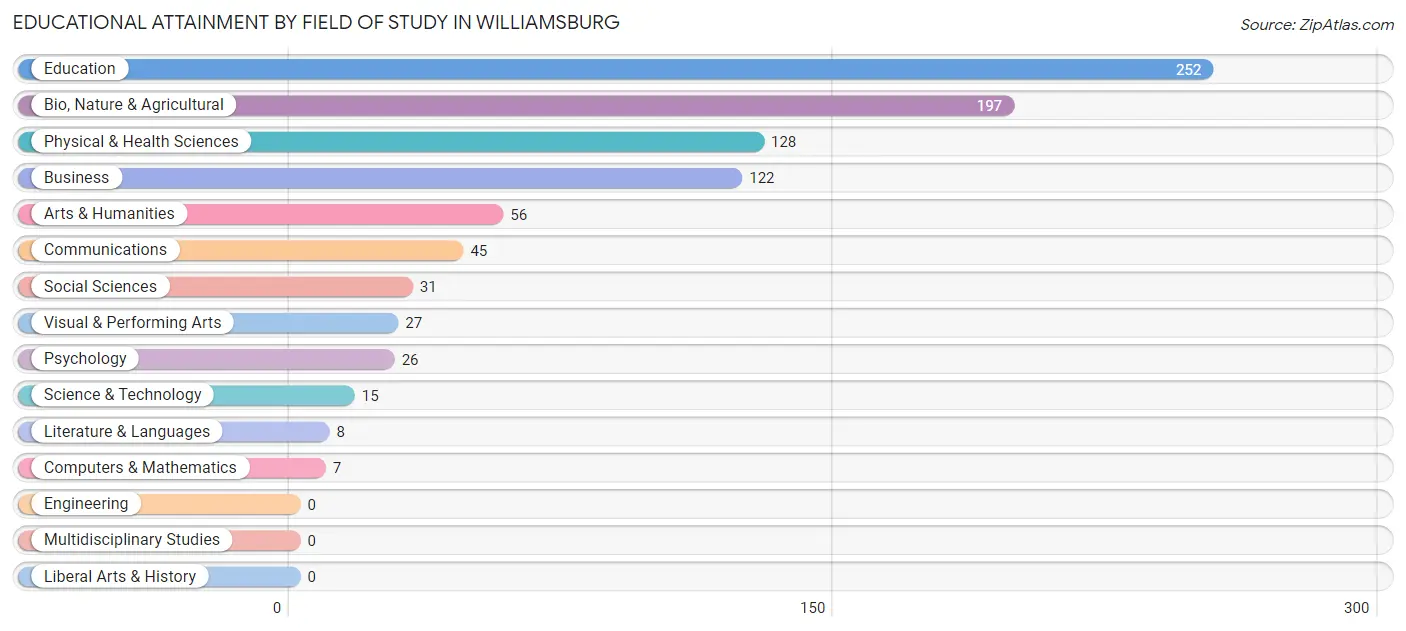
| Field of Study | # Graduates | % Graduates |
| Computers & Mathematics | 7 | 0.8% |
| Bio, Nature & Agricultural | 197 | 21.5% |
| Physical & Health Sciences | 128 | 14.0% |
| Psychology | 26 | 2.8% |
| Social Sciences | 31 | 3.4% |
| Engineering | 0 | 0.0% |
| Multidisciplinary Studies | 0 | 0.0% |
| Science & Technology | 15 | 1.6% |
| Business | 122 | 13.4% |
| Education | 252 | 27.6% |
| Literature & Languages | 8 | 0.9% |
| Liberal Arts & History | 0 | 0.0% |
| Visual & Performing Arts | 27 | 2.9% |
| Communications | 45 | 4.9% |
| Arts & Humanities | 56 | 6.1% |
| Total | 914 | 100.0% |
Transportation & Commute in Williamsburg
Vehicle Availability by Sex in Williamsburg
The most prevalent vehicle ownership categories in Williamsburg are males with 2 vehicles (487, accounting for 44.6%) and females with 2 vehicles (359, making up 59.8%).
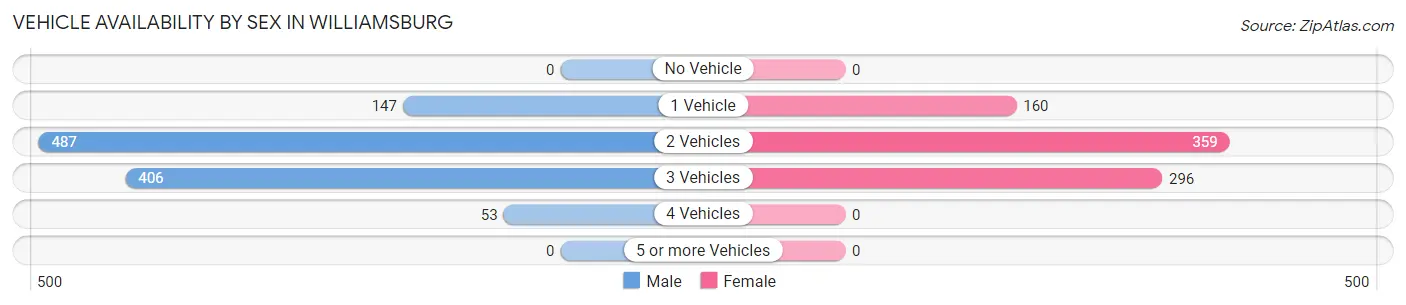
| Vehicles Available | Male | Female |
| No Vehicle | 0 (0.0%) | 0 (0.0%) |
| 1 Vehicle | 147 (13.5%) | 160 (19.6%) |
| 2 Vehicles | 487 (44.6%) | 359 (44.1%) |
| 3 Vehicles | 406 (37.1%) | 296 (36.3%) |
| 4 Vehicles | 53 (4.9%) | 0 (0.0%) |
| 5 or more Vehicles | 0 (0.0%) | 0 (0.0%) |
| Total | 1,093 (100.0%) | 815 (100.0%) |
Commute Time in Williamsburg
The most frequently occuring commute durations in Williamsburg are 5 to 9 minutes (385 commuters, 21.3%), less than 5 minutes (243 commuters, 13.4%), and 30 to 34 minutes (243 commuters, 13.4%).
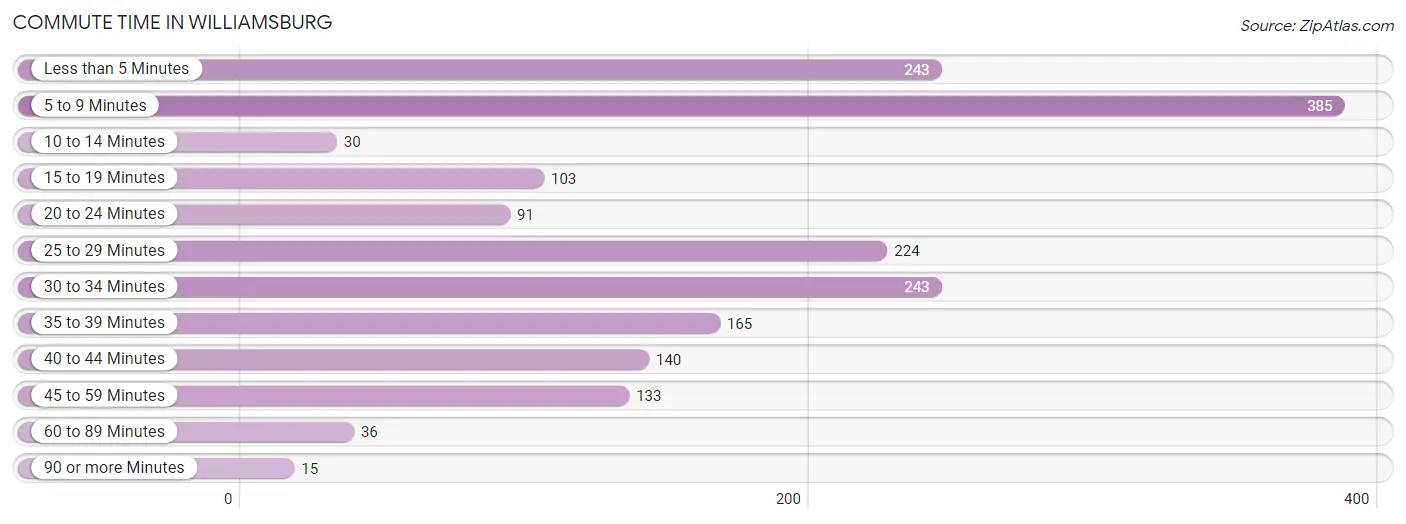
| Commute Time | # Commuters | % Commuters |
| Less than 5 Minutes | 243 | 13.4% |
| 5 to 9 Minutes | 385 | 21.3% |
| 10 to 14 Minutes | 30 | 1.7% |
| 15 to 19 Minutes | 103 | 5.7% |
| 20 to 24 Minutes | 91 | 5.0% |
| 25 to 29 Minutes | 224 | 12.4% |
| 30 to 34 Minutes | 243 | 13.4% |
| 35 to 39 Minutes | 165 | 9.1% |
| 40 to 44 Minutes | 140 | 7.7% |
| 45 to 59 Minutes | 133 | 7.4% |
| 60 to 89 Minutes | 36 | 2.0% |
| 90 or more Minutes | 15 | 0.8% |
Commute Time by Sex in Williamsburg
The most common commute times in Williamsburg are 5 to 9 minutes (229 commuters, 21.1%) for males and 5 to 9 minutes (156 commuters, 21.6%) for females.
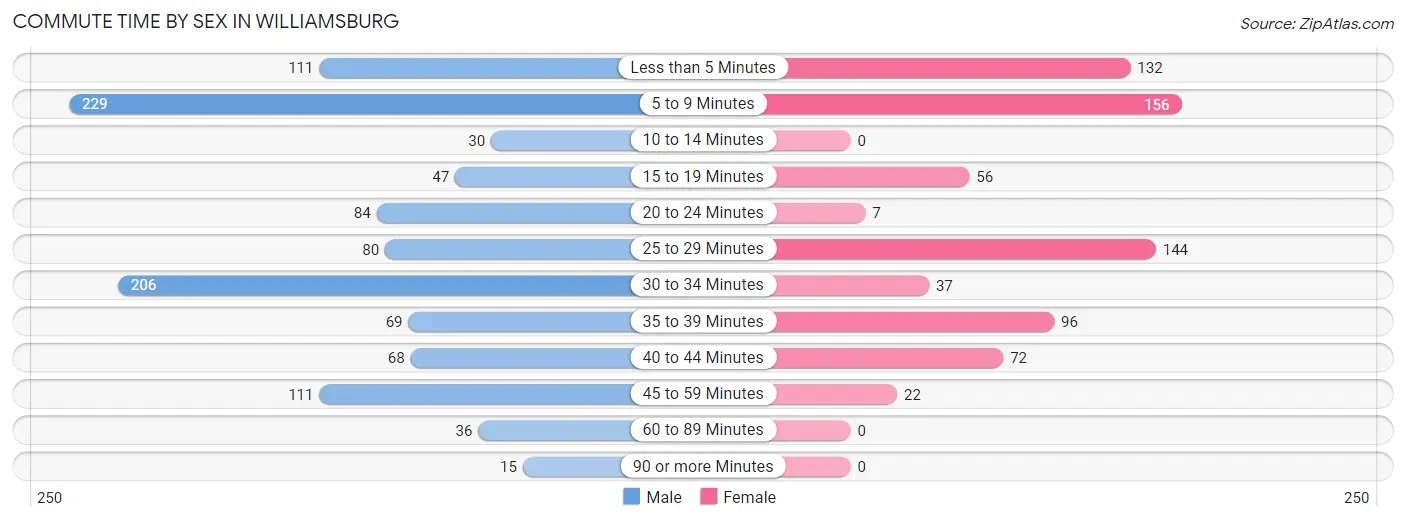
| Commute Time | Male | Female |
| Less than 5 Minutes | 111 (10.2%) | 132 (18.3%) |
| 5 to 9 Minutes | 229 (21.1%) | 156 (21.6%) |
| 10 to 14 Minutes | 30 (2.8%) | 0 (0.0%) |
| 15 to 19 Minutes | 47 (4.3%) | 56 (7.8%) |
| 20 to 24 Minutes | 84 (7.7%) | 7 (1.0%) |
| 25 to 29 Minutes | 80 (7.4%) | 144 (19.9%) |
| 30 to 34 Minutes | 206 (19.0%) | 37 (5.1%) |
| 35 to 39 Minutes | 69 (6.4%) | 96 (13.3%) |
| 40 to 44 Minutes | 68 (6.3%) | 72 (10.0%) |
| 45 to 59 Minutes | 111 (10.2%) | 22 (3.0%) |
| 60 to 89 Minutes | 36 (3.3%) | 0 (0.0%) |
| 90 or more Minutes | 15 (1.4%) | 0 (0.0%) |
Time of Departure to Work by Sex in Williamsburg
The most frequent times of departure to work in Williamsburg are 4:00 PM to 11:59 PM (182, 16.8%) for males and 7:00 AM to 7:29 AM (218, 30.2%) for females.
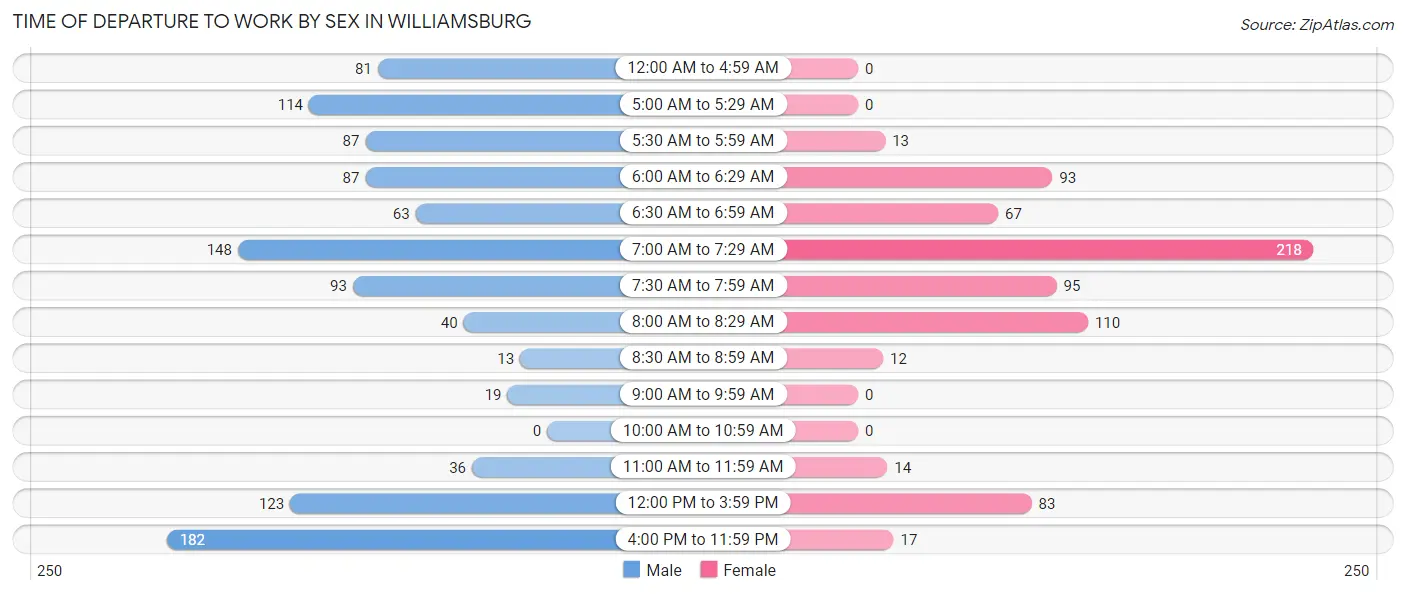
| Time of Departure | Male | Female |
| 12:00 AM to 4:59 AM | 81 (7.5%) | 0 (0.0%) |
| 5:00 AM to 5:29 AM | 114 (10.5%) | 0 (0.0%) |
| 5:30 AM to 5:59 AM | 87 (8.0%) | 13 (1.8%) |
| 6:00 AM to 6:29 AM | 87 (8.0%) | 93 (12.9%) |
| 6:30 AM to 6:59 AM | 63 (5.8%) | 67 (9.3%) |
| 7:00 AM to 7:29 AM | 148 (13.6%) | 218 (30.2%) |
| 7:30 AM to 7:59 AM | 93 (8.6%) | 95 (13.2%) |
| 8:00 AM to 8:29 AM | 40 (3.7%) | 110 (15.2%) |
| 8:30 AM to 8:59 AM | 13 (1.2%) | 12 (1.7%) |
| 9:00 AM to 9:59 AM | 19 (1.8%) | 0 (0.0%) |
| 10:00 AM to 10:59 AM | 0 (0.0%) | 0 (0.0%) |
| 11:00 AM to 11:59 AM | 36 (3.3%) | 14 (1.9%) |
| 12:00 PM to 3:59 PM | 123 (11.3%) | 83 (11.5%) |
| 4:00 PM to 11:59 PM | 182 (16.8%) | 17 (2.4%) |
| Total | 1,086 (100.0%) | 722 (100.0%) |
Housing Occupancy in Williamsburg
Occupancy by Ownership in Williamsburg
Of the total 1,475 dwellings in Williamsburg, owner-occupied units account for 921 (62.4%), while renter-occupied units make up 554 (37.6%).
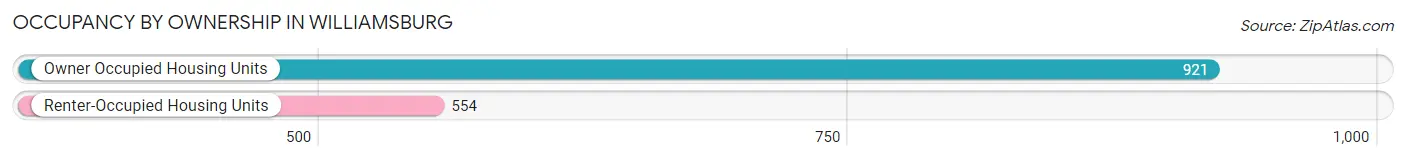
| Occupancy | # Housing Units | % Housing Units |
| Owner Occupied Housing Units | 921 | 62.4% |
| Renter-Occupied Housing Units | 554 | 37.6% |
| Total Occupied Housing Units | 1,475 | 100.0% |
Occupancy by Household Size in Williamsburg
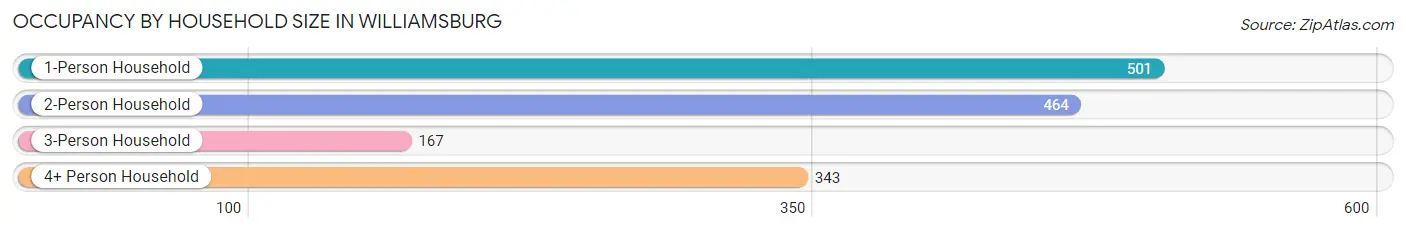
| Household Size | # Housing Units | % Housing Units |
| 1-Person Household | 501 | 34.0% |
| 2-Person Household | 464 | 31.5% |
| 3-Person Household | 167 | 11.3% |
| 4+ Person Household | 343 | 23.3% |
| Total Housing Units | 1,475 | 100.0% |
Occupancy by Ownership by Household Size in Williamsburg
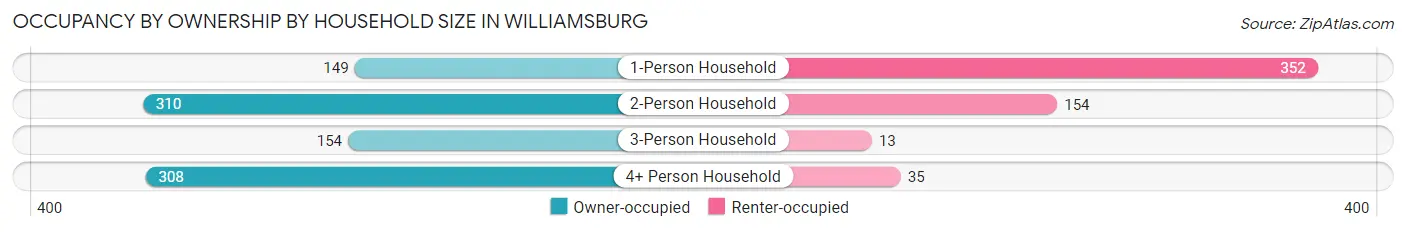
| Household Size | Owner-occupied | Renter-occupied |
| 1-Person Household | 149 (29.7%) | 352 (70.3%) |
| 2-Person Household | 310 (66.8%) | 154 (33.2%) |
| 3-Person Household | 154 (92.2%) | 13 (7.8%) |
| 4+ Person Household | 308 (89.8%) | 35 (10.2%) |
| Total Housing Units | 921 (62.4%) | 554 (37.6%) |
Occupancy by Educational Attainment in Williamsburg
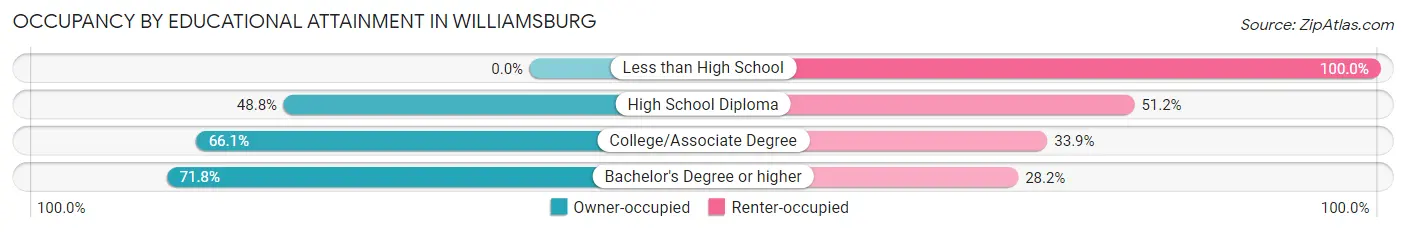
| Household Size | Owner-occupied | Renter-occupied |
| Less than High School | 0 (0.0%) | 29 (100.0%) |
| High School Diploma | 182 (48.8%) | 191 (51.2%) |
| College/Associate Degree | 364 (66.1%) | 187 (33.9%) |
| Bachelor's Degree or higher | 375 (71.8%) | 147 (28.2%) |
Occupancy by Age of Householder in Williamsburg
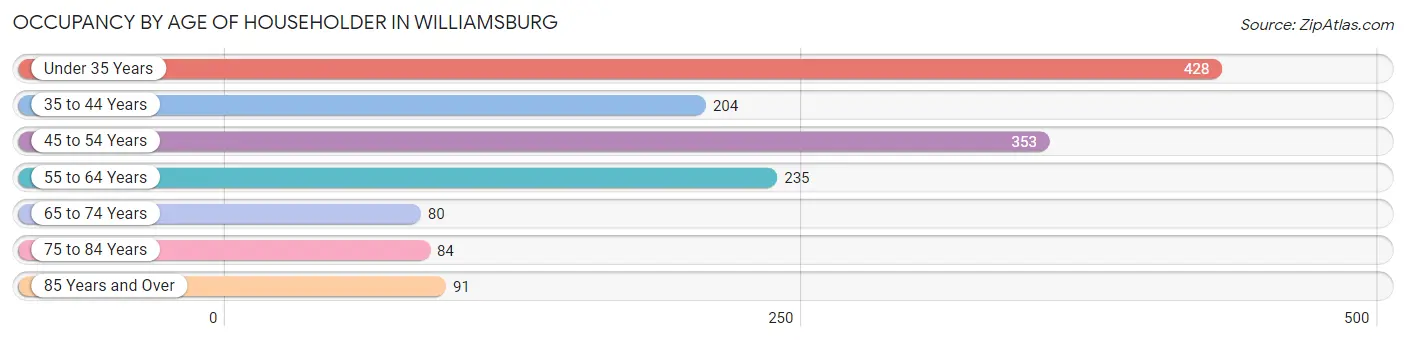
| Age Bracket | # Households | % Households |
| Under 35 Years | 428 | 29.0% |
| 35 to 44 Years | 204 | 13.8% |
| 45 to 54 Years | 353 | 23.9% |
| 55 to 64 Years | 235 | 15.9% |
| 65 to 74 Years | 80 | 5.4% |
| 75 to 84 Years | 84 | 5.7% |
| 85 Years and Over | 91 | 6.2% |
| Total | 1,475 | 100.0% |
Housing Finances in Williamsburg
Median Income by Occupancy in Williamsburg
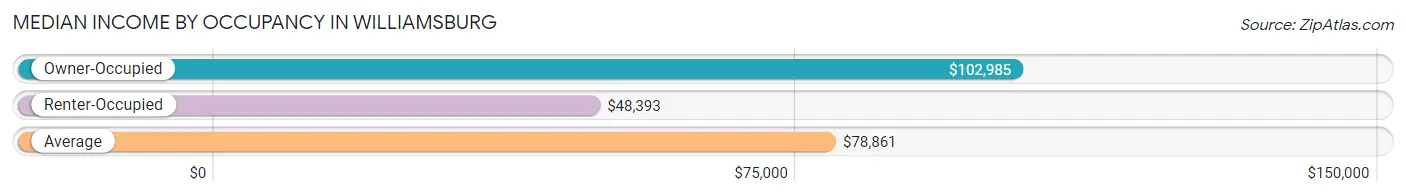
| Occupancy Type | # Households | Median Income |
| Owner-Occupied | 921 (62.4%) | $102,985 |
| Renter-Occupied | 554 (37.6%) | $48,393 |
| Average | 1,475 (100.0%) | $78,861 |
Occupancy by Householder Income Bracket in Williamsburg

| Income Bracket | Owner-occupied | Renter-occupied |
| Less than $5,000 | 0 (0.0%) | 22 (4.0%) |
| $5,000 to $9,999 | 0 (0.0%) | 16 (2.9%) |
| $10,000 to $14,999 | 12 (1.3%) | 11 (2.0%) |
| $15,000 to $19,999 | 0 (0.0%) | 0 (0.0%) |
| $20,000 to $24,999 | 9 (1.0%) | 43 (7.8%) |
| $25,000 to $34,999 | 50 (5.4%) | 112 (20.2%) |
| $35,000 to $49,999 | 96 (10.4%) | 91 (16.4%) |
| $50,000 to $74,999 | 107 (11.6%) | 144 (26.0%) |
| $75,000 to $99,999 | 167 (18.1%) | 62 (11.2%) |
| $100,000 to $149,999 | 291 (31.6%) | 0 (0.0%) |
| $150,000 or more | 189 (20.5%) | 53 (9.6%) |
| Total | 921 (100.0%) | 554 (100.0%) |
Monthly Housing Cost Tiers in Williamsburg
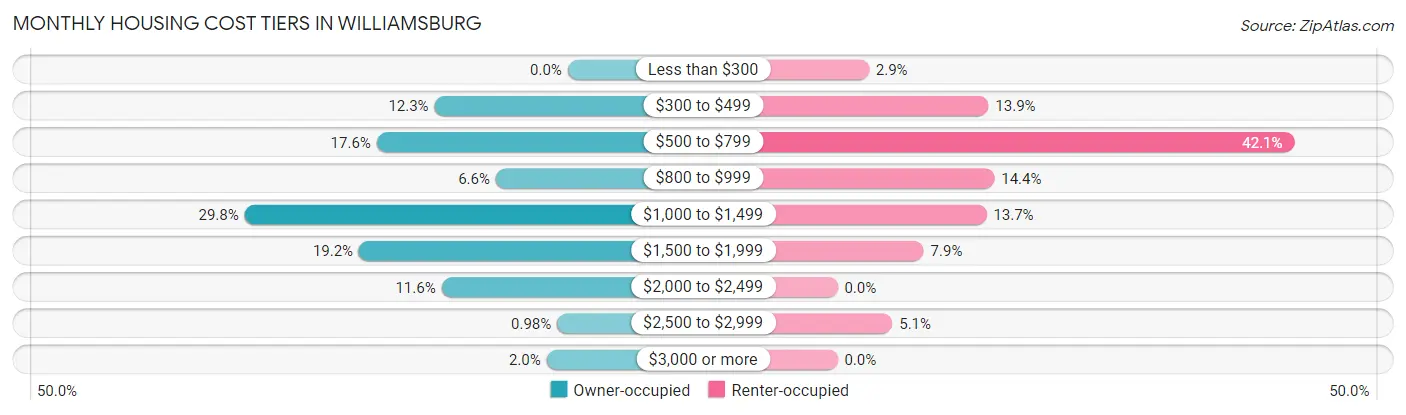
| Monthly Cost | Owner-occupied | Renter-occupied |
| Less than $300 | 0 (0.0%) | 16 (2.9%) |
| $300 to $499 | 113 (12.3%) | 77 (13.9%) |
| $500 to $799 | 162 (17.6%) | 233 (42.1%) |
| $800 to $999 | 61 (6.6%) | 80 (14.4%) |
| $1,000 to $1,499 | 274 (29.7%) | 76 (13.7%) |
| $1,500 to $1,999 | 177 (19.2%) | 44 (7.9%) |
| $2,000 to $2,499 | 107 (11.6%) | 0 (0.0%) |
| $2,500 to $2,999 | 9 (1.0%) | 28 (5.1%) |
| $3,000 or more | 18 (1.9%) | 0 (0.0%) |
| Total | 921 (100.0%) | 554 (100.0%) |
Physical Housing Characteristics in Williamsburg
Housing Structures in Williamsburg
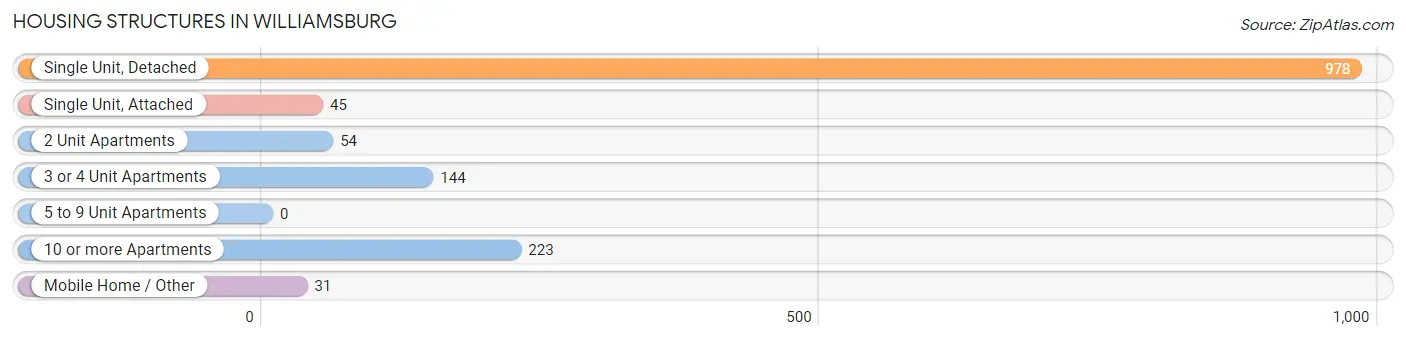
| Structure Type | # Housing Units | % Housing Units |
| Single Unit, Detached | 978 | 66.3% |
| Single Unit, Attached | 45 | 3.0% |
| 2 Unit Apartments | 54 | 3.7% |
| 3 or 4 Unit Apartments | 144 | 9.8% |
| 5 to 9 Unit Apartments | 0 | 0.0% |
| 10 or more Apartments | 223 | 15.1% |
| Mobile Home / Other | 31 | 2.1% |
| Total | 1,475 | 100.0% |
Housing Structures by Occupancy in Williamsburg
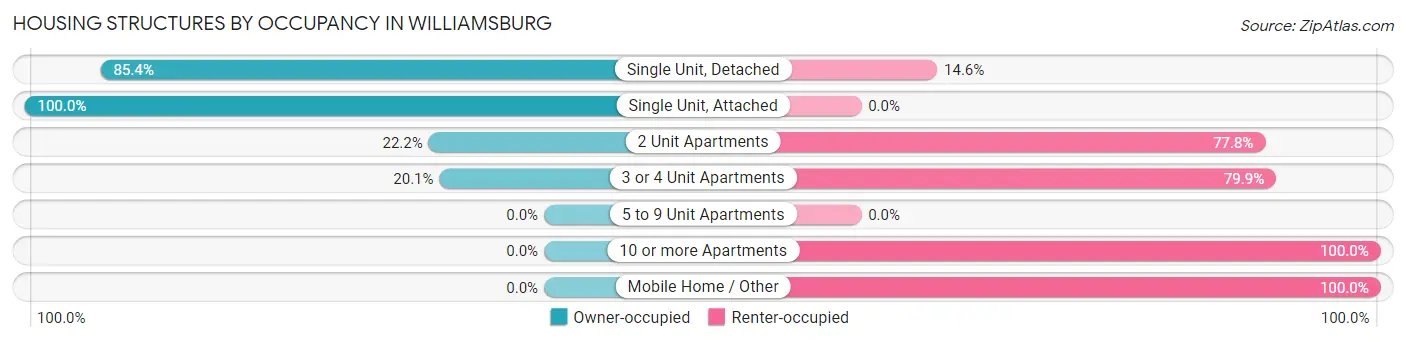
| Structure Type | Owner-occupied | Renter-occupied |
| Single Unit, Detached | 835 (85.4%) | 143 (14.6%) |
| Single Unit, Attached | 45 (100.0%) | 0 (0.0%) |
| 2 Unit Apartments | 12 (22.2%) | 42 (77.8%) |
| 3 or 4 Unit Apartments | 29 (20.1%) | 115 (79.9%) |
| 5 to 9 Unit Apartments | 0 (0.0%) | 0 (0.0%) |
| 10 or more Apartments | 0 (0.0%) | 223 (100.0%) |
| Mobile Home / Other | 0 (0.0%) | 31 (100.0%) |
| Total | 921 (62.4%) | 554 (37.6%) |
Housing Structures by Number of Rooms in Williamsburg
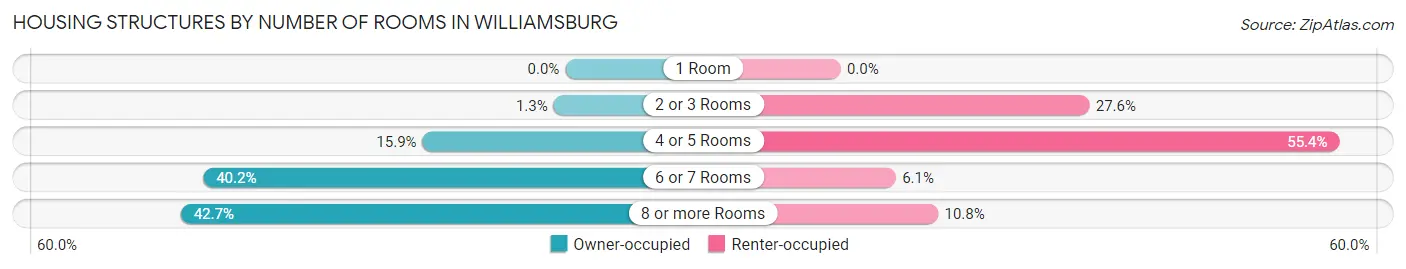
| Number of Rooms | Owner-occupied | Renter-occupied |
| 1 Room | 0 (0.0%) | 0 (0.0%) |
| 2 or 3 Rooms | 12 (1.3%) | 153 (27.6%) |
| 4 or 5 Rooms | 146 (15.9%) | 307 (55.4%) |
| 6 or 7 Rooms | 370 (40.2%) | 34 (6.1%) |
| 8 or more Rooms | 393 (42.7%) | 60 (10.8%) |
| Total | 921 (100.0%) | 554 (100.0%) |
Housing Structure by Heating Type in Williamsburg
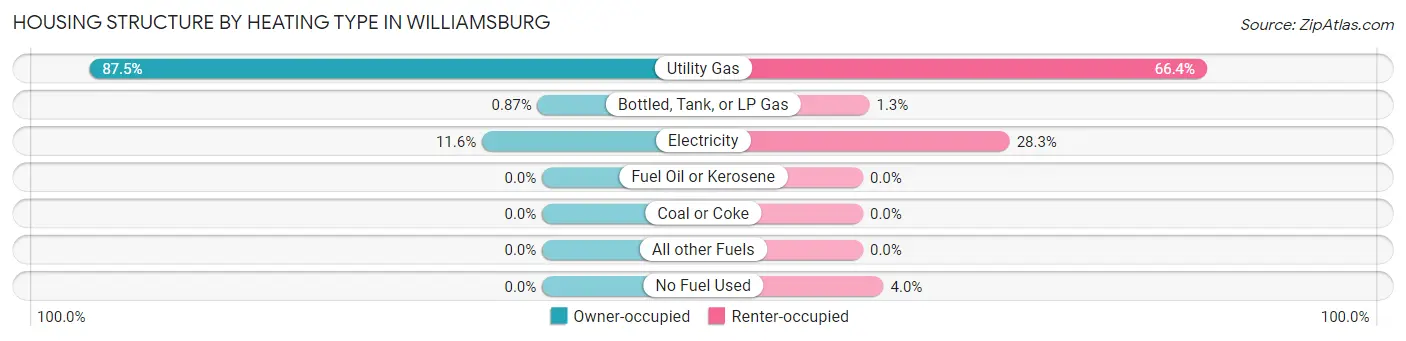
| Heating Type | Owner-occupied | Renter-occupied |
| Utility Gas | 806 (87.5%) | 368 (66.4%) |
| Bottled, Tank, or LP Gas | 8 (0.9%) | 7 (1.3%) |
| Electricity | 107 (11.6%) | 157 (28.3%) |
| Fuel Oil or Kerosene | 0 (0.0%) | 0 (0.0%) |
| Coal or Coke | 0 (0.0%) | 0 (0.0%) |
| All other Fuels | 0 (0.0%) | 0 (0.0%) |
| No Fuel Used | 0 (0.0%) | 22 (4.0%) |
| Total | 921 (100.0%) | 554 (100.0%) |
Household Vehicle Usage in Williamsburg
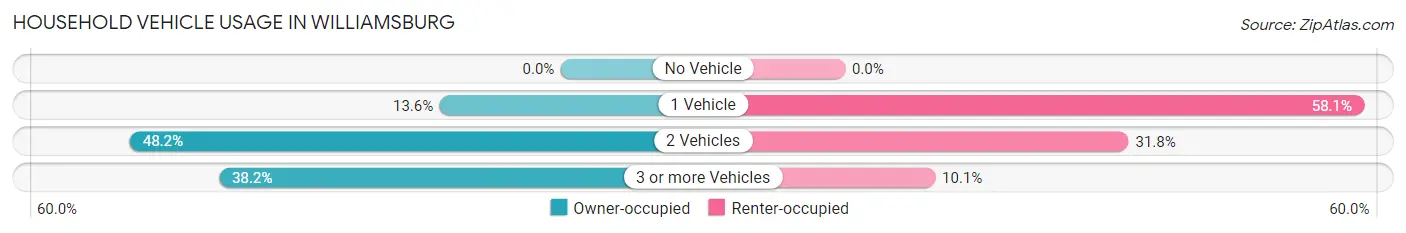
| Vehicles per Household | Owner-occupied | Renter-occupied |
| No Vehicle | 0 (0.0%) | 0 (0.0%) |
| 1 Vehicle | 125 (13.6%) | 322 (58.1%) |
| 2 Vehicles | 444 (48.2%) | 176 (31.8%) |
| 3 or more Vehicles | 352 (38.2%) | 56 (10.1%) |
| Total | 921 (100.0%) | 554 (100.0%) |
Real Estate & Mortgages in Williamsburg
Real Estate and Mortgage Overview in Williamsburg
| Characteristic | Without Mortgage | With Mortgage |
| Housing Units | 381 | 540 |
| Median Property Value | $187,100 | $186,600 |
| Median Household Income | $57,250 | $132 |
| Monthly Housing Costs | $654 | $18 |
| Real Estate Taxes | $2,871 | $0 |
Property Value by Mortgage Status in Williamsburg
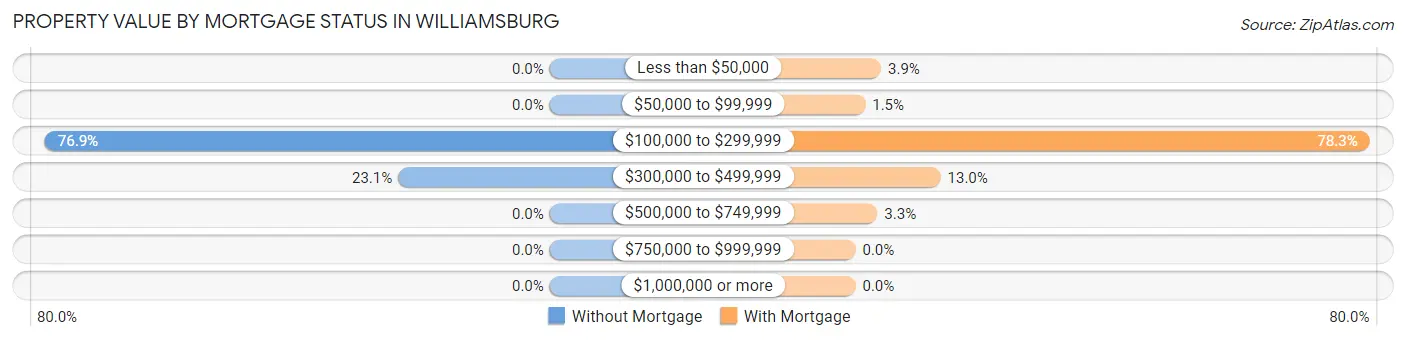
| Property Value | Without Mortgage | With Mortgage |
| Less than $50,000 | 0 (0.0%) | 21 (3.9%) |
| $50,000 to $99,999 | 0 (0.0%) | 8 (1.5%) |
| $100,000 to $299,999 | 293 (76.9%) | 423 (78.3%) |
| $300,000 to $499,999 | 88 (23.1%) | 70 (13.0%) |
| $500,000 to $749,999 | 0 (0.0%) | 18 (3.3%) |
| $750,000 to $999,999 | 0 (0.0%) | 0 (0.0%) |
| $1,000,000 or more | 0 (0.0%) | 0 (0.0%) |
| Total | 381 (100.0%) | 540 (100.0%) |
Household Income by Mortgage Status in Williamsburg
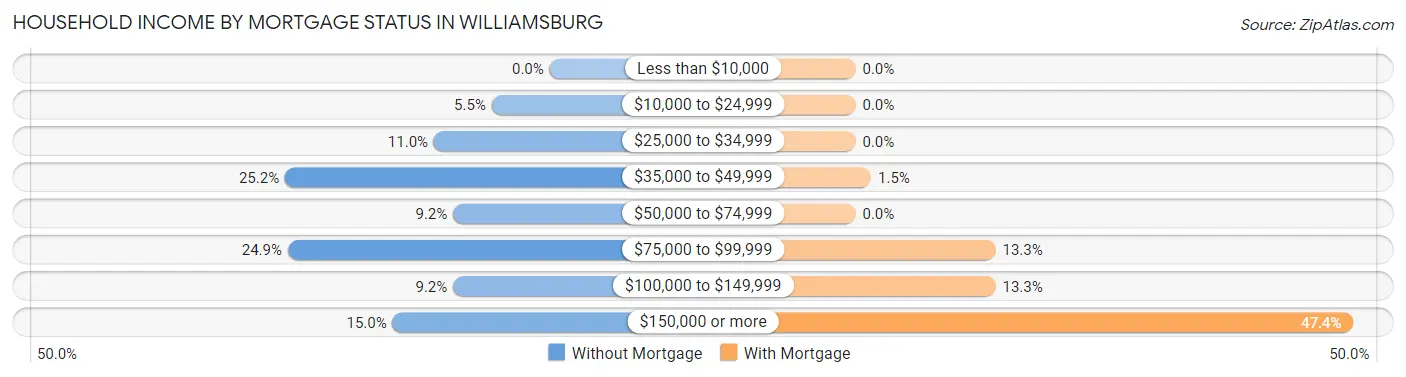
| Household Income | Without Mortgage | With Mortgage |
| Less than $10,000 | 0 (0.0%) | 0 (0.0%) |
| $10,000 to $24,999 | 21 (5.5%) | 0 (0.0%) |
| $25,000 to $34,999 | 42 (11.0%) | 0 (0.0%) |
| $35,000 to $49,999 | 96 (25.2%) | 8 (1.5%) |
| $50,000 to $74,999 | 35 (9.2%) | 0 (0.0%) |
| $75,000 to $99,999 | 95 (24.9%) | 72 (13.3%) |
| $100,000 to $149,999 | 35 (9.2%) | 72 (13.3%) |
| $150,000 or more | 57 (15.0%) | 256 (47.4%) |
| Total | 381 (100.0%) | 540 (100.0%) |
Property Value to Household Income Ratio in Williamsburg
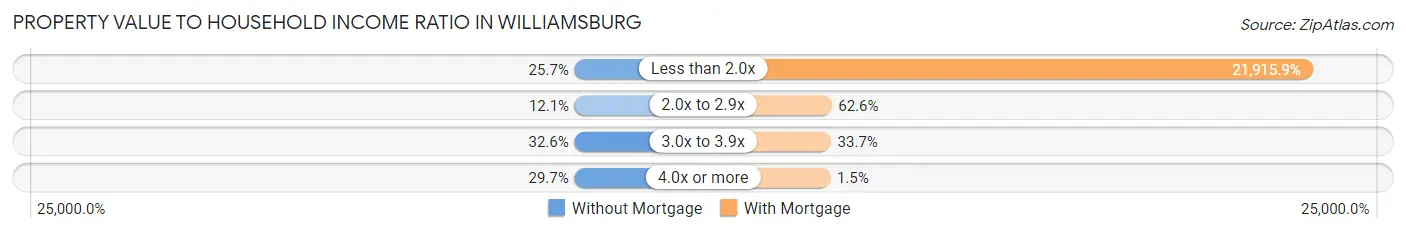
| Value-to-Income Ratio | Without Mortgage | With Mortgage |
| Less than 2.0x | 98 (25.7%) | 118,346 (21,915.9%) |
| 2.0x to 2.9x | 46 (12.1%) | 338 (62.6%) |
| 3.0x to 3.9x | 124 (32.6%) | 182 (33.7%) |
| 4.0x or more | 113 (29.7%) | 8 (1.5%) |
| Total | 381 (100.0%) | 540 (100.0%) |
Real Estate Taxes by Mortgage Status in Williamsburg
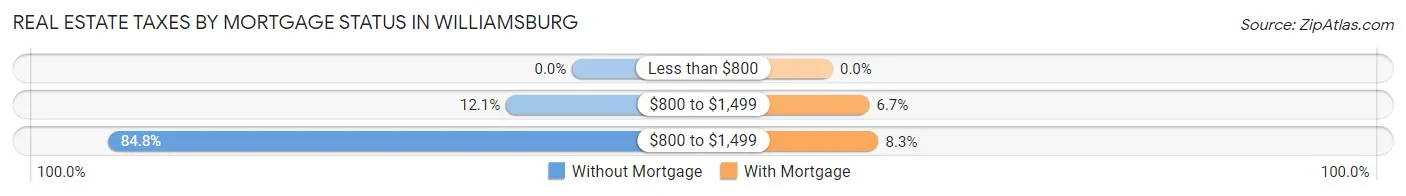
| Property Taxes | Without Mortgage | With Mortgage |
| Less than $800 | 0 (0.0%) | 0 (0.0%) |
| $800 to $1,499 | 46 (12.1%) | 36 (6.7%) |
| $800 to $1,499 | 323 (84.8%) | 45 (8.3%) |
| Total | 381 (100.0%) | 540 (100.0%) |
Health & Disability in Williamsburg
Health Insurance Coverage by Age in Williamsburg
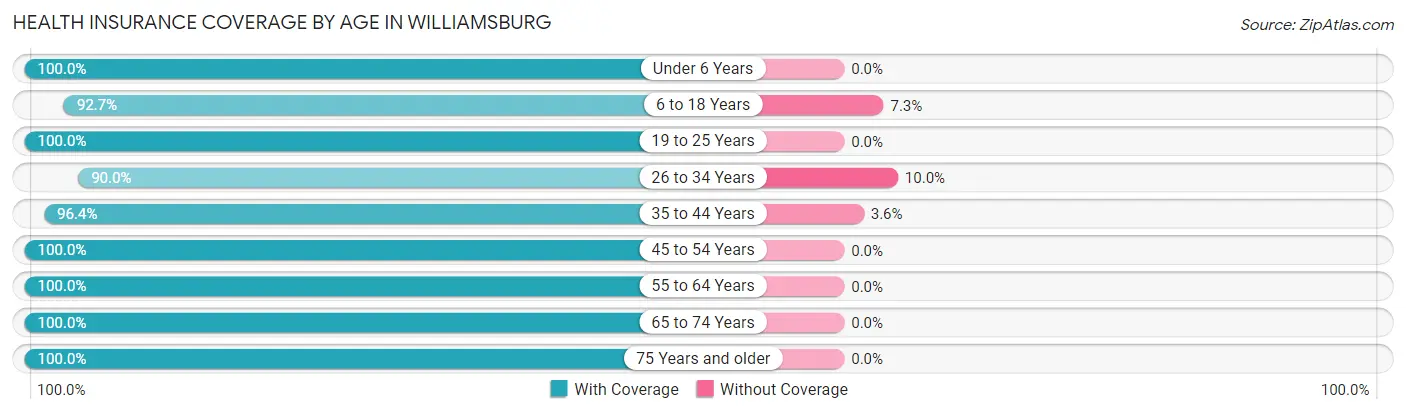
| Age Bracket | With Coverage | Without Coverage |
| Under 6 Years | 226 (100.0%) | 0 (0.0%) |
| 6 to 18 Years | 557 (92.7%) | 44 (7.3%) |
| 19 to 25 Years | 339 (100.0%) | 0 (0.0%) |
| 26 to 34 Years | 396 (90.0%) | 44 (10.0%) |
| 35 to 44 Years | 345 (96.4%) | 13 (3.6%) |
| 45 to 54 Years | 552 (100.0%) | 0 (0.0%) |
| 55 to 64 Years | 395 (100.0%) | 0 (0.0%) |
| 65 to 74 Years | 142 (100.0%) | 0 (0.0%) |
| 75 Years and older | 217 (100.0%) | 0 (0.0%) |
| Total | 3,169 (96.9%) | 101 (3.1%) |
Health Insurance Coverage by Citizenship Status in Williamsburg
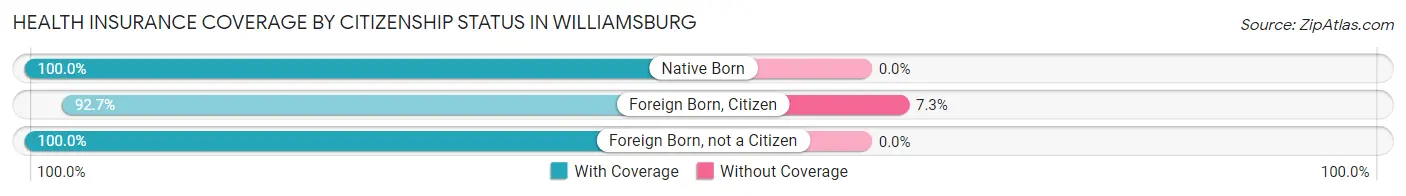
| Citizenship Status | With Coverage | Without Coverage |
| Native Born | 226 (100.0%) | 0 (0.0%) |
| Foreign Born, Citizen | 557 (92.7%) | 44 (7.3%) |
| Foreign Born, not a Citizen | 339 (100.0%) | 0 (0.0%) |
Health Insurance Coverage by Household Income in Williamsburg
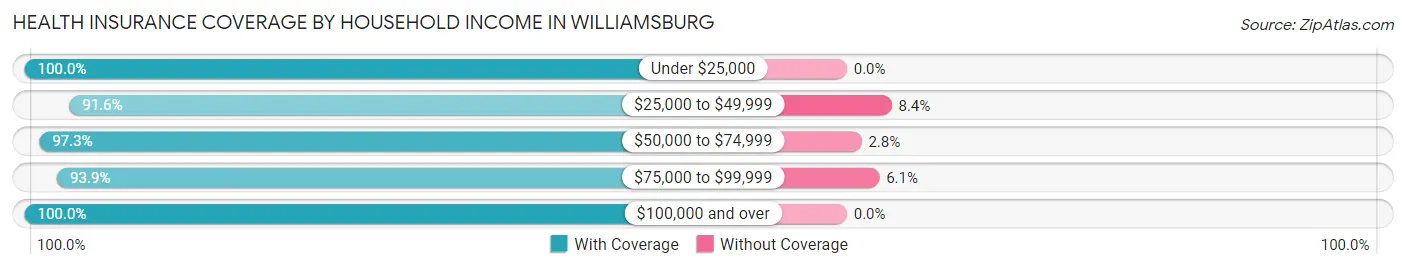
| Household Income | With Coverage | Without Coverage |
| Under $25,000 | 113 (100.0%) | 0 (0.0%) |
| $25,000 to $49,999 | 481 (91.6%) | 44 (8.4%) |
| $50,000 to $74,999 | 459 (97.3%) | 13 (2.8%) |
| $75,000 to $99,999 | 680 (93.9%) | 44 (6.1%) |
| $100,000 and over | 1,436 (100.0%) | 0 (0.0%) |
Public vs Private Health Insurance Coverage by Age in Williamsburg
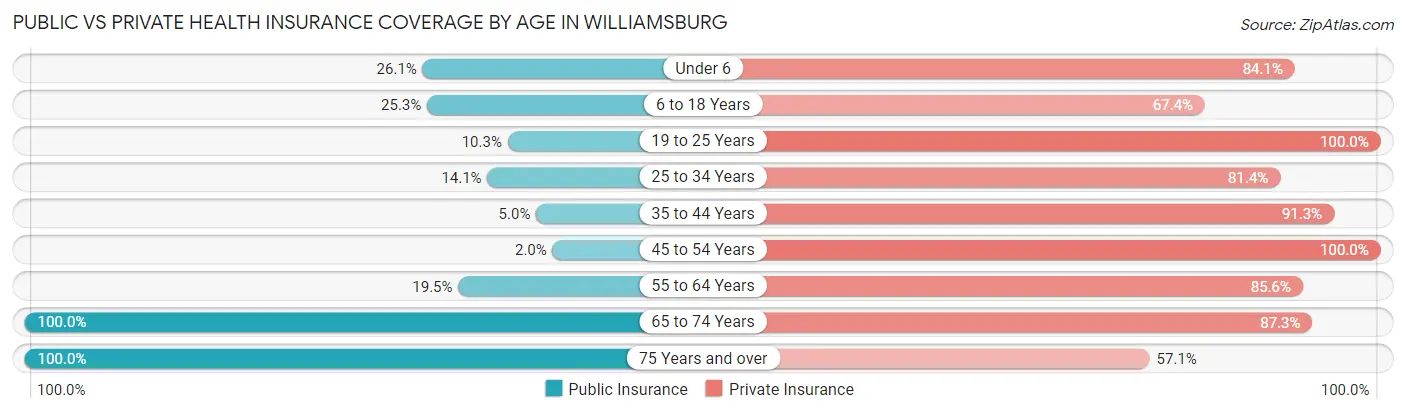
| Age Bracket | Public Insurance | Private Insurance |
| Under 6 | 59 (26.1%) | 190 (84.1%) |
| 6 to 18 Years | 152 (25.3%) | 405 (67.4%) |
| 19 to 25 Years | 35 (10.3%) | 339 (100.0%) |
| 25 to 34 Years | 62 (14.1%) | 358 (81.4%) |
| 35 to 44 Years | 18 (5.0%) | 327 (91.3%) |
| 45 to 54 Years | 11 (2.0%) | 552 (100.0%) |
| 55 to 64 Years | 77 (19.5%) | 338 (85.6%) |
| 65 to 74 Years | 142 (100.0%) | 124 (87.3%) |
| 75 Years and over | 217 (100.0%) | 124 (57.1%) |
| Total | 773 (23.6%) | 2,757 (84.3%) |
Disability Status by Sex by Age in Williamsburg
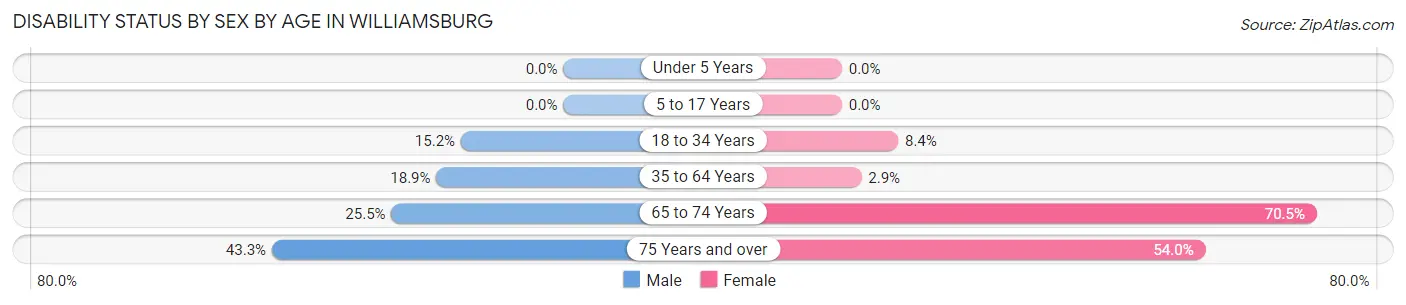
| Age Bracket | Male | Female |
| Under 5 Years | 0 (0.0%) | 0 (0.0%) |
| 5 to 17 Years | 0 (0.0%) | 0 (0.0%) |
| 18 to 34 Years | 61 (15.2%) | 37 (8.4%) |
| 35 to 64 Years | 142 (18.9%) | 16 (2.9%) |
| 65 to 74 Years | 12 (25.5%) | 67 (70.5%) |
| 75 Years and over | 29 (43.3%) | 81 (54.0%) |
Disability Class by Sex by Age in Williamsburg
Disability Class: Hearing Difficulty
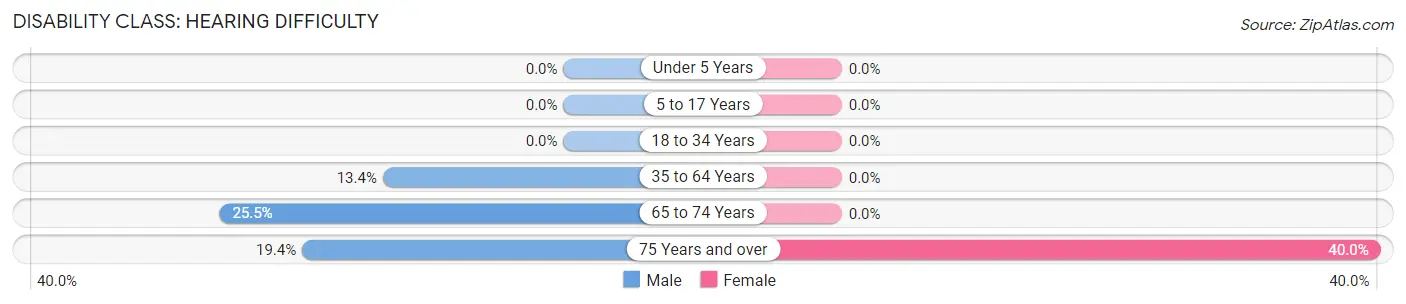
| Age Bracket | Male | Female |
| Under 5 Years | 0 (0.0%) | 0 (0.0%) |
| 5 to 17 Years | 0 (0.0%) | 0 (0.0%) |
| 18 to 34 Years | 0 (0.0%) | 0 (0.0%) |
| 35 to 64 Years | 101 (13.4%) | 0 (0.0%) |
| 65 to 74 Years | 12 (25.5%) | 0 (0.0%) |
| 75 Years and over | 13 (19.4%) | 60 (40.0%) |
Disability Class: Vision Difficulty
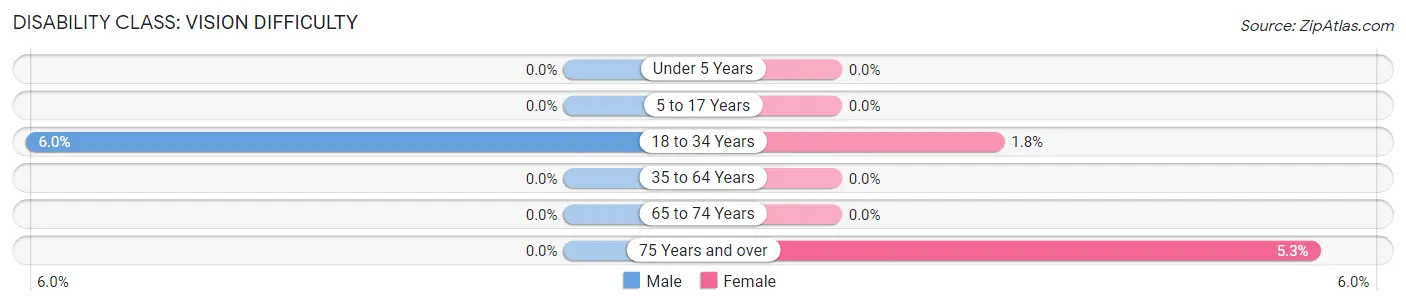
| Age Bracket | Male | Female |
| Under 5 Years | 0 (0.0%) | 0 (0.0%) |
| 5 to 17 Years | 0 (0.0%) | 0 (0.0%) |
| 18 to 34 Years | 24 (6.0%) | 8 (1.8%) |
| 35 to 64 Years | 0 (0.0%) | 0 (0.0%) |
| 65 to 74 Years | 0 (0.0%) | 0 (0.0%) |
| 75 Years and over | 0 (0.0%) | 8 (5.3%) |
Disability Class: Cognitive Difficulty
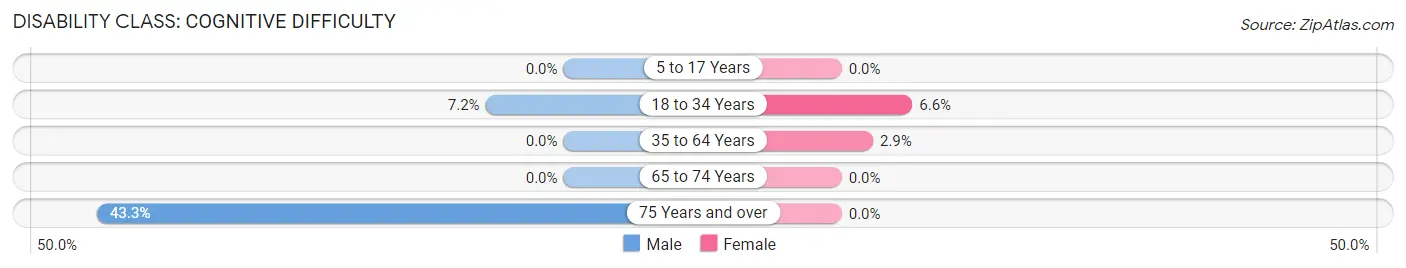
| Age Bracket | Male | Female |
| 5 to 17 Years | 0 (0.0%) | 0 (0.0%) |
| 18 to 34 Years | 29 (7.2%) | 29 (6.6%) |
| 35 to 64 Years | 0 (0.0%) | 16 (2.9%) |
| 65 to 74 Years | 0 (0.0%) | 0 (0.0%) |
| 75 Years and over | 29 (43.3%) | 0 (0.0%) |
Disability Class: Ambulatory Difficulty
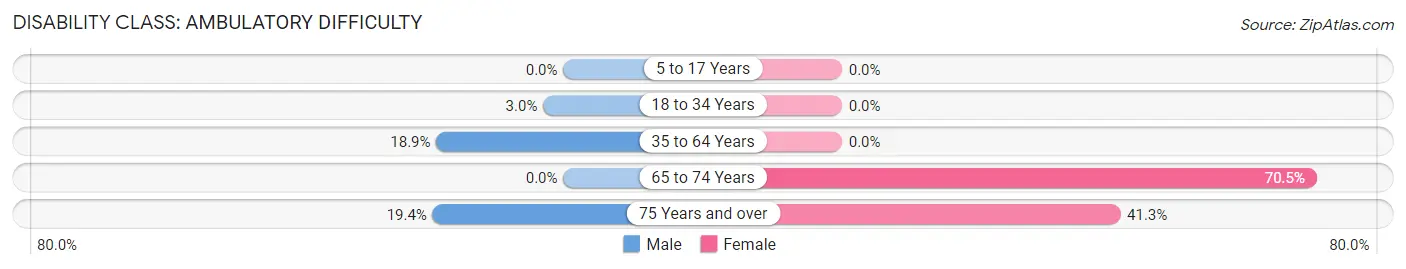
| Age Bracket | Male | Female |
| 5 to 17 Years | 0 (0.0%) | 0 (0.0%) |
| 18 to 34 Years | 12 (3.0%) | 0 (0.0%) |
| 35 to 64 Years | 142 (18.9%) | 0 (0.0%) |
| 65 to 74 Years | 0 (0.0%) | 67 (70.5%) |
| 75 Years and over | 13 (19.4%) | 62 (41.3%) |
Disability Class: Self-Care Difficulty
| Age Bracket | Male | Female |
| 5 to 17 Years | 0 (0.0%) | 0 (0.0%) |
| 18 to 34 Years | 0 (0.0%) | 0 (0.0%) |
| 35 to 64 Years | 0 (0.0%) | 0 (0.0%) |
| 65 to 74 Years | 0 (0.0%) | 0 (0.0%) |
| 75 Years and over | 0 (0.0%) | 0 (0.0%) |
Technology Access in Williamsburg
Computing Device Access in Williamsburg
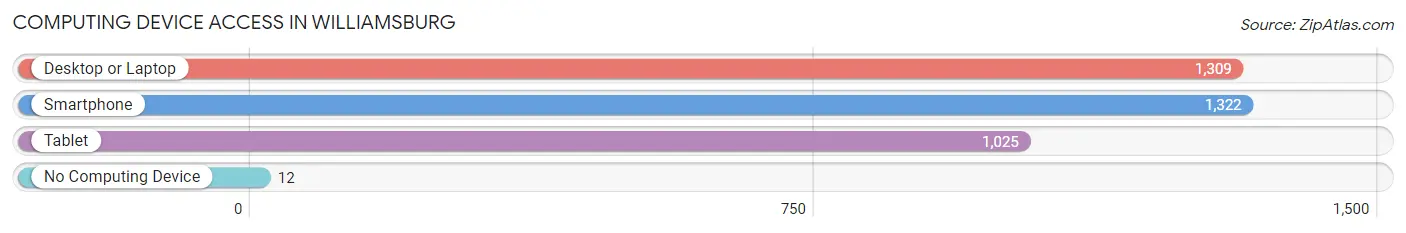
| Device Type | # Households | % Households |
| Desktop or Laptop | 1,309 | 88.7% |
| Smartphone | 1,322 | 89.6% |
| Tablet | 1,025 | 69.5% |
| No Computing Device | 12 | 0.8% |
| Total | 1,475 | 100.0% |
Internet Access in Williamsburg
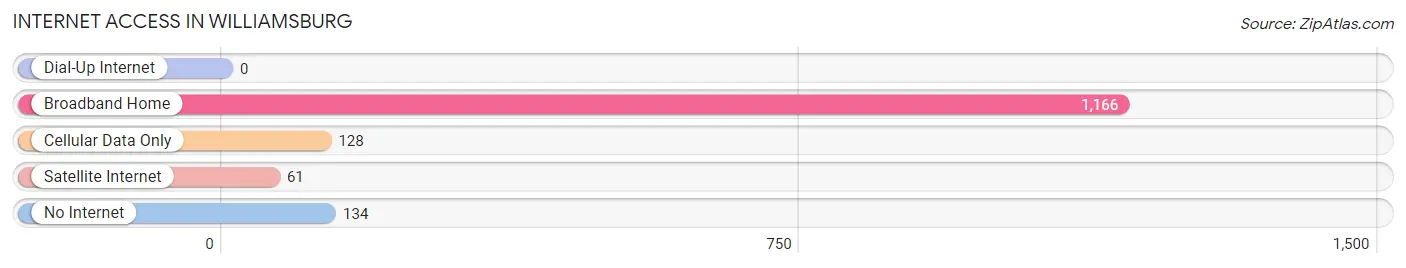
| Internet Type | # Households | % Households |
| Dial-Up Internet | 0 | 0.0% |
| Broadband Home | 1,166 | 79.0% |
| Cellular Data Only | 128 | 8.7% |
| Satellite Internet | 61 | 4.1% |
| No Internet | 134 | 9.1% |
| Total | 1,475 | 100.0% |
Williamsburg Summary
Williamsburg, Iowa is a small city located in Iowa County, Iowa, United States. It is situated on the banks of the Iowa River, about 30 miles south of Cedar Rapids. The city has a population of 2,845 as of the 2010 census.
History
Williamsburg was founded in 1839 by a group of settlers from New York. The city was named after William Williams, one of the original settlers. The city was incorporated in 1851 and has since grown to become a thriving community.
The city was an important stop on the Underground Railroad, with many slaves escaping to freedom in Canada. The city was also a major stop on the Chicago, Burlington and Quincy Railroad, which connected the city to the rest of the country.
Geography
Williamsburg is located at 41°45'N, 91°45'W (41.75, -91.75). The city is situated on the banks of the Iowa River, about 30 miles south of Cedar Rapids. The city has a total area of 2.2 square miles, all of which is land.
The city is located in a rural area, with rolling hills and farmland surrounding it. The city is also located near the Amana Colonies, a historic German settlement.
Economy
Williamsburg is a small city with a diverse economy. The city is home to several manufacturing companies, including a furniture factory, a plastics factory, and a printing company. The city also has a number of retail stores, restaurants, and other businesses.
The city is also home to a number of educational institutions, including a community college, a technical college, and a vocational school.
Demographics
As of the 2010 census, Williamsburg had a population of 2,845. The racial makeup of the city was 97.2% White, 0.7% African American, 0.3% Native American, 0.3% Asian, 0.1% Pacific Islander, 0.3% from other races, and 1.2% from two or more races. Hispanic or Latino of any race were 1.2% of the population.
The median income for a household in the city was $41,250, and the median income for a family was $50,000. The per capita income for the city was $20,845. About 8.3% of families and 10.2% of the population were below the poverty line, including 14.2% of those under age 18 and 8.2% of those age 65 or over.
Williamsburg is a small city with a rich history and a diverse economy. The city is home to a number of educational institutions, manufacturing companies, and other businesses. The city has a population of 2,845 as of the 2010 census, with a median income of $41,250 for a household and $50,000 for a family.
Common Questions
What is Per Capita Income in Williamsburg?
Per Capita income in Williamsburg is $45,923.
What is the Median Family Income in Williamsburg?
Median Family Income in Williamsburg is $105,964.
What is the Median Household income in Williamsburg?
Median Household Income in Williamsburg is $78,861.
What is Income or Wage Gap in Williamsburg?
Income or Wage Gap in Williamsburg is 30.1%.
Women in Williamsburg earn 69.9 cents for every dollar earned by a man.
What is Inequality or Gini Index in Williamsburg?
Inequality or Gini Index in Williamsburg is 0.46.
What is the Total Population of Williamsburg?
Total Population of Williamsburg is 3,332.
What is the Total Male Population of Williamsburg?
Total Male Population of Williamsburg is 1,684.
What is the Total Female Population of Williamsburg?
Total Female Population of Williamsburg is 1,648.
What is the Ratio of Males per 100 Females in Williamsburg?
There are 102.18 Males per 100 Females in Williamsburg.
What is the Ratio of Females per 100 Males in Williamsburg?
There are 97.86 Females per 100 Males in Williamsburg.
What is the Median Population Age in Williamsburg?
Median Population Age in Williamsburg is 37.8 Years.
What is the Average Family Size in Williamsburg
Average Family Size in Williamsburg is 2.9 People.
What is the Average Household Size in Williamsburg
Average Household Size in Williamsburg is 2.2 People.
How Large is the Labor Force in Williamsburg?
There are 2,015 People in the Labor Forcein in Williamsburg.
What is the Percentage of People in the Labor Force in Williamsburg?
76.4% of People are in the Labor Force in Williamsburg.
What is the Unemployment Rate in Williamsburg?
Unemployment Rate in Williamsburg is 5.4%.