Victor, IA Map & Demographics
Victor Map
Victor Overview
$27,771
PER CAPITA INCOME
$72,727
AVG FAMILY INCOME
$64,141
AVG HOUSEHOLD INCOME
6.8%
WAGE / INCOME GAP [ % ]
93.2¢/ $1
WAGE / INCOME GAP [ $ ]
0.36
INEQUALITY / GINI INDEX
946
TOTAL POPULATION
473
MALE POPULATION
473
FEMALE POPULATION
100.00
MALES / 100 FEMALES
100.00
FEMALES / 100 MALES
43.3
MEDIAN AGE
3.4
AVG FAMILY SIZE
2.8
AVG HOUSEHOLD SIZE
423
LABOR FORCE [ PEOPLE ]
60.3%
PERCENT IN LABOR FORCE
1.9%
UNEMPLOYMENT RATE
Victor Zip Codes
Victor Area Codes
Income in Victor
Income Overview in Victor
Per Capita Income in Victor is $27,771, while median incomes of families and households are $72,727 and $64,141 respectively.
| Characteristic | Number | Measure |
| Per Capita Income | 946 | $27,771 |
| Median Family Income | 234 | $72,727 |
| Mean Family Income | 234 | $80,034 |
| Median Household Income | 343 | $64,141 |
| Mean Household Income | 343 | $70,390 |
| Income Deficit | 234 | $0 |
| Wage / Income Gap (%) | 946 | 6.82% |
| Wage / Income Gap ($) | 946 | 93.18¢ per $1 |
| Gini / Inequality Index | 946 | 0.36 |
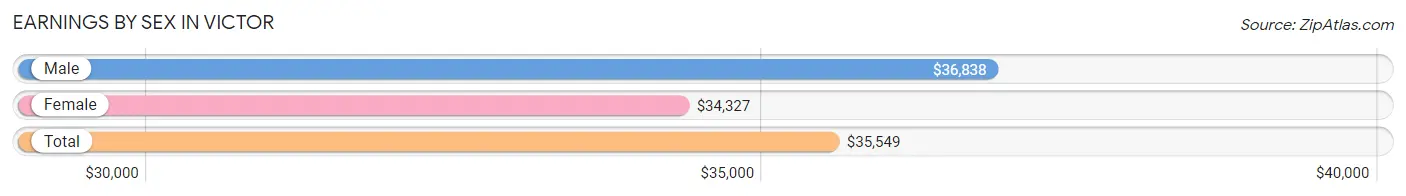
Earnings by Sex in Victor
Average Earnings in Victor are $35,549, $36,838 for men and $34,327 for women, a difference of 6.8%.
| Sex | Number | Average Earnings |
| Male | 269 (53.2%) | $36,838 |
| Female | 237 (46.8%) | $34,327 |
| Total | 506 (100.0%) | $35,549 |
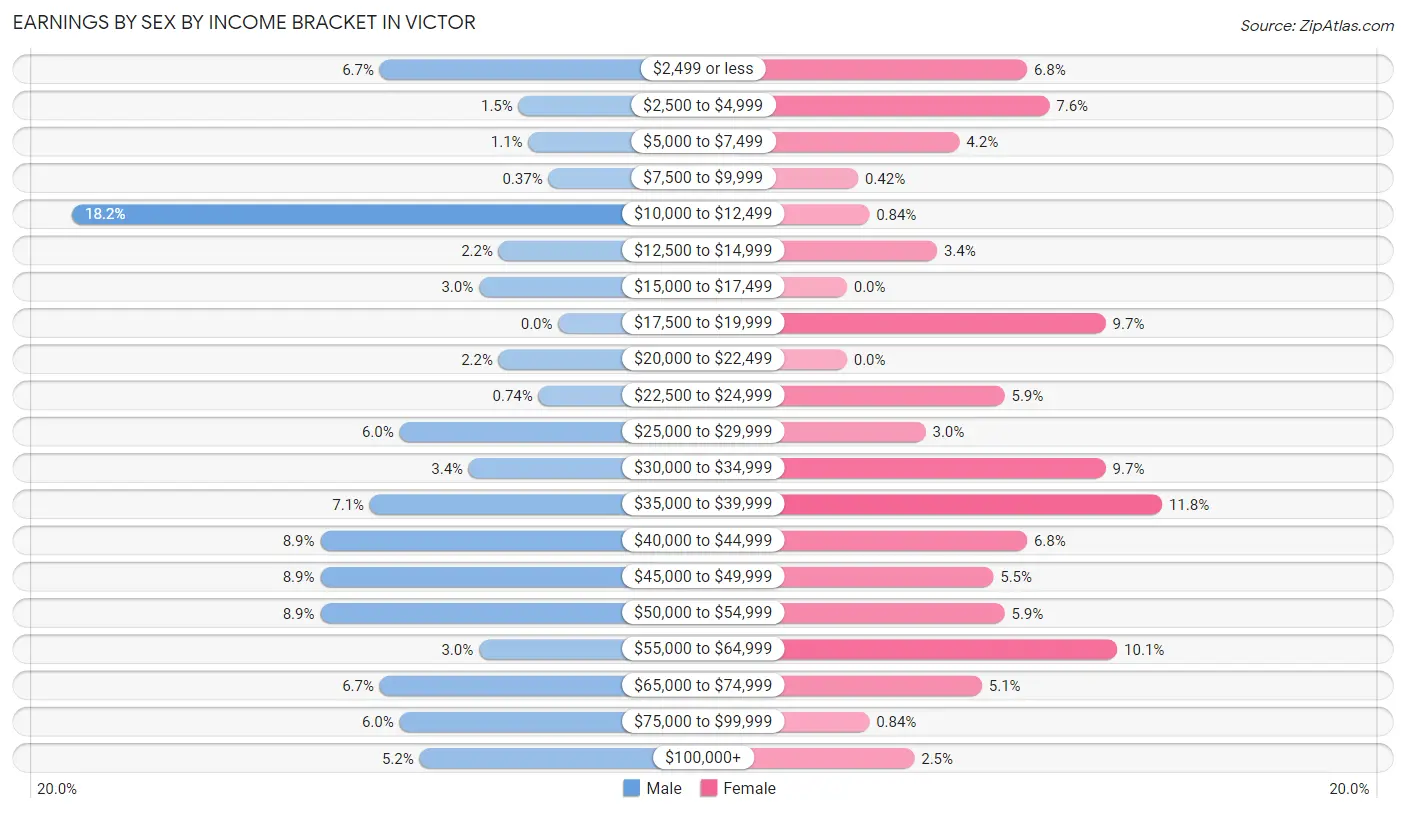
Earnings by Sex by Income Bracket in Victor
The most common earnings brackets in Victor are $10,000 to $12,499 for men (49 | 18.2%) and $35,000 to $39,999 for women (28 | 11.8%).
| Income | Male | Female |
| $2,499 or less | 18 (6.7%) | 16 (6.8%) |
| $2,500 to $4,999 | 4 (1.5%) | 18 (7.6%) |
| $5,000 to $7,499 | 3 (1.1%) | 10 (4.2%) |
| $7,500 to $9,999 | 1 (0.4%) | 1 (0.4%) |
| $10,000 to $12,499 | 49 (18.2%) | 2 (0.8%) |
| $12,500 to $14,999 | 6 (2.2%) | 8 (3.4%) |
| $15,000 to $17,499 | 8 (3.0%) | 0 (0.0%) |
| $17,500 to $19,999 | 0 (0.0%) | 23 (9.7%) |
| $20,000 to $22,499 | 6 (2.2%) | 0 (0.0%) |
| $22,500 to $24,999 | 2 (0.7%) | 14 (5.9%) |
| $25,000 to $29,999 | 16 (5.9%) | 7 (2.9%) |
| $30,000 to $34,999 | 9 (3.4%) | 23 (9.7%) |
| $35,000 to $39,999 | 19 (7.1%) | 28 (11.8%) |
| $40,000 to $44,999 | 24 (8.9%) | 16 (6.8%) |
| $45,000 to $49,999 | 24 (8.9%) | 13 (5.5%) |
| $50,000 to $54,999 | 24 (8.9%) | 14 (5.9%) |
| $55,000 to $64,999 | 8 (3.0%) | 24 (10.1%) |
| $65,000 to $74,999 | 18 (6.7%) | 12 (5.1%) |
| $75,000 to $99,999 | 16 (5.9%) | 2 (0.8%) |
| $100,000+ | 14 (5.2%) | 6 (2.5%) |
| Total | 269 (100.0%) | 237 (100.0%) |
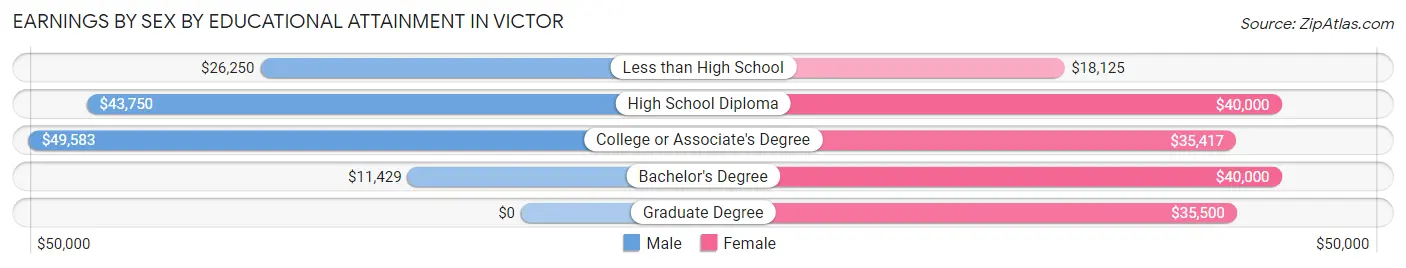
Earnings by Sex by Educational Attainment in Victor
Average earnings in Victor are $37,500 for men and $35,417 for women, a difference of 5.6%. Men with an educational attainment of college or associate's degree enjoy the highest average annual earnings of $49,583, while those with bachelor's degree education earn the least with $11,429. Women with an educational attainment of high school diploma earn the most with the average annual earnings of $40,000, while those with less than high school education have the smallest earnings of $18,125.
| Educational Attainment | Male Income | Female Income |
| Less than High School | $26,250 | $18,125 |
| High School Diploma | $43,750 | $40,000 |
| College or Associate's Degree | $49,583 | $35,417 |
| Bachelor's Degree | $11,429 | $40,000 |
| Graduate Degree | - | - |
| Total | $37,500 | $35,417 |
Family Income in Victor
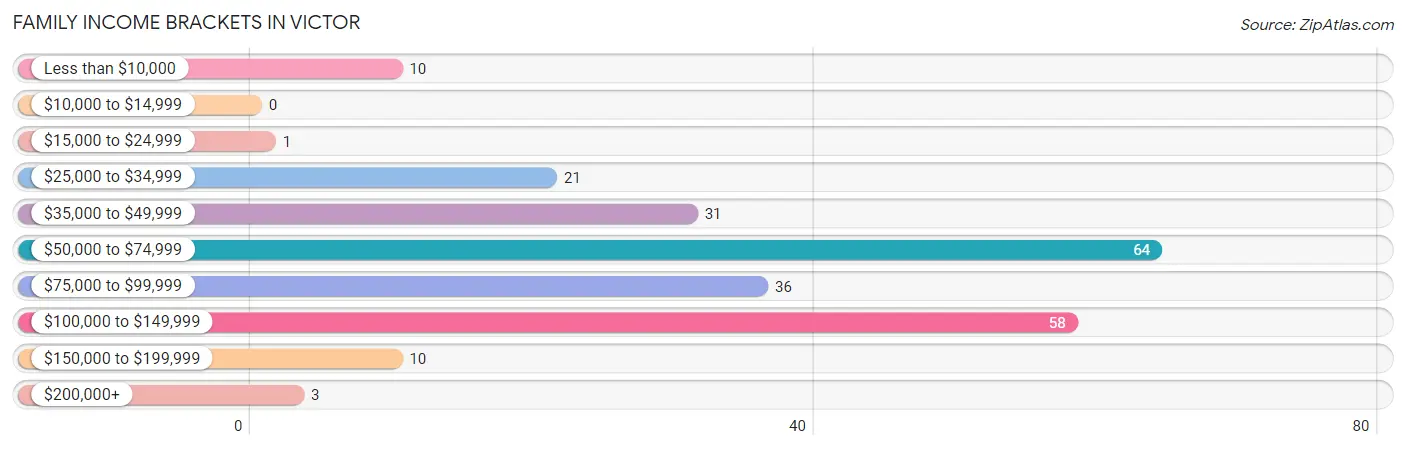
Family Income Brackets in Victor
According to the Victor family income data, there are 64 families falling into the $50,000 to $74,999 income range, which is the most common income bracket and makes up 27.4% of all families.
| Income Bracket | # Families | % Families |
| Less than $10,000 | 10 | 4.3% |
| $10,000 to $14,999 | 0 | 0.0% |
| $15,000 to $24,999 | 1 | 0.4% |
| $25,000 to $34,999 | 21 | 9.0% |
| $35,000 to $49,999 | 31 | 13.2% |
| $50,000 to $74,999 | 64 | 27.4% |
| $75,000 to $99,999 | 36 | 15.4% |
| $100,000 to $149,999 | 58 | 24.8% |
| $150,000 to $199,999 | 10 | 4.3% |
| $200,000+ | 3 | 1.3% |
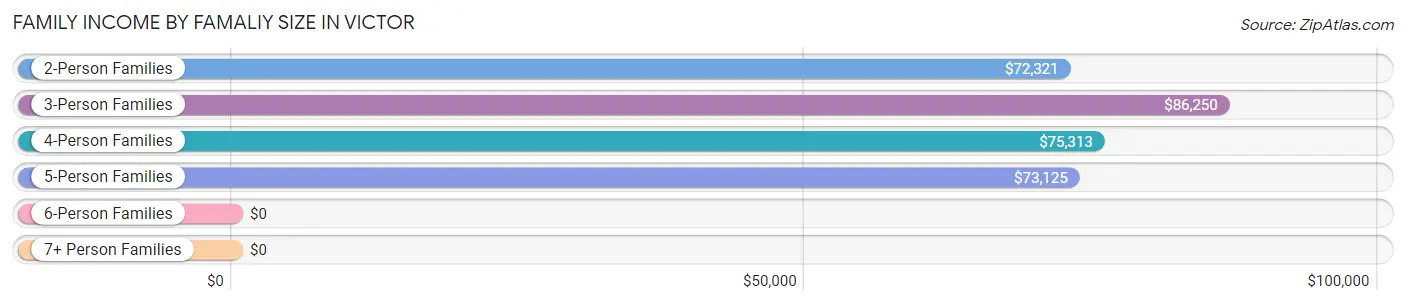
Family Income by Famaliy Size in Victor
3-person families (34 | 14.5%) account for the highest median family income in Victor with $86,250 per family, while 2-person families (137 | 58.6%) have the highest median income of $36,160 per family member.
| Income Bracket | # Families | Median Income |
| 2-Person Families | 137 (58.6%) | $72,321 |
| 3-Person Families | 34 (14.5%) | $86,250 |
| 4-Person Families | 29 (12.4%) | $75,313 |
| 5-Person Families | 20 (8.6%) | $73,125 |
| 6-Person Families | 1 (0.4%) | $0 |
| 7+ Person Families | 13 (5.6%) | $0 |
| Total | 234 (100.0%) | $72,727 |
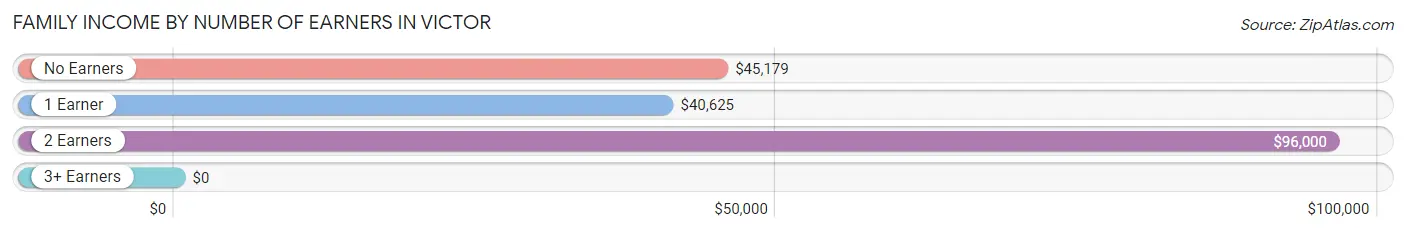
Family Income by Number of Earners in Victor
| Number of Earners | # Families | Median Income |
| No Earners | 51 (21.8%) | $45,179 |
| 1 Earner | 42 (17.9%) | $40,625 |
| 2 Earners | 114 (48.7%) | $96,000 |
| 3+ Earners | 27 (11.5%) | $0 |
| Total | 234 (100.0%) | $72,727 |
Household Income in Victor
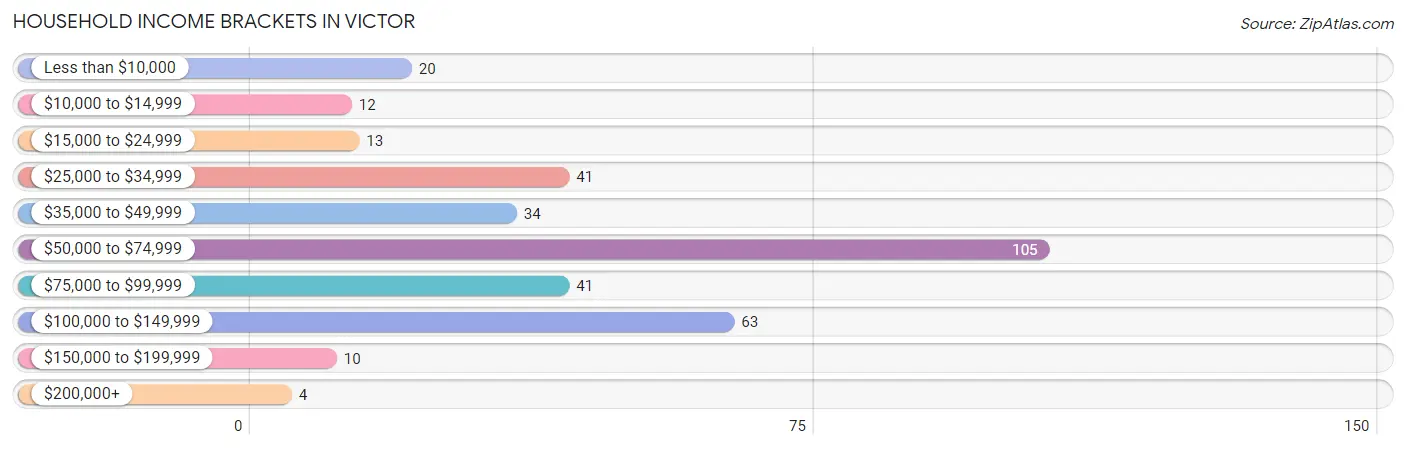
Household Income Brackets in Victor
With 105 households falling in the category, the $50,000 to $74,999 income range is the most frequent in Victor, accounting for 30.6% of all households. In contrast, only 4 households (1.2%) fall into the $200,000+ income bracket, making it the least populous group.
| Income Bracket | # Households | % Households |
| Less than $10,000 | 20 | 5.8% |
| $10,000 to $14,999 | 12 | 3.5% |
| $15,000 to $24,999 | 13 | 3.8% |
| $25,000 to $34,999 | 41 | 12.0% |
| $35,000 to $49,999 | 34 | 9.9% |
| $50,000 to $74,999 | 105 | 30.6% |
| $75,000 to $99,999 | 41 | 12.0% |
| $100,000 to $149,999 | 63 | 18.4% |
| $150,000 to $199,999 | 10 | 2.9% |
| $200,000+ | 4 | 1.2% |
Household Income by Householder Age in Victor
The median household income in Victor is $64,141, with the highest median household income of $84,375 found in the 45 to 64 years age bracket for the primary householder. A total of 130 households (37.9%) fall into this category. Meanwhile, the 65+ years age bracket for the primary householder has the lowest median household income of $44,583, with 111 households (32.4%) in this group.
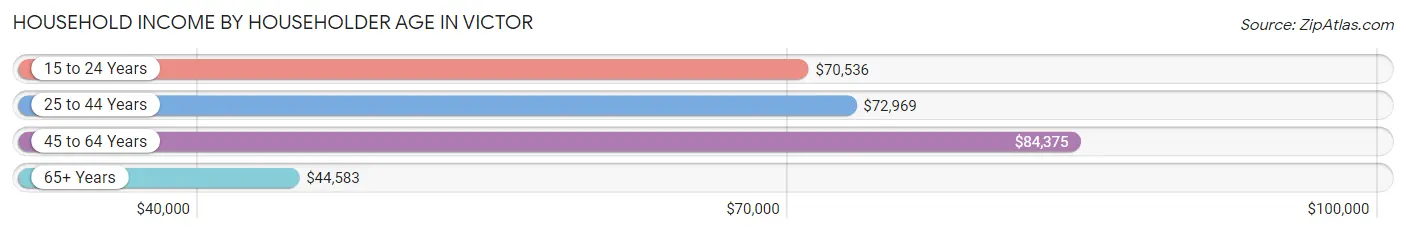
| Income Bracket | # Households | Median Income |
| 15 to 24 Years | 13 (3.8%) | $70,536 |
| 25 to 44 Years | 89 (26.0%) | $72,969 |
| 45 to 64 Years | 130 (37.9%) | $84,375 |
| 65+ Years | 111 (32.4%) | $44,583 |
| Total | 343 (100.0%) | $64,141 |
Poverty in Victor
Income Below Poverty by Sex and Age in Victor
With 23.9% poverty level for males and 16.1% for females among the residents of Victor, 6 to 11 year old males and 6 to 11 year old females are the most vulnerable to poverty, with 37 males (74.0%) and 42 females (72.4%) in their respective age groups living below the poverty level.
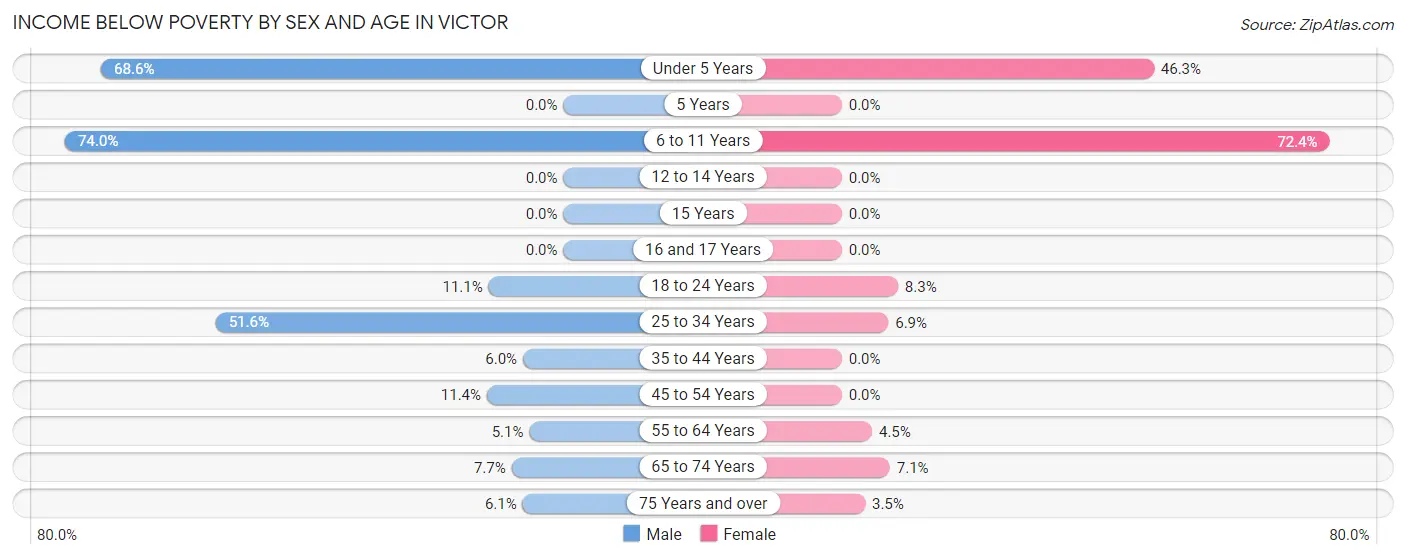
| Age Bracket | Male | Female |
| Under 5 Years | 35 (68.6%) | 19 (46.3%) |
| 5 Years | 0 (0.0%) | 0 (0.0%) |
| 6 to 11 Years | 37 (74.0%) | 42 (72.4%) |
| 12 to 14 Years | 0 (0.0%) | 0 (0.0%) |
| 15 Years | 0 (0.0%) | 0 (0.0%) |
| 16 and 17 Years | 0 (0.0%) | 0 (0.0%) |
| 18 to 24 Years | 3 (11.1%) | 2 (8.3%) |
| 25 to 34 Years | 16 (51.6%) | 4 (6.9%) |
| 35 to 44 Years | 3 (6.0%) | 0 (0.0%) |
| 45 to 54 Years | 10 (11.4%) | 0 (0.0%) |
| 55 to 64 Years | 4 (5.1%) | 4 (4.5%) |
| 65 to 74 Years | 3 (7.7%) | 4 (7.1%) |
| 75 Years and over | 2 (6.1%) | 1 (3.5%) |
| Total | 113 (23.9%) | 76 (16.1%) |
Income Above Poverty by Sex and Age in Victor
According to the poverty statistics in Victor, males aged 5 years and females aged 5 years are the age groups that are most secure financially, with 100.0% of males and 100.0% of females in these age groups living above the poverty line.
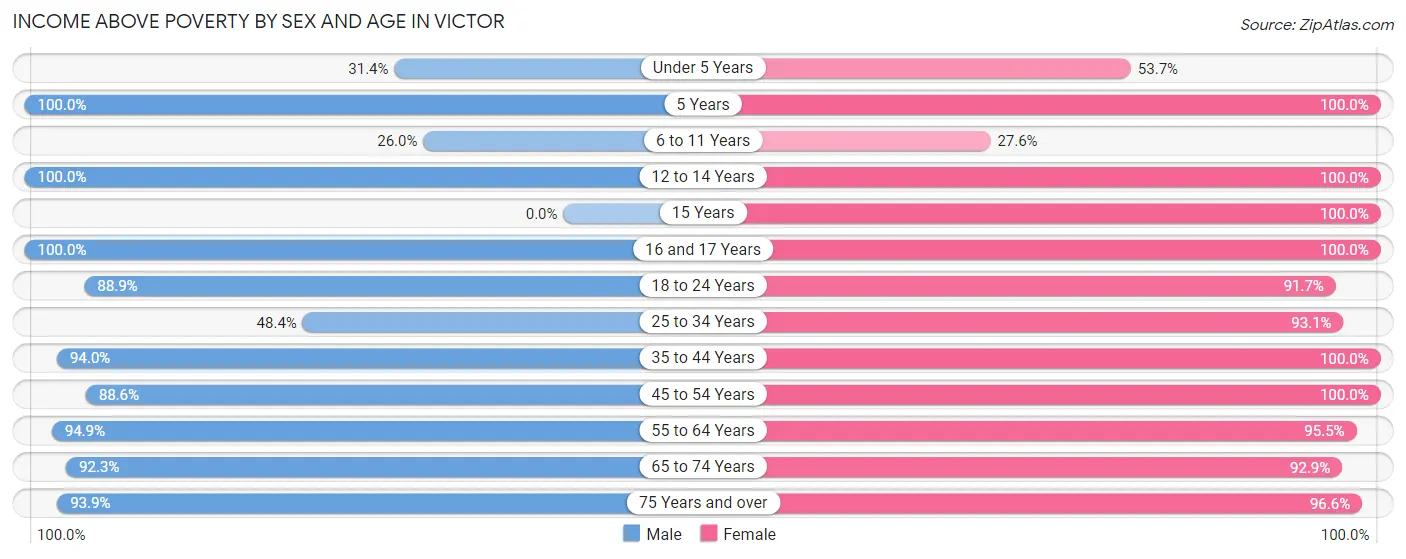
| Age Bracket | Male | Female |
| Under 5 Years | 16 (31.4%) | 22 (53.7%) |
| 5 Years | 5 (100.0%) | 3 (100.0%) |
| 6 to 11 Years | 13 (26.0%) | 16 (27.6%) |
| 12 to 14 Years | 1 (100.0%) | 28 (100.0%) |
| 15 Years | 0 (0.0%) | 7 (100.0%) |
| 16 and 17 Years | 19 (100.0%) | 4 (100.0%) |
| 18 to 24 Years | 24 (88.9%) | 22 (91.7%) |
| 25 to 34 Years | 15 (48.4%) | 54 (93.1%) |
| 35 to 44 Years | 47 (94.0%) | 30 (100.0%) |
| 45 to 54 Years | 78 (88.6%) | 46 (100.0%) |
| 55 to 64 Years | 75 (94.9%) | 85 (95.5%) |
| 65 to 74 Years | 36 (92.3%) | 52 (92.9%) |
| 75 Years and over | 31 (93.9%) | 28 (96.6%) |
| Total | 360 (76.1%) | 397 (83.9%) |
Income Below Poverty Among Married-Couple Families in Victor
The poverty statistics for married-couple families in Victor show that 3.7% or 7 of the total 187 families live below the poverty line. Families with 1 or 2 children have the highest poverty rate of 13.3%, comprising of 4 families. On the other hand, families with 3 or 4 children have the lowest poverty rate of 0.0%, which includes 0 families.
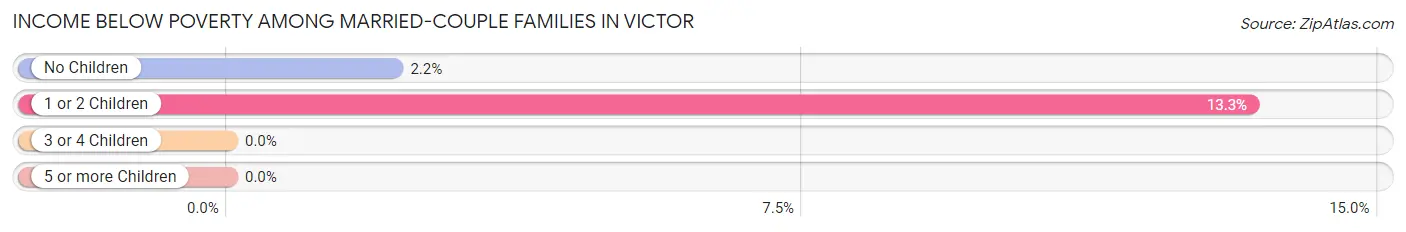
| Children | Above Poverty | Below Poverty |
| No Children | 136 (97.8%) | 3 (2.2%) |
| 1 or 2 Children | 26 (86.7%) | 4 (13.3%) |
| 3 or 4 Children | 18 (100.0%) | 0 (0.0%) |
| 5 or more Children | 0 (0.0%) | 0 (0.0%) |
| Total | 180 (96.3%) | 7 (3.7%) |
Income Below Poverty Among Single-Parent Households in Victor
According to the poverty data in Victor, 71.4% or 15 single-father households and 7.7% or 2 single-mother households are living below the poverty line. Among single-father households, those with 1 or 2 children have the highest poverty rate, with 2 households (100.0%) experiencing poverty. Likewise, among single-mother households, those with 1 or 2 children have the highest poverty rate, with 2 households (11.1%) falling below the poverty line.
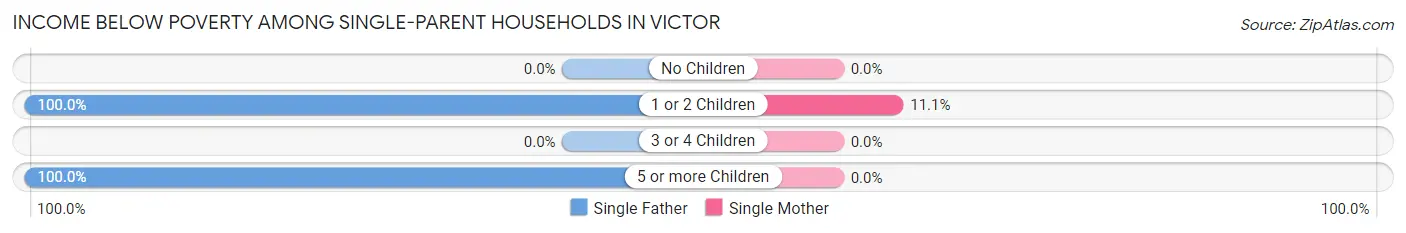
| Children | Single Father | Single Mother |
| No Children | 0 (0.0%) | 0 (0.0%) |
| 1 or 2 Children | 2 (100.0%) | 2 (11.1%) |
| 3 or 4 Children | 0 (0.0%) | 0 (0.0%) |
| 5 or more Children | 13 (100.0%) | 0 (0.0%) |
| Total | 15 (71.4%) | 2 (7.7%) |
Income Below Poverty Among Married-Couple vs Single-Parent Households in Victor
The poverty data for Victor shows that 7 of the married-couple family households (3.7%) and 17 of the single-parent households (36.2%) are living below the poverty level. Within the married-couple family households, those with 1 or 2 children have the highest poverty rate, with 4 households (13.3%) falling below the poverty line. Among the single-parent households, those with 5 or more children have the highest poverty rate, with 13 household (100.0%) living below poverty.
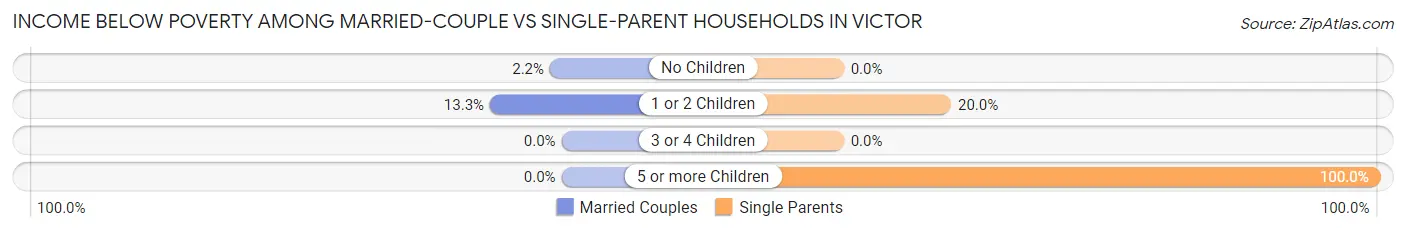
| Children | Married-Couple Families | Single-Parent Households |
| No Children | 3 (2.2%) | 0 (0.0%) |
| 1 or 2 Children | 4 (13.3%) | 4 (20.0%) |
| 3 or 4 Children | 0 (0.0%) | 0 (0.0%) |
| 5 or more Children | 0 (0.0%) | 13 (100.0%) |
| Total | 7 (3.7%) | 17 (36.2%) |
Race in Victor
The most populous races in Victor are White / Caucasian (894 | 94.5%), Two or more Races (51 | 5.4%), and Hispanic or Latino (2 | 0.2%).
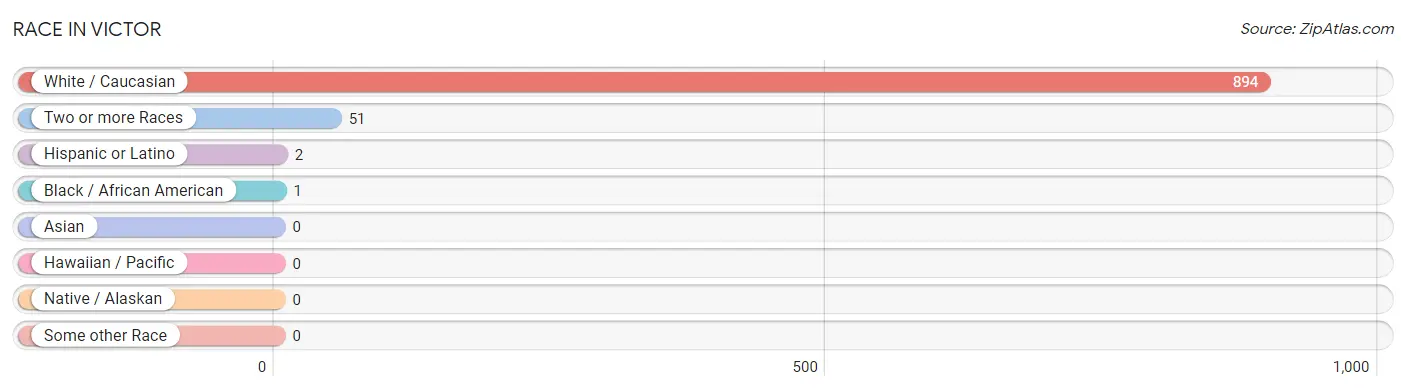
| Race | # Population | % Population |
| Asian | 0 | 0.0% |
| Black / African American | 1 | 0.1% |
| Hawaiian / Pacific | 0 | 0.0% |
| Hispanic or Latino | 2 | 0.2% |
| Native / Alaskan | 0 | 0.0% |
| White / Caucasian | 894 | 94.5% |
| Two or more Races | 51 | 5.4% |
| Some other Race | 0 | 0.0% |
| Total | 946 | 100.0% |
Ancestry in Victor
The most populous ancestries reported in Victor are German (429 | 45.4%), Irish (238 | 25.2%), Czech (83 | 8.8%), English (75 | 7.9%), and Belgian (53 | 5.6%), together accounting for 92.8% of all Victor residents.
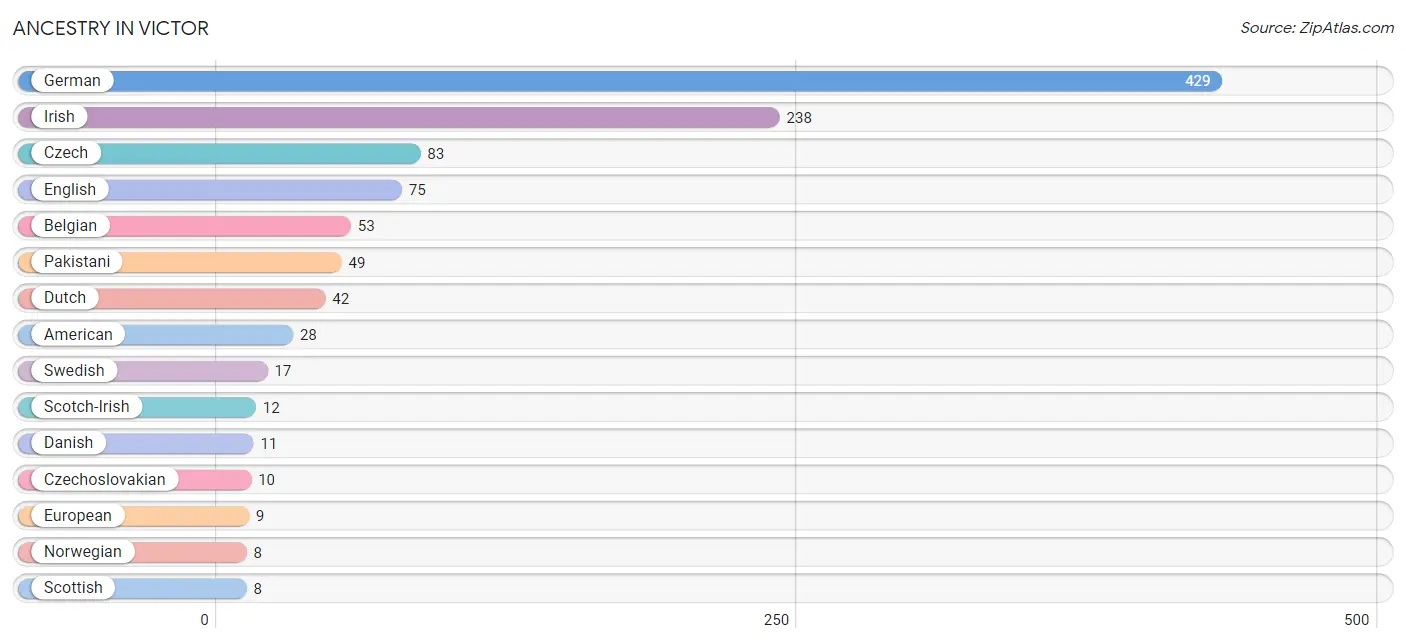
| Ancestry | # Population | % Population |
| African | 2 | 0.2% |
| American | 28 | 3.0% |
| Armenian | 2 | 0.2% |
| Belgian | 53 | 5.6% |
| Czech | 83 | 8.8% |
| Czechoslovakian | 10 | 1.1% |
| Danish | 11 | 1.2% |
| Dutch | 42 | 4.4% |
| English | 75 | 7.9% |
| European | 9 | 0.9% |
| French | 2 | 0.2% |
| German | 429 | 45.4% |
| German Russian | 3 | 0.3% |
| Irish | 238 | 25.2% |
| Mexican | 2 | 0.2% |
| Norwegian | 8 | 0.9% |
| Pakistani | 49 | 5.2% |
| Pennsylvania German | 4 | 0.4% |
| Russian | 6 | 0.6% |
| Scotch-Irish | 12 | 1.3% |
| Scottish | 8 | 0.9% |
| Subsaharan African | 2 | 0.2% |
| Swedish | 17 | 1.8% |
| Swiss | 2 | 0.2% |
| Welsh | 6 | 0.6% | View All 25 Rows |
Immigrants in Victor
The most numerous immigrant groups reported in Victor came from Eastern Europe (6 | 0.6%), Europe (6 | 0.6%), Russia (6 | 0.6%), Central America (2 | 0.2%), and Latin America (2 | 0.2%), together accounting for 2.3% of all Victor residents.
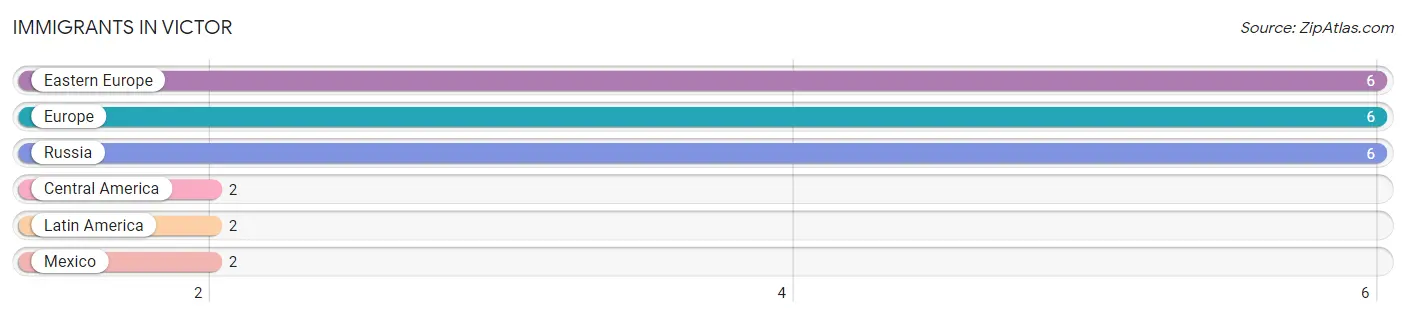
| Immigration Origin | # Population | % Population |
| Central America | 2 | 0.2% |
| Eastern Europe | 6 | 0.6% |
| Europe | 6 | 0.6% |
| Latin America | 2 | 0.2% |
| Mexico | 2 | 0.2% |
| Russia | 6 | 0.6% | View All 6 Rows |
Sex and Age in Victor
Sex and Age in Victor
The most populous age groups in Victor are 50 to 54 Years (67 | 14.2%) for men and 60 to 64 Years (63 | 13.3%) for women.
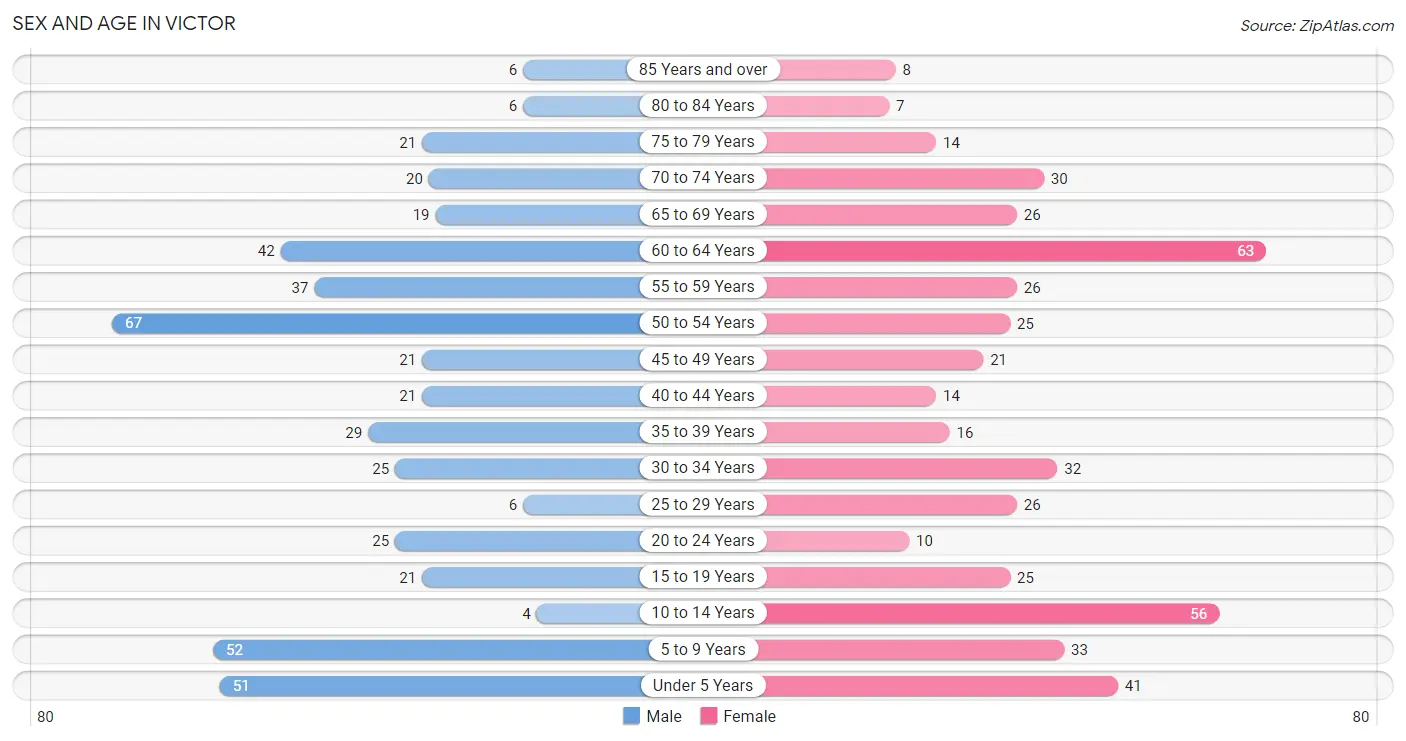
| Age Bracket | Male | Female |
| Under 5 Years | 51 (10.8%) | 41 (8.7%) |
| 5 to 9 Years | 52 (11.0%) | 33 (7.0%) |
| 10 to 14 Years | 4 (0.9%) | 56 (11.8%) |
| 15 to 19 Years | 21 (4.4%) | 25 (5.3%) |
| 20 to 24 Years | 25 (5.3%) | 10 (2.1%) |
| 25 to 29 Years | 6 (1.3%) | 26 (5.5%) |
| 30 to 34 Years | 25 (5.3%) | 32 (6.8%) |
| 35 to 39 Years | 29 (6.1%) | 16 (3.4%) |
| 40 to 44 Years | 21 (4.4%) | 14 (3.0%) |
| 45 to 49 Years | 21 (4.4%) | 21 (4.4%) |
| 50 to 54 Years | 67 (14.2%) | 25 (5.3%) |
| 55 to 59 Years | 37 (7.8%) | 26 (5.5%) |
| 60 to 64 Years | 42 (8.9%) | 63 (13.3%) |
| 65 to 69 Years | 19 (4.0%) | 26 (5.5%) |
| 70 to 74 Years | 20 (4.2%) | 30 (6.3%) |
| 75 to 79 Years | 21 (4.4%) | 14 (3.0%) |
| 80 to 84 Years | 6 (1.3%) | 7 (1.5%) |
| 85 Years and over | 6 (1.3%) | 8 (1.7%) |
| Total | 473 (100.0%) | 473 (100.0%) |
Families and Households in Victor
Median Family Size in Victor
The median family size in Victor is 3.44 persons per family, with single male/father families (21 | 9.0%) accounting for the largest median family size of 7.33 persons per family. On the other hand, married-couple families (187 | 79.9%) represent the smallest median family size with 2.80 persons per family.
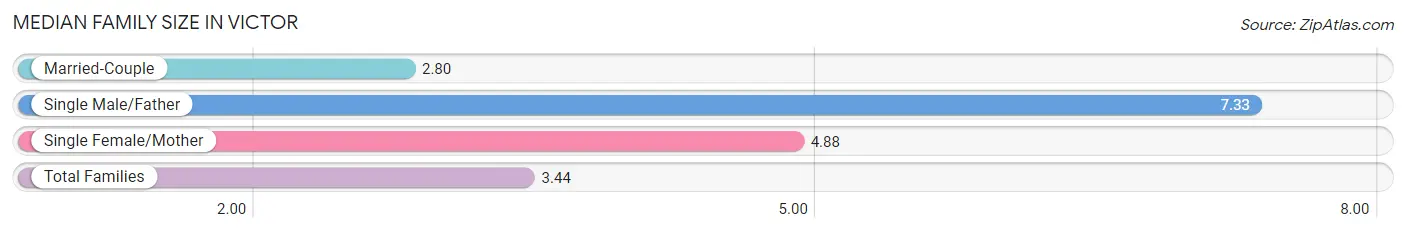
| Family Type | # Families | Family Size |
| Married-Couple | 187 (79.9%) | 2.80 |
| Single Male/Father | 21 (9.0%) | 7.33 |
| Single Female/Mother | 26 (11.1%) | 4.88 |
| Total Families | 234 (100.0%) | 3.44 |
Median Household Size in Victor
The median household size in Victor is 2.76 persons per household, with single male/father households (21 | 6.1%) accounting for the largest median household size of 8.05 persons per household. non-family households (109 | 31.8%) represent the smallest median household size with 1.14 persons per household.
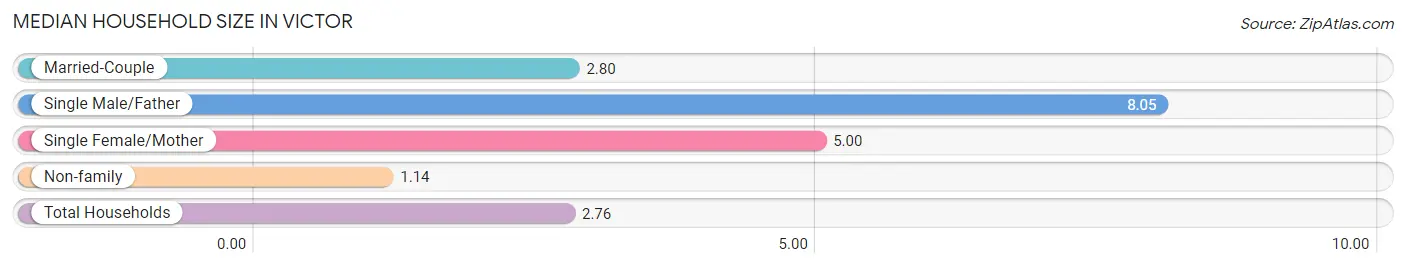
| Household Type | # Households | Household Size |
| Married-Couple | 187 (54.5%) | 2.80 |
| Single Male/Father | 21 (6.1%) | 8.05 |
| Single Female/Mother | 26 (7.6%) | 5.00 |
| Non-family | 109 (31.8%) | 1.14 |
| Total Households | 343 (100.0%) | 2.76 |
Household Size by Marriage Status in Victor
Out of a total of 343 households in Victor, 234 (68.2%) are family households, while 109 (31.8%) are nonfamily households. The most numerous type of family households are 2-person households, comprising 135, and the most common type of nonfamily households are 1-person households, comprising 93.
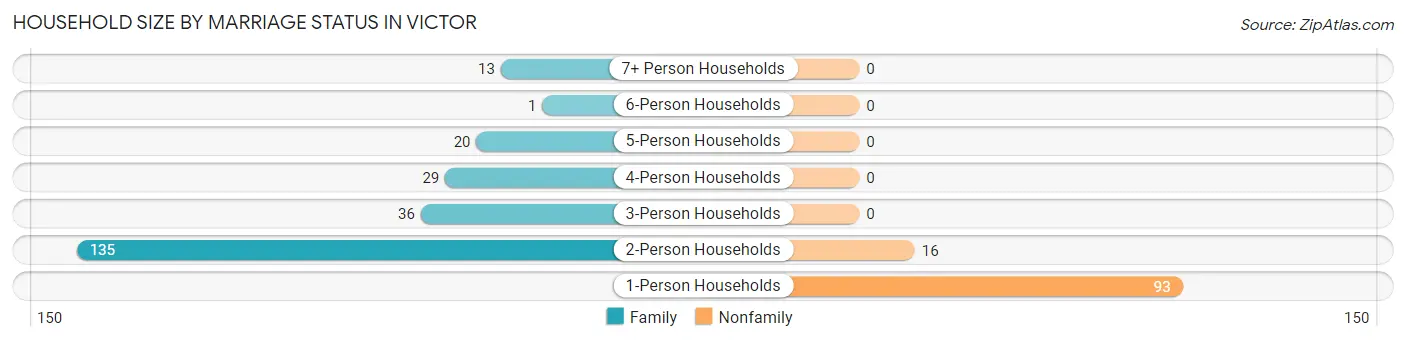
| Household Size | Family Households | Nonfamily Households |
| 1-Person Households | - | 93 (27.1%) |
| 2-Person Households | 135 (39.4%) | 16 (4.7%) |
| 3-Person Households | 36 (10.5%) | 0 (0.0%) |
| 4-Person Households | 29 (8.5%) | 0 (0.0%) |
| 5-Person Households | 20 (5.8%) | 0 (0.0%) |
| 6-Person Households | 1 (0.3%) | 0 (0.0%) |
| 7+ Person Households | 13 (3.8%) | 0 (0.0%) |
| Total | 234 (68.2%) | 109 (31.8%) |
Female Fertility in Victor
Fertility by Age in Victor
Average fertility rate in Victor is 238.0 births per 1,000 women. Women in the age bracket of 20 to 34 years have the highest fertility rate with 471.0 births per 1,000 women. Women in the age bracket of 20 to 34 years acount for 91.4% of all women with births.
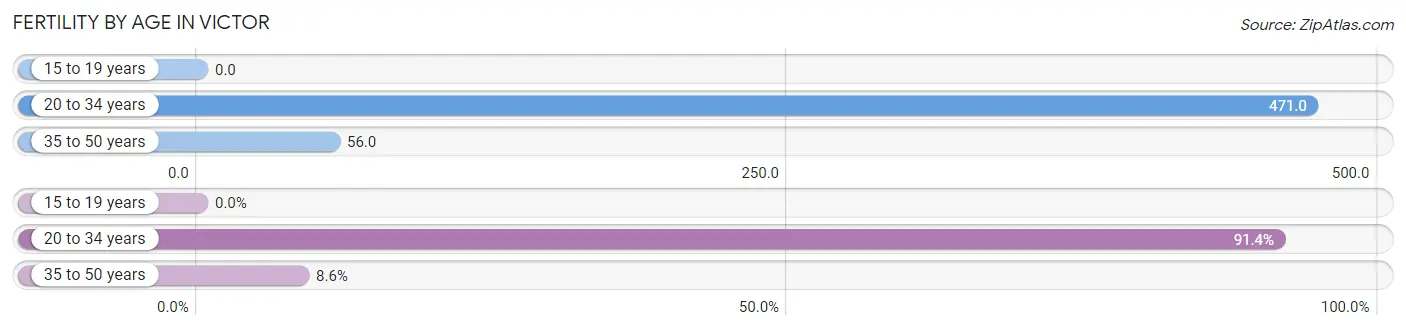
| Age Bracket | Women with Births | Births / 1,000 Women |
| 15 to 19 years | 0 (0.0%) | 0.0 |
| 20 to 34 years | 32 (91.4%) | 471.0 |
| 35 to 50 years | 3 (8.6%) | 56.0 |
| Total | 35 (100.0%) | 238.0 |
Fertility by Age by Marriage Status in Victor
57.1% of women with births (35) in Victor are married. The highest percentage of unmarried women with births falls into 20 to 34 years age bracket with 46.9% of them unmarried at the time of birth, while the lowest percentage of unmarried women with births belong to 35 to 50 years age bracket with 0.0% of them unmarried.
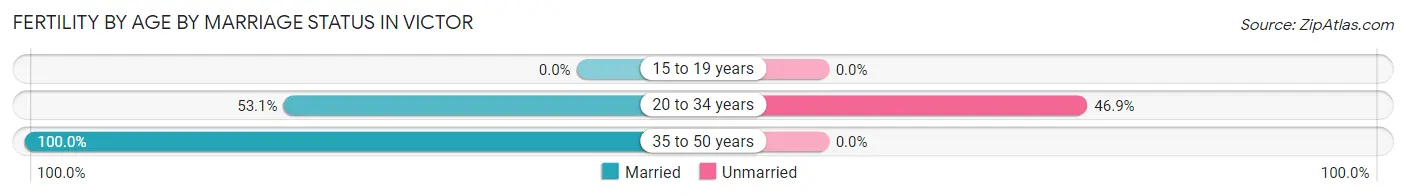
| Age Bracket | Married | Unmarried |
| 15 to 19 years | 0 (0.0%) | 0 (0.0%) |
| 20 to 34 years | 17 (53.1%) | 15 (46.9%) |
| 35 to 50 years | 3 (100.0%) | 0 (0.0%) |
| Total | 20 (57.1%) | 15 (42.9%) |
Fertility by Education in Victor
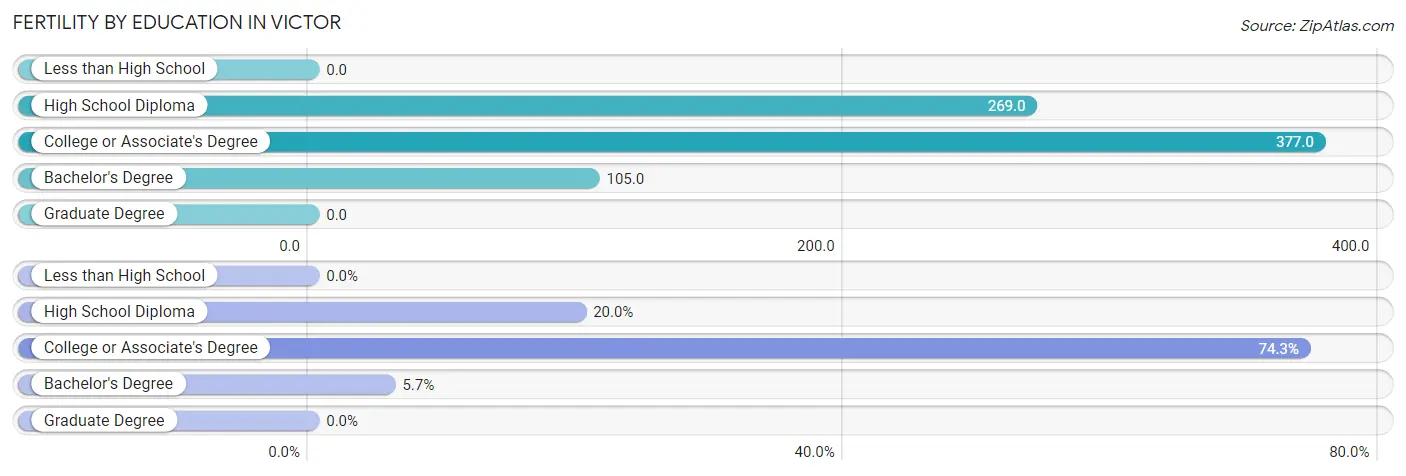
| Educational Attainment | Women with Births | Births / 1,000 Women |
| Less than High School | 0 (0.0%) | 0.0 |
| High School Diploma | 7 (20.0%) | 269.0 |
| College or Associate's Degree | 26 (74.3%) | 377.0 |
| Bachelor's Degree | 2 (5.7%) | 105.0 |
| Graduate Degree | 0 (0.0%) | 0.0 |
| Total | 35 (100.0%) | 238.0 |
Fertility by Education by Marriage Status in Victor
42.9% of women with births in Victor are unmarried. Women with the educational attainment of high school diploma are most likely to be married with 100.0% of them married at childbirth, while women with the educational attainment of college or associate's degree are least likely to be married with 57.7% of them unmarried at childbirth.
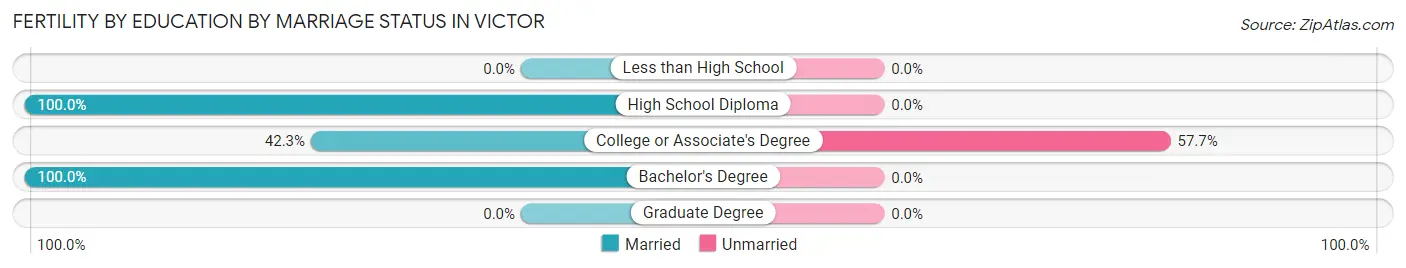
| Educational Attainment | Married | Unmarried |
| Less than High School | 0 (0.0%) | 0 (0.0%) |
| High School Diploma | 7 (100.0%) | 0 (0.0%) |
| College or Associate's Degree | 11 (42.3%) | 15 (57.7%) |
| Bachelor's Degree | 2 (100.0%) | 0 (0.0%) |
| Graduate Degree | 0 (0.0%) | 0 (0.0%) |
| Total | 20 (57.1%) | 15 (42.9%) |
Employment Characteristics in Victor
Employment by Class of Employer in Victor
Among the 371 employed individuals in Victor, private company employees (253 | 68.2%), self-employed (not incorporated) (30 | 8.1%), and local government employees (27 | 7.3%) make up the most common classes of employment.
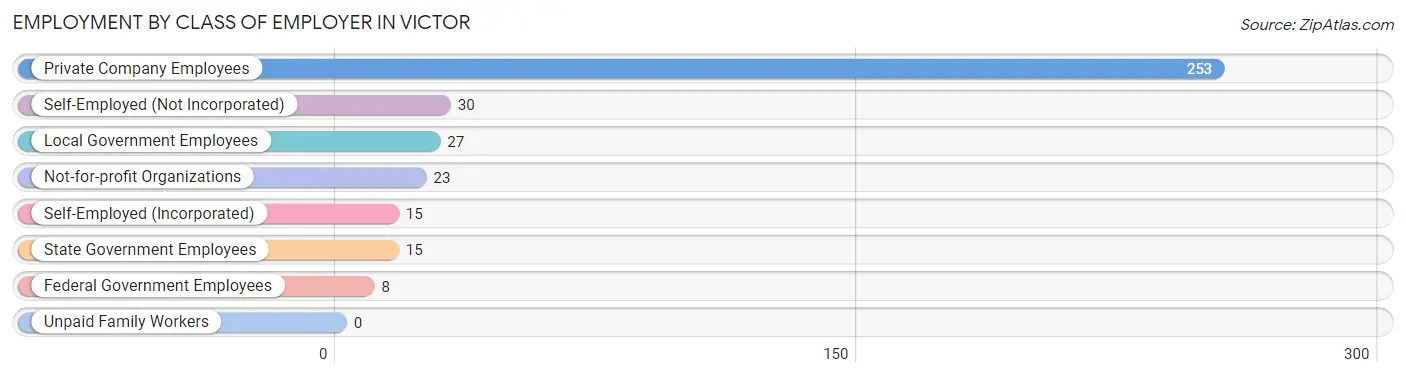
| Employer Class | # Employees | % Employees |
| Private Company Employees | 253 | 68.2% |
| Self-Employed (Incorporated) | 15 | 4.0% |
| Self-Employed (Not Incorporated) | 30 | 8.1% |
| Not-for-profit Organizations | 23 | 6.2% |
| Local Government Employees | 27 | 7.3% |
| State Government Employees | 15 | 4.0% |
| Federal Government Employees | 8 | 2.2% |
| Unpaid Family Workers | 0 | 0.0% |
| Total | 371 | 100.0% |
Employment Status by Age in Victor
According to the labor force statistics for Victor, out of the total population over 16 years of age (702), 60.3% or 423 individuals are in the labor force, with 1.9% or 8 of them unemployed. The age group with the highest labor force participation rate is 20 to 24 years, with 100.0% or 35 individuals in the labor force. Within the labor force, the 25 to 29 years age range has the highest percentage of unemployed individuals, with 14.3% or 4 of them being unemployed.
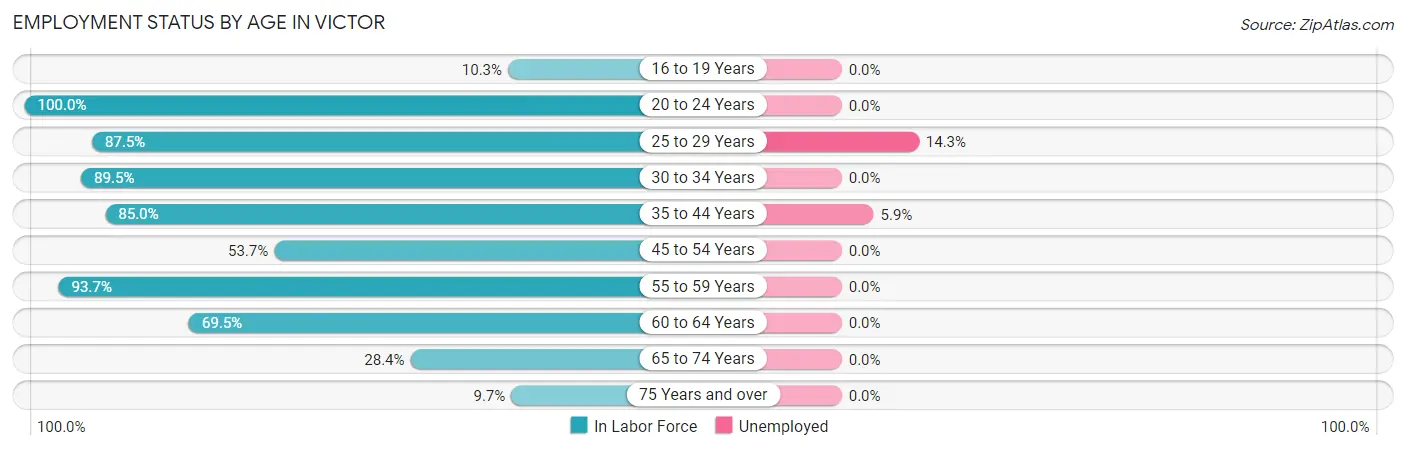
| Age Bracket | In Labor Force | Unemployed |
| 16 to 19 Years | 4 (10.3%) | 0 (0.0%) |
| 20 to 24 Years | 35 (100.0%) | 0 (0.0%) |
| 25 to 29 Years | 28 (87.5%) | 4 (14.3%) |
| 30 to 34 Years | 51 (89.5%) | 0 (0.0%) |
| 35 to 44 Years | 68 (85.0%) | 4 (5.9%) |
| 45 to 54 Years | 72 (53.7%) | 0 (0.0%) |
| 55 to 59 Years | 59 (93.7%) | 0 (0.0%) |
| 60 to 64 Years | 73 (69.5%) | 0 (0.0%) |
| 65 to 74 Years | 27 (28.4%) | 0 (0.0%) |
| 75 Years and over | 6 (9.7%) | 0 (0.0%) |
| Total | 423 (60.3%) | 8 (1.9%) |
Employment Status by Educational Attainment in Victor
According to labor force statistics for Victor, 74.5% of individuals (351) out of the total population between 25 and 64 years of age (471) are in the labor force, with 2.3% or 8 of them being unemployed. The group with the highest labor force participation rate are those with the educational attainment of college / associate degree, with 92.0% or 138 individuals in the labor force. Within the labor force, individuals with bachelor's degree or higher education have the highest percentage of unemployment, with 5.1% or 3 of them being unemployed.
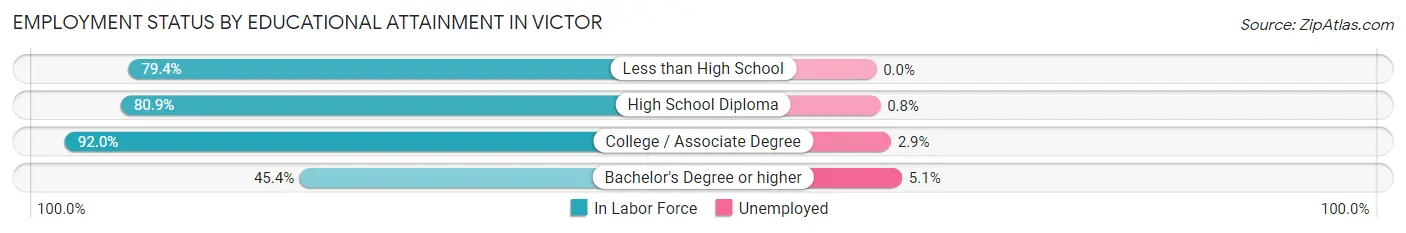
| Educational Attainment | In Labor Force | Unemployed |
| Less than High School | 27 (79.4%) | 0 (0.0%) |
| High School Diploma | 127 (80.9%) | 1 (0.8%) |
| College / Associate Degree | 138 (92.0%) | 4 (2.9%) |
| Bachelor's Degree or higher | 59 (45.4%) | 7 (5.1%) |
| Total | 351 (74.5%) | 11 (2.3%) |
Employment Occupations by Sex in Victor
Management, Business, Science and Arts Occupations
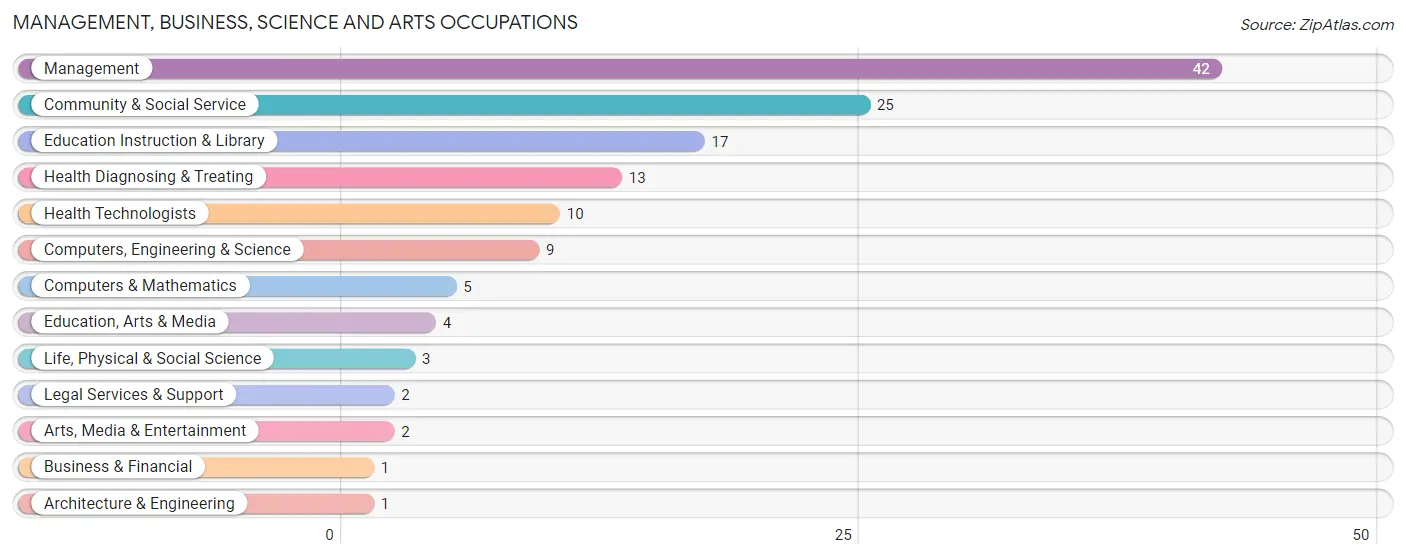
The most common Management, Business, Science and Arts occupations in Victor are Management (42 | 10.1%), Community & Social Service (25 | 6.0%), Education Instruction & Library (17 | 4.1%), Health Diagnosing & Treating (13 | 3.1%), and Health Technologists (10 | 2.4%).
Management, Business, Science and Arts Occupations by Sex
Within the Management, Business, Science and Arts occupations in Victor, the most male-oriented occupations are Architecture & Engineering (100.0%), Life, Physical & Social Science (100.0%), and Education, Arts & Media (75.0%), while the most female-oriented occupations are Business & Financial (100.0%), Legal Services & Support (100.0%), and Arts, Media & Entertainment (100.0%).
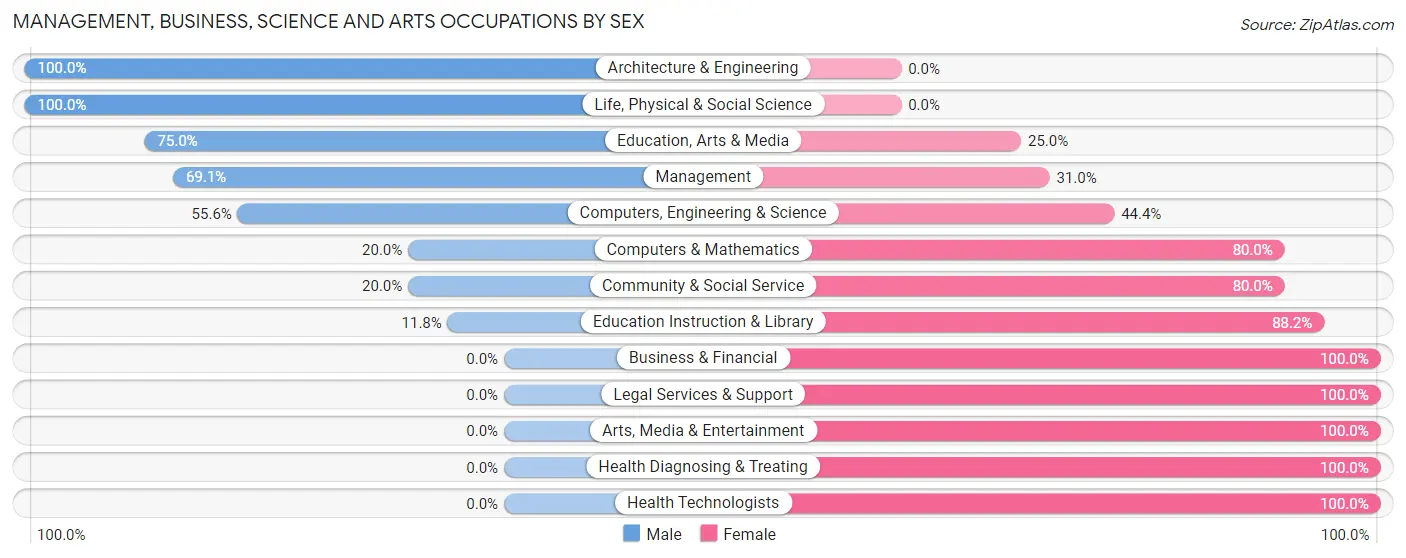
| Occupation | Male | Female |
| Management | 29 (69.1%) | 13 (30.9%) |
| Business & Financial | 0 (0.0%) | 1 (100.0%) |
| Computers, Engineering & Science | 5 (55.6%) | 4 (44.4%) |
| Computers & Mathematics | 1 (20.0%) | 4 (80.0%) |
| Architecture & Engineering | 1 (100.0%) | 0 (0.0%) |
| Life, Physical & Social Science | 3 (100.0%) | 0 (0.0%) |
| Community & Social Service | 5 (20.0%) | 20 (80.0%) |
| Education, Arts & Media | 3 (75.0%) | 1 (25.0%) |
| Legal Services & Support | 0 (0.0%) | 2 (100.0%) |
| Education Instruction & Library | 2 (11.8%) | 15 (88.2%) |
| Arts, Media & Entertainment | 0 (0.0%) | 2 (100.0%) |
| Health Diagnosing & Treating | 0 (0.0%) | 13 (100.0%) |
| Health Technologists | 0 (0.0%) | 10 (100.0%) |
| Total (Category) | 39 (43.3%) | 51 (56.7%) |
| Total (Overall) | 198 (47.7%) | 217 (52.3%) |
Services Occupations
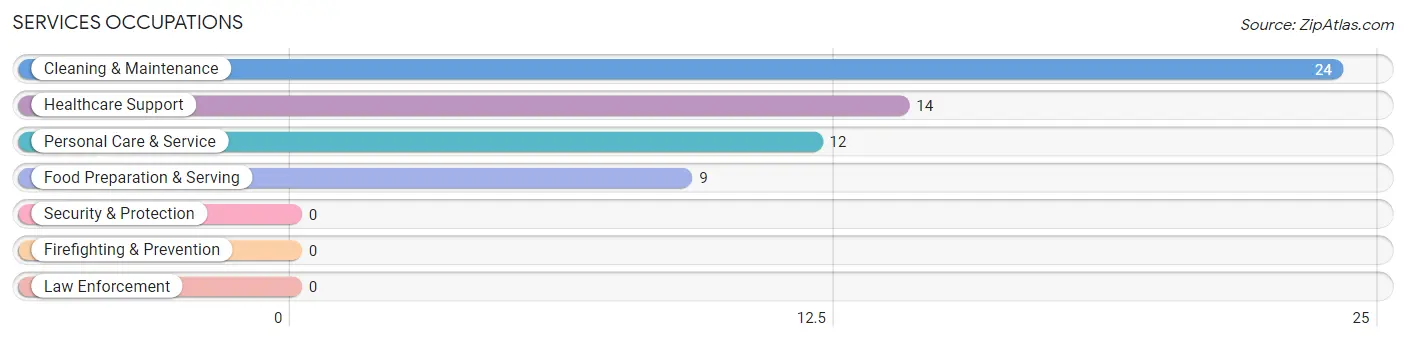
The most common Services occupations in Victor are Cleaning & Maintenance (24 | 5.8%), Healthcare Support (14 | 3.4%), Personal Care & Service (12 | 2.9%), and Food Preparation & Serving (9 | 2.2%).
Services Occupations by Sex
Within the Services occupations in Victor, the most male-oriented occupations are Cleaning & Maintenance (25.0%), and Personal Care & Service (25.0%), while the most female-oriented occupations are Healthcare Support (100.0%), Food Preparation & Serving (100.0%), and Cleaning & Maintenance (75.0%).
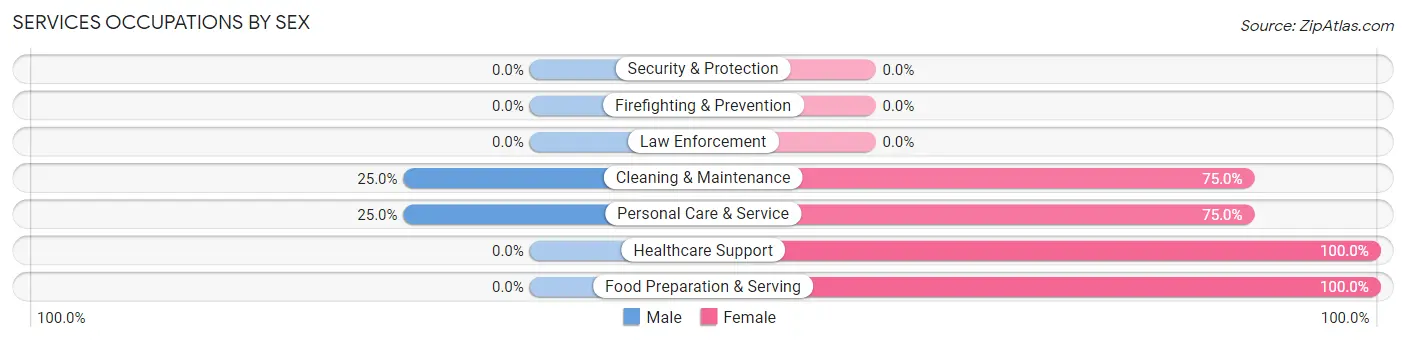
| Occupation | Male | Female |
| Healthcare Support | 0 (0.0%) | 14 (100.0%) |
| Security & Protection | 0 (0.0%) | 0 (0.0%) |
| Firefighting & Prevention | 0 (0.0%) | 0 (0.0%) |
| Law Enforcement | 0 (0.0%) | 0 (0.0%) |
| Food Preparation & Serving | 0 (0.0%) | 9 (100.0%) |
| Cleaning & Maintenance | 6 (25.0%) | 18 (75.0%) |
| Personal Care & Service | 3 (25.0%) | 9 (75.0%) |
| Total (Category) | 9 (15.2%) | 50 (84.8%) |
| Total (Overall) | 198 (47.7%) | 217 (52.3%) |
Sales and Office Occupations
The most common Sales and Office occupations in Victor are Office & Administration (59 | 14.2%), and Sales & Related (36 | 8.7%).
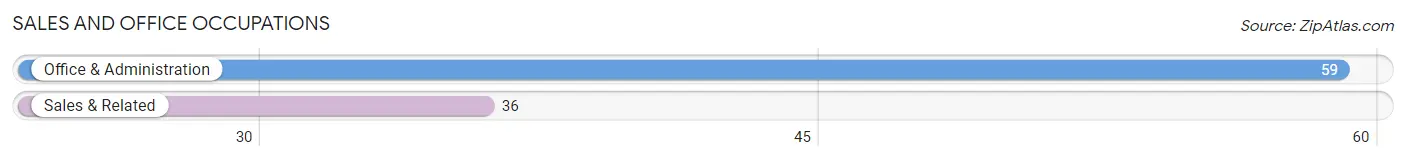
Sales and Office Occupations by Sex
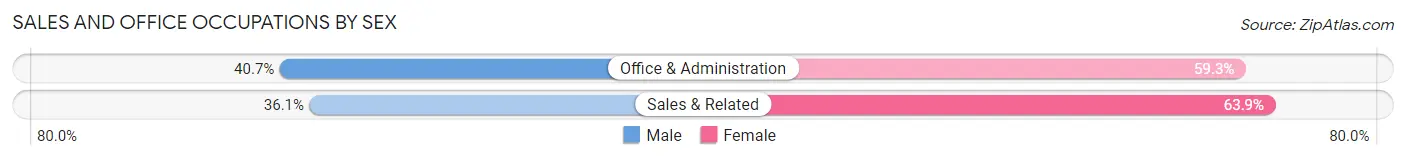
| Occupation | Male | Female |
| Sales & Related | 13 (36.1%) | 23 (63.9%) |
| Office & Administration | 24 (40.7%) | 35 (59.3%) |
| Total (Category) | 37 (39.0%) | 58 (61.1%) |
| Total (Overall) | 198 (47.7%) | 217 (52.3%) |
Natural Resources, Construction and Maintenance Occupations
The most common Natural Resources, Construction and Maintenance occupations in Victor are Construction & Extraction (35 | 8.4%), Installation, Maintenance & Repair (27 | 6.5%), and Farming, Fishing & Forestry (9 | 2.2%).
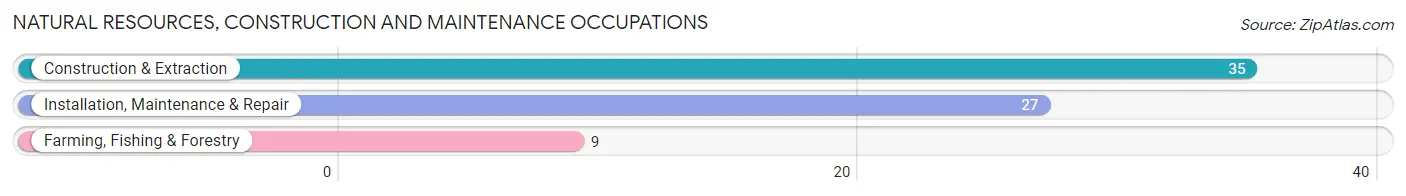
Natural Resources, Construction and Maintenance Occupations by Sex
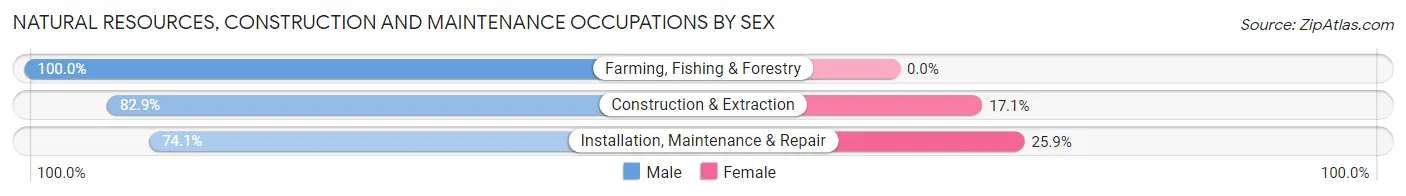
| Occupation | Male | Female |
| Farming, Fishing & Forestry | 9 (100.0%) | 0 (0.0%) |
| Construction & Extraction | 29 (82.9%) | 6 (17.1%) |
| Installation, Maintenance & Repair | 20 (74.1%) | 7 (25.9%) |
| Total (Category) | 58 (81.7%) | 13 (18.3%) |
| Total (Overall) | 198 (47.7%) | 217 (52.3%) |
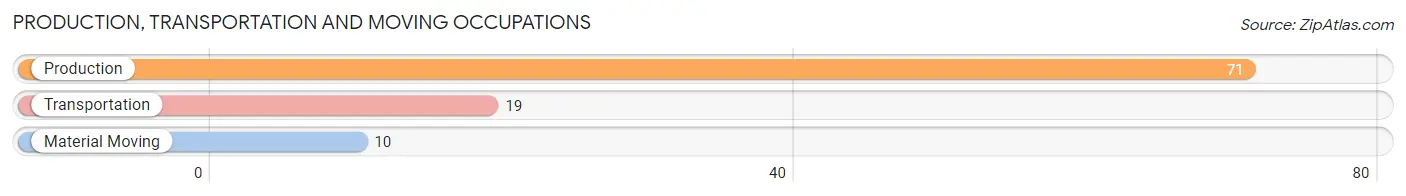
Production, Transportation and Moving Occupations
The most common Production, Transportation and Moving occupations in Victor are Production (71 | 17.1%), Transportation (19 | 4.6%), and Material Moving (10 | 2.4%).
Production, Transportation and Moving Occupations by Sex
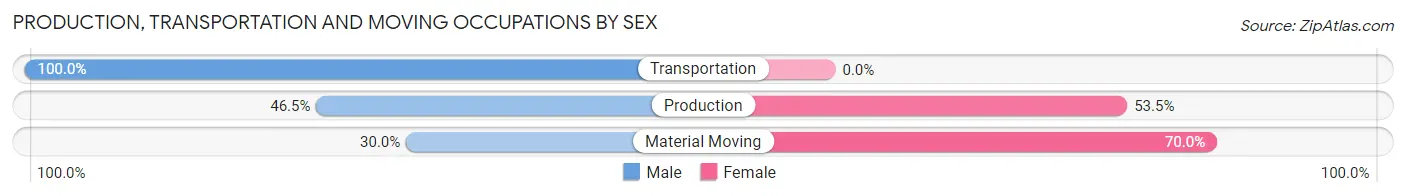
| Occupation | Male | Female |
| Production | 33 (46.5%) | 38 (53.5%) |
| Transportation | 19 (100.0%) | 0 (0.0%) |
| Material Moving | 3 (30.0%) | 7 (70.0%) |
| Total (Category) | 55 (55.0%) | 45 (45.0%) |
| Total (Overall) | 198 (47.7%) | 217 (52.3%) |
Employment Industries by Sex in Victor
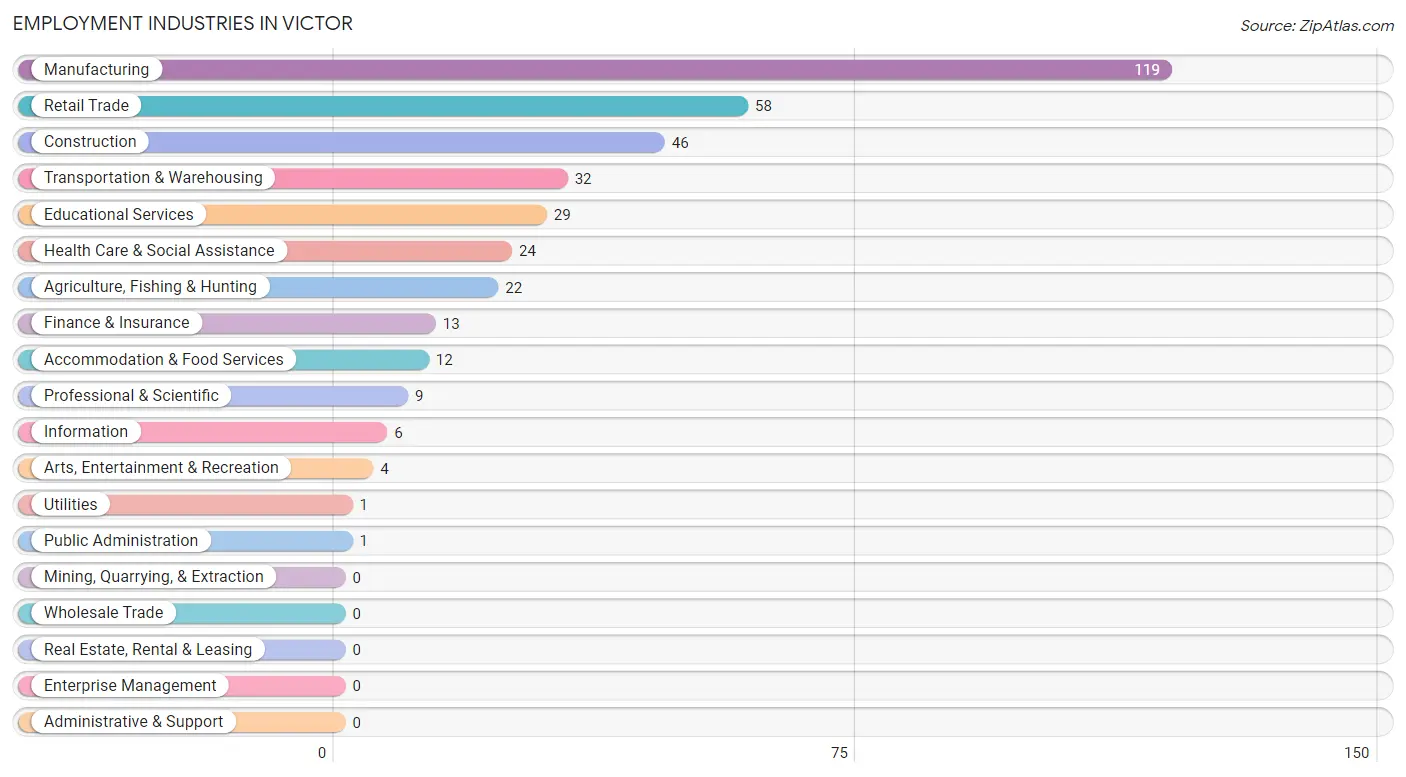
Employment Industries in Victor
The major employment industries in Victor include Manufacturing (119 | 28.7%), Retail Trade (58 | 14.0%), Construction (46 | 11.1%), Transportation & Warehousing (32 | 7.7%), and Educational Services (29 | 7.0%).
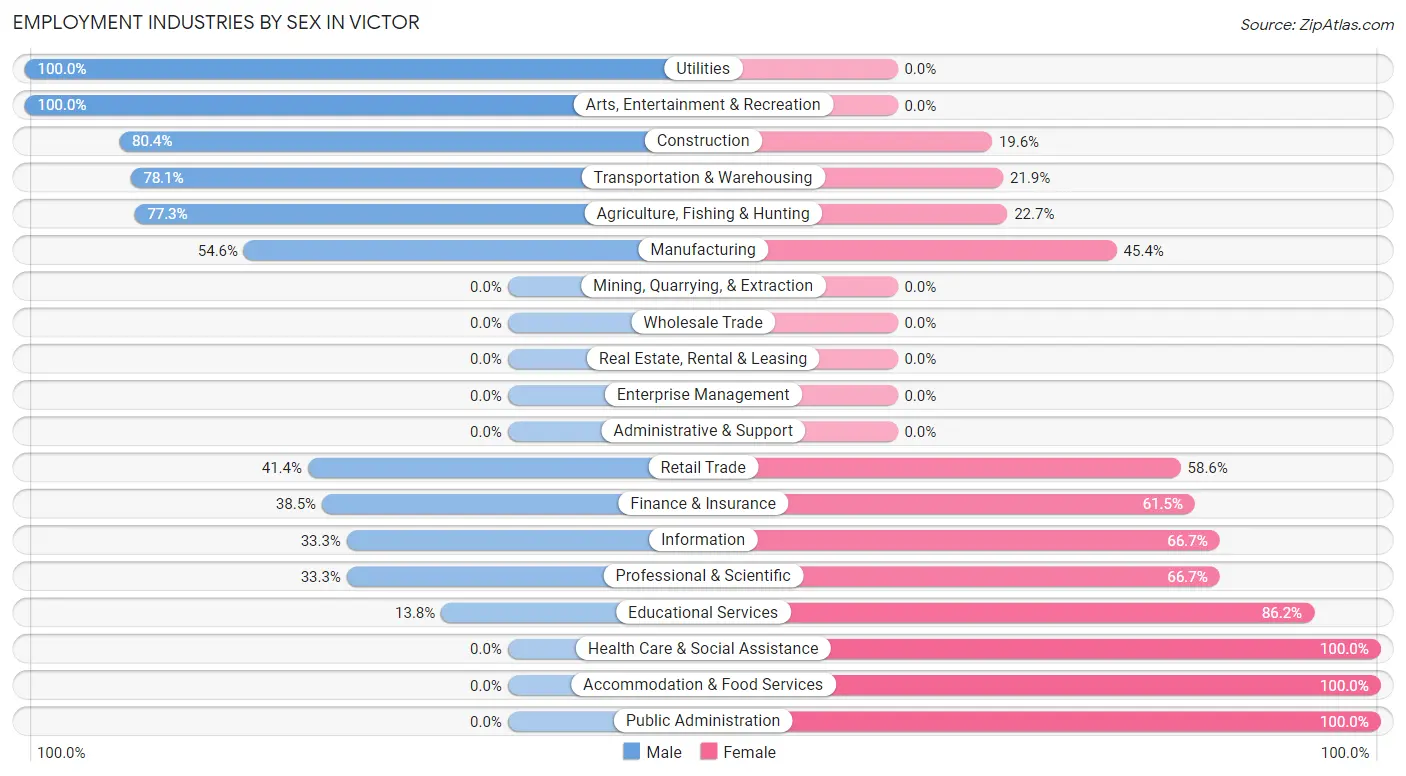
Employment Industries by Sex in Victor
The Victor industries that see more men than women are Utilities (100.0%), Arts, Entertainment & Recreation (100.0%), and Construction (80.4%), whereas the industries that tend to have a higher number of women are Health Care & Social Assistance (100.0%), Accommodation & Food Services (100.0%), and Public Administration (100.0%).
| Industry | Male | Female |
| Agriculture, Fishing & Hunting | 17 (77.3%) | 5 (22.7%) |
| Mining, Quarrying, & Extraction | 0 (0.0%) | 0 (0.0%) |
| Construction | 37 (80.4%) | 9 (19.6%) |
| Manufacturing | 65 (54.6%) | 54 (45.4%) |
| Wholesale Trade | 0 (0.0%) | 0 (0.0%) |
| Retail Trade | 24 (41.4%) | 34 (58.6%) |
| Transportation & Warehousing | 25 (78.1%) | 7 (21.9%) |
| Utilities | 1 (100.0%) | 0 (0.0%) |
| Information | 2 (33.3%) | 4 (66.7%) |
| Finance & Insurance | 5 (38.5%) | 8 (61.5%) |
| Real Estate, Rental & Leasing | 0 (0.0%) | 0 (0.0%) |
| Professional & Scientific | 3 (33.3%) | 6 (66.7%) |
| Enterprise Management | 0 (0.0%) | 0 (0.0%) |
| Administrative & Support | 0 (0.0%) | 0 (0.0%) |
| Educational Services | 4 (13.8%) | 25 (86.2%) |
| Health Care & Social Assistance | 0 (0.0%) | 24 (100.0%) |
| Arts, Entertainment & Recreation | 4 (100.0%) | 0 (0.0%) |
| Accommodation & Food Services | 0 (0.0%) | 12 (100.0%) |
| Public Administration | 0 (0.0%) | 1 (100.0%) |
| Total | 198 (47.7%) | 217 (52.3%) |
Education in Victor
School Enrollment in Victor
The most common levels of schooling among the 132 students in Victor are high school (40 | 30.3%), elementary school (34 | 25.8%), and middle school (32 | 24.2%).
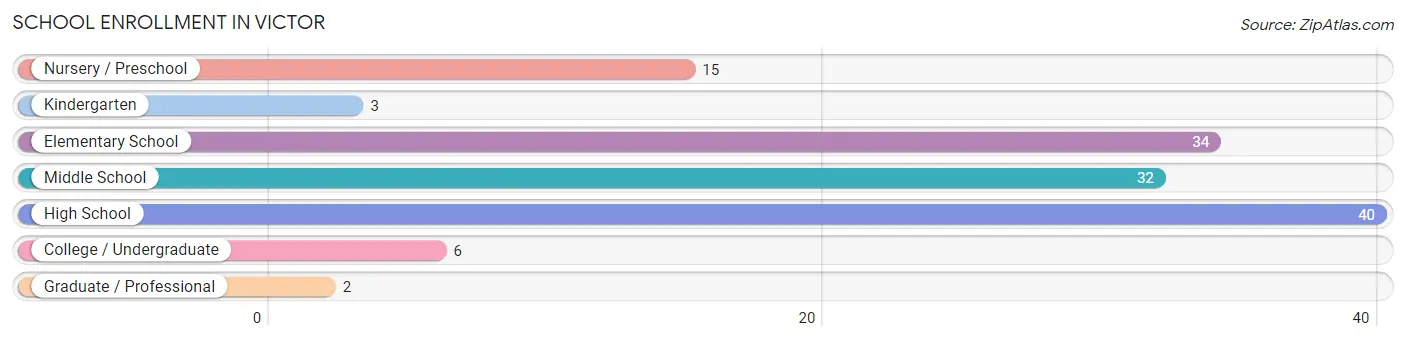
| School Level | # Students | % Students |
| Nursery / Preschool | 15 | 11.4% |
| Kindergarten | 3 | 2.3% |
| Elementary School | 34 | 25.8% |
| Middle School | 32 | 24.2% |
| High School | 40 | 30.3% |
| College / Undergraduate | 6 | 4.5% |
| Graduate / Professional | 2 | 1.5% |
| Total | 132 | 100.0% |
School Enrollment by Age by Funding Source in Victor
Out of a total of 132 students who are enrolled in schools in Victor, 12 (9.1%) attend a private institution, while the remaining 120 (90.9%) are enrolled in public schools. The age group of 25 to 34 year olds has the highest likelihood of being enrolled in private schools, with 2 (100.0% in the age bracket) enrolled. Conversely, the age group of 10 to 14 year olds has the lowest likelihood of being enrolled in a private school, with 38 (100.0% in the age bracket) attending a public institution.
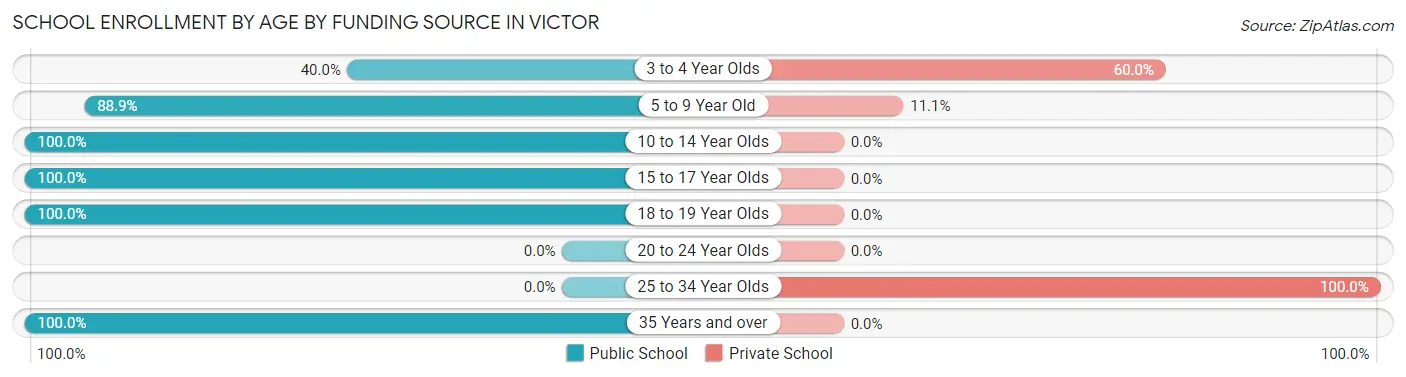
| Age Bracket | Public School | Private School |
| 3 to 4 Year Olds | 4 (40.0%) | 6 (60.0%) |
| 5 to 9 Year Old | 32 (88.9%) | 4 (11.1%) |
| 10 to 14 Year Olds | 38 (100.0%) | 0 (0.0%) |
| 15 to 17 Year Olds | 26 (100.0%) | 0 (0.0%) |
| 18 to 19 Year Olds | 16 (100.0%) | 0 (0.0%) |
| 20 to 24 Year Olds | 0 (0.0%) | 0 (0.0%) |
| 25 to 34 Year Olds | 0 (0.0%) | 2 (100.0%) |
| 35 Years and over | 4 (100.0%) | 0 (0.0%) |
| Total | 120 (90.9%) | 12 (9.1%) |
Educational Attainment by Field of Study in Victor
Visual & performing arts (56 | 35.4%), science & technology (25 | 15.8%), education (21 | 13.3%), bio, nature & agricultural (16 | 10.1%), and business (7 | 4.4%) are the most common fields of study among 158 individuals in Victor who have obtained a bachelor's degree or higher.
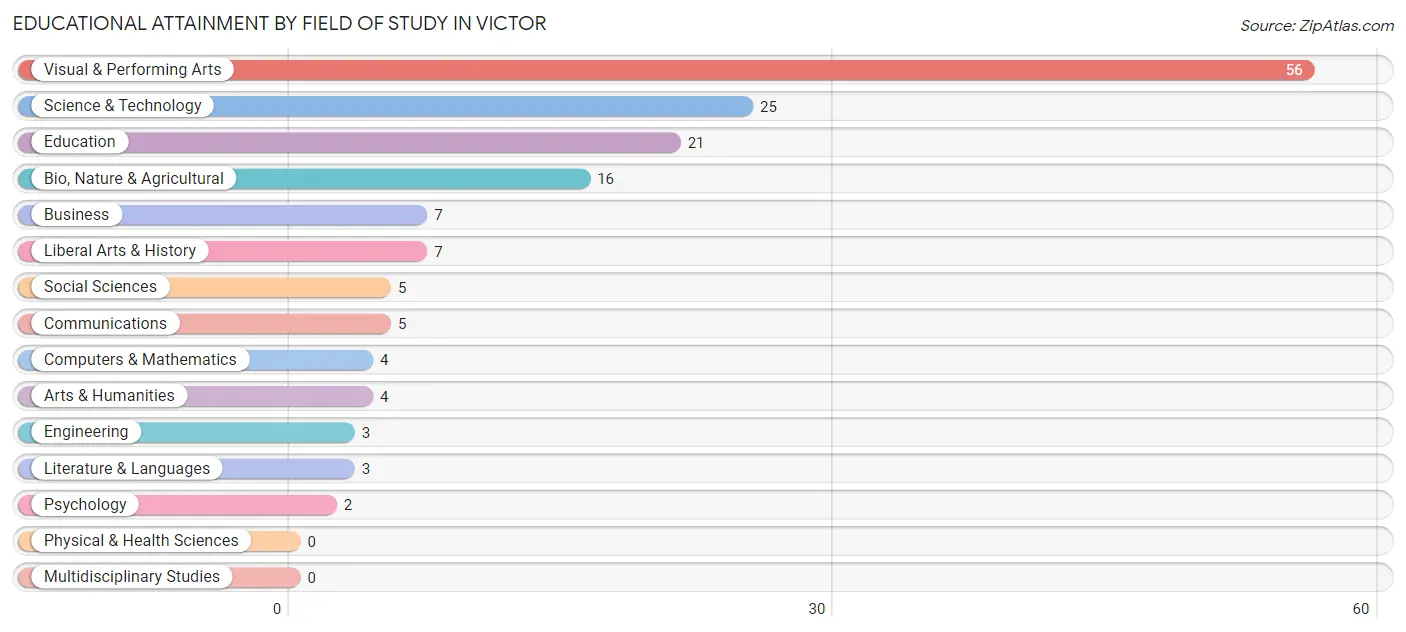
| Field of Study | # Graduates | % Graduates |
| Computers & Mathematics | 4 | 2.5% |
| Bio, Nature & Agricultural | 16 | 10.1% |
| Physical & Health Sciences | 0 | 0.0% |
| Psychology | 2 | 1.3% |
| Social Sciences | 5 | 3.2% |
| Engineering | 3 | 1.9% |
| Multidisciplinary Studies | 0 | 0.0% |
| Science & Technology | 25 | 15.8% |
| Business | 7 | 4.4% |
| Education | 21 | 13.3% |
| Literature & Languages | 3 | 1.9% |
| Liberal Arts & History | 7 | 4.4% |
| Visual & Performing Arts | 56 | 35.4% |
| Communications | 5 | 3.2% |
| Arts & Humanities | 4 | 2.5% |
| Total | 158 | 100.0% |
Transportation & Commute in Victor
Vehicle Availability by Sex in Victor
The most prevalent vehicle ownership categories in Victor are males with 3 vehicles (64, accounting for 37.4%) and females with 3 vehicles (31, making up 32.0%).
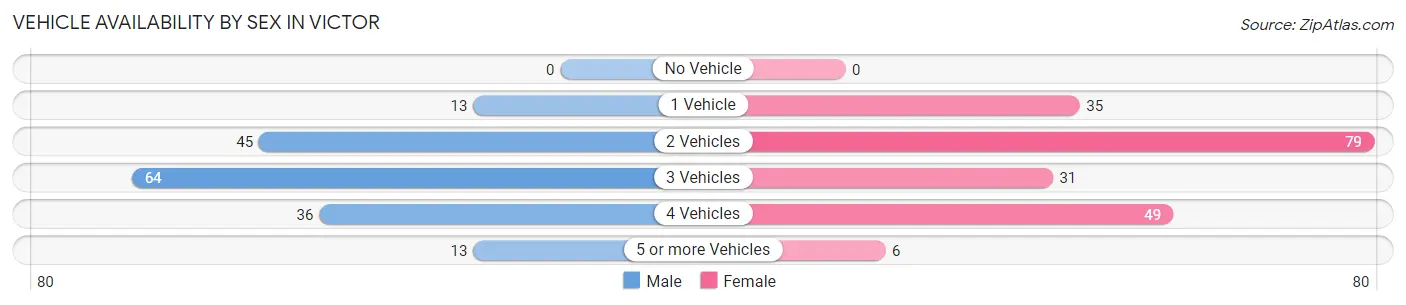
| Vehicles Available | Male | Female |
| No Vehicle | 0 (0.0%) | 0 (0.0%) |
| 1 Vehicle | 13 (7.6%) | 35 (17.5%) |
| 2 Vehicles | 45 (26.3%) | 79 (39.5%) |
| 3 Vehicles | 64 (37.4%) | 31 (15.5%) |
| 4 Vehicles | 36 (21.0%) | 49 (24.5%) |
| 5 or more Vehicles | 13 (7.6%) | 6 (3.0%) |
| Total | 171 (100.0%) | 200 (100.0%) |
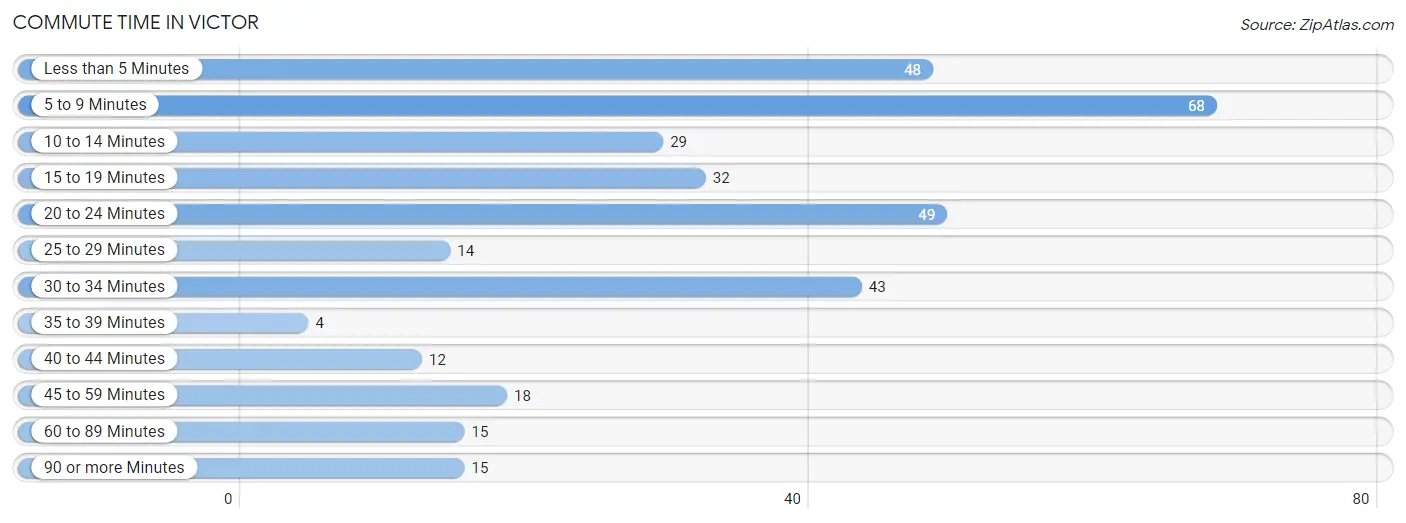
Commute Time in Victor
The most frequently occuring commute durations in Victor are 5 to 9 minutes (68 commuters, 19.6%), 20 to 24 minutes (49 commuters, 14.1%), and less than 5 minutes (48 commuters, 13.8%).
| Commute Time | # Commuters | % Commuters |
| Less than 5 Minutes | 48 | 13.8% |
| 5 to 9 Minutes | 68 | 19.6% |
| 10 to 14 Minutes | 29 | 8.4% |
| 15 to 19 Minutes | 32 | 9.2% |
| 20 to 24 Minutes | 49 | 14.1% |
| 25 to 29 Minutes | 14 | 4.0% |
| 30 to 34 Minutes | 43 | 12.4% |
| 35 to 39 Minutes | 4 | 1.1% |
| 40 to 44 Minutes | 12 | 3.5% |
| 45 to 59 Minutes | 18 | 5.2% |
| 60 to 89 Minutes | 15 | 4.3% |
| 90 or more Minutes | 15 | 4.3% |
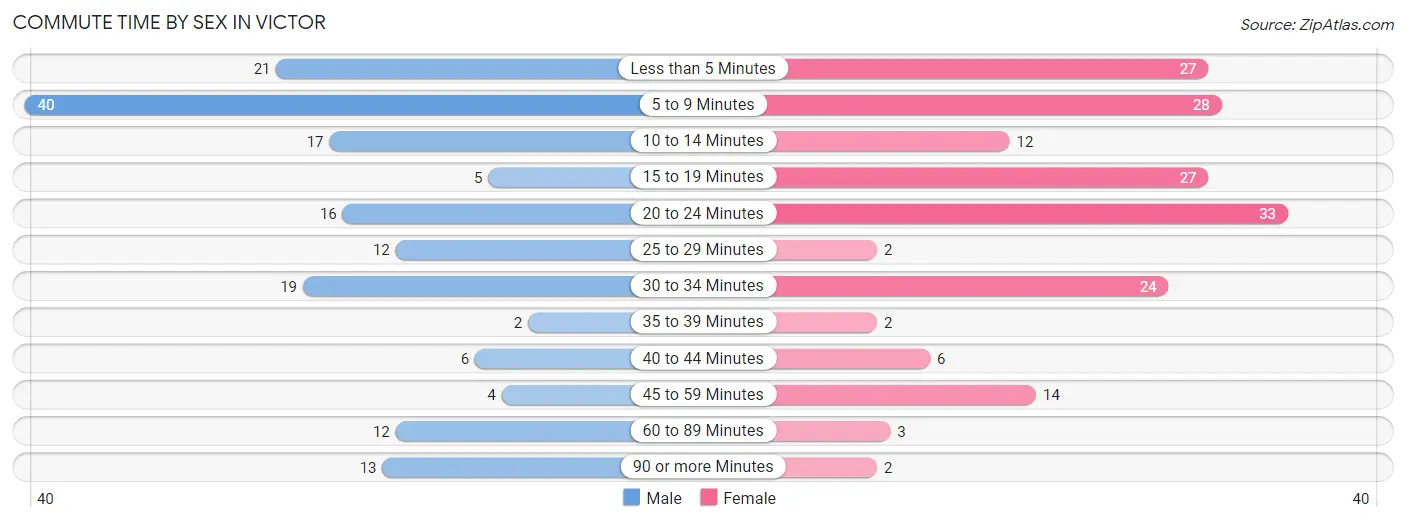
Commute Time by Sex in Victor
The most common commute times in Victor are 5 to 9 minutes (40 commuters, 23.9%) for males and 20 to 24 minutes (33 commuters, 18.3%) for females.
| Commute Time | Male | Female |
| Less than 5 Minutes | 21 (12.6%) | 27 (15.0%) |
| 5 to 9 Minutes | 40 (23.9%) | 28 (15.6%) |
| 10 to 14 Minutes | 17 (10.2%) | 12 (6.7%) |
| 15 to 19 Minutes | 5 (3.0%) | 27 (15.0%) |
| 20 to 24 Minutes | 16 (9.6%) | 33 (18.3%) |
| 25 to 29 Minutes | 12 (7.2%) | 2 (1.1%) |
| 30 to 34 Minutes | 19 (11.4%) | 24 (13.3%) |
| 35 to 39 Minutes | 2 (1.2%) | 2 (1.1%) |
| 40 to 44 Minutes | 6 (3.6%) | 6 (3.3%) |
| 45 to 59 Minutes | 4 (2.4%) | 14 (7.8%) |
| 60 to 89 Minutes | 12 (7.2%) | 3 (1.7%) |
| 90 or more Minutes | 13 (7.8%) | 2 (1.1%) |
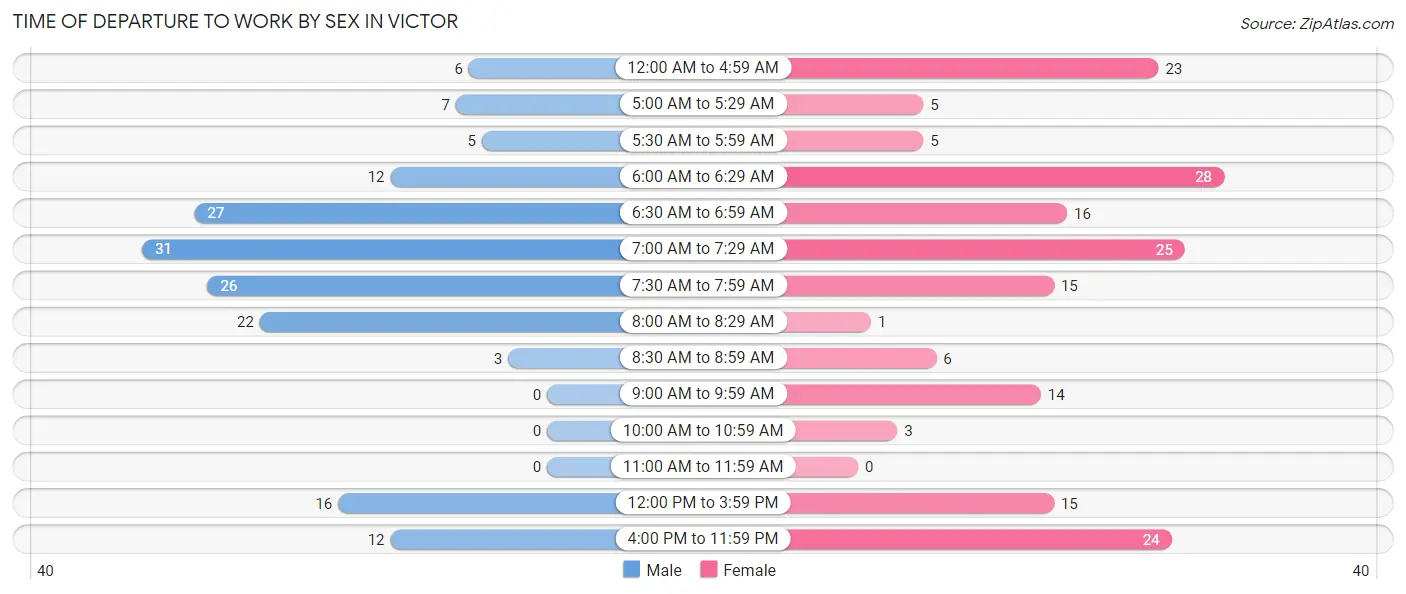
Time of Departure to Work by Sex in Victor
The most frequent times of departure to work in Victor are 7:00 AM to 7:29 AM (31, 18.6%) for males and 6:00 AM to 6:29 AM (28, 15.6%) for females.
| Time of Departure | Male | Female |
| 12:00 AM to 4:59 AM | 6 (3.6%) | 23 (12.8%) |
| 5:00 AM to 5:29 AM | 7 (4.2%) | 5 (2.8%) |
| 5:30 AM to 5:59 AM | 5 (3.0%) | 5 (2.8%) |
| 6:00 AM to 6:29 AM | 12 (7.2%) | 28 (15.6%) |
| 6:30 AM to 6:59 AM | 27 (16.2%) | 16 (8.9%) |
| 7:00 AM to 7:29 AM | 31 (18.6%) | 25 (13.9%) |
| 7:30 AM to 7:59 AM | 26 (15.6%) | 15 (8.3%) |
| 8:00 AM to 8:29 AM | 22 (13.2%) | 1 (0.6%) |
| 8:30 AM to 8:59 AM | 3 (1.8%) | 6 (3.3%) |
| 9:00 AM to 9:59 AM | 0 (0.0%) | 14 (7.8%) |
| 10:00 AM to 10:59 AM | 0 (0.0%) | 3 (1.7%) |
| 11:00 AM to 11:59 AM | 0 (0.0%) | 0 (0.0%) |
| 12:00 PM to 3:59 PM | 16 (9.6%) | 15 (8.3%) |
| 4:00 PM to 11:59 PM | 12 (7.2%) | 24 (13.3%) |
| Total | 167 (100.0%) | 180 (100.0%) |
Housing Occupancy in Victor
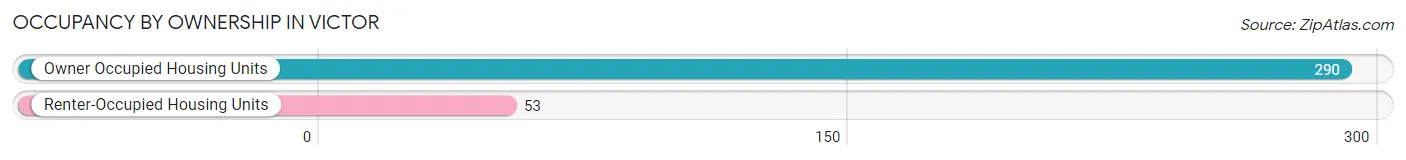
Occupancy by Ownership in Victor
Of the total 343 dwellings in Victor, owner-occupied units account for 290 (84.6%), while renter-occupied units make up 53 (15.4%).
| Occupancy | # Housing Units | % Housing Units |
| Owner Occupied Housing Units | 290 | 84.6% |
| Renter-Occupied Housing Units | 53 | 15.4% |
| Total Occupied Housing Units | 343 | 100.0% |
Occupancy by Household Size in Victor
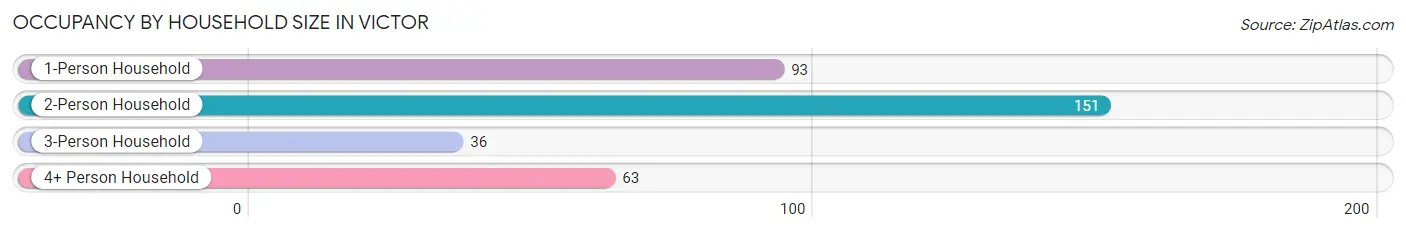
| Household Size | # Housing Units | % Housing Units |
| 1-Person Household | 93 | 27.1% |
| 2-Person Household | 151 | 44.0% |
| 3-Person Household | 36 | 10.5% |
| 4+ Person Household | 63 | 18.4% |
| Total Housing Units | 343 | 100.0% |
Occupancy by Ownership by Household Size in Victor
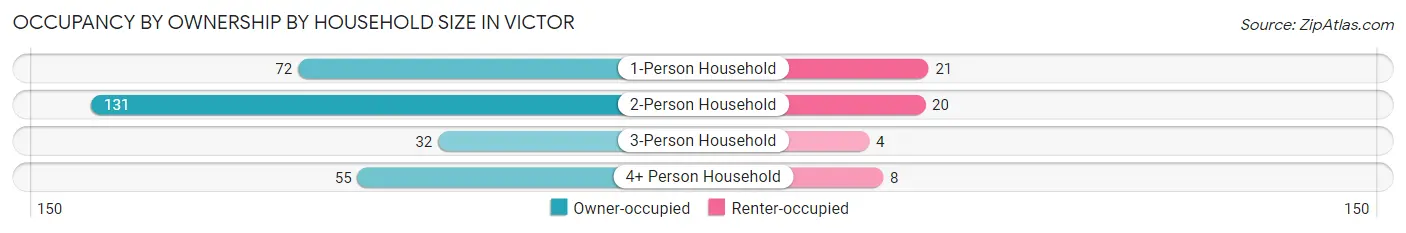
| Household Size | Owner-occupied | Renter-occupied |
| 1-Person Household | 72 (77.4%) | 21 (22.6%) |
| 2-Person Household | 131 (86.8%) | 20 (13.3%) |
| 3-Person Household | 32 (88.9%) | 4 (11.1%) |
| 4+ Person Household | 55 (87.3%) | 8 (12.7%) |
| Total Housing Units | 290 (84.6%) | 53 (15.4%) |
Occupancy by Educational Attainment in Victor
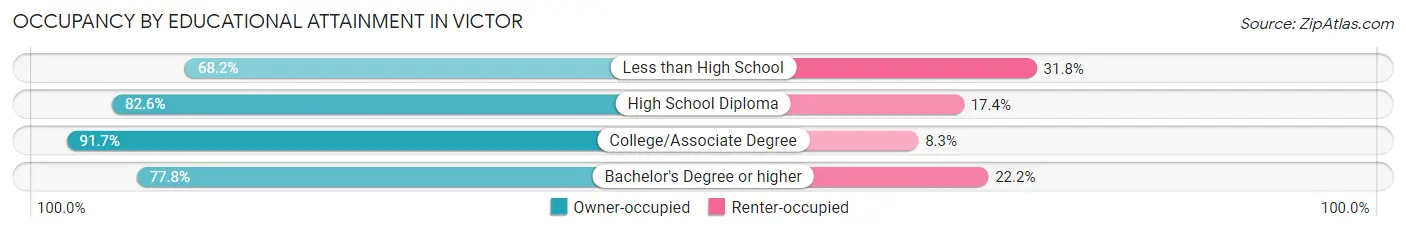
| Household Size | Owner-occupied | Renter-occupied |
| Less than High School | 15 (68.2%) | 7 (31.8%) |
| High School Diploma | 119 (82.6%) | 25 (17.4%) |
| College/Associate Degree | 121 (91.7%) | 11 (8.3%) |
| Bachelor's Degree or higher | 35 (77.8%) | 10 (22.2%) |
Occupancy by Age of Householder in Victor
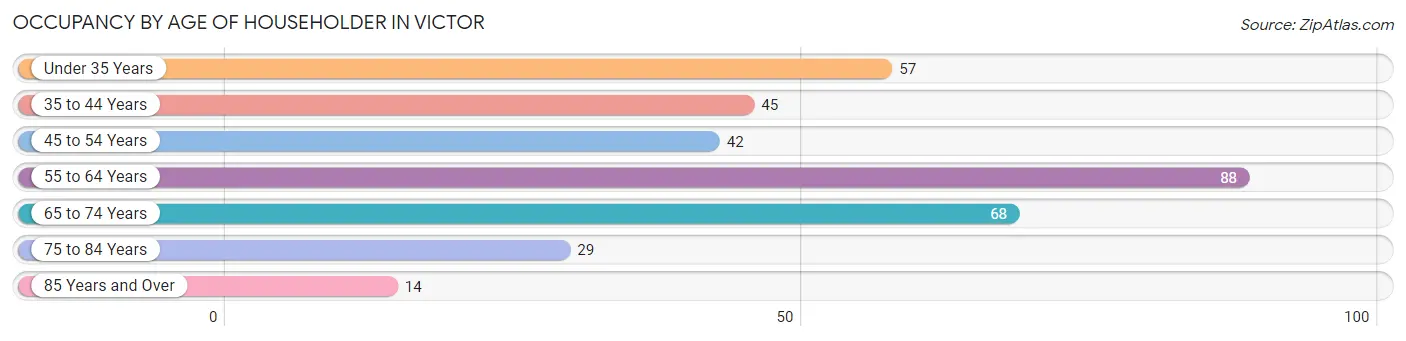
| Age Bracket | # Households | % Households |
| Under 35 Years | 57 | 16.6% |
| 35 to 44 Years | 45 | 13.1% |
| 45 to 54 Years | 42 | 12.2% |
| 55 to 64 Years | 88 | 25.7% |
| 65 to 74 Years | 68 | 19.8% |
| 75 to 84 Years | 29 | 8.5% |
| 85 Years and Over | 14 | 4.1% |
| Total | 343 | 100.0% |
Housing Finances in Victor
Median Income by Occupancy in Victor
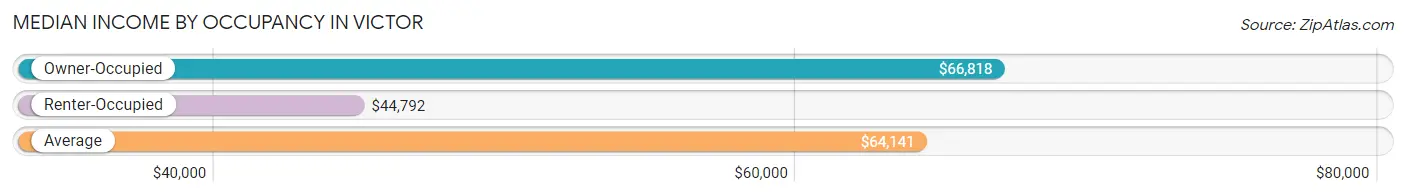
| Occupancy Type | # Households | Median Income |
| Owner-Occupied | 290 (84.6%) | $66,818 |
| Renter-Occupied | 53 (15.4%) | $44,792 |
| Average | 343 (100.0%) | $64,141 |
Occupancy by Householder Income Bracket in Victor
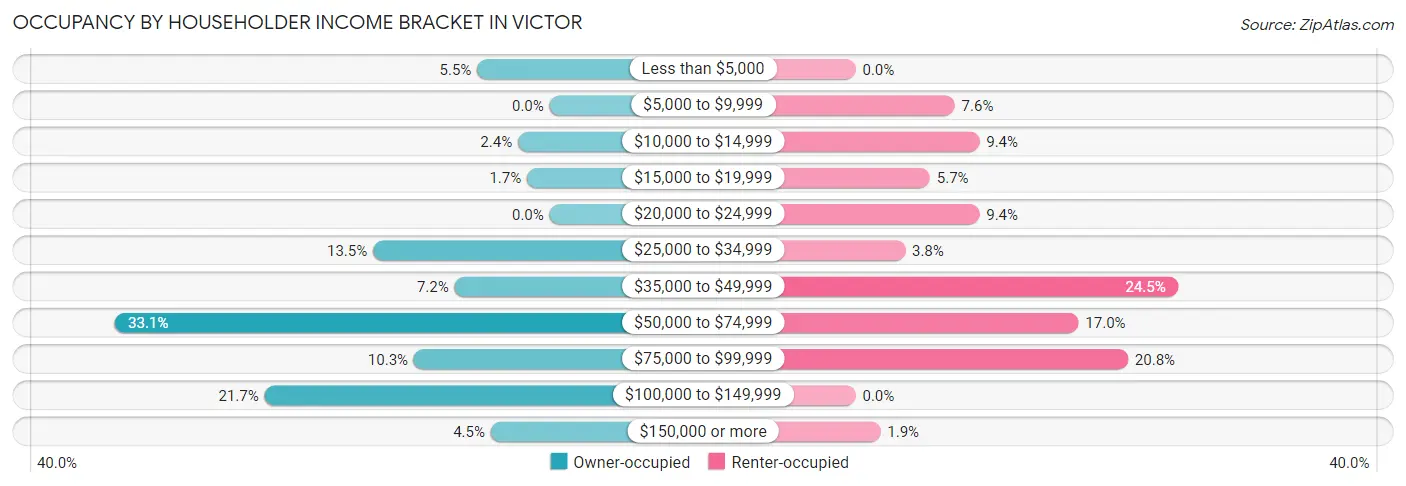
| Income Bracket | Owner-occupied | Renter-occupied |
| Less than $5,000 | 16 (5.5%) | 0 (0.0%) |
| $5,000 to $9,999 | 0 (0.0%) | 4 (7.5%) |
| $10,000 to $14,999 | 7 (2.4%) | 5 (9.4%) |
| $15,000 to $19,999 | 5 (1.7%) | 3 (5.7%) |
| $20,000 to $24,999 | 0 (0.0%) | 5 (9.4%) |
| $25,000 to $34,999 | 39 (13.5%) | 2 (3.8%) |
| $35,000 to $49,999 | 21 (7.2%) | 13 (24.5%) |
| $50,000 to $74,999 | 96 (33.1%) | 9 (17.0%) |
| $75,000 to $99,999 | 30 (10.3%) | 11 (20.7%) |
| $100,000 to $149,999 | 63 (21.7%) | 0 (0.0%) |
| $150,000 or more | 13 (4.5%) | 1 (1.9%) |
| Total | 290 (100.0%) | 53 (100.0%) |
Monthly Housing Cost Tiers in Victor
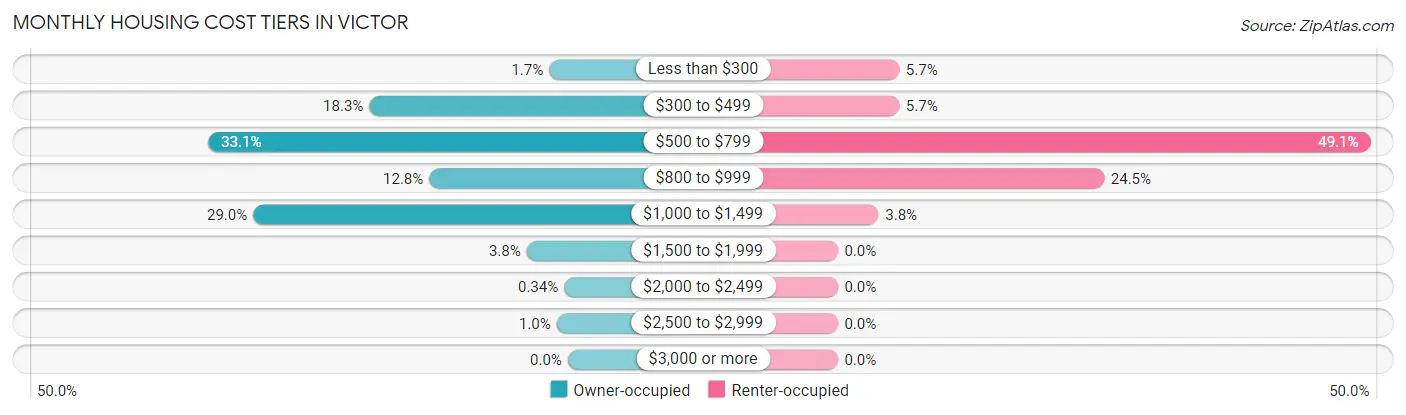
| Monthly Cost | Owner-occupied | Renter-occupied |
| Less than $300 | 5 (1.7%) | 3 (5.7%) |
| $300 to $499 | 53 (18.3%) | 3 (5.7%) |
| $500 to $799 | 96 (33.1%) | 26 (49.1%) |
| $800 to $999 | 37 (12.8%) | 13 (24.5%) |
| $1,000 to $1,499 | 84 (29.0%) | 2 (3.8%) |
| $1,500 to $1,999 | 11 (3.8%) | 0 (0.0%) |
| $2,000 to $2,499 | 1 (0.3%) | 0 (0.0%) |
| $2,500 to $2,999 | 3 (1.0%) | 0 (0.0%) |
| $3,000 or more | 0 (0.0%) | 0 (0.0%) |
| Total | 290 (100.0%) | 53 (100.0%) |
Physical Housing Characteristics in Victor
Housing Structures in Victor
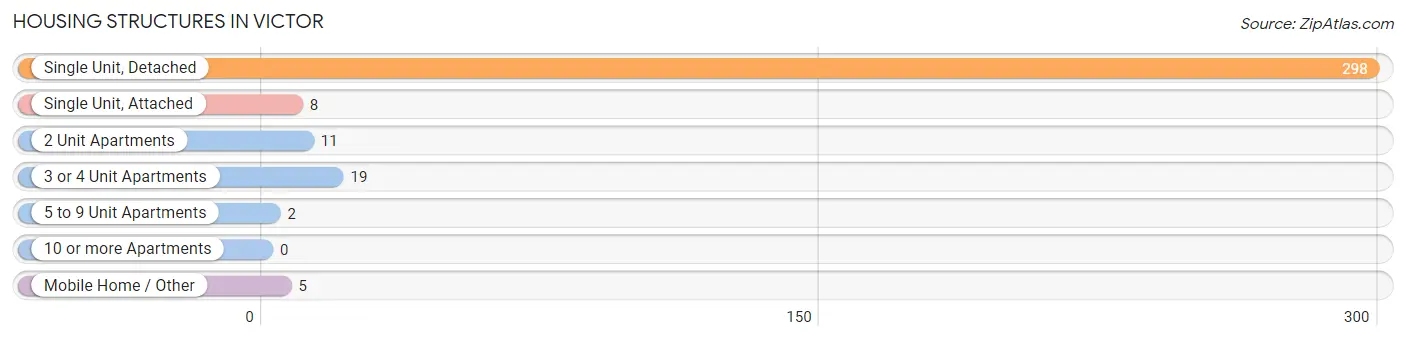
| Structure Type | # Housing Units | % Housing Units |
| Single Unit, Detached | 298 | 86.9% |
| Single Unit, Attached | 8 | 2.3% |
| 2 Unit Apartments | 11 | 3.2% |
| 3 or 4 Unit Apartments | 19 | 5.5% |
| 5 to 9 Unit Apartments | 2 | 0.6% |
| 10 or more Apartments | 0 | 0.0% |
| Mobile Home / Other | 5 | 1.5% |
| Total | 343 | 100.0% |
Housing Structures by Occupancy in Victor
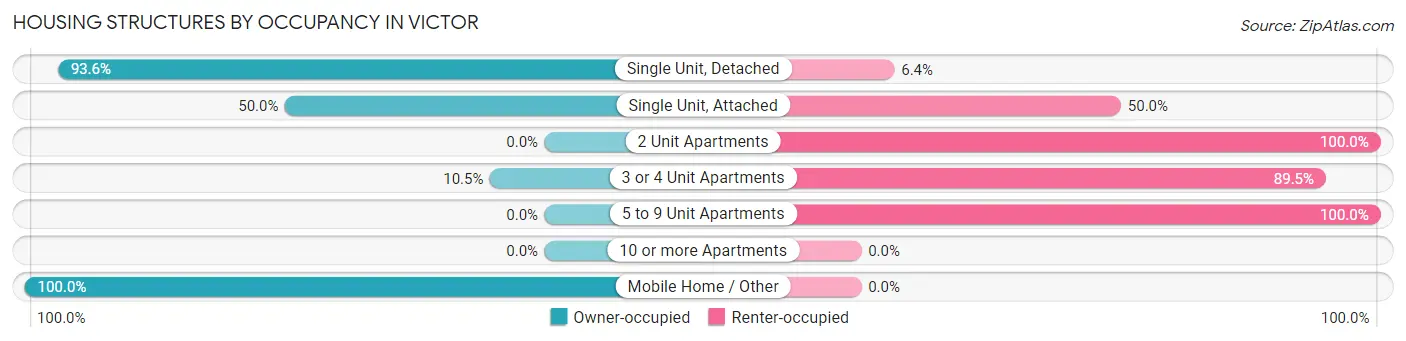
| Structure Type | Owner-occupied | Renter-occupied |
| Single Unit, Detached | 279 (93.6%) | 19 (6.4%) |
| Single Unit, Attached | 4 (50.0%) | 4 (50.0%) |
| 2 Unit Apartments | 0 (0.0%) | 11 (100.0%) |
| 3 or 4 Unit Apartments | 2 (10.5%) | 17 (89.5%) |
| 5 to 9 Unit Apartments | 0 (0.0%) | 2 (100.0%) |
| 10 or more Apartments | 0 (0.0%) | 0 (0.0%) |
| Mobile Home / Other | 5 (100.0%) | 0 (0.0%) |
| Total | 290 (84.6%) | 53 (15.4%) |
Housing Structures by Number of Rooms in Victor
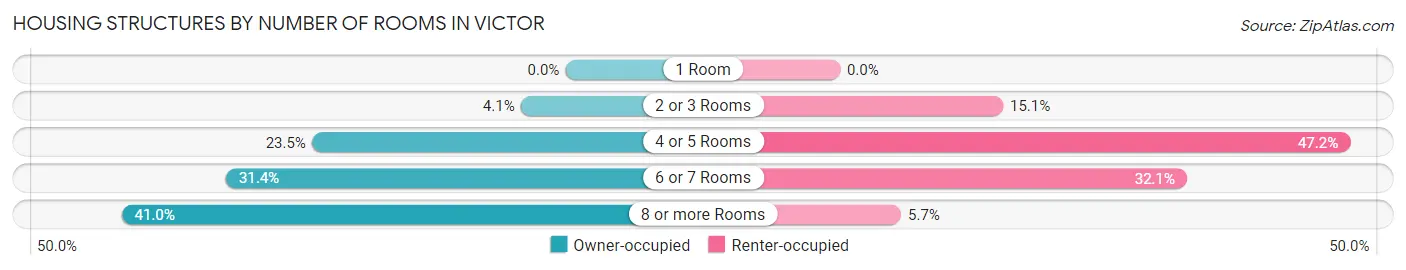
| Number of Rooms | Owner-occupied | Renter-occupied |
| 1 Room | 0 (0.0%) | 0 (0.0%) |
| 2 or 3 Rooms | 12 (4.1%) | 8 (15.1%) |
| 4 or 5 Rooms | 68 (23.4%) | 25 (47.2%) |
| 6 or 7 Rooms | 91 (31.4%) | 17 (32.1%) |
| 8 or more Rooms | 119 (41.0%) | 3 (5.7%) |
| Total | 290 (100.0%) | 53 (100.0%) |
Housing Structure by Heating Type in Victor
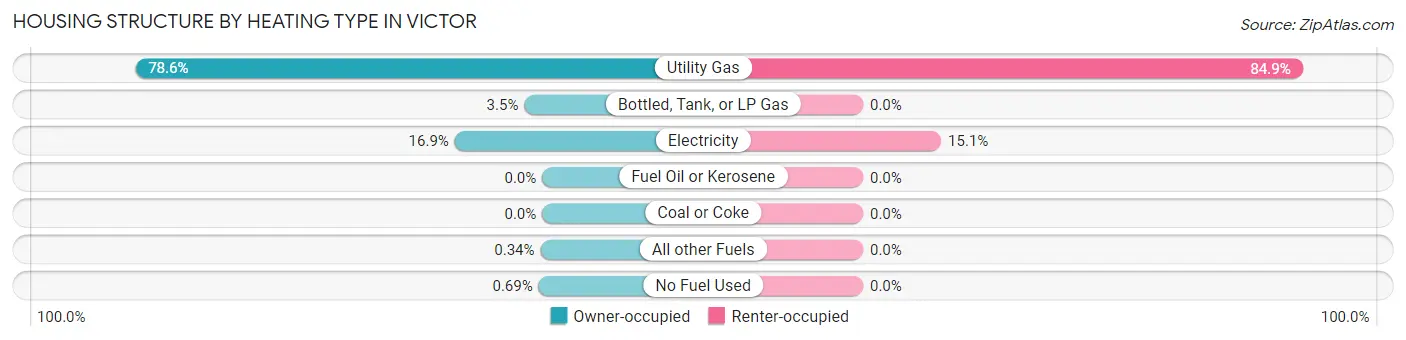
| Heating Type | Owner-occupied | Renter-occupied |
| Utility Gas | 228 (78.6%) | 45 (84.9%) |
| Bottled, Tank, or LP Gas | 10 (3.5%) | 0 (0.0%) |
| Electricity | 49 (16.9%) | 8 (15.1%) |
| Fuel Oil or Kerosene | 0 (0.0%) | 0 (0.0%) |
| Coal or Coke | 0 (0.0%) | 0 (0.0%) |
| All other Fuels | 1 (0.3%) | 0 (0.0%) |
| No Fuel Used | 2 (0.7%) | 0 (0.0%) |
| Total | 290 (100.0%) | 53 (100.0%) |
Household Vehicle Usage in Victor
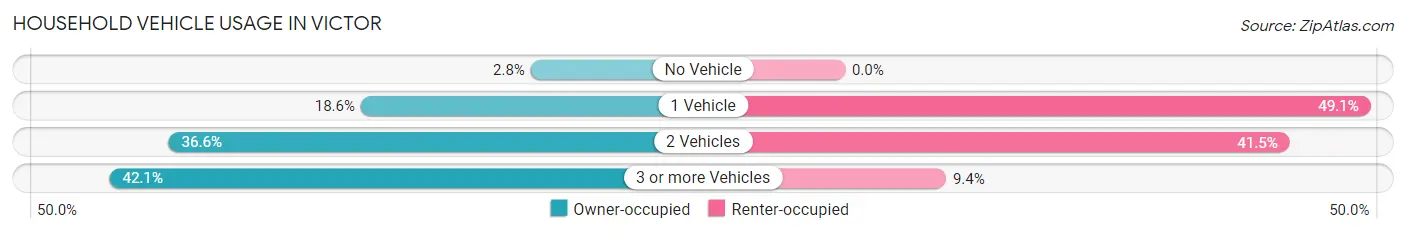
| Vehicles per Household | Owner-occupied | Renter-occupied |
| No Vehicle | 8 (2.8%) | 0 (0.0%) |
| 1 Vehicle | 54 (18.6%) | 26 (49.1%) |
| 2 Vehicles | 106 (36.5%) | 22 (41.5%) |
| 3 or more Vehicles | 122 (42.1%) | 5 (9.4%) |
| Total | 290 (100.0%) | 53 (100.0%) |
Real Estate & Mortgages in Victor
Real Estate and Mortgage Overview in Victor
| Characteristic | Without Mortgage | With Mortgage |
| Housing Units | 134 | 156 |
| Median Property Value | $113,000 | $98,400 |
| Median Household Income | $56,000 | $8 |
| Monthly Housing Costs | $523 | $0 |
| Real Estate Taxes | $1,813 | $0 |
Property Value by Mortgage Status in Victor
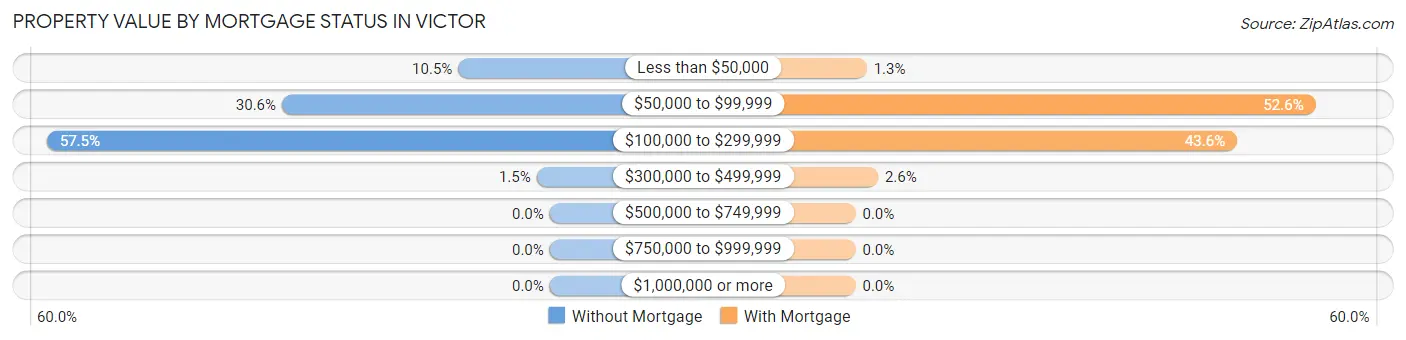
| Property Value | Without Mortgage | With Mortgage |
| Less than $50,000 | 14 (10.4%) | 2 (1.3%) |
| $50,000 to $99,999 | 41 (30.6%) | 82 (52.6%) |
| $100,000 to $299,999 | 77 (57.5%) | 68 (43.6%) |
| $300,000 to $499,999 | 2 (1.5%) | 4 (2.6%) |
| $500,000 to $749,999 | 0 (0.0%) | 0 (0.0%) |
| $750,000 to $999,999 | 0 (0.0%) | 0 (0.0%) |
| $1,000,000 or more | 0 (0.0%) | 0 (0.0%) |
| Total | 134 (100.0%) | 156 (100.0%) |
Household Income by Mortgage Status in Victor
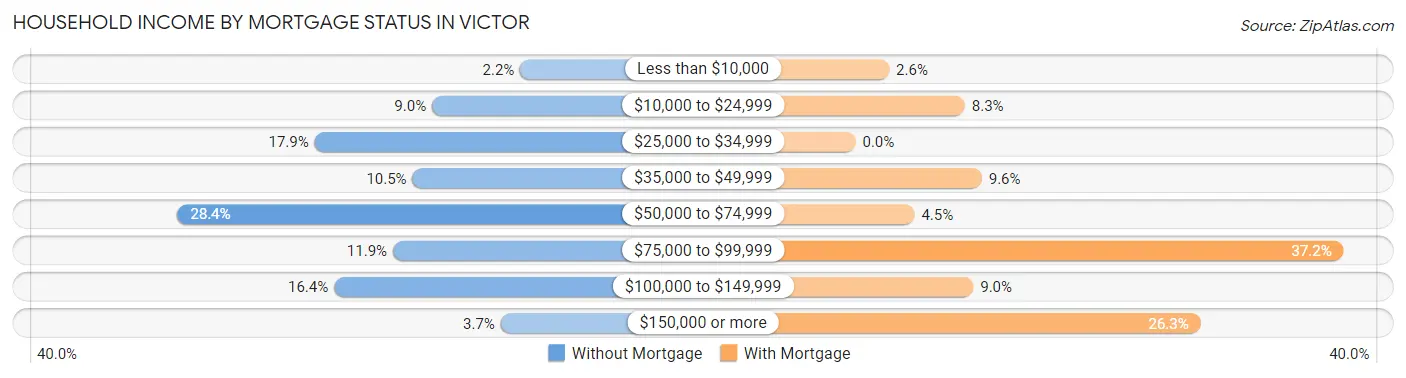
| Household Income | Without Mortgage | With Mortgage |
| Less than $10,000 | 3 (2.2%) | 4 (2.6%) |
| $10,000 to $24,999 | 12 (9.0%) | 13 (8.3%) |
| $25,000 to $34,999 | 24 (17.9%) | 0 (0.0%) |
| $35,000 to $49,999 | 14 (10.4%) | 15 (9.6%) |
| $50,000 to $74,999 | 38 (28.4%) | 7 (4.5%) |
| $75,000 to $99,999 | 16 (11.9%) | 58 (37.2%) |
| $100,000 to $149,999 | 22 (16.4%) | 14 (9.0%) |
| $150,000 or more | 5 (3.7%) | 41 (26.3%) |
| Total | 134 (100.0%) | 156 (100.0%) |
Property Value to Household Income Ratio in Victor
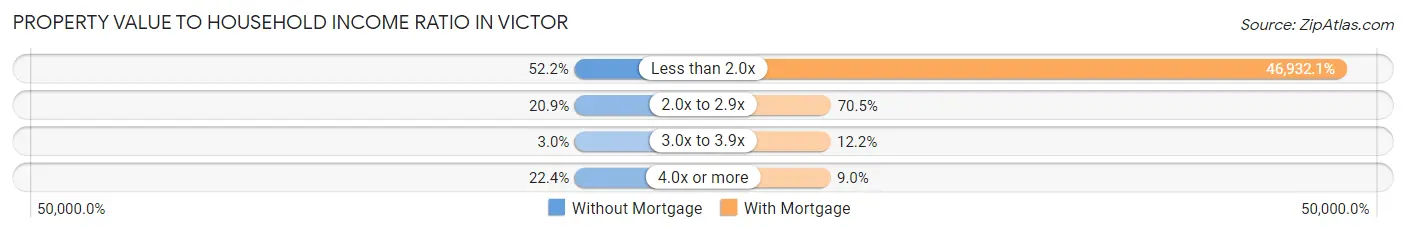
| Value-to-Income Ratio | Without Mortgage | With Mortgage |
| Less than 2.0x | 70 (52.2%) | 73,214 (46,932.0%) |
| 2.0x to 2.9x | 28 (20.9%) | 110 (70.5%) |
| 3.0x to 3.9x | 4 (3.0%) | 19 (12.2%) |
| 4.0x or more | 30 (22.4%) | 14 (9.0%) |
| Total | 134 (100.0%) | 156 (100.0%) |
Real Estate Taxes by Mortgage Status in Victor
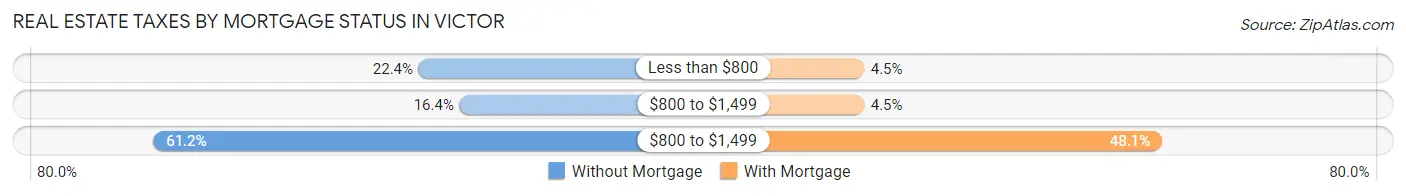
| Property Taxes | Without Mortgage | With Mortgage |
| Less than $800 | 30 (22.4%) | 7 (4.5%) |
| $800 to $1,499 | 22 (16.4%) | 7 (4.5%) |
| $800 to $1,499 | 82 (61.2%) | 75 (48.1%) |
| Total | 134 (100.0%) | 156 (100.0%) |
Health & Disability in Victor
Health Insurance Coverage by Age in Victor
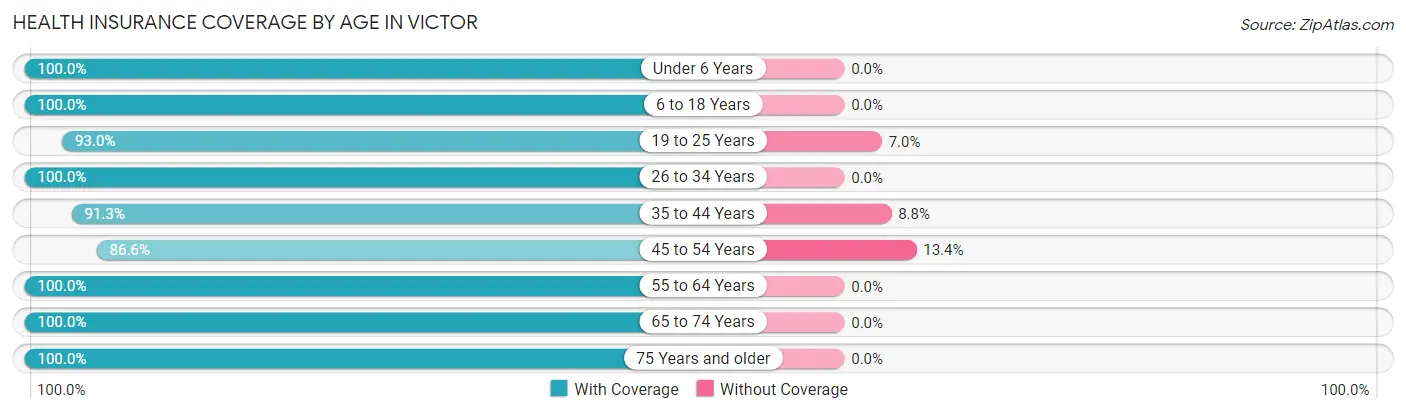
| Age Bracket | With Coverage | Without Coverage |
| Under 6 Years | 100 (100.0%) | 0 (0.0%) |
| 6 to 18 Years | 177 (100.0%) | 0 (0.0%) |
| 19 to 25 Years | 40 (93.0%) | 3 (7.0%) |
| 26 to 34 Years | 87 (100.0%) | 0 (0.0%) |
| 35 to 44 Years | 73 (91.2%) | 7 (8.7%) |
| 45 to 54 Years | 116 (86.6%) | 18 (13.4%) |
| 55 to 64 Years | 168 (100.0%) | 0 (0.0%) |
| 65 to 74 Years | 95 (100.0%) | 0 (0.0%) |
| 75 Years and older | 62 (100.0%) | 0 (0.0%) |
| Total | 918 (97.0%) | 28 (3.0%) |
Health Insurance Coverage by Citizenship Status in Victor
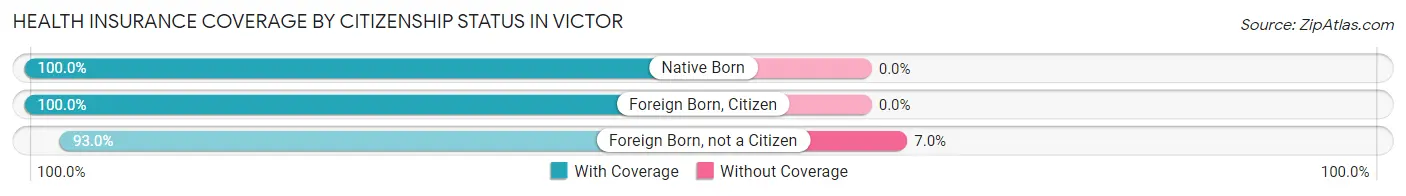
| Citizenship Status | With Coverage | Without Coverage |
| Native Born | 100 (100.0%) | 0 (0.0%) |
| Foreign Born, Citizen | 177 (100.0%) | 0 (0.0%) |
| Foreign Born, not a Citizen | 40 (93.0%) | 3 (7.0%) |
Health Insurance Coverage by Household Income in Victor
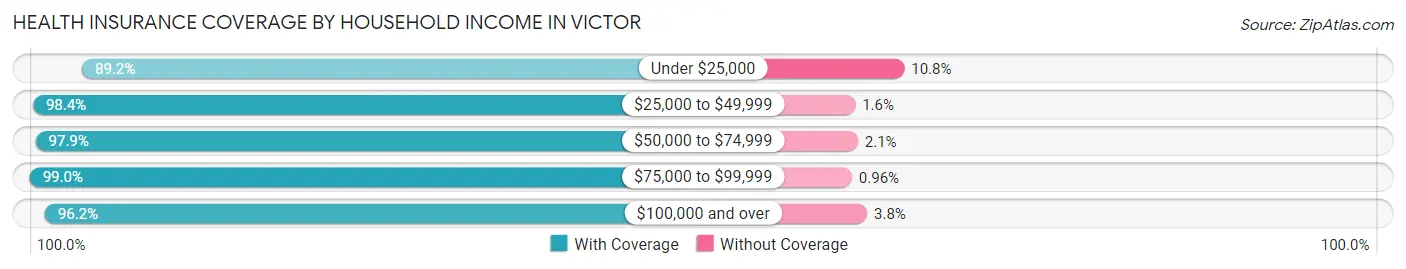
| Household Income | With Coverage | Without Coverage |
| Under $25,000 | 58 (89.2%) | 7 (10.8%) |
| $25,000 to $49,999 | 125 (98.4%) | 2 (1.6%) |
| $50,000 to $74,999 | 379 (97.9%) | 8 (2.1%) |
| $75,000 to $99,999 | 103 (99.0%) | 1 (1.0%) |
| $100,000 and over | 253 (96.2%) | 10 (3.8%) |
Public vs Private Health Insurance Coverage by Age in Victor
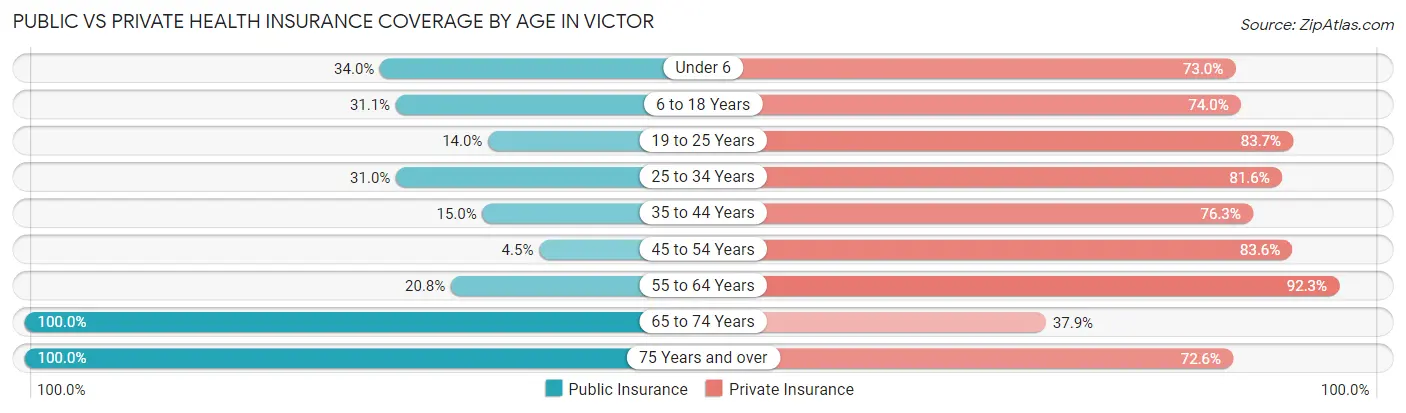
| Age Bracket | Public Insurance | Private Insurance |
| Under 6 | 34 (34.0%) | 73 (73.0%) |
| 6 to 18 Years | 55 (31.1%) | 131 (74.0%) |
| 19 to 25 Years | 6 (14.0%) | 36 (83.7%) |
| 25 to 34 Years | 27 (31.0%) | 71 (81.6%) |
| 35 to 44 Years | 12 (15.0%) | 61 (76.2%) |
| 45 to 54 Years | 6 (4.5%) | 112 (83.6%) |
| 55 to 64 Years | 35 (20.8%) | 155 (92.3%) |
| 65 to 74 Years | 95 (100.0%) | 36 (37.9%) |
| 75 Years and over | 62 (100.0%) | 45 (72.6%) |
| Total | 332 (35.1%) | 720 (76.1%) |
Disability Status by Sex by Age in Victor
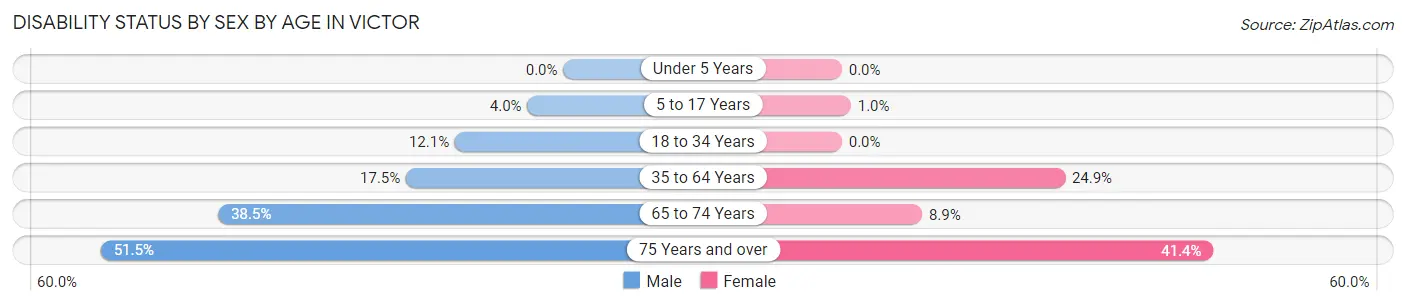
| Age Bracket | Male | Female |
| Under 5 Years | 0 (0.0%) | 0 (0.0%) |
| 5 to 17 Years | 3 (4.0%) | 1 (1.0%) |
| 18 to 34 Years | 7 (12.1%) | 0 (0.0%) |
| 35 to 64 Years | 38 (17.5%) | 41 (24.8%) |
| 65 to 74 Years | 15 (38.5%) | 5 (8.9%) |
| 75 Years and over | 17 (51.5%) | 12 (41.4%) |
Disability Class by Sex by Age in Victor
Disability Class: Hearing Difficulty
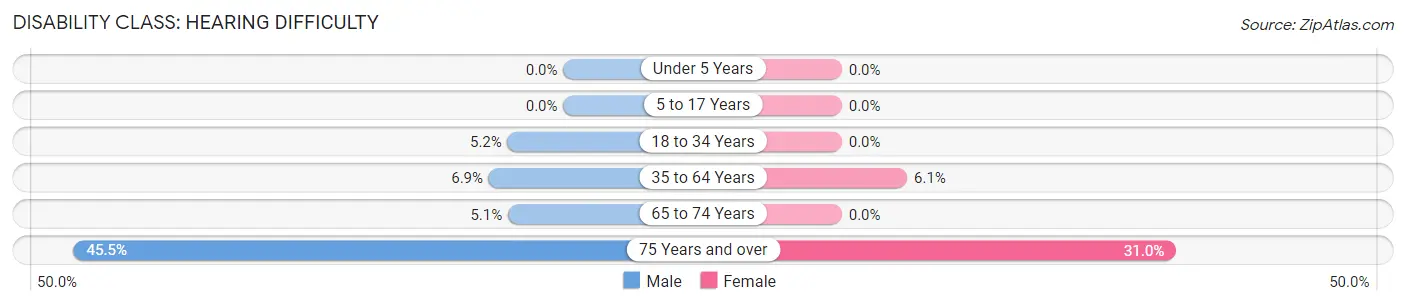
| Age Bracket | Male | Female |
| Under 5 Years | 0 (0.0%) | 0 (0.0%) |
| 5 to 17 Years | 0 (0.0%) | 0 (0.0%) |
| 18 to 34 Years | 3 (5.2%) | 0 (0.0%) |
| 35 to 64 Years | 15 (6.9%) | 10 (6.1%) |
| 65 to 74 Years | 2 (5.1%) | 0 (0.0%) |
| 75 Years and over | 15 (45.5%) | 9 (31.0%) |
Disability Class: Vision Difficulty
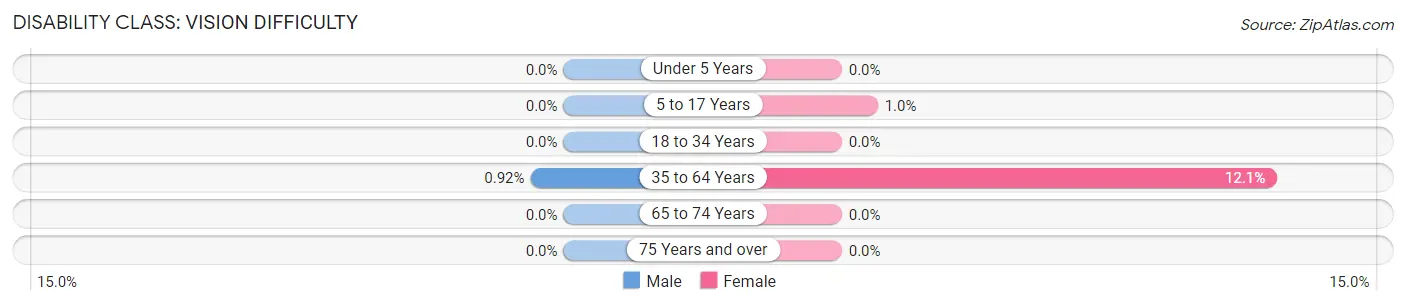
| Age Bracket | Male | Female |
| Under 5 Years | 0 (0.0%) | 0 (0.0%) |
| 5 to 17 Years | 0 (0.0%) | 1 (1.0%) |
| 18 to 34 Years | 0 (0.0%) | 0 (0.0%) |
| 35 to 64 Years | 2 (0.9%) | 20 (12.1%) |
| 65 to 74 Years | 0 (0.0%) | 0 (0.0%) |
| 75 Years and over | 0 (0.0%) | 0 (0.0%) |
Disability Class: Cognitive Difficulty
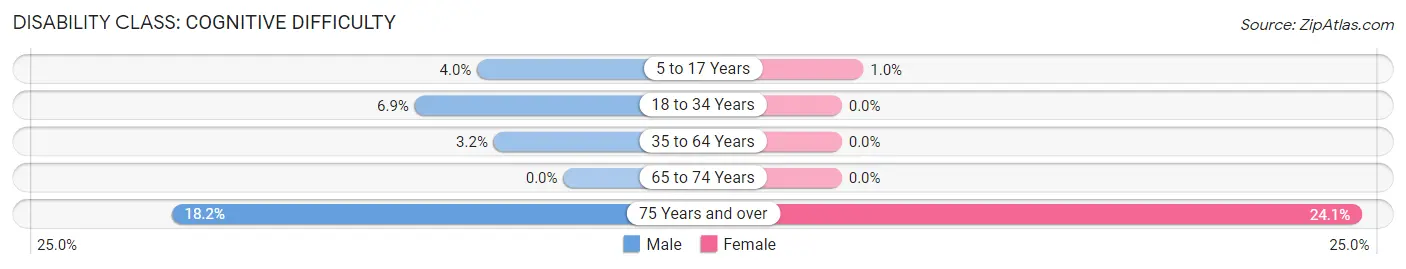
| Age Bracket | Male | Female |
| 5 to 17 Years | 3 (4.0%) | 1 (1.0%) |
| 18 to 34 Years | 4 (6.9%) | 0 (0.0%) |
| 35 to 64 Years | 7 (3.2%) | 0 (0.0%) |
| 65 to 74 Years | 0 (0.0%) | 0 (0.0%) |
| 75 Years and over | 6 (18.2%) | 7 (24.1%) |
Disability Class: Ambulatory Difficulty
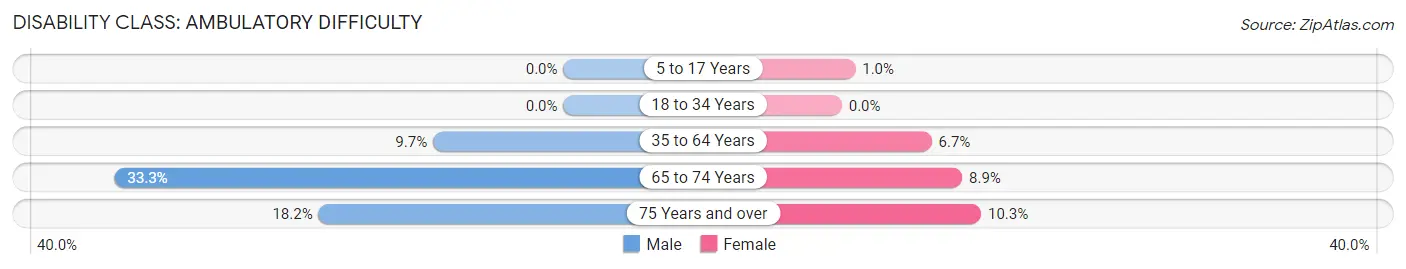
| Age Bracket | Male | Female |
| 5 to 17 Years | 0 (0.0%) | 1 (1.0%) |
| 18 to 34 Years | 0 (0.0%) | 0 (0.0%) |
| 35 to 64 Years | 21 (9.7%) | 11 (6.7%) |
| 65 to 74 Years | 13 (33.3%) | 5 (8.9%) |
| 75 Years and over | 6 (18.2%) | 3 (10.3%) |
Disability Class: Self-Care Difficulty
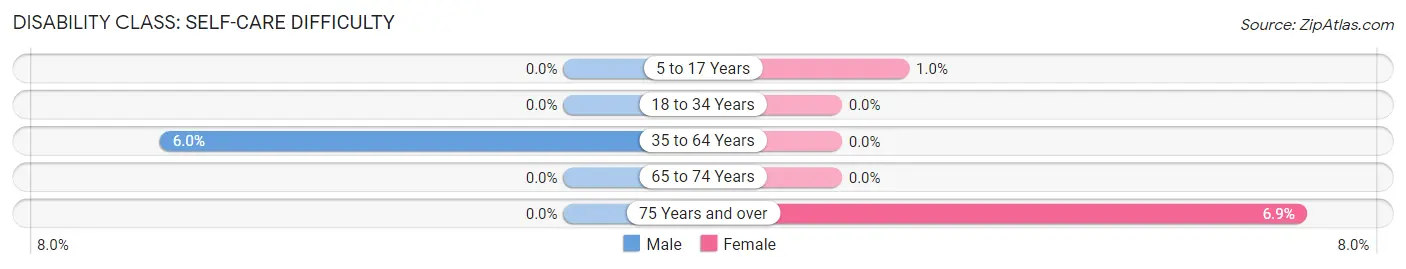
| Age Bracket | Male | Female |
| 5 to 17 Years | 0 (0.0%) | 1 (1.0%) |
| 18 to 34 Years | 0 (0.0%) | 0 (0.0%) |
| 35 to 64 Years | 13 (6.0%) | 0 (0.0%) |
| 65 to 74 Years | 0 (0.0%) | 0 (0.0%) |
| 75 Years and over | 0 (0.0%) | 2 (6.9%) |
Technology Access in Victor
Computing Device Access in Victor
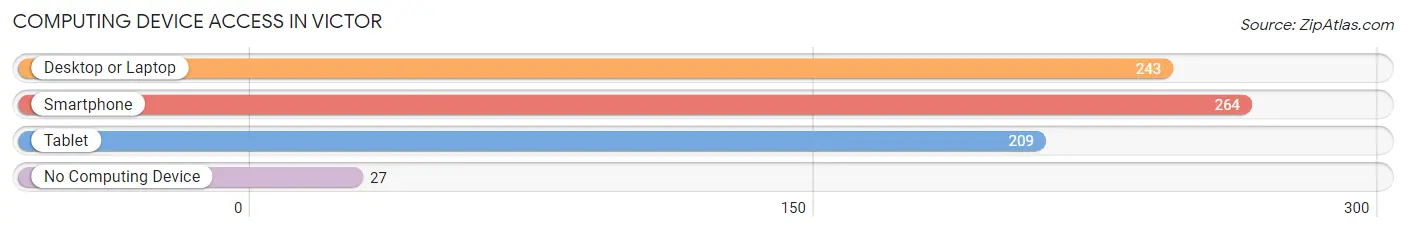
| Device Type | # Households | % Households |
| Desktop or Laptop | 243 | 70.9% |
| Smartphone | 264 | 77.0% |
| Tablet | 209 | 60.9% |
| No Computing Device | 27 | 7.9% |
| Total | 343 | 100.0% |
Internet Access in Victor
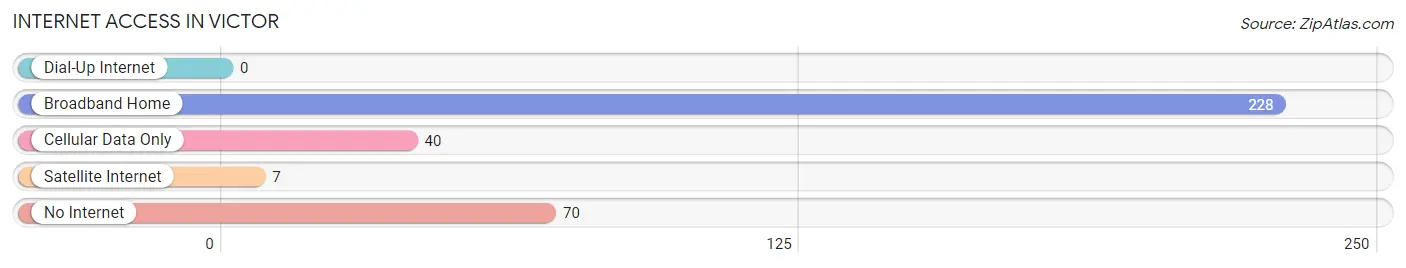
| Internet Type | # Households | % Households |
| Dial-Up Internet | 0 | 0.0% |
| Broadband Home | 228 | 66.5% |
| Cellular Data Only | 40 | 11.7% |
| Satellite Internet | 7 | 2.0% |
| No Internet | 70 | 20.4% |
| Total | 343 | 100.0% |
Victor Summary
Victor, Iowa is a small town located in the southeastern corner of Iowa, in the county of Keokuk. It is situated on the banks of the Iowa River, and is surrounded by rolling hills and farmland. The town has a population of just over 1,000 people, and is known for its small-town charm and friendly atmosphere.
Victor was founded in 1854 by a group of settlers from Ohio. The town was named after a local Native American chief, Victor, who had been a friend to the settlers. The town quickly grew, and by the late 1800s, it had become a thriving agricultural center. The town was home to several grain elevators, a flour mill, and a number of other businesses.
Victor is located in a rural area of Iowa, and the economy is largely based on agriculture. The town is home to several large farms, and the surrounding area is known for its production of corn, soybeans, and other crops. The town also has a number of small businesses, including a grocery store, a hardware store, and a few restaurants.
Victor is served by the Keokuk County School District, which includes two elementary schools, a middle school, and a high school. The town also has a public library, a post office, and a number of churches.
Victor is a predominantly white town, with a population that is 97.3% white. The median household income is $45,000, and the median home value is $90,000. The town has a low unemployment rate, and the poverty rate is below the national average.
Victor is a small town with a lot of charm and a friendly atmosphere. It is a great place to raise a family, and the town is known for its strong sense of community. The town is also home to a number of parks and recreational areas, and the Iowa River provides a great place for fishing and boating. Victor is a great place to live, and it is a great place to visit.
Common Questions
What is Per Capita Income in Victor?
Per Capita income in Victor is $27,771.
What is the Median Family Income in Victor?
Median Family Income in Victor is $72,727.
What is the Median Household income in Victor?
Median Household Income in Victor is $64,141.
What is Income or Wage Gap in Victor?
Income or Wage Gap in Victor is 6.8%.
Women in Victor earn 93.2 cents for every dollar earned by a man.
What is Inequality or Gini Index in Victor?
Inequality or Gini Index in Victor is 0.36.
What is the Total Population of Victor?
Total Population of Victor is 946.
What is the Total Male Population of Victor?
Total Male Population of Victor is 473.
What is the Total Female Population of Victor?
Total Female Population of Victor is 473.
What is the Ratio of Males per 100 Females in Victor?
There are 100.00 Males per 100 Females in Victor.
What is the Ratio of Females per 100 Males in Victor?
There are 100.00 Females per 100 Males in Victor.
What is the Median Population Age in Victor?
Median Population Age in Victor is 43.3 Years.
What is the Average Family Size in Victor
Average Family Size in Victor is 3.4 People.
What is the Average Household Size in Victor
Average Household Size in Victor is 2.8 People.
How Large is the Labor Force in Victor?
There are 423 People in the Labor Forcein in Victor.
What is the Percentage of People in the Labor Force in Victor?
60.3% of People are in the Labor Force in Victor.
What is the Unemployment Rate in Victor?
Unemployment Rate in Victor is 1.9%.