Unionville, IA Map & Demographics
Unionville Map
Unionville Overview
$29,889
PER CAPITA INCOME
$73,750
AVG FAMILY INCOME
0.42
INEQUALITY / GINI INDEX
115
TOTAL POPULATION
72
MALE POPULATION
43
FEMALE POPULATION
167.44
MALES / 100 FEMALES
59.72
FEMALES / 100 MALES
60.9
MEDIAN AGE
2.2
AVG FAMILY SIZE
1.9
AVG HOUSEHOLD SIZE
54
LABOR FORCE [ PEOPLE ]
52.9%
PERCENT IN LABOR FORCE
1.9%
UNEMPLOYMENT RATE
Unionville Zip Codes
Unionville Area Codes
Income in Unionville
Income Overview in Unionville
| Characteristic | Number | Measure |
| Per Capita Income | 115 | $29,889 |
| Median Family Income | 44 | $73,750 |
| Mean Family Income | 44 | $69,907 |
| Median Household Income | 62 | $0 |
| Mean Household Income | 62 | $56,165 |
| Income Deficit | 44 | $0 |
| Wage / Income Gap (%) | 115 | 0.00% |
| Wage / Income Gap ($) | 115 | 100.00¢ per $1 |
| Gini / Inequality Index | 115 | 0.42 |
Earnings by Sex in Unionville
| Sex | Number | Average Earnings |
| Male | 38 (69.1%) | $0 |
| Female | 17 (30.9%) | $0 |
| Total | 55 (100.0%) | $0 |
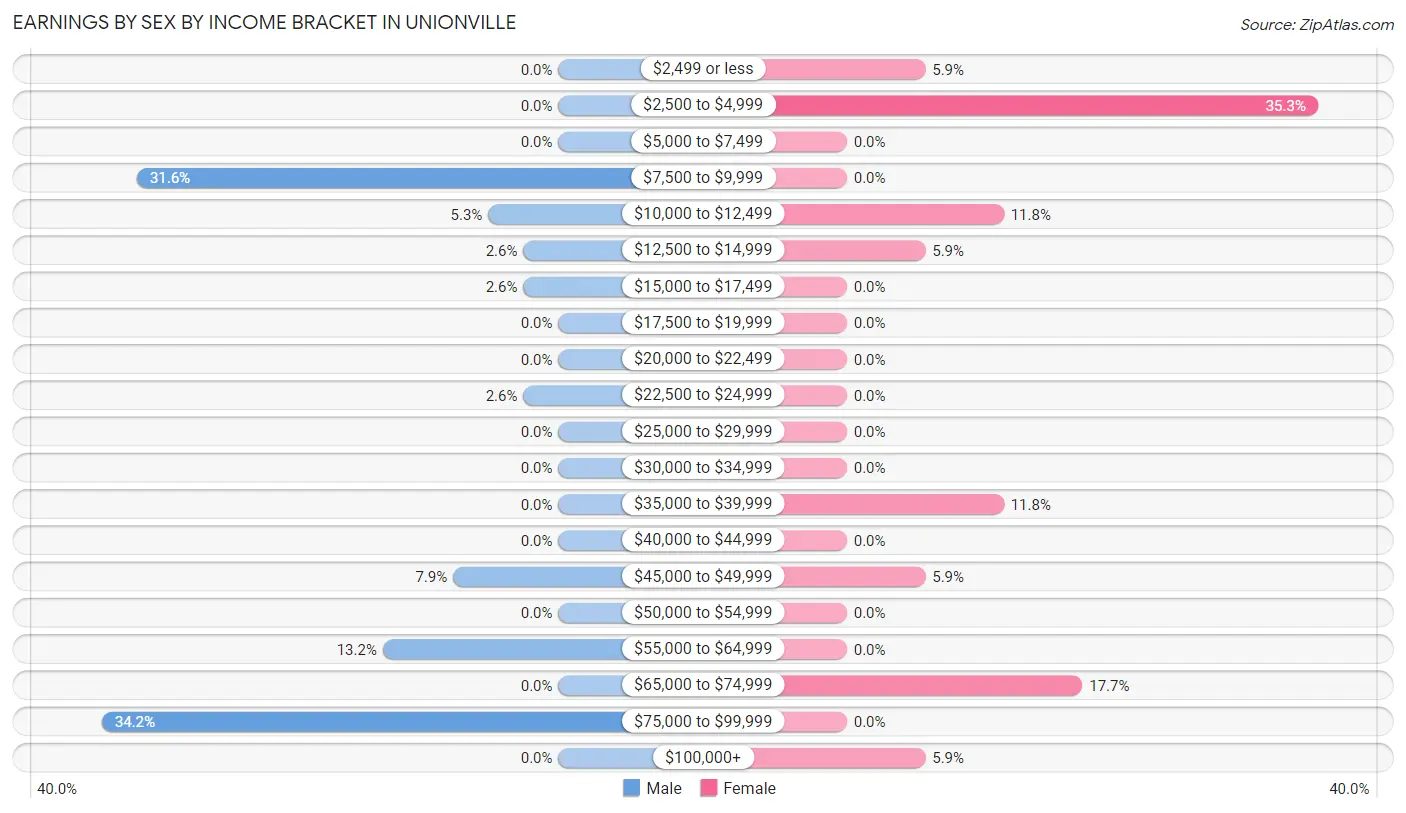
Earnings by Sex by Income Bracket in Unionville
The most common earnings brackets in Unionville are $75,000 to $99,999 for men (13 | 34.2%) and $2,500 to $4,999 for women (6 | 35.3%).
| Income | Male | Female |
| $2,499 or less | 0 (0.0%) | 1 (5.9%) |
| $2,500 to $4,999 | 0 (0.0%) | 6 (35.3%) |
| $5,000 to $7,499 | 0 (0.0%) | 0 (0.0%) |
| $7,500 to $9,999 | 12 (31.6%) | 0 (0.0%) |
| $10,000 to $12,499 | 2 (5.3%) | 2 (11.8%) |
| $12,500 to $14,999 | 1 (2.6%) | 1 (5.9%) |
| $15,000 to $17,499 | 1 (2.6%) | 0 (0.0%) |
| $17,500 to $19,999 | 0 (0.0%) | 0 (0.0%) |
| $20,000 to $22,499 | 0 (0.0%) | 0 (0.0%) |
| $22,500 to $24,999 | 1 (2.6%) | 0 (0.0%) |
| $25,000 to $29,999 | 0 (0.0%) | 0 (0.0%) |
| $30,000 to $34,999 | 0 (0.0%) | 0 (0.0%) |
| $35,000 to $39,999 | 0 (0.0%) | 2 (11.8%) |
| $40,000 to $44,999 | 0 (0.0%) | 0 (0.0%) |
| $45,000 to $49,999 | 3 (7.9%) | 1 (5.9%) |
| $50,000 to $54,999 | 0 (0.0%) | 0 (0.0%) |
| $55,000 to $64,999 | 5 (13.2%) | 0 (0.0%) |
| $65,000 to $74,999 | 0 (0.0%) | 3 (17.6%) |
| $75,000 to $99,999 | 13 (34.2%) | 0 (0.0%) |
| $100,000+ | 0 (0.0%) | 1 (5.9%) |
| Total | 38 (100.0%) | 17 (100.0%) |
Earnings by Sex by Educational Attainment in Unionville
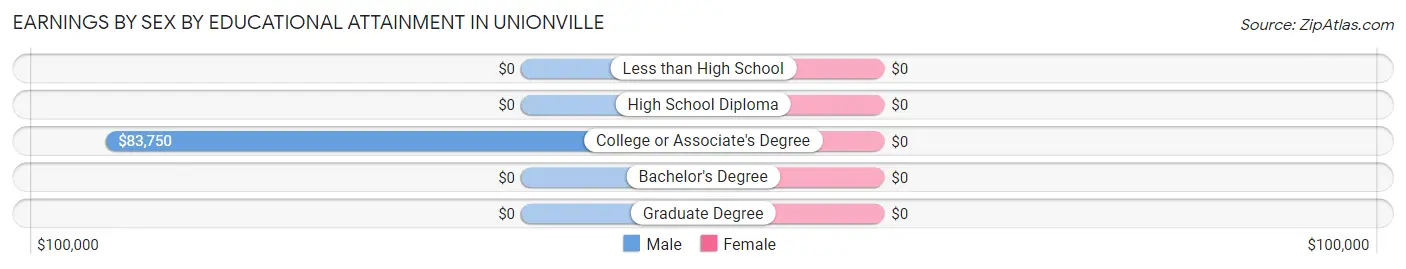
| Educational Attainment | Male Income | Female Income |
| Less than High School | - | - |
| High School Diploma | - | - |
| College or Associate's Degree | $83,750 | $0 |
| Bachelor's Degree | - | - |
| Graduate Degree | - | - |
| Total | $57,000 | $0 |
Family Income in Unionville
Family Income Brackets in Unionville
According to the Unionville family income data, there are 14 families falling into the $15,000 to $24,999 income range, which is the most common income bracket and makes up 31.8% of all families.
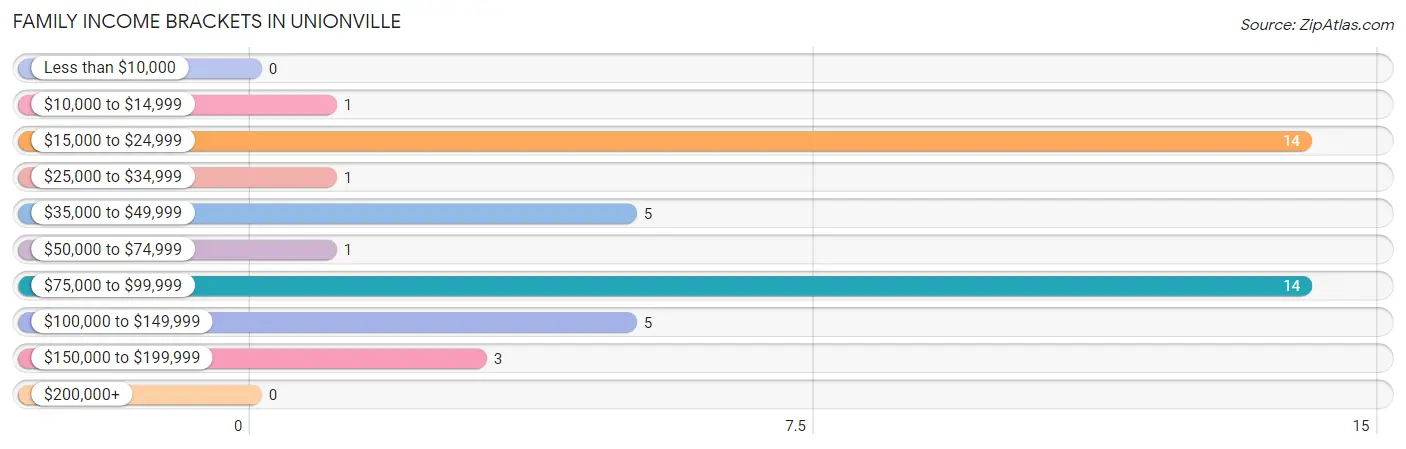
| Income Bracket | # Families | % Families |
| Less than $10,000 | 0 | 0.0% |
| $10,000 to $14,999 | 1 | 2.3% |
| $15,000 to $24,999 | 14 | 31.8% |
| $25,000 to $34,999 | 1 | 2.3% |
| $35,000 to $49,999 | 5 | 11.4% |
| $50,000 to $74,999 | 1 | 2.3% |
| $75,000 to $99,999 | 14 | 31.8% |
| $100,000 to $149,999 | 5 | 11.4% |
| $150,000 to $199,999 | 3 | 6.8% |
| $200,000+ | 0 | 0.0% |
Family Income by Famaliy Size in Unionville
2-person families (37 | 84.1%) account for the highest median family income in Unionville with $88,125 per family, while 2-person families (37 | 84.1%) have the highest median income of $44,062 per family member.
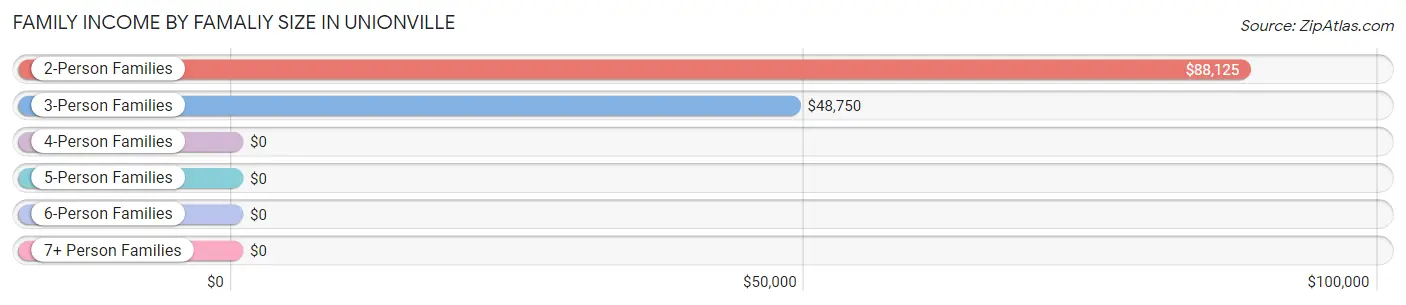
| Income Bracket | # Families | Median Income |
| 2-Person Families | 37 (84.1%) | $88,125 |
| 3-Person Families | 4 (9.1%) | $48,750 |
| 4-Person Families | 3 (6.8%) | $0 |
| 5-Person Families | 0 (0.0%) | $0 |
| 6-Person Families | 0 (0.0%) | $0 |
| 7+ Person Families | 0 (0.0%) | $0 |
| Total | 44 (100.0%) | $73,750 |
Family Income by Number of Earners in Unionville
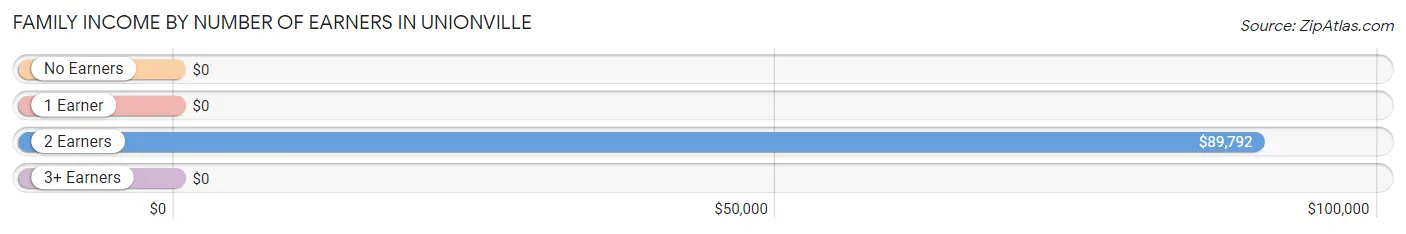
| Number of Earners | # Families | Median Income |
| No Earners | 8 (18.2%) | $0 |
| 1 Earner | 21 (47.7%) | $0 |
| 2 Earners | 15 (34.1%) | $89,792 |
| 3+ Earners | 0 (0.0%) | $0 |
| Total | 44 (100.0%) | $73,750 |
Household Income in Unionville
Household Income Brackets in Unionville
With 25 households falling in the category, the $15,000 to $24,999 income range is the most frequent in Unionville, accounting for 40.3% of all households.
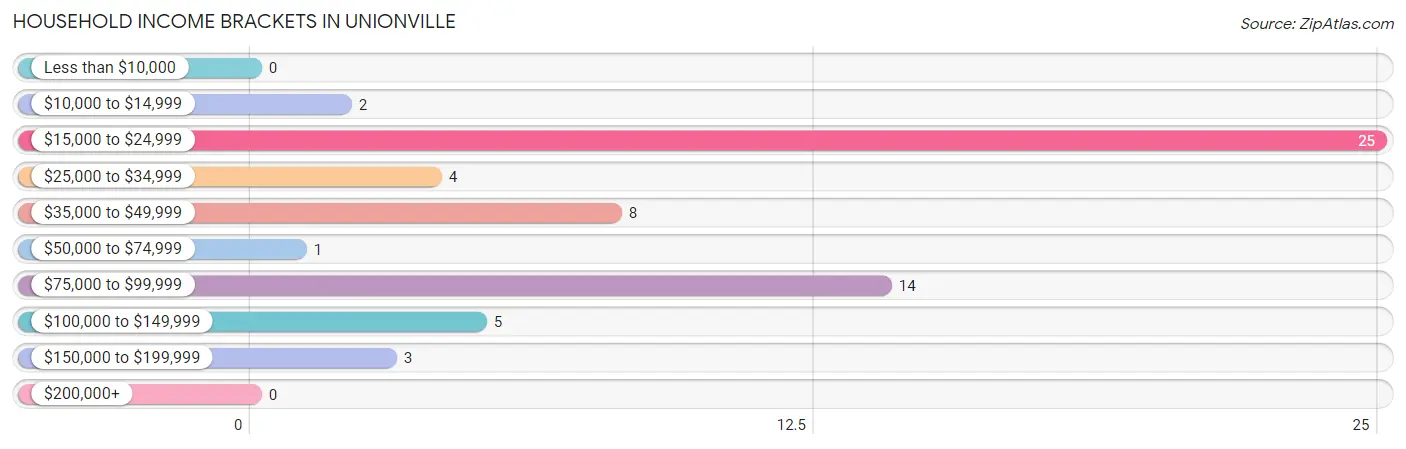
| Income Bracket | # Households | % Households |
| Less than $10,000 | 0 | 0.0% |
| $10,000 to $14,999 | 2 | 3.2% |
| $15,000 to $24,999 | 25 | 40.3% |
| $25,000 to $34,999 | 4 | 6.5% |
| $35,000 to $49,999 | 8 | 12.9% |
| $50,000 to $74,999 | 1 | 1.6% |
| $75,000 to $99,999 | 14 | 22.6% |
| $100,000 to $149,999 | 5 | 8.1% |
| $150,000 to $199,999 | 3 | 4.8% |
| $200,000+ | 0 | 0.0% |
Household Income by Householder Age in Unionville
The median household income in Unionville is $0, with the highest median household income of $94,000 found in the 45 to 64 years age bracket for the primary householder. A total of 18 households (29.0%) fall into this category. Meanwhile, the 15 to 24 years age bracket for the primary householder has the lowest median household income of $0, with 10 households (16.1%) in this group.
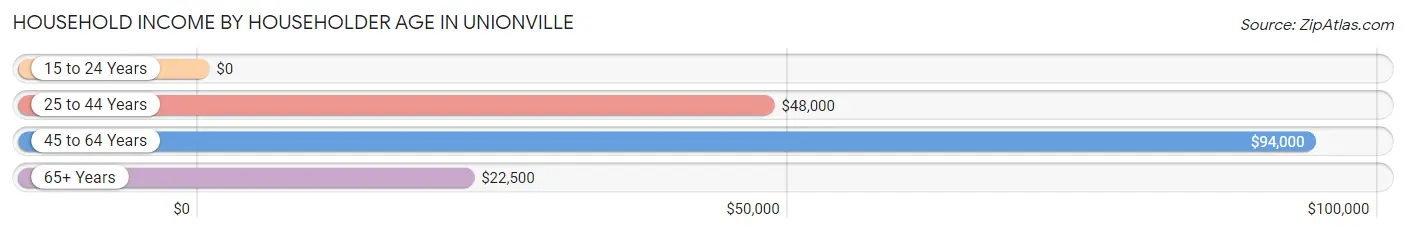
| Income Bracket | # Households | Median Income |
| 15 to 24 Years | 10 (16.1%) | $0 |
| 25 to 44 Years | 10 (16.1%) | $48,000 |
| 45 to 64 Years | 18 (29.0%) | $94,000 |
| 65+ Years | 24 (38.7%) | $22,500 |
| Total | 62 (100.0%) | $0 |
Poverty in Unionville
Income Below Poverty by Sex and Age in Unionville
With 8.3% poverty level for males and 7.0% for females among the residents of Unionville, 25 to 34 year old males and 25 to 34 year old females are the most vulnerable to poverty, with 1 males (100.0%) and 3 females (50.0%) in their respective age groups living below the poverty level.
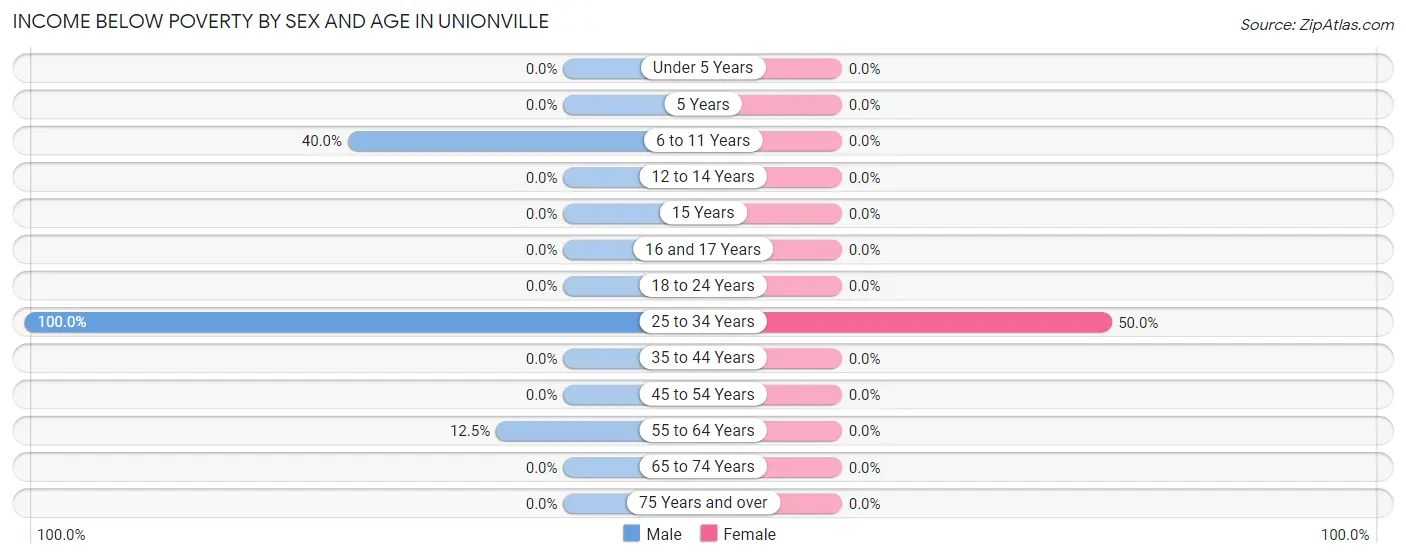
| Age Bracket | Male | Female |
| Under 5 Years | 0 (0.0%) | 0 (0.0%) |
| 5 Years | 0 (0.0%) | 0 (0.0%) |
| 6 to 11 Years | 4 (40.0%) | 0 (0.0%) |
| 12 to 14 Years | 0 (0.0%) | 0 (0.0%) |
| 15 Years | 0 (0.0%) | 0 (0.0%) |
| 16 and 17 Years | 0 (0.0%) | 0 (0.0%) |
| 18 to 24 Years | 0 (0.0%) | 0 (0.0%) |
| 25 to 34 Years | 1 (100.0%) | 3 (50.0%) |
| 35 to 44 Years | 0 (0.0%) | 0 (0.0%) |
| 45 to 54 Years | 0 (0.0%) | 0 (0.0%) |
| 55 to 64 Years | 1 (12.5%) | 0 (0.0%) |
| 65 to 74 Years | 0 (0.0%) | 0 (0.0%) |
| 75 Years and over | 0 (0.0%) | 0 (0.0%) |
| Total | 6 (8.3%) | 3 (7.0%) |
Income Above Poverty by Sex and Age in Unionville
According to the poverty statistics in Unionville, males aged under 5 years and females aged 18 to 24 years are the age groups that are most secure financially, with 100.0% of males and 100.0% of females in these age groups living above the poverty line.
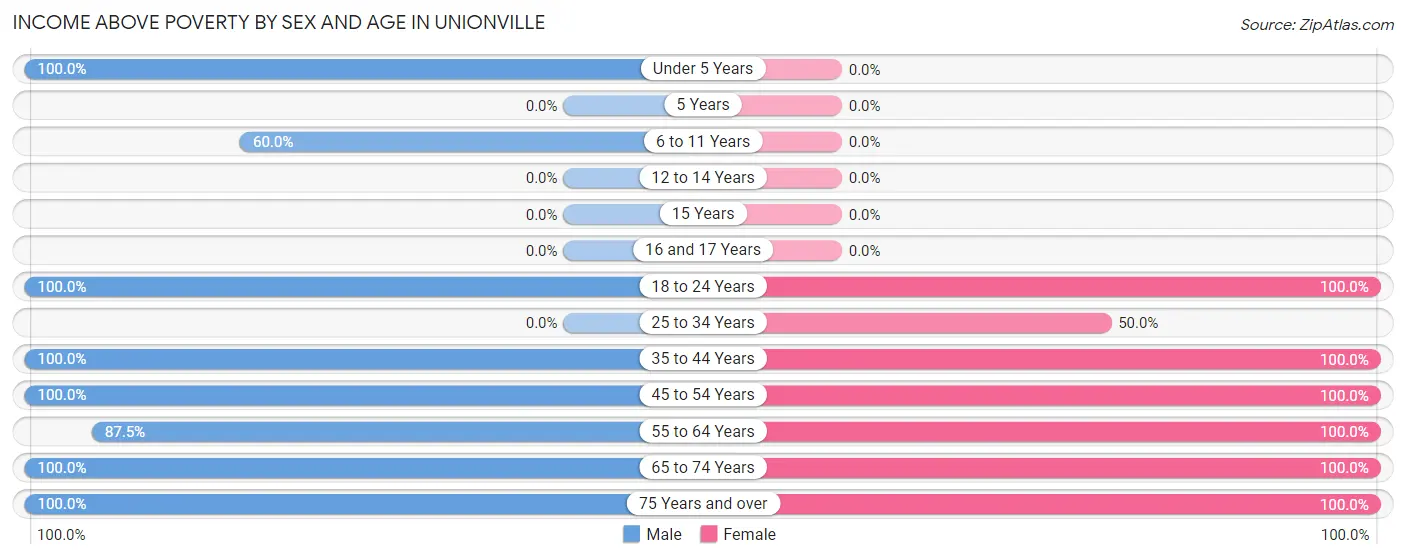
| Age Bracket | Male | Female |
| Under 5 Years | 3 (100.0%) | 0 (0.0%) |
| 5 Years | 0 (0.0%) | 0 (0.0%) |
| 6 to 11 Years | 6 (60.0%) | 0 (0.0%) |
| 12 to 14 Years | 0 (0.0%) | 0 (0.0%) |
| 15 Years | 0 (0.0%) | 0 (0.0%) |
| 16 and 17 Years | 0 (0.0%) | 0 (0.0%) |
| 18 to 24 Years | 10 (100.0%) | 6 (100.0%) |
| 25 to 34 Years | 0 (0.0%) | 3 (50.0%) |
| 35 to 44 Years | 6 (100.0%) | 3 (100.0%) |
| 45 to 54 Years | 6 (100.0%) | 1 (100.0%) |
| 55 to 64 Years | 7 (87.5%) | 13 (100.0%) |
| 65 to 74 Years | 23 (100.0%) | 9 (100.0%) |
| 75 Years and over | 5 (100.0%) | 5 (100.0%) |
| Total | 66 (91.7%) | 40 (93.0%) |
Income Below Poverty Among Married-Couple Families in Unionville
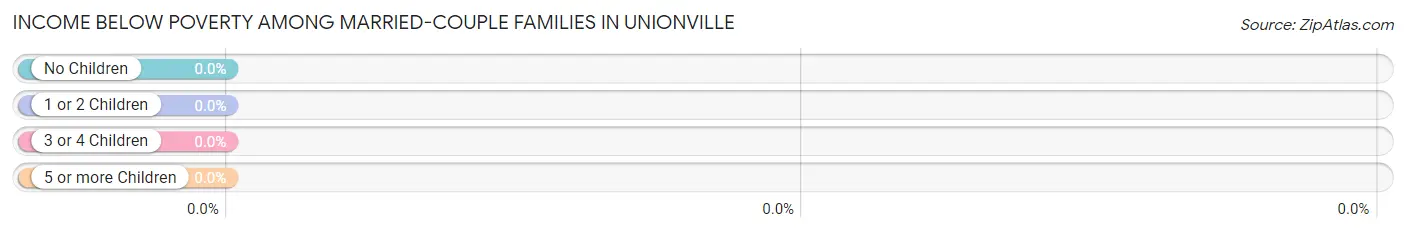
| Children | Above Poverty | Below Poverty |
| No Children | 21 (100.0%) | 0 (0.0%) |
| 1 or 2 Children | 5 (100.0%) | 0 (0.0%) |
| 3 or 4 Children | 0 (0.0%) | 0 (0.0%) |
| 5 or more Children | 0 (0.0%) | 0 (0.0%) |
| Total | 26 (100.0%) | 0 (0.0%) |
Income Below Poverty Among Single-Parent Households in Unionville
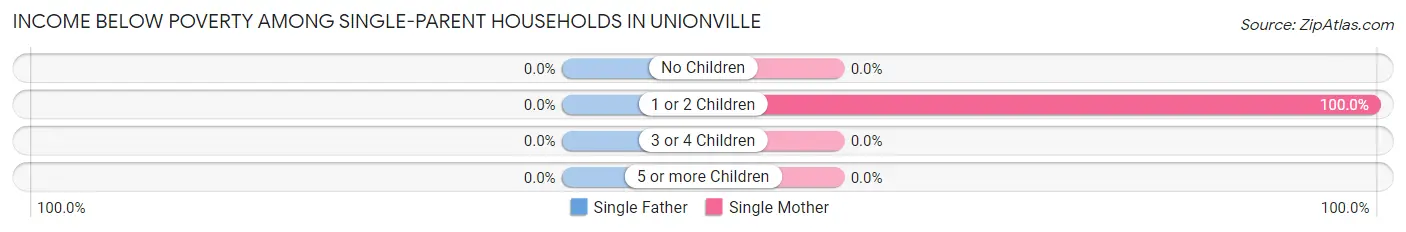
| Children | Single Father | Single Mother |
| No Children | 0 (0.0%) | 0 (0.0%) |
| 1 or 2 Children | 0 (0.0%) | 1 (100.0%) |
| 3 or 4 Children | 0 (0.0%) | 0 (0.0%) |
| 5 or more Children | 0 (0.0%) | 0 (0.0%) |
| Total | 0 (0.0%) | 1 (50.0%) |
Income Below Poverty Among Married-Couple vs Single-Parent Households in Unionville
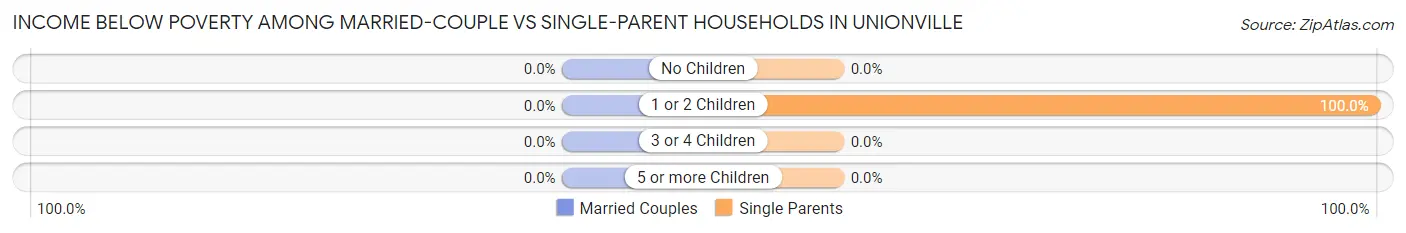
| Children | Married-Couple Families | Single-Parent Households |
| No Children | 0 (0.0%) | 0 (0.0%) |
| 1 or 2 Children | 0 (0.0%) | 1 (100.0%) |
| 3 or 4 Children | 0 (0.0%) | 0 (0.0%) |
| 5 or more Children | 0 (0.0%) | 0 (0.0%) |
| Total | 0 (0.0%) | 1 (5.6%) |
Race in Unionville
The most populous races in Unionville are White / Caucasian (104 | 90.4%), and Two or more Races (11 | 9.6%).
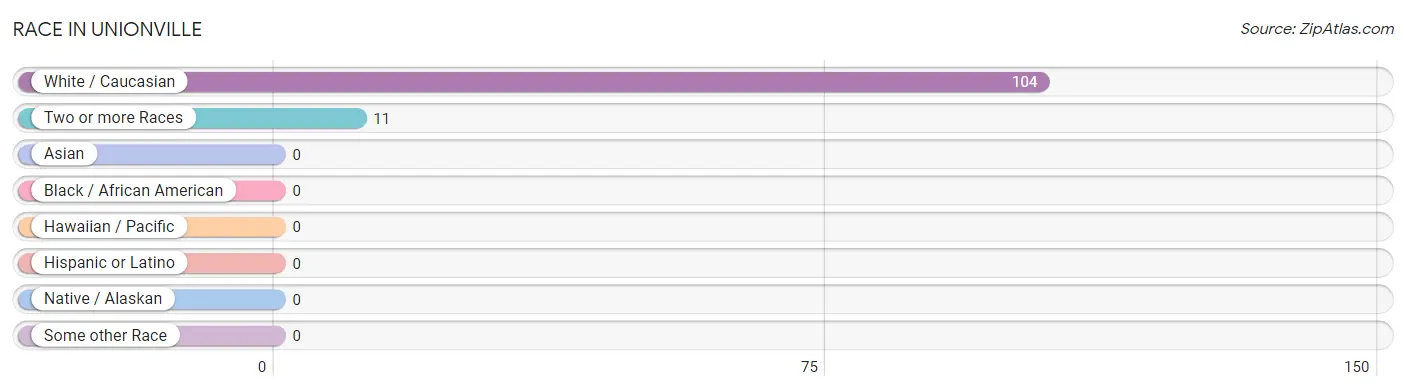
| Race | # Population | % Population |
| Asian | 0 | 0.0% |
| Black / African American | 0 | 0.0% |
| Hawaiian / Pacific | 0 | 0.0% |
| Hispanic or Latino | 0 | 0.0% |
| Native / Alaskan | 0 | 0.0% |
| White / Caucasian | 104 | 90.4% |
| Two or more Races | 11 | 9.6% |
| Some other Race | 0 | 0.0% |
| Total | 115 | 100.0% |
Ancestry in Unionville
The most populous ancestries reported in Unionville are Irish (28 | 24.3%), German (27 | 23.5%), English (13 | 11.3%), Eastern European (5 | 4.3%), and European (4 | 3.5%), together accounting for 67.0% of all Unionville residents.
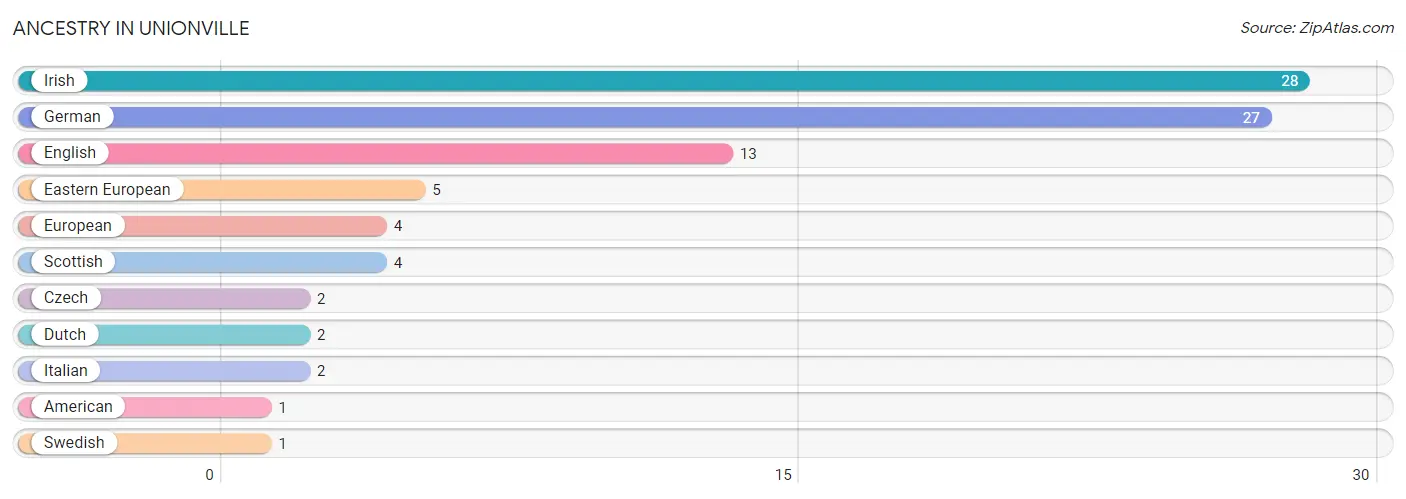
| Ancestry | # Population | % Population |
| American | 1 | 0.9% |
| Czech | 2 | 1.7% |
| Dutch | 2 | 1.7% |
| Eastern European | 5 | 4.3% |
| English | 13 | 11.3% |
| European | 4 | 3.5% |
| German | 27 | 23.5% |
| Irish | 28 | 24.3% |
| Italian | 2 | 1.7% |
| Scottish | 4 | 3.5% |
| Swedish | 1 | 0.9% | View All 11 Rows |
Immigrants in Unionville

| Immigration Origin | # Population | % Population | View All 0 Rows |
Sex and Age in Unionville
Sex and Age in Unionville
The most populous age groups in Unionville are 65 to 69 Years (19 | 26.4%) for men and 60 to 64 Years (13 | 30.2%) for women.
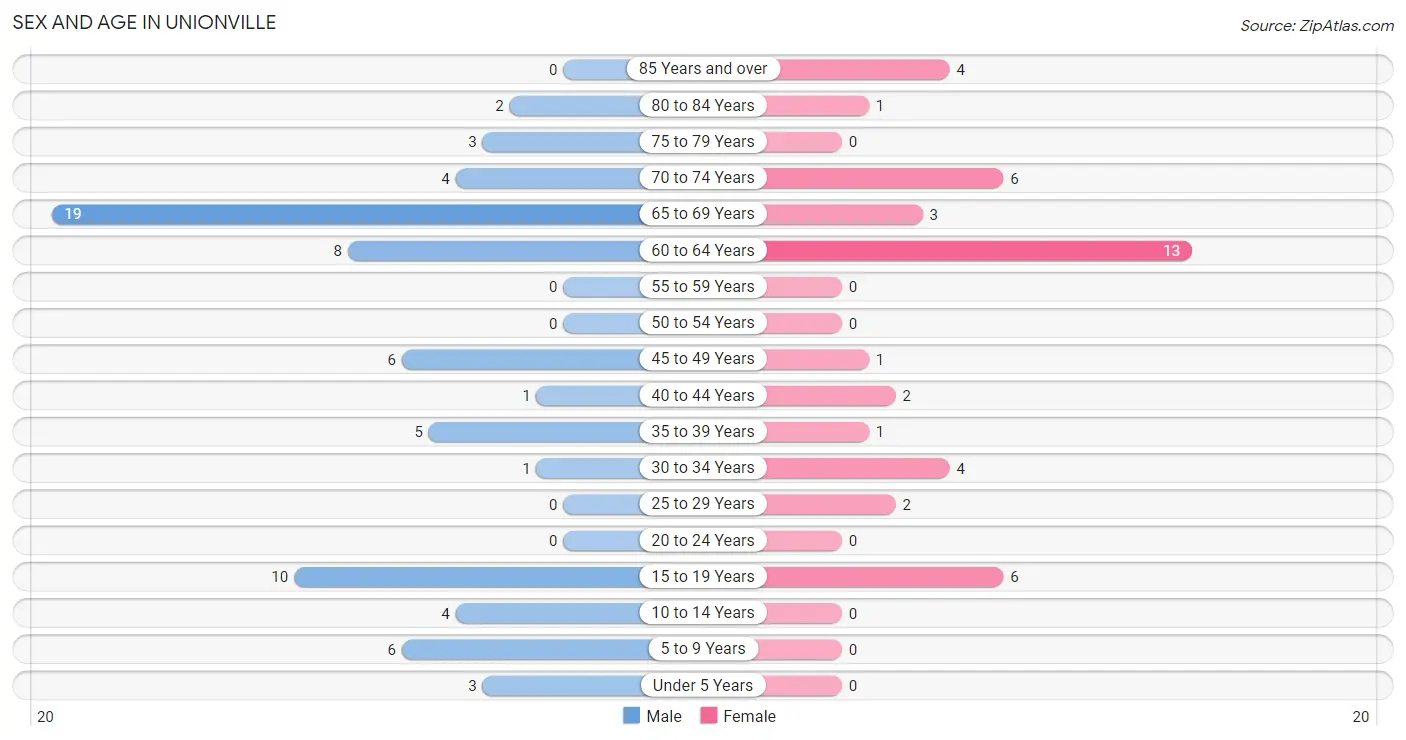
| Age Bracket | Male | Female |
| Under 5 Years | 3 (4.2%) | 0 (0.0%) |
| 5 to 9 Years | 6 (8.3%) | 0 (0.0%) |
| 10 to 14 Years | 4 (5.6%) | 0 (0.0%) |
| 15 to 19 Years | 10 (13.9%) | 6 (14.0%) |
| 20 to 24 Years | 0 (0.0%) | 0 (0.0%) |
| 25 to 29 Years | 0 (0.0%) | 2 (4.6%) |
| 30 to 34 Years | 1 (1.4%) | 4 (9.3%) |
| 35 to 39 Years | 5 (6.9%) | 1 (2.3%) |
| 40 to 44 Years | 1 (1.4%) | 2 (4.6%) |
| 45 to 49 Years | 6 (8.3%) | 1 (2.3%) |
| 50 to 54 Years | 0 (0.0%) | 0 (0.0%) |
| 55 to 59 Years | 0 (0.0%) | 0 (0.0%) |
| 60 to 64 Years | 8 (11.1%) | 13 (30.2%) |
| 65 to 69 Years | 19 (26.4%) | 3 (7.0%) |
| 70 to 74 Years | 4 (5.6%) | 6 (14.0%) |
| 75 to 79 Years | 3 (4.2%) | 0 (0.0%) |
| 80 to 84 Years | 2 (2.8%) | 1 (2.3%) |
| 85 Years and over | 0 (0.0%) | 4 (9.3%) |
| Total | 72 (100.0%) | 43 (100.0%) |
Families and Households in Unionville
Median Family Size in Unionville
The median family size in Unionville is 2.16 persons per family, with single female/mother families (2 | 4.5%) accounting for the largest median family size of 4 persons per family. On the other hand, single male/father families (16 | 36.4%) represent the smallest median family size with 1.50 persons per family.
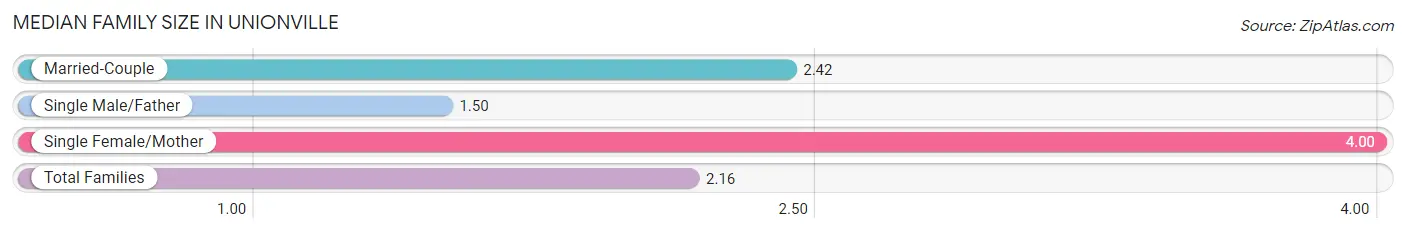
| Family Type | # Families | Family Size |
| Married-Couple | 26 (59.1%) | 2.42 |
| Single Male/Father | 16 (36.4%) | 1.50 |
| Single Female/Mother | 2 (4.5%) | 4.00 |
| Total Families | 44 (100.0%) | 2.16 |
Median Household Size in Unionville
The median household size in Unionville is 1.85 persons per household, with single female/mother households (2 | 3.2%) accounting for the largest median household size of 4.5 persons per household. non-family households (18 | 29.0%) represent the smallest median household size with 1.06 persons per household.
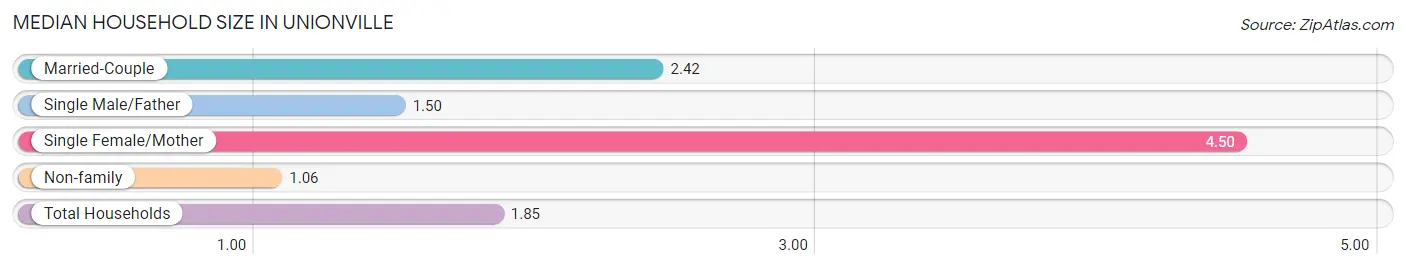
| Household Type | # Households | Household Size |
| Married-Couple | 26 (41.9%) | 2.42 |
| Single Male/Father | 16 (25.8%) | 1.50 |
| Single Female/Mother | 2 (3.2%) | 4.50 |
| Non-family | 18 (29.0%) | 1.06 |
| Total Households | 62 (100.0%) | 1.85 |
Household Size by Marriage Status in Unionville
Out of a total of 62 households in Unionville, 44 (71.0%) are family households, while 18 (29.0%) are nonfamily households. The most numerous type of family households are 2-person households, comprising 37, and the most common type of nonfamily households are 1-person households, comprising 16.
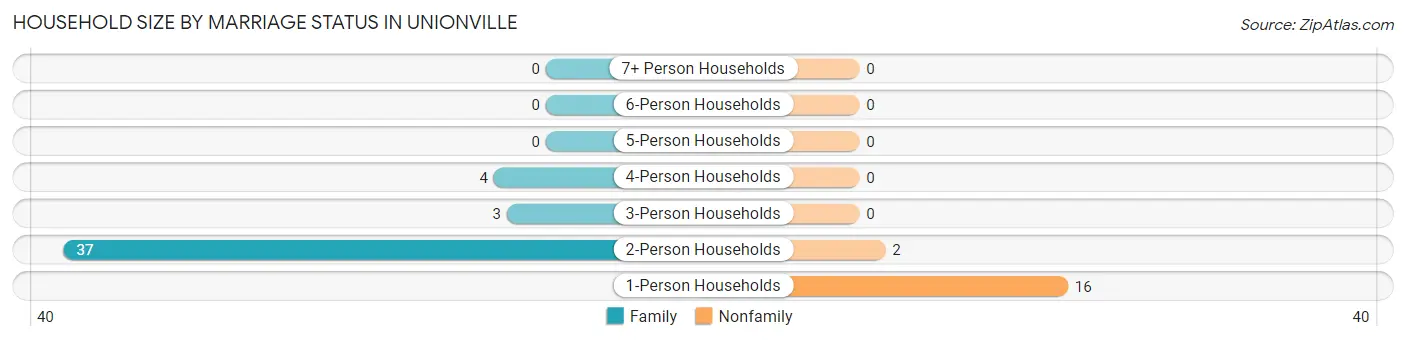
| Household Size | Family Households | Nonfamily Households |
| 1-Person Households | - | 16 (25.8%) |
| 2-Person Households | 37 (59.7%) | 2 (3.2%) |
| 3-Person Households | 3 (4.8%) | 0 (0.0%) |
| 4-Person Households | 4 (6.5%) | 0 (0.0%) |
| 5-Person Households | 0 (0.0%) | 0 (0.0%) |
| 6-Person Households | 0 (0.0%) | 0 (0.0%) |
| 7+ Person Households | 0 (0.0%) | 0 (0.0%) |
| Total | 44 (71.0%) | 18 (29.0%) |
Female Fertility in Unionville
Fertility by Age in Unionville
| Age Bracket | Women with Births | Births / 1,000 Women |
| 15 to 19 years | 0 (0.0%) | 0.0 |
| 20 to 34 years | 0 (0.0%) | 0.0 |
| 35 to 50 years | 0 (0.0%) | 0.0 |
| Total | 0 (0.0%) | 0.0 |
Fertility by Age by Marriage Status in Unionville
| Age Bracket | Married | Unmarried |
| 15 to 19 years | 0 (0.0%) | 0 (0.0%) |
| 20 to 34 years | 0 (0.0%) | 0 (0.0%) |
| 35 to 50 years | 0 (0.0%) | 0 (0.0%) |
| Total | 0 (0.0%) | 0 (0.0%) |
Fertility by Education in Unionville
| Educational Attainment | Women with Births | Births / 1,000 Women |
| Less than High School | 0 (0.0%) | 0.0 |
| High School Diploma | 0 (0.0%) | 0.0 |
| College or Associate's Degree | 0 (0.0%) | 0.0 |
| Bachelor's Degree | 0 (0.0%) | 0.0 |
| Graduate Degree | 0 (0.0%) | 0.0 |
| Total | 0 (0.0%) | 0.0 |
Fertility by Education by Marriage Status in Unionville
| Educational Attainment | Married | Unmarried |
| Less than High School | 0 (0.0%) | 0 (0.0%) |
| High School Diploma | 0 (0.0%) | 0 (0.0%) |
| College or Associate's Degree | 0 (0.0%) | 0 (0.0%) |
| Bachelor's Degree | 0 (0.0%) | 0 (0.0%) |
| Graduate Degree | 0 (0.0%) | 0 (0.0%) |
| Total | 0 (0.0%) | 0 (0.0%) |
Employment Characteristics in Unionville
Employment by Class of Employer in Unionville
Among the 53 employed individuals in Unionville, private company employees (40 | 75.5%), self-employed (not incorporated) (11 | 20.7%), and self-employed (incorporated) (1 | 1.9%) make up the most common classes of employment.
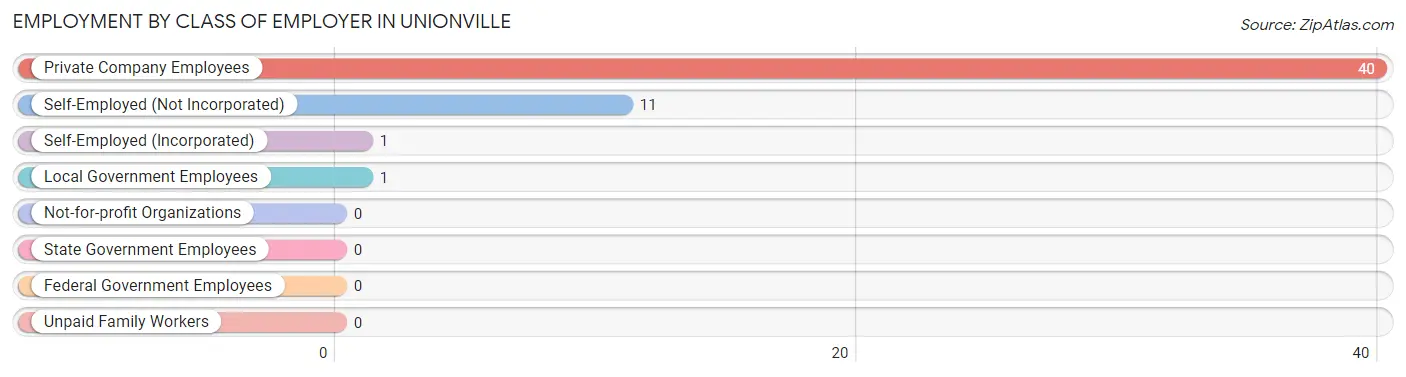
| Employer Class | # Employees | % Employees |
| Private Company Employees | 40 | 75.5% |
| Self-Employed (Incorporated) | 1 | 1.9% |
| Self-Employed (Not Incorporated) | 11 | 20.7% |
| Not-for-profit Organizations | 0 | 0.0% |
| Local Government Employees | 1 | 1.9% |
| State Government Employees | 0 | 0.0% |
| Federal Government Employees | 0 | 0.0% |
| Unpaid Family Workers | 0 | 0.0% |
| Total | 53 | 100.0% |
Employment Status by Age in Unionville
According to the labor force statistics for Unionville, out of the total population over 16 years of age (102), 52.9% or 54 individuals are in the labor force, with 1.9% or 1 of them unemployed. The age group with the highest labor force participation rate is 16 to 19 years, with 100.0% or 16 individuals in the labor force. Within the labor force, the 30 to 34 years age range has the highest percentage of unemployed individuals, with 50.0% or 1 of them being unemployed.
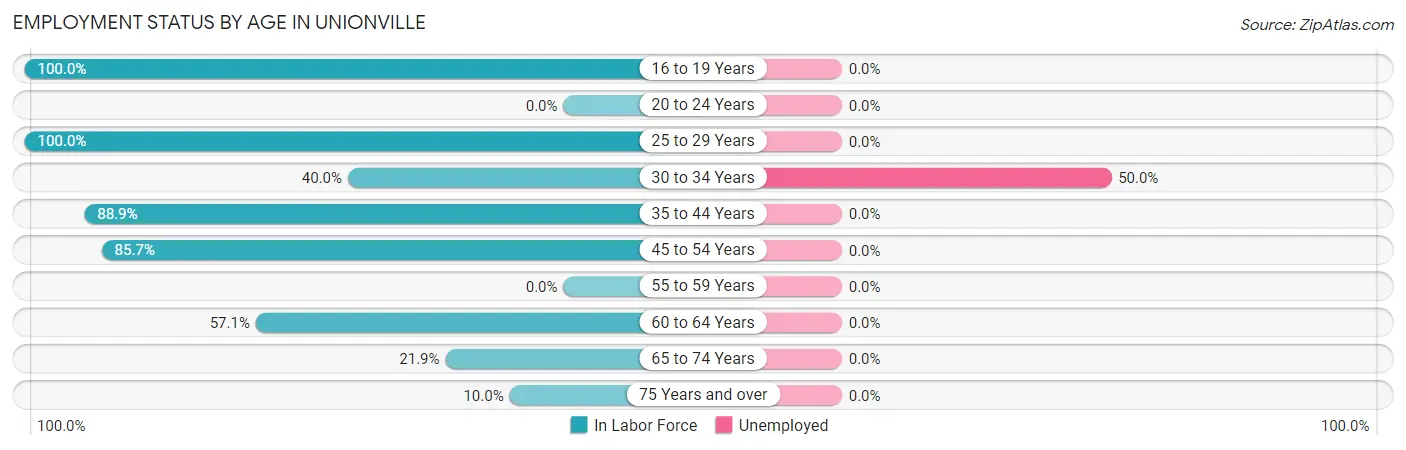
| Age Bracket | In Labor Force | Unemployed |
| 16 to 19 Years | 16 (100.0%) | 0 (0.0%) |
| 20 to 24 Years | 0 (0.0%) | 0 (0.0%) |
| 25 to 29 Years | 2 (100.0%) | 0 (0.0%) |
| 30 to 34 Years | 2 (40.0%) | 1 (50.0%) |
| 35 to 44 Years | 8 (88.9%) | 0 (0.0%) |
| 45 to 54 Years | 6 (85.7%) | 0 (0.0%) |
| 55 to 59 Years | 0 (0.0%) | 0 (0.0%) |
| 60 to 64 Years | 12 (57.1%) | 0 (0.0%) |
| 65 to 74 Years | 7 (21.9%) | 0 (0.0%) |
| 75 Years and over | 1 (10.0%) | 0 (0.0%) |
| Total | 54 (52.9%) | 1 (1.9%) |
Employment Status by Educational Attainment in Unionville
According to labor force statistics for Unionville, 68.2% of individuals (30) out of the total population between 25 and 64 years of age (44) are in the labor force, with 3.3% or 1 of them being unemployed. The group with the highest labor force participation rate are those with the educational attainment of bachelor's degree or higher, with 100.0% or 1 individuals in the labor force. Within the labor force, individuals with college / associate degree education have the highest percentage of unemployment, with 3.8% or 1 of them being unemployed.
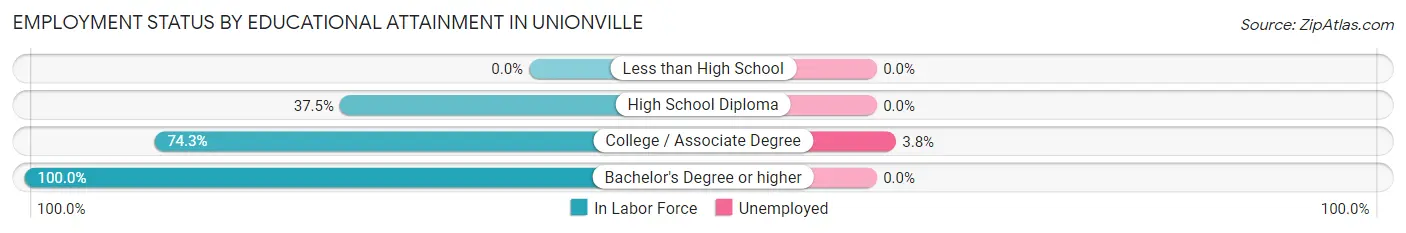
| Educational Attainment | In Labor Force | Unemployed |
| Less than High School | 0 (0.0%) | 0 (0.0%) |
| High School Diploma | 3 (37.5%) | 0 (0.0%) |
| College / Associate Degree | 26 (74.3%) | 1 (3.8%) |
| Bachelor's Degree or higher | 1 (100.0%) | 0 (0.0%) |
| Total | 30 (68.2%) | 1 (3.3%) |
Employment Occupations by Sex in Unionville
Management, Business, Science and Arts Occupations
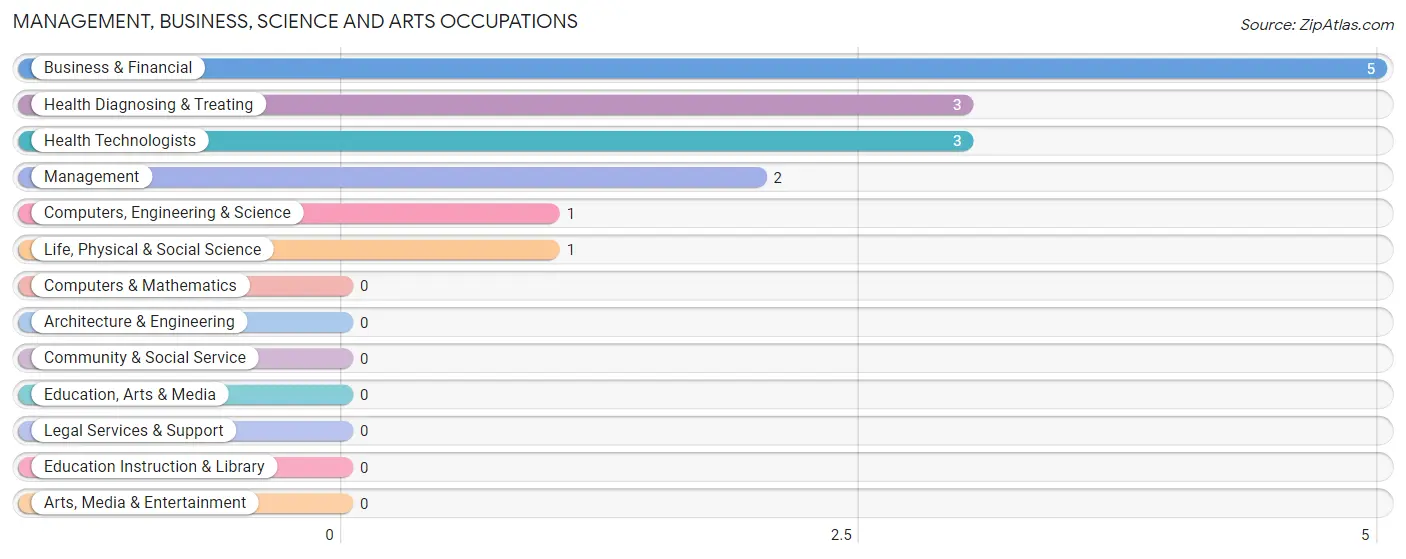
The most common Management, Business, Science and Arts occupations in Unionville are Business & Financial (5 | 9.4%), Health Diagnosing & Treating (3 | 5.7%), Health Technologists (3 | 5.7%), Management (2 | 3.8%), and Computers, Engineering & Science (1 | 1.9%).
Management, Business, Science and Arts Occupations by Sex
Within the Management, Business, Science and Arts occupations in Unionville, the most male-oriented occupations are Management (100.0%), and Business & Financial (100.0%), while the most female-oriented occupations are Computers, Engineering & Science (100.0%), Life, Physical & Social Science (100.0%), and Health Diagnosing & Treating (100.0%).
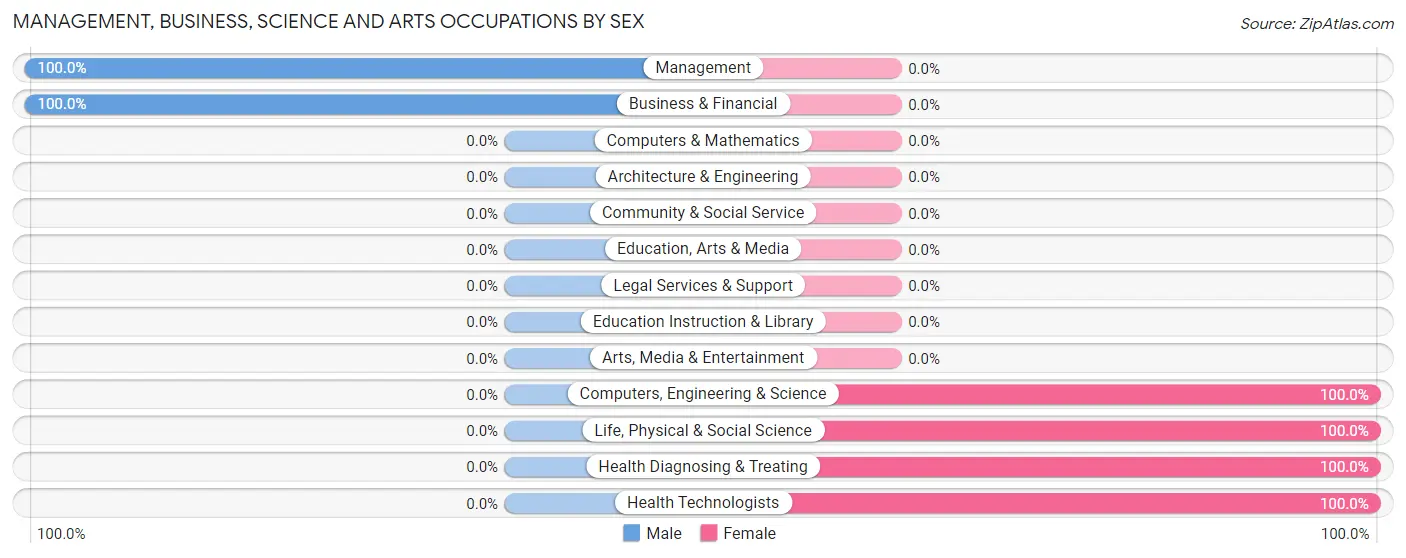
| Occupation | Male | Female |
| Management | 2 (100.0%) | 0 (0.0%) |
| Business & Financial | 5 (100.0%) | 0 (0.0%) |
| Computers, Engineering & Science | 0 (0.0%) | 1 (100.0%) |
| Computers & Mathematics | 0 (0.0%) | 0 (0.0%) |
| Architecture & Engineering | 0 (0.0%) | 0 (0.0%) |
| Life, Physical & Social Science | 0 (0.0%) | 1 (100.0%) |
| Community & Social Service | 0 (0.0%) | 0 (0.0%) |
| Education, Arts & Media | 0 (0.0%) | 0 (0.0%) |
| Legal Services & Support | 0 (0.0%) | 0 (0.0%) |
| Education Instruction & Library | 0 (0.0%) | 0 (0.0%) |
| Arts, Media & Entertainment | 0 (0.0%) | 0 (0.0%) |
| Health Diagnosing & Treating | 0 (0.0%) | 3 (100.0%) |
| Health Technologists | 0 (0.0%) | 3 (100.0%) |
| Total (Category) | 7 (63.6%) | 4 (36.4%) |
| Total (Overall) | 37 (69.8%) | 16 (30.2%) |
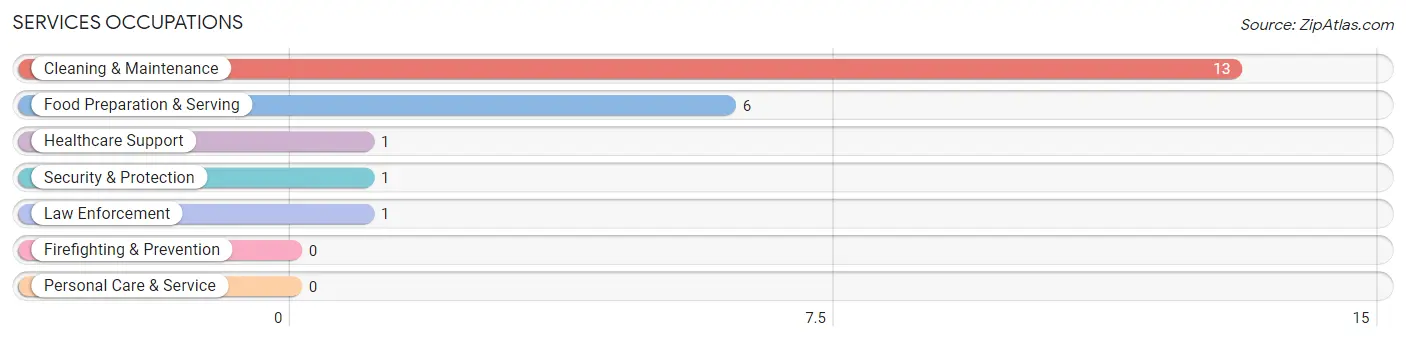
Services Occupations
The most common Services occupations in Unionville are Cleaning & Maintenance (13 | 24.5%), Food Preparation & Serving (6 | 11.3%), Healthcare Support (1 | 1.9%), Security & Protection (1 | 1.9%), and Law Enforcement (1 | 1.9%).
Services Occupations by Sex
Within the Services occupations in Unionville, the most male-oriented occupations are Security & Protection (100.0%), Law Enforcement (100.0%), and Cleaning & Maintenance (100.0%), while the most female-oriented occupations are Healthcare Support (100.0%), and Food Preparation & Serving (100.0%).
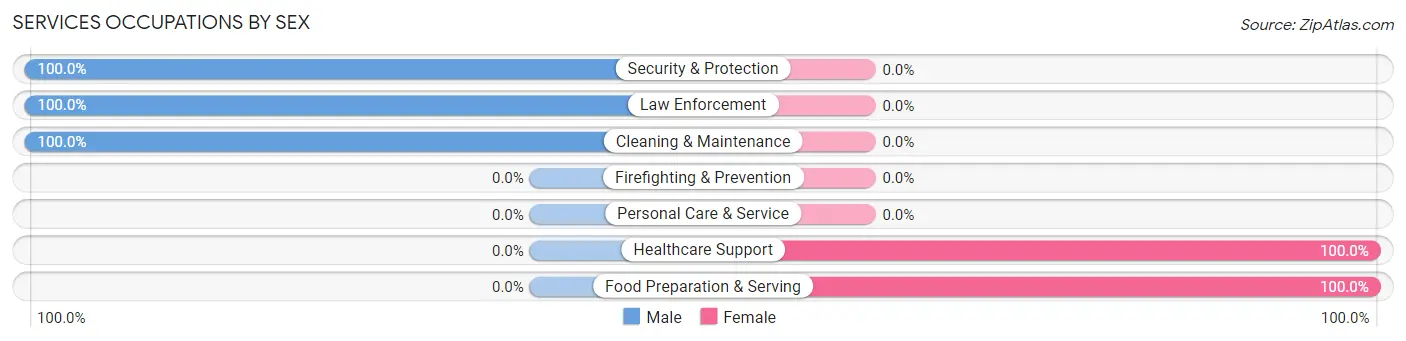
| Occupation | Male | Female |
| Healthcare Support | 0 (0.0%) | 1 (100.0%) |
| Security & Protection | 1 (100.0%) | 0 (0.0%) |
| Firefighting & Prevention | 0 (0.0%) | 0 (0.0%) |
| Law Enforcement | 1 (100.0%) | 0 (0.0%) |
| Food Preparation & Serving | 0 (0.0%) | 6 (100.0%) |
| Cleaning & Maintenance | 13 (100.0%) | 0 (0.0%) |
| Personal Care & Service | 0 (0.0%) | 0 (0.0%) |
| Total (Category) | 14 (66.7%) | 7 (33.3%) |
| Total (Overall) | 37 (69.8%) | 16 (30.2%) |
Sales and Office Occupations
The most common Sales and Office occupations in Unionville are Office & Administration (2 | 3.8%), and Sales & Related (1 | 1.9%).
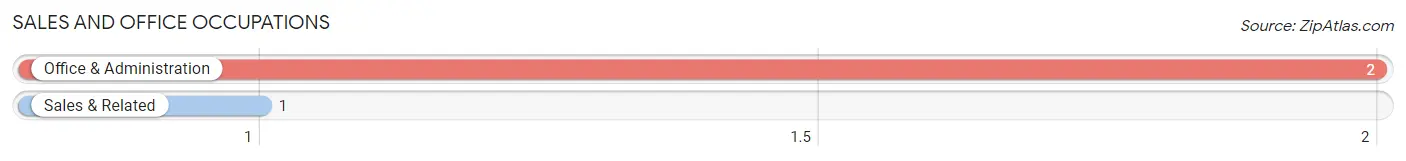
Sales and Office Occupations by Sex
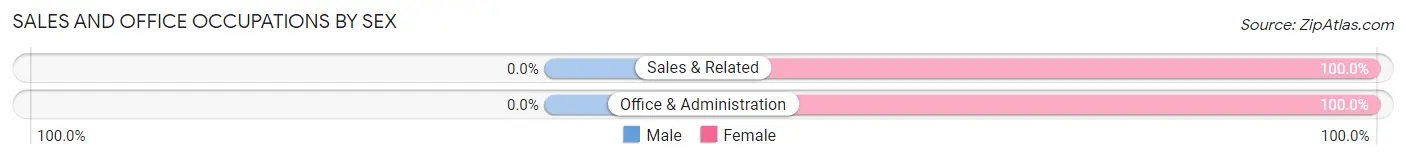
| Occupation | Male | Female |
| Sales & Related | 0 (0.0%) | 1 (100.0%) |
| Office & Administration | 0 (0.0%) | 2 (100.0%) |
| Total (Category) | 0 (0.0%) | 3 (100.0%) |
| Total (Overall) | 37 (69.8%) | 16 (30.2%) |
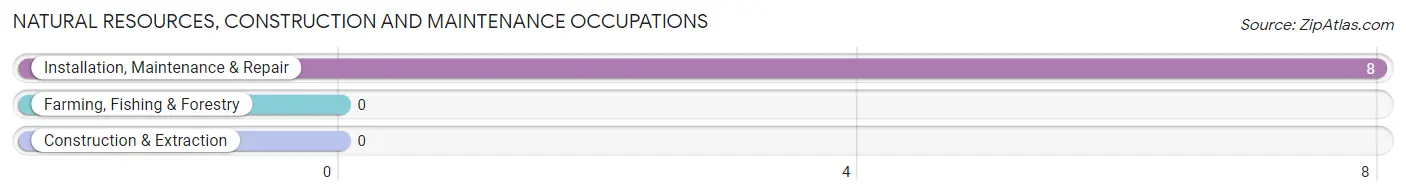
Natural Resources, Construction and Maintenance Occupations
The most common Natural Resources, Construction and Maintenance occupations in Unionville are , and Installation, Maintenance & Repair (8 | 15.1%).
Natural Resources, Construction and Maintenance Occupations by Sex
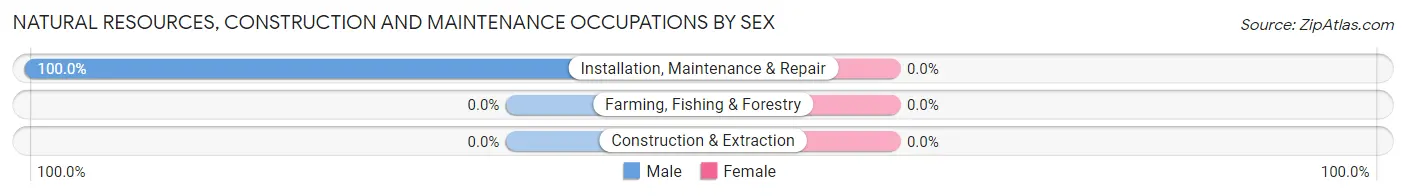
| Occupation | Male | Female |
| Farming, Fishing & Forestry | 0 (0.0%) | 0 (0.0%) |
| Construction & Extraction | 0 (0.0%) | 0 (0.0%) |
| Installation, Maintenance & Repair | 8 (100.0%) | 0 (0.0%) |
| Total (Category) | 8 (100.0%) | 0 (0.0%) |
| Total (Overall) | 37 (69.8%) | 16 (30.2%) |
Production, Transportation and Moving Occupations
The most common Production, Transportation and Moving occupations in Unionville are Transportation (6 | 11.3%), Material Moving (3 | 5.7%), and Production (1 | 1.9%).
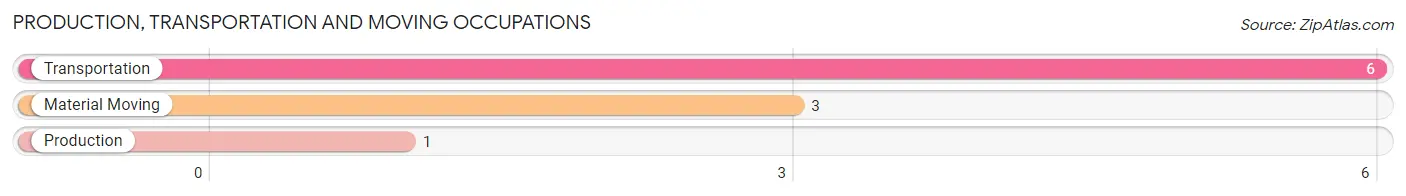
Production, Transportation and Moving Occupations by Sex
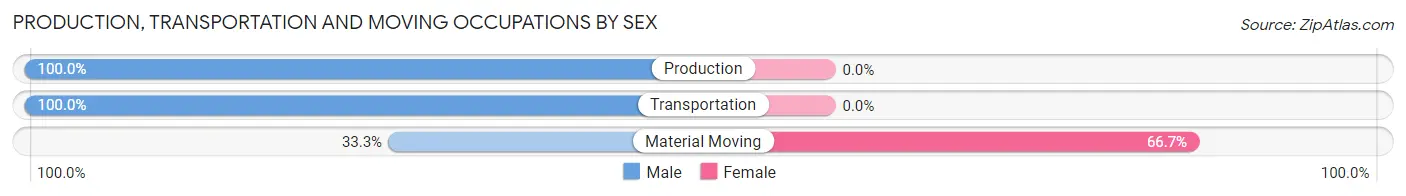
| Occupation | Male | Female |
| Production | 1 (100.0%) | 0 (0.0%) |
| Transportation | 6 (100.0%) | 0 (0.0%) |
| Material Moving | 1 (33.3%) | 2 (66.7%) |
| Total (Category) | 8 (80.0%) | 2 (20.0%) |
| Total (Overall) | 37 (69.8%) | 16 (30.2%) |
Employment Industries by Sex in Unionville
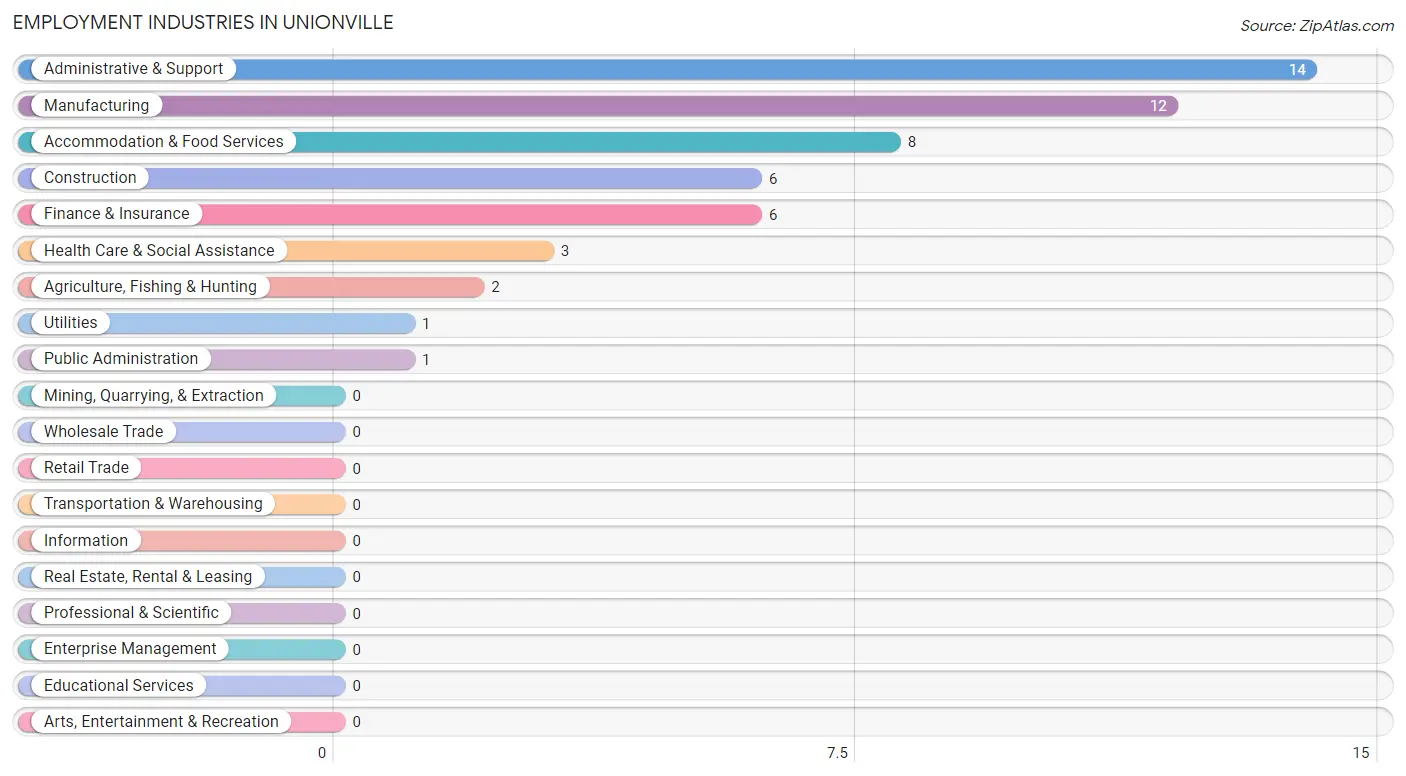
Employment Industries in Unionville
The major employment industries in Unionville include Administrative & Support (14 | 26.4%), Manufacturing (12 | 22.6%), Accommodation & Food Services (8 | 15.1%), Construction (6 | 11.3%), and Finance & Insurance (6 | 11.3%).
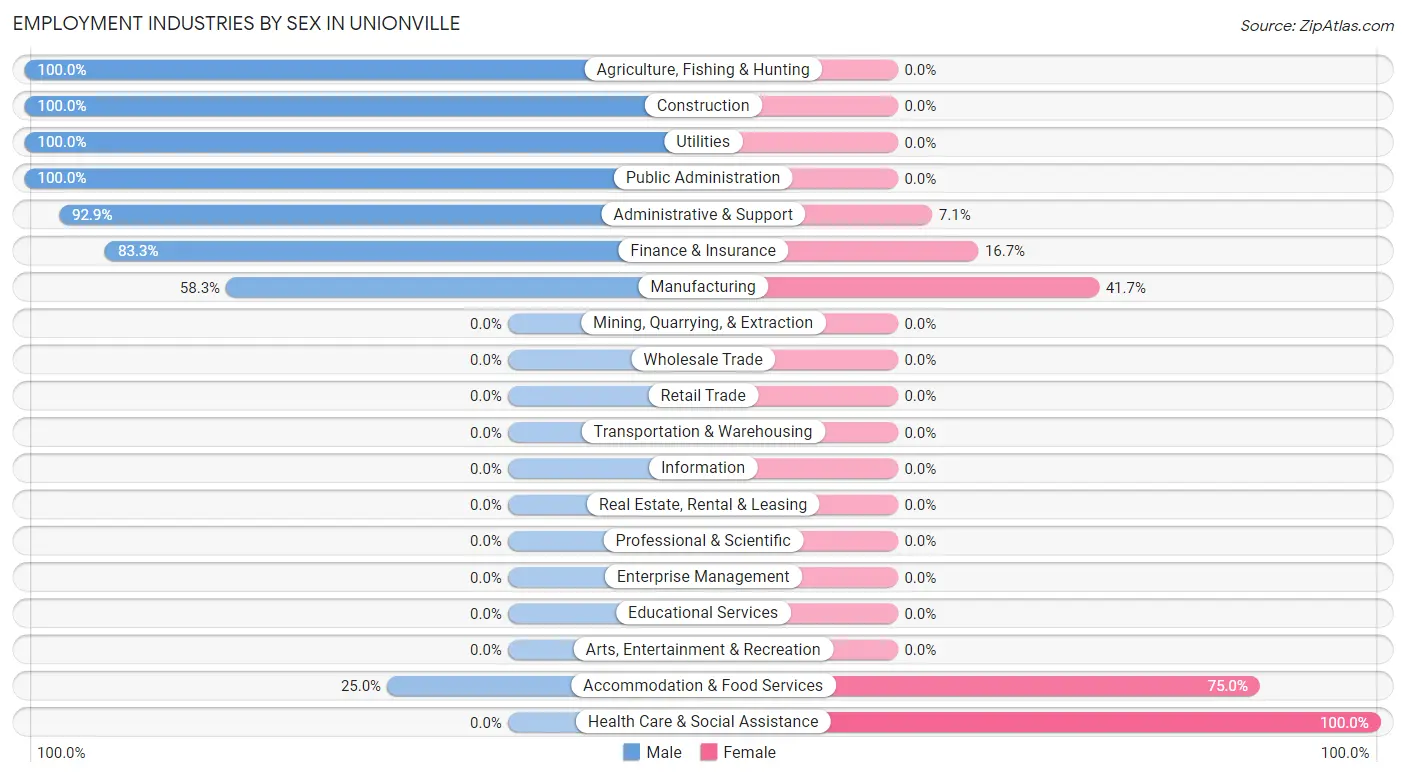
Employment Industries by Sex in Unionville
The Unionville industries that see more men than women are Agriculture, Fishing & Hunting (100.0%), Construction (100.0%), and Utilities (100.0%), whereas the industries that tend to have a higher number of women are Health Care & Social Assistance (100.0%), Accommodation & Food Services (75.0%), and Manufacturing (41.7%).
| Industry | Male | Female |
| Agriculture, Fishing & Hunting | 2 (100.0%) | 0 (0.0%) |
| Mining, Quarrying, & Extraction | 0 (0.0%) | 0 (0.0%) |
| Construction | 6 (100.0%) | 0 (0.0%) |
| Manufacturing | 7 (58.3%) | 5 (41.7%) |
| Wholesale Trade | 0 (0.0%) | 0 (0.0%) |
| Retail Trade | 0 (0.0%) | 0 (0.0%) |
| Transportation & Warehousing | 0 (0.0%) | 0 (0.0%) |
| Utilities | 1 (100.0%) | 0 (0.0%) |
| Information | 0 (0.0%) | 0 (0.0%) |
| Finance & Insurance | 5 (83.3%) | 1 (16.7%) |
| Real Estate, Rental & Leasing | 0 (0.0%) | 0 (0.0%) |
| Professional & Scientific | 0 (0.0%) | 0 (0.0%) |
| Enterprise Management | 0 (0.0%) | 0 (0.0%) |
| Administrative & Support | 13 (92.9%) | 1 (7.1%) |
| Educational Services | 0 (0.0%) | 0 (0.0%) |
| Health Care & Social Assistance | 0 (0.0%) | 3 (100.0%) |
| Arts, Entertainment & Recreation | 0 (0.0%) | 0 (0.0%) |
| Accommodation & Food Services | 2 (25.0%) | 6 (75.0%) |
| Public Administration | 1 (100.0%) | 0 (0.0%) |
| Total | 37 (69.8%) | 16 (30.2%) |
Education in Unionville
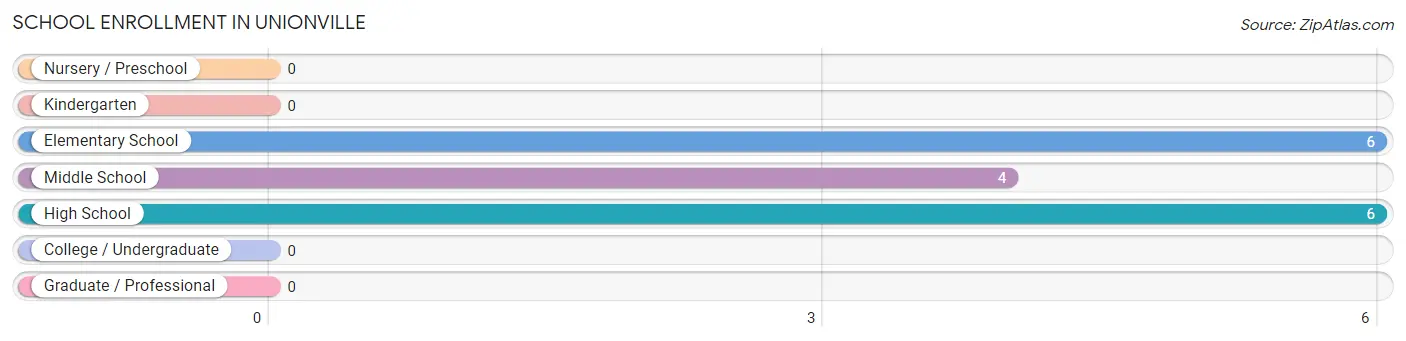
School Enrollment in Unionville
The most common levels of schooling among the 16 students in Unionville are elementary school (6 | 37.5%), high school (6 | 37.5%), and middle school (4 | 25.0%).
| School Level | # Students | % Students |
| Nursery / Preschool | 0 | 0.0% |
| Kindergarten | 0 | 0.0% |
| Elementary School | 6 | 37.5% |
| Middle School | 4 | 25.0% |
| High School | 6 | 37.5% |
| College / Undergraduate | 0 | 0.0% |
| Graduate / Professional | 0 | 0.0% |
| Total | 16 | 100.0% |
School Enrollment by Age by Funding Source in Unionville
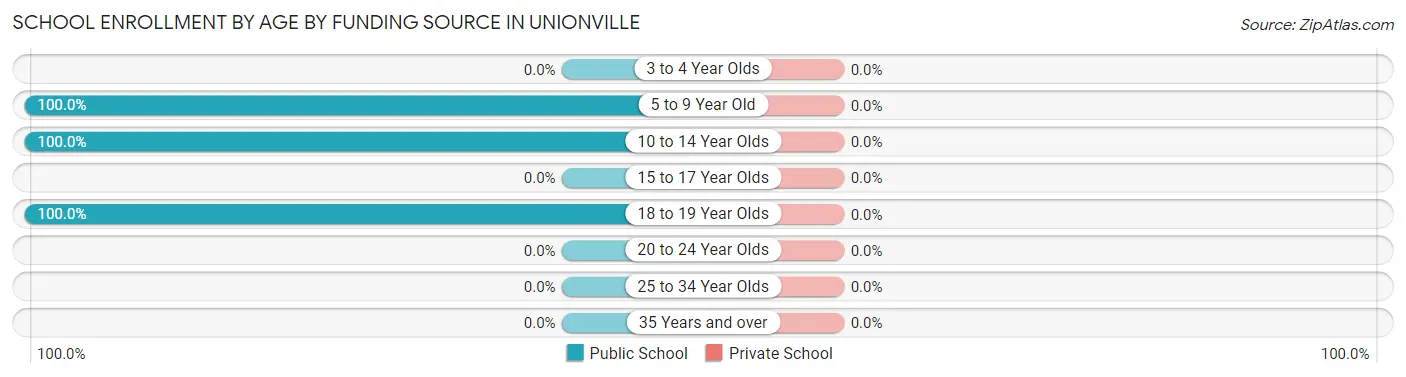
| Age Bracket | Public School | Private School |
| 3 to 4 Year Olds | 0 (0.0%) | 0 (0.0%) |
| 5 to 9 Year Old | 6 (100.0%) | 0 (0.0%) |
| 10 to 14 Year Olds | 4 (100.0%) | 0 (0.0%) |
| 15 to 17 Year Olds | 0 (0.0%) | 0 (0.0%) |
| 18 to 19 Year Olds | 6 (100.0%) | 0 (0.0%) |
| 20 to 24 Year Olds | 0 (0.0%) | 0 (0.0%) |
| 25 to 34 Year Olds | 0 (0.0%) | 0 (0.0%) |
| 35 Years and over | 0 (0.0%) | 0 (0.0%) |
| Total | 16 (100.0%) | 0 (0.0%) |
Educational Attainment by Field of Study in Unionville
Social sciences (2 | 33.3%), computers & mathematics (1 | 16.7%), bio, nature & agricultural (1 | 16.7%), physical & health sciences (1 | 16.7%), and science & technology (1 | 16.7%) are the most common fields of study among 6 individuals in Unionville who have obtained a bachelor's degree or higher.
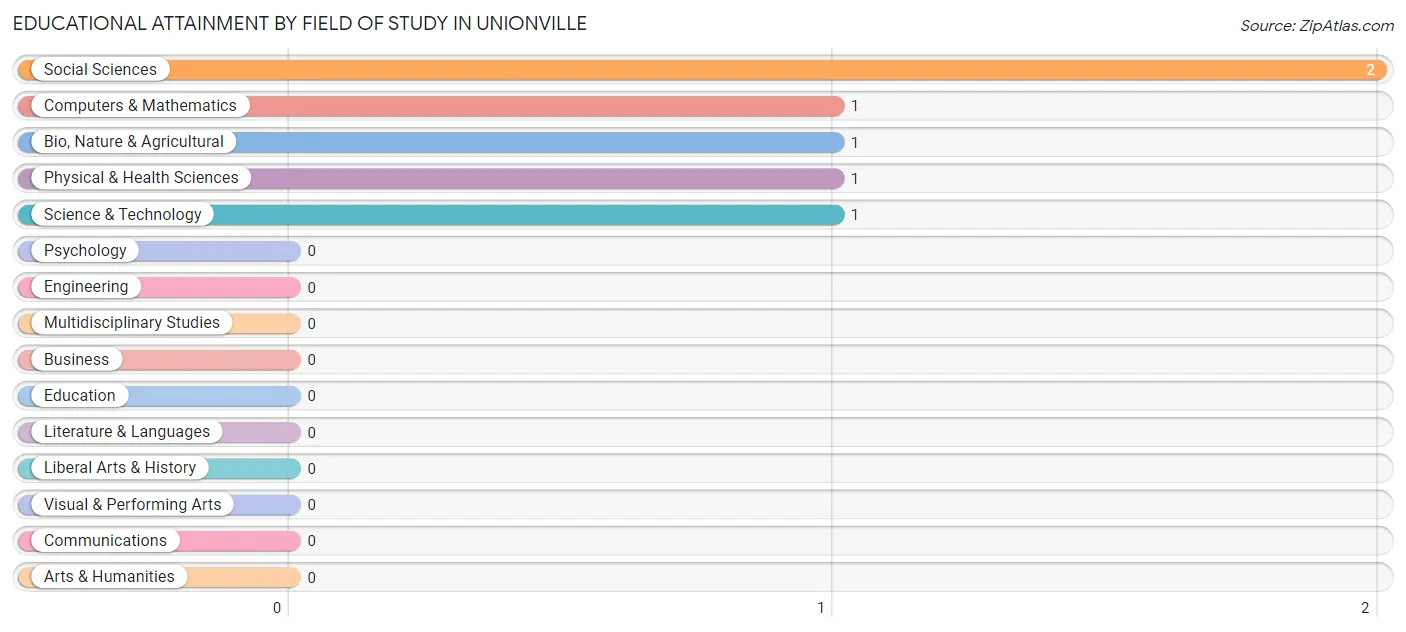
| Field of Study | # Graduates | % Graduates |
| Computers & Mathematics | 1 | 16.7% |
| Bio, Nature & Agricultural | 1 | 16.7% |
| Physical & Health Sciences | 1 | 16.7% |
| Psychology | 0 | 0.0% |
| Social Sciences | 2 | 33.3% |
| Engineering | 0 | 0.0% |
| Multidisciplinary Studies | 0 | 0.0% |
| Science & Technology | 1 | 16.7% |
| Business | 0 | 0.0% |
| Education | 0 | 0.0% |
| Literature & Languages | 0 | 0.0% |
| Liberal Arts & History | 0 | 0.0% |
| Visual & Performing Arts | 0 | 0.0% |
| Communications | 0 | 0.0% |
| Arts & Humanities | 0 | 0.0% |
| Total | 6 | 100.0% |
Transportation & Commute in Unionville
Vehicle Availability by Sex in Unionville
The most prevalent vehicle ownership categories in Unionville are males with 4 vehicles (17, accounting for 46.0%) and females with 4 vehicles (1, making up 106.2%).
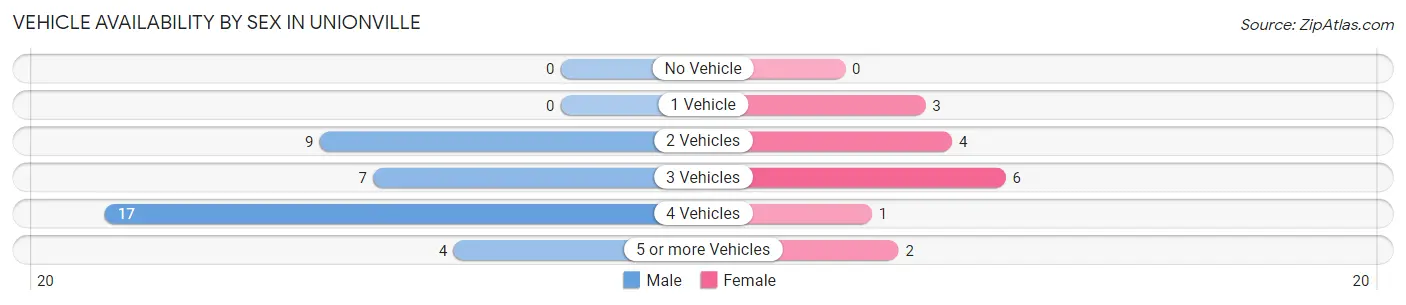
| Vehicles Available | Male | Female |
| No Vehicle | 0 (0.0%) | 0 (0.0%) |
| 1 Vehicle | 0 (0.0%) | 3 (18.8%) |
| 2 Vehicles | 9 (24.3%) | 4 (25.0%) |
| 3 Vehicles | 7 (18.9%) | 6 (37.5%) |
| 4 Vehicles | 17 (46.0%) | 1 (6.2%) |
| 5 or more Vehicles | 4 (10.8%) | 2 (12.5%) |
| Total | 37 (100.0%) | 16 (100.0%) |
Commute Time in Unionville
The most frequently occuring commute durations in Unionville are 25 to 29 minutes (11 commuters, 22.5%), 5 to 9 minutes (10 commuters, 20.4%), and 30 to 34 minutes (9 commuters, 18.4%).
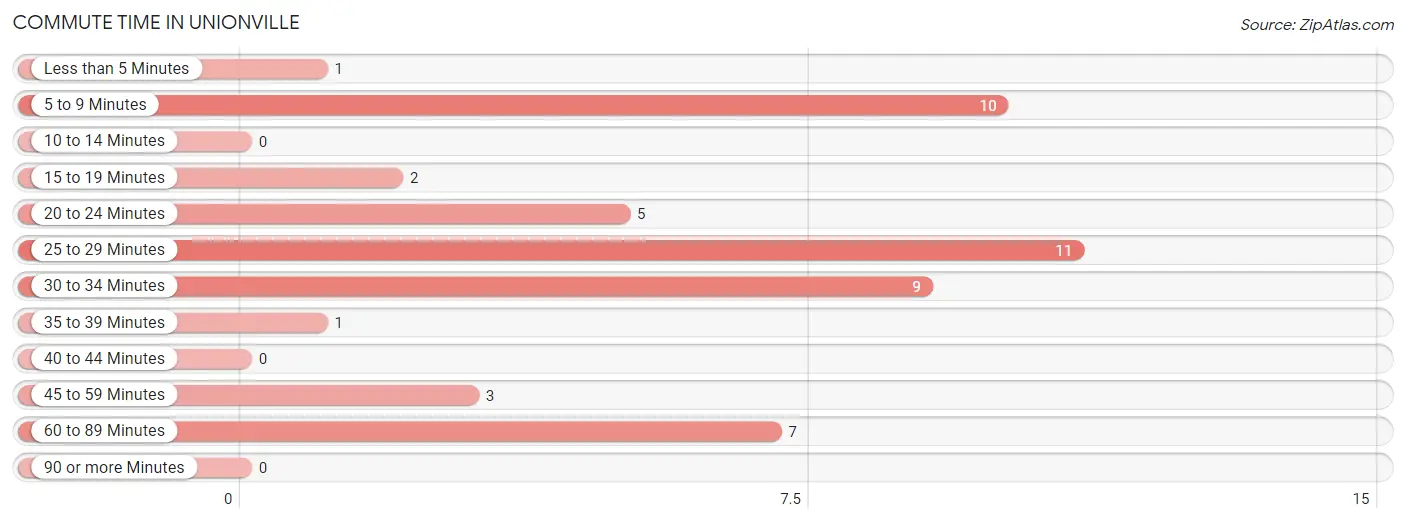
| Commute Time | # Commuters | % Commuters |
| Less than 5 Minutes | 1 | 2.0% |
| 5 to 9 Minutes | 10 | 20.4% |
| 10 to 14 Minutes | 0 | 0.0% |
| 15 to 19 Minutes | 2 | 4.1% |
| 20 to 24 Minutes | 5 | 10.2% |
| 25 to 29 Minutes | 11 | 22.5% |
| 30 to 34 Minutes | 9 | 18.4% |
| 35 to 39 Minutes | 1 | 2.0% |
| 40 to 44 Minutes | 0 | 0.0% |
| 45 to 59 Minutes | 3 | 6.1% |
| 60 to 89 Minutes | 7 | 14.3% |
| 90 or more Minutes | 0 | 0.0% |
Commute Time by Sex in Unionville
The most common commute times in Unionville are 5 to 9 minutes (10 commuters, 30.3%) for males and 25 to 29 minutes (6 commuters, 37.5%) for females.
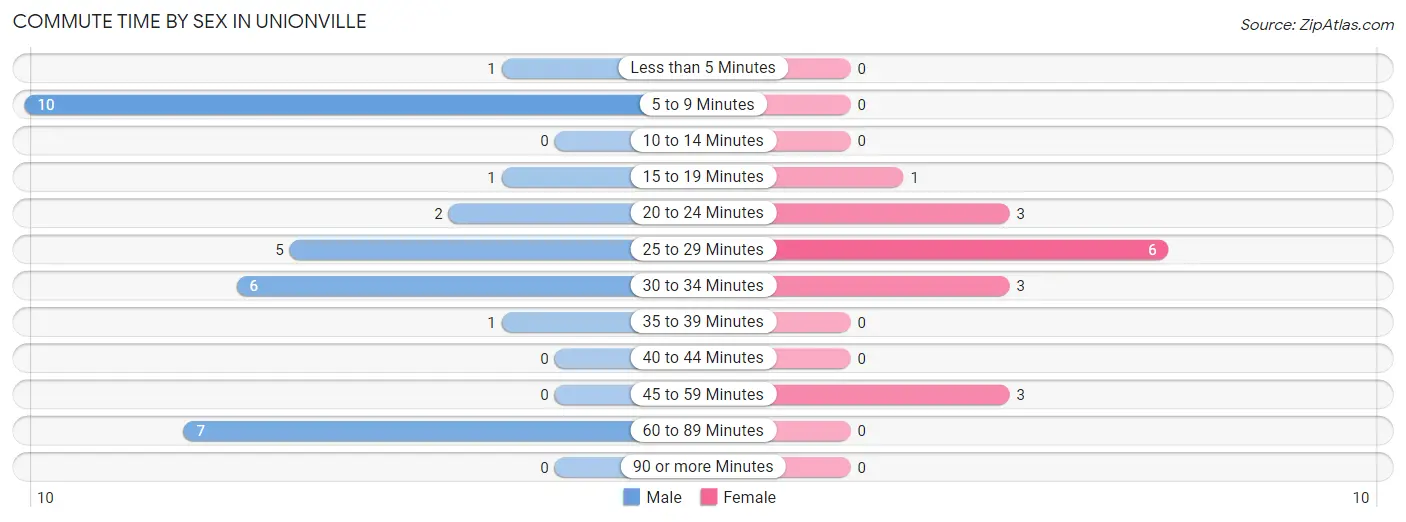
| Commute Time | Male | Female |
| Less than 5 Minutes | 1 (3.0%) | 0 (0.0%) |
| 5 to 9 Minutes | 10 (30.3%) | 0 (0.0%) |
| 10 to 14 Minutes | 0 (0.0%) | 0 (0.0%) |
| 15 to 19 Minutes | 1 (3.0%) | 1 (6.2%) |
| 20 to 24 Minutes | 2 (6.1%) | 3 (18.8%) |
| 25 to 29 Minutes | 5 (15.1%) | 6 (37.5%) |
| 30 to 34 Minutes | 6 (18.2%) | 3 (18.8%) |
| 35 to 39 Minutes | 1 (3.0%) | 0 (0.0%) |
| 40 to 44 Minutes | 0 (0.0%) | 0 (0.0%) |
| 45 to 59 Minutes | 0 (0.0%) | 3 (18.8%) |
| 60 to 89 Minutes | 7 (21.2%) | 0 (0.0%) |
| 90 or more Minutes | 0 (0.0%) | 0 (0.0%) |
Time of Departure to Work by Sex in Unionville
The most frequent times of departure to work in Unionville are 7:30 AM to 7:59 AM (10, 30.3%) for males and 12:00 PM to 3:59 PM (9, 56.2%) for females.
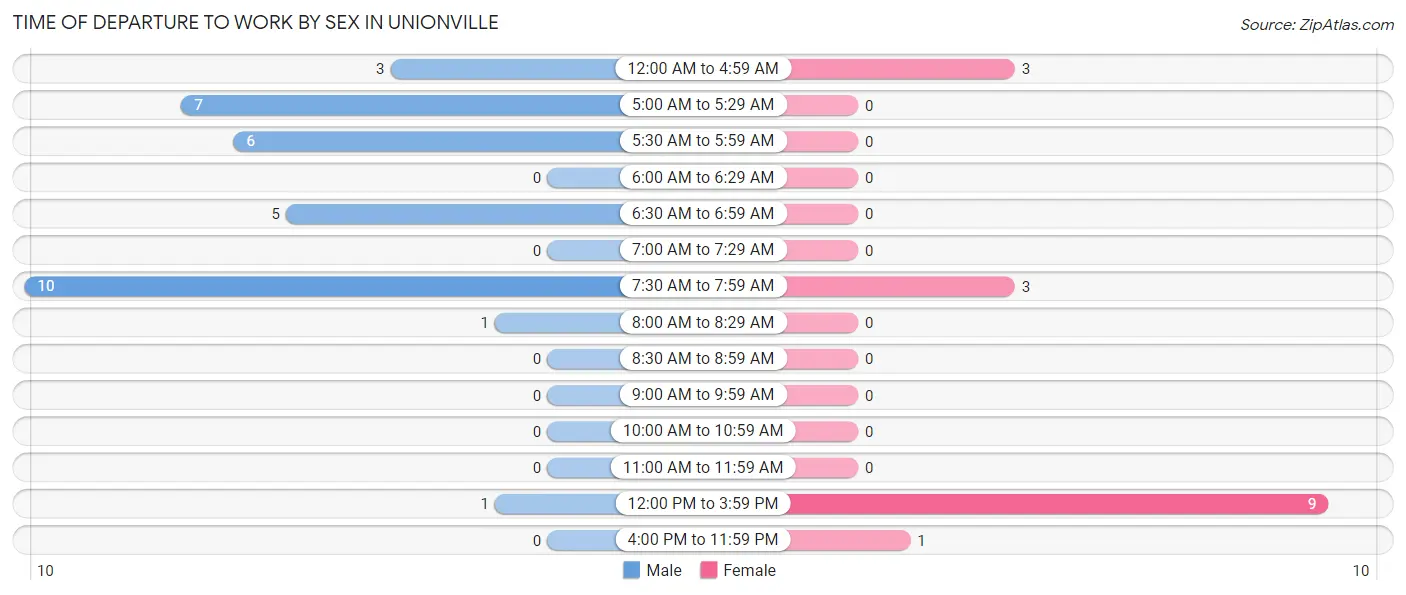
| Time of Departure | Male | Female |
| 12:00 AM to 4:59 AM | 3 (9.1%) | 3 (18.8%) |
| 5:00 AM to 5:29 AM | 7 (21.2%) | 0 (0.0%) |
| 5:30 AM to 5:59 AM | 6 (18.2%) | 0 (0.0%) |
| 6:00 AM to 6:29 AM | 0 (0.0%) | 0 (0.0%) |
| 6:30 AM to 6:59 AM | 5 (15.1%) | 0 (0.0%) |
| 7:00 AM to 7:29 AM | 0 (0.0%) | 0 (0.0%) |
| 7:30 AM to 7:59 AM | 10 (30.3%) | 3 (18.8%) |
| 8:00 AM to 8:29 AM | 1 (3.0%) | 0 (0.0%) |
| 8:30 AM to 8:59 AM | 0 (0.0%) | 0 (0.0%) |
| 9:00 AM to 9:59 AM | 0 (0.0%) | 0 (0.0%) |
| 10:00 AM to 10:59 AM | 0 (0.0%) | 0 (0.0%) |
| 11:00 AM to 11:59 AM | 0 (0.0%) | 0 (0.0%) |
| 12:00 PM to 3:59 PM | 1 (3.0%) | 9 (56.2%) |
| 4:00 PM to 11:59 PM | 0 (0.0%) | 1 (6.2%) |
| Total | 33 (100.0%) | 16 (100.0%) |
Housing Occupancy in Unionville
Occupancy by Ownership in Unionville
Of the total 62 dwellings in Unionville, owner-occupied units account for 59 (95.2%), while renter-occupied units make up 3 (4.8%).
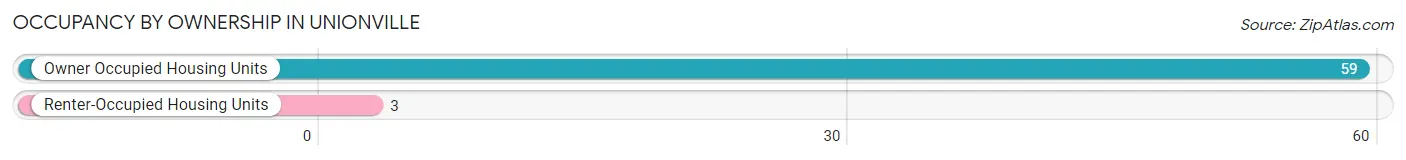
| Occupancy | # Housing Units | % Housing Units |
| Owner Occupied Housing Units | 59 | 95.2% |
| Renter-Occupied Housing Units | 3 | 4.8% |
| Total Occupied Housing Units | 62 | 100.0% |
Occupancy by Household Size in Unionville
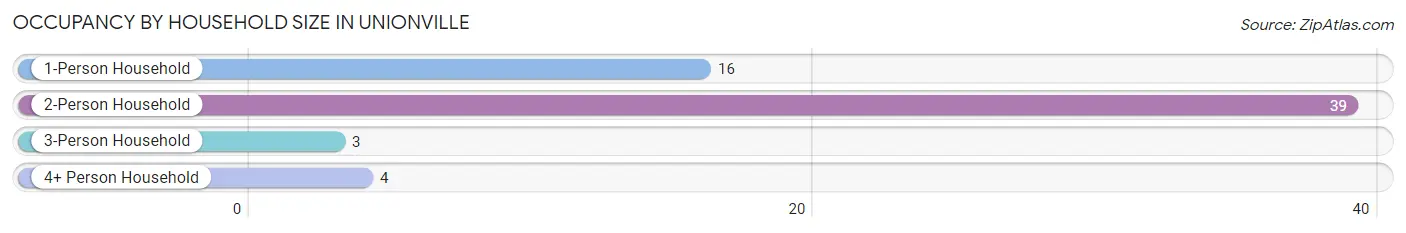
| Household Size | # Housing Units | % Housing Units |
| 1-Person Household | 16 | 25.8% |
| 2-Person Household | 39 | 62.9% |
| 3-Person Household | 3 | 4.8% |
| 4+ Person Household | 4 | 6.5% |
| Total Housing Units | 62 | 100.0% |
Occupancy by Ownership by Household Size in Unionville
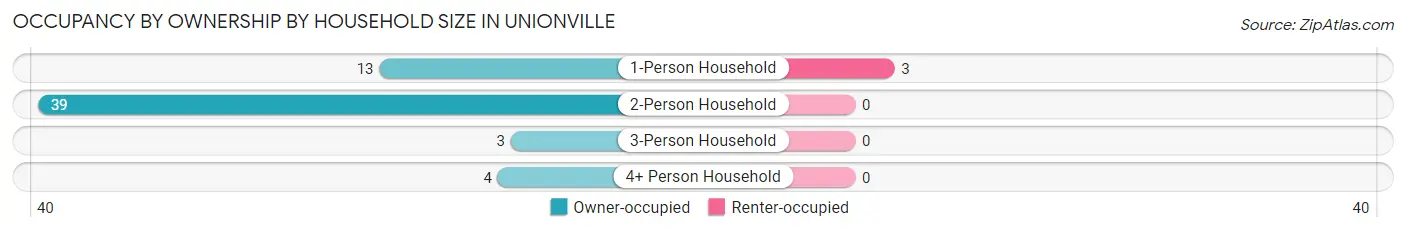
| Household Size | Owner-occupied | Renter-occupied |
| 1-Person Household | 13 (81.2%) | 3 (18.8%) |
| 2-Person Household | 39 (100.0%) | 0 (0.0%) |
| 3-Person Household | 3 (100.0%) | 0 (0.0%) |
| 4+ Person Household | 4 (100.0%) | 0 (0.0%) |
| Total Housing Units | 59 (95.2%) | 3 (4.8%) |
Occupancy by Educational Attainment in Unionville
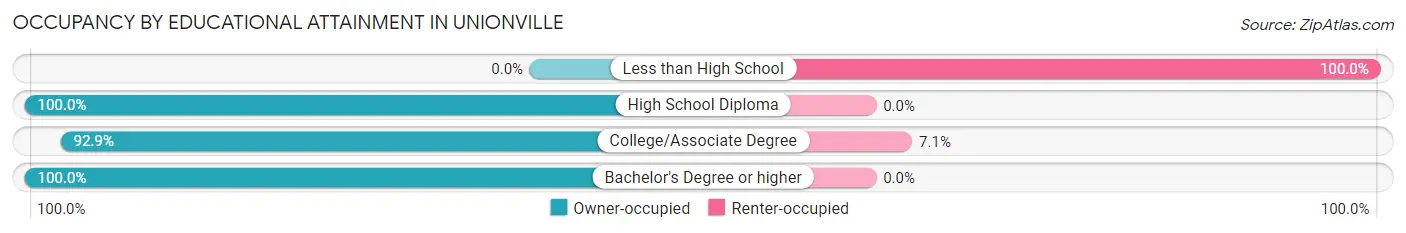
| Household Size | Owner-occupied | Renter-occupied |
| Less than High School | 0 (0.0%) | 1 (100.0%) |
| High School Diploma | 31 (100.0%) | 0 (0.0%) |
| College/Associate Degree | 26 (92.9%) | 2 (7.1%) |
| Bachelor's Degree or higher | 2 (100.0%) | 0 (0.0%) |
Occupancy by Age of Householder in Unionville
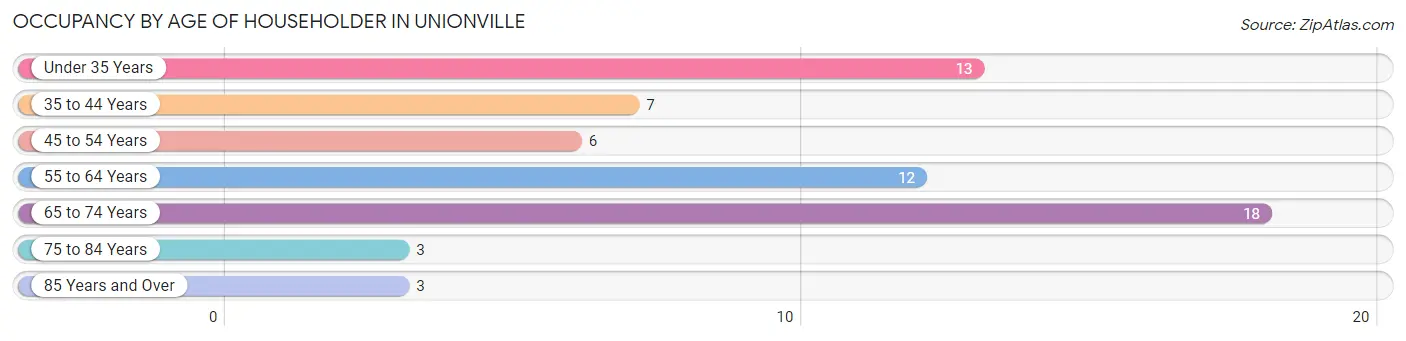
| Age Bracket | # Households | % Households |
| Under 35 Years | 13 | 21.0% |
| 35 to 44 Years | 7 | 11.3% |
| 45 to 54 Years | 6 | 9.7% |
| 55 to 64 Years | 12 | 19.4% |
| 65 to 74 Years | 18 | 29.0% |
| 75 to 84 Years | 3 | 4.8% |
| 85 Years and Over | 3 | 4.8% |
| Total | 62 | 100.0% |
Housing Finances in Unionville
Median Income by Occupancy in Unionville
| Occupancy Type | # Households | Median Income |
| Owner-Occupied | 59 (95.2%) | $0 |
| Renter-Occupied | 3 (4.8%) | $0 |
| Average | 62 (100.0%) | $0 |
Occupancy by Householder Income Bracket in Unionville
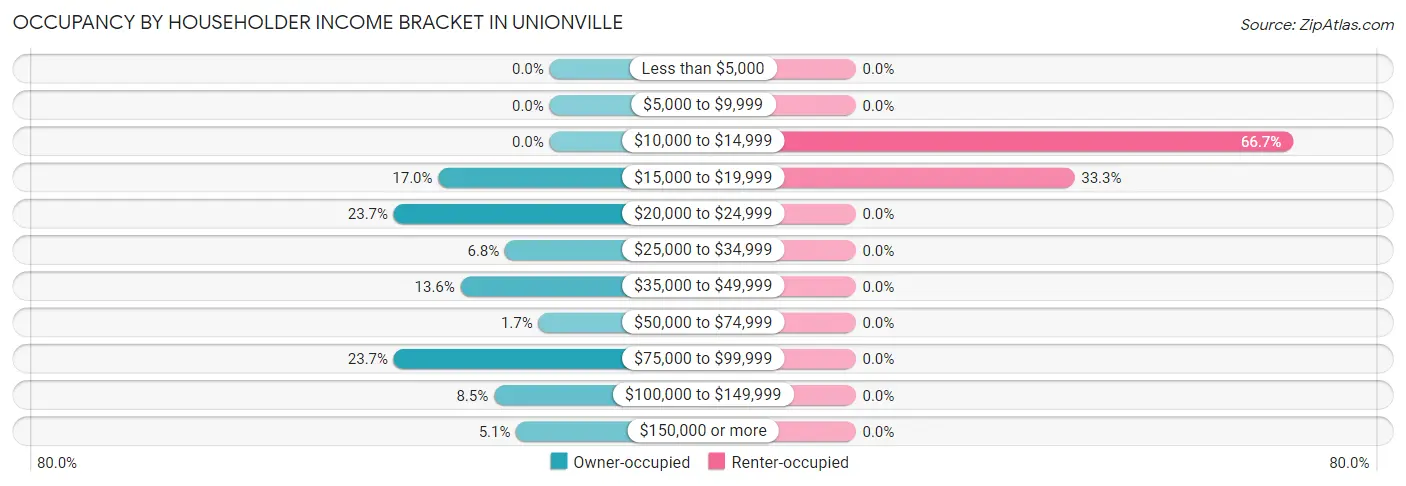
| Income Bracket | Owner-occupied | Renter-occupied |
| Less than $5,000 | 0 (0.0%) | 0 (0.0%) |
| $5,000 to $9,999 | 0 (0.0%) | 0 (0.0%) |
| $10,000 to $14,999 | 0 (0.0%) | 2 (66.7%) |
| $15,000 to $19,999 | 10 (17.0%) | 1 (33.3%) |
| $20,000 to $24,999 | 14 (23.7%) | 0 (0.0%) |
| $25,000 to $34,999 | 4 (6.8%) | 0 (0.0%) |
| $35,000 to $49,999 | 8 (13.6%) | 0 (0.0%) |
| $50,000 to $74,999 | 1 (1.7%) | 0 (0.0%) |
| $75,000 to $99,999 | 14 (23.7%) | 0 (0.0%) |
| $100,000 to $149,999 | 5 (8.5%) | 0 (0.0%) |
| $150,000 or more | 3 (5.1%) | 0 (0.0%) |
| Total | 59 (100.0%) | 3 (100.0%) |
Monthly Housing Cost Tiers in Unionville
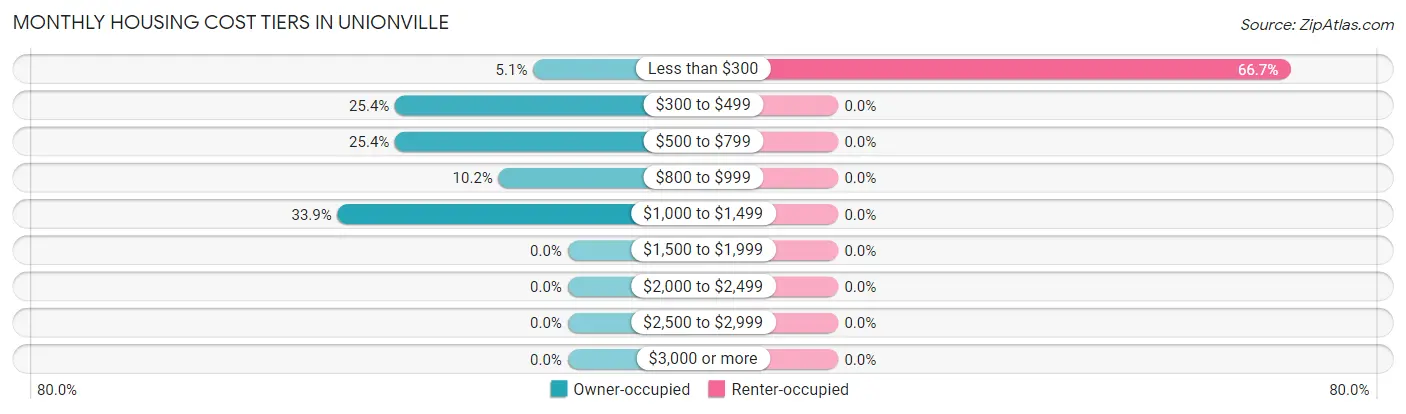
| Monthly Cost | Owner-occupied | Renter-occupied |
| Less than $300 | 3 (5.1%) | 2 (66.7%) |
| $300 to $499 | 15 (25.4%) | 0 (0.0%) |
| $500 to $799 | 15 (25.4%) | 0 (0.0%) |
| $800 to $999 | 6 (10.2%) | 0 (0.0%) |
| $1,000 to $1,499 | 20 (33.9%) | 0 (0.0%) |
| $1,500 to $1,999 | 0 (0.0%) | 0 (0.0%) |
| $2,000 to $2,499 | 0 (0.0%) | 0 (0.0%) |
| $2,500 to $2,999 | 0 (0.0%) | 0 (0.0%) |
| $3,000 or more | 0 (0.0%) | 0 (0.0%) |
| Total | 59 (100.0%) | 3 (100.0%) |
Physical Housing Characteristics in Unionville
Housing Structures in Unionville
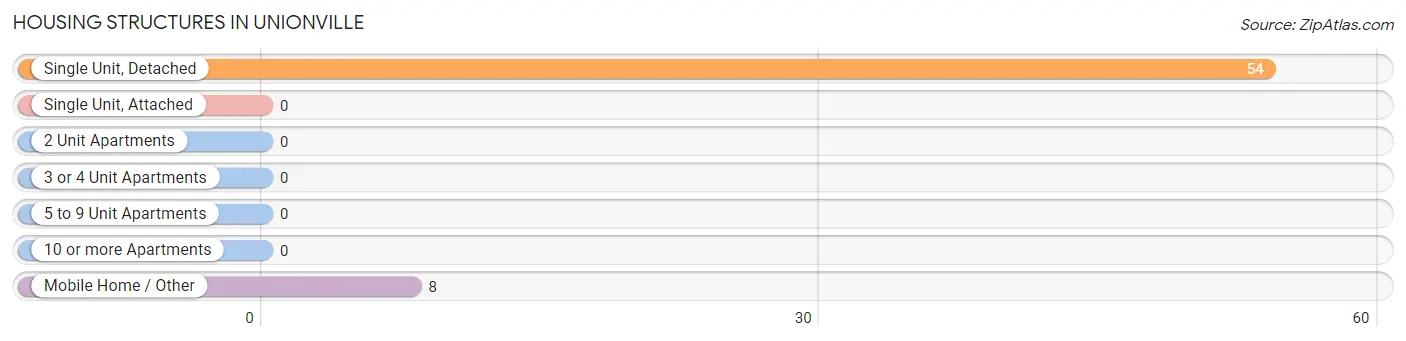
| Structure Type | # Housing Units | % Housing Units |
| Single Unit, Detached | 54 | 87.1% |
| Single Unit, Attached | 0 | 0.0% |
| 2 Unit Apartments | 0 | 0.0% |
| 3 or 4 Unit Apartments | 0 | 0.0% |
| 5 to 9 Unit Apartments | 0 | 0.0% |
| 10 or more Apartments | 0 | 0.0% |
| Mobile Home / Other | 8 | 12.9% |
| Total | 62 | 100.0% |
Housing Structures by Occupancy in Unionville
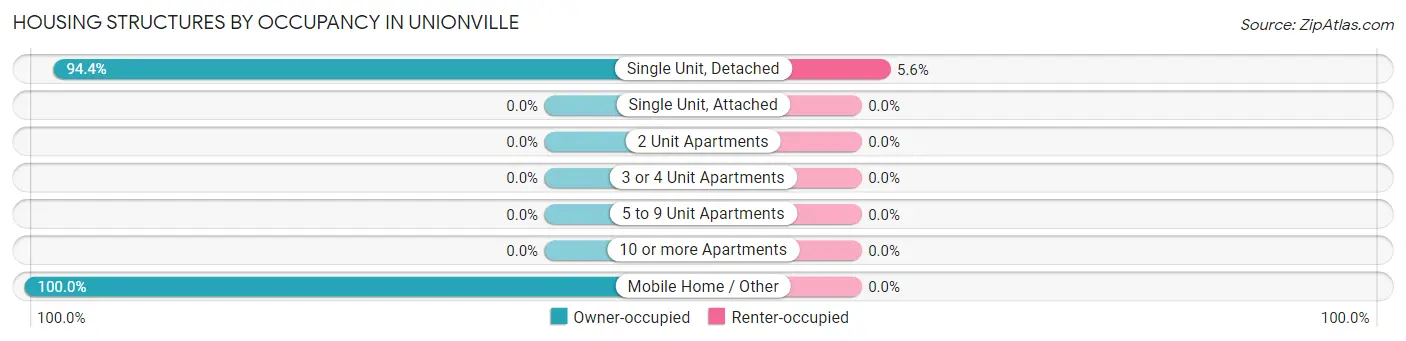
| Structure Type | Owner-occupied | Renter-occupied |
| Single Unit, Detached | 51 (94.4%) | 3 (5.6%) |
| Single Unit, Attached | 0 (0.0%) | 0 (0.0%) |
| 2 Unit Apartments | 0 (0.0%) | 0 (0.0%) |
| 3 or 4 Unit Apartments | 0 (0.0%) | 0 (0.0%) |
| 5 to 9 Unit Apartments | 0 (0.0%) | 0 (0.0%) |
| 10 or more Apartments | 0 (0.0%) | 0 (0.0%) |
| Mobile Home / Other | 8 (100.0%) | 0 (0.0%) |
| Total | 59 (95.2%) | 3 (4.8%) |
Housing Structures by Number of Rooms in Unionville
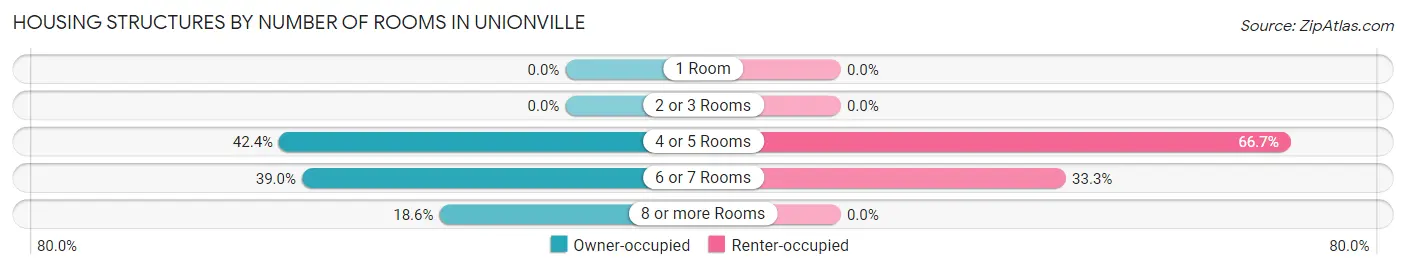
| Number of Rooms | Owner-occupied | Renter-occupied |
| 1 Room | 0 (0.0%) | 0 (0.0%) |
| 2 or 3 Rooms | 0 (0.0%) | 0 (0.0%) |
| 4 or 5 Rooms | 25 (42.4%) | 2 (66.7%) |
| 6 or 7 Rooms | 23 (39.0%) | 1 (33.3%) |
| 8 or more Rooms | 11 (18.6%) | 0 (0.0%) |
| Total | 59 (100.0%) | 3 (100.0%) |
Housing Structure by Heating Type in Unionville
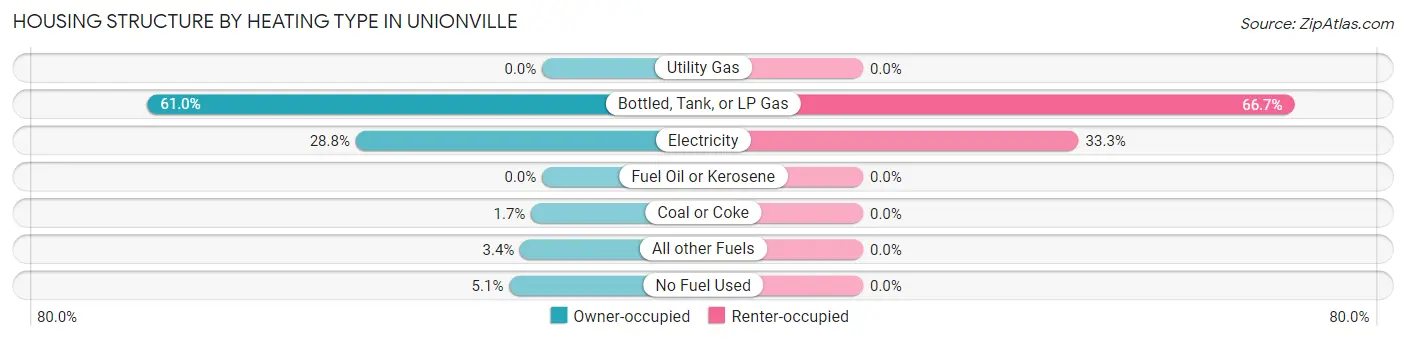
| Heating Type | Owner-occupied | Renter-occupied |
| Utility Gas | 0 (0.0%) | 0 (0.0%) |
| Bottled, Tank, or LP Gas | 36 (61.0%) | 2 (66.7%) |
| Electricity | 17 (28.8%) | 1 (33.3%) |
| Fuel Oil or Kerosene | 0 (0.0%) | 0 (0.0%) |
| Coal or Coke | 1 (1.7%) | 0 (0.0%) |
| All other Fuels | 2 (3.4%) | 0 (0.0%) |
| No Fuel Used | 3 (5.1%) | 0 (0.0%) |
| Total | 59 (100.0%) | 3 (100.0%) |
Household Vehicle Usage in Unionville
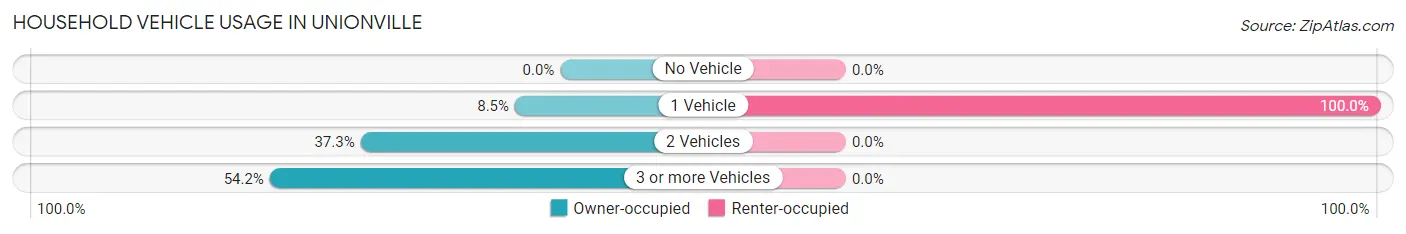
| Vehicles per Household | Owner-occupied | Renter-occupied |
| No Vehicle | 0 (0.0%) | 0 (0.0%) |
| 1 Vehicle | 5 (8.5%) | 3 (100.0%) |
| 2 Vehicles | 22 (37.3%) | 0 (0.0%) |
| 3 or more Vehicles | 32 (54.2%) | 0 (0.0%) |
| Total | 59 (100.0%) | 3 (100.0%) |
Real Estate & Mortgages in Unionville
Real Estate and Mortgage Overview in Unionville
| Characteristic | Without Mortgage | With Mortgage |
| Housing Units | 43 | 16 |
| Median Property Value | $88,800 | $110,000 |
| Median Household Income | - | - |
| Monthly Housing Costs | $558 | $0 |
| Real Estate Taxes | - | - |
Property Value by Mortgage Status in Unionville
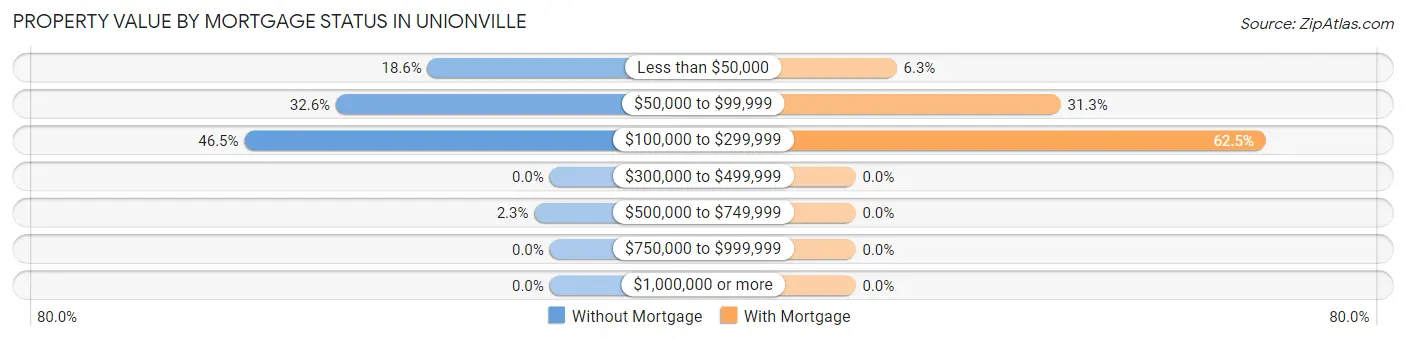
| Property Value | Without Mortgage | With Mortgage |
| Less than $50,000 | 8 (18.6%) | 1 (6.2%) |
| $50,000 to $99,999 | 14 (32.6%) | 5 (31.2%) |
| $100,000 to $299,999 | 20 (46.5%) | 10 (62.5%) |
| $300,000 to $499,999 | 0 (0.0%) | 0 (0.0%) |
| $500,000 to $749,999 | 1 (2.3%) | 0 (0.0%) |
| $750,000 to $999,999 | 0 (0.0%) | 0 (0.0%) |
| $1,000,000 or more | 0 (0.0%) | 0 (0.0%) |
| Total | 43 (100.0%) | 16 (100.0%) |
Household Income by Mortgage Status in Unionville
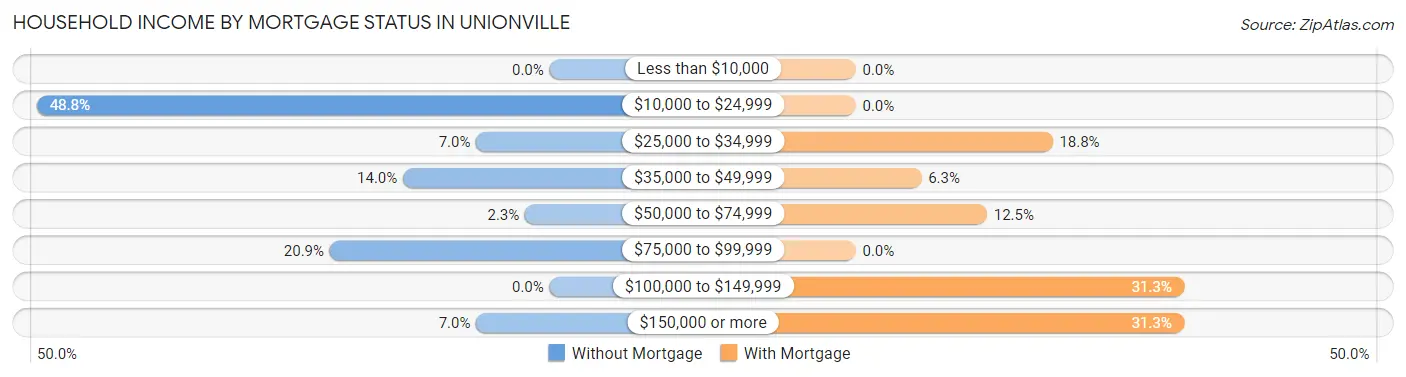
| Household Income | Without Mortgage | With Mortgage |
| Less than $10,000 | 0 (0.0%) | 0 (0.0%) |
| $10,000 to $24,999 | 21 (48.8%) | 0 (0.0%) |
| $25,000 to $34,999 | 3 (7.0%) | 3 (18.8%) |
| $35,000 to $49,999 | 6 (14.0%) | 1 (6.2%) |
| $50,000 to $74,999 | 1 (2.3%) | 2 (12.5%) |
| $75,000 to $99,999 | 9 (20.9%) | 0 (0.0%) |
| $100,000 to $149,999 | 0 (0.0%) | 5 (31.2%) |
| $150,000 or more | 3 (7.0%) | 5 (31.2%) |
| Total | 43 (100.0%) | 16 (100.0%) |
Property Value to Household Income Ratio in Unionville
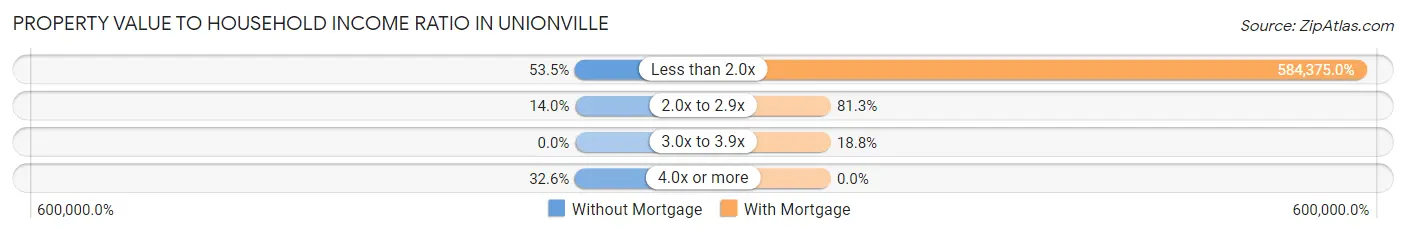
| Value-to-Income Ratio | Without Mortgage | With Mortgage |
| Less than 2.0x | 23 (53.5%) | 93,500 (584,375.0%) |
| 2.0x to 2.9x | 6 (14.0%) | 13 (81.2%) |
| 3.0x to 3.9x | 0 (0.0%) | 3 (18.8%) |
| 4.0x or more | 14 (32.6%) | 0 (0.0%) |
| Total | 43 (100.0%) | 16 (100.0%) |
Real Estate Taxes by Mortgage Status in Unionville
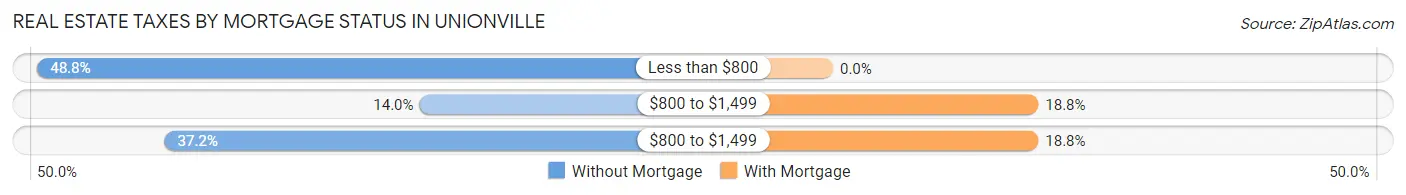
| Property Taxes | Without Mortgage | With Mortgage |
| Less than $800 | 21 (48.8%) | 0 (0.0%) |
| $800 to $1,499 | 6 (14.0%) | 3 (18.8%) |
| $800 to $1,499 | 16 (37.2%) | 3 (18.8%) |
| Total | 43 (100.0%) | 16 (100.0%) |
Health & Disability in Unionville
Health Insurance Coverage by Age in Unionville
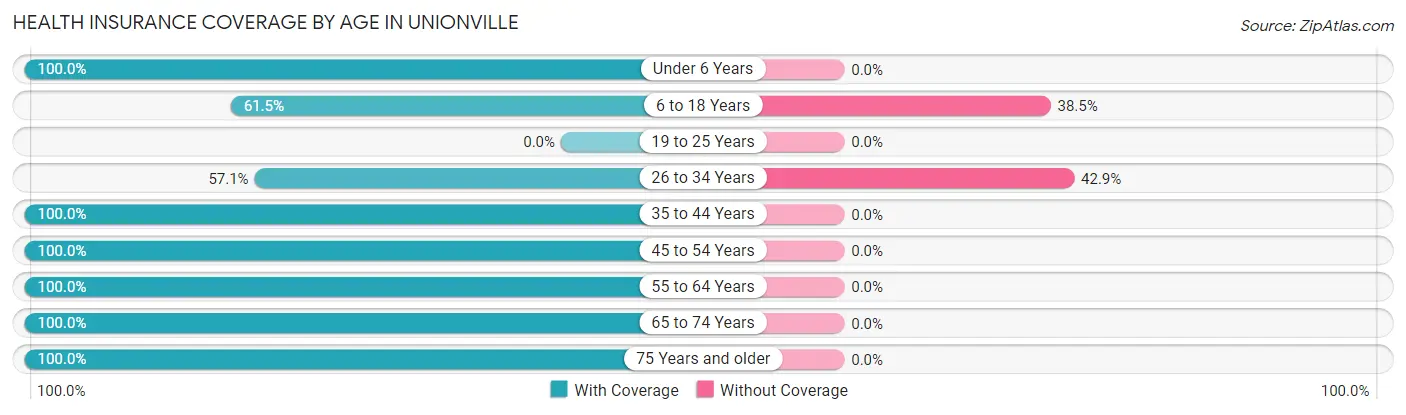
| Age Bracket | With Coverage | Without Coverage |
| Under 6 Years | 3 (100.0%) | 0 (0.0%) |
| 6 to 18 Years | 16 (61.5%) | 10 (38.5%) |
| 19 to 25 Years | 0 (0.0%) | 0 (0.0%) |
| 26 to 34 Years | 4 (57.1%) | 3 (42.9%) |
| 35 to 44 Years | 9 (100.0%) | 0 (0.0%) |
| 45 to 54 Years | 7 (100.0%) | 0 (0.0%) |
| 55 to 64 Years | 21 (100.0%) | 0 (0.0%) |
| 65 to 74 Years | 32 (100.0%) | 0 (0.0%) |
| 75 Years and older | 10 (100.0%) | 0 (0.0%) |
| Total | 102 (88.7%) | 13 (11.3%) |
Health Insurance Coverage by Citizenship Status in Unionville
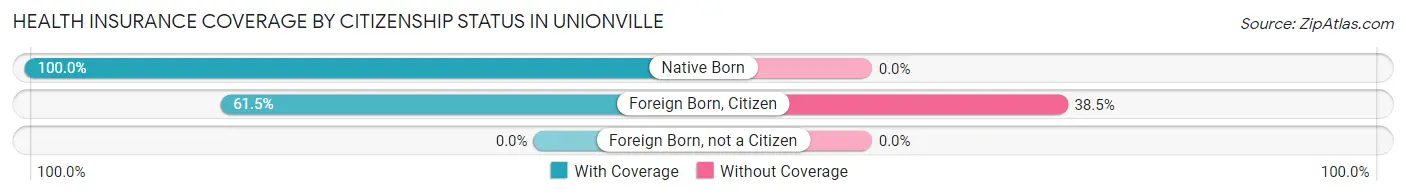
| Citizenship Status | With Coverage | Without Coverage |
| Native Born | 3 (100.0%) | 0 (0.0%) |
| Foreign Born, Citizen | 16 (61.5%) | 10 (38.5%) |
| Foreign Born, not a Citizen | 0 (0.0%) | 0 (0.0%) |
Health Insurance Coverage by Household Income in Unionville
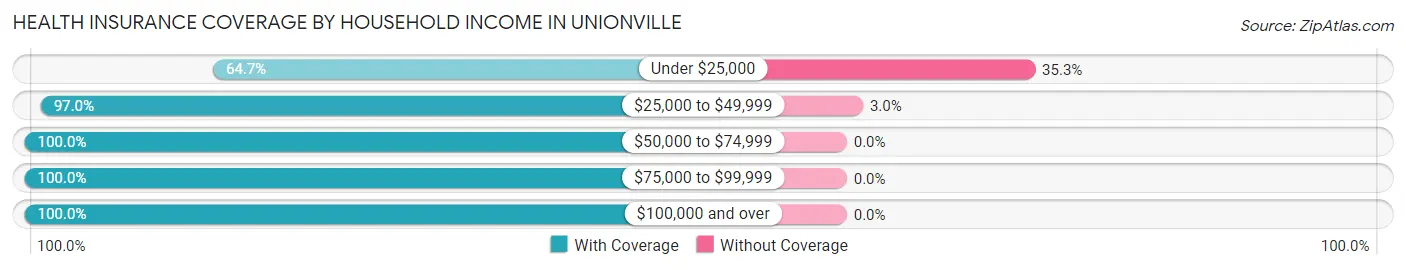
| Household Income | With Coverage | Without Coverage |
| Under $25,000 | 22 (64.7%) | 12 (35.3%) |
| $25,000 to $49,999 | 32 (97.0%) | 1 (3.0%) |
| $50,000 to $74,999 | 3 (100.0%) | 0 (0.0%) |
| $75,000 to $99,999 | 31 (100.0%) | 0 (0.0%) |
| $100,000 and over | 14 (100.0%) | 0 (0.0%) |
Public vs Private Health Insurance Coverage by Age in Unionville
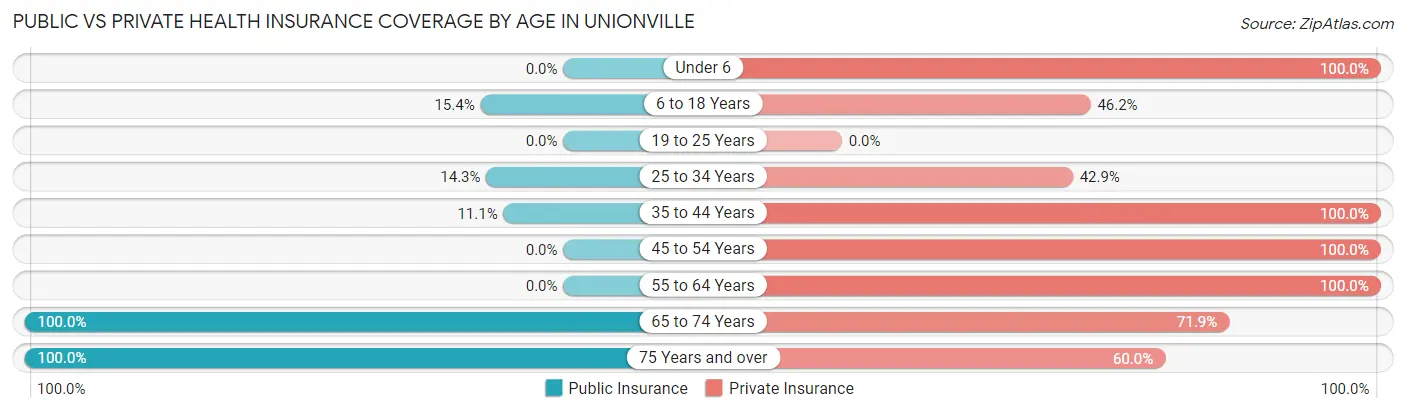
| Age Bracket | Public Insurance | Private Insurance |
| Under 6 | 0 (0.0%) | 3 (100.0%) |
| 6 to 18 Years | 4 (15.4%) | 12 (46.2%) |
| 19 to 25 Years | 0 (0.0%) | 0 (0.0%) |
| 25 to 34 Years | 1 (14.3%) | 3 (42.9%) |
| 35 to 44 Years | 1 (11.1%) | 9 (100.0%) |
| 45 to 54 Years | 0 (0.0%) | 7 (100.0%) |
| 55 to 64 Years | 0 (0.0%) | 21 (100.0%) |
| 65 to 74 Years | 32 (100.0%) | 23 (71.9%) |
| 75 Years and over | 10 (100.0%) | 6 (60.0%) |
| Total | 48 (41.7%) | 84 (73.0%) |
Disability Status by Sex by Age in Unionville
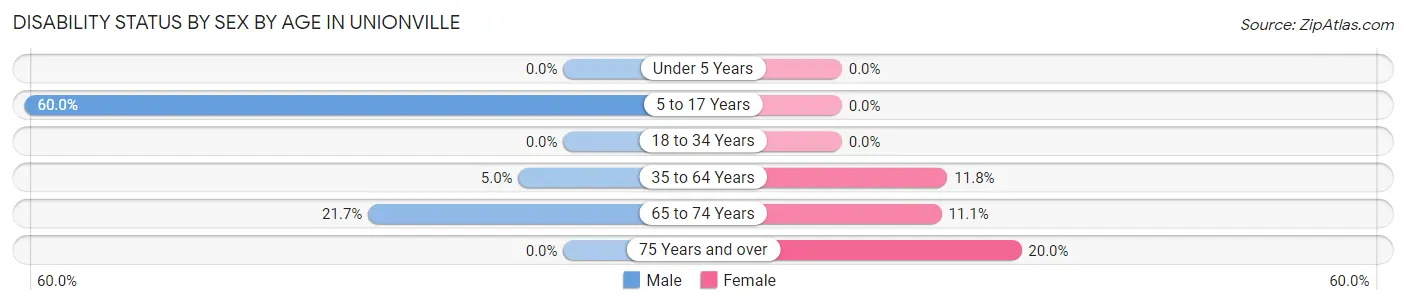
| Age Bracket | Male | Female |
| Under 5 Years | 0 (0.0%) | 0 (0.0%) |
| 5 to 17 Years | 6 (60.0%) | 0 (0.0%) |
| 18 to 34 Years | 0 (0.0%) | 0 (0.0%) |
| 35 to 64 Years | 1 (5.0%) | 2 (11.8%) |
| 65 to 74 Years | 5 (21.7%) | 1 (11.1%) |
| 75 Years and over | 0 (0.0%) | 1 (20.0%) |
Disability Class by Sex by Age in Unionville
Disability Class: Hearing Difficulty
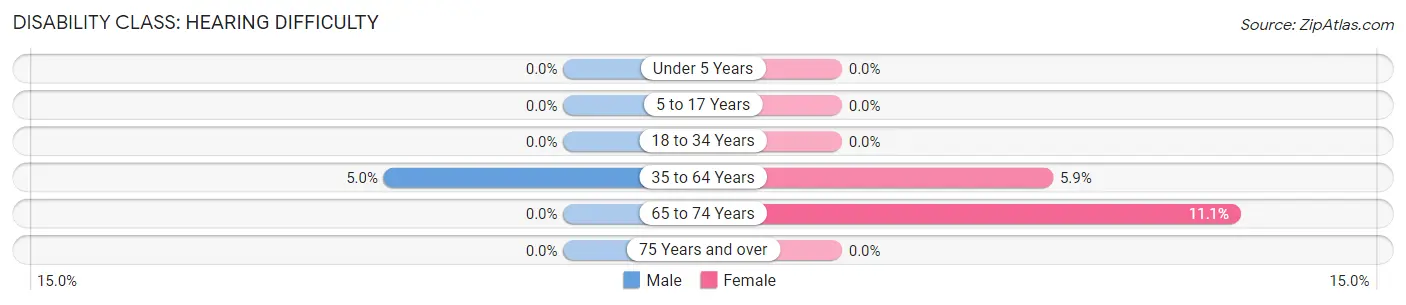
| Age Bracket | Male | Female |
| Under 5 Years | 0 (0.0%) | 0 (0.0%) |
| 5 to 17 Years | 0 (0.0%) | 0 (0.0%) |
| 18 to 34 Years | 0 (0.0%) | 0 (0.0%) |
| 35 to 64 Years | 1 (5.0%) | 1 (5.9%) |
| 65 to 74 Years | 0 (0.0%) | 1 (11.1%) |
| 75 Years and over | 0 (0.0%) | 0 (0.0%) |
Disability Class: Vision Difficulty
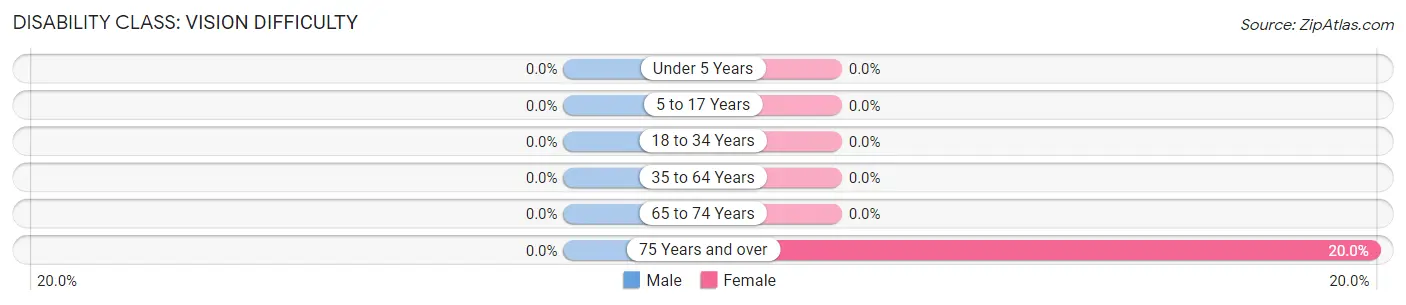
| Age Bracket | Male | Female |
| Under 5 Years | 0 (0.0%) | 0 (0.0%) |
| 5 to 17 Years | 0 (0.0%) | 0 (0.0%) |
| 18 to 34 Years | 0 (0.0%) | 0 (0.0%) |
| 35 to 64 Years | 0 (0.0%) | 0 (0.0%) |
| 65 to 74 Years | 0 (0.0%) | 0 (0.0%) |
| 75 Years and over | 0 (0.0%) | 1 (20.0%) |
Disability Class: Cognitive Difficulty
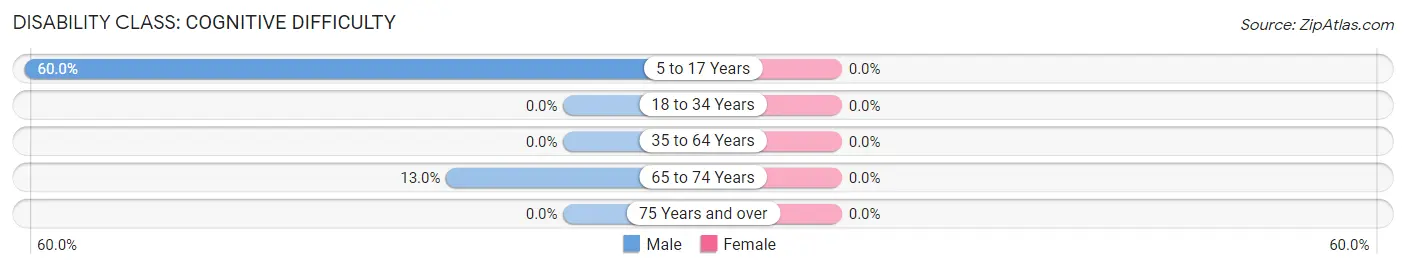
| Age Bracket | Male | Female |
| 5 to 17 Years | 6 (60.0%) | 0 (0.0%) |
| 18 to 34 Years | 0 (0.0%) | 0 (0.0%) |
| 35 to 64 Years | 0 (0.0%) | 0 (0.0%) |
| 65 to 74 Years | 3 (13.0%) | 0 (0.0%) |
| 75 Years and over | 0 (0.0%) | 0 (0.0%) |
Disability Class: Ambulatory Difficulty
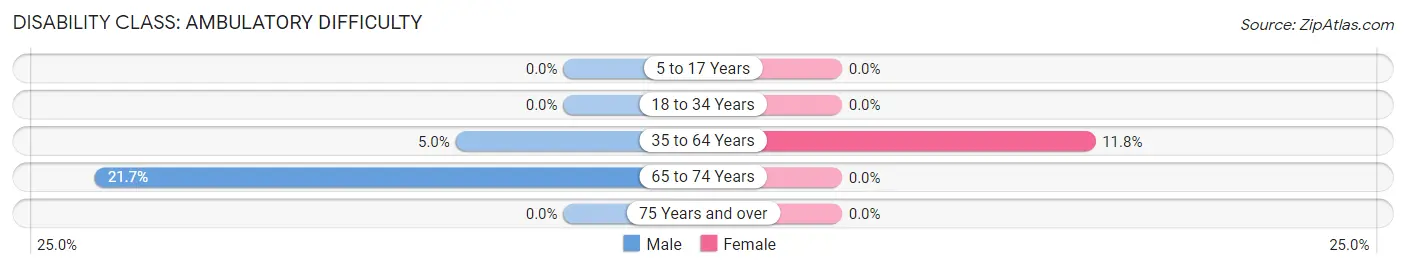
| Age Bracket | Male | Female |
| 5 to 17 Years | 0 (0.0%) | 0 (0.0%) |
| 18 to 34 Years | 0 (0.0%) | 0 (0.0%) |
| 35 to 64 Years | 1 (5.0%) | 2 (11.8%) |
| 65 to 74 Years | 5 (21.7%) | 0 (0.0%) |
| 75 Years and over | 0 (0.0%) | 0 (0.0%) |
Disability Class: Self-Care Difficulty
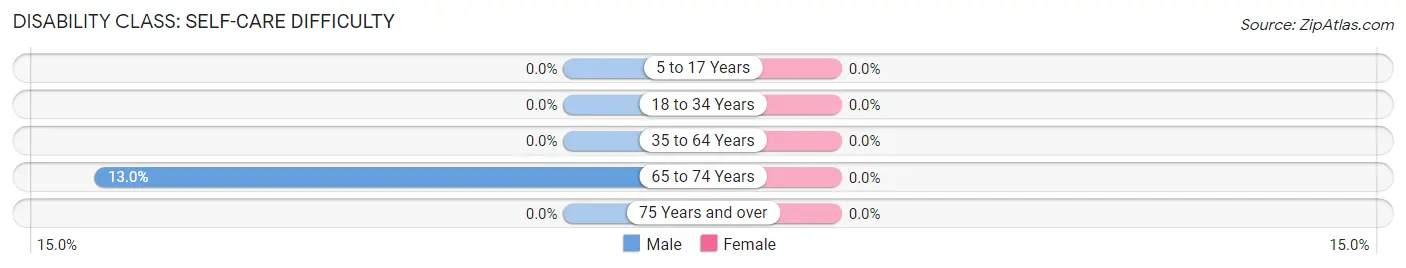
| Age Bracket | Male | Female |
| 5 to 17 Years | 0 (0.0%) | 0 (0.0%) |
| 18 to 34 Years | 0 (0.0%) | 0 (0.0%) |
| 35 to 64 Years | 0 (0.0%) | 0 (0.0%) |
| 65 to 74 Years | 3 (13.0%) | 0 (0.0%) |
| 75 Years and over | 0 (0.0%) | 0 (0.0%) |
Technology Access in Unionville
Computing Device Access in Unionville
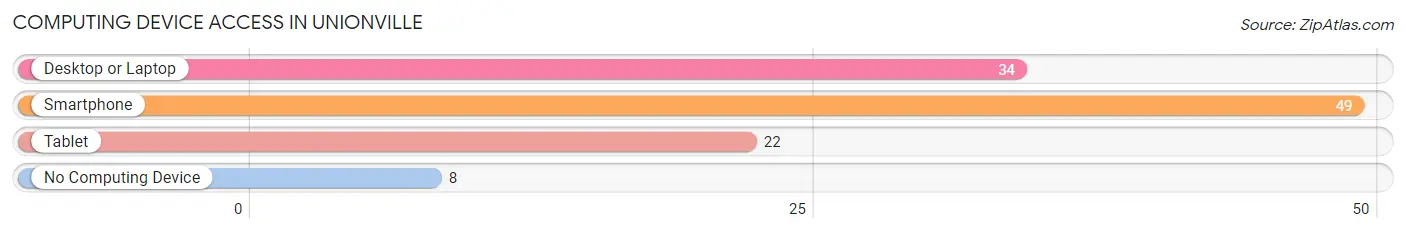
| Device Type | # Households | % Households |
| Desktop or Laptop | 34 | 54.8% |
| Smartphone | 49 | 79.0% |
| Tablet | 22 | 35.5% |
| No Computing Device | 8 | 12.9% |
| Total | 62 | 100.0% |
Internet Access in Unionville
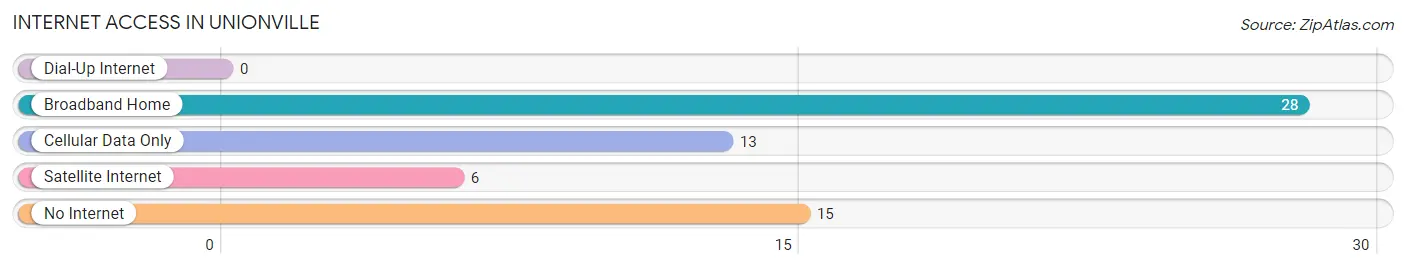
| Internet Type | # Households | % Households |
| Dial-Up Internet | 0 | 0.0% |
| Broadband Home | 28 | 45.2% |
| Cellular Data Only | 13 | 21.0% |
| Satellite Internet | 6 | 9.7% |
| No Internet | 15 | 24.2% |
| Total | 62 | 100.0% |
Unionville Summary
Introduction
Unionville is a small city located in Appanoose County, Iowa. It is situated in the south-central part of the state, approximately 90 miles south of Des Moines. The city has a population of 1,092 people, according to the 2010 census. Unionville is a rural community with a strong agricultural base. The city is home to a variety of businesses, including a grain elevator, a feed mill, a lumber yard, and a variety of retail stores.
History
Unionville was founded in 1854 by a group of settlers from Ohio. The city was named after the Unionville post office, which was established in 1855. The city was incorporated in 1868.
In the late 19th century, Unionville was a thriving agricultural community. The city was home to a variety of businesses, including a grain elevator, a feed mill, a lumber yard, and a variety of retail stores.
In the early 20th century, Unionville experienced a period of growth and prosperity. The city was home to a variety of industries, including a brickyard, a canning factory, and a creamery.
Geography
Unionville is located in Appanoose County, Iowa. The city is situated in the south-central part of the state, approximately 90 miles south of Des Moines. The city is located on the banks of the Chariton River.
The city has a total area of 1.2 square miles, all of which is land. The city is located in a flat, open area with rolling hills in the surrounding area. The climate is characterized by hot, humid summers and cold, wet winters.
Economy
Unionville is a rural community with a strong agricultural base. The city is home to a variety of businesses, including a grain elevator, a feed mill, a lumber yard, and a variety of retail stores.
The city is also home to a variety of manufacturing businesses, including a brickyard, a canning factory, and a creamery. The city is also home to a variety of service businesses, including a bank, a post office, and a variety of restaurants.
Demographics
According to the 2010 census, Unionville has a population of 1,092 people. The city has a median household income of $41,250 and a median family income of $50,000. The city has a poverty rate of 16.3%.
The city is predominantly white, with 92.3% of the population identifying as white. The city is also home to a small Hispanic population, with 4.2% of the population identifying as Hispanic or Latino.
Conclusion
Unionville is a small city located in Appanoose County, Iowa. The city has a population of 1,092 people, according to the 2010 census. Unionville is a rural community with a strong agricultural base. The city is home to a variety of businesses, including a grain elevator, a feed mill, a lumber yard, and a variety of retail stores. The city is predominantly white, with 92.3% of the population identifying as white. The city has a median household income of $41,250 and a median family income of $50,000. The city has a poverty rate of 16.3%.
Common Questions
What is Per Capita Income in Unionville?
Per Capita income in Unionville is $29,889.
What is the Median Family Income in Unionville?
Median Family Income in Unionville is $73,750.
What is Inequality or Gini Index in Unionville?
Inequality or Gini Index in Unionville is 0.42.
What is the Total Population of Unionville?
Total Population of Unionville is 115.
What is the Total Male Population of Unionville?
Total Male Population of Unionville is 72.
What is the Total Female Population of Unionville?
Total Female Population of Unionville is 43.
What is the Ratio of Males per 100 Females in Unionville?
There are 167.44 Males per 100 Females in Unionville.
What is the Ratio of Females per 100 Males in Unionville?
There are 59.72 Females per 100 Males in Unionville.
What is the Median Population Age in Unionville?
Median Population Age in Unionville is 60.9 Years.
What is the Average Family Size in Unionville
Average Family Size in Unionville is 2.2 People.
What is the Average Household Size in Unionville
Average Household Size in Unionville is 1.9 People.
How Large is the Labor Force in Unionville?
There are 54 People in the Labor Forcein in Unionville.
What is the Percentage of People in the Labor Force in Unionville?
52.9% of People are in the Labor Force in Unionville.
What is the Unemployment Rate in Unionville?
Unemployment Rate in Unionville is 1.9%.