Sumner, IA Map & Demographics
Sumner Map
Sumner Overview
$35,723
PER CAPITA INCOME
$90,536
AVG FAMILY INCOME
$59,926
AVG HOUSEHOLD INCOME
26.4%
WAGE / INCOME GAP [ % ]
73.6¢/ $1
WAGE / INCOME GAP [ $ ]
0.43
INEQUALITY / GINI INDEX
2,145
TOTAL POPULATION
1,095
MALE POPULATION
1,050
FEMALE POPULATION
104.29
MALES / 100 FEMALES
95.89
FEMALES / 100 MALES
45.7
MEDIAN AGE
3.2
AVG FAMILY SIZE
2.4
AVG HOUSEHOLD SIZE
1,054
LABOR FORCE [ PEOPLE ]
61.5%
PERCENT IN LABOR FORCE
3.1%
UNEMPLOYMENT RATE
Sumner Zip Codes
Sumner Area Codes
Income in Sumner
Income Overview in Sumner
Per Capita Income in Sumner is $35,723, while median incomes of families and households are $90,536 and $59,926 respectively.
| Characteristic | Number | Measure |
| Per Capita Income | 2,145 | $35,723 |
| Median Family Income | 507 | $90,536 |
| Mean Family Income | 507 | $106,191 |
| Median Household Income | 879 | $59,926 |
| Mean Household Income | 879 | $81,315 |
| Income Deficit | 507 | $0 |
| Wage / Income Gap (%) | 2,145 | 26.42% |
| Wage / Income Gap ($) | 2,145 | 73.58¢ per $1 |
| Gini / Inequality Index | 2,145 | 0.43 |
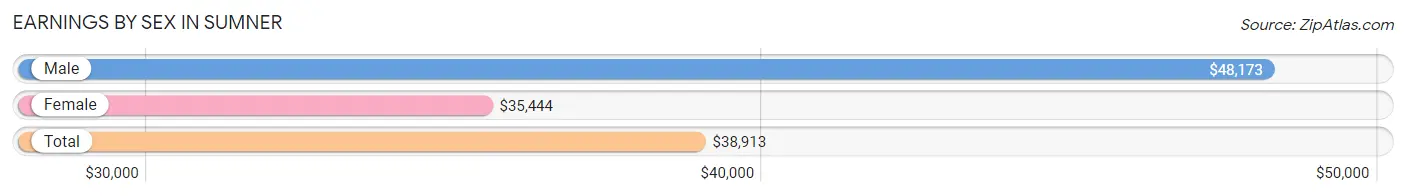
Earnings by Sex in Sumner
Average Earnings in Sumner are $38,913, $48,173 for men and $35,444 for women, a difference of 26.4%.
| Sex | Number | Average Earnings |
| Male | 619 (51.6%) | $48,173 |
| Female | 581 (48.4%) | $35,444 |
| Total | 1,200 (100.0%) | $38,913 |
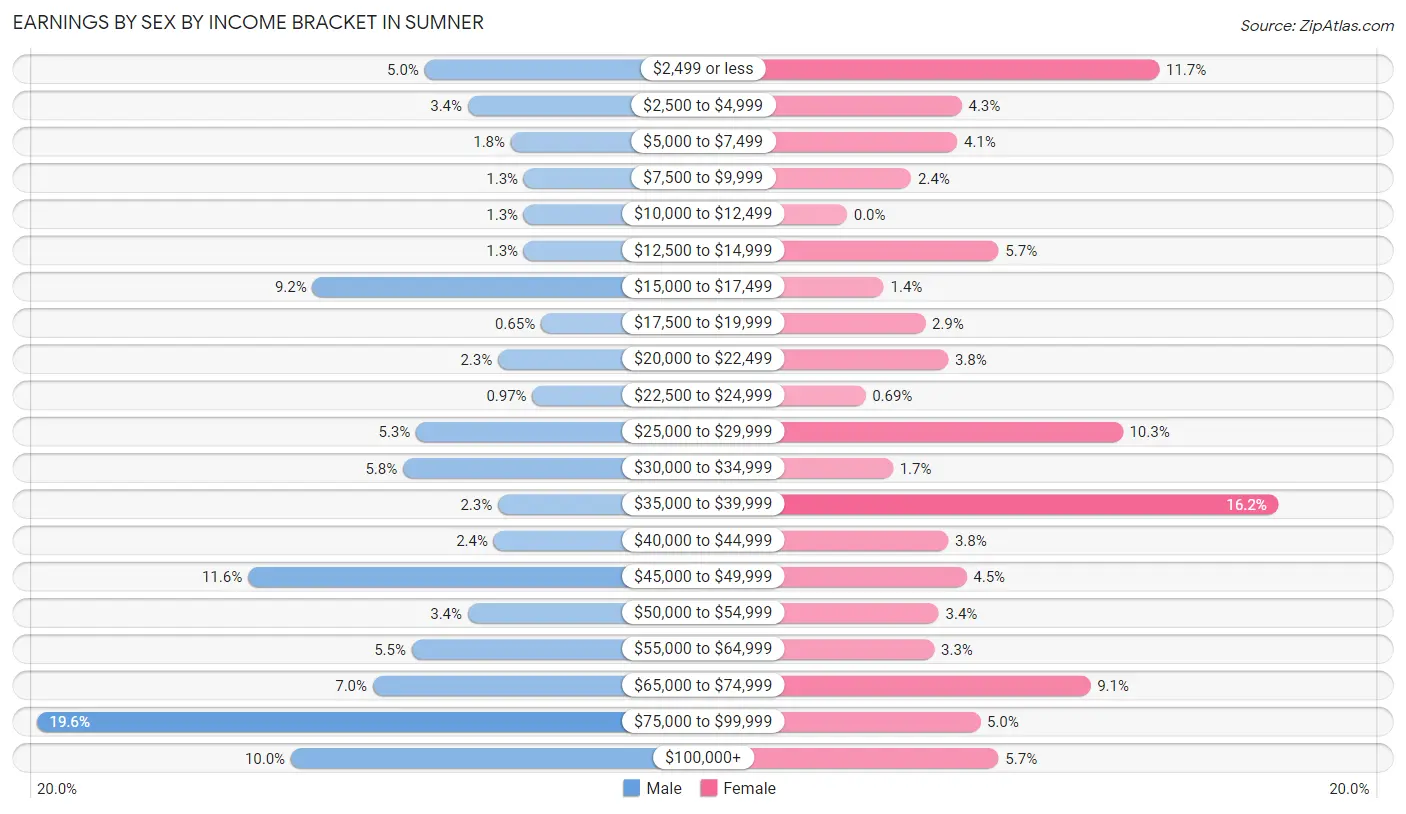
Earnings by Sex by Income Bracket in Sumner
The most common earnings brackets in Sumner are $75,000 to $99,999 for men (121 | 19.6%) and $35,000 to $39,999 for women (94 | 16.2%).
| Income | Male | Female |
| $2,499 or less | 31 (5.0%) | 68 (11.7%) |
| $2,500 to $4,999 | 21 (3.4%) | 25 (4.3%) |
| $5,000 to $7,499 | 11 (1.8%) | 24 (4.1%) |
| $7,500 to $9,999 | 8 (1.3%) | 14 (2.4%) |
| $10,000 to $12,499 | 8 (1.3%) | 0 (0.0%) |
| $12,500 to $14,999 | 8 (1.3%) | 33 (5.7%) |
| $15,000 to $17,499 | 57 (9.2%) | 8 (1.4%) |
| $17,500 to $19,999 | 4 (0.6%) | 17 (2.9%) |
| $20,000 to $22,499 | 14 (2.3%) | 22 (3.8%) |
| $22,500 to $24,999 | 6 (1.0%) | 4 (0.7%) |
| $25,000 to $29,999 | 33 (5.3%) | 60 (10.3%) |
| $30,000 to $34,999 | 36 (5.8%) | 10 (1.7%) |
| $35,000 to $39,999 | 14 (2.3%) | 94 (16.2%) |
| $40,000 to $44,999 | 15 (2.4%) | 22 (3.8%) |
| $45,000 to $49,999 | 72 (11.6%) | 26 (4.5%) |
| $50,000 to $54,999 | 21 (3.4%) | 20 (3.4%) |
| $55,000 to $64,999 | 34 (5.5%) | 19 (3.3%) |
| $65,000 to $74,999 | 43 (7.0%) | 53 (9.1%) |
| $75,000 to $99,999 | 121 (19.6%) | 29 (5.0%) |
| $100,000+ | 62 (10.0%) | 33 (5.7%) |
| Total | 619 (100.0%) | 581 (100.0%) |
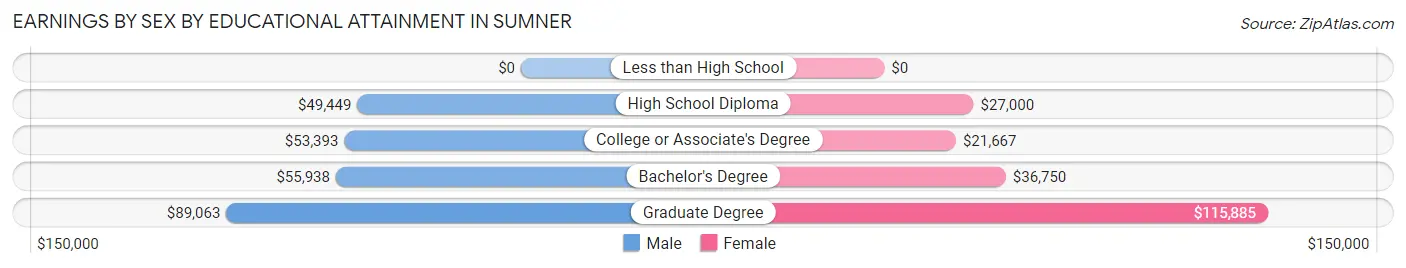
Earnings by Sex by Educational Attainment in Sumner
Average earnings in Sumner are $52,679 for men and $34,688 for women, a difference of 34.2%. Men with an educational attainment of graduate degree enjoy the highest average annual earnings of $89,063, while those with high school diploma education earn the least with $49,449. Women with an educational attainment of graduate degree earn the most with the average annual earnings of $115,885, while those with college or associate's degree education have the smallest earnings of $21,667.
| Educational Attainment | Male Income | Female Income |
| Less than High School | - | - |
| High School Diploma | $49,449 | $27,000 |
| College or Associate's Degree | $53,393 | $21,667 |
| Bachelor's Degree | $55,938 | $36,750 |
| Graduate Degree | $89,063 | $115,885 |
| Total | $52,679 | $34,688 |
Family Income in Sumner
Family Income Brackets in Sumner
According to the Sumner family income data, there are 144 families falling into the $100,000 to $149,999 income range, which is the most common income bracket and makes up 28.4% of all families. Conversely, the $10,000 to $14,999 income bracket is the least frequent group with only 5 families (1.0%) belonging to this category.
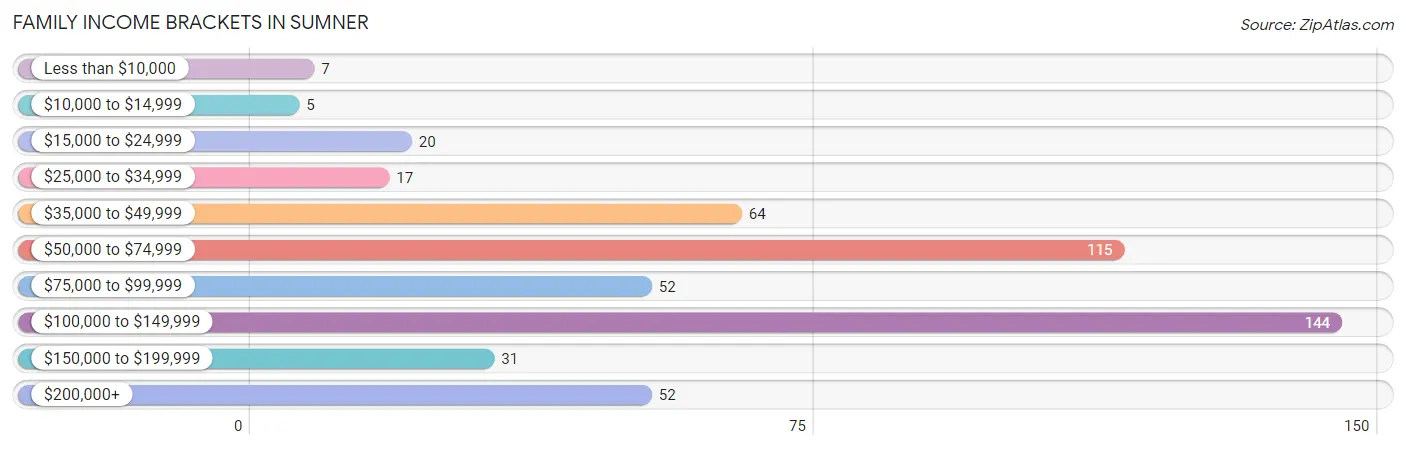
| Income Bracket | # Families | % Families |
| Less than $10,000 | 7 | 1.4% |
| $10,000 to $14,999 | 5 | 1.0% |
| $15,000 to $24,999 | 20 | 3.9% |
| $25,000 to $34,999 | 17 | 3.4% |
| $35,000 to $49,999 | 64 | 12.6% |
| $50,000 to $74,999 | 115 | 22.7% |
| $75,000 to $99,999 | 52 | 10.3% |
| $100,000 to $149,999 | 144 | 28.4% |
| $150,000 to $199,999 | 31 | 6.1% |
| $200,000+ | 52 | 10.3% |
Family Income by Famaliy Size in Sumner
3-person families (71 | 14.0%) account for the highest median family income in Sumner with $127,014 per family, while 3-person families (71 | 14.0%) have the highest median income of $42,338 per family member.
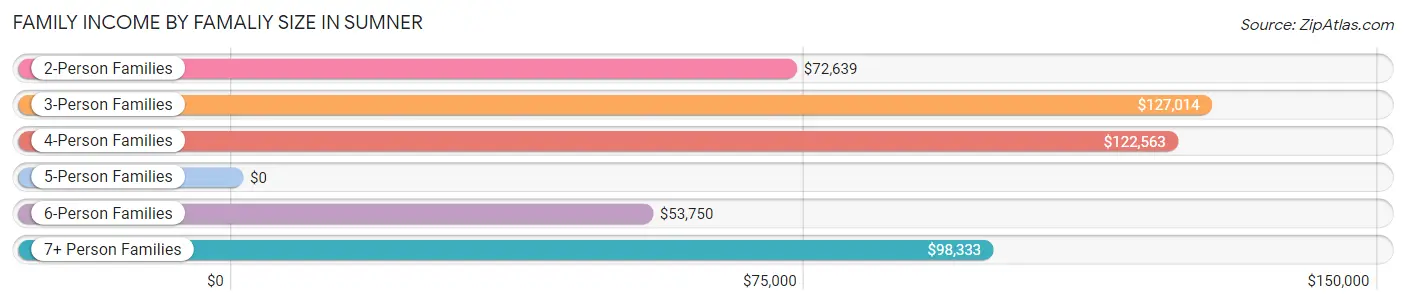
| Income Bracket | # Families | Median Income |
| 2-Person Families | 283 (55.8%) | $72,639 |
| 3-Person Families | 71 (14.0%) | $127,014 |
| 4-Person Families | 91 (17.9%) | $122,563 |
| 5-Person Families | 30 (5.9%) | $0 |
| 6-Person Families | 16 (3.2%) | $53,750 |
| 7+ Person Families | 16 (3.2%) | $98,333 |
| Total | 507 (100.0%) | $90,536 |
Family Income by Number of Earners in Sumner
The median family income in Sumner is $90,536, with families comprising 3+ earners (57) having the highest median family income of $123,188, while families with no earners (69) have the lowest median family income of $45,313, accounting for 11.2% and 13.6% of families, respectively.
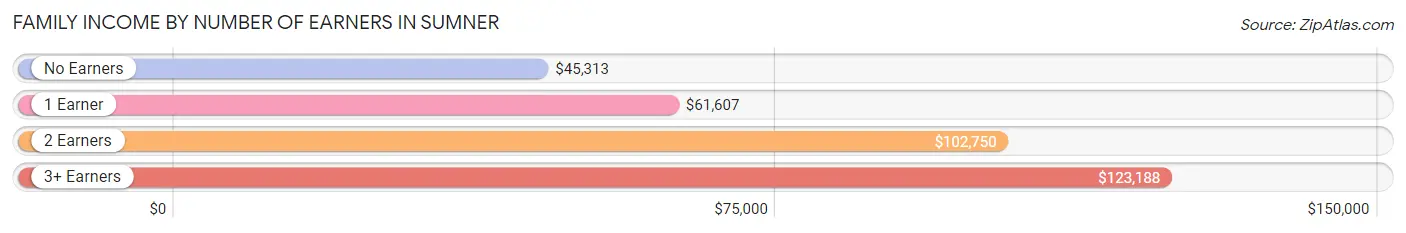
| Number of Earners | # Families | Median Income |
| No Earners | 69 (13.6%) | $45,313 |
| 1 Earner | 124 (24.5%) | $61,607 |
| 2 Earners | 257 (50.7%) | $102,750 |
| 3+ Earners | 57 (11.2%) | $123,188 |
| Total | 507 (100.0%) | $90,536 |
Household Income in Sumner
Household Income Brackets in Sumner
With 174 households falling in the category, the $100,000 to $149,999 income range is the most frequent in Sumner, accounting for 19.8% of all households. In contrast, only 31 households (3.5%) fall into the $150,000 to $199,999 income bracket, making it the least populous group.
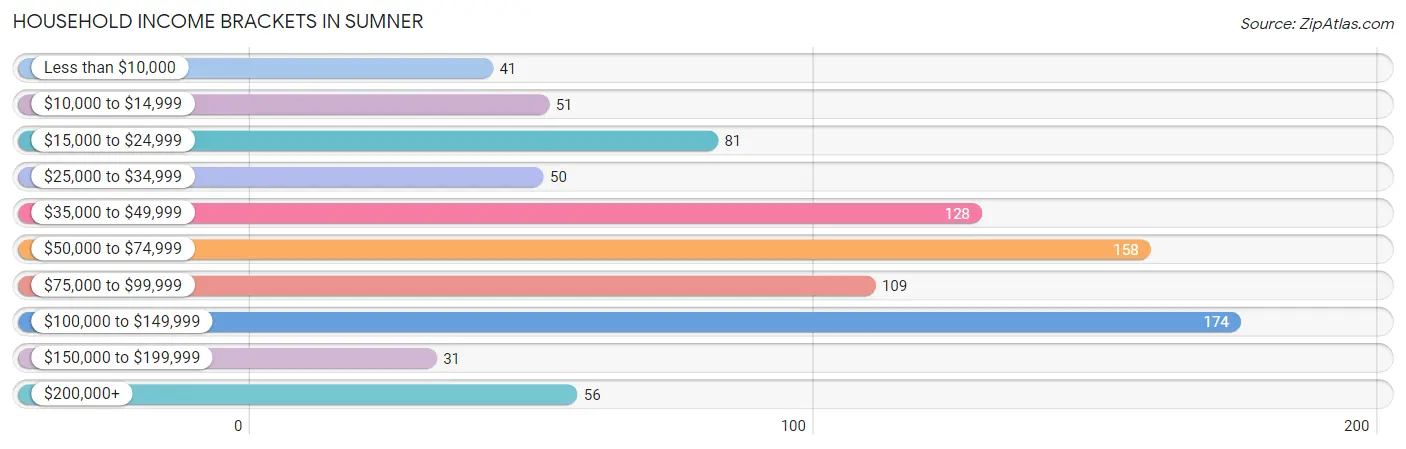
| Income Bracket | # Households | % Households |
| Less than $10,000 | 41 | 4.7% |
| $10,000 to $14,999 | 51 | 5.8% |
| $15,000 to $24,999 | 81 | 9.2% |
| $25,000 to $34,999 | 50 | 5.7% |
| $35,000 to $49,999 | 128 | 14.6% |
| $50,000 to $74,999 | 158 | 18.0% |
| $75,000 to $99,999 | 109 | 12.4% |
| $100,000 to $149,999 | 174 | 19.8% |
| $150,000 to $199,999 | 31 | 3.5% |
| $200,000+ | 56 | 6.4% |
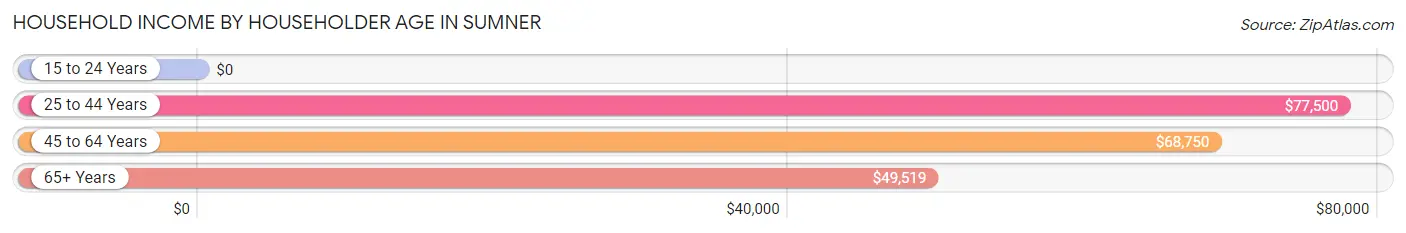
Household Income by Householder Age in Sumner
The median household income in Sumner is $59,926, with the highest median household income of $77,500 found in the 25 to 44 years age bracket for the primary householder. A total of 230 households (26.2%) fall into this category. Meanwhile, the 15 to 24 years age bracket for the primary householder has the lowest median household income of $0, with 20 households (2.3%) in this group.
| Income Bracket | # Households | Median Income |
| 15 to 24 Years | 20 (2.3%) | $0 |
| 25 to 44 Years | 230 (26.2%) | $77,500 |
| 45 to 64 Years | 344 (39.1%) | $68,750 |
| 65+ Years | 285 (32.4%) | $49,519 |
| Total | 879 (100.0%) | $59,926 |
Poverty in Sumner
Income Below Poverty by Sex and Age in Sumner
With 14.1% poverty level for males and 10.2% for females among the residents of Sumner, 5 year old males and 5 year old females are the most vulnerable to poverty, with 11 males (50.0%) and 12 females (63.2%) in their respective age groups living below the poverty level.
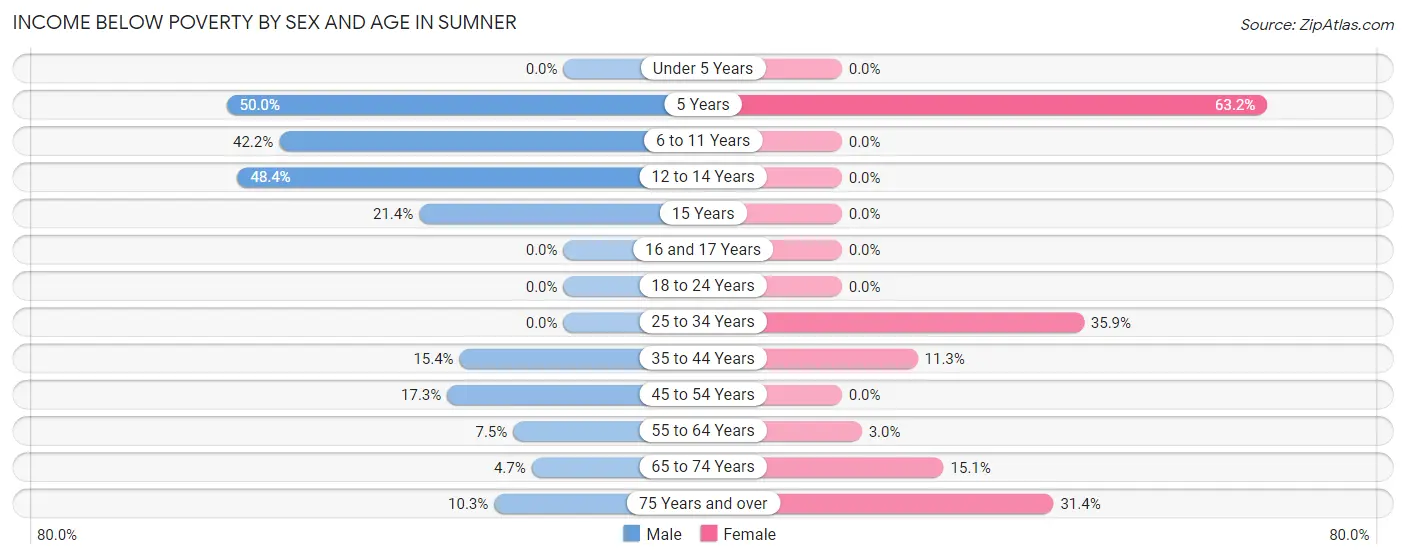
| Age Bracket | Male | Female |
| Under 5 Years | 0 (0.0%) | 0 (0.0%) |
| 5 Years | 11 (50.0%) | 12 (63.2%) |
| 6 to 11 Years | 38 (42.2%) | 0 (0.0%) |
| 12 to 14 Years | 15 (48.4%) | 0 (0.0%) |
| 15 Years | 6 (21.4%) | 0 (0.0%) |
| 16 and 17 Years | 0 (0.0%) | 0 (0.0%) |
| 18 to 24 Years | 0 (0.0%) | 0 (0.0%) |
| 25 to 34 Years | 0 (0.0%) | 23 (35.9%) |
| 35 to 44 Years | 25 (15.4%) | 17 (11.3%) |
| 45 to 54 Years | 29 (17.3%) | 0 (0.0%) |
| 55 to 64 Years | 10 (7.5%) | 5 (3.0%) |
| 65 to 74 Years | 5 (4.7%) | 13 (15.1%) |
| 75 Years and over | 11 (10.3%) | 33 (31.4%) |
| Total | 150 (14.1%) | 103 (10.2%) |
Income Above Poverty by Sex and Age in Sumner
According to the poverty statistics in Sumner, males aged under 5 years and females aged under 5 years are the age groups that are most secure financially, with 100.0% of males and 100.0% of females in these age groups living above the poverty line.
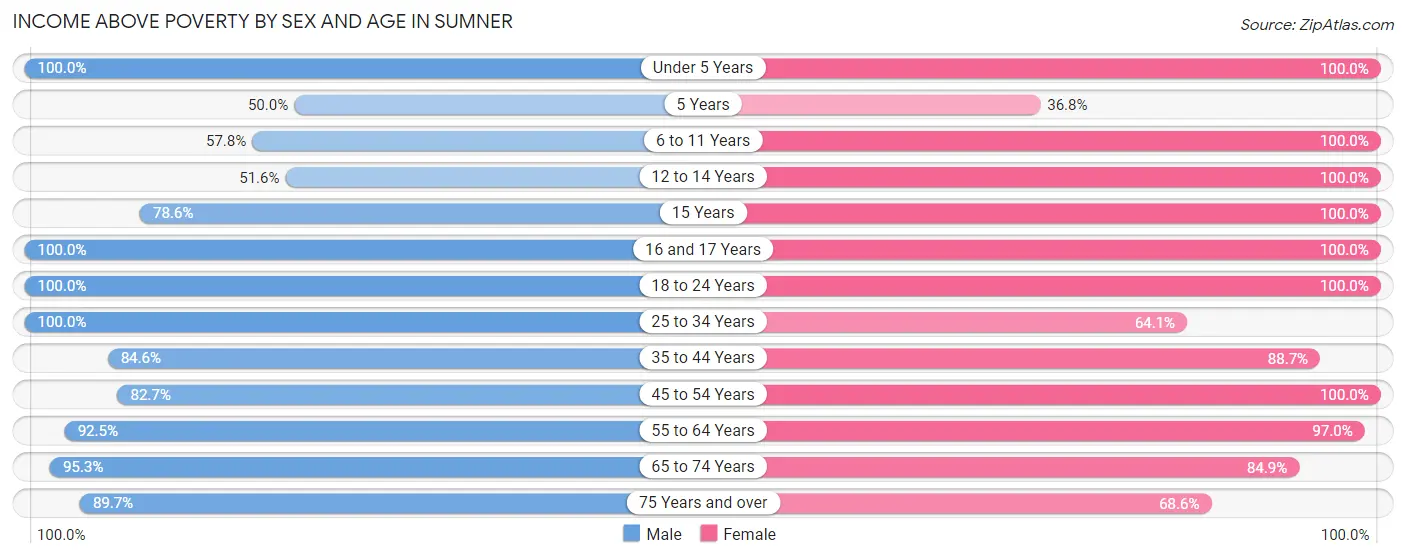
| Age Bracket | Male | Female |
| Under 5 Years | 62 (100.0%) | 42 (100.0%) |
| 5 Years | 11 (50.0%) | 7 (36.8%) |
| 6 to 11 Years | 52 (57.8%) | 57 (100.0%) |
| 12 to 14 Years | 16 (51.6%) | 65 (100.0%) |
| 15 Years | 22 (78.6%) | 10 (100.0%) |
| 16 and 17 Years | 48 (100.0%) | 7 (100.0%) |
| 18 to 24 Years | 38 (100.0%) | 95 (100.0%) |
| 25 to 34 Years | 71 (100.0%) | 41 (64.1%) |
| 35 to 44 Years | 137 (84.6%) | 134 (88.7%) |
| 45 to 54 Years | 139 (82.7%) | 143 (100.0%) |
| 55 to 64 Years | 124 (92.5%) | 164 (97.0%) |
| 65 to 74 Years | 101 (95.3%) | 73 (84.9%) |
| 75 Years and over | 96 (89.7%) | 72 (68.6%) |
| Total | 917 (85.9%) | 910 (89.8%) |
Income Below Poverty Among Married-Couple Families in Sumner
The poverty statistics for married-couple families in Sumner show that 6.1% or 25 of the total 407 families live below the poverty line. Families with 3 or 4 children have the highest poverty rate of 28.3%, comprising of 13 families. On the other hand, families with 1 or 2 children have the lowest poverty rate of 0.0%, which includes 0 families.
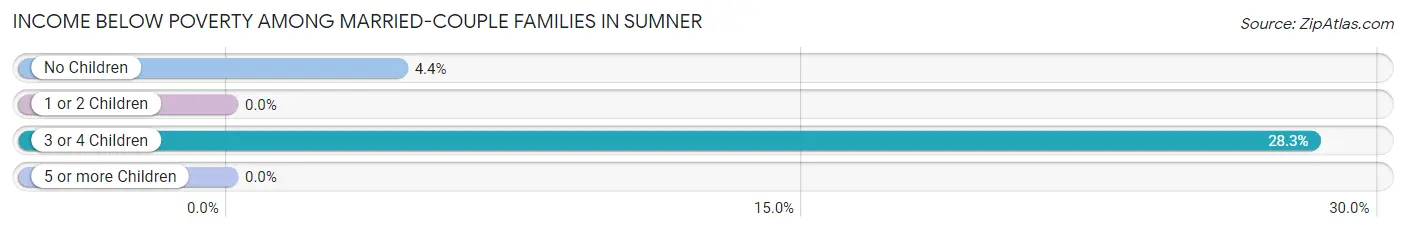
| Children | Above Poverty | Below Poverty |
| No Children | 259 (95.6%) | 12 (4.4%) |
| 1 or 2 Children | 80 (100.0%) | 0 (0.0%) |
| 3 or 4 Children | 33 (71.7%) | 13 (28.3%) |
| 5 or more Children | 10 (100.0%) | 0 (0.0%) |
| Total | 382 (93.9%) | 25 (6.1%) |
Income Below Poverty Among Single-Parent Households in Sumner
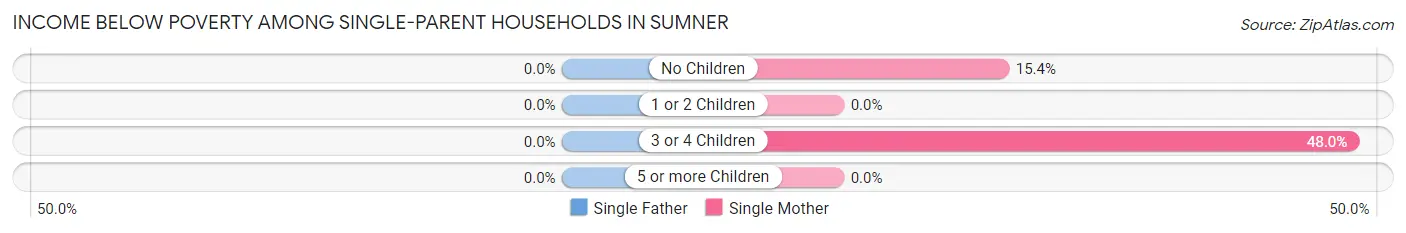
| Children | Single Father | Single Mother |
| No Children | 0 (0.0%) | 4 (15.4%) |
| 1 or 2 Children | 0 (0.0%) | 0 (0.0%) |
| 3 or 4 Children | 0 (0.0%) | 12 (48.0%) |
| 5 or more Children | 0 (0.0%) | 0 (0.0%) |
| Total | 0 (0.0%) | 16 (21.9%) |
Income Below Poverty Among Married-Couple vs Single-Parent Households in Sumner
The poverty data for Sumner shows that 25 of the married-couple family households (6.1%) and 16 of the single-parent households (16.0%) are living below the poverty level. Within the married-couple family households, those with 3 or 4 children have the highest poverty rate, with 13 households (28.3%) falling below the poverty line. Among the single-parent households, those with 3 or 4 children have the highest poverty rate, with 12 household (48.0%) living below poverty.
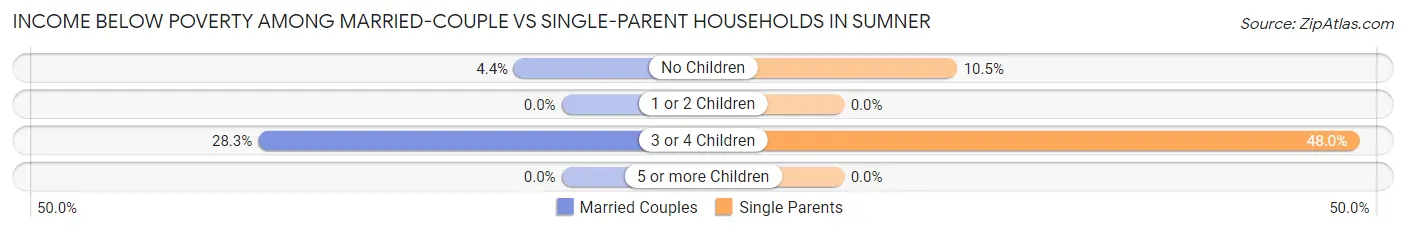
| Children | Married-Couple Families | Single-Parent Households |
| No Children | 12 (4.4%) | 4 (10.5%) |
| 1 or 2 Children | 0 (0.0%) | 0 (0.0%) |
| 3 or 4 Children | 13 (28.3%) | 12 (48.0%) |
| 5 or more Children | 0 (0.0%) | 0 (0.0%) |
| Total | 25 (6.1%) | 16 (16.0%) |
Race in Sumner
The most populous races in Sumner are White / Caucasian (2,074 | 96.7%), Two or more Races (37 | 1.7%), and Black / African American (25 | 1.2%).
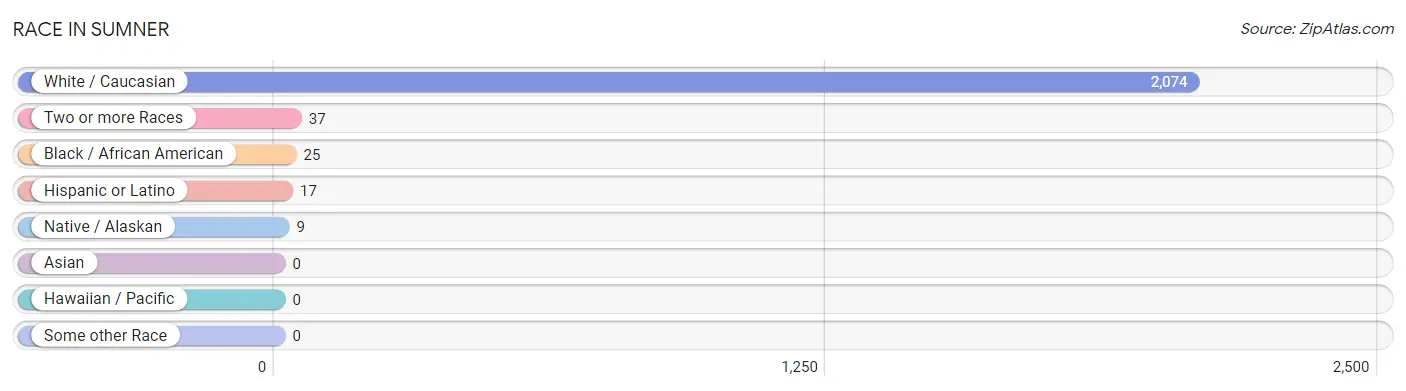
| Race | # Population | % Population |
| Asian | 0 | 0.0% |
| Black / African American | 25 | 1.2% |
| Hawaiian / Pacific | 0 | 0.0% |
| Hispanic or Latino | 17 | 0.8% |
| Native / Alaskan | 9 | 0.4% |
| White / Caucasian | 2,074 | 96.7% |
| Two or more Races | 37 | 1.7% |
| Some other Race | 0 | 0.0% |
| Total | 2,145 | 100.0% |
Ancestry in Sumner
The most populous ancestries reported in Sumner are German (1,061 | 49.5%), Irish (424 | 19.8%), English (303 | 14.1%), Scotch-Irish (103 | 4.8%), and American (81 | 3.8%), together accounting for 91.9% of all Sumner residents.
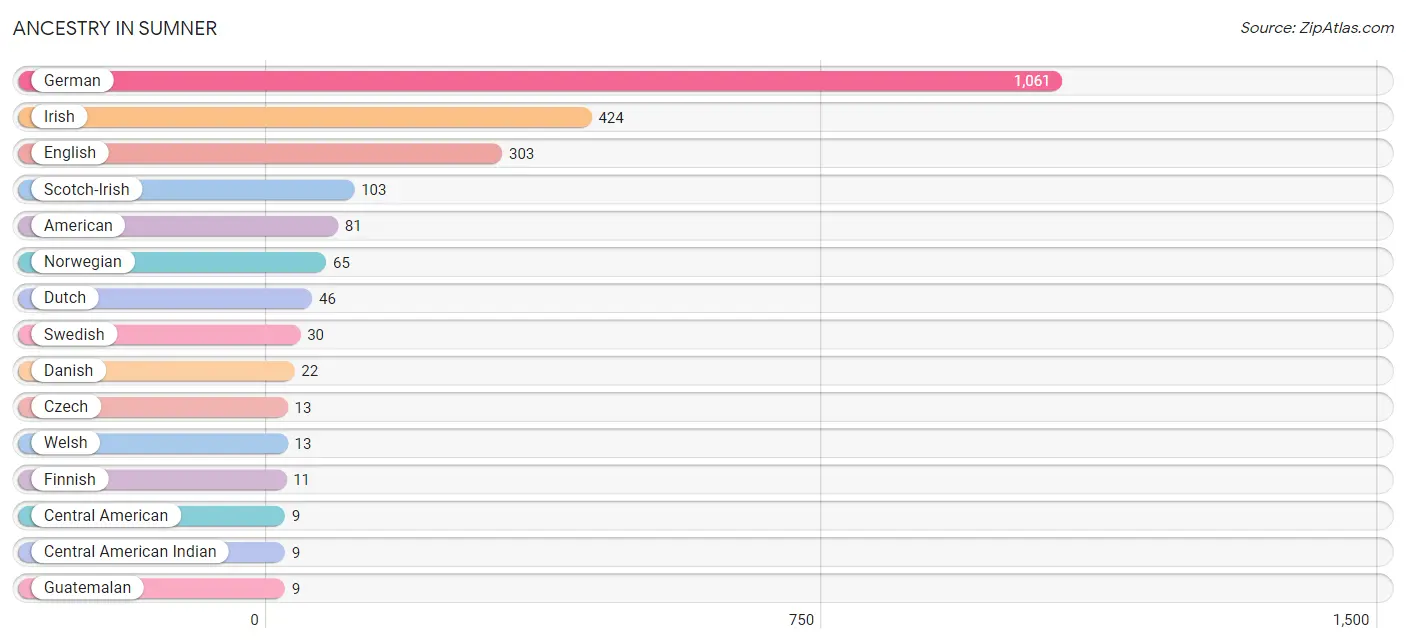
| Ancestry | # Population | % Population |
| American | 81 | 3.8% |
| Bhutanese | 7 | 0.3% |
| Central American | 9 | 0.4% |
| Central American Indian | 9 | 0.4% |
| Croatian | 4 | 0.2% |
| Czech | 13 | 0.6% |
| Danish | 22 | 1.0% |
| Dutch | 46 | 2.1% |
| English | 303 | 14.1% |
| European | 4 | 0.2% |
| Finnish | 11 | 0.5% |
| French | 8 | 0.4% |
| German | 1,061 | 49.5% |
| Guatemalan | 9 | 0.4% |
| Hungarian | 5 | 0.2% |
| Irish | 424 | 19.8% |
| Italian | 5 | 0.2% |
| Mexican | 4 | 0.2% |
| Norwegian | 65 | 3.0% |
| Polish | 9 | 0.4% |
| Russian | 3 | 0.1% |
| Scandinavian | 8 | 0.4% |
| Scotch-Irish | 103 | 4.8% |
| Scottish | 5 | 0.2% |
| Swedish | 30 | 1.4% |
| Swiss | 4 | 0.2% |
| Welsh | 13 | 0.6% | View All 27 Rows |
Immigrants in Sumner
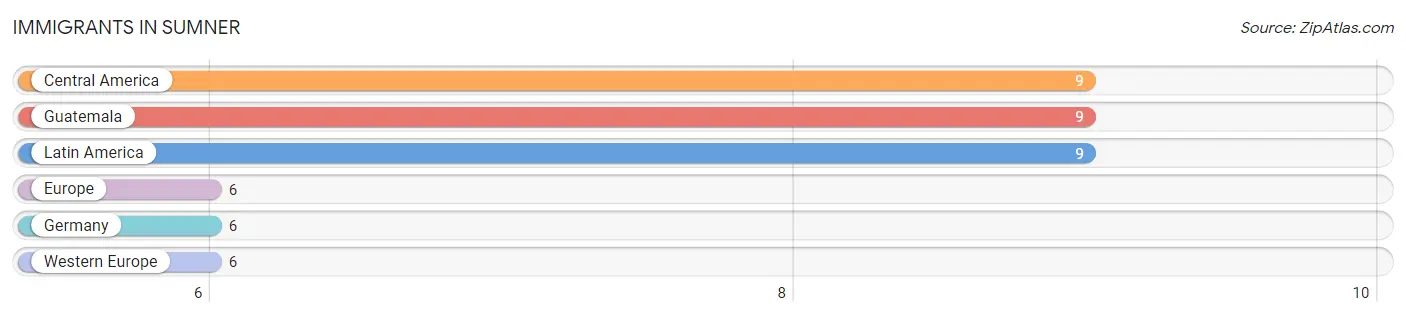
The most numerous immigrant groups reported in Sumner came from Central America (9 | 0.4%), Guatemala (9 | 0.4%), Latin America (9 | 0.4%), Europe (6 | 0.3%), and Germany (6 | 0.3%), together accounting for 1.8% of all Sumner residents.
| Immigration Origin | # Population | % Population |
| Central America | 9 | 0.4% |
| Europe | 6 | 0.3% |
| Germany | 6 | 0.3% |
| Guatemala | 9 | 0.4% |
| Latin America | 9 | 0.4% |
| Western Europe | 6 | 0.3% | View All 6 Rows |
Sex and Age in Sumner
Sex and Age in Sumner
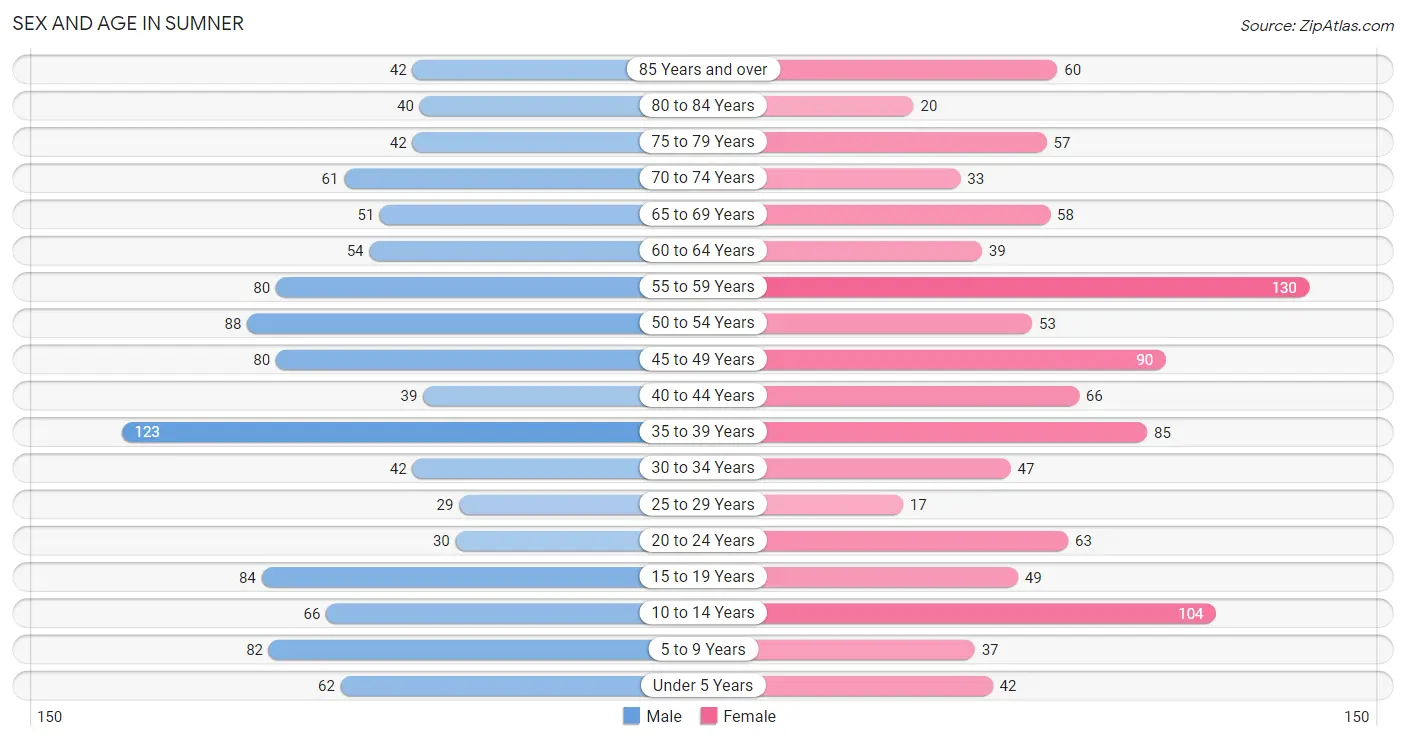
The most populous age groups in Sumner are 35 to 39 Years (123 | 11.2%) for men and 55 to 59 Years (130 | 12.4%) for women.
| Age Bracket | Male | Female |
| Under 5 Years | 62 (5.7%) | 42 (4.0%) |
| 5 to 9 Years | 82 (7.5%) | 37 (3.5%) |
| 10 to 14 Years | 66 (6.0%) | 104 (9.9%) |
| 15 to 19 Years | 84 (7.7%) | 49 (4.7%) |
| 20 to 24 Years | 30 (2.7%) | 63 (6.0%) |
| 25 to 29 Years | 29 (2.6%) | 17 (1.6%) |
| 30 to 34 Years | 42 (3.8%) | 47 (4.5%) |
| 35 to 39 Years | 123 (11.2%) | 85 (8.1%) |
| 40 to 44 Years | 39 (3.6%) | 66 (6.3%) |
| 45 to 49 Years | 80 (7.3%) | 90 (8.6%) |
| 50 to 54 Years | 88 (8.0%) | 53 (5.1%) |
| 55 to 59 Years | 80 (7.3%) | 130 (12.4%) |
| 60 to 64 Years | 54 (4.9%) | 39 (3.7%) |
| 65 to 69 Years | 51 (4.7%) | 58 (5.5%) |
| 70 to 74 Years | 61 (5.6%) | 33 (3.1%) |
| 75 to 79 Years | 42 (3.8%) | 57 (5.4%) |
| 80 to 84 Years | 40 (3.6%) | 20 (1.9%) |
| 85 Years and over | 42 (3.8%) | 60 (5.7%) |
| Total | 1,095 (100.0%) | 1,050 (100.0%) |
Families and Households in Sumner
Median Family Size in Sumner
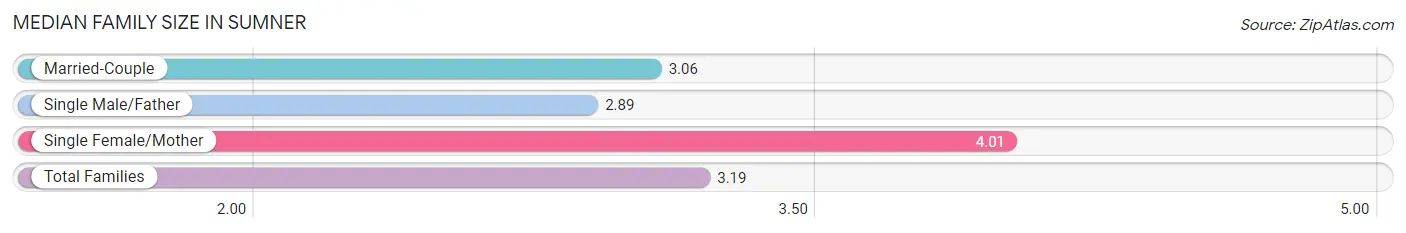
The median family size in Sumner is 3.19 persons per family, with single female/mother families (73 | 14.4%) accounting for the largest median family size of 4.01 persons per family. On the other hand, single male/father families (27 | 5.3%) represent the smallest median family size with 2.89 persons per family.
| Family Type | # Families | Family Size |
| Married-Couple | 407 (80.3%) | 3.06 |
| Single Male/Father | 27 (5.3%) | 2.89 |
| Single Female/Mother | 73 (14.4%) | 4.01 |
| Total Families | 507 (100.0%) | 3.19 |
Median Household Size in Sumner
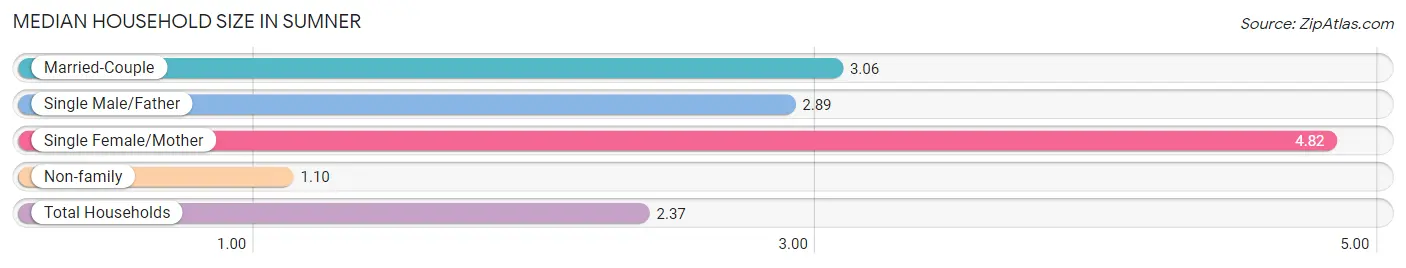
The median household size in Sumner is 2.37 persons per household, with single female/mother households (73 | 8.3%) accounting for the largest median household size of 4.82 persons per household. non-family households (372 | 42.3%) represent the smallest median household size with 1.10 persons per household.
| Household Type | # Households | Household Size |
| Married-Couple | 407 (46.3%) | 3.06 |
| Single Male/Father | 27 (3.1%) | 2.89 |
| Single Female/Mother | 73 (8.3%) | 4.82 |
| Non-family | 372 (42.3%) | 1.10 |
| Total Households | 879 (100.0%) | 2.37 |
Household Size by Marriage Status in Sumner
Out of a total of 879 households in Sumner, 507 (57.7%) are family households, while 372 (42.3%) are nonfamily households. The most numerous type of family households are 2-person households, comprising 277, and the most common type of nonfamily households are 1-person households, comprising 347.
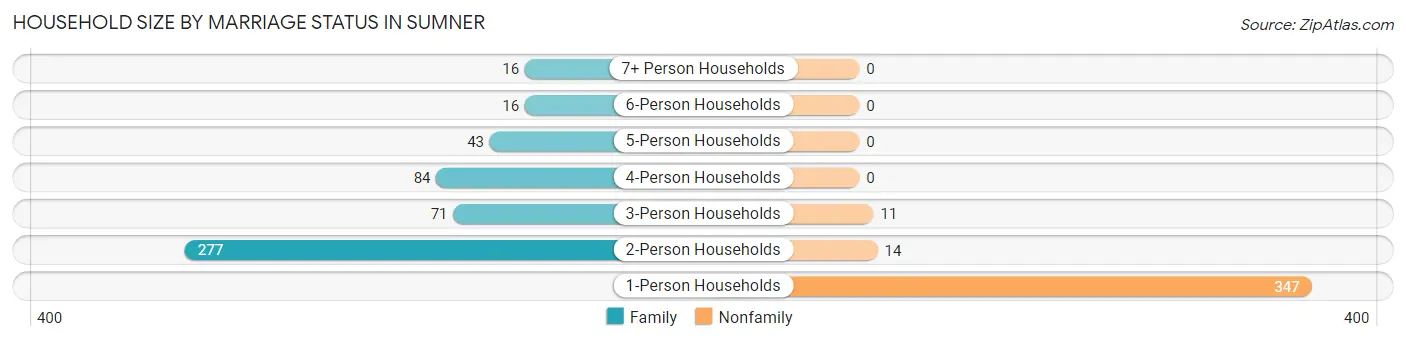
| Household Size | Family Households | Nonfamily Households |
| 1-Person Households | - | 347 (39.5%) |
| 2-Person Households | 277 (31.5%) | 14 (1.6%) |
| 3-Person Households | 71 (8.1%) | 11 (1.3%) |
| 4-Person Households | 84 (9.6%) | 0 (0.0%) |
| 5-Person Households | 43 (4.9%) | 0 (0.0%) |
| 6-Person Households | 16 (1.8%) | 0 (0.0%) |
| 7+ Person Households | 16 (1.8%) | 0 (0.0%) |
| Total | 507 (57.7%) | 372 (42.3%) |
Female Fertility in Sumner
Fertility by Age in Sumner
Average fertility rate in Sumner is 24.0 births per 1,000 women. Women in the age bracket of 35 to 50 years have the highest fertility rate with 40.0 births per 1,000 women. Women in the age bracket of 35 to 50 years acount for 100.0% of all women with births.
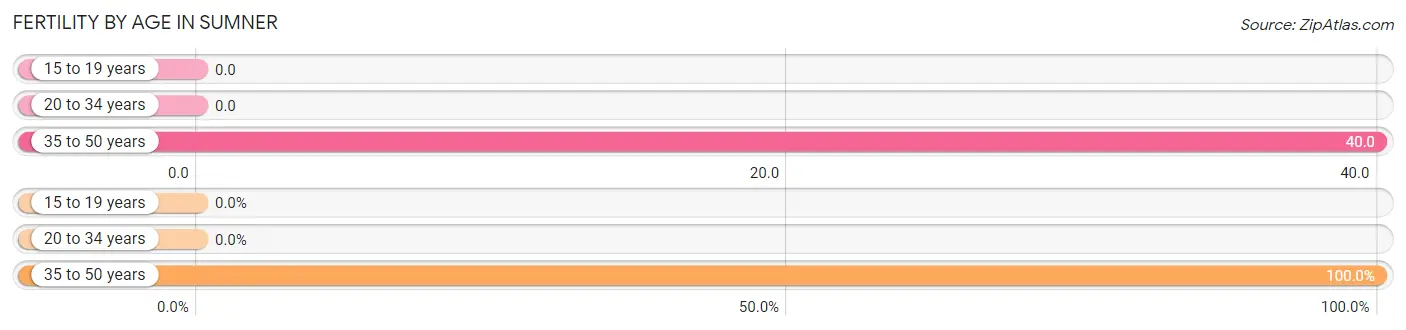
| Age Bracket | Women with Births | Births / 1,000 Women |
| 15 to 19 years | 0 (0.0%) | 0.0 |
| 20 to 34 years | 0 (0.0%) | 0.0 |
| 35 to 50 years | 10 (100.0%) | 40.0 |
| Total | 10 (100.0%) | 24.0 |
Fertility by Age by Marriage Status in Sumner
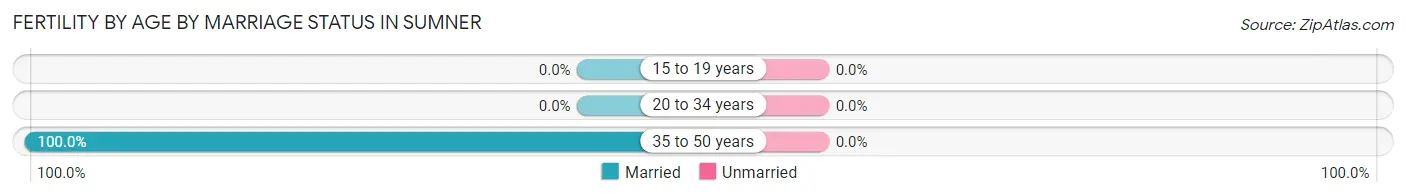
| Age Bracket | Married | Unmarried |
| 15 to 19 years | 0 (0.0%) | 0 (0.0%) |
| 20 to 34 years | 0 (0.0%) | 0 (0.0%) |
| 35 to 50 years | 10 (100.0%) | 0 (0.0%) |
| Total | 10 (100.0%) | 0 (0.0%) |
Fertility by Education in Sumner
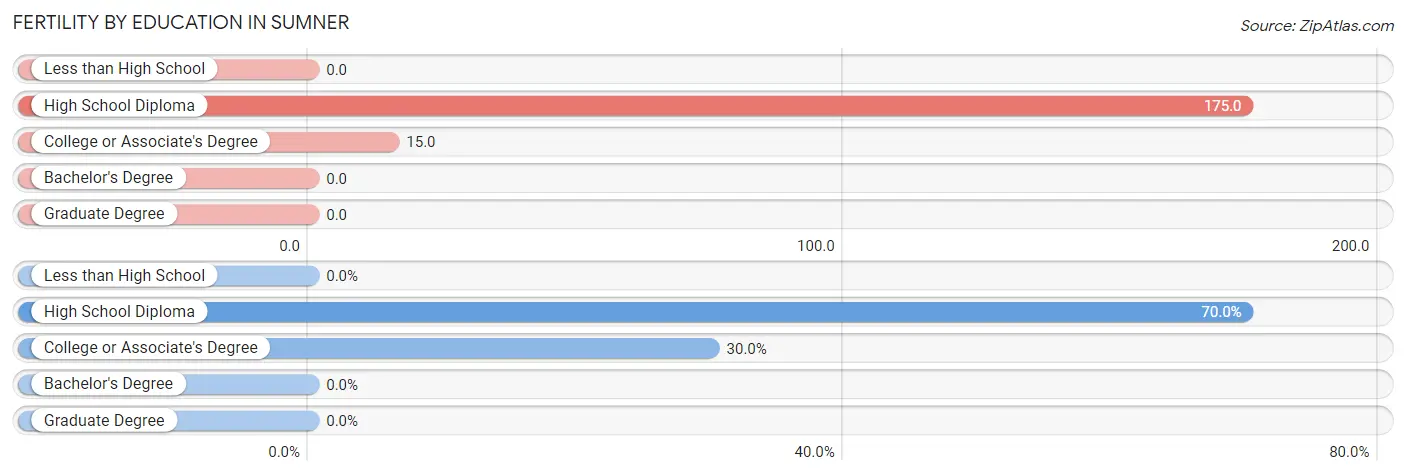
| Educational Attainment | Women with Births | Births / 1,000 Women |
| Less than High School | 0 (0.0%) | 0.0 |
| High School Diploma | 7 (70.0%) | 175.0 |
| College or Associate's Degree | 3 (30.0%) | 15.0 |
| Bachelor's Degree | 0 (0.0%) | 0.0 |
| Graduate Degree | 0 (0.0%) | 0.0 |
| Total | 10 (100.0%) | 24.0 |
Fertility by Education by Marriage Status in Sumner
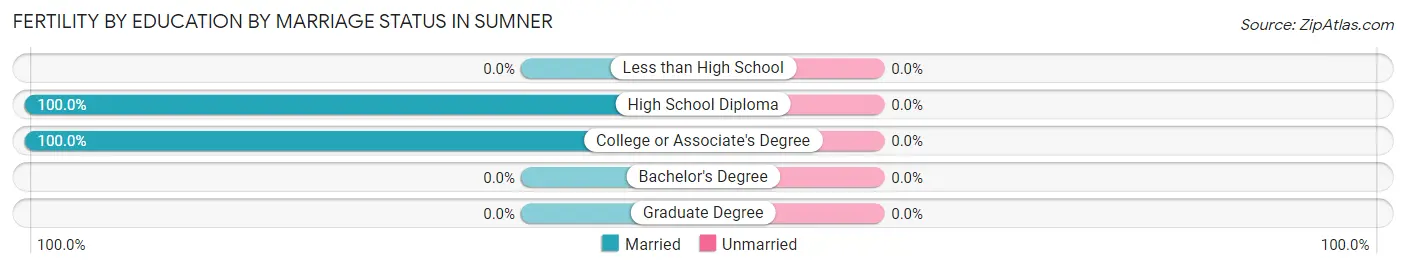
| Educational Attainment | Married | Unmarried |
| Less than High School | 0 (0.0%) | 0 (0.0%) |
| High School Diploma | 7 (100.0%) | 0 (0.0%) |
| College or Associate's Degree | 3 (100.0%) | 0 (0.0%) |
| Bachelor's Degree | 0 (0.0%) | 0 (0.0%) |
| Graduate Degree | 0 (0.0%) | 0 (0.0%) |
| Total | 10 (100.0%) | 0 (0.0%) |
Employment Characteristics in Sumner
Employment by Class of Employer in Sumner
Among the 1,015 employed individuals in Sumner, private company employees (694 | 68.4%), not-for-profit organizations (142 | 14.0%), and local government employees (84 | 8.3%) make up the most common classes of employment.
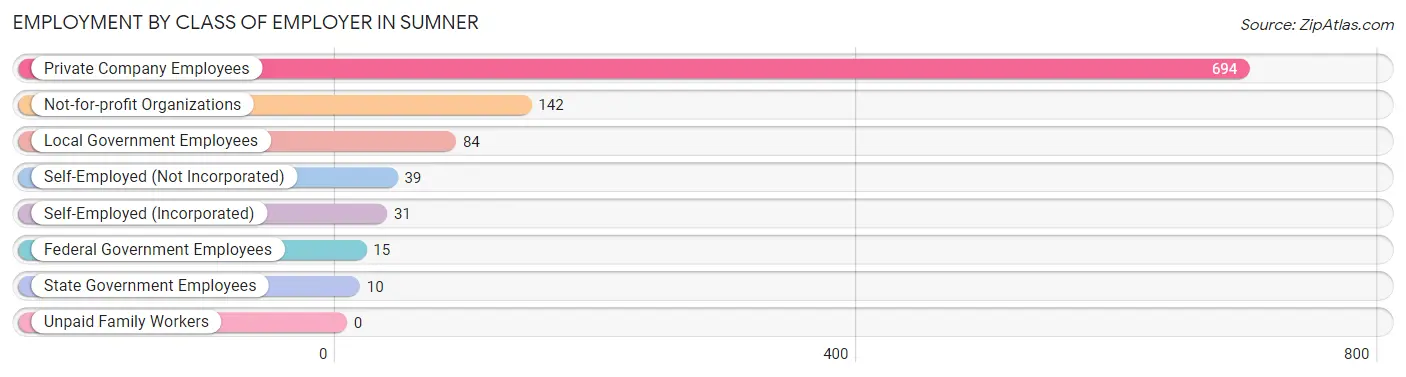
| Employer Class | # Employees | % Employees |
| Private Company Employees | 694 | 68.4% |
| Self-Employed (Incorporated) | 31 | 3.0% |
| Self-Employed (Not Incorporated) | 39 | 3.8% |
| Not-for-profit Organizations | 142 | 14.0% |
| Local Government Employees | 84 | 8.3% |
| State Government Employees | 10 | 1.0% |
| Federal Government Employees | 15 | 1.5% |
| Unpaid Family Workers | 0 | 0.0% |
| Total | 1,015 | 100.0% |
Employment Status by Age in Sumner
According to the labor force statistics for Sumner, out of the total population over 16 years of age (1,714), 61.5% or 1,054 individuals are in the labor force, with 3.1% or 33 of them unemployed. The age group with the highest labor force participation rate is 20 to 24 years, with 100.0% or 93 individuals in the labor force. Within the labor force, the 55 to 59 years age range has the highest percentage of unemployed individuals, with 9.5% or 13 of them being unemployed.
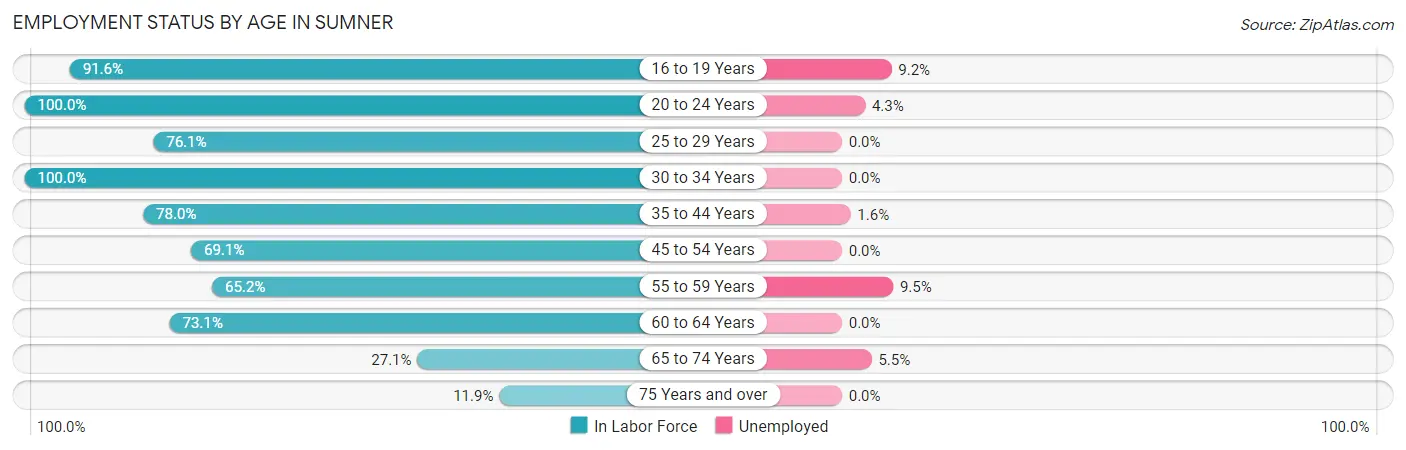
| Age Bracket | In Labor Force | Unemployed |
| 16 to 19 Years | 87 (91.6%) | 8 (9.2%) |
| 20 to 24 Years | 93 (100.0%) | 4 (4.3%) |
| 25 to 29 Years | 35 (76.1%) | 0 (0.0%) |
| 30 to 34 Years | 89 (100.0%) | 0 (0.0%) |
| 35 to 44 Years | 244 (78.0%) | 4 (1.6%) |
| 45 to 54 Years | 215 (69.1%) | 0 (0.0%) |
| 55 to 59 Years | 137 (65.2%) | 13 (9.5%) |
| 60 to 64 Years | 68 (73.1%) | 0 (0.0%) |
| 65 to 74 Years | 55 (27.1%) | 3 (5.5%) |
| 75 Years and over | 31 (11.9%) | 0 (0.0%) |
| Total | 1,054 (61.5%) | 33 (3.1%) |
Employment Status by Educational Attainment in Sumner
According to labor force statistics for Sumner, 74.2% of individuals (788) out of the total population between 25 and 64 years of age (1,062) are in the labor force, with 2.2% or 17 of them being unemployed. The group with the highest labor force participation rate are those with the educational attainment of bachelor's degree or higher, with 80.1% or 217 individuals in the labor force. Within the labor force, individuals with college / associate degree education have the highest percentage of unemployment, with 5.3% or 17 of them being unemployed.
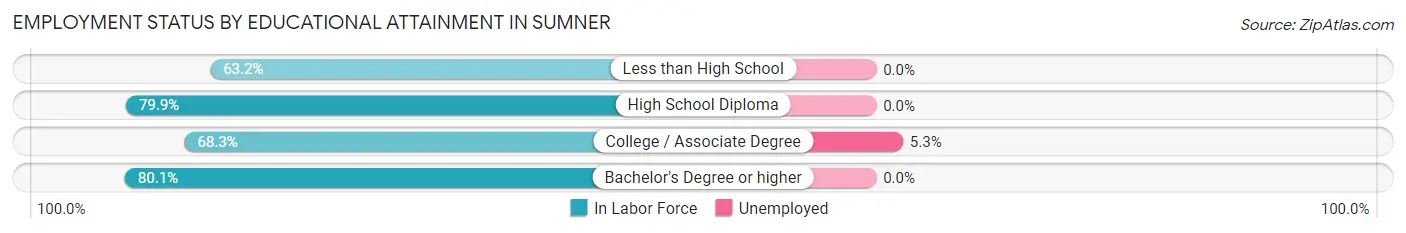
| Educational Attainment | In Labor Force | Unemployed |
| Less than High School | 24 (63.2%) | 0 (0.0%) |
| High School Diploma | 226 (79.9%) | 0 (0.0%) |
| College / Associate Degree | 321 (68.3%) | 25 (5.3%) |
| Bachelor's Degree or higher | 217 (80.1%) | 0 (0.0%) |
| Total | 788 (74.2%) | 23 (2.2%) |
Employment Occupations by Sex in Sumner
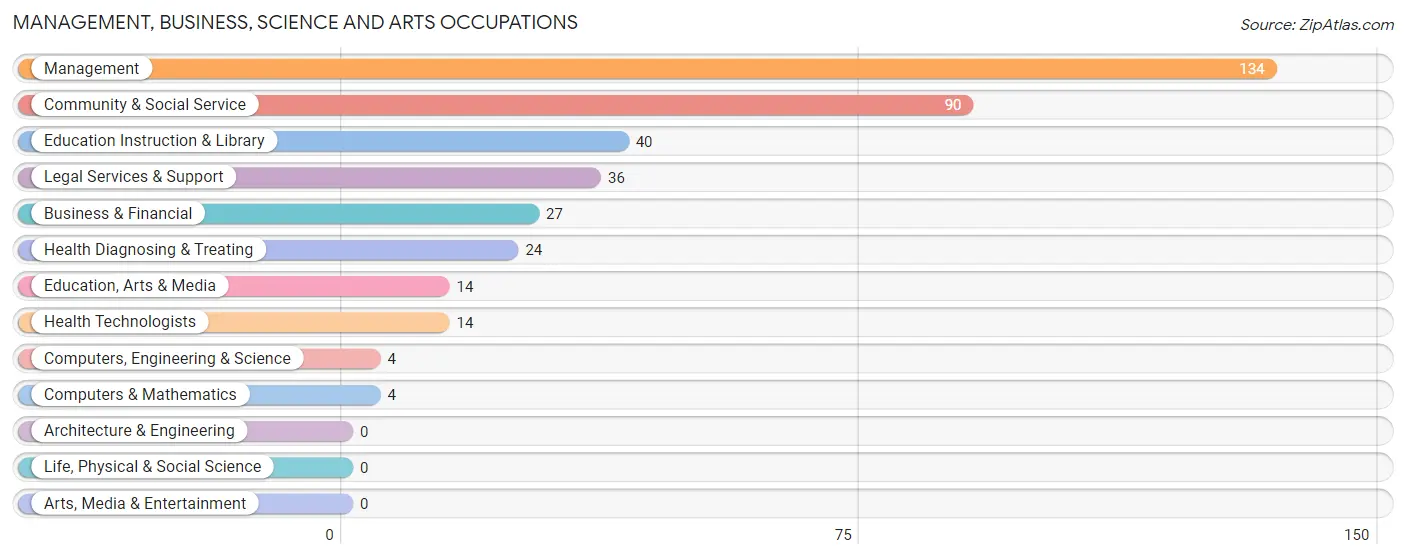
Management, Business, Science and Arts Occupations
The most common Management, Business, Science and Arts occupations in Sumner are Management (134 | 13.3%), Community & Social Service (90 | 8.9%), Education Instruction & Library (40 | 4.0%), Legal Services & Support (36 | 3.6%), and Business & Financial (27 | 2.7%).
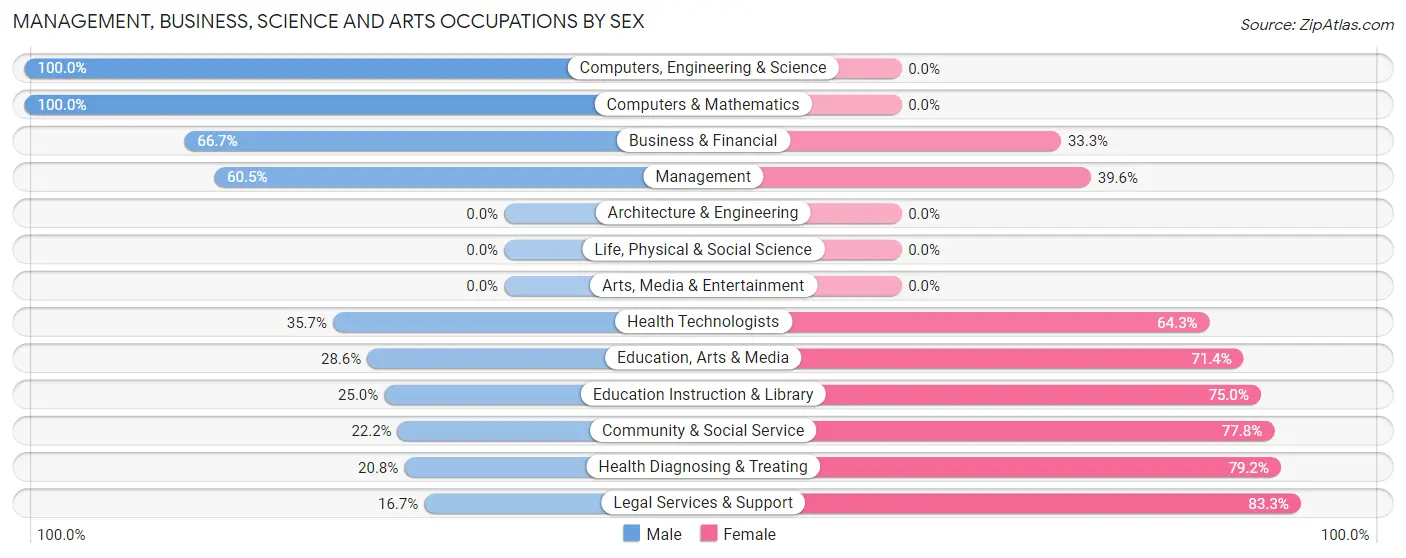
Management, Business, Science and Arts Occupations by Sex
Within the Management, Business, Science and Arts occupations in Sumner, the most male-oriented occupations are Computers, Engineering & Science (100.0%), Computers & Mathematics (100.0%), and Business & Financial (66.7%), while the most female-oriented occupations are Legal Services & Support (83.3%), Health Diagnosing & Treating (79.2%), and Community & Social Service (77.8%).
| Occupation | Male | Female |
| Management | 81 (60.5%) | 53 (39.6%) |
| Business & Financial | 18 (66.7%) | 9 (33.3%) |
| Computers, Engineering & Science | 4 (100.0%) | 0 (0.0%) |
| Computers & Mathematics | 4 (100.0%) | 0 (0.0%) |
| Architecture & Engineering | 0 (0.0%) | 0 (0.0%) |
| Life, Physical & Social Science | 0 (0.0%) | 0 (0.0%) |
| Community & Social Service | 20 (22.2%) | 70 (77.8%) |
| Education, Arts & Media | 4 (28.6%) | 10 (71.4%) |
| Legal Services & Support | 6 (16.7%) | 30 (83.3%) |
| Education Instruction & Library | 10 (25.0%) | 30 (75.0%) |
| Arts, Media & Entertainment | 0 (0.0%) | 0 (0.0%) |
| Health Diagnosing & Treating | 5 (20.8%) | 19 (79.2%) |
| Health Technologists | 5 (35.7%) | 9 (64.3%) |
| Total (Category) | 128 (45.9%) | 151 (54.1%) |
| Total (Overall) | 528 (52.2%) | 483 (47.8%) |
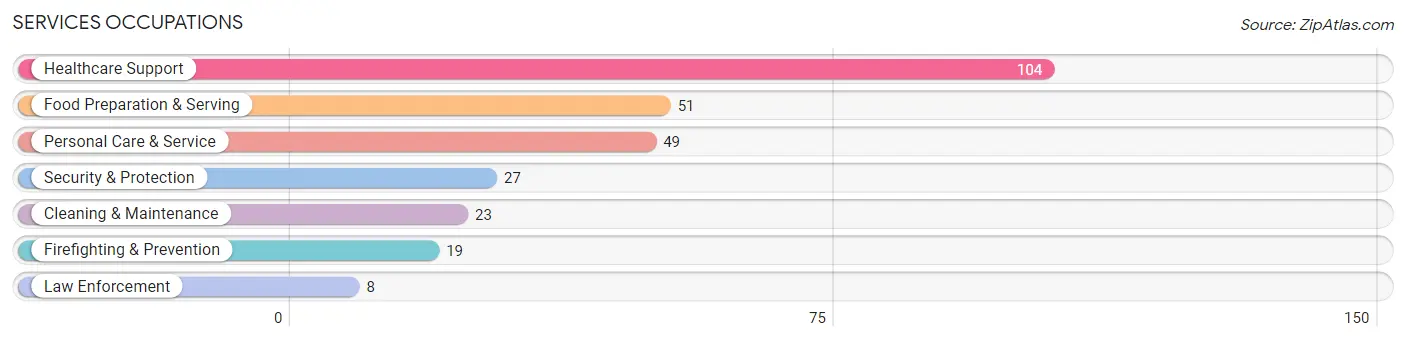
Services Occupations
The most common Services occupations in Sumner are Healthcare Support (104 | 10.3%), Food Preparation & Serving (51 | 5.0%), Personal Care & Service (49 | 4.9%), Security & Protection (27 | 2.7%), and Cleaning & Maintenance (23 | 2.3%).
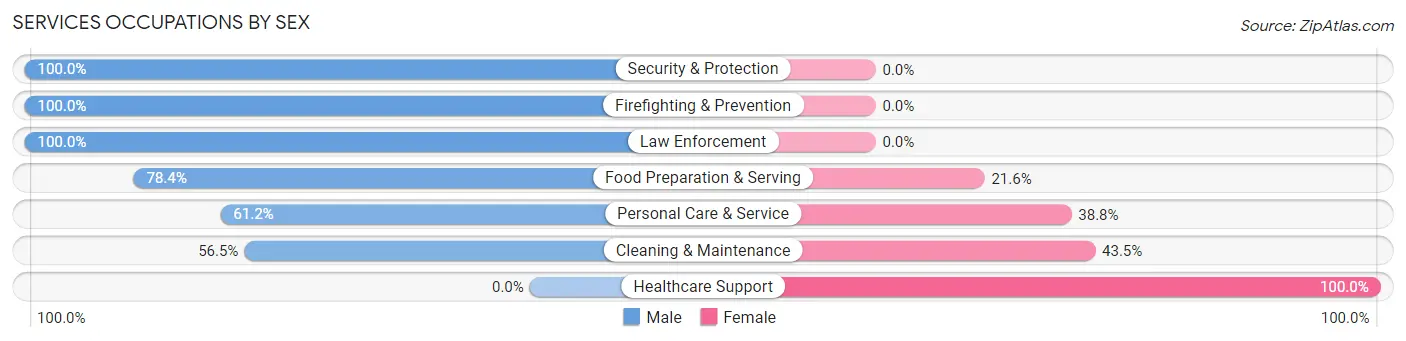
Services Occupations by Sex
Within the Services occupations in Sumner, the most male-oriented occupations are Security & Protection (100.0%), Firefighting & Prevention (100.0%), and Law Enforcement (100.0%), while the most female-oriented occupations are Healthcare Support (100.0%), Cleaning & Maintenance (43.5%), and Personal Care & Service (38.8%).
| Occupation | Male | Female |
| Healthcare Support | 0 (0.0%) | 104 (100.0%) |
| Security & Protection | 27 (100.0%) | 0 (0.0%) |
| Firefighting & Prevention | 19 (100.0%) | 0 (0.0%) |
| Law Enforcement | 8 (100.0%) | 0 (0.0%) |
| Food Preparation & Serving | 40 (78.4%) | 11 (21.6%) |
| Cleaning & Maintenance | 13 (56.5%) | 10 (43.5%) |
| Personal Care & Service | 30 (61.2%) | 19 (38.8%) |
| Total (Category) | 110 (43.3%) | 144 (56.7%) |
| Total (Overall) | 528 (52.2%) | 483 (47.8%) |
Sales and Office Occupations
The most common Sales and Office occupations in Sumner are Office & Administration (135 | 13.4%), and Sales & Related (88 | 8.7%).
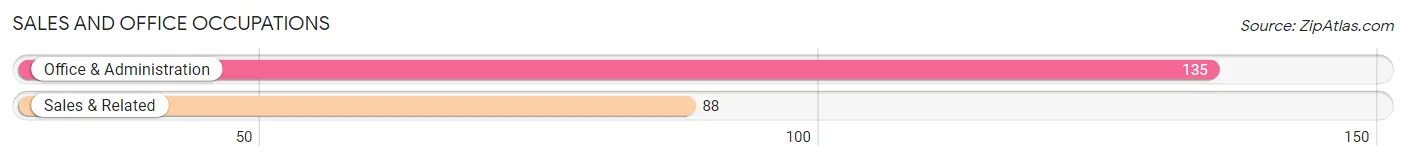
Sales and Office Occupations by Sex
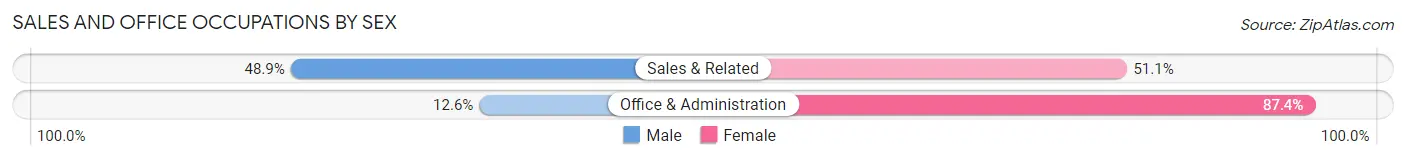
| Occupation | Male | Female |
| Sales & Related | 43 (48.9%) | 45 (51.1%) |
| Office & Administration | 17 (12.6%) | 118 (87.4%) |
| Total (Category) | 60 (26.9%) | 163 (73.1%) |
| Total (Overall) | 528 (52.2%) | 483 (47.8%) |
Natural Resources, Construction and Maintenance Occupations
The most common Natural Resources, Construction and Maintenance occupations in Sumner are Construction & Extraction (50 | 5.0%), and Installation, Maintenance & Repair (43 | 4.3%).
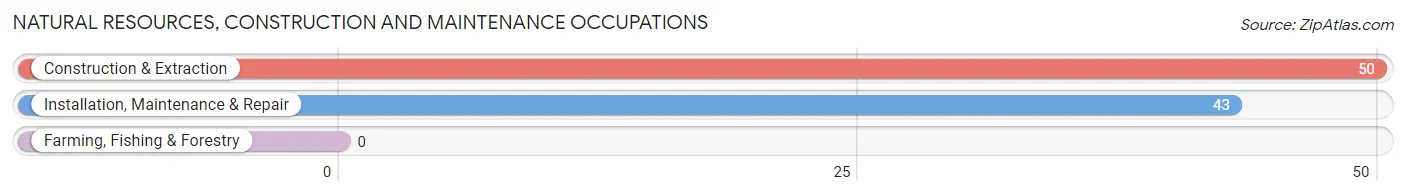
Natural Resources, Construction and Maintenance Occupations by Sex
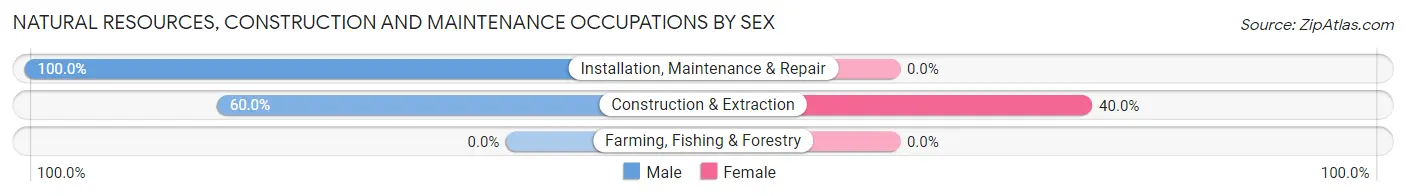
| Occupation | Male | Female |
| Farming, Fishing & Forestry | 0 (0.0%) | 0 (0.0%) |
| Construction & Extraction | 30 (60.0%) | 20 (40.0%) |
| Installation, Maintenance & Repair | 43 (100.0%) | 0 (0.0%) |
| Total (Category) | 73 (78.5%) | 20 (21.5%) |
| Total (Overall) | 528 (52.2%) | 483 (47.8%) |
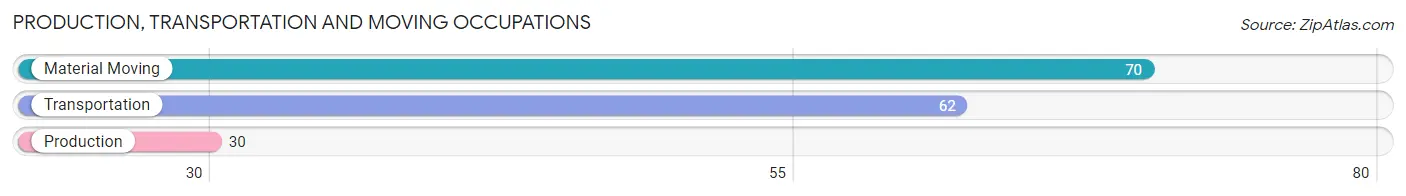
Production, Transportation and Moving Occupations
The most common Production, Transportation and Moving occupations in Sumner are Material Moving (70 | 6.9%), Transportation (62 | 6.1%), and Production (30 | 3.0%).
Production, Transportation and Moving Occupations by Sex
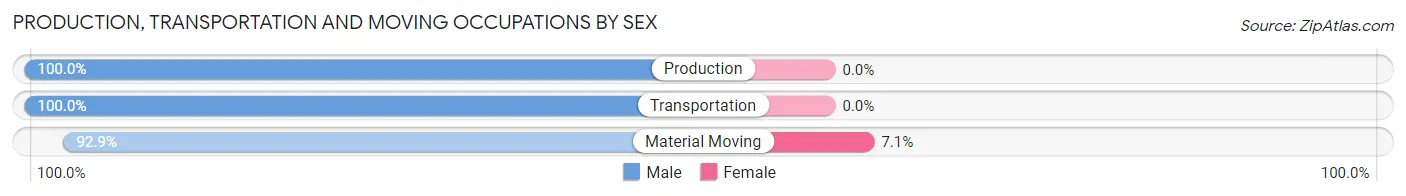
| Occupation | Male | Female |
| Production | 30 (100.0%) | 0 (0.0%) |
| Transportation | 62 (100.0%) | 0 (0.0%) |
| Material Moving | 65 (92.9%) | 5 (7.1%) |
| Total (Category) | 157 (96.9%) | 5 (3.1%) |
| Total (Overall) | 528 (52.2%) | 483 (47.8%) |
Employment Industries by Sex in Sumner
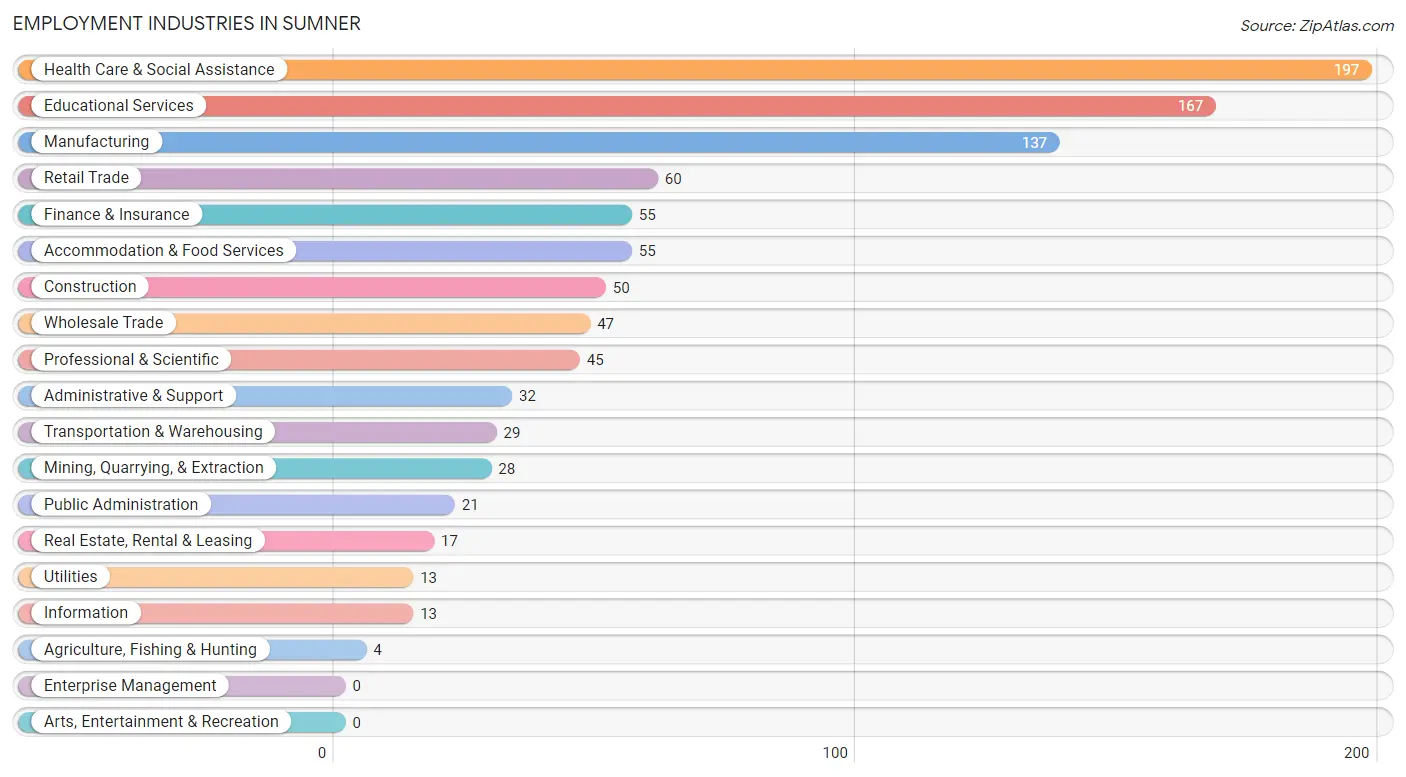
Employment Industries in Sumner
The major employment industries in Sumner include Health Care & Social Assistance (197 | 19.5%), Educational Services (167 | 16.5%), Manufacturing (137 | 13.6%), Retail Trade (60 | 5.9%), and Finance & Insurance (55 | 5.4%).
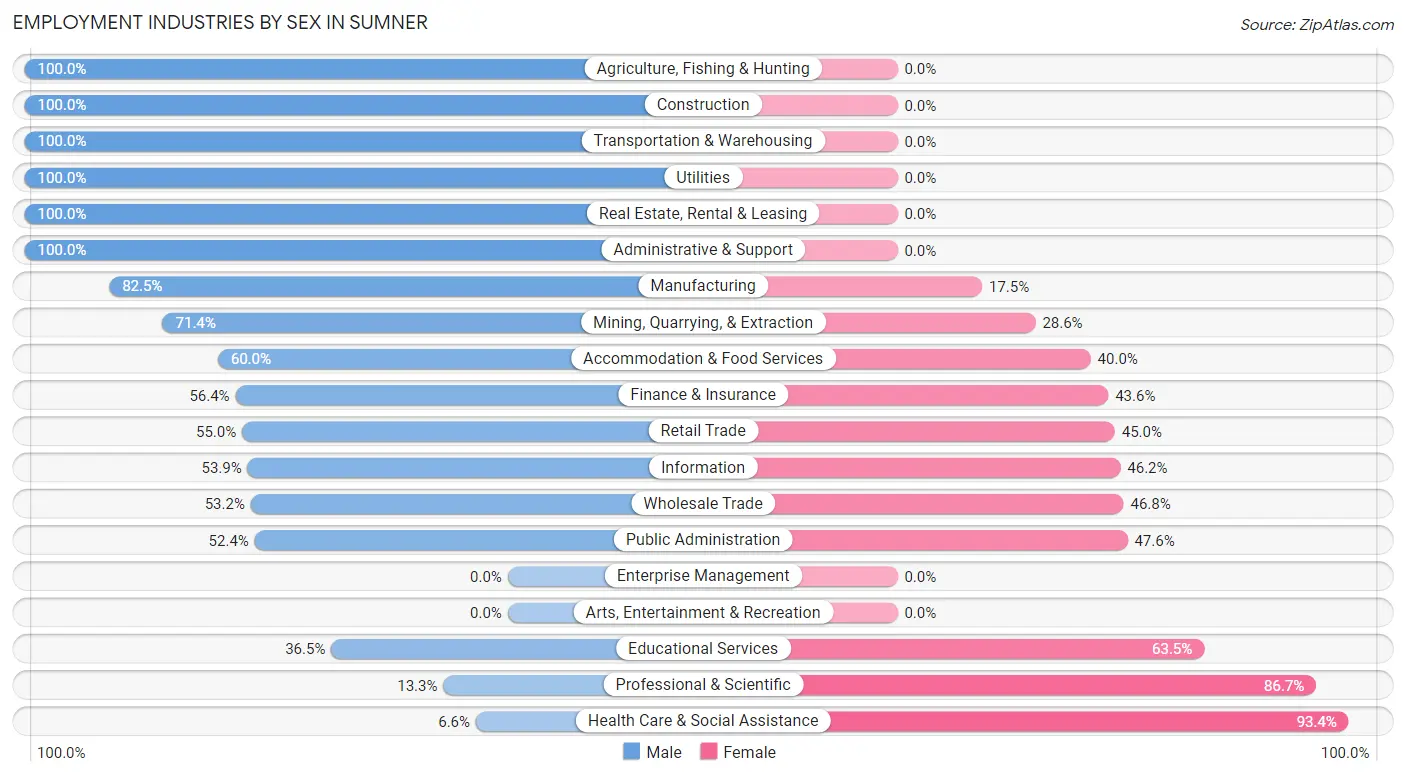
Employment Industries by Sex in Sumner
The Sumner industries that see more men than women are Agriculture, Fishing & Hunting (100.0%), Construction (100.0%), and Transportation & Warehousing (100.0%), whereas the industries that tend to have a higher number of women are Health Care & Social Assistance (93.4%), Professional & Scientific (86.7%), and Educational Services (63.5%).
| Industry | Male | Female |
| Agriculture, Fishing & Hunting | 4 (100.0%) | 0 (0.0%) |
| Mining, Quarrying, & Extraction | 20 (71.4%) | 8 (28.6%) |
| Construction | 50 (100.0%) | 0 (0.0%) |
| Manufacturing | 113 (82.5%) | 24 (17.5%) |
| Wholesale Trade | 25 (53.2%) | 22 (46.8%) |
| Retail Trade | 33 (55.0%) | 27 (45.0%) |
| Transportation & Warehousing | 29 (100.0%) | 0 (0.0%) |
| Utilities | 13 (100.0%) | 0 (0.0%) |
| Information | 7 (53.8%) | 6 (46.2%) |
| Finance & Insurance | 31 (56.4%) | 24 (43.6%) |
| Real Estate, Rental & Leasing | 17 (100.0%) | 0 (0.0%) |
| Professional & Scientific | 6 (13.3%) | 39 (86.7%) |
| Enterprise Management | 0 (0.0%) | 0 (0.0%) |
| Administrative & Support | 32 (100.0%) | 0 (0.0%) |
| Educational Services | 61 (36.5%) | 106 (63.5%) |
| Health Care & Social Assistance | 13 (6.6%) | 184 (93.4%) |
| Arts, Entertainment & Recreation | 0 (0.0%) | 0 (0.0%) |
| Accommodation & Food Services | 33 (60.0%) | 22 (40.0%) |
| Public Administration | 11 (52.4%) | 10 (47.6%) |
| Total | 528 (52.2%) | 483 (47.8%) |
Education in Sumner
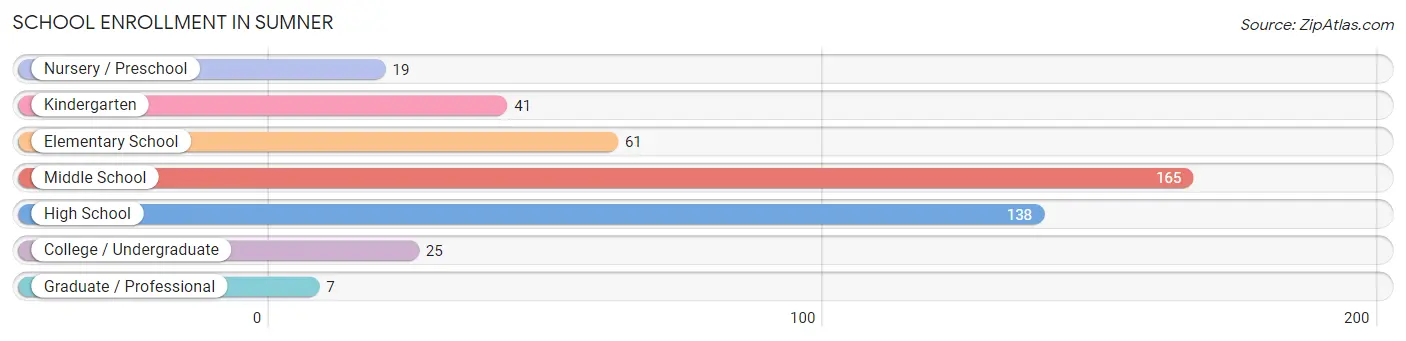
School Enrollment in Sumner
The most common levels of schooling among the 456 students in Sumner are middle school (165 | 36.2%), high school (138 | 30.3%), and elementary school (61 | 13.4%).
| School Level | # Students | % Students |
| Nursery / Preschool | 19 | 4.2% |
| Kindergarten | 41 | 9.0% |
| Elementary School | 61 | 13.4% |
| Middle School | 165 | 36.2% |
| High School | 138 | 30.3% |
| College / Undergraduate | 25 | 5.5% |
| Graduate / Professional | 7 | 1.5% |
| Total | 456 | 100.0% |
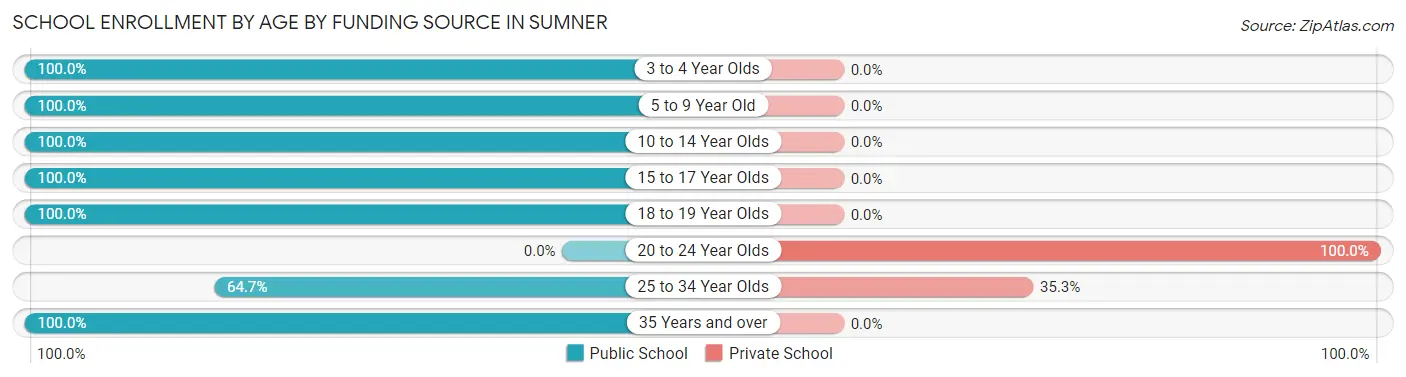
School Enrollment by Age by Funding Source in Sumner
Out of a total of 456 students who are enrolled in schools in Sumner, 7 (1.5%) attend a private institution, while the remaining 449 (98.5%) are enrolled in public schools. The age group of 20 to 24 year olds has the highest likelihood of being enrolled in private schools, with 1 (100.0% in the age bracket) enrolled. Conversely, the age group of 3 to 4 year olds has the lowest likelihood of being enrolled in a private school, with 13 (100.0% in the age bracket) attending a public institution.
| Age Bracket | Public School | Private School |
| 3 to 4 Year Olds | 13 (100.0%) | 0 (0.0%) |
| 5 to 9 Year Old | 108 (100.0%) | 0 (0.0%) |
| 10 to 14 Year Olds | 170 (100.0%) | 0 (0.0%) |
| 15 to 17 Year Olds | 93 (100.0%) | 0 (0.0%) |
| 18 to 19 Year Olds | 40 (100.0%) | 0 (0.0%) |
| 20 to 24 Year Olds | 0 (0.0%) | 1 (100.0%) |
| 25 to 34 Year Olds | 11 (64.7%) | 6 (35.3%) |
| 35 Years and over | 14 (100.0%) | 0 (0.0%) |
| Total | 449 (98.5%) | 7 (1.5%) |
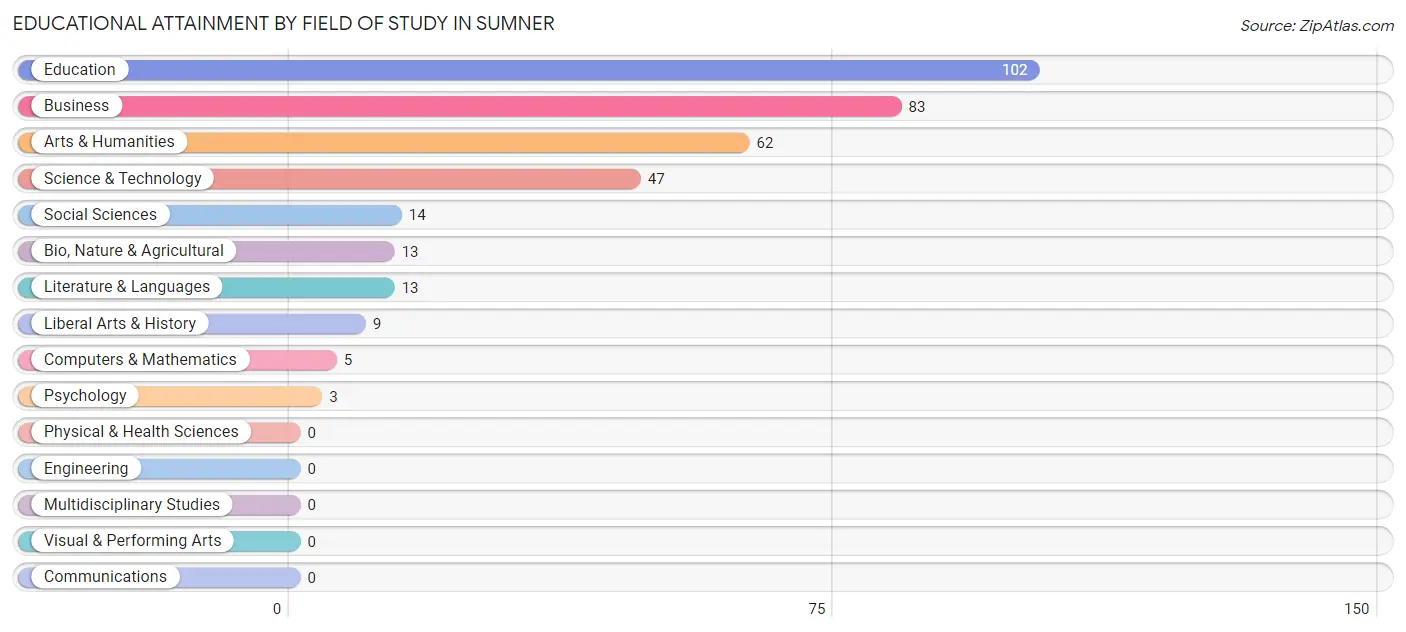
Educational Attainment by Field of Study in Sumner
Education (102 | 29.1%), business (83 | 23.6%), arts & humanities (62 | 17.7%), science & technology (47 | 13.4%), and social sciences (14 | 4.0%) are the most common fields of study among 351 individuals in Sumner who have obtained a bachelor's degree or higher.
| Field of Study | # Graduates | % Graduates |
| Computers & Mathematics | 5 | 1.4% |
| Bio, Nature & Agricultural | 13 | 3.7% |
| Physical & Health Sciences | 0 | 0.0% |
| Psychology | 3 | 0.9% |
| Social Sciences | 14 | 4.0% |
| Engineering | 0 | 0.0% |
| Multidisciplinary Studies | 0 | 0.0% |
| Science & Technology | 47 | 13.4% |
| Business | 83 | 23.6% |
| Education | 102 | 29.1% |
| Literature & Languages | 13 | 3.7% |
| Liberal Arts & History | 9 | 2.6% |
| Visual & Performing Arts | 0 | 0.0% |
| Communications | 0 | 0.0% |
| Arts & Humanities | 62 | 17.7% |
| Total | 351 | 100.0% |
Transportation & Commute in Sumner
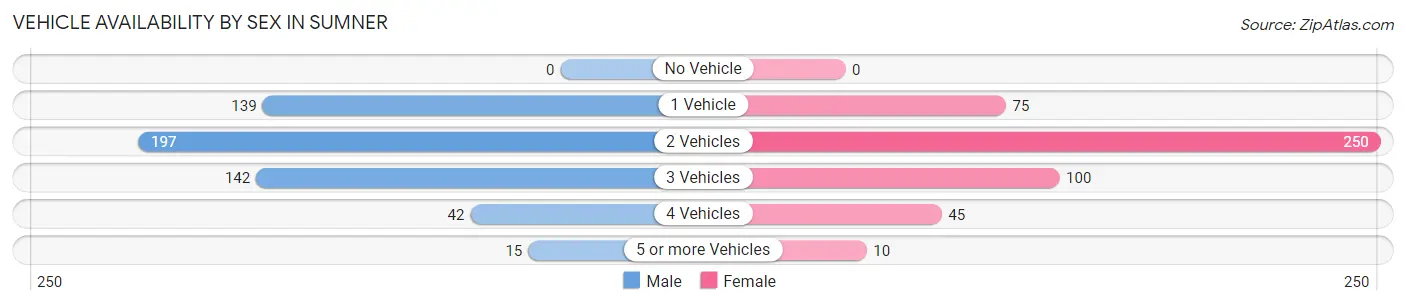
Vehicle Availability by Sex in Sumner
The most prevalent vehicle ownership categories in Sumner are males with 2 vehicles (197, accounting for 36.8%) and females with 2 vehicles (250, making up 41.0%).
| Vehicles Available | Male | Female |
| No Vehicle | 0 (0.0%) | 0 (0.0%) |
| 1 Vehicle | 139 (26.0%) | 75 (15.6%) |
| 2 Vehicles | 197 (36.8%) | 250 (52.1%) |
| 3 Vehicles | 142 (26.5%) | 100 (20.8%) |
| 4 Vehicles | 42 (7.9%) | 45 (9.4%) |
| 5 or more Vehicles | 15 (2.8%) | 10 (2.1%) |
| Total | 535 (100.0%) | 480 (100.0%) |
Commute Time in Sumner
The most frequently occuring commute durations in Sumner are 5 to 9 minutes (346 commuters, 36.0%), less than 5 minutes (179 commuters, 18.6%), and 20 to 24 minutes (115 commuters, 11.9%).
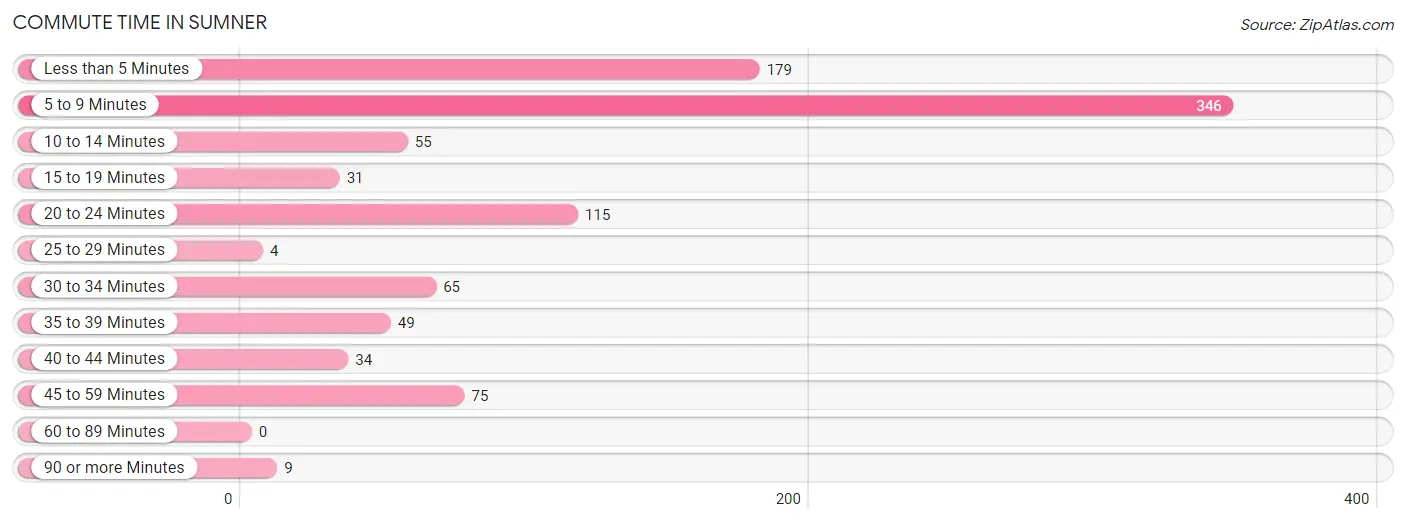
| Commute Time | # Commuters | % Commuters |
| Less than 5 Minutes | 179 | 18.6% |
| 5 to 9 Minutes | 346 | 36.0% |
| 10 to 14 Minutes | 55 | 5.7% |
| 15 to 19 Minutes | 31 | 3.2% |
| 20 to 24 Minutes | 115 | 11.9% |
| 25 to 29 Minutes | 4 | 0.4% |
| 30 to 34 Minutes | 65 | 6.8% |
| 35 to 39 Minutes | 49 | 5.1% |
| 40 to 44 Minutes | 34 | 3.5% |
| 45 to 59 Minutes | 75 | 7.8% |
| 60 to 89 Minutes | 0 | 0.0% |
| 90 or more Minutes | 9 | 0.9% |
Commute Time by Sex in Sumner
The most common commute times in Sumner are 5 to 9 minutes (194 commuters, 37.2%) for males and 5 to 9 minutes (152 commuters, 34.5%) for females.
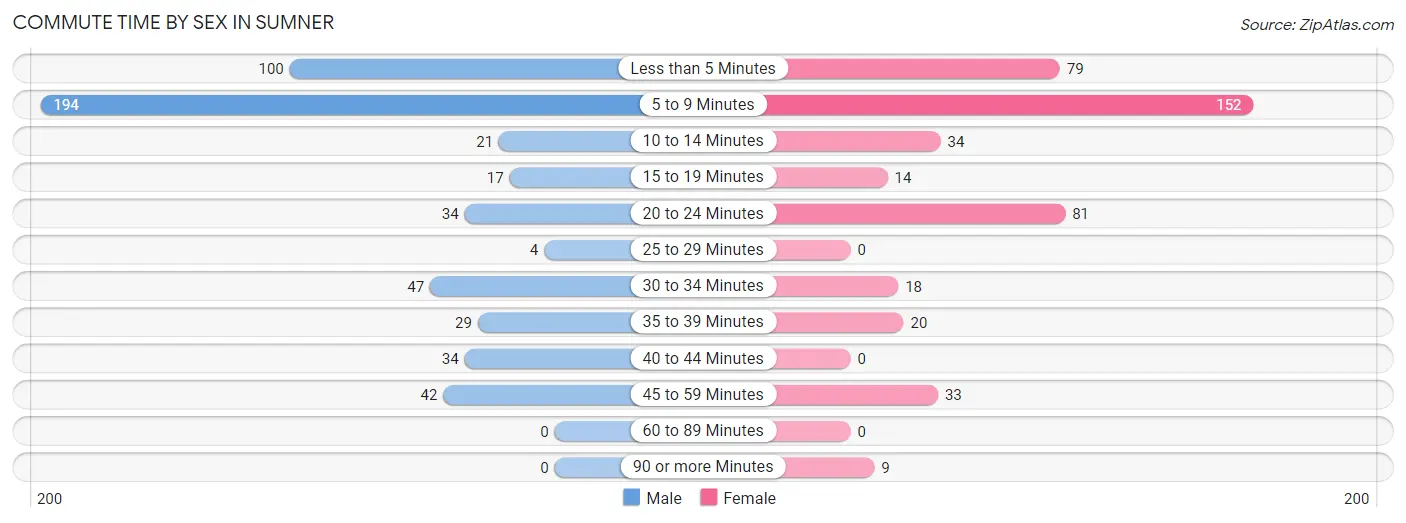
| Commute Time | Male | Female |
| Less than 5 Minutes | 100 (19.2%) | 79 (17.9%) |
| 5 to 9 Minutes | 194 (37.2%) | 152 (34.5%) |
| 10 to 14 Minutes | 21 (4.0%) | 34 (7.7%) |
| 15 to 19 Minutes | 17 (3.3%) | 14 (3.2%) |
| 20 to 24 Minutes | 34 (6.5%) | 81 (18.4%) |
| 25 to 29 Minutes | 4 (0.8%) | 0 (0.0%) |
| 30 to 34 Minutes | 47 (9.0%) | 18 (4.1%) |
| 35 to 39 Minutes | 29 (5.6%) | 20 (4.5%) |
| 40 to 44 Minutes | 34 (6.5%) | 0 (0.0%) |
| 45 to 59 Minutes | 42 (8.1%) | 33 (7.5%) |
| 60 to 89 Minutes | 0 (0.0%) | 0 (0.0%) |
| 90 or more Minutes | 0 (0.0%) | 9 (2.1%) |
Time of Departure to Work by Sex in Sumner
The most frequent times of departure to work in Sumner are 5:30 AM to 5:59 AM (150, 28.7%) for males and 7:30 AM to 7:59 AM (110, 25.0%) for females.
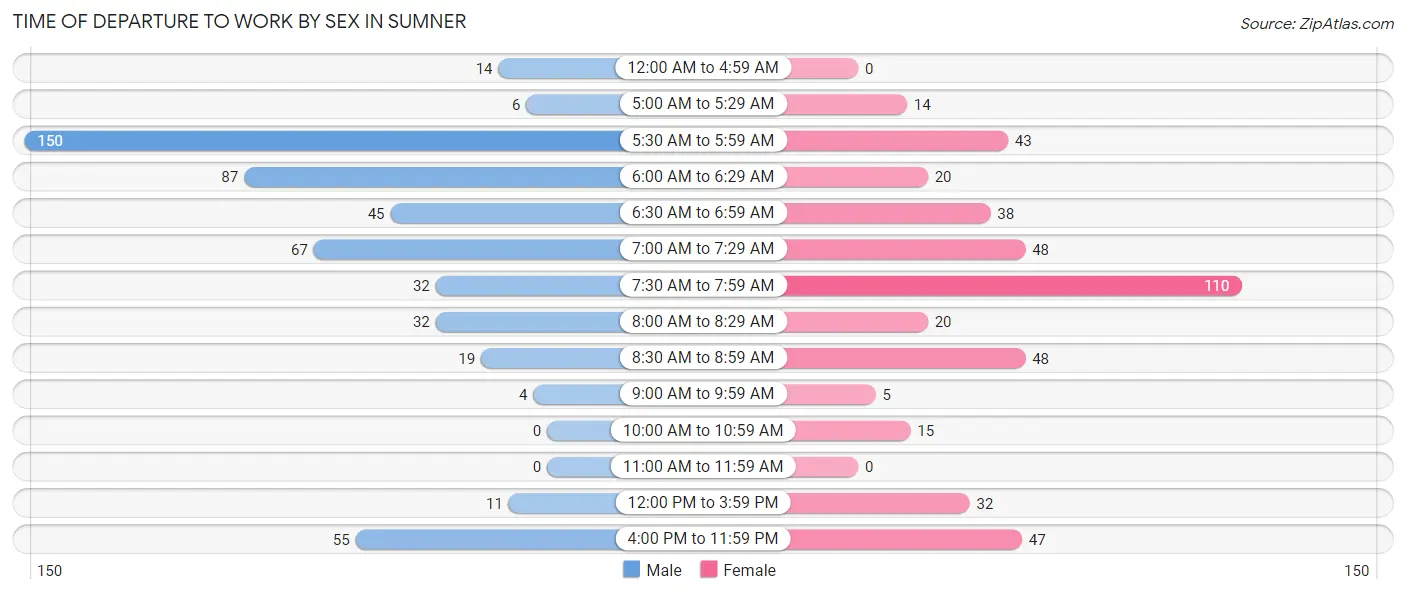
| Time of Departure | Male | Female |
| 12:00 AM to 4:59 AM | 14 (2.7%) | 0 (0.0%) |
| 5:00 AM to 5:29 AM | 6 (1.1%) | 14 (3.2%) |
| 5:30 AM to 5:59 AM | 150 (28.7%) | 43 (9.8%) |
| 6:00 AM to 6:29 AM | 87 (16.7%) | 20 (4.5%) |
| 6:30 AM to 6:59 AM | 45 (8.6%) | 38 (8.6%) |
| 7:00 AM to 7:29 AM | 67 (12.8%) | 48 (10.9%) |
| 7:30 AM to 7:59 AM | 32 (6.1%) | 110 (25.0%) |
| 8:00 AM to 8:29 AM | 32 (6.1%) | 20 (4.5%) |
| 8:30 AM to 8:59 AM | 19 (3.6%) | 48 (10.9%) |
| 9:00 AM to 9:59 AM | 4 (0.8%) | 5 (1.1%) |
| 10:00 AM to 10:59 AM | 0 (0.0%) | 15 (3.4%) |
| 11:00 AM to 11:59 AM | 0 (0.0%) | 0 (0.0%) |
| 12:00 PM to 3:59 PM | 11 (2.1%) | 32 (7.3%) |
| 4:00 PM to 11:59 PM | 55 (10.5%) | 47 (10.7%) |
| Total | 522 (100.0%) | 440 (100.0%) |
Housing Occupancy in Sumner
Occupancy by Ownership in Sumner
Of the total 879 dwellings in Sumner, owner-occupied units account for 659 (75.0%), while renter-occupied units make up 220 (25.0%).
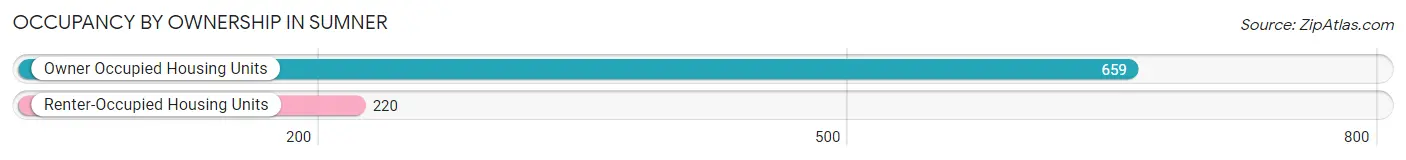
| Occupancy | # Housing Units | % Housing Units |
| Owner Occupied Housing Units | 659 | 75.0% |
| Renter-Occupied Housing Units | 220 | 25.0% |
| Total Occupied Housing Units | 879 | 100.0% |
Occupancy by Household Size in Sumner
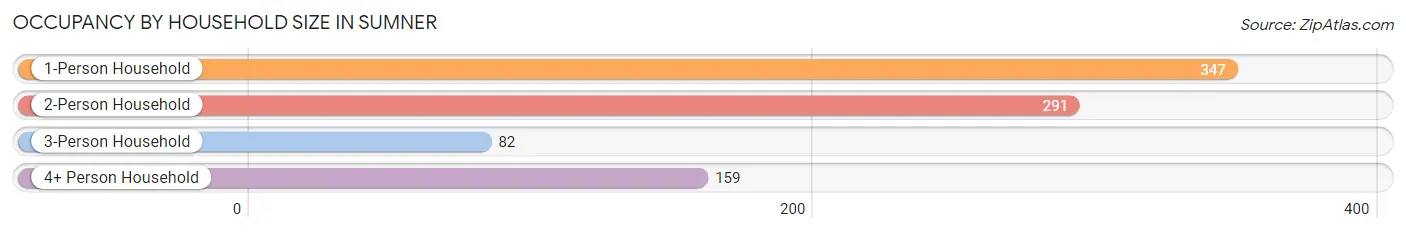
| Household Size | # Housing Units | % Housing Units |
| 1-Person Household | 347 | 39.5% |
| 2-Person Household | 291 | 33.1% |
| 3-Person Household | 82 | 9.3% |
| 4+ Person Household | 159 | 18.1% |
| Total Housing Units | 879 | 100.0% |
Occupancy by Ownership by Household Size in Sumner
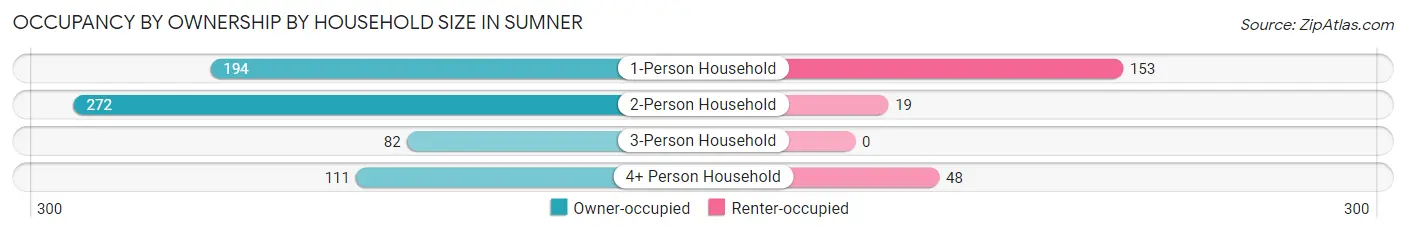
| Household Size | Owner-occupied | Renter-occupied |
| 1-Person Household | 194 (55.9%) | 153 (44.1%) |
| 2-Person Household | 272 (93.5%) | 19 (6.5%) |
| 3-Person Household | 82 (100.0%) | 0 (0.0%) |
| 4+ Person Household | 111 (69.8%) | 48 (30.2%) |
| Total Housing Units | 659 (75.0%) | 220 (25.0%) |
Occupancy by Educational Attainment in Sumner
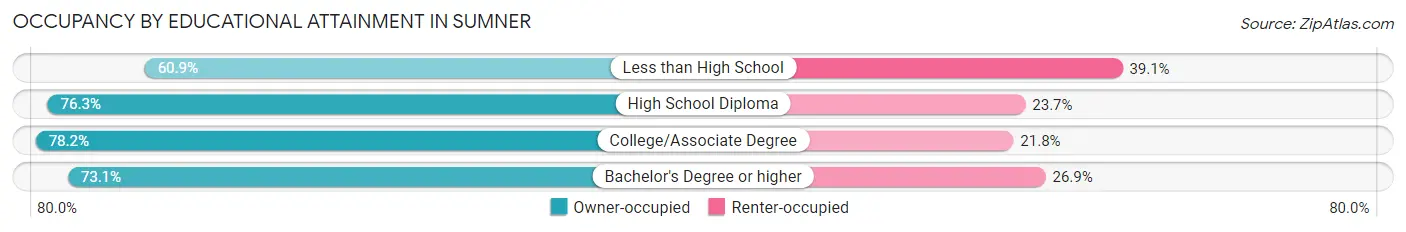
| Household Size | Owner-occupied | Renter-occupied |
| Less than High School | 39 (60.9%) | 25 (39.1%) |
| High School Diploma | 242 (76.3%) | 75 (23.7%) |
| College/Associate Degree | 212 (78.2%) | 59 (21.8%) |
| Bachelor's Degree or higher | 166 (73.1%) | 61 (26.9%) |
Occupancy by Age of Householder in Sumner
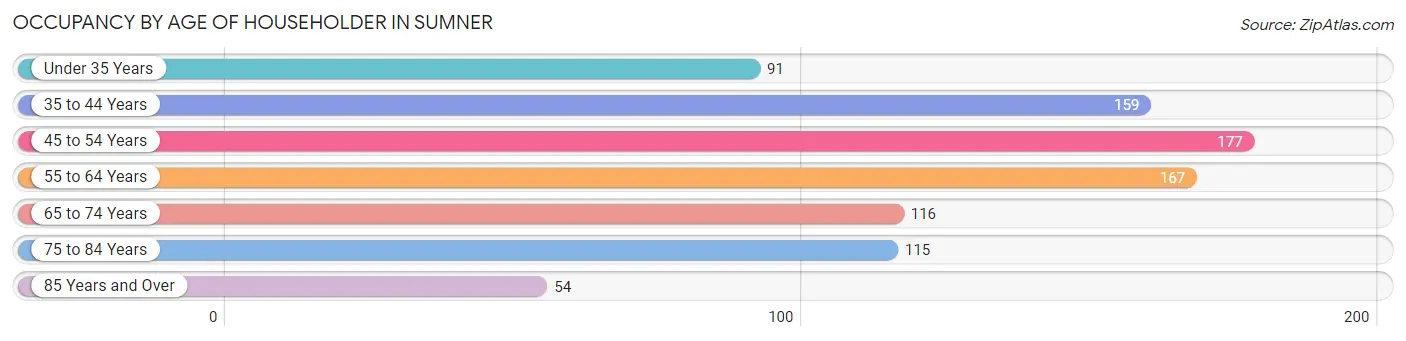
| Age Bracket | # Households | % Households |
| Under 35 Years | 91 | 10.3% |
| 35 to 44 Years | 159 | 18.1% |
| 45 to 54 Years | 177 | 20.1% |
| 55 to 64 Years | 167 | 19.0% |
| 65 to 74 Years | 116 | 13.2% |
| 75 to 84 Years | 115 | 13.1% |
| 85 Years and Over | 54 | 6.1% |
| Total | 879 | 100.0% |
Housing Finances in Sumner
Median Income by Occupancy in Sumner
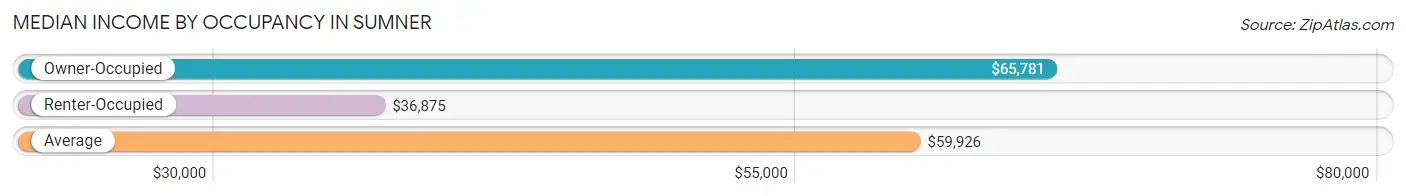
| Occupancy Type | # Households | Median Income |
| Owner-Occupied | 659 (75.0%) | $65,781 |
| Renter-Occupied | 220 (25.0%) | $36,875 |
| Average | 879 (100.0%) | $59,926 |
Occupancy by Householder Income Bracket in Sumner
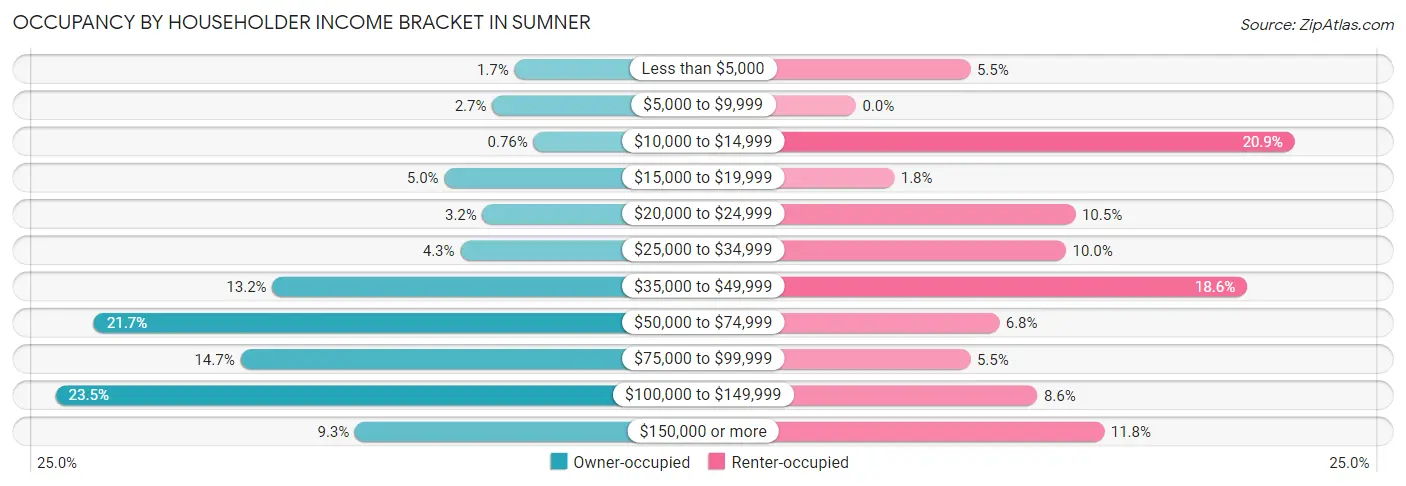
| Income Bracket | Owner-occupied | Renter-occupied |
| Less than $5,000 | 11 (1.7%) | 12 (5.4%) |
| $5,000 to $9,999 | 18 (2.7%) | 0 (0.0%) |
| $10,000 to $14,999 | 5 (0.8%) | 46 (20.9%) |
| $15,000 to $19,999 | 33 (5.0%) | 4 (1.8%) |
| $20,000 to $24,999 | 21 (3.2%) | 23 (10.4%) |
| $25,000 to $34,999 | 28 (4.3%) | 22 (10.0%) |
| $35,000 to $49,999 | 87 (13.2%) | 41 (18.6%) |
| $50,000 to $74,999 | 143 (21.7%) | 15 (6.8%) |
| $75,000 to $99,999 | 97 (14.7%) | 12 (5.4%) |
| $100,000 to $149,999 | 155 (23.5%) | 19 (8.6%) |
| $150,000 or more | 61 (9.3%) | 26 (11.8%) |
| Total | 659 (100.0%) | 220 (100.0%) |
Monthly Housing Cost Tiers in Sumner
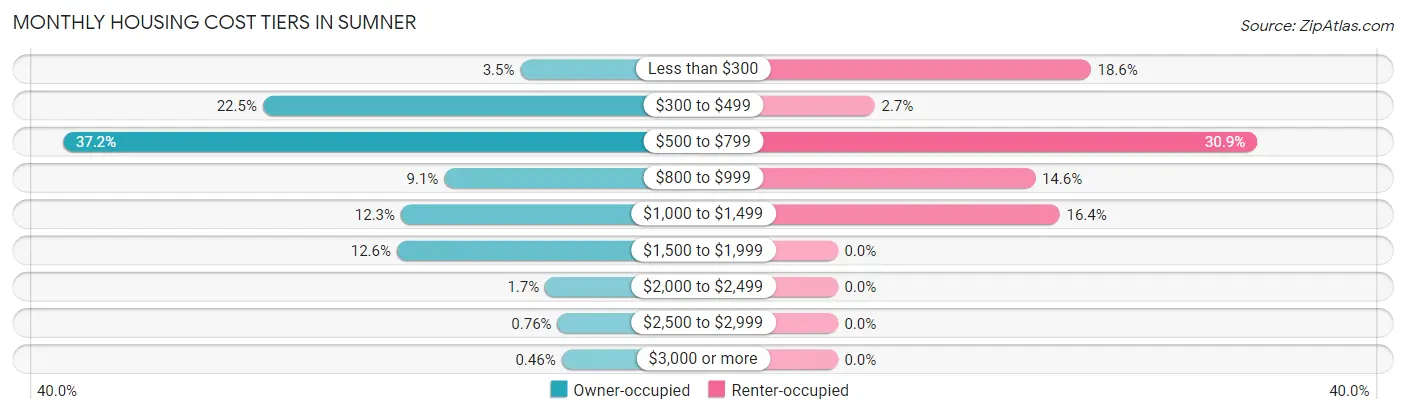
| Monthly Cost | Owner-occupied | Renter-occupied |
| Less than $300 | 23 (3.5%) | 41 (18.6%) |
| $300 to $499 | 148 (22.5%) | 6 (2.7%) |
| $500 to $799 | 245 (37.2%) | 68 (30.9%) |
| $800 to $999 | 60 (9.1%) | 32 (14.5%) |
| $1,000 to $1,499 | 81 (12.3%) | 36 (16.4%) |
| $1,500 to $1,999 | 83 (12.6%) | 0 (0.0%) |
| $2,000 to $2,499 | 11 (1.7%) | 0 (0.0%) |
| $2,500 to $2,999 | 5 (0.8%) | 0 (0.0%) |
| $3,000 or more | 3 (0.5%) | 0 (0.0%) |
| Total | 659 (100.0%) | 220 (100.0%) |
Physical Housing Characteristics in Sumner
Housing Structures in Sumner
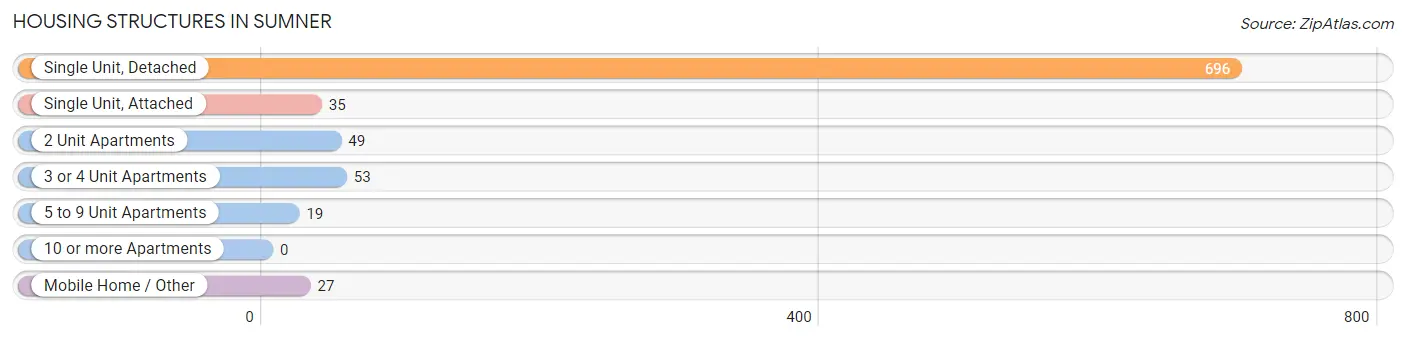
| Structure Type | # Housing Units | % Housing Units |
| Single Unit, Detached | 696 | 79.2% |
| Single Unit, Attached | 35 | 4.0% |
| 2 Unit Apartments | 49 | 5.6% |
| 3 or 4 Unit Apartments | 53 | 6.0% |
| 5 to 9 Unit Apartments | 19 | 2.2% |
| 10 or more Apartments | 0 | 0.0% |
| Mobile Home / Other | 27 | 3.1% |
| Total | 879 | 100.0% |
Housing Structures by Occupancy in Sumner
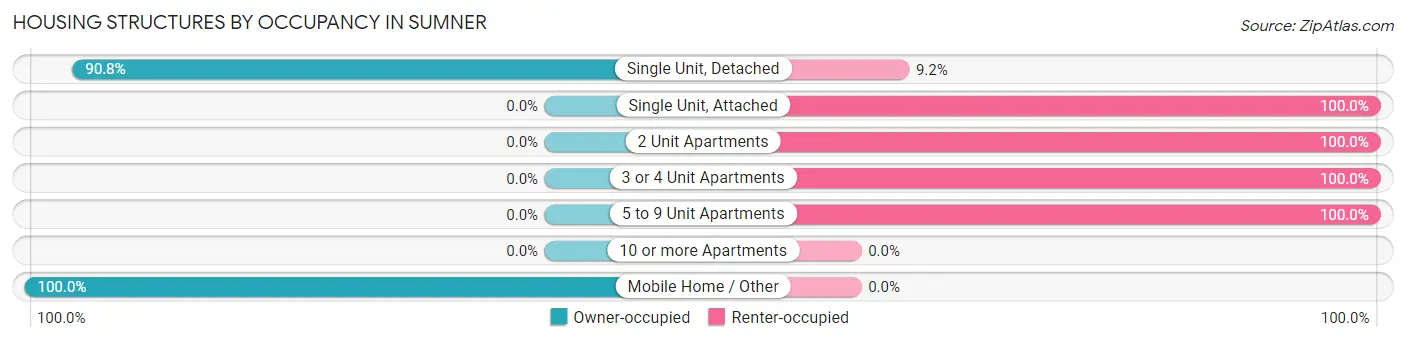
| Structure Type | Owner-occupied | Renter-occupied |
| Single Unit, Detached | 632 (90.8%) | 64 (9.2%) |
| Single Unit, Attached | 0 (0.0%) | 35 (100.0%) |
| 2 Unit Apartments | 0 (0.0%) | 49 (100.0%) |
| 3 or 4 Unit Apartments | 0 (0.0%) | 53 (100.0%) |
| 5 to 9 Unit Apartments | 0 (0.0%) | 19 (100.0%) |
| 10 or more Apartments | 0 (0.0%) | 0 (0.0%) |
| Mobile Home / Other | 27 (100.0%) | 0 (0.0%) |
| Total | 659 (75.0%) | 220 (25.0%) |
Housing Structures by Number of Rooms in Sumner
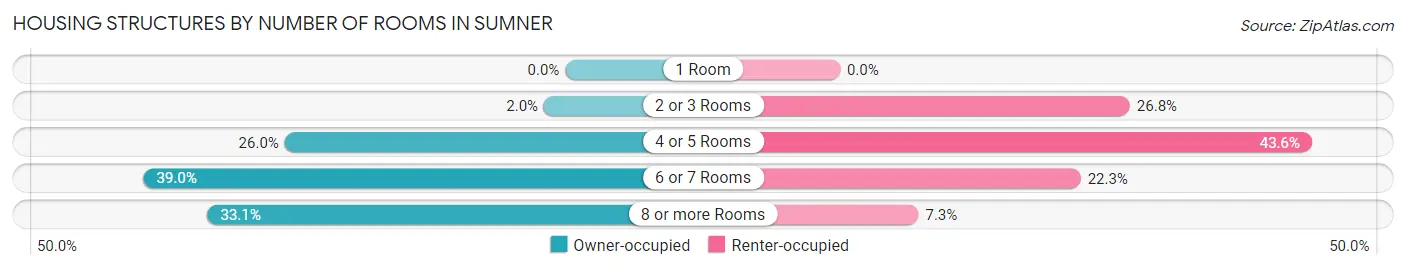
| Number of Rooms | Owner-occupied | Renter-occupied |
| 1 Room | 0 (0.0%) | 0 (0.0%) |
| 2 or 3 Rooms | 13 (2.0%) | 59 (26.8%) |
| 4 or 5 Rooms | 171 (26.0%) | 96 (43.6%) |
| 6 or 7 Rooms | 257 (39.0%) | 49 (22.3%) |
| 8 or more Rooms | 218 (33.1%) | 16 (7.3%) |
| Total | 659 (100.0%) | 220 (100.0%) |
Housing Structure by Heating Type in Sumner
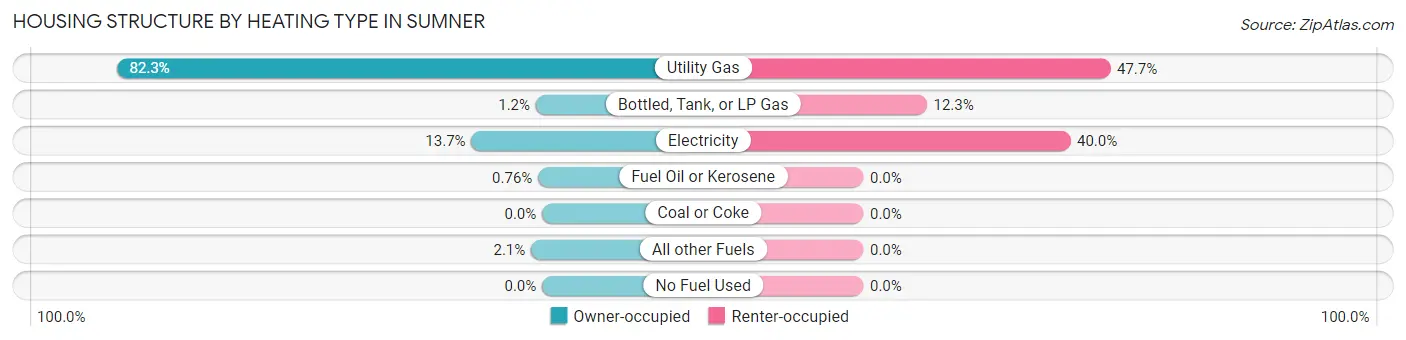
| Heating Type | Owner-occupied | Renter-occupied |
| Utility Gas | 542 (82.3%) | 105 (47.7%) |
| Bottled, Tank, or LP Gas | 8 (1.2%) | 27 (12.3%) |
| Electricity | 90 (13.7%) | 88 (40.0%) |
| Fuel Oil or Kerosene | 5 (0.8%) | 0 (0.0%) |
| Coal or Coke | 0 (0.0%) | 0 (0.0%) |
| All other Fuels | 14 (2.1%) | 0 (0.0%) |
| No Fuel Used | 0 (0.0%) | 0 (0.0%) |
| Total | 659 (100.0%) | 220 (100.0%) |
Household Vehicle Usage in Sumner
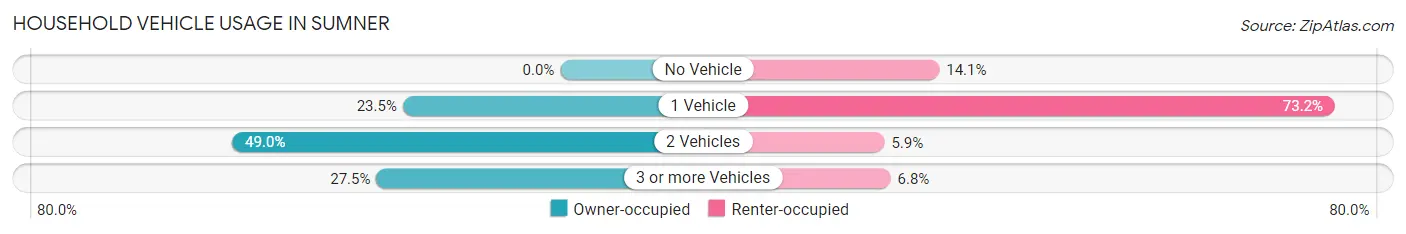
| Vehicles per Household | Owner-occupied | Renter-occupied |
| No Vehicle | 0 (0.0%) | 31 (14.1%) |
| 1 Vehicle | 155 (23.5%) | 161 (73.2%) |
| 2 Vehicles | 323 (49.0%) | 13 (5.9%) |
| 3 or more Vehicles | 181 (27.5%) | 15 (6.8%) |
| Total | 659 (100.0%) | 220 (100.0%) |
Real Estate & Mortgages in Sumner
Real Estate and Mortgage Overview in Sumner
| Characteristic | Without Mortgage | With Mortgage |
| Housing Units | 363 | 296 |
| Median Property Value | $100,700 | $116,100 |
| Median Household Income | $56,417 | $35 |
| Monthly Housing Costs | $515 | $3 |
| Real Estate Taxes | $1,644 | $0 |
Property Value by Mortgage Status in Sumner
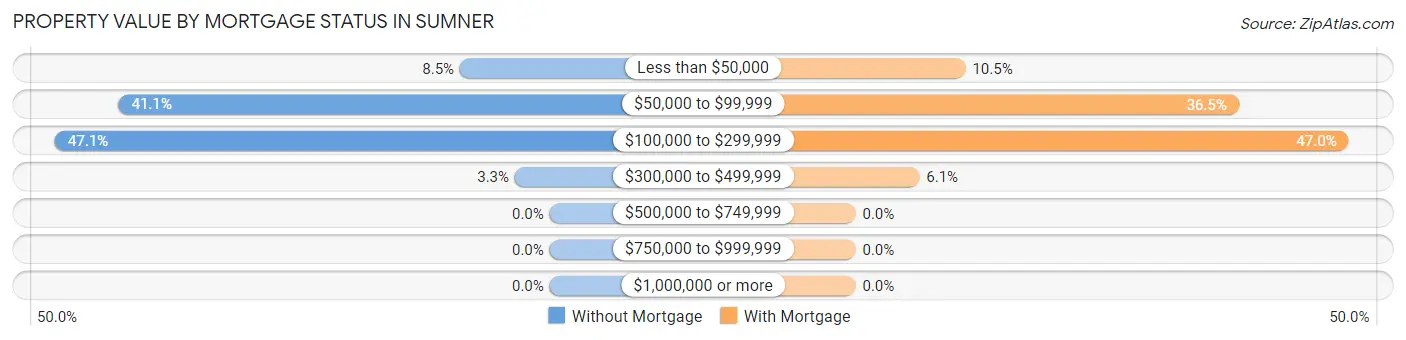
| Property Value | Without Mortgage | With Mortgage |
| Less than $50,000 | 31 (8.5%) | 31 (10.5%) |
| $50,000 to $99,999 | 149 (41.0%) | 108 (36.5%) |
| $100,000 to $299,999 | 171 (47.1%) | 139 (47.0%) |
| $300,000 to $499,999 | 12 (3.3%) | 18 (6.1%) |
| $500,000 to $749,999 | 0 (0.0%) | 0 (0.0%) |
| $750,000 to $999,999 | 0 (0.0%) | 0 (0.0%) |
| $1,000,000 or more | 0 (0.0%) | 0 (0.0%) |
| Total | 363 (100.0%) | 296 (100.0%) |
Household Income by Mortgage Status in Sumner
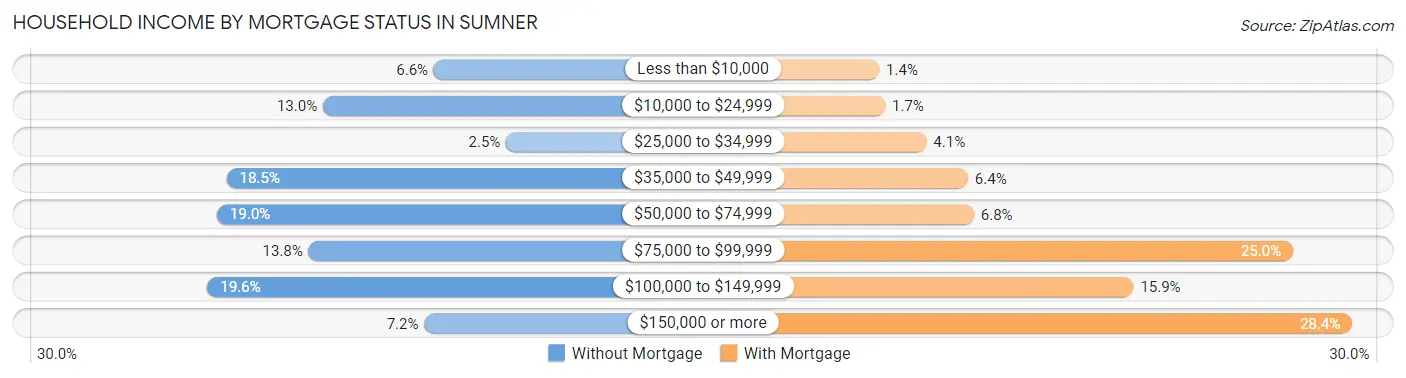
| Household Income | Without Mortgage | With Mortgage |
| Less than $10,000 | 24 (6.6%) | 4 (1.3%) |
| $10,000 to $24,999 | 47 (13.0%) | 5 (1.7%) |
| $25,000 to $34,999 | 9 (2.5%) | 12 (4.1%) |
| $35,000 to $49,999 | 67 (18.5%) | 19 (6.4%) |
| $50,000 to $74,999 | 69 (19.0%) | 20 (6.8%) |
| $75,000 to $99,999 | 50 (13.8%) | 74 (25.0%) |
| $100,000 to $149,999 | 71 (19.6%) | 47 (15.9%) |
| $150,000 or more | 26 (7.2%) | 84 (28.4%) |
| Total | 363 (100.0%) | 296 (100.0%) |
Property Value to Household Income Ratio in Sumner
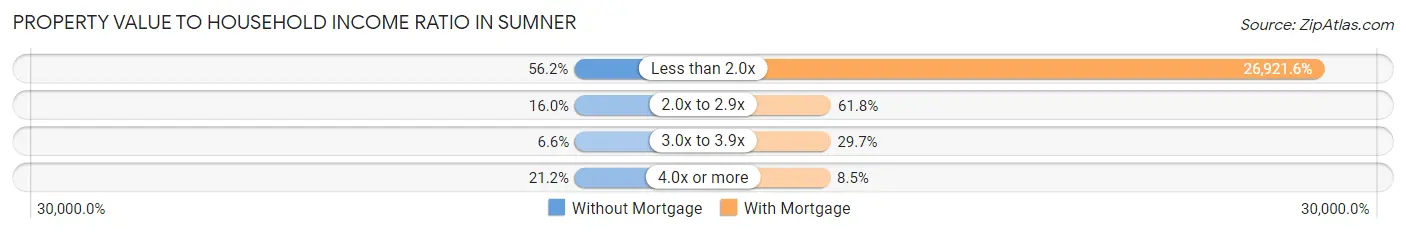
| Value-to-Income Ratio | Without Mortgage | With Mortgage |
| Less than 2.0x | 204 (56.2%) | 79,688 (26,921.6%) |
| 2.0x to 2.9x | 58 (16.0%) | 183 (61.8%) |
| 3.0x to 3.9x | 24 (6.6%) | 88 (29.7%) |
| 4.0x or more | 77 (21.2%) | 25 (8.5%) |
| Total | 363 (100.0%) | 296 (100.0%) |
Real Estate Taxes by Mortgage Status in Sumner
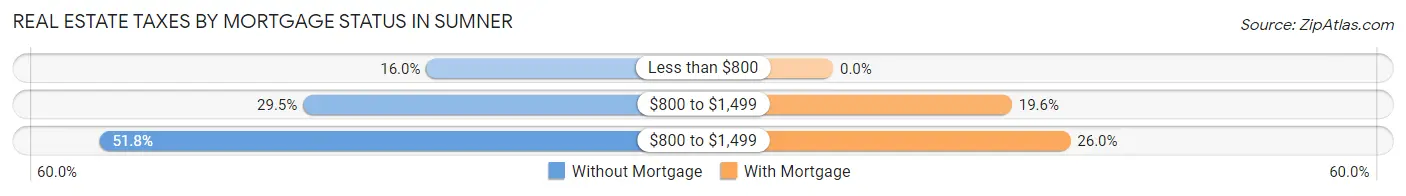
| Property Taxes | Without Mortgage | With Mortgage |
| Less than $800 | 58 (16.0%) | 0 (0.0%) |
| $800 to $1,499 | 107 (29.5%) | 58 (19.6%) |
| $800 to $1,499 | 188 (51.8%) | 77 (26.0%) |
| Total | 363 (100.0%) | 296 (100.0%) |
Health & Disability in Sumner
Health Insurance Coverage by Age in Sumner
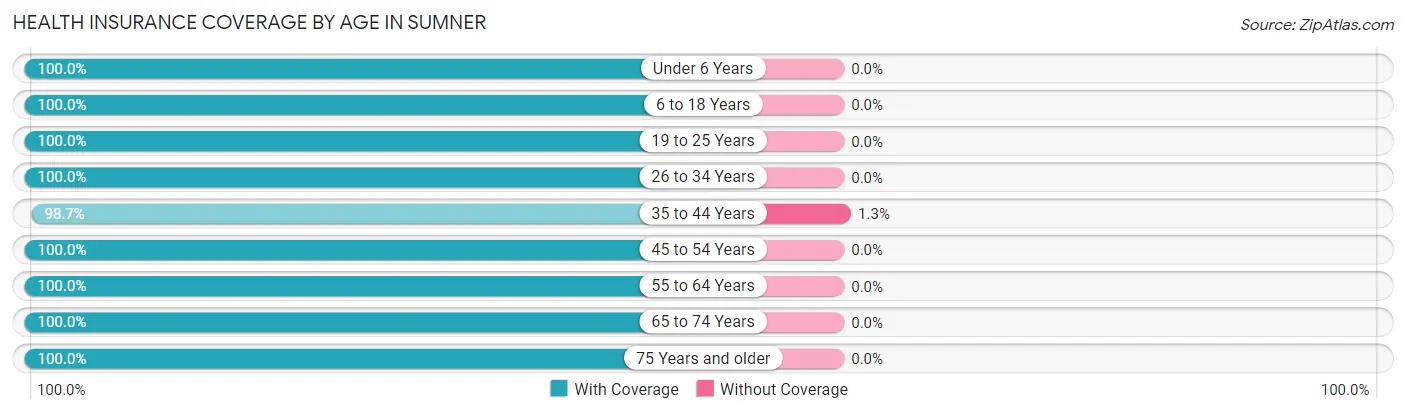
| Age Bracket | With Coverage | Without Coverage |
| Under 6 Years | 145 (100.0%) | 0 (0.0%) |
| 6 to 18 Years | 381 (100.0%) | 0 (0.0%) |
| 19 to 25 Years | 99 (100.0%) | 0 (0.0%) |
| 26 to 34 Years | 129 (100.0%) | 0 (0.0%) |
| 35 to 44 Years | 309 (98.7%) | 4 (1.3%) |
| 45 to 54 Years | 311 (100.0%) | 0 (0.0%) |
| 55 to 64 Years | 292 (100.0%) | 0 (0.0%) |
| 65 to 74 Years | 192 (100.0%) | 0 (0.0%) |
| 75 Years and older | 212 (100.0%) | 0 (0.0%) |
| Total | 2,070 (99.8%) | 4 (0.2%) |
Health Insurance Coverage by Citizenship Status in Sumner
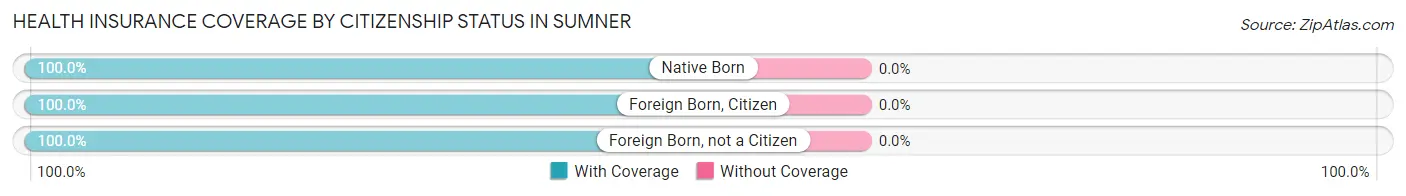
| Citizenship Status | With Coverage | Without Coverage |
| Native Born | 145 (100.0%) | 0 (0.0%) |
| Foreign Born, Citizen | 381 (100.0%) | 0 (0.0%) |
| Foreign Born, not a Citizen | 99 (100.0%) | 0 (0.0%) |
Health Insurance Coverage by Household Income in Sumner
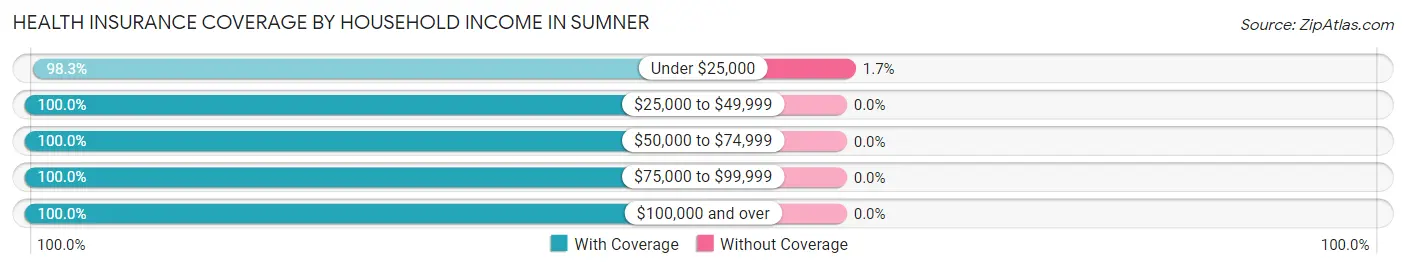
| Household Income | With Coverage | Without Coverage |
| Under $25,000 | 231 (98.3%) | 4 (1.7%) |
| $25,000 to $49,999 | 365 (100.0%) | 0 (0.0%) |
| $50,000 to $74,999 | 350 (100.0%) | 0 (0.0%) |
| $75,000 to $99,999 | 311 (100.0%) | 0 (0.0%) |
| $100,000 and over | 813 (100.0%) | 0 (0.0%) |
Public vs Private Health Insurance Coverage by Age in Sumner
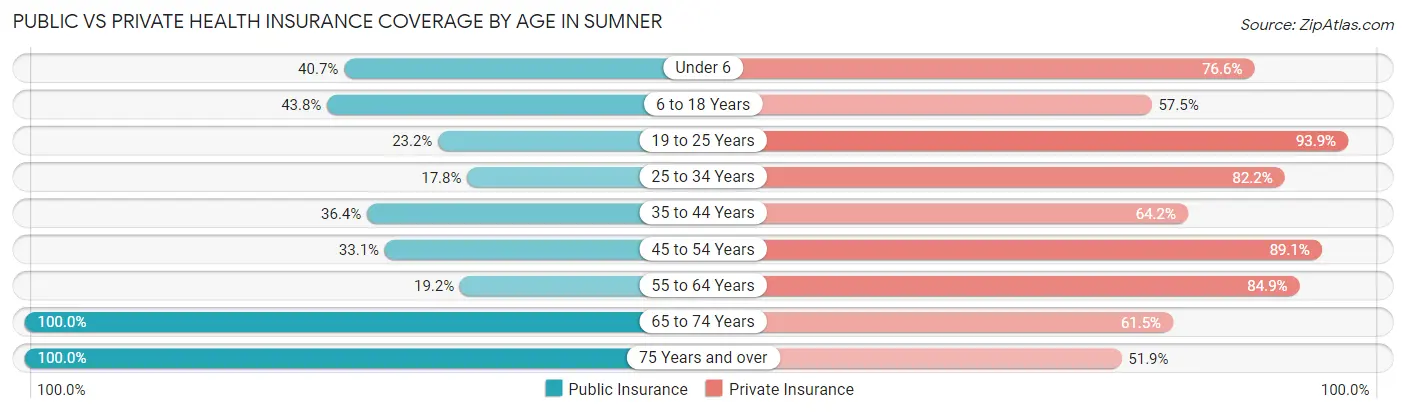
| Age Bracket | Public Insurance | Private Insurance |
| Under 6 | 59 (40.7%) | 111 (76.5%) |
| 6 to 18 Years | 167 (43.8%) | 219 (57.5%) |
| 19 to 25 Years | 23 (23.2%) | 93 (93.9%) |
| 25 to 34 Years | 23 (17.8%) | 106 (82.2%) |
| 35 to 44 Years | 114 (36.4%) | 201 (64.2%) |
| 45 to 54 Years | 103 (33.1%) | 277 (89.1%) |
| 55 to 64 Years | 56 (19.2%) | 248 (84.9%) |
| 65 to 74 Years | 192 (100.0%) | 118 (61.5%) |
| 75 Years and over | 212 (100.0%) | 110 (51.9%) |
| Total | 949 (45.8%) | 1,483 (71.5%) |
Disability Status by Sex by Age in Sumner
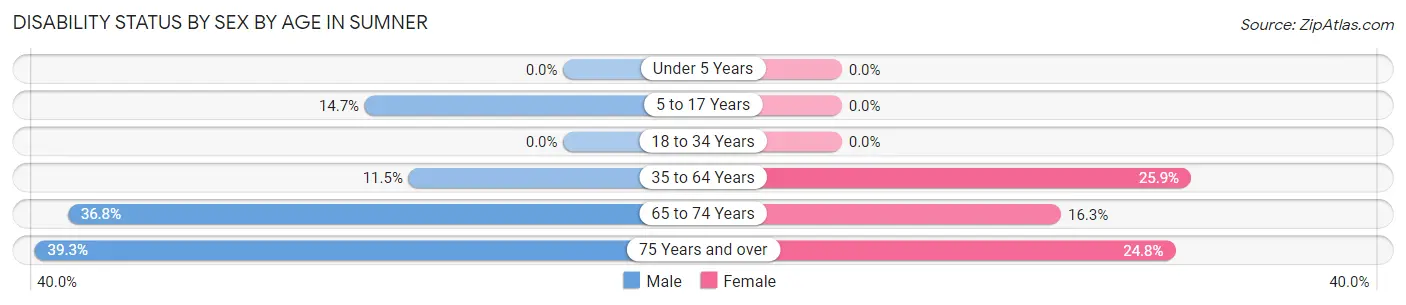
| Age Bracket | Male | Female |
| Under 5 Years | 0 (0.0%) | 0 (0.0%) |
| 5 to 17 Years | 33 (14.7%) | 0 (0.0%) |
| 18 to 34 Years | 0 (0.0%) | 0 (0.0%) |
| 35 to 64 Years | 52 (11.5%) | 120 (25.9%) |
| 65 to 74 Years | 39 (36.8%) | 14 (16.3%) |
| 75 Years and over | 42 (39.3%) | 26 (24.8%) |
Disability Class by Sex by Age in Sumner
Disability Class: Hearing Difficulty
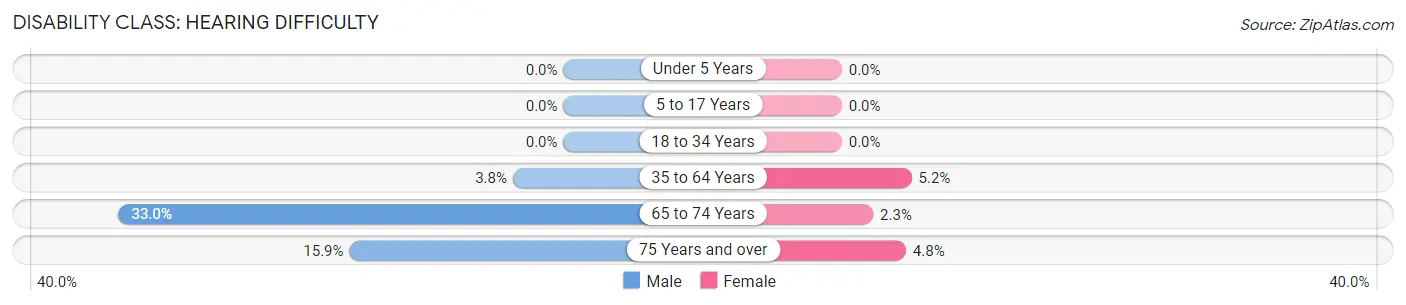
| Age Bracket | Male | Female |
| Under 5 Years | 0 (0.0%) | 0 (0.0%) |
| 5 to 17 Years | 0 (0.0%) | 0 (0.0%) |
| 18 to 34 Years | 0 (0.0%) | 0 (0.0%) |
| 35 to 64 Years | 17 (3.7%) | 24 (5.2%) |
| 65 to 74 Years | 35 (33.0%) | 2 (2.3%) |
| 75 Years and over | 17 (15.9%) | 5 (4.8%) |
Disability Class: Vision Difficulty
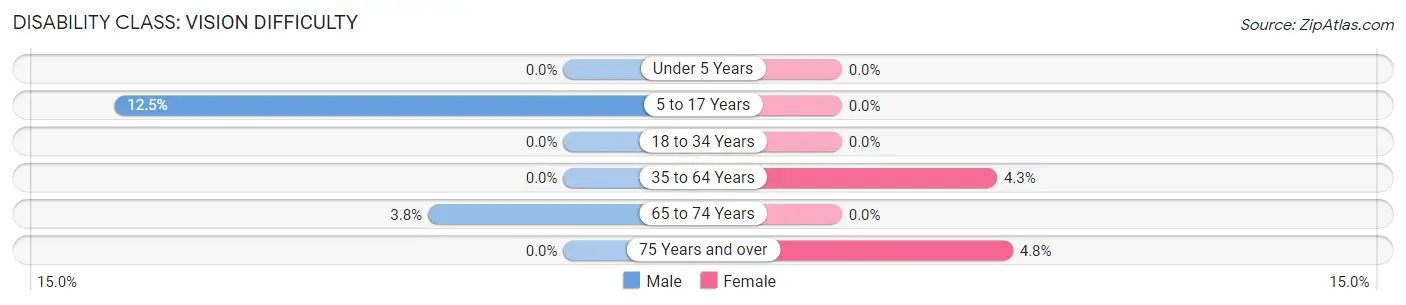
| Age Bracket | Male | Female |
| Under 5 Years | 0 (0.0%) | 0 (0.0%) |
| 5 to 17 Years | 28 (12.5%) | 0 (0.0%) |
| 18 to 34 Years | 0 (0.0%) | 0 (0.0%) |
| 35 to 64 Years | 0 (0.0%) | 20 (4.3%) |
| 65 to 74 Years | 4 (3.8%) | 0 (0.0%) |
| 75 Years and over | 0 (0.0%) | 5 (4.8%) |
Disability Class: Cognitive Difficulty
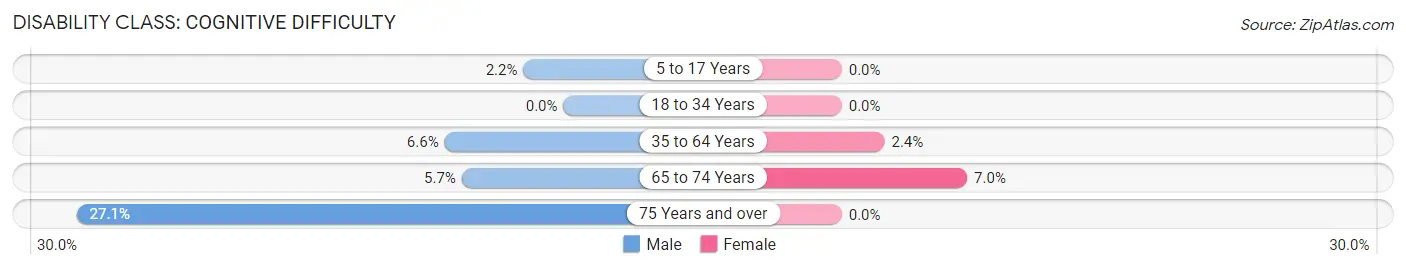
| Age Bracket | Male | Female |
| 5 to 17 Years | 5 (2.2%) | 0 (0.0%) |
| 18 to 34 Years | 0 (0.0%) | 0 (0.0%) |
| 35 to 64 Years | 30 (6.6%) | 11 (2.4%) |
| 65 to 74 Years | 6 (5.7%) | 6 (7.0%) |
| 75 Years and over | 29 (27.1%) | 0 (0.0%) |
Disability Class: Ambulatory Difficulty
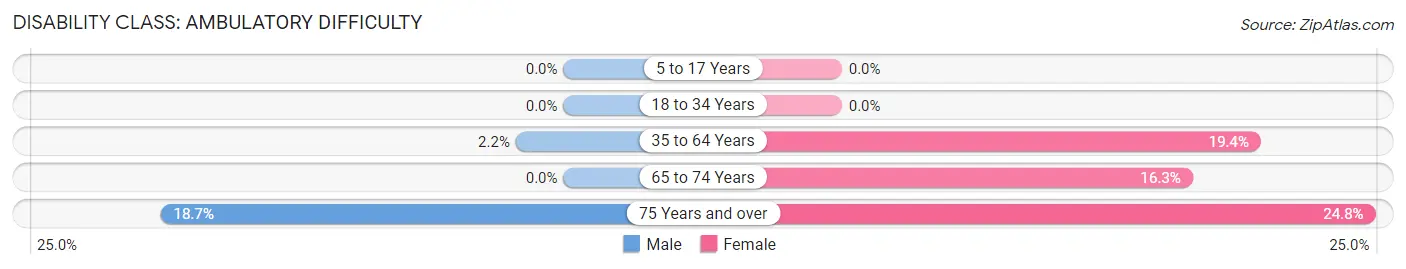
| Age Bracket | Male | Female |
| 5 to 17 Years | 0 (0.0%) | 0 (0.0%) |
| 18 to 34 Years | 0 (0.0%) | 0 (0.0%) |
| 35 to 64 Years | 10 (2.2%) | 90 (19.4%) |
| 65 to 74 Years | 0 (0.0%) | 14 (16.3%) |
| 75 Years and over | 20 (18.7%) | 26 (24.8%) |
Disability Class: Self-Care Difficulty
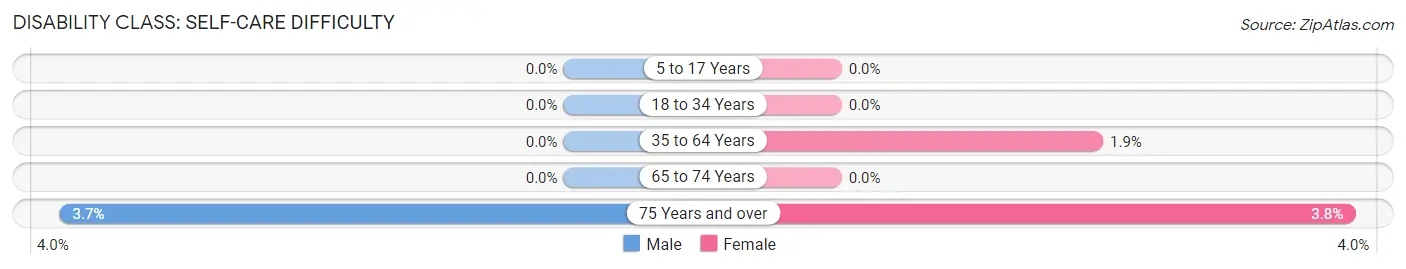
| Age Bracket | Male | Female |
| 5 to 17 Years | 0 (0.0%) | 0 (0.0%) |
| 18 to 34 Years | 0 (0.0%) | 0 (0.0%) |
| 35 to 64 Years | 0 (0.0%) | 9 (1.9%) |
| 65 to 74 Years | 0 (0.0%) | 0 (0.0%) |
| 75 Years and over | 4 (3.7%) | 4 (3.8%) |
Technology Access in Sumner
Computing Device Access in Sumner
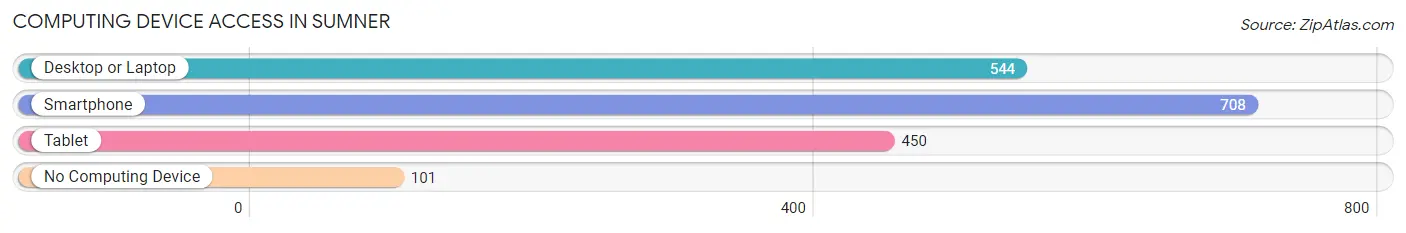
| Device Type | # Households | % Households |
| Desktop or Laptop | 544 | 61.9% |
| Smartphone | 708 | 80.5% |
| Tablet | 450 | 51.2% |
| No Computing Device | 101 | 11.5% |
| Total | 879 | 100.0% |
Internet Access in Sumner
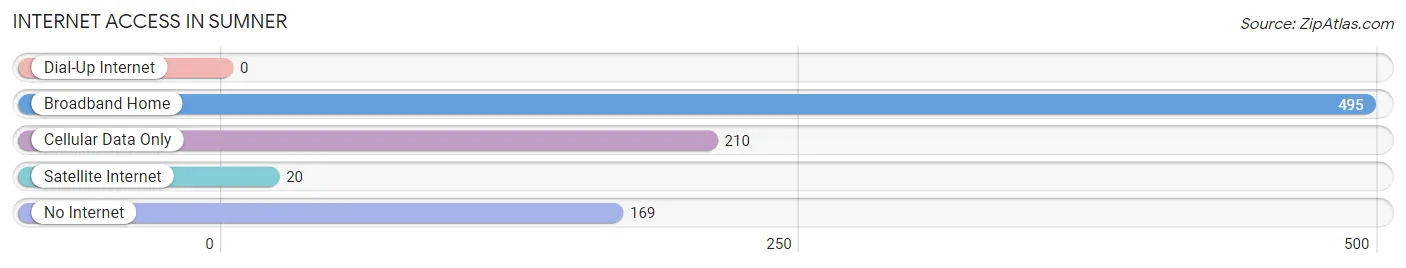
| Internet Type | # Households | % Households |
| Dial-Up Internet | 0 | 0.0% |
| Broadband Home | 495 | 56.3% |
| Cellular Data Only | 210 | 23.9% |
| Satellite Internet | 20 | 2.3% |
| No Internet | 169 | 19.2% |
| Total | 879 | 100.0% |
Sumner Summary
Sumner, Iowa is a small city located in Bremer County, Iowa. It is situated on the banks of the Wapsipinicon River, about 25 miles northeast of Waterloo. The city has a population of 1,845 people, according to the 2010 census.
History
Sumner was founded in 1854 by a group of settlers from New York. The city was named after Charles Sumner, a prominent abolitionist and senator from Massachusetts. The city was incorporated in 1858 and quickly became a thriving agricultural center. The railroad arrived in 1872, connecting Sumner to the rest of the state and the nation.
The city experienced a period of growth in the late 19th and early 20th centuries, with the establishment of several businesses, including a flour mill, a creamery, and a brickyard. The city also became a popular destination for tourists, who came to enjoy the city’s natural beauty and recreational opportunities.
Geography
Sumner is located in Bremer County, Iowa, about 25 miles northeast of Waterloo. The city is situated on the banks of the Wapsipinicon River, which flows through the city. The city is surrounded by rolling hills and farmland, and is located in the heart of Iowa’s agricultural region.
The city has a total area of 1.3 square miles, all of which is land. The city has a humid continental climate, with hot summers and cold winters. The average annual temperature is 48 degrees Fahrenheit, and the average annual precipitation is 33 inches.
Economy
Sumner’s economy is largely based on agriculture. The city is home to several large farms, which produce corn, soybeans, and other crops. The city also has several manufacturing companies, which produce a variety of products, including furniture, clothing, and automotive parts.
The city is also home to several small businesses, including restaurants, retail stores, and service providers. The city is also home to a number of tourist attractions, including the Wapsipinicon River, the Sumner County Historical Museum, and the Sumner County Fairgrounds.
Demographics
According to the 2010 census, Sumner has a population of 1,845 people. The city has a median age of 38.7 years, and a median household income of $45,945. The city is predominantly white, with 92.3% of the population identifying as white. The city also has a small Hispanic population, with 4.2% of the population identifying as Hispanic or Latino.
Sumner is a small city with a rich history and a vibrant economy. The city is home to a diverse population, and offers a variety of recreational and cultural activities. The city is a great place to live, work, and raise a family.
Common Questions
What is Per Capita Income in Sumner?
Per Capita income in Sumner is $35,723.
What is the Median Family Income in Sumner?
Median Family Income in Sumner is $90,536.
What is the Median Household income in Sumner?
Median Household Income in Sumner is $59,926.
What is Income or Wage Gap in Sumner?
Income or Wage Gap in Sumner is 26.4%.
Women in Sumner earn 73.6 cents for every dollar earned by a man.
What is Inequality or Gini Index in Sumner?
Inequality or Gini Index in Sumner is 0.43.
What is the Total Population of Sumner?
Total Population of Sumner is 2,145.
What is the Total Male Population of Sumner?
Total Male Population of Sumner is 1,095.
What is the Total Female Population of Sumner?
Total Female Population of Sumner is 1,050.
What is the Ratio of Males per 100 Females in Sumner?
There are 104.29 Males per 100 Females in Sumner.
What is the Ratio of Females per 100 Males in Sumner?
There are 95.89 Females per 100 Males in Sumner.
What is the Median Population Age in Sumner?
Median Population Age in Sumner is 45.7 Years.
What is the Average Family Size in Sumner
Average Family Size in Sumner is 3.2 People.
What is the Average Household Size in Sumner
Average Household Size in Sumner is 2.4 People.
How Large is the Labor Force in Sumner?
There are 1,054 People in the Labor Forcein in Sumner.
What is the Percentage of People in the Labor Force in Sumner?
61.5% of People are in the Labor Force in Sumner.
What is the Unemployment Rate in Sumner?
Unemployment Rate in Sumner is 3.1%.