Stanley, IA Map & Demographics
Stanley Map
Stanley Overview
$29,496
PER CAPITA INCOME
$43,542
AVG HOUSEHOLD INCOME
0.44
INEQUALITY / GINI INDEX
81
TOTAL POPULATION
34
MALE POPULATION
47
FEMALE POPULATION
72.34
MALES / 100 FEMALES
138.24
FEMALES / 100 MALES
44.9
MEDIAN AGE
3.1
AVG FAMILY SIZE
2.2
AVG HOUSEHOLD SIZE
53
LABOR FORCE [ PEOPLE ]
72.6%
PERCENT IN LABOR FORCE
30.2%
UNEMPLOYMENT RATE
Stanley Zip Codes
Income in Stanley
Income Overview in Stanley
| Characteristic | Number | Measure |
| Per Capita Income | 81 | $29,496 |
| Median Family Income | 20 | $0 |
| Mean Family Income | 20 | $88,685 |
| Median Household Income | 37 | $43,542 |
| Mean Household Income | 37 | $61,273 |
| Income Deficit | 20 | $0 |
| Wage / Income Gap (%) | 81 | 0.00% |
| Wage / Income Gap ($) | 81 | 100.00¢ per $1 |
| Gini / Inequality Index | 81 | 0.44 |
Earnings by Sex in Stanley
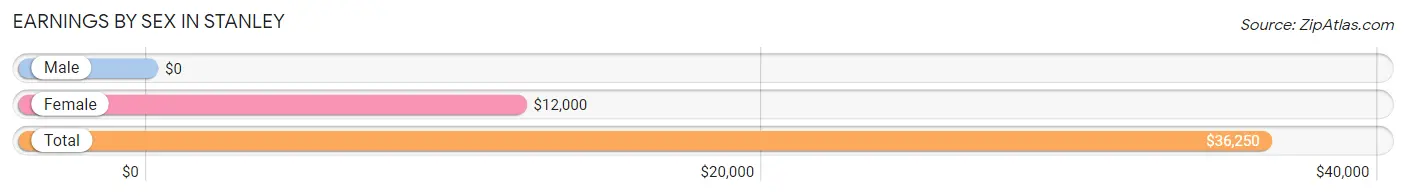
| Sex | Number | Average Earnings |
| Male | 23 (43.4%) | $0 |
| Female | 30 (56.6%) | $12,000 |
| Total | 53 (100.0%) | $36,250 |
Earnings by Sex by Income Bracket in Stanley
The most common earnings brackets in Stanley are $40,000 to $44,999 for men (6 | 26.1%) and $2,499 or less for women (10 | 33.3%).
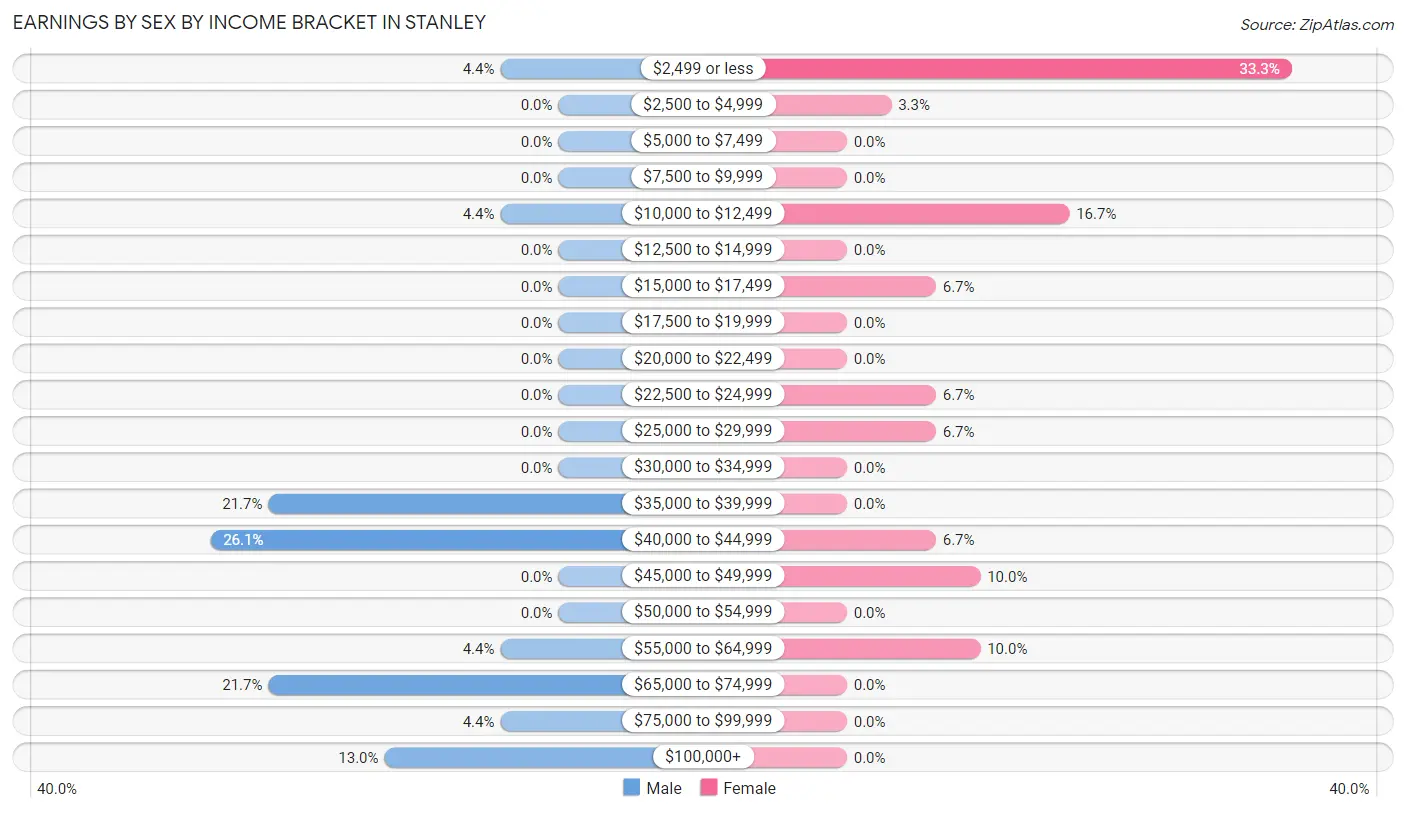
| Income | Male | Female |
| $2,499 or less | 1 (4.3%) | 10 (33.3%) |
| $2,500 to $4,999 | 0 (0.0%) | 1 (3.3%) |
| $5,000 to $7,499 | 0 (0.0%) | 0 (0.0%) |
| $7,500 to $9,999 | 0 (0.0%) | 0 (0.0%) |
| $10,000 to $12,499 | 1 (4.3%) | 5 (16.7%) |
| $12,500 to $14,999 | 0 (0.0%) | 0 (0.0%) |
| $15,000 to $17,499 | 0 (0.0%) | 2 (6.7%) |
| $17,500 to $19,999 | 0 (0.0%) | 0 (0.0%) |
| $20,000 to $22,499 | 0 (0.0%) | 0 (0.0%) |
| $22,500 to $24,999 | 0 (0.0%) | 2 (6.7%) |
| $25,000 to $29,999 | 0 (0.0%) | 2 (6.7%) |
| $30,000 to $34,999 | 0 (0.0%) | 0 (0.0%) |
| $35,000 to $39,999 | 5 (21.7%) | 0 (0.0%) |
| $40,000 to $44,999 | 6 (26.1%) | 2 (6.7%) |
| $45,000 to $49,999 | 0 (0.0%) | 3 (10.0%) |
| $50,000 to $54,999 | 0 (0.0%) | 0 (0.0%) |
| $55,000 to $64,999 | 1 (4.3%) | 3 (10.0%) |
| $65,000 to $74,999 | 5 (21.7%) | 0 (0.0%) |
| $75,000 to $99,999 | 1 (4.3%) | 0 (0.0%) |
| $100,000+ | 3 (13.0%) | 0 (0.0%) |
| Total | 23 (100.0%) | 30 (100.0%) |
Earnings by Sex by Educational Attainment in Stanley
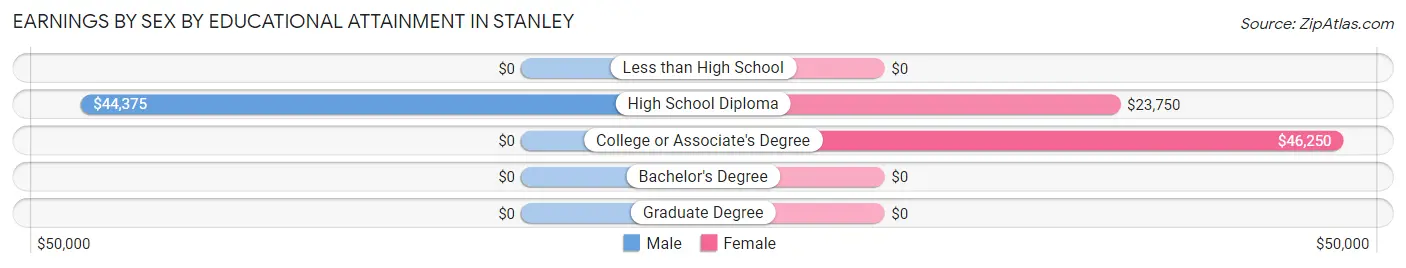
| Educational Attainment | Male Income | Female Income |
| Less than High School | - | - |
| High School Diploma | $44,375 | $23,750 |
| College or Associate's Degree | - | - |
| Bachelor's Degree | - | - |
| Graduate Degree | - | - |
| Total | - | - |
Family Income in Stanley
Family Income Brackets in Stanley
According to the Stanley family income data, there are 6 families falling into the $100,000 to $149,999 income range, which is the most common income bracket and makes up 30.0% of all families.
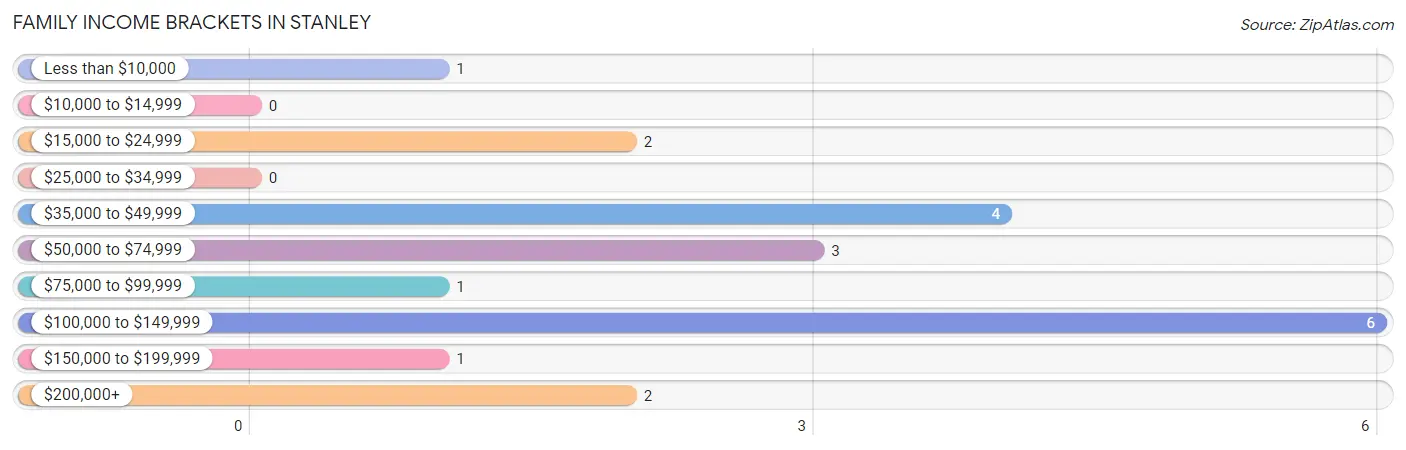
| Income Bracket | # Families | % Families |
| Less than $10,000 | 1 | 5.0% |
| $10,000 to $14,999 | 0 | 0.0% |
| $15,000 to $24,999 | 2 | 10.0% |
| $25,000 to $34,999 | 0 | 0.0% |
| $35,000 to $49,999 | 4 | 20.0% |
| $50,000 to $74,999 | 3 | 15.0% |
| $75,000 to $99,999 | 1 | 5.0% |
| $100,000 to $149,999 | 6 | 30.0% |
| $150,000 to $199,999 | 1 | 5.0% |
| $200,000+ | 2 | 10.0% |
Family Income by Famaliy Size in Stanley
2-person families (11 | 55.0%) account for the highest median family income in Stanley with $53,750 per family, while 2-person families (11 | 55.0%) have the highest median income of $26,875 per family member.
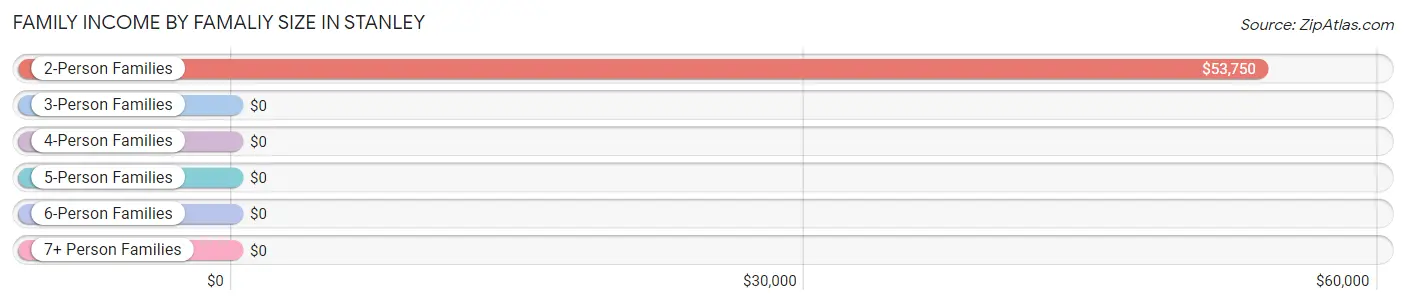
| Income Bracket | # Families | Median Income |
| 2-Person Families | 11 (55.0%) | $53,750 |
| 3-Person Families | 4 (20.0%) | $0 |
| 4-Person Families | 3 (15.0%) | $0 |
| 5-Person Families | 2 (10.0%) | $0 |
| 6-Person Families | 0 (0.0%) | $0 |
| 7+ Person Families | 0 (0.0%) | $0 |
| Total | 20 (100.0%) | $0 |
Family Income by Number of Earners in Stanley
| Number of Earners | # Families | Median Income |
| No Earners | 3 (15.0%) | $0 |
| 1 Earner | 6 (30.0%) | $0 |
| 2 Earners | 6 (30.0%) | $0 |
| 3+ Earners | 5 (25.0%) | $0 |
| Total | 20 (100.0%) | $0 |
Household Income in Stanley
Household Income Brackets in Stanley
With 11 households falling in the category, the $35,000 to $49,999 income range is the most frequent in Stanley, accounting for 29.7% of all households.
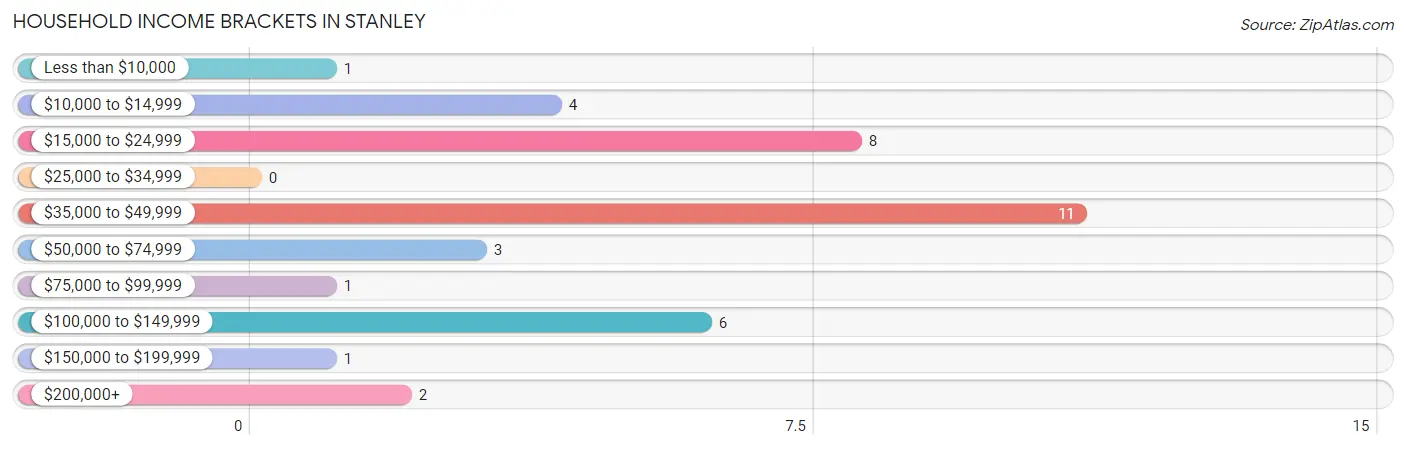
| Income Bracket | # Households | % Households |
| Less than $10,000 | 1 | 2.7% |
| $10,000 to $14,999 | 4 | 10.8% |
| $15,000 to $24,999 | 8 | 21.6% |
| $25,000 to $34,999 | 0 | 0.0% |
| $35,000 to $49,999 | 11 | 29.7% |
| $50,000 to $74,999 | 3 | 8.1% |
| $75,000 to $99,999 | 1 | 2.7% |
| $100,000 to $149,999 | 6 | 16.2% |
| $150,000 to $199,999 | 1 | 2.7% |
| $200,000+ | 2 | 5.4% |
Household Income by Householder Age in Stanley
The median household income in Stanley is $43,542, with the highest median household income of $97,500 found in the 45 to 64 years age bracket for the primary householder. A total of 14 households (37.8%) fall into this category.
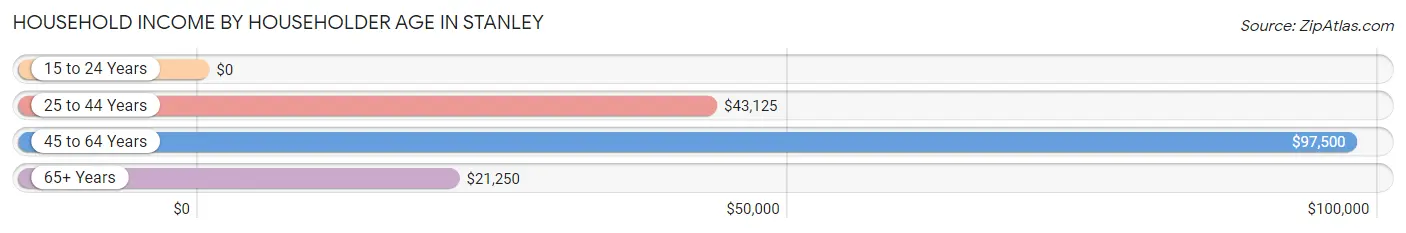
| Income Bracket | # Households | Median Income |
| 15 to 24 Years | 0 (0.0%) | $0 |
| 25 to 44 Years | 9 (24.3%) | $43,125 |
| 45 to 64 Years | 14 (37.8%) | $97,500 |
| 65+ Years | 14 (37.8%) | $21,250 |
| Total | 37 (100.0%) | $43,542 |
Poverty in Stanley
Income Below Poverty by Sex and Age in Stanley
With 2.9% poverty level for males and 4.3% for females among the residents of Stanley, 65 to 74 year old males and 6 to 11 year old females are the most vulnerable to poverty, with 1 males (25.0%) and 1 females (100.0%) in their respective age groups living below the poverty level.
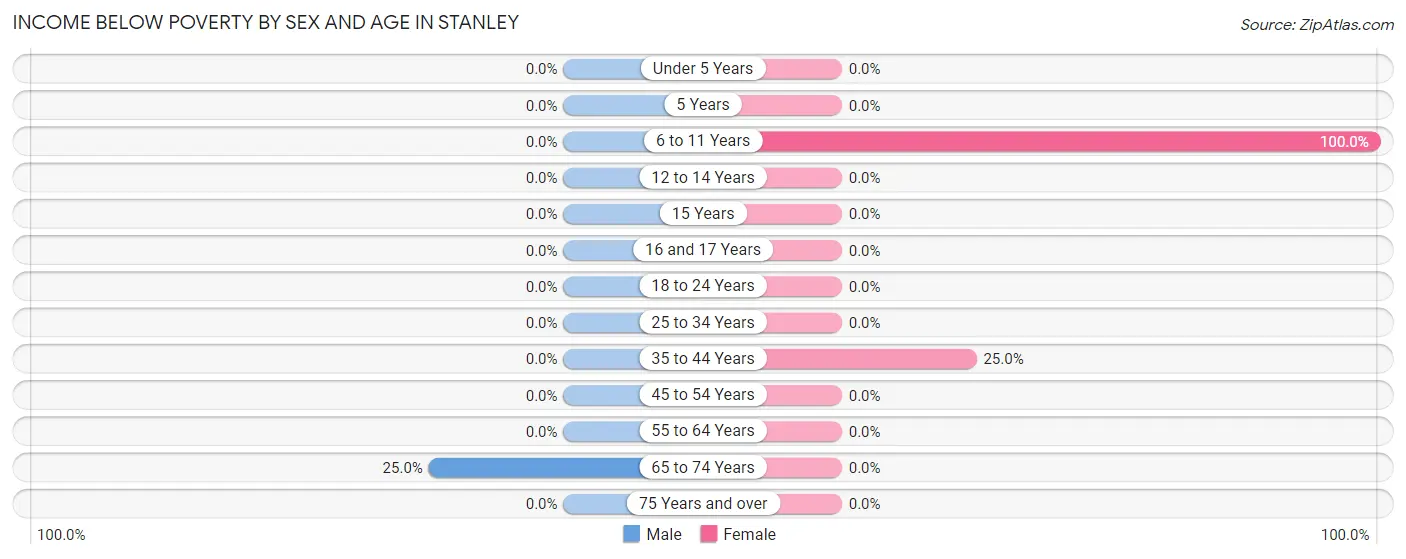
| Age Bracket | Male | Female |
| Under 5 Years | 0 (0.0%) | 0 (0.0%) |
| 5 Years | 0 (0.0%) | 0 (0.0%) |
| 6 to 11 Years | 0 (0.0%) | 1 (100.0%) |
| 12 to 14 Years | 0 (0.0%) | 0 (0.0%) |
| 15 Years | 0 (0.0%) | 0 (0.0%) |
| 16 and 17 Years | 0 (0.0%) | 0 (0.0%) |
| 18 to 24 Years | 0 (0.0%) | 0 (0.0%) |
| 25 to 34 Years | 0 (0.0%) | 0 (0.0%) |
| 35 to 44 Years | 0 (0.0%) | 1 (25.0%) |
| 45 to 54 Years | 0 (0.0%) | 0 (0.0%) |
| 55 to 64 Years | 0 (0.0%) | 0 (0.0%) |
| 65 to 74 Years | 1 (25.0%) | 0 (0.0%) |
| 75 Years and over | 0 (0.0%) | 0 (0.0%) |
| Total | 1 (2.9%) | 2 (4.3%) |
Income Above Poverty by Sex and Age in Stanley
According to the poverty statistics in Stanley, males aged 6 to 11 years and females aged 12 to 14 years are the age groups that are most secure financially, with 100.0% of males and 100.0% of females in these age groups living above the poverty line.
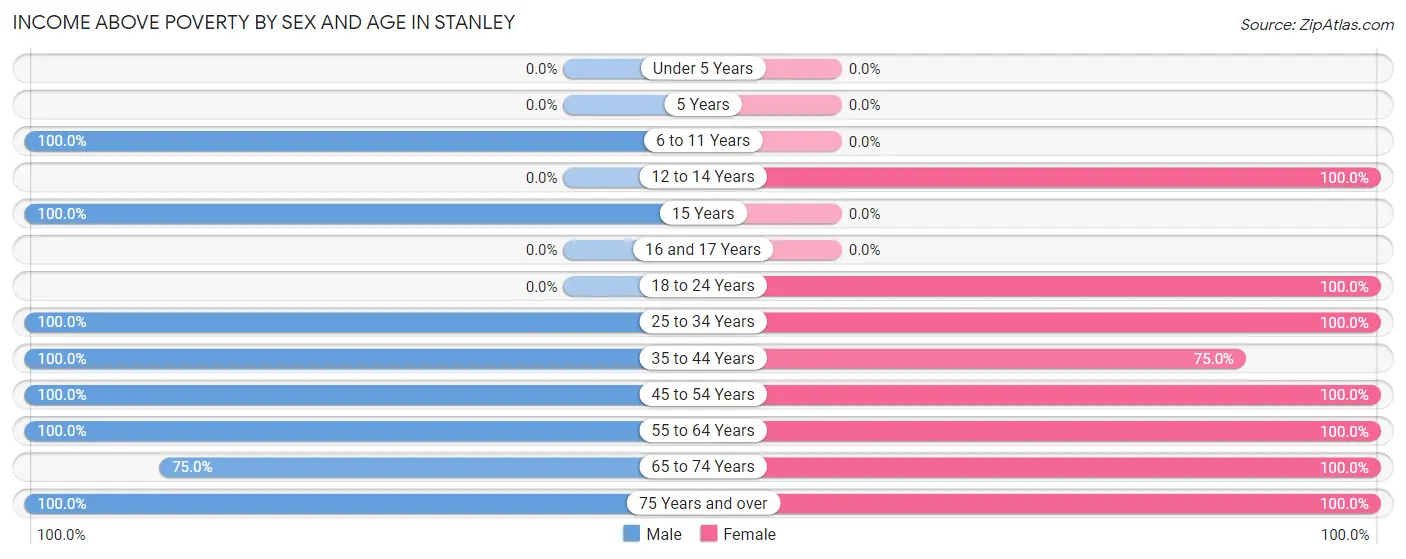
| Age Bracket | Male | Female |
| Under 5 Years | 0 (0.0%) | 0 (0.0%) |
| 5 Years | 0 (0.0%) | 0 (0.0%) |
| 6 to 11 Years | 3 (100.0%) | 0 (0.0%) |
| 12 to 14 Years | 0 (0.0%) | 3 (100.0%) |
| 15 Years | 1 (100.0%) | 0 (0.0%) |
| 16 and 17 Years | 0 (0.0%) | 0 (0.0%) |
| 18 to 24 Years | 0 (0.0%) | 10 (100.0%) |
| 25 to 34 Years | 6 (100.0%) | 4 (100.0%) |
| 35 to 44 Years | 9 (100.0%) | 3 (75.0%) |
| 45 to 54 Years | 7 (100.0%) | 9 (100.0%) |
| 55 to 64 Years | 2 (100.0%) | 4 (100.0%) |
| 65 to 74 Years | 3 (75.0%) | 9 (100.0%) |
| 75 Years and over | 2 (100.0%) | 3 (100.0%) |
| Total | 33 (97.1%) | 45 (95.7%) |
Income Below Poverty Among Married-Couple Families in Stanley
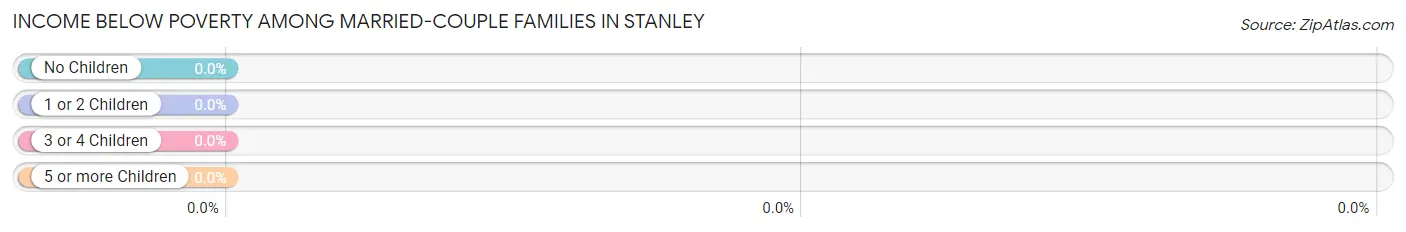
| Children | Above Poverty | Below Poverty |
| No Children | 14 (100.0%) | 0 (0.0%) |
| 1 or 2 Children | 2 (100.0%) | 0 (0.0%) |
| 3 or 4 Children | 2 (100.0%) | 0 (0.0%) |
| 5 or more Children | 0 (0.0%) | 0 (0.0%) |
| Total | 18 (100.0%) | 0 (0.0%) |
Income Below Poverty Among Single-Parent Households in Stanley
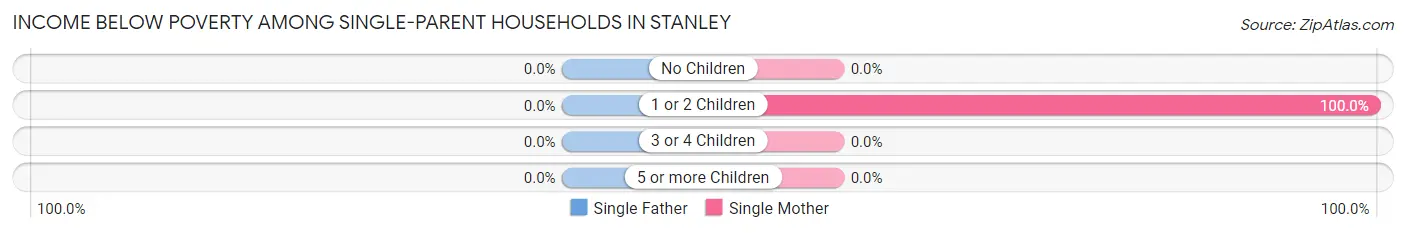
| Children | Single Father | Single Mother |
| No Children | 0 (0.0%) | 0 (0.0%) |
| 1 or 2 Children | 0 (0.0%) | 1 (100.0%) |
| 3 or 4 Children | 0 (0.0%) | 0 (0.0%) |
| 5 or more Children | 0 (0.0%) | 0 (0.0%) |
| Total | 0 (0.0%) | 1 (50.0%) |
Income Below Poverty Among Married-Couple vs Single-Parent Households in Stanley
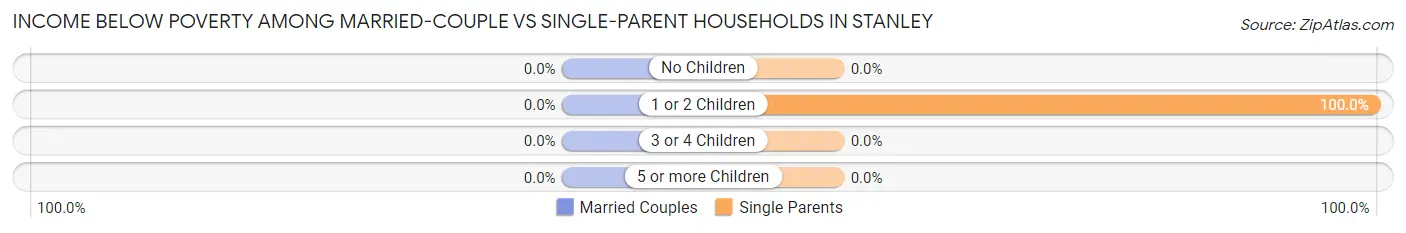
| Children | Married-Couple Families | Single-Parent Households |
| No Children | 0 (0.0%) | 0 (0.0%) |
| 1 or 2 Children | 0 (0.0%) | 1 (100.0%) |
| 3 or 4 Children | 0 (0.0%) | 0 (0.0%) |
| 5 or more Children | 0 (0.0%) | 0 (0.0%) |
| Total | 0 (0.0%) | 1 (50.0%) |
Race in Stanley
The most populous races in Stanley are White / Caucasian (77 | 95.1%), Hispanic or Latino (5 | 6.2%), and Some other Race (2 | 2.5%).
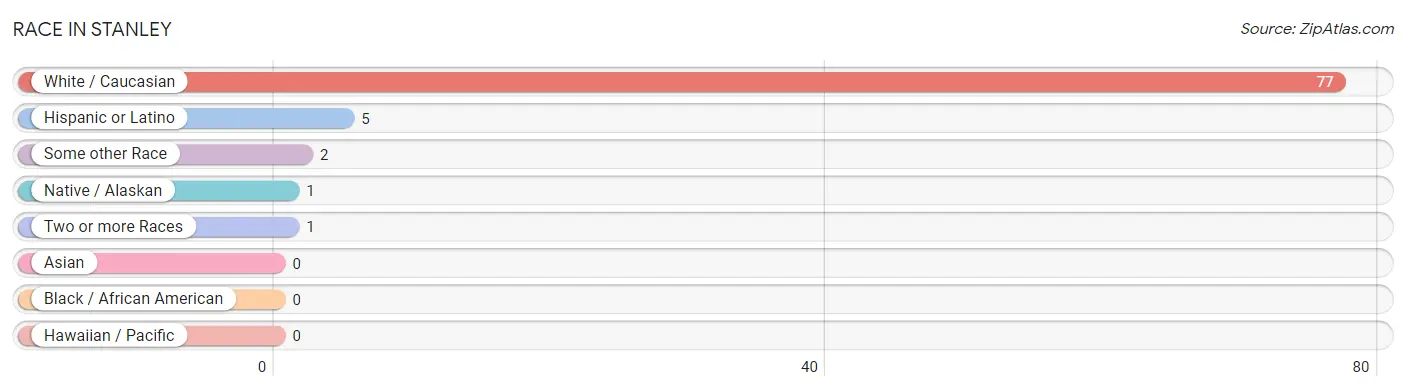
| Race | # Population | % Population |
| Asian | 0 | 0.0% |
| Black / African American | 0 | 0.0% |
| Hawaiian / Pacific | 0 | 0.0% |
| Hispanic or Latino | 5 | 6.2% |
| Native / Alaskan | 1 | 1.2% |
| White / Caucasian | 77 | 95.1% |
| Two or more Races | 1 | 1.2% |
| Some other Race | 2 | 2.5% |
| Total | 81 | 100.0% |
Ancestry in Stanley
The most populous ancestries reported in Stanley are German (28 | 34.6%), English (10 | 12.3%), French (7 | 8.6%), Irish (4 | 4.9%), and Mexican (3 | 3.7%), together accounting for 64.2% of all Stanley residents.
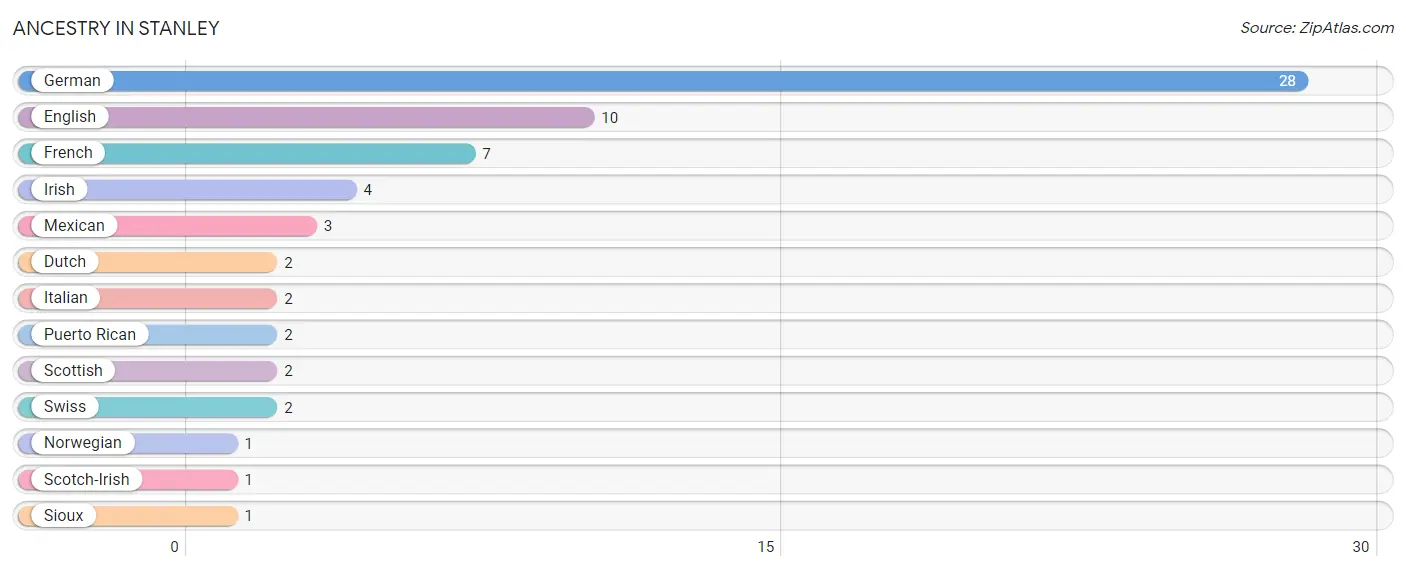
| Ancestry | # Population | % Population |
| Dutch | 2 | 2.5% |
| English | 10 | 12.3% |
| French | 7 | 8.6% |
| German | 28 | 34.6% |
| Irish | 4 | 4.9% |
| Italian | 2 | 2.5% |
| Mexican | 3 | 3.7% |
| Norwegian | 1 | 1.2% |
| Puerto Rican | 2 | 2.5% |
| Scotch-Irish | 1 | 1.2% |
| Scottish | 2 | 2.5% |
| Sioux | 1 | 1.2% |
| Swiss | 2 | 2.5% | View All 13 Rows |
Immigrants in Stanley

| Immigration Origin | # Population | % Population | View All 0 Rows |
Sex and Age in Stanley
Sex and Age in Stanley
The most populous age groups in Stanley are 40 to 44 Years (7 | 20.6%) for men and 15 to 19 Years (8 | 17.0%) for women.
| Age Bracket | Male | Female |
| Under 5 Years | 0 (0.0%) | 0 (0.0%) |
| 5 to 9 Years | 2 (5.9%) | 1 (2.1%) |
| 10 to 14 Years | 1 (2.9%) | 3 (6.4%) |
| 15 to 19 Years | 1 (2.9%) | 8 (17.0%) |
| 20 to 24 Years | 0 (0.0%) | 2 (4.3%) |
| 25 to 29 Years | 6 (17.6%) | 2 (4.3%) |
| 30 to 34 Years | 0 (0.0%) | 2 (4.3%) |
| 35 to 39 Years | 2 (5.9%) | 1 (2.1%) |
| 40 to 44 Years | 7 (20.6%) | 3 (6.4%) |
| 45 to 49 Years | 2 (5.9%) | 2 (4.3%) |
| 50 to 54 Years | 5 (14.7%) | 7 (14.9%) |
| 55 to 59 Years | 1 (2.9%) | 1 (2.1%) |
| 60 to 64 Years | 1 (2.9%) | 3 (6.4%) |
| 65 to 69 Years | 2 (5.9%) | 5 (10.6%) |
| 70 to 74 Years | 2 (5.9%) | 4 (8.5%) |
| 75 to 79 Years | 0 (0.0%) | 0 (0.0%) |
| 80 to 84 Years | 2 (5.9%) | 3 (6.4%) |
| 85 Years and over | 0 (0.0%) | 0 (0.0%) |
| Total | 34 (100.0%) | 47 (100.0%) |
Families and Households in Stanley
Median Family Size in Stanley
| Family Type | # Families | Family Size |
| Married-Couple | 18 (90.0%) | 3.11 |
| Single Male/Father | 0 (0.0%) | - |
| Single Female/Mother | 2 (10.0%) | 3.00 |
| Total Families | 20 (100.0%) | 3.10 |
Median Household Size in Stanley
| Household Type | # Households | Household Size |
| Married-Couple | 18 (48.6%) | 3.11 |
| Single Male/Father | 0 (0.0%) | - |
| Single Female/Mother | 2 (5.4%) | 4.00 |
| Non-family | 17 (46.0%) | - |
| Total Households | 37 (100.0%) | 2.19 |
Household Size by Marriage Status in Stanley
Out of a total of 37 households in Stanley, 20 (54.0%) are family households, while 17 (46.0%) are nonfamily households. The most numerous type of family households are 2-person households, comprising 10, and the most common type of nonfamily households are 1-person households, comprising 17.
| Household Size | Family Households | Nonfamily Households |
| 1-Person Households | - | 17 (46.0%) |
| 2-Person Households | 10 (27.0%) | 0 (0.0%) |
| 3-Person Households | 5 (13.5%) | 0 (0.0%) |
| 4-Person Households | 3 (8.1%) | 0 (0.0%) |
| 5-Person Households | 2 (5.4%) | 0 (0.0%) |
| 6-Person Households | 0 (0.0%) | 0 (0.0%) |
| 7+ Person Households | 0 (0.0%) | 0 (0.0%) |
| Total | 20 (54.0%) | 17 (46.0%) |
Female Fertility in Stanley
Fertility by Age in Stanley
| Age Bracket | Women with Births | Births / 1,000 Women |
| 15 to 19 years | 0 (0.0%) | 0.0 |
| 20 to 34 years | 0 (0.0%) | 0.0 |
| 35 to 50 years | 0 (0.0%) | 0.0 |
| Total | 0 (0.0%) | 0.0 |
Fertility by Age by Marriage Status in Stanley
| Age Bracket | Married | Unmarried |
| 15 to 19 years | 0 (0.0%) | 0 (0.0%) |
| 20 to 34 years | 0 (0.0%) | 0 (0.0%) |
| 35 to 50 years | 0 (0.0%) | 0 (0.0%) |
| Total | 0 (0.0%) | 0 (0.0%) |
Fertility by Education in Stanley
| Educational Attainment | Women with Births | Births / 1,000 Women |
| Less than High School | 0 (0.0%) | 0.0 |
| High School Diploma | 0 (0.0%) | 0.0 |
| College or Associate's Degree | 0 (0.0%) | 0.0 |
| Bachelor's Degree | 0 (0.0%) | 0.0 |
| Graduate Degree | 0 (0.0%) | 0.0 |
| Total | 0 (0.0%) | 0.0 |
Fertility by Education by Marriage Status in Stanley
| Educational Attainment | Married | Unmarried |
| Less than High School | 0 (0.0%) | 0 (0.0%) |
| High School Diploma | 0 (0.0%) | 0 (0.0%) |
| College or Associate's Degree | 0 (0.0%) | 0 (0.0%) |
| Bachelor's Degree | 0 (0.0%) | 0 (0.0%) |
| Graduate Degree | 0 (0.0%) | 0 (0.0%) |
| Total | 0 (0.0%) | 0 (0.0%) |
Employment Characteristics in Stanley
Employment by Class of Employer in Stanley
Among the 37 employed individuals in Stanley, private company employees (30 | 81.1%), not-for-profit organizations (5 | 13.5%), and local government employees (1 | 2.7%) make up the most common classes of employment.
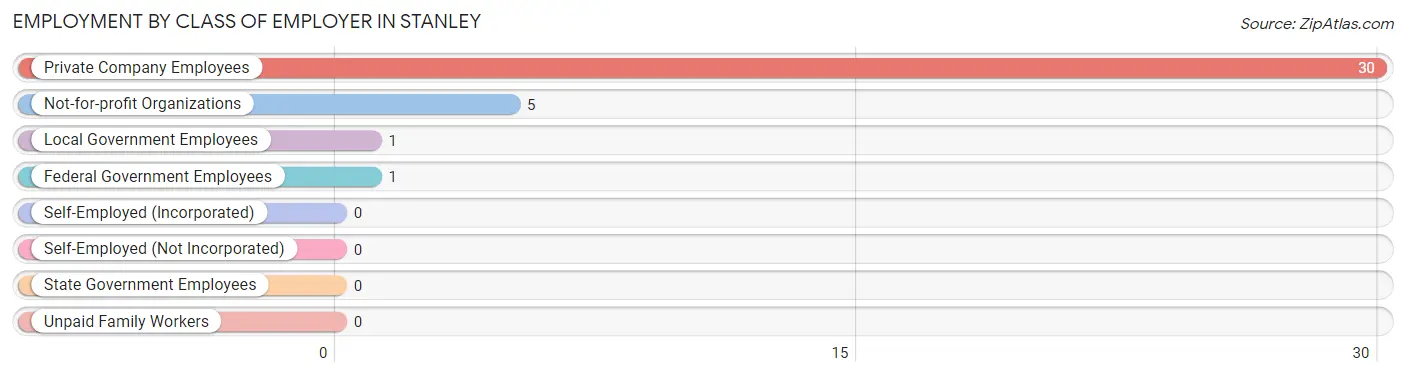
| Employer Class | # Employees | % Employees |
| Private Company Employees | 30 | 81.1% |
| Self-Employed (Incorporated) | 0 | 0.0% |
| Self-Employed (Not Incorporated) | 0 | 0.0% |
| Not-for-profit Organizations | 5 | 13.5% |
| Local Government Employees | 1 | 2.7% |
| State Government Employees | 0 | 0.0% |
| Federal Government Employees | 1 | 2.7% |
| Unpaid Family Workers | 0 | 0.0% |
| Total | 37 | 100.0% |
Employment Status by Age in Stanley
According to the labor force statistics for Stanley, out of the total population over 16 years of age (73), 72.6% or 53 individuals are in the labor force, with 30.2% or 16 of them unemployed. The age group with the highest labor force participation rate is 16 to 19 years, with 100.0% or 8 individuals in the labor force. Within the labor force, the 16 to 19 years age range has the highest percentage of unemployed individuals, with 100.0% or 8 of them being unemployed.
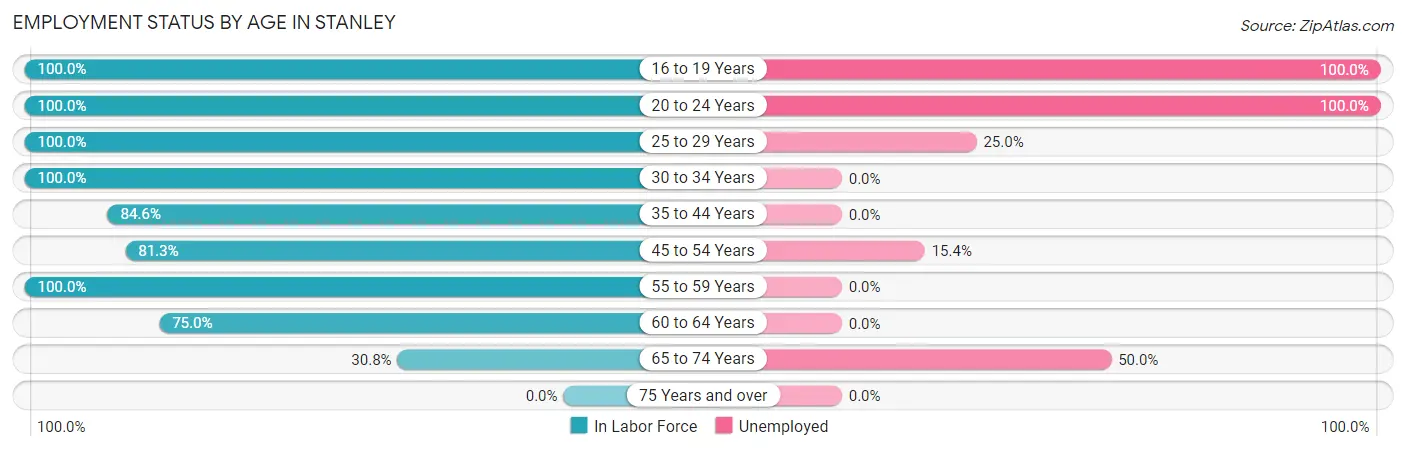
| Age Bracket | In Labor Force | Unemployed |
| 16 to 19 Years | 8 (100.0%) | 8 (100.0%) |
| 20 to 24 Years | 2 (100.0%) | 2 (100.0%) |
| 25 to 29 Years | 8 (100.0%) | 2 (25.0%) |
| 30 to 34 Years | 2 (100.0%) | 0 (0.0%) |
| 35 to 44 Years | 11 (84.6%) | 0 (0.0%) |
| 45 to 54 Years | 13 (81.3%) | 2 (15.4%) |
| 55 to 59 Years | 2 (100.0%) | 0 (0.0%) |
| 60 to 64 Years | 3 (75.0%) | 0 (0.0%) |
| 65 to 74 Years | 4 (30.8%) | 2 (50.0%) |
| 75 Years and over | 0 (0.0%) | 0 (0.0%) |
| Total | 53 (72.6%) | 16 (30.2%) |
Employment Status by Educational Attainment in Stanley
According to labor force statistics for Stanley, 86.7% of individuals (39) out of the total population between 25 and 64 years of age (45) are in the labor force, with 10.3% or 4 of them being unemployed. The group with the highest labor force participation rate are those with the educational attainment of less than high school, with 100.0% or 2 individuals in the labor force. Within the labor force, individuals with bachelor's degree or higher education have the highest percentage of unemployment, with 40.0% or 2 of them being unemployed.
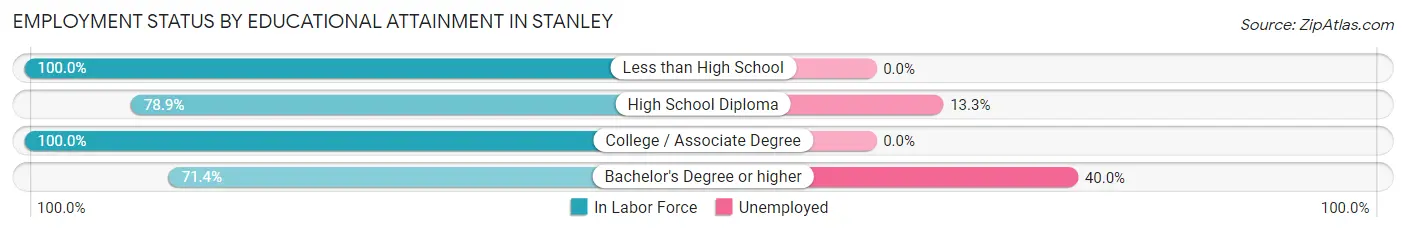
| Educational Attainment | In Labor Force | Unemployed |
| Less than High School | 2 (100.0%) | 0 (0.0%) |
| High School Diploma | 15 (78.9%) | 3 (13.3%) |
| College / Associate Degree | 17 (100.0%) | 0 (0.0%) |
| Bachelor's Degree or higher | 5 (71.4%) | 3 (40.0%) |
| Total | 39 (86.7%) | 5 (10.3%) |
Employment Occupations by Sex in Stanley
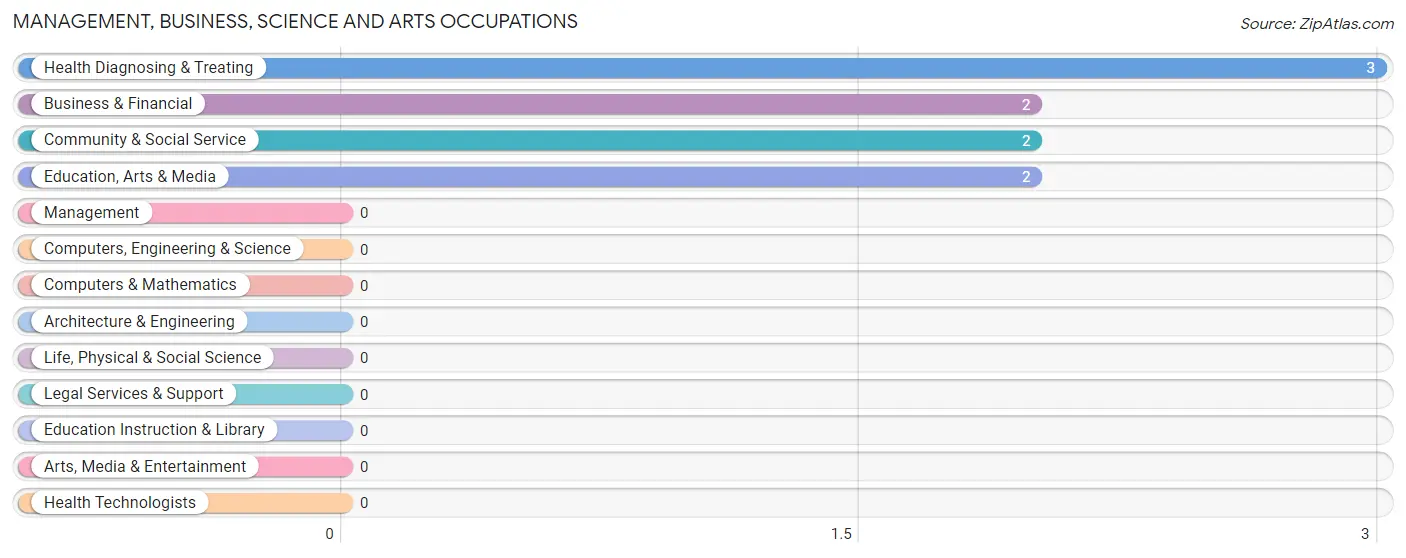
Management, Business, Science and Arts Occupations
The most common Management, Business, Science and Arts occupations in Stanley are Health Diagnosing & Treating (3 | 8.1%), Business & Financial (2 | 5.4%), Community & Social Service (2 | 5.4%), and Education, Arts & Media (2 | 5.4%).
Management, Business, Science and Arts Occupations by Sex
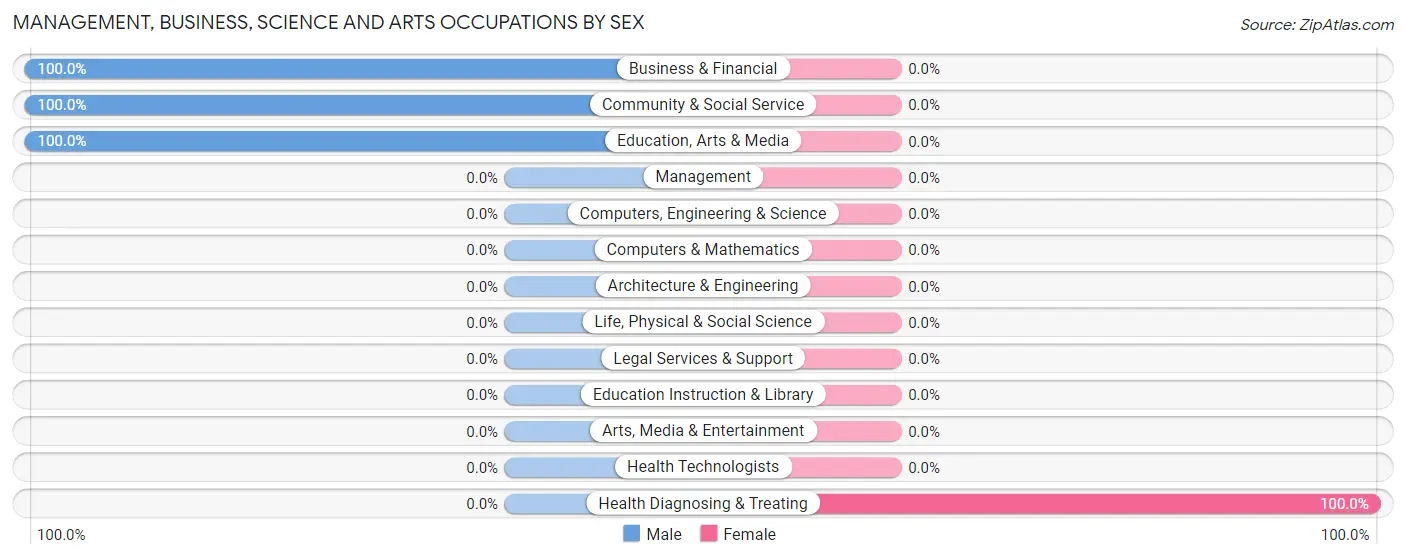
| Occupation | Male | Female |
| Management | 0 (0.0%) | 0 (0.0%) |
| Business & Financial | 2 (100.0%) | 0 (0.0%) |
| Computers, Engineering & Science | 0 (0.0%) | 0 (0.0%) |
| Computers & Mathematics | 0 (0.0%) | 0 (0.0%) |
| Architecture & Engineering | 0 (0.0%) | 0 (0.0%) |
| Life, Physical & Social Science | 0 (0.0%) | 0 (0.0%) |
| Community & Social Service | 2 (100.0%) | 0 (0.0%) |
| Education, Arts & Media | 2 (100.0%) | 0 (0.0%) |
| Legal Services & Support | 0 (0.0%) | 0 (0.0%) |
| Education Instruction & Library | 0 (0.0%) | 0 (0.0%) |
| Arts, Media & Entertainment | 0 (0.0%) | 0 (0.0%) |
| Health Diagnosing & Treating | 0 (0.0%) | 3 (100.0%) |
| Health Technologists | 0 (0.0%) | 0 (0.0%) |
| Total (Category) | 4 (57.1%) | 3 (42.9%) |
| Total (Overall) | 23 (62.2%) | 14 (37.8%) |
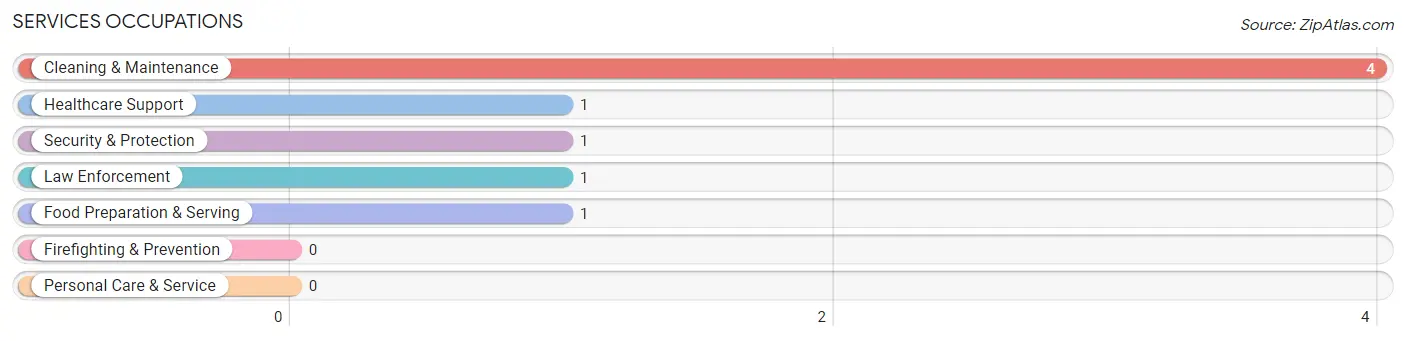
Services Occupations
The most common Services occupations in Stanley are Cleaning & Maintenance (4 | 10.8%), Healthcare Support (1 | 2.7%), Security & Protection (1 | 2.7%), Law Enforcement (1 | 2.7%), and Food Preparation & Serving (1 | 2.7%).
Services Occupations by Sex
Within the Services occupations in Stanley, the most male-oriented occupations are Security & Protection (100.0%), Law Enforcement (100.0%), and Cleaning & Maintenance (25.0%), while the most female-oriented occupations are Healthcare Support (100.0%), Food Preparation & Serving (100.0%), and Cleaning & Maintenance (75.0%).
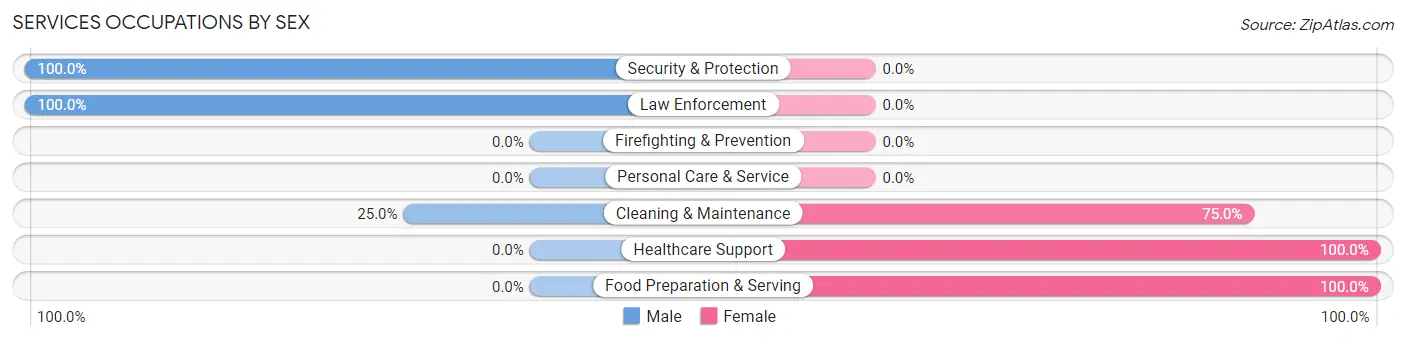
| Occupation | Male | Female |
| Healthcare Support | 0 (0.0%) | 1 (100.0%) |
| Security & Protection | 1 (100.0%) | 0 (0.0%) |
| Firefighting & Prevention | 0 (0.0%) | 0 (0.0%) |
| Law Enforcement | 1 (100.0%) | 0 (0.0%) |
| Food Preparation & Serving | 0 (0.0%) | 1 (100.0%) |
| Cleaning & Maintenance | 1 (25.0%) | 3 (75.0%) |
| Personal Care & Service | 0 (0.0%) | 0 (0.0%) |
| Total (Category) | 2 (28.6%) | 5 (71.4%) |
| Total (Overall) | 23 (62.2%) | 14 (37.8%) |
Sales and Office Occupations
The most common Sales and Office occupations in Stanley are Sales & Related (2 | 5.4%), and Office & Administration (2 | 5.4%).
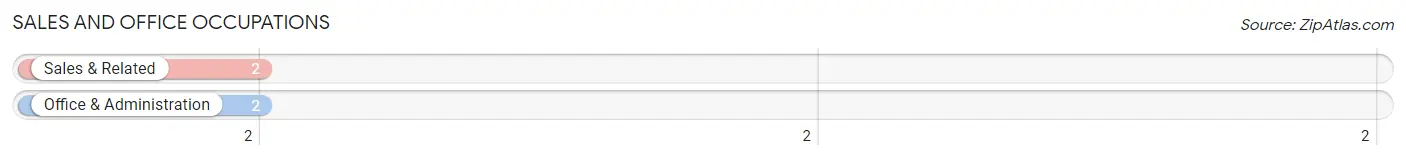
Sales and Office Occupations by Sex
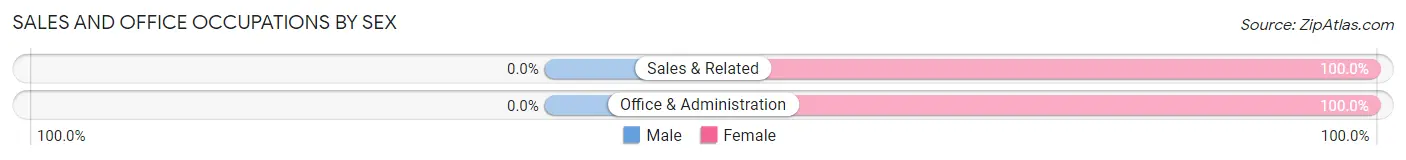
| Occupation | Male | Female |
| Sales & Related | 0 (0.0%) | 2 (100.0%) |
| Office & Administration | 0 (0.0%) | 2 (100.0%) |
| Total (Category) | 0 (0.0%) | 4 (100.0%) |
| Total (Overall) | 23 (62.2%) | 14 (37.8%) |
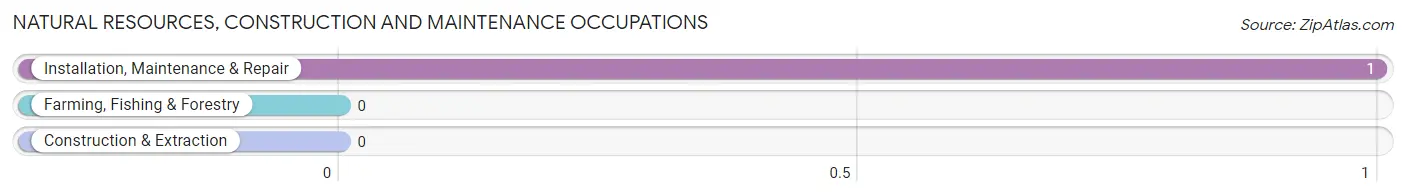
Natural Resources, Construction and Maintenance Occupations
The most common Natural Resources, Construction and Maintenance occupations in Stanley are , and Installation, Maintenance & Repair (1 | 2.7%).
Natural Resources, Construction and Maintenance Occupations by Sex
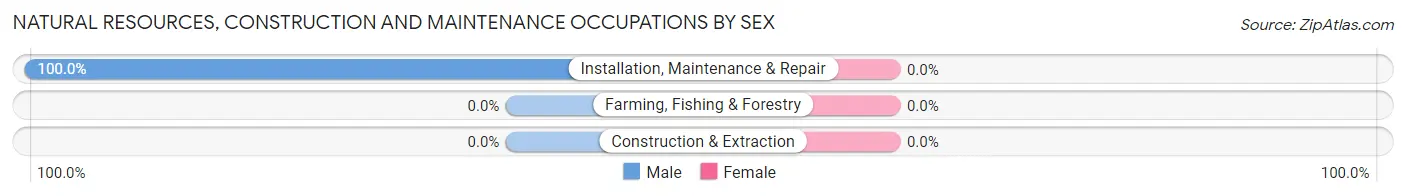
| Occupation | Male | Female |
| Farming, Fishing & Forestry | 0 (0.0%) | 0 (0.0%) |
| Construction & Extraction | 0 (0.0%) | 0 (0.0%) |
| Installation, Maintenance & Repair | 1 (100.0%) | 0 (0.0%) |
| Total (Category) | 1 (100.0%) | 0 (0.0%) |
| Total (Overall) | 23 (62.2%) | 14 (37.8%) |
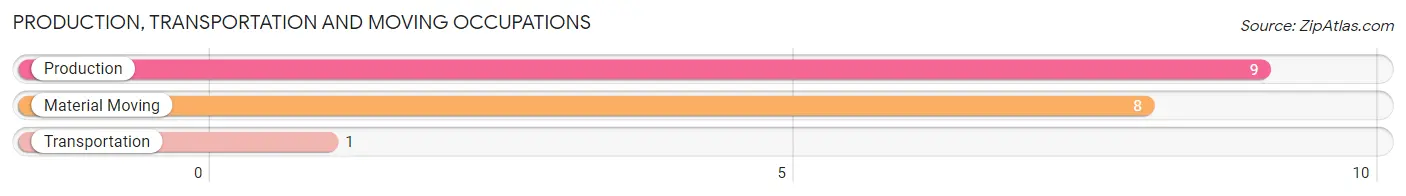
Production, Transportation and Moving Occupations
The most common Production, Transportation and Moving occupations in Stanley are Production (9 | 24.3%), Material Moving (8 | 21.6%), and Transportation (1 | 2.7%).
Production, Transportation and Moving Occupations by Sex
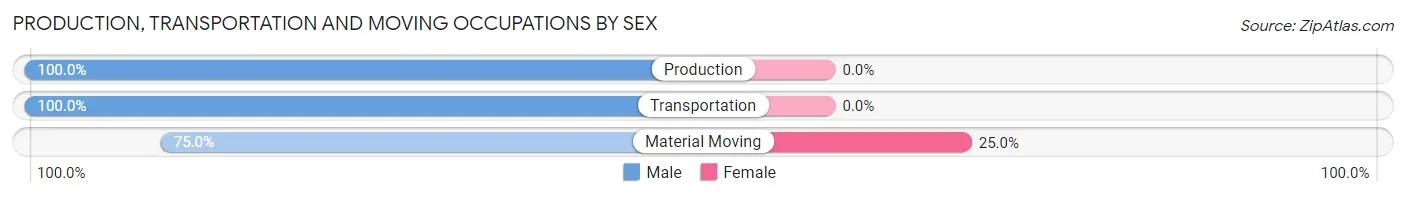
| Occupation | Male | Female |
| Production | 9 (100.0%) | 0 (0.0%) |
| Transportation | 1 (100.0%) | 0 (0.0%) |
| Material Moving | 6 (75.0%) | 2 (25.0%) |
| Total (Category) | 16 (88.9%) | 2 (11.1%) |
| Total (Overall) | 23 (62.2%) | 14 (37.8%) |
Employment Industries by Sex in Stanley
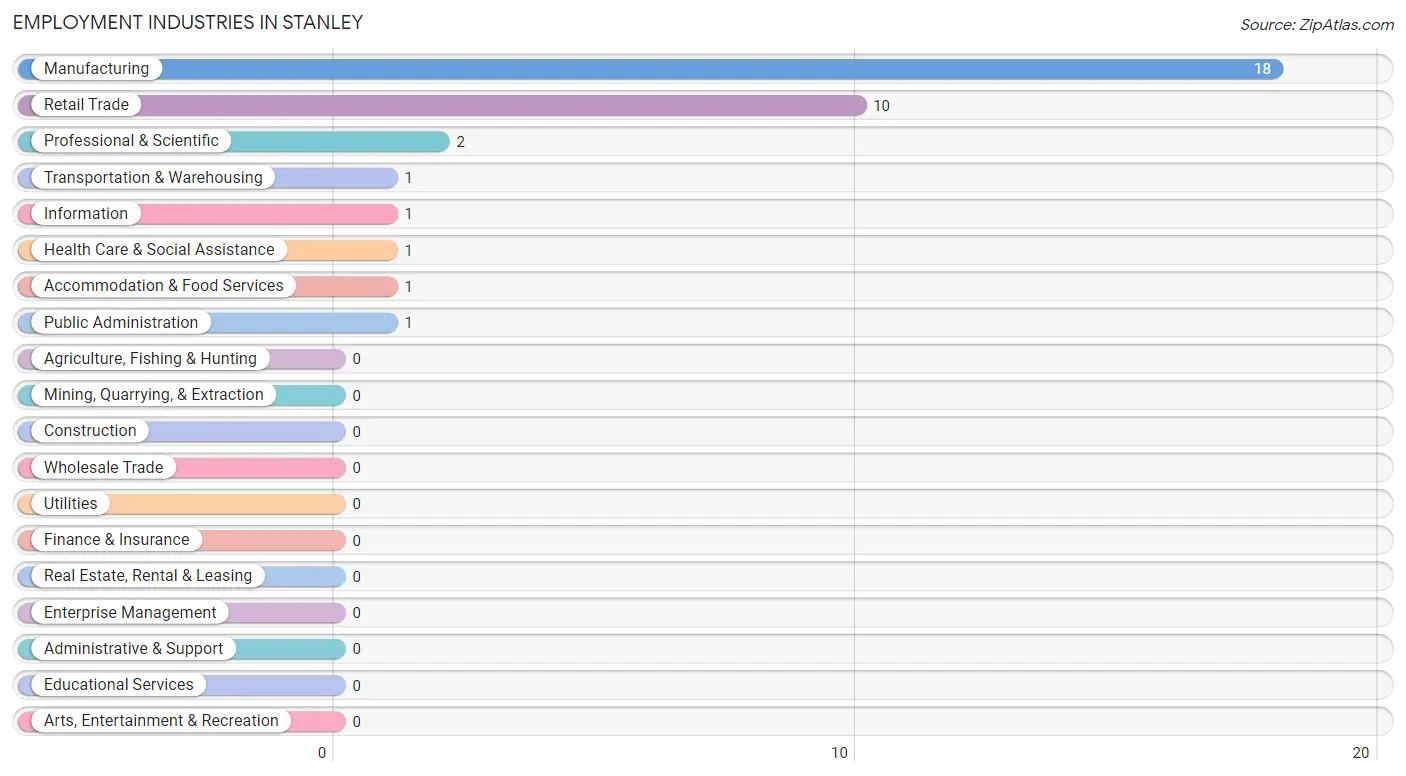
Employment Industries in Stanley
The major employment industries in Stanley include Manufacturing (18 | 48.6%), Retail Trade (10 | 27.0%), Professional & Scientific (2 | 5.4%), Transportation & Warehousing (1 | 2.7%), and Information (1 | 2.7%).
Employment Industries by Sex in Stanley
The Stanley industries that see more men than women are Professional & Scientific (100.0%), Public Administration (100.0%), and Manufacturing (94.4%), whereas the industries that tend to have a higher number of women are Transportation & Warehousing (100.0%), Information (100.0%), and Health Care & Social Assistance (100.0%).
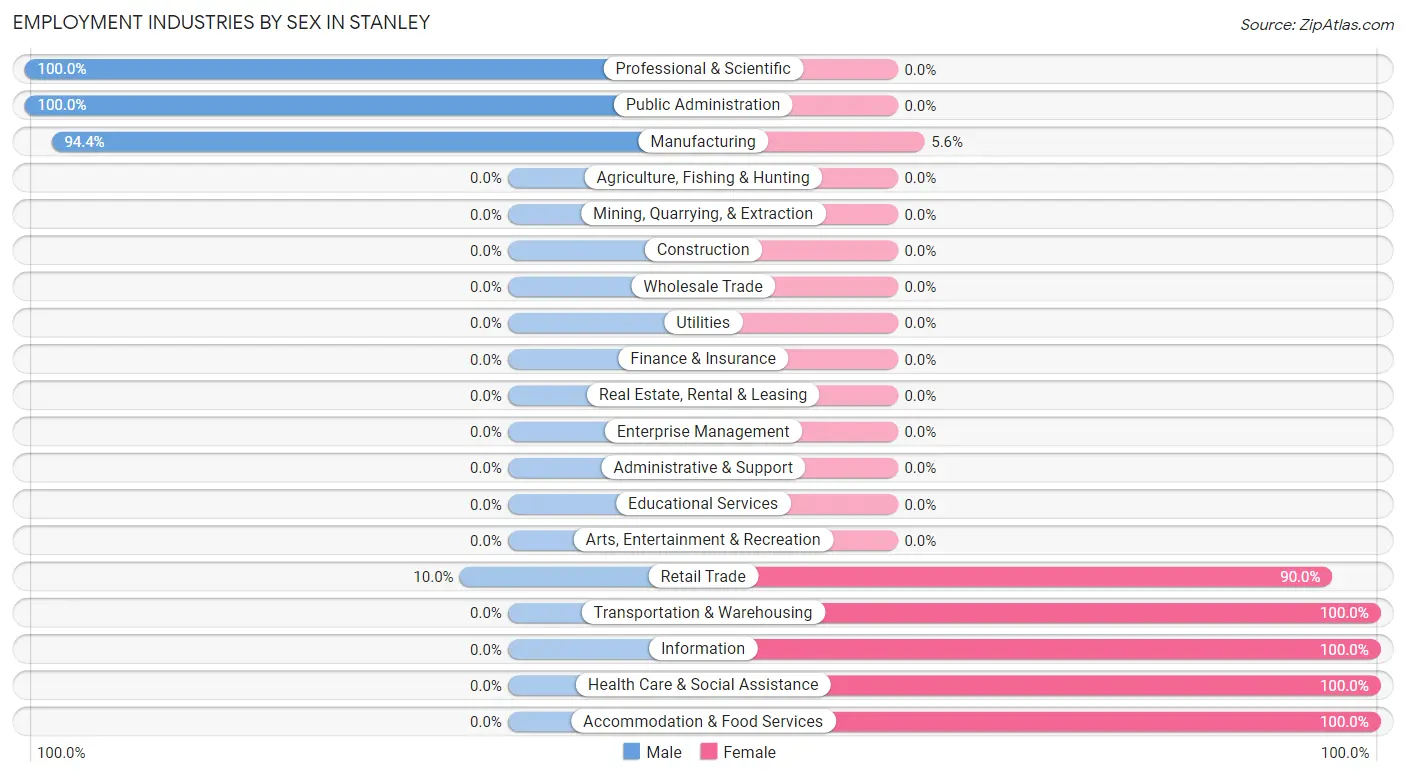
| Industry | Male | Female |
| Agriculture, Fishing & Hunting | 0 (0.0%) | 0 (0.0%) |
| Mining, Quarrying, & Extraction | 0 (0.0%) | 0 (0.0%) |
| Construction | 0 (0.0%) | 0 (0.0%) |
| Manufacturing | 17 (94.4%) | 1 (5.6%) |
| Wholesale Trade | 0 (0.0%) | 0 (0.0%) |
| Retail Trade | 1 (10.0%) | 9 (90.0%) |
| Transportation & Warehousing | 0 (0.0%) | 1 (100.0%) |
| Utilities | 0 (0.0%) | 0 (0.0%) |
| Information | 0 (0.0%) | 1 (100.0%) |
| Finance & Insurance | 0 (0.0%) | 0 (0.0%) |
| Real Estate, Rental & Leasing | 0 (0.0%) | 0 (0.0%) |
| Professional & Scientific | 2 (100.0%) | 0 (0.0%) |
| Enterprise Management | 0 (0.0%) | 0 (0.0%) |
| Administrative & Support | 0 (0.0%) | 0 (0.0%) |
| Educational Services | 0 (0.0%) | 0 (0.0%) |
| Health Care & Social Assistance | 0 (0.0%) | 1 (100.0%) |
| Arts, Entertainment & Recreation | 0 (0.0%) | 0 (0.0%) |
| Accommodation & Food Services | 0 (0.0%) | 1 (100.0%) |
| Public Administration | 1 (100.0%) | 0 (0.0%) |
| Total | 23 (62.2%) | 14 (37.8%) |
Education in Stanley
School Enrollment in Stanley
The most common levels of schooling among the 15 students in Stanley are high school (9 | 60.0%), middle school (4 | 26.7%), and elementary school (2 | 13.3%).
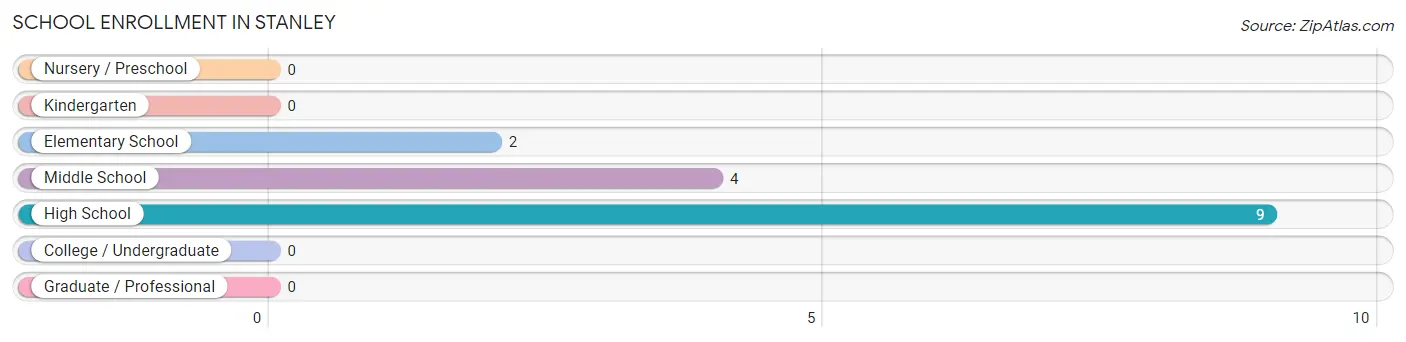
| School Level | # Students | % Students |
| Nursery / Preschool | 0 | 0.0% |
| Kindergarten | 0 | 0.0% |
| Elementary School | 2 | 13.3% |
| Middle School | 4 | 26.7% |
| High School | 9 | 60.0% |
| College / Undergraduate | 0 | 0.0% |
| Graduate / Professional | 0 | 0.0% |
| Total | 15 | 100.0% |
School Enrollment by Age by Funding Source in Stanley
Out of a total of 15 students who are enrolled in schools in Stanley, 8 (53.3%) attend a private institution, while the remaining 7 (46.7%) are enrolled in public schools. The age group of 18 to 19 year olds has the highest likelihood of being enrolled in private schools, with 8 (100.0% in the age bracket) enrolled. Conversely, the age group of 5 to 9 year old has the lowest likelihood of being enrolled in a private school, with 2 (100.0% in the age bracket) attending a public institution.
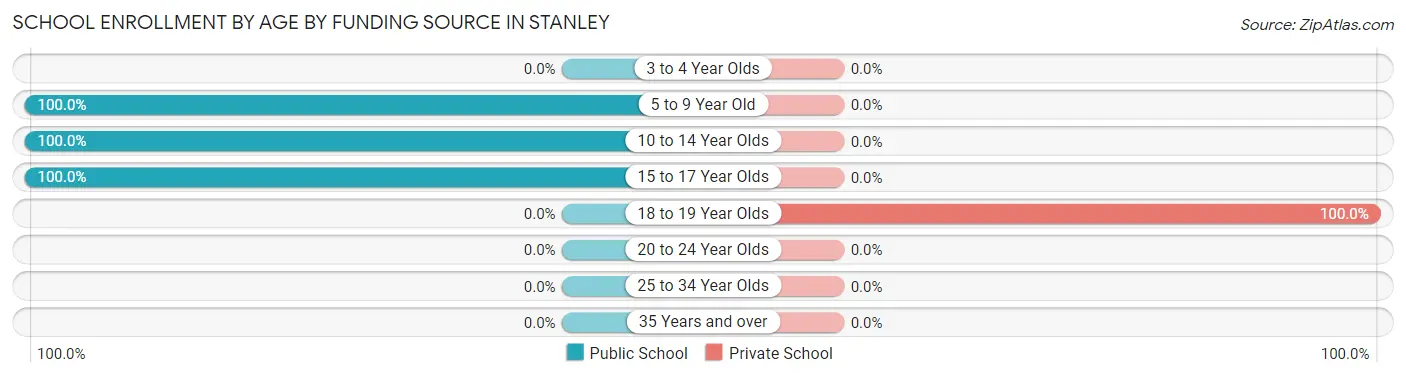
| Age Bracket | Public School | Private School |
| 3 to 4 Year Olds | 0 (0.0%) | 0 (0.0%) |
| 5 to 9 Year Old | 2 (100.0%) | 0 (0.0%) |
| 10 to 14 Year Olds | 4 (100.0%) | 0 (0.0%) |
| 15 to 17 Year Olds | 1 (100.0%) | 0 (0.0%) |
| 18 to 19 Year Olds | 0 (0.0%) | 8 (100.0%) |
| 20 to 24 Year Olds | 0 (0.0%) | 0 (0.0%) |
| 25 to 34 Year Olds | 0 (0.0%) | 0 (0.0%) |
| 35 Years and over | 0 (0.0%) | 0 (0.0%) |
| Total | 7 (46.7%) | 8 (53.3%) |
Educational Attainment by Field of Study in Stanley
Business (4 | 36.4%), education (3 | 27.3%), liberal arts & history (3 | 27.3%), and science & technology (1 | 9.1%) are the most common fields of study among 11 individuals in Stanley who have obtained a bachelor's degree or higher.
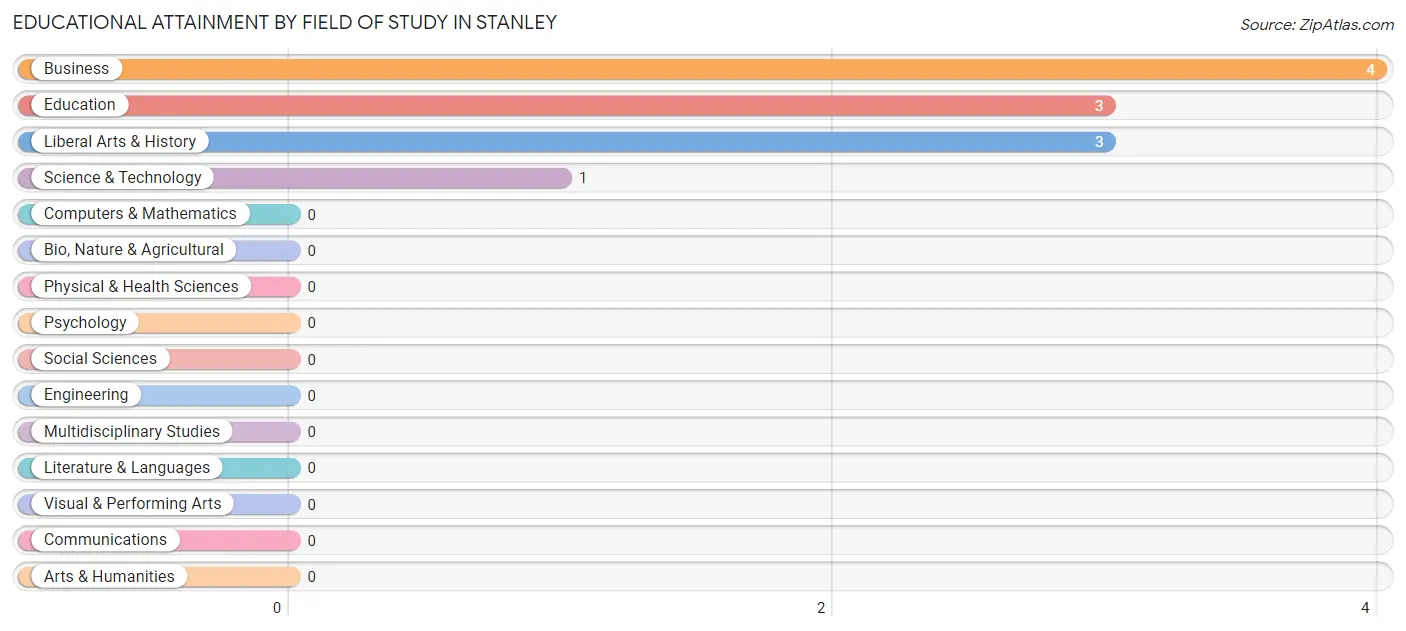
| Field of Study | # Graduates | % Graduates |
| Computers & Mathematics | 0 | 0.0% |
| Bio, Nature & Agricultural | 0 | 0.0% |
| Physical & Health Sciences | 0 | 0.0% |
| Psychology | 0 | 0.0% |
| Social Sciences | 0 | 0.0% |
| Engineering | 0 | 0.0% |
| Multidisciplinary Studies | 0 | 0.0% |
| Science & Technology | 1 | 9.1% |
| Business | 4 | 36.4% |
| Education | 3 | 27.3% |
| Literature & Languages | 0 | 0.0% |
| Liberal Arts & History | 3 | 27.3% |
| Visual & Performing Arts | 0 | 0.0% |
| Communications | 0 | 0.0% |
| Arts & Humanities | 0 | 0.0% |
| Total | 11 | 100.0% |
Transportation & Commute in Stanley
Vehicle Availability by Sex in Stanley
The most prevalent vehicle ownership categories in Stanley are males with 2 vehicles (14, accounting for 60.9%) and females with 2 vehicles (7, making up 100.0%).
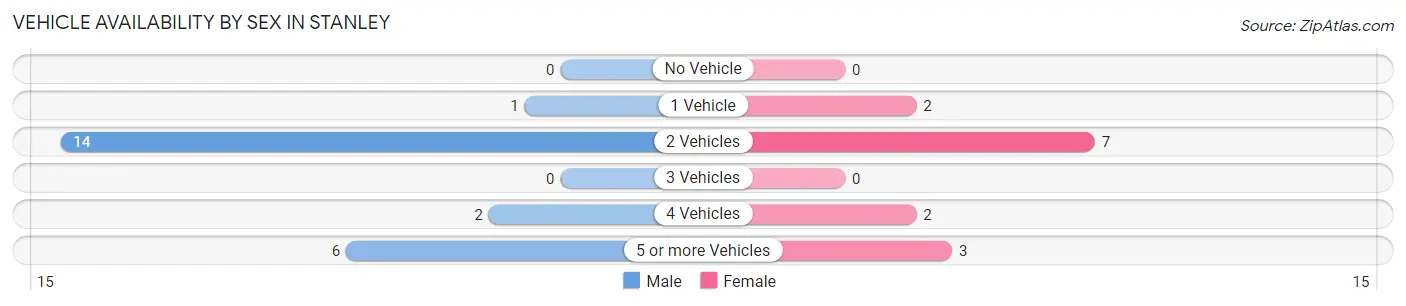
| Vehicles Available | Male | Female |
| No Vehicle | 0 (0.0%) | 0 (0.0%) |
| 1 Vehicle | 1 (4.3%) | 2 (14.3%) |
| 2 Vehicles | 14 (60.9%) | 7 (50.0%) |
| 3 Vehicles | 0 (0.0%) | 0 (0.0%) |
| 4 Vehicles | 2 (8.7%) | 2 (14.3%) |
| 5 or more Vehicles | 6 (26.1%) | 3 (21.4%) |
| Total | 23 (100.0%) | 14 (100.0%) |
Commute Time in Stanley
The most frequently occuring commute durations in Stanley are 20 to 24 minutes (8 commuters, 22.9%), 10 to 14 minutes (6 commuters, 17.1%), and 15 to 19 minutes (5 commuters, 14.3%).
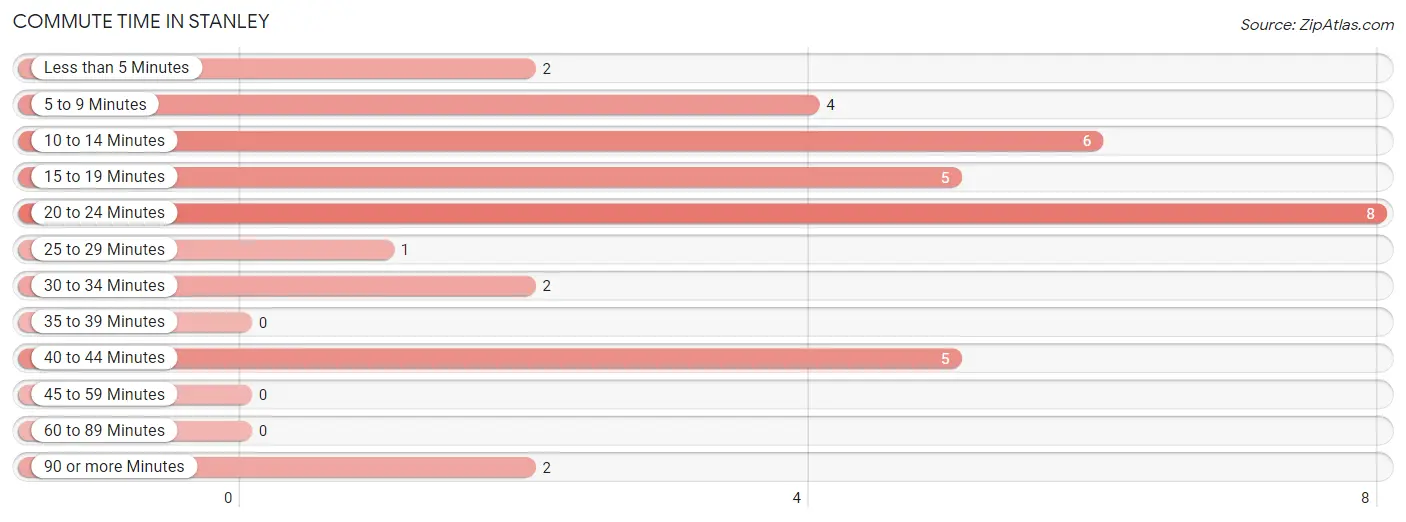
| Commute Time | # Commuters | % Commuters |
| Less than 5 Minutes | 2 | 5.7% |
| 5 to 9 Minutes | 4 | 11.4% |
| 10 to 14 Minutes | 6 | 17.1% |
| 15 to 19 Minutes | 5 | 14.3% |
| 20 to 24 Minutes | 8 | 22.9% |
| 25 to 29 Minutes | 1 | 2.9% |
| 30 to 34 Minutes | 2 | 5.7% |
| 35 to 39 Minutes | 0 | 0.0% |
| 40 to 44 Minutes | 5 | 14.3% |
| 45 to 59 Minutes | 0 | 0.0% |
| 60 to 89 Minutes | 0 | 0.0% |
| 90 or more Minutes | 2 | 5.7% |
Commute Time by Sex in Stanley
The most common commute times in Stanley are 10 to 14 minutes (6 commuters, 28.6%) for males and 15 to 19 minutes (4 commuters, 28.6%) for females.
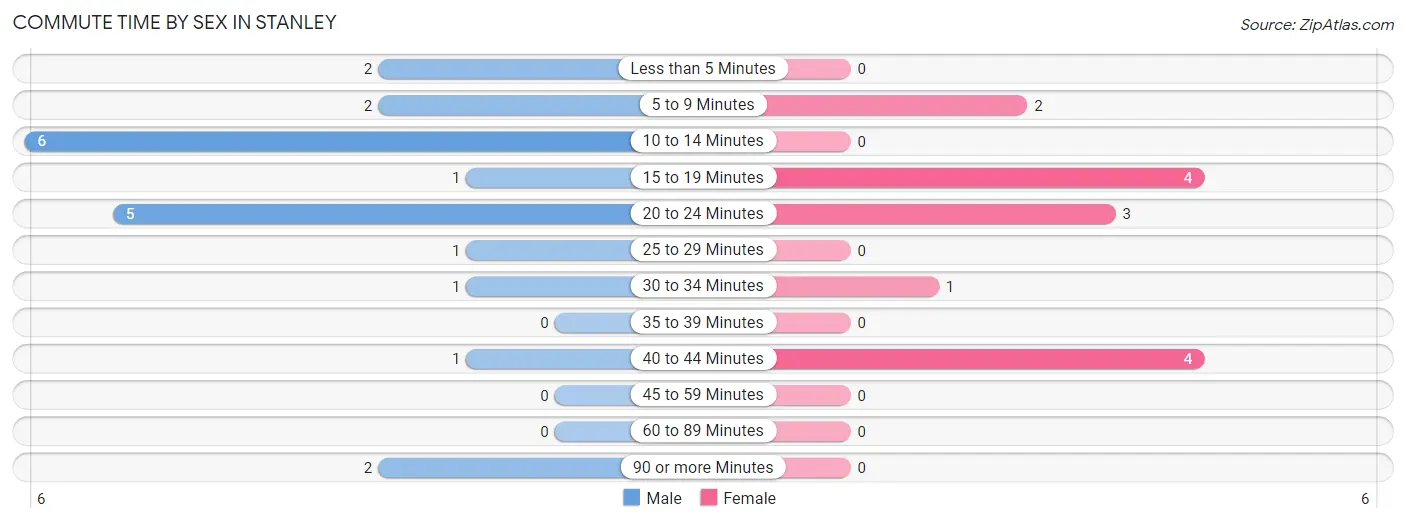
| Commute Time | Male | Female |
| Less than 5 Minutes | 2 (9.5%) | 0 (0.0%) |
| 5 to 9 Minutes | 2 (9.5%) | 2 (14.3%) |
| 10 to 14 Minutes | 6 (28.6%) | 0 (0.0%) |
| 15 to 19 Minutes | 1 (4.8%) | 4 (28.6%) |
| 20 to 24 Minutes | 5 (23.8%) | 3 (21.4%) |
| 25 to 29 Minutes | 1 (4.8%) | 0 (0.0%) |
| 30 to 34 Minutes | 1 (4.8%) | 1 (7.1%) |
| 35 to 39 Minutes | 0 (0.0%) | 0 (0.0%) |
| 40 to 44 Minutes | 1 (4.8%) | 4 (28.6%) |
| 45 to 59 Minutes | 0 (0.0%) | 0 (0.0%) |
| 60 to 89 Minutes | 0 (0.0%) | 0 (0.0%) |
| 90 or more Minutes | 2 (9.5%) | 0 (0.0%) |
Time of Departure to Work by Sex in Stanley
The most frequent times of departure to work in Stanley are 4:00 PM to 11:59 PM (8, 38.1%) for males and 7:30 AM to 7:59 AM (5, 35.7%) for females.
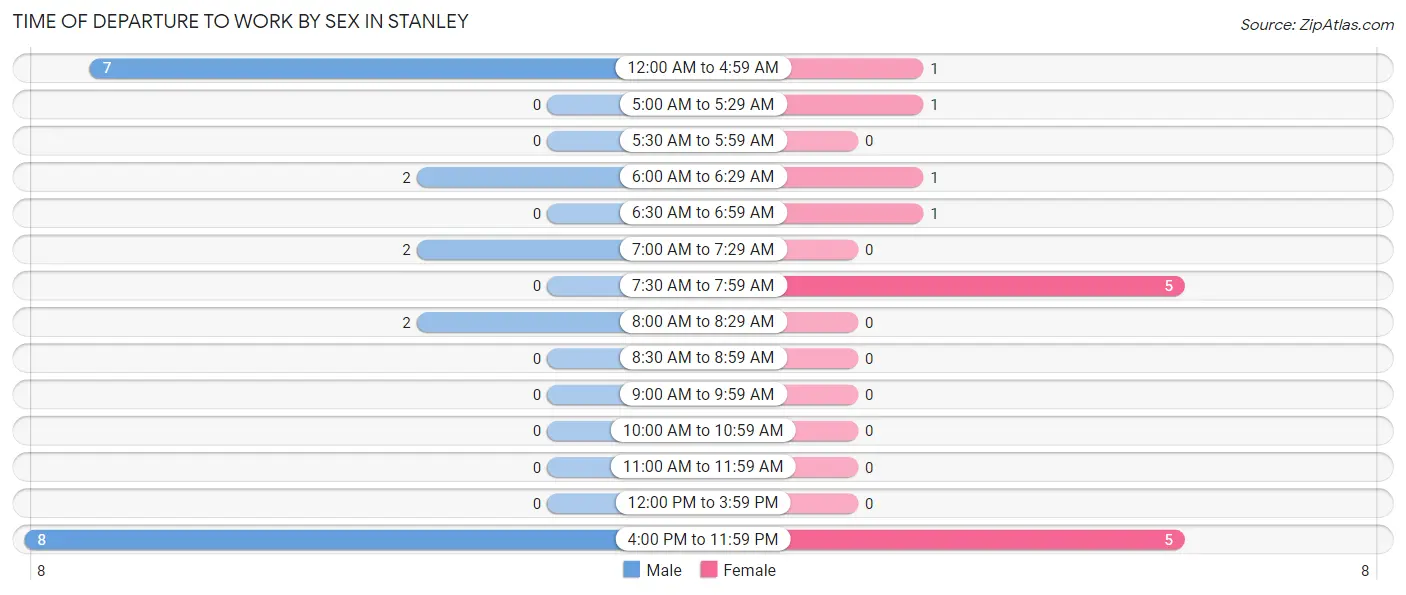
| Time of Departure | Male | Female |
| 12:00 AM to 4:59 AM | 7 (33.3%) | 1 (7.1%) |
| 5:00 AM to 5:29 AM | 0 (0.0%) | 1 (7.1%) |
| 5:30 AM to 5:59 AM | 0 (0.0%) | 0 (0.0%) |
| 6:00 AM to 6:29 AM | 2 (9.5%) | 1 (7.1%) |
| 6:30 AM to 6:59 AM | 0 (0.0%) | 1 (7.1%) |
| 7:00 AM to 7:29 AM | 2 (9.5%) | 0 (0.0%) |
| 7:30 AM to 7:59 AM | 0 (0.0%) | 5 (35.7%) |
| 8:00 AM to 8:29 AM | 2 (9.5%) | 0 (0.0%) |
| 8:30 AM to 8:59 AM | 0 (0.0%) | 0 (0.0%) |
| 9:00 AM to 9:59 AM | 0 (0.0%) | 0 (0.0%) |
| 10:00 AM to 10:59 AM | 0 (0.0%) | 0 (0.0%) |
| 11:00 AM to 11:59 AM | 0 (0.0%) | 0 (0.0%) |
| 12:00 PM to 3:59 PM | 0 (0.0%) | 0 (0.0%) |
| 4:00 PM to 11:59 PM | 8 (38.1%) | 5 (35.7%) |
| Total | 21 (100.0%) | 14 (100.0%) |
Housing Occupancy in Stanley
Occupancy by Ownership in Stanley
Of the total 37 dwellings in Stanley, owner-occupied units account for 28 (75.7%), while renter-occupied units make up 9 (24.3%).
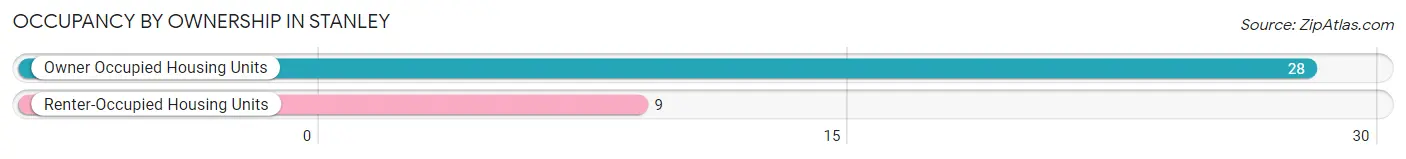
| Occupancy | # Housing Units | % Housing Units |
| Owner Occupied Housing Units | 28 | 75.7% |
| Renter-Occupied Housing Units | 9 | 24.3% |
| Total Occupied Housing Units | 37 | 100.0% |
Occupancy by Household Size in Stanley
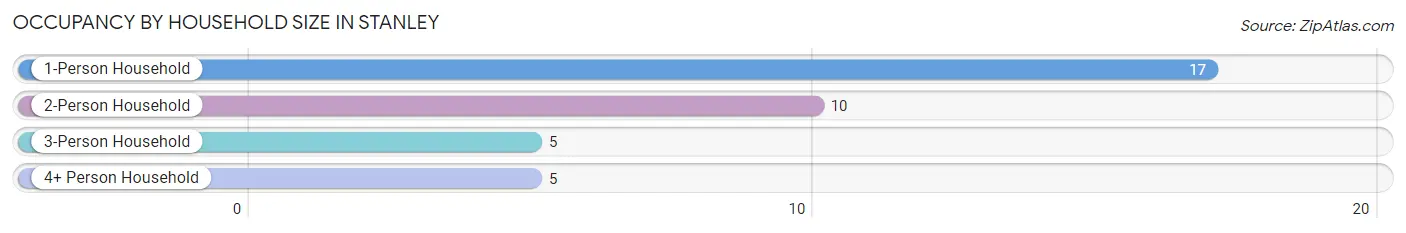
| Household Size | # Housing Units | % Housing Units |
| 1-Person Household | 17 | 46.0% |
| 2-Person Household | 10 | 27.0% |
| 3-Person Household | 5 | 13.5% |
| 4+ Person Household | 5 | 13.5% |
| Total Housing Units | 37 | 100.0% |
Occupancy by Ownership by Household Size in Stanley
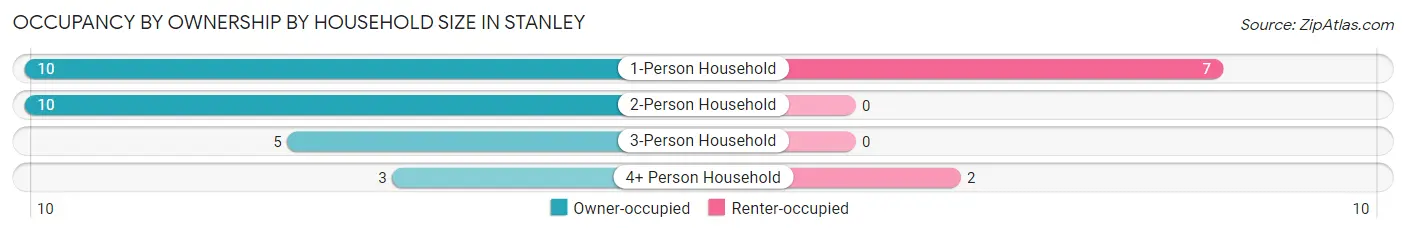
| Household Size | Owner-occupied | Renter-occupied |
| 1-Person Household | 10 (58.8%) | 7 (41.2%) |
| 2-Person Household | 10 (100.0%) | 0 (0.0%) |
| 3-Person Household | 5 (100.0%) | 0 (0.0%) |
| 4+ Person Household | 3 (60.0%) | 2 (40.0%) |
| Total Housing Units | 28 (75.7%) | 9 (24.3%) |
Occupancy by Educational Attainment in Stanley
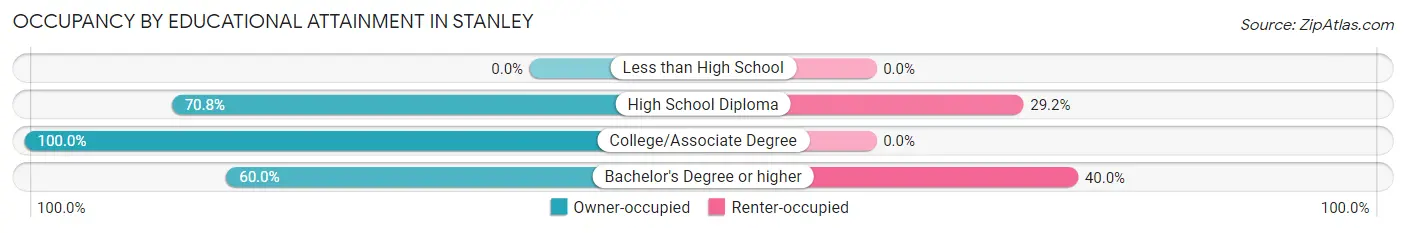
| Household Size | Owner-occupied | Renter-occupied |
| Less than High School | 0 (0.0%) | 0 (0.0%) |
| High School Diploma | 17 (70.8%) | 7 (29.2%) |
| College/Associate Degree | 8 (100.0%) | 0 (0.0%) |
| Bachelor's Degree or higher | 3 (60.0%) | 2 (40.0%) |
Occupancy by Age of Householder in Stanley
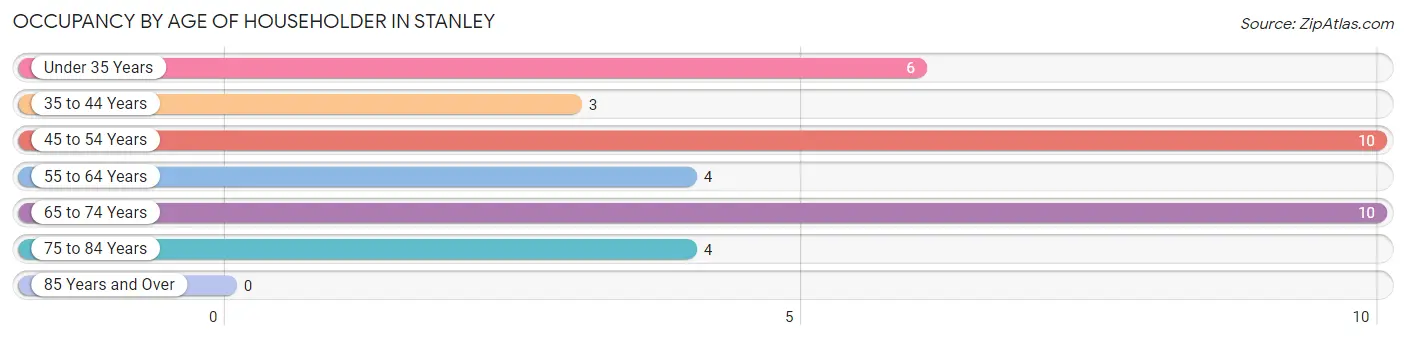
| Age Bracket | # Households | % Households |
| Under 35 Years | 6 | 16.2% |
| 35 to 44 Years | 3 | 8.1% |
| 45 to 54 Years | 10 | 27.0% |
| 55 to 64 Years | 4 | 10.8% |
| 65 to 74 Years | 10 | 27.0% |
| 75 to 84 Years | 4 | 10.8% |
| 85 Years and Over | 0 | 0.0% |
| Total | 37 | 100.0% |
Housing Finances in Stanley
Median Income by Occupancy in Stanley
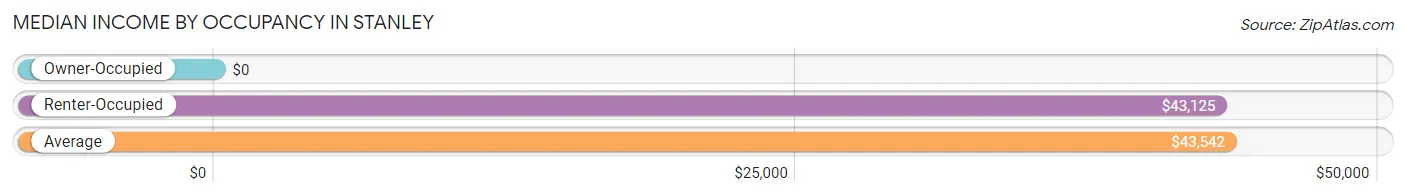
| Occupancy Type | # Households | Median Income |
| Owner-Occupied | 28 (75.7%) | $0 |
| Renter-Occupied | 9 (24.3%) | $43,125 |
| Average | 37 (100.0%) | $43,542 |
Occupancy by Householder Income Bracket in Stanley
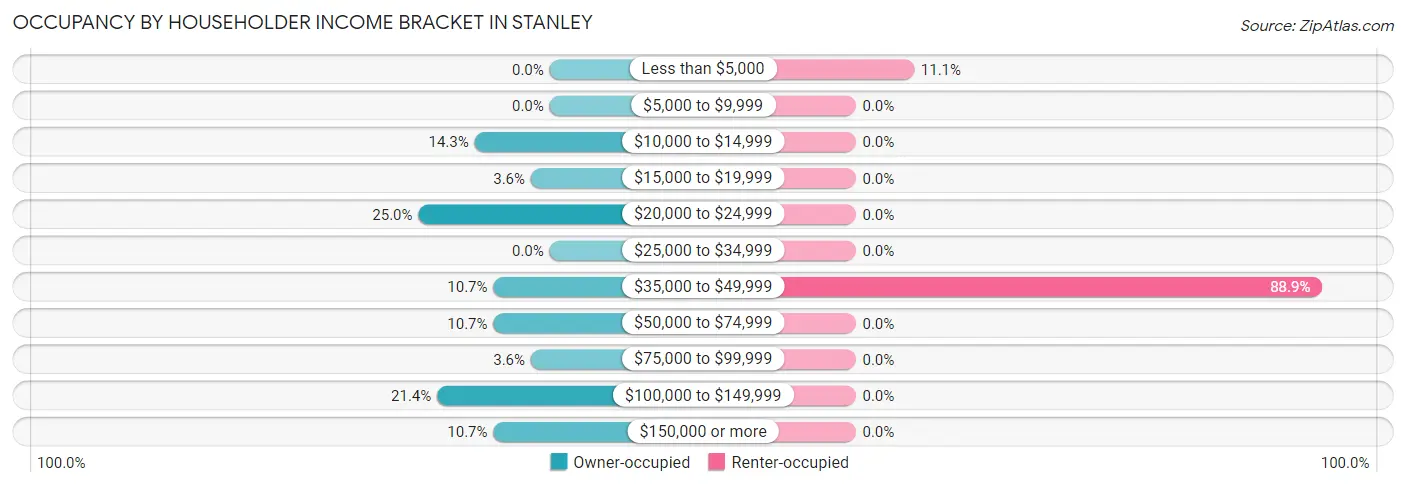
| Income Bracket | Owner-occupied | Renter-occupied |
| Less than $5,000 | 0 (0.0%) | 1 (11.1%) |
| $5,000 to $9,999 | 0 (0.0%) | 0 (0.0%) |
| $10,000 to $14,999 | 4 (14.3%) | 0 (0.0%) |
| $15,000 to $19,999 | 1 (3.6%) | 0 (0.0%) |
| $20,000 to $24,999 | 7 (25.0%) | 0 (0.0%) |
| $25,000 to $34,999 | 0 (0.0%) | 0 (0.0%) |
| $35,000 to $49,999 | 3 (10.7%) | 8 (88.9%) |
| $50,000 to $74,999 | 3 (10.7%) | 0 (0.0%) |
| $75,000 to $99,999 | 1 (3.6%) | 0 (0.0%) |
| $100,000 to $149,999 | 6 (21.4%) | 0 (0.0%) |
| $150,000 or more | 3 (10.7%) | 0 (0.0%) |
| Total | 28 (100.0%) | 9 (100.0%) |
Monthly Housing Cost Tiers in Stanley
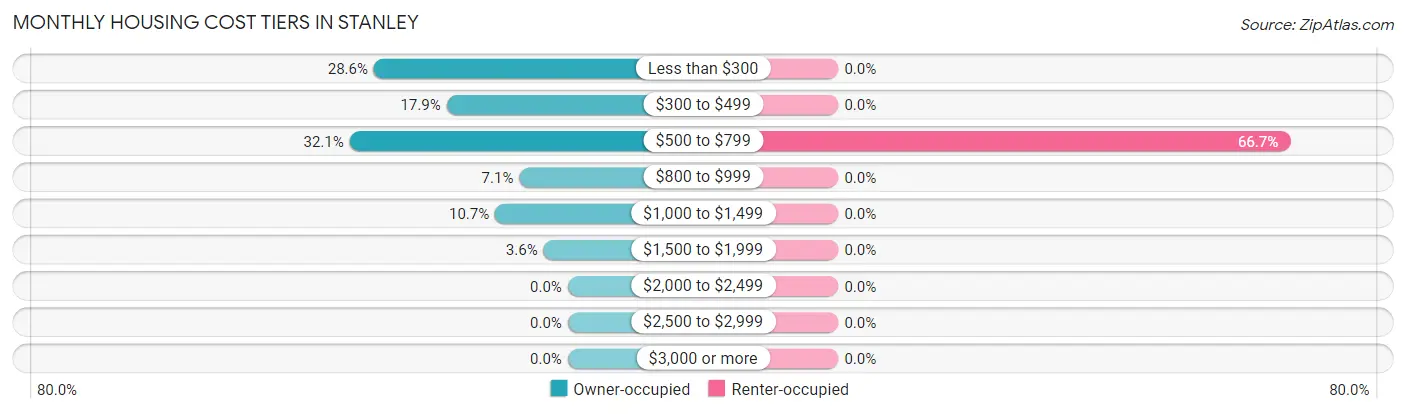
| Monthly Cost | Owner-occupied | Renter-occupied |
| Less than $300 | 8 (28.6%) | 0 (0.0%) |
| $300 to $499 | 5 (17.9%) | 0 (0.0%) |
| $500 to $799 | 9 (32.1%) | 6 (66.7%) |
| $800 to $999 | 2 (7.1%) | 0 (0.0%) |
| $1,000 to $1,499 | 3 (10.7%) | 0 (0.0%) |
| $1,500 to $1,999 | 1 (3.6%) | 0 (0.0%) |
| $2,000 to $2,499 | 0 (0.0%) | 0 (0.0%) |
| $2,500 to $2,999 | 0 (0.0%) | 0 (0.0%) |
| $3,000 or more | 0 (0.0%) | 0 (0.0%) |
| Total | 28 (100.0%) | 9 (100.0%) |
Physical Housing Characteristics in Stanley
Housing Structures in Stanley
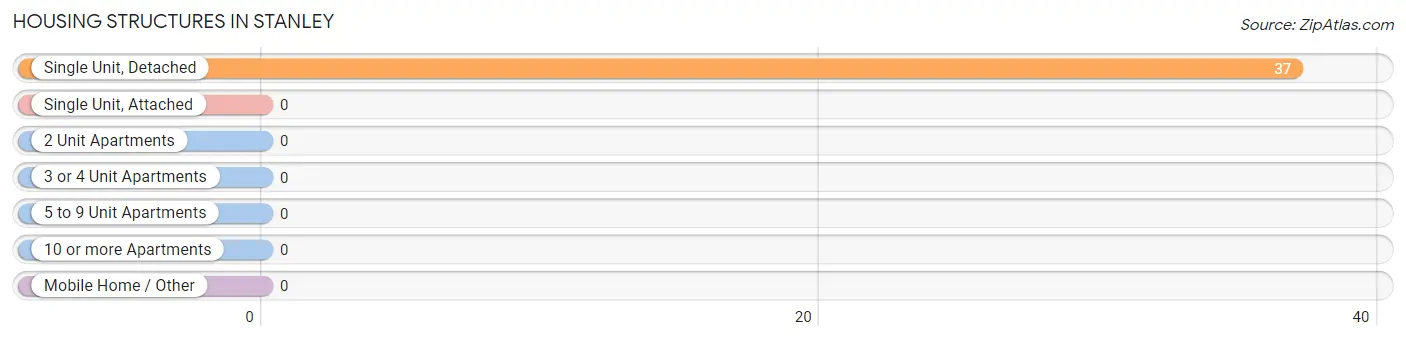
| Structure Type | # Housing Units | % Housing Units |
| Single Unit, Detached | 37 | 100.0% |
| Single Unit, Attached | 0 | 0.0% |
| 2 Unit Apartments | 0 | 0.0% |
| 3 or 4 Unit Apartments | 0 | 0.0% |
| 5 to 9 Unit Apartments | 0 | 0.0% |
| 10 or more Apartments | 0 | 0.0% |
| Mobile Home / Other | 0 | 0.0% |
| Total | 37 | 100.0% |
Housing Structures by Occupancy in Stanley
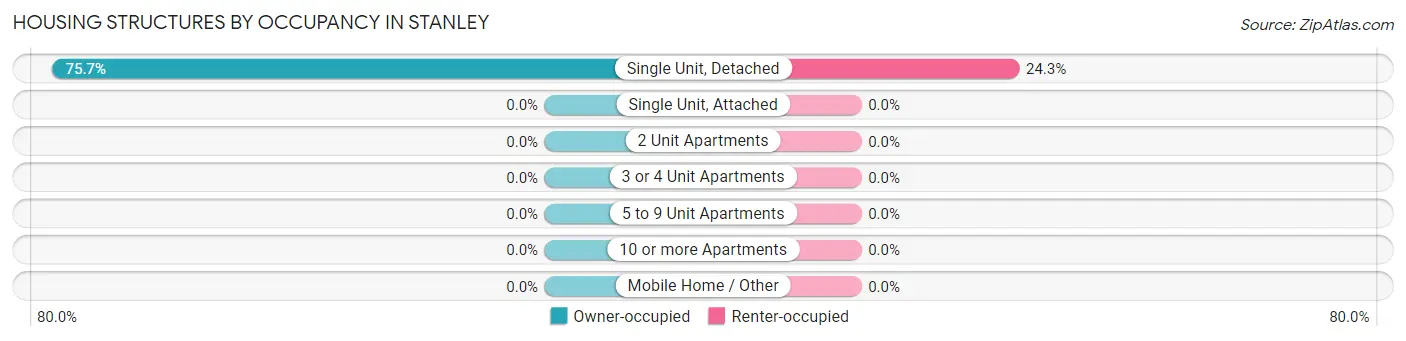
| Structure Type | Owner-occupied | Renter-occupied |
| Single Unit, Detached | 28 (75.7%) | 9 (24.3%) |
| Single Unit, Attached | 0 (0.0%) | 0 (0.0%) |
| 2 Unit Apartments | 0 (0.0%) | 0 (0.0%) |
| 3 or 4 Unit Apartments | 0 (0.0%) | 0 (0.0%) |
| 5 to 9 Unit Apartments | 0 (0.0%) | 0 (0.0%) |
| 10 or more Apartments | 0 (0.0%) | 0 (0.0%) |
| Mobile Home / Other | 0 (0.0%) | 0 (0.0%) |
| Total | 28 (75.7%) | 9 (24.3%) |
Housing Structures by Number of Rooms in Stanley
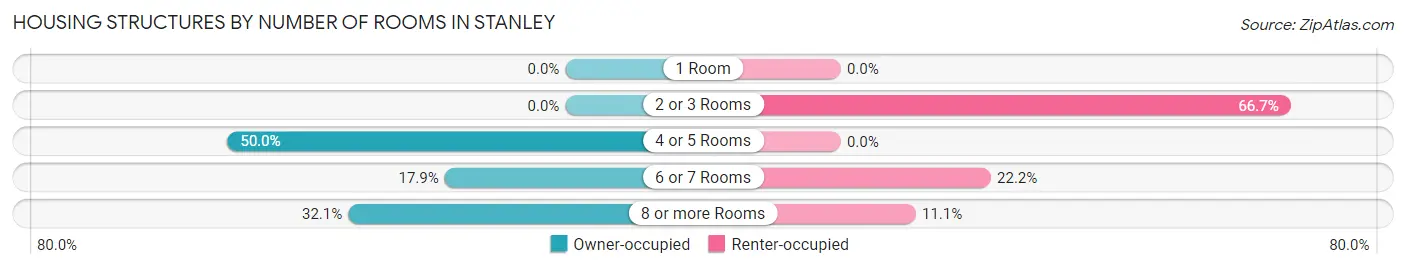
| Number of Rooms | Owner-occupied | Renter-occupied |
| 1 Room | 0 (0.0%) | 0 (0.0%) |
| 2 or 3 Rooms | 0 (0.0%) | 6 (66.7%) |
| 4 or 5 Rooms | 14 (50.0%) | 0 (0.0%) |
| 6 or 7 Rooms | 5 (17.9%) | 2 (22.2%) |
| 8 or more Rooms | 9 (32.1%) | 1 (11.1%) |
| Total | 28 (100.0%) | 9 (100.0%) |
Housing Structure by Heating Type in Stanley
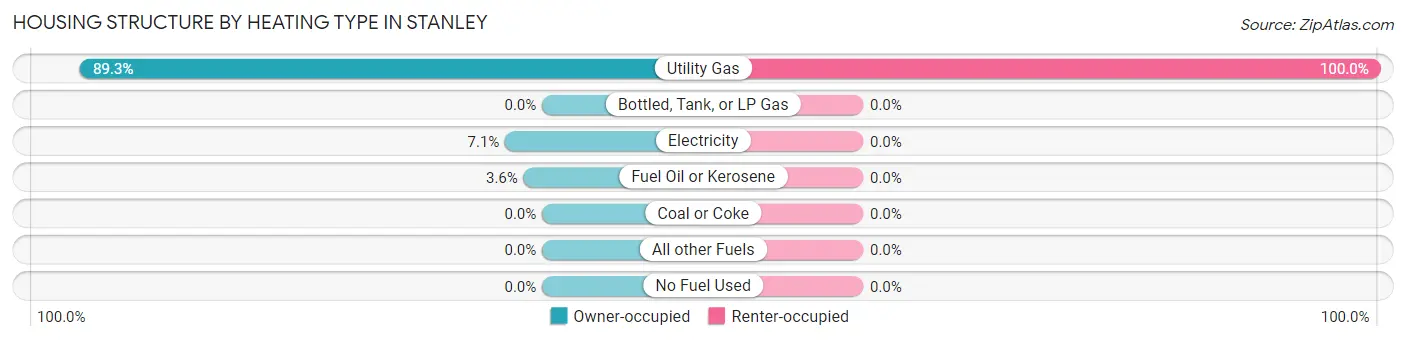
| Heating Type | Owner-occupied | Renter-occupied |
| Utility Gas | 25 (89.3%) | 9 (100.0%) |
| Bottled, Tank, or LP Gas | 0 (0.0%) | 0 (0.0%) |
| Electricity | 2 (7.1%) | 0 (0.0%) |
| Fuel Oil or Kerosene | 1 (3.6%) | 0 (0.0%) |
| Coal or Coke | 0 (0.0%) | 0 (0.0%) |
| All other Fuels | 0 (0.0%) | 0 (0.0%) |
| No Fuel Used | 0 (0.0%) | 0 (0.0%) |
| Total | 28 (100.0%) | 9 (100.0%) |
Household Vehicle Usage in Stanley
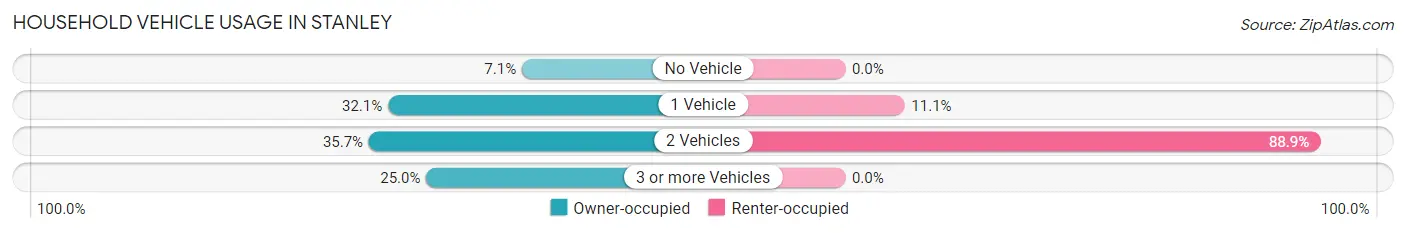
| Vehicles per Household | Owner-occupied | Renter-occupied |
| No Vehicle | 2 (7.1%) | 0 (0.0%) |
| 1 Vehicle | 9 (32.1%) | 1 (11.1%) |
| 2 Vehicles | 10 (35.7%) | 8 (88.9%) |
| 3 or more Vehicles | 7 (25.0%) | 0 (0.0%) |
| Total | 28 (100.0%) | 9 (100.0%) |
Real Estate & Mortgages in Stanley
Real Estate and Mortgage Overview in Stanley
| Characteristic | Without Mortgage | With Mortgage |
| Housing Units | 19 | 9 |
| Median Property Value | - | - |
| Median Household Income | - | - |
| Monthly Housing Costs | $325 | $0 |
| Real Estate Taxes | $738 | $0 |
Property Value by Mortgage Status in Stanley
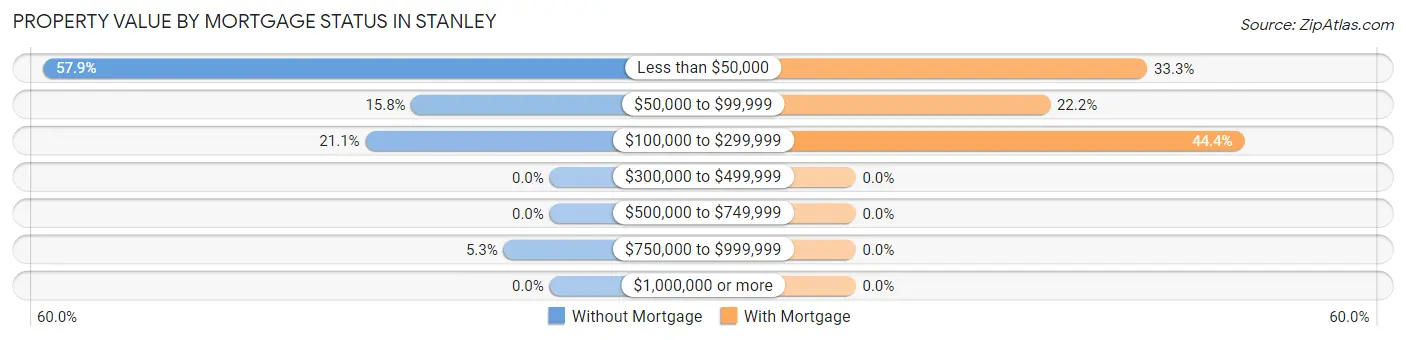
| Property Value | Without Mortgage | With Mortgage |
| Less than $50,000 | 11 (57.9%) | 3 (33.3%) |
| $50,000 to $99,999 | 3 (15.8%) | 2 (22.2%) |
| $100,000 to $299,999 | 4 (21.0%) | 4 (44.4%) |
| $300,000 to $499,999 | 0 (0.0%) | 0 (0.0%) |
| $500,000 to $749,999 | 0 (0.0%) | 0 (0.0%) |
| $750,000 to $999,999 | 1 (5.3%) | 0 (0.0%) |
| $1,000,000 or more | 0 (0.0%) | 0 (0.0%) |
| Total | 19 (100.0%) | 9 (100.0%) |
Household Income by Mortgage Status in Stanley
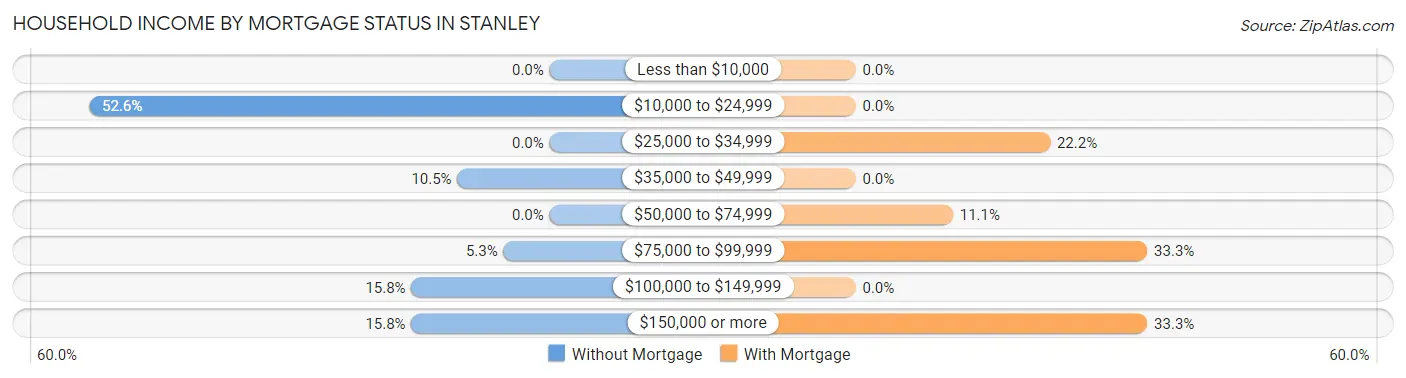
| Household Income | Without Mortgage | With Mortgage |
| Less than $10,000 | 0 (0.0%) | 0 (0.0%) |
| $10,000 to $24,999 | 10 (52.6%) | 0 (0.0%) |
| $25,000 to $34,999 | 0 (0.0%) | 2 (22.2%) |
| $35,000 to $49,999 | 2 (10.5%) | 0 (0.0%) |
| $50,000 to $74,999 | 0 (0.0%) | 1 (11.1%) |
| $75,000 to $99,999 | 1 (5.3%) | 3 (33.3%) |
| $100,000 to $149,999 | 3 (15.8%) | 0 (0.0%) |
| $150,000 or more | 3 (15.8%) | 3 (33.3%) |
| Total | 19 (100.0%) | 9 (100.0%) |
Property Value to Household Income Ratio in Stanley
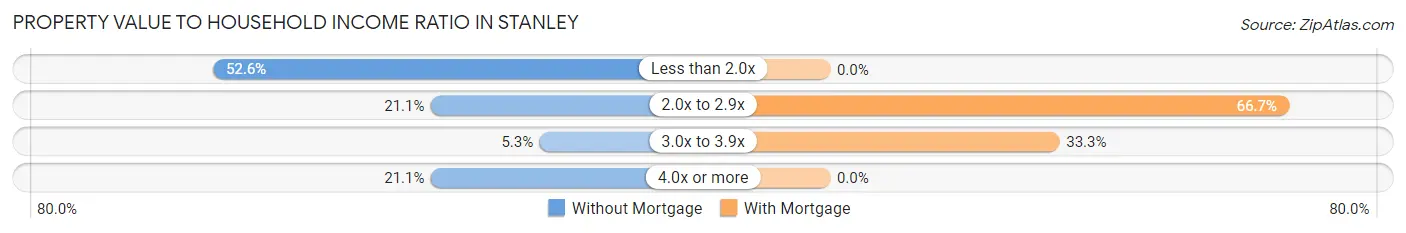
| Value-to-Income Ratio | Without Mortgage | With Mortgage |
| Less than 2.0x | 10 (52.6%) | 0 (0.0%) |
| 2.0x to 2.9x | 4 (21.0%) | 6 (66.7%) |
| 3.0x to 3.9x | 1 (5.3%) | 3 (33.3%) |
| 4.0x or more | 4 (21.0%) | 0 (0.0%) |
| Total | 19 (100.0%) | 9 (100.0%) |
Real Estate Taxes by Mortgage Status in Stanley
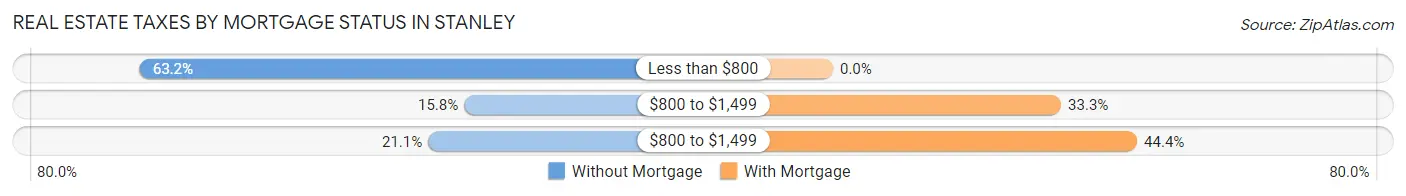
| Property Taxes | Without Mortgage | With Mortgage |
| Less than $800 | 12 (63.2%) | 0 (0.0%) |
| $800 to $1,499 | 3 (15.8%) | 3 (33.3%) |
| $800 to $1,499 | 4 (21.0%) | 4 (44.4%) |
| Total | 19 (100.0%) | 9 (100.0%) |
Health & Disability in Stanley
Health Insurance Coverage by Age in Stanley
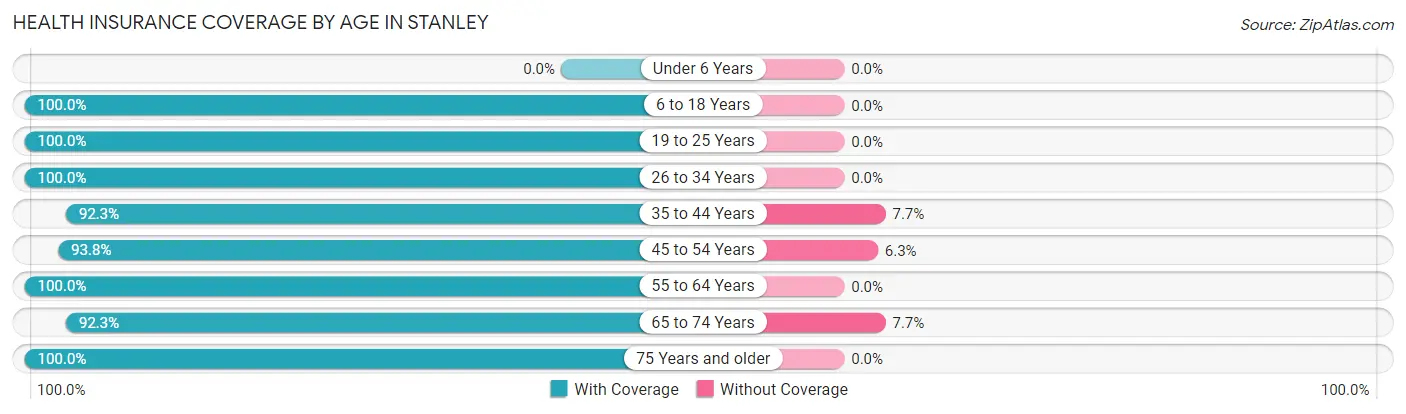
| Age Bracket | With Coverage | Without Coverage |
| Under 6 Years | 0 (0.0%) | 0 (0.0%) |
| 6 to 18 Years | 16 (100.0%) | 0 (0.0%) |
| 19 to 25 Years | 2 (100.0%) | 0 (0.0%) |
| 26 to 34 Years | 10 (100.0%) | 0 (0.0%) |
| 35 to 44 Years | 12 (92.3%) | 1 (7.7%) |
| 45 to 54 Years | 15 (93.8%) | 1 (6.2%) |
| 55 to 64 Years | 6 (100.0%) | 0 (0.0%) |
| 65 to 74 Years | 12 (92.3%) | 1 (7.7%) |
| 75 Years and older | 5 (100.0%) | 0 (0.0%) |
| Total | 78 (96.3%) | 3 (3.7%) |
Health Insurance Coverage by Citizenship Status in Stanley
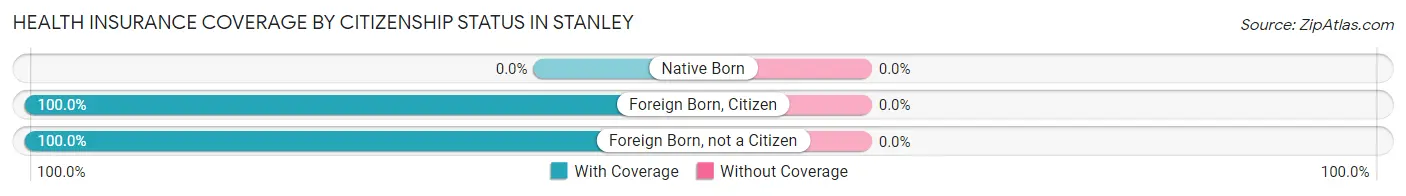
| Citizenship Status | With Coverage | Without Coverage |
| Native Born | 0 (0.0%) | 0 (0.0%) |
| Foreign Born, Citizen | 16 (100.0%) | 0 (0.0%) |
| Foreign Born, not a Citizen | 2 (100.0%) | 0 (0.0%) |
Health Insurance Coverage by Household Income in Stanley
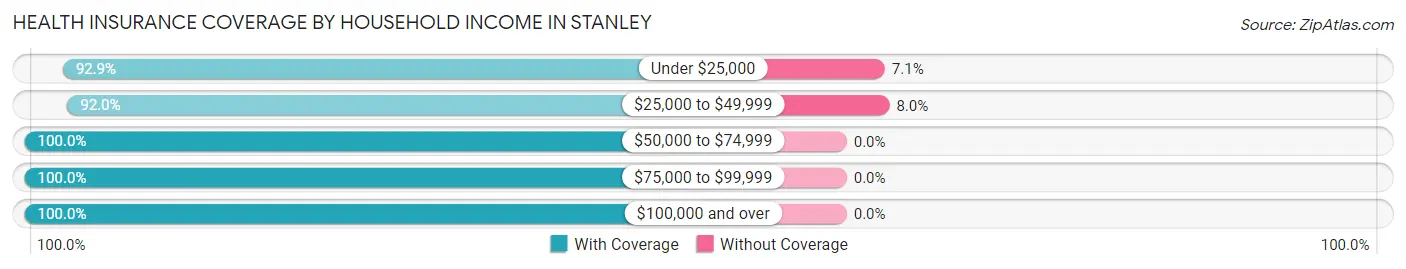
| Household Income | With Coverage | Without Coverage |
| Under $25,000 | 13 (92.9%) | 1 (7.1%) |
| $25,000 to $49,999 | 23 (92.0%) | 2 (8.0%) |
| $50,000 to $74,999 | 5 (100.0%) | 0 (0.0%) |
| $75,000 to $99,999 | 5 (100.0%) | 0 (0.0%) |
| $100,000 and over | 32 (100.0%) | 0 (0.0%) |
Public vs Private Health Insurance Coverage by Age in Stanley
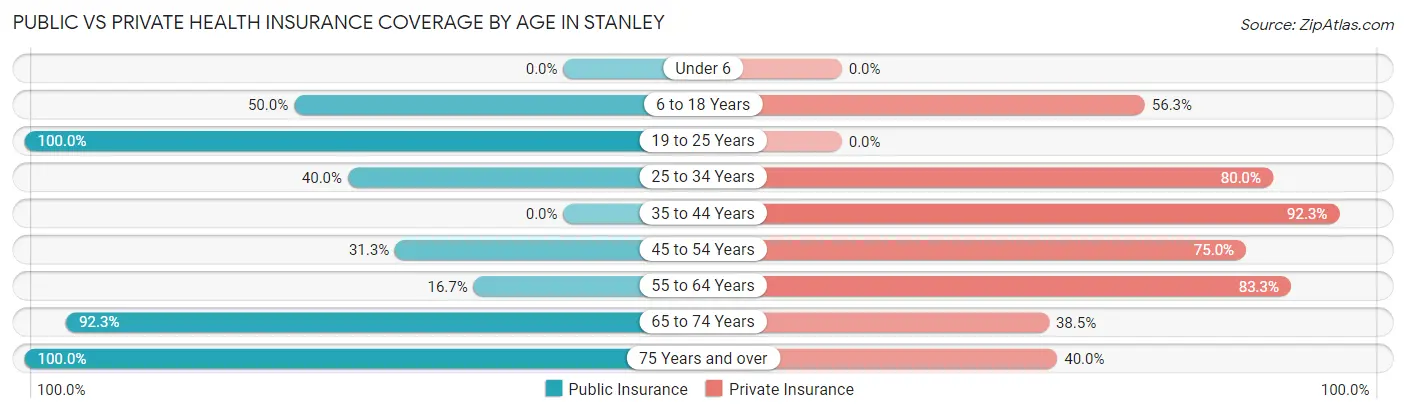
| Age Bracket | Public Insurance | Private Insurance |
| Under 6 | 0 (0.0%) | 0 (0.0%) |
| 6 to 18 Years | 8 (50.0%) | 9 (56.2%) |
| 19 to 25 Years | 2 (100.0%) | 0 (0.0%) |
| 25 to 34 Years | 4 (40.0%) | 8 (80.0%) |
| 35 to 44 Years | 0 (0.0%) | 12 (92.3%) |
| 45 to 54 Years | 5 (31.2%) | 12 (75.0%) |
| 55 to 64 Years | 1 (16.7%) | 5 (83.3%) |
| 65 to 74 Years | 12 (92.3%) | 5 (38.5%) |
| 75 Years and over | 5 (100.0%) | 2 (40.0%) |
| Total | 37 (45.7%) | 53 (65.4%) |
Disability Status by Sex by Age in Stanley
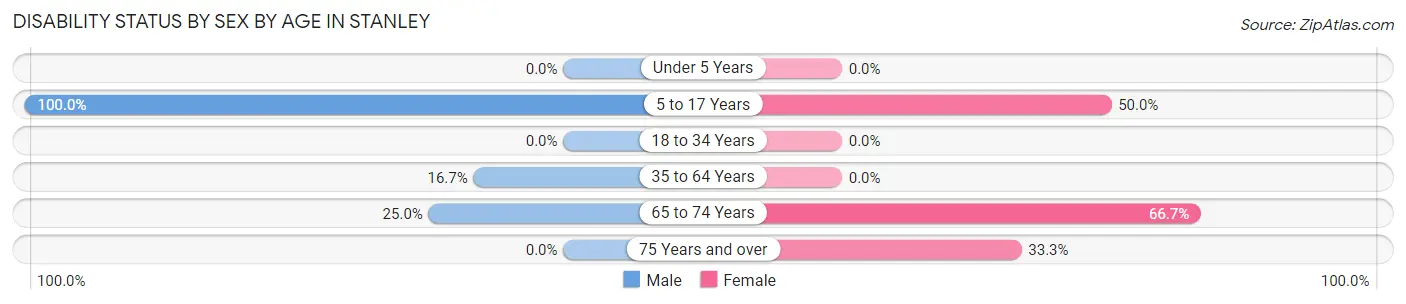
| Age Bracket | Male | Female |
| Under 5 Years | 0 (0.0%) | 0 (0.0%) |
| 5 to 17 Years | 4 (100.0%) | 2 (50.0%) |
| 18 to 34 Years | 0 (0.0%) | 0 (0.0%) |
| 35 to 64 Years | 3 (16.7%) | 0 (0.0%) |
| 65 to 74 Years | 1 (25.0%) | 6 (66.7%) |
| 75 Years and over | 0 (0.0%) | 1 (33.3%) |
Disability Class by Sex by Age in Stanley
Disability Class: Hearing Difficulty
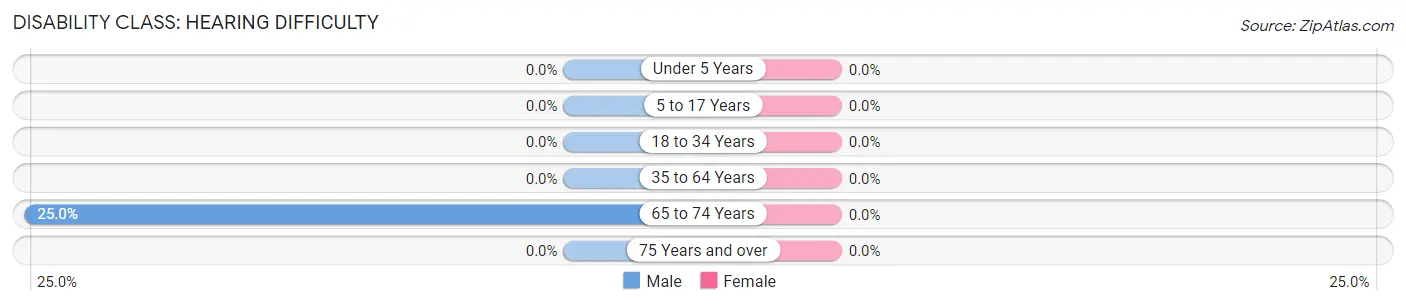
| Age Bracket | Male | Female |
| Under 5 Years | 0 (0.0%) | 0 (0.0%) |
| 5 to 17 Years | 0 (0.0%) | 0 (0.0%) |
| 18 to 34 Years | 0 (0.0%) | 0 (0.0%) |
| 35 to 64 Years | 0 (0.0%) | 0 (0.0%) |
| 65 to 74 Years | 1 (25.0%) | 0 (0.0%) |
| 75 Years and over | 0 (0.0%) | 0 (0.0%) |
Disability Class: Vision Difficulty
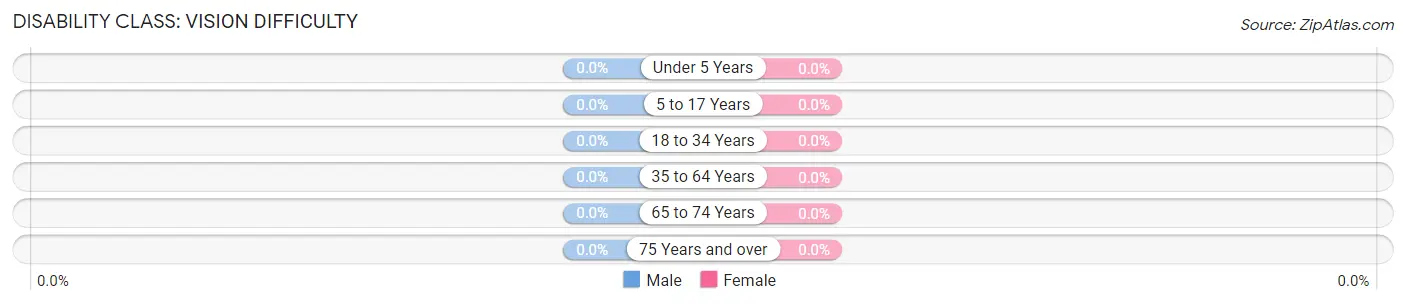
| Age Bracket | Male | Female |
| Under 5 Years | 0 (0.0%) | 0 (0.0%) |
| 5 to 17 Years | 0 (0.0%) | 0 (0.0%) |
| 18 to 34 Years | 0 (0.0%) | 0 (0.0%) |
| 35 to 64 Years | 0 (0.0%) | 0 (0.0%) |
| 65 to 74 Years | 0 (0.0%) | 0 (0.0%) |
| 75 Years and over | 0 (0.0%) | 0 (0.0%) |
Disability Class: Cognitive Difficulty
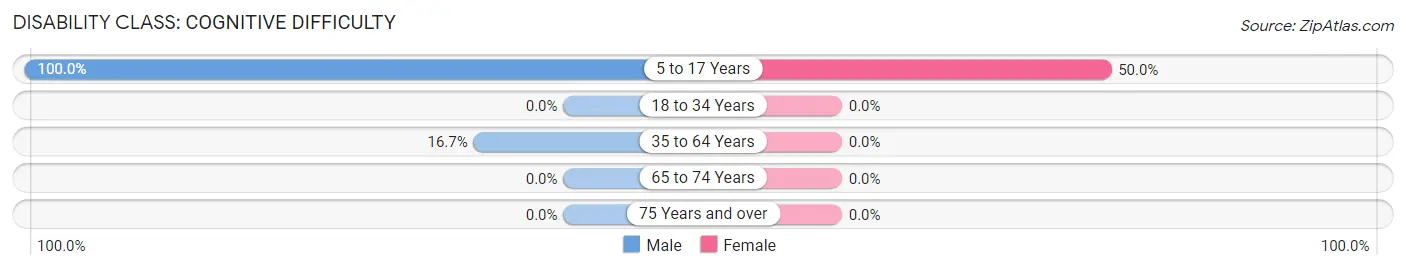
| Age Bracket | Male | Female |
| 5 to 17 Years | 4 (100.0%) | 2 (50.0%) |
| 18 to 34 Years | 0 (0.0%) | 0 (0.0%) |
| 35 to 64 Years | 3 (16.7%) | 0 (0.0%) |
| 65 to 74 Years | 0 (0.0%) | 0 (0.0%) |
| 75 Years and over | 0 (0.0%) | 0 (0.0%) |
Disability Class: Ambulatory Difficulty
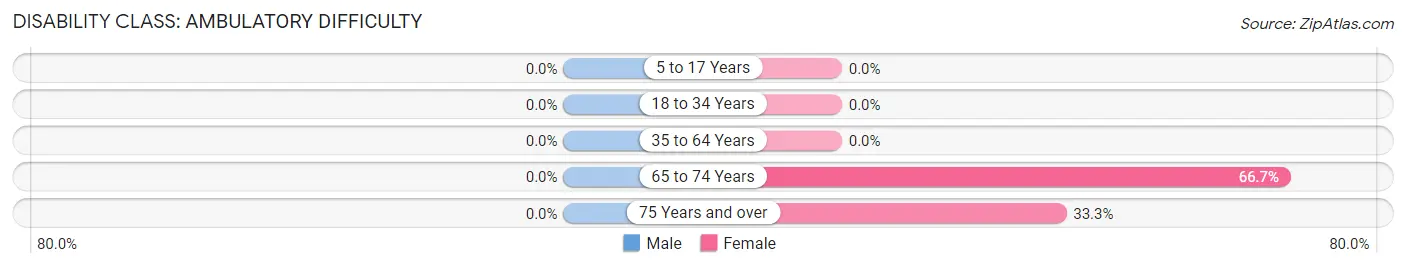
| Age Bracket | Male | Female |
| 5 to 17 Years | 0 (0.0%) | 0 (0.0%) |
| 18 to 34 Years | 0 (0.0%) | 0 (0.0%) |
| 35 to 64 Years | 0 (0.0%) | 0 (0.0%) |
| 65 to 74 Years | 0 (0.0%) | 6 (66.7%) |
| 75 Years and over | 0 (0.0%) | 1 (33.3%) |
Disability Class: Self-Care Difficulty
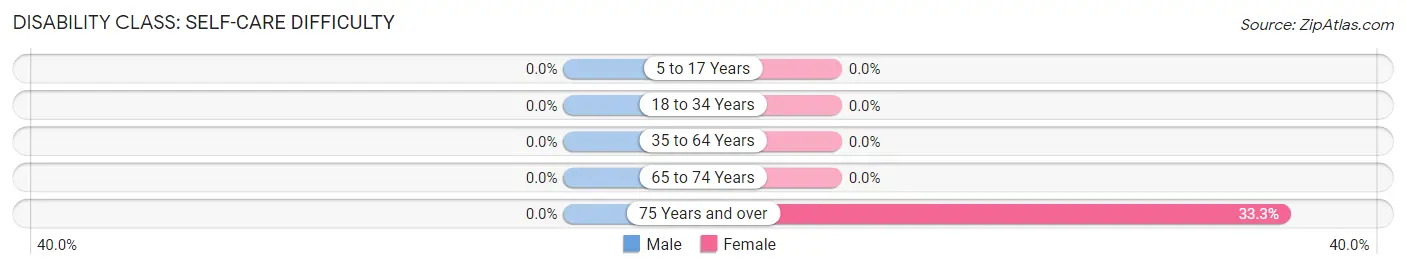
| Age Bracket | Male | Female |
| 5 to 17 Years | 0 (0.0%) | 0 (0.0%) |
| 18 to 34 Years | 0 (0.0%) | 0 (0.0%) |
| 35 to 64 Years | 0 (0.0%) | 0 (0.0%) |
| 65 to 74 Years | 0 (0.0%) | 0 (0.0%) |
| 75 Years and over | 0 (0.0%) | 1 (33.3%) |
Technology Access in Stanley
Computing Device Access in Stanley
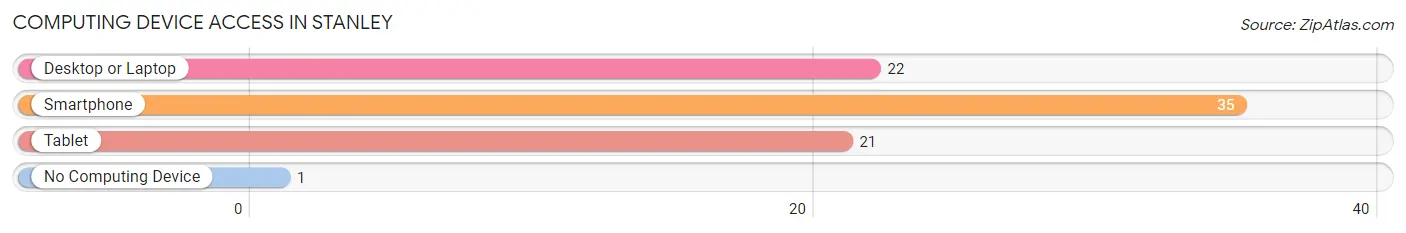
| Device Type | # Households | % Households |
| Desktop or Laptop | 22 | 59.5% |
| Smartphone | 35 | 94.6% |
| Tablet | 21 | 56.8% |
| No Computing Device | 1 | 2.7% |
| Total | 37 | 100.0% |
Internet Access in Stanley
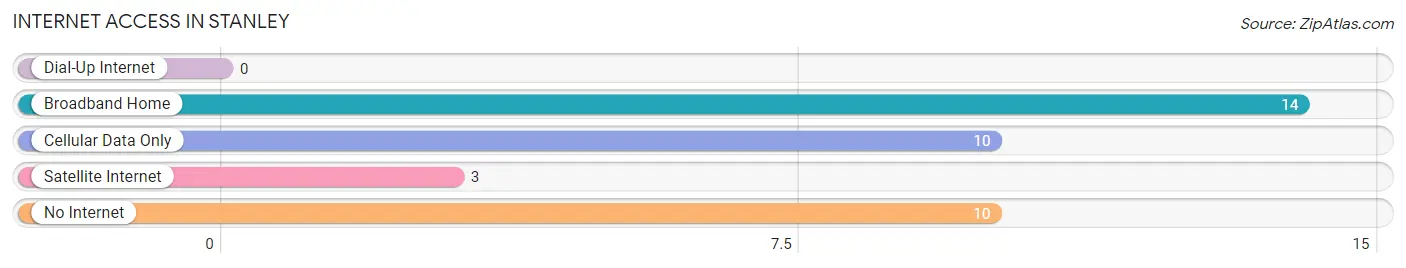
| Internet Type | # Households | % Households |
| Dial-Up Internet | 0 | 0.0% |
| Broadband Home | 14 | 37.8% |
| Cellular Data Only | 10 | 27.0% |
| Satellite Internet | 3 | 8.1% |
| No Internet | 10 | 27.0% |
| Total | 37 | 100.0% |
Stanley Summary
Stanley, Iowa is a small town located in Buchanan County, Iowa. It is situated on the banks of the Wapsipinicon River, and is home to a population of just over 500 people. The town was founded in 1856, and has a rich history of farming, industry, and small-town life.
Geography
Stanley is located in the northeast corner of Buchanan County, Iowa, and is situated on the banks of the Wapsipinicon River. The town is surrounded by rolling hills and farmland, and is located approximately 25 miles from Cedar Rapids. The town is located at an elevation of 890 feet above sea level.
Economy
The economy of Stanley is largely based on agriculture and small businesses. The town is home to several small businesses, including a grocery store, a hardware store, a restaurant, and a few other small shops. The town also has a few small manufacturing businesses, such as a furniture factory and a machine shop. The town is also home to a few farms, which produce corn, soybeans, and other crops.
Demographics
As of the 2010 census, the population of Stanley was 514 people. The racial makeup of the town was 97.3% White, 0.6% African American, 0.2% Native American, 0.2% Asian, 0.4% from other races, and 1.3% from two or more races. Hispanic or Latino of any race were 1.2% of the population.
The median income for a household in Stanley was $41,250, and the median income for a family was $45,000. The per capita income for the town was $18,945. About 8.3% of families and 10.2% of the population were below the poverty line, including 11.3% of those under age 18 and 8.3% of those age 65 or over.
History
Stanley was founded in 1856 by a group of settlers from Ohio. The town was named after Stanley County, Ohio, which was the home of many of the settlers. The town was originally a farming community, and the settlers grew corn, wheat, and other crops. The town also had a few small businesses, such as a blacksmith shop and a general store.
In the late 19th century, the town began to grow and develop. The railroad came to town in 1881, and the town began to attract more businesses and industry. The town also had a few small manufacturing businesses, such as a furniture factory and a machine shop.
In the early 20th century, the town continued to grow and develop. The town had a few small businesses, such as a grocery store, a hardware store, and a restaurant. The town also had a few small manufacturing businesses, such as a furniture factory and a machine shop.
In the late 20th century, the town began to decline. Many of the businesses and industries closed, and the population began to decline. The town is now a small, quiet town, and is home to a population of just over 500 people.
Common Questions
What is Per Capita Income in Stanley?
Per Capita income in Stanley is $29,496.
What is the Median Household income in Stanley?
Median Household Income in Stanley is $43,542.
What is Inequality or Gini Index in Stanley?
Inequality or Gini Index in Stanley is 0.44.
What is the Total Population of Stanley?
Total Population of Stanley is 81.
What is the Total Male Population of Stanley?
Total Male Population of Stanley is 34.
What is the Total Female Population of Stanley?
Total Female Population of Stanley is 47.
What is the Ratio of Males per 100 Females in Stanley?
There are 72.34 Males per 100 Females in Stanley.
What is the Ratio of Females per 100 Males in Stanley?
There are 138.24 Females per 100 Males in Stanley.
What is the Median Population Age in Stanley?
Median Population Age in Stanley is 44.9 Years.
What is the Average Family Size in Stanley
Average Family Size in Stanley is 3.1 People.
What is the Average Household Size in Stanley
Average Household Size in Stanley is 2.2 People.
How Large is the Labor Force in Stanley?
There are 53 People in the Labor Forcein in Stanley.
What is the Percentage of People in the Labor Force in Stanley?
72.6% of People are in the Labor Force in Stanley.
What is the Unemployment Rate in Stanley?
Unemployment Rate in Stanley is 30.2%.