Springville, IA Map & Demographics
Springville Map
Springville Overview
$34,025
PER CAPITA INCOME
$87,083
AVG FAMILY INCOME
$78,636
AVG HOUSEHOLD INCOME
45.6%
WAGE / INCOME GAP [ % ]
54.4¢/ $1
WAGE / INCOME GAP [ $ ]
0.36
INEQUALITY / GINI INDEX
1,160
TOTAL POPULATION
598
MALE POPULATION
562
FEMALE POPULATION
106.41
MALES / 100 FEMALES
93.98
FEMALES / 100 MALES
39.7
MEDIAN AGE
2.9
AVG FAMILY SIZE
2.6
AVG HOUSEHOLD SIZE
638
LABOR FORCE [ PEOPLE ]
71.2%
PERCENT IN LABOR FORCE
1.4%
UNEMPLOYMENT RATE
Springville Zip Codes
Springville Area Codes
Income in Springville
Income Overview in Springville
Per Capita Income in Springville is $34,025, while median incomes of families and households are $87,083 and $78,636 respectively.
| Characteristic | Number | Measure |
| Per Capita Income | 1,160 | $34,025 |
| Median Family Income | 342 | $87,083 |
| Mean Family Income | 342 | $96,038 |
| Median Household Income | 440 | $78,636 |
| Mean Household Income | 440 | $89,687 |
| Income Deficit | 342 | $0 |
| Wage / Income Gap (%) | 1,160 | 45.63% |
| Wage / Income Gap ($) | 1,160 | 54.37¢ per $1 |
| Gini / Inequality Index | 1,160 | 0.36 |
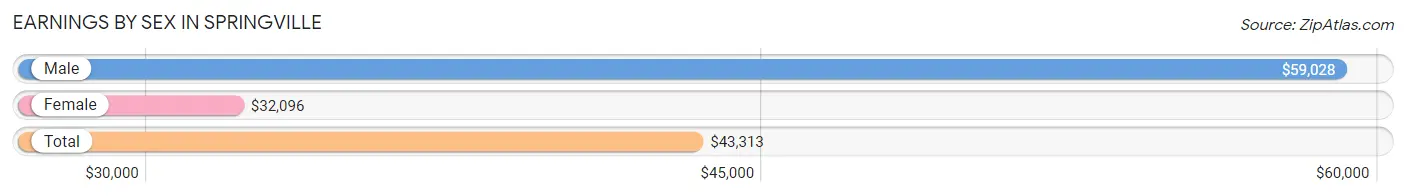
Earnings by Sex in Springville
Average Earnings in Springville are $43,313, $59,028 for men and $32,096 for women, a difference of 45.6%.
| Sex | Number | Average Earnings |
| Male | 318 (48.5%) | $59,028 |
| Female | 337 (51.4%) | $32,096 |
| Total | 655 (100.0%) | $43,313 |
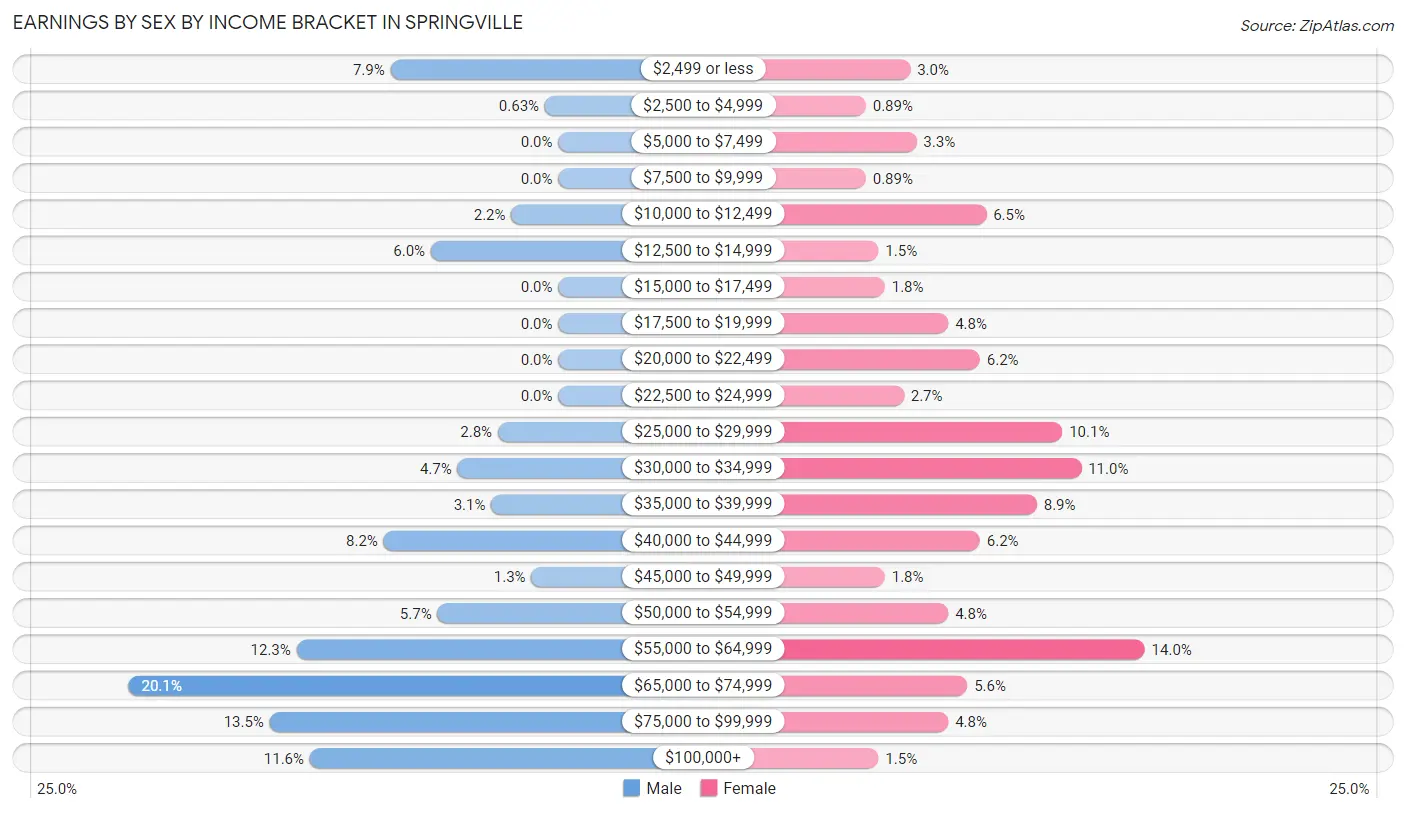
Earnings by Sex by Income Bracket in Springville
The most common earnings brackets in Springville are $65,000 to $74,999 for men (64 | 20.1%) and $55,000 to $64,999 for women (47 | 14.0%).
| Income | Male | Female |
| $2,499 or less | 25 (7.9%) | 10 (3.0%) |
| $2,500 to $4,999 | 2 (0.6%) | 3 (0.9%) |
| $5,000 to $7,499 | 0 (0.0%) | 11 (3.3%) |
| $7,500 to $9,999 | 0 (0.0%) | 3 (0.9%) |
| $10,000 to $12,499 | 7 (2.2%) | 22 (6.5%) |
| $12,500 to $14,999 | 19 (6.0%) | 5 (1.5%) |
| $15,000 to $17,499 | 0 (0.0%) | 6 (1.8%) |
| $17,500 to $19,999 | 0 (0.0%) | 16 (4.8%) |
| $20,000 to $22,499 | 0 (0.0%) | 21 (6.2%) |
| $22,500 to $24,999 | 0 (0.0%) | 9 (2.7%) |
| $25,000 to $29,999 | 9 (2.8%) | 34 (10.1%) |
| $30,000 to $34,999 | 15 (4.7%) | 37 (11.0%) |
| $35,000 to $39,999 | 10 (3.1%) | 30 (8.9%) |
| $40,000 to $44,999 | 26 (8.2%) | 21 (6.2%) |
| $45,000 to $49,999 | 4 (1.3%) | 6 (1.8%) |
| $50,000 to $54,999 | 18 (5.7%) | 16 (4.8%) |
| $55,000 to $64,999 | 39 (12.3%) | 47 (14.0%) |
| $65,000 to $74,999 | 64 (20.1%) | 19 (5.6%) |
| $75,000 to $99,999 | 43 (13.5%) | 16 (4.8%) |
| $100,000+ | 37 (11.6%) | 5 (1.5%) |
| Total | 318 (100.0%) | 337 (100.0%) |
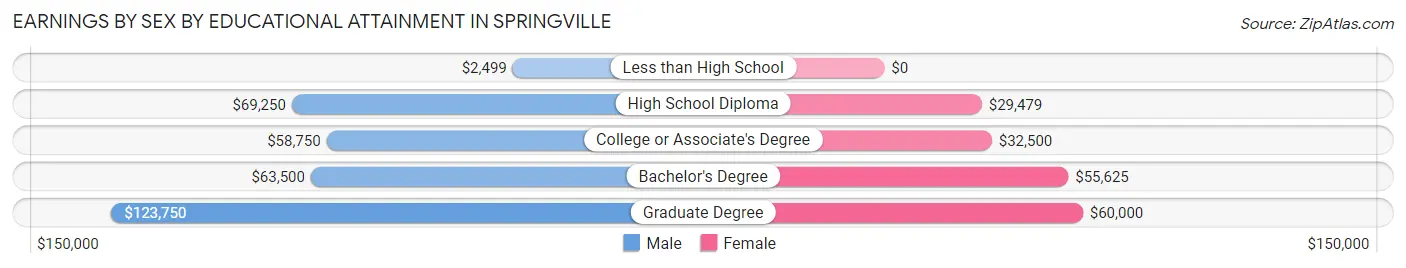
Earnings by Sex by Educational Attainment in Springville
Average earnings in Springville are $62,656 for men and $35,192 for women, a difference of 43.8%. Men with an educational attainment of graduate degree enjoy the highest average annual earnings of $123,750, while those with less than high school education earn the least with $2,499. Women with an educational attainment of graduate degree earn the most with the average annual earnings of $60,000, while those with high school diploma education have the smallest earnings of $29,479.
| Educational Attainment | Male Income | Female Income |
| Less than High School | $2,499 | $0 |
| High School Diploma | $69,250 | $29,479 |
| College or Associate's Degree | $58,750 | $32,500 |
| Bachelor's Degree | $63,500 | $55,625 |
| Graduate Degree | $123,750 | $60,000 |
| Total | $62,656 | $35,192 |
Family Income in Springville
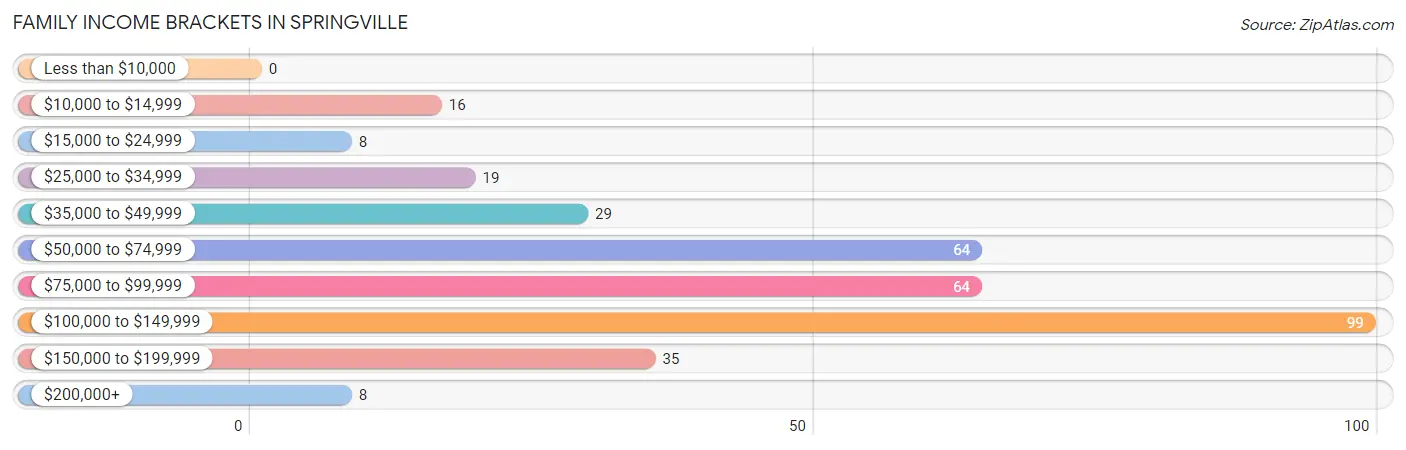
Family Income Brackets in Springville
According to the Springville family income data, there are 99 families falling into the $100,000 to $149,999 income range, which is the most common income bracket and makes up 28.9% of all families.
| Income Bracket | # Families | % Families |
| Less than $10,000 | 0 | 0.0% |
| $10,000 to $14,999 | 16 | 4.7% |
| $15,000 to $24,999 | 8 | 2.3% |
| $25,000 to $34,999 | 19 | 5.6% |
| $35,000 to $49,999 | 29 | 8.5% |
| $50,000 to $74,999 | 64 | 18.7% |
| $75,000 to $99,999 | 64 | 18.7% |
| $100,000 to $149,999 | 99 | 28.9% |
| $150,000 to $199,999 | 35 | 10.2% |
| $200,000+ | 8 | 2.3% |
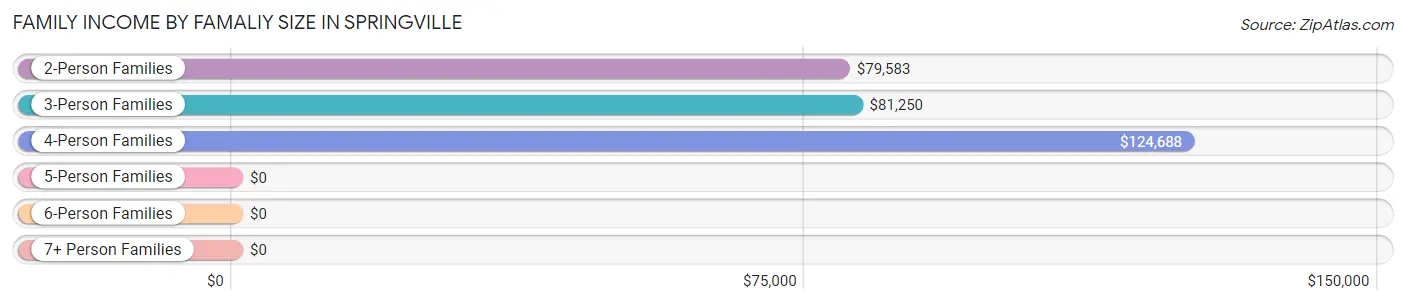
Family Income by Famaliy Size in Springville
4-person families (51 | 14.9%) account for the highest median family income in Springville with $124,688 per family, while 2-person families (123 | 36.0%) have the highest median income of $39,792 per family member.
| Income Bracket | # Families | Median Income |
| 2-Person Families | 123 (36.0%) | $79,583 |
| 3-Person Families | 135 (39.5%) | $81,250 |
| 4-Person Families | 51 (14.9%) | $124,688 |
| 5-Person Families | 23 (6.7%) | $0 |
| 6-Person Families | 3 (0.9%) | $0 |
| 7+ Person Families | 7 (2.1%) | $0 |
| Total | 342 (100.0%) | $87,083 |
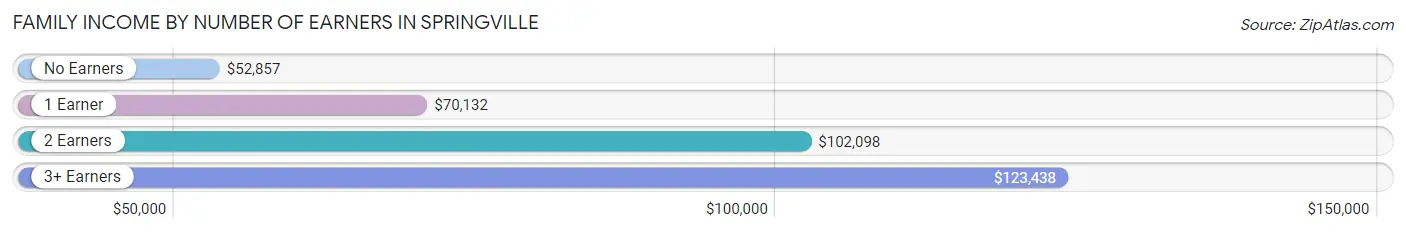
Family Income by Number of Earners in Springville
The median family income in Springville is $87,083, with families comprising 3+ earners (35) having the highest median family income of $123,438, while families with no earners (48) have the lowest median family income of $52,857, accounting for 10.2% and 14.0% of families, respectively.
| Number of Earners | # Families | Median Income |
| No Earners | 48 (14.0%) | $52,857 |
| 1 Earner | 82 (24.0%) | $70,132 |
| 2 Earners | 177 (51.7%) | $102,098 |
| 3+ Earners | 35 (10.2%) | $123,438 |
| Total | 342 (100.0%) | $87,083 |
Household Income in Springville
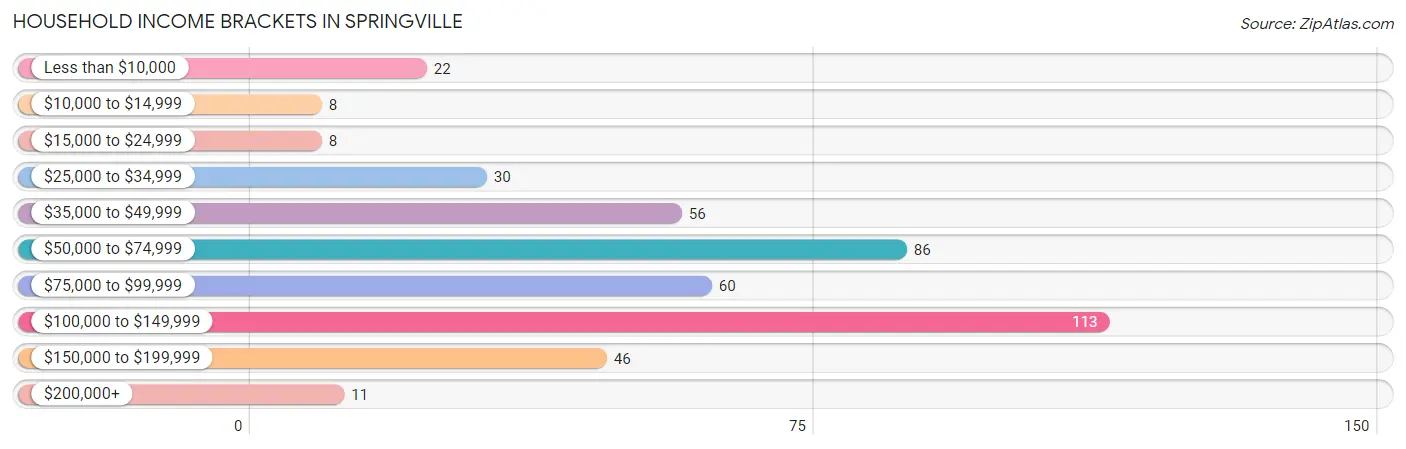
Household Income Brackets in Springville
With 113 households falling in the category, the $100,000 to $149,999 income range is the most frequent in Springville, accounting for 25.7% of all households. In contrast, only 8 households (1.8%) fall into the $10,000 to $14,999 income bracket, making it the least populous group.
| Income Bracket | # Households | % Households |
| Less than $10,000 | 22 | 5.0% |
| $10,000 to $14,999 | 8 | 1.8% |
| $15,000 to $24,999 | 8 | 1.8% |
| $25,000 to $34,999 | 30 | 6.8% |
| $35,000 to $49,999 | 56 | 12.7% |
| $50,000 to $74,999 | 86 | 19.5% |
| $75,000 to $99,999 | 60 | 13.6% |
| $100,000 to $149,999 | 113 | 25.7% |
| $150,000 to $199,999 | 46 | 10.5% |
| $200,000+ | 11 | 2.5% |
Household Income by Householder Age in Springville
The median household income in Springville is $78,636, with the highest median household income of $97,917 found in the 45 to 64 years age bracket for the primary householder. A total of 172 households (39.1%) fall into this category. Meanwhile, the 15 to 24 years age bracket for the primary householder has the lowest median household income of $0, with 17 households (3.9%) in this group.
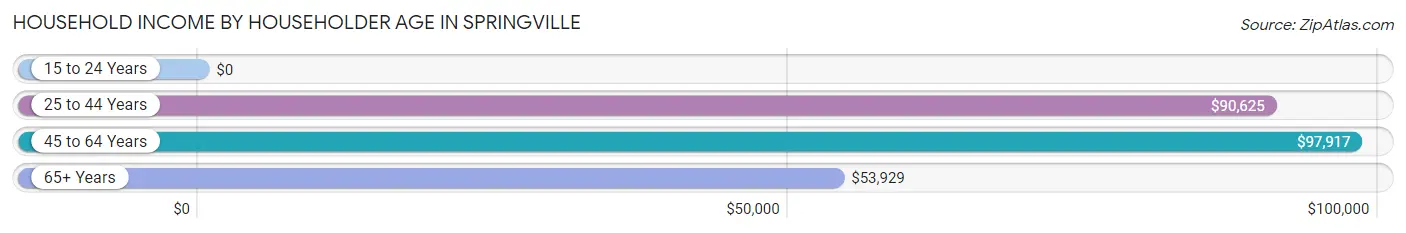
| Income Bracket | # Households | Median Income |
| 15 to 24 Years | 17 (3.9%) | $0 |
| 25 to 44 Years | 163 (37.0%) | $90,625 |
| 45 to 64 Years | 172 (39.1%) | $97,917 |
| 65+ Years | 88 (20.0%) | $53,929 |
| Total | 440 (100.0%) | $78,636 |
Poverty in Springville
Income Below Poverty by Sex and Age in Springville
With 9.0% poverty level for males and 12.5% for females among the residents of Springville, 65 to 74 year old males and 6 to 11 year old females are the most vulnerable to poverty, with 10 males (26.3%) and 8 females (33.3%) in their respective age groups living below the poverty level.
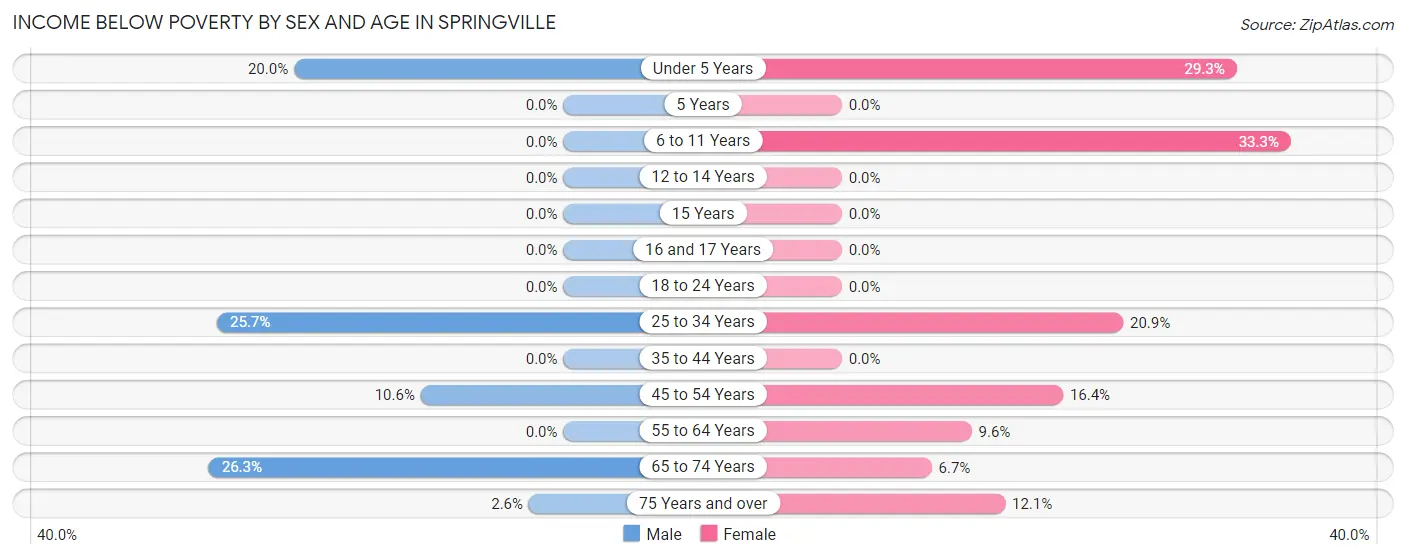
| Age Bracket | Male | Female |
| Under 5 Years | 15 (20.0%) | 17 (29.3%) |
| 5 Years | 0 (0.0%) | 0 (0.0%) |
| 6 to 11 Years | 0 (0.0%) | 8 (33.3%) |
| 12 to 14 Years | 0 (0.0%) | 0 (0.0%) |
| 15 Years | 0 (0.0%) | 0 (0.0%) |
| 16 and 17 Years | 0 (0.0%) | 0 (0.0%) |
| 18 to 24 Years | 0 (0.0%) | 0 (0.0%) |
| 25 to 34 Years | 18 (25.7%) | 19 (20.9%) |
| 35 to 44 Years | 0 (0.0%) | 0 (0.0%) |
| 45 to 54 Years | 9 (10.6%) | 11 (16.4%) |
| 55 to 64 Years | 0 (0.0%) | 8 (9.6%) |
| 65 to 74 Years | 10 (26.3%) | 3 (6.7%) |
| 75 Years and over | 1 (2.6%) | 4 (12.1%) |
| Total | 53 (9.0%) | 70 (12.5%) |
Income Above Poverty by Sex and Age in Springville
According to the poverty statistics in Springville, males aged 5 years and females aged 5 years are the age groups that are most secure financially, with 100.0% of males and 100.0% of females in these age groups living above the poverty line.
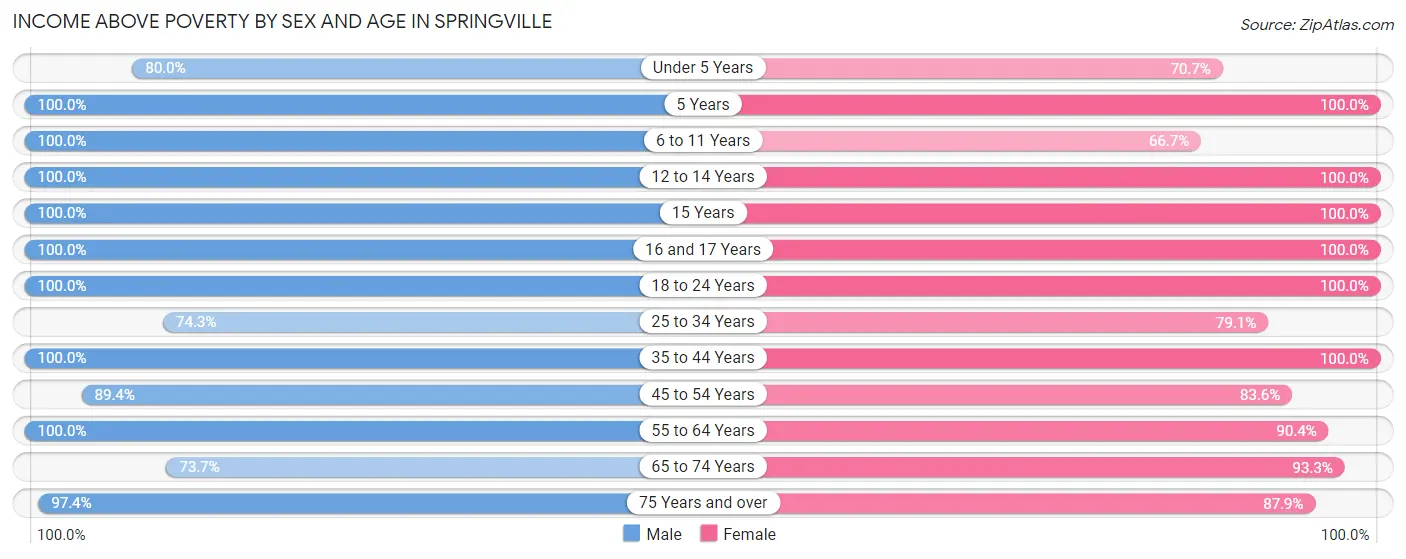
| Age Bracket | Male | Female |
| Under 5 Years | 60 (80.0%) | 41 (70.7%) |
| 5 Years | 3 (100.0%) | 9 (100.0%) |
| 6 to 11 Years | 35 (100.0%) | 16 (66.7%) |
| 12 to 14 Years | 27 (100.0%) | 16 (100.0%) |
| 15 Years | 6 (100.0%) | 4 (100.0%) |
| 16 and 17 Years | 15 (100.0%) | 12 (100.0%) |
| 18 to 24 Years | 18 (100.0%) | 52 (100.0%) |
| 25 to 34 Years | 52 (74.3%) | 72 (79.1%) |
| 35 to 44 Years | 111 (100.0%) | 68 (100.0%) |
| 45 to 54 Years | 76 (89.4%) | 56 (83.6%) |
| 55 to 64 Years | 69 (100.0%) | 75 (90.4%) |
| 65 to 74 Years | 28 (73.7%) | 42 (93.3%) |
| 75 Years and over | 38 (97.4%) | 29 (87.9%) |
| Total | 538 (91.0%) | 492 (87.5%) |
Income Below Poverty Among Married-Couple Families in Springville
The poverty statistics for married-couple families in Springville show that 5.9% or 16 of the total 273 families live below the poverty line. Families with 3 or 4 children have the highest poverty rate of 34.8%, comprising of 8 families. On the other hand, families with 1 or 2 children have the lowest poverty rate of 0.0%, which includes 0 families.
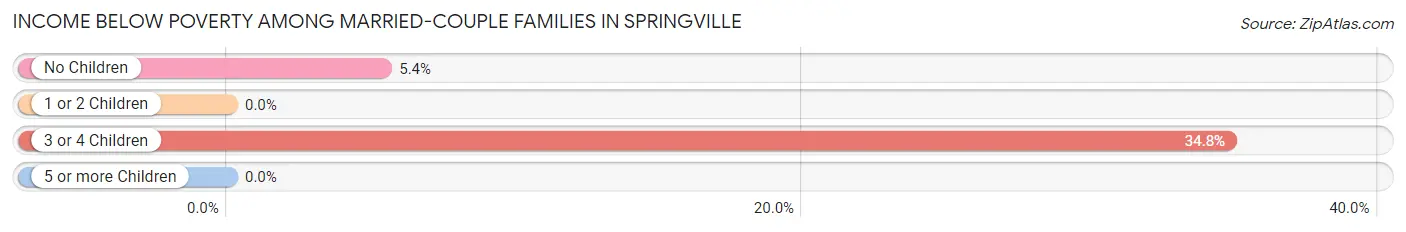
| Children | Above Poverty | Below Poverty |
| No Children | 141 (94.6%) | 8 (5.4%) |
| 1 or 2 Children | 101 (100.0%) | 0 (0.0%) |
| 3 or 4 Children | 15 (65.2%) | 8 (34.8%) |
| 5 or more Children | 0 (0.0%) | 0 (0.0%) |
| Total | 257 (94.1%) | 16 (5.9%) |
Income Below Poverty Among Single-Parent Households in Springville
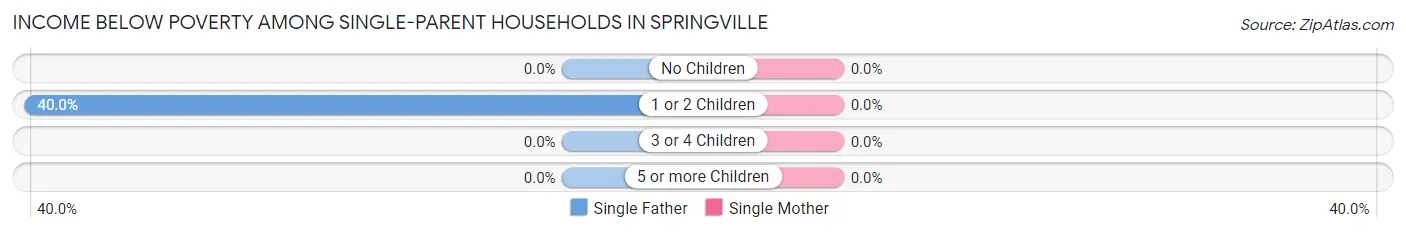
| Children | Single Father | Single Mother |
| No Children | 0 (0.0%) | 0 (0.0%) |
| 1 or 2 Children | 8 (40.0%) | 0 (0.0%) |
| 3 or 4 Children | 0 (0.0%) | 0 (0.0%) |
| 5 or more Children | 0 (0.0%) | 0 (0.0%) |
| Total | 8 (32.0%) | 0 (0.0%) |
Income Below Poverty Among Married-Couple vs Single-Parent Households in Springville
The poverty data for Springville shows that 16 of the married-couple family households (5.9%) and 8 of the single-parent households (11.6%) are living below the poverty level. Within the married-couple family households, those with 3 or 4 children have the highest poverty rate, with 8 households (34.8%) falling below the poverty line. Among the single-parent households, those with 1 or 2 children have the highest poverty rate, with 8 household (13.8%) living below poverty.
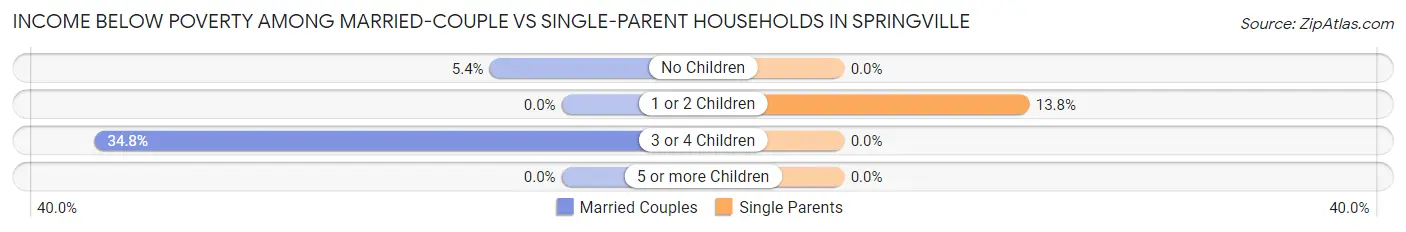
| Children | Married-Couple Families | Single-Parent Households |
| No Children | 8 (5.4%) | 0 (0.0%) |
| 1 or 2 Children | 0 (0.0%) | 8 (13.8%) |
| 3 or 4 Children | 8 (34.8%) | 0 (0.0%) |
| 5 or more Children | 0 (0.0%) | 0 (0.0%) |
| Total | 16 (5.9%) | 8 (11.6%) |
Race in Springville
The most populous races in Springville are White / Caucasian (1,099 | 94.7%), Two or more Races (34 | 2.9%), and Hispanic or Latino (23 | 2.0%).
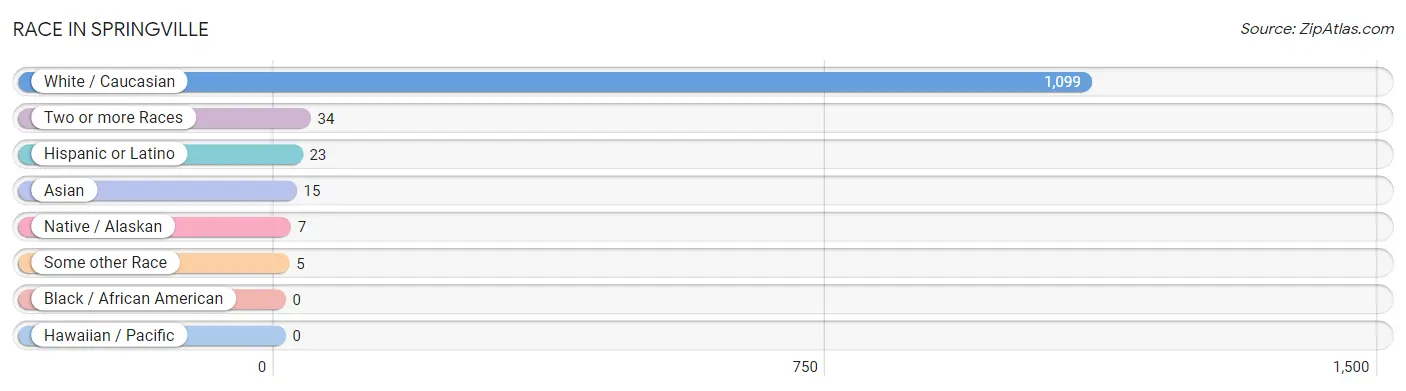
| Race | # Population | % Population |
| Asian | 15 | 1.3% |
| Black / African American | 0 | 0.0% |
| Hawaiian / Pacific | 0 | 0.0% |
| Hispanic or Latino | 23 | 2.0% |
| Native / Alaskan | 7 | 0.6% |
| White / Caucasian | 1,099 | 94.7% |
| Two or more Races | 34 | 2.9% |
| Some other Race | 5 | 0.4% |
| Total | 1,160 | 100.0% |
Ancestry in Springville
The most populous ancestries reported in Springville are German (475 | 40.9%), Irish (180 | 15.5%), English (110 | 9.5%), Norwegian (44 | 3.8%), and American (35 | 3.0%), together accounting for 72.8% of all Springville residents.
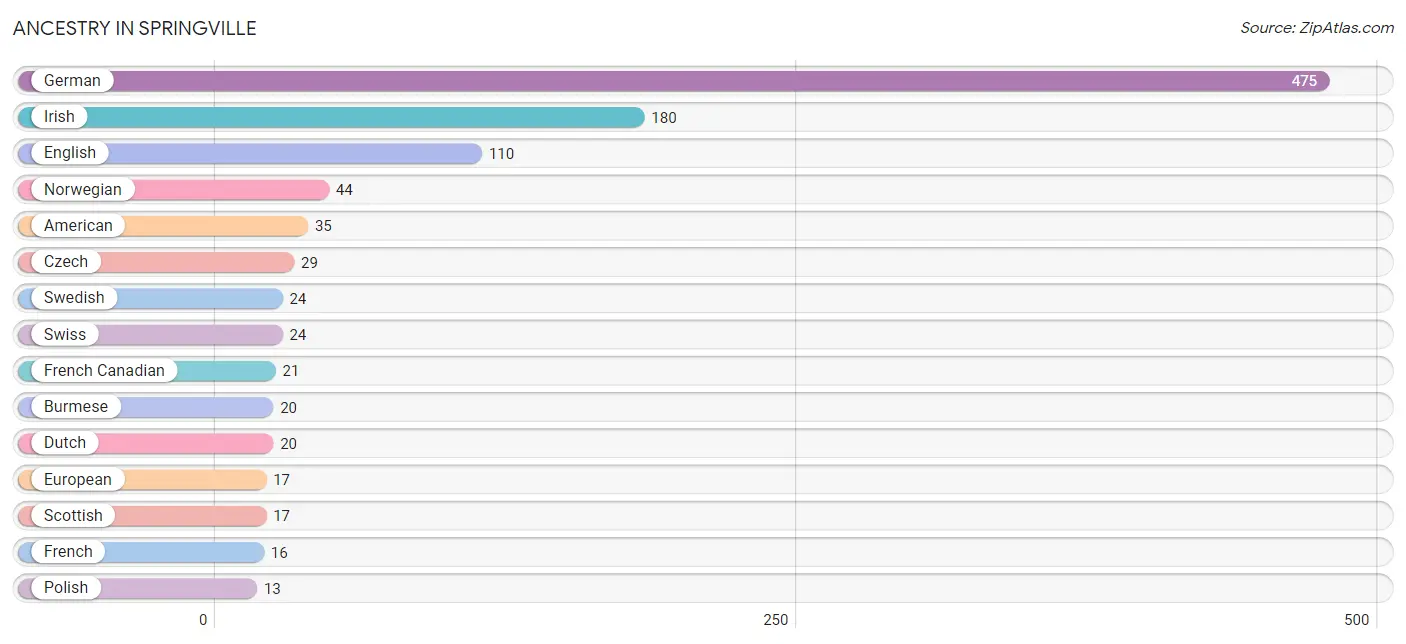
| Ancestry | # Population | % Population |
| American | 35 | 3.0% |
| Austrian | 1 | 0.1% |
| Bangladeshi | 10 | 0.9% |
| Burmese | 20 | 1.7% |
| Chippewa | 5 | 0.4% |
| Czech | 29 | 2.5% |
| Czechoslovakian | 3 | 0.3% |
| Danish | 11 | 0.9% |
| Dutch | 20 | 1.7% |
| English | 110 | 9.5% |
| European | 17 | 1.5% |
| French | 16 | 1.4% |
| French Canadian | 21 | 1.8% |
| German | 475 | 40.9% |
| Hungarian | 2 | 0.2% |
| Irish | 180 | 15.5% |
| Luxembourger | 1 | 0.1% |
| Malaysian | 11 | 0.9% |
| Mexican | 12 | 1.0% |
| Northern European | 12 | 1.0% |
| Norwegian | 44 | 3.8% |
| Polish | 13 | 1.1% |
| Russian | 11 | 0.9% |
| Scandinavian | 2 | 0.2% |
| Scottish | 17 | 1.5% |
| Sri Lankan | 7 | 0.6% |
| Swedish | 24 | 2.1% |
| Swiss | 24 | 2.1% |
| Welsh | 2 | 0.2% | View All 29 Rows |
Immigrants in Springville
The most numerous immigrant groups reported in Springville came from Europe (7 | 0.6%), Germany (7 | 0.6%), Western Europe (7 | 0.6%), Asia (5 | 0.4%), and South Eastern Asia (5 | 0.4%), together accounting for 2.7% of all Springville residents.
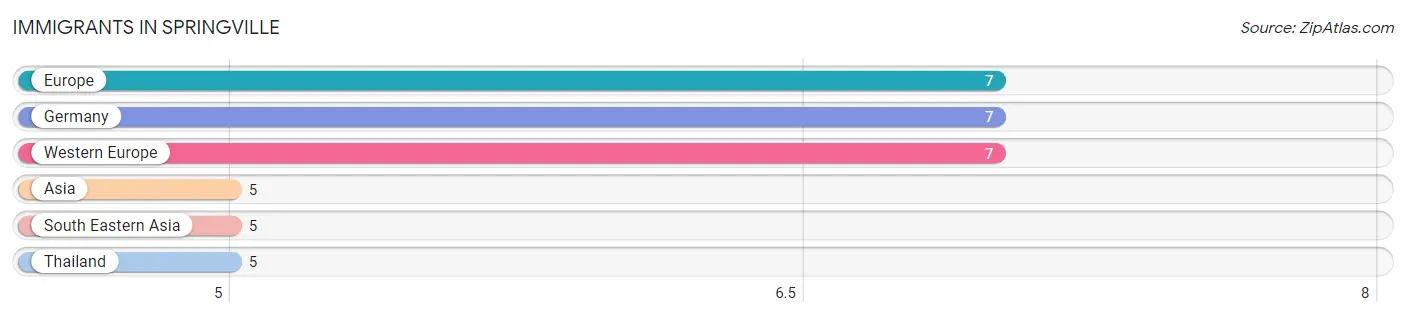
| Immigration Origin | # Population | % Population |
| Asia | 5 | 0.4% |
| Europe | 7 | 0.6% |
| Germany | 7 | 0.6% |
| South Eastern Asia | 5 | 0.4% |
| Thailand | 5 | 0.4% |
| Western Europe | 7 | 0.6% | View All 6 Rows |
Sex and Age in Springville
Sex and Age in Springville
The most populous age groups in Springville are Under 5 Years (82 | 13.7%) for men and 55 to 59 Years (63 | 11.2%) for women.
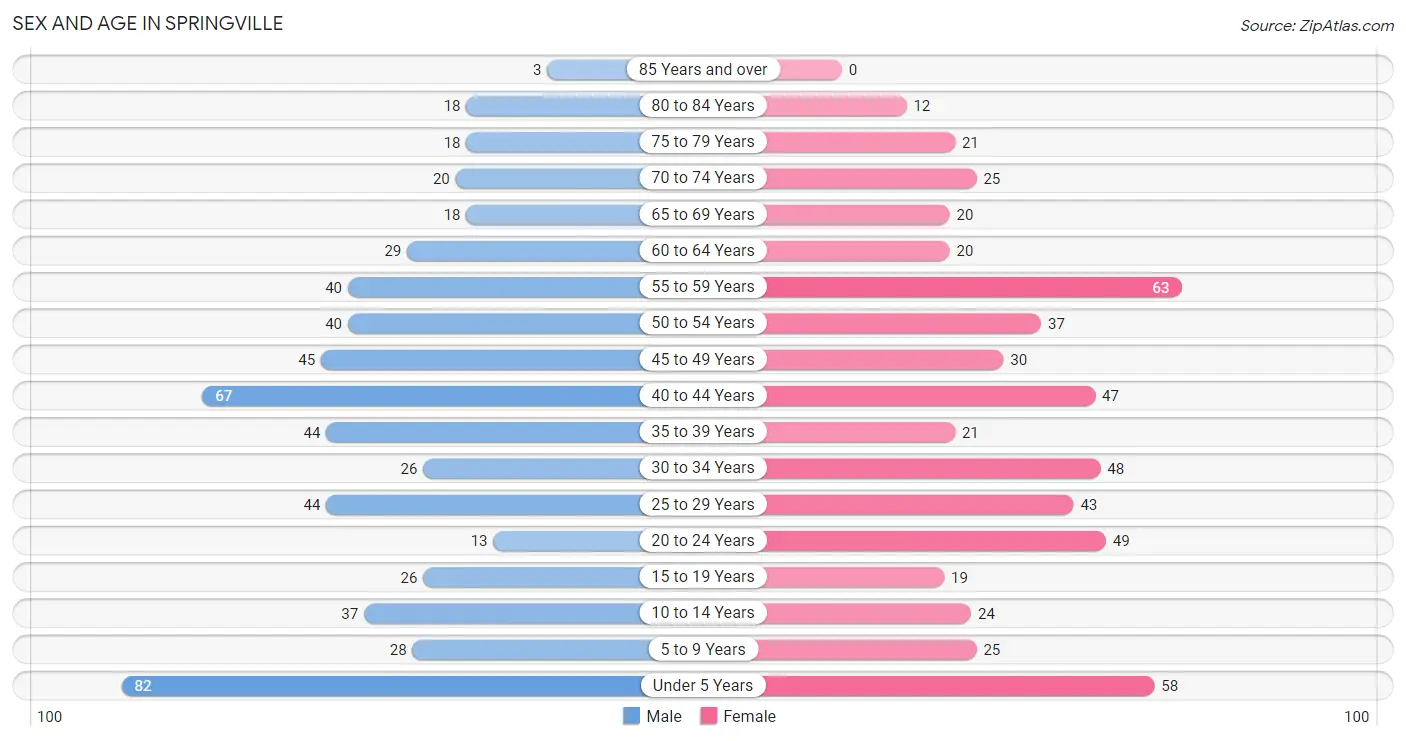
| Age Bracket | Male | Female |
| Under 5 Years | 82 (13.7%) | 58 (10.3%) |
| 5 to 9 Years | 28 (4.7%) | 25 (4.4%) |
| 10 to 14 Years | 37 (6.2%) | 24 (4.3%) |
| 15 to 19 Years | 26 (4.3%) | 19 (3.4%) |
| 20 to 24 Years | 13 (2.2%) | 49 (8.7%) |
| 25 to 29 Years | 44 (7.4%) | 43 (7.6%) |
| 30 to 34 Years | 26 (4.3%) | 48 (8.5%) |
| 35 to 39 Years | 44 (7.4%) | 21 (3.7%) |
| 40 to 44 Years | 67 (11.2%) | 47 (8.4%) |
| 45 to 49 Years | 45 (7.5%) | 30 (5.3%) |
| 50 to 54 Years | 40 (6.7%) | 37 (6.6%) |
| 55 to 59 Years | 40 (6.7%) | 63 (11.2%) |
| 60 to 64 Years | 29 (4.9%) | 20 (3.6%) |
| 65 to 69 Years | 18 (3.0%) | 20 (3.6%) |
| 70 to 74 Years | 20 (3.3%) | 25 (4.4%) |
| 75 to 79 Years | 18 (3.0%) | 21 (3.7%) |
| 80 to 84 Years | 18 (3.0%) | 12 (2.1%) |
| 85 Years and over | 3 (0.5%) | 0 (0.0%) |
| Total | 598 (100.0%) | 562 (100.0%) |
Families and Households in Springville
Median Family Size in Springville
The median family size in Springville is 2.93 persons per family, with married-couple families (273 | 79.8%) accounting for the largest median family size of 2.98 persons per family. On the other hand, single male/father families (25 | 7.3%) represent the smallest median family size with 2.44 persons per family.
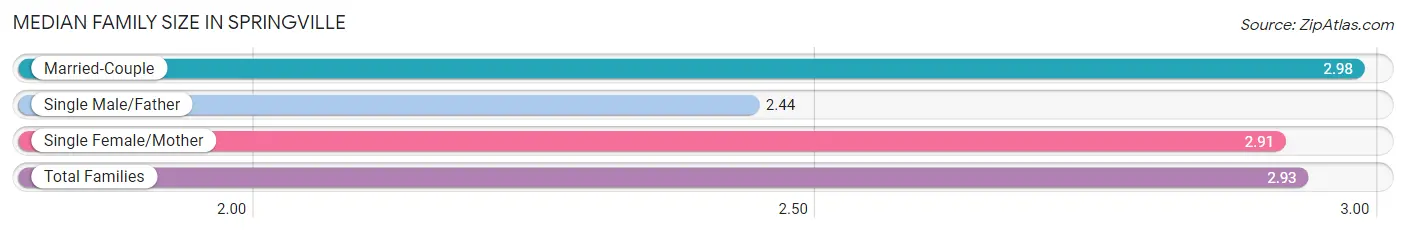
| Family Type | # Families | Family Size |
| Married-Couple | 273 (79.8%) | 2.98 |
| Single Male/Father | 25 (7.3%) | 2.44 |
| Single Female/Mother | 44 (12.9%) | 2.91 |
| Total Families | 342 (100.0%) | 2.93 |
Median Household Size in Springville
The median household size in Springville is 2.64 persons per household, with single female/mother households (44 | 10.0%) accounting for the largest median household size of 3.09 persons per household. non-family households (98 | 22.3%) represent the smallest median household size with 1.33 persons per household.
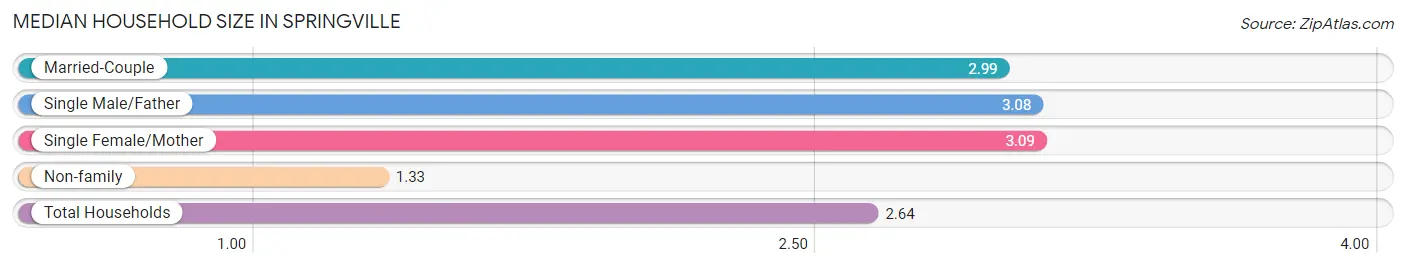
| Household Type | # Households | Household Size |
| Married-Couple | 273 (62.1%) | 2.99 |
| Single Male/Father | 25 (5.7%) | 3.08 |
| Single Female/Mother | 44 (10.0%) | 3.09 |
| Non-family | 98 (22.3%) | 1.33 |
| Total Households | 440 (100.0%) | 2.64 |
Household Size by Marriage Status in Springville
Out of a total of 440 households in Springville, 342 (77.7%) are family households, while 98 (22.3%) are nonfamily households. The most numerous type of family households are 2-person households, comprising 123, and the most common type of nonfamily households are 1-person households, comprising 80.
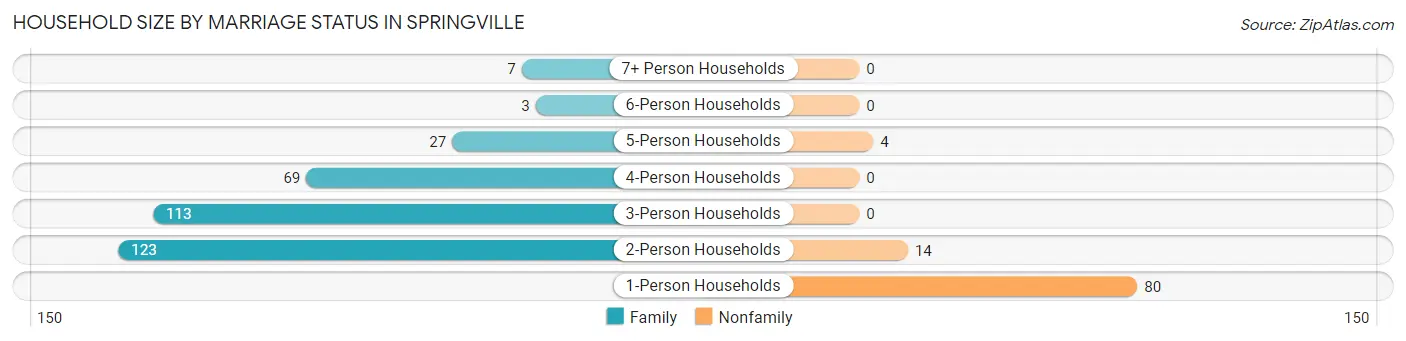
| Household Size | Family Households | Nonfamily Households |
| 1-Person Households | - | 80 (18.2%) |
| 2-Person Households | 123 (28.0%) | 14 (3.2%) |
| 3-Person Households | 113 (25.7%) | 0 (0.0%) |
| 4-Person Households | 69 (15.7%) | 0 (0.0%) |
| 5-Person Households | 27 (6.1%) | 4 (0.9%) |
| 6-Person Households | 3 (0.7%) | 0 (0.0%) |
| 7+ Person Households | 7 (1.6%) | 0 (0.0%) |
| Total | 342 (77.7%) | 98 (22.3%) |
Female Fertility in Springville
Fertility by Age in Springville
Average fertility rate in Springville is 156.0 births per 1,000 women. Women in the age bracket of 20 to 34 years have the highest fertility rate with 307.0 births per 1,000 women. Women in the age bracket of 20 to 34 years acount for 100.0% of all women with births.
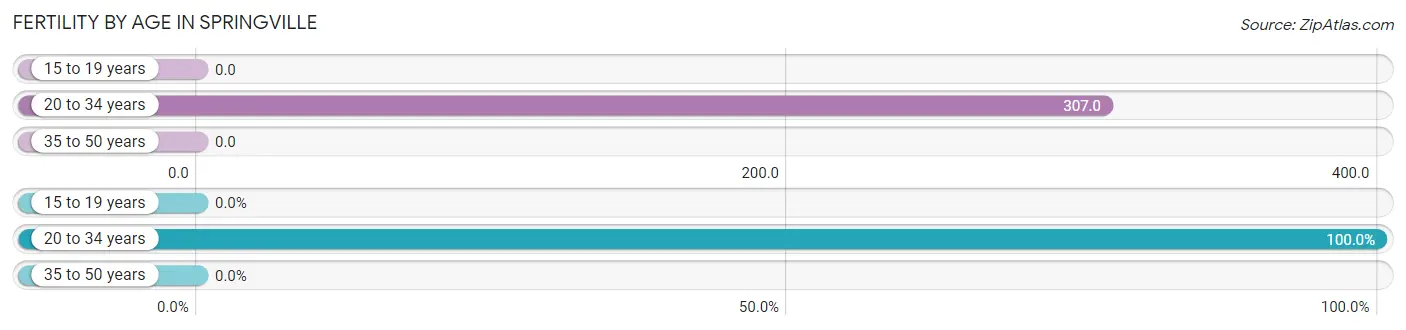
| Age Bracket | Women with Births | Births / 1,000 Women |
| 15 to 19 years | 0 (0.0%) | 0.0 |
| 20 to 34 years | 43 (100.0%) | 307.0 |
| 35 to 50 years | 0 (0.0%) | 0.0 |
| Total | 43 (100.0%) | 156.0 |
Fertility by Age by Marriage Status in Springville
51.2% of women with births (43) in Springville are married. The highest percentage of unmarried women with births falls into 20 to 34 years age bracket with 48.8% of them unmarried at the time of birth, while the lowest percentage of unmarried women with births belong to 20 to 34 years age bracket with 48.8% of them unmarried.
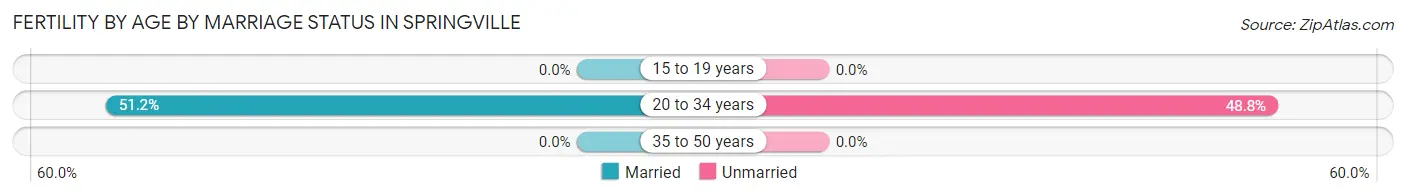
| Age Bracket | Married | Unmarried |
| 15 to 19 years | 0 (0.0%) | 0 (0.0%) |
| 20 to 34 years | 22 (51.2%) | 21 (48.8%) |
| 35 to 50 years | 0 (0.0%) | 0 (0.0%) |
| Total | 22 (51.2%) | 21 (48.8%) |
Fertility by Education in Springville
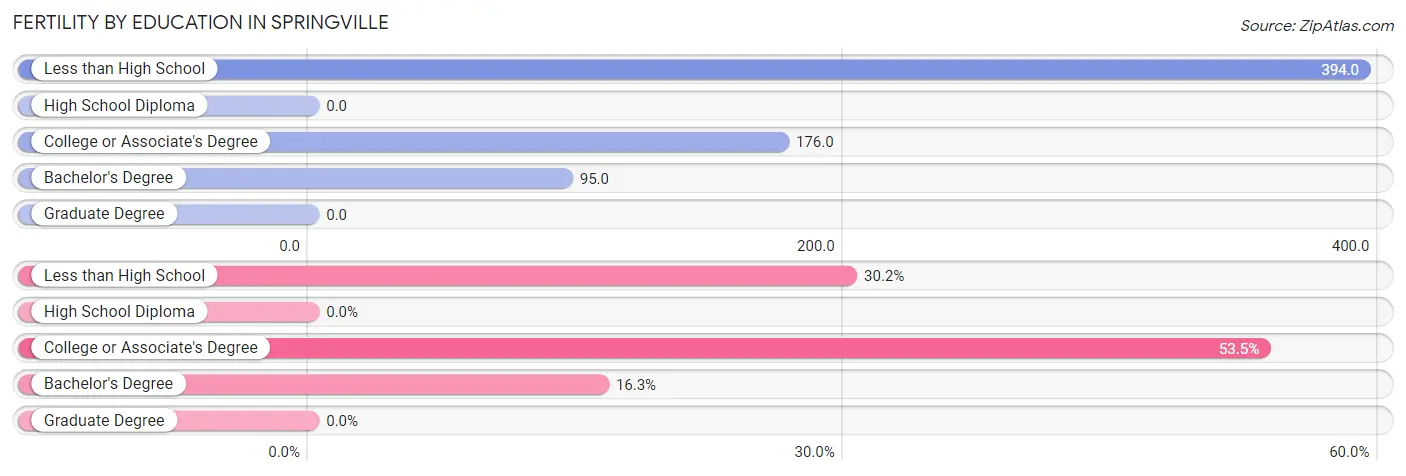
| Educational Attainment | Women with Births | Births / 1,000 Women |
| Less than High School | 13 (30.2%) | 394.0 |
| High School Diploma | 0 (0.0%) | 0.0 |
| College or Associate's Degree | 23 (53.5%) | 176.0 |
| Bachelor's Degree | 7 (16.3%) | 95.0 |
| Graduate Degree | 0 (0.0%) | 0.0 |
| Total | 43 (100.0%) | 156.0 |
Fertility by Education by Marriage Status in Springville
48.8% of women with births in Springville are unmarried. Women with the educational attainment of bachelor's degree are most likely to be married with 100.0% of them married at childbirth, while women with the educational attainment of less than high school are least likely to be married with 100.0% of them unmarried at childbirth.
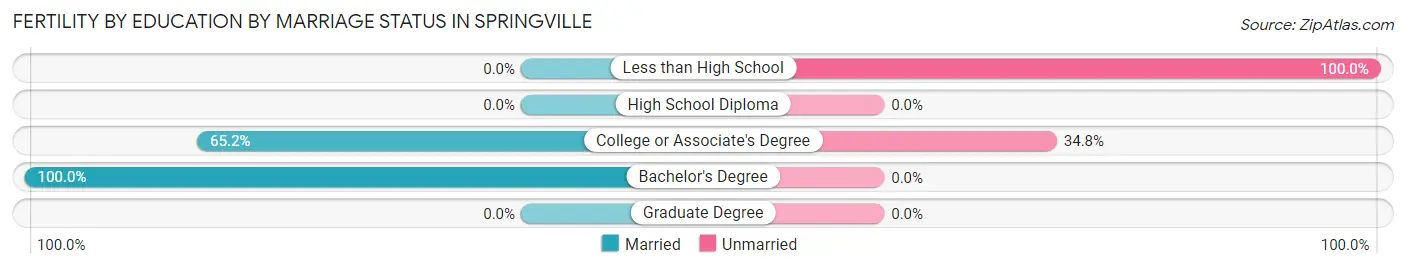
| Educational Attainment | Married | Unmarried |
| Less than High School | 0 (0.0%) | 13 (100.0%) |
| High School Diploma | 0 (0.0%) | 0 (0.0%) |
| College or Associate's Degree | 15 (65.2%) | 8 (34.8%) |
| Bachelor's Degree | 7 (100.0%) | 0 (0.0%) |
| Graduate Degree | 0 (0.0%) | 0 (0.0%) |
| Total | 22 (51.2%) | 21 (48.8%) |
Employment Characteristics in Springville
Employment by Class of Employer in Springville
Among the 614 employed individuals in Springville, private company employees (488 | 79.5%), local government employees (40 | 6.5%), and self-employed (not incorporated) (31 | 5.1%) make up the most common classes of employment.
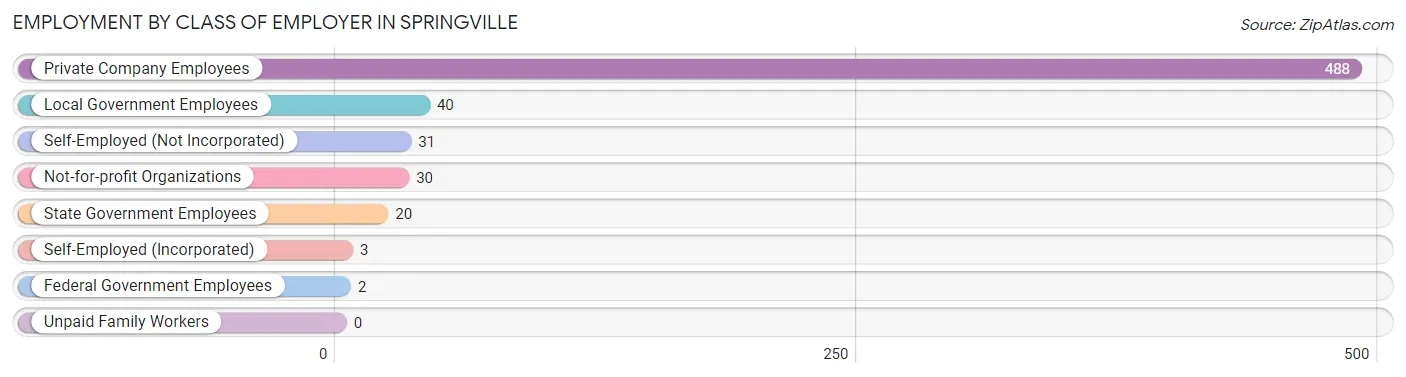
| Employer Class | # Employees | % Employees |
| Private Company Employees | 488 | 79.5% |
| Self-Employed (Incorporated) | 3 | 0.5% |
| Self-Employed (Not Incorporated) | 31 | 5.1% |
| Not-for-profit Organizations | 30 | 4.9% |
| Local Government Employees | 40 | 6.5% |
| State Government Employees | 20 | 3.3% |
| Federal Government Employees | 2 | 0.3% |
| Unpaid Family Workers | 0 | 0.0% |
| Total | 614 | 100.0% |
Employment Status by Age in Springville
According to the labor force statistics for Springville, out of the total population over 16 years of age (896), 71.2% or 638 individuals are in the labor force, with 1.4% or 9 of them unemployed. The age group with the highest labor force participation rate is 25 to 29 years, with 97.7% or 85 individuals in the labor force. Within the labor force, the 16 to 19 years age range has the highest percentage of unemployed individuals, with 27.8% or 5 of them being unemployed.
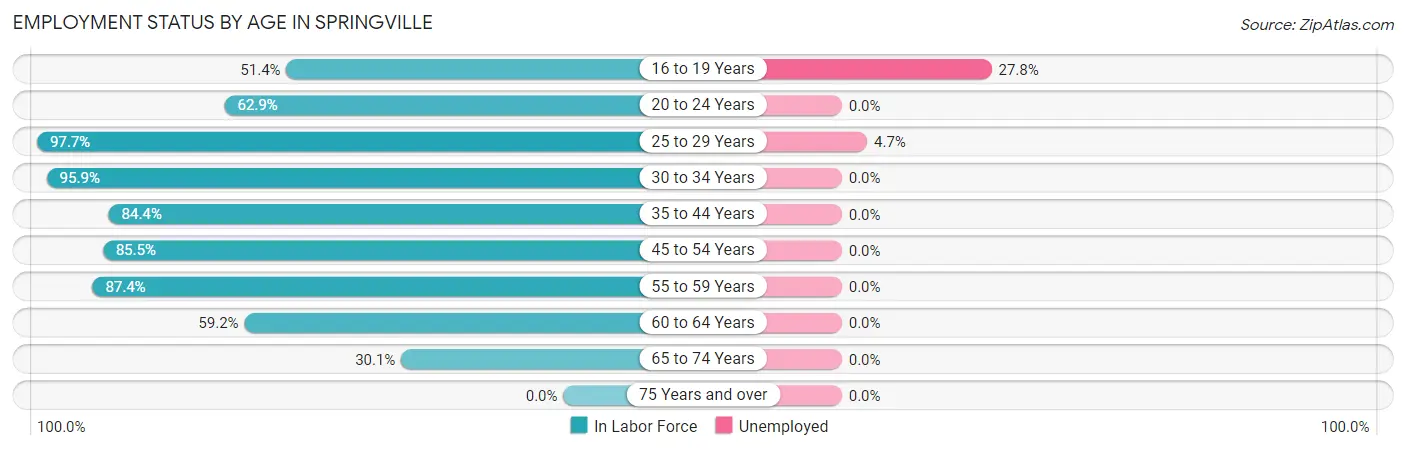
| Age Bracket | In Labor Force | Unemployed |
| 16 to 19 Years | 18 (51.4%) | 5 (27.8%) |
| 20 to 24 Years | 39 (62.9%) | 0 (0.0%) |
| 25 to 29 Years | 85 (97.7%) | 4 (4.7%) |
| 30 to 34 Years | 71 (95.9%) | 0 (0.0%) |
| 35 to 44 Years | 151 (84.4%) | 0 (0.0%) |
| 45 to 54 Years | 130 (85.5%) | 0 (0.0%) |
| 55 to 59 Years | 90 (87.4%) | 0 (0.0%) |
| 60 to 64 Years | 29 (59.2%) | 0 (0.0%) |
| 65 to 74 Years | 25 (30.1%) | 0 (0.0%) |
| 75 Years and over | 0 (0.0%) | 0 (0.0%) |
| Total | 638 (71.2%) | 9 (1.4%) |
Employment Status by Educational Attainment in Springville
According to labor force statistics for Springville, 86.3% of individuals (556) out of the total population between 25 and 64 years of age (644) are in the labor force, with 0.7% or 4 of them being unemployed. The group with the highest labor force participation rate are those with the educational attainment of high school diploma, with 94.3% or 181 individuals in the labor force. Within the labor force, individuals with college / associate degree education have the highest percentage of unemployment, with 1.9% or 4 of them being unemployed.
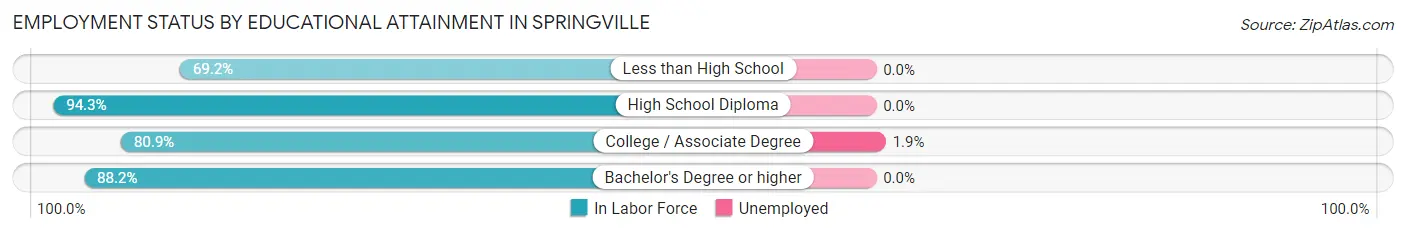
| Educational Attainment | In Labor Force | Unemployed |
| Less than High School | 18 (69.2%) | 0 (0.0%) |
| High School Diploma | 181 (94.3%) | 0 (0.0%) |
| College / Associate Degree | 207 (80.9%) | 5 (1.9%) |
| Bachelor's Degree or higher | 150 (88.2%) | 0 (0.0%) |
| Total | 556 (86.3%) | 5 (0.7%) |
Employment Occupations by Sex in Springville
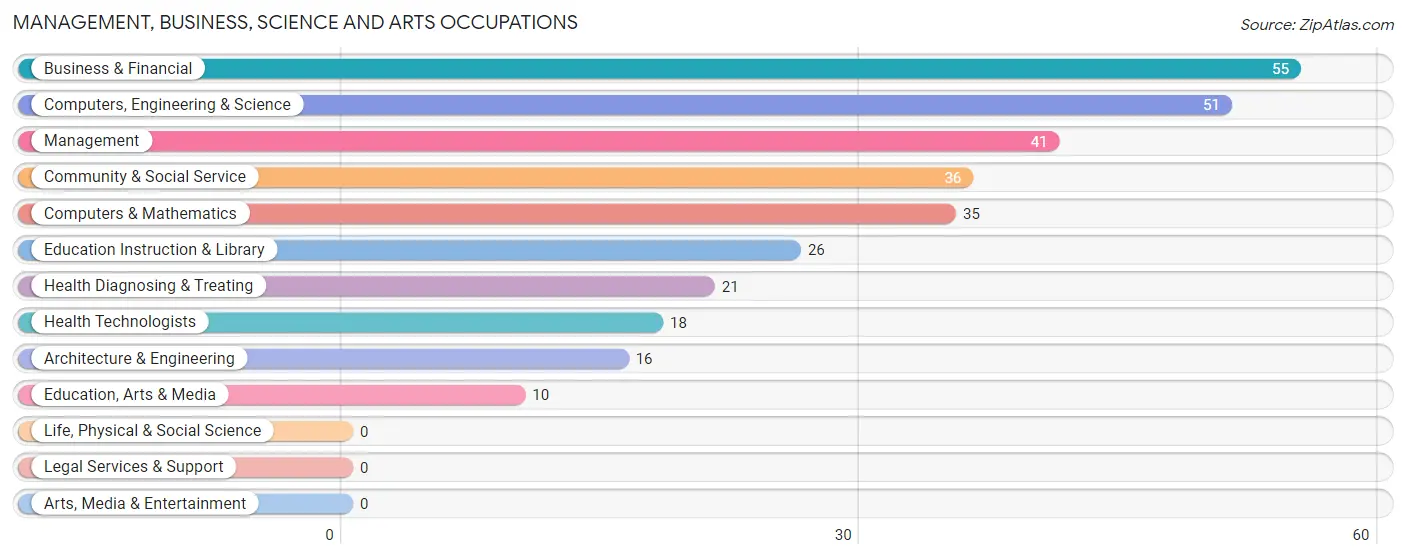
Management, Business, Science and Arts Occupations
The most common Management, Business, Science and Arts occupations in Springville are Business & Financial (55 | 8.7%), Computers, Engineering & Science (51 | 8.1%), Management (41 | 6.5%), Community & Social Service (36 | 5.7%), and Computers & Mathematics (35 | 5.6%).
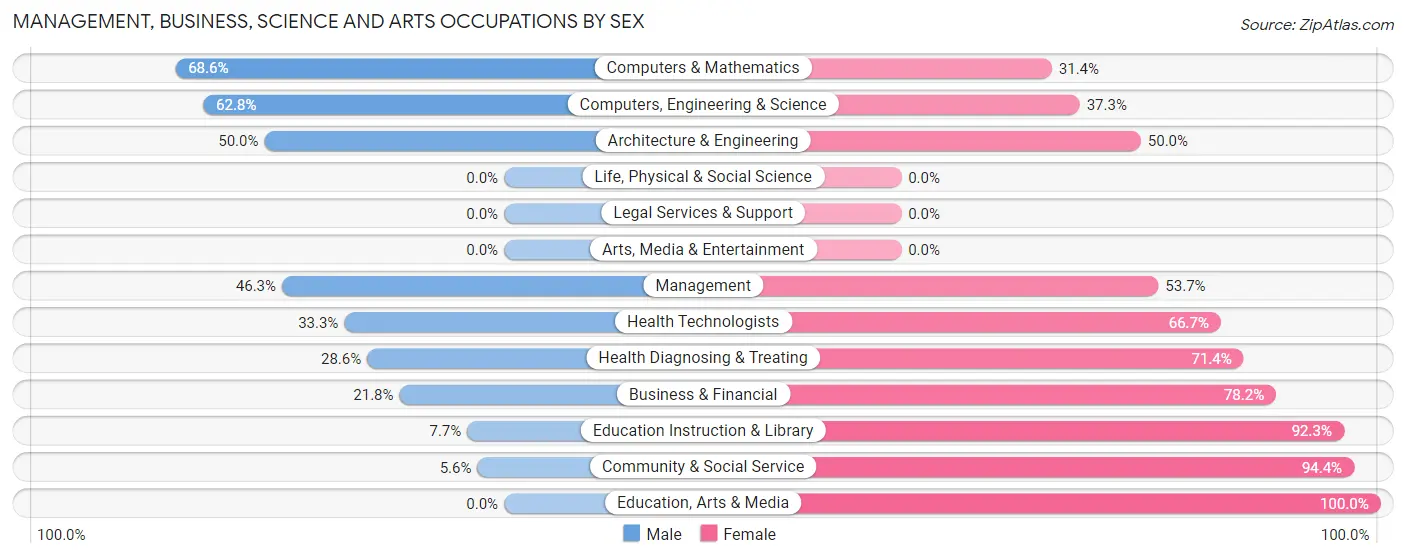
Management, Business, Science and Arts Occupations by Sex
Within the Management, Business, Science and Arts occupations in Springville, the most male-oriented occupations are Computers & Mathematics (68.6%), Computers, Engineering & Science (62.7%), and Architecture & Engineering (50.0%), while the most female-oriented occupations are Education, Arts & Media (100.0%), Community & Social Service (94.4%), and Education Instruction & Library (92.3%).
| Occupation | Male | Female |
| Management | 19 (46.3%) | 22 (53.7%) |
| Business & Financial | 12 (21.8%) | 43 (78.2%) |
| Computers, Engineering & Science | 32 (62.7%) | 19 (37.2%) |
| Computers & Mathematics | 24 (68.6%) | 11 (31.4%) |
| Architecture & Engineering | 8 (50.0%) | 8 (50.0%) |
| Life, Physical & Social Science | 0 (0.0%) | 0 (0.0%) |
| Community & Social Service | 2 (5.6%) | 34 (94.4%) |
| Education, Arts & Media | 0 (0.0%) | 10 (100.0%) |
| Legal Services & Support | 0 (0.0%) | 0 (0.0%) |
| Education Instruction & Library | 2 (7.7%) | 24 (92.3%) |
| Arts, Media & Entertainment | 0 (0.0%) | 0 (0.0%) |
| Health Diagnosing & Treating | 6 (28.6%) | 15 (71.4%) |
| Health Technologists | 6 (33.3%) | 12 (66.7%) |
| Total (Category) | 71 (34.8%) | 133 (65.2%) |
| Total (Overall) | 302 (48.0%) | 327 (52.0%) |
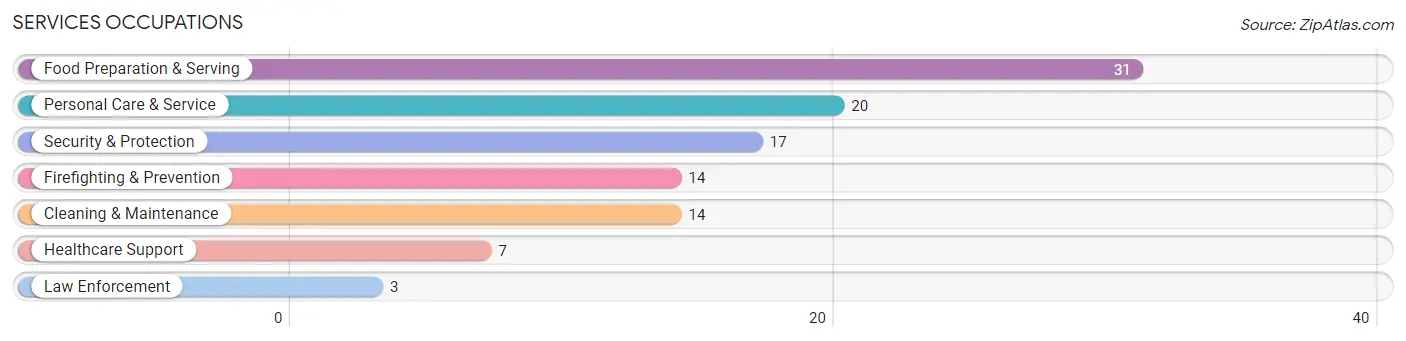
Services Occupations
The most common Services occupations in Springville are Food Preparation & Serving (31 | 4.9%), Personal Care & Service (20 | 3.2%), Security & Protection (17 | 2.7%), Firefighting & Prevention (14 | 2.2%), and Cleaning & Maintenance (14 | 2.2%).
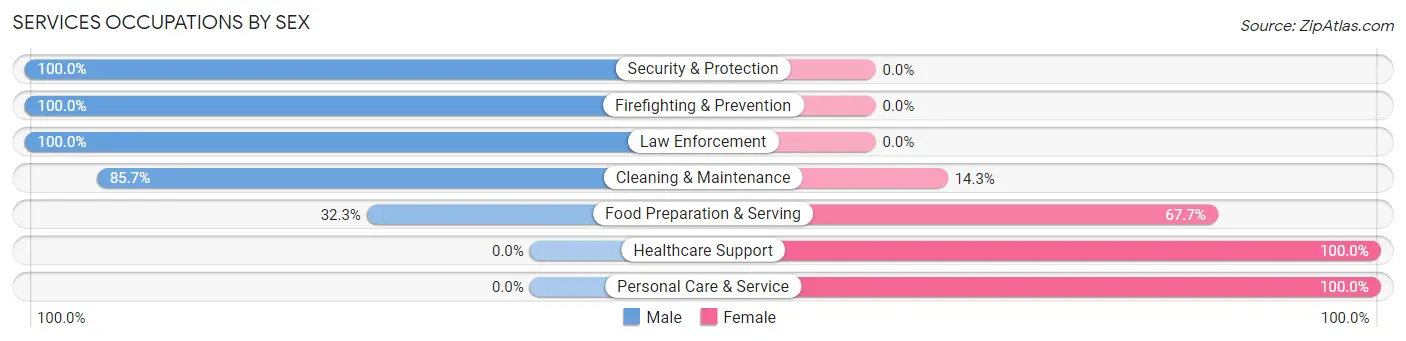
Services Occupations by Sex
Within the Services occupations in Springville, the most male-oriented occupations are Security & Protection (100.0%), Firefighting & Prevention (100.0%), and Law Enforcement (100.0%), while the most female-oriented occupations are Healthcare Support (100.0%), Personal Care & Service (100.0%), and Food Preparation & Serving (67.7%).
| Occupation | Male | Female |
| Healthcare Support | 0 (0.0%) | 7 (100.0%) |
| Security & Protection | 17 (100.0%) | 0 (0.0%) |
| Firefighting & Prevention | 14 (100.0%) | 0 (0.0%) |
| Law Enforcement | 3 (100.0%) | 0 (0.0%) |
| Food Preparation & Serving | 10 (32.3%) | 21 (67.7%) |
| Cleaning & Maintenance | 12 (85.7%) | 2 (14.3%) |
| Personal Care & Service | 0 (0.0%) | 20 (100.0%) |
| Total (Category) | 39 (43.8%) | 50 (56.2%) |
| Total (Overall) | 302 (48.0%) | 327 (52.0%) |
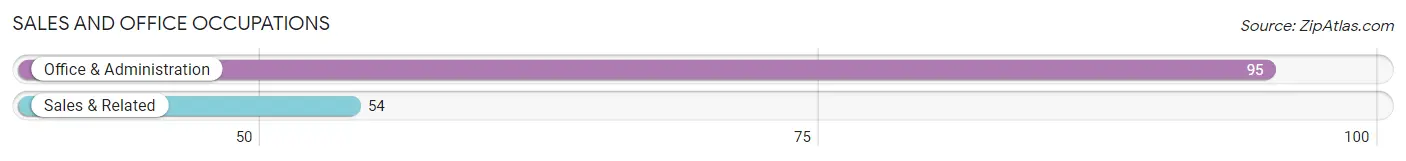
Sales and Office Occupations
The most common Sales and Office occupations in Springville are Office & Administration (95 | 15.1%), and Sales & Related (54 | 8.6%).
Sales and Office Occupations by Sex
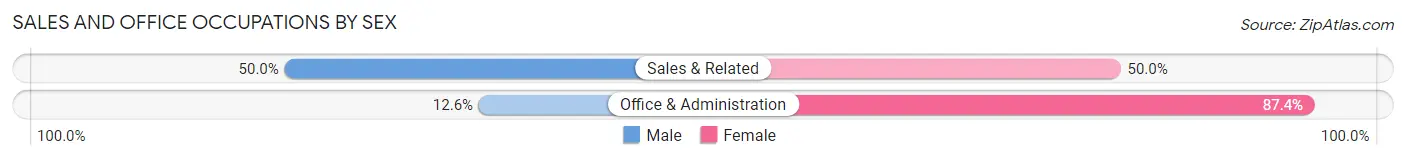
| Occupation | Male | Female |
| Sales & Related | 27 (50.0%) | 27 (50.0%) |
| Office & Administration | 12 (12.6%) | 83 (87.4%) |
| Total (Category) | 39 (26.2%) | 110 (73.8%) |
| Total (Overall) | 302 (48.0%) | 327 (52.0%) |
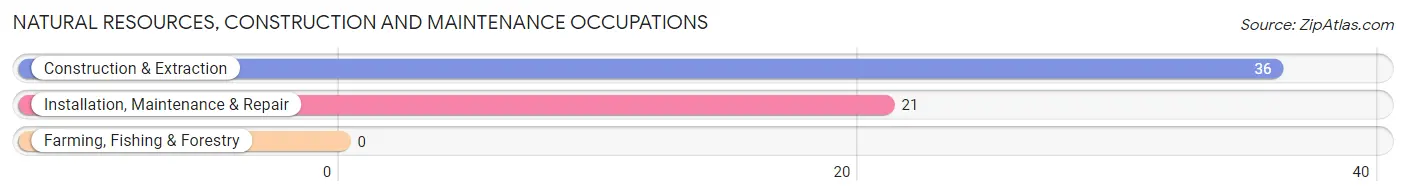
Natural Resources, Construction and Maintenance Occupations
The most common Natural Resources, Construction and Maintenance occupations in Springville are Construction & Extraction (36 | 5.7%), and Installation, Maintenance & Repair (21 | 3.3%).
Natural Resources, Construction and Maintenance Occupations by Sex
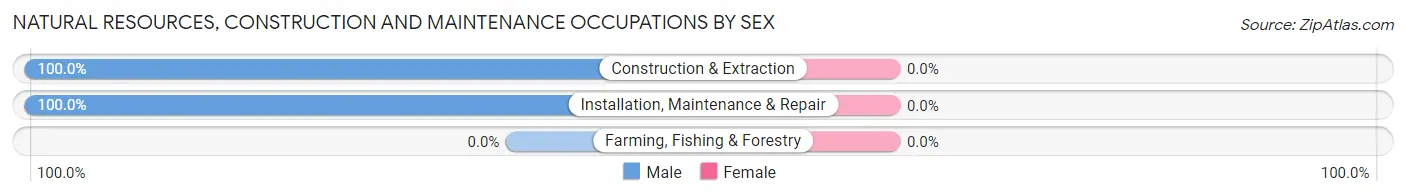
| Occupation | Male | Female |
| Farming, Fishing & Forestry | 0 (0.0%) | 0 (0.0%) |
| Construction & Extraction | 36 (100.0%) | 0 (0.0%) |
| Installation, Maintenance & Repair | 21 (100.0%) | 0 (0.0%) |
| Total (Category) | 57 (100.0%) | 0 (0.0%) |
| Total (Overall) | 302 (48.0%) | 327 (52.0%) |
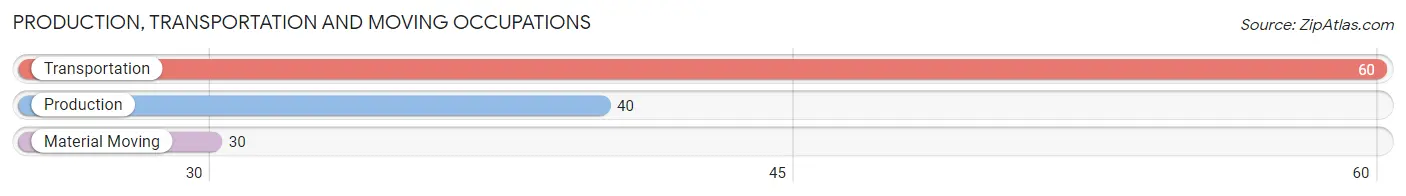
Production, Transportation and Moving Occupations
The most common Production, Transportation and Moving occupations in Springville are Transportation (60 | 9.5%), Production (40 | 6.4%), and Material Moving (30 | 4.8%).
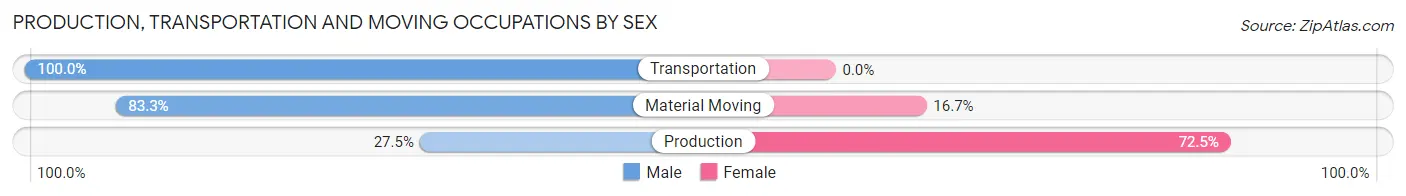
Production, Transportation and Moving Occupations by Sex
| Occupation | Male | Female |
| Production | 11 (27.5%) | 29 (72.5%) |
| Transportation | 60 (100.0%) | 0 (0.0%) |
| Material Moving | 25 (83.3%) | 5 (16.7%) |
| Total (Category) | 96 (73.9%) | 34 (26.2%) |
| Total (Overall) | 302 (48.0%) | 327 (52.0%) |
Employment Industries by Sex in Springville
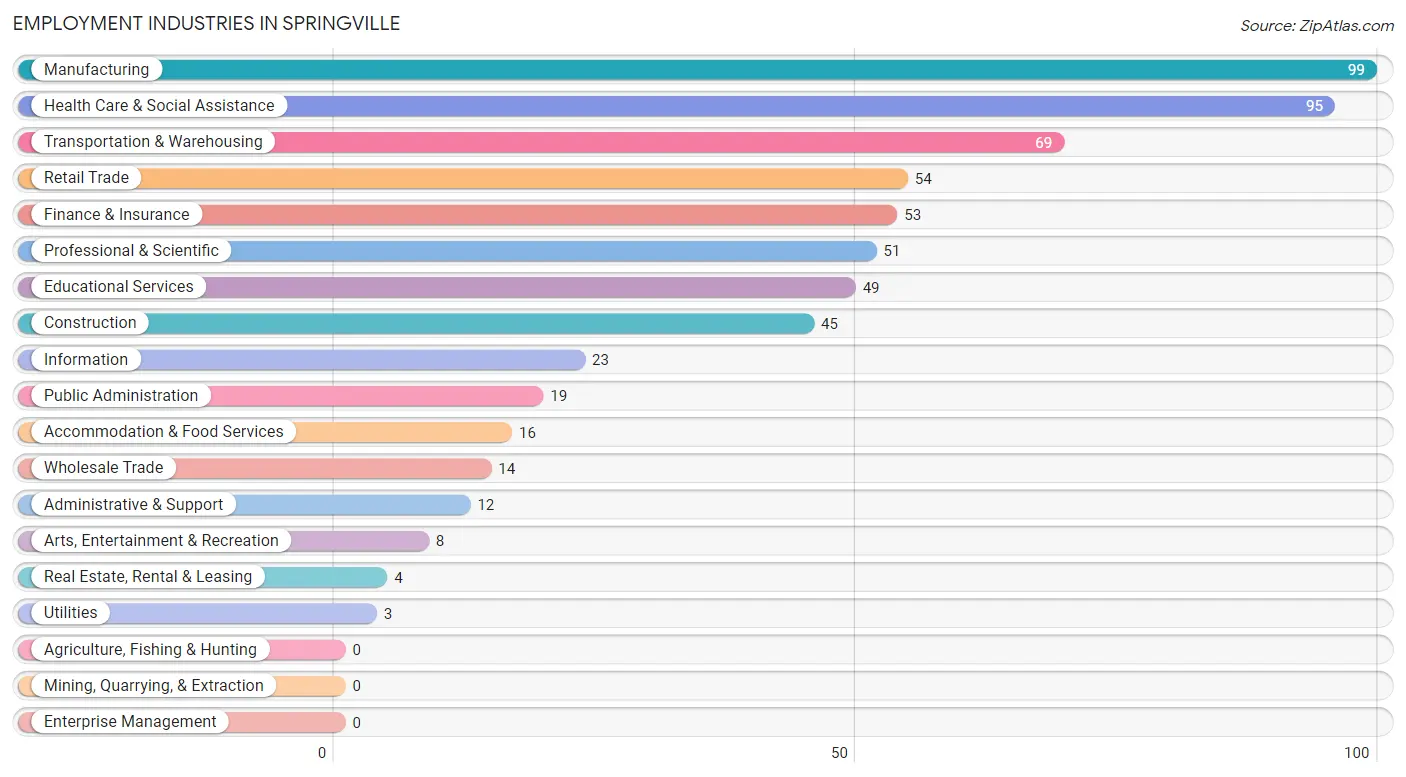
Employment Industries in Springville
The major employment industries in Springville include Manufacturing (99 | 15.7%), Health Care & Social Assistance (95 | 15.1%), Transportation & Warehousing (69 | 11.0%), Retail Trade (54 | 8.6%), and Finance & Insurance (53 | 8.4%).
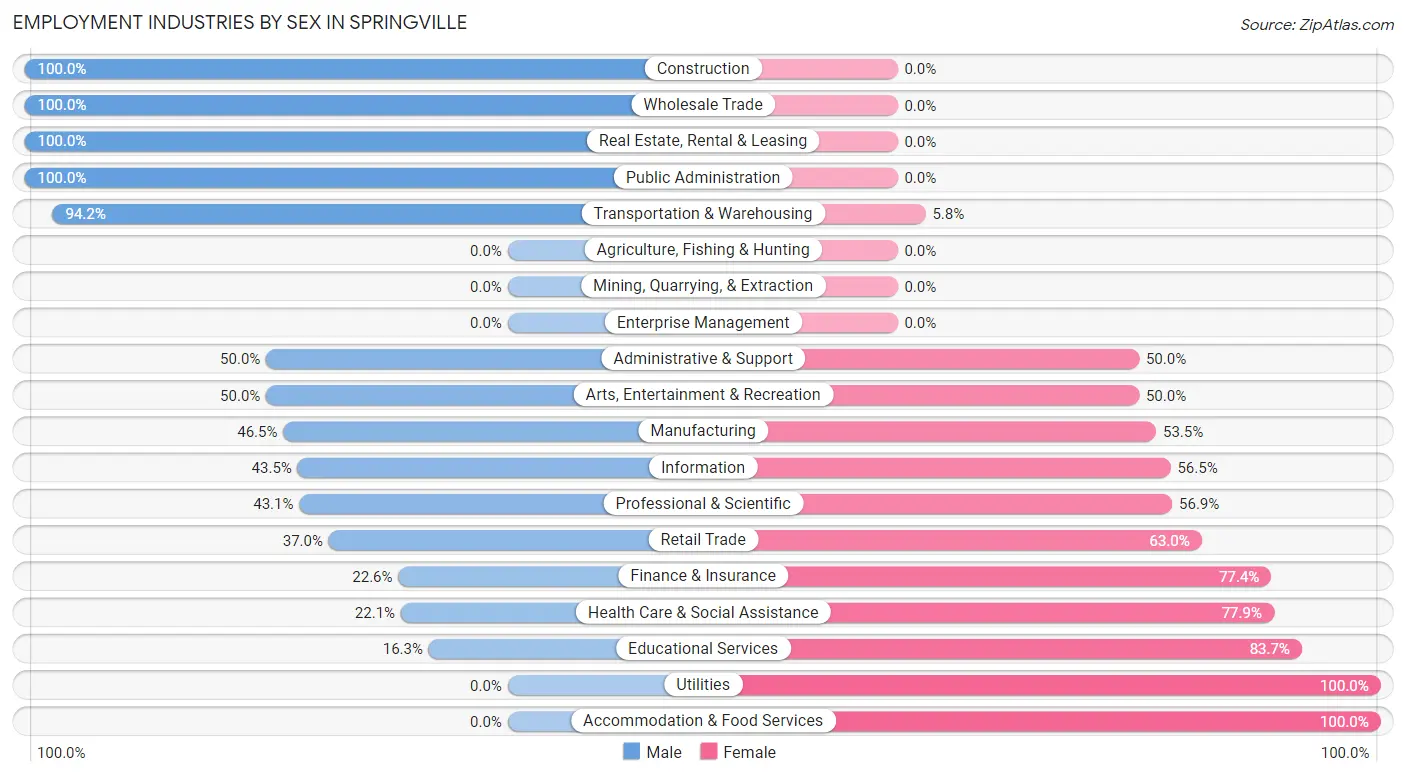
Employment Industries by Sex in Springville
The Springville industries that see more men than women are Construction (100.0%), Wholesale Trade (100.0%), and Real Estate, Rental & Leasing (100.0%), whereas the industries that tend to have a higher number of women are Utilities (100.0%), Accommodation & Food Services (100.0%), and Educational Services (83.7%).
| Industry | Male | Female |
| Agriculture, Fishing & Hunting | 0 (0.0%) | 0 (0.0%) |
| Mining, Quarrying, & Extraction | 0 (0.0%) | 0 (0.0%) |
| Construction | 45 (100.0%) | 0 (0.0%) |
| Manufacturing | 46 (46.5%) | 53 (53.5%) |
| Wholesale Trade | 14 (100.0%) | 0 (0.0%) |
| Retail Trade | 20 (37.0%) | 34 (63.0%) |
| Transportation & Warehousing | 65 (94.2%) | 4 (5.8%) |
| Utilities | 0 (0.0%) | 3 (100.0%) |
| Information | 10 (43.5%) | 13 (56.5%) |
| Finance & Insurance | 12 (22.6%) | 41 (77.4%) |
| Real Estate, Rental & Leasing | 4 (100.0%) | 0 (0.0%) |
| Professional & Scientific | 22 (43.1%) | 29 (56.9%) |
| Enterprise Management | 0 (0.0%) | 0 (0.0%) |
| Administrative & Support | 6 (50.0%) | 6 (50.0%) |
| Educational Services | 8 (16.3%) | 41 (83.7%) |
| Health Care & Social Assistance | 21 (22.1%) | 74 (77.9%) |
| Arts, Entertainment & Recreation | 4 (50.0%) | 4 (50.0%) |
| Accommodation & Food Services | 0 (0.0%) | 16 (100.0%) |
| Public Administration | 19 (100.0%) | 0 (0.0%) |
| Total | 302 (48.0%) | 327 (52.0%) |
Education in Springville
School Enrollment in Springville
The most common levels of schooling among the 224 students in Springville are high school (46 | 20.5%), middle school (45 | 20.1%), and college / undergraduate (44 | 19.6%).
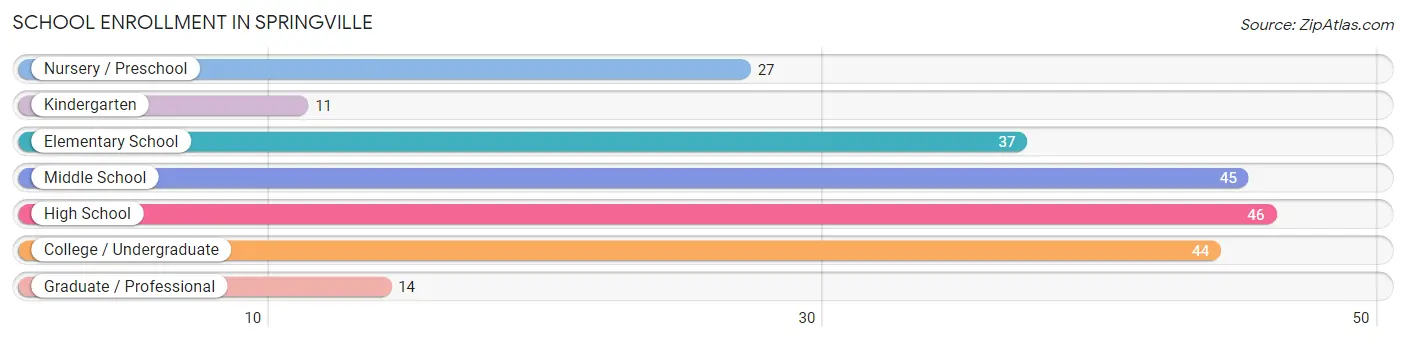
| School Level | # Students | % Students |
| Nursery / Preschool | 27 | 12.0% |
| Kindergarten | 11 | 4.9% |
| Elementary School | 37 | 16.5% |
| Middle School | 45 | 20.1% |
| High School | 46 | 20.5% |
| College / Undergraduate | 44 | 19.6% |
| Graduate / Professional | 14 | 6.2% |
| Total | 224 | 100.0% |
School Enrollment by Age by Funding Source in Springville
Out of a total of 224 students who are enrolled in schools in Springville, 23 (10.3%) attend a private institution, while the remaining 201 (89.7%) are enrolled in public schools. The age group of 25 to 34 year olds has the highest likelihood of being enrolled in private schools, with 8 (61.5% in the age bracket) enrolled. Conversely, the age group of 5 to 9 year old has the lowest likelihood of being enrolled in a private school, with 53 (100.0% in the age bracket) attending a public institution.
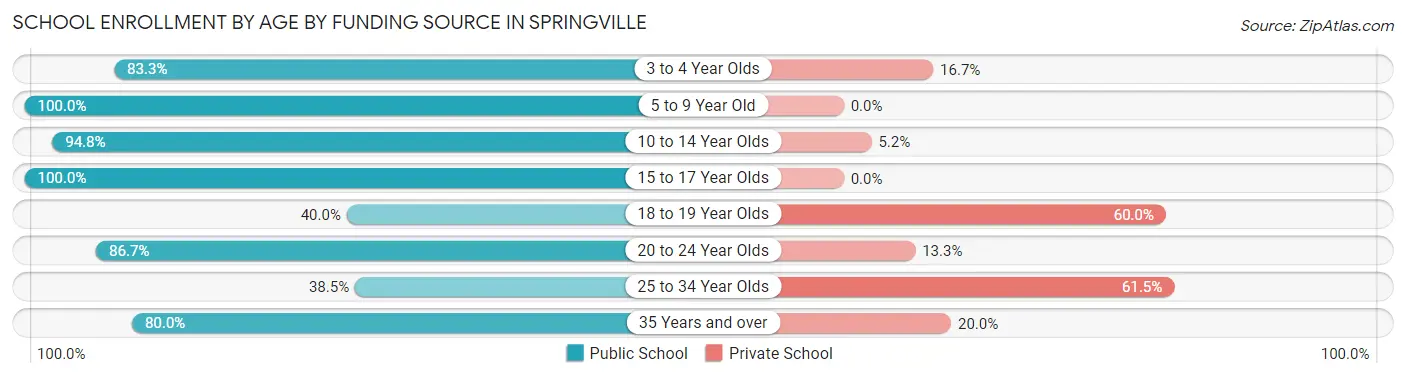
| Age Bracket | Public School | Private School |
| 3 to 4 Year Olds | 15 (83.3%) | 3 (16.7%) |
| 5 to 9 Year Old | 53 (100.0%) | 0 (0.0%) |
| 10 to 14 Year Olds | 55 (94.8%) | 3 (5.2%) |
| 15 to 17 Year Olds | 37 (100.0%) | 0 (0.0%) |
| 18 to 19 Year Olds | 2 (40.0%) | 3 (60.0%) |
| 20 to 24 Year Olds | 26 (86.7%) | 4 (13.3%) |
| 25 to 34 Year Olds | 5 (38.5%) | 8 (61.5%) |
| 35 Years and over | 8 (80.0%) | 2 (20.0%) |
| Total | 201 (89.7%) | 23 (10.3%) |
Educational Attainment by Field of Study in Springville
Education (48 | 19.3%), business (45 | 18.1%), arts & humanities (27 | 10.8%), engineering (18 | 7.2%), and bio, nature & agricultural (16 | 6.4%) are the most common fields of study among 249 individuals in Springville who have obtained a bachelor's degree or higher.
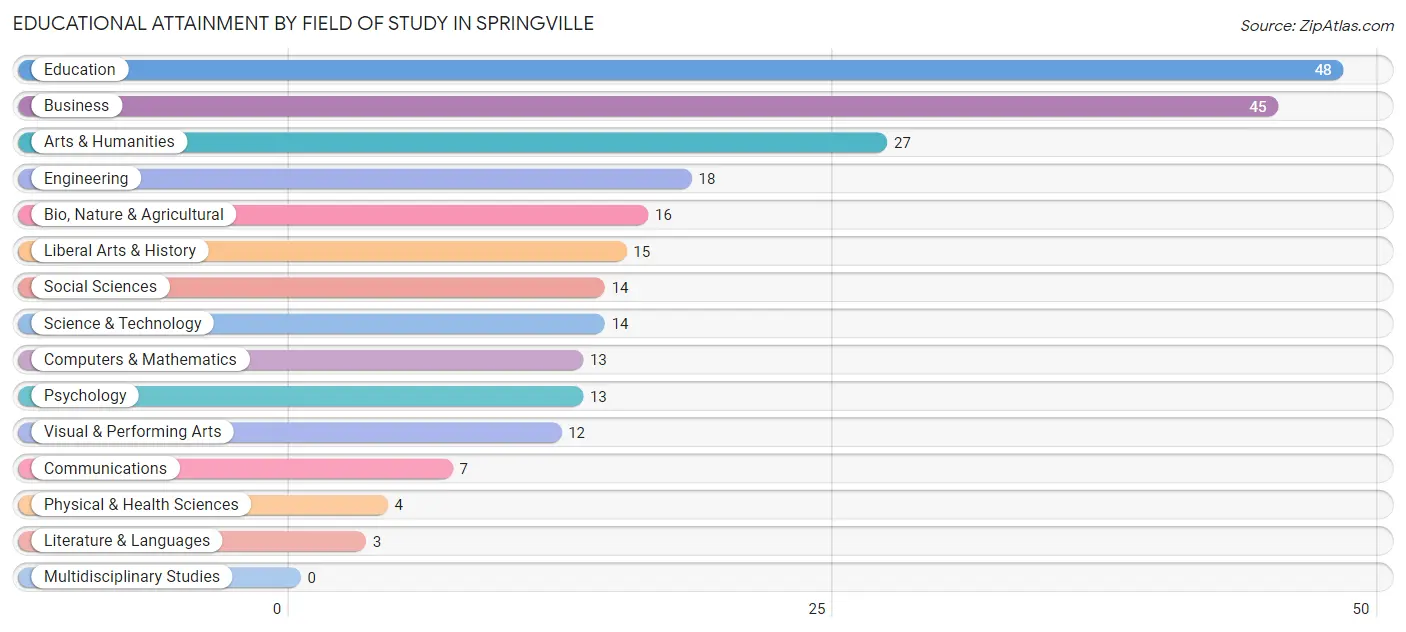
| Field of Study | # Graduates | % Graduates |
| Computers & Mathematics | 13 | 5.2% |
| Bio, Nature & Agricultural | 16 | 6.4% |
| Physical & Health Sciences | 4 | 1.6% |
| Psychology | 13 | 5.2% |
| Social Sciences | 14 | 5.6% |
| Engineering | 18 | 7.2% |
| Multidisciplinary Studies | 0 | 0.0% |
| Science & Technology | 14 | 5.6% |
| Business | 45 | 18.1% |
| Education | 48 | 19.3% |
| Literature & Languages | 3 | 1.2% |
| Liberal Arts & History | 15 | 6.0% |
| Visual & Performing Arts | 12 | 4.8% |
| Communications | 7 | 2.8% |
| Arts & Humanities | 27 | 10.8% |
| Total | 249 | 100.0% |
Transportation & Commute in Springville
Vehicle Availability by Sex in Springville
The most prevalent vehicle ownership categories in Springville are males with 2 vehicles (159, accounting for 53.9%) and females with 2 vehicles (147, making up 49.8%).
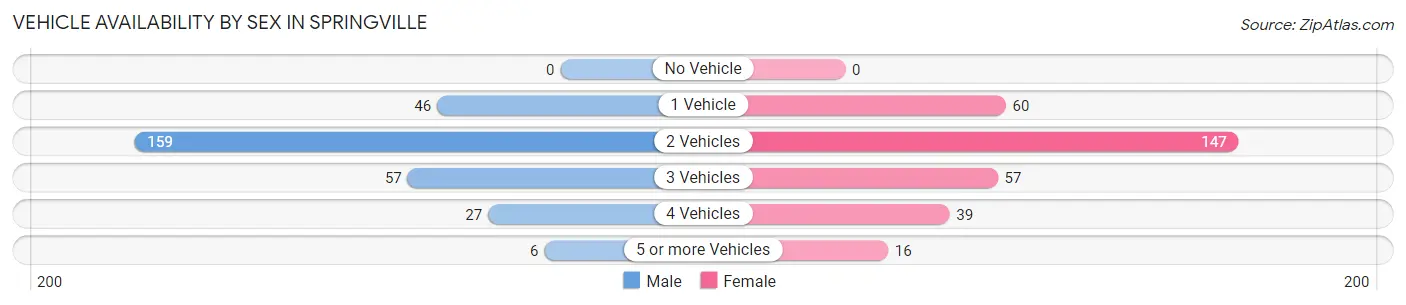
| Vehicles Available | Male | Female |
| No Vehicle | 0 (0.0%) | 0 (0.0%) |
| 1 Vehicle | 46 (15.6%) | 60 (18.8%) |
| 2 Vehicles | 159 (53.9%) | 147 (46.1%) |
| 3 Vehicles | 57 (19.3%) | 57 (17.9%) |
| 4 Vehicles | 27 (9.1%) | 39 (12.2%) |
| 5 or more Vehicles | 6 (2.0%) | 16 (5.0%) |
| Total | 295 (100.0%) | 319 (100.0%) |
Commute Time in Springville
The most frequently occuring commute durations in Springville are 25 to 29 minutes (141 commuters, 25.7%), 30 to 34 minutes (123 commuters, 22.5%), and 20 to 24 minutes (61 commuters, 11.1%).
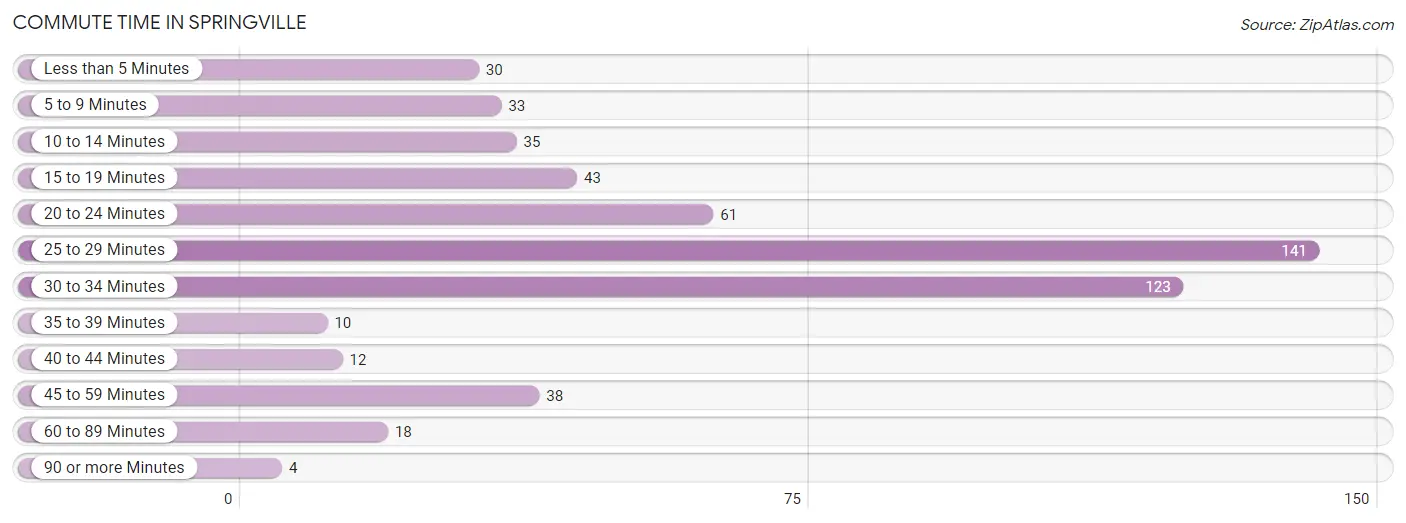
| Commute Time | # Commuters | % Commuters |
| Less than 5 Minutes | 30 | 5.5% |
| 5 to 9 Minutes | 33 | 6.0% |
| 10 to 14 Minutes | 35 | 6.4% |
| 15 to 19 Minutes | 43 | 7.9% |
| 20 to 24 Minutes | 61 | 11.1% |
| 25 to 29 Minutes | 141 | 25.7% |
| 30 to 34 Minutes | 123 | 22.5% |
| 35 to 39 Minutes | 10 | 1.8% |
| 40 to 44 Minutes | 12 | 2.2% |
| 45 to 59 Minutes | 38 | 6.9% |
| 60 to 89 Minutes | 18 | 3.3% |
| 90 or more Minutes | 4 | 0.7% |
Commute Time by Sex in Springville
The most common commute times in Springville are 25 to 29 minutes (83 commuters, 30.3%) for males and 30 to 34 minutes (60 commuters, 21.9%) for females.
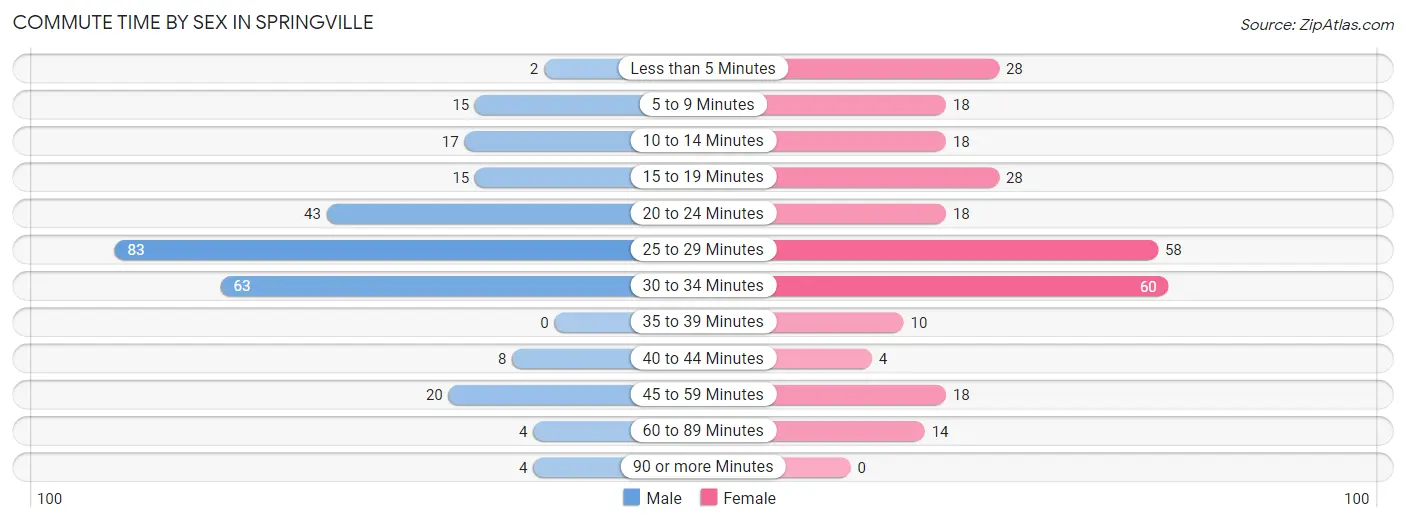
| Commute Time | Male | Female |
| Less than 5 Minutes | 2 (0.7%) | 28 (10.2%) |
| 5 to 9 Minutes | 15 (5.5%) | 18 (6.6%) |
| 10 to 14 Minutes | 17 (6.2%) | 18 (6.6%) |
| 15 to 19 Minutes | 15 (5.5%) | 28 (10.2%) |
| 20 to 24 Minutes | 43 (15.7%) | 18 (6.6%) |
| 25 to 29 Minutes | 83 (30.3%) | 58 (21.2%) |
| 30 to 34 Minutes | 63 (23.0%) | 60 (21.9%) |
| 35 to 39 Minutes | 0 (0.0%) | 10 (3.6%) |
| 40 to 44 Minutes | 8 (2.9%) | 4 (1.5%) |
| 45 to 59 Minutes | 20 (7.3%) | 18 (6.6%) |
| 60 to 89 Minutes | 4 (1.5%) | 14 (5.1%) |
| 90 or more Minutes | 4 (1.5%) | 0 (0.0%) |
Time of Departure to Work by Sex in Springville
The most frequent times of departure to work in Springville are 6:00 AM to 6:29 AM (55, 20.1%) for males and 7:00 AM to 7:29 AM (89, 32.5%) for females.
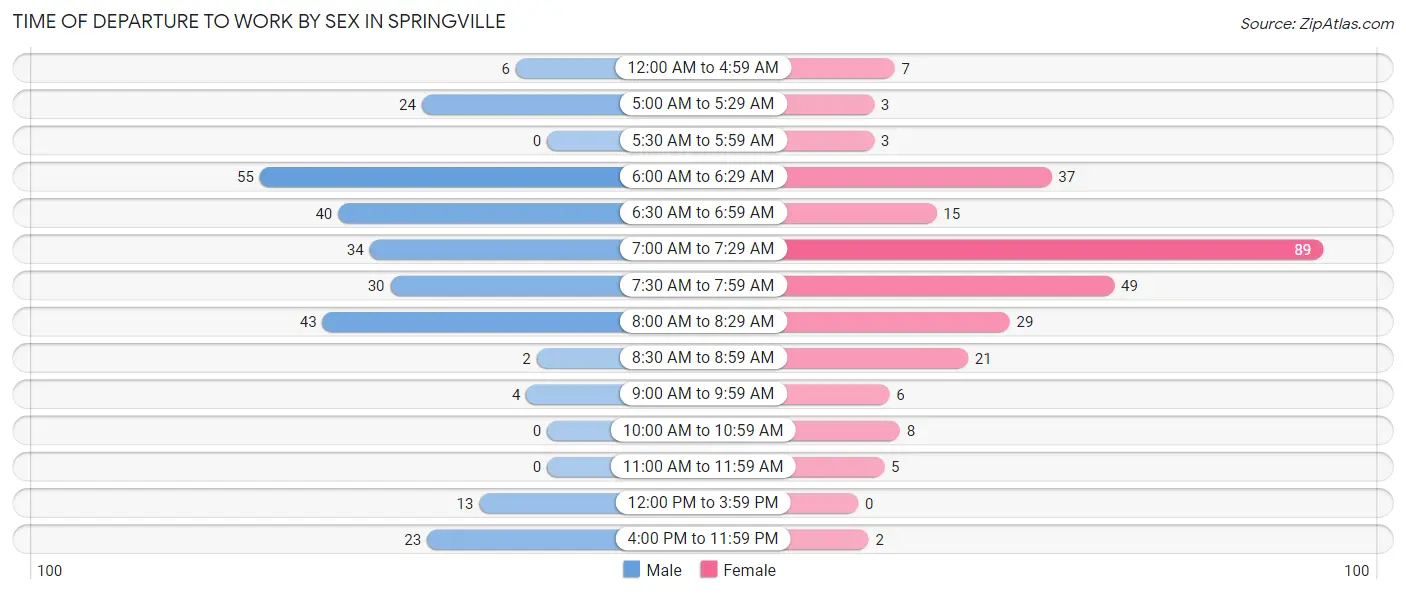
| Time of Departure | Male | Female |
| 12:00 AM to 4:59 AM | 6 (2.2%) | 7 (2.5%) |
| 5:00 AM to 5:29 AM | 24 (8.8%) | 3 (1.1%) |
| 5:30 AM to 5:59 AM | 0 (0.0%) | 3 (1.1%) |
| 6:00 AM to 6:29 AM | 55 (20.1%) | 37 (13.5%) |
| 6:30 AM to 6:59 AM | 40 (14.6%) | 15 (5.5%) |
| 7:00 AM to 7:29 AM | 34 (12.4%) | 89 (32.5%) |
| 7:30 AM to 7:59 AM | 30 (11.0%) | 49 (17.9%) |
| 8:00 AM to 8:29 AM | 43 (15.7%) | 29 (10.6%) |
| 8:30 AM to 8:59 AM | 2 (0.7%) | 21 (7.7%) |
| 9:00 AM to 9:59 AM | 4 (1.5%) | 6 (2.2%) |
| 10:00 AM to 10:59 AM | 0 (0.0%) | 8 (2.9%) |
| 11:00 AM to 11:59 AM | 0 (0.0%) | 5 (1.8%) |
| 12:00 PM to 3:59 PM | 13 (4.7%) | 0 (0.0%) |
| 4:00 PM to 11:59 PM | 23 (8.4%) | 2 (0.7%) |
| Total | 274 (100.0%) | 274 (100.0%) |
Housing Occupancy in Springville
Occupancy by Ownership in Springville
Of the total 440 dwellings in Springville, owner-occupied units account for 318 (72.3%), while renter-occupied units make up 122 (27.7%).
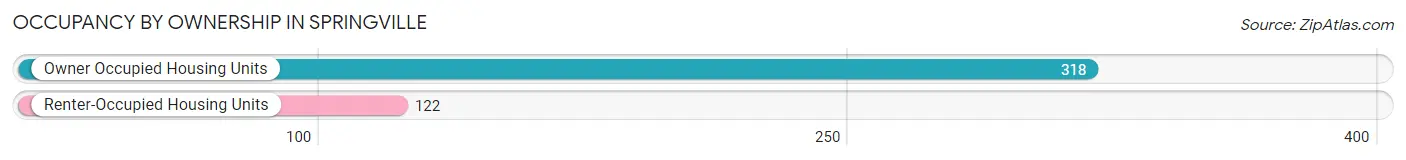
| Occupancy | # Housing Units | % Housing Units |
| Owner Occupied Housing Units | 318 | 72.3% |
| Renter-Occupied Housing Units | 122 | 27.7% |
| Total Occupied Housing Units | 440 | 100.0% |
Occupancy by Household Size in Springville
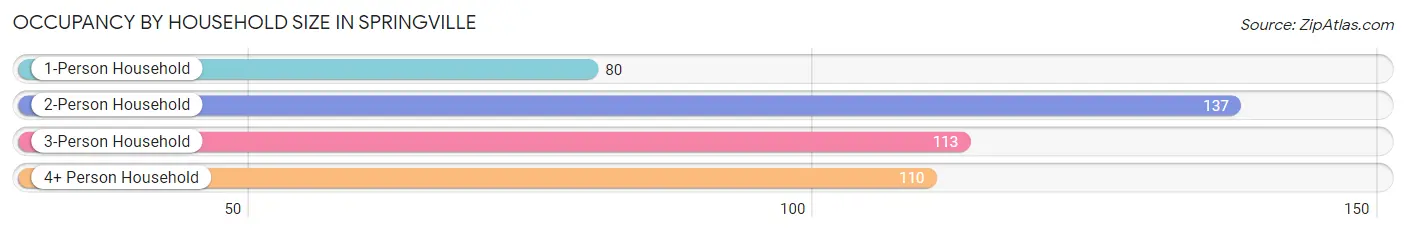
| Household Size | # Housing Units | % Housing Units |
| 1-Person Household | 80 | 18.2% |
| 2-Person Household | 137 | 31.1% |
| 3-Person Household | 113 | 25.7% |
| 4+ Person Household | 110 | 25.0% |
| Total Housing Units | 440 | 100.0% |
Occupancy by Ownership by Household Size in Springville
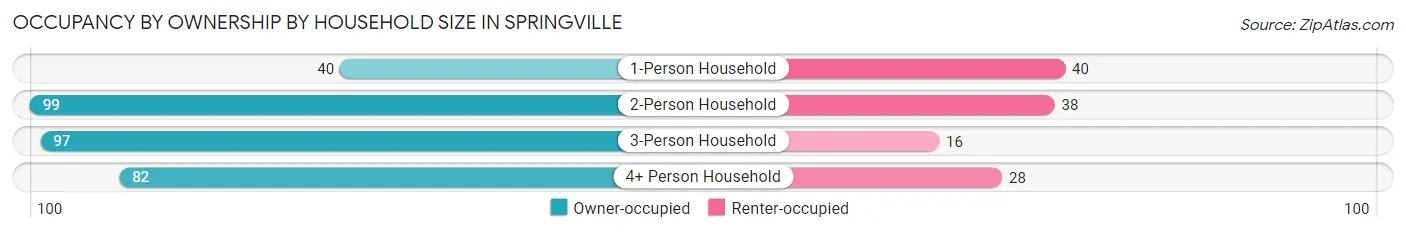
| Household Size | Owner-occupied | Renter-occupied |
| 1-Person Household | 40 (50.0%) | 40 (50.0%) |
| 2-Person Household | 99 (72.3%) | 38 (27.7%) |
| 3-Person Household | 97 (85.8%) | 16 (14.2%) |
| 4+ Person Household | 82 (74.6%) | 28 (25.5%) |
| Total Housing Units | 318 (72.3%) | 122 (27.7%) |
Occupancy by Educational Attainment in Springville
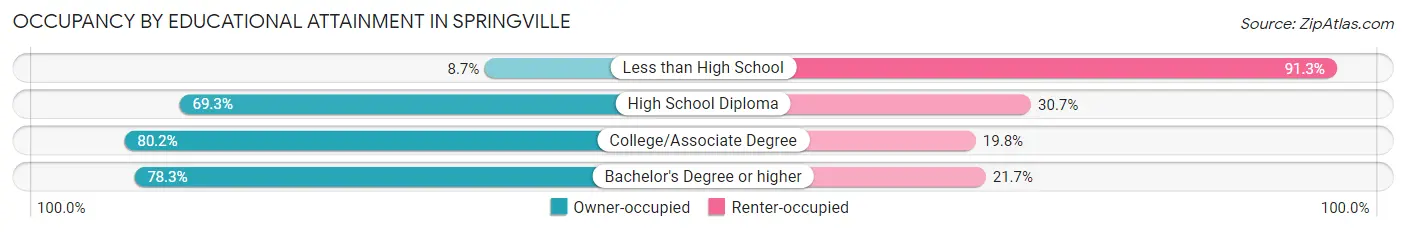
| Household Size | Owner-occupied | Renter-occupied |
| Less than High School | 2 (8.7%) | 21 (91.3%) |
| High School Diploma | 106 (69.3%) | 47 (30.7%) |
| College/Associate Degree | 138 (80.2%) | 34 (19.8%) |
| Bachelor's Degree or higher | 72 (78.3%) | 20 (21.7%) |
Occupancy by Age of Householder in Springville
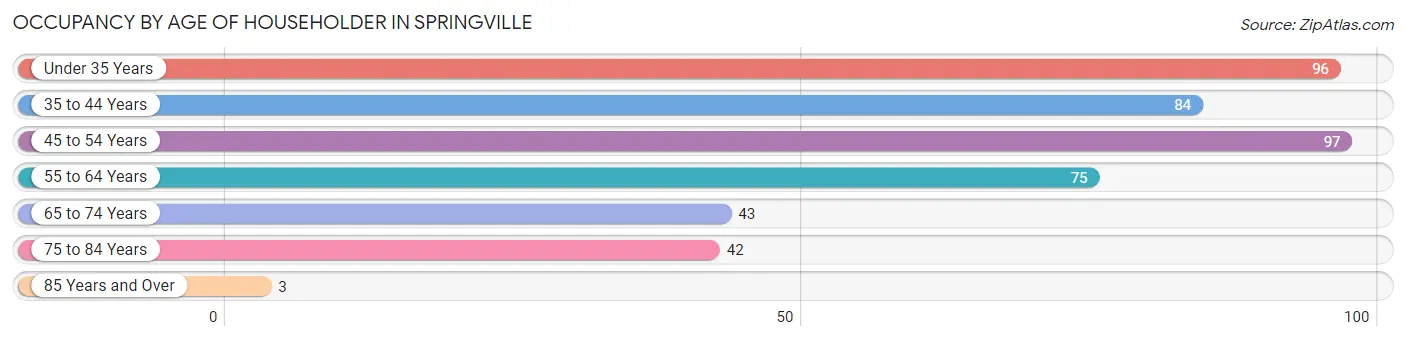
| Age Bracket | # Households | % Households |
| Under 35 Years | 96 | 21.8% |
| 35 to 44 Years | 84 | 19.1% |
| 45 to 54 Years | 97 | 22.1% |
| 55 to 64 Years | 75 | 17.1% |
| 65 to 74 Years | 43 | 9.8% |
| 75 to 84 Years | 42 | 9.6% |
| 85 Years and Over | 3 | 0.7% |
| Total | 440 | 100.0% |
Housing Finances in Springville
Median Income by Occupancy in Springville
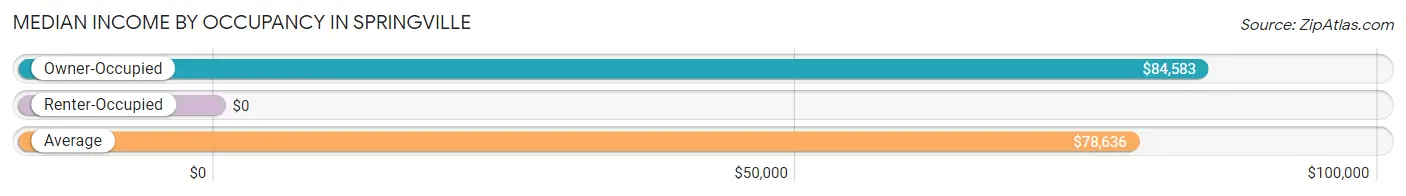
| Occupancy Type | # Households | Median Income |
| Owner-Occupied | 318 (72.3%) | $84,583 |
| Renter-Occupied | 122 (27.7%) | $0 |
| Average | 440 (100.0%) | $78,636 |
Occupancy by Householder Income Bracket in Springville
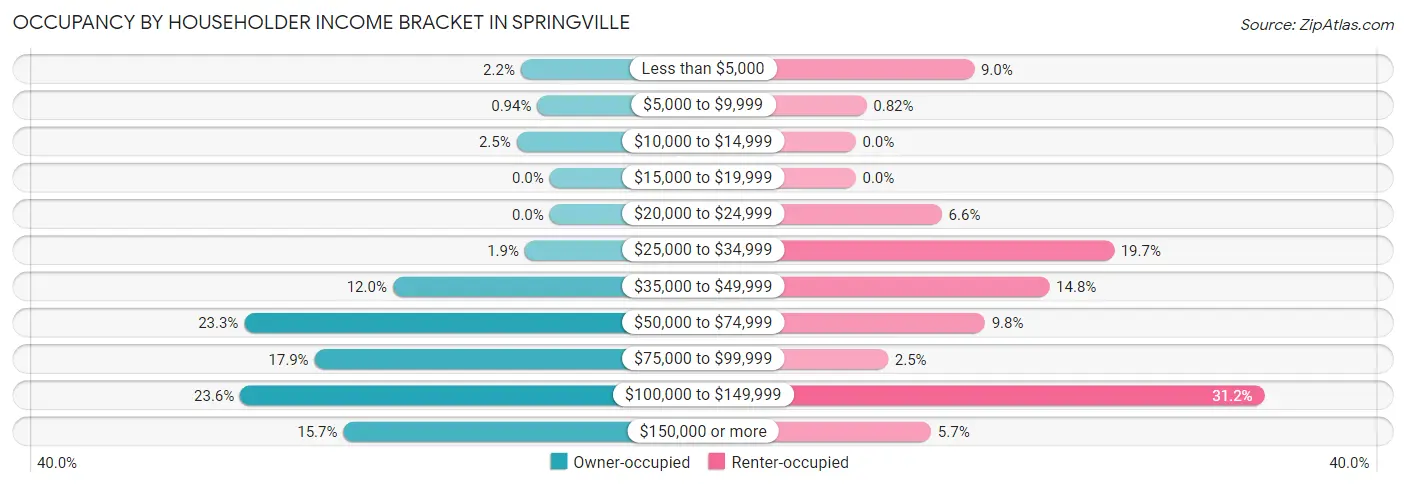
| Income Bracket | Owner-occupied | Renter-occupied |
| Less than $5,000 | 7 (2.2%) | 11 (9.0%) |
| $5,000 to $9,999 | 3 (0.9%) | 1 (0.8%) |
| $10,000 to $14,999 | 8 (2.5%) | 0 (0.0%) |
| $15,000 to $19,999 | 0 (0.0%) | 0 (0.0%) |
| $20,000 to $24,999 | 0 (0.0%) | 8 (6.6%) |
| $25,000 to $34,999 | 6 (1.9%) | 24 (19.7%) |
| $35,000 to $49,999 | 38 (11.9%) | 18 (14.7%) |
| $50,000 to $74,999 | 74 (23.3%) | 12 (9.8%) |
| $75,000 to $99,999 | 57 (17.9%) | 3 (2.5%) |
| $100,000 to $149,999 | 75 (23.6%) | 38 (31.1%) |
| $150,000 or more | 50 (15.7%) | 7 (5.7%) |
| Total | 318 (100.0%) | 122 (100.0%) |
Monthly Housing Cost Tiers in Springville
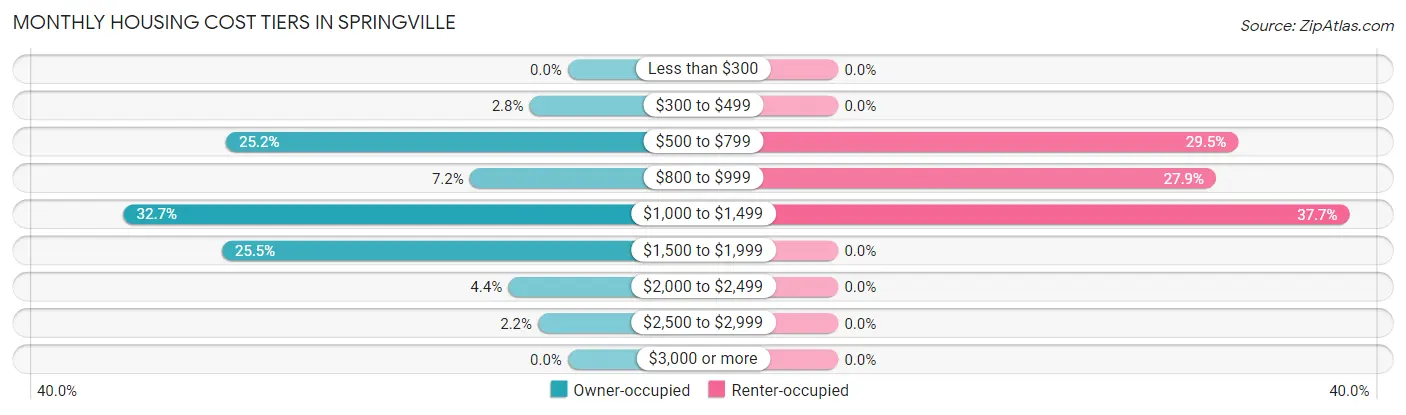
| Monthly Cost | Owner-occupied | Renter-occupied |
| Less than $300 | 0 (0.0%) | 0 (0.0%) |
| $300 to $499 | 9 (2.8%) | 0 (0.0%) |
| $500 to $799 | 80 (25.2%) | 36 (29.5%) |
| $800 to $999 | 23 (7.2%) | 34 (27.9%) |
| $1,000 to $1,499 | 104 (32.7%) | 46 (37.7%) |
| $1,500 to $1,999 | 81 (25.5%) | 0 (0.0%) |
| $2,000 to $2,499 | 14 (4.4%) | 0 (0.0%) |
| $2,500 to $2,999 | 7 (2.2%) | 0 (0.0%) |
| $3,000 or more | 0 (0.0%) | 0 (0.0%) |
| Total | 318 (100.0%) | 122 (100.0%) |
Physical Housing Characteristics in Springville
Housing Structures in Springville
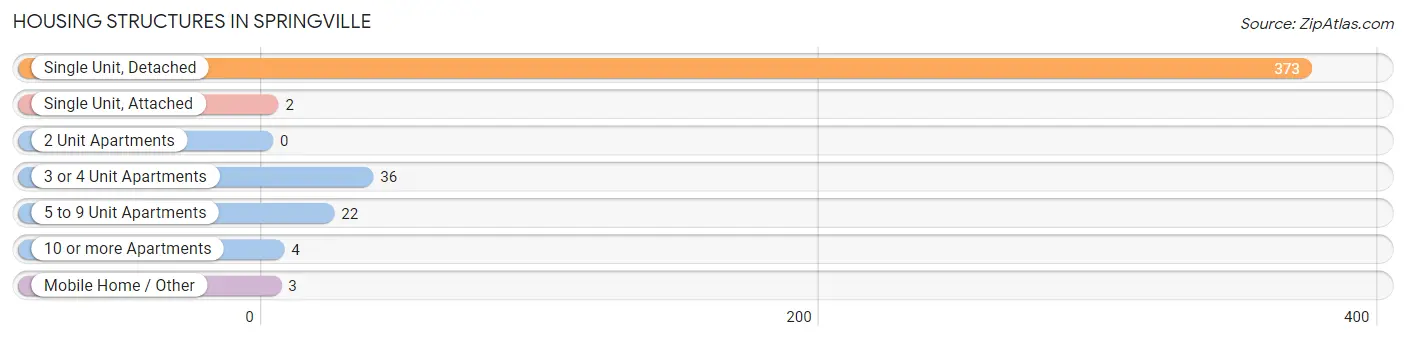
| Structure Type | # Housing Units | % Housing Units |
| Single Unit, Detached | 373 | 84.8% |
| Single Unit, Attached | 2 | 0.4% |
| 2 Unit Apartments | 0 | 0.0% |
| 3 or 4 Unit Apartments | 36 | 8.2% |
| 5 to 9 Unit Apartments | 22 | 5.0% |
| 10 or more Apartments | 4 | 0.9% |
| Mobile Home / Other | 3 | 0.7% |
| Total | 440 | 100.0% |
Housing Structures by Occupancy in Springville
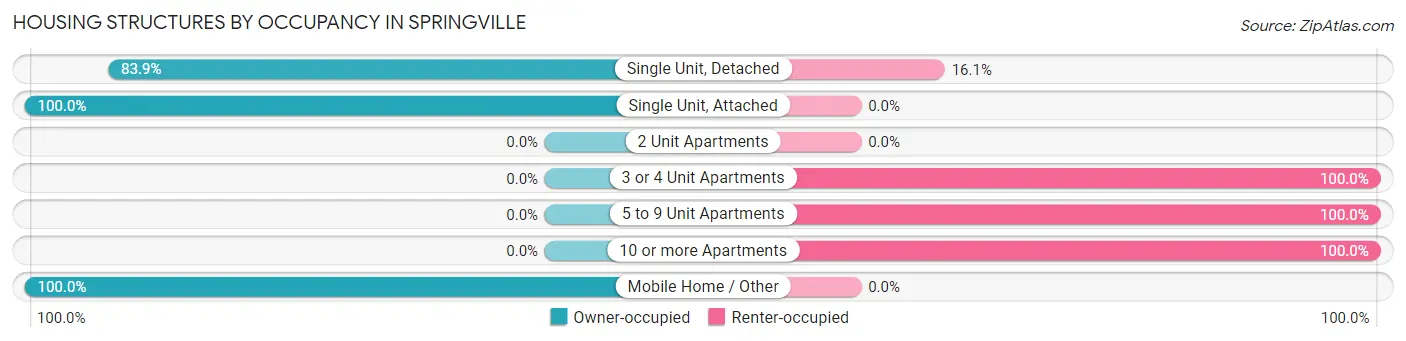
| Structure Type | Owner-occupied | Renter-occupied |
| Single Unit, Detached | 313 (83.9%) | 60 (16.1%) |
| Single Unit, Attached | 2 (100.0%) | 0 (0.0%) |
| 2 Unit Apartments | 0 (0.0%) | 0 (0.0%) |
| 3 or 4 Unit Apartments | 0 (0.0%) | 36 (100.0%) |
| 5 to 9 Unit Apartments | 0 (0.0%) | 22 (100.0%) |
| 10 or more Apartments | 0 (0.0%) | 4 (100.0%) |
| Mobile Home / Other | 3 (100.0%) | 0 (0.0%) |
| Total | 318 (72.3%) | 122 (27.7%) |
Housing Structures by Number of Rooms in Springville
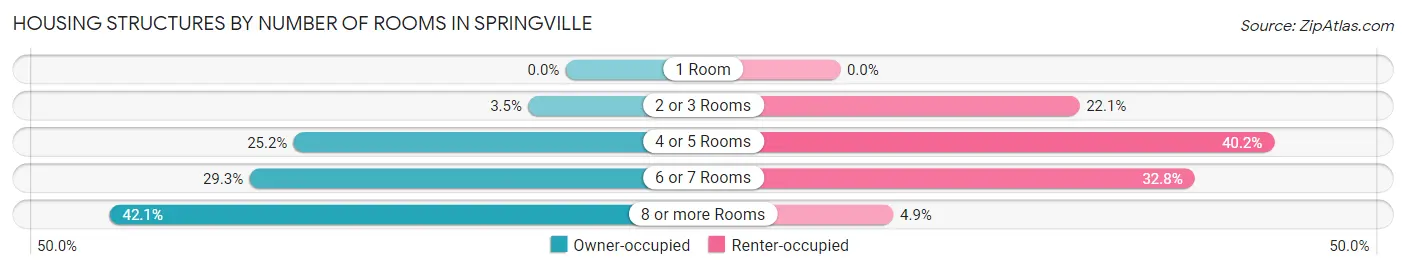
| Number of Rooms | Owner-occupied | Renter-occupied |
| 1 Room | 0 (0.0%) | 0 (0.0%) |
| 2 or 3 Rooms | 11 (3.5%) | 27 (22.1%) |
| 4 or 5 Rooms | 80 (25.2%) | 49 (40.2%) |
| 6 or 7 Rooms | 93 (29.2%) | 40 (32.8%) |
| 8 or more Rooms | 134 (42.1%) | 6 (4.9%) |
| Total | 318 (100.0%) | 122 (100.0%) |
Housing Structure by Heating Type in Springville
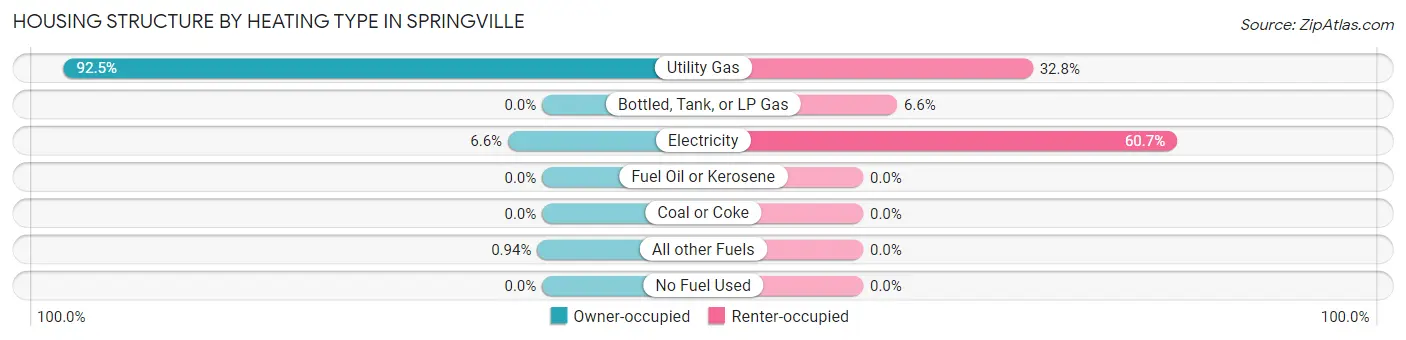
| Heating Type | Owner-occupied | Renter-occupied |
| Utility Gas | 294 (92.4%) | 40 (32.8%) |
| Bottled, Tank, or LP Gas | 0 (0.0%) | 8 (6.6%) |
| Electricity | 21 (6.6%) | 74 (60.7%) |
| Fuel Oil or Kerosene | 0 (0.0%) | 0 (0.0%) |
| Coal or Coke | 0 (0.0%) | 0 (0.0%) |
| All other Fuels | 3 (0.9%) | 0 (0.0%) |
| No Fuel Used | 0 (0.0%) | 0 (0.0%) |
| Total | 318 (100.0%) | 122 (100.0%) |
Household Vehicle Usage in Springville
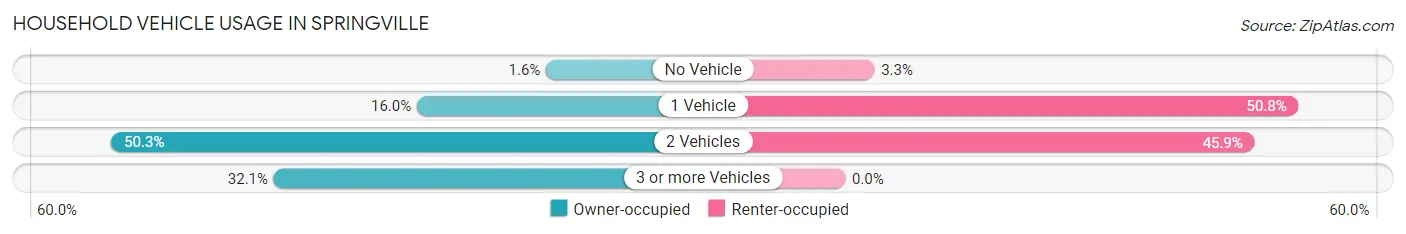
| Vehicles per Household | Owner-occupied | Renter-occupied |
| No Vehicle | 5 (1.6%) | 4 (3.3%) |
| 1 Vehicle | 51 (16.0%) | 62 (50.8%) |
| 2 Vehicles | 160 (50.3%) | 56 (45.9%) |
| 3 or more Vehicles | 102 (32.1%) | 0 (0.0%) |
| Total | 318 (100.0%) | 122 (100.0%) |
Real Estate & Mortgages in Springville
Real Estate and Mortgage Overview in Springville
| Characteristic | Without Mortgage | With Mortgage |
| Housing Units | 85 | 233 |
| Median Property Value | $160,900 | $161,400 |
| Median Household Income | $72,292 | $47 |
| Monthly Housing Costs | $591 | $0 |
| Real Estate Taxes | $2,653 | $0 |
Property Value by Mortgage Status in Springville
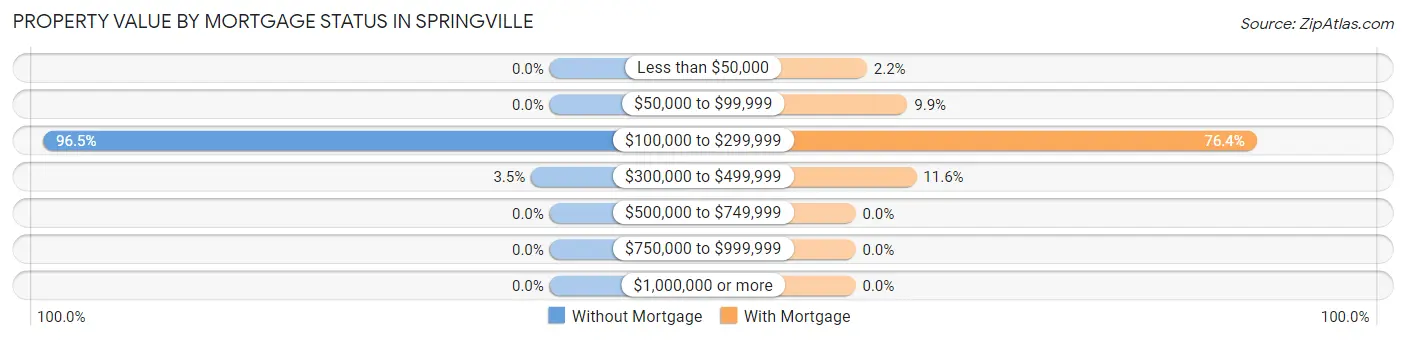
| Property Value | Without Mortgage | With Mortgage |
| Less than $50,000 | 0 (0.0%) | 5 (2.1%) |
| $50,000 to $99,999 | 0 (0.0%) | 23 (9.9%) |
| $100,000 to $299,999 | 82 (96.5%) | 178 (76.4%) |
| $300,000 to $499,999 | 3 (3.5%) | 27 (11.6%) |
| $500,000 to $749,999 | 0 (0.0%) | 0 (0.0%) |
| $750,000 to $999,999 | 0 (0.0%) | 0 (0.0%) |
| $1,000,000 or more | 0 (0.0%) | 0 (0.0%) |
| Total | 85 (100.0%) | 233 (100.0%) |
Household Income by Mortgage Status in Springville
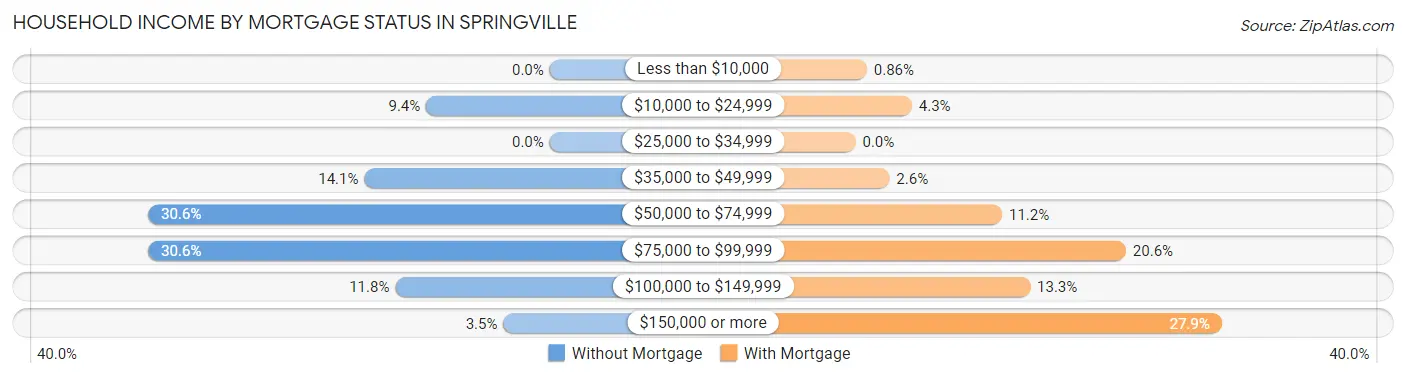
| Household Income | Without Mortgage | With Mortgage |
| Less than $10,000 | 0 (0.0%) | 2 (0.9%) |
| $10,000 to $24,999 | 8 (9.4%) | 10 (4.3%) |
| $25,000 to $34,999 | 0 (0.0%) | 0 (0.0%) |
| $35,000 to $49,999 | 12 (14.1%) | 6 (2.6%) |
| $50,000 to $74,999 | 26 (30.6%) | 26 (11.2%) |
| $75,000 to $99,999 | 26 (30.6%) | 48 (20.6%) |
| $100,000 to $149,999 | 10 (11.8%) | 31 (13.3%) |
| $150,000 or more | 3 (3.5%) | 65 (27.9%) |
| Total | 85 (100.0%) | 233 (100.0%) |
Property Value to Household Income Ratio in Springville
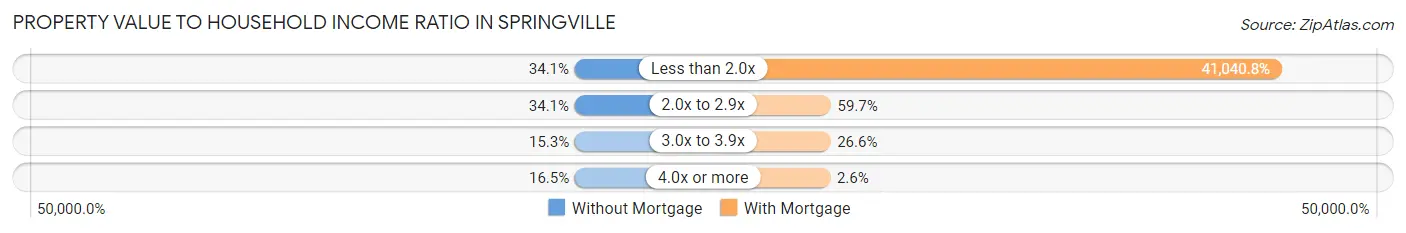
| Value-to-Income Ratio | Without Mortgage | With Mortgage |
| Less than 2.0x | 29 (34.1%) | 95,625 (41,040.8%) |
| 2.0x to 2.9x | 29 (34.1%) | 139 (59.7%) |
| 3.0x to 3.9x | 13 (15.3%) | 62 (26.6%) |
| 4.0x or more | 14 (16.5%) | 6 (2.6%) |
| Total | 85 (100.0%) | 233 (100.0%) |
Real Estate Taxes by Mortgage Status in Springville
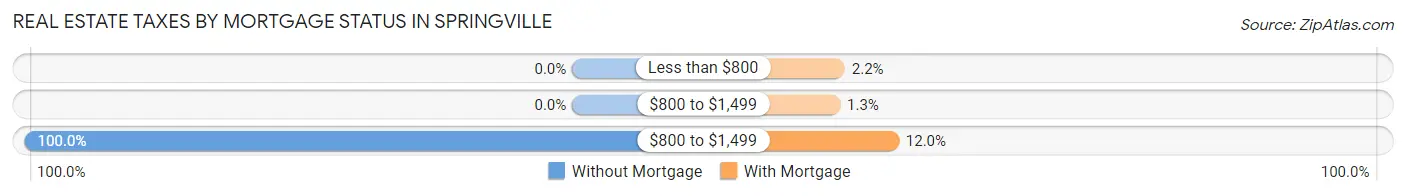
| Property Taxes | Without Mortgage | With Mortgage |
| Less than $800 | 0 (0.0%) | 5 (2.1%) |
| $800 to $1,499 | 0 (0.0%) | 3 (1.3%) |
| $800 to $1,499 | 85 (100.0%) | 28 (12.0%) |
| Total | 85 (100.0%) | 233 (100.0%) |
Health & Disability in Springville
Health Insurance Coverage by Age in Springville
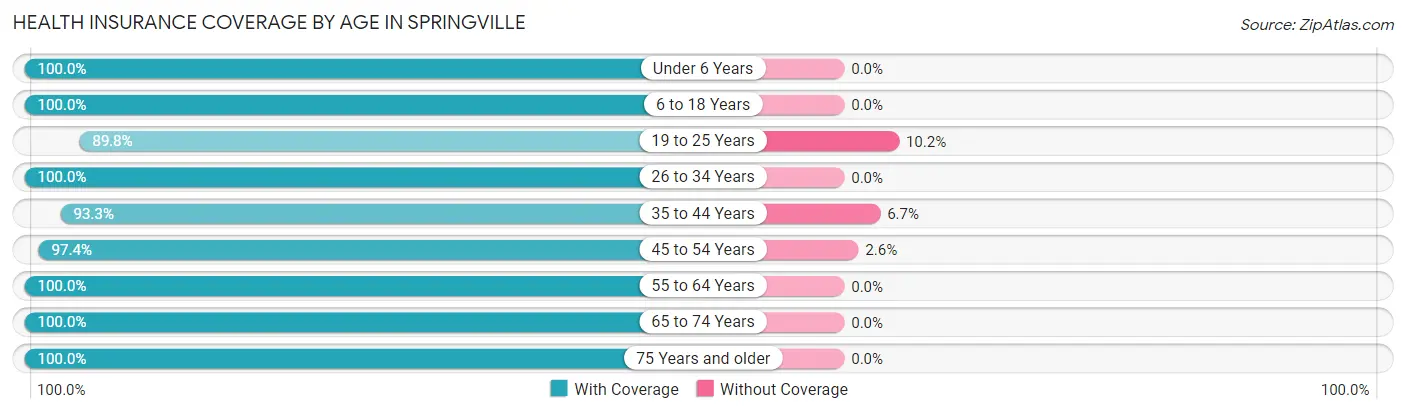
| Age Bracket | With Coverage | Without Coverage |
| Under 6 Years | 152 (100.0%) | 0 (0.0%) |
| 6 to 18 Years | 139 (100.0%) | 0 (0.0%) |
| 19 to 25 Years | 88 (89.8%) | 10 (10.2%) |
| 26 to 34 Years | 133 (100.0%) | 0 (0.0%) |
| 35 to 44 Years | 167 (93.3%) | 12 (6.7%) |
| 45 to 54 Years | 148 (97.4%) | 4 (2.6%) |
| 55 to 64 Years | 152 (100.0%) | 0 (0.0%) |
| 65 to 74 Years | 83 (100.0%) | 0 (0.0%) |
| 75 Years and older | 72 (100.0%) | 0 (0.0%) |
| Total | 1,134 (97.8%) | 26 (2.2%) |
Health Insurance Coverage by Citizenship Status in Springville
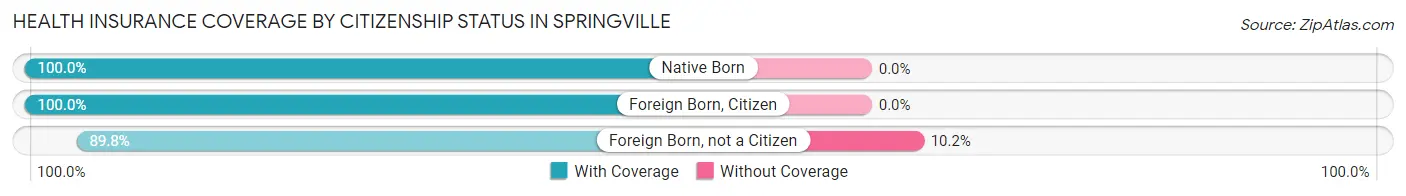
| Citizenship Status | With Coverage | Without Coverage |
| Native Born | 152 (100.0%) | 0 (0.0%) |
| Foreign Born, Citizen | 139 (100.0%) | 0 (0.0%) |
| Foreign Born, not a Citizen | 88 (89.8%) | 10 (10.2%) |
Health Insurance Coverage by Household Income in Springville
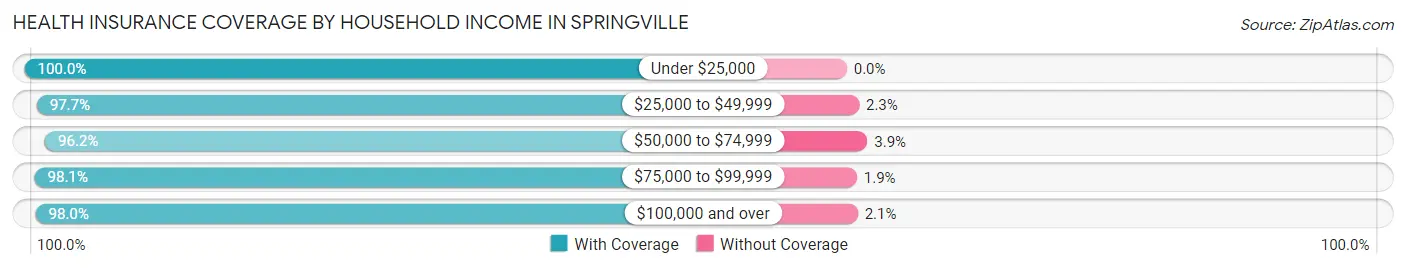
| Household Income | With Coverage | Without Coverage |
| Under $25,000 | 81 (100.0%) | 0 (0.0%) |
| $25,000 to $49,999 | 171 (97.7%) | 4 (2.3%) |
| $50,000 to $74,999 | 200 (96.2%) | 8 (3.8%) |
| $75,000 to $99,999 | 157 (98.1%) | 3 (1.9%) |
| $100,000 and over | 525 (98.0%) | 11 (2.1%) |
Public vs Private Health Insurance Coverage by Age in Springville
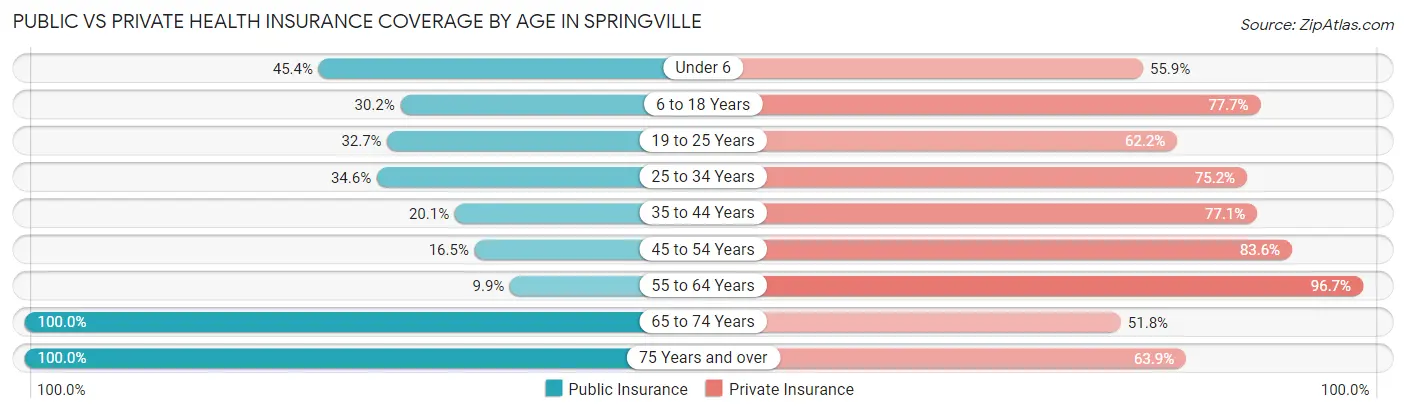
| Age Bracket | Public Insurance | Private Insurance |
| Under 6 | 69 (45.4%) | 85 (55.9%) |
| 6 to 18 Years | 42 (30.2%) | 108 (77.7%) |
| 19 to 25 Years | 32 (32.7%) | 61 (62.2%) |
| 25 to 34 Years | 46 (34.6%) | 100 (75.2%) |
| 35 to 44 Years | 36 (20.1%) | 138 (77.1%) |
| 45 to 54 Years | 25 (16.5%) | 127 (83.6%) |
| 55 to 64 Years | 15 (9.9%) | 147 (96.7%) |
| 65 to 74 Years | 83 (100.0%) | 43 (51.8%) |
| 75 Years and over | 72 (100.0%) | 46 (63.9%) |
| Total | 420 (36.2%) | 855 (73.7%) |
Disability Status by Sex by Age in Springville
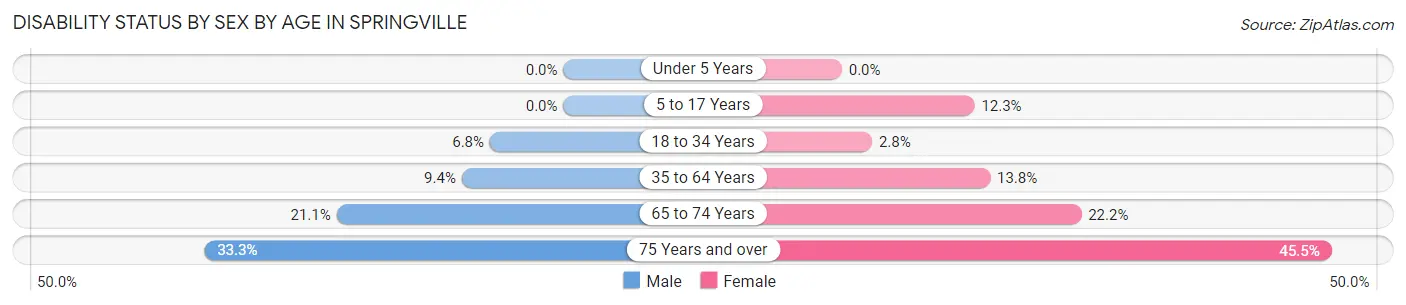
| Age Bracket | Male | Female |
| Under 5 Years | 0 (0.0%) | 0 (0.0%) |
| 5 to 17 Years | 0 (0.0%) | 8 (12.3%) |
| 18 to 34 Years | 6 (6.8%) | 4 (2.8%) |
| 35 to 64 Years | 25 (9.4%) | 30 (13.8%) |
| 65 to 74 Years | 8 (21.0%) | 10 (22.2%) |
| 75 Years and over | 13 (33.3%) | 15 (45.5%) |
Disability Class by Sex by Age in Springville
Disability Class: Hearing Difficulty
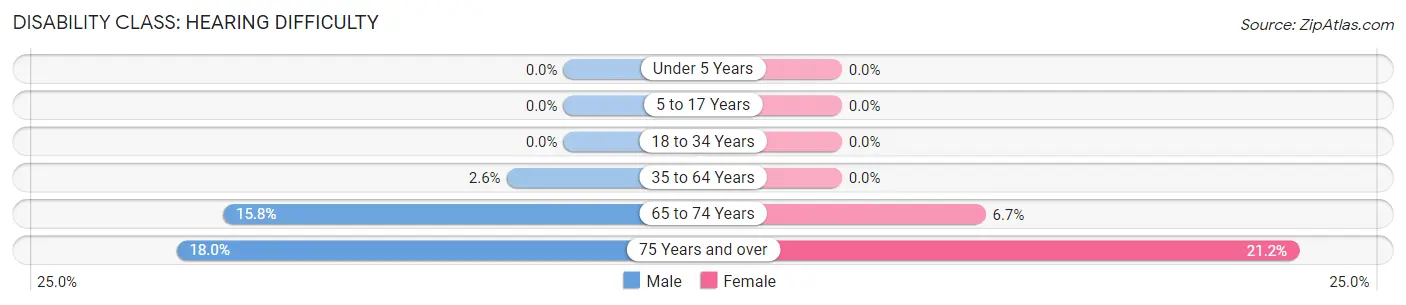
| Age Bracket | Male | Female |
| Under 5 Years | 0 (0.0%) | 0 (0.0%) |
| 5 to 17 Years | 0 (0.0%) | 0 (0.0%) |
| 18 to 34 Years | 0 (0.0%) | 0 (0.0%) |
| 35 to 64 Years | 7 (2.6%) | 0 (0.0%) |
| 65 to 74 Years | 6 (15.8%) | 3 (6.7%) |
| 75 Years and over | 7 (17.9%) | 7 (21.2%) |
Disability Class: Vision Difficulty
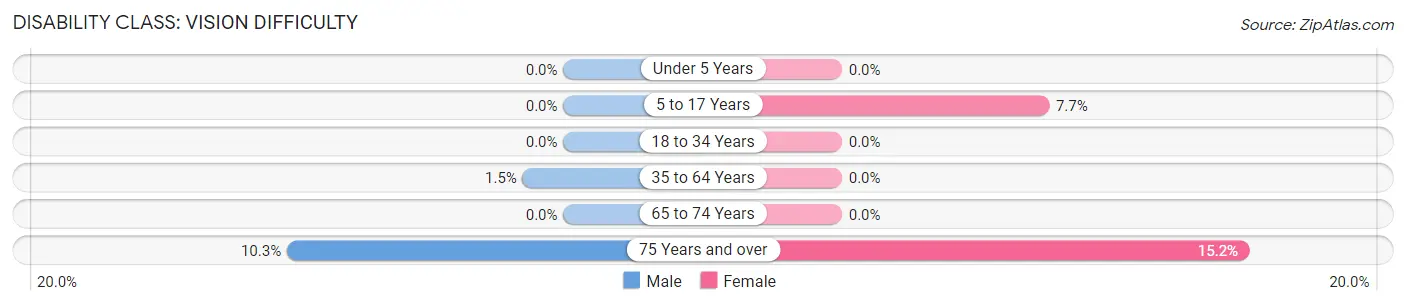
| Age Bracket | Male | Female |
| Under 5 Years | 0 (0.0%) | 0 (0.0%) |
| 5 to 17 Years | 0 (0.0%) | 5 (7.7%) |
| 18 to 34 Years | 0 (0.0%) | 0 (0.0%) |
| 35 to 64 Years | 4 (1.5%) | 0 (0.0%) |
| 65 to 74 Years | 0 (0.0%) | 0 (0.0%) |
| 75 Years and over | 4 (10.3%) | 5 (15.1%) |
Disability Class: Cognitive Difficulty
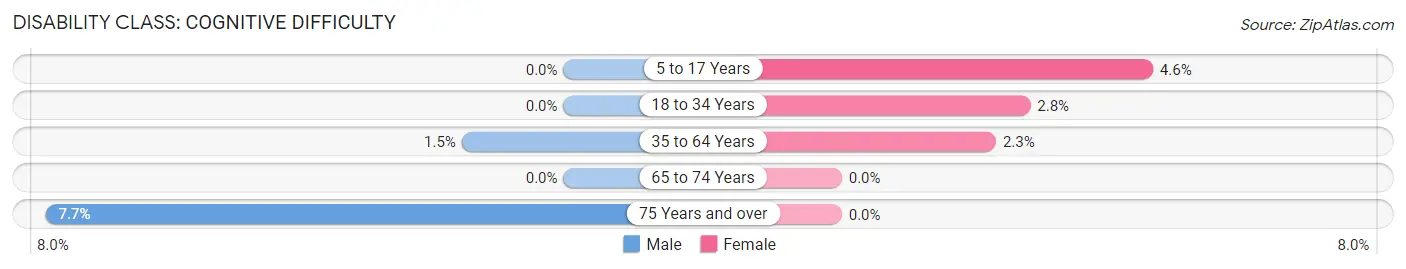
| Age Bracket | Male | Female |
| 5 to 17 Years | 0 (0.0%) | 3 (4.6%) |
| 18 to 34 Years | 0 (0.0%) | 4 (2.8%) |
| 35 to 64 Years | 4 (1.5%) | 5 (2.3%) |
| 65 to 74 Years | 0 (0.0%) | 0 (0.0%) |
| 75 Years and over | 3 (7.7%) | 0 (0.0%) |
Disability Class: Ambulatory Difficulty
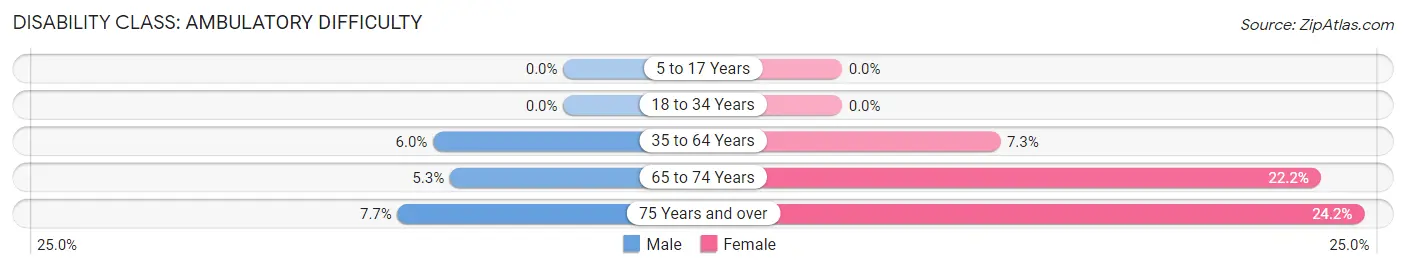
| Age Bracket | Male | Female |
| 5 to 17 Years | 0 (0.0%) | 0 (0.0%) |
| 18 to 34 Years | 0 (0.0%) | 0 (0.0%) |
| 35 to 64 Years | 16 (6.0%) | 16 (7.3%) |
| 65 to 74 Years | 2 (5.3%) | 10 (22.2%) |
| 75 Years and over | 3 (7.7%) | 8 (24.2%) |
Disability Class: Self-Care Difficulty
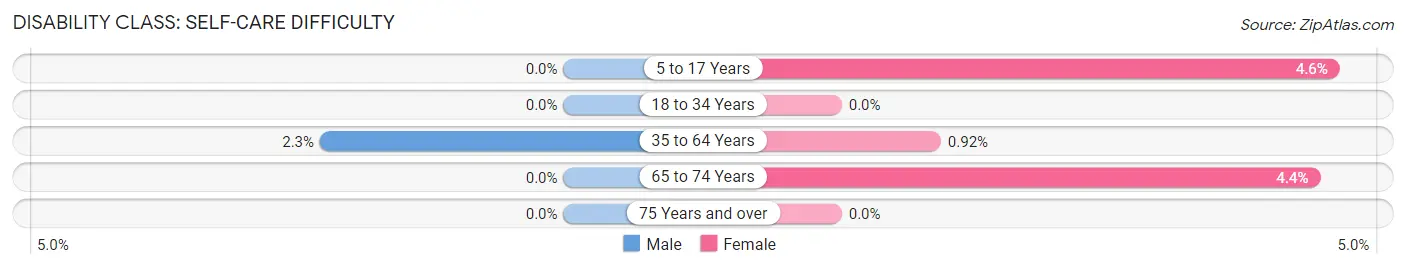
| Age Bracket | Male | Female |
| 5 to 17 Years | 0 (0.0%) | 3 (4.6%) |
| 18 to 34 Years | 0 (0.0%) | 0 (0.0%) |
| 35 to 64 Years | 6 (2.3%) | 2 (0.9%) |
| 65 to 74 Years | 0 (0.0%) | 2 (4.4%) |
| 75 Years and over | 0 (0.0%) | 0 (0.0%) |
Technology Access in Springville
Computing Device Access in Springville
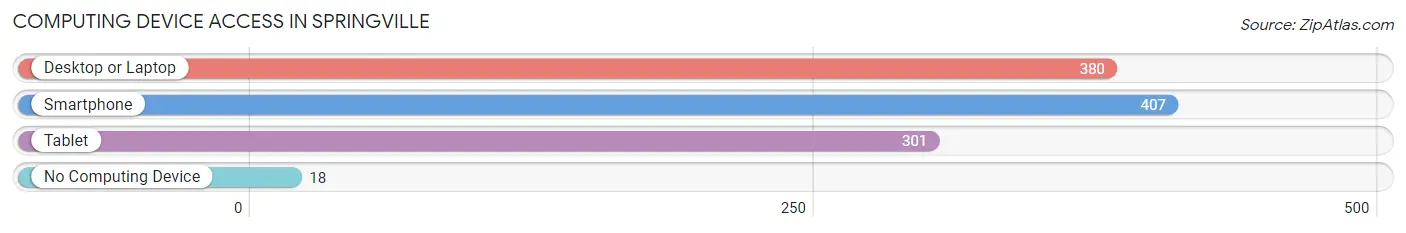
| Device Type | # Households | % Households |
| Desktop or Laptop | 380 | 86.4% |
| Smartphone | 407 | 92.5% |
| Tablet | 301 | 68.4% |
| No Computing Device | 18 | 4.1% |
| Total | 440 | 100.0% |
Internet Access in Springville
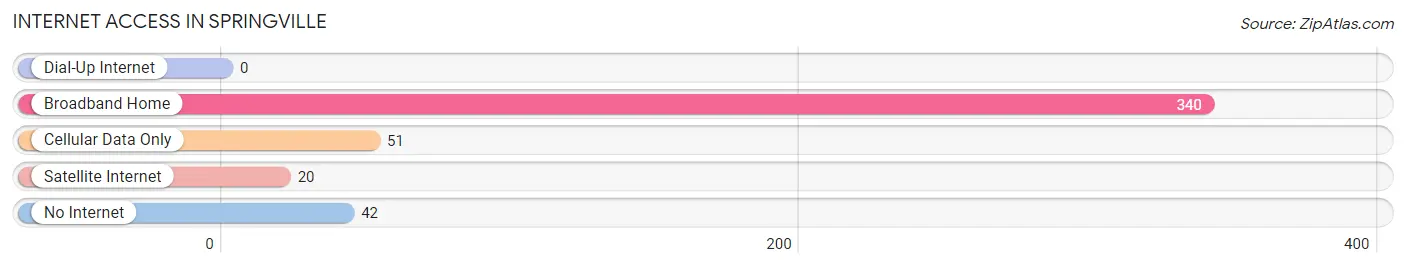
| Internet Type | # Households | % Households |
| Dial-Up Internet | 0 | 0.0% |
| Broadband Home | 340 | 77.3% |
| Cellular Data Only | 51 | 11.6% |
| Satellite Internet | 20 | 4.5% |
| No Internet | 42 | 9.6% |
| Total | 440 | 100.0% |
Springville Summary
History
The city of Springville, Iowa is located in Linn County, Iowa, and is part of the Cedar Rapids Metropolitan Statistical Area. The city was founded in 1854 by a group of settlers from Ohio, led by William and Mary Spring. The city was originally named Springville Station, and was later shortened to Springville. The city was officially incorporated in 1872.
The city of Springville has a rich history of industry and agriculture. In the late 1800s, the city was home to a number of factories, including a flour mill, a sawmill, a brickyard, and a furniture factory. The city also had a number of stores, including a general store, a drug store, and a hardware store.
In the early 1900s, the city was home to a number of dairy farms, as well as a number of other agricultural businesses. The city was also home to a number of churches, including the First Baptist Church, the Methodist Episcopal Church, and the United Brethren Church.
In the mid-1900s, the city experienced a period of growth and development. The city was home to a number of new businesses, including a grocery store, a bank, and a movie theater. The city also had a number of new schools, including an elementary school, a high school, and a junior college.
Geography
Springville is located in Linn County, Iowa, and is part of the Cedar Rapids Metropolitan Statistical Area. The city is situated on the banks of the Cedar River, and is surrounded by rolling hills and farmland. The city has a total area of 4.2 square miles, all of which is land.
The city of Springville has a humid continental climate, with hot summers and cold winters. The average temperature in the summer is around 75 degrees Fahrenheit, and the average temperature in the winter is around 25 degrees Fahrenheit. The city receives an average of 36 inches of precipitation per year.
Economy
The economy of Springville is largely based on agriculture and manufacturing. The city is home to a number of agricultural businesses, including dairy farms, grain elevators, and feed mills. The city is also home to a number of manufacturing businesses, including a furniture factory, a brickyard, and a sawmill.
The city is also home to a number of retail businesses, including a grocery store, a bank, and a movie theater. The city is also home to a number of service businesses, including a number of restaurants, a hotel, and a number of auto repair shops.
Demographics
As of the 2010 census, the city of Springville had a population of 1,845. The racial makeup of the city was 97.3% White, 0.7% African American, 0.2% Native American, 0.2% Asian, 0.2% from other races, and 1.6% from two or more races. Hispanic or Latino of any race were 1.2% of the population.
The median income for a household in the city was $45,938, and the median income for a family was $51,250. The per capita income for the city was $20,945. About 8.2% of families and 10.2% of the population were below the poverty line, including 14.2% of those under age 18 and 8.3% of those age 65 or over.
Common Questions
What is Per Capita Income in Springville?
Per Capita income in Springville is $34,025.
What is the Median Family Income in Springville?
Median Family Income in Springville is $87,083.
What is the Median Household income in Springville?
Median Household Income in Springville is $78,636.
What is Income or Wage Gap in Springville?
Income or Wage Gap in Springville is 45.6%.
Women in Springville earn 54.4 cents for every dollar earned by a man.
What is Inequality or Gini Index in Springville?
Inequality or Gini Index in Springville is 0.36.
What is the Total Population of Springville?
Total Population of Springville is 1,160.
What is the Total Male Population of Springville?
Total Male Population of Springville is 598.
What is the Total Female Population of Springville?
Total Female Population of Springville is 562.
What is the Ratio of Males per 100 Females in Springville?
There are 106.41 Males per 100 Females in Springville.
What is the Ratio of Females per 100 Males in Springville?
There are 93.98 Females per 100 Males in Springville.
What is the Median Population Age in Springville?
Median Population Age in Springville is 39.7 Years.
What is the Average Family Size in Springville
Average Family Size in Springville is 2.9 People.
What is the Average Household Size in Springville
Average Household Size in Springville is 2.6 People.
How Large is the Labor Force in Springville?
There are 638 People in the Labor Forcein in Springville.
What is the Percentage of People in the Labor Force in Springville?
71.2% of People are in the Labor Force in Springville.
What is the Unemployment Rate in Springville?
Unemployment Rate in Springville is 1.4%.