Sharpsburg, IA Map & Demographics
Sharpsburg Map
Sharpsburg Overview
$23,388
PER CAPITA INCOME
$47,143
AVG FAMILY INCOME
$47,321
AVG HOUSEHOLD INCOME
0.27
INEQUALITY / GINI INDEX
72
TOTAL POPULATION
36
MALE POPULATION
36
FEMALE POPULATION
100.00
MALES / 100 FEMALES
100.00
FEMALES / 100 MALES
53.5
MEDIAN AGE
2.9
AVG FAMILY SIZE
2.5
AVG HOUSEHOLD SIZE
34
LABOR FORCE [ PEOPLE ]
55.7%
PERCENT IN LABOR FORCE
2.9%
UNEMPLOYMENT RATE
Sharpsburg Zip Codes
Sharpsburg Area Codes
Income in Sharpsburg
Income Overview in Sharpsburg
Per Capita Income in Sharpsburg is $23,388, while median incomes of families and households are $47,143 and $47,321 respectively.
| Characteristic | Number | Measure |
| Per Capita Income | 72 | $23,388 |
| Median Family Income | 22 | $47,143 |
| Mean Family Income | 22 | $56,745 |
| Median Household Income | 29 | $47,321 |
| Mean Household Income | 29 | $56,621 |
| Income Deficit | 22 | $0 |
| Wage / Income Gap (%) | 72 | 0.00% |
| Wage / Income Gap ($) | 72 | 100.00¢ per $1 |
| Gini / Inequality Index | 72 | 0.27 |
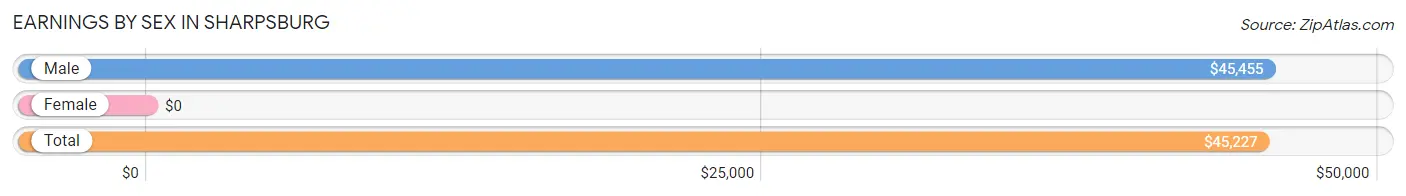
Earnings by Sex in Sharpsburg
| Sex | Number | Average Earnings |
| Male | 24 (66.7%) | $45,455 |
| Female | 12 (33.3%) | $0 |
| Total | 36 (100.0%) | $45,227 |
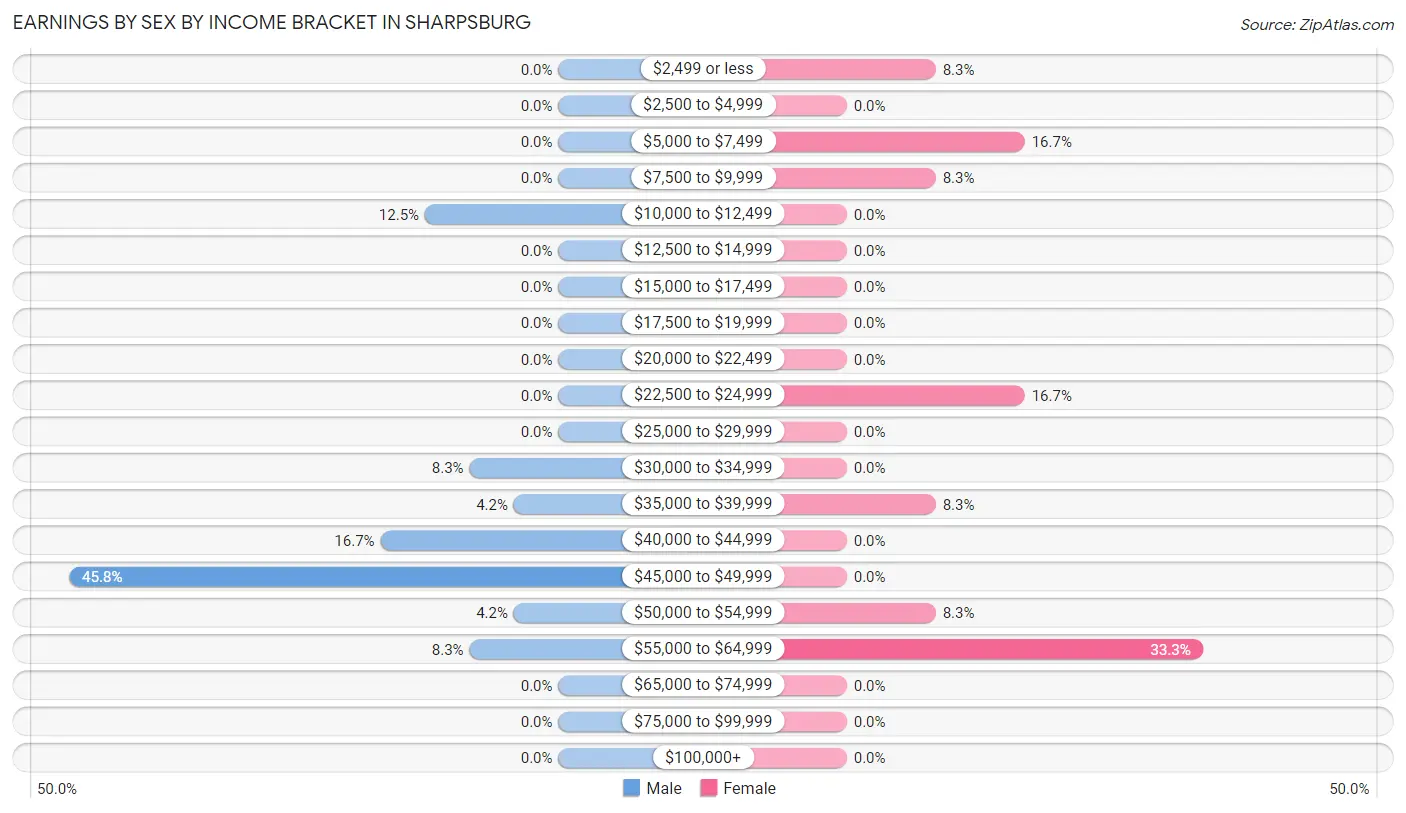
Earnings by Sex by Income Bracket in Sharpsburg
The most common earnings brackets in Sharpsburg are $45,000 to $49,999 for men (11 | 45.8%) and $55,000 to $64,999 for women (4 | 33.3%).
| Income | Male | Female |
| $2,499 or less | 0 (0.0%) | 1 (8.3%) |
| $2,500 to $4,999 | 0 (0.0%) | 0 (0.0%) |
| $5,000 to $7,499 | 0 (0.0%) | 2 (16.7%) |
| $7,500 to $9,999 | 0 (0.0%) | 1 (8.3%) |
| $10,000 to $12,499 | 3 (12.5%) | 0 (0.0%) |
| $12,500 to $14,999 | 0 (0.0%) | 0 (0.0%) |
| $15,000 to $17,499 | 0 (0.0%) | 0 (0.0%) |
| $17,500 to $19,999 | 0 (0.0%) | 0 (0.0%) |
| $20,000 to $22,499 | 0 (0.0%) | 0 (0.0%) |
| $22,500 to $24,999 | 0 (0.0%) | 2 (16.7%) |
| $25,000 to $29,999 | 0 (0.0%) | 0 (0.0%) |
| $30,000 to $34,999 | 2 (8.3%) | 0 (0.0%) |
| $35,000 to $39,999 | 1 (4.2%) | 1 (8.3%) |
| $40,000 to $44,999 | 4 (16.7%) | 0 (0.0%) |
| $45,000 to $49,999 | 11 (45.8%) | 0 (0.0%) |
| $50,000 to $54,999 | 1 (4.2%) | 1 (8.3%) |
| $55,000 to $64,999 | 2 (8.3%) | 4 (33.3%) |
| $65,000 to $74,999 | 0 (0.0%) | 0 (0.0%) |
| $75,000 to $99,999 | 0 (0.0%) | 0 (0.0%) |
| $100,000+ | 0 (0.0%) | 0 (0.0%) |
| Total | 24 (100.0%) | 12 (100.0%) |
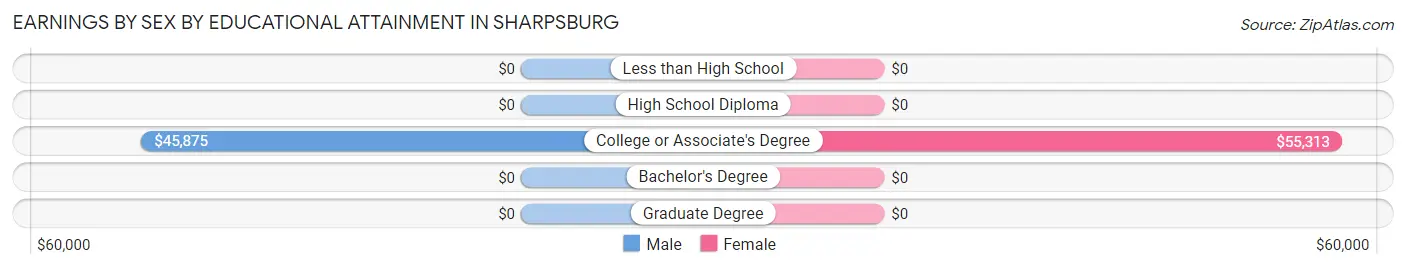
Earnings by Sex by Educational Attainment in Sharpsburg
| Educational Attainment | Male Income | Female Income |
| Less than High School | - | - |
| High School Diploma | - | - |
| College or Associate's Degree | $45,875 | $55,313 |
| Bachelor's Degree | - | - |
| Graduate Degree | - | - |
| Total | $45,455 | $0 |
Family Income in Sharpsburg
Family Income Brackets in Sharpsburg
According to the Sharpsburg family income data, there are 8 families falling into the $35,000 to $49,999 income range, which is the most common income bracket and makes up 36.4% of all families.
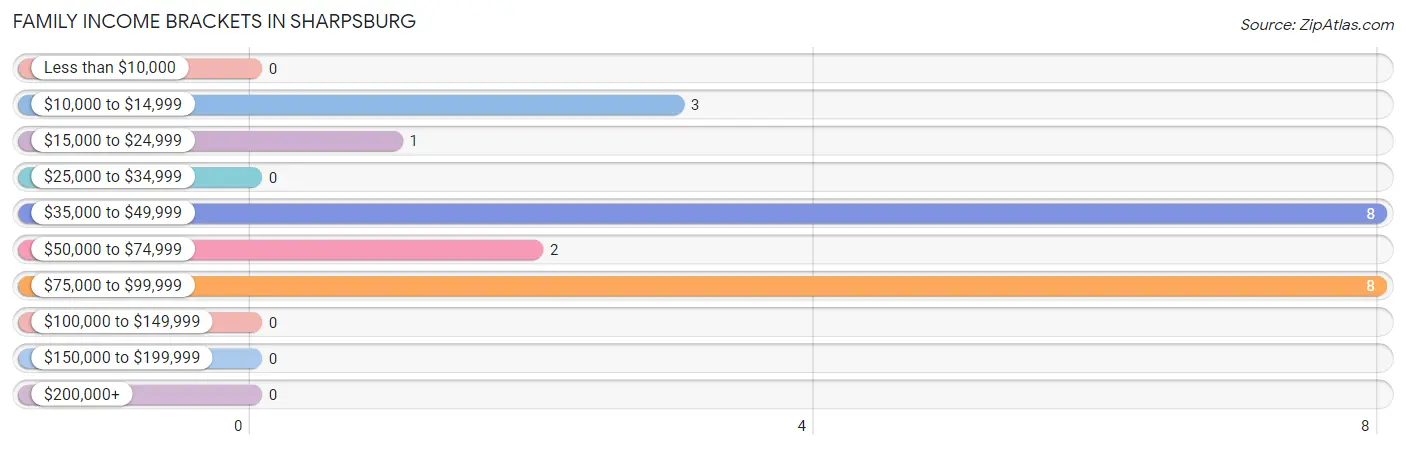
| Income Bracket | # Families | % Families |
| Less than $10,000 | 0 | 0.0% |
| $10,000 to $14,999 | 3 | 13.6% |
| $15,000 to $24,999 | 1 | 4.5% |
| $25,000 to $34,999 | 0 | 0.0% |
| $35,000 to $49,999 | 8 | 36.4% |
| $50,000 to $74,999 | 2 | 9.1% |
| $75,000 to $99,999 | 8 | 36.4% |
| $100,000 to $149,999 | 0 | 0.0% |
| $150,000 to $199,999 | 0 | 0.0% |
| $200,000+ | 0 | 0.0% |
Family Income by Famaliy Size in Sharpsburg
2-person families (12 | 54.5%) account for the highest median family income in Sharpsburg with $46,786 per family, while 2-person families (12 | 54.5%) have the highest median income of $23,393 per family member.
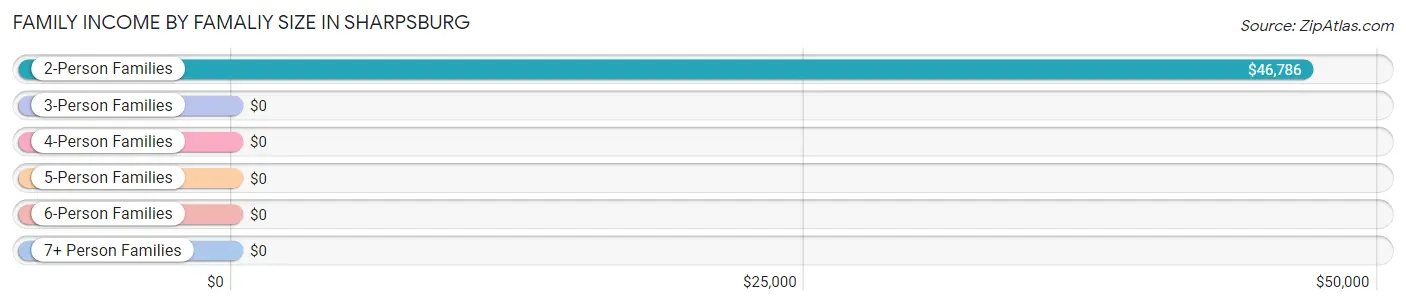
| Income Bracket | # Families | Median Income |
| 2-Person Families | 12 (54.5%) | $46,786 |
| 3-Person Families | 5 (22.7%) | $0 |
| 4-Person Families | 5 (22.7%) | $0 |
| 5-Person Families | 0 (0.0%) | $0 |
| 6-Person Families | 0 (0.0%) | $0 |
| 7+ Person Families | 0 (0.0%) | $0 |
| Total | 22 (100.0%) | $47,143 |
Family Income by Number of Earners in Sharpsburg
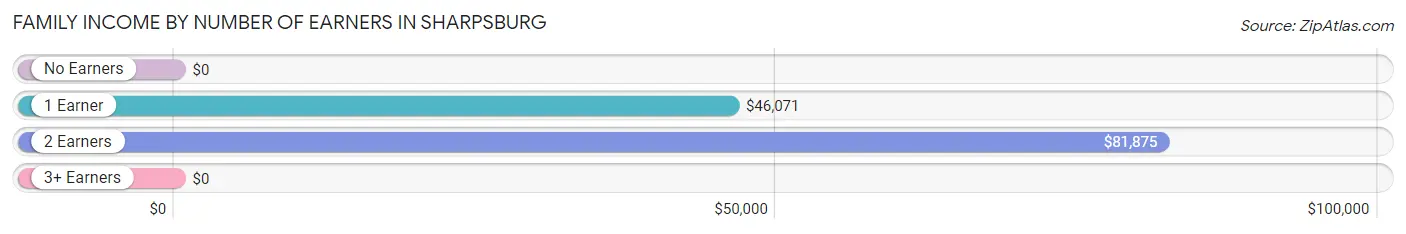
| Number of Earners | # Families | Median Income |
| No Earners | 1 (4.5%) | $0 |
| 1 Earner | 12 (54.5%) | $46,071 |
| 2 Earners | 9 (40.9%) | $81,875 |
| 3+ Earners | 0 (0.0%) | $0 |
| Total | 22 (100.0%) | $47,143 |
Household Income in Sharpsburg
Household Income Brackets in Sharpsburg
With 8 households falling in the category, the $35,000 to $49,999 income range is the most frequent in Sharpsburg, accounting for 27.6% of all households.
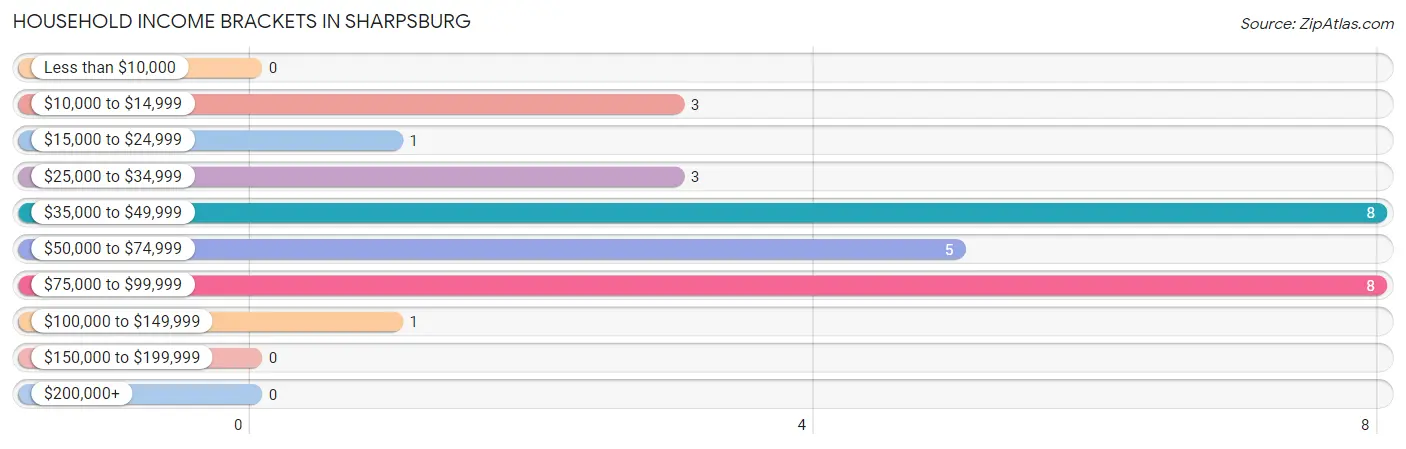
| Income Bracket | # Households | % Households |
| Less than $10,000 | 0 | 0.0% |
| $10,000 to $14,999 | 3 | 10.3% |
| $15,000 to $24,999 | 1 | 3.4% |
| $25,000 to $34,999 | 3 | 10.3% |
| $35,000 to $49,999 | 8 | 27.6% |
| $50,000 to $74,999 | 5 | 17.2% |
| $75,000 to $99,999 | 8 | 27.6% |
| $100,000 to $149,999 | 1 | 3.4% |
| $150,000 to $199,999 | 0 | 0.0% |
| $200,000+ | 0 | 0.0% |
Household Income by Householder Age in Sharpsburg
The median household income in Sharpsburg is $47,321, with the highest median household income of $87,500 found in the 25 to 44 years age bracket for the primary householder. A total of 8 households (27.6%) fall into this category.
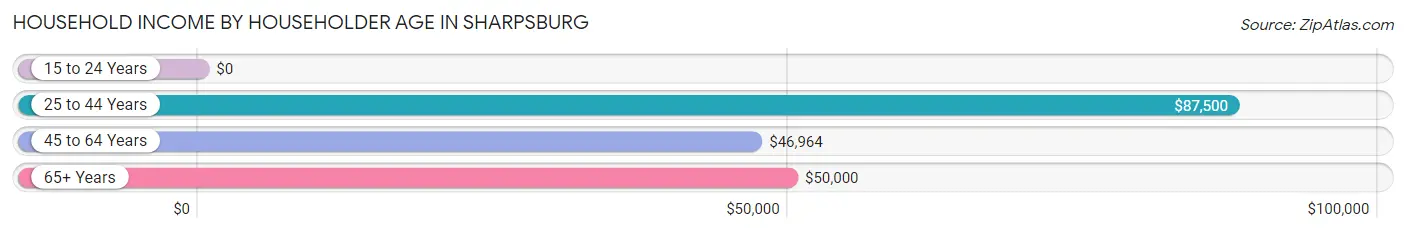
| Income Bracket | # Households | Median Income |
| 15 to 24 Years | 0 (0.0%) | $0 |
| 25 to 44 Years | 8 (27.6%) | $87,500 |
| 45 to 64 Years | 13 (44.8%) | $46,964 |
| 65+ Years | 8 (27.6%) | $50,000 |
| Total | 29 (100.0%) | $47,321 |
Poverty in Sharpsburg
Income Below Poverty by Sex and Age in Sharpsburg
With 19.4% poverty level for males and 2.8% for females among the residents of Sharpsburg, 6 to 11 year old males and 75 year old and over females are the most vulnerable to poverty, with 1 males (100.0%) and 1 females (20.0%) in their respective age groups living below the poverty level.
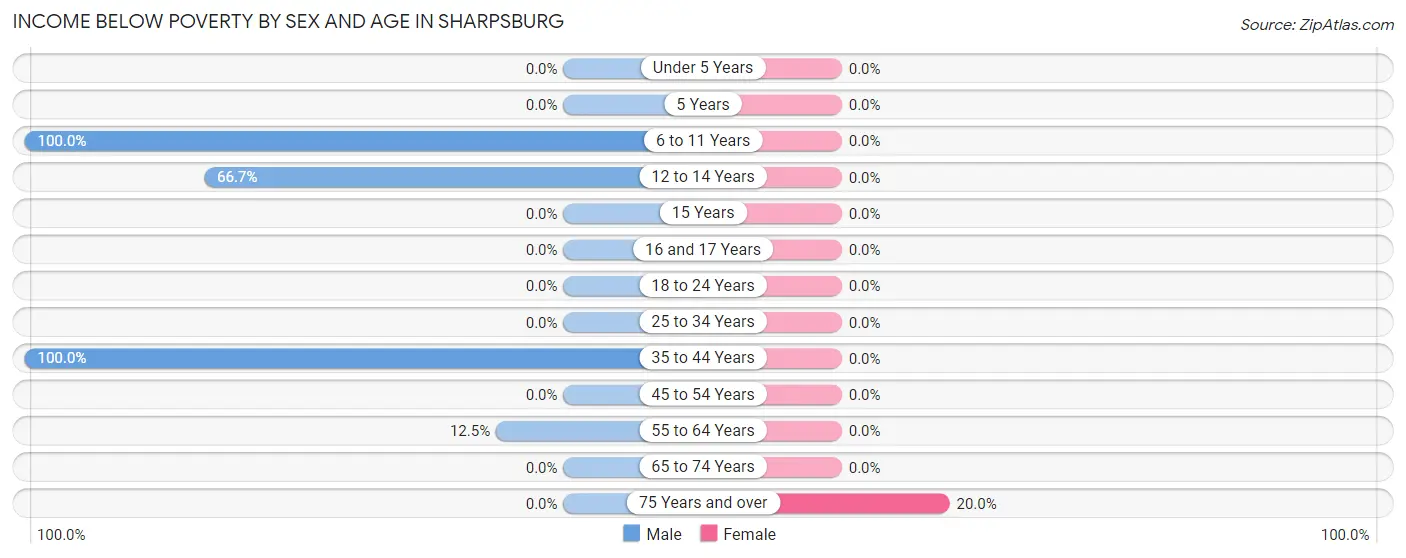
| Age Bracket | Male | Female |
| Under 5 Years | 0 (0.0%) | 0 (0.0%) |
| 5 Years | 0 (0.0%) | 0 (0.0%) |
| 6 to 11 Years | 1 (100.0%) | 0 (0.0%) |
| 12 to 14 Years | 2 (66.7%) | 0 (0.0%) |
| 15 Years | 0 (0.0%) | 0 (0.0%) |
| 16 and 17 Years | 0 (0.0%) | 0 (0.0%) |
| 18 to 24 Years | 0 (0.0%) | 0 (0.0%) |
| 25 to 34 Years | 0 (0.0%) | 0 (0.0%) |
| 35 to 44 Years | 3 (100.0%) | 0 (0.0%) |
| 45 to 54 Years | 0 (0.0%) | 0 (0.0%) |
| 55 to 64 Years | 1 (12.5%) | 0 (0.0%) |
| 65 to 74 Years | 0 (0.0%) | 0 (0.0%) |
| 75 Years and over | 0 (0.0%) | 1 (20.0%) |
| Total | 7 (19.4%) | 1 (2.8%) |
Income Above Poverty by Sex and Age in Sharpsburg
According to the poverty statistics in Sharpsburg, males aged under 5 years and females aged 12 to 14 years are the age groups that are most secure financially, with 100.0% of males and 100.0% of females in these age groups living above the poverty line.
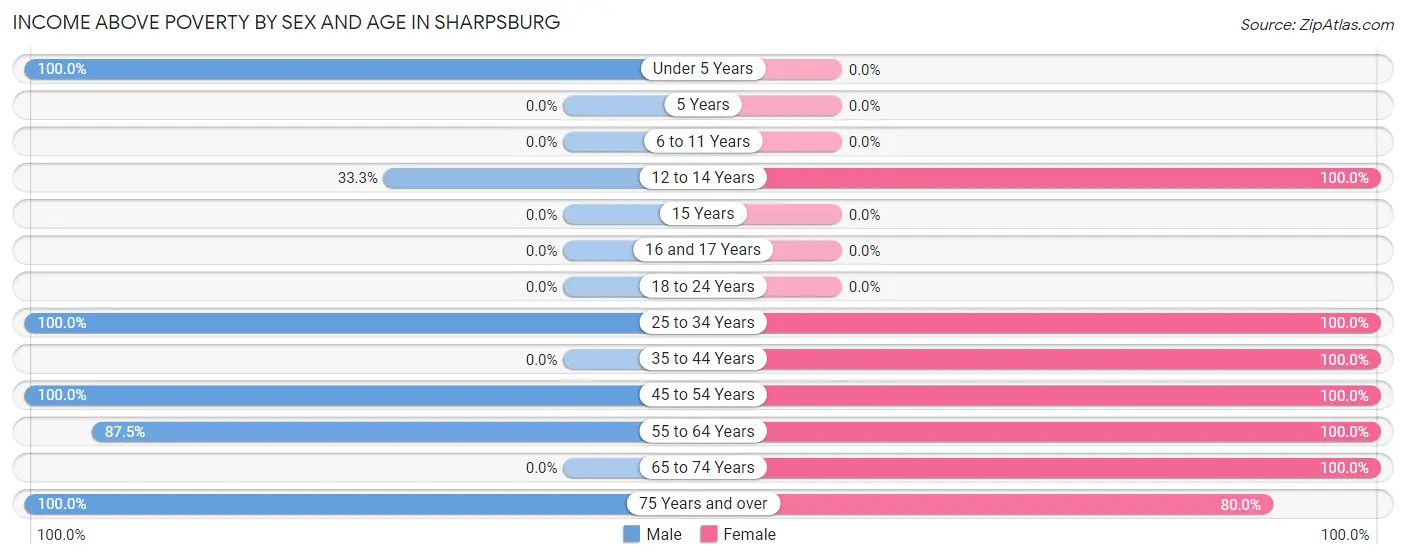
| Age Bracket | Male | Female |
| Under 5 Years | 5 (100.0%) | 0 (0.0%) |
| 5 Years | 0 (0.0%) | 0 (0.0%) |
| 6 to 11 Years | 0 (0.0%) | 0 (0.0%) |
| 12 to 14 Years | 1 (33.3%) | 2 (100.0%) |
| 15 Years | 0 (0.0%) | 0 (0.0%) |
| 16 and 17 Years | 0 (0.0%) | 0 (0.0%) |
| 18 to 24 Years | 0 (0.0%) | 0 (0.0%) |
| 25 to 34 Years | 6 (100.0%) | 6 (100.0%) |
| 35 to 44 Years | 0 (0.0%) | 3 (100.0%) |
| 45 to 54 Years | 8 (100.0%) | 17 (100.0%) |
| 55 to 64 Years | 7 (87.5%) | 2 (100.0%) |
| 65 to 74 Years | 0 (0.0%) | 1 (100.0%) |
| 75 Years and over | 2 (100.0%) | 4 (80.0%) |
| Total | 29 (80.6%) | 35 (97.2%) |
Income Below Poverty Among Married-Couple Families in Sharpsburg
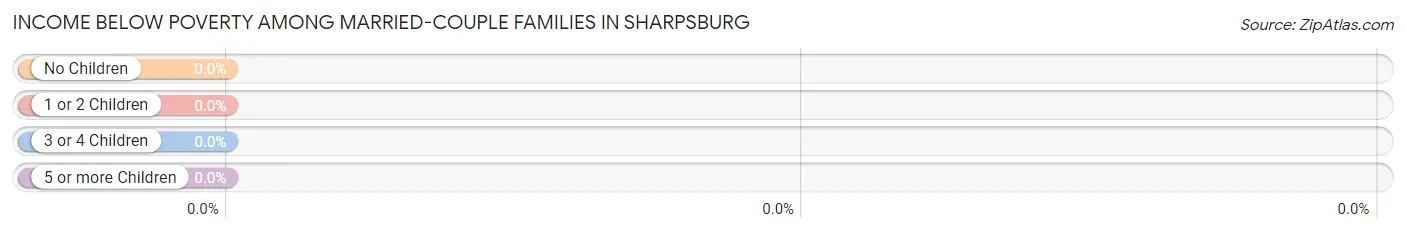
| Children | Above Poverty | Below Poverty |
| No Children | 8 (100.0%) | 0 (0.0%) |
| 1 or 2 Children | 7 (100.0%) | 0 (0.0%) |
| 3 or 4 Children | 0 (0.0%) | 0 (0.0%) |
| 5 or more Children | 0 (0.0%) | 0 (0.0%) |
| Total | 15 (100.0%) | 0 (0.0%) |
Income Below Poverty Among Single-Parent Households in Sharpsburg
According to the poverty data in Sharpsburg, 50.0% or 3 single-father households and 100.0% or 1 single-mother households are living below the poverty line. Among single-father households, those with 1 or 2 children have the highest poverty rate, with 3 households (100.0%) experiencing poverty. Likewise, among single-mother households, those with no children have the highest poverty rate, with 1 households (100.0%) falling below the poverty line.
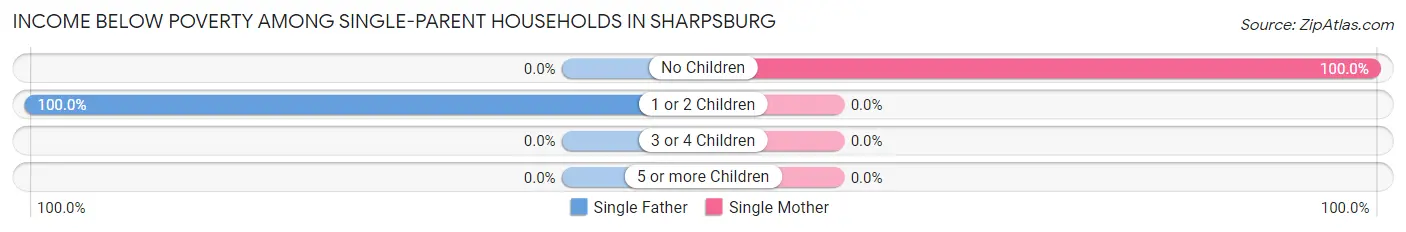
| Children | Single Father | Single Mother |
| No Children | 0 (0.0%) | 1 (100.0%) |
| 1 or 2 Children | 3 (100.0%) | 0 (0.0%) |
| 3 or 4 Children | 0 (0.0%) | 0 (0.0%) |
| 5 or more Children | 0 (0.0%) | 0 (0.0%) |
| Total | 3 (50.0%) | 1 (100.0%) |
Income Below Poverty Among Married-Couple vs Single-Parent Households in Sharpsburg
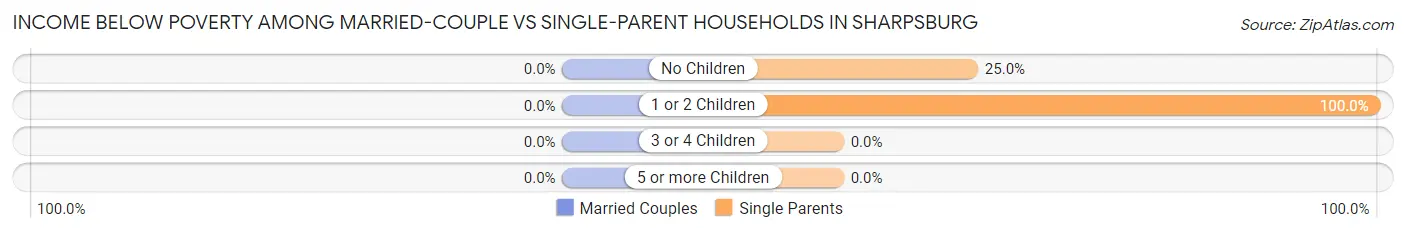
| Children | Married-Couple Families | Single-Parent Households |
| No Children | 0 (0.0%) | 1 (25.0%) |
| 1 or 2 Children | 0 (0.0%) | 3 (100.0%) |
| 3 or 4 Children | 0 (0.0%) | 0 (0.0%) |
| 5 or more Children | 0 (0.0%) | 0 (0.0%) |
| Total | 0 (0.0%) | 4 (57.1%) |
Race in Sharpsburg
The most populous races in Sharpsburg are White / Caucasian (71 | 98.6%), Hispanic or Latino (1 | 1.4%), and Some other Race (1 | 1.4%).
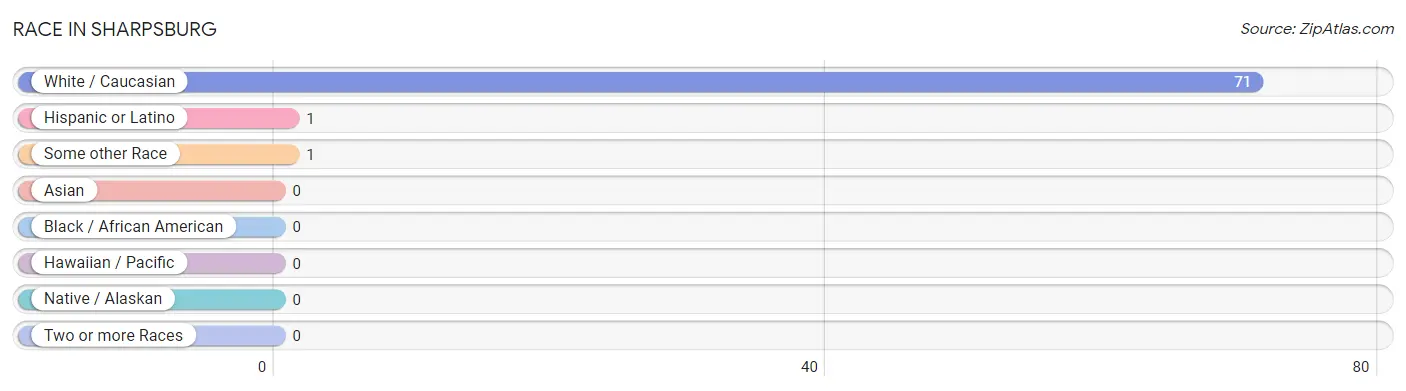
| Race | # Population | % Population |
| Asian | 0 | 0.0% |
| Black / African American | 0 | 0.0% |
| Hawaiian / Pacific | 0 | 0.0% |
| Hispanic or Latino | 1 | 1.4% |
| Native / Alaskan | 0 | 0.0% |
| White / Caucasian | 71 | 98.6% |
| Two or more Races | 0 | 0.0% |
| Some other Race | 1 | 1.4% |
| Total | 72 | 100.0% |
Ancestry in Sharpsburg
The most populous ancestries reported in Sharpsburg are American (18 | 25.0%), English (10 | 13.9%), European (6 | 8.3%), German (5 | 6.9%), and Irish (5 | 6.9%), together accounting for 61.1% of all Sharpsburg residents.
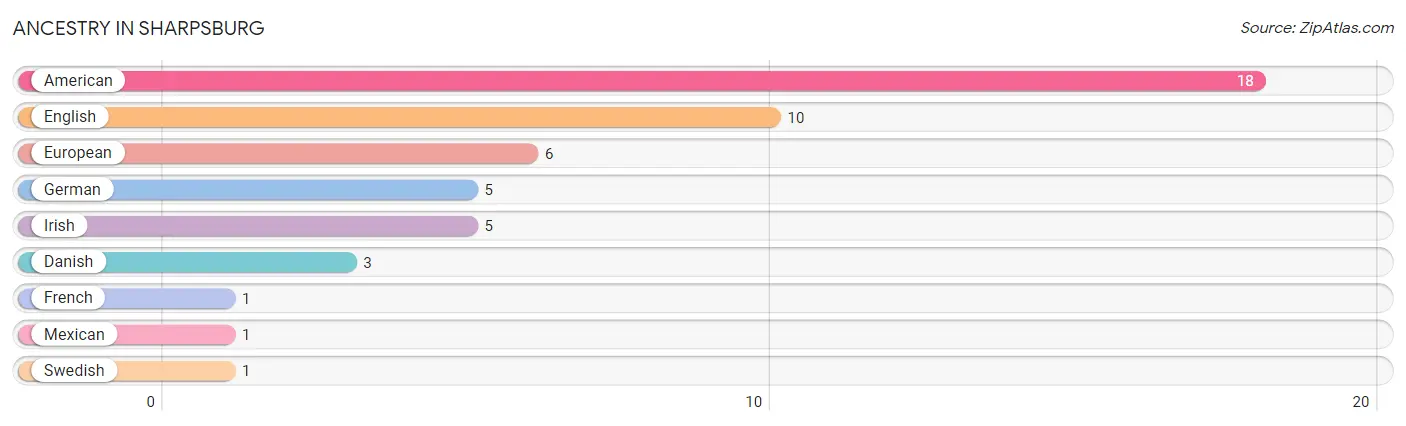
| Ancestry | # Population | % Population |
| American | 18 | 25.0% |
| Danish | 3 | 4.2% |
| English | 10 | 13.9% |
| European | 6 | 8.3% |
| French | 1 | 1.4% |
| German | 5 | 6.9% |
| Irish | 5 | 6.9% |
| Mexican | 1 | 1.4% |
| Swedish | 1 | 1.4% | View All 9 Rows |
Immigrants in Sharpsburg
The most numerous immigrant groups reported in Sharpsburg came from Central America (1 | 1.4%), Latin America (1 | 1.4%), and Mexico (1 | 1.4%), together accounting for 4.2% of all Sharpsburg residents.
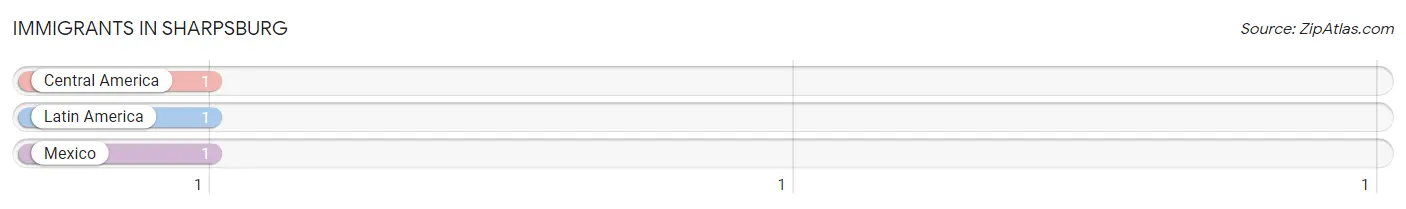
| Immigration Origin | # Population | % Population |
| Central America | 1 | 1.4% |
| Latin America | 1 | 1.4% |
| Mexico | 1 | 1.4% | View All 3 Rows |
Sex and Age in Sharpsburg
Sex and Age in Sharpsburg
The most populous age groups in Sharpsburg are 60 to 64 Years (7 | 19.4%) for men and 50 to 54 Years (17 | 47.2%) for women.

| Age Bracket | Male | Female |
| Under 5 Years | 5 (13.9%) | 0 (0.0%) |
| 5 to 9 Years | 0 (0.0%) | 0 (0.0%) |
| 10 to 14 Years | 4 (11.1%) | 2 (5.6%) |
| 15 to 19 Years | 0 (0.0%) | 0 (0.0%) |
| 20 to 24 Years | 0 (0.0%) | 0 (0.0%) |
| 25 to 29 Years | 6 (16.7%) | 0 (0.0%) |
| 30 to 34 Years | 0 (0.0%) | 6 (16.7%) |
| 35 to 39 Years | 3 (8.3%) | 1 (2.8%) |
| 40 to 44 Years | 0 (0.0%) | 2 (5.6%) |
| 45 to 49 Years | 2 (5.6%) | 0 (0.0%) |
| 50 to 54 Years | 6 (16.7%) | 17 (47.2%) |
| 55 to 59 Years | 1 (2.8%) | 1 (2.8%) |
| 60 to 64 Years | 7 (19.4%) | 1 (2.8%) |
| 65 to 69 Years | 0 (0.0%) | 0 (0.0%) |
| 70 to 74 Years | 0 (0.0%) | 1 (2.8%) |
| 75 to 79 Years | 2 (5.6%) | 0 (0.0%) |
| 80 to 84 Years | 0 (0.0%) | 2 (5.6%) |
| 85 Years and over | 0 (0.0%) | 3 (8.3%) |
| Total | 36 (100.0%) | 36 (100.0%) |
Families and Households in Sharpsburg
Median Family Size in Sharpsburg
The median family size in Sharpsburg is 2.91 persons per family, with married-couple families (15 | 68.2%) accounting for the largest median family size of 3.2 persons per family. On the other hand, single female/mother families (1 | 4.5%) represent the smallest median family size with 2.00 persons per family.
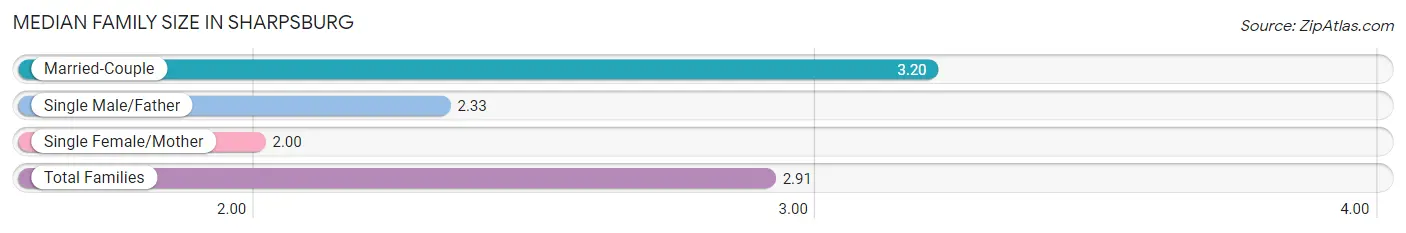
| Family Type | # Families | Family Size |
| Married-Couple | 15 (68.2%) | 3.20 |
| Single Male/Father | 6 (27.3%) | 2.33 |
| Single Female/Mother | 1 (4.5%) | 2.00 |
| Total Families | 22 (100.0%) | 2.91 |
Median Household Size in Sharpsburg
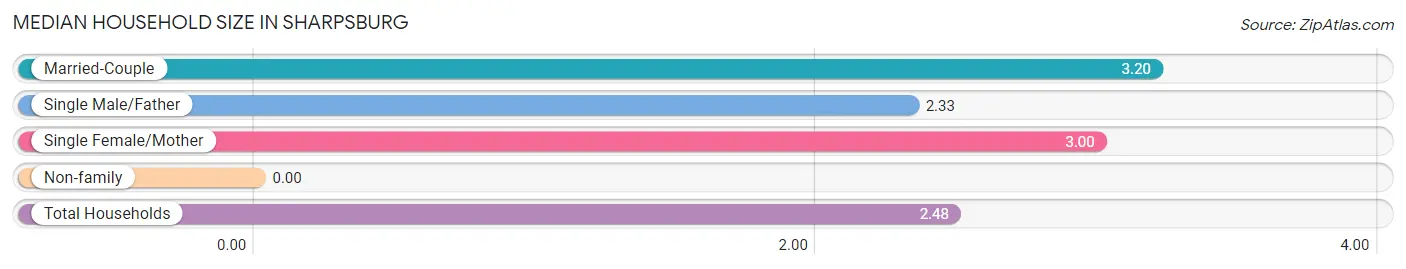
| Household Type | # Households | Household Size |
| Married-Couple | 15 (51.7%) | 3.20 |
| Single Male/Father | 6 (20.7%) | 2.33 |
| Single Female/Mother | 1 (3.5%) | 3.00 |
| Non-family | 7 (24.1%) | - |
| Total Households | 29 (100.0%) | 2.48 |
Household Size by Marriage Status in Sharpsburg
Out of a total of 29 households in Sharpsburg, 22 (75.9%) are family households, while 7 (24.1%) are nonfamily households. The most numerous type of family households are 2-person households, comprising 11, and the most common type of nonfamily households are 1-person households, comprising 7.
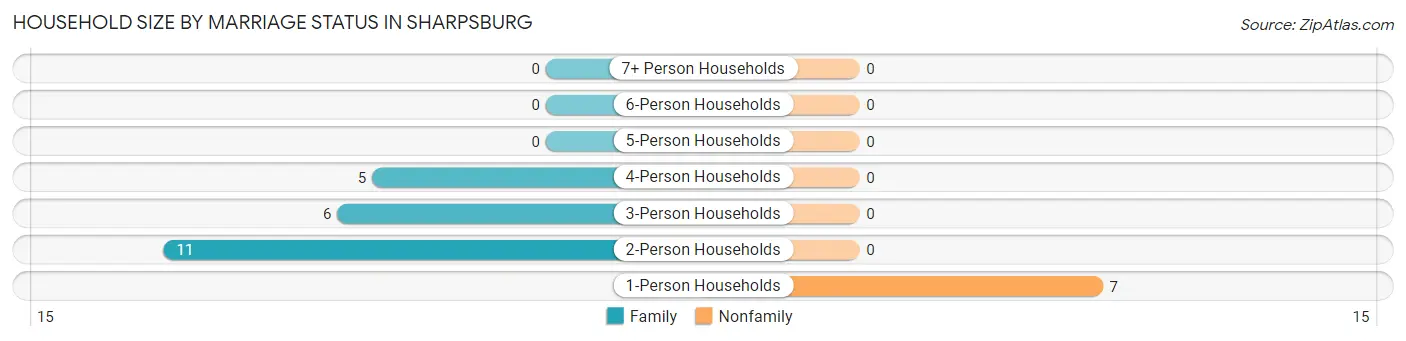
| Household Size | Family Households | Nonfamily Households |
| 1-Person Households | - | 7 (24.1%) |
| 2-Person Households | 11 (37.9%) | 0 (0.0%) |
| 3-Person Households | 6 (20.7%) | 0 (0.0%) |
| 4-Person Households | 5 (17.2%) | 0 (0.0%) |
| 5-Person Households | 0 (0.0%) | 0 (0.0%) |
| 6-Person Households | 0 (0.0%) | 0 (0.0%) |
| 7+ Person Households | 0 (0.0%) | 0 (0.0%) |
| Total | 22 (75.9%) | 7 (24.1%) |
Female Fertility in Sharpsburg
Fertility by Age in Sharpsburg
Average fertility rate in Sharpsburg is 444.0 births per 1,000 women. Women in the age bracket of 20 to 34 years have the highest fertility rate with 667.0 births per 1,000 women. Women in the age bracket of 20 to 34 years acount for 100.0% of all women with births.
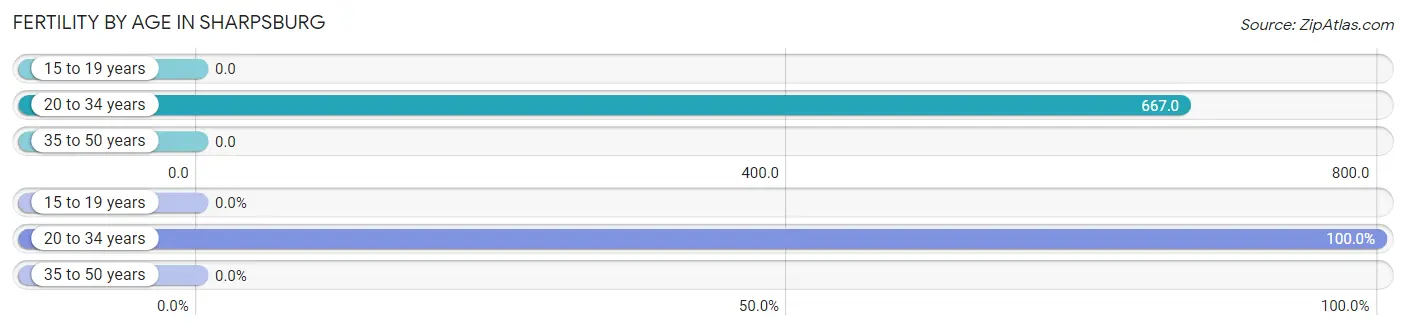
| Age Bracket | Women with Births | Births / 1,000 Women |
| 15 to 19 years | 0 (0.0%) | 0.0 |
| 20 to 34 years | 4 (100.0%) | 667.0 |
| 35 to 50 years | 0 (0.0%) | 0.0 |
| Total | 4 (100.0%) | 444.0 |
Fertility by Age by Marriage Status in Sharpsburg
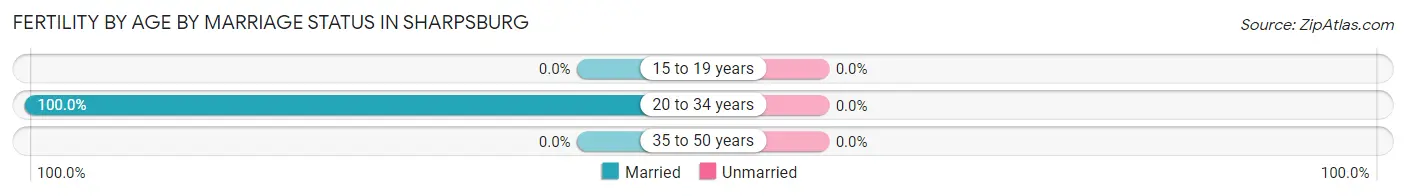
| Age Bracket | Married | Unmarried |
| 15 to 19 years | 0 (0.0%) | 0 (0.0%) |
| 20 to 34 years | 4 (100.0%) | 0 (0.0%) |
| 35 to 50 years | 0 (0.0%) | 0 (0.0%) |
| Total | 4 (100.0%) | 0 (0.0%) |
Fertility by Education in Sharpsburg
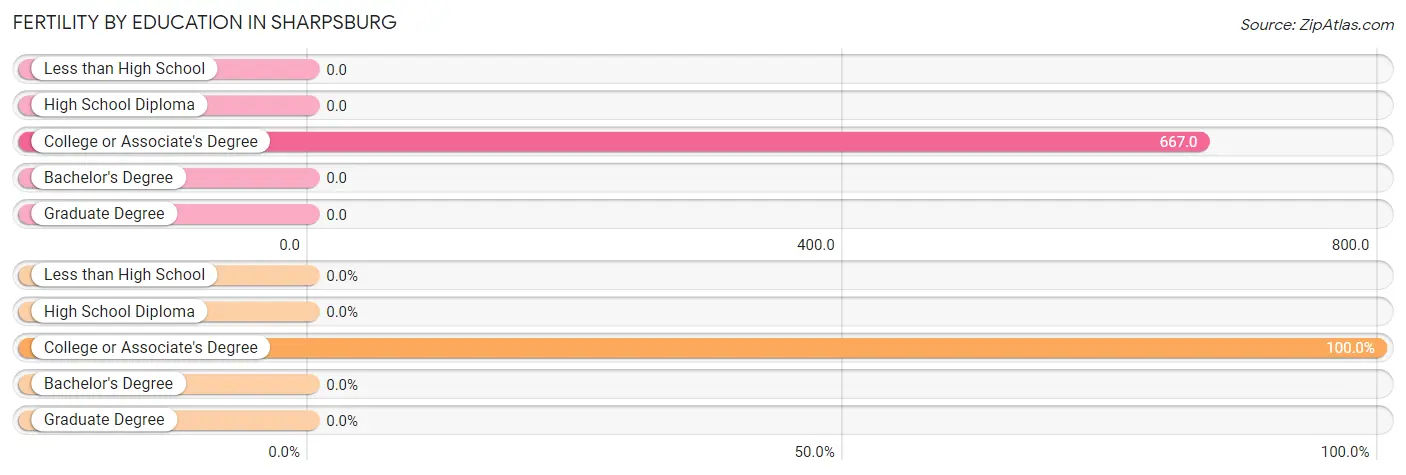
| Educational Attainment | Women with Births | Births / 1,000 Women |
| Less than High School | 0 (0.0%) | 0.0 |
| High School Diploma | 0 (0.0%) | 0.0 |
| College or Associate's Degree | 4 (100.0%) | 667.0 |
| Bachelor's Degree | 0 (0.0%) | 0.0 |
| Graduate Degree | 0 (0.0%) | 0.0 |
| Total | 4 (100.0%) | 444.0 |
Fertility by Education by Marriage Status in Sharpsburg
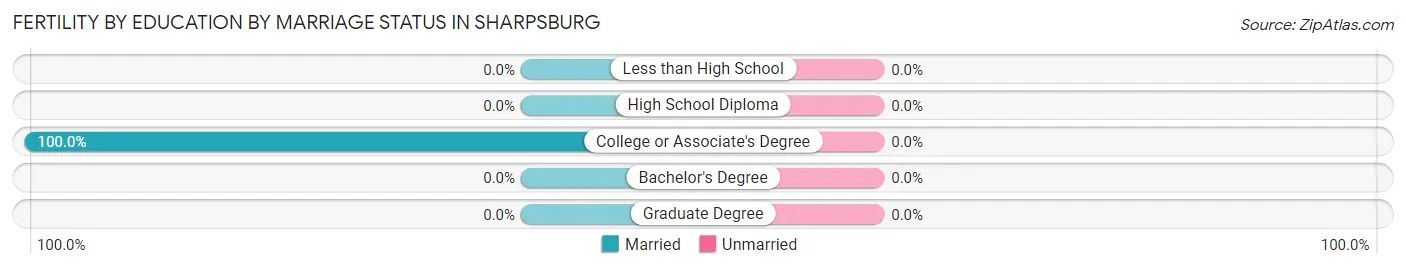
| Educational Attainment | Married | Unmarried |
| Less than High School | 0 (0.0%) | 0 (0.0%) |
| High School Diploma | 0 (0.0%) | 0 (0.0%) |
| College or Associate's Degree | 4 (100.0%) | 0 (0.0%) |
| Bachelor's Degree | 0 (0.0%) | 0 (0.0%) |
| Graduate Degree | 0 (0.0%) | 0 (0.0%) |
| Total | 4 (100.0%) | 0 (0.0%) |
Employment Characteristics in Sharpsburg
Employment by Class of Employer in Sharpsburg
Among the 30 employed individuals in Sharpsburg, private company employees (13 | 43.3%), self-employed (not incorporated) (7 | 23.3%), and not-for-profit organizations (5 | 16.7%) make up the most common classes of employment.
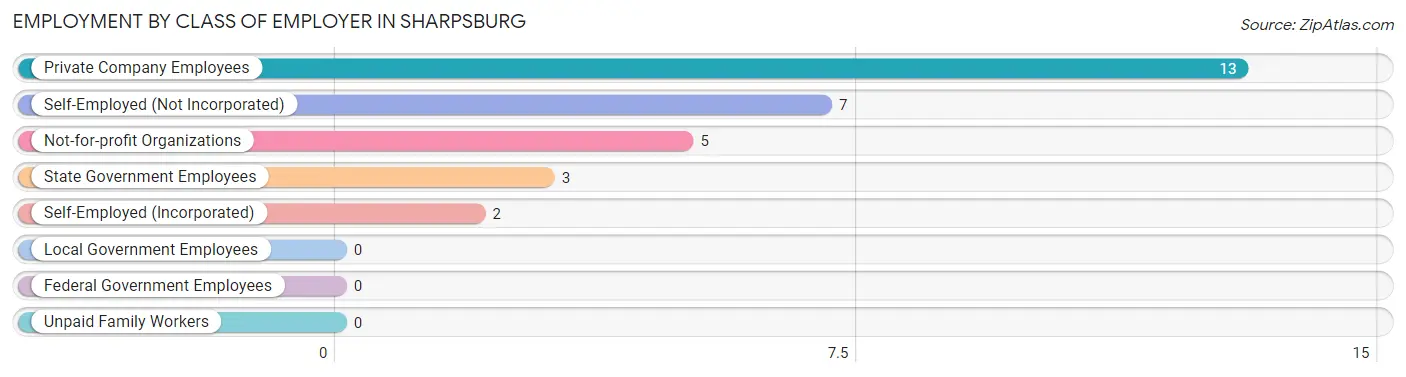
| Employer Class | # Employees | % Employees |
| Private Company Employees | 13 | 43.3% |
| Self-Employed (Incorporated) | 2 | 6.7% |
| Self-Employed (Not Incorporated) | 7 | 23.3% |
| Not-for-profit Organizations | 5 | 16.7% |
| Local Government Employees | 0 | 0.0% |
| State Government Employees | 3 | 10.0% |
| Federal Government Employees | 0 | 0.0% |
| Unpaid Family Workers | 0 | 0.0% |
| Total | 30 | 100.0% |
Employment Status by Age in Sharpsburg
According to the labor force statistics for Sharpsburg, out of the total population over 16 years of age (61), 55.7% or 34 individuals are in the labor force, with 2.9% or 1 of them unemployed. The age group with the highest labor force participation rate is 25 to 29 years, with 100.0% or 6 individuals in the labor force. Within the labor force, the 55 to 59 years age range has the highest percentage of unemployed individuals, with 50.0% or 1 of them being unemployed.
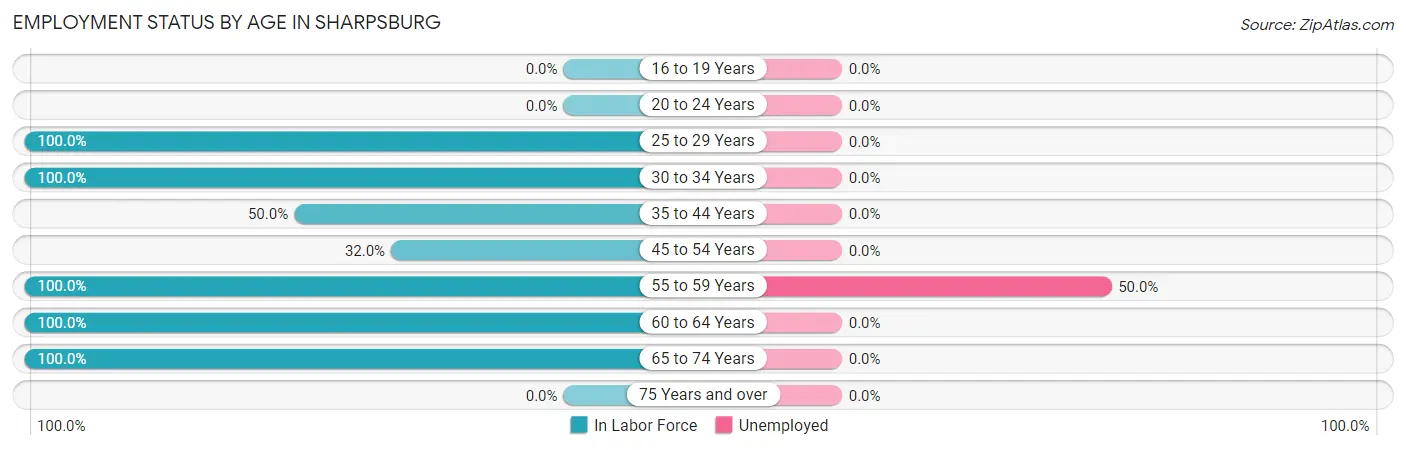
| Age Bracket | In Labor Force | Unemployed |
| 16 to 19 Years | 0 (0.0%) | 0 (0.0%) |
| 20 to 24 Years | 0 (0.0%) | 0 (0.0%) |
| 25 to 29 Years | 6 (100.0%) | 0 (0.0%) |
| 30 to 34 Years | 6 (100.0%) | 0 (0.0%) |
| 35 to 44 Years | 3 (50.0%) | 0 (0.0%) |
| 45 to 54 Years | 8 (32.0%) | 0 (0.0%) |
| 55 to 59 Years | 2 (100.0%) | 1 (50.0%) |
| 60 to 64 Years | 8 (100.0%) | 0 (0.0%) |
| 65 to 74 Years | 1 (100.0%) | 0 (0.0%) |
| 75 Years and over | 0 (0.0%) | 0 (0.0%) |
| Total | 34 (55.7%) | 1 (2.9%) |
Employment Status by Educational Attainment in Sharpsburg
According to labor force statistics for Sharpsburg, 62.3% of individuals (33) out of the total population between 25 and 64 years of age (53) are in the labor force, with 3.0% or 1 of them being unemployed. The group with the highest labor force participation rate are those with the educational attainment of less than high school, with 100.0% or 1 individuals in the labor force. Within the labor force, individuals with high school diploma education have the highest percentage of unemployment, with 12.5% or 1 of them being unemployed.
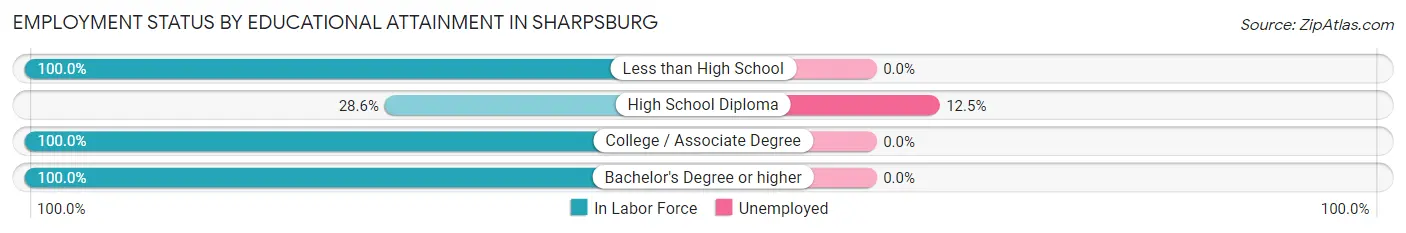
| Educational Attainment | In Labor Force | Unemployed |
| Less than High School | 1 (100.0%) | 0 (0.0%) |
| High School Diploma | 8 (28.6%) | 4 (12.5%) |
| College / Associate Degree | 23 (100.0%) | 0 (0.0%) |
| Bachelor's Degree or higher | 1 (100.0%) | 0 (0.0%) |
| Total | 33 (62.3%) | 2 (3.0%) |
Employment Occupations by Sex in Sharpsburg
Management, Business, Science and Arts Occupations
The most common Management, Business, Science and Arts occupations in Sharpsburg are Business & Financial (1 | 3.0%), Community & Social Service (1 | 3.0%), and Education, Arts & Media (1 | 3.0%).
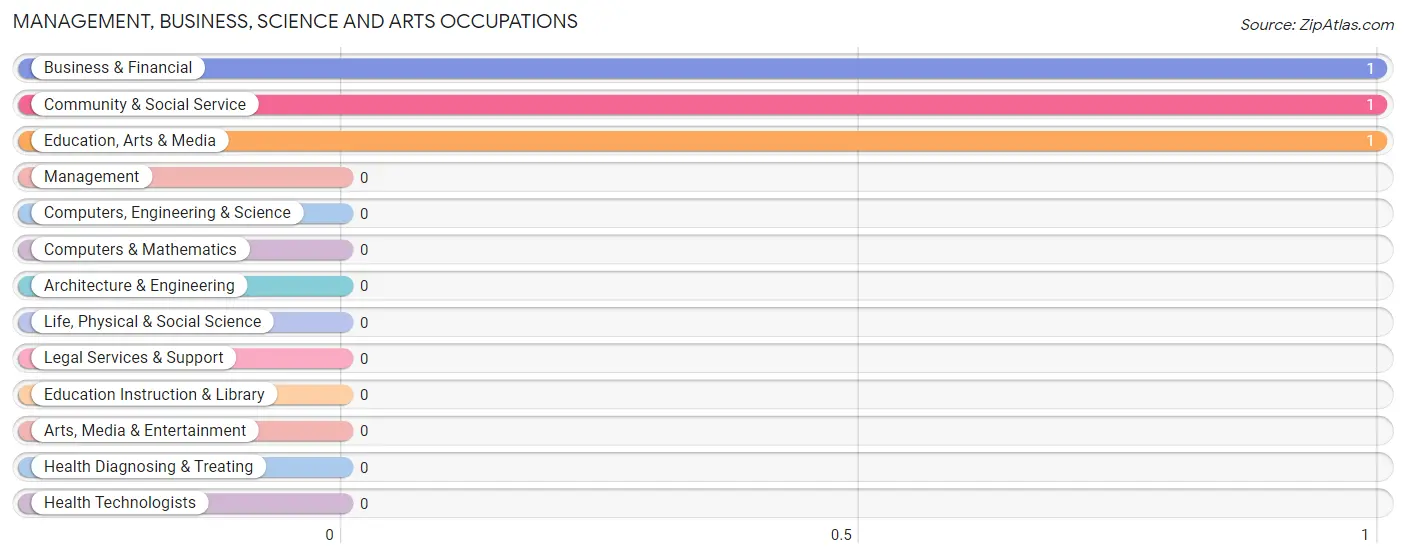
Management, Business, Science and Arts Occupations by Sex
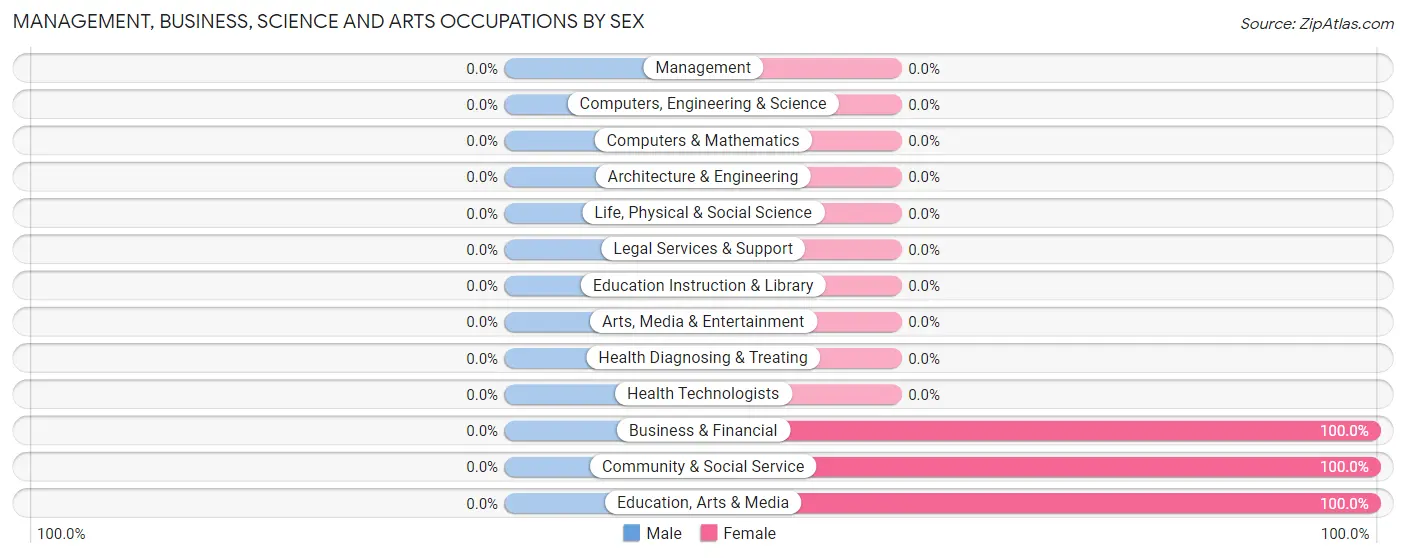
| Occupation | Male | Female |
| Management | 0 (0.0%) | 0 (0.0%) |
| Business & Financial | 0 (0.0%) | 1 (100.0%) |
| Computers, Engineering & Science | 0 (0.0%) | 0 (0.0%) |
| Computers & Mathematics | 0 (0.0%) | 0 (0.0%) |
| Architecture & Engineering | 0 (0.0%) | 0 (0.0%) |
| Life, Physical & Social Science | 0 (0.0%) | 0 (0.0%) |
| Community & Social Service | 0 (0.0%) | 1 (100.0%) |
| Education, Arts & Media | 0 (0.0%) | 1 (100.0%) |
| Legal Services & Support | 0 (0.0%) | 0 (0.0%) |
| Education Instruction & Library | 0 (0.0%) | 0 (0.0%) |
| Arts, Media & Entertainment | 0 (0.0%) | 0 (0.0%) |
| Health Diagnosing & Treating | 0 (0.0%) | 0 (0.0%) |
| Health Technologists | 0 (0.0%) | 0 (0.0%) |
| Total (Category) | 0 (0.0%) | 2 (100.0%) |
| Total (Overall) | 21 (63.6%) | 12 (36.4%) |
Services Occupations
The most common Services occupations in Sharpsburg are , and Healthcare Support (4 | 12.1%).
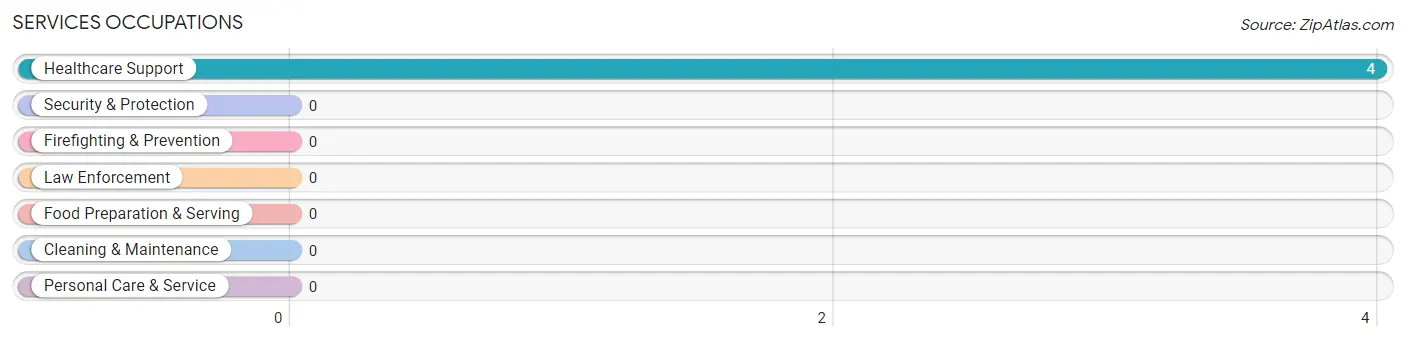
Services Occupations by Sex
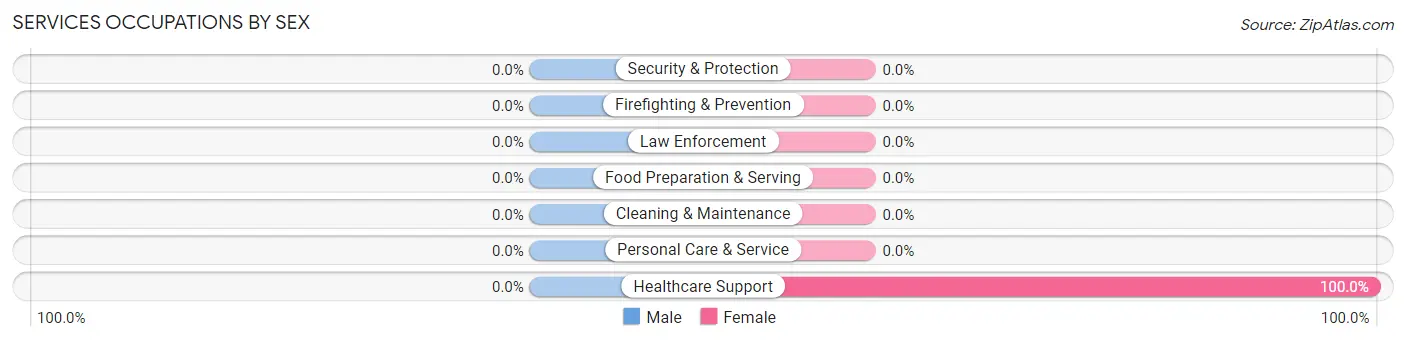
| Occupation | Male | Female |
| Healthcare Support | 0 (0.0%) | 4 (100.0%) |
| Security & Protection | 0 (0.0%) | 0 (0.0%) |
| Firefighting & Prevention | 0 (0.0%) | 0 (0.0%) |
| Law Enforcement | 0 (0.0%) | 0 (0.0%) |
| Food Preparation & Serving | 0 (0.0%) | 0 (0.0%) |
| Cleaning & Maintenance | 0 (0.0%) | 0 (0.0%) |
| Personal Care & Service | 0 (0.0%) | 0 (0.0%) |
| Total (Category) | 0 (0.0%) | 4 (100.0%) |
| Total (Overall) | 21 (63.6%) | 12 (36.4%) |
Sales and Office Occupations
The most common Sales and Office occupations in Sharpsburg are , and Sales & Related (9 | 27.3%).
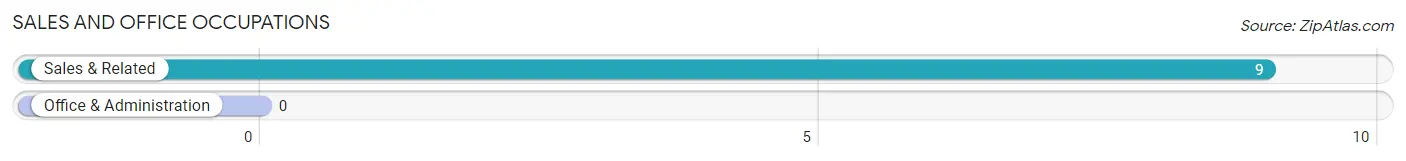
Sales and Office Occupations by Sex
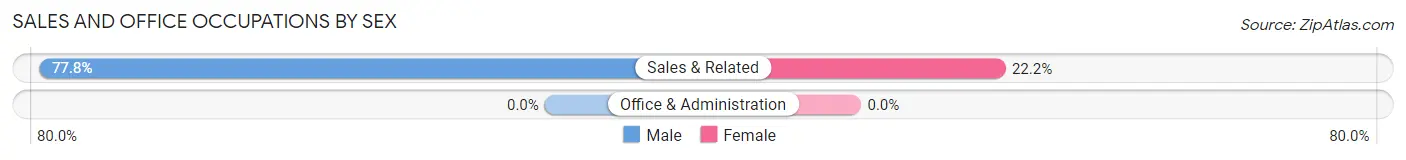
| Occupation | Male | Female |
| Sales & Related | 7 (77.8%) | 2 (22.2%) |
| Office & Administration | 0 (0.0%) | 0 (0.0%) |
| Total (Category) | 7 (77.8%) | 2 (22.2%) |
| Total (Overall) | 21 (63.6%) | 12 (36.4%) |
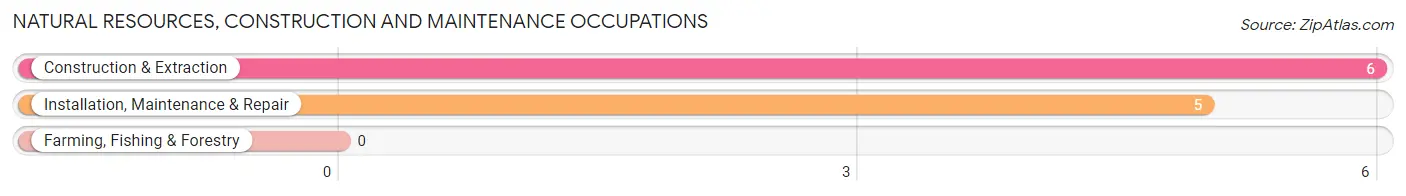
Natural Resources, Construction and Maintenance Occupations
The most common Natural Resources, Construction and Maintenance occupations in Sharpsburg are Construction & Extraction (6 | 18.2%), and Installation, Maintenance & Repair (5 | 15.1%).
Natural Resources, Construction and Maintenance Occupations by Sex
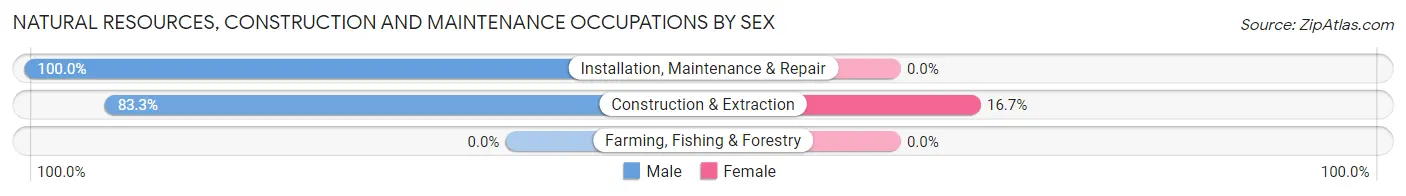
| Occupation | Male | Female |
| Farming, Fishing & Forestry | 0 (0.0%) | 0 (0.0%) |
| Construction & Extraction | 5 (83.3%) | 1 (16.7%) |
| Installation, Maintenance & Repair | 5 (100.0%) | 0 (0.0%) |
| Total (Category) | 10 (90.9%) | 1 (9.1%) |
| Total (Overall) | 21 (63.6%) | 12 (36.4%) |
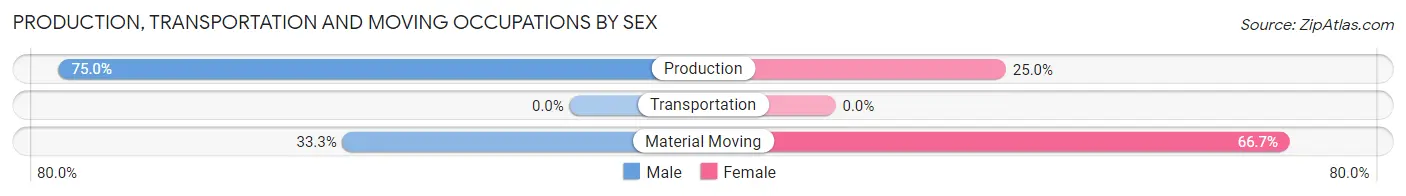
Production, Transportation and Moving Occupations
The most common Production, Transportation and Moving occupations in Sharpsburg are Production (4 | 12.1%), and Material Moving (3 | 9.1%).
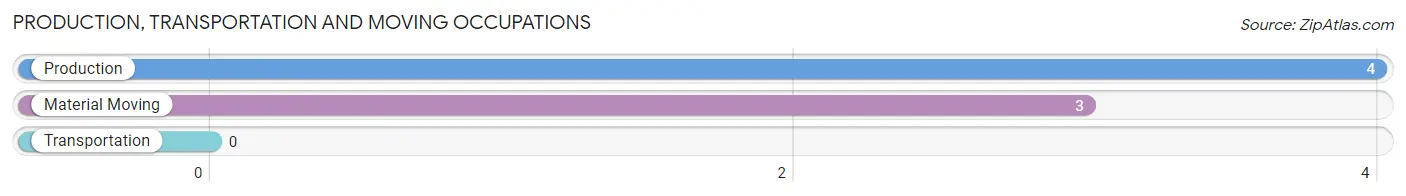
Production, Transportation and Moving Occupations by Sex
| Occupation | Male | Female |
| Production | 3 (75.0%) | 1 (25.0%) |
| Transportation | 0 (0.0%) | 0 (0.0%) |
| Material Moving | 1 (33.3%) | 2 (66.7%) |
| Total (Category) | 4 (57.1%) | 3 (42.9%) |
| Total (Overall) | 21 (63.6%) | 12 (36.4%) |
Employment Industries by Sex in Sharpsburg
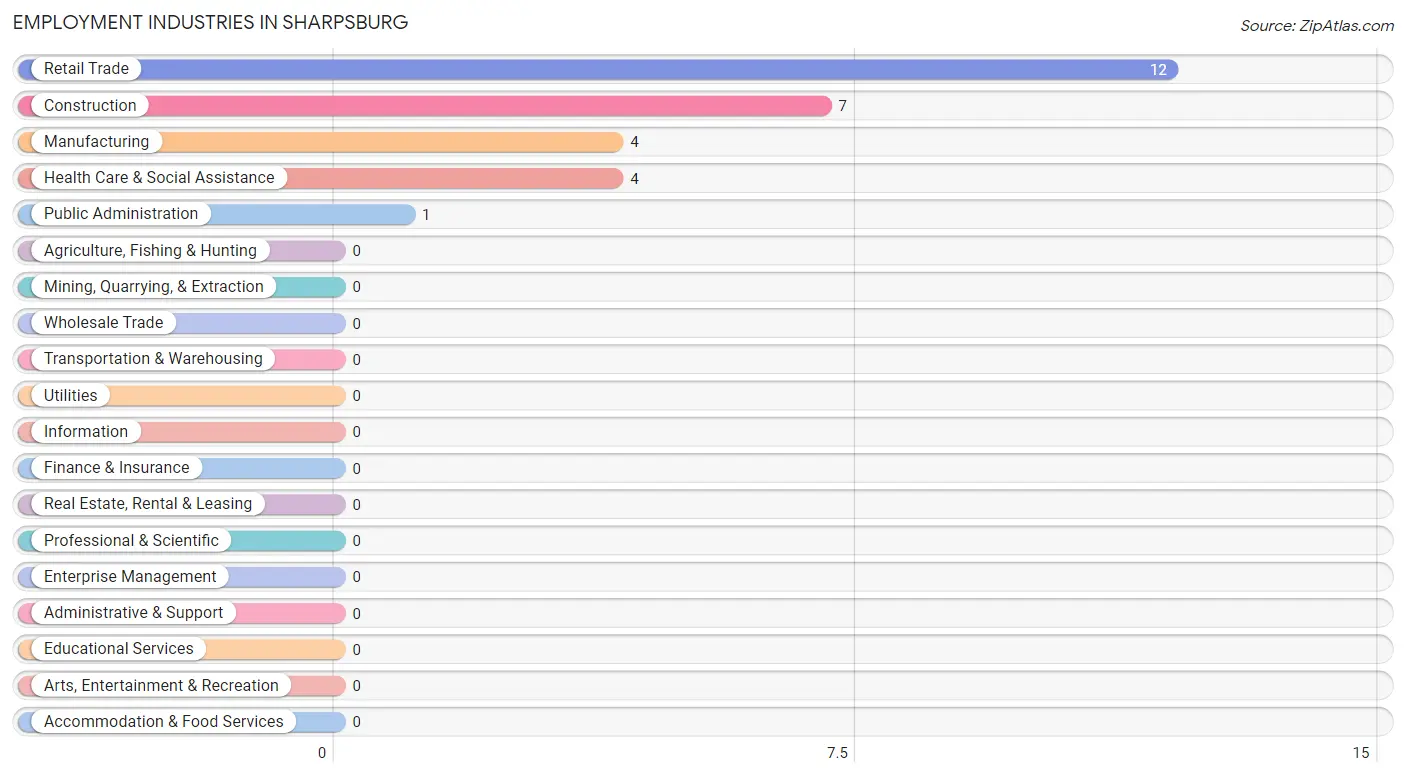
Employment Industries in Sharpsburg
The major employment industries in Sharpsburg include Retail Trade (12 | 36.4%), Construction (7 | 21.2%), Manufacturing (4 | 12.1%), Health Care & Social Assistance (4 | 12.1%), and Public Administration (1 | 3.0%).
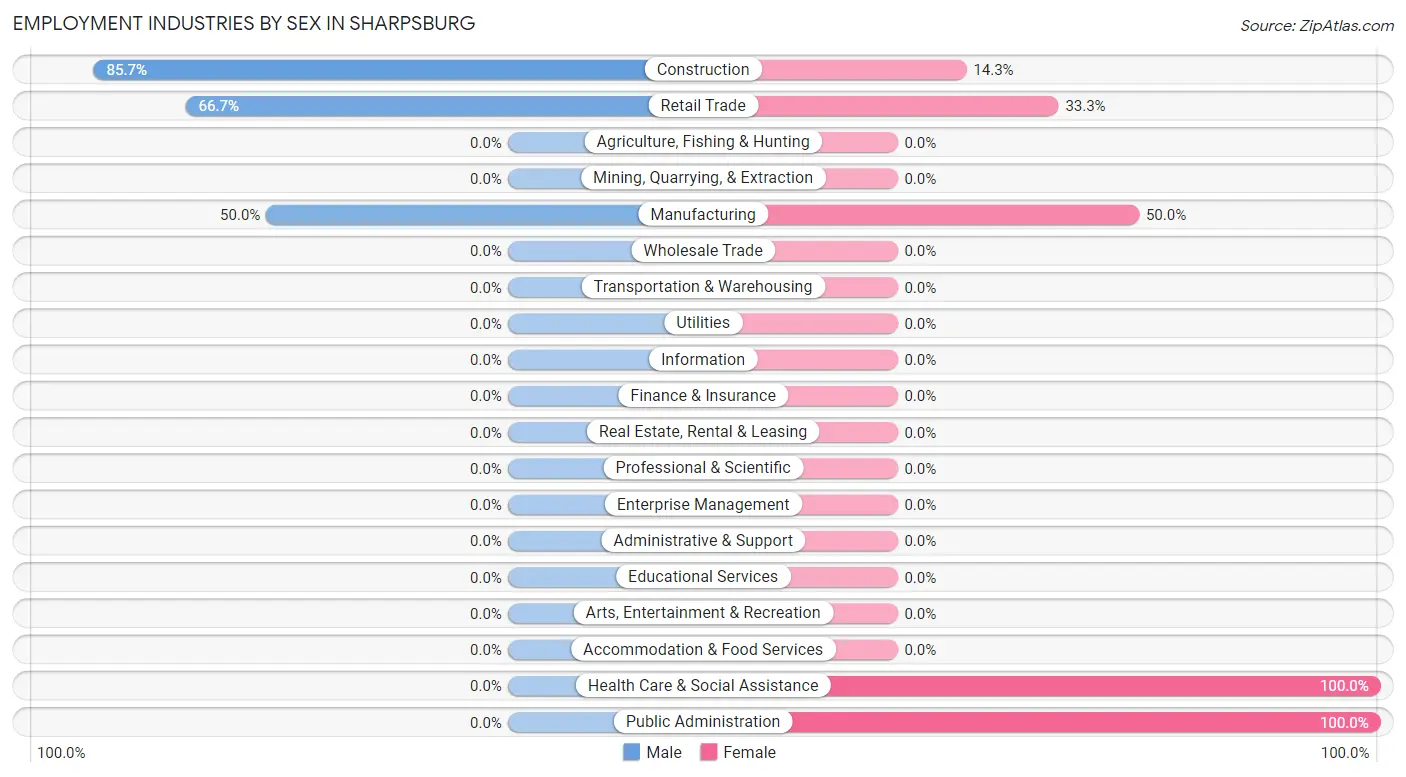
Employment Industries by Sex in Sharpsburg
The Sharpsburg industries that see more men than women are Construction (85.7%), Retail Trade (66.7%), and Manufacturing (50.0%), whereas the industries that tend to have a higher number of women are Health Care & Social Assistance (100.0%), Public Administration (100.0%), and Manufacturing (50.0%).
| Industry | Male | Female |
| Agriculture, Fishing & Hunting | 0 (0.0%) | 0 (0.0%) |
| Mining, Quarrying, & Extraction | 0 (0.0%) | 0 (0.0%) |
| Construction | 6 (85.7%) | 1 (14.3%) |
| Manufacturing | 2 (50.0%) | 2 (50.0%) |
| Wholesale Trade | 0 (0.0%) | 0 (0.0%) |
| Retail Trade | 8 (66.7%) | 4 (33.3%) |
| Transportation & Warehousing | 0 (0.0%) | 0 (0.0%) |
| Utilities | 0 (0.0%) | 0 (0.0%) |
| Information | 0 (0.0%) | 0 (0.0%) |
| Finance & Insurance | 0 (0.0%) | 0 (0.0%) |
| Real Estate, Rental & Leasing | 0 (0.0%) | 0 (0.0%) |
| Professional & Scientific | 0 (0.0%) | 0 (0.0%) |
| Enterprise Management | 0 (0.0%) | 0 (0.0%) |
| Administrative & Support | 0 (0.0%) | 0 (0.0%) |
| Educational Services | 0 (0.0%) | 0 (0.0%) |
| Health Care & Social Assistance | 0 (0.0%) | 4 (100.0%) |
| Arts, Entertainment & Recreation | 0 (0.0%) | 0 (0.0%) |
| Accommodation & Food Services | 0 (0.0%) | 0 (0.0%) |
| Public Administration | 0 (0.0%) | 1 (100.0%) |
| Total | 21 (63.6%) | 12 (36.4%) |
Education in Sharpsburg
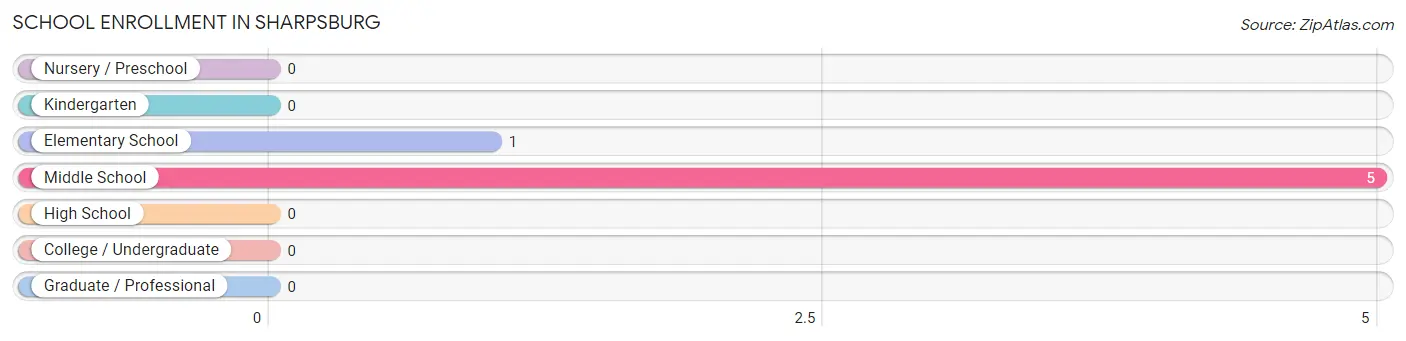
School Enrollment in Sharpsburg
The most common levels of schooling among the 6 students in Sharpsburg are middle school (5 | 83.3%), and elementary school (1 | 16.7%).
| School Level | # Students | % Students |
| Nursery / Preschool | 0 | 0.0% |
| Kindergarten | 0 | 0.0% |
| Elementary School | 1 | 16.7% |
| Middle School | 5 | 83.3% |
| High School | 0 | 0.0% |
| College / Undergraduate | 0 | 0.0% |
| Graduate / Professional | 0 | 0.0% |
| Total | 6 | 100.0% |
School Enrollment by Age by Funding Source in Sharpsburg
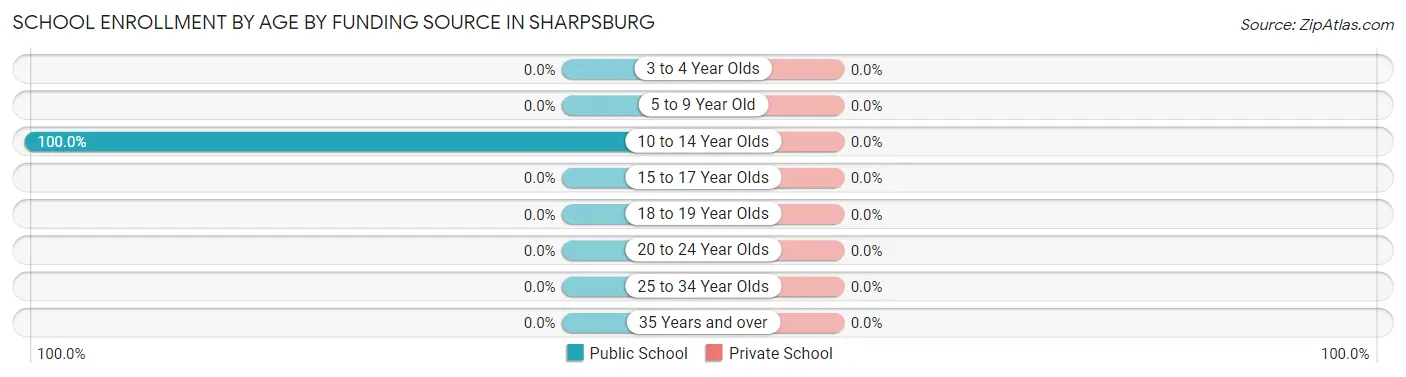
| Age Bracket | Public School | Private School |
| 3 to 4 Year Olds | 0 (0.0%) | 0 (0.0%) |
| 5 to 9 Year Old | 0 (0.0%) | 0 (0.0%) |
| 10 to 14 Year Olds | 6 (100.0%) | 0 (0.0%) |
| 15 to 17 Year Olds | 0 (0.0%) | 0 (0.0%) |
| 18 to 19 Year Olds | 0 (0.0%) | 0 (0.0%) |
| 20 to 24 Year Olds | 0 (0.0%) | 0 (0.0%) |
| 25 to 34 Year Olds | 0 (0.0%) | 0 (0.0%) |
| 35 Years and over | 0 (0.0%) | 0 (0.0%) |
| Total | 6 (100.0%) | 0 (0.0%) |
Educational Attainment by Field of Study in Sharpsburg
Bio, nature & agricultural (2 | 40.0%), physical & health sciences (2 | 40.0%), and education (1 | 20.0%) are the most common fields of study among 5 individuals in Sharpsburg who have obtained a bachelor's degree or higher.
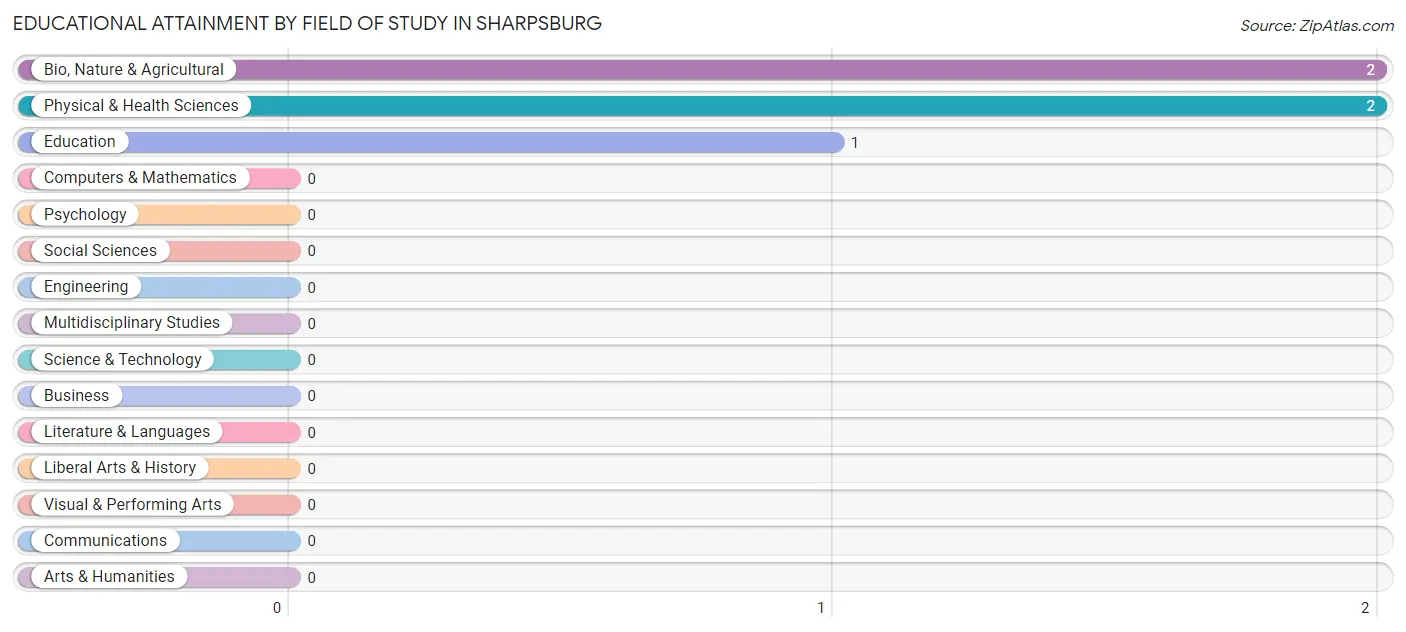
| Field of Study | # Graduates | % Graduates |
| Computers & Mathematics | 0 | 0.0% |
| Bio, Nature & Agricultural | 2 | 40.0% |
| Physical & Health Sciences | 2 | 40.0% |
| Psychology | 0 | 0.0% |
| Social Sciences | 0 | 0.0% |
| Engineering | 0 | 0.0% |
| Multidisciplinary Studies | 0 | 0.0% |
| Science & Technology | 0 | 0.0% |
| Business | 0 | 0.0% |
| Education | 1 | 20.0% |
| Literature & Languages | 0 | 0.0% |
| Liberal Arts & History | 0 | 0.0% |
| Visual & Performing Arts | 0 | 0.0% |
| Communications | 0 | 0.0% |
| Arts & Humanities | 0 | 0.0% |
| Total | 5 | 100.0% |
Transportation & Commute in Sharpsburg
Vehicle Availability by Sex in Sharpsburg
The most prevalent vehicle ownership categories in Sharpsburg are males with 3 vehicles (8, accounting for 44.4%) and females with 3 vehicles (2, making up 66.7%).
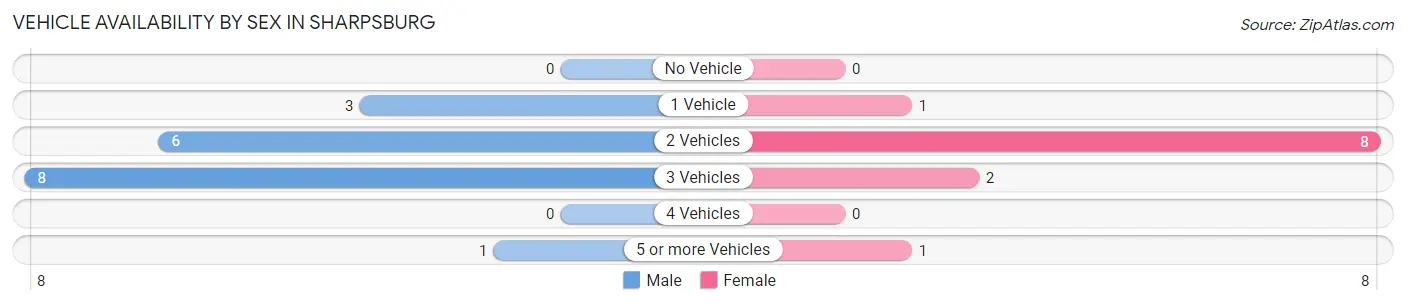
| Vehicles Available | Male | Female |
| No Vehicle | 0 (0.0%) | 0 (0.0%) |
| 1 Vehicle | 3 (16.7%) | 1 (8.3%) |
| 2 Vehicles | 6 (33.3%) | 8 (66.7%) |
| 3 Vehicles | 8 (44.4%) | 2 (16.7%) |
| 4 Vehicles | 0 (0.0%) | 0 (0.0%) |
| 5 or more Vehicles | 1 (5.6%) | 1 (8.3%) |
| Total | 18 (100.0%) | 12 (100.0%) |
Commute Time in Sharpsburg
The most frequently occuring commute durations in Sharpsburg are 15 to 19 minutes (14 commuters, 46.7%), 25 to 29 minutes (6 commuters, 20.0%), and 30 to 34 minutes (3 commuters, 10.0%).
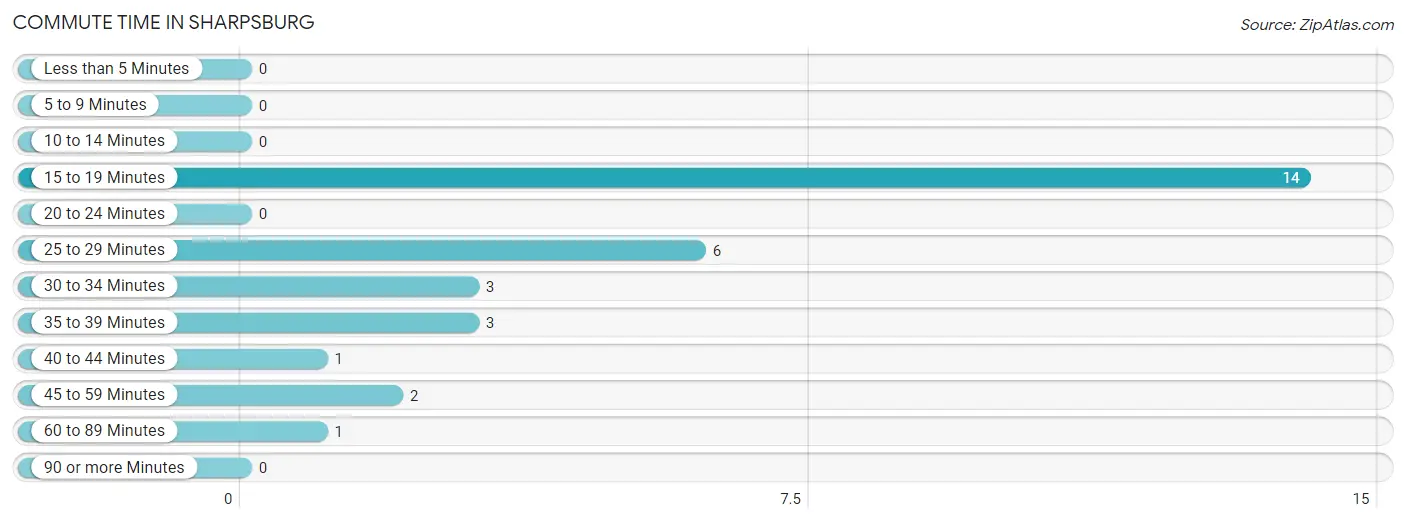
| Commute Time | # Commuters | % Commuters |
| Less than 5 Minutes | 0 | 0.0% |
| 5 to 9 Minutes | 0 | 0.0% |
| 10 to 14 Minutes | 0 | 0.0% |
| 15 to 19 Minutes | 14 | 46.7% |
| 20 to 24 Minutes | 0 | 0.0% |
| 25 to 29 Minutes | 6 | 20.0% |
| 30 to 34 Minutes | 3 | 10.0% |
| 35 to 39 Minutes | 3 | 10.0% |
| 40 to 44 Minutes | 1 | 3.3% |
| 45 to 59 Minutes | 2 | 6.7% |
| 60 to 89 Minutes | 1 | 3.3% |
| 90 or more Minutes | 0 | 0.0% |
Commute Time by Sex in Sharpsburg
The most common commute times in Sharpsburg are 15 to 19 minutes (10 commuters, 55.6%) for males and 25 to 29 minutes (6 commuters, 50.0%) for females.
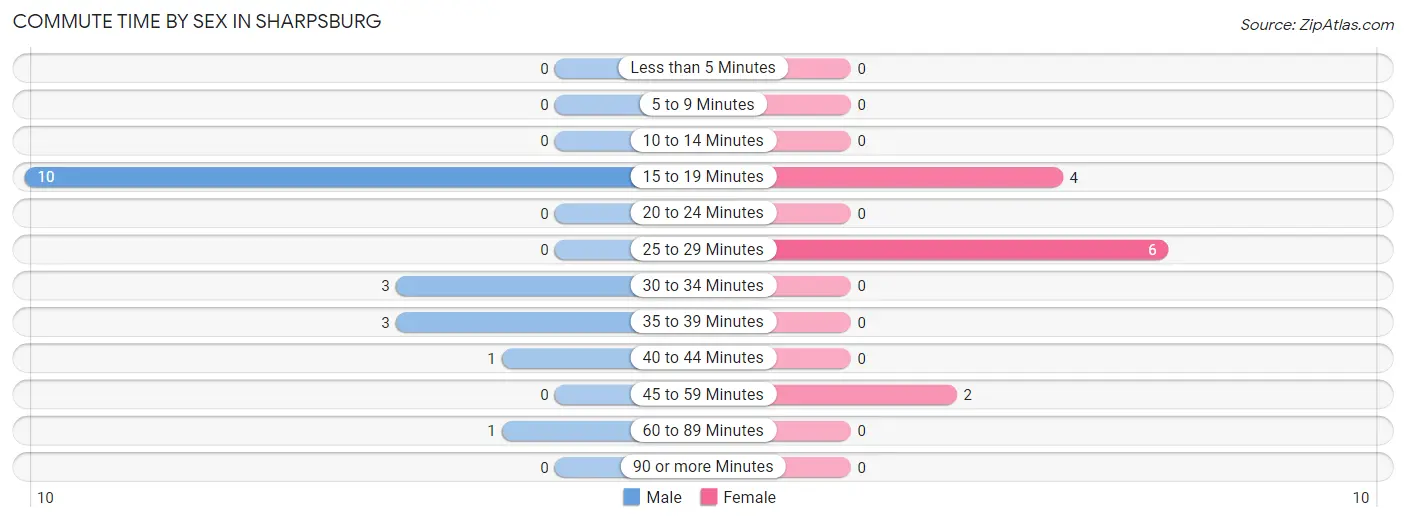
| Commute Time | Male | Female |
| Less than 5 Minutes | 0 (0.0%) | 0 (0.0%) |
| 5 to 9 Minutes | 0 (0.0%) | 0 (0.0%) |
| 10 to 14 Minutes | 0 (0.0%) | 0 (0.0%) |
| 15 to 19 Minutes | 10 (55.6%) | 4 (33.3%) |
| 20 to 24 Minutes | 0 (0.0%) | 0 (0.0%) |
| 25 to 29 Minutes | 0 (0.0%) | 6 (50.0%) |
| 30 to 34 Minutes | 3 (16.7%) | 0 (0.0%) |
| 35 to 39 Minutes | 3 (16.7%) | 0 (0.0%) |
| 40 to 44 Minutes | 1 (5.6%) | 0 (0.0%) |
| 45 to 59 Minutes | 0 (0.0%) | 2 (16.7%) |
| 60 to 89 Minutes | 1 (5.6%) | 0 (0.0%) |
| 90 or more Minutes | 0 (0.0%) | 0 (0.0%) |
Time of Departure to Work by Sex in Sharpsburg
The most frequent times of departure to work in Sharpsburg are 8:30 AM to 8:59 AM (7, 38.9%) for males and 6:30 AM to 6:59 AM (6, 50.0%) for females.
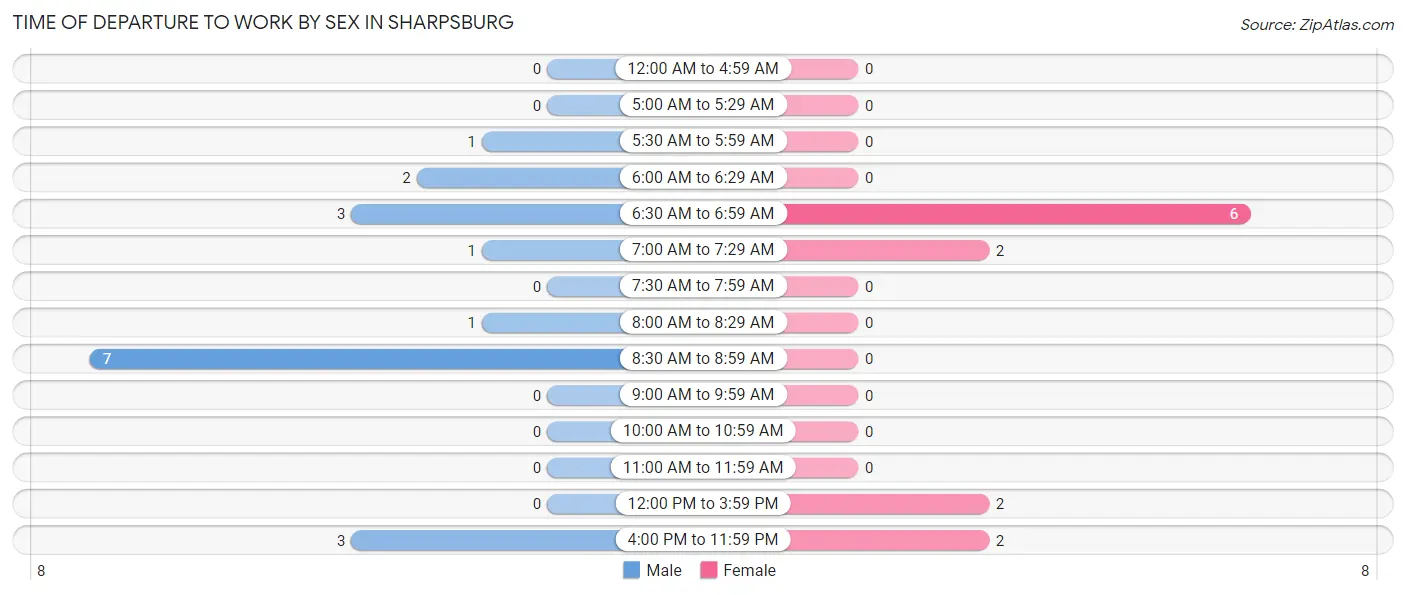
| Time of Departure | Male | Female |
| 12:00 AM to 4:59 AM | 0 (0.0%) | 0 (0.0%) |
| 5:00 AM to 5:29 AM | 0 (0.0%) | 0 (0.0%) |
| 5:30 AM to 5:59 AM | 1 (5.6%) | 0 (0.0%) |
| 6:00 AM to 6:29 AM | 2 (11.1%) | 0 (0.0%) |
| 6:30 AM to 6:59 AM | 3 (16.7%) | 6 (50.0%) |
| 7:00 AM to 7:29 AM | 1 (5.6%) | 2 (16.7%) |
| 7:30 AM to 7:59 AM | 0 (0.0%) | 0 (0.0%) |
| 8:00 AM to 8:29 AM | 1 (5.6%) | 0 (0.0%) |
| 8:30 AM to 8:59 AM | 7 (38.9%) | 0 (0.0%) |
| 9:00 AM to 9:59 AM | 0 (0.0%) | 0 (0.0%) |
| 10:00 AM to 10:59 AM | 0 (0.0%) | 0 (0.0%) |
| 11:00 AM to 11:59 AM | 0 (0.0%) | 0 (0.0%) |
| 12:00 PM to 3:59 PM | 0 (0.0%) | 2 (16.7%) |
| 4:00 PM to 11:59 PM | 3 (16.7%) | 2 (16.7%) |
| Total | 18 (100.0%) | 12 (100.0%) |
Housing Occupancy in Sharpsburg
Occupancy by Ownership in Sharpsburg
Of the total 29 dwellings in Sharpsburg, owner-occupied units account for 24 (82.8%), while renter-occupied units make up 5 (17.2%).
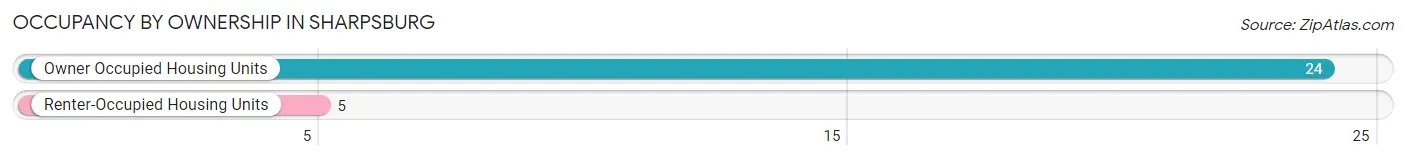
| Occupancy | # Housing Units | % Housing Units |
| Owner Occupied Housing Units | 24 | 82.8% |
| Renter-Occupied Housing Units | 5 | 17.2% |
| Total Occupied Housing Units | 29 | 100.0% |
Occupancy by Household Size in Sharpsburg
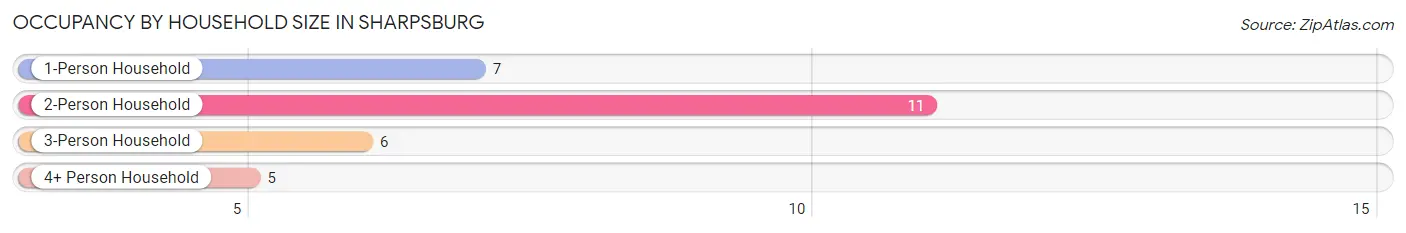
| Household Size | # Housing Units | % Housing Units |
| 1-Person Household | 7 | 24.1% |
| 2-Person Household | 11 | 37.9% |
| 3-Person Household | 6 | 20.7% |
| 4+ Person Household | 5 | 17.2% |
| Total Housing Units | 29 | 100.0% |
Occupancy by Ownership by Household Size in Sharpsburg
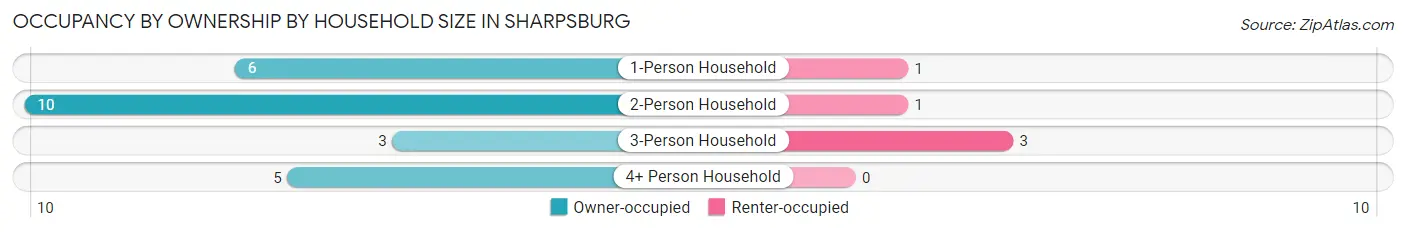
| Household Size | Owner-occupied | Renter-occupied |
| 1-Person Household | 6 (85.7%) | 1 (14.3%) |
| 2-Person Household | 10 (90.9%) | 1 (9.1%) |
| 3-Person Household | 3 (50.0%) | 3 (50.0%) |
| 4+ Person Household | 5 (100.0%) | 0 (0.0%) |
| Total Housing Units | 24 (82.8%) | 5 (17.2%) |
Occupancy by Educational Attainment in Sharpsburg
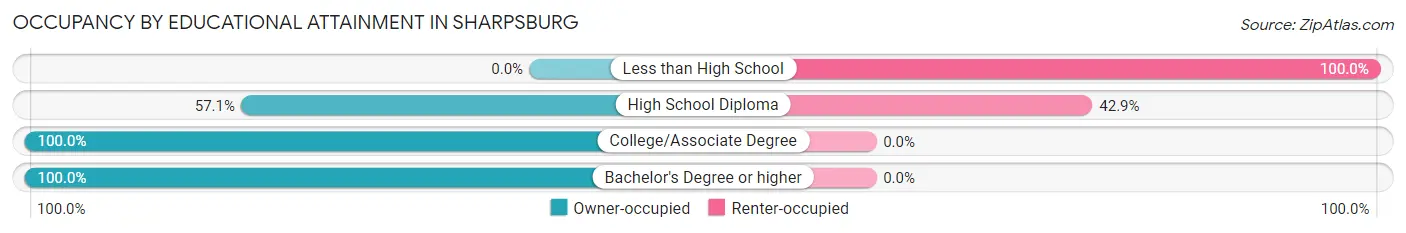
| Household Size | Owner-occupied | Renter-occupied |
| Less than High School | 0 (0.0%) | 2 (100.0%) |
| High School Diploma | 4 (57.1%) | 3 (42.9%) |
| College/Associate Degree | 17 (100.0%) | 0 (0.0%) |
| Bachelor's Degree or higher | 3 (100.0%) | 0 (0.0%) |
Occupancy by Age of Householder in Sharpsburg
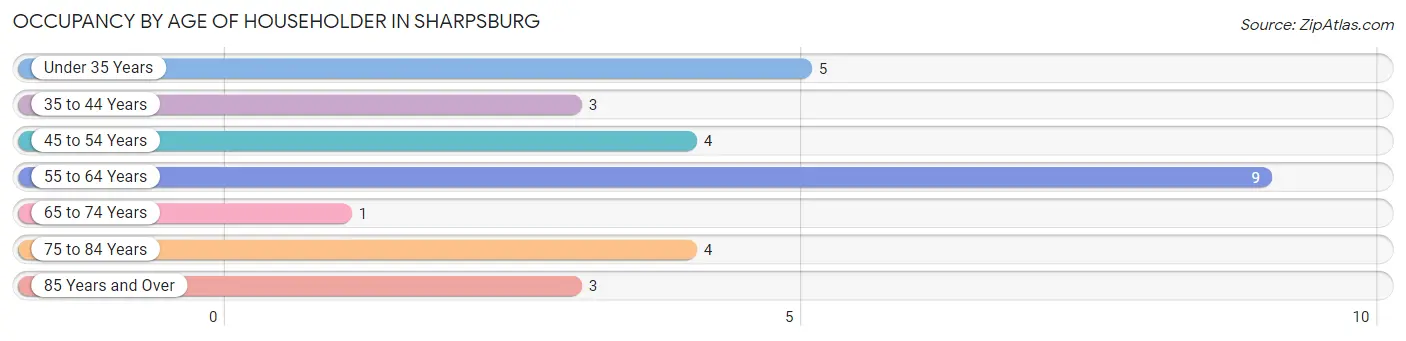
| Age Bracket | # Households | % Households |
| Under 35 Years | 5 | 17.2% |
| 35 to 44 Years | 3 | 10.3% |
| 45 to 54 Years | 4 | 13.8% |
| 55 to 64 Years | 9 | 31.0% |
| 65 to 74 Years | 1 | 3.5% |
| 75 to 84 Years | 4 | 13.8% |
| 85 Years and Over | 3 | 10.3% |
| Total | 29 | 100.0% |
Housing Finances in Sharpsburg
Median Income by Occupancy in Sharpsburg
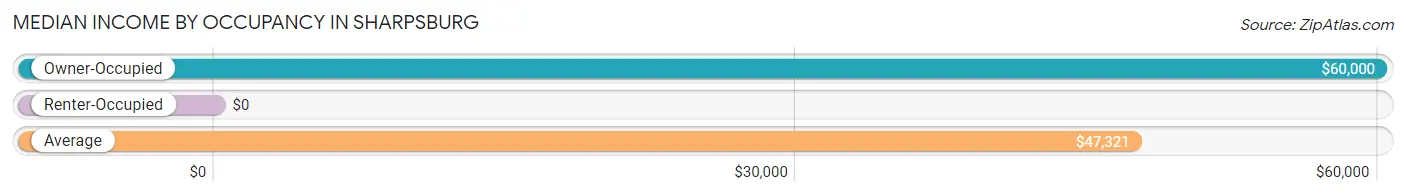
| Occupancy Type | # Households | Median Income |
| Owner-Occupied | 24 (82.8%) | $60,000 |
| Renter-Occupied | 5 (17.2%) | $0 |
| Average | 29 (100.0%) | $47,321 |
Occupancy by Householder Income Bracket in Sharpsburg
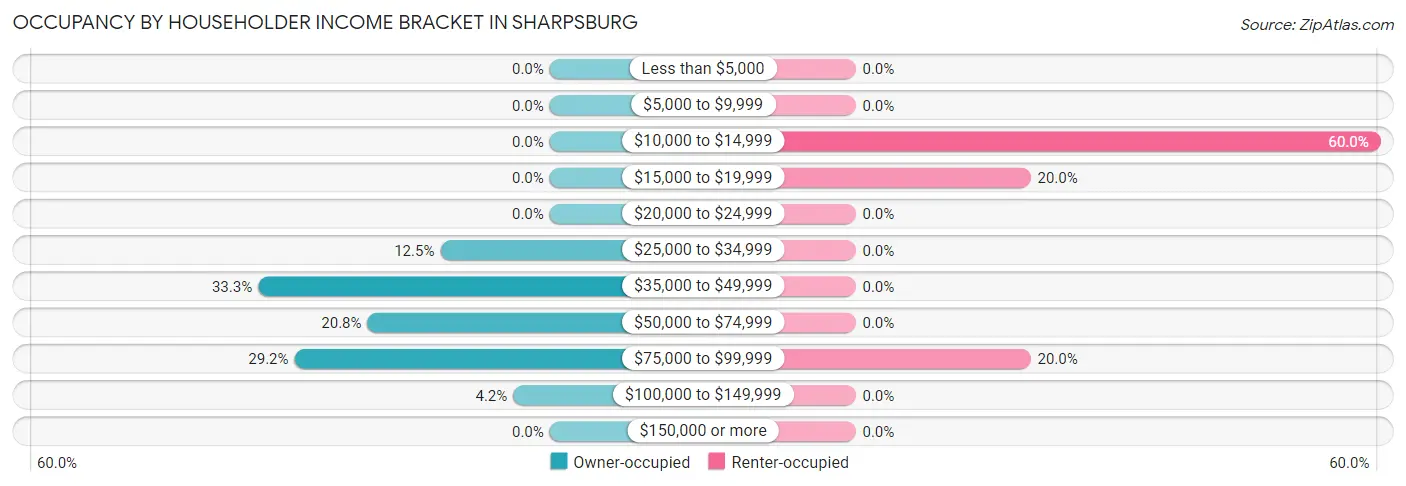
| Income Bracket | Owner-occupied | Renter-occupied |
| Less than $5,000 | 0 (0.0%) | 0 (0.0%) |
| $5,000 to $9,999 | 0 (0.0%) | 0 (0.0%) |
| $10,000 to $14,999 | 0 (0.0%) | 3 (60.0%) |
| $15,000 to $19,999 | 0 (0.0%) | 1 (20.0%) |
| $20,000 to $24,999 | 0 (0.0%) | 0 (0.0%) |
| $25,000 to $34,999 | 3 (12.5%) | 0 (0.0%) |
| $35,000 to $49,999 | 8 (33.3%) | 0 (0.0%) |
| $50,000 to $74,999 | 5 (20.8%) | 0 (0.0%) |
| $75,000 to $99,999 | 7 (29.2%) | 1 (20.0%) |
| $100,000 to $149,999 | 1 (4.2%) | 0 (0.0%) |
| $150,000 or more | 0 (0.0%) | 0 (0.0%) |
| Total | 24 (100.0%) | 5 (100.0%) |
Monthly Housing Cost Tiers in Sharpsburg
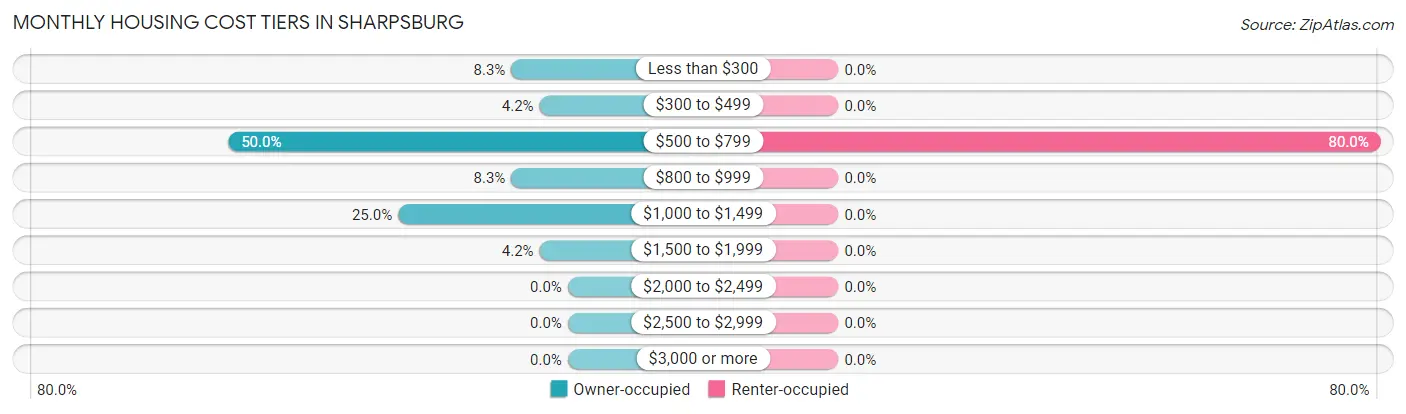
| Monthly Cost | Owner-occupied | Renter-occupied |
| Less than $300 | 2 (8.3%) | 0 (0.0%) |
| $300 to $499 | 1 (4.2%) | 0 (0.0%) |
| $500 to $799 | 12 (50.0%) | 4 (80.0%) |
| $800 to $999 | 2 (8.3%) | 0 (0.0%) |
| $1,000 to $1,499 | 6 (25.0%) | 0 (0.0%) |
| $1,500 to $1,999 | 1 (4.2%) | 0 (0.0%) |
| $2,000 to $2,499 | 0 (0.0%) | 0 (0.0%) |
| $2,500 to $2,999 | 0 (0.0%) | 0 (0.0%) |
| $3,000 or more | 0 (0.0%) | 0 (0.0%) |
| Total | 24 (100.0%) | 5 (100.0%) |
Physical Housing Characteristics in Sharpsburg
Housing Structures in Sharpsburg
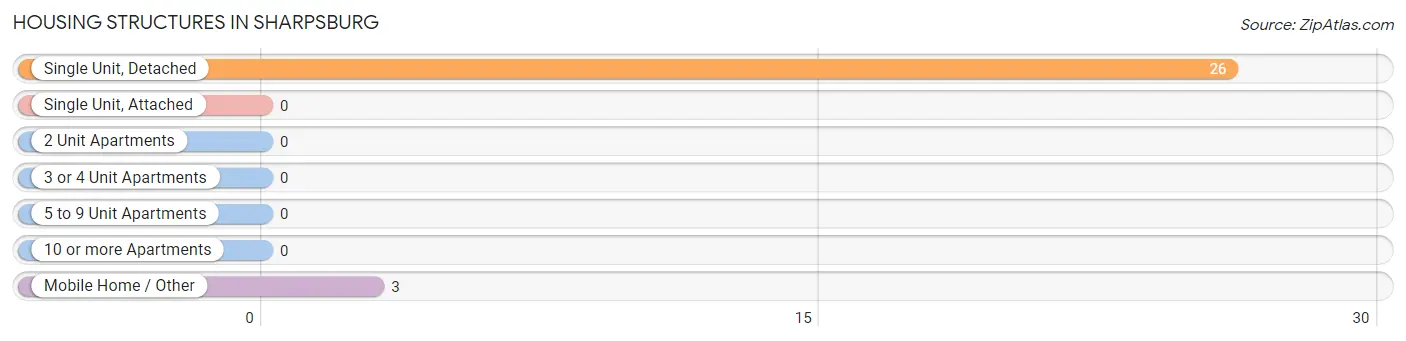
| Structure Type | # Housing Units | % Housing Units |
| Single Unit, Detached | 26 | 89.7% |
| Single Unit, Attached | 0 | 0.0% |
| 2 Unit Apartments | 0 | 0.0% |
| 3 or 4 Unit Apartments | 0 | 0.0% |
| 5 to 9 Unit Apartments | 0 | 0.0% |
| 10 or more Apartments | 0 | 0.0% |
| Mobile Home / Other | 3 | 10.3% |
| Total | 29 | 100.0% |
Housing Structures by Occupancy in Sharpsburg
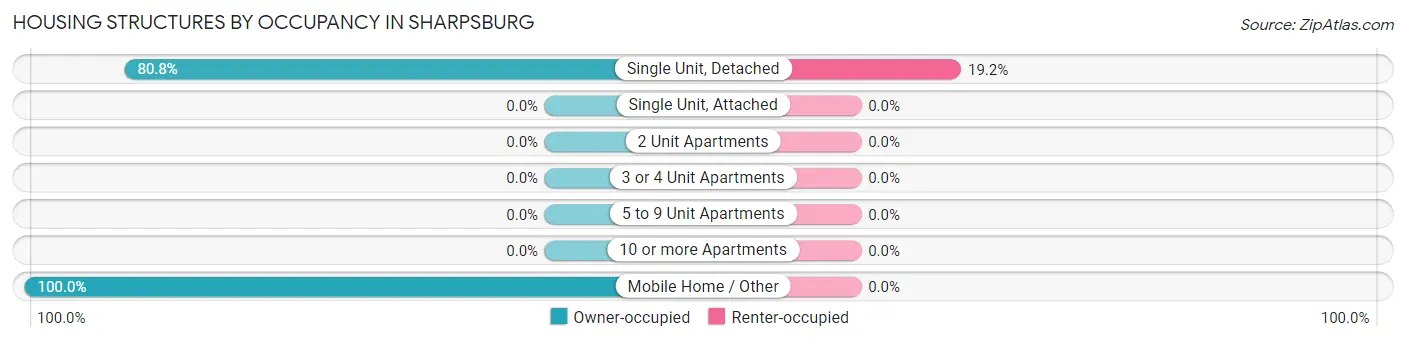
| Structure Type | Owner-occupied | Renter-occupied |
| Single Unit, Detached | 21 (80.8%) | 5 (19.2%) |
| Single Unit, Attached | 0 (0.0%) | 0 (0.0%) |
| 2 Unit Apartments | 0 (0.0%) | 0 (0.0%) |
| 3 or 4 Unit Apartments | 0 (0.0%) | 0 (0.0%) |
| 5 to 9 Unit Apartments | 0 (0.0%) | 0 (0.0%) |
| 10 or more Apartments | 0 (0.0%) | 0 (0.0%) |
| Mobile Home / Other | 3 (100.0%) | 0 (0.0%) |
| Total | 24 (82.8%) | 5 (17.2%) |
Housing Structures by Number of Rooms in Sharpsburg
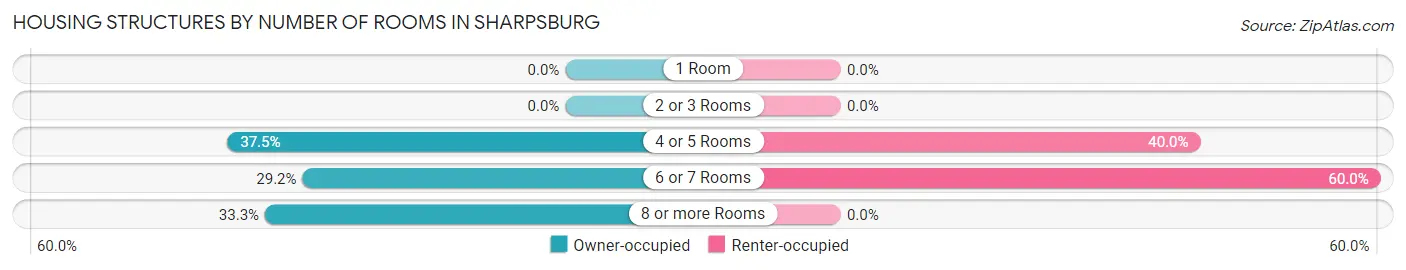
| Number of Rooms | Owner-occupied | Renter-occupied |
| 1 Room | 0 (0.0%) | 0 (0.0%) |
| 2 or 3 Rooms | 0 (0.0%) | 0 (0.0%) |
| 4 or 5 Rooms | 9 (37.5%) | 2 (40.0%) |
| 6 or 7 Rooms | 7 (29.2%) | 3 (60.0%) |
| 8 or more Rooms | 8 (33.3%) | 0 (0.0%) |
| Total | 24 (100.0%) | 5 (100.0%) |
Housing Structure by Heating Type in Sharpsburg
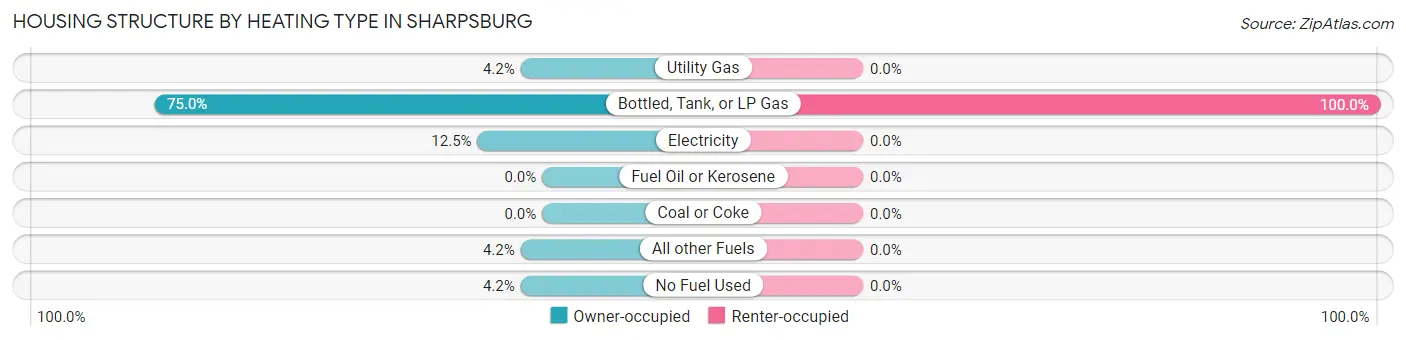
| Heating Type | Owner-occupied | Renter-occupied |
| Utility Gas | 1 (4.2%) | 0 (0.0%) |
| Bottled, Tank, or LP Gas | 18 (75.0%) | 5 (100.0%) |
| Electricity | 3 (12.5%) | 0 (0.0%) |
| Fuel Oil or Kerosene | 0 (0.0%) | 0 (0.0%) |
| Coal or Coke | 0 (0.0%) | 0 (0.0%) |
| All other Fuels | 1 (4.2%) | 0 (0.0%) |
| No Fuel Used | 1 (4.2%) | 0 (0.0%) |
| Total | 24 (100.0%) | 5 (100.0%) |
Household Vehicle Usage in Sharpsburg
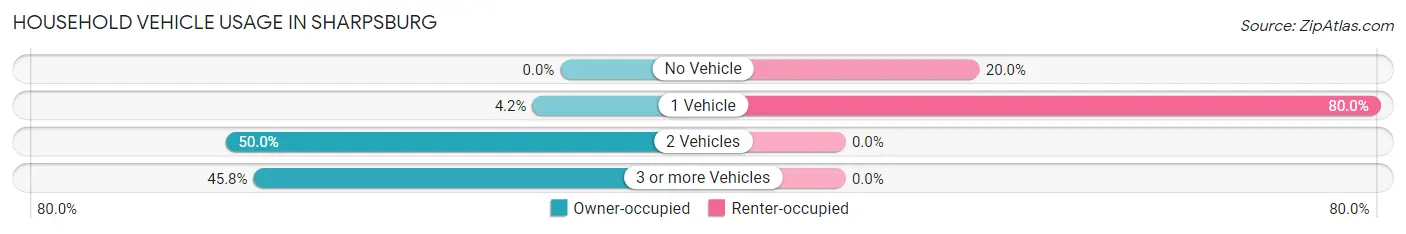
| Vehicles per Household | Owner-occupied | Renter-occupied |
| No Vehicle | 0 (0.0%) | 1 (20.0%) |
| 1 Vehicle | 1 (4.2%) | 4 (80.0%) |
| 2 Vehicles | 12 (50.0%) | 0 (0.0%) |
| 3 or more Vehicles | 11 (45.8%) | 0 (0.0%) |
| Total | 24 (100.0%) | 5 (100.0%) |
Real Estate & Mortgages in Sharpsburg
Real Estate and Mortgage Overview in Sharpsburg
| Characteristic | Without Mortgage | With Mortgage |
| Housing Units | 9 | 15 |
| Median Property Value | - | - |
| Median Household Income | $71,250 | $0 |
| Monthly Housing Costs | $550 | $0 |
| Real Estate Taxes | - | - |
Property Value by Mortgage Status in Sharpsburg
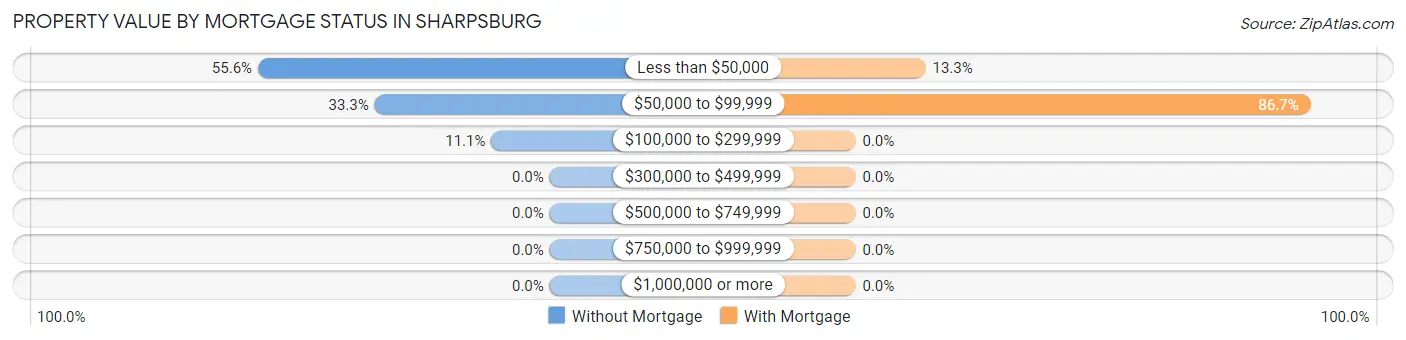
| Property Value | Without Mortgage | With Mortgage |
| Less than $50,000 | 5 (55.6%) | 2 (13.3%) |
| $50,000 to $99,999 | 3 (33.3%) | 13 (86.7%) |
| $100,000 to $299,999 | 1 (11.1%) | 0 (0.0%) |
| $300,000 to $499,999 | 0 (0.0%) | 0 (0.0%) |
| $500,000 to $749,999 | 0 (0.0%) | 0 (0.0%) |
| $750,000 to $999,999 | 0 (0.0%) | 0 (0.0%) |
| $1,000,000 or more | 0 (0.0%) | 0 (0.0%) |
| Total | 9 (100.0%) | 15 (100.0%) |
Household Income by Mortgage Status in Sharpsburg
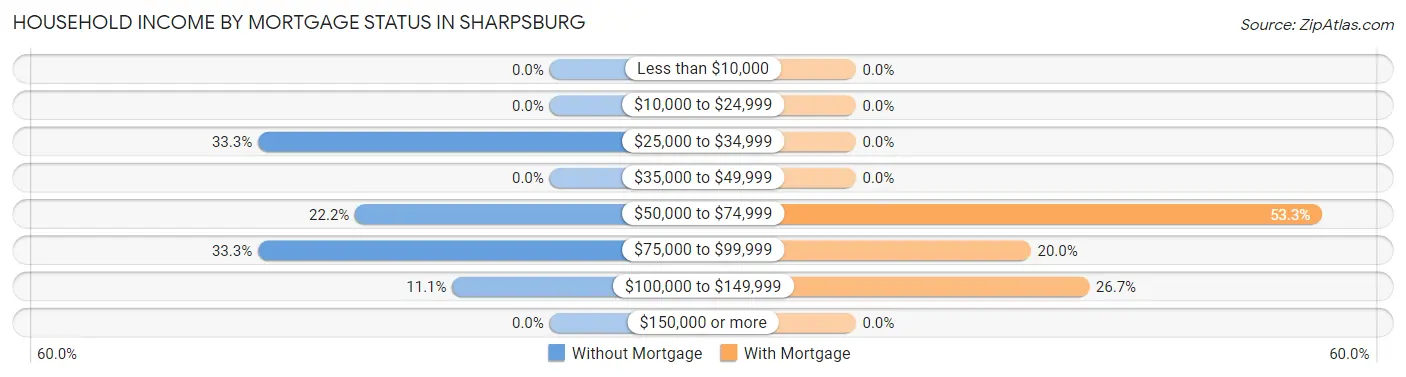
| Household Income | Without Mortgage | With Mortgage |
| Less than $10,000 | 0 (0.0%) | 0 (0.0%) |
| $10,000 to $24,999 | 0 (0.0%) | 0 (0.0%) |
| $25,000 to $34,999 | 3 (33.3%) | 0 (0.0%) |
| $35,000 to $49,999 | 0 (0.0%) | 0 (0.0%) |
| $50,000 to $74,999 | 2 (22.2%) | 8 (53.3%) |
| $75,000 to $99,999 | 3 (33.3%) | 3 (20.0%) |
| $100,000 to $149,999 | 1 (11.1%) | 4 (26.7%) |
| $150,000 or more | 0 (0.0%) | 0 (0.0%) |
| Total | 9 (100.0%) | 15 (100.0%) |
Property Value to Household Income Ratio in Sharpsburg
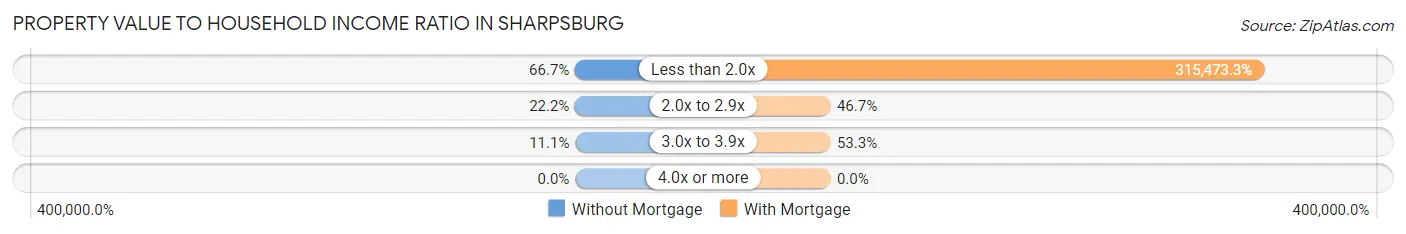
| Value-to-Income Ratio | Without Mortgage | With Mortgage |
| Less than 2.0x | 6 (66.7%) | 47,321 (315,473.3%) |
| 2.0x to 2.9x | 2 (22.2%) | 7 (46.7%) |
| 3.0x to 3.9x | 1 (11.1%) | 8 (53.3%) |
| 4.0x or more | 0 (0.0%) | 0 (0.0%) |
| Total | 9 (100.0%) | 15 (100.0%) |
Real Estate Taxes by Mortgage Status in Sharpsburg
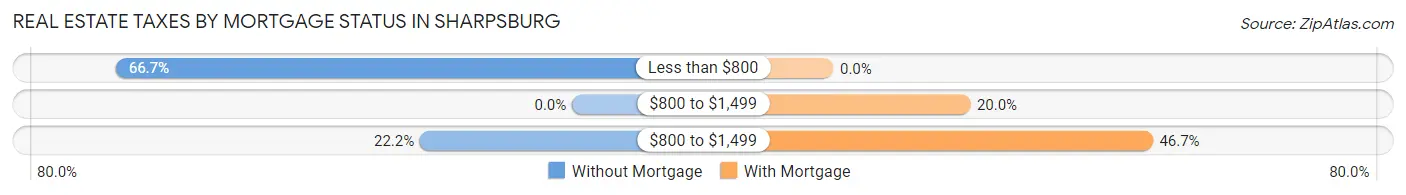
| Property Taxes | Without Mortgage | With Mortgage |
| Less than $800 | 6 (66.7%) | 0 (0.0%) |
| $800 to $1,499 | 0 (0.0%) | 3 (20.0%) |
| $800 to $1,499 | 2 (22.2%) | 7 (46.7%) |
| Total | 9 (100.0%) | 15 (100.0%) |
Health & Disability in Sharpsburg
Health Insurance Coverage by Age in Sharpsburg
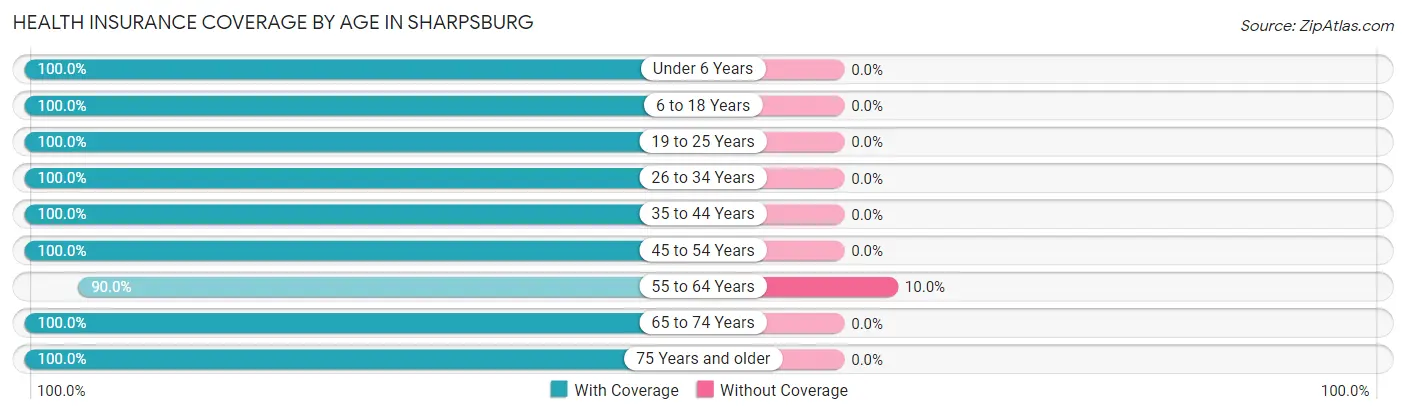
| Age Bracket | With Coverage | Without Coverage |
| Under 6 Years | 5 (100.0%) | 0 (0.0%) |
| 6 to 18 Years | 6 (100.0%) | 0 (0.0%) |
| 19 to 25 Years | 1 (100.0%) | 0 (0.0%) |
| 26 to 34 Years | 11 (100.0%) | 0 (0.0%) |
| 35 to 44 Years | 6 (100.0%) | 0 (0.0%) |
| 45 to 54 Years | 25 (100.0%) | 0 (0.0%) |
| 55 to 64 Years | 9 (90.0%) | 1 (10.0%) |
| 65 to 74 Years | 1 (100.0%) | 0 (0.0%) |
| 75 Years and older | 7 (100.0%) | 0 (0.0%) |
| Total | 71 (98.6%) | 1 (1.4%) |
Health Insurance Coverage by Citizenship Status in Sharpsburg
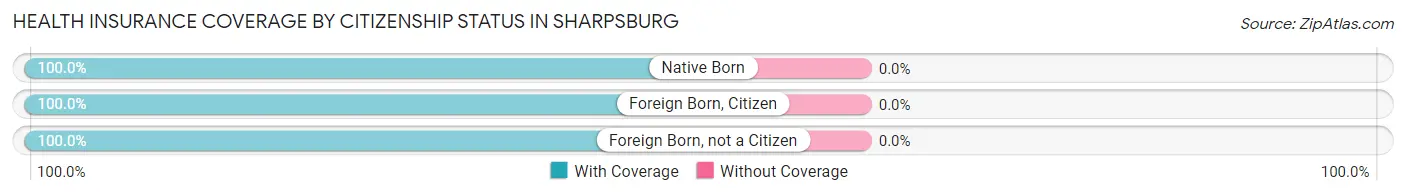
| Citizenship Status | With Coverage | Without Coverage |
| Native Born | 5 (100.0%) | 0 (0.0%) |
| Foreign Born, Citizen | 6 (100.0%) | 0 (0.0%) |
| Foreign Born, not a Citizen | 1 (100.0%) | 0 (0.0%) |
Health Insurance Coverage by Household Income in Sharpsburg
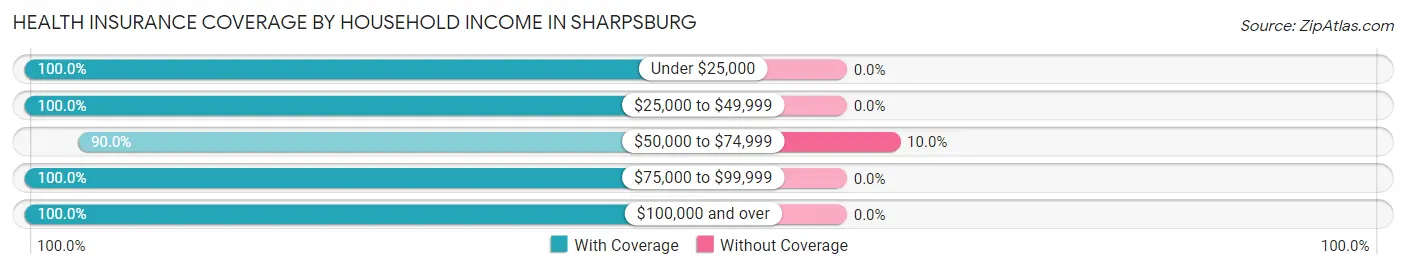
| Household Income | With Coverage | Without Coverage |
| Under $25,000 | 7 (100.0%) | 0 (0.0%) |
| $25,000 to $49,999 | 32 (100.0%) | 0 (0.0%) |
| $50,000 to $74,999 | 9 (90.0%) | 1 (10.0%) |
| $75,000 to $99,999 | 22 (100.0%) | 0 (0.0%) |
| $100,000 and over | 1 (100.0%) | 0 (0.0%) |
Public vs Private Health Insurance Coverage by Age in Sharpsburg
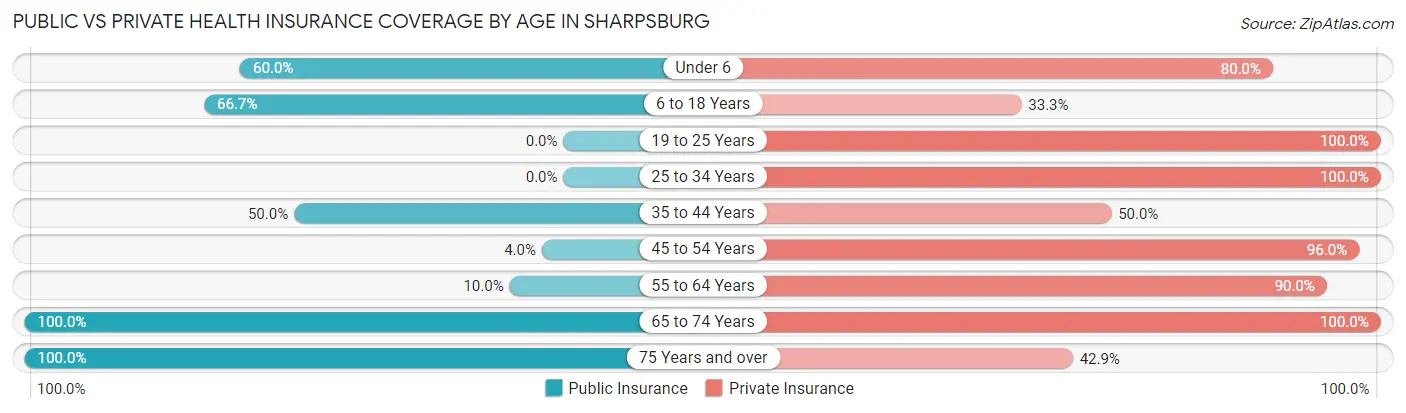
| Age Bracket | Public Insurance | Private Insurance |
| Under 6 | 3 (60.0%) | 4 (80.0%) |
| 6 to 18 Years | 4 (66.7%) | 2 (33.3%) |
| 19 to 25 Years | 0 (0.0%) | 1 (100.0%) |
| 25 to 34 Years | 0 (0.0%) | 11 (100.0%) |
| 35 to 44 Years | 3 (50.0%) | 3 (50.0%) |
| 45 to 54 Years | 1 (4.0%) | 24 (96.0%) |
| 55 to 64 Years | 1 (10.0%) | 9 (90.0%) |
| 65 to 74 Years | 1 (100.0%) | 1 (100.0%) |
| 75 Years and over | 7 (100.0%) | 3 (42.9%) |
| Total | 20 (27.8%) | 58 (80.6%) |
Disability Status by Sex by Age in Sharpsburg
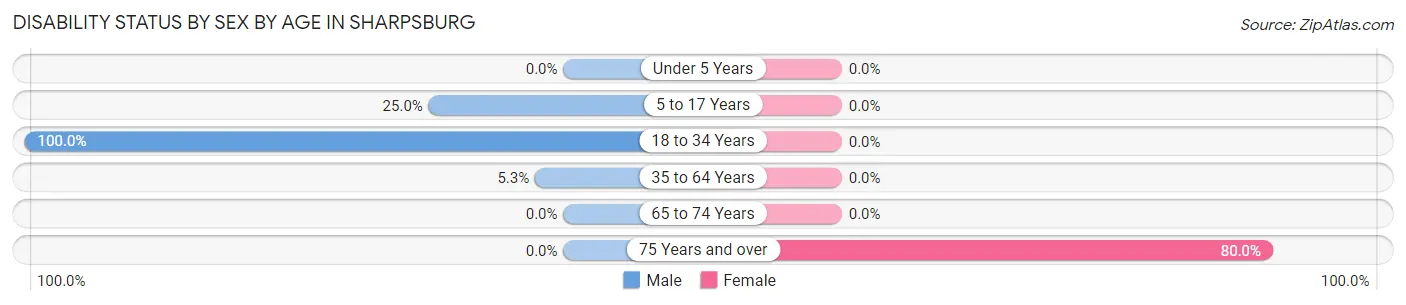
| Age Bracket | Male | Female |
| Under 5 Years | 0 (0.0%) | 0 (0.0%) |
| 5 to 17 Years | 1 (25.0%) | 0 (0.0%) |
| 18 to 34 Years | 6 (100.0%) | 0 (0.0%) |
| 35 to 64 Years | 1 (5.3%) | 0 (0.0%) |
| 65 to 74 Years | 0 (0.0%) | 0 (0.0%) |
| 75 Years and over | 0 (0.0%) | 4 (80.0%) |
Disability Class by Sex by Age in Sharpsburg
Disability Class: Hearing Difficulty
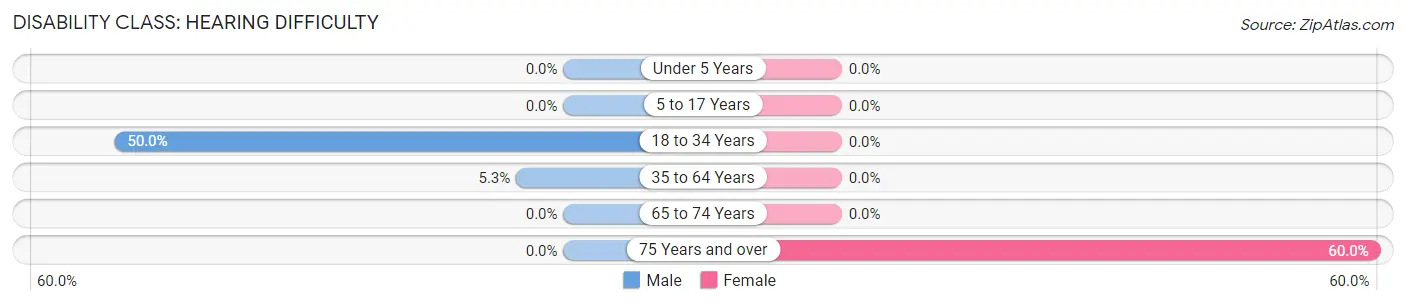
| Age Bracket | Male | Female |
| Under 5 Years | 0 (0.0%) | 0 (0.0%) |
| 5 to 17 Years | 0 (0.0%) | 0 (0.0%) |
| 18 to 34 Years | 3 (50.0%) | 0 (0.0%) |
| 35 to 64 Years | 1 (5.3%) | 0 (0.0%) |
| 65 to 74 Years | 0 (0.0%) | 0 (0.0%) |
| 75 Years and over | 0 (0.0%) | 3 (60.0%) |
Disability Class: Vision Difficulty
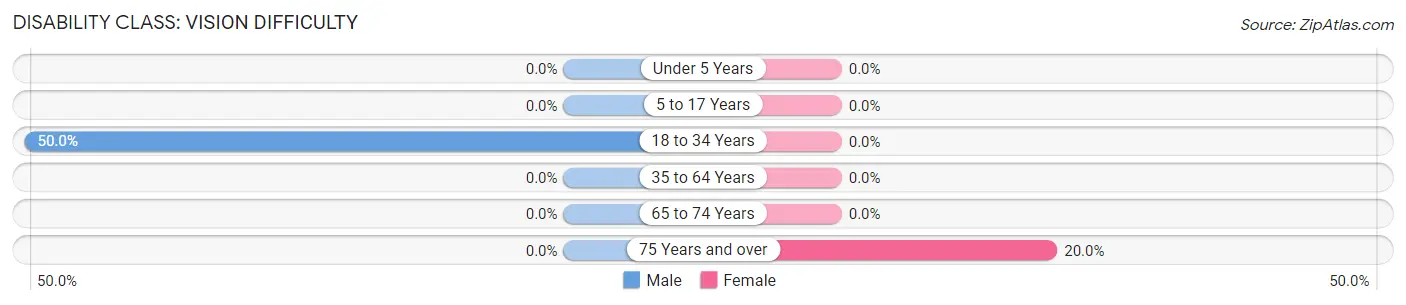
| Age Bracket | Male | Female |
| Under 5 Years | 0 (0.0%) | 0 (0.0%) |
| 5 to 17 Years | 0 (0.0%) | 0 (0.0%) |
| 18 to 34 Years | 3 (50.0%) | 0 (0.0%) |
| 35 to 64 Years | 0 (0.0%) | 0 (0.0%) |
| 65 to 74 Years | 0 (0.0%) | 0 (0.0%) |
| 75 Years and over | 0 (0.0%) | 1 (20.0%) |
Disability Class: Cognitive Difficulty

| Age Bracket | Male | Female |
| 5 to 17 Years | 1 (25.0%) | 0 (0.0%) |
| 18 to 34 Years | 0 (0.0%) | 0 (0.0%) |
| 35 to 64 Years | 0 (0.0%) | 0 (0.0%) |
| 65 to 74 Years | 0 (0.0%) | 0 (0.0%) |
| 75 Years and over | 0 (0.0%) | 0 (0.0%) |
Disability Class: Ambulatory Difficulty
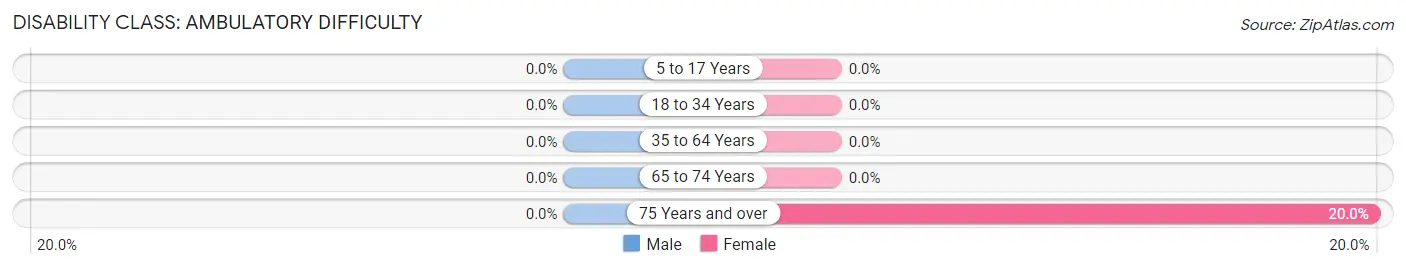
| Age Bracket | Male | Female |
| 5 to 17 Years | 0 (0.0%) | 0 (0.0%) |
| 18 to 34 Years | 0 (0.0%) | 0 (0.0%) |
| 35 to 64 Years | 0 (0.0%) | 0 (0.0%) |
| 65 to 74 Years | 0 (0.0%) | 0 (0.0%) |
| 75 Years and over | 0 (0.0%) | 1 (20.0%) |
Disability Class: Self-Care Difficulty
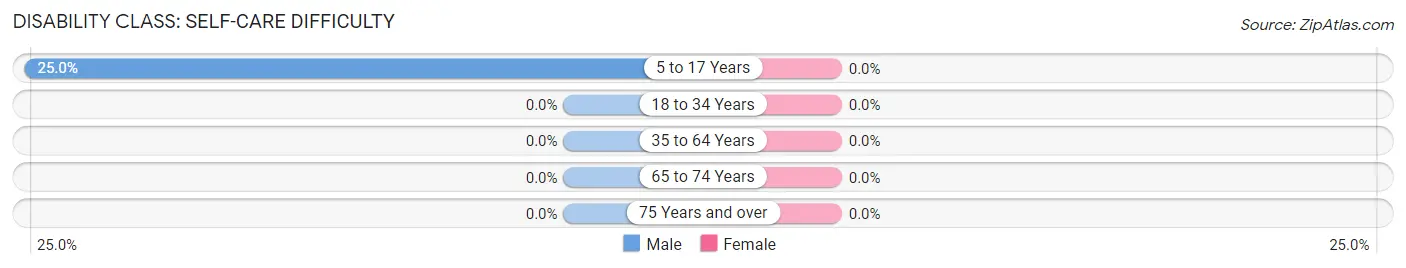
| Age Bracket | Male | Female |
| 5 to 17 Years | 1 (25.0%) | 0 (0.0%) |
| 18 to 34 Years | 0 (0.0%) | 0 (0.0%) |
| 35 to 64 Years | 0 (0.0%) | 0 (0.0%) |
| 65 to 74 Years | 0 (0.0%) | 0 (0.0%) |
| 75 Years and over | 0 (0.0%) | 0 (0.0%) |
Technology Access in Sharpsburg
Computing Device Access in Sharpsburg
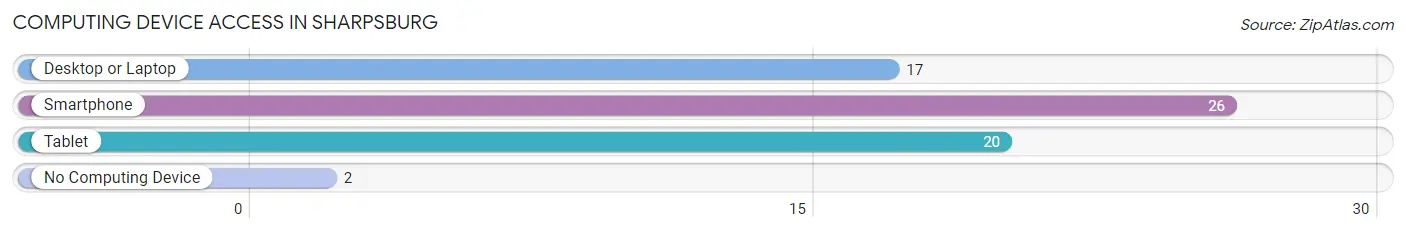
| Device Type | # Households | % Households |
| Desktop or Laptop | 17 | 58.6% |
| Smartphone | 26 | 89.7% |
| Tablet | 20 | 69.0% |
| No Computing Device | 2 | 6.9% |
| Total | 29 | 100.0% |
Internet Access in Sharpsburg
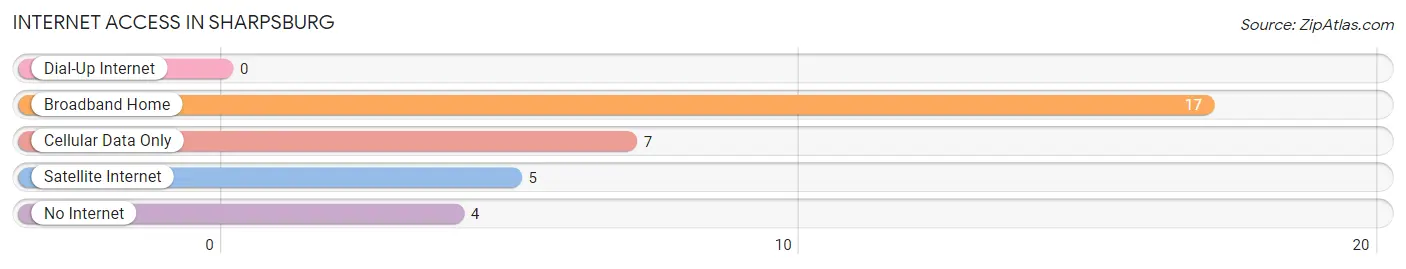
| Internet Type | # Households | % Households |
| Dial-Up Internet | 0 | 0.0% |
| Broadband Home | 17 | 58.6% |
| Cellular Data Only | 7 | 24.1% |
| Satellite Internet | 5 | 17.2% |
| No Internet | 4 | 13.8% |
| Total | 29 | 100.0% |
Sharpsburg Summary
Sharpburg, Iowa is a small town located in the northwest corner of the state, in the county of Harrison. It is situated on the banks of the Little Sioux River, and is home to a population of just over 500 people. The town was founded in 1856, and has a rich history of farming, industry, and small-town life.
Geography
Sharpburg is located in the northwest corner of Iowa, in the county of Harrison. It is situated on the banks of the Little Sioux River, and is surrounded by rolling hills and farmland. The town is located approximately 30 miles from the state capital of Des Moines, and is within easy driving distance of Omaha, Nebraska. The town is also close to the Missouri River, which provides a great opportunity for fishing and other recreational activities.
The town is located in a temperate climate, with hot summers and cold winters. The average temperature in the summer is around 80 degrees Fahrenheit, and the average temperature in the winter is around 20 degrees Fahrenheit. The town receives an average of 40 inches of precipitation each year, with most of it falling in the spring and summer months.
Economy
Sharpburg’s economy is largely based on agriculture and small businesses. The town is home to several small businesses, including a grocery store, a hardware store, a restaurant, and a few other small shops. The town also has a few larger employers, such as a manufacturing plant and a trucking company.
The town is also home to a number of farms, which produce a variety of crops, including corn, soybeans, and hay. The town also has a few small-scale livestock operations, which produce beef, pork, and poultry.
Demographics
As of the 2010 census, Sharpburg had a population of 514 people. The town is predominantly white, with a small minority population of African Americans, Hispanics, and Native Americans. The median age of the population is 44 years old, and the median household income is $41,250.
The town is home to a number of churches, including the First Baptist Church, the United Methodist Church, and the Church of the Nazarene. The town also has a public library, a post office, and a few other small businesses.
History
Sharpburg was founded in 1856 by a group of settlers from Ohio. The town was originally called “Sharp’s Town”, after the first settler, John Sharp. The town was officially incorporated in 1868, and the name was changed to Sharpburg.
The town grew slowly over the years, and by the early 1900s, it had become a thriving agricultural community. The town was home to several small businesses, including a grocery store, a hardware store, and a few other small shops.
In the late 1950s, the town began to experience a decline in population, as many of the younger residents moved away to larger cities. The town’s population has remained relatively stable since then, and it continues to be a small, rural community.
Common Questions
What is Per Capita Income in Sharpsburg?
Per Capita income in Sharpsburg is $23,388.
What is the Median Family Income in Sharpsburg?
Median Family Income in Sharpsburg is $47,143.
What is the Median Household income in Sharpsburg?
Median Household Income in Sharpsburg is $47,321.
What is Inequality or Gini Index in Sharpsburg?
Inequality or Gini Index in Sharpsburg is 0.27.
What is the Total Population of Sharpsburg?
Total Population of Sharpsburg is 72.
What is the Total Male Population of Sharpsburg?
Total Male Population of Sharpsburg is 36.
What is the Total Female Population of Sharpsburg?
Total Female Population of Sharpsburg is 36.
What is the Ratio of Males per 100 Females in Sharpsburg?
There are 100.00 Males per 100 Females in Sharpsburg.
What is the Ratio of Females per 100 Males in Sharpsburg?
There are 100.00 Females per 100 Males in Sharpsburg.
What is the Median Population Age in Sharpsburg?
Median Population Age in Sharpsburg is 53.5 Years.
What is the Average Family Size in Sharpsburg
Average Family Size in Sharpsburg is 2.9 People.
What is the Average Household Size in Sharpsburg
Average Household Size in Sharpsburg is 2.5 People.
How Large is the Labor Force in Sharpsburg?
There are 34 People in the Labor Forcein in Sharpsburg.
What is the Percentage of People in the Labor Force in Sharpsburg?
55.7% of People are in the Labor Force in Sharpsburg.
What is the Unemployment Rate in Sharpsburg?
Unemployment Rate in Sharpsburg is 2.9%.