Salem, IA Map & Demographics
Salem Map
Salem Overview
$23,549
PER CAPITA INCOME
$61,944
AVG FAMILY INCOME
$53,125
AVG HOUSEHOLD INCOME
15.5%
WAGE / INCOME GAP [ % ]
84.5¢/ $1
WAGE / INCOME GAP [ $ ]
0.34
INEQUALITY / GINI INDEX
338
TOTAL POPULATION
164
MALE POPULATION
174
FEMALE POPULATION
94.25
MALES / 100 FEMALES
106.10
FEMALES / 100 MALES
50.4
MEDIAN AGE
2.9
AVG FAMILY SIZE
2.4
AVG HOUSEHOLD SIZE
147
LABOR FORCE [ PEOPLE ]
53.5%
PERCENT IN LABOR FORCE
2.1%
UNEMPLOYMENT RATE
Salem Zip Codes
Salem Area Codes
Income in Salem
Income Overview in Salem
Per Capita Income in Salem is $23,549, while median incomes of families and households are $61,944 and $53,125 respectively.
| Characteristic | Number | Measure |
| Per Capita Income | 338 | $23,549 |
| Median Family Income | 96 | $61,944 |
| Mean Family Income | 96 | $61,147 |
| Median Household Income | 141 | $53,125 |
| Mean Household Income | 141 | $53,837 |
| Income Deficit | 96 | $0 |
| Wage / Income Gap (%) | 338 | 15.50% |
| Wage / Income Gap ($) | 338 | 84.50¢ per $1 |
| Gini / Inequality Index | 338 | 0.34 |
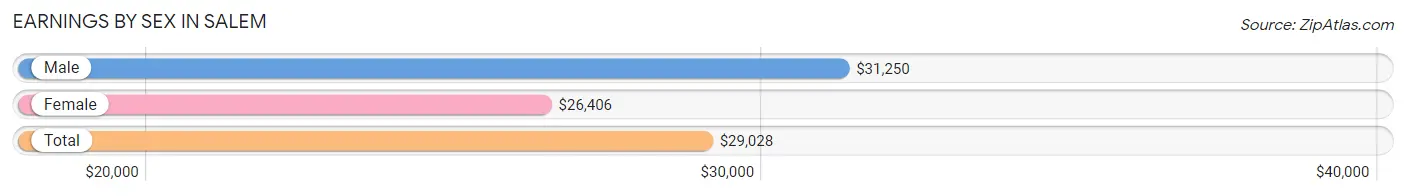
Earnings by Sex in Salem
Average Earnings in Salem are $29,028, $31,250 for men and $26,406 for women, a difference of 15.5%.
| Sex | Number | Average Earnings |
| Male | 77 (46.9%) | $31,250 |
| Female | 87 (53.0%) | $26,406 |
| Total | 164 (100.0%) | $29,028 |
Earnings by Sex by Income Bracket in Salem
The most common earnings brackets in Salem are $25,000 to $29,999 for men (20 | 26.0%) and $2,499 or less for women (12 | 13.8%).
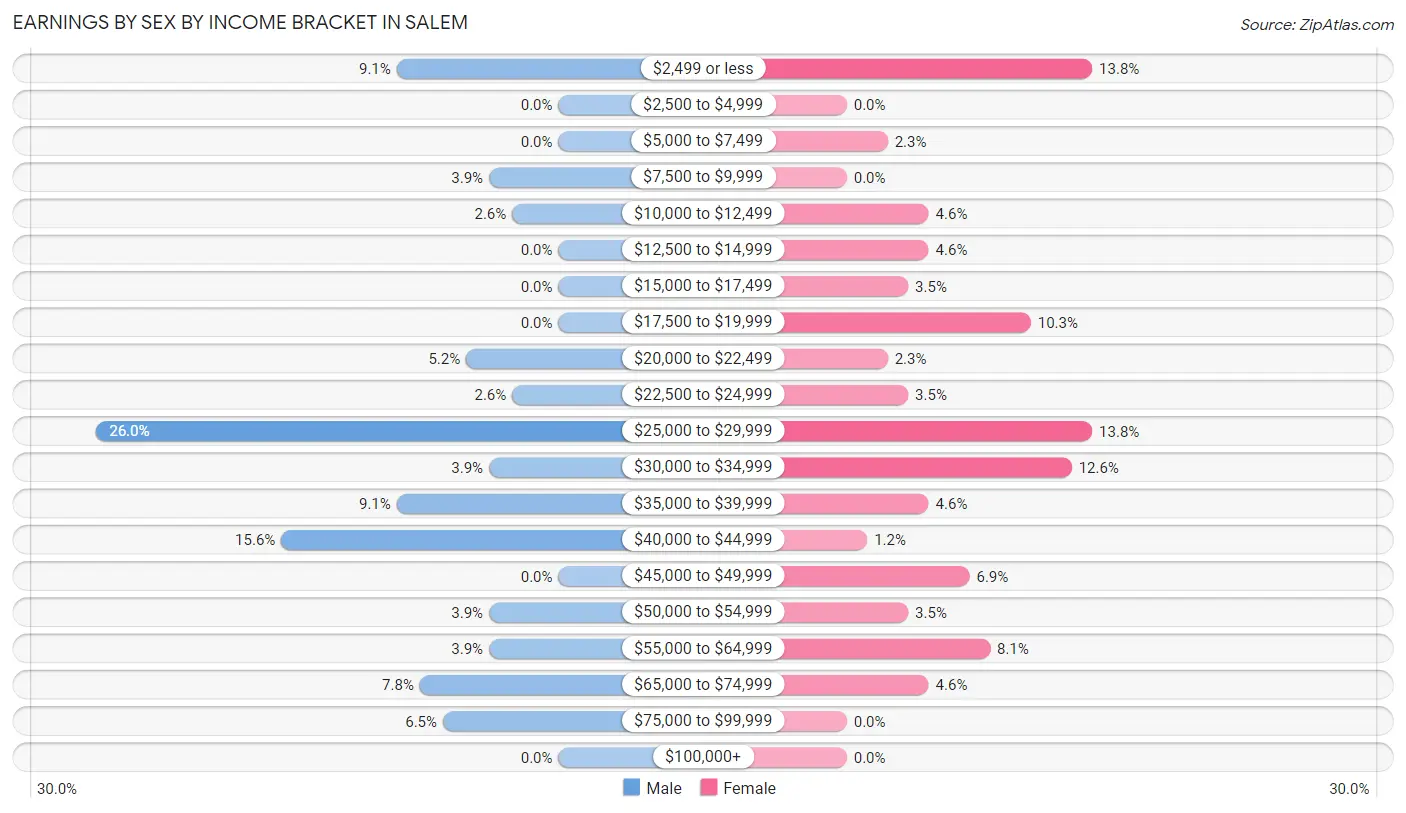
| Income | Male | Female |
| $2,499 or less | 7 (9.1%) | 12 (13.8%) |
| $2,500 to $4,999 | 0 (0.0%) | 0 (0.0%) |
| $5,000 to $7,499 | 0 (0.0%) | 2 (2.3%) |
| $7,500 to $9,999 | 3 (3.9%) | 0 (0.0%) |
| $10,000 to $12,499 | 2 (2.6%) | 4 (4.6%) |
| $12,500 to $14,999 | 0 (0.0%) | 4 (4.6%) |
| $15,000 to $17,499 | 0 (0.0%) | 3 (3.5%) |
| $17,500 to $19,999 | 0 (0.0%) | 9 (10.3%) |
| $20,000 to $22,499 | 4 (5.2%) | 2 (2.3%) |
| $22,500 to $24,999 | 2 (2.6%) | 3 (3.5%) |
| $25,000 to $29,999 | 20 (26.0%) | 12 (13.8%) |
| $30,000 to $34,999 | 3 (3.9%) | 11 (12.6%) |
| $35,000 to $39,999 | 7 (9.1%) | 4 (4.6%) |
| $40,000 to $44,999 | 12 (15.6%) | 1 (1.1%) |
| $45,000 to $49,999 | 0 (0.0%) | 6 (6.9%) |
| $50,000 to $54,999 | 3 (3.9%) | 3 (3.5%) |
| $55,000 to $64,999 | 3 (3.9%) | 7 (8.1%) |
| $65,000 to $74,999 | 6 (7.8%) | 4 (4.6%) |
| $75,000 to $99,999 | 5 (6.5%) | 0 (0.0%) |
| $100,000+ | 0 (0.0%) | 0 (0.0%) |
| Total | 77 (100.0%) | 87 (100.0%) |
Earnings by Sex by Educational Attainment in Salem
Average earnings in Salem are $36,500 for men and $28,125 for women, a difference of 23.0%. Men with an educational attainment of college or associate's degree enjoy the highest average annual earnings of $38,125, while those with less than high school education earn the least with $26,250. Women with an educational attainment of college or associate's degree earn the most with the average annual earnings of $30,000, while those with high school diploma education have the smallest earnings of $26,563.
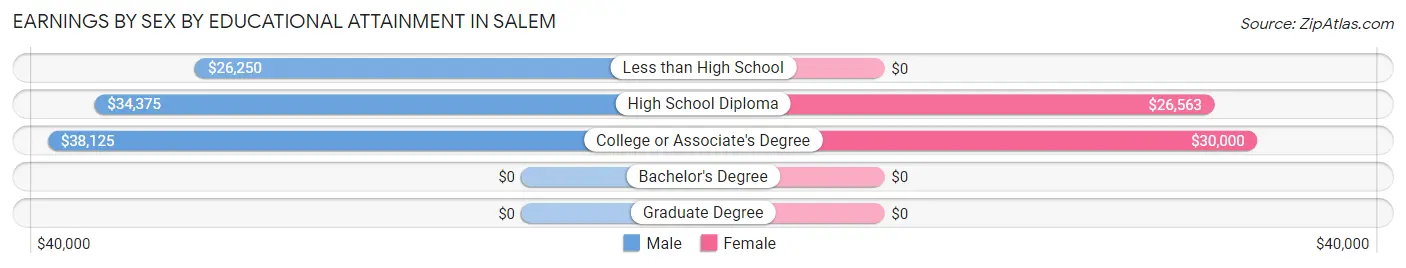
| Educational Attainment | Male Income | Female Income |
| Less than High School | $26,250 | $0 |
| High School Diploma | $34,375 | $26,563 |
| College or Associate's Degree | $38,125 | $30,000 |
| Bachelor's Degree | - | - |
| Graduate Degree | - | - |
| Total | $36,500 | $28,125 |
Family Income in Salem
Family Income Brackets in Salem
According to the Salem family income data, there are 24 families falling into the $50,000 to $74,999 income range, which is the most common income bracket and makes up 25.0% of all families.
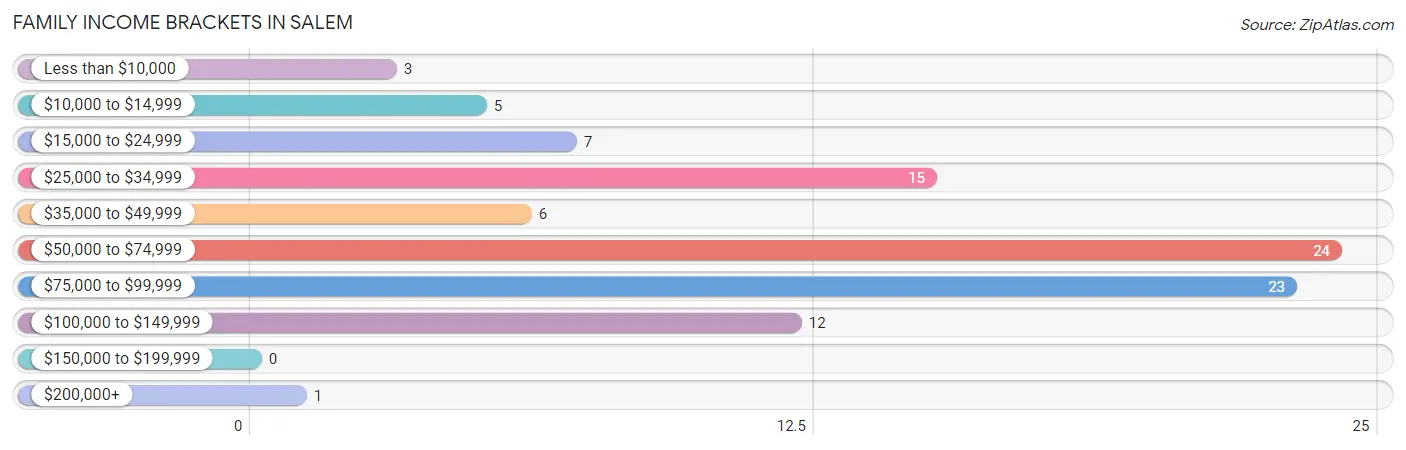
| Income Bracket | # Families | % Families |
| Less than $10,000 | 3 | 3.1% |
| $10,000 to $14,999 | 5 | 5.2% |
| $15,000 to $24,999 | 7 | 7.3% |
| $25,000 to $34,999 | 15 | 15.6% |
| $35,000 to $49,999 | 6 | 6.3% |
| $50,000 to $74,999 | 24 | 25.0% |
| $75,000 to $99,999 | 23 | 24.0% |
| $100,000 to $149,999 | 12 | 12.5% |
| $150,000 to $199,999 | 0 | 0.0% |
| $200,000+ | 1 | 1.0% |
Family Income by Famaliy Size in Salem
2-person families (71 | 74.0%) account for the highest median family income in Salem with $61,406 per family, while 2-person families (71 | 74.0%) have the highest median income of $30,703 per family member.
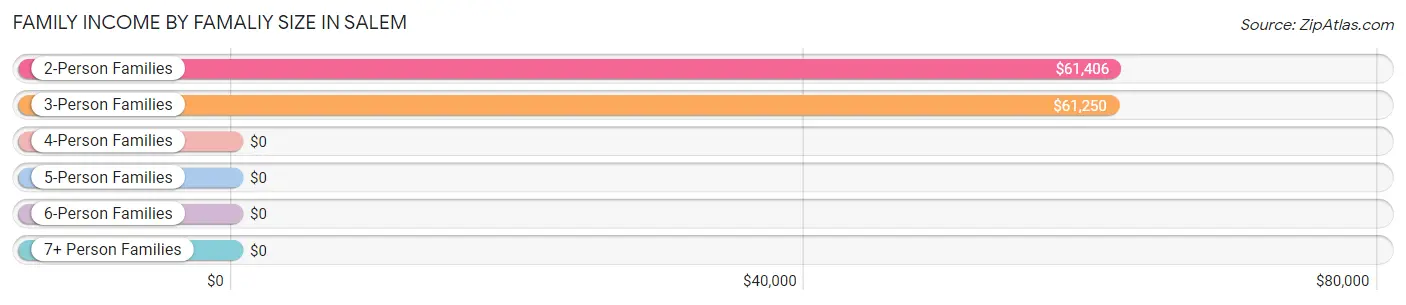
| Income Bracket | # Families | Median Income |
| 2-Person Families | 71 (74.0%) | $61,406 |
| 3-Person Families | 9 (9.4%) | $61,250 |
| 4-Person Families | 6 (6.2%) | $0 |
| 5-Person Families | 4 (4.2%) | $0 |
| 6-Person Families | 5 (5.2%) | $0 |
| 7+ Person Families | 1 (1.0%) | $0 |
| Total | 96 (100.0%) | $61,944 |
Family Income by Number of Earners in Salem
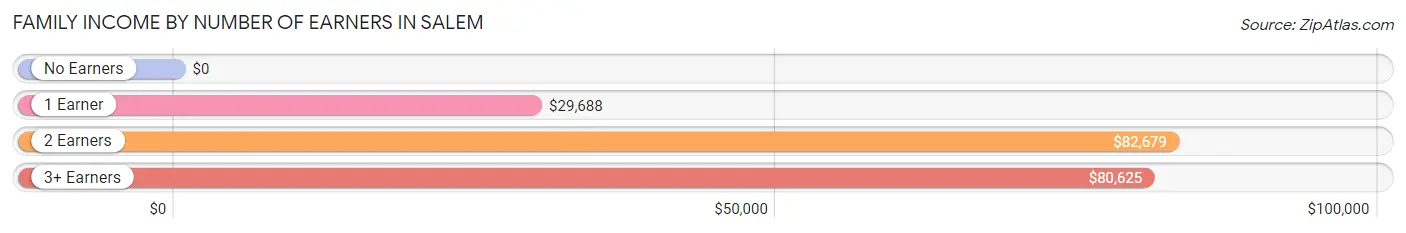
| Number of Earners | # Families | Median Income |
| No Earners | 26 (27.1%) | $0 |
| 1 Earner | 26 (27.1%) | $29,688 |
| 2 Earners | 39 (40.6%) | $82,679 |
| 3+ Earners | 5 (5.2%) | $80,625 |
| Total | 96 (100.0%) | $61,944 |
Household Income in Salem
Household Income Brackets in Salem
With 35 households falling in the category, the $50,000 to $74,999 income range is the most frequent in Salem, accounting for 24.8% of all households.
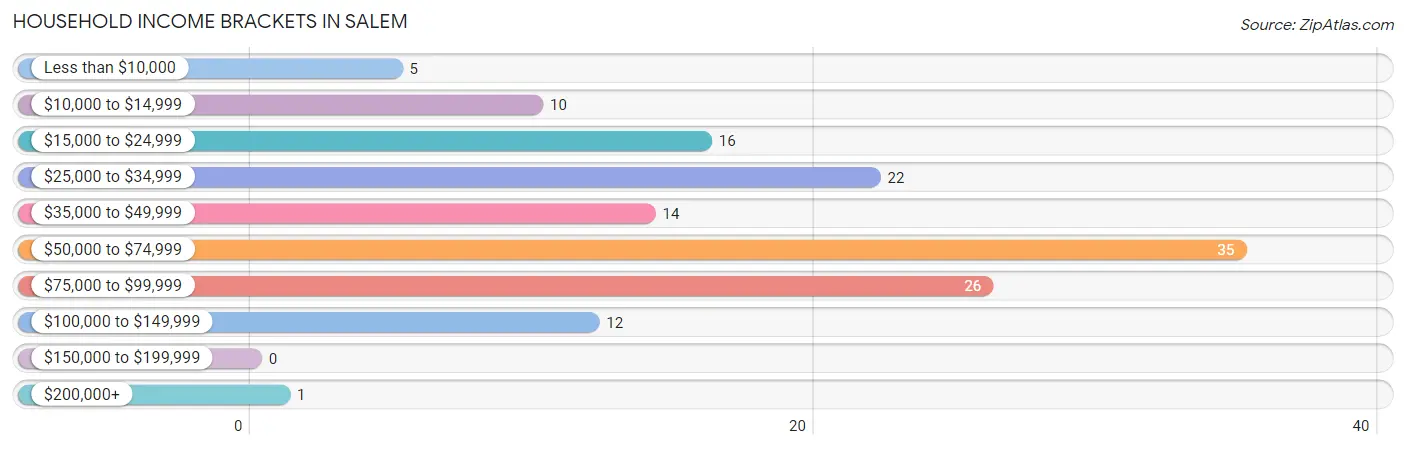
| Income Bracket | # Households | % Households |
| Less than $10,000 | 5 | 3.5% |
| $10,000 to $14,999 | 10 | 7.1% |
| $15,000 to $24,999 | 16 | 11.3% |
| $25,000 to $34,999 | 22 | 15.6% |
| $35,000 to $49,999 | 14 | 9.9% |
| $50,000 to $74,999 | 35 | 24.8% |
| $75,000 to $99,999 | 26 | 18.4% |
| $100,000 to $149,999 | 12 | 8.5% |
| $150,000 to $199,999 | 0 | 0.0% |
| $200,000+ | 1 | 0.7% |
Household Income by Householder Age in Salem
The median household income in Salem is $53,125, with the highest median household income of $61,250 found in the 25 to 44 years age bracket for the primary householder. A total of 36 households (25.5%) fall into this category. Meanwhile, the 15 to 24 years age bracket for the primary householder has the lowest median household income of $0, with 1 households (0.7%) in this group.
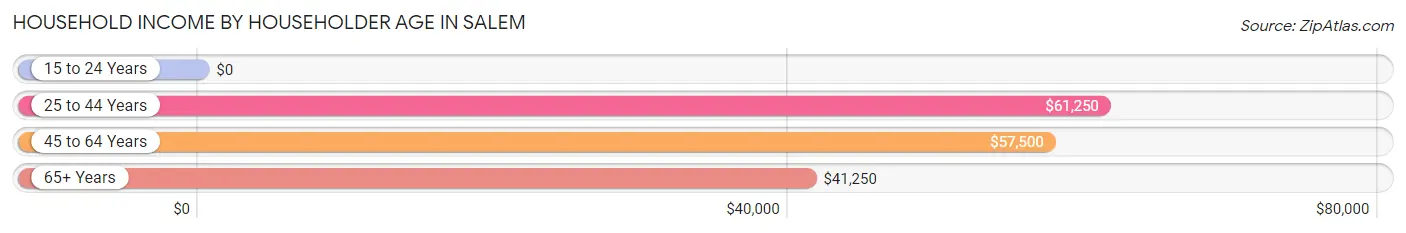
| Income Bracket | # Households | Median Income |
| 15 to 24 Years | 1 (0.7%) | $0 |
| 25 to 44 Years | 36 (25.5%) | $61,250 |
| 45 to 64 Years | 58 (41.1%) | $57,500 |
| 65+ Years | 46 (32.6%) | $41,250 |
| Total | 141 (100.0%) | $53,125 |
Poverty in Salem
Income Below Poverty by Sex and Age in Salem
With 10.4% poverty level for males and 13.2% for females among the residents of Salem, 18 to 24 year old males and 12 to 14 year old females are the most vulnerable to poverty, with 3 males (27.3%) and 4 females (100.0%) in their respective age groups living below the poverty level.
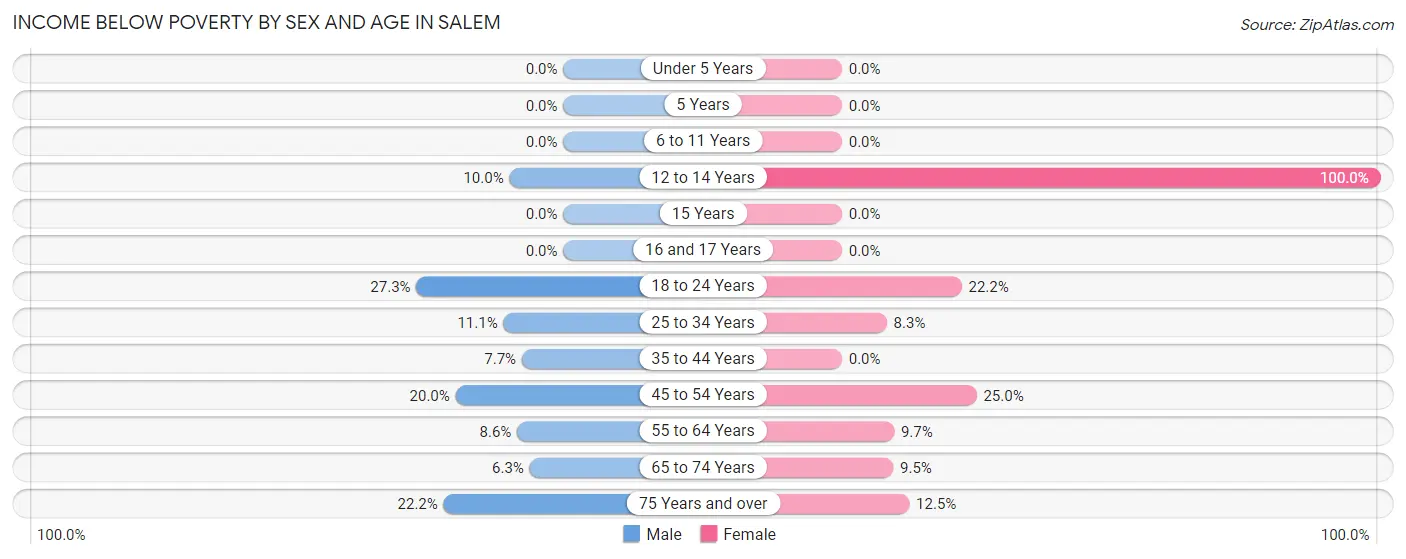
| Age Bracket | Male | Female |
| Under 5 Years | 0 (0.0%) | 0 (0.0%) |
| 5 Years | 0 (0.0%) | 0 (0.0%) |
| 6 to 11 Years | 0 (0.0%) | 0 (0.0%) |
| 12 to 14 Years | 1 (10.0%) | 4 (100.0%) |
| 15 Years | 0 (0.0%) | 0 (0.0%) |
| 16 and 17 Years | 0 (0.0%) | 0 (0.0%) |
| 18 to 24 Years | 3 (27.3%) | 2 (22.2%) |
| 25 to 34 Years | 2 (11.1%) | 2 (8.3%) |
| 35 to 44 Years | 1 (7.7%) | 0 (0.0%) |
| 45 to 54 Years | 2 (20.0%) | 7 (25.0%) |
| 55 to 64 Years | 3 (8.6%) | 3 (9.7%) |
| 65 to 74 Years | 1 (6.2%) | 2 (9.5%) |
| 75 Years and over | 4 (22.2%) | 3 (12.5%) |
| Total | 17 (10.4%) | 23 (13.2%) |
Income Above Poverty by Sex and Age in Salem
According to the poverty statistics in Salem, males aged under 5 years and females aged under 5 years are the age groups that are most secure financially, with 100.0% of males and 100.0% of females in these age groups living above the poverty line.
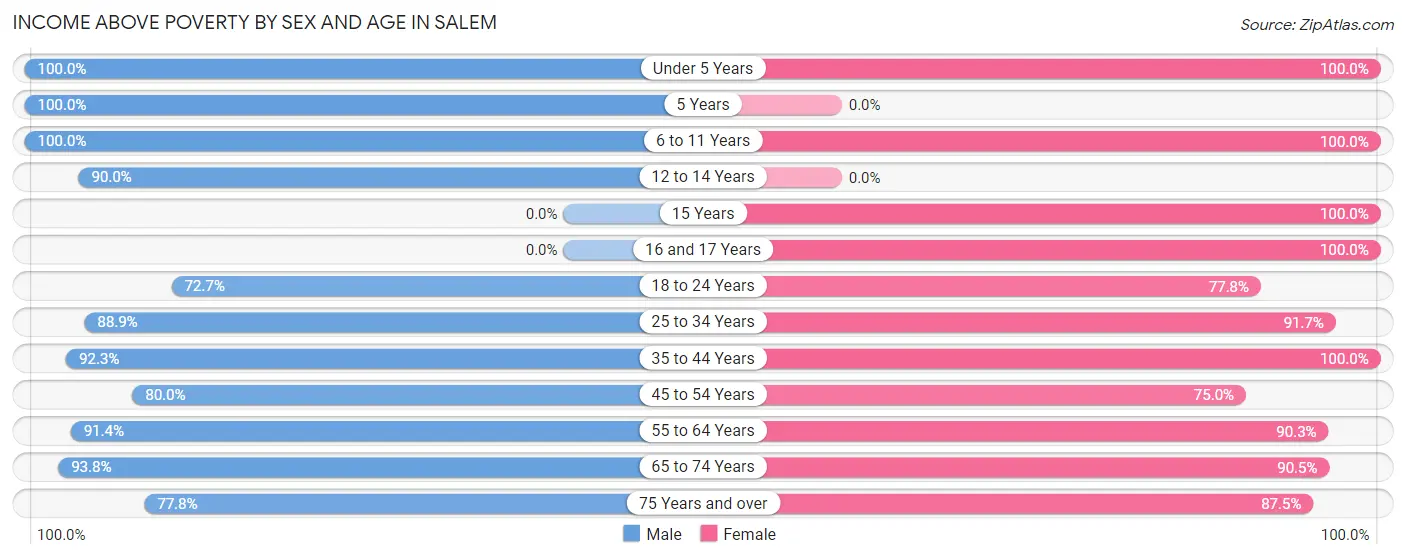
| Age Bracket | Male | Female |
| Under 5 Years | 9 (100.0%) | 7 (100.0%) |
| 5 Years | 5 (100.0%) | 0 (0.0%) |
| 6 to 11 Years | 19 (100.0%) | 5 (100.0%) |
| 12 to 14 Years | 9 (90.0%) | 0 (0.0%) |
| 15 Years | 0 (0.0%) | 4 (100.0%) |
| 16 and 17 Years | 0 (0.0%) | 2 (100.0%) |
| 18 to 24 Years | 8 (72.7%) | 7 (77.8%) |
| 25 to 34 Years | 16 (88.9%) | 22 (91.7%) |
| 35 to 44 Years | 12 (92.3%) | 15 (100.0%) |
| 45 to 54 Years | 8 (80.0%) | 21 (75.0%) |
| 55 to 64 Years | 32 (91.4%) | 28 (90.3%) |
| 65 to 74 Years | 15 (93.8%) | 19 (90.5%) |
| 75 Years and over | 14 (77.8%) | 21 (87.5%) |
| Total | 147 (89.6%) | 151 (86.8%) |
Income Below Poverty Among Married-Couple Families in Salem
The poverty statistics for married-couple families in Salem show that 6.8% or 5 of the total 74 families live below the poverty line. Families with 1 or 2 children have the highest poverty rate of 22.2%, comprising of 2 families. On the other hand, families with 3 or 4 children have the lowest poverty rate of 0.0%, which includes 0 families.
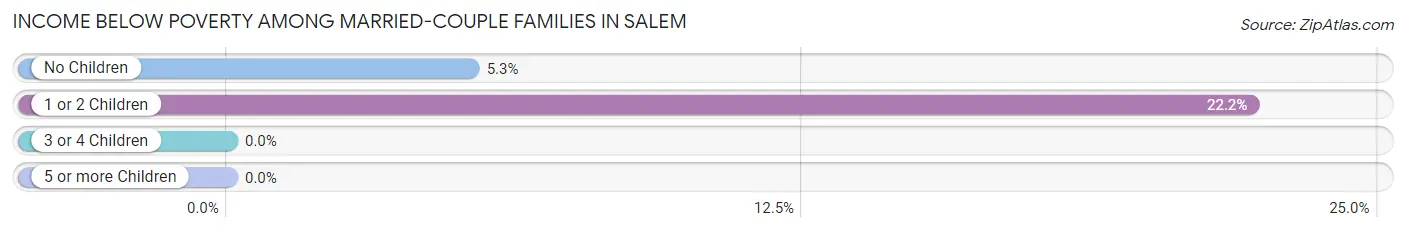
| Children | Above Poverty | Below Poverty |
| No Children | 54 (94.7%) | 3 (5.3%) |
| 1 or 2 Children | 7 (77.8%) | 2 (22.2%) |
| 3 or 4 Children | 8 (100.0%) | 0 (0.0%) |
| 5 or more Children | 0 (0.0%) | 0 (0.0%) |
| Total | 69 (93.2%) | 5 (6.8%) |
Income Below Poverty Among Single-Parent Households in Salem
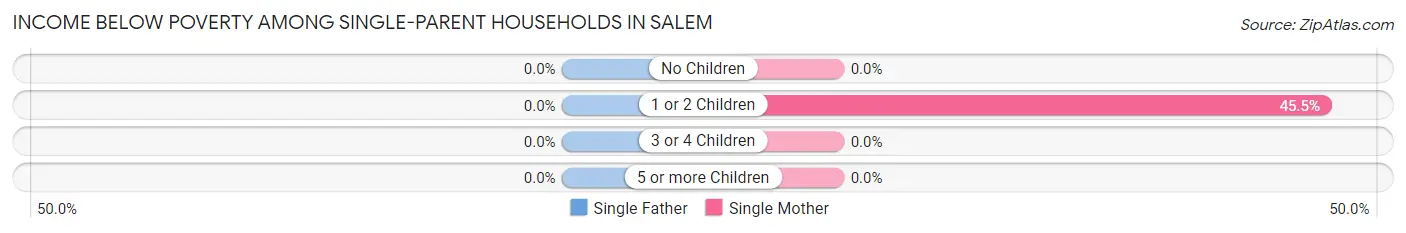
| Children | Single Father | Single Mother |
| No Children | 0 (0.0%) | 0 (0.0%) |
| 1 or 2 Children | 0 (0.0%) | 5 (45.5%) |
| 3 or 4 Children | 0 (0.0%) | 0 (0.0%) |
| 5 or more Children | 0 (0.0%) | 0 (0.0%) |
| Total | 0 (0.0%) | 5 (26.3%) |
Income Below Poverty Among Married-Couple vs Single-Parent Households in Salem
The poverty data for Salem shows that 5 of the married-couple family households (6.8%) and 5 of the single-parent households (22.7%) are living below the poverty level. Within the married-couple family households, those with 1 or 2 children have the highest poverty rate, with 2 households (22.2%) falling below the poverty line. Among the single-parent households, those with 1 or 2 children have the highest poverty rate, with 5 household (45.5%) living below poverty.
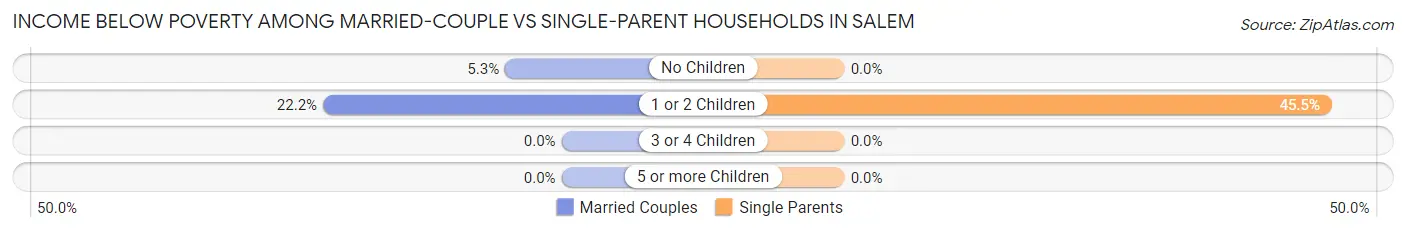
| Children | Married-Couple Families | Single-Parent Households |
| No Children | 3 (5.3%) | 0 (0.0%) |
| 1 or 2 Children | 2 (22.2%) | 5 (45.5%) |
| 3 or 4 Children | 0 (0.0%) | 0 (0.0%) |
| 5 or more Children | 0 (0.0%) | 0 (0.0%) |
| Total | 5 (6.8%) | 5 (22.7%) |
Race in Salem
The most populous races in Salem are White / Caucasian (297 | 87.9%), Two or more Races (24 | 7.1%), and Asian (10 | 3.0%).
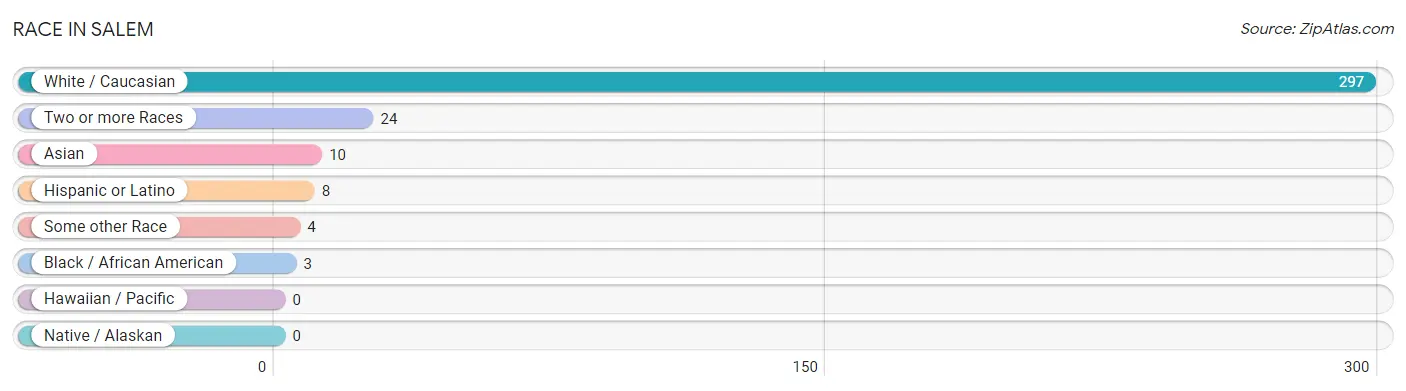
| Race | # Population | % Population |
| Asian | 10 | 3.0% |
| Black / African American | 3 | 0.9% |
| Hawaiian / Pacific | 0 | 0.0% |
| Hispanic or Latino | 8 | 2.4% |
| Native / Alaskan | 0 | 0.0% |
| White / Caucasian | 297 | 87.9% |
| Two or more Races | 24 | 7.1% |
| Some other Race | 4 | 1.2% |
| Total | 338 | 100.0% |
Ancestry in Salem
The most populous ancestries reported in Salem are Irish (64 | 18.9%), German (60 | 17.7%), English (36 | 10.6%), American (29 | 8.6%), and Malaysian (16 | 4.7%), together accounting for 60.6% of all Salem residents.
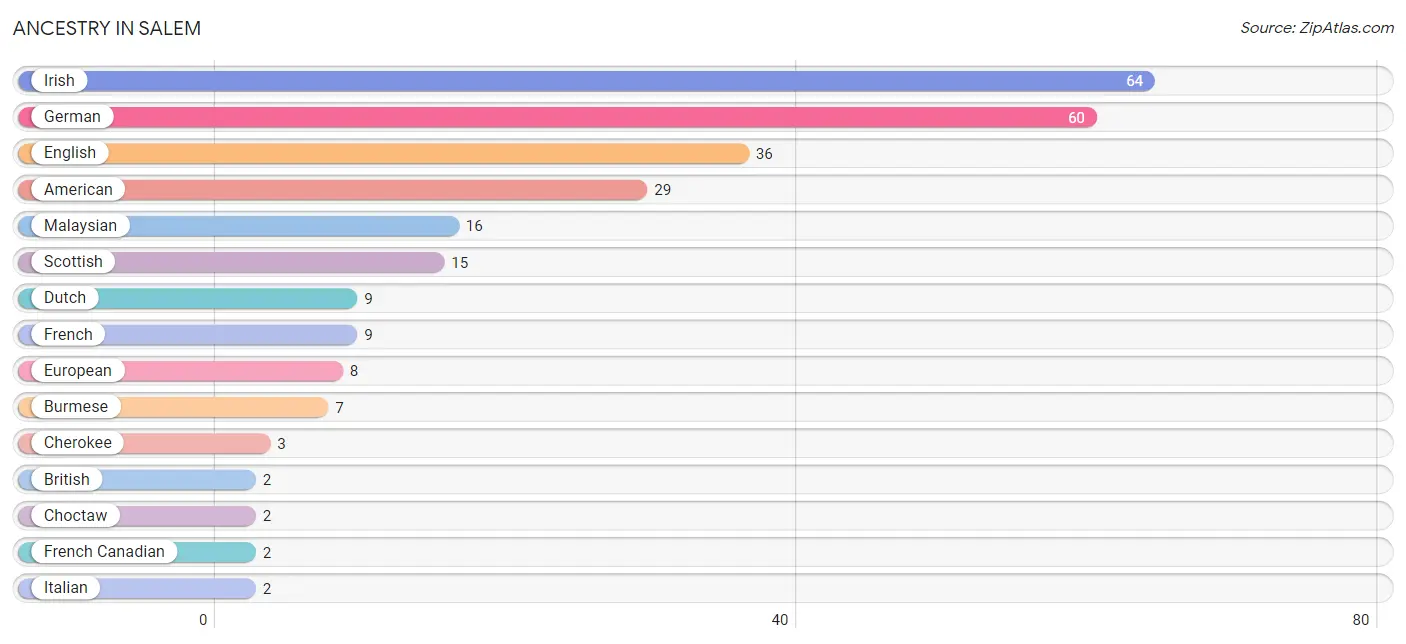
| Ancestry | # Population | % Population |
| American | 29 | 8.6% |
| Apache | 1 | 0.3% |
| British | 2 | 0.6% |
| Burmese | 7 | 2.1% |
| Cherokee | 3 | 0.9% |
| Choctaw | 2 | 0.6% |
| Dutch | 9 | 2.7% |
| English | 36 | 10.6% |
| European | 8 | 2.4% |
| French | 9 | 2.7% |
| French Canadian | 2 | 0.6% |
| German | 60 | 17.7% |
| Irish | 64 | 18.9% |
| Italian | 2 | 0.6% |
| Malaysian | 16 | 4.7% |
| Norwegian | 1 | 0.3% |
| Scotch-Irish | 2 | 0.6% |
| Scottish | 15 | 4.4% |
| Spanish | 2 | 0.6% | View All 19 Rows |
Immigrants in Salem
The most numerous immigrant groups reported in Salem came from Asia (6 | 1.8%), Eastern Asia (3 | 0.9%), Korea (3 | 0.9%), Laos (3 | 0.9%), and South Eastern Asia (3 | 0.9%), together accounting for 5.3% of all Salem residents.
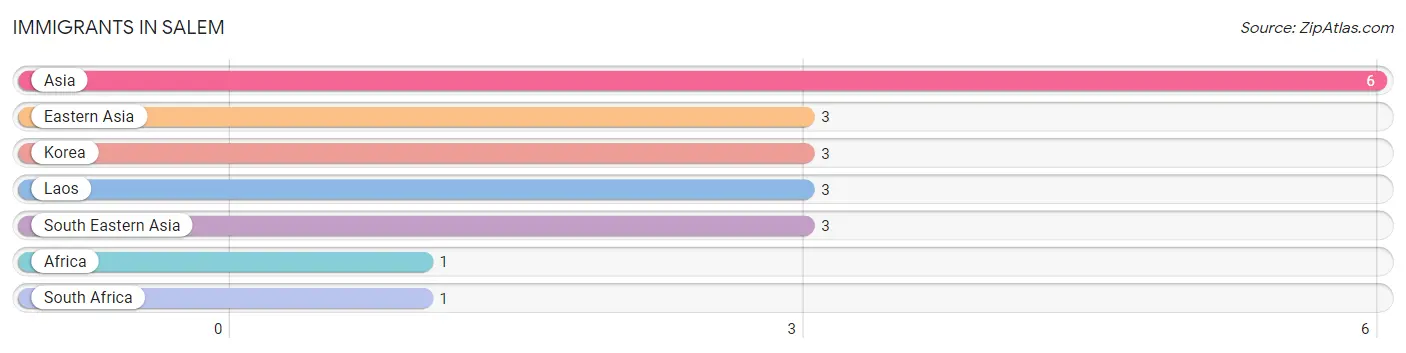
| Immigration Origin | # Population | % Population |
| Africa | 1 | 0.3% |
| Asia | 6 | 1.8% |
| Eastern Asia | 3 | 0.9% |
| Korea | 3 | 0.9% |
| Laos | 3 | 0.9% |
| South Africa | 1 | 0.3% |
| South Eastern Asia | 3 | 0.9% | View All 7 Rows |
Sex and Age in Salem
Sex and Age in Salem
The most populous age groups in Salem are 5 to 9 Years (24 | 14.6%) for men and 50 to 54 Years (23 | 13.2%) for women.
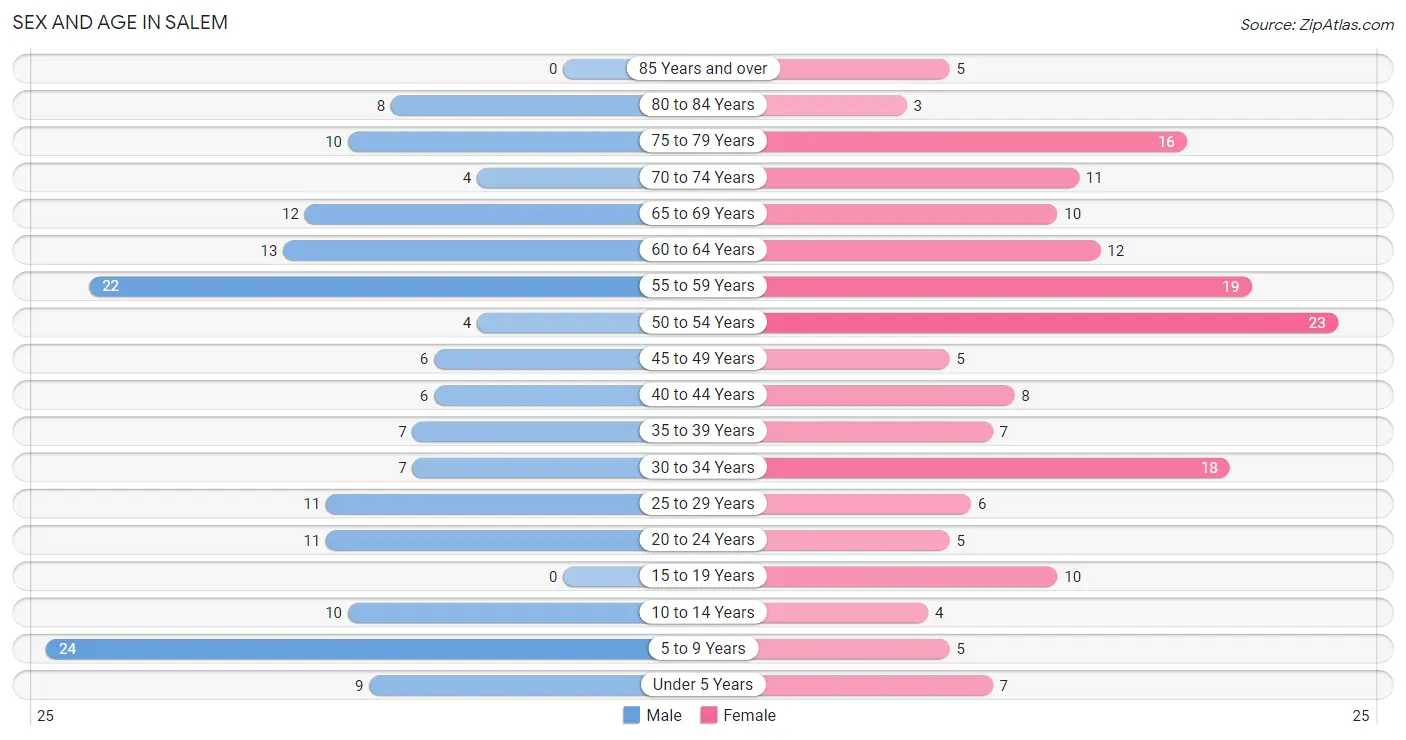
| Age Bracket | Male | Female |
| Under 5 Years | 9 (5.5%) | 7 (4.0%) |
| 5 to 9 Years | 24 (14.6%) | 5 (2.9%) |
| 10 to 14 Years | 10 (6.1%) | 4 (2.3%) |
| 15 to 19 Years | 0 (0.0%) | 10 (5.8%) |
| 20 to 24 Years | 11 (6.7%) | 5 (2.9%) |
| 25 to 29 Years | 11 (6.7%) | 6 (3.5%) |
| 30 to 34 Years | 7 (4.3%) | 18 (10.3%) |
| 35 to 39 Years | 7 (4.3%) | 7 (4.0%) |
| 40 to 44 Years | 6 (3.7%) | 8 (4.6%) |
| 45 to 49 Years | 6 (3.7%) | 5 (2.9%) |
| 50 to 54 Years | 4 (2.4%) | 23 (13.2%) |
| 55 to 59 Years | 22 (13.4%) | 19 (10.9%) |
| 60 to 64 Years | 13 (7.9%) | 12 (6.9%) |
| 65 to 69 Years | 12 (7.3%) | 10 (5.8%) |
| 70 to 74 Years | 4 (2.4%) | 11 (6.3%) |
| 75 to 79 Years | 10 (6.1%) | 16 (9.2%) |
| 80 to 84 Years | 8 (4.9%) | 3 (1.7%) |
| 85 Years and over | 0 (0.0%) | 5 (2.9%) |
| Total | 164 (100.0%) | 174 (100.0%) |
Families and Households in Salem
Median Family Size in Salem
The median family size in Salem is 2.85 persons per family, with single male/father families (3 | 3.1%) accounting for the largest median family size of 5 persons per family. On the other hand, single female/mother families (19 | 19.8%) represent the smallest median family size with 2.11 persons per family.
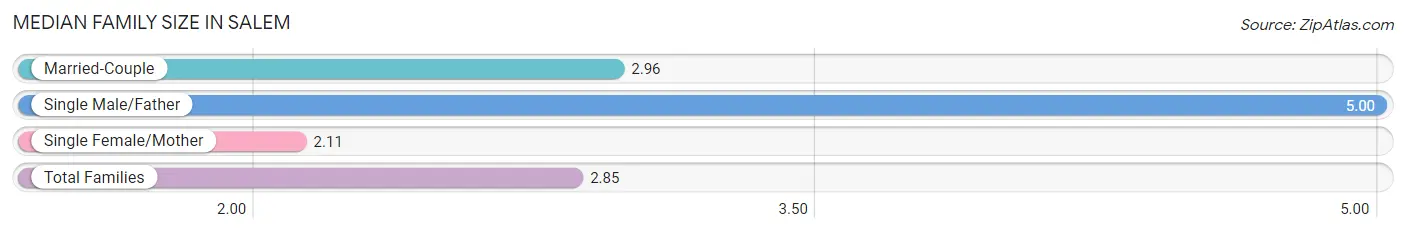
| Family Type | # Families | Family Size |
| Married-Couple | 74 (77.1%) | 2.96 |
| Single Male/Father | 3 (3.1%) | 5.00 |
| Single Female/Mother | 19 (19.8%) | 2.11 |
| Total Families | 96 (100.0%) | 2.85 |
Median Household Size in Salem
The median household size in Salem is 2.40 persons per household, with single male/father households (3 | 2.1%) accounting for the largest median household size of 5 persons per household. non-family households (45 | 31.9%) represent the smallest median household size with 1.42 persons per household.
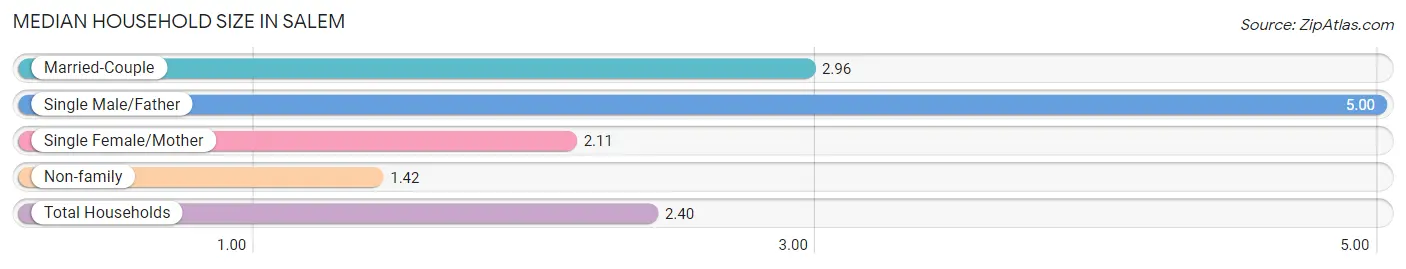
| Household Type | # Households | Household Size |
| Married-Couple | 74 (52.5%) | 2.96 |
| Single Male/Father | 3 (2.1%) | 5.00 |
| Single Female/Mother | 19 (13.5%) | 2.11 |
| Non-family | 45 (31.9%) | 1.42 |
| Total Households | 141 (100.0%) | 2.40 |
Household Size by Marriage Status in Salem
Out of a total of 141 households in Salem, 96 (68.1%) are family households, while 45 (31.9%) are nonfamily households. The most numerous type of family households are 2-person households, comprising 71, and the most common type of nonfamily households are 1-person households, comprising 27.
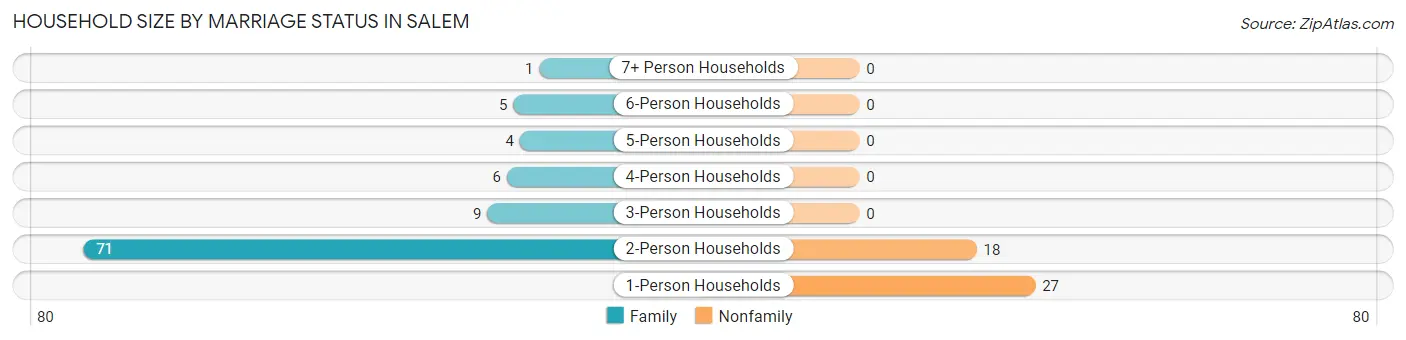
| Household Size | Family Households | Nonfamily Households |
| 1-Person Households | - | 27 (19.2%) |
| 2-Person Households | 71 (50.3%) | 18 (12.8%) |
| 3-Person Households | 9 (6.4%) | 0 (0.0%) |
| 4-Person Households | 6 (4.3%) | 0 (0.0%) |
| 5-Person Households | 4 (2.8%) | 0 (0.0%) |
| 6-Person Households | 5 (3.5%) | 0 (0.0%) |
| 7+ Person Households | 1 (0.7%) | 0 (0.0%) |
| Total | 96 (68.1%) | 45 (31.9%) |
Female Fertility in Salem
Fertility by Age in Salem
Average fertility rate in Salem is 48.0 births per 1,000 women. Women in the age bracket of 20 to 34 years have the highest fertility rate with 103.0 births per 1,000 women. Women in the age bracket of 20 to 34 years acount for 100.0% of all women with births.
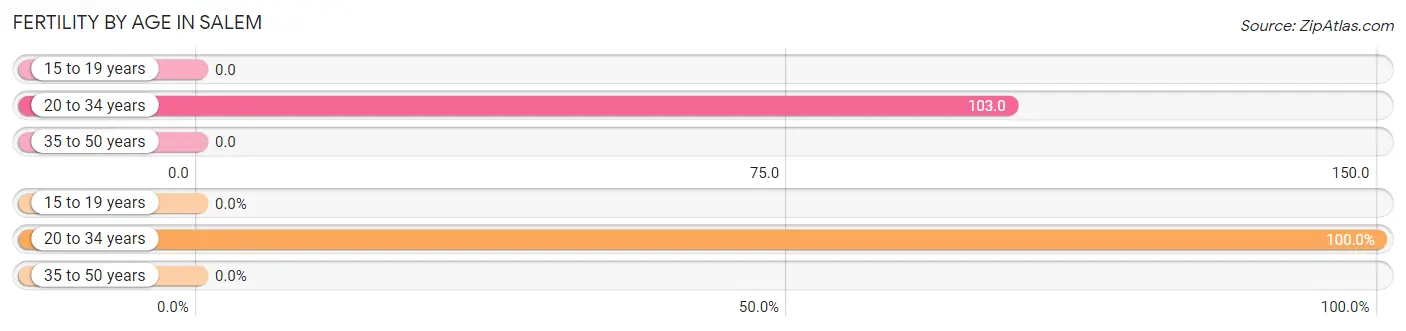
| Age Bracket | Women with Births | Births / 1,000 Women |
| 15 to 19 years | 0 (0.0%) | 0.0 |
| 20 to 34 years | 3 (100.0%) | 103.0 |
| 35 to 50 years | 0 (0.0%) | 0.0 |
| Total | 3 (100.0%) | 48.0 |
Fertility by Age by Marriage Status in Salem
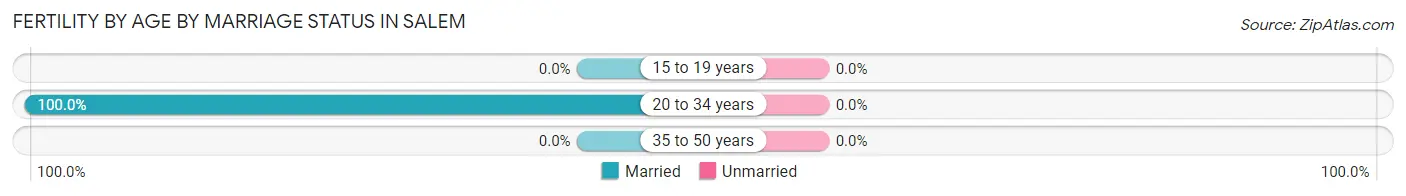
| Age Bracket | Married | Unmarried |
| 15 to 19 years | 0 (0.0%) | 0 (0.0%) |
| 20 to 34 years | 3 (100.0%) | 0 (0.0%) |
| 35 to 50 years | 0 (0.0%) | 0 (0.0%) |
| Total | 3 (100.0%) | 0 (0.0%) |
Fertility by Education in Salem
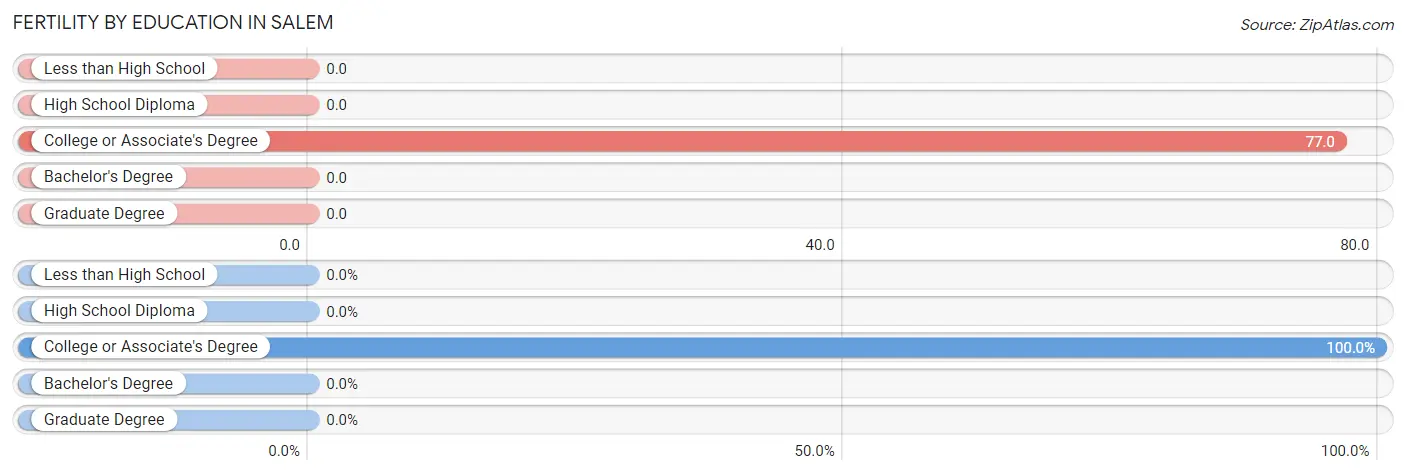
| Educational Attainment | Women with Births | Births / 1,000 Women |
| Less than High School | 0 (0.0%) | 0.0 |
| High School Diploma | 0 (0.0%) | 0.0 |
| College or Associate's Degree | 3 (100.0%) | 77.0 |
| Bachelor's Degree | 0 (0.0%) | 0.0 |
| Graduate Degree | 0 (0.0%) | 0.0 |
| Total | 3 (100.0%) | 48.0 |
Fertility by Education by Marriage Status in Salem
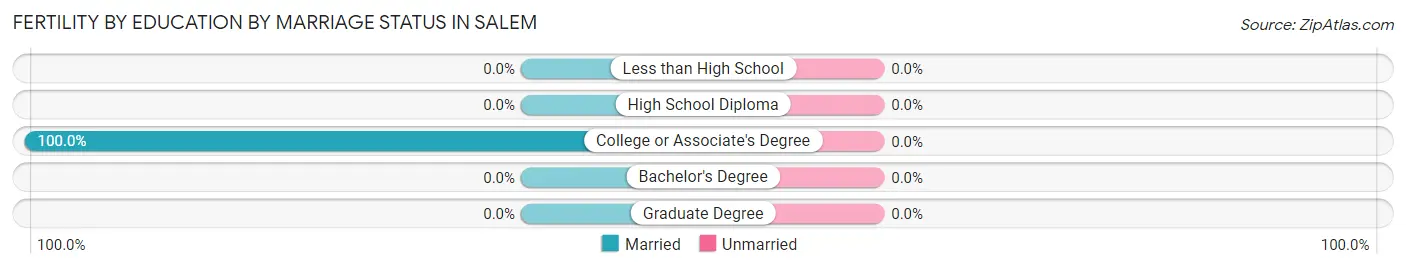
| Educational Attainment | Married | Unmarried |
| Less than High School | 0 (0.0%) | 0 (0.0%) |
| High School Diploma | 0 (0.0%) | 0 (0.0%) |
| College or Associate's Degree | 3 (100.0%) | 0 (0.0%) |
| Bachelor's Degree | 0 (0.0%) | 0 (0.0%) |
| Graduate Degree | 0 (0.0%) | 0 (0.0%) |
| Total | 3 (100.0%) | 0 (0.0%) |
Employment Characteristics in Salem
Employment by Class of Employer in Salem
Among the 144 employed individuals in Salem, private company employees (91 | 63.2%), self-employed (not incorporated) (20 | 13.9%), and local government employees (14 | 9.7%) make up the most common classes of employment.
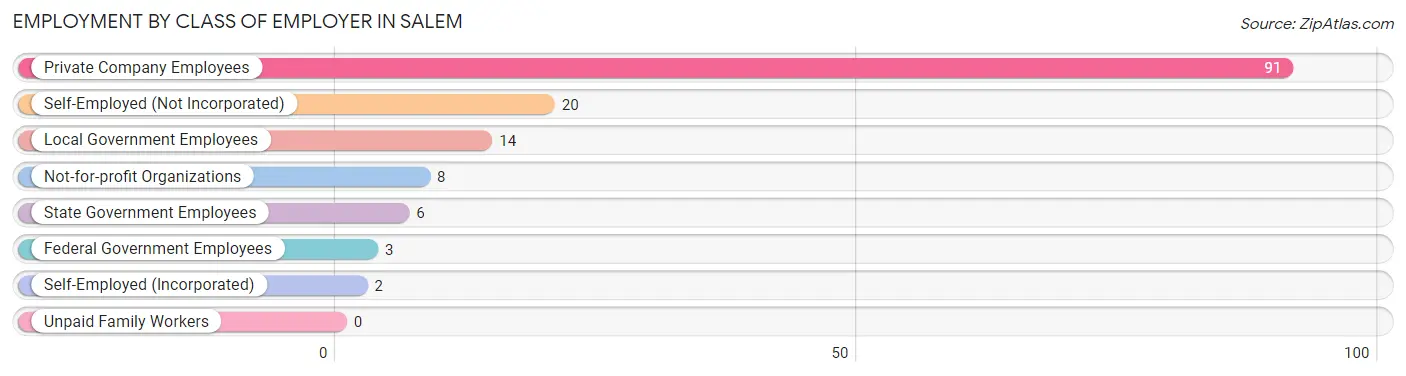
| Employer Class | # Employees | % Employees |
| Private Company Employees | 91 | 63.2% |
| Self-Employed (Incorporated) | 2 | 1.4% |
| Self-Employed (Not Incorporated) | 20 | 13.9% |
| Not-for-profit Organizations | 8 | 5.6% |
| Local Government Employees | 14 | 9.7% |
| State Government Employees | 6 | 4.2% |
| Federal Government Employees | 3 | 2.1% |
| Unpaid Family Workers | 0 | 0.0% |
| Total | 144 | 100.0% |
Employment Status by Age in Salem
According to the labor force statistics for Salem, out of the total population over 16 years of age (275), 53.5% or 147 individuals are in the labor force, with 2.1% or 3 of them unemployed. The age group with the highest labor force participation rate is 35 to 44 years, with 100.0% or 28 individuals in the labor force. Within the labor force, the 45 to 54 years age range has the highest percentage of unemployed individuals, with 8.0% or 2 of them being unemployed.
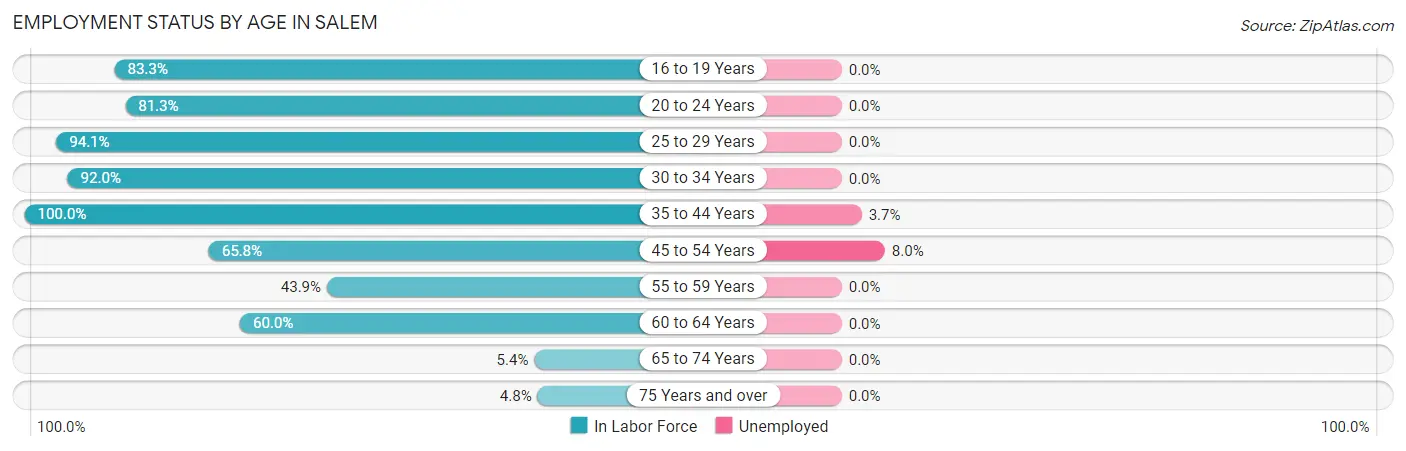
| Age Bracket | In Labor Force | Unemployed |
| 16 to 19 Years | 5 (83.3%) | 0 (0.0%) |
| 20 to 24 Years | 13 (81.3%) | 0 (0.0%) |
| 25 to 29 Years | 16 (94.1%) | 0 (0.0%) |
| 30 to 34 Years | 23 (92.0%) | 0 (0.0%) |
| 35 to 44 Years | 28 (100.0%) | 1 (3.7%) |
| 45 to 54 Years | 25 (65.8%) | 2 (8.0%) |
| 55 to 59 Years | 18 (43.9%) | 0 (0.0%) |
| 60 to 64 Years | 15 (60.0%) | 0 (0.0%) |
| 65 to 74 Years | 2 (5.4%) | 0 (0.0%) |
| 75 Years and over | 2 (4.8%) | 0 (0.0%) |
| Total | 147 (53.5%) | 3 (2.1%) |
Employment Status by Educational Attainment in Salem
According to labor force statistics for Salem, 71.8% of individuals (125) out of the total population between 25 and 64 years of age (174) are in the labor force, with 2.4% or 3 of them being unemployed. The group with the highest labor force participation rate are those with the educational attainment of college / associate degree, with 75.8% or 69 individuals in the labor force. Within the labor force, individuals with high school diploma education have the highest percentage of unemployment, with 6.5% or 3 of them being unemployed.
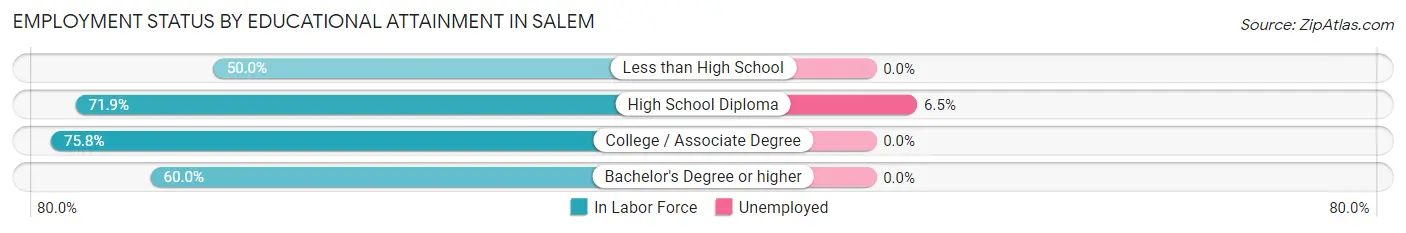
| Educational Attainment | In Labor Force | Unemployed |
| Less than High School | 7 (50.0%) | 0 (0.0%) |
| High School Diploma | 46 (71.9%) | 4 (6.5%) |
| College / Associate Degree | 69 (75.8%) | 0 (0.0%) |
| Bachelor's Degree or higher | 3 (60.0%) | 0 (0.0%) |
| Total | 125 (71.8%) | 4 (2.4%) |
Employment Occupations by Sex in Salem
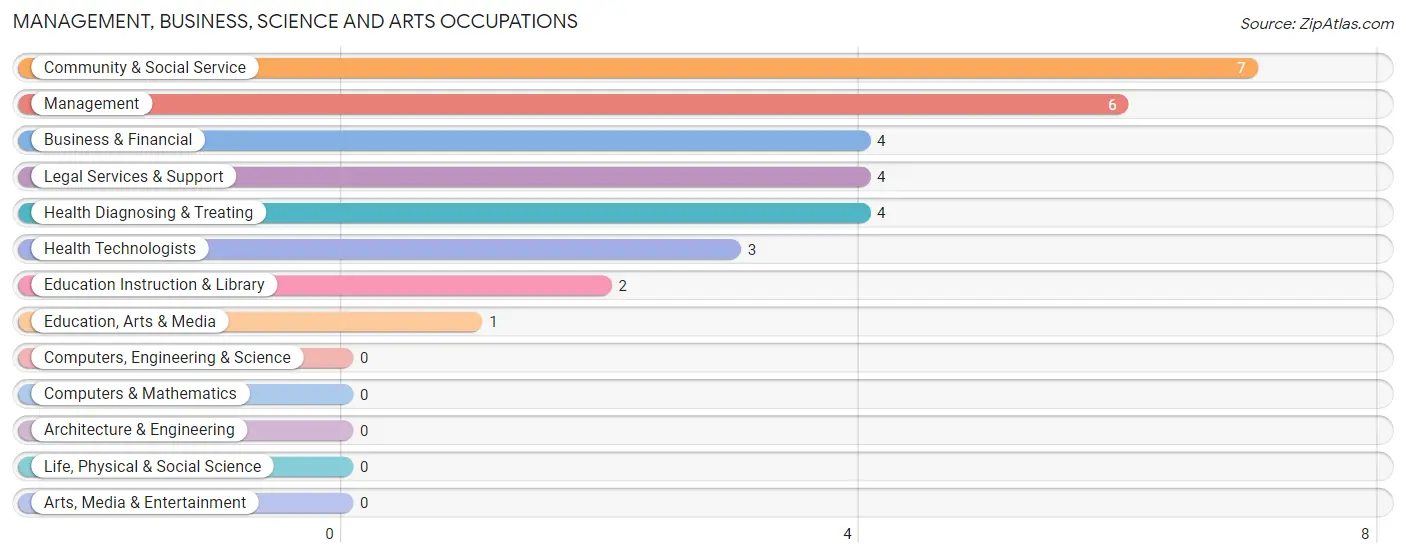
Management, Business, Science and Arts Occupations
The most common Management, Business, Science and Arts occupations in Salem are Community & Social Service (7 | 4.9%), Management (6 | 4.2%), Business & Financial (4 | 2.8%), Legal Services & Support (4 | 2.8%), and Health Diagnosing & Treating (4 | 2.8%).
Management, Business, Science and Arts Occupations by Sex
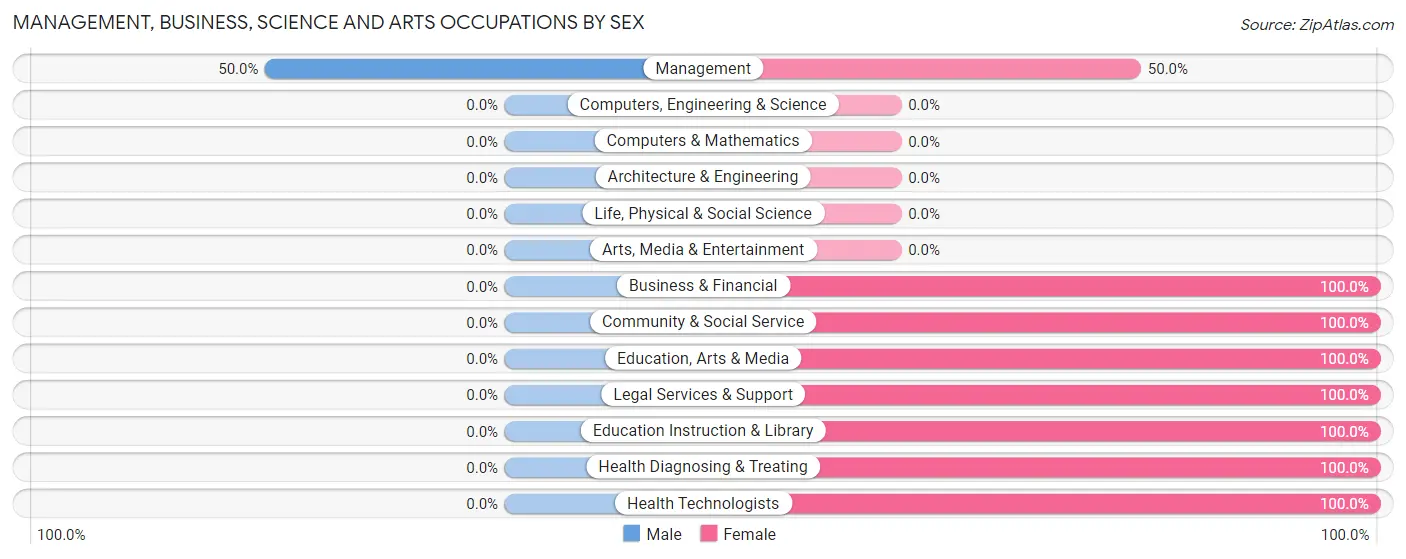
| Occupation | Male | Female |
| Management | 3 (50.0%) | 3 (50.0%) |
| Business & Financial | 0 (0.0%) | 4 (100.0%) |
| Computers, Engineering & Science | 0 (0.0%) | 0 (0.0%) |
| Computers & Mathematics | 0 (0.0%) | 0 (0.0%) |
| Architecture & Engineering | 0 (0.0%) | 0 (0.0%) |
| Life, Physical & Social Science | 0 (0.0%) | 0 (0.0%) |
| Community & Social Service | 0 (0.0%) | 7 (100.0%) |
| Education, Arts & Media | 0 (0.0%) | 1 (100.0%) |
| Legal Services & Support | 0 (0.0%) | 4 (100.0%) |
| Education Instruction & Library | 0 (0.0%) | 2 (100.0%) |
| Arts, Media & Entertainment | 0 (0.0%) | 0 (0.0%) |
| Health Diagnosing & Treating | 0 (0.0%) | 4 (100.0%) |
| Health Technologists | 0 (0.0%) | 3 (100.0%) |
| Total (Category) | 3 (14.3%) | 18 (85.7%) |
| Total (Overall) | 61 (43.0%) | 81 (57.0%) |
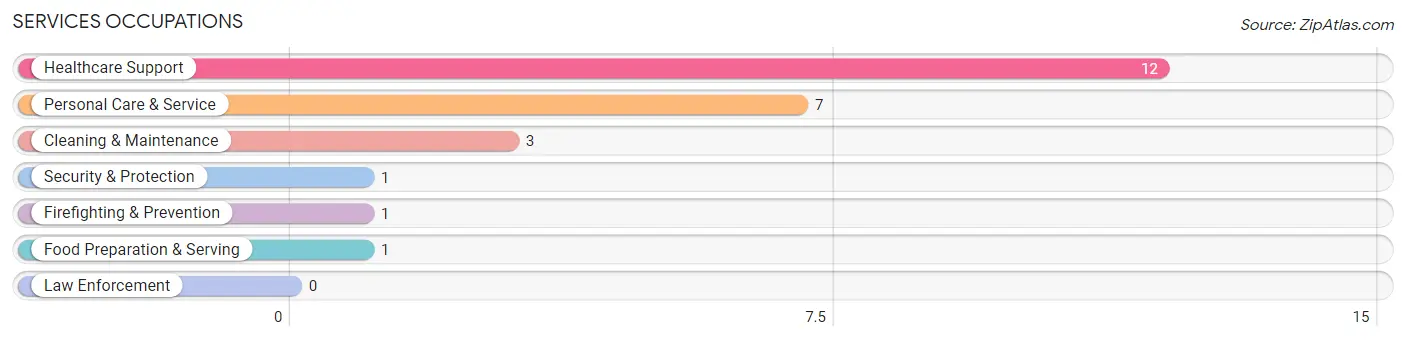
Services Occupations
The most common Services occupations in Salem are Healthcare Support (12 | 8.5%), Personal Care & Service (7 | 4.9%), Cleaning & Maintenance (3 | 2.1%), Security & Protection (1 | 0.7%), and Firefighting & Prevention (1 | 0.7%).
Services Occupations by Sex
Within the Services occupations in Salem, the most male-oriented occupations are Cleaning & Maintenance (100.0%), and Healthcare Support (33.3%), while the most female-oriented occupations are Security & Protection (100.0%), Firefighting & Prevention (100.0%), and Food Preparation & Serving (100.0%).
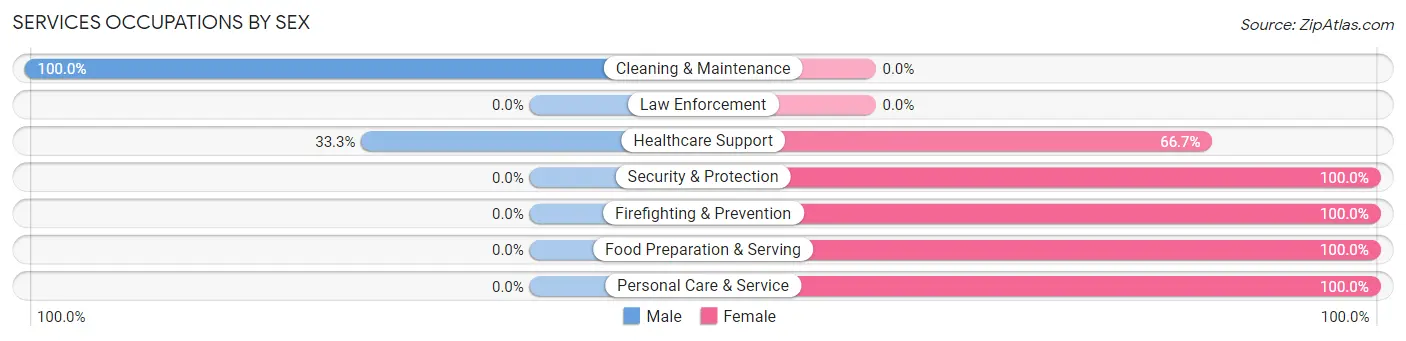
| Occupation | Male | Female |
| Healthcare Support | 4 (33.3%) | 8 (66.7%) |
| Security & Protection | 0 (0.0%) | 1 (100.0%) |
| Firefighting & Prevention | 0 (0.0%) | 1 (100.0%) |
| Law Enforcement | 0 (0.0%) | 0 (0.0%) |
| Food Preparation & Serving | 0 (0.0%) | 1 (100.0%) |
| Cleaning & Maintenance | 3 (100.0%) | 0 (0.0%) |
| Personal Care & Service | 0 (0.0%) | 7 (100.0%) |
| Total (Category) | 7 (29.2%) | 17 (70.8%) |
| Total (Overall) | 61 (43.0%) | 81 (57.0%) |
Sales and Office Occupations
The most common Sales and Office occupations in Salem are Sales & Related (18 | 12.7%), and Office & Administration (17 | 12.0%).
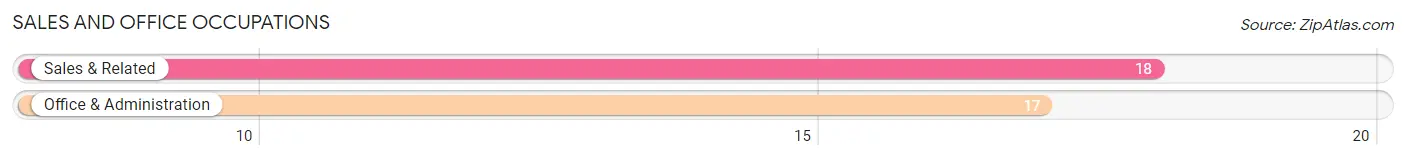
Sales and Office Occupations by Sex
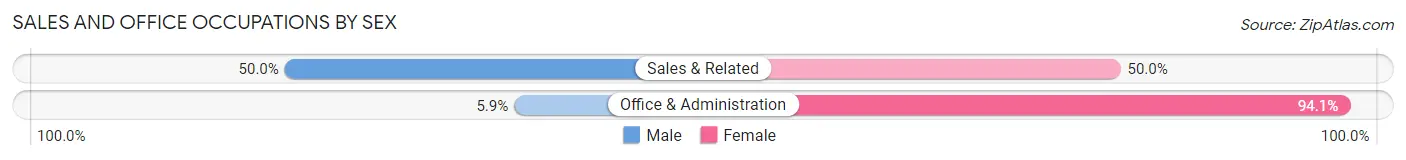
| Occupation | Male | Female |
| Sales & Related | 9 (50.0%) | 9 (50.0%) |
| Office & Administration | 1 (5.9%) | 16 (94.1%) |
| Total (Category) | 10 (28.6%) | 25 (71.4%) |
| Total (Overall) | 61 (43.0%) | 81 (57.0%) |
Natural Resources, Construction and Maintenance Occupations
The most common Natural Resources, Construction and Maintenance occupations in Salem are Construction & Extraction (10 | 7.0%), and Installation, Maintenance & Repair (7 | 4.9%).
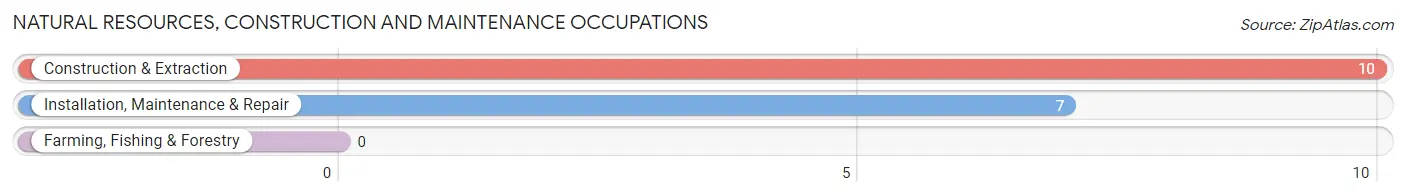
Natural Resources, Construction and Maintenance Occupations by Sex
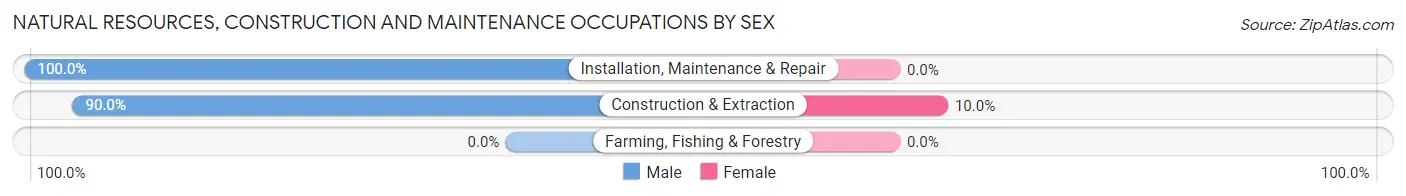
| Occupation | Male | Female |
| Farming, Fishing & Forestry | 0 (0.0%) | 0 (0.0%) |
| Construction & Extraction | 9 (90.0%) | 1 (10.0%) |
| Installation, Maintenance & Repair | 7 (100.0%) | 0 (0.0%) |
| Total (Category) | 16 (94.1%) | 1 (5.9%) |
| Total (Overall) | 61 (43.0%) | 81 (57.0%) |
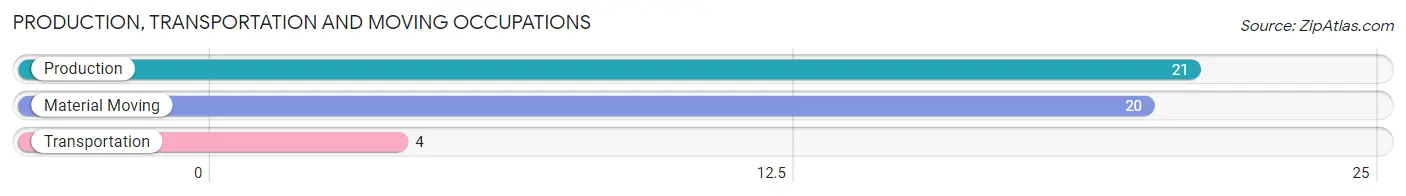
Production, Transportation and Moving Occupations
The most common Production, Transportation and Moving occupations in Salem are Production (21 | 14.8%), Material Moving (20 | 14.1%), and Transportation (4 | 2.8%).
Production, Transportation and Moving Occupations by Sex
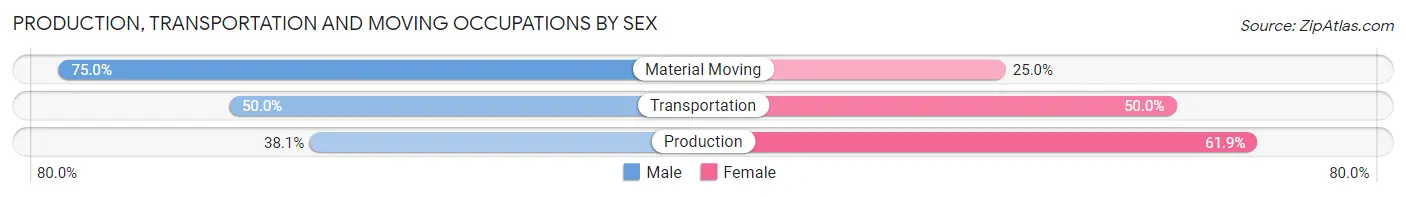
| Occupation | Male | Female |
| Production | 8 (38.1%) | 13 (61.9%) |
| Transportation | 2 (50.0%) | 2 (50.0%) |
| Material Moving | 15 (75.0%) | 5 (25.0%) |
| Total (Category) | 25 (55.6%) | 20 (44.4%) |
| Total (Overall) | 61 (43.0%) | 81 (57.0%) |
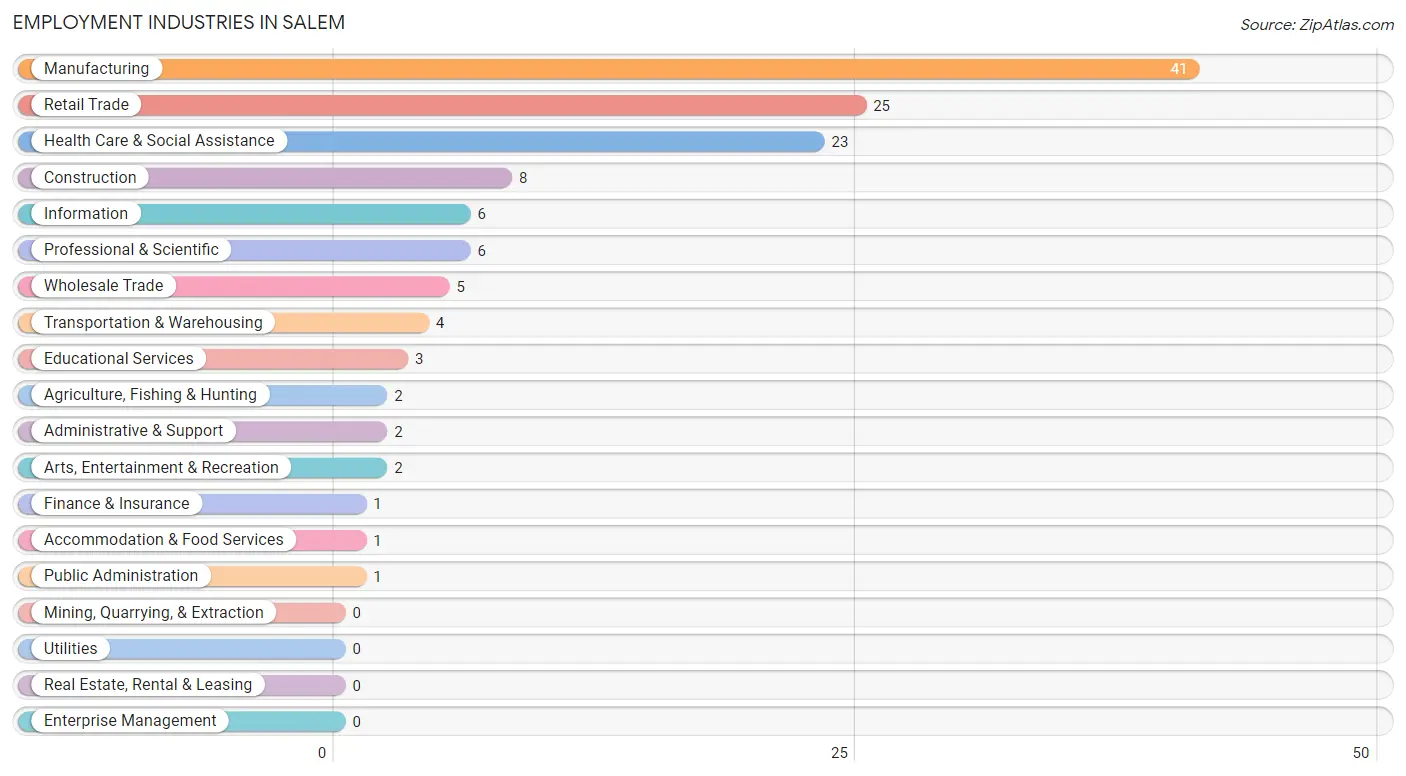
Employment Industries by Sex in Salem
Employment Industries in Salem
The major employment industries in Salem include Manufacturing (41 | 28.9%), Retail Trade (25 | 17.6%), Health Care & Social Assistance (23 | 16.2%), Construction (8 | 5.6%), and Information (6 | 4.2%).
Employment Industries by Sex in Salem
The Salem industries that see more men than women are Wholesale Trade (100.0%), Administrative & Support (100.0%), and Construction (87.5%), whereas the industries that tend to have a higher number of women are Information (100.0%), Finance & Insurance (100.0%), and Professional & Scientific (100.0%).
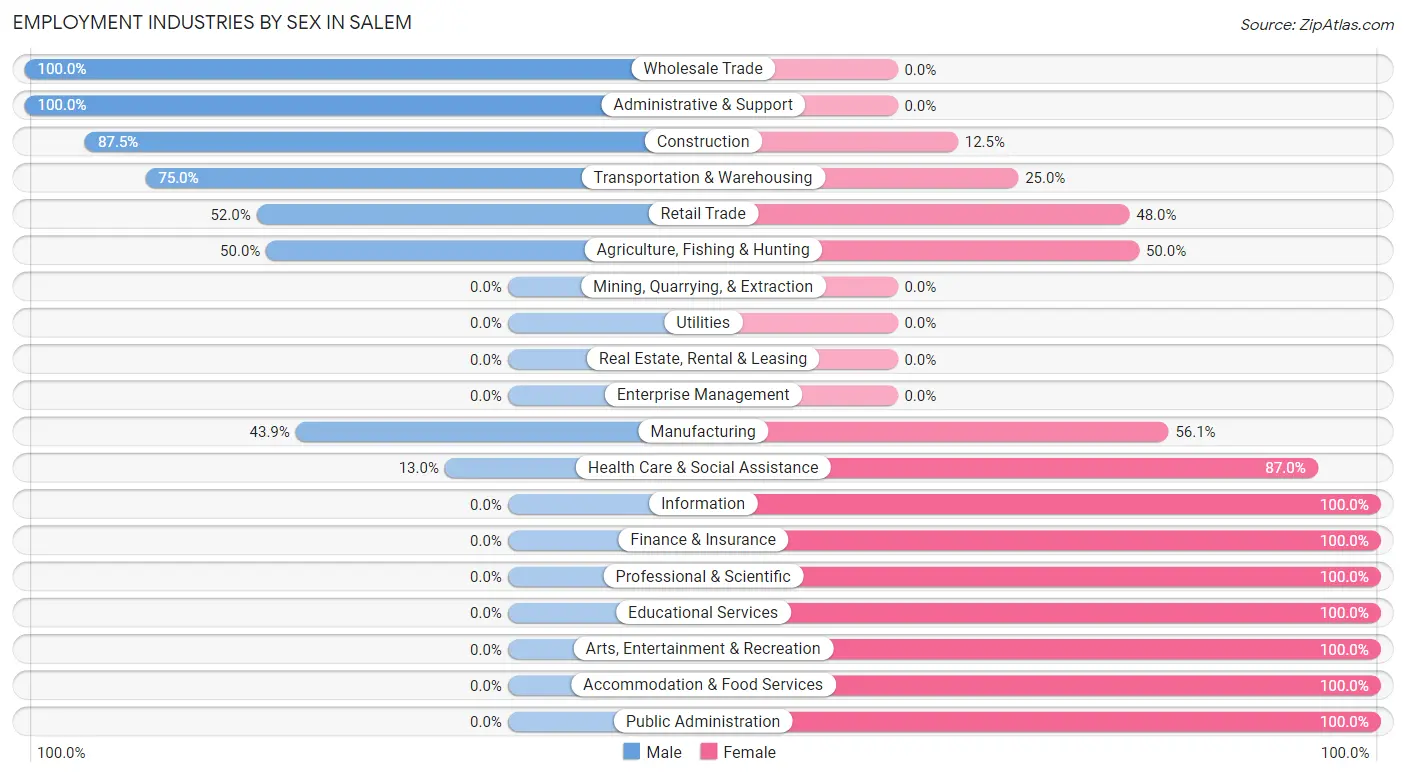
| Industry | Male | Female |
| Agriculture, Fishing & Hunting | 1 (50.0%) | 1 (50.0%) |
| Mining, Quarrying, & Extraction | 0 (0.0%) | 0 (0.0%) |
| Construction | 7 (87.5%) | 1 (12.5%) |
| Manufacturing | 18 (43.9%) | 23 (56.1%) |
| Wholesale Trade | 5 (100.0%) | 0 (0.0%) |
| Retail Trade | 13 (52.0%) | 12 (48.0%) |
| Transportation & Warehousing | 3 (75.0%) | 1 (25.0%) |
| Utilities | 0 (0.0%) | 0 (0.0%) |
| Information | 0 (0.0%) | 6 (100.0%) |
| Finance & Insurance | 0 (0.0%) | 1 (100.0%) |
| Real Estate, Rental & Leasing | 0 (0.0%) | 0 (0.0%) |
| Professional & Scientific | 0 (0.0%) | 6 (100.0%) |
| Enterprise Management | 0 (0.0%) | 0 (0.0%) |
| Administrative & Support | 2 (100.0%) | 0 (0.0%) |
| Educational Services | 0 (0.0%) | 3 (100.0%) |
| Health Care & Social Assistance | 3 (13.0%) | 20 (87.0%) |
| Arts, Entertainment & Recreation | 0 (0.0%) | 2 (100.0%) |
| Accommodation & Food Services | 0 (0.0%) | 1 (100.0%) |
| Public Administration | 0 (0.0%) | 1 (100.0%) |
| Total | 61 (43.0%) | 81 (57.0%) |
Education in Salem
School Enrollment in Salem
The most common levels of schooling among the 48 students in Salem are elementary school (21 | 43.8%), middle school (11 | 22.9%), and kindergarten (6 | 12.5%).
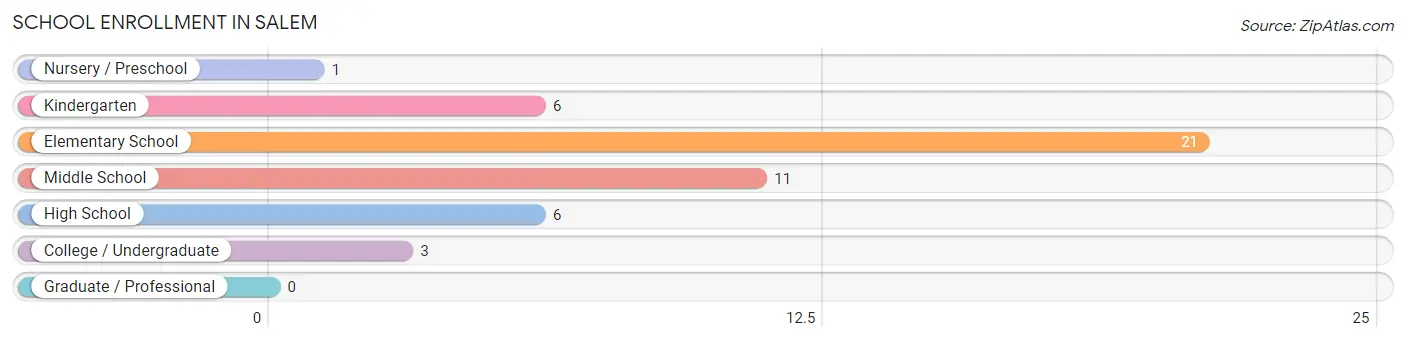
| School Level | # Students | % Students |
| Nursery / Preschool | 1 | 2.1% |
| Kindergarten | 6 | 12.5% |
| Elementary School | 21 | 43.8% |
| Middle School | 11 | 22.9% |
| High School | 6 | 12.5% |
| College / Undergraduate | 3 | 6.2% |
| Graduate / Professional | 0 | 0.0% |
| Total | 48 | 100.0% |
School Enrollment by Age by Funding Source in Salem
Out of a total of 48 students who are enrolled in schools in Salem, 1 (2.1%) attend a private institution, while the remaining 47 (97.9%) are enrolled in public schools. The age group of 35 years and over has the highest likelihood of being enrolled in private schools, with 1 (100.0% in the age bracket) enrolled. Conversely, the age group of 5 to 9 year old has the lowest likelihood of being enrolled in a private school, with 28 (100.0% in the age bracket) attending a public institution.
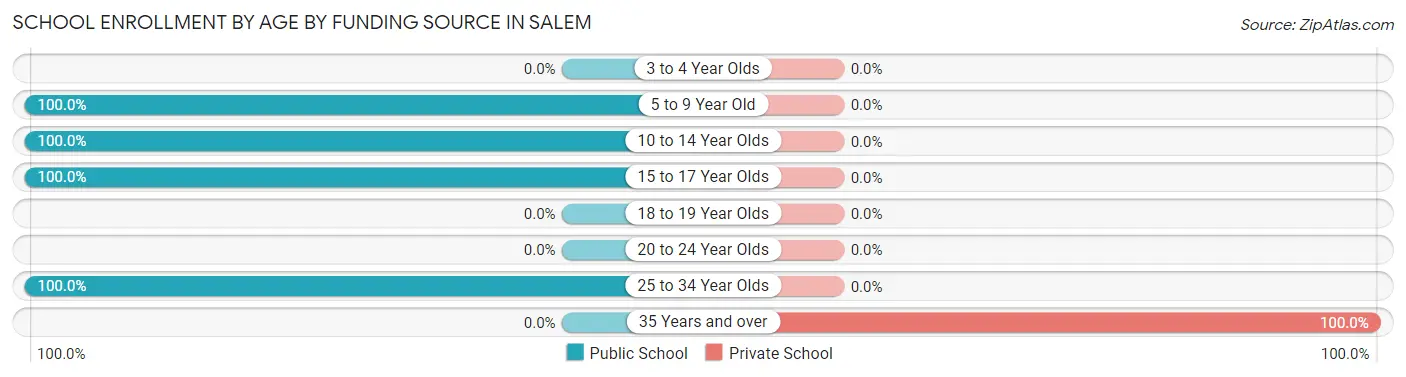
| Age Bracket | Public School | Private School |
| 3 to 4 Year Olds | 0 (0.0%) | 0 (0.0%) |
| 5 to 9 Year Old | 28 (100.0%) | 0 (0.0%) |
| 10 to 14 Year Olds | 11 (100.0%) | 0 (0.0%) |
| 15 to 17 Year Olds | 6 (100.0%) | 0 (0.0%) |
| 18 to 19 Year Olds | 0 (0.0%) | 0 (0.0%) |
| 20 to 24 Year Olds | 0 (0.0%) | 0 (0.0%) |
| 25 to 34 Year Olds | 2 (100.0%) | 0 (0.0%) |
| 35 Years and over | 0 (0.0%) | 1 (100.0%) |
| Total | 47 (97.9%) | 1 (2.1%) |
Educational Attainment by Field of Study in Salem
Science & technology (3 | 21.4%), education (3 | 21.4%), bio, nature & agricultural (2 | 14.3%), physical & health sciences (2 | 14.3%), and business (2 | 14.3%) are the most common fields of study among 14 individuals in Salem who have obtained a bachelor's degree or higher.
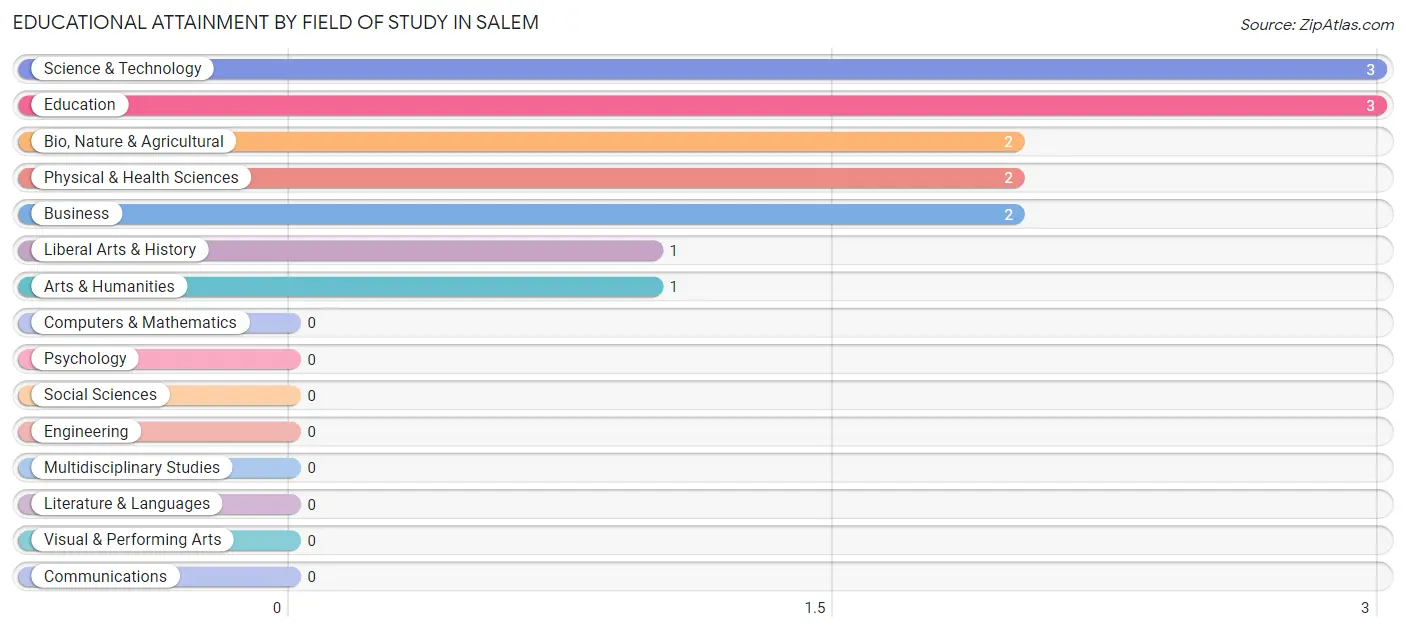
| Field of Study | # Graduates | % Graduates |
| Computers & Mathematics | 0 | 0.0% |
| Bio, Nature & Agricultural | 2 | 14.3% |
| Physical & Health Sciences | 2 | 14.3% |
| Psychology | 0 | 0.0% |
| Social Sciences | 0 | 0.0% |
| Engineering | 0 | 0.0% |
| Multidisciplinary Studies | 0 | 0.0% |
| Science & Technology | 3 | 21.4% |
| Business | 2 | 14.3% |
| Education | 3 | 21.4% |
| Literature & Languages | 0 | 0.0% |
| Liberal Arts & History | 1 | 7.1% |
| Visual & Performing Arts | 0 | 0.0% |
| Communications | 0 | 0.0% |
| Arts & Humanities | 1 | 7.1% |
| Total | 14 | 100.0% |
Transportation & Commute in Salem
Vehicle Availability by Sex in Salem
The most prevalent vehicle ownership categories in Salem are males with 2 vehicles (22, accounting for 34.9%) and females with 2 vehicles (38, making up 27.2%).
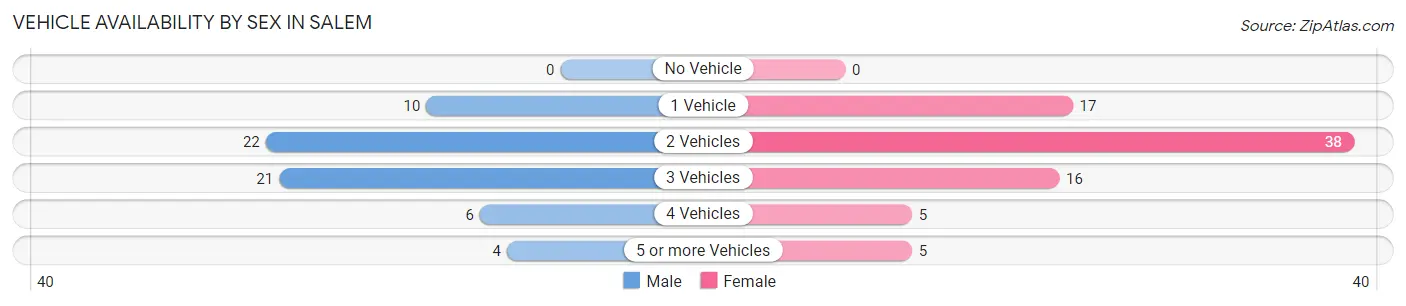
| Vehicles Available | Male | Female |
| No Vehicle | 0 (0.0%) | 0 (0.0%) |
| 1 Vehicle | 10 (15.9%) | 17 (21.0%) |
| 2 Vehicles | 22 (34.9%) | 38 (46.9%) |
| 3 Vehicles | 21 (33.3%) | 16 (19.8%) |
| 4 Vehicles | 6 (9.5%) | 5 (6.2%) |
| 5 or more Vehicles | 4 (6.4%) | 5 (6.2%) |
| Total | 63 (100.0%) | 81 (100.0%) |
Commute Time in Salem
The most frequently occuring commute durations in Salem are 15 to 19 minutes (44 commuters, 33.9%), 20 to 24 minutes (25 commuters, 19.2%), and 30 to 34 minutes (18 commuters, 13.9%).
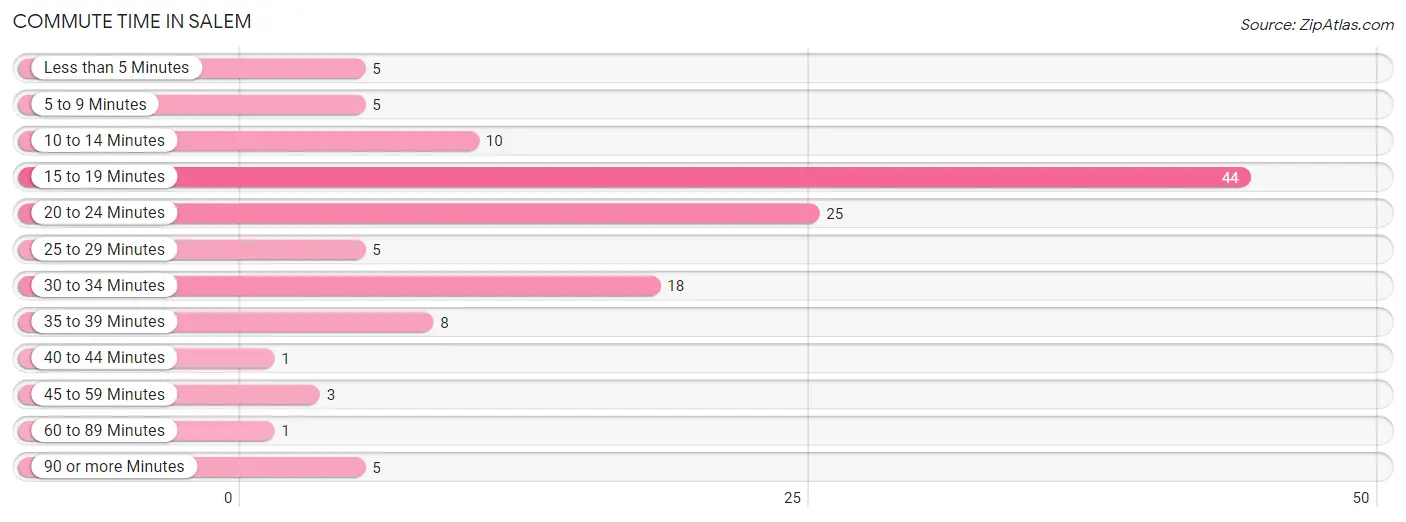
| Commute Time | # Commuters | % Commuters |
| Less than 5 Minutes | 5 | 3.8% |
| 5 to 9 Minutes | 5 | 3.8% |
| 10 to 14 Minutes | 10 | 7.7% |
| 15 to 19 Minutes | 44 | 33.9% |
| 20 to 24 Minutes | 25 | 19.2% |
| 25 to 29 Minutes | 5 | 3.8% |
| 30 to 34 Minutes | 18 | 13.9% |
| 35 to 39 Minutes | 8 | 6.1% |
| 40 to 44 Minutes | 1 | 0.8% |
| 45 to 59 Minutes | 3 | 2.3% |
| 60 to 89 Minutes | 1 | 0.8% |
| 90 or more Minutes | 5 | 3.8% |
Commute Time by Sex in Salem
The most common commute times in Salem are 15 to 19 minutes (17 commuters, 28.8%) for males and 15 to 19 minutes (27 commuters, 38.0%) for females.
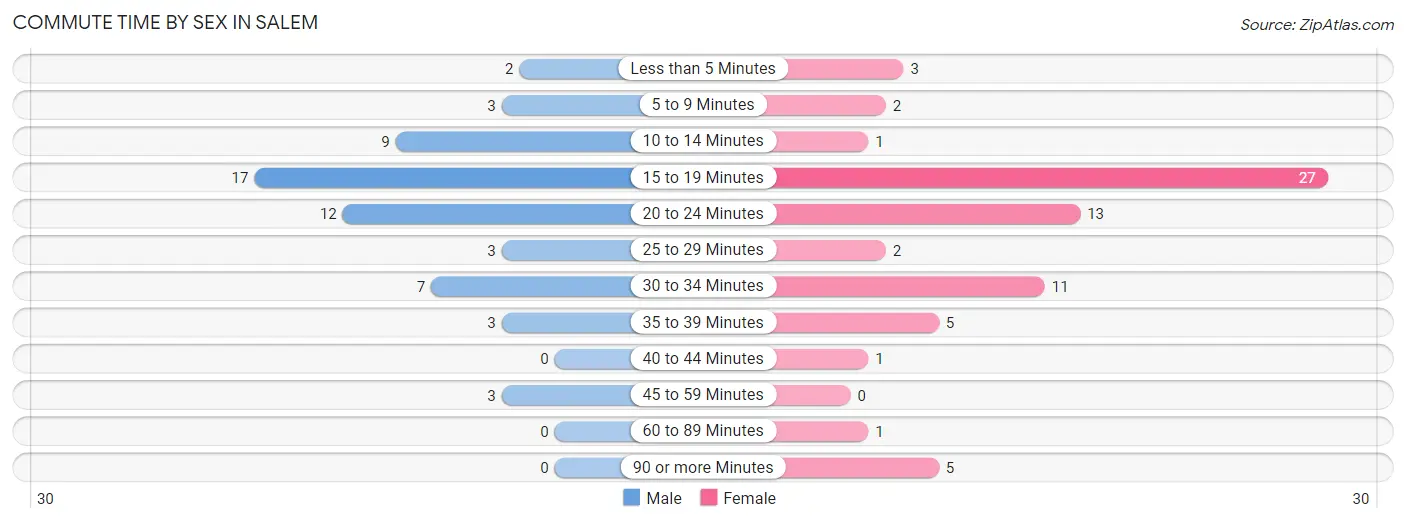
| Commute Time | Male | Female |
| Less than 5 Minutes | 2 (3.4%) | 3 (4.2%) |
| 5 to 9 Minutes | 3 (5.1%) | 2 (2.8%) |
| 10 to 14 Minutes | 9 (15.2%) | 1 (1.4%) |
| 15 to 19 Minutes | 17 (28.8%) | 27 (38.0%) |
| 20 to 24 Minutes | 12 (20.3%) | 13 (18.3%) |
| 25 to 29 Minutes | 3 (5.1%) | 2 (2.8%) |
| 30 to 34 Minutes | 7 (11.9%) | 11 (15.5%) |
| 35 to 39 Minutes | 3 (5.1%) | 5 (7.0%) |
| 40 to 44 Minutes | 0 (0.0%) | 1 (1.4%) |
| 45 to 59 Minutes | 3 (5.1%) | 0 (0.0%) |
| 60 to 89 Minutes | 0 (0.0%) | 1 (1.4%) |
| 90 or more Minutes | 0 (0.0%) | 5 (7.0%) |
Time of Departure to Work by Sex in Salem
The most frequent times of departure to work in Salem are 12:00 AM to 4:59 AM (10, 17.0%) for males and 12:00 PM to 3:59 PM (14, 19.7%) for females.
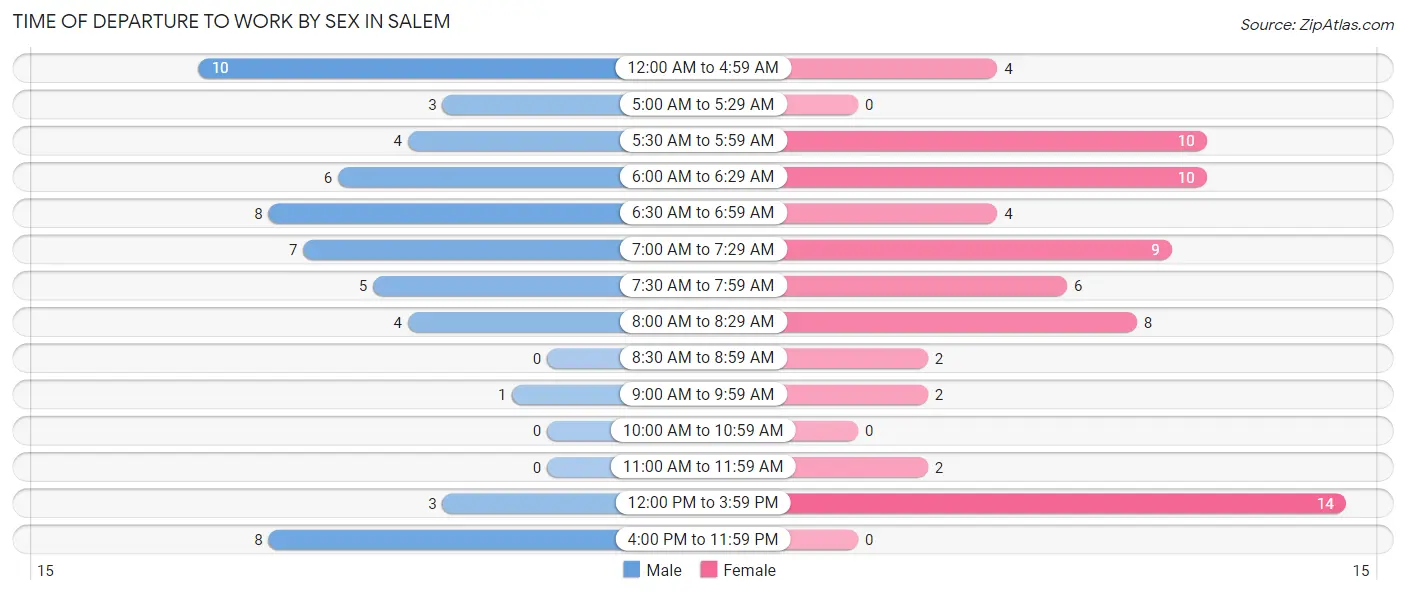
| Time of Departure | Male | Female |
| 12:00 AM to 4:59 AM | 10 (17.0%) | 4 (5.6%) |
| 5:00 AM to 5:29 AM | 3 (5.1%) | 0 (0.0%) |
| 5:30 AM to 5:59 AM | 4 (6.8%) | 10 (14.1%) |
| 6:00 AM to 6:29 AM | 6 (10.2%) | 10 (14.1%) |
| 6:30 AM to 6:59 AM | 8 (13.6%) | 4 (5.6%) |
| 7:00 AM to 7:29 AM | 7 (11.9%) | 9 (12.7%) |
| 7:30 AM to 7:59 AM | 5 (8.5%) | 6 (8.5%) |
| 8:00 AM to 8:29 AM | 4 (6.8%) | 8 (11.3%) |
| 8:30 AM to 8:59 AM | 0 (0.0%) | 2 (2.8%) |
| 9:00 AM to 9:59 AM | 1 (1.7%) | 2 (2.8%) |
| 10:00 AM to 10:59 AM | 0 (0.0%) | 0 (0.0%) |
| 11:00 AM to 11:59 AM | 0 (0.0%) | 2 (2.8%) |
| 12:00 PM to 3:59 PM | 3 (5.1%) | 14 (19.7%) |
| 4:00 PM to 11:59 PM | 8 (13.6%) | 0 (0.0%) |
| Total | 59 (100.0%) | 71 (100.0%) |
Housing Occupancy in Salem
Occupancy by Ownership in Salem
Of the total 141 dwellings in Salem, owner-occupied units account for 122 (86.5%), while renter-occupied units make up 19 (13.5%).
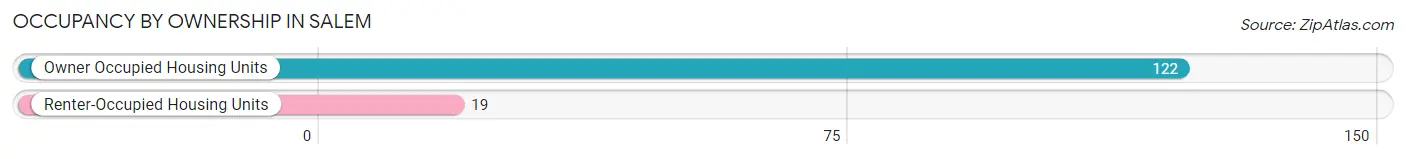
| Occupancy | # Housing Units | % Housing Units |
| Owner Occupied Housing Units | 122 | 86.5% |
| Renter-Occupied Housing Units | 19 | 13.5% |
| Total Occupied Housing Units | 141 | 100.0% |
Occupancy by Household Size in Salem
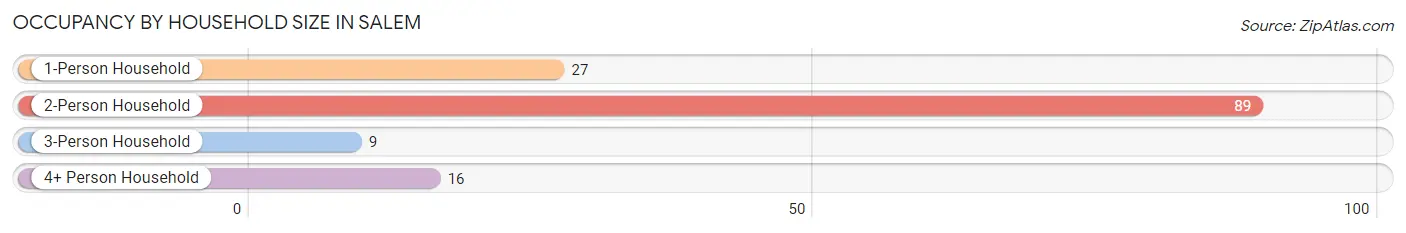
| Household Size | # Housing Units | % Housing Units |
| 1-Person Household | 27 | 19.2% |
| 2-Person Household | 89 | 63.1% |
| 3-Person Household | 9 | 6.4% |
| 4+ Person Household | 16 | 11.4% |
| Total Housing Units | 141 | 100.0% |
Occupancy by Ownership by Household Size in Salem
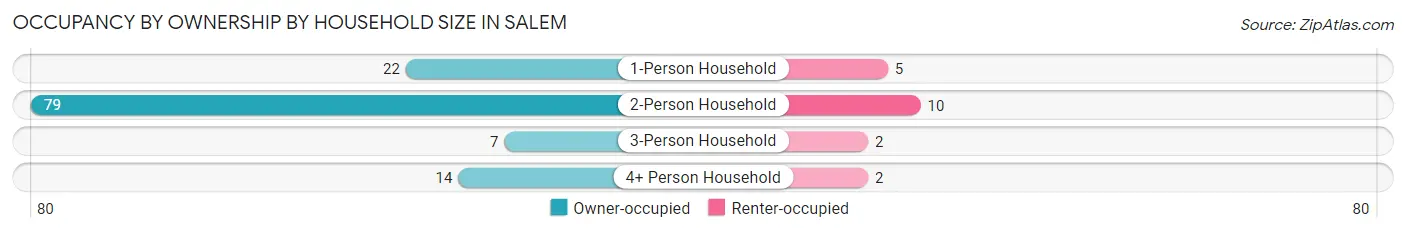
| Household Size | Owner-occupied | Renter-occupied |
| 1-Person Household | 22 (81.5%) | 5 (18.5%) |
| 2-Person Household | 79 (88.8%) | 10 (11.2%) |
| 3-Person Household | 7 (77.8%) | 2 (22.2%) |
| 4+ Person Household | 14 (87.5%) | 2 (12.5%) |
| Total Housing Units | 122 (86.5%) | 19 (13.5%) |
Occupancy by Educational Attainment in Salem
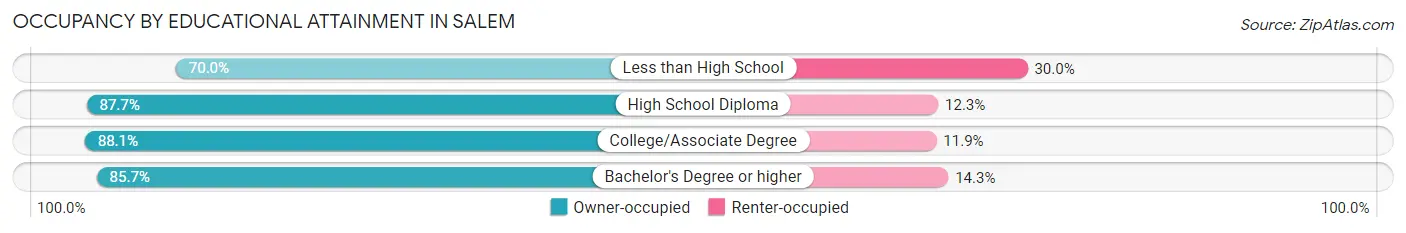
| Household Size | Owner-occupied | Renter-occupied |
| Less than High School | 7 (70.0%) | 3 (30.0%) |
| High School Diploma | 50 (87.7%) | 7 (12.3%) |
| College/Associate Degree | 59 (88.1%) | 8 (11.9%) |
| Bachelor's Degree or higher | 6 (85.7%) | 1 (14.3%) |
Occupancy by Age of Householder in Salem
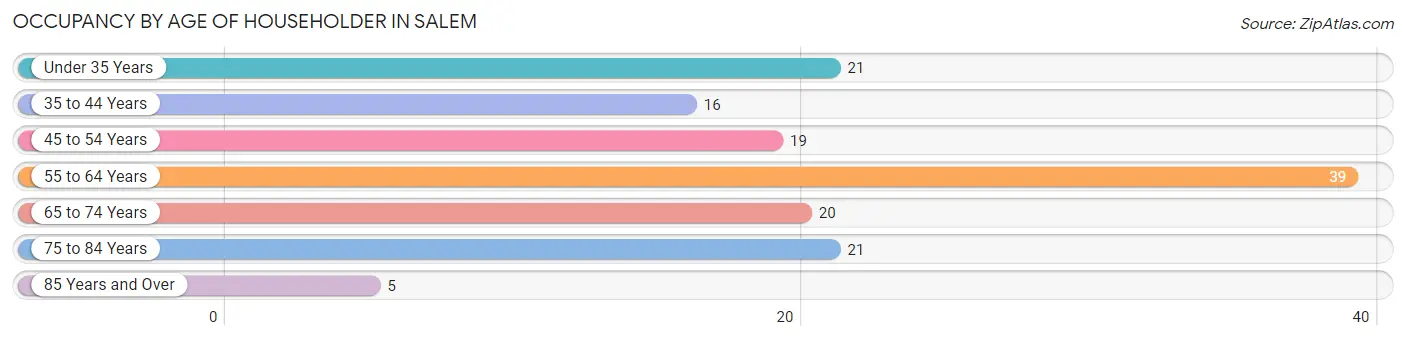
| Age Bracket | # Households | % Households |
| Under 35 Years | 21 | 14.9% |
| 35 to 44 Years | 16 | 11.4% |
| 45 to 54 Years | 19 | 13.5% |
| 55 to 64 Years | 39 | 27.7% |
| 65 to 74 Years | 20 | 14.2% |
| 75 to 84 Years | 21 | 14.9% |
| 85 Years and Over | 5 | 3.5% |
| Total | 141 | 100.0% |
Housing Finances in Salem
Median Income by Occupancy in Salem
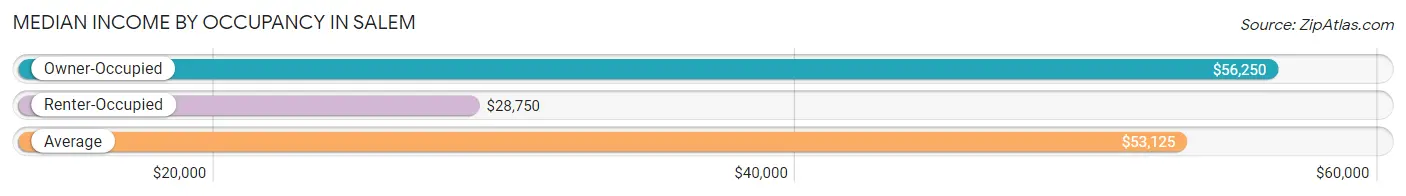
| Occupancy Type | # Households | Median Income |
| Owner-Occupied | 122 (86.5%) | $56,250 |
| Renter-Occupied | 19 (13.5%) | $28,750 |
| Average | 141 (100.0%) | $53,125 |
Occupancy by Householder Income Bracket in Salem
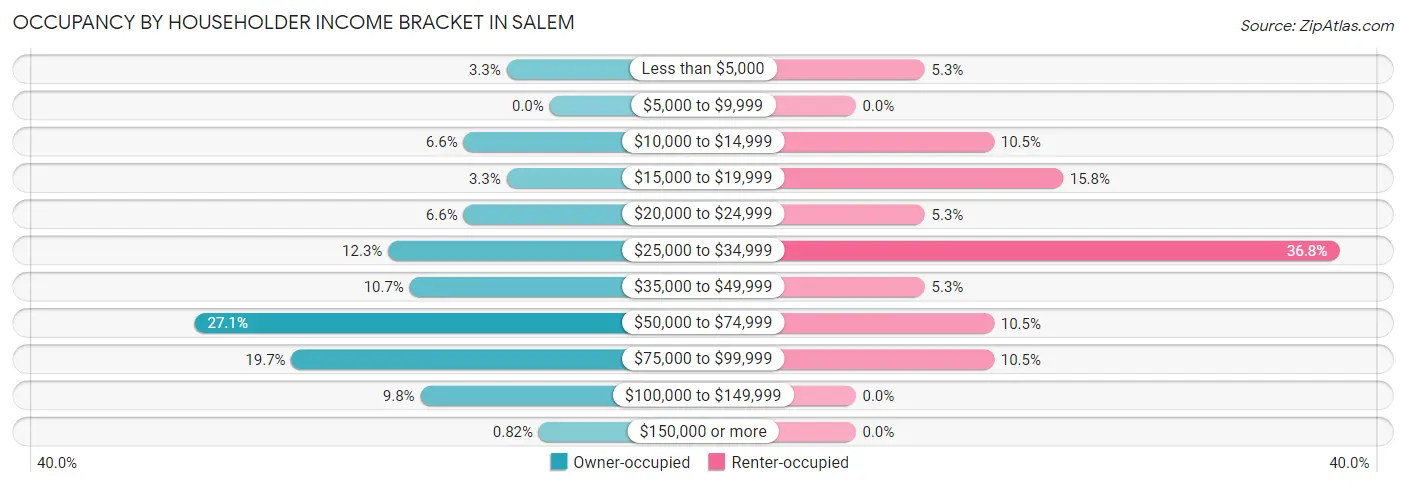
| Income Bracket | Owner-occupied | Renter-occupied |
| Less than $5,000 | 4 (3.3%) | 1 (5.3%) |
| $5,000 to $9,999 | 0 (0.0%) | 0 (0.0%) |
| $10,000 to $14,999 | 8 (6.6%) | 2 (10.5%) |
| $15,000 to $19,999 | 4 (3.3%) | 3 (15.8%) |
| $20,000 to $24,999 | 8 (6.6%) | 1 (5.3%) |
| $25,000 to $34,999 | 15 (12.3%) | 7 (36.8%) |
| $35,000 to $49,999 | 13 (10.7%) | 1 (5.3%) |
| $50,000 to $74,999 | 33 (27.1%) | 2 (10.5%) |
| $75,000 to $99,999 | 24 (19.7%) | 2 (10.5%) |
| $100,000 to $149,999 | 12 (9.8%) | 0 (0.0%) |
| $150,000 or more | 1 (0.8%) | 0 (0.0%) |
| Total | 122 (100.0%) | 19 (100.0%) |
Monthly Housing Cost Tiers in Salem
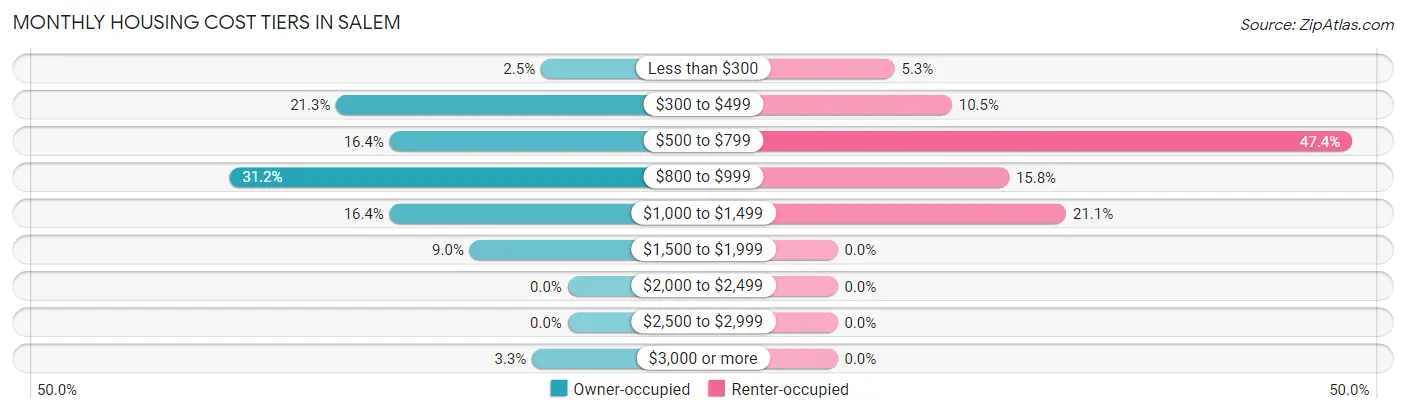
| Monthly Cost | Owner-occupied | Renter-occupied |
| Less than $300 | 3 (2.5%) | 1 (5.3%) |
| $300 to $499 | 26 (21.3%) | 2 (10.5%) |
| $500 to $799 | 20 (16.4%) | 9 (47.4%) |
| $800 to $999 | 38 (31.1%) | 3 (15.8%) |
| $1,000 to $1,499 | 20 (16.4%) | 4 (21.0%) |
| $1,500 to $1,999 | 11 (9.0%) | 0 (0.0%) |
| $2,000 to $2,499 | 0 (0.0%) | 0 (0.0%) |
| $2,500 to $2,999 | 0 (0.0%) | 0 (0.0%) |
| $3,000 or more | 4 (3.3%) | 0 (0.0%) |
| Total | 122 (100.0%) | 19 (100.0%) |
Physical Housing Characteristics in Salem
Housing Structures in Salem
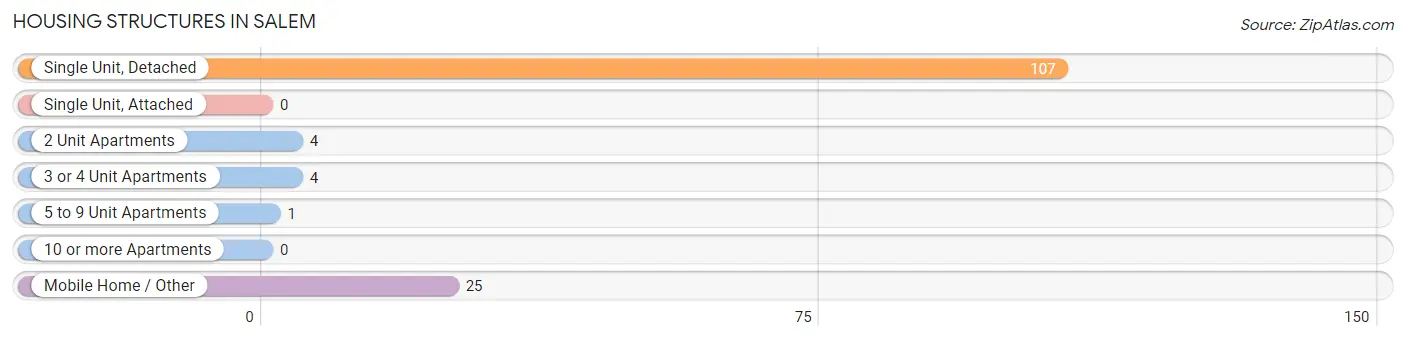
| Structure Type | # Housing Units | % Housing Units |
| Single Unit, Detached | 107 | 75.9% |
| Single Unit, Attached | 0 | 0.0% |
| 2 Unit Apartments | 4 | 2.8% |
| 3 or 4 Unit Apartments | 4 | 2.8% |
| 5 to 9 Unit Apartments | 1 | 0.7% |
| 10 or more Apartments | 0 | 0.0% |
| Mobile Home / Other | 25 | 17.7% |
| Total | 141 | 100.0% |
Housing Structures by Occupancy in Salem
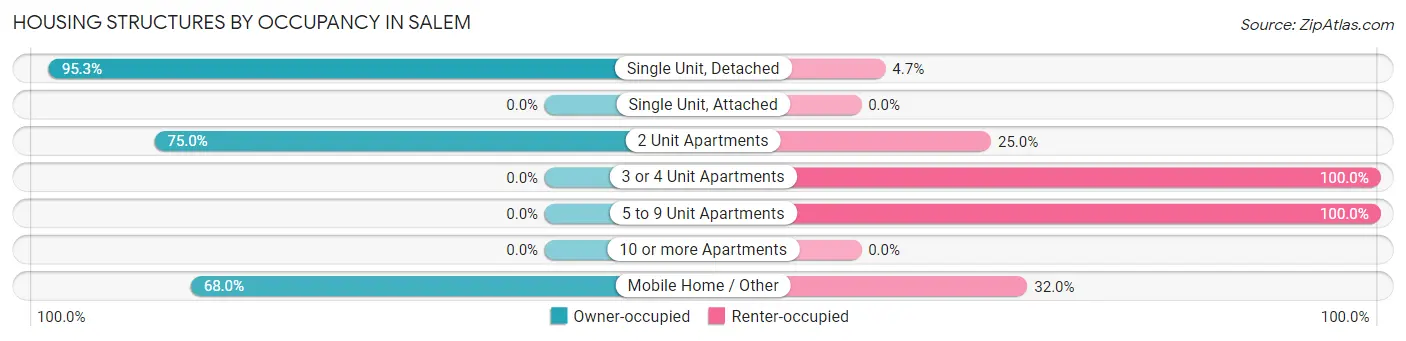
| Structure Type | Owner-occupied | Renter-occupied |
| Single Unit, Detached | 102 (95.3%) | 5 (4.7%) |
| Single Unit, Attached | 0 (0.0%) | 0 (0.0%) |
| 2 Unit Apartments | 3 (75.0%) | 1 (25.0%) |
| 3 or 4 Unit Apartments | 0 (0.0%) | 4 (100.0%) |
| 5 to 9 Unit Apartments | 0 (0.0%) | 1 (100.0%) |
| 10 or more Apartments | 0 (0.0%) | 0 (0.0%) |
| Mobile Home / Other | 17 (68.0%) | 8 (32.0%) |
| Total | 122 (86.5%) | 19 (13.5%) |
Housing Structures by Number of Rooms in Salem
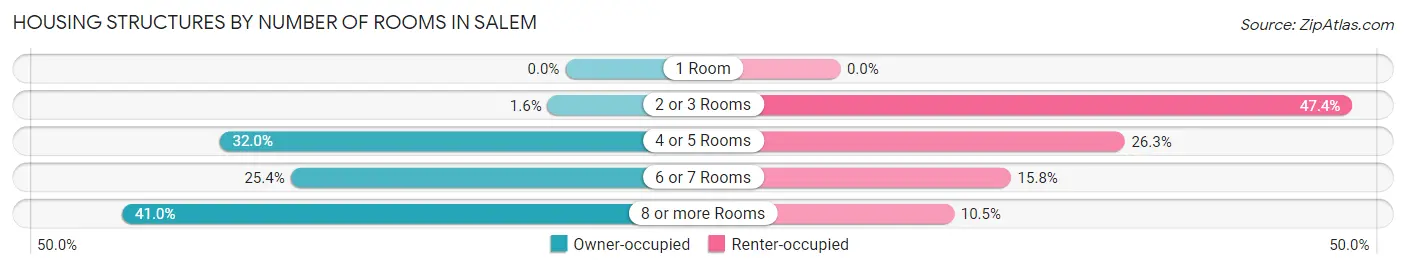
| Number of Rooms | Owner-occupied | Renter-occupied |
| 1 Room | 0 (0.0%) | 0 (0.0%) |
| 2 or 3 Rooms | 2 (1.6%) | 9 (47.4%) |
| 4 or 5 Rooms | 39 (32.0%) | 5 (26.3%) |
| 6 or 7 Rooms | 31 (25.4%) | 3 (15.8%) |
| 8 or more Rooms | 50 (41.0%) | 2 (10.5%) |
| Total | 122 (100.0%) | 19 (100.0%) |
Housing Structure by Heating Type in Salem
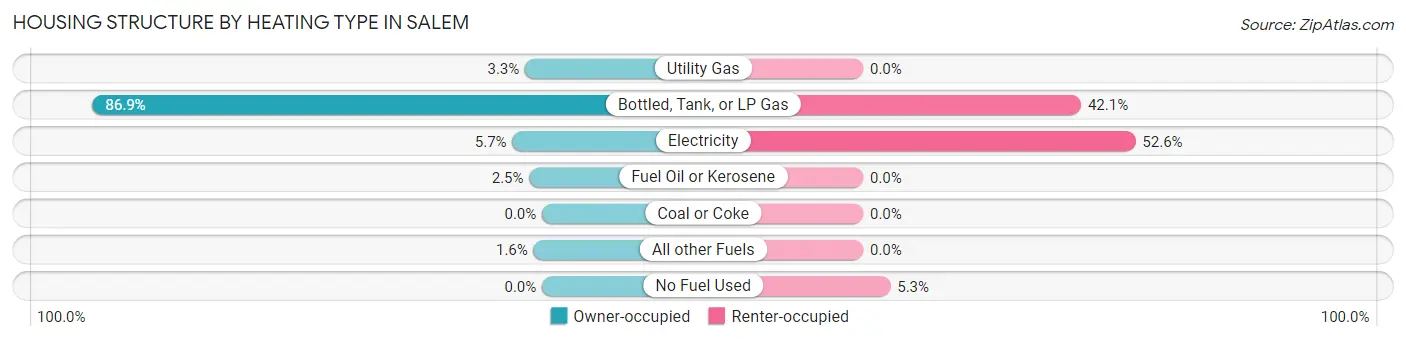
| Heating Type | Owner-occupied | Renter-occupied |
| Utility Gas | 4 (3.3%) | 0 (0.0%) |
| Bottled, Tank, or LP Gas | 106 (86.9%) | 8 (42.1%) |
| Electricity | 7 (5.7%) | 10 (52.6%) |
| Fuel Oil or Kerosene | 3 (2.5%) | 0 (0.0%) |
| Coal or Coke | 0 (0.0%) | 0 (0.0%) |
| All other Fuels | 2 (1.6%) | 0 (0.0%) |
| No Fuel Used | 0 (0.0%) | 1 (5.3%) |
| Total | 122 (100.0%) | 19 (100.0%) |
Household Vehicle Usage in Salem
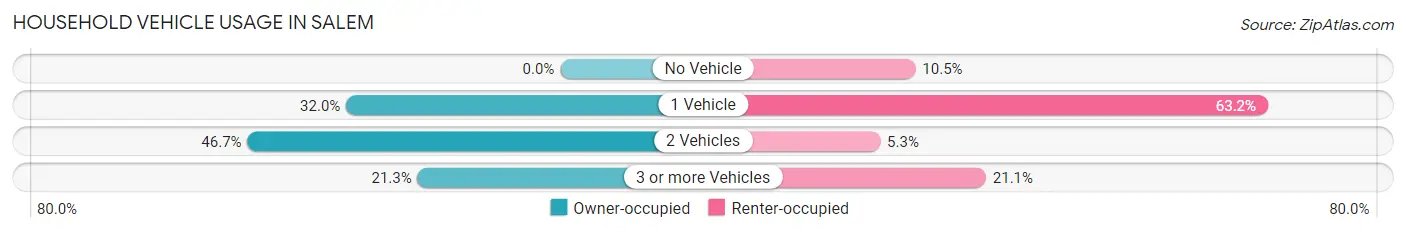
| Vehicles per Household | Owner-occupied | Renter-occupied |
| No Vehicle | 0 (0.0%) | 2 (10.5%) |
| 1 Vehicle | 39 (32.0%) | 12 (63.2%) |
| 2 Vehicles | 57 (46.7%) | 1 (5.3%) |
| 3 or more Vehicles | 26 (21.3%) | 4 (21.0%) |
| Total | 122 (100.0%) | 19 (100.0%) |
Real Estate & Mortgages in Salem
Real Estate and Mortgage Overview in Salem
| Characteristic | Without Mortgage | With Mortgage |
| Housing Units | 40 | 82 |
| Median Property Value | $81,300 | $71,300 |
| Median Household Income | $52,500 | $0 |
| Monthly Housing Costs | $456 | $4 |
| Real Estate Taxes | $1,136 | $4 |
Property Value by Mortgage Status in Salem
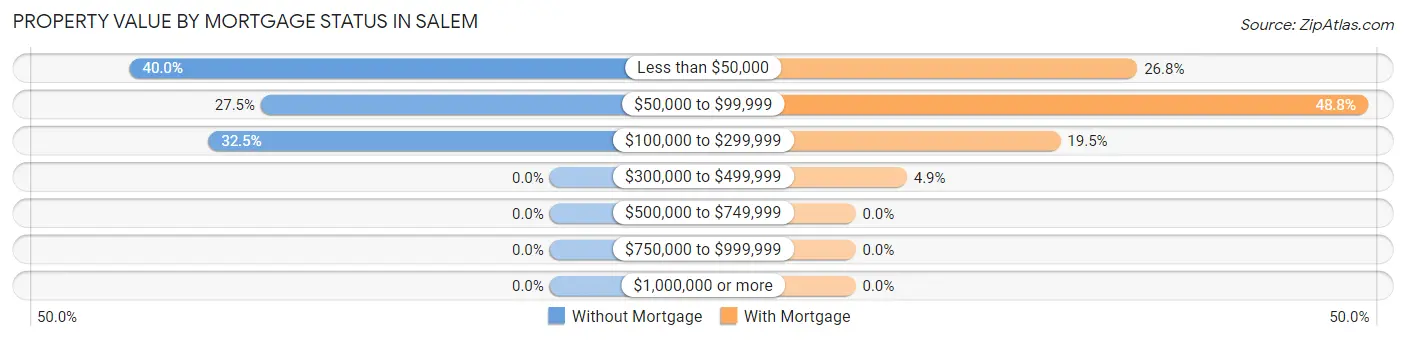
| Property Value | Without Mortgage | With Mortgage |
| Less than $50,000 | 16 (40.0%) | 22 (26.8%) |
| $50,000 to $99,999 | 11 (27.5%) | 40 (48.8%) |
| $100,000 to $299,999 | 13 (32.5%) | 16 (19.5%) |
| $300,000 to $499,999 | 0 (0.0%) | 4 (4.9%) |
| $500,000 to $749,999 | 0 (0.0%) | 0 (0.0%) |
| $750,000 to $999,999 | 0 (0.0%) | 0 (0.0%) |
| $1,000,000 or more | 0 (0.0%) | 0 (0.0%) |
| Total | 40 (100.0%) | 82 (100.0%) |
Household Income by Mortgage Status in Salem
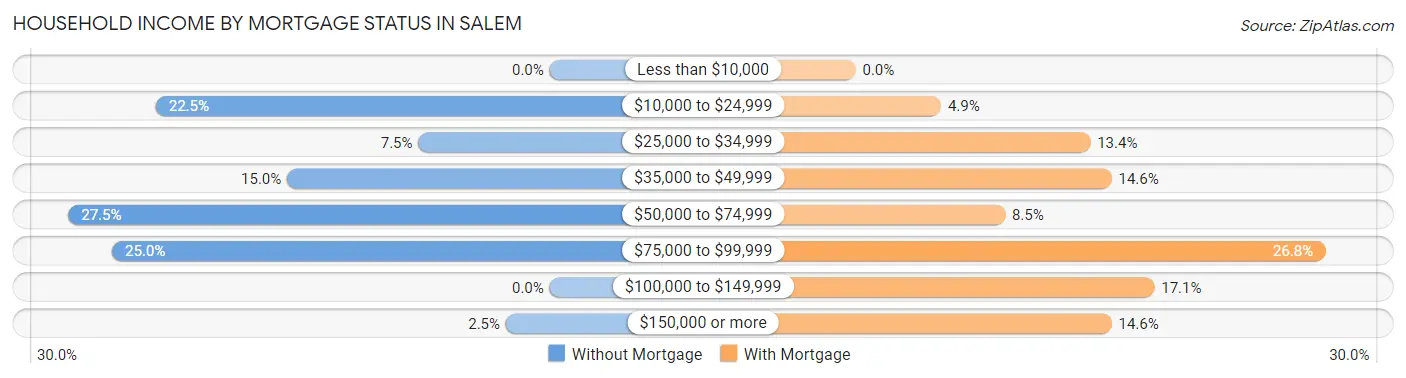
| Household Income | Without Mortgage | With Mortgage |
| Less than $10,000 | 0 (0.0%) | 0 (0.0%) |
| $10,000 to $24,999 | 9 (22.5%) | 4 (4.9%) |
| $25,000 to $34,999 | 3 (7.5%) | 11 (13.4%) |
| $35,000 to $49,999 | 6 (15.0%) | 12 (14.6%) |
| $50,000 to $74,999 | 11 (27.5%) | 7 (8.5%) |
| $75,000 to $99,999 | 10 (25.0%) | 22 (26.8%) |
| $100,000 to $149,999 | 0 (0.0%) | 14 (17.1%) |
| $150,000 or more | 1 (2.5%) | 12 (14.6%) |
| Total | 40 (100.0%) | 82 (100.0%) |
Property Value to Household Income Ratio in Salem
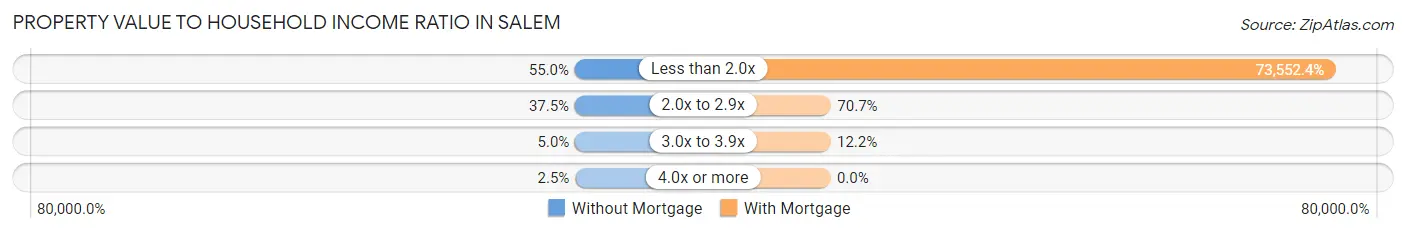
| Value-to-Income Ratio | Without Mortgage | With Mortgage |
| Less than 2.0x | 22 (55.0%) | 60,313 (73,552.4%) |
| 2.0x to 2.9x | 15 (37.5%) | 58 (70.7%) |
| 3.0x to 3.9x | 2 (5.0%) | 10 (12.2%) |
| 4.0x or more | 1 (2.5%) | 0 (0.0%) |
| Total | 40 (100.0%) | 82 (100.0%) |
Real Estate Taxes by Mortgage Status in Salem
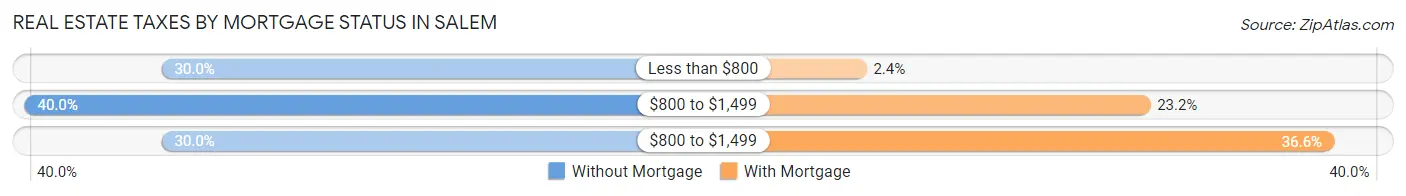
| Property Taxes | Without Mortgage | With Mortgage |
| Less than $800 | 12 (30.0%) | 2 (2.4%) |
| $800 to $1,499 | 16 (40.0%) | 19 (23.2%) |
| $800 to $1,499 | 12 (30.0%) | 30 (36.6%) |
| Total | 40 (100.0%) | 82 (100.0%) |
Health & Disability in Salem
Health Insurance Coverage by Age in Salem
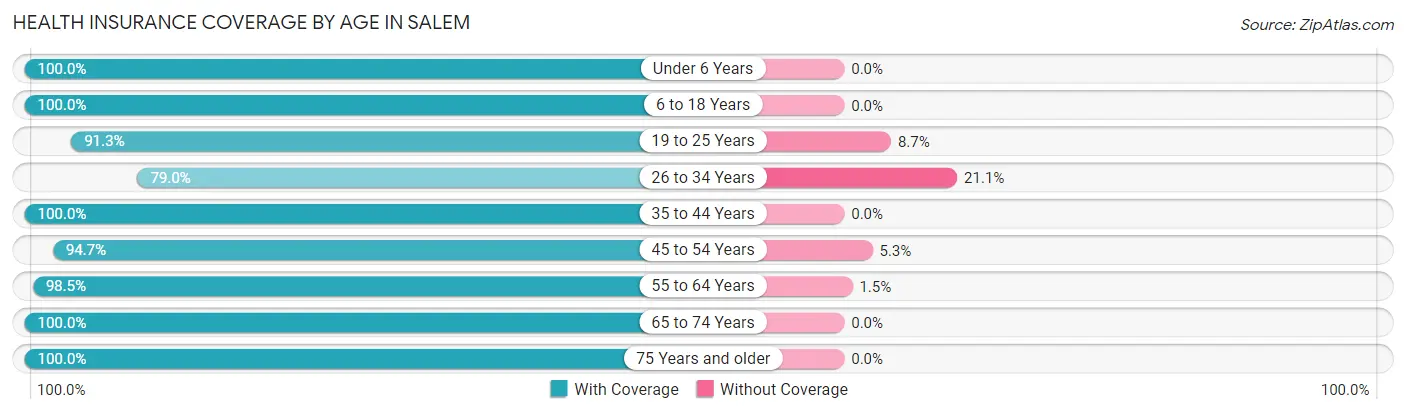
| Age Bracket | With Coverage | Without Coverage |
| Under 6 Years | 21 (100.0%) | 0 (0.0%) |
| 6 to 18 Years | 44 (100.0%) | 0 (0.0%) |
| 19 to 25 Years | 21 (91.3%) | 2 (8.7%) |
| 26 to 34 Years | 30 (78.9%) | 8 (21.0%) |
| 35 to 44 Years | 27 (100.0%) | 0 (0.0%) |
| 45 to 54 Years | 36 (94.7%) | 2 (5.3%) |
| 55 to 64 Years | 65 (98.5%) | 1 (1.5%) |
| 65 to 74 Years | 37 (100.0%) | 0 (0.0%) |
| 75 Years and older | 42 (100.0%) | 0 (0.0%) |
| Total | 323 (96.1%) | 13 (3.9%) |
Health Insurance Coverage by Citizenship Status in Salem
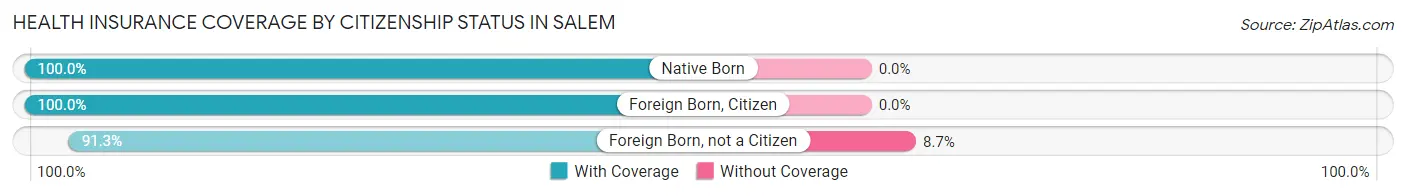
| Citizenship Status | With Coverage | Without Coverage |
| Native Born | 21 (100.0%) | 0 (0.0%) |
| Foreign Born, Citizen | 44 (100.0%) | 0 (0.0%) |
| Foreign Born, not a Citizen | 21 (91.3%) | 2 (8.7%) |
Health Insurance Coverage by Household Income in Salem
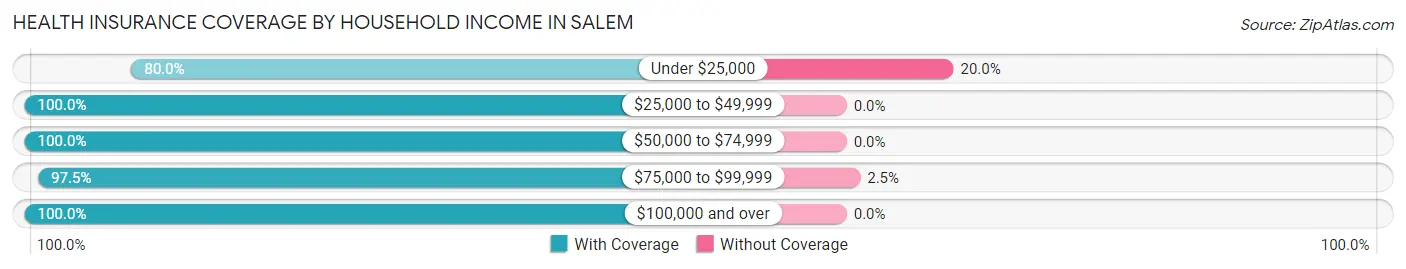
| Household Income | With Coverage | Without Coverage |
| Under $25,000 | 44 (80.0%) | 11 (20.0%) |
| $25,000 to $49,999 | 68 (100.0%) | 0 (0.0%) |
| $50,000 to $74,999 | 106 (100.0%) | 0 (0.0%) |
| $75,000 to $99,999 | 77 (97.5%) | 2 (2.5%) |
| $100,000 and over | 28 (100.0%) | 0 (0.0%) |
Public vs Private Health Insurance Coverage by Age in Salem
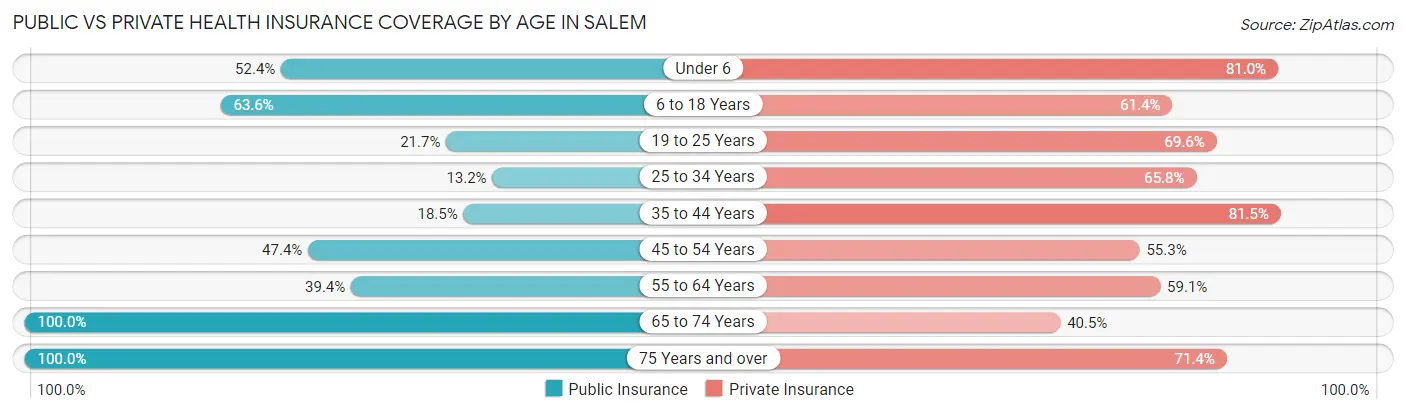
| Age Bracket | Public Insurance | Private Insurance |
| Under 6 | 11 (52.4%) | 17 (80.9%) |
| 6 to 18 Years | 28 (63.6%) | 27 (61.4%) |
| 19 to 25 Years | 5 (21.7%) | 16 (69.6%) |
| 25 to 34 Years | 5 (13.2%) | 25 (65.8%) |
| 35 to 44 Years | 5 (18.5%) | 22 (81.5%) |
| 45 to 54 Years | 18 (47.4%) | 21 (55.3%) |
| 55 to 64 Years | 26 (39.4%) | 39 (59.1%) |
| 65 to 74 Years | 37 (100.0%) | 15 (40.5%) |
| 75 Years and over | 42 (100.0%) | 30 (71.4%) |
| Total | 177 (52.7%) | 212 (63.1%) |
Disability Status by Sex by Age in Salem
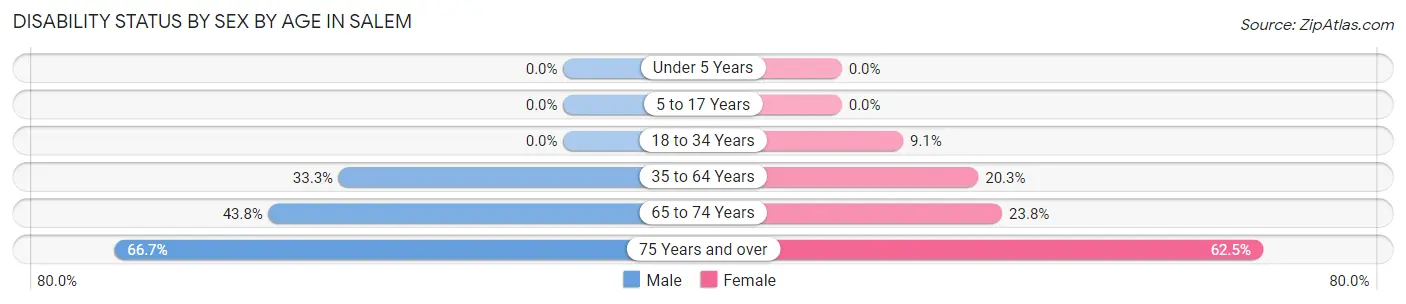
| Age Bracket | Male | Female |
| Under 5 Years | 0 (0.0%) | 0 (0.0%) |
| 5 to 17 Years | 0 (0.0%) | 0 (0.0%) |
| 18 to 34 Years | 0 (0.0%) | 3 (9.1%) |
| 35 to 64 Years | 19 (33.3%) | 15 (20.3%) |
| 65 to 74 Years | 7 (43.8%) | 5 (23.8%) |
| 75 Years and over | 12 (66.7%) | 15 (62.5%) |
Disability Class by Sex by Age in Salem
Disability Class: Hearing Difficulty
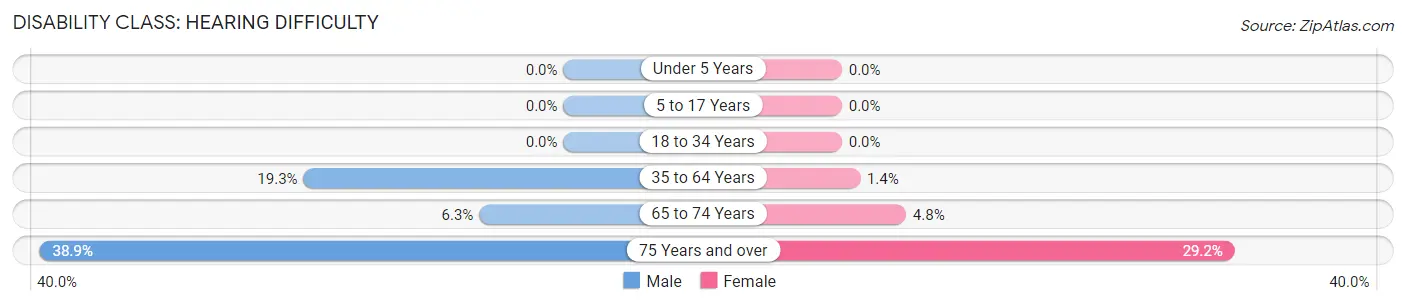
| Age Bracket | Male | Female |
| Under 5 Years | 0 (0.0%) | 0 (0.0%) |
| 5 to 17 Years | 0 (0.0%) | 0 (0.0%) |
| 18 to 34 Years | 0 (0.0%) | 0 (0.0%) |
| 35 to 64 Years | 11 (19.3%) | 1 (1.3%) |
| 65 to 74 Years | 1 (6.2%) | 1 (4.8%) |
| 75 Years and over | 7 (38.9%) | 7 (29.2%) |
Disability Class: Vision Difficulty
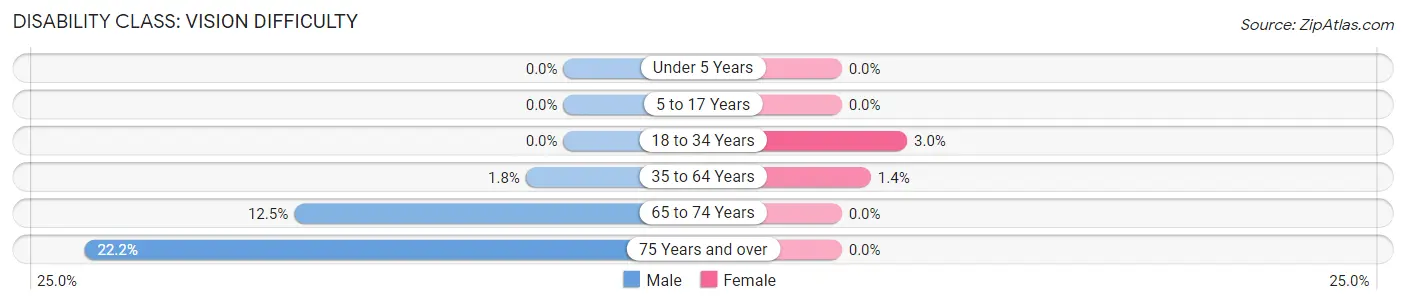
| Age Bracket | Male | Female |
| Under 5 Years | 0 (0.0%) | 0 (0.0%) |
| 5 to 17 Years | 0 (0.0%) | 0 (0.0%) |
| 18 to 34 Years | 0 (0.0%) | 1 (3.0%) |
| 35 to 64 Years | 1 (1.8%) | 1 (1.3%) |
| 65 to 74 Years | 2 (12.5%) | 0 (0.0%) |
| 75 Years and over | 4 (22.2%) | 0 (0.0%) |
Disability Class: Cognitive Difficulty
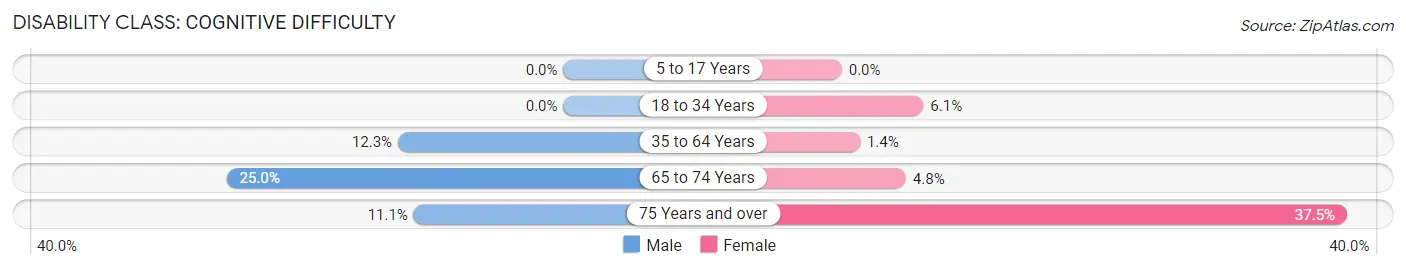
| Age Bracket | Male | Female |
| 5 to 17 Years | 0 (0.0%) | 0 (0.0%) |
| 18 to 34 Years | 0 (0.0%) | 2 (6.1%) |
| 35 to 64 Years | 7 (12.3%) | 1 (1.3%) |
| 65 to 74 Years | 4 (25.0%) | 1 (4.8%) |
| 75 Years and over | 2 (11.1%) | 9 (37.5%) |
Disability Class: Ambulatory Difficulty
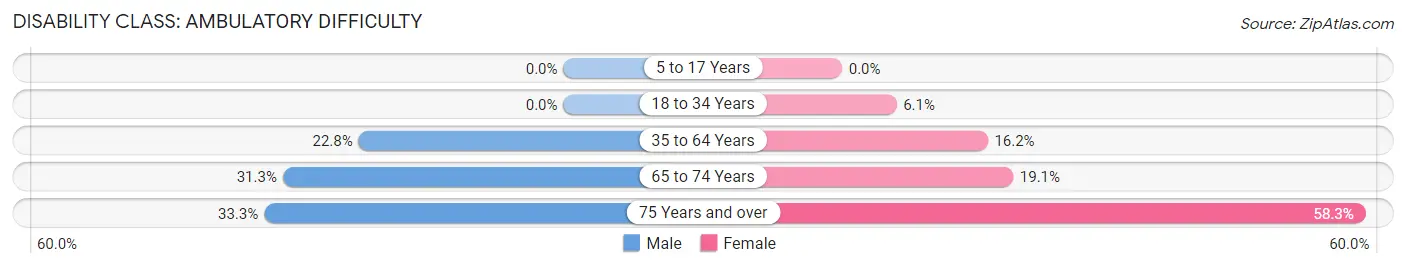
| Age Bracket | Male | Female |
| 5 to 17 Years | 0 (0.0%) | 0 (0.0%) |
| 18 to 34 Years | 0 (0.0%) | 2 (6.1%) |
| 35 to 64 Years | 13 (22.8%) | 12 (16.2%) |
| 65 to 74 Years | 5 (31.2%) | 4 (19.1%) |
| 75 Years and over | 6 (33.3%) | 14 (58.3%) |
Disability Class: Self-Care Difficulty
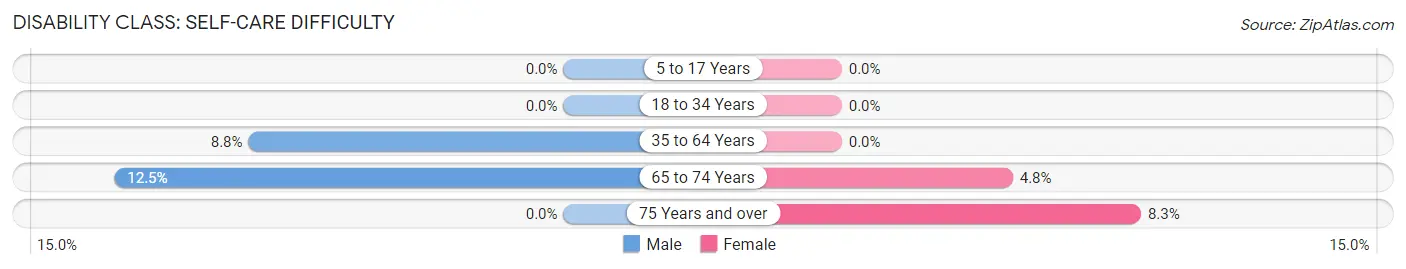
| Age Bracket | Male | Female |
| 5 to 17 Years | 0 (0.0%) | 0 (0.0%) |
| 18 to 34 Years | 0 (0.0%) | 0 (0.0%) |
| 35 to 64 Years | 5 (8.8%) | 0 (0.0%) |
| 65 to 74 Years | 2 (12.5%) | 1 (4.8%) |
| 75 Years and over | 0 (0.0%) | 2 (8.3%) |
Technology Access in Salem
Computing Device Access in Salem
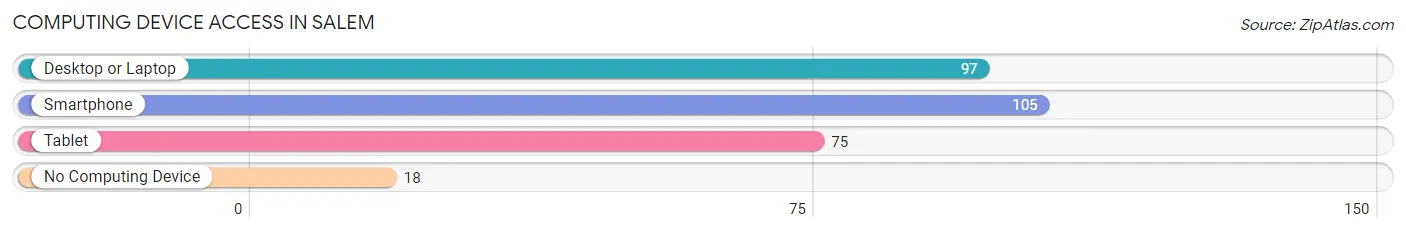
| Device Type | # Households | % Households |
| Desktop or Laptop | 97 | 68.8% |
| Smartphone | 105 | 74.5% |
| Tablet | 75 | 53.2% |
| No Computing Device | 18 | 12.8% |
| Total | 141 | 100.0% |
Internet Access in Salem
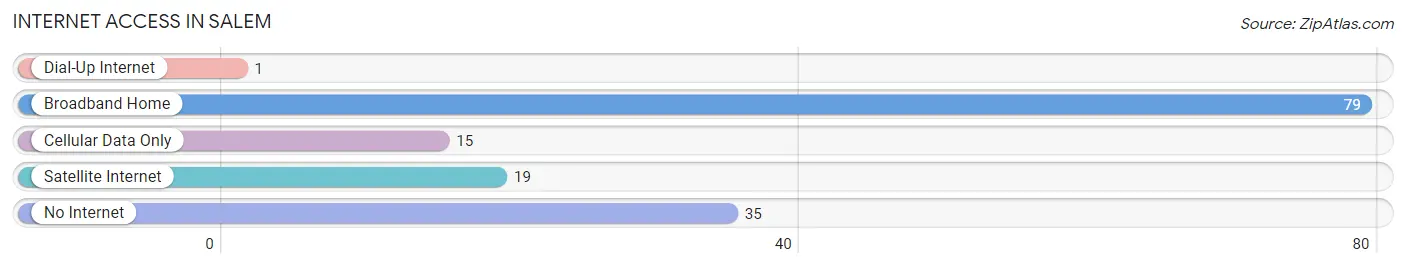
| Internet Type | # Households | % Households |
| Dial-Up Internet | 1 | 0.7% |
| Broadband Home | 79 | 56.0% |
| Cellular Data Only | 15 | 10.6% |
| Satellite Internet | 19 | 13.5% |
| No Internet | 35 | 24.8% |
| Total | 141 | 100.0% |
Salem Summary
Salem, Iowa is a small town located in Henry County in the southeastern corner of the state. It is situated along the Iowa River and is part of the Keokuk-Fort Madison Metropolitan Statistical Area. The town has a population of just over 1,000 people and is known for its rural charm and friendly atmosphere.
Geography
Salem is located in the southeastern corner of Iowa, in Henry County. It is situated along the Iowa River, which is a tributary of the Mississippi River. The town is located about 25 miles south of Burlington and about 40 miles west of Davenport. The terrain is mostly flat, with some rolling hills in the area. The climate is humid continental, with hot summers and cold winters.
Economy
The economy of Salem is largely based on agriculture. The town is home to several farms, which produce corn, soybeans, and other crops. There are also several small businesses in the area, including a grocery store, a hardware store, and a few restaurants. The town also has a few manufacturing plants, which produce a variety of products, including furniture and automotive parts.
Demographics
As of the 2010 census, the population of Salem was 1,039. The racial makeup of the town was 97.3% White, 0.7% African American, 0.3% Native American, 0.2% Asian, 0.1% Pacific Islander, 0.3% from other races, and 1.2% from two or more races. Hispanic or Latino of any race were 1.2% of the population.
The median income for a household in Salem was $41,250, and the median income for a family was $48,750. Males had a median income of $35,000 versus $25,000 for females. The per capita income for the town was $19,845. About 8.2% of families and 10.2% of the population were below the poverty line, including 14.3% of those under age 18 and 8.3% of those age 65 or over.
History
Salem was founded in 1837 by a group of settlers from Ohio. The town was named after Salem, Ohio, which was the hometown of the settlers. The town grew slowly, but steadily, and by the late 19th century, it had become a thriving agricultural community. The town was also home to several churches, a school, and a post office.
In the early 20th century, Salem experienced a period of growth and prosperity. The town was home to several businesses, including a bank, a newspaper, and a hotel. The town also had a movie theater and a library.
In the late 20th century, Salem experienced a period of decline. Many of the businesses closed, and the population began to decline. However, in recent years, the town has seen a resurgence in population and economic activity. The town is now home to several small businesses, and the population is slowly increasing.
Common Questions
What is Per Capita Income in Salem?
Per Capita income in Salem is $23,549.
What is the Median Family Income in Salem?
Median Family Income in Salem is $61,944.
What is the Median Household income in Salem?
Median Household Income in Salem is $53,125.
What is Income or Wage Gap in Salem?
Income or Wage Gap in Salem is 15.5%.
Women in Salem earn 84.5 cents for every dollar earned by a man.
What is Inequality or Gini Index in Salem?
Inequality or Gini Index in Salem is 0.34.
What is the Total Population of Salem?
Total Population of Salem is 338.
What is the Total Male Population of Salem?
Total Male Population of Salem is 164.
What is the Total Female Population of Salem?
Total Female Population of Salem is 174.
What is the Ratio of Males per 100 Females in Salem?
There are 94.25 Males per 100 Females in Salem.
What is the Ratio of Females per 100 Males in Salem?
There are 106.10 Females per 100 Males in Salem.
What is the Median Population Age in Salem?
Median Population Age in Salem is 50.4 Years.
What is the Average Family Size in Salem
Average Family Size in Salem is 2.9 People.
What is the Average Household Size in Salem
Average Household Size in Salem is 2.4 People.
How Large is the Labor Force in Salem?
There are 147 People in the Labor Forcein in Salem.
What is the Percentage of People in the Labor Force in Salem?
53.5% of People are in the Labor Force in Salem.
What is the Unemployment Rate in Salem?
Unemployment Rate in Salem is 2.1%.