Protivin, IA Map & Demographics
Protivin Map
Protivin Overview
$29,925
PER CAPITA INCOME
$93,750
AVG FAMILY INCOME
$59,375
AVG HOUSEHOLD INCOME
3.2%
WAGE / INCOME GAP [ % ]
96.8¢/ $1
WAGE / INCOME GAP [ $ ]
0.30
INEQUALITY / GINI INDEX
365
TOTAL POPULATION
180
MALE POPULATION
185
FEMALE POPULATION
97.30
MALES / 100 FEMALES
102.78
FEMALES / 100 MALES
37.1
MEDIAN AGE
3.2
AVG FAMILY SIZE
2.4
AVG HOUSEHOLD SIZE
184
LABOR FORCE [ PEOPLE ]
74.2%
PERCENT IN LABOR FORCE
3.3%
UNEMPLOYMENT RATE
Protivin Zip Codes
Income in Protivin
Income Overview in Protivin
Per Capita Income in Protivin is $29,925, while median incomes of families and households are $93,750 and $59,375 respectively.
| Characteristic | Number | Measure |
| Per Capita Income | 365 | $29,925 |
| Median Family Income | 94 | $93,750 |
| Mean Family Income | 94 | $89,548 |
| Median Household Income | 154 | $59,375 |
| Mean Household Income | 154 | $69,738 |
| Income Deficit | 94 | $0 |
| Wage / Income Gap (%) | 365 | 3.22% |
| Wage / Income Gap ($) | 365 | 96.78¢ per $1 |
| Gini / Inequality Index | 365 | 0.30 |
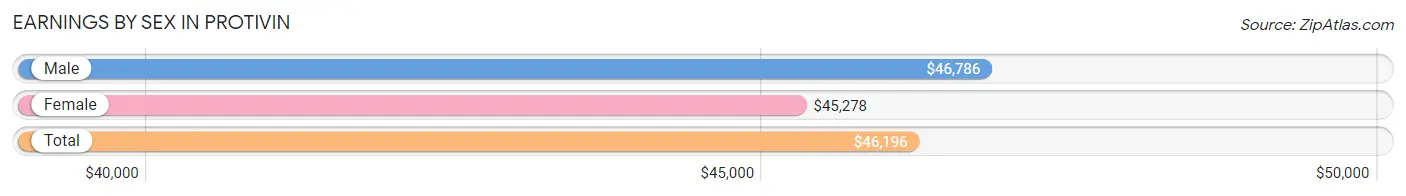
Earnings by Sex in Protivin
Average Earnings in Protivin are $46,196, $46,786 for men and $45,278 for women, a difference of 3.2%.
| Sex | Number | Average Earnings |
| Male | 104 (54.7%) | $46,786 |
| Female | 86 (45.3%) | $45,278 |
| Total | 190 (100.0%) | $46,196 |
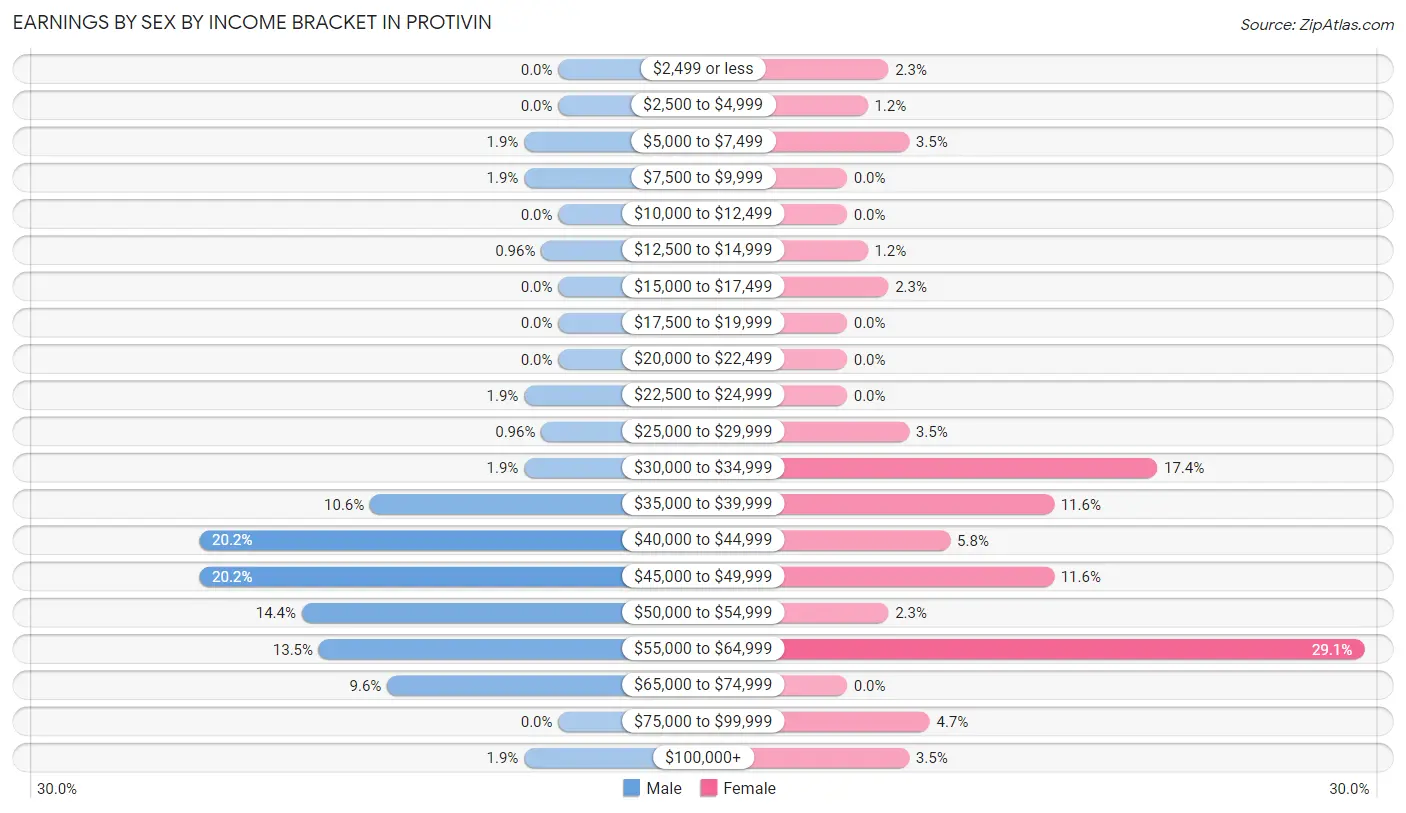
Earnings by Sex by Income Bracket in Protivin
The most common earnings brackets in Protivin are $40,000 to $44,999 for men (21 | 20.2%) and $55,000 to $64,999 for women (25 | 29.1%).
| Income | Male | Female |
| $2,499 or less | 0 (0.0%) | 2 (2.3%) |
| $2,500 to $4,999 | 0 (0.0%) | 1 (1.2%) |
| $5,000 to $7,499 | 2 (1.9%) | 3 (3.5%) |
| $7,500 to $9,999 | 2 (1.9%) | 0 (0.0%) |
| $10,000 to $12,499 | 0 (0.0%) | 0 (0.0%) |
| $12,500 to $14,999 | 1 (1.0%) | 1 (1.2%) |
| $15,000 to $17,499 | 0 (0.0%) | 2 (2.3%) |
| $17,500 to $19,999 | 0 (0.0%) | 0 (0.0%) |
| $20,000 to $22,499 | 0 (0.0%) | 0 (0.0%) |
| $22,500 to $24,999 | 2 (1.9%) | 0 (0.0%) |
| $25,000 to $29,999 | 1 (1.0%) | 3 (3.5%) |
| $30,000 to $34,999 | 2 (1.9%) | 15 (17.4%) |
| $35,000 to $39,999 | 11 (10.6%) | 10 (11.6%) |
| $40,000 to $44,999 | 21 (20.2%) | 5 (5.8%) |
| $45,000 to $49,999 | 21 (20.2%) | 10 (11.6%) |
| $50,000 to $54,999 | 15 (14.4%) | 2 (2.3%) |
| $55,000 to $64,999 | 14 (13.5%) | 25 (29.1%) |
| $65,000 to $74,999 | 10 (9.6%) | 0 (0.0%) |
| $75,000 to $99,999 | 0 (0.0%) | 4 (4.6%) |
| $100,000+ | 2 (1.9%) | 3 (3.5%) |
| Total | 104 (100.0%) | 86 (100.0%) |
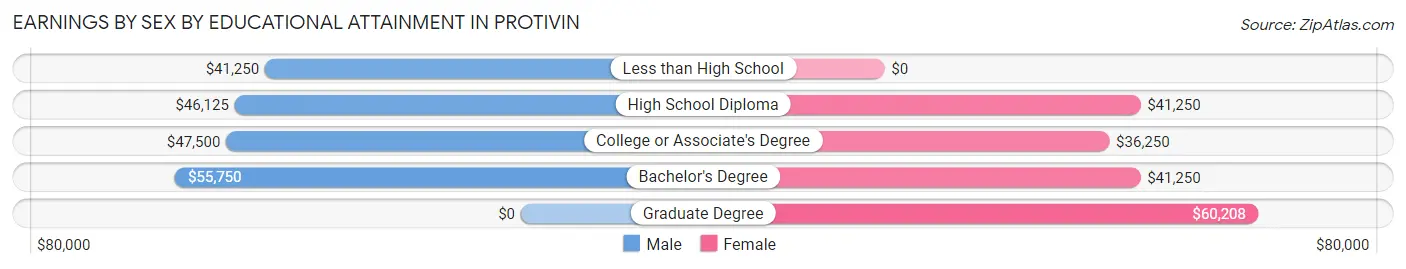
Earnings by Sex by Educational Attainment in Protivin
Average earnings in Protivin are $46,786 for men and $45,556 for women, a difference of 2.6%. Men with an educational attainment of bachelor's degree enjoy the highest average annual earnings of $55,750, while those with less than high school education earn the least with $41,250. Women with an educational attainment of graduate degree earn the most with the average annual earnings of $60,208, while those with college or associate's degree education have the smallest earnings of $36,250.
| Educational Attainment | Male Income | Female Income |
| Less than High School | $41,250 | $0 |
| High School Diploma | $46,125 | $41,250 |
| College or Associate's Degree | $47,500 | $36,250 |
| Bachelor's Degree | $55,750 | $41,250 |
| Graduate Degree | - | - |
| Total | $46,786 | $45,556 |
Family Income in Protivin
Family Income Brackets in Protivin
According to the Protivin family income data, there are 33 families falling into the $75,000 to $99,999 income range, which is the most common income bracket and makes up 35.1% of all families.
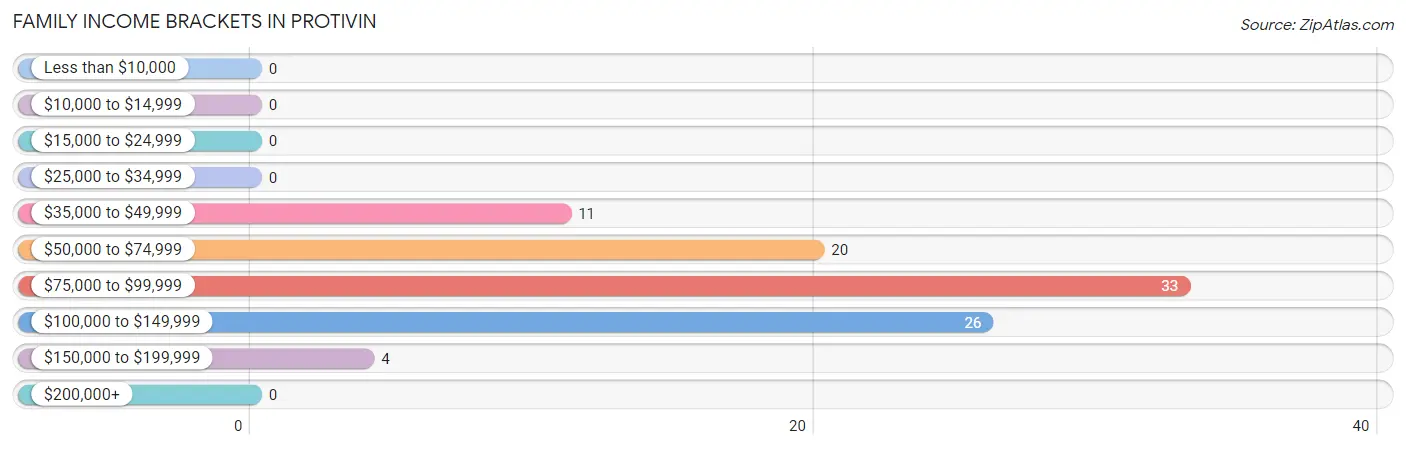
| Income Bracket | # Families | % Families |
| Less than $10,000 | 0 | 0.0% |
| $10,000 to $14,999 | 0 | 0.0% |
| $15,000 to $24,999 | 0 | 0.0% |
| $25,000 to $34,999 | 0 | 0.0% |
| $35,000 to $49,999 | 11 | 11.7% |
| $50,000 to $74,999 | 20 | 21.3% |
| $75,000 to $99,999 | 33 | 35.1% |
| $100,000 to $149,999 | 26 | 27.7% |
| $150,000 to $199,999 | 4 | 4.3% |
| $200,000+ | 0 | 0.0% |
Family Income by Famaliy Size in Protivin
5-person families (19 | 20.2%) account for the highest median family income in Protivin with $103,125 per family, while 2-person families (50 | 53.2%) have the highest median income of $42,500 per family member.
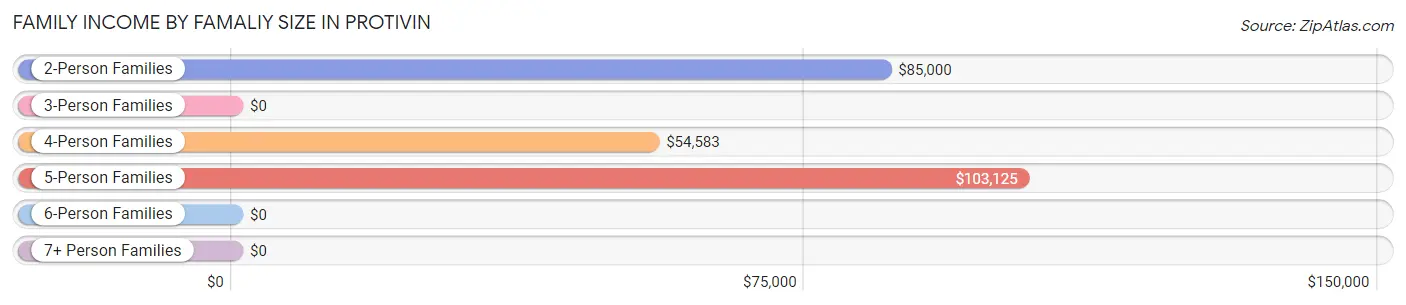
| Income Bracket | # Families | Median Income |
| 2-Person Families | 50 (53.2%) | $85,000 |
| 3-Person Families | 9 (9.6%) | $0 |
| 4-Person Families | 15 (16.0%) | $54,583 |
| 5-Person Families | 19 (20.2%) | $103,125 |
| 6-Person Families | 1 (1.1%) | $0 |
| 7+ Person Families | 0 (0.0%) | $0 |
| Total | 94 (100.0%) | $93,750 |
Family Income by Number of Earners in Protivin
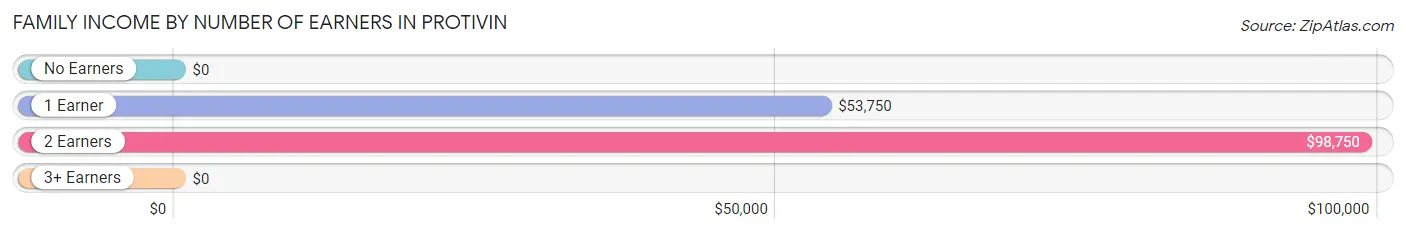
| Number of Earners | # Families | Median Income |
| No Earners | 7 (7.4%) | $0 |
| 1 Earner | 24 (25.5%) | $53,750 |
| 2 Earners | 63 (67.0%) | $98,750 |
| 3+ Earners | 0 (0.0%) | $0 |
| Total | 94 (100.0%) | $93,750 |
Household Income in Protivin
Household Income Brackets in Protivin
With 39 households falling in the category, the $35,000 to $49,999 income range is the most frequent in Protivin, accounting for 25.3% of all households.
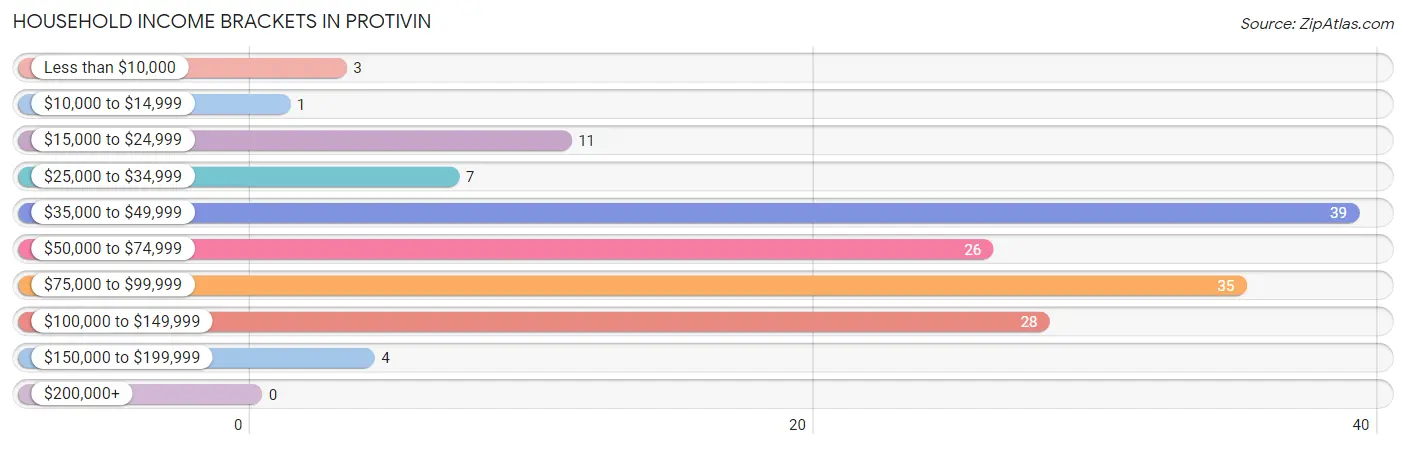
| Income Bracket | # Households | % Households |
| Less than $10,000 | 3 | 1.9% |
| $10,000 to $14,999 | 1 | 0.6% |
| $15,000 to $24,999 | 11 | 7.1% |
| $25,000 to $34,999 | 7 | 4.5% |
| $35,000 to $49,999 | 39 | 25.3% |
| $50,000 to $74,999 | 26 | 16.9% |
| $75,000 to $99,999 | 35 | 22.7% |
| $100,000 to $149,999 | 28 | 18.2% |
| $150,000 to $199,999 | 4 | 2.6% |
| $200,000+ | 0 | 0.0% |
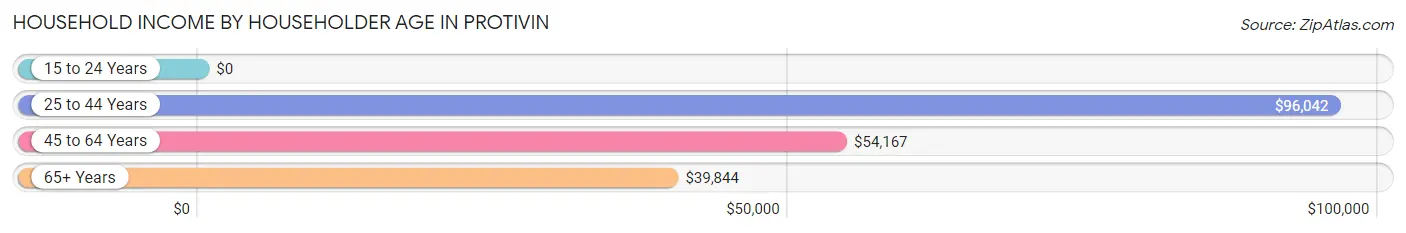
Household Income by Householder Age in Protivin
The median household income in Protivin is $59,375, with the highest median household income of $96,042 found in the 25 to 44 years age bracket for the primary householder. A total of 63 households (40.9%) fall into this category.
| Income Bracket | # Households | Median Income |
| 15 to 24 Years | 0 (0.0%) | $0 |
| 25 to 44 Years | 63 (40.9%) | $96,042 |
| 45 to 64 Years | 36 (23.4%) | $54,167 |
| 65+ Years | 55 (35.7%) | $39,844 |
| Total | 154 (100.0%) | $59,375 |
Poverty in Protivin
Income Below Poverty by Sex and Age in Protivin
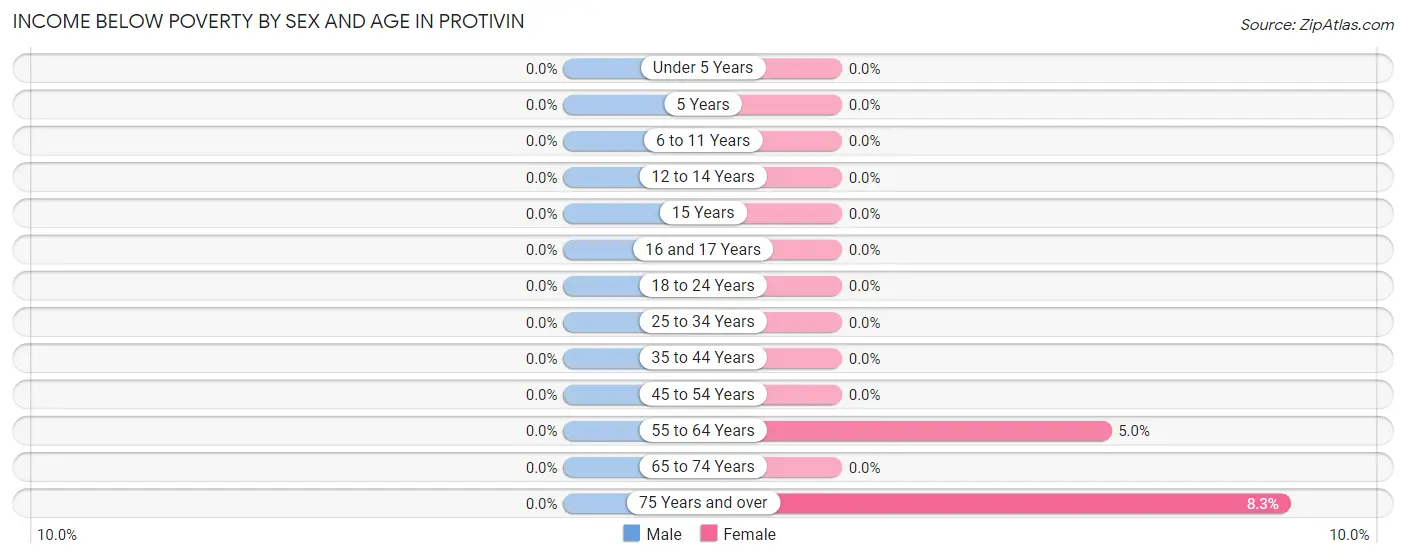
| Age Bracket | Male | Female |
| Under 5 Years | 0 (0.0%) | 0 (0.0%) |
| 5 Years | 0 (0.0%) | 0 (0.0%) |
| 6 to 11 Years | 0 (0.0%) | 0 (0.0%) |
| 12 to 14 Years | 0 (0.0%) | 0 (0.0%) |
| 15 Years | 0 (0.0%) | 0 (0.0%) |
| 16 and 17 Years | 0 (0.0%) | 0 (0.0%) |
| 18 to 24 Years | 0 (0.0%) | 0 (0.0%) |
| 25 to 34 Years | 0 (0.0%) | 0 (0.0%) |
| 35 to 44 Years | 0 (0.0%) | 0 (0.0%) |
| 45 to 54 Years | 0 (0.0%) | 0 (0.0%) |
| 55 to 64 Years | 0 (0.0%) | 1 (5.0%) |
| 65 to 74 Years | 0 (0.0%) | 0 (0.0%) |
| 75 Years and over | 0 (0.0%) | 3 (8.3%) |
| Total | 0 (0.0%) | 4 (2.2%) |
Income Above Poverty by Sex and Age in Protivin
According to the poverty statistics in Protivin, males aged under 5 years and females aged under 5 years are the age groups that are most secure financially, with 100.0% of males and 100.0% of females in these age groups living above the poverty line.
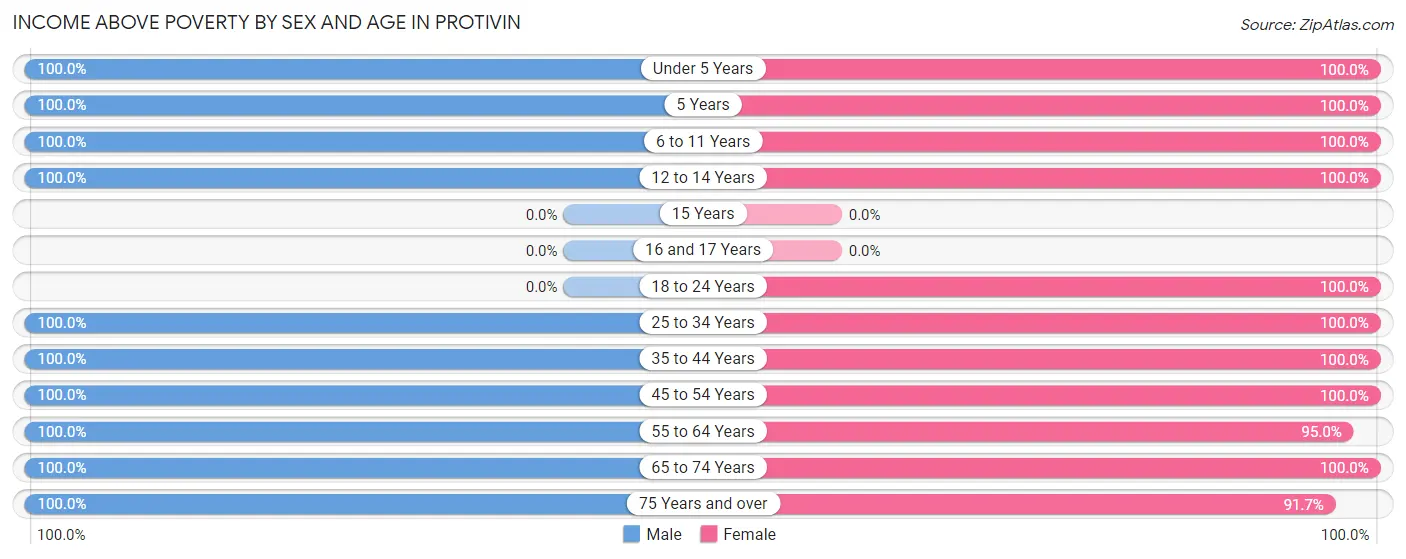
| Age Bracket | Male | Female |
| Under 5 Years | 32 (100.0%) | 14 (100.0%) |
| 5 Years | 1 (100.0%) | 24 (100.0%) |
| 6 to 11 Years | 21 (100.0%) | 13 (100.0%) |
| 12 to 14 Years | 9 (100.0%) | 3 (100.0%) |
| 15 Years | 0 (0.0%) | 0 (0.0%) |
| 16 and 17 Years | 0 (0.0%) | 0 (0.0%) |
| 18 to 24 Years | 0 (0.0%) | 2 (100.0%) |
| 25 to 34 Years | 20 (100.0%) | 29 (100.0%) |
| 35 to 44 Years | 35 (100.0%) | 21 (100.0%) |
| 45 to 54 Years | 2 (100.0%) | 6 (100.0%) |
| 55 to 64 Years | 26 (100.0%) | 19 (95.0%) |
| 65 to 74 Years | 22 (100.0%) | 17 (100.0%) |
| 75 Years and over | 12 (100.0%) | 33 (91.7%) |
| Total | 180 (100.0%) | 181 (97.8%) |
Income Below Poverty Among Married-Couple Families in Protivin
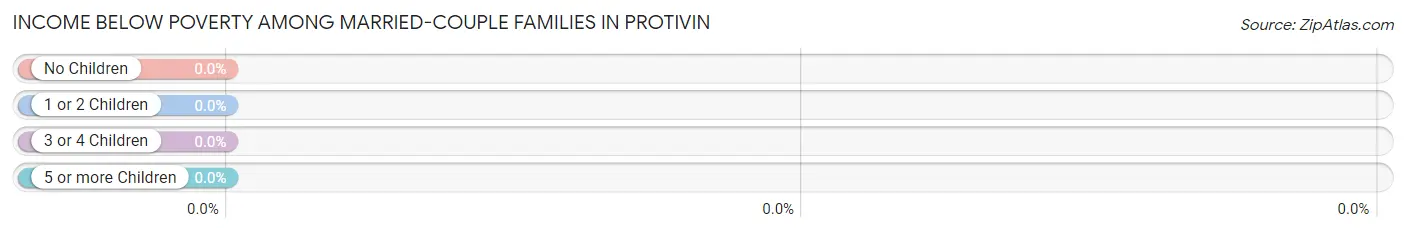
| Children | Above Poverty | Below Poverty |
| No Children | 43 (100.0%) | 0 (0.0%) |
| 1 or 2 Children | 19 (100.0%) | 0 (0.0%) |
| 3 or 4 Children | 20 (100.0%) | 0 (0.0%) |
| 5 or more Children | 0 (0.0%) | 0 (0.0%) |
| Total | 82 (100.0%) | 0 (0.0%) |
Income Below Poverty Among Single-Parent Households in Protivin
| Children | Single Father | Single Mother |
| No Children | 0 (0.0%) | 0 (0.0%) |
| 1 or 2 Children | 0 (0.0%) | 0 (0.0%) |
| 3 or 4 Children | 0 (0.0%) | 0 (0.0%) |
| 5 or more Children | 0 (0.0%) | 0 (0.0%) |
| Total | 0 (0.0%) | 0 (0.0%) |
Income Below Poverty Among Married-Couple vs Single-Parent Households in Protivin
| Children | Married-Couple Families | Single-Parent Households |
| No Children | 0 (0.0%) | 0 (0.0%) |
| 1 or 2 Children | 0 (0.0%) | 0 (0.0%) |
| 3 or 4 Children | 0 (0.0%) | 0 (0.0%) |
| 5 or more Children | 0 (0.0%) | 0 (0.0%) |
| Total | 0 (0.0%) | 0 (0.0%) |
Race in Protivin
The most populous races in Protivin are White / Caucasian (356 | 97.5%), Hispanic or Latino (6 | 1.6%), and Asian (3 | 0.8%).
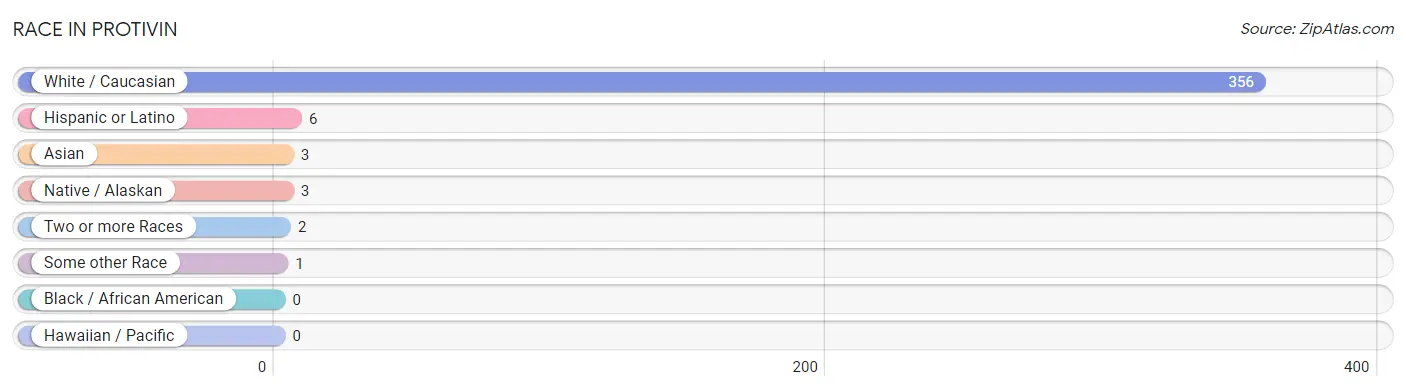
| Race | # Population | % Population |
| Asian | 3 | 0.8% |
| Black / African American | 0 | 0.0% |
| Hawaiian / Pacific | 0 | 0.0% |
| Hispanic or Latino | 6 | 1.6% |
| Native / Alaskan | 3 | 0.8% |
| White / Caucasian | 356 | 97.5% |
| Two or more Races | 2 | 0.5% |
| Some other Race | 1 | 0.3% |
| Total | 365 | 100.0% |
Ancestry in Protivin
The most populous ancestries reported in Protivin are Czech (177 | 48.5%), German (174 | 47.7%), Norwegian (46 | 12.6%), Irish (36 | 9.9%), and English (19 | 5.2%), together accounting for 123.8% of all Protivin residents.
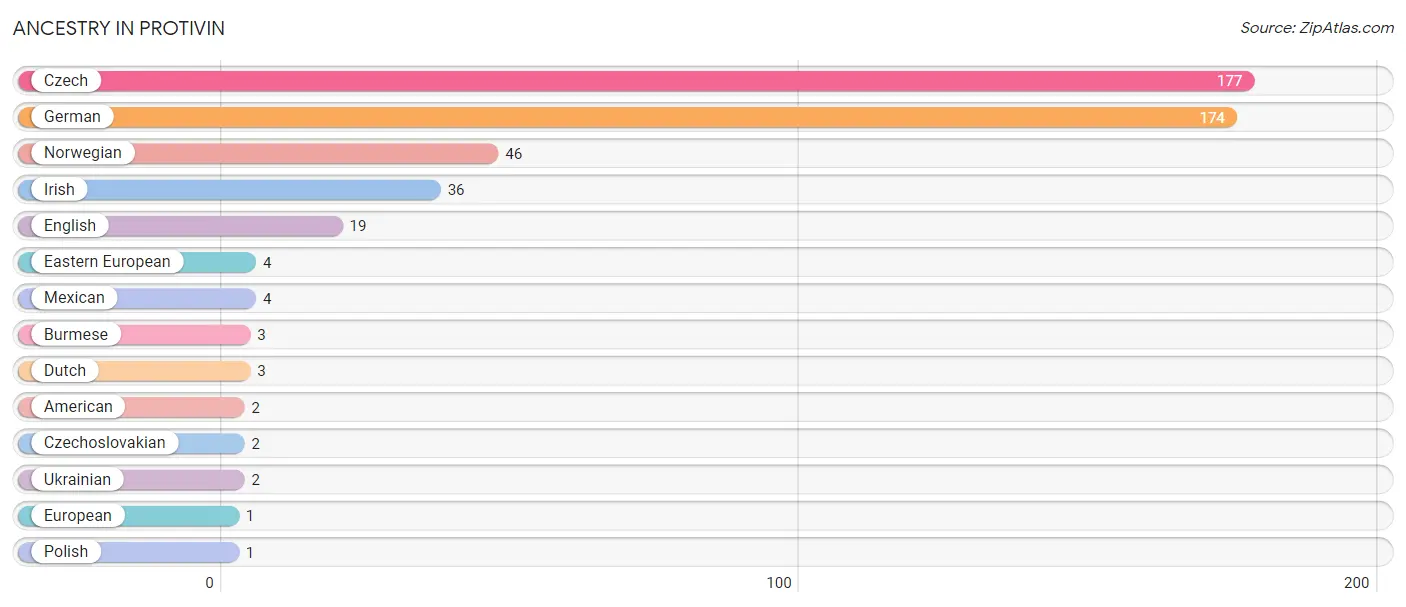
| Ancestry | # Population | % Population |
| American | 2 | 0.5% |
| Burmese | 3 | 0.8% |
| Czech | 177 | 48.5% |
| Czechoslovakian | 2 | 0.5% |
| Dutch | 3 | 0.8% |
| Eastern European | 4 | 1.1% |
| English | 19 | 5.2% |
| European | 1 | 0.3% |
| German | 174 | 47.7% |
| Irish | 36 | 9.9% |
| Mexican | 4 | 1.1% |
| Norwegian | 46 | 12.6% |
| Polish | 1 | 0.3% |
| Ukrainian | 2 | 0.5% | View All 14 Rows |
Immigrants in Protivin
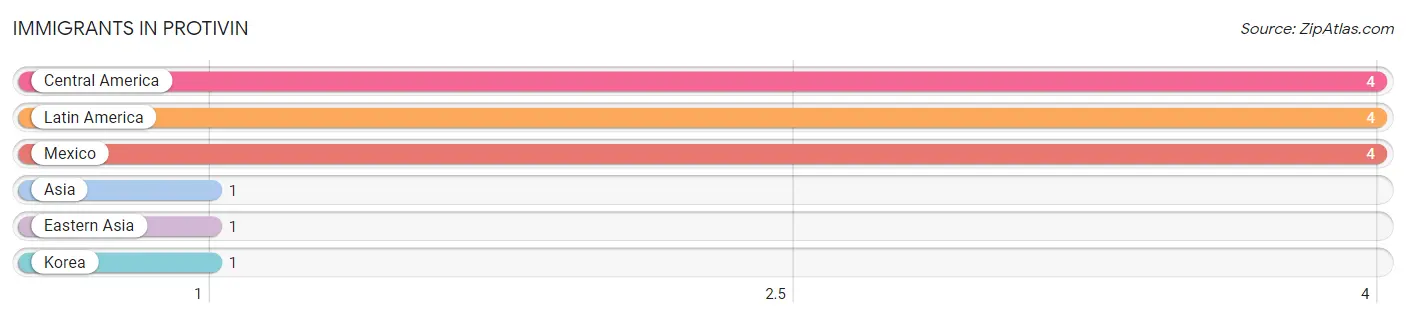
The most numerous immigrant groups reported in Protivin came from Central America (4 | 1.1%), Latin America (4 | 1.1%), Mexico (4 | 1.1%), Asia (1 | 0.3%), and Eastern Asia (1 | 0.3%), together accounting for 3.8% of all Protivin residents.
| Immigration Origin | # Population | % Population |
| Asia | 1 | 0.3% |
| Central America | 4 | 1.1% |
| Eastern Asia | 1 | 0.3% |
| Korea | 1 | 0.3% |
| Latin America | 4 | 1.1% |
| Mexico | 4 | 1.1% | View All 6 Rows |
Sex and Age in Protivin
Sex and Age in Protivin
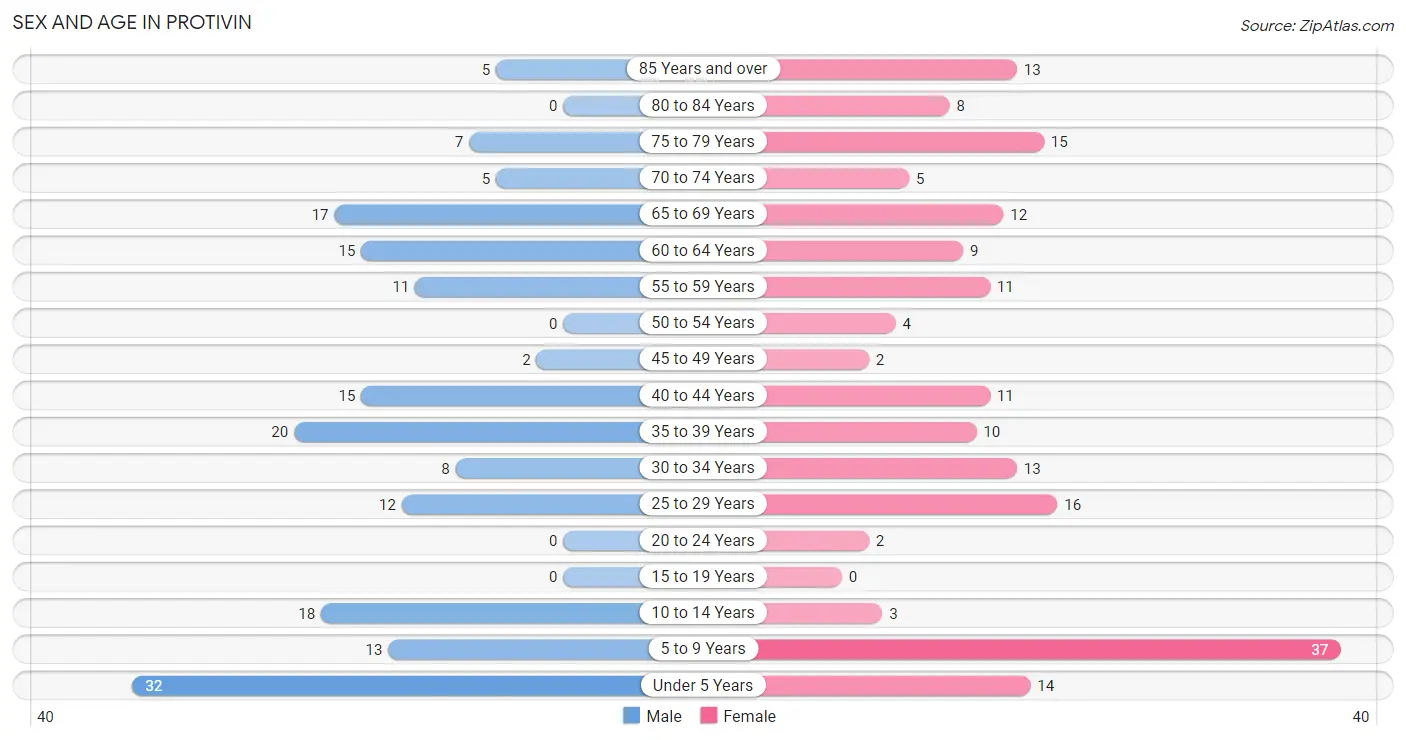
The most populous age groups in Protivin are Under 5 Years (32 | 17.8%) for men and 5 to 9 Years (37 | 20.0%) for women.
| Age Bracket | Male | Female |
| Under 5 Years | 32 (17.8%) | 14 (7.6%) |
| 5 to 9 Years | 13 (7.2%) | 37 (20.0%) |
| 10 to 14 Years | 18 (10.0%) | 3 (1.6%) |
| 15 to 19 Years | 0 (0.0%) | 0 (0.0%) |
| 20 to 24 Years | 0 (0.0%) | 2 (1.1%) |
| 25 to 29 Years | 12 (6.7%) | 16 (8.6%) |
| 30 to 34 Years | 8 (4.4%) | 13 (7.0%) |
| 35 to 39 Years | 20 (11.1%) | 10 (5.4%) |
| 40 to 44 Years | 15 (8.3%) | 11 (5.9%) |
| 45 to 49 Years | 2 (1.1%) | 2 (1.1%) |
| 50 to 54 Years | 0 (0.0%) | 4 (2.2%) |
| 55 to 59 Years | 11 (6.1%) | 11 (5.9%) |
| 60 to 64 Years | 15 (8.3%) | 9 (4.9%) |
| 65 to 69 Years | 17 (9.4%) | 12 (6.5%) |
| 70 to 74 Years | 5 (2.8%) | 5 (2.7%) |
| 75 to 79 Years | 7 (3.9%) | 15 (8.1%) |
| 80 to 84 Years | 0 (0.0%) | 8 (4.3%) |
| 85 Years and over | 5 (2.8%) | 13 (7.0%) |
| Total | 180 (100.0%) | 185 (100.0%) |
Families and Households in Protivin
Median Family Size in Protivin
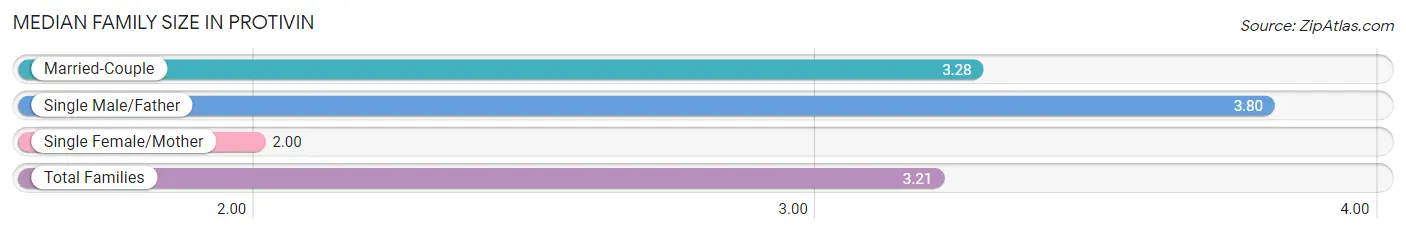
The median family size in Protivin is 3.21 persons per family, with single male/father families (5 | 5.3%) accounting for the largest median family size of 3.8 persons per family. On the other hand, single female/mother families (7 | 7.4%) represent the smallest median family size with 2.00 persons per family.
| Family Type | # Families | Family Size |
| Married-Couple | 82 (87.2%) | 3.28 |
| Single Male/Father | 5 (5.3%) | 3.80 |
| Single Female/Mother | 7 (7.4%) | 2.00 |
| Total Families | 94 (100.0%) | 3.21 |
Median Household Size in Protivin
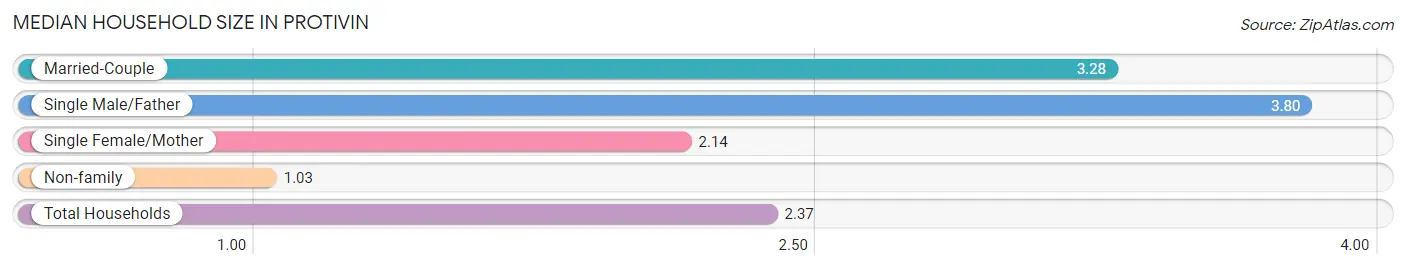
The median household size in Protivin is 2.37 persons per household, with single male/father households (5 | 3.3%) accounting for the largest median household size of 3.8 persons per household. non-family households (60 | 39.0%) represent the smallest median household size with 1.03 persons per household.
| Household Type | # Households | Household Size |
| Married-Couple | 82 (53.2%) | 3.28 |
| Single Male/Father | 5 (3.3%) | 3.80 |
| Single Female/Mother | 7 (4.5%) | 2.14 |
| Non-family | 60 (39.0%) | 1.03 |
| Total Households | 154 (100.0%) | 2.37 |
Household Size by Marriage Status in Protivin
Out of a total of 154 households in Protivin, 94 (61.0%) are family households, while 60 (39.0%) are nonfamily households. The most numerous type of family households are 2-person households, comprising 48, and the most common type of nonfamily households are 1-person households, comprising 58.
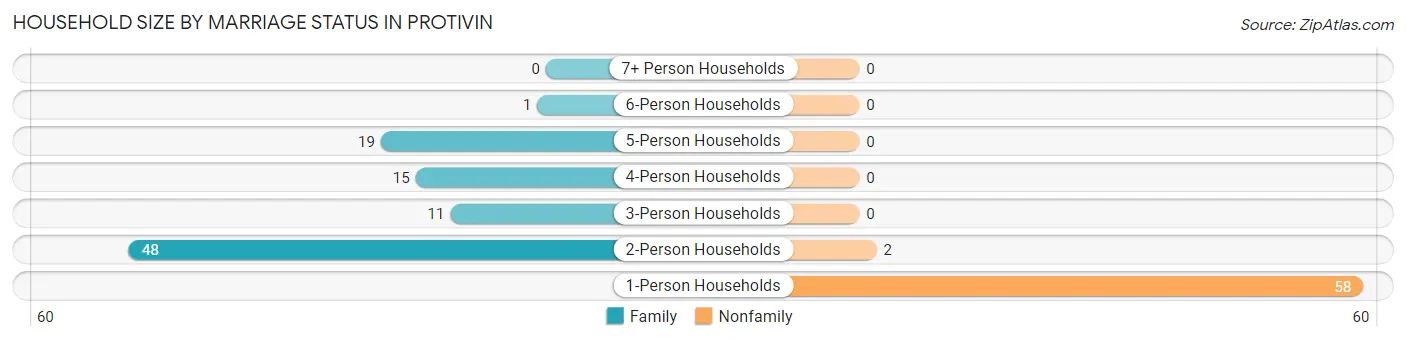
| Household Size | Family Households | Nonfamily Households |
| 1-Person Households | - | 58 (37.7%) |
| 2-Person Households | 48 (31.2%) | 2 (1.3%) |
| 3-Person Households | 11 (7.1%) | 0 (0.0%) |
| 4-Person Households | 15 (9.7%) | 0 (0.0%) |
| 5-Person Households | 19 (12.3%) | 0 (0.0%) |
| 6-Person Households | 1 (0.6%) | 0 (0.0%) |
| 7+ Person Households | 0 (0.0%) | 0 (0.0%) |
| Total | 94 (61.0%) | 60 (39.0%) |
Female Fertility in Protivin
Fertility by Age in Protivin
Average fertility rate in Protivin is 74.0 births per 1,000 women. Women in the age bracket of 20 to 34 years have the highest fertility rate with 129.0 births per 1,000 women. Women in the age bracket of 20 to 34 years acount for 100.0% of all women with births.
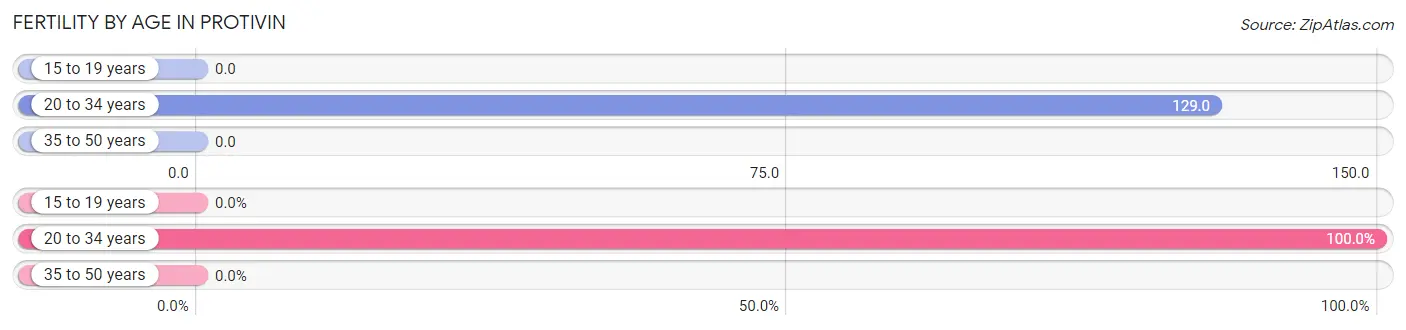
| Age Bracket | Women with Births | Births / 1,000 Women |
| 15 to 19 years | 0 (0.0%) | 0.0 |
| 20 to 34 years | 4 (100.0%) | 129.0 |
| 35 to 50 years | 0 (0.0%) | 0.0 |
| Total | 4 (100.0%) | 74.0 |
Fertility by Age by Marriage Status in Protivin
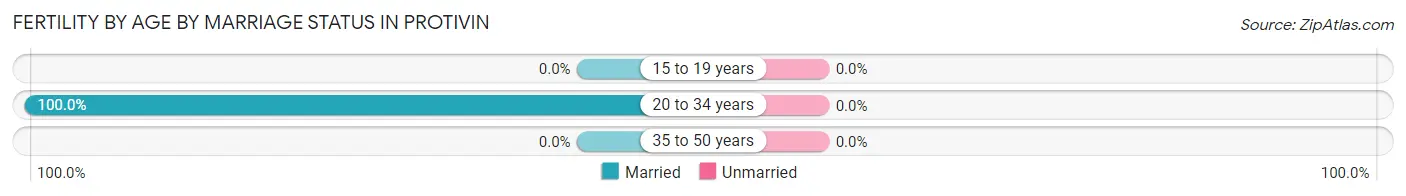
| Age Bracket | Married | Unmarried |
| 15 to 19 years | 0 (0.0%) | 0 (0.0%) |
| 20 to 34 years | 4 (100.0%) | 0 (0.0%) |
| 35 to 50 years | 0 (0.0%) | 0 (0.0%) |
| Total | 4 (100.0%) | 0 (0.0%) |
Fertility by Education in Protivin
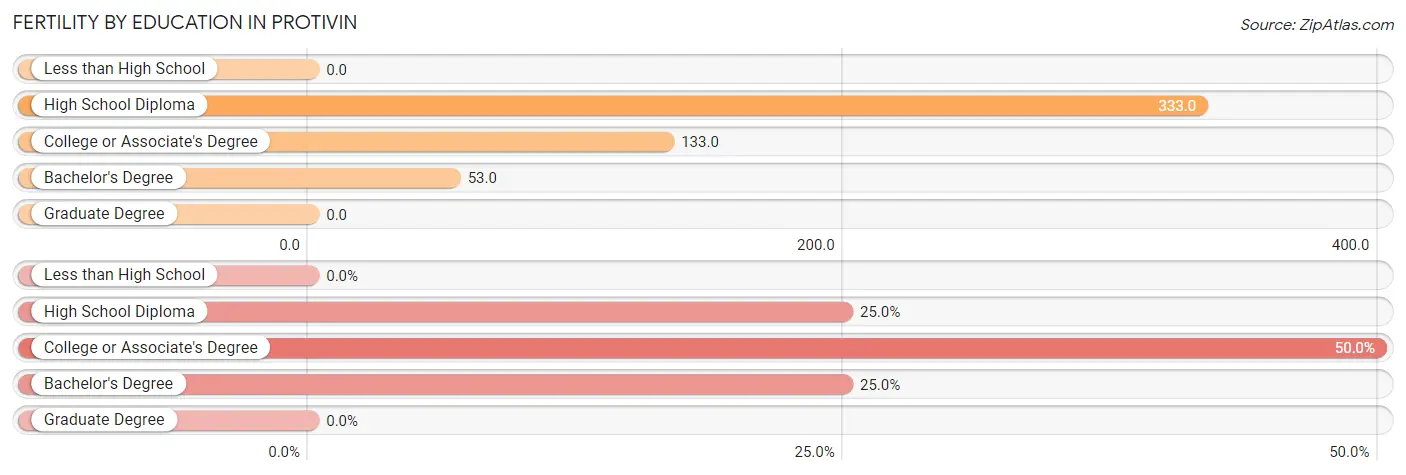
| Educational Attainment | Women with Births | Births / 1,000 Women |
| Less than High School | 0 (0.0%) | 0.0 |
| High School Diploma | 1 (25.0%) | 333.0 |
| College or Associate's Degree | 2 (50.0%) | 133.0 |
| Bachelor's Degree | 1 (25.0%) | 53.0 |
| Graduate Degree | 0 (0.0%) | 0.0 |
| Total | 4 (100.0%) | 74.0 |
Fertility by Education by Marriage Status in Protivin
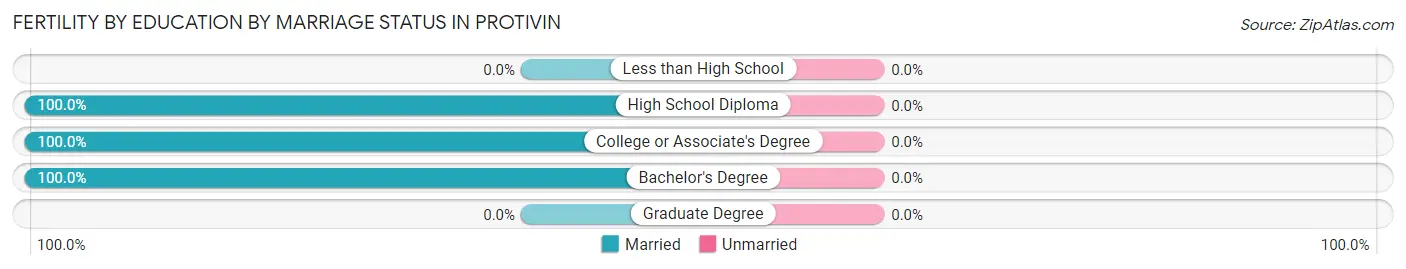
| Educational Attainment | Married | Unmarried |
| Less than High School | 0 (0.0%) | 0 (0.0%) |
| High School Diploma | 1 (100.0%) | 0 (0.0%) |
| College or Associate's Degree | 2 (100.0%) | 0 (0.0%) |
| Bachelor's Degree | 1 (100.0%) | 0 (0.0%) |
| Graduate Degree | 0 (0.0%) | 0 (0.0%) |
| Total | 4 (100.0%) | 0 (0.0%) |
Employment Characteristics in Protivin
Employment by Class of Employer in Protivin
Among the 178 employed individuals in Protivin, private company employees (94 | 52.8%), local government employees (28 | 15.7%), and not-for-profit organizations (22 | 12.4%) make up the most common classes of employment.
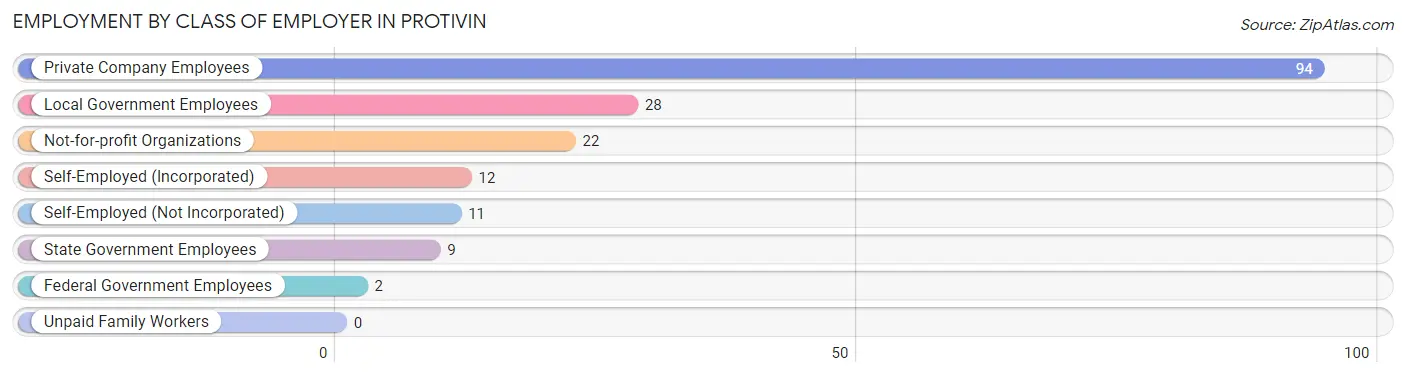
| Employer Class | # Employees | % Employees |
| Private Company Employees | 94 | 52.8% |
| Self-Employed (Incorporated) | 12 | 6.7% |
| Self-Employed (Not Incorporated) | 11 | 6.2% |
| Not-for-profit Organizations | 22 | 12.4% |
| Local Government Employees | 28 | 15.7% |
| State Government Employees | 9 | 5.1% |
| Federal Government Employees | 2 | 1.1% |
| Unpaid Family Workers | 0 | 0.0% |
| Total | 178 | 100.0% |
Employment Status by Age in Protivin
According to the labor force statistics for Protivin, out of the total population over 16 years of age (248), 74.2% or 184 individuals are in the labor force, with 3.3% or 6 of them unemployed. The age group with the highest labor force participation rate is 20 to 24 years, with 100.0% or 2 individuals in the labor force. Within the labor force, the 65 to 74 years age range has the highest percentage of unemployed individuals, with 18.5% or 5 of them being unemployed.
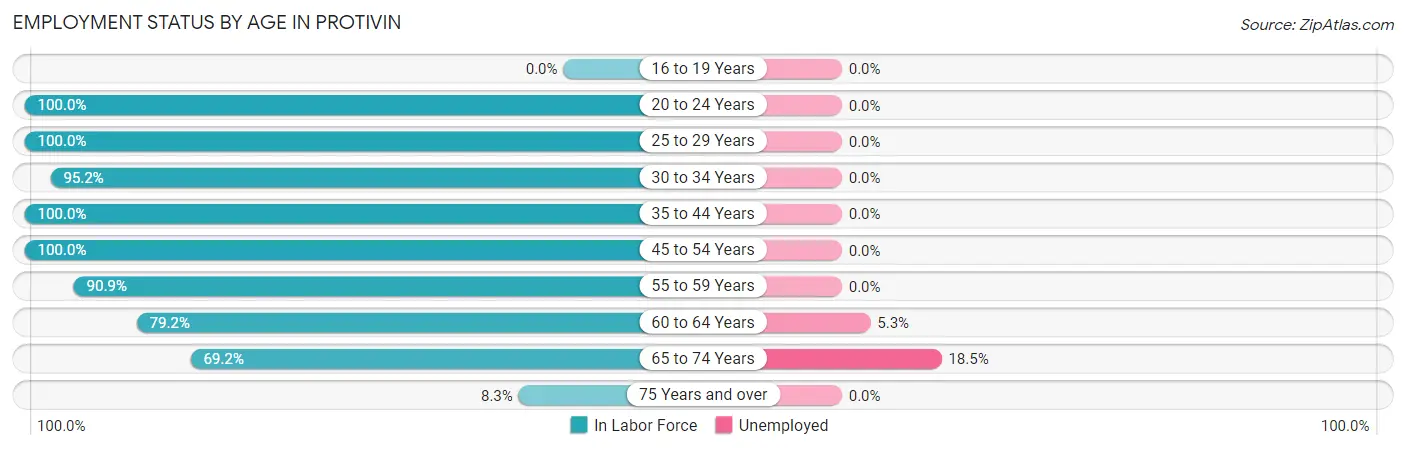
| Age Bracket | In Labor Force | Unemployed |
| 16 to 19 Years | 0 (0.0%) | 0 (0.0%) |
| 20 to 24 Years | 2 (100.0%) | 0 (0.0%) |
| 25 to 29 Years | 28 (100.0%) | 0 (0.0%) |
| 30 to 34 Years | 20 (95.2%) | 0 (0.0%) |
| 35 to 44 Years | 56 (100.0%) | 0 (0.0%) |
| 45 to 54 Years | 8 (100.0%) | 0 (0.0%) |
| 55 to 59 Years | 20 (90.9%) | 0 (0.0%) |
| 60 to 64 Years | 19 (79.2%) | 1 (5.3%) |
| 65 to 74 Years | 27 (69.2%) | 5 (18.5%) |
| 75 Years and over | 4 (8.3%) | 0 (0.0%) |
| Total | 184 (74.2%) | 6 (3.3%) |
Employment Status by Educational Attainment in Protivin
According to labor force statistics for Protivin, 95.0% of individuals (151) out of the total population between 25 and 64 years of age (159) are in the labor force, with 0.7% or 1 of them being unemployed. The group with the highest labor force participation rate are those with the educational attainment of less than high school, with 100.0% or 3 individuals in the labor force. Within the labor force, individuals with less than high school education have the highest percentage of unemployment, with 33.3% or 1 of them being unemployed.
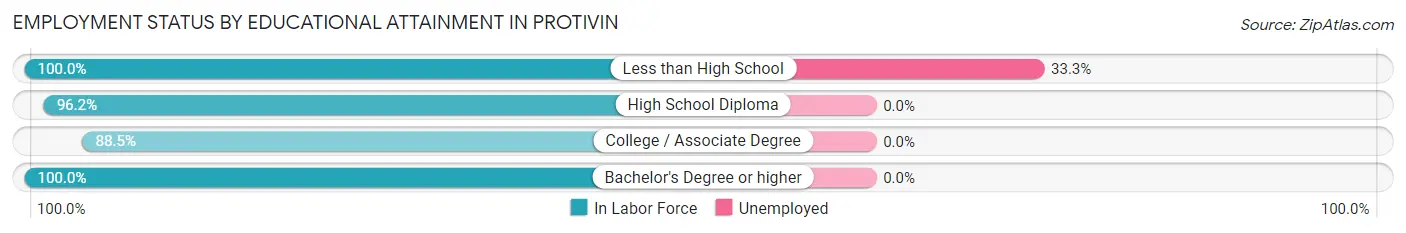
| Educational Attainment | In Labor Force | Unemployed |
| Less than High School | 3 (100.0%) | 1 (33.3%) |
| High School Diploma | 50 (96.2%) | 0 (0.0%) |
| College / Associate Degree | 46 (88.5%) | 0 (0.0%) |
| Bachelor's Degree or higher | 52 (100.0%) | 0 (0.0%) |
| Total | 151 (95.0%) | 1 (0.7%) |
Employment Occupations by Sex in Protivin
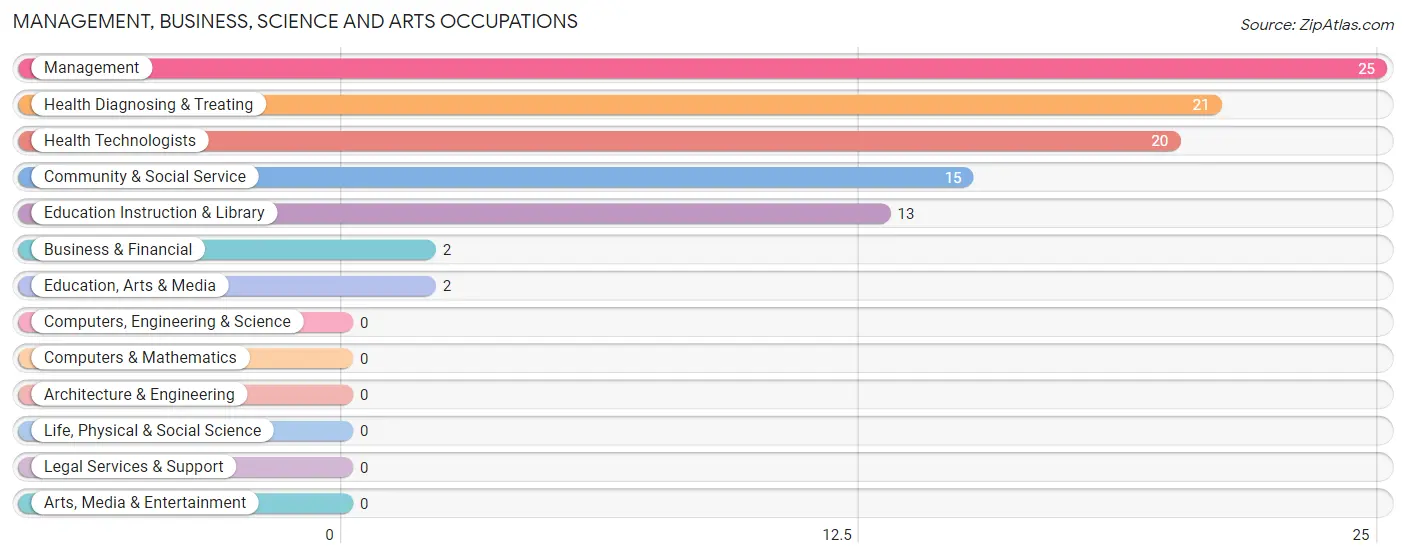
Management, Business, Science and Arts Occupations
The most common Management, Business, Science and Arts occupations in Protivin are Management (25 | 14.0%), Health Diagnosing & Treating (21 | 11.8%), Health Technologists (20 | 11.2%), Community & Social Service (15 | 8.4%), and Education Instruction & Library (13 | 7.3%).
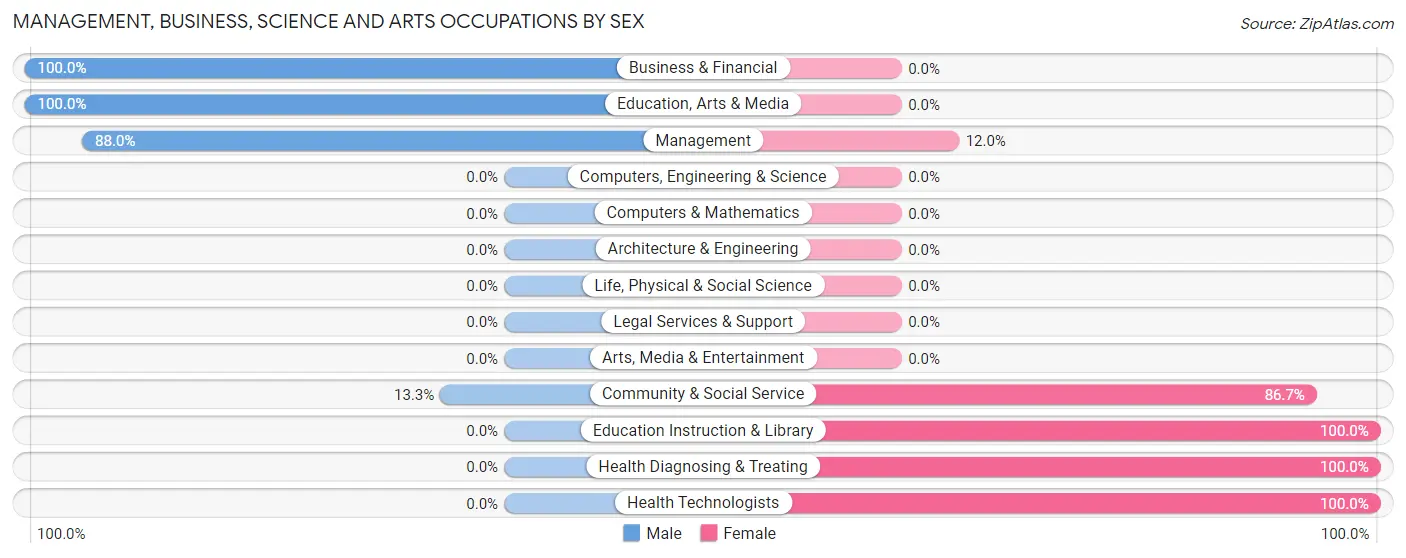
Management, Business, Science and Arts Occupations by Sex
Within the Management, Business, Science and Arts occupations in Protivin, the most male-oriented occupations are Business & Financial (100.0%), Education, Arts & Media (100.0%), and Management (88.0%), while the most female-oriented occupations are Education Instruction & Library (100.0%), Health Diagnosing & Treating (100.0%), and Health Technologists (100.0%).
| Occupation | Male | Female |
| Management | 22 (88.0%) | 3 (12.0%) |
| Business & Financial | 2 (100.0%) | 0 (0.0%) |
| Computers, Engineering & Science | 0 (0.0%) | 0 (0.0%) |
| Computers & Mathematics | 0 (0.0%) | 0 (0.0%) |
| Architecture & Engineering | 0 (0.0%) | 0 (0.0%) |
| Life, Physical & Social Science | 0 (0.0%) | 0 (0.0%) |
| Community & Social Service | 2 (13.3%) | 13 (86.7%) |
| Education, Arts & Media | 2 (100.0%) | 0 (0.0%) |
| Legal Services & Support | 0 (0.0%) | 0 (0.0%) |
| Education Instruction & Library | 0 (0.0%) | 13 (100.0%) |
| Arts, Media & Entertainment | 0 (0.0%) | 0 (0.0%) |
| Health Diagnosing & Treating | 0 (0.0%) | 21 (100.0%) |
| Health Technologists | 0 (0.0%) | 20 (100.0%) |
| Total (Category) | 26 (41.3%) | 37 (58.7%) |
| Total (Overall) | 95 (53.4%) | 83 (46.6%) |
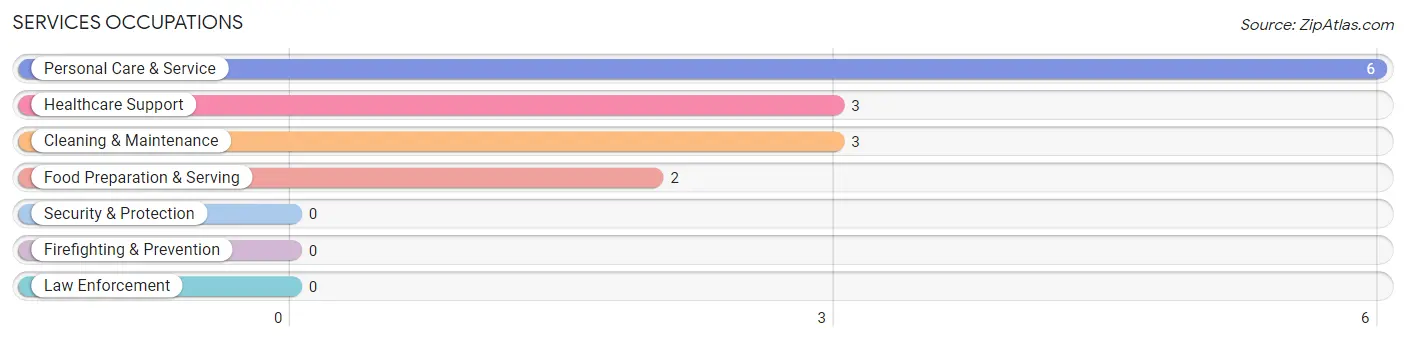
Services Occupations
The most common Services occupations in Protivin are Personal Care & Service (6 | 3.4%), Healthcare Support (3 | 1.7%), Cleaning & Maintenance (3 | 1.7%), and Food Preparation & Serving (2 | 1.1%).
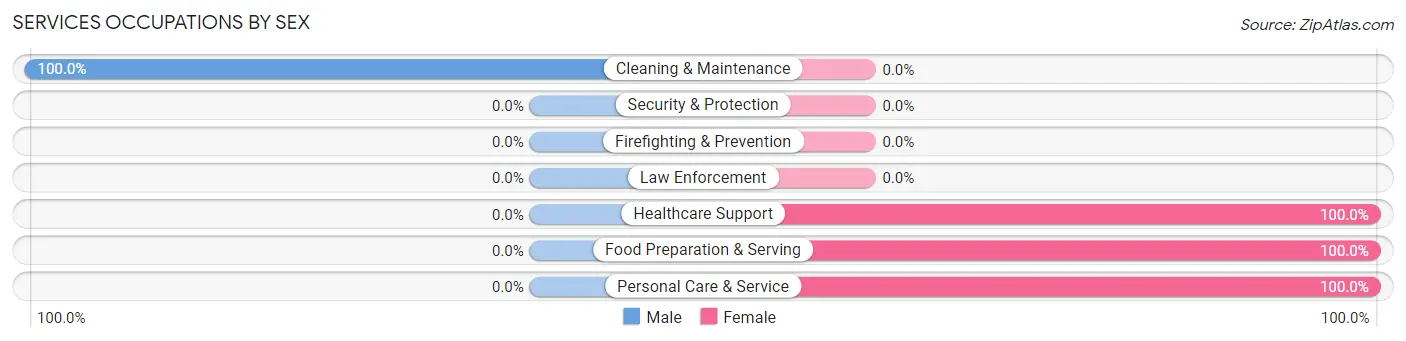
Services Occupations by Sex
| Occupation | Male | Female |
| Healthcare Support | 0 (0.0%) | 3 (100.0%) |
| Security & Protection | 0 (0.0%) | 0 (0.0%) |
| Firefighting & Prevention | 0 (0.0%) | 0 (0.0%) |
| Law Enforcement | 0 (0.0%) | 0 (0.0%) |
| Food Preparation & Serving | 0 (0.0%) | 2 (100.0%) |
| Cleaning & Maintenance | 3 (100.0%) | 0 (0.0%) |
| Personal Care & Service | 0 (0.0%) | 6 (100.0%) |
| Total (Category) | 3 (21.4%) | 11 (78.6%) |
| Total (Overall) | 95 (53.4%) | 83 (46.6%) |
Sales and Office Occupations
The most common Sales and Office occupations in Protivin are Office & Administration (16 | 9.0%), and Sales & Related (11 | 6.2%).
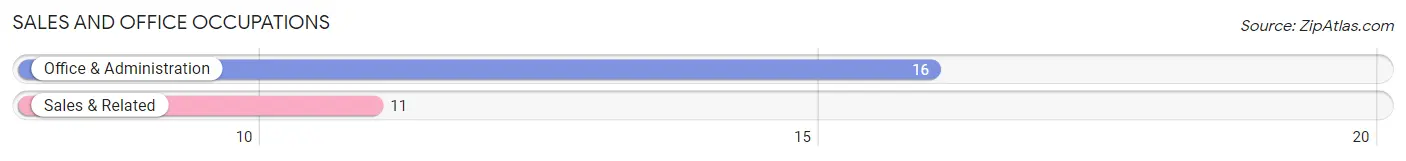
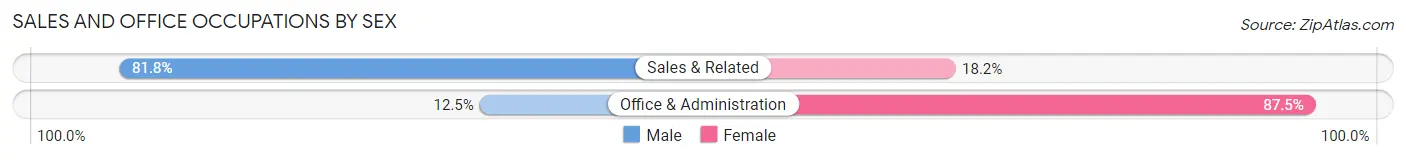
Sales and Office Occupations by Sex
| Occupation | Male | Female |
| Sales & Related | 9 (81.8%) | 2 (18.2%) |
| Office & Administration | 2 (12.5%) | 14 (87.5%) |
| Total (Category) | 11 (40.7%) | 16 (59.3%) |
| Total (Overall) | 95 (53.4%) | 83 (46.6%) |
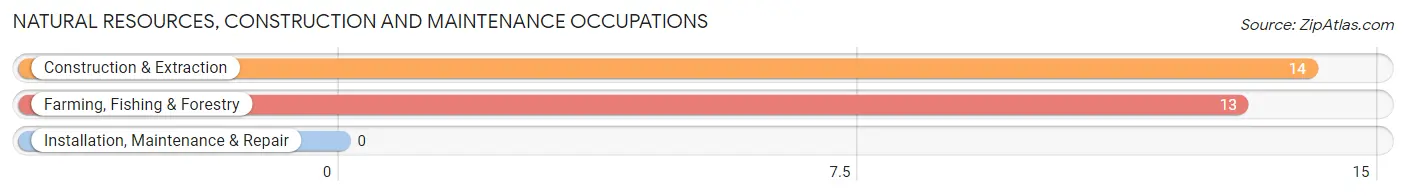
Natural Resources, Construction and Maintenance Occupations
The most common Natural Resources, Construction and Maintenance occupations in Protivin are Construction & Extraction (14 | 7.9%), and Farming, Fishing & Forestry (13 | 7.3%).
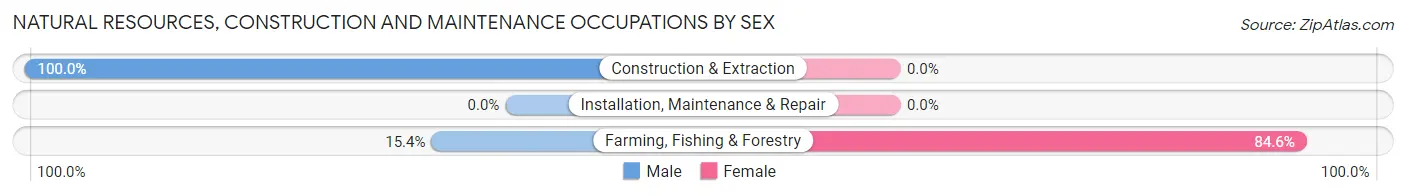
Natural Resources, Construction and Maintenance Occupations by Sex
| Occupation | Male | Female |
| Farming, Fishing & Forestry | 2 (15.4%) | 11 (84.6%) |
| Construction & Extraction | 14 (100.0%) | 0 (0.0%) |
| Installation, Maintenance & Repair | 0 (0.0%) | 0 (0.0%) |
| Total (Category) | 16 (59.3%) | 11 (40.7%) |
| Total (Overall) | 95 (53.4%) | 83 (46.6%) |
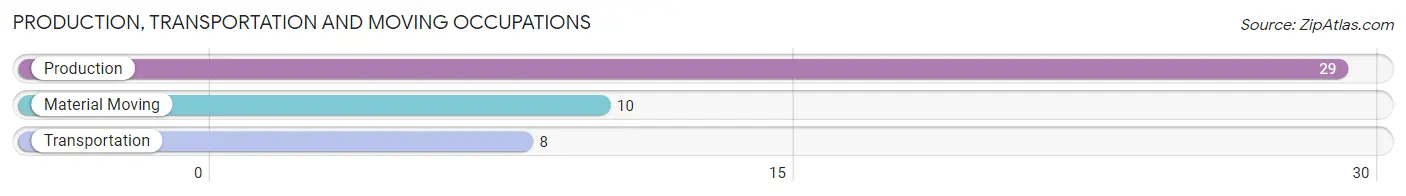
Production, Transportation and Moving Occupations
The most common Production, Transportation and Moving occupations in Protivin are Production (29 | 16.3%), Material Moving (10 | 5.6%), and Transportation (8 | 4.5%).
Production, Transportation and Moving Occupations by Sex
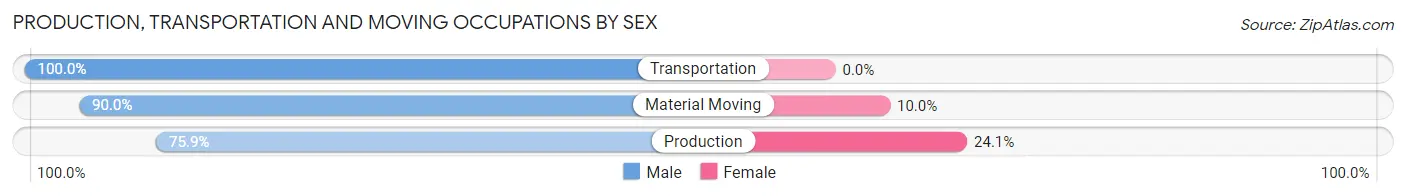
| Occupation | Male | Female |
| Production | 22 (75.9%) | 7 (24.1%) |
| Transportation | 8 (100.0%) | 0 (0.0%) |
| Material Moving | 9 (90.0%) | 1 (10.0%) |
| Total (Category) | 39 (83.0%) | 8 (17.0%) |
| Total (Overall) | 95 (53.4%) | 83 (46.6%) |
Employment Industries by Sex in Protivin
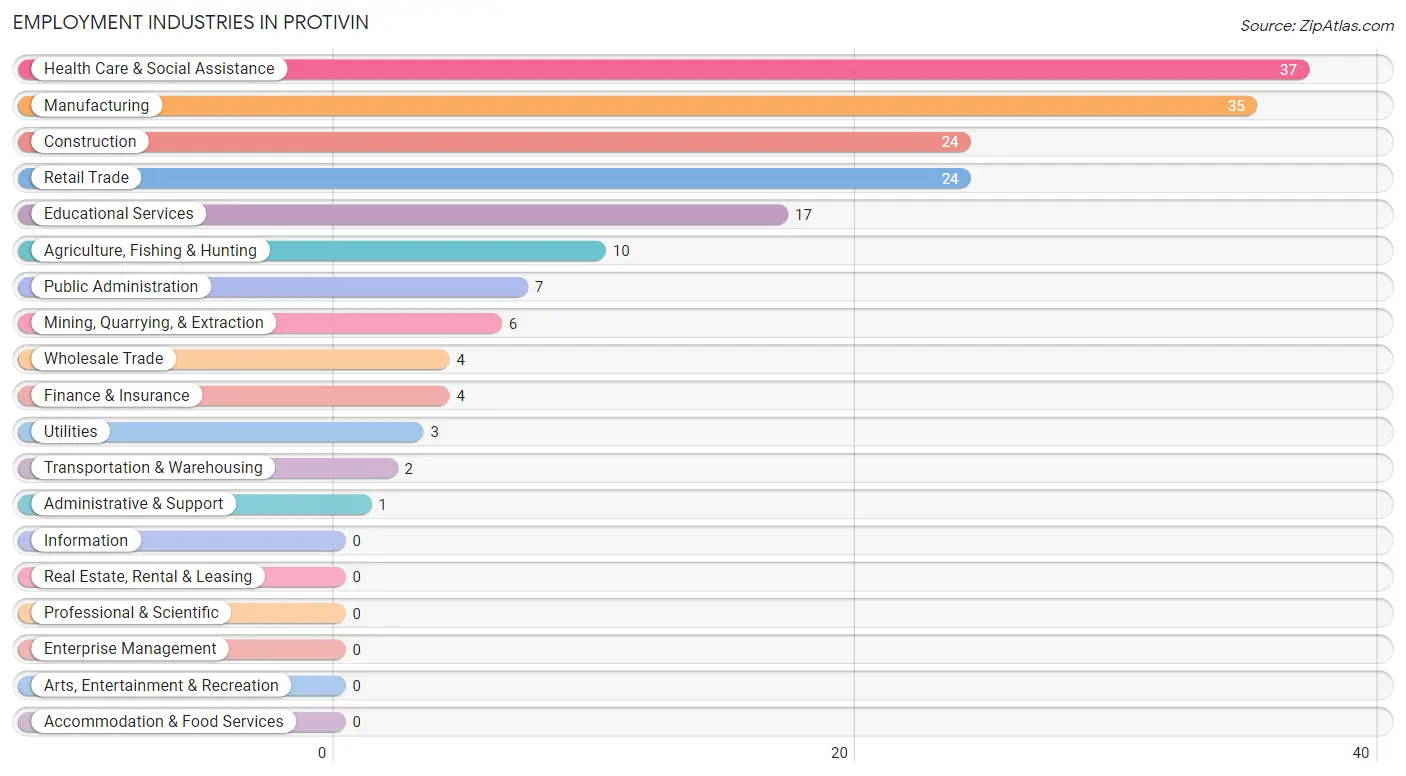
Employment Industries in Protivin
The major employment industries in Protivin include Health Care & Social Assistance (37 | 20.8%), Manufacturing (35 | 19.7%), Construction (24 | 13.5%), Retail Trade (24 | 13.5%), and Educational Services (17 | 9.6%).
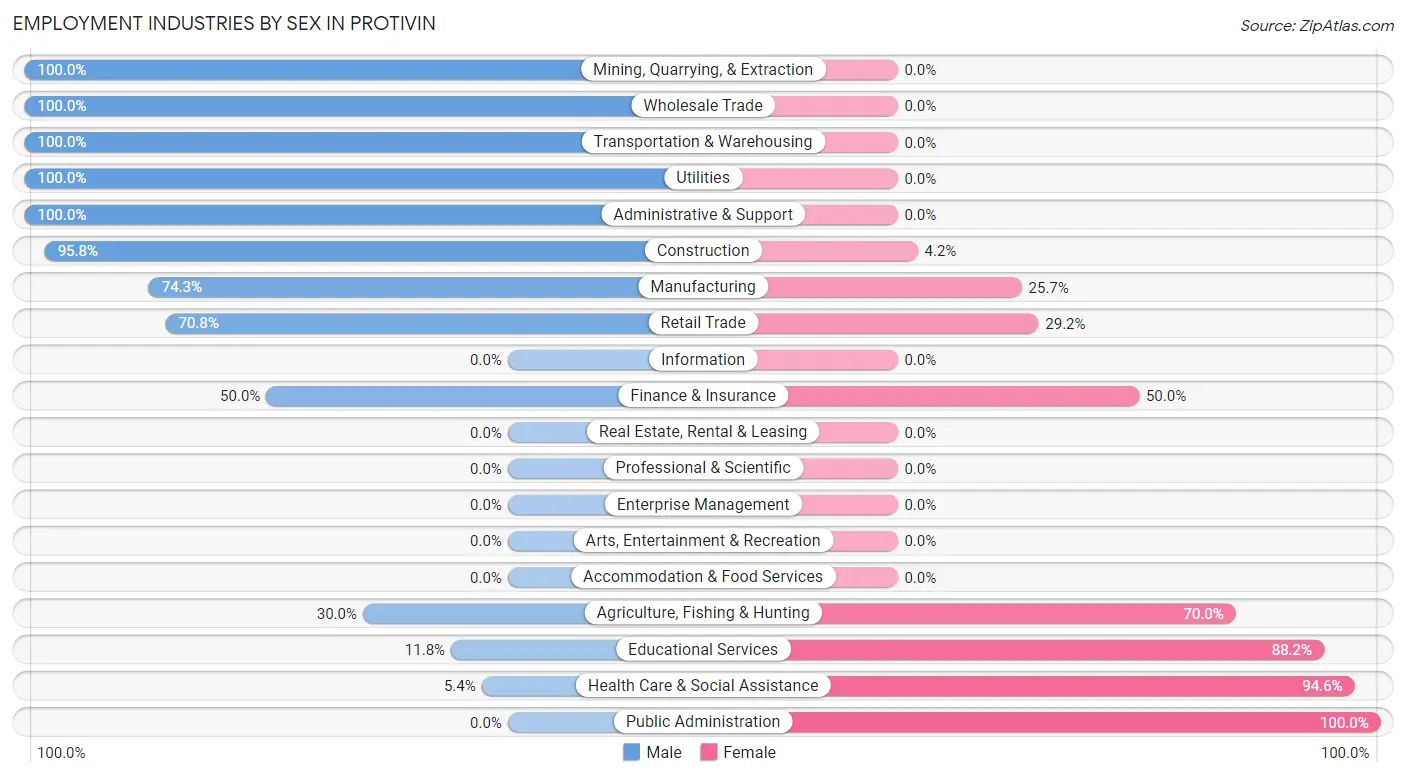
Employment Industries by Sex in Protivin
The Protivin industries that see more men than women are Mining, Quarrying, & Extraction (100.0%), Wholesale Trade (100.0%), and Transportation & Warehousing (100.0%), whereas the industries that tend to have a higher number of women are Public Administration (100.0%), Health Care & Social Assistance (94.6%), and Educational Services (88.2%).
| Industry | Male | Female |
| Agriculture, Fishing & Hunting | 3 (30.0%) | 7 (70.0%) |
| Mining, Quarrying, & Extraction | 6 (100.0%) | 0 (0.0%) |
| Construction | 23 (95.8%) | 1 (4.2%) |
| Manufacturing | 26 (74.3%) | 9 (25.7%) |
| Wholesale Trade | 4 (100.0%) | 0 (0.0%) |
| Retail Trade | 17 (70.8%) | 7 (29.2%) |
| Transportation & Warehousing | 2 (100.0%) | 0 (0.0%) |
| Utilities | 3 (100.0%) | 0 (0.0%) |
| Information | 0 (0.0%) | 0 (0.0%) |
| Finance & Insurance | 2 (50.0%) | 2 (50.0%) |
| Real Estate, Rental & Leasing | 0 (0.0%) | 0 (0.0%) |
| Professional & Scientific | 0 (0.0%) | 0 (0.0%) |
| Enterprise Management | 0 (0.0%) | 0 (0.0%) |
| Administrative & Support | 1 (100.0%) | 0 (0.0%) |
| Educational Services | 2 (11.8%) | 15 (88.2%) |
| Health Care & Social Assistance | 2 (5.4%) | 35 (94.6%) |
| Arts, Entertainment & Recreation | 0 (0.0%) | 0 (0.0%) |
| Accommodation & Food Services | 0 (0.0%) | 0 (0.0%) |
| Public Administration | 0 (0.0%) | 7 (100.0%) |
| Total | 95 (53.4%) | 83 (46.6%) |
Education in Protivin
School Enrollment in Protivin
The most common levels of schooling among the 86 students in Protivin are nursery / preschool (29 | 33.7%), elementary school (29 | 33.7%), and middle school (13 | 15.1%).
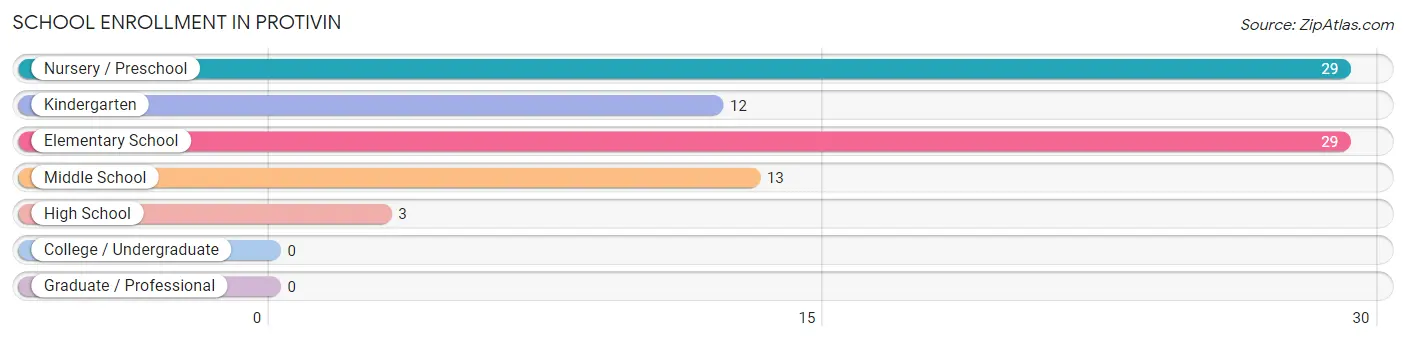
| School Level | # Students | % Students |
| Nursery / Preschool | 29 | 33.7% |
| Kindergarten | 12 | 14.0% |
| Elementary School | 29 | 33.7% |
| Middle School | 13 | 15.1% |
| High School | 3 | 3.5% |
| College / Undergraduate | 0 | 0.0% |
| Graduate / Professional | 0 | 0.0% |
| Total | 86 | 100.0% |
School Enrollment by Age by Funding Source in Protivin
Out of a total of 86 students who are enrolled in schools in Protivin, 41 (47.7%) attend a private institution, while the remaining 45 (52.3%) are enrolled in public schools. The age group of 5 to 9 year old has the highest likelihood of being enrolled in private schools, with 40 (80.0% in the age bracket) enrolled. Conversely, the age group of 10 to 14 year olds has the lowest likelihood of being enrolled in a private school, with 21 (100.0% in the age bracket) attending a public institution.
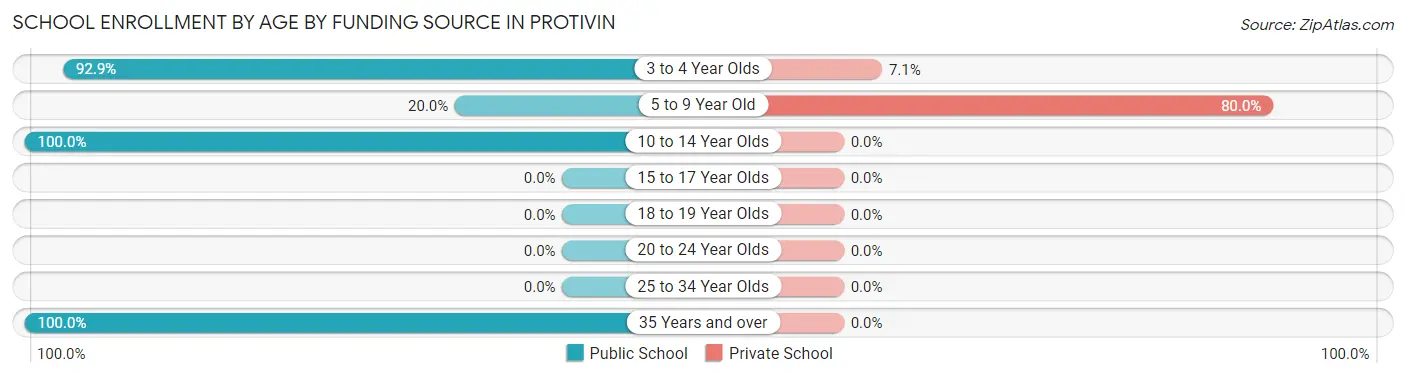
| Age Bracket | Public School | Private School |
| 3 to 4 Year Olds | 13 (92.9%) | 1 (7.1%) |
| 5 to 9 Year Old | 10 (20.0%) | 40 (80.0%) |
| 10 to 14 Year Olds | 21 (100.0%) | 0 (0.0%) |
| 15 to 17 Year Olds | 0 (0.0%) | 0 (0.0%) |
| 18 to 19 Year Olds | 0 (0.0%) | 0 (0.0%) |
| 20 to 24 Year Olds | 0 (0.0%) | 0 (0.0%) |
| 25 to 34 Year Olds | 0 (0.0%) | 0 (0.0%) |
| 35 Years and over | 1 (100.0%) | 0 (0.0%) |
| Total | 45 (52.3%) | 41 (47.7%) |
Educational Attainment by Field of Study in Protivin
Bio, nature & agricultural (21 | 30.0%), education (18 | 25.7%), business (10 | 14.3%), physical & health sciences (8 | 11.4%), and science & technology (5 | 7.1%) are the most common fields of study among 70 individuals in Protivin who have obtained a bachelor's degree or higher.
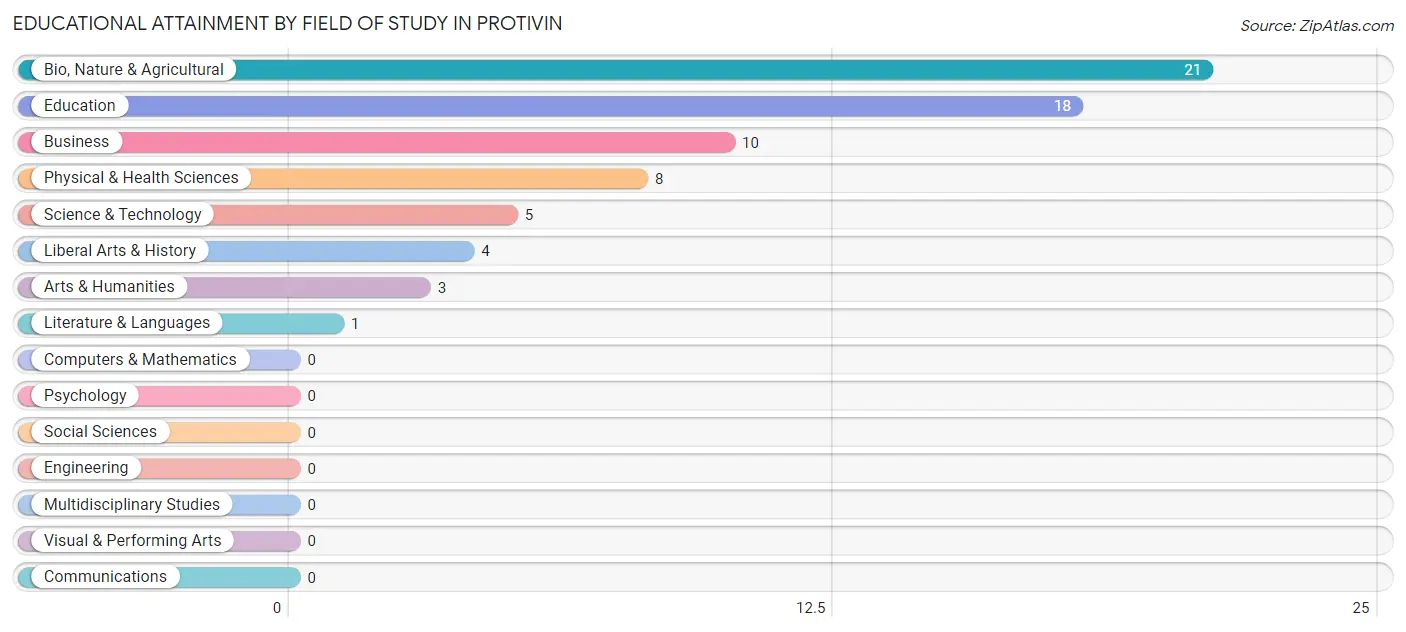
| Field of Study | # Graduates | % Graduates |
| Computers & Mathematics | 0 | 0.0% |
| Bio, Nature & Agricultural | 21 | 30.0% |
| Physical & Health Sciences | 8 | 11.4% |
| Psychology | 0 | 0.0% |
| Social Sciences | 0 | 0.0% |
| Engineering | 0 | 0.0% |
| Multidisciplinary Studies | 0 | 0.0% |
| Science & Technology | 5 | 7.1% |
| Business | 10 | 14.3% |
| Education | 18 | 25.7% |
| Literature & Languages | 1 | 1.4% |
| Liberal Arts & History | 4 | 5.7% |
| Visual & Performing Arts | 0 | 0.0% |
| Communications | 0 | 0.0% |
| Arts & Humanities | 3 | 4.3% |
| Total | 70 | 100.0% |
Transportation & Commute in Protivin
Vehicle Availability by Sex in Protivin
The most prevalent vehicle ownership categories in Protivin are males with 2 vehicles (55, accounting for 57.9%) and females with 2 vehicles (42, making up 66.3%).
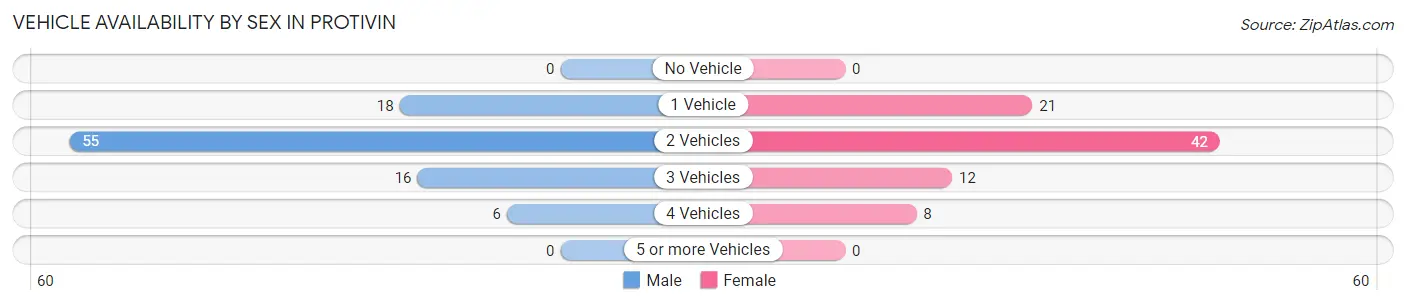
| Vehicles Available | Male | Female |
| No Vehicle | 0 (0.0%) | 0 (0.0%) |
| 1 Vehicle | 18 (19.0%) | 21 (25.3%) |
| 2 Vehicles | 55 (57.9%) | 42 (50.6%) |
| 3 Vehicles | 16 (16.8%) | 12 (14.5%) |
| 4 Vehicles | 6 (6.3%) | 8 (9.6%) |
| 5 or more Vehicles | 0 (0.0%) | 0 (0.0%) |
| Total | 95 (100.0%) | 83 (100.0%) |
Commute Time in Protivin
The most frequently occuring commute durations in Protivin are 30 to 34 minutes (34 commuters, 21.9%), less than 5 minutes (24 commuters, 15.5%), and 5 to 9 minutes (22 commuters, 14.2%).
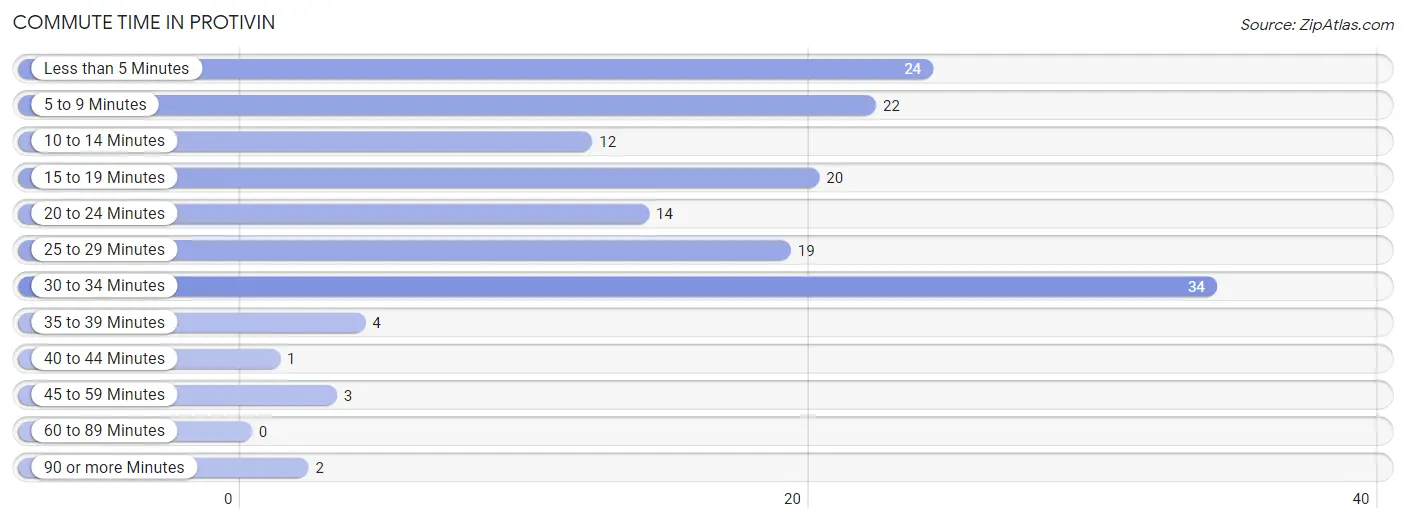
| Commute Time | # Commuters | % Commuters |
| Less than 5 Minutes | 24 | 15.5% |
| 5 to 9 Minutes | 22 | 14.2% |
| 10 to 14 Minutes | 12 | 7.7% |
| 15 to 19 Minutes | 20 | 12.9% |
| 20 to 24 Minutes | 14 | 9.0% |
| 25 to 29 Minutes | 19 | 12.3% |
| 30 to 34 Minutes | 34 | 21.9% |
| 35 to 39 Minutes | 4 | 2.6% |
| 40 to 44 Minutes | 1 | 0.6% |
| 45 to 59 Minutes | 3 | 1.9% |
| 60 to 89 Minutes | 0 | 0.0% |
| 90 or more Minutes | 2 | 1.3% |
Commute Time by Sex in Protivin
The most common commute times in Protivin are less than 5 minutes (21 commuters, 22.6%) for males and 15 to 19 minutes (13 commuters, 21.0%) for females.
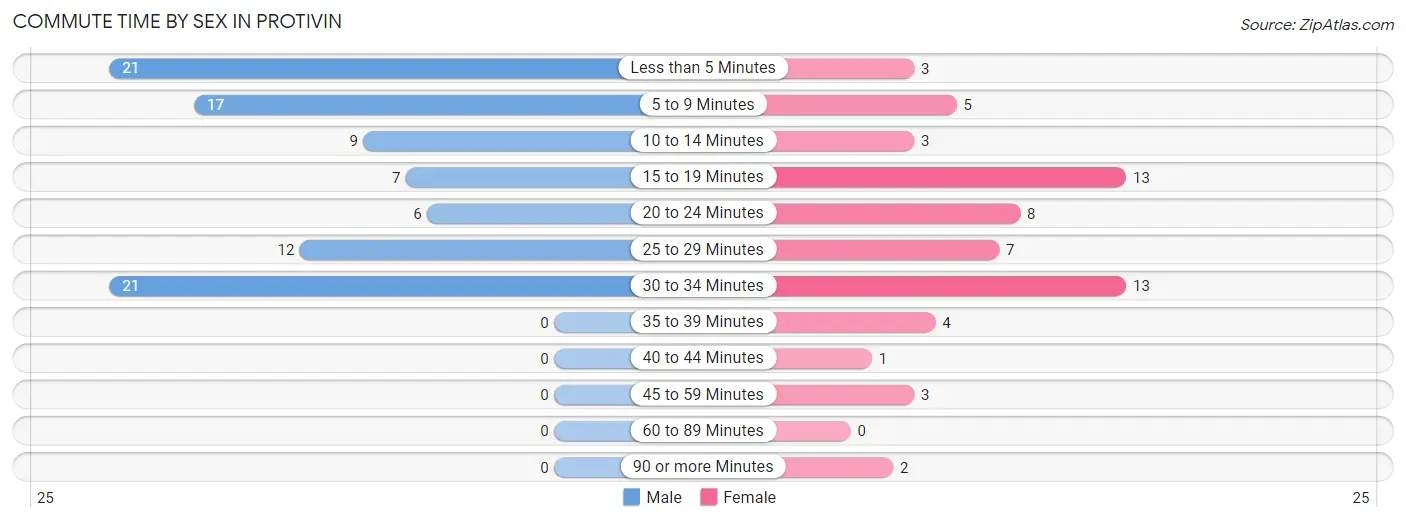
| Commute Time | Male | Female |
| Less than 5 Minutes | 21 (22.6%) | 3 (4.8%) |
| 5 to 9 Minutes | 17 (18.3%) | 5 (8.1%) |
| 10 to 14 Minutes | 9 (9.7%) | 3 (4.8%) |
| 15 to 19 Minutes | 7 (7.5%) | 13 (21.0%) |
| 20 to 24 Minutes | 6 (6.5%) | 8 (12.9%) |
| 25 to 29 Minutes | 12 (12.9%) | 7 (11.3%) |
| 30 to 34 Minutes | 21 (22.6%) | 13 (21.0%) |
| 35 to 39 Minutes | 0 (0.0%) | 4 (6.5%) |
| 40 to 44 Minutes | 0 (0.0%) | 1 (1.6%) |
| 45 to 59 Minutes | 0 (0.0%) | 3 (4.8%) |
| 60 to 89 Minutes | 0 (0.0%) | 0 (0.0%) |
| 90 or more Minutes | 0 (0.0%) | 2 (3.2%) |
Time of Departure to Work by Sex in Protivin
The most frequent times of departure to work in Protivin are 6:00 AM to 6:29 AM (20, 21.5%) for males and 7:00 AM to 7:29 AM (14, 22.6%) for females.
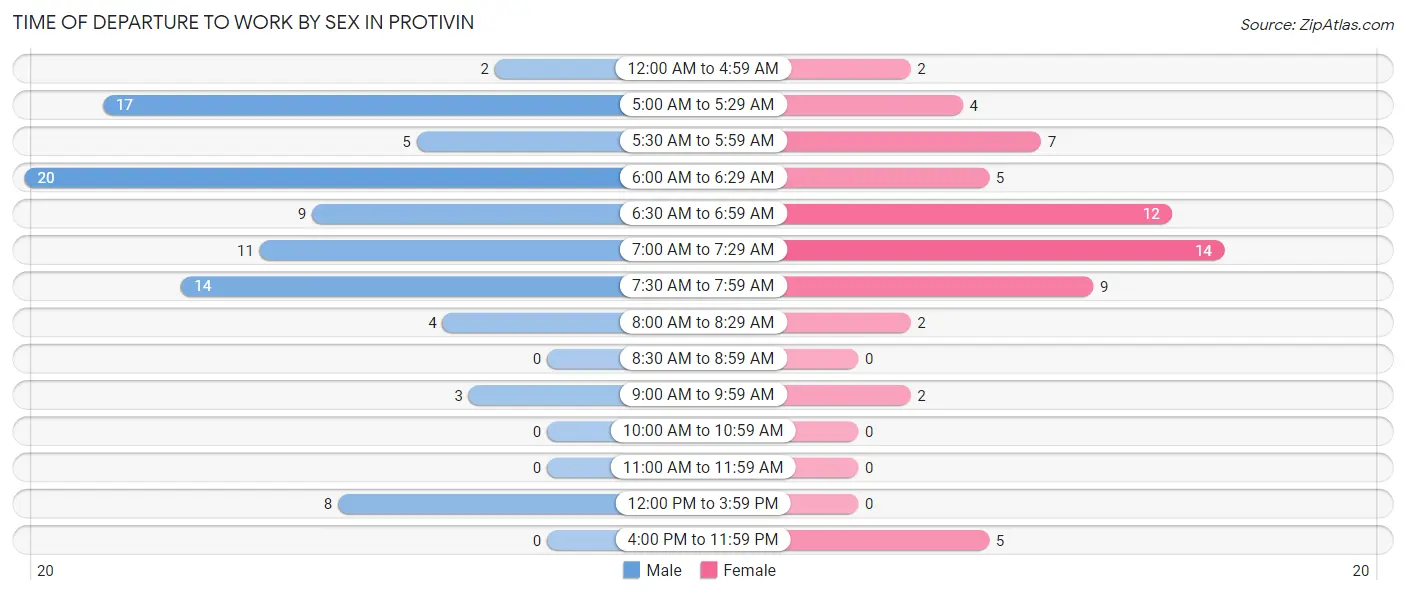
| Time of Departure | Male | Female |
| 12:00 AM to 4:59 AM | 2 (2.1%) | 2 (3.2%) |
| 5:00 AM to 5:29 AM | 17 (18.3%) | 4 (6.5%) |
| 5:30 AM to 5:59 AM | 5 (5.4%) | 7 (11.3%) |
| 6:00 AM to 6:29 AM | 20 (21.5%) | 5 (8.1%) |
| 6:30 AM to 6:59 AM | 9 (9.7%) | 12 (19.4%) |
| 7:00 AM to 7:29 AM | 11 (11.8%) | 14 (22.6%) |
| 7:30 AM to 7:59 AM | 14 (15.0%) | 9 (14.5%) |
| 8:00 AM to 8:29 AM | 4 (4.3%) | 2 (3.2%) |
| 8:30 AM to 8:59 AM | 0 (0.0%) | 0 (0.0%) |
| 9:00 AM to 9:59 AM | 3 (3.2%) | 2 (3.2%) |
| 10:00 AM to 10:59 AM | 0 (0.0%) | 0 (0.0%) |
| 11:00 AM to 11:59 AM | 0 (0.0%) | 0 (0.0%) |
| 12:00 PM to 3:59 PM | 8 (8.6%) | 0 (0.0%) |
| 4:00 PM to 11:59 PM | 0 (0.0%) | 5 (8.1%) |
| Total | 93 (100.0%) | 62 (100.0%) |
Housing Occupancy in Protivin
Occupancy by Ownership in Protivin
Of the total 154 dwellings in Protivin, owner-occupied units account for 145 (94.2%), while renter-occupied units make up 9 (5.8%).
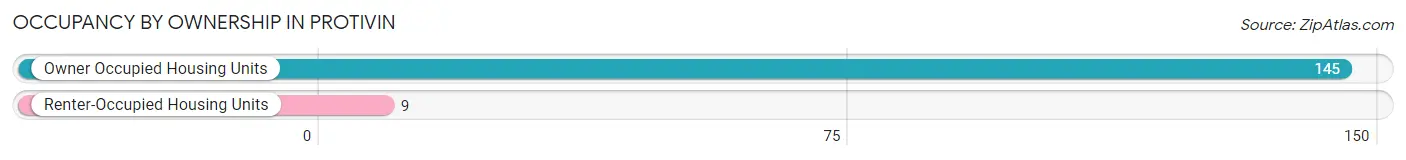
| Occupancy | # Housing Units | % Housing Units |
| Owner Occupied Housing Units | 145 | 94.2% |
| Renter-Occupied Housing Units | 9 | 5.8% |
| Total Occupied Housing Units | 154 | 100.0% |
Occupancy by Household Size in Protivin
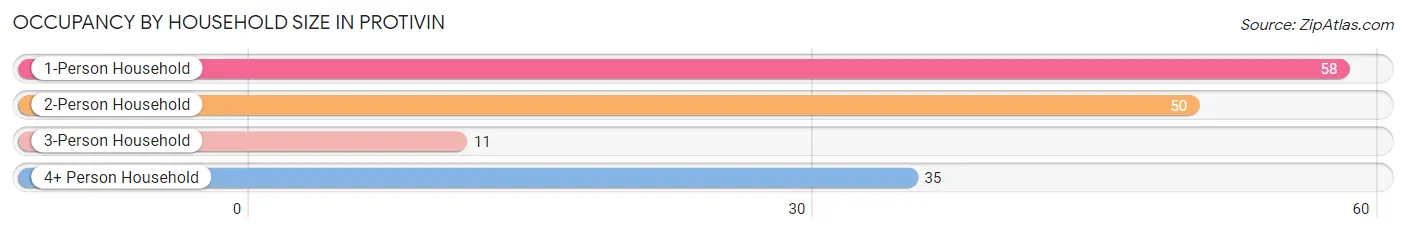
| Household Size | # Housing Units | % Housing Units |
| 1-Person Household | 58 | 37.7% |
| 2-Person Household | 50 | 32.5% |
| 3-Person Household | 11 | 7.1% |
| 4+ Person Household | 35 | 22.7% |
| Total Housing Units | 154 | 100.0% |
Occupancy by Ownership by Household Size in Protivin
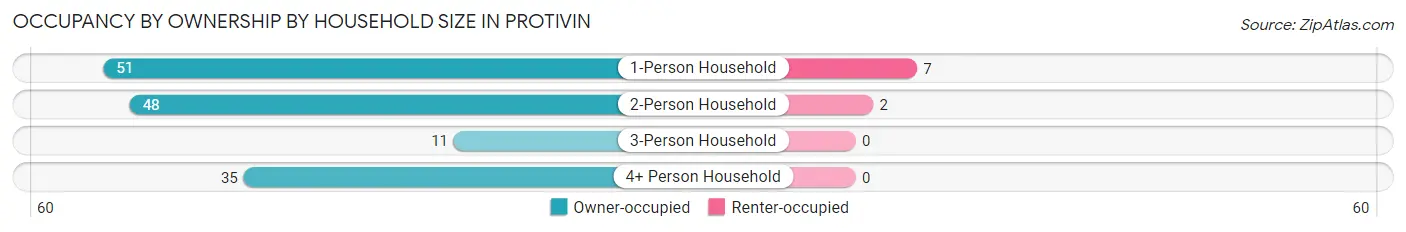
| Household Size | Owner-occupied | Renter-occupied |
| 1-Person Household | 51 (87.9%) | 7 (12.1%) |
| 2-Person Household | 48 (96.0%) | 2 (4.0%) |
| 3-Person Household | 11 (100.0%) | 0 (0.0%) |
| 4+ Person Household | 35 (100.0%) | 0 (0.0%) |
| Total Housing Units | 145 (94.2%) | 9 (5.8%) |
Occupancy by Educational Attainment in Protivin
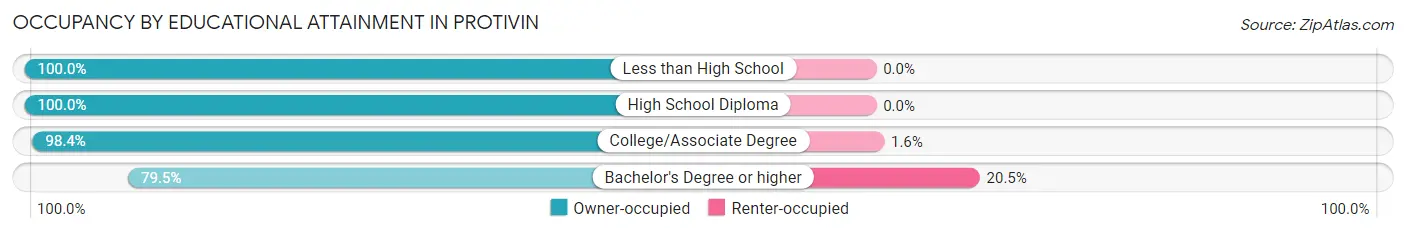
| Household Size | Owner-occupied | Renter-occupied |
| Less than High School | 4 (100.0%) | 0 (0.0%) |
| High School Diploma | 47 (100.0%) | 0 (0.0%) |
| College/Associate Degree | 63 (98.4%) | 1 (1.6%) |
| Bachelor's Degree or higher | 31 (79.5%) | 8 (20.5%) |
Occupancy by Age of Householder in Protivin
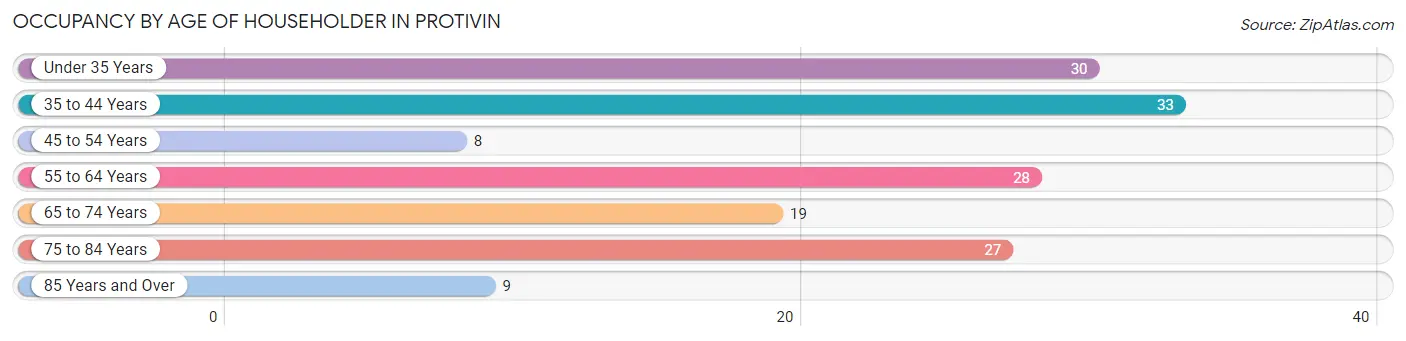
| Age Bracket | # Households | % Households |
| Under 35 Years | 30 | 19.5% |
| 35 to 44 Years | 33 | 21.4% |
| 45 to 54 Years | 8 | 5.2% |
| 55 to 64 Years | 28 | 18.2% |
| 65 to 74 Years | 19 | 12.3% |
| 75 to 84 Years | 27 | 17.5% |
| 85 Years and Over | 9 | 5.8% |
| Total | 154 | 100.0% |
Housing Finances in Protivin
Median Income by Occupancy in Protivin
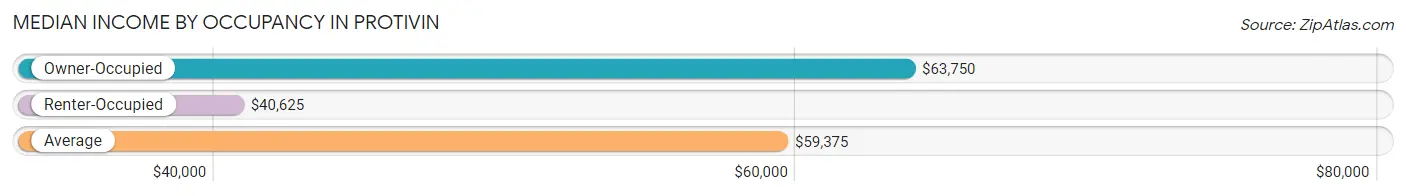
| Occupancy Type | # Households | Median Income |
| Owner-Occupied | 145 (94.2%) | $63,750 |
| Renter-Occupied | 9 (5.8%) | $40,625 |
| Average | 154 (100.0%) | $59,375 |
Occupancy by Householder Income Bracket in Protivin
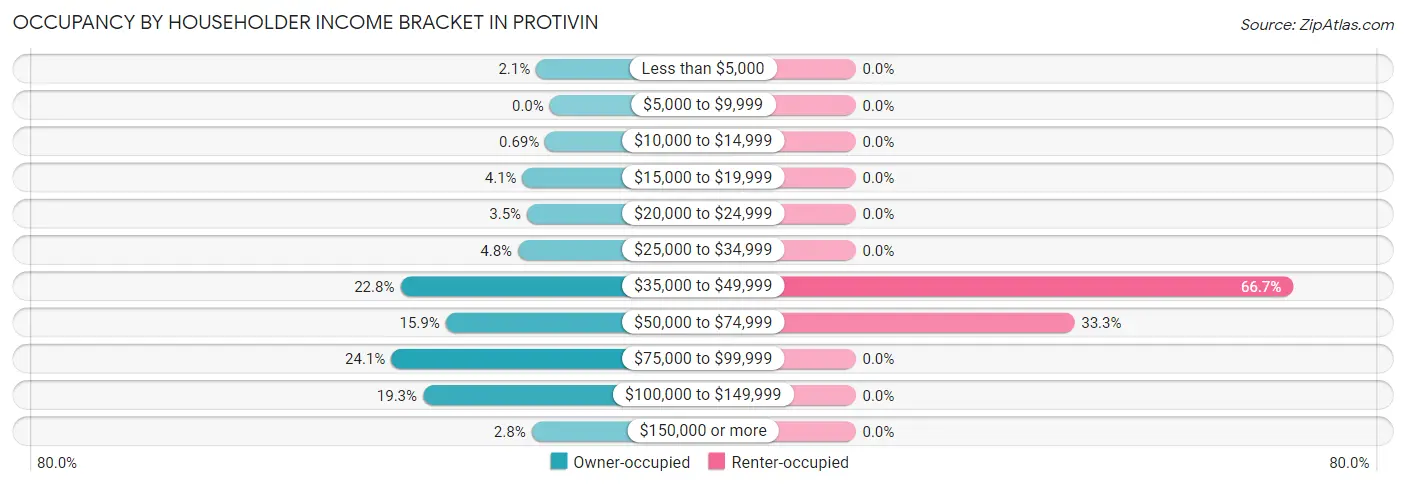
| Income Bracket | Owner-occupied | Renter-occupied |
| Less than $5,000 | 3 (2.1%) | 0 (0.0%) |
| $5,000 to $9,999 | 0 (0.0%) | 0 (0.0%) |
| $10,000 to $14,999 | 1 (0.7%) | 0 (0.0%) |
| $15,000 to $19,999 | 6 (4.1%) | 0 (0.0%) |
| $20,000 to $24,999 | 5 (3.5%) | 0 (0.0%) |
| $25,000 to $34,999 | 7 (4.8%) | 0 (0.0%) |
| $35,000 to $49,999 | 33 (22.8%) | 6 (66.7%) |
| $50,000 to $74,999 | 23 (15.9%) | 3 (33.3%) |
| $75,000 to $99,999 | 35 (24.1%) | 0 (0.0%) |
| $100,000 to $149,999 | 28 (19.3%) | 0 (0.0%) |
| $150,000 or more | 4 (2.8%) | 0 (0.0%) |
| Total | 145 (100.0%) | 9 (100.0%) |
Monthly Housing Cost Tiers in Protivin
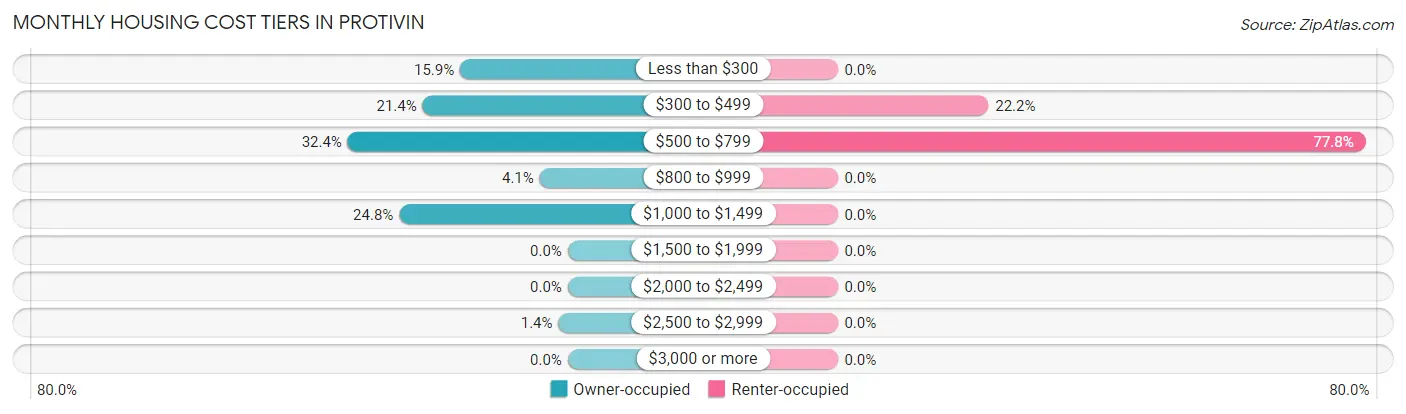
| Monthly Cost | Owner-occupied | Renter-occupied |
| Less than $300 | 23 (15.9%) | 0 (0.0%) |
| $300 to $499 | 31 (21.4%) | 2 (22.2%) |
| $500 to $799 | 47 (32.4%) | 7 (77.8%) |
| $800 to $999 | 6 (4.1%) | 0 (0.0%) |
| $1,000 to $1,499 | 36 (24.8%) | 0 (0.0%) |
| $1,500 to $1,999 | 0 (0.0%) | 0 (0.0%) |
| $2,000 to $2,499 | 0 (0.0%) | 0 (0.0%) |
| $2,500 to $2,999 | 2 (1.4%) | 0 (0.0%) |
| $3,000 or more | 0 (0.0%) | 0 (0.0%) |
| Total | 145 (100.0%) | 9 (100.0%) |
Physical Housing Characteristics in Protivin
Housing Structures in Protivin
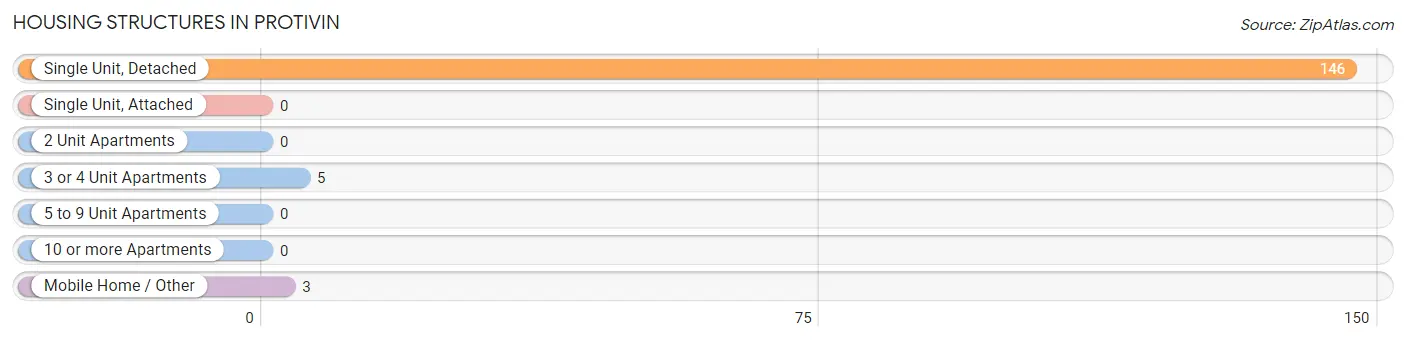
| Structure Type | # Housing Units | % Housing Units |
| Single Unit, Detached | 146 | 94.8% |
| Single Unit, Attached | 0 | 0.0% |
| 2 Unit Apartments | 0 | 0.0% |
| 3 or 4 Unit Apartments | 5 | 3.3% |
| 5 to 9 Unit Apartments | 0 | 0.0% |
| 10 or more Apartments | 0 | 0.0% |
| Mobile Home / Other | 3 | 1.9% |
| Total | 154 | 100.0% |
Housing Structures by Occupancy in Protivin
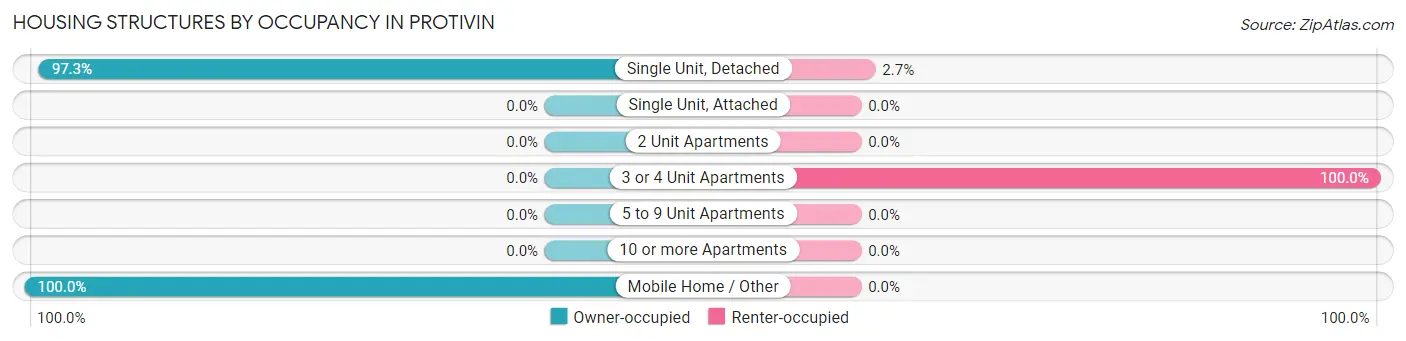
| Structure Type | Owner-occupied | Renter-occupied |
| Single Unit, Detached | 142 (97.3%) | 4 (2.7%) |
| Single Unit, Attached | 0 (0.0%) | 0 (0.0%) |
| 2 Unit Apartments | 0 (0.0%) | 0 (0.0%) |
| 3 or 4 Unit Apartments | 0 (0.0%) | 5 (100.0%) |
| 5 to 9 Unit Apartments | 0 (0.0%) | 0 (0.0%) |
| 10 or more Apartments | 0 (0.0%) | 0 (0.0%) |
| Mobile Home / Other | 3 (100.0%) | 0 (0.0%) |
| Total | 145 (94.2%) | 9 (5.8%) |
Housing Structures by Number of Rooms in Protivin
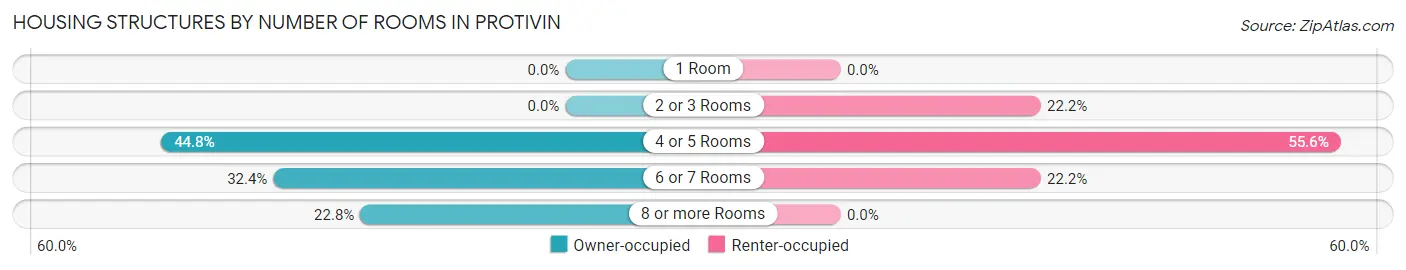
| Number of Rooms | Owner-occupied | Renter-occupied |
| 1 Room | 0 (0.0%) | 0 (0.0%) |
| 2 or 3 Rooms | 0 (0.0%) | 2 (22.2%) |
| 4 or 5 Rooms | 65 (44.8%) | 5 (55.6%) |
| 6 or 7 Rooms | 47 (32.4%) | 2 (22.2%) |
| 8 or more Rooms | 33 (22.8%) | 0 (0.0%) |
| Total | 145 (100.0%) | 9 (100.0%) |
Housing Structure by Heating Type in Protivin
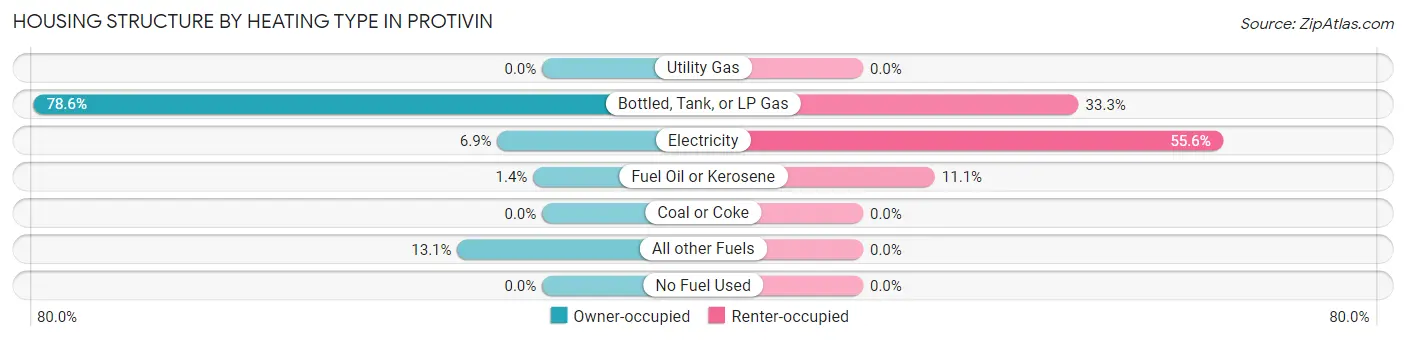
| Heating Type | Owner-occupied | Renter-occupied |
| Utility Gas | 0 (0.0%) | 0 (0.0%) |
| Bottled, Tank, or LP Gas | 114 (78.6%) | 3 (33.3%) |
| Electricity | 10 (6.9%) | 5 (55.6%) |
| Fuel Oil or Kerosene | 2 (1.4%) | 1 (11.1%) |
| Coal or Coke | 0 (0.0%) | 0 (0.0%) |
| All other Fuels | 19 (13.1%) | 0 (0.0%) |
| No Fuel Used | 0 (0.0%) | 0 (0.0%) |
| Total | 145 (100.0%) | 9 (100.0%) |
Household Vehicle Usage in Protivin
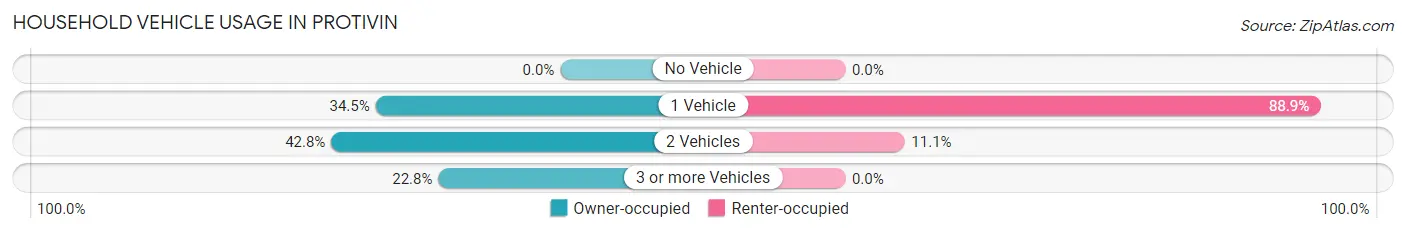
| Vehicles per Household | Owner-occupied | Renter-occupied |
| No Vehicle | 0 (0.0%) | 0 (0.0%) |
| 1 Vehicle | 50 (34.5%) | 8 (88.9%) |
| 2 Vehicles | 62 (42.8%) | 1 (11.1%) |
| 3 or more Vehicles | 33 (22.8%) | 0 (0.0%) |
| Total | 145 (100.0%) | 9 (100.0%) |
Real Estate & Mortgages in Protivin
Real Estate and Mortgage Overview in Protivin
| Characteristic | Without Mortgage | With Mortgage |
| Housing Units | 76 | 69 |
| Median Property Value | $95,000 | $85,600 |
| Median Household Income | $55,000 | $0 |
| Monthly Housing Costs | $427 | $0 |
| Real Estate Taxes | $1,198 | $0 |
Property Value by Mortgage Status in Protivin
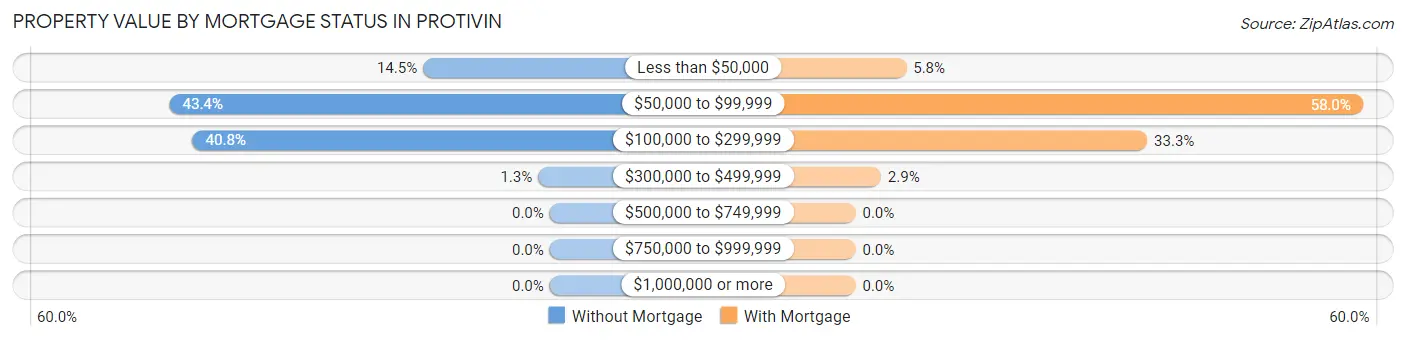
| Property Value | Without Mortgage | With Mortgage |
| Less than $50,000 | 11 (14.5%) | 4 (5.8%) |
| $50,000 to $99,999 | 33 (43.4%) | 40 (58.0%) |
| $100,000 to $299,999 | 31 (40.8%) | 23 (33.3%) |
| $300,000 to $499,999 | 1 (1.3%) | 2 (2.9%) |
| $500,000 to $749,999 | 0 (0.0%) | 0 (0.0%) |
| $750,000 to $999,999 | 0 (0.0%) | 0 (0.0%) |
| $1,000,000 or more | 0 (0.0%) | 0 (0.0%) |
| Total | 76 (100.0%) | 69 (100.0%) |
Household Income by Mortgage Status in Protivin
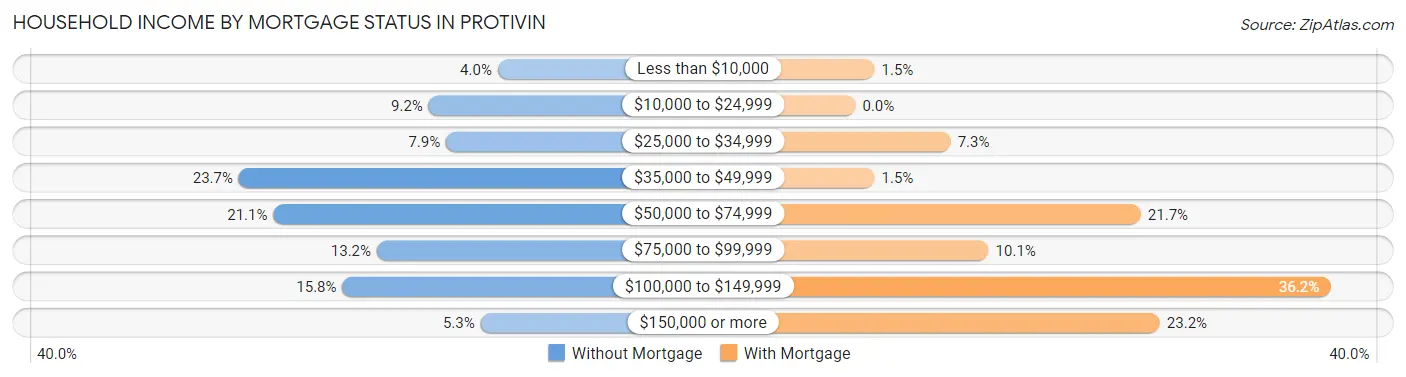
| Household Income | Without Mortgage | With Mortgage |
| Less than $10,000 | 3 (4.0%) | 1 (1.5%) |
| $10,000 to $24,999 | 7 (9.2%) | 0 (0.0%) |
| $25,000 to $34,999 | 6 (7.9%) | 5 (7.2%) |
| $35,000 to $49,999 | 18 (23.7%) | 1 (1.5%) |
| $50,000 to $74,999 | 16 (21.0%) | 15 (21.7%) |
| $75,000 to $99,999 | 10 (13.2%) | 7 (10.1%) |
| $100,000 to $149,999 | 12 (15.8%) | 25 (36.2%) |
| $150,000 or more | 4 (5.3%) | 16 (23.2%) |
| Total | 76 (100.0%) | 69 (100.0%) |
Property Value to Household Income Ratio in Protivin
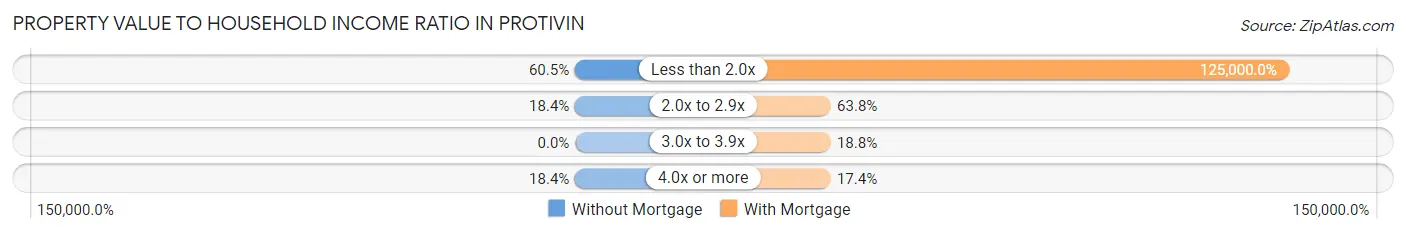
| Value-to-Income Ratio | Without Mortgage | With Mortgage |
| Less than 2.0x | 46 (60.5%) | 86,250 (125,000.0%) |
| 2.0x to 2.9x | 14 (18.4%) | 44 (63.8%) |
| 3.0x to 3.9x | 0 (0.0%) | 13 (18.8%) |
| 4.0x or more | 14 (18.4%) | 12 (17.4%) |
| Total | 76 (100.0%) | 69 (100.0%) |
Real Estate Taxes by Mortgage Status in Protivin
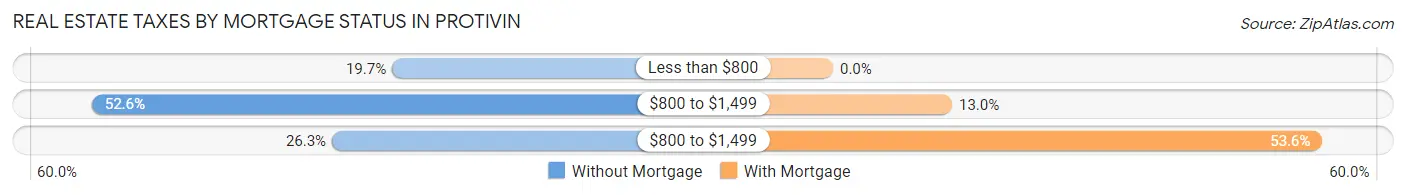
| Property Taxes | Without Mortgage | With Mortgage |
| Less than $800 | 15 (19.7%) | 0 (0.0%) |
| $800 to $1,499 | 40 (52.6%) | 9 (13.0%) |
| $800 to $1,499 | 20 (26.3%) | 37 (53.6%) |
| Total | 76 (100.0%) | 69 (100.0%) |
Health & Disability in Protivin
Health Insurance Coverage by Age in Protivin
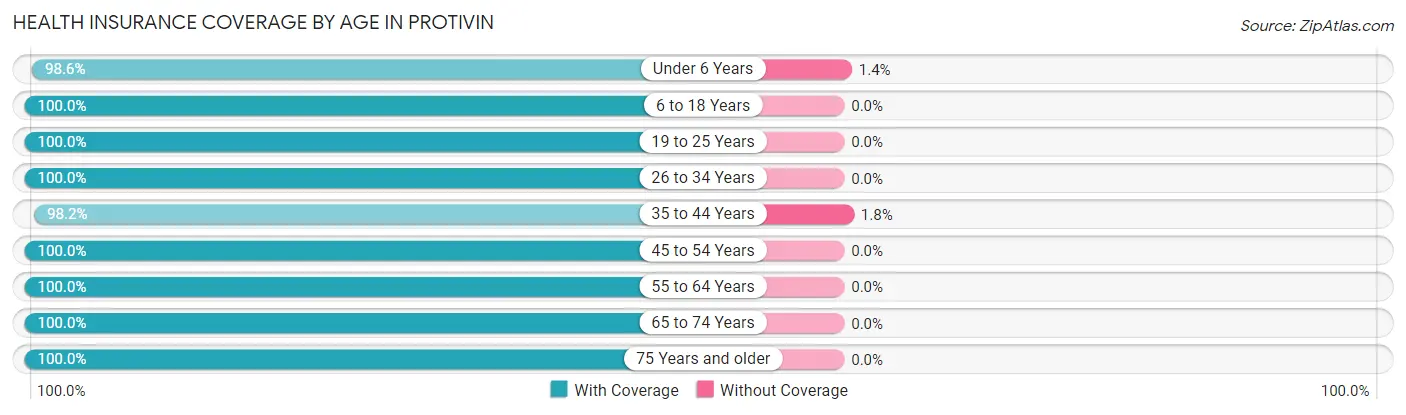
| Age Bracket | With Coverage | Without Coverage |
| Under 6 Years | 70 (98.6%) | 1 (1.4%) |
| 6 to 18 Years | 46 (100.0%) | 0 (0.0%) |
| 19 to 25 Years | 5 (100.0%) | 0 (0.0%) |
| 26 to 34 Years | 46 (100.0%) | 0 (0.0%) |
| 35 to 44 Years | 55 (98.2%) | 1 (1.8%) |
| 45 to 54 Years | 8 (100.0%) | 0 (0.0%) |
| 55 to 64 Years | 46 (100.0%) | 0 (0.0%) |
| 65 to 74 Years | 39 (100.0%) | 0 (0.0%) |
| 75 Years and older | 48 (100.0%) | 0 (0.0%) |
| Total | 363 (99.5%) | 2 (0.5%) |
Health Insurance Coverage by Citizenship Status in Protivin
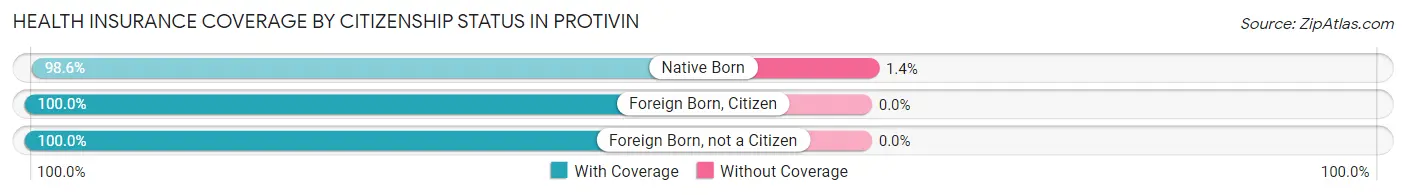
| Citizenship Status | With Coverage | Without Coverage |
| Native Born | 70 (98.6%) | 1 (1.4%) |
| Foreign Born, Citizen | 46 (100.0%) | 0 (0.0%) |
| Foreign Born, not a Citizen | 5 (100.0%) | 0 (0.0%) |
Health Insurance Coverage by Household Income in Protivin
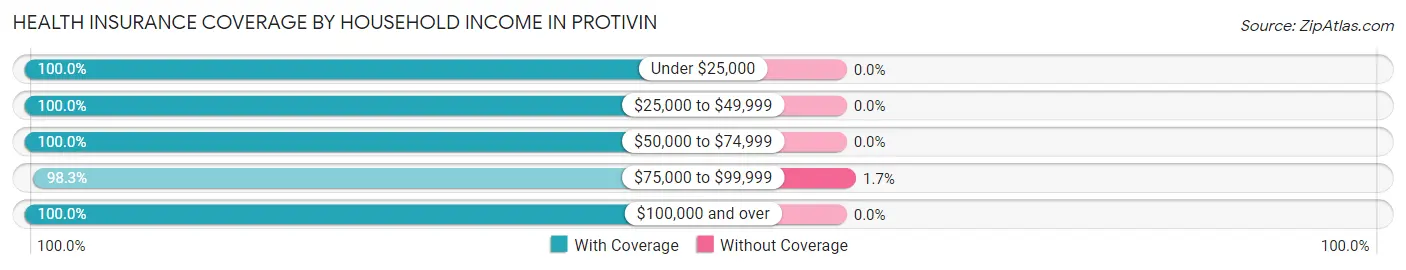
| Household Income | With Coverage | Without Coverage |
| Under $25,000 | 15 (100.0%) | 0 (0.0%) |
| $25,000 to $49,999 | 67 (100.0%) | 0 (0.0%) |
| $50,000 to $74,999 | 61 (100.0%) | 0 (0.0%) |
| $75,000 to $99,999 | 113 (98.3%) | 2 (1.7%) |
| $100,000 and over | 107 (100.0%) | 0 (0.0%) |
Public vs Private Health Insurance Coverage by Age in Protivin
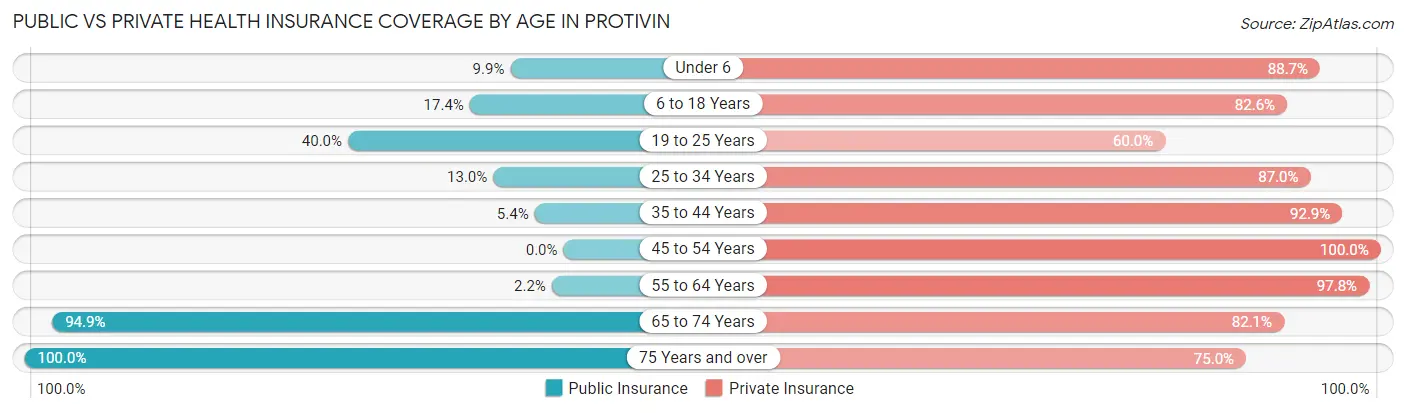
| Age Bracket | Public Insurance | Private Insurance |
| Under 6 | 7 (9.9%) | 63 (88.7%) |
| 6 to 18 Years | 8 (17.4%) | 38 (82.6%) |
| 19 to 25 Years | 2 (40.0%) | 3 (60.0%) |
| 25 to 34 Years | 6 (13.0%) | 40 (87.0%) |
| 35 to 44 Years | 3 (5.4%) | 52 (92.9%) |
| 45 to 54 Years | 0 (0.0%) | 8 (100.0%) |
| 55 to 64 Years | 1 (2.2%) | 45 (97.8%) |
| 65 to 74 Years | 37 (94.9%) | 32 (82.1%) |
| 75 Years and over | 48 (100.0%) | 36 (75.0%) |
| Total | 112 (30.7%) | 317 (86.9%) |
Disability Status by Sex by Age in Protivin
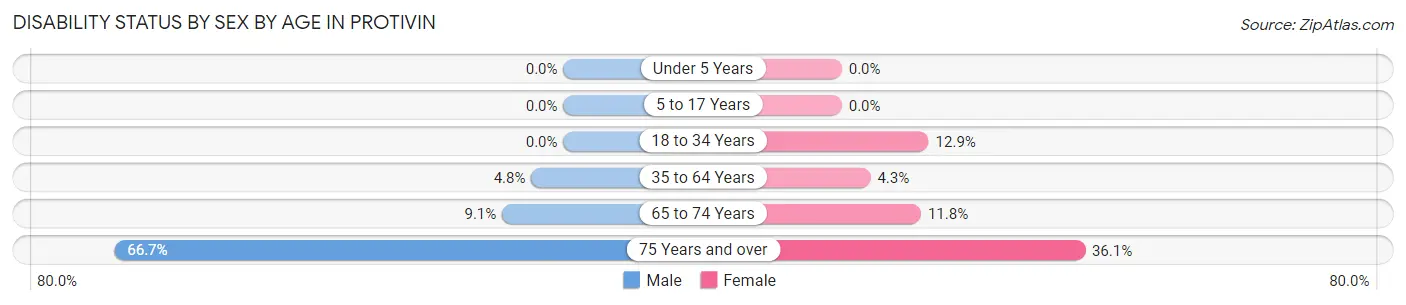
| Age Bracket | Male | Female |
| Under 5 Years | 0 (0.0%) | 0 (0.0%) |
| 5 to 17 Years | 0 (0.0%) | 0 (0.0%) |
| 18 to 34 Years | 0 (0.0%) | 4 (12.9%) |
| 35 to 64 Years | 3 (4.8%) | 2 (4.3%) |
| 65 to 74 Years | 2 (9.1%) | 2 (11.8%) |
| 75 Years and over | 8 (66.7%) | 13 (36.1%) |
Disability Class by Sex by Age in Protivin
Disability Class: Hearing Difficulty
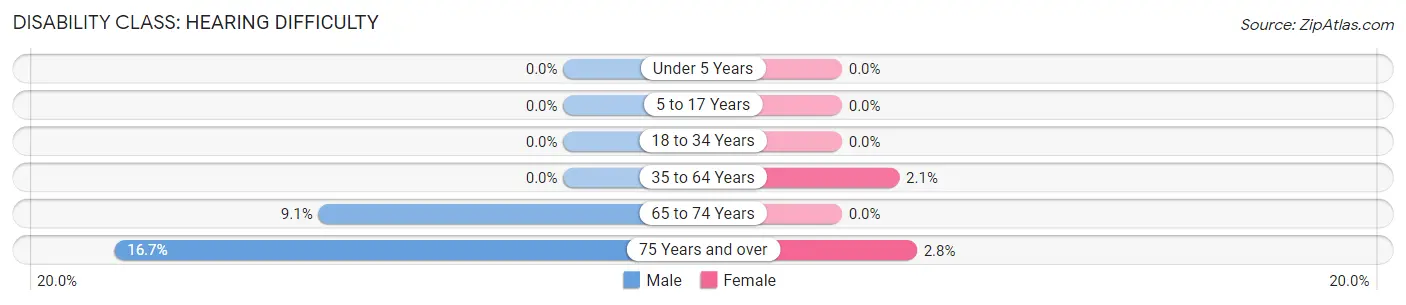
| Age Bracket | Male | Female |
| Under 5 Years | 0 (0.0%) | 0 (0.0%) |
| 5 to 17 Years | 0 (0.0%) | 0 (0.0%) |
| 18 to 34 Years | 0 (0.0%) | 0 (0.0%) |
| 35 to 64 Years | 0 (0.0%) | 1 (2.1%) |
| 65 to 74 Years | 2 (9.1%) | 0 (0.0%) |
| 75 Years and over | 2 (16.7%) | 1 (2.8%) |
Disability Class: Vision Difficulty
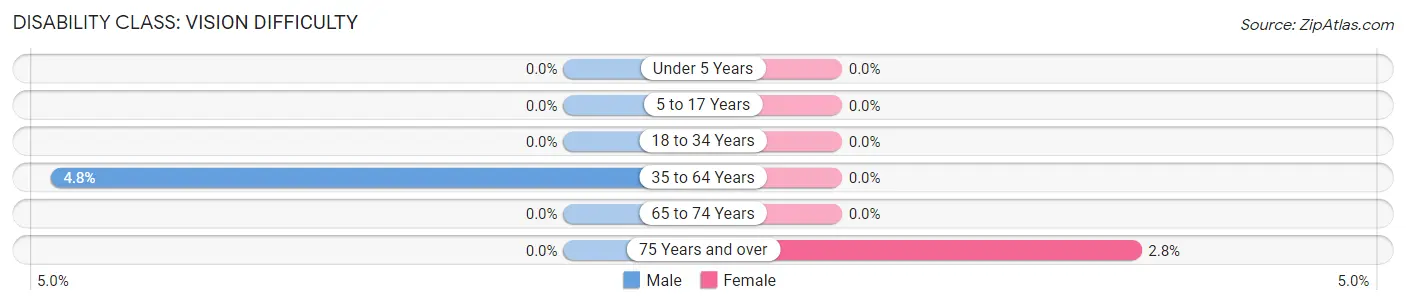
| Age Bracket | Male | Female |
| Under 5 Years | 0 (0.0%) | 0 (0.0%) |
| 5 to 17 Years | 0 (0.0%) | 0 (0.0%) |
| 18 to 34 Years | 0 (0.0%) | 0 (0.0%) |
| 35 to 64 Years | 3 (4.8%) | 0 (0.0%) |
| 65 to 74 Years | 0 (0.0%) | 0 (0.0%) |
| 75 Years and over | 0 (0.0%) | 1 (2.8%) |
Disability Class: Cognitive Difficulty
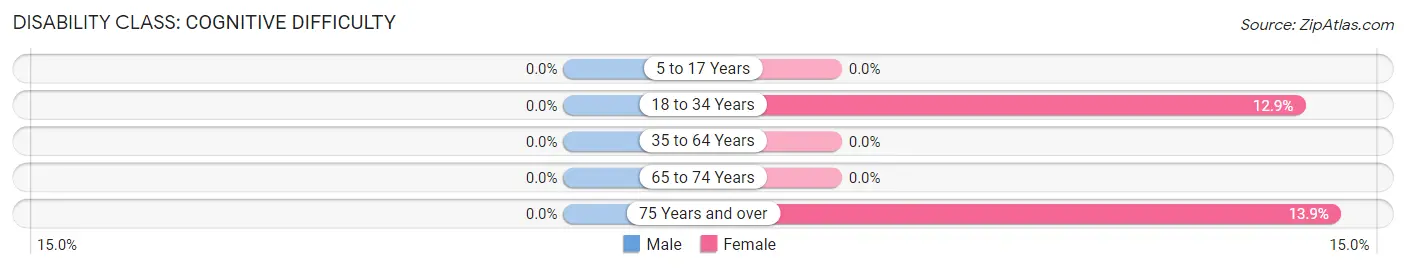
| Age Bracket | Male | Female |
| 5 to 17 Years | 0 (0.0%) | 0 (0.0%) |
| 18 to 34 Years | 0 (0.0%) | 4 (12.9%) |
| 35 to 64 Years | 0 (0.0%) | 0 (0.0%) |
| 65 to 74 Years | 0 (0.0%) | 0 (0.0%) |
| 75 Years and over | 0 (0.0%) | 5 (13.9%) |
Disability Class: Ambulatory Difficulty
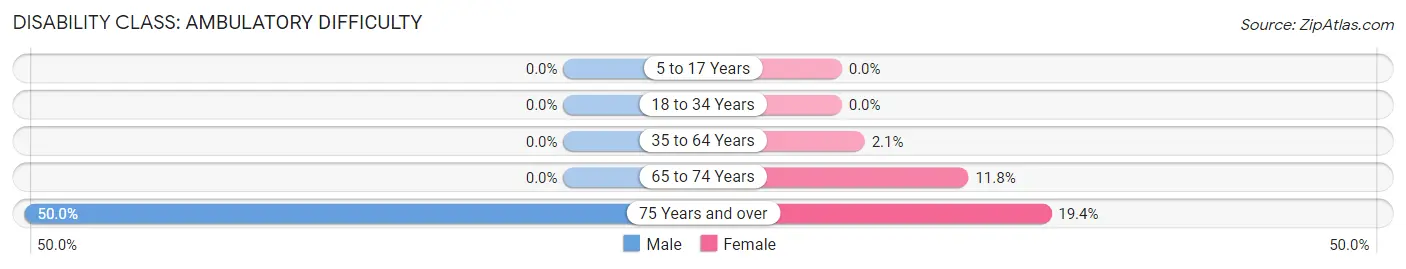
| Age Bracket | Male | Female |
| 5 to 17 Years | 0 (0.0%) | 0 (0.0%) |
| 18 to 34 Years | 0 (0.0%) | 0 (0.0%) |
| 35 to 64 Years | 0 (0.0%) | 1 (2.1%) |
| 65 to 74 Years | 0 (0.0%) | 2 (11.8%) |
| 75 Years and over | 6 (50.0%) | 7 (19.4%) |
Disability Class: Self-Care Difficulty
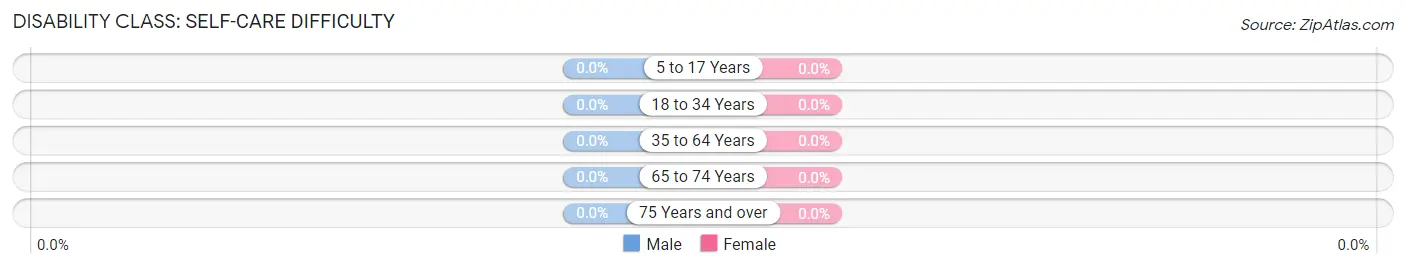
| Age Bracket | Male | Female |
| 5 to 17 Years | 0 (0.0%) | 0 (0.0%) |
| 18 to 34 Years | 0 (0.0%) | 0 (0.0%) |
| 35 to 64 Years | 0 (0.0%) | 0 (0.0%) |
| 65 to 74 Years | 0 (0.0%) | 0 (0.0%) |
| 75 Years and over | 0 (0.0%) | 0 (0.0%) |
Technology Access in Protivin
Computing Device Access in Protivin
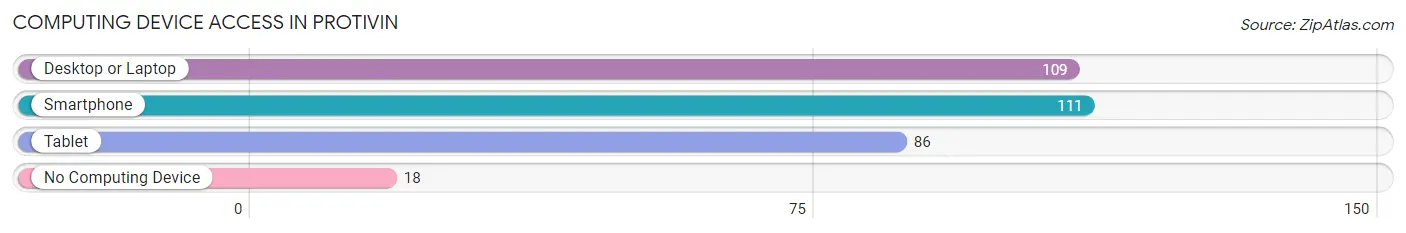
| Device Type | # Households | % Households |
| Desktop or Laptop | 109 | 70.8% |
| Smartphone | 111 | 72.1% |
| Tablet | 86 | 55.8% |
| No Computing Device | 18 | 11.7% |
| Total | 154 | 100.0% |
Internet Access in Protivin
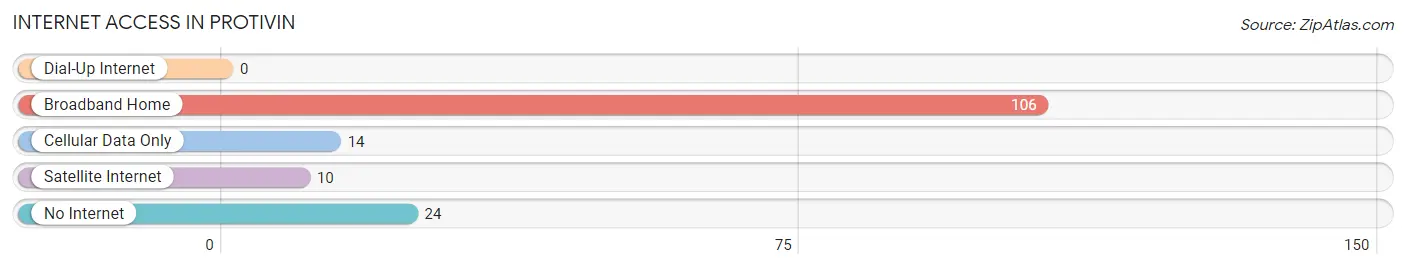
| Internet Type | # Households | % Households |
| Dial-Up Internet | 0 | 0.0% |
| Broadband Home | 106 | 68.8% |
| Cellular Data Only | 14 | 9.1% |
| Satellite Internet | 10 | 6.5% |
| No Internet | 24 | 15.6% |
| Total | 154 | 100.0% |
Protivin Summary
Protivin is a small city located in Howard County, Iowa, United States. It is situated in the northeast corner of the state, about 30 miles from the Minnesota border. The population of Protivin was 545 at the 2010 census.
History
Protivin was founded in 1856 by Czech immigrants who had come to the area from Bohemia. The town was named after the Czech village of Protivin, which is located in the Czech Republic. The first settlers were mostly farmers, and the town quickly grew to become a thriving agricultural community.
In 1872, the first school was built in Protivin, and the town soon became a center of education and culture. The first church was built in 1876, and the first newspaper was established in 1877.
Protivin was incorporated as a city in 1883. The town continued to grow and prosper, and by the early 1900s, it had become a major center of commerce and industry. The town was home to several factories, including a flour mill, a creamery, a canning factory, and a brickyard.
Geography
Protivin is located at the intersection of U.S. Route 63 and Iowa Highway 9. It is situated in the northeast corner of the state, about 30 miles from the Minnesota border. The city is located in the rolling hills of the Driftless Area, which is characterized by its rugged terrain and steep valleys.
The city is surrounded by several small towns, including Lime Springs, Chester, and Elma. The nearest major city is Rochester, Minnesota, which is about 40 miles away.
Economy
Protivin’s economy is largely based on agriculture. The town is home to several farms, which produce a variety of crops, including corn, soybeans, and hay. The town is also home to several small businesses, including a grocery store, a hardware store, and a restaurant.
The town is also home to several manufacturing companies, including a furniture factory, a plastics factory, and a metal fabrication plant.
Demographics
As of the 2010 census, the population of Protivin was 545. The racial makeup of the town was 97.3% White, 0.2% African American, 0.2% Native American, 0.4% Asian, 0.2% from other races, and 1.7% from two or more races. Hispanic or Latino of any race were 1.3% of the population.
The median income for a household in Protivin was $41,250, and the median income for a family was $50,000. The per capita income for the town was $19,945. About 8.3% of families and 10.2% of the population were below the poverty line, including 11.3% of those under age 18 and 8.3% of those age 65 or over.
Conclusion
Protivin is a small city located in Howard County, Iowa. It was founded in 1856 by Czech immigrants, and it has since become a thriving agricultural community. The town is home to several farms, businesses, and manufacturing companies, and it has a population of 545 as of the 2010 census. Protivin’s economy is largely based on agriculture, and the town is also home to several small businesses and manufacturing companies. The median income for a household in Protivin was $41,250, and the median income for a family was $50,000.
Common Questions
What is Per Capita Income in Protivin?
Per Capita income in Protivin is $29,925.
What is the Median Family Income in Protivin?
Median Family Income in Protivin is $93,750.
What is the Median Household income in Protivin?
Median Household Income in Protivin is $59,375.
What is Income or Wage Gap in Protivin?
Income or Wage Gap in Protivin is 3.2%.
Women in Protivin earn 96.8 cents for every dollar earned by a man.
What is Inequality or Gini Index in Protivin?
Inequality or Gini Index in Protivin is 0.30.
What is the Total Population of Protivin?
Total Population of Protivin is 365.
What is the Total Male Population of Protivin?
Total Male Population of Protivin is 180.
What is the Total Female Population of Protivin?
Total Female Population of Protivin is 185.
What is the Ratio of Males per 100 Females in Protivin?
There are 97.30 Males per 100 Females in Protivin.
What is the Ratio of Females per 100 Males in Protivin?
There are 102.78 Females per 100 Males in Protivin.
What is the Median Population Age in Protivin?
Median Population Age in Protivin is 37.1 Years.
What is the Average Family Size in Protivin
Average Family Size in Protivin is 3.2 People.
What is the Average Household Size in Protivin
Average Household Size in Protivin is 2.4 People.
How Large is the Labor Force in Protivin?
There are 184 People in the Labor Forcein in Protivin.
What is the Percentage of People in the Labor Force in Protivin?
74.2% of People are in the Labor Force in Protivin.
What is the Unemployment Rate in Protivin?
Unemployment Rate in Protivin is 3.3%.