Oelwein, IA Map & Demographics
Oelwein Map
Oelwein Overview
$26,500
PER CAPITA INCOME
$58,806
AVG FAMILY INCOME
$41,629
AVG HOUSEHOLD INCOME
40.9%
WAGE / INCOME GAP [ % ]
59.1¢/ $1
WAGE / INCOME GAP [ $ ]
$17,088
FAMILY INCOME DEFICIT
0.46
INEQUALITY / GINI INDEX
5,934
TOTAL POPULATION
3,008
MALE POPULATION
2,926
FEMALE POPULATION
102.80
MALES / 100 FEMALES
97.27
FEMALES / 100 MALES
44.2
MEDIAN AGE
2.9
AVG FAMILY SIZE
2.2
AVG HOUSEHOLD SIZE
2,507
LABOR FORCE [ PEOPLE ]
51.6%
PERCENT IN LABOR FORCE
6.7%
UNEMPLOYMENT RATE
Oelwein Zip Codes
Oelwein Area Codes
Income in Oelwein
Income Overview in Oelwein
Per Capita Income in Oelwein is $26,500, while median incomes of families and households are $58,806 and $41,629 respectively.
| Characteristic | Number | Measure |
| Per Capita Income | 5,934 | $26,500 |
| Median Family Income | 1,407 | $58,806 |
| Mean Family Income | 1,407 | $72,899 |
| Median Household Income | 2,628 | $41,629 |
| Mean Household Income | 2,628 | $57,561 |
| Income Deficit | 1,407 | $17,088 |
| Wage / Income Gap (%) | 5,934 | 40.95% |
| Wage / Income Gap ($) | 5,934 | 59.05¢ per $1 |
| Gini / Inequality Index | 5,934 | 0.46 |
Earnings by Sex in Oelwein
Average Earnings in Oelwein are $32,705, $43,661 for men and $25,784 for women, a difference of 40.9%.
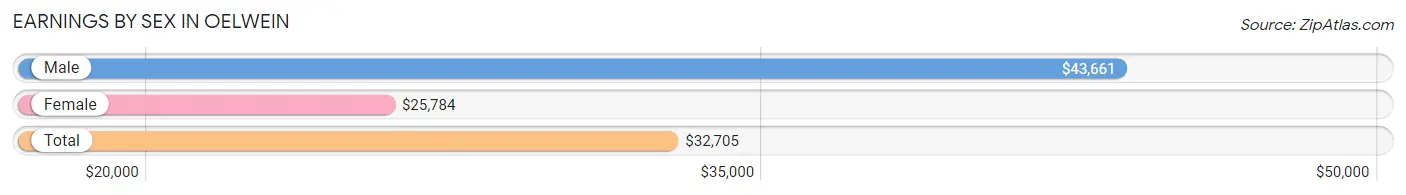
| Sex | Number | Average Earnings |
| Male | 1,496 (54.5%) | $43,661 |
| Female | 1,248 (45.5%) | $25,784 |
| Total | 2,744 (100.0%) | $32,705 |
Earnings by Sex by Income Bracket in Oelwein
The most common earnings brackets in Oelwein are $55,000 to $64,999 for men (239 | 16.0%) and $25,000 to $29,999 for women (196 | 15.7%).

| Income | Male | Female |
| $2,499 or less | 42 (2.8%) | 162 (13.0%) |
| $2,500 to $4,999 | 53 (3.5%) | 8 (0.6%) |
| $5,000 to $7,499 | 126 (8.4%) | 88 (7.0%) |
| $7,500 to $9,999 | 95 (6.4%) | 2 (0.2%) |
| $10,000 to $12,499 | 47 (3.1%) | 43 (3.5%) |
| $12,500 to $14,999 | 0 (0.0%) | 8 (0.6%) |
| $15,000 to $17,499 | 24 (1.6%) | 75 (6.0%) |
| $17,500 to $19,999 | 0 (0.0%) | 32 (2.6%) |
| $20,000 to $22,499 | 34 (2.3%) | 0 (0.0%) |
| $22,500 to $24,999 | 0 (0.0%) | 169 (13.5%) |
| $25,000 to $29,999 | 78 (5.2%) | 196 (15.7%) |
| $30,000 to $34,999 | 125 (8.4%) | 66 (5.3%) |
| $35,000 to $39,999 | 102 (6.8%) | 36 (2.9%) |
| $40,000 to $44,999 | 37 (2.5%) | 111 (8.9%) |
| $45,000 to $49,999 | 137 (9.2%) | 16 (1.3%) |
| $50,000 to $54,999 | 114 (7.6%) | 39 (3.1%) |
| $55,000 to $64,999 | 239 (16.0%) | 70 (5.6%) |
| $65,000 to $74,999 | 67 (4.5%) | 38 (3.0%) |
| $75,000 to $99,999 | 87 (5.8%) | 34 (2.7%) |
| $100,000+ | 89 (5.9%) | 55 (4.4%) |
| Total | 1,496 (100.0%) | 1,248 (100.0%) |
Earnings by Sex by Educational Attainment in Oelwein
Average earnings in Oelwein are $45,867 for men and $27,282 for women, a difference of 40.5%. Men with an educational attainment of graduate degree enjoy the highest average annual earnings of $115,074, while those with high school diploma education earn the least with $36,696. Women with an educational attainment of graduate degree earn the most with the average annual earnings of $66,771, while those with bachelor's degree education have the smallest earnings of $16,667.
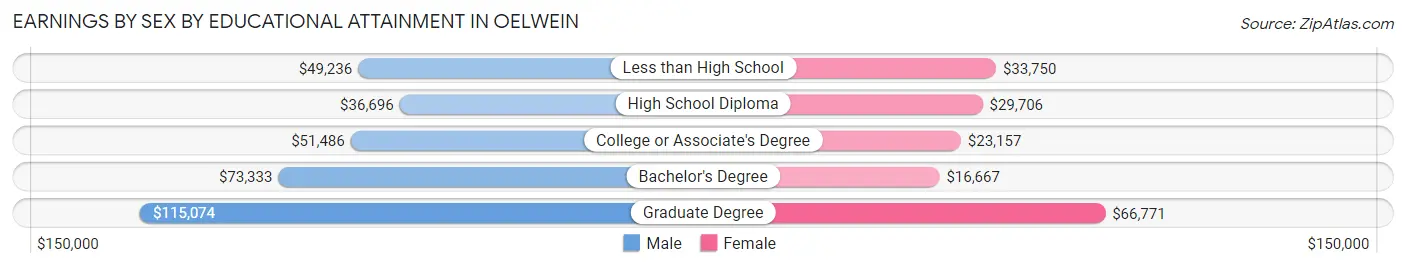
| Educational Attainment | Male Income | Female Income |
| Less than High School | $49,236 | $33,750 |
| High School Diploma | $36,696 | $29,706 |
| College or Associate's Degree | $51,486 | $23,157 |
| Bachelor's Degree | $73,333 | $16,667 |
| Graduate Degree | $115,074 | $66,771 |
| Total | $45,867 | $27,282 |
Family Income in Oelwein
Family Income Brackets in Oelwein
According to the Oelwein family income data, there are 353 families falling into the $50,000 to $74,999 income range, which is the most common income bracket and makes up 25.1% of all families. Conversely, the $150,000 to $199,999 income bracket is the least frequent group with only 23 families (1.6%) belonging to this category.
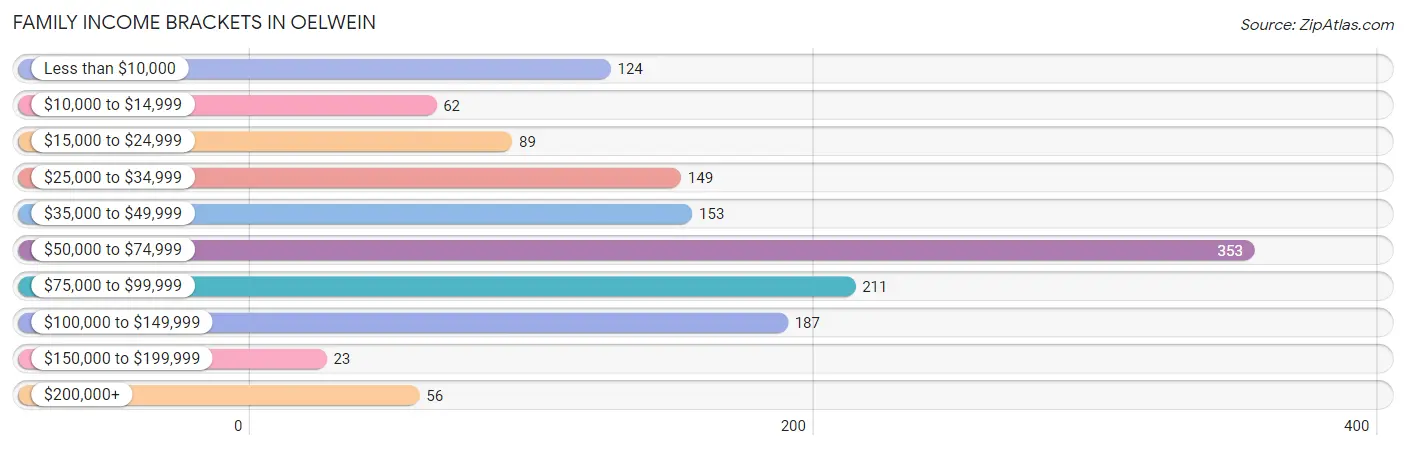
| Income Bracket | # Families | % Families |
| Less than $10,000 | 124 | 8.8% |
| $10,000 to $14,999 | 62 | 4.4% |
| $15,000 to $24,999 | 89 | 6.3% |
| $25,000 to $34,999 | 149 | 10.6% |
| $35,000 to $49,999 | 153 | 10.9% |
| $50,000 to $74,999 | 353 | 25.1% |
| $75,000 to $99,999 | 211 | 15.0% |
| $100,000 to $149,999 | 187 | 13.3% |
| $150,000 to $199,999 | 23 | 1.6% |
| $200,000+ | 56 | 4.0% |
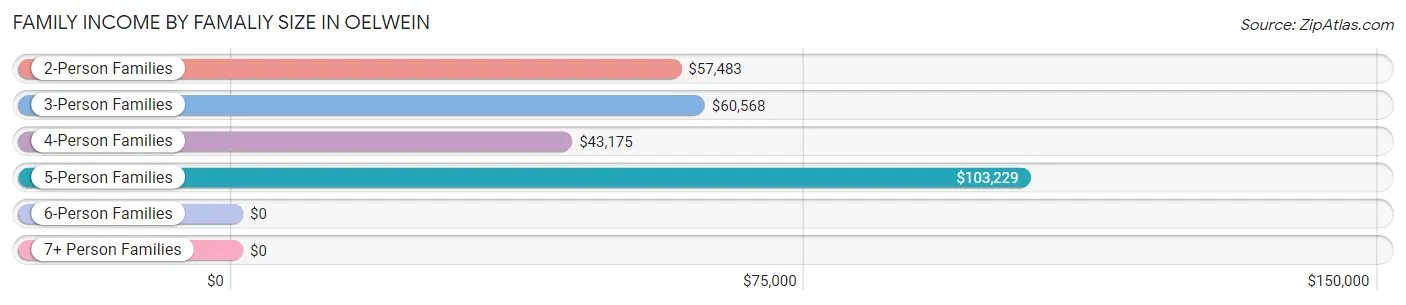
Family Income by Famaliy Size in Oelwein
5-person families (63 | 4.5%) account for the highest median family income in Oelwein with $103,229 per family, while 2-person families (721 | 51.2%) have the highest median income of $28,742 per family member.
| Income Bracket | # Families | Median Income |
| 2-Person Families | 721 (51.2%) | $57,483 |
| 3-Person Families | 320 (22.7%) | $60,568 |
| 4-Person Families | 285 (20.3%) | $43,175 |
| 5-Person Families | 63 (4.5%) | $103,229 |
| 6-Person Families | 7 (0.5%) | $0 |
| 7+ Person Families | 11 (0.8%) | $0 |
| Total | 1,407 (100.0%) | $58,806 |
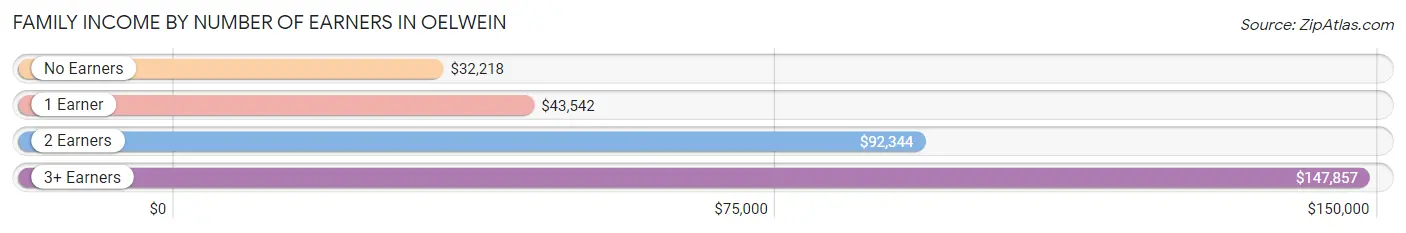
Family Income by Number of Earners in Oelwein
The median family income in Oelwein is $58,806, with families comprising 3+ earners (48) having the highest median family income of $147,857, while families with no earners (223) have the lowest median family income of $32,218, accounting for 3.4% and 15.9% of families, respectively.
| Number of Earners | # Families | Median Income |
| No Earners | 223 (15.9%) | $32,218 |
| 1 Earner | 691 (49.1%) | $43,542 |
| 2 Earners | 445 (31.6%) | $92,344 |
| 3+ Earners | 48 (3.4%) | $147,857 |
| Total | 1,407 (100.0%) | $58,806 |
Household Income in Oelwein
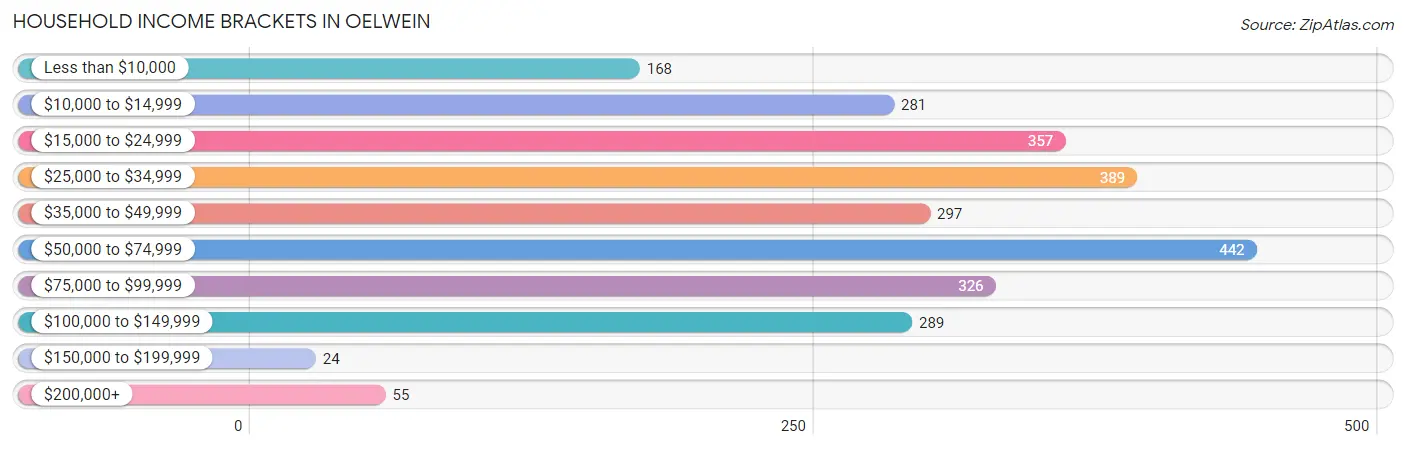
Household Income Brackets in Oelwein
With 442 households falling in the category, the $50,000 to $74,999 income range is the most frequent in Oelwein, accounting for 16.8% of all households. In contrast, only 24 households (0.9%) fall into the $150,000 to $199,999 income bracket, making it the least populous group.
| Income Bracket | # Households | % Households |
| Less than $10,000 | 168 | 6.4% |
| $10,000 to $14,999 | 281 | 10.7% |
| $15,000 to $24,999 | 357 | 13.6% |
| $25,000 to $34,999 | 389 | 14.8% |
| $35,000 to $49,999 | 297 | 11.3% |
| $50,000 to $74,999 | 442 | 16.8% |
| $75,000 to $99,999 | 326 | 12.4% |
| $100,000 to $149,999 | 289 | 11.0% |
| $150,000 to $199,999 | 24 | 0.9% |
| $200,000+ | 55 | 2.1% |
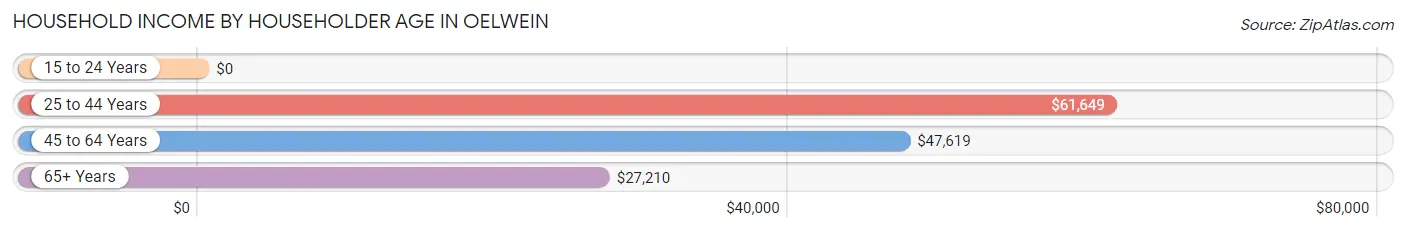
Household Income by Householder Age in Oelwein
The median household income in Oelwein is $41,629, with the highest median household income of $61,649 found in the 25 to 44 years age bracket for the primary householder. A total of 714 households (27.2%) fall into this category. Meanwhile, the 15 to 24 years age bracket for the primary householder has the lowest median household income of $0, with 145 households (5.5%) in this group.
| Income Bracket | # Households | Median Income |
| 15 to 24 Years | 145 (5.5%) | $0 |
| 25 to 44 Years | 714 (27.2%) | $61,649 |
| 45 to 64 Years | 882 (33.6%) | $47,619 |
| 65+ Years | 887 (33.8%) | $27,210 |
| Total | 2,628 (100.0%) | $41,629 |
Poverty in Oelwein
Income Below Poverty by Sex and Age in Oelwein
With 16.8% poverty level for males and 18.2% for females among the residents of Oelwein, 6 to 11 year old males and under 5 year old females are the most vulnerable to poverty, with 87 males (34.5%) and 75 females (52.8%) in their respective age groups living below the poverty level.
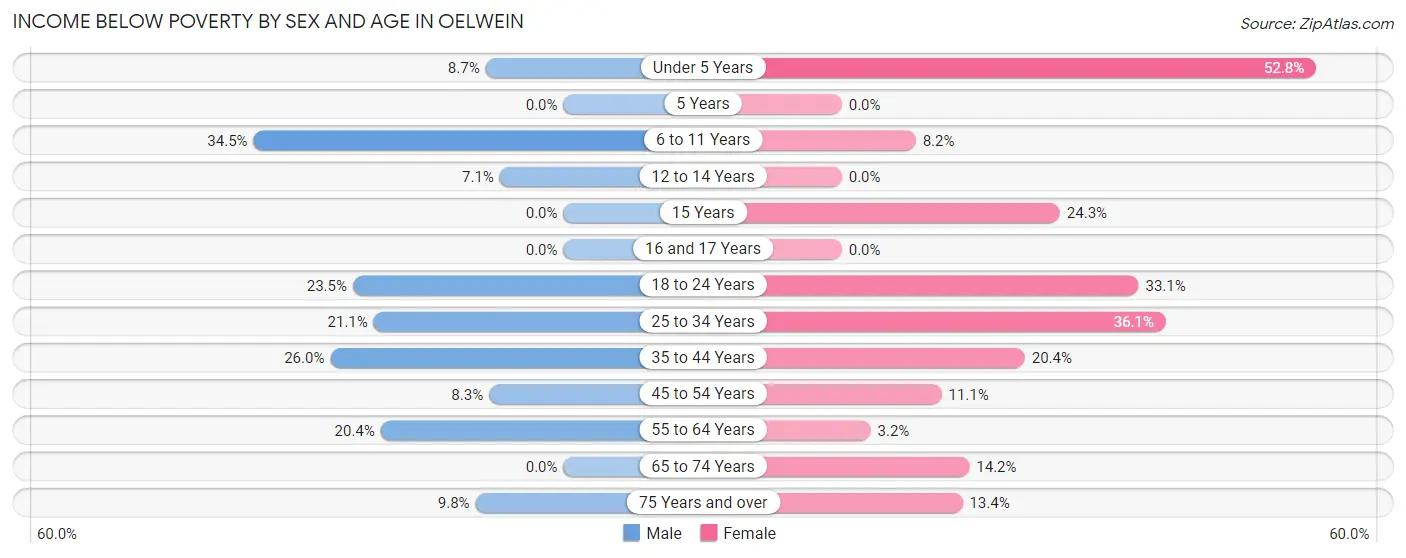
| Age Bracket | Male | Female |
| Under 5 Years | 13 (8.7%) | 75 (52.8%) |
| 5 Years | 0 (0.0%) | 0 (0.0%) |
| 6 to 11 Years | 87 (34.5%) | 13 (8.2%) |
| 12 to 14 Years | 10 (7.1%) | 0 (0.0%) |
| 15 Years | 0 (0.0%) | 17 (24.3%) |
| 16 and 17 Years | 0 (0.0%) | 0 (0.0%) |
| 18 to 24 Years | 34 (23.4%) | 78 (33.1%) |
| 25 to 34 Years | 90 (21.1%) | 122 (36.1%) |
| 35 to 44 Years | 122 (26.0%) | 53 (20.4%) |
| 45 to 54 Years | 26 (8.3%) | 41 (11.1%) |
| 55 to 64 Years | 92 (20.3%) | 13 (3.2%) |
| 65 to 74 Years | 0 (0.0%) | 57 (14.2%) |
| 75 Years and over | 14 (9.8%) | 50 (13.4%) |
| Total | 488 (16.8%) | 519 (18.2%) |
Income Above Poverty by Sex and Age in Oelwein
According to the poverty statistics in Oelwein, males aged 5 years and females aged 5 years are the age groups that are most secure financially, with 100.0% of males and 100.0% of females in these age groups living above the poverty line.
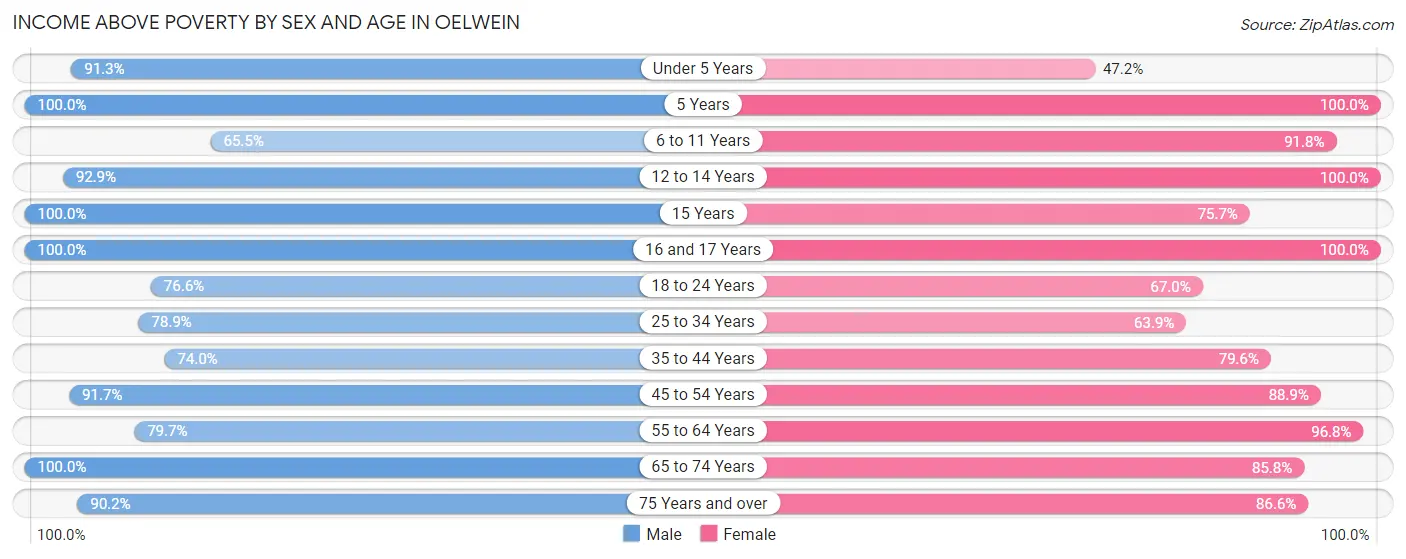
| Age Bracket | Male | Female |
| Under 5 Years | 137 (91.3%) | 67 (47.2%) |
| 5 Years | 24 (100.0%) | 33 (100.0%) |
| 6 to 11 Years | 165 (65.5%) | 145 (91.8%) |
| 12 to 14 Years | 131 (92.9%) | 60 (100.0%) |
| 15 Years | 29 (100.0%) | 53 (75.7%) |
| 16 and 17 Years | 90 (100.0%) | 14 (100.0%) |
| 18 to 24 Years | 111 (76.5%) | 158 (66.9%) |
| 25 to 34 Years | 336 (78.9%) | 216 (63.9%) |
| 35 to 44 Years | 348 (74.0%) | 207 (79.6%) |
| 45 to 54 Years | 288 (91.7%) | 328 (88.9%) |
| 55 to 64 Years | 360 (79.6%) | 392 (96.8%) |
| 65 to 74 Years | 276 (100.0%) | 344 (85.8%) |
| 75 Years and over | 129 (90.2%) | 322 (86.6%) |
| Total | 2,424 (83.2%) | 2,339 (81.8%) |
Income Below Poverty Among Married-Couple Families in Oelwein
The poverty statistics for married-couple families in Oelwein show that 6.9% or 68 of the total 987 families live below the poverty line. Families with 1 or 2 children have the highest poverty rate of 12.6%, comprising of 47 families. On the other hand, families with 3 or 4 children have the lowest poverty rate of 0.0%, which includes 0 families.
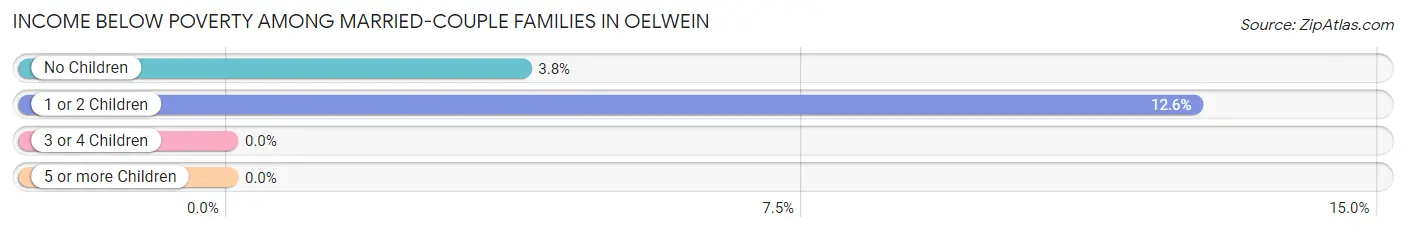
| Children | Above Poverty | Below Poverty |
| No Children | 527 (96.2%) | 21 (3.8%) |
| 1 or 2 Children | 326 (87.4%) | 47 (12.6%) |
| 3 or 4 Children | 66 (100.0%) | 0 (0.0%) |
| 5 or more Children | 0 (0.0%) | 0 (0.0%) |
| Total | 919 (93.1%) | 68 (6.9%) |
Income Below Poverty Among Single-Parent Households in Oelwein
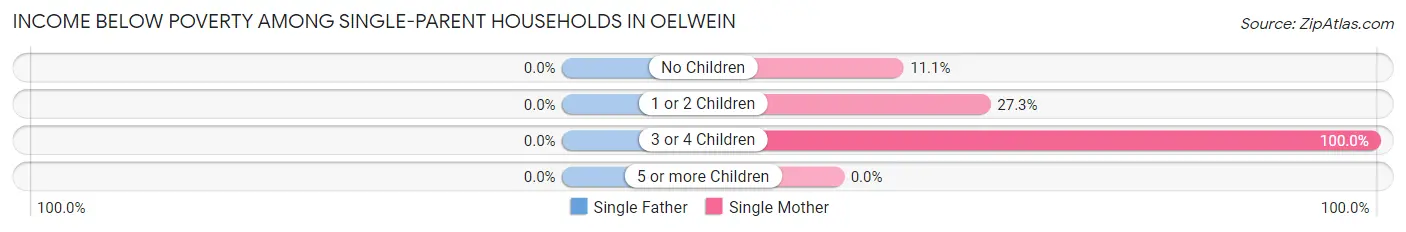
| Children | Single Father | Single Mother |
| No Children | 0 (0.0%) | 8 (11.1%) |
| 1 or 2 Children | 0 (0.0%) | 50 (27.3%) |
| 3 or 4 Children | 0 (0.0%) | 60 (100.0%) |
| 5 or more Children | 0 (0.0%) | 0 (0.0%) |
| Total | 0 (0.0%) | 118 (37.5%) |
Income Below Poverty Among Married-Couple vs Single-Parent Households in Oelwein
The poverty data for Oelwein shows that 68 of the married-couple family households (6.9%) and 118 of the single-parent households (28.1%) are living below the poverty level. Within the married-couple family households, those with 1 or 2 children have the highest poverty rate, with 47 households (12.6%) falling below the poverty line. Among the single-parent households, those with 3 or 4 children have the highest poverty rate, with 60 household (100.0%) living below poverty.
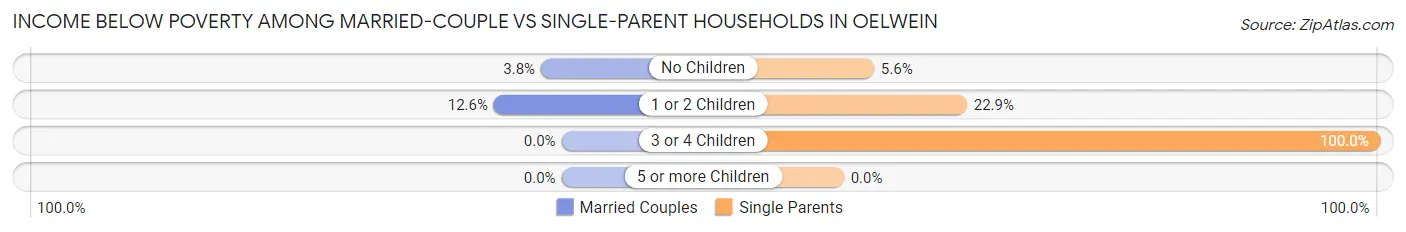
| Children | Married-Couple Families | Single-Parent Households |
| No Children | 21 (3.8%) | 8 (5.6%) |
| 1 or 2 Children | 47 (12.6%) | 50 (22.9%) |
| 3 or 4 Children | 0 (0.0%) | 60 (100.0%) |
| 5 or more Children | 0 (0.0%) | 0 (0.0%) |
| Total | 68 (6.9%) | 118 (28.1%) |
Race in Oelwein
The most populous races in Oelwein are White / Caucasian (5,443 | 91.7%), Two or more Races (384 | 6.5%), and Hispanic or Latino (145 | 2.4%).
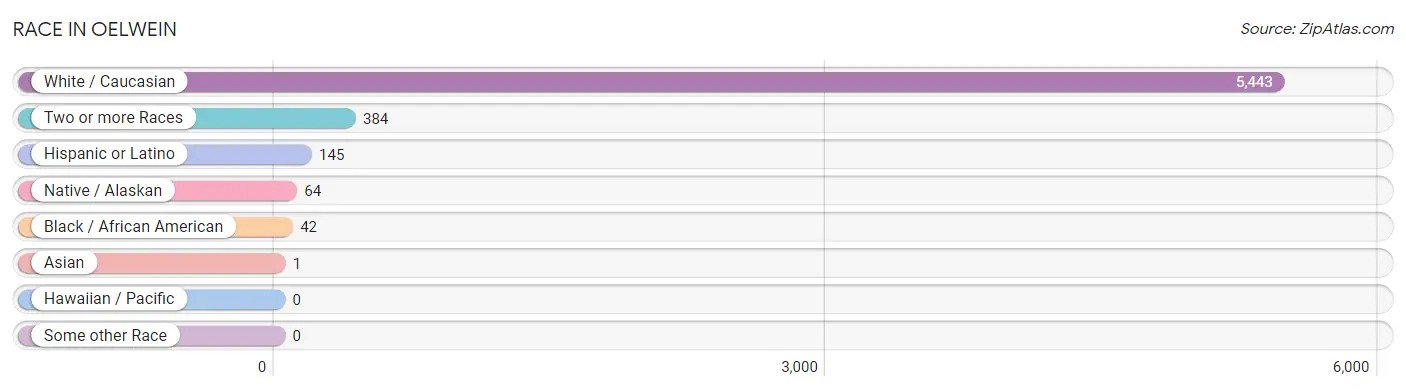
| Race | # Population | % Population |
| Asian | 1 | 0.0% |
| Black / African American | 42 | 0.7% |
| Hawaiian / Pacific | 0 | 0.0% |
| Hispanic or Latino | 145 | 2.4% |
| Native / Alaskan | 64 | 1.1% |
| White / Caucasian | 5,443 | 91.7% |
| Two or more Races | 384 | 6.5% |
| Some other Race | 0 | 0.0% |
| Total | 5,934 | 100.0% |
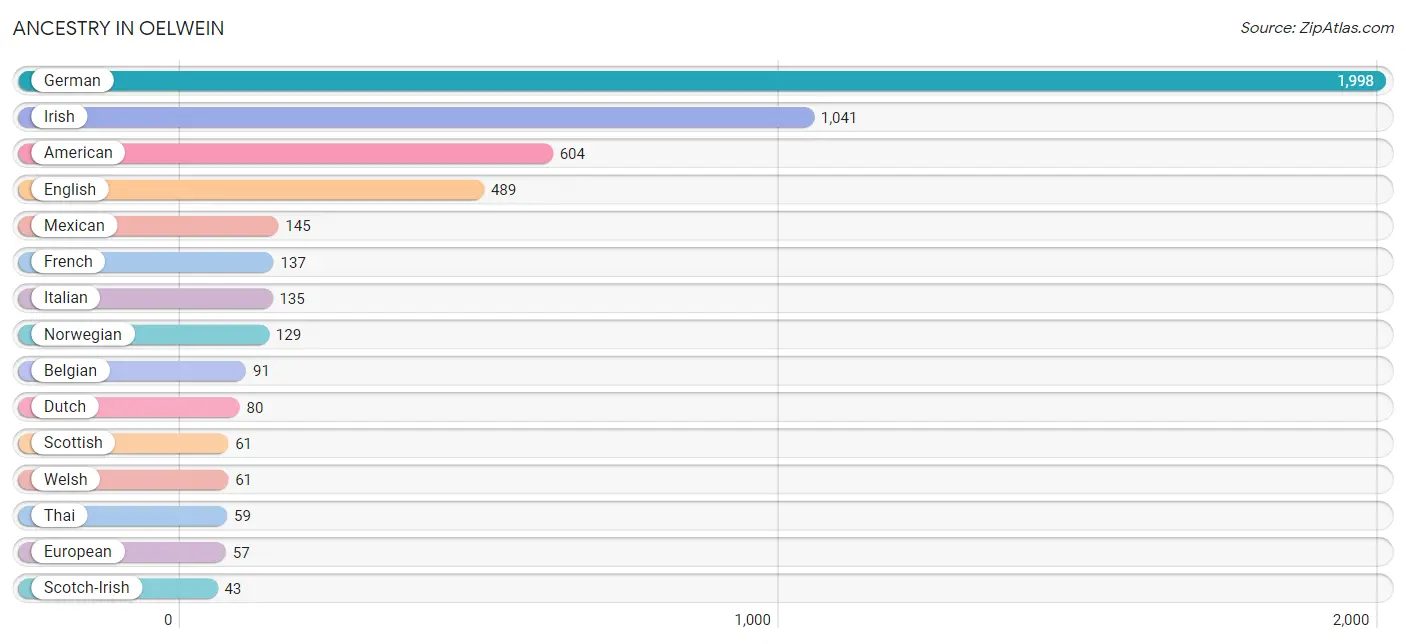
Ancestry in Oelwein
The most populous ancestries reported in Oelwein are German (1,998 | 33.7%), Irish (1,041 | 17.5%), American (604 | 10.2%), English (489 | 8.2%), and Mexican (145 | 2.4%), together accounting for 72.1% of all Oelwein residents.
| Ancestry | # Population | % Population |
| American | 604 | 10.2% |
| Belgian | 91 | 1.5% |
| Bulgarian | 10 | 0.2% |
| Burmese | 40 | 0.7% |
| Chippewa | 5 | 0.1% |
| Crow | 2 | 0.0% |
| Czech | 23 | 0.4% |
| Danish | 24 | 0.4% |
| Dutch | 80 | 1.3% |
| Eastern European | 9 | 0.2% |
| English | 489 | 8.2% |
| Estonian | 8 | 0.1% |
| European | 57 | 1.0% |
| French | 137 | 2.3% |
| French Canadian | 6 | 0.1% |
| German | 1,998 | 33.7% |
| Greek | 9 | 0.2% |
| Hungarian | 29 | 0.5% |
| Indian (Asian) | 25 | 0.4% |
| Irish | 1,041 | 17.5% |
| Italian | 135 | 2.3% |
| Latvian | 21 | 0.4% |
| Luxembourger | 18 | 0.3% |
| Mexican | 145 | 2.4% |
| Northern European | 32 | 0.5% |
| Norwegian | 129 | 2.2% |
| Polish | 25 | 0.4% |
| Portuguese | 9 | 0.2% |
| Russian | 20 | 0.3% |
| Scandinavian | 7 | 0.1% |
| Scotch-Irish | 43 | 0.7% |
| Scottish | 61 | 1.0% |
| Sioux | 18 | 0.3% |
| Swedish | 7 | 0.1% |
| Swiss | 11 | 0.2% |
| Thai | 59 | 1.0% |
| Welsh | 61 | 1.0% | View All 37 Rows |
Immigrants in Oelwein
The most numerous immigrant groups reported in Oelwein came from Asia (1 | 0.0%), Eastern Asia (1 | 0.0%), and Korea (1 | 0.0%), together accounting for 0.1% of all Oelwein residents.
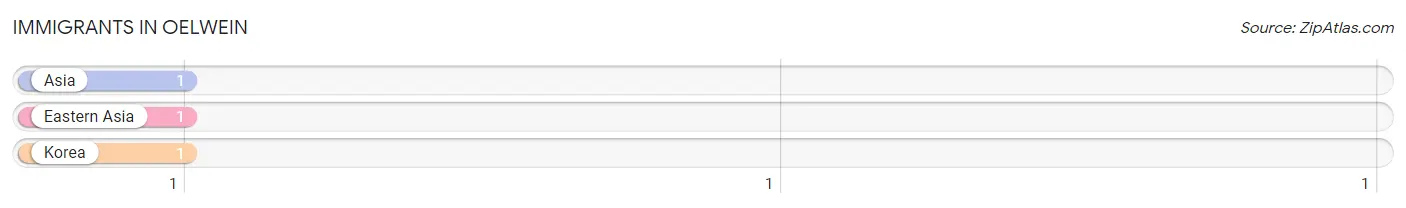
| Immigration Origin | # Population | % Population |
| Asia | 1 | 0.0% |
| Eastern Asia | 1 | 0.0% |
| Korea | 1 | 0.0% | View All 3 Rows |
Sex and Age in Oelwein
Sex and Age in Oelwein
The most populous age groups in Oelwein are 55 to 59 Years (268 | 8.9%) for men and 65 to 69 Years (281 | 9.6%) for women.
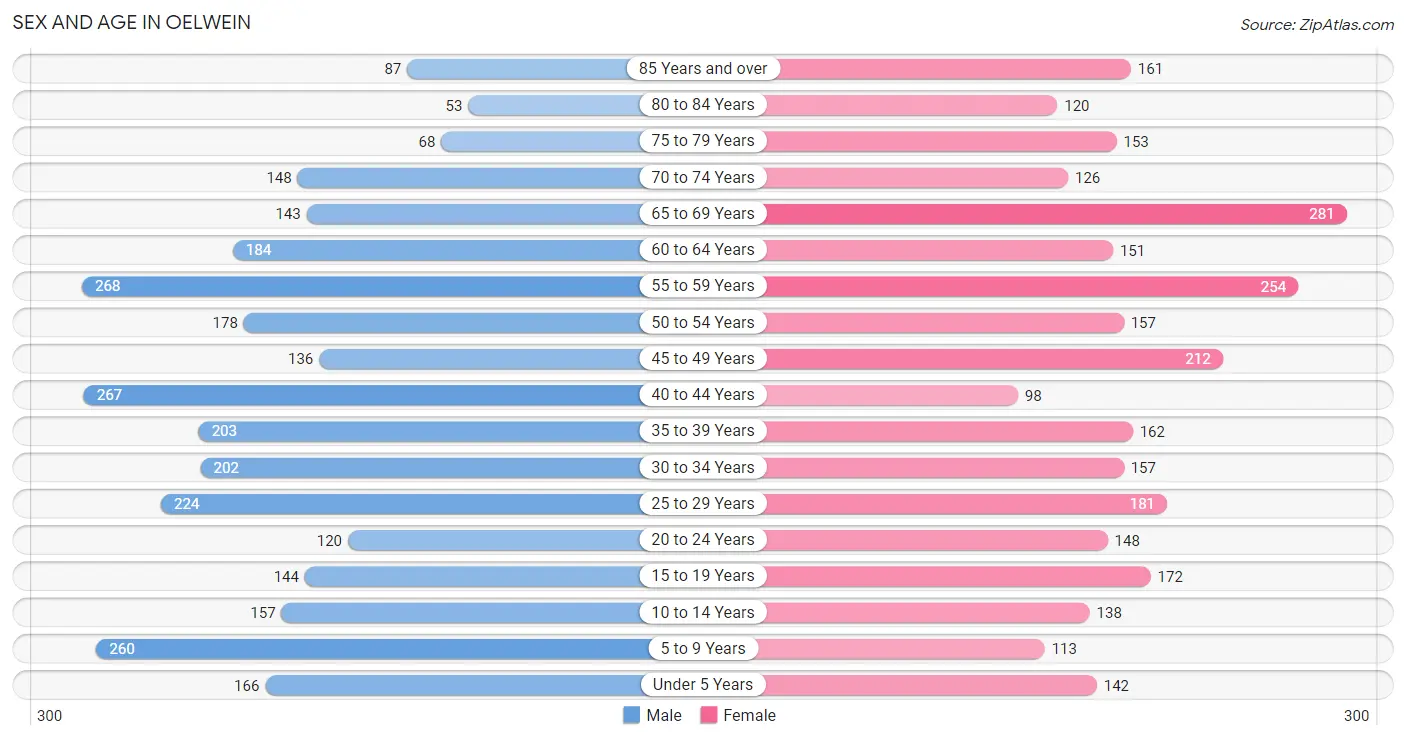
| Age Bracket | Male | Female |
| Under 5 Years | 166 (5.5%) | 142 (4.9%) |
| 5 to 9 Years | 260 (8.6%) | 113 (3.9%) |
| 10 to 14 Years | 157 (5.2%) | 138 (4.7%) |
| 15 to 19 Years | 144 (4.8%) | 172 (5.9%) |
| 20 to 24 Years | 120 (4.0%) | 148 (5.1%) |
| 25 to 29 Years | 224 (7.4%) | 181 (6.2%) |
| 30 to 34 Years | 202 (6.7%) | 157 (5.4%) |
| 35 to 39 Years | 203 (6.8%) | 162 (5.5%) |
| 40 to 44 Years | 267 (8.9%) | 98 (3.4%) |
| 45 to 49 Years | 136 (4.5%) | 212 (7.2%) |
| 50 to 54 Years | 178 (5.9%) | 157 (5.4%) |
| 55 to 59 Years | 268 (8.9%) | 254 (8.7%) |
| 60 to 64 Years | 184 (6.1%) | 151 (5.2%) |
| 65 to 69 Years | 143 (4.8%) | 281 (9.6%) |
| 70 to 74 Years | 148 (4.9%) | 126 (4.3%) |
| 75 to 79 Years | 68 (2.3%) | 153 (5.2%) |
| 80 to 84 Years | 53 (1.8%) | 120 (4.1%) |
| 85 Years and over | 87 (2.9%) | 161 (5.5%) |
| Total | 3,008 (100.0%) | 2,926 (100.0%) |
Families and Households in Oelwein
Median Family Size in Oelwein
The median family size in Oelwein is 2.88 persons per family, with single male/father families (105 | 7.5%) accounting for the largest median family size of 3.02 persons per family. On the other hand, single female/mother families (315 | 22.4%) represent the smallest median family size with 2.71 persons per family.
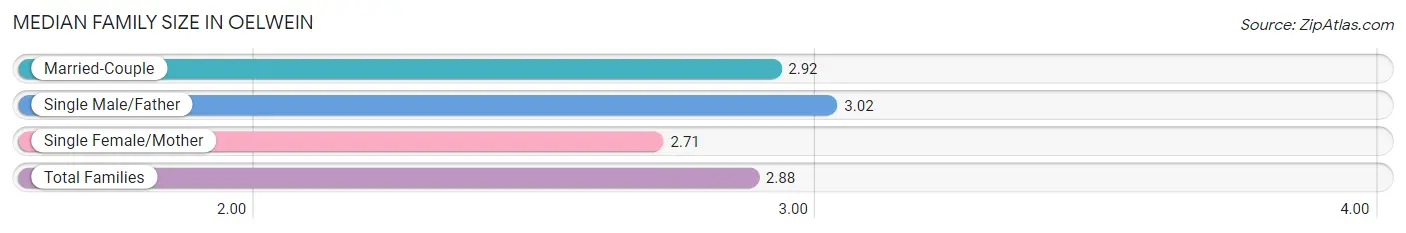
| Family Type | # Families | Family Size |
| Married-Couple | 987 (70.2%) | 2.92 |
| Single Male/Father | 105 (7.5%) | 3.02 |
| Single Female/Mother | 315 (22.4%) | 2.71 |
| Total Families | 1,407 (100.0%) | 2.88 |
Median Household Size in Oelwein
The median household size in Oelwein is 2.20 persons per household, with single male/father households (105 | 4.0%) accounting for the largest median household size of 3.31 persons per household. non-family households (1,221 | 46.5%) represent the smallest median household size with 1.21 persons per household.
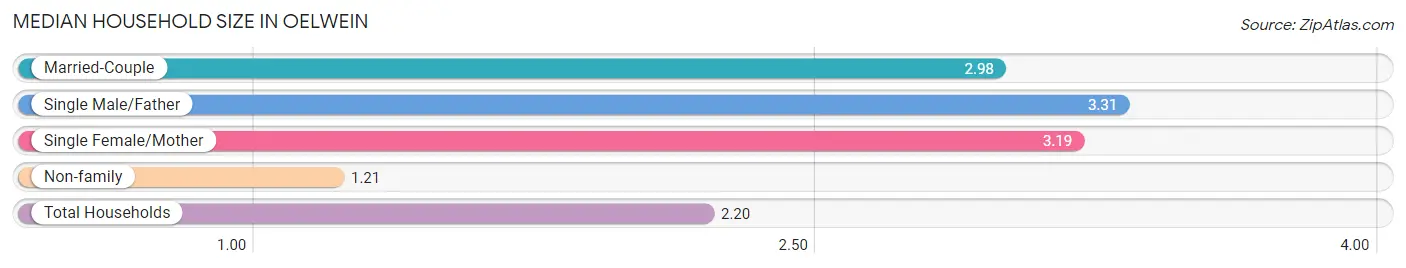
| Household Type | # Households | Household Size |
| Married-Couple | 987 (37.6%) | 2.98 |
| Single Male/Father | 105 (4.0%) | 3.31 |
| Single Female/Mother | 315 (12.0%) | 3.19 |
| Non-family | 1,221 (46.5%) | 1.21 |
| Total Households | 2,628 (100.0%) | 2.20 |
Household Size by Marriage Status in Oelwein
Out of a total of 2,628 households in Oelwein, 1,407 (53.5%) are family households, while 1,221 (46.5%) are nonfamily households. The most numerous type of family households are 2-person households, comprising 632, and the most common type of nonfamily households are 1-person households, comprising 1,090.
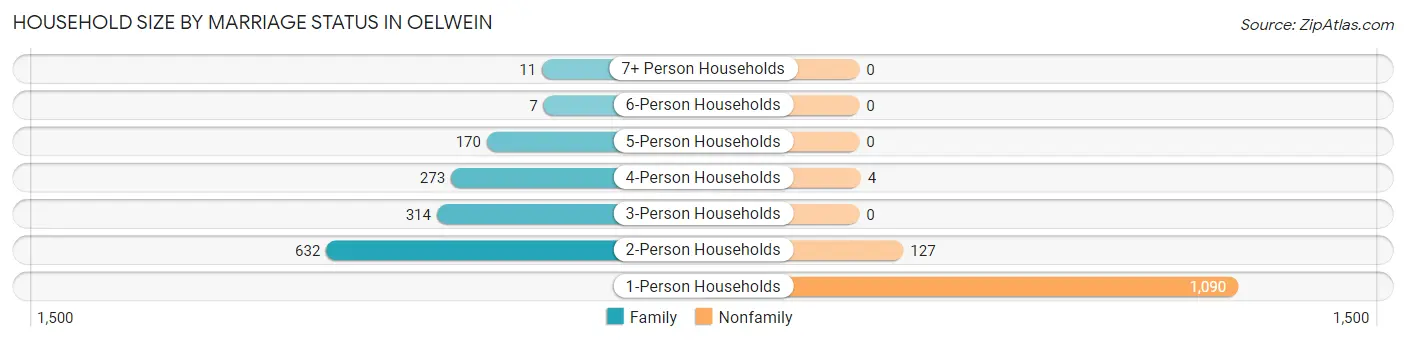
| Household Size | Family Households | Nonfamily Households |
| 1-Person Households | - | 1,090 (41.5%) |
| 2-Person Households | 632 (24.0%) | 127 (4.8%) |
| 3-Person Households | 314 (11.9%) | 0 (0.0%) |
| 4-Person Households | 273 (10.4%) | 4 (0.2%) |
| 5-Person Households | 170 (6.5%) | 0 (0.0%) |
| 6-Person Households | 7 (0.3%) | 0 (0.0%) |
| 7+ Person Households | 11 (0.4%) | 0 (0.0%) |
| Total | 1,407 (53.5%) | 1,221 (46.5%) |
Female Fertility in Oelwein
Fertility by Age in Oelwein
Average fertility rate in Oelwein is 97.0 births per 1,000 women. Women in the age bracket of 20 to 34 years have the highest fertility rate with 235.0 births per 1,000 women. Women in the age bracket of 20 to 34 years acount for 100.0% of all women with births.
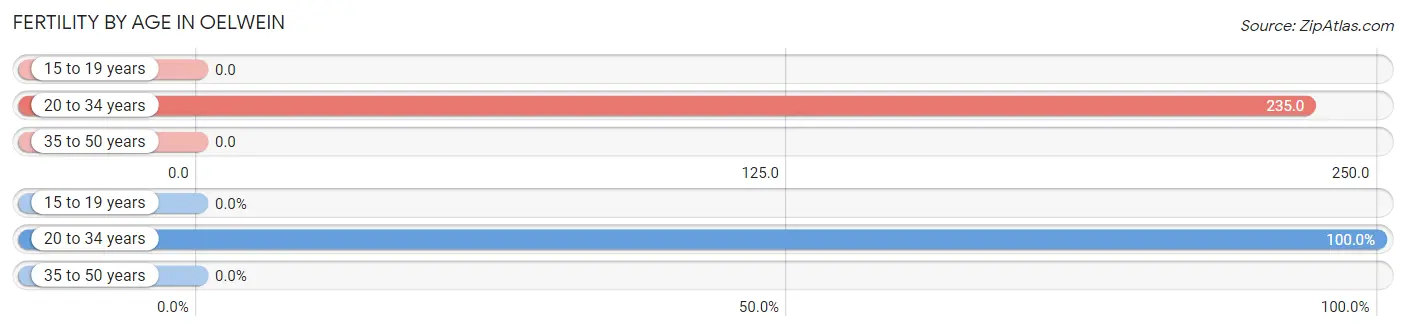
| Age Bracket | Women with Births | Births / 1,000 Women |
| 15 to 19 years | 0 (0.0%) | 0.0 |
| 20 to 34 years | 114 (100.0%) | 235.0 |
| 35 to 50 years | 0 (0.0%) | 0.0 |
| Total | 114 (100.0%) | 97.0 |
Fertility by Age by Marriage Status in Oelwein
57.0% of women with births (114) in Oelwein are married. The highest percentage of unmarried women with births falls into 20 to 34 years age bracket with 43.0% of them unmarried at the time of birth, while the lowest percentage of unmarried women with births belong to 20 to 34 years age bracket with 43.0% of them unmarried.
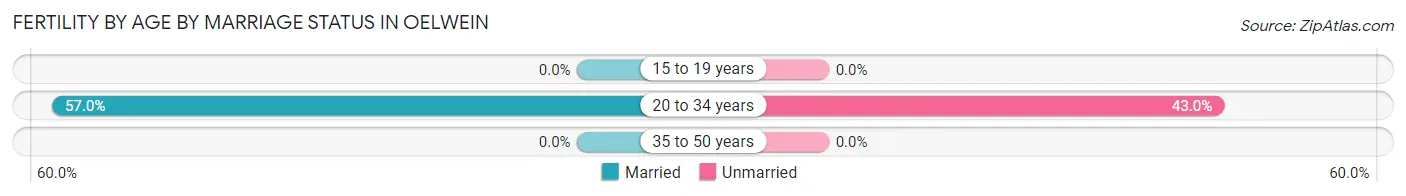
| Age Bracket | Married | Unmarried |
| 15 to 19 years | 0 (0.0%) | 0 (0.0%) |
| 20 to 34 years | 65 (57.0%) | 49 (43.0%) |
| 35 to 50 years | 0 (0.0%) | 0 (0.0%) |
| Total | 65 (57.0%) | 49 (43.0%) |
Fertility by Education in Oelwein
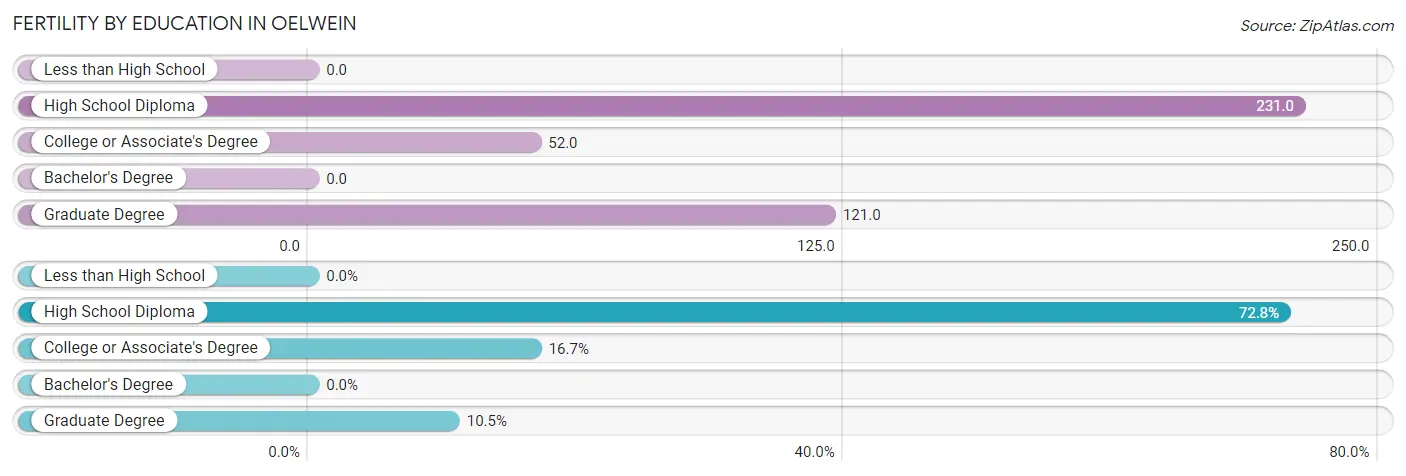
| Educational Attainment | Women with Births | Births / 1,000 Women |
| Less than High School | 0 (0.0%) | 0.0 |
| High School Diploma | 83 (72.8%) | 231.0 |
| College or Associate's Degree | 19 (16.7%) | 52.0 |
| Bachelor's Degree | 0 (0.0%) | 0.0 |
| Graduate Degree | 12 (10.5%) | 121.0 |
| Total | 114 (100.0%) | 97.0 |
Fertility by Education by Marriage Status in Oelwein
43.0% of women with births in Oelwein are unmarried. Women with the educational attainment of graduate degree are most likely to be married with 100.0% of them married at childbirth, while women with the educational attainment of college or associate's degree are least likely to be married with 73.7% of them unmarried at childbirth.
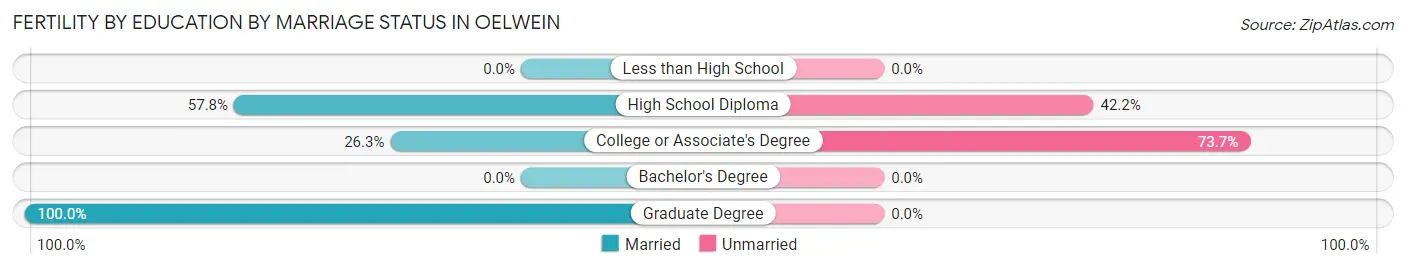
| Educational Attainment | Married | Unmarried |
| Less than High School | 0 (0.0%) | 0 (0.0%) |
| High School Diploma | 48 (57.8%) | 35 (42.2%) |
| College or Associate's Degree | 5 (26.3%) | 14 (73.7%) |
| Bachelor's Degree | 0 (0.0%) | 0 (0.0%) |
| Graduate Degree | 12 (100.0%) | 0 (0.0%) |
| Total | 65 (57.0%) | 49 (43.0%) |
Employment Characteristics in Oelwein
Employment by Class of Employer in Oelwein
Among the 2,311 employed individuals in Oelwein, private company employees (1,692 | 73.2%), local government employees (193 | 8.4%), and not-for-profit organizations (190 | 8.2%) make up the most common classes of employment.
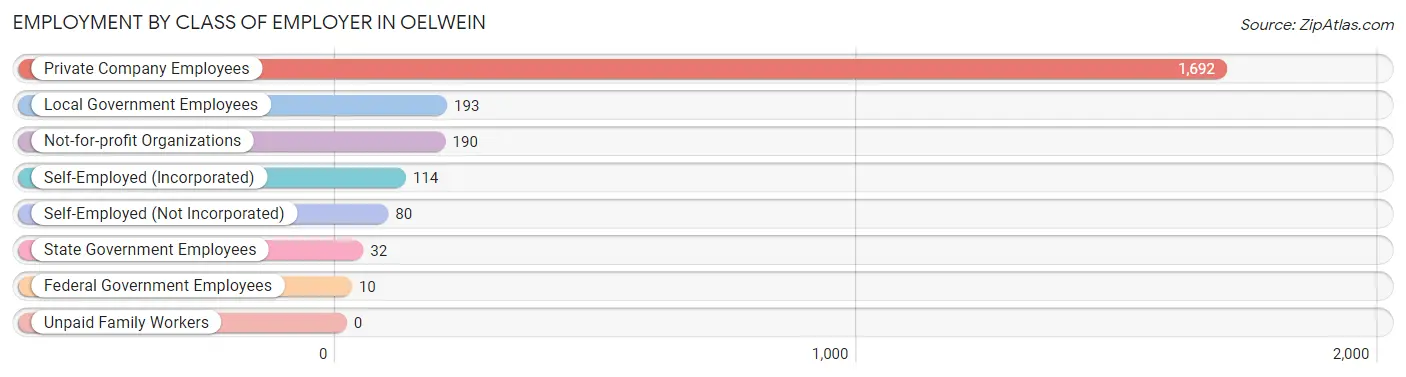
| Employer Class | # Employees | % Employees |
| Private Company Employees | 1,692 | 73.2% |
| Self-Employed (Incorporated) | 114 | 4.9% |
| Self-Employed (Not Incorporated) | 80 | 3.5% |
| Not-for-profit Organizations | 190 | 8.2% |
| Local Government Employees | 193 | 8.4% |
| State Government Employees | 32 | 1.4% |
| Federal Government Employees | 10 | 0.4% |
| Unpaid Family Workers | 0 | 0.0% |
| Total | 2,311 | 100.0% |
Employment Status by Age in Oelwein
According to the labor force statistics for Oelwein, out of the total population over 16 years of age (4,859), 51.6% or 2,507 individuals are in the labor force, with 6.7% or 168 of them unemployed. The age group with the highest labor force participation rate is 20 to 24 years, with 88.1% or 236 individuals in the labor force. Within the labor force, the 20 to 24 years age range has the highest percentage of unemployed individuals, with 36.0% or 85 of them being unemployed.
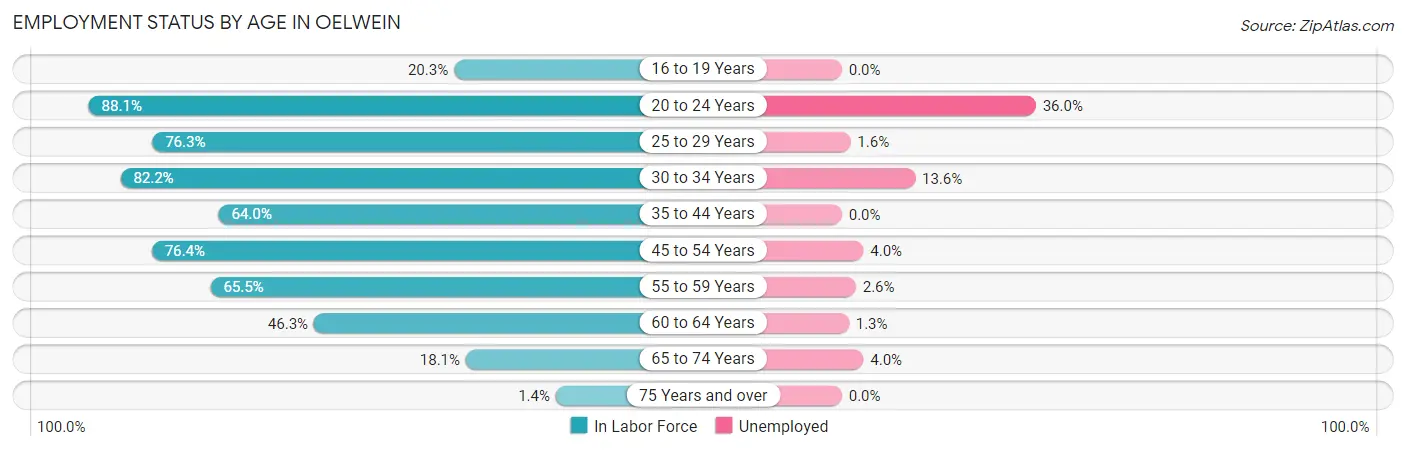
| Age Bracket | In Labor Force | Unemployed |
| 16 to 19 Years | 44 (20.3%) | 0 (0.0%) |
| 20 to 24 Years | 236 (88.1%) | 85 (36.0%) |
| 25 to 29 Years | 309 (76.3%) | 5 (1.6%) |
| 30 to 34 Years | 295 (82.2%) | 40 (13.6%) |
| 35 to 44 Years | 467 (64.0%) | 0 (0.0%) |
| 45 to 54 Years | 522 (76.4%) | 21 (4.0%) |
| 55 to 59 Years | 342 (65.5%) | 9 (2.6%) |
| 60 to 64 Years | 155 (46.3%) | 2 (1.3%) |
| 65 to 74 Years | 126 (18.1%) | 5 (4.0%) |
| 75 Years and over | 9 (1.4%) | 0 (0.0%) |
| Total | 2,507 (51.6%) | 168 (6.7%) |
Employment Status by Educational Attainment in Oelwein
According to labor force statistics for Oelwein, 68.9% of individuals (2,090) out of the total population between 25 and 64 years of age (3,034) are in the labor force, with 3.7% or 77 of them being unemployed. The group with the highest labor force participation rate are those with the educational attainment of college / associate degree, with 79.4% or 820 individuals in the labor force. Within the labor force, individuals with high school diploma education have the highest percentage of unemployment, with 4.7% or 40 of them being unemployed.
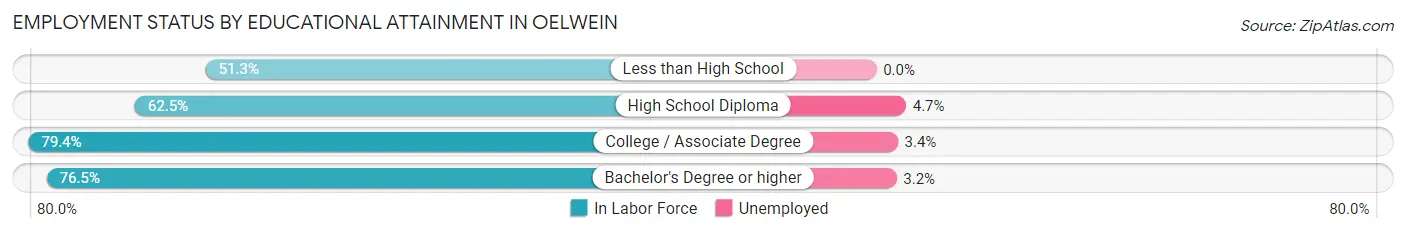
| Educational Attainment | In Labor Force | Unemployed |
| Less than High School | 143 (51.3%) | 0 (0.0%) |
| High School Diploma | 850 (62.5%) | 64 (4.7%) |
| College / Associate Degree | 820 (79.4%) | 35 (3.4%) |
| Bachelor's Degree or higher | 277 (76.5%) | 12 (3.2%) |
| Total | 2,090 (68.9%) | 112 (3.7%) |
Employment Occupations by Sex in Oelwein
Management, Business, Science and Arts Occupations
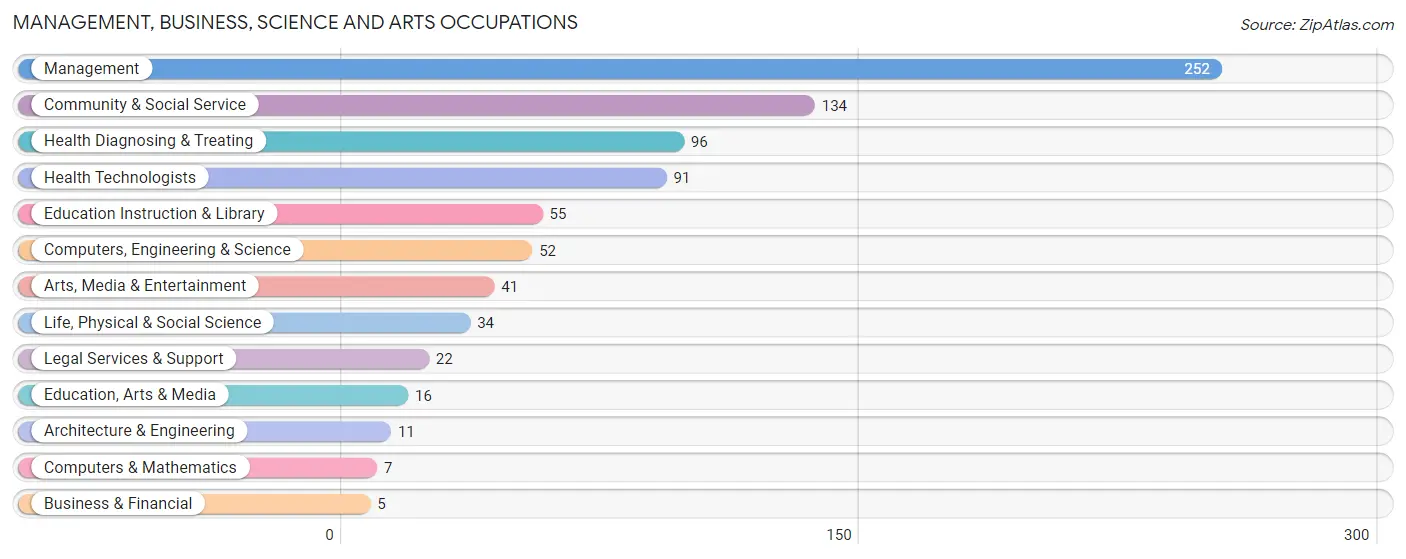
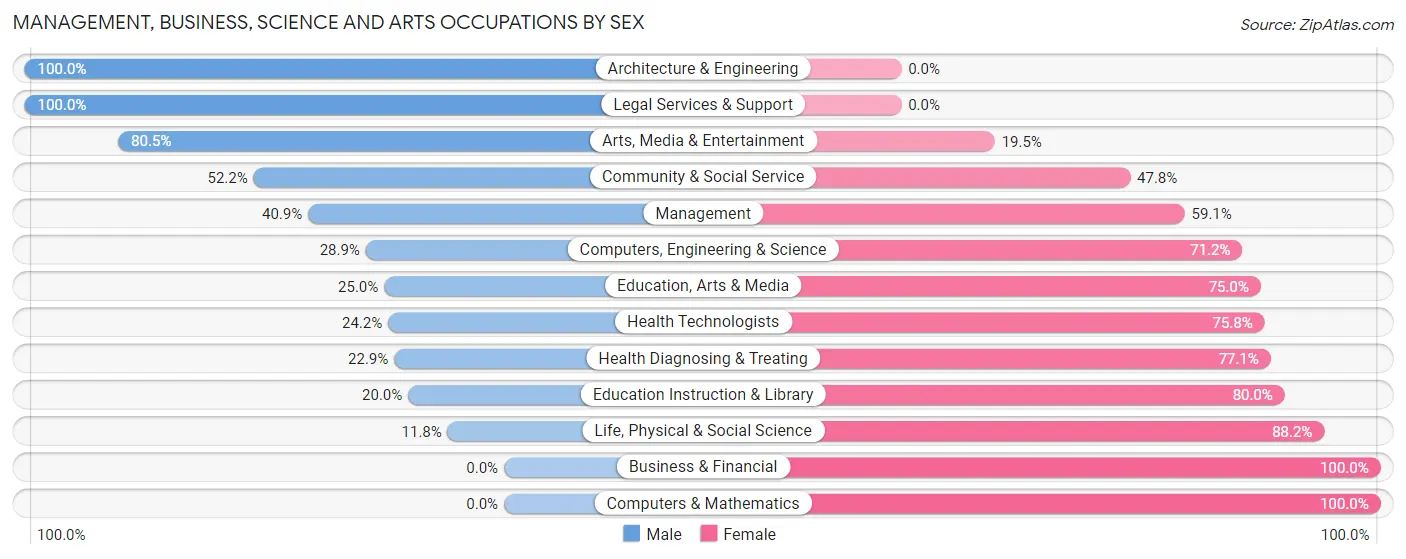
The most common Management, Business, Science and Arts occupations in Oelwein are Management (252 | 10.8%), Community & Social Service (134 | 5.7%), Health Diagnosing & Treating (96 | 4.1%), Health Technologists (91 | 3.9%), and Education Instruction & Library (55 | 2.4%).
Management, Business, Science and Arts Occupations by Sex
Within the Management, Business, Science and Arts occupations in Oelwein, the most male-oriented occupations are Architecture & Engineering (100.0%), Legal Services & Support (100.0%), and Arts, Media & Entertainment (80.5%), while the most female-oriented occupations are Business & Financial (100.0%), Computers & Mathematics (100.0%), and Life, Physical & Social Science (88.2%).
| Occupation | Male | Female |
| Management | 103 (40.9%) | 149 (59.1%) |
| Business & Financial | 0 (0.0%) | 5 (100.0%) |
| Computers, Engineering & Science | 15 (28.8%) | 37 (71.2%) |
| Computers & Mathematics | 0 (0.0%) | 7 (100.0%) |
| Architecture & Engineering | 11 (100.0%) | 0 (0.0%) |
| Life, Physical & Social Science | 4 (11.8%) | 30 (88.2%) |
| Community & Social Service | 70 (52.2%) | 64 (47.8%) |
| Education, Arts & Media | 4 (25.0%) | 12 (75.0%) |
| Legal Services & Support | 22 (100.0%) | 0 (0.0%) |
| Education Instruction & Library | 11 (20.0%) | 44 (80.0%) |
| Arts, Media & Entertainment | 33 (80.5%) | 8 (19.5%) |
| Health Diagnosing & Treating | 22 (22.9%) | 74 (77.1%) |
| Health Technologists | 22 (24.2%) | 69 (75.8%) |
| Total (Category) | 210 (39.0%) | 329 (61.0%) |
| Total (Overall) | 1,326 (56.7%) | 1,012 (43.3%) |
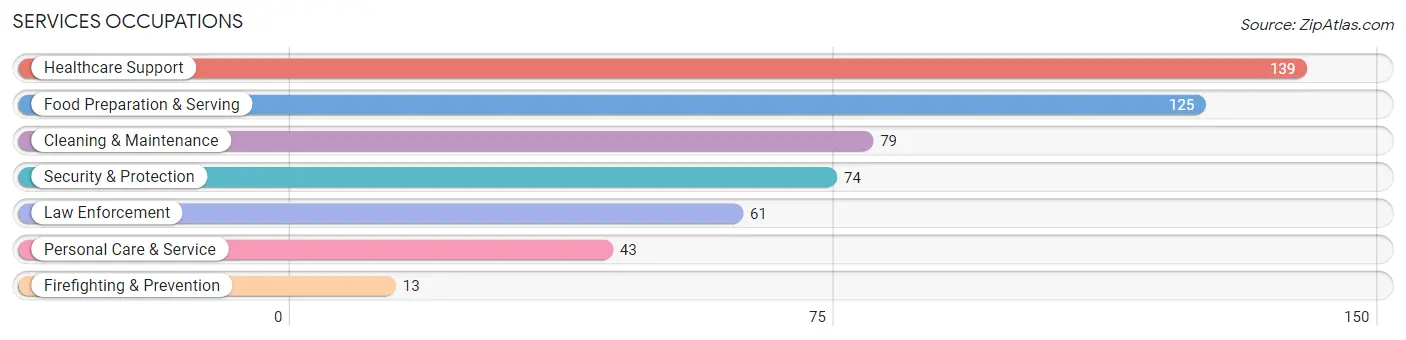
Services Occupations
The most common Services occupations in Oelwein are Healthcare Support (139 | 5.9%), Food Preparation & Serving (125 | 5.3%), Cleaning & Maintenance (79 | 3.4%), Security & Protection (74 | 3.2%), and Law Enforcement (61 | 2.6%).
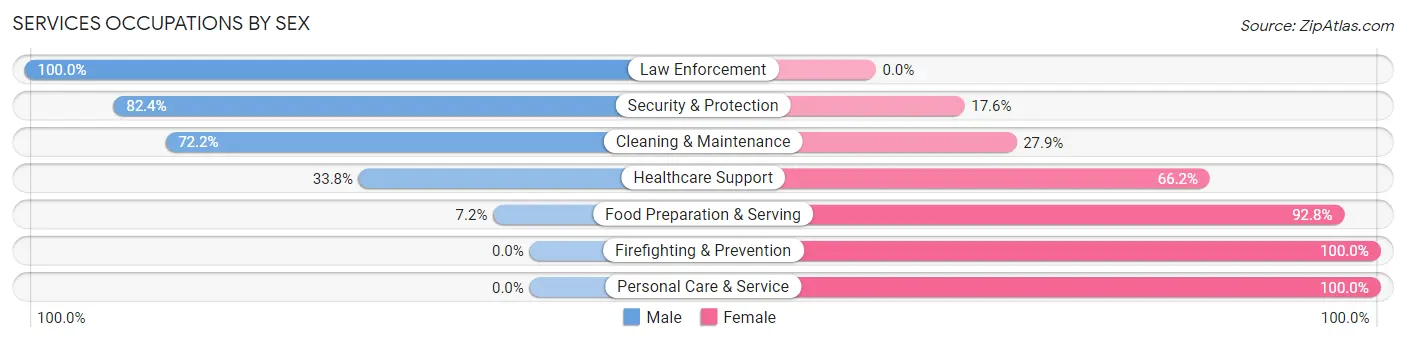
Services Occupations by Sex
Within the Services occupations in Oelwein, the most male-oriented occupations are Law Enforcement (100.0%), Security & Protection (82.4%), and Cleaning & Maintenance (72.2%), while the most female-oriented occupations are Firefighting & Prevention (100.0%), Personal Care & Service (100.0%), and Food Preparation & Serving (92.8%).
| Occupation | Male | Female |
| Healthcare Support | 47 (33.8%) | 92 (66.2%) |
| Security & Protection | 61 (82.4%) | 13 (17.6%) |
| Firefighting & Prevention | 0 (0.0%) | 13 (100.0%) |
| Law Enforcement | 61 (100.0%) | 0 (0.0%) |
| Food Preparation & Serving | 9 (7.2%) | 116 (92.8%) |
| Cleaning & Maintenance | 57 (72.2%) | 22 (27.9%) |
| Personal Care & Service | 0 (0.0%) | 43 (100.0%) |
| Total (Category) | 174 (37.8%) | 286 (62.2%) |
| Total (Overall) | 1,326 (56.7%) | 1,012 (43.3%) |
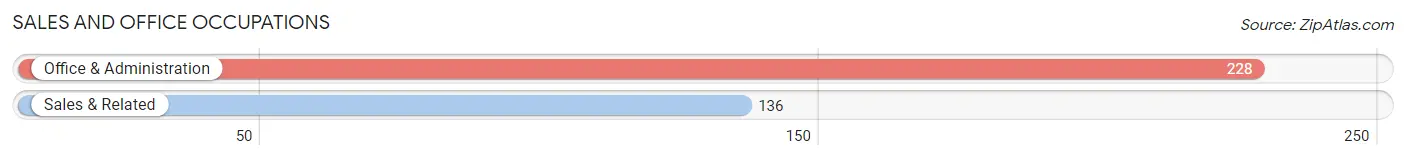
Sales and Office Occupations
The most common Sales and Office occupations in Oelwein are Office & Administration (228 | 9.8%), and Sales & Related (136 | 5.8%).
Sales and Office Occupations by Sex
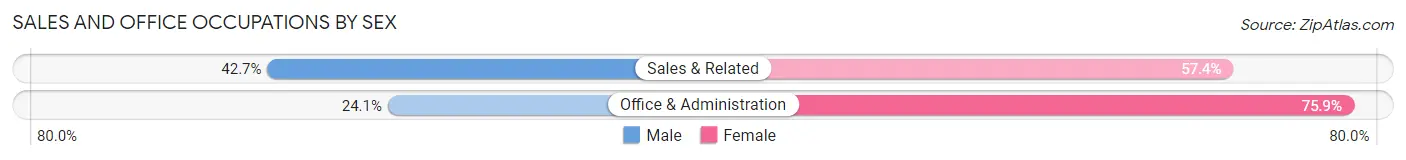
| Occupation | Male | Female |
| Sales & Related | 58 (42.6%) | 78 (57.4%) |
| Office & Administration | 55 (24.1%) | 173 (75.9%) |
| Total (Category) | 113 (31.0%) | 251 (69.0%) |
| Total (Overall) | 1,326 (56.7%) | 1,012 (43.3%) |
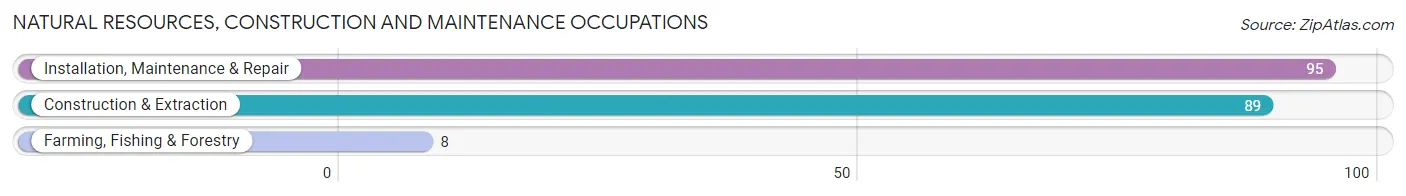
Natural Resources, Construction and Maintenance Occupations
The most common Natural Resources, Construction and Maintenance occupations in Oelwein are Installation, Maintenance & Repair (95 | 4.1%), Construction & Extraction (89 | 3.8%), and Farming, Fishing & Forestry (8 | 0.3%).
Natural Resources, Construction and Maintenance Occupations by Sex
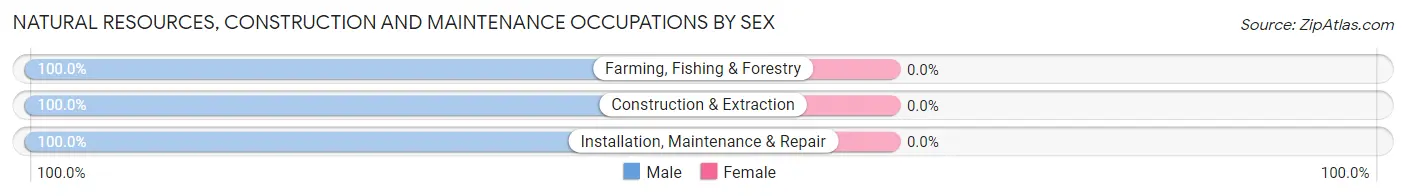
| Occupation | Male | Female |
| Farming, Fishing & Forestry | 8 (100.0%) | 0 (0.0%) |
| Construction & Extraction | 89 (100.0%) | 0 (0.0%) |
| Installation, Maintenance & Repair | 95 (100.0%) | 0 (0.0%) |
| Total (Category) | 192 (100.0%) | 0 (0.0%) |
| Total (Overall) | 1,326 (56.7%) | 1,012 (43.3%) |
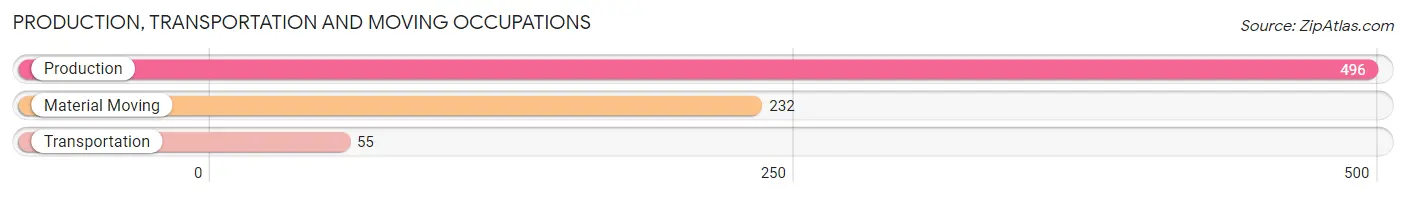
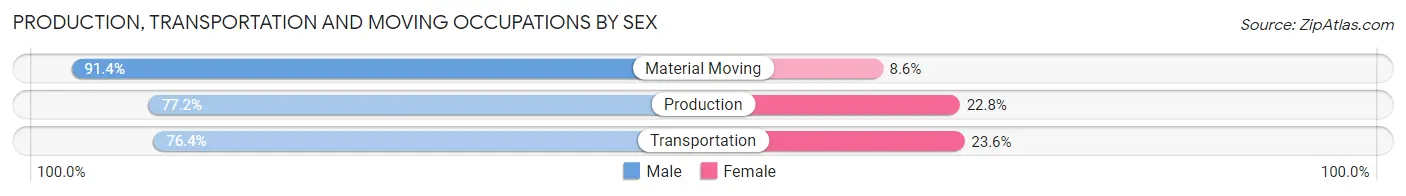
Production, Transportation and Moving Occupations
The most common Production, Transportation and Moving occupations in Oelwein are Production (496 | 21.2%), Material Moving (232 | 9.9%), and Transportation (55 | 2.4%).
Production, Transportation and Moving Occupations by Sex
| Occupation | Male | Female |
| Production | 383 (77.2%) | 113 (22.8%) |
| Transportation | 42 (76.4%) | 13 (23.6%) |
| Material Moving | 212 (91.4%) | 20 (8.6%) |
| Total (Category) | 637 (81.4%) | 146 (18.6%) |
| Total (Overall) | 1,326 (56.7%) | 1,012 (43.3%) |
Employment Industries by Sex in Oelwein
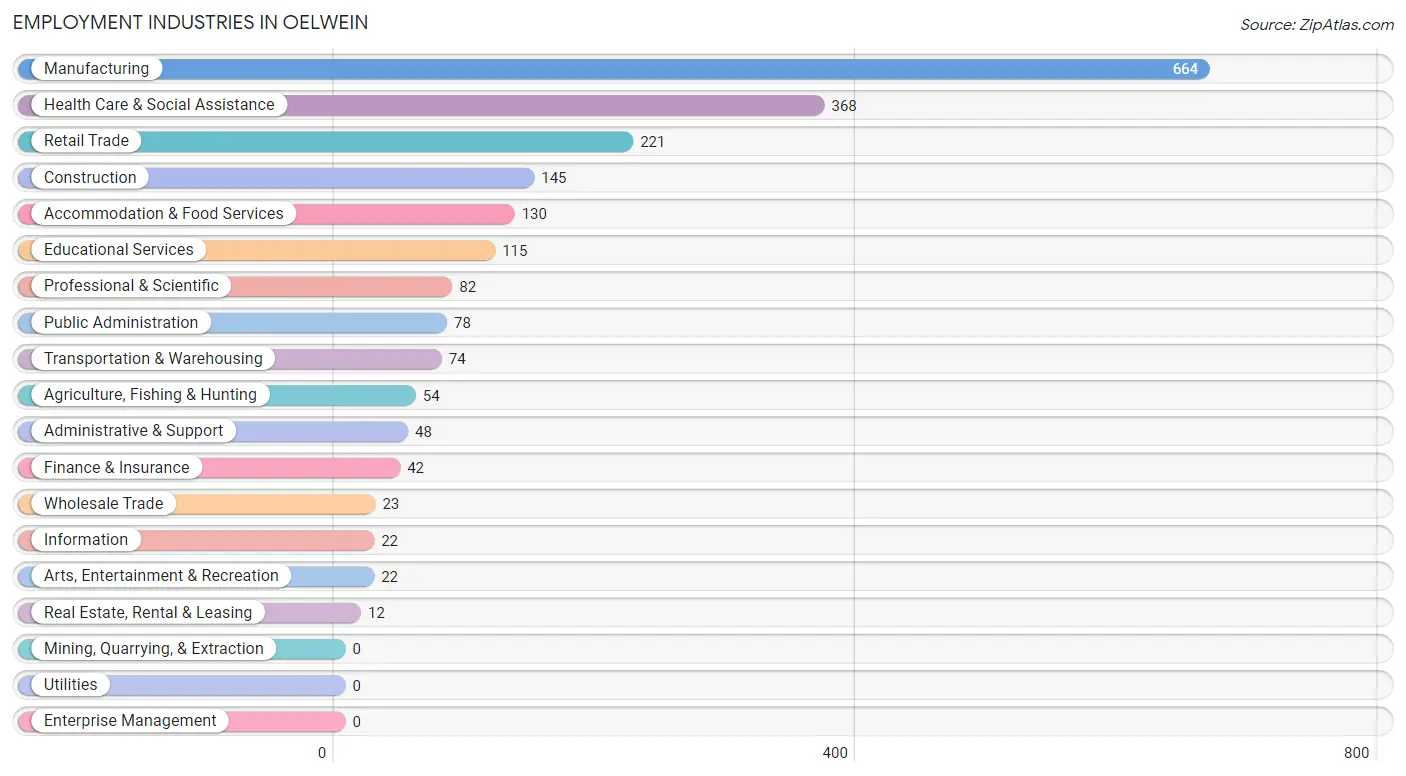
Employment Industries in Oelwein
The major employment industries in Oelwein include Manufacturing (664 | 28.4%), Health Care & Social Assistance (368 | 15.7%), Retail Trade (221 | 9.5%), Construction (145 | 6.2%), and Accommodation & Food Services (130 | 5.6%).
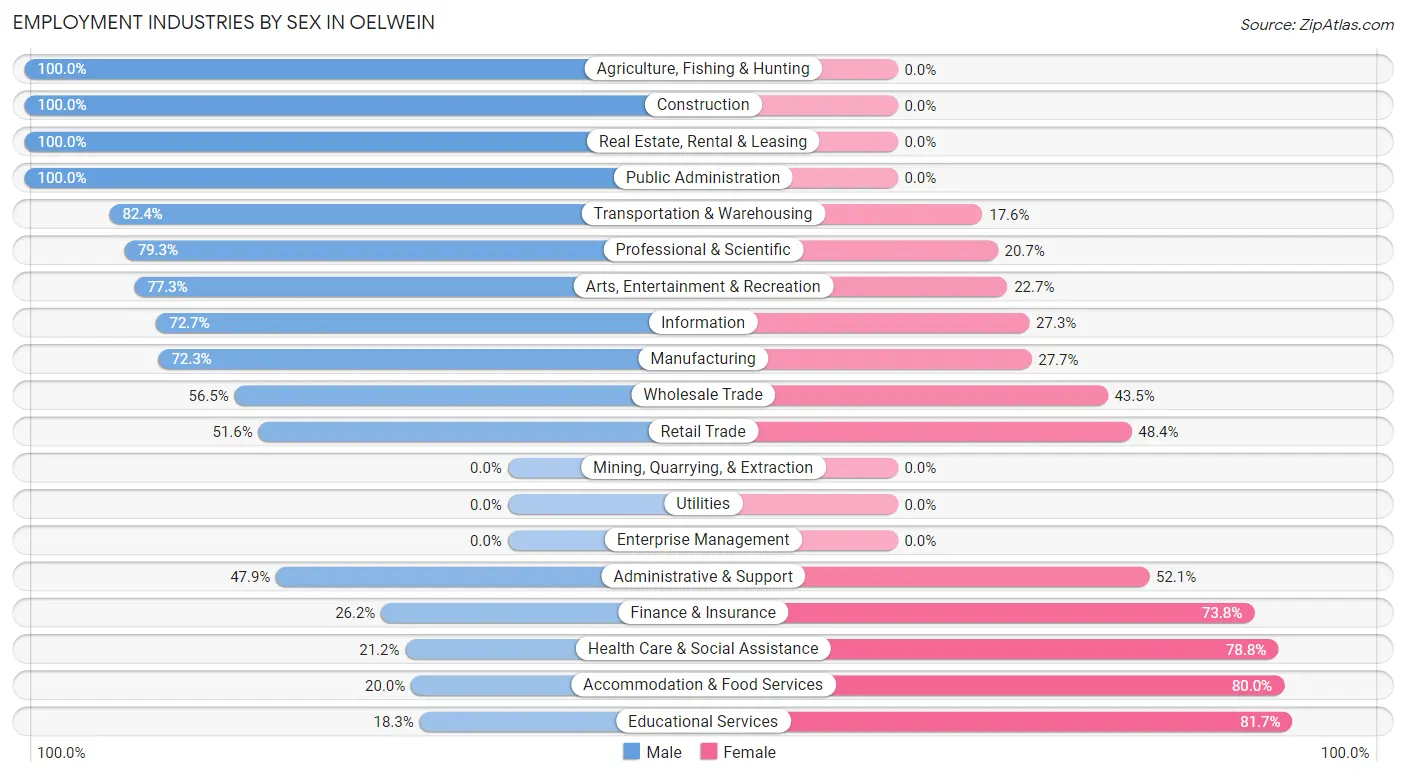
Employment Industries by Sex in Oelwein
The Oelwein industries that see more men than women are Agriculture, Fishing & Hunting (100.0%), Construction (100.0%), and Real Estate, Rental & Leasing (100.0%), whereas the industries that tend to have a higher number of women are Educational Services (81.7%), Accommodation & Food Services (80.0%), and Health Care & Social Assistance (78.8%).
| Industry | Male | Female |
| Agriculture, Fishing & Hunting | 54 (100.0%) | 0 (0.0%) |
| Mining, Quarrying, & Extraction | 0 (0.0%) | 0 (0.0%) |
| Construction | 145 (100.0%) | 0 (0.0%) |
| Manufacturing | 480 (72.3%) | 184 (27.7%) |
| Wholesale Trade | 13 (56.5%) | 10 (43.5%) |
| Retail Trade | 114 (51.6%) | 107 (48.4%) |
| Transportation & Warehousing | 61 (82.4%) | 13 (17.6%) |
| Utilities | 0 (0.0%) | 0 (0.0%) |
| Information | 16 (72.7%) | 6 (27.3%) |
| Finance & Insurance | 11 (26.2%) | 31 (73.8%) |
| Real Estate, Rental & Leasing | 12 (100.0%) | 0 (0.0%) |
| Professional & Scientific | 65 (79.3%) | 17 (20.7%) |
| Enterprise Management | 0 (0.0%) | 0 (0.0%) |
| Administrative & Support | 23 (47.9%) | 25 (52.1%) |
| Educational Services | 21 (18.3%) | 94 (81.7%) |
| Health Care & Social Assistance | 78 (21.2%) | 290 (78.8%) |
| Arts, Entertainment & Recreation | 17 (77.3%) | 5 (22.7%) |
| Accommodation & Food Services | 26 (20.0%) | 104 (80.0%) |
| Public Administration | 78 (100.0%) | 0 (0.0%) |
| Total | 1,326 (56.7%) | 1,012 (43.3%) |
Education in Oelwein
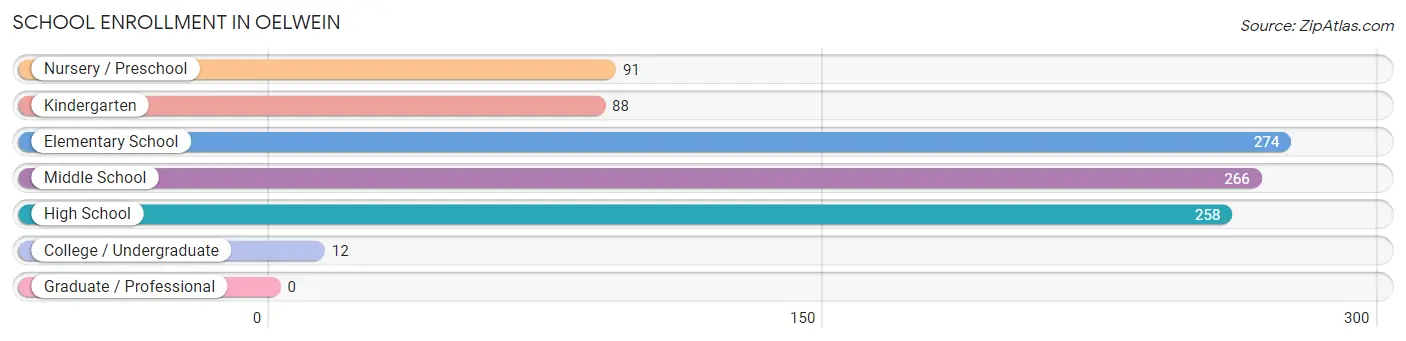
School Enrollment in Oelwein
The most common levels of schooling among the 989 students in Oelwein are elementary school (274 | 27.7%), middle school (266 | 26.9%), and high school (258 | 26.1%).
| School Level | # Students | % Students |
| Nursery / Preschool | 91 | 9.2% |
| Kindergarten | 88 | 8.9% |
| Elementary School | 274 | 27.7% |
| Middle School | 266 | 26.9% |
| High School | 258 | 26.1% |
| College / Undergraduate | 12 | 1.2% |
| Graduate / Professional | 0 | 0.0% |
| Total | 989 | 100.0% |
School Enrollment by Age by Funding Source in Oelwein
Out of a total of 989 students who are enrolled in schools in Oelwein, 133 (13.4%) attend a private institution, while the remaining 856 (86.6%) are enrolled in public schools. The age group of 20 to 24 year olds has the highest likelihood of being enrolled in private schools, with 12 (100.0% in the age bracket) enrolled. Conversely, the age group of 5 to 9 year old has the lowest likelihood of being enrolled in a private school, with 358 (100.0% in the age bracket) attending a public institution.
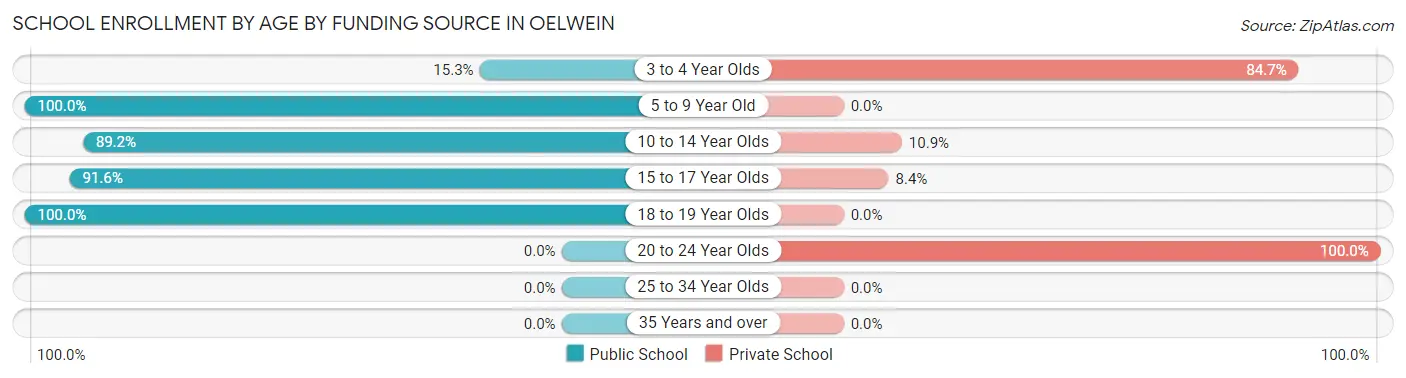
| Age Bracket | Public School | Private School |
| 3 to 4 Year Olds | 13 (15.3%) | 72 (84.7%) |
| 5 to 9 Year Old | 358 (100.0%) | 0 (0.0%) |
| 10 to 14 Year Olds | 263 (89.1%) | 32 (10.8%) |
| 15 to 17 Year Olds | 186 (91.6%) | 17 (8.4%) |
| 18 to 19 Year Olds | 36 (100.0%) | 0 (0.0%) |
| 20 to 24 Year Olds | 0 (0.0%) | 12 (100.0%) |
| 25 to 34 Year Olds | 0 (0.0%) | 0 (0.0%) |
| 35 Years and over | 0 (0.0%) | 0 (0.0%) |
| Total | 856 (86.6%) | 133 (13.4%) |
Educational Attainment by Field of Study in Oelwein
Education (241 | 38.9%), science & technology (62 | 10.0%), arts & humanities (61 | 9.9%), business (41 | 6.6%), and bio, nature & agricultural (40 | 6.5%) are the most common fields of study among 619 individuals in Oelwein who have obtained a bachelor's degree or higher.
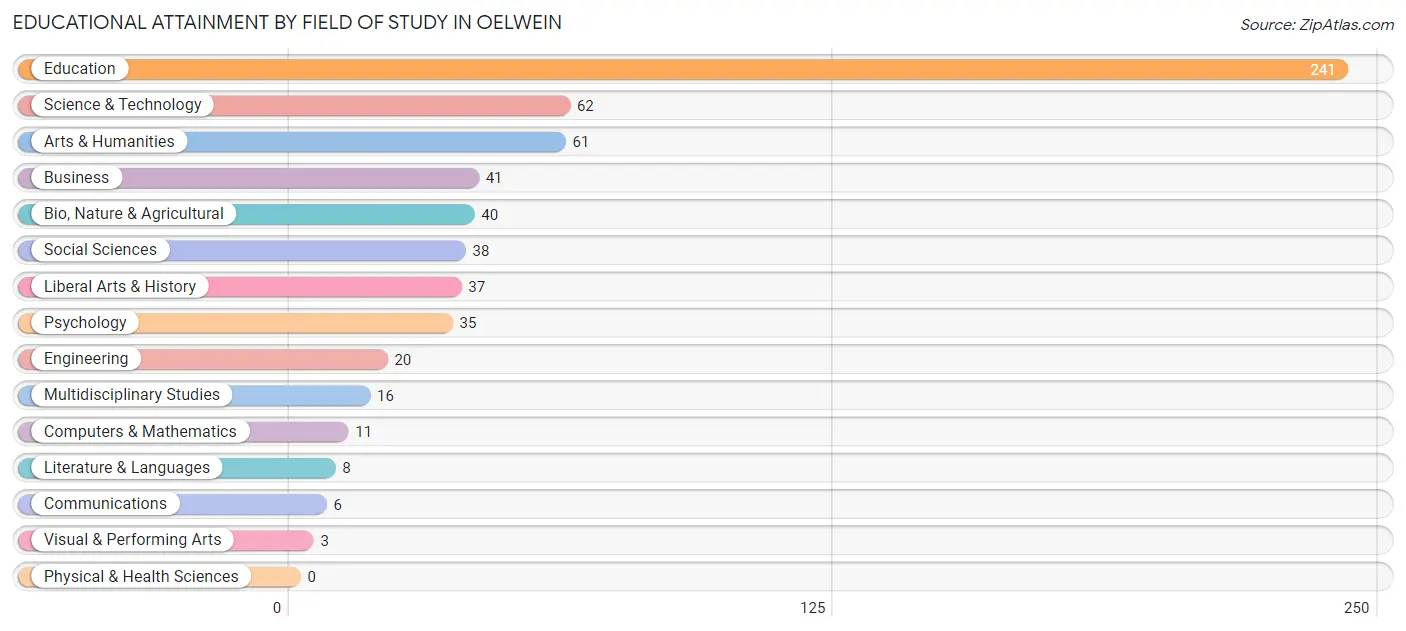
| Field of Study | # Graduates | % Graduates |
| Computers & Mathematics | 11 | 1.8% |
| Bio, Nature & Agricultural | 40 | 6.5% |
| Physical & Health Sciences | 0 | 0.0% |
| Psychology | 35 | 5.7% |
| Social Sciences | 38 | 6.1% |
| Engineering | 20 | 3.2% |
| Multidisciplinary Studies | 16 | 2.6% |
| Science & Technology | 62 | 10.0% |
| Business | 41 | 6.6% |
| Education | 241 | 38.9% |
| Literature & Languages | 8 | 1.3% |
| Liberal Arts & History | 37 | 6.0% |
| Visual & Performing Arts | 3 | 0.5% |
| Communications | 6 | 1.0% |
| Arts & Humanities | 61 | 9.9% |
| Total | 619 | 100.0% |
Transportation & Commute in Oelwein
Vehicle Availability by Sex in Oelwein
The most prevalent vehicle ownership categories in Oelwein are males with 2 vehicles (623, accounting for 47.6%) and females with 2 vehicles (425, making up 62.4%).
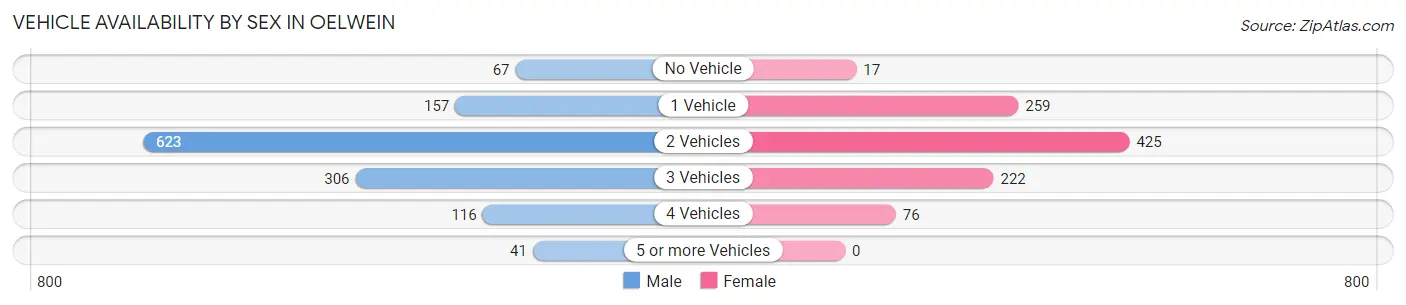
| Vehicles Available | Male | Female |
| No Vehicle | 67 (5.1%) | 17 (1.7%) |
| 1 Vehicle | 157 (12.0%) | 259 (25.9%) |
| 2 Vehicles | 623 (47.6%) | 425 (42.5%) |
| 3 Vehicles | 306 (23.4%) | 222 (22.2%) |
| 4 Vehicles | 116 (8.8%) | 76 (7.6%) |
| 5 or more Vehicles | 41 (3.1%) | 0 (0.0%) |
| Total | 1,310 (100.0%) | 999 (100.0%) |
Commute Time in Oelwein
The most frequently occuring commute durations in Oelwein are 5 to 9 minutes (625 commuters, 28.4%), less than 5 minutes (334 commuters, 15.2%), and 10 to 14 minutes (294 commuters, 13.4%).
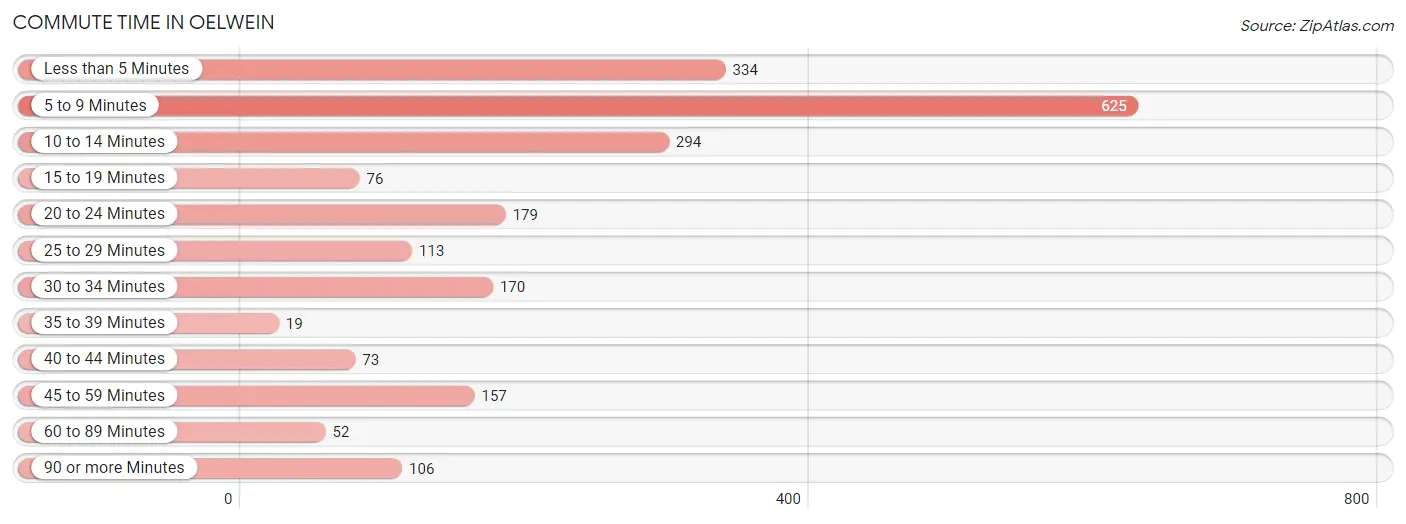
| Commute Time | # Commuters | % Commuters |
| Less than 5 Minutes | 334 | 15.2% |
| 5 to 9 Minutes | 625 | 28.4% |
| 10 to 14 Minutes | 294 | 13.4% |
| 15 to 19 Minutes | 76 | 3.5% |
| 20 to 24 Minutes | 179 | 8.1% |
| 25 to 29 Minutes | 113 | 5.1% |
| 30 to 34 Minutes | 170 | 7.7% |
| 35 to 39 Minutes | 19 | 0.9% |
| 40 to 44 Minutes | 73 | 3.3% |
| 45 to 59 Minutes | 157 | 7.1% |
| 60 to 89 Minutes | 52 | 2.4% |
| 90 or more Minutes | 106 | 4.8% |
Commute Time by Sex in Oelwein
The most common commute times in Oelwein are 5 to 9 minutes (260 commuters, 21.7%) for males and 5 to 9 minutes (365 commuters, 36.5%) for females.
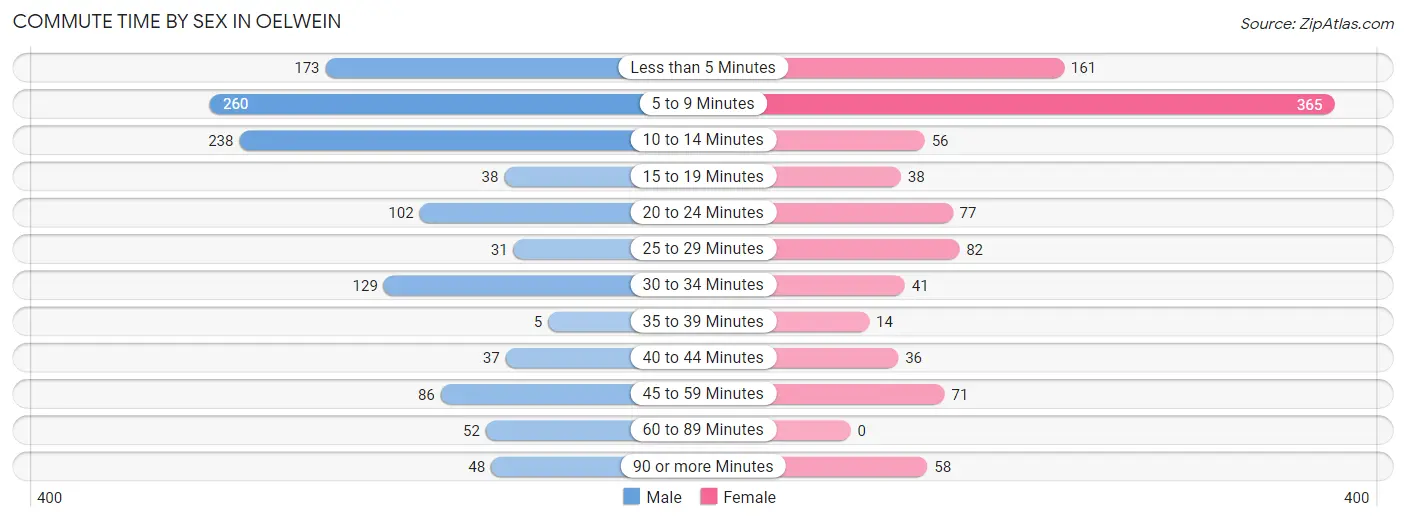
| Commute Time | Male | Female |
| Less than 5 Minutes | 173 (14.4%) | 161 (16.1%) |
| 5 to 9 Minutes | 260 (21.7%) | 365 (36.5%) |
| 10 to 14 Minutes | 238 (19.9%) | 56 (5.6%) |
| 15 to 19 Minutes | 38 (3.2%) | 38 (3.8%) |
| 20 to 24 Minutes | 102 (8.5%) | 77 (7.7%) |
| 25 to 29 Minutes | 31 (2.6%) | 82 (8.2%) |
| 30 to 34 Minutes | 129 (10.8%) | 41 (4.1%) |
| 35 to 39 Minutes | 5 (0.4%) | 14 (1.4%) |
| 40 to 44 Minutes | 37 (3.1%) | 36 (3.6%) |
| 45 to 59 Minutes | 86 (7.2%) | 71 (7.1%) |
| 60 to 89 Minutes | 52 (4.3%) | 0 (0.0%) |
| 90 or more Minutes | 48 (4.0%) | 58 (5.8%) |
Time of Departure to Work by Sex in Oelwein
The most frequent times of departure to work in Oelwein are 12:00 PM to 3:59 PM (165, 13.8%) for males and 5:30 AM to 5:59 AM (201, 20.1%) for females.
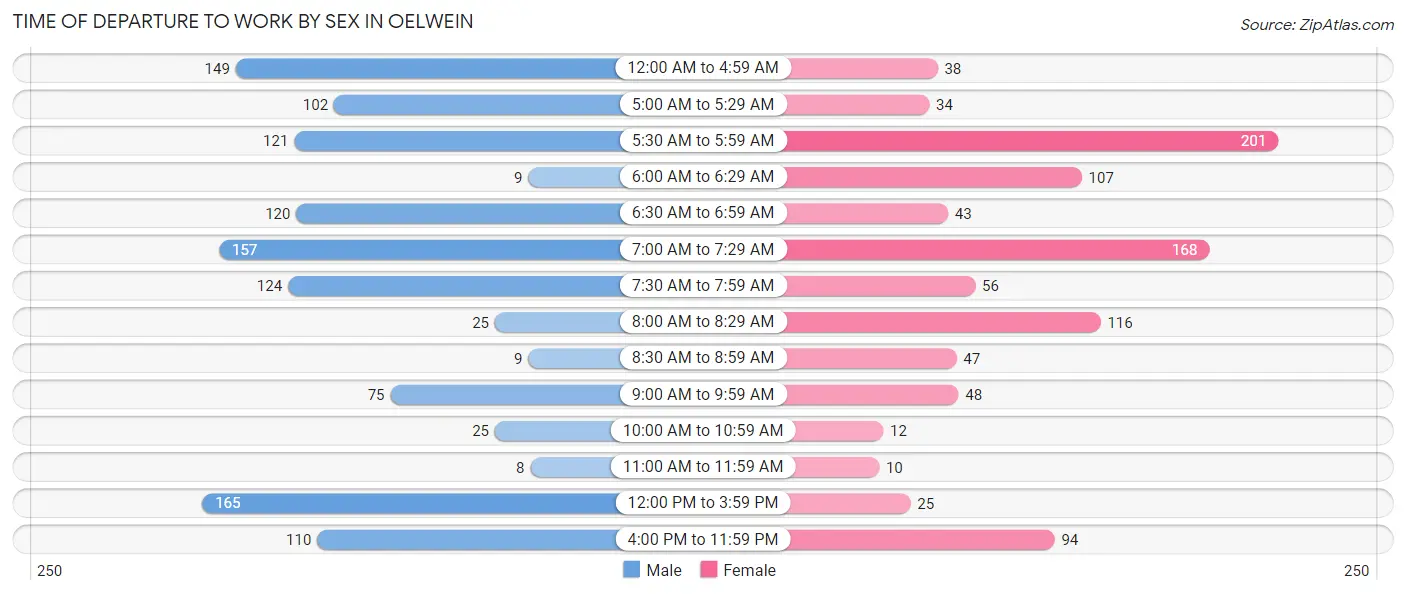
| Time of Departure | Male | Female |
| 12:00 AM to 4:59 AM | 149 (12.4%) | 38 (3.8%) |
| 5:00 AM to 5:29 AM | 102 (8.5%) | 34 (3.4%) |
| 5:30 AM to 5:59 AM | 121 (10.1%) | 201 (20.1%) |
| 6:00 AM to 6:29 AM | 9 (0.7%) | 107 (10.7%) |
| 6:30 AM to 6:59 AM | 120 (10.0%) | 43 (4.3%) |
| 7:00 AM to 7:29 AM | 157 (13.1%) | 168 (16.8%) |
| 7:30 AM to 7:59 AM | 124 (10.3%) | 56 (5.6%) |
| 8:00 AM to 8:29 AM | 25 (2.1%) | 116 (11.6%) |
| 8:30 AM to 8:59 AM | 9 (0.7%) | 47 (4.7%) |
| 9:00 AM to 9:59 AM | 75 (6.3%) | 48 (4.8%) |
| 10:00 AM to 10:59 AM | 25 (2.1%) | 12 (1.2%) |
| 11:00 AM to 11:59 AM | 8 (0.7%) | 10 (1.0%) |
| 12:00 PM to 3:59 PM | 165 (13.8%) | 25 (2.5%) |
| 4:00 PM to 11:59 PM | 110 (9.2%) | 94 (9.4%) |
| Total | 1,199 (100.0%) | 999 (100.0%) |
Housing Occupancy in Oelwein
Occupancy by Ownership in Oelwein
Of the total 2,628 dwellings in Oelwein, owner-occupied units account for 1,925 (73.3%), while renter-occupied units make up 703 (26.8%).
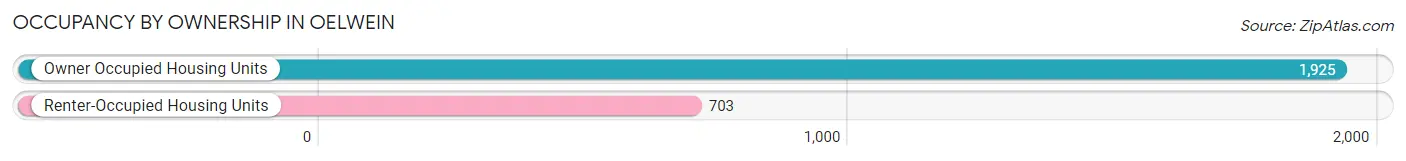
| Occupancy | # Housing Units | % Housing Units |
| Owner Occupied Housing Units | 1,925 | 73.3% |
| Renter-Occupied Housing Units | 703 | 26.8% |
| Total Occupied Housing Units | 2,628 | 100.0% |
Occupancy by Household Size in Oelwein
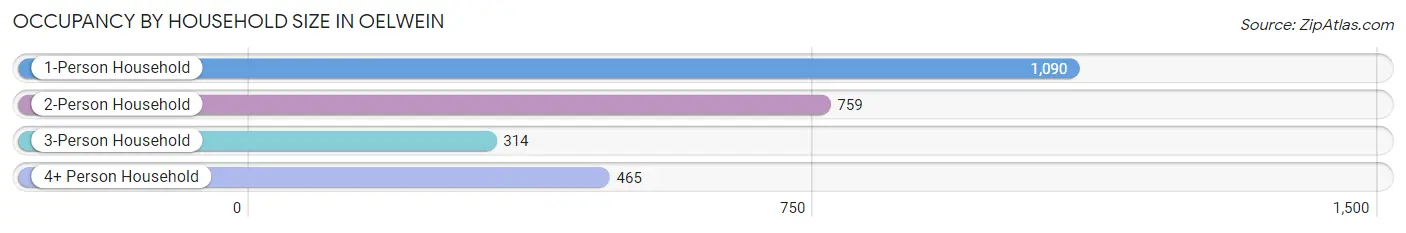
| Household Size | # Housing Units | % Housing Units |
| 1-Person Household | 1,090 | 41.5% |
| 2-Person Household | 759 | 28.9% |
| 3-Person Household | 314 | 11.9% |
| 4+ Person Household | 465 | 17.7% |
| Total Housing Units | 2,628 | 100.0% |
Occupancy by Ownership by Household Size in Oelwein
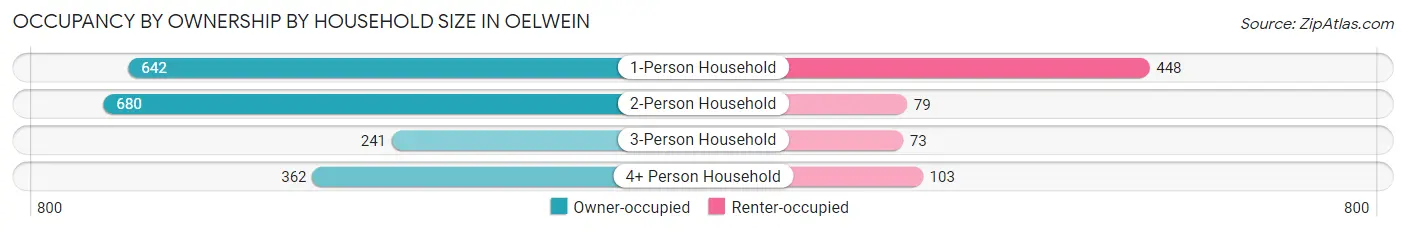
| Household Size | Owner-occupied | Renter-occupied |
| 1-Person Household | 642 (58.9%) | 448 (41.1%) |
| 2-Person Household | 680 (89.6%) | 79 (10.4%) |
| 3-Person Household | 241 (76.7%) | 73 (23.3%) |
| 4+ Person Household | 362 (77.8%) | 103 (22.2%) |
| Total Housing Units | 1,925 (73.3%) | 703 (26.8%) |
Occupancy by Educational Attainment in Oelwein
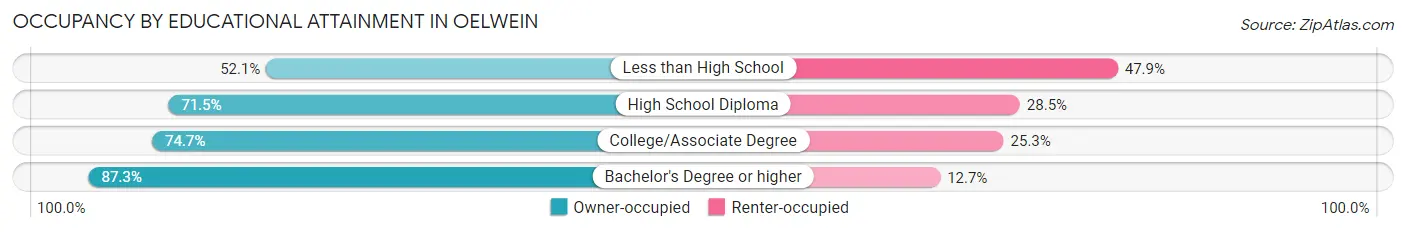
| Household Size | Owner-occupied | Renter-occupied |
| Less than High School | 124 (52.1%) | 114 (47.9%) |
| High School Diploma | 765 (71.5%) | 305 (28.5%) |
| College/Associate Degree | 692 (74.7%) | 234 (25.3%) |
| Bachelor's Degree or higher | 344 (87.3%) | 50 (12.7%) |
Occupancy by Age of Householder in Oelwein
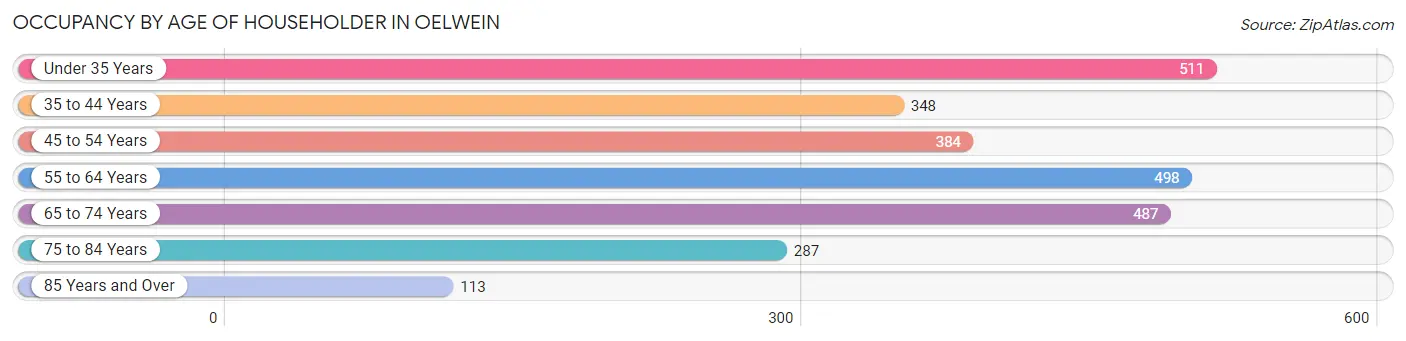
| Age Bracket | # Households | % Households |
| Under 35 Years | 511 | 19.4% |
| 35 to 44 Years | 348 | 13.2% |
| 45 to 54 Years | 384 | 14.6% |
| 55 to 64 Years | 498 | 19.0% |
| 65 to 74 Years | 487 | 18.5% |
| 75 to 84 Years | 287 | 10.9% |
| 85 Years and Over | 113 | 4.3% |
| Total | 2,628 | 100.0% |
Housing Finances in Oelwein
Median Income by Occupancy in Oelwein
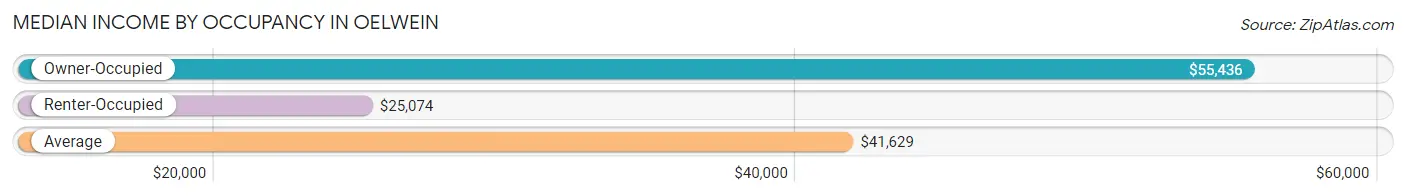
| Occupancy Type | # Households | Median Income |
| Owner-Occupied | 1,925 (73.3%) | $55,436 |
| Renter-Occupied | 703 (26.8%) | $25,074 |
| Average | 2,628 (100.0%) | $41,629 |
Occupancy by Householder Income Bracket in Oelwein
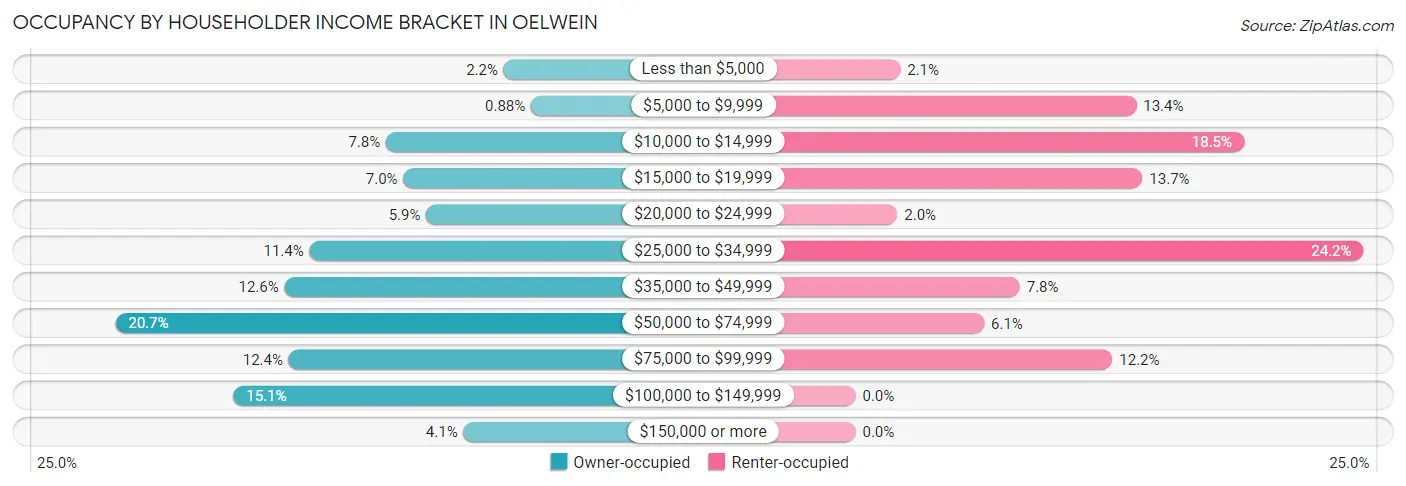
| Income Bracket | Owner-occupied | Renter-occupied |
| Less than $5,000 | 42 (2.2%) | 15 (2.1%) |
| $5,000 to $9,999 | 17 (0.9%) | 94 (13.4%) |
| $10,000 to $14,999 | 150 (7.8%) | 130 (18.5%) |
| $15,000 to $19,999 | 134 (7.0%) | 96 (13.7%) |
| $20,000 to $24,999 | 113 (5.9%) | 14 (2.0%) |
| $25,000 to $34,999 | 220 (11.4%) | 170 (24.2%) |
| $35,000 to $49,999 | 243 (12.6%) | 55 (7.8%) |
| $50,000 to $74,999 | 398 (20.7%) | 43 (6.1%) |
| $75,000 to $99,999 | 239 (12.4%) | 86 (12.2%) |
| $100,000 to $149,999 | 290 (15.1%) | 0 (0.0%) |
| $150,000 or more | 79 (4.1%) | 0 (0.0%) |
| Total | 1,925 (100.0%) | 703 (100.0%) |
Monthly Housing Cost Tiers in Oelwein
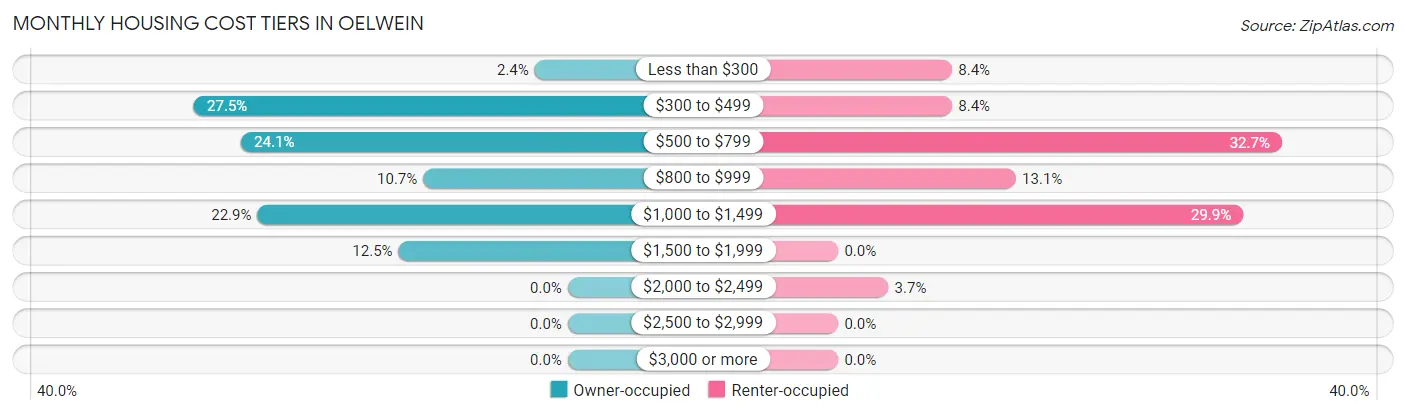
| Monthly Cost | Owner-occupied | Renter-occupied |
| Less than $300 | 47 (2.4%) | 59 (8.4%) |
| $300 to $499 | 530 (27.5%) | 59 (8.4%) |
| $500 to $799 | 463 (24.0%) | 230 (32.7%) |
| $800 to $999 | 205 (10.6%) | 92 (13.1%) |
| $1,000 to $1,499 | 440 (22.9%) | 210 (29.9%) |
| $1,500 to $1,999 | 240 (12.5%) | 0 (0.0%) |
| $2,000 to $2,499 | 0 (0.0%) | 26 (3.7%) |
| $2,500 to $2,999 | 0 (0.0%) | 0 (0.0%) |
| $3,000 or more | 0 (0.0%) | 0 (0.0%) |
| Total | 1,925 (100.0%) | 703 (100.0%) |
Physical Housing Characteristics in Oelwein
Housing Structures in Oelwein
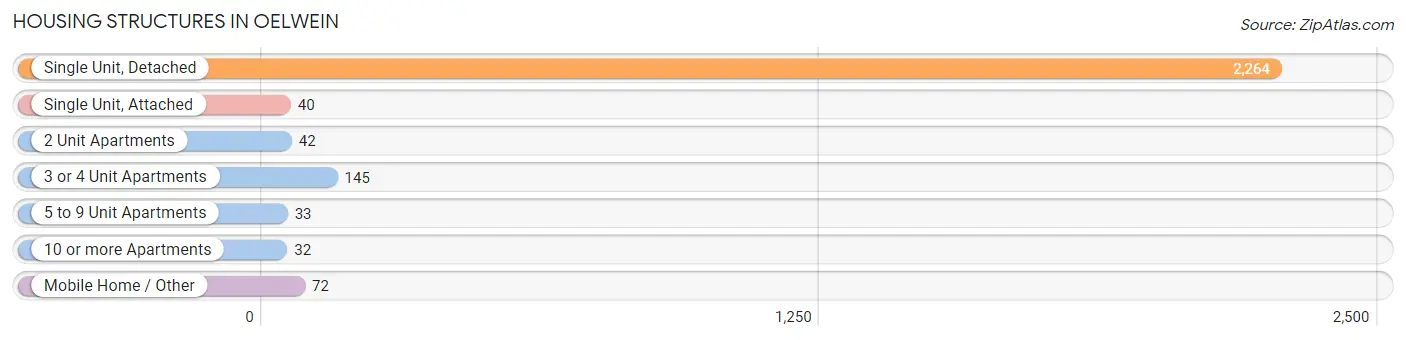
| Structure Type | # Housing Units | % Housing Units |
| Single Unit, Detached | 2,264 | 86.2% |
| Single Unit, Attached | 40 | 1.5% |
| 2 Unit Apartments | 42 | 1.6% |
| 3 or 4 Unit Apartments | 145 | 5.5% |
| 5 to 9 Unit Apartments | 33 | 1.3% |
| 10 or more Apartments | 32 | 1.2% |
| Mobile Home / Other | 72 | 2.7% |
| Total | 2,628 | 100.0% |
Housing Structures by Occupancy in Oelwein
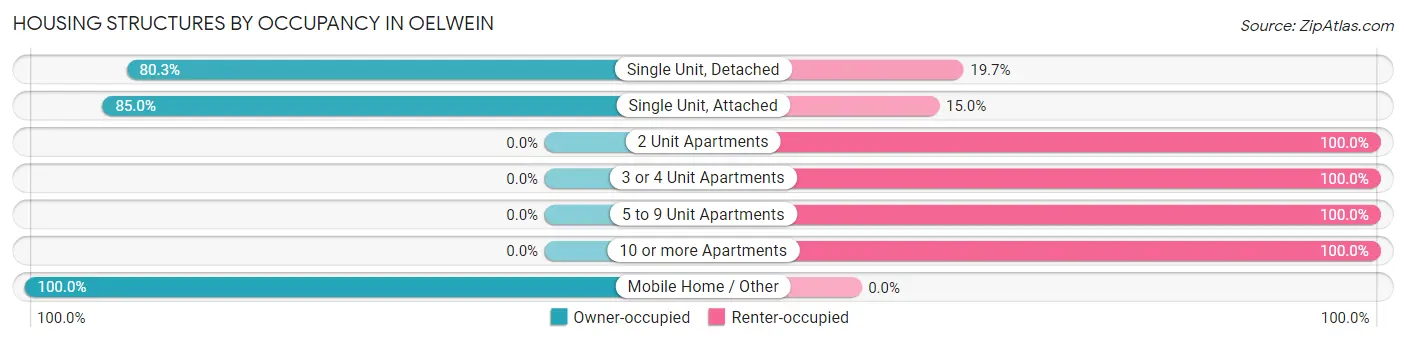
| Structure Type | Owner-occupied | Renter-occupied |
| Single Unit, Detached | 1,819 (80.3%) | 445 (19.7%) |
| Single Unit, Attached | 34 (85.0%) | 6 (15.0%) |
| 2 Unit Apartments | 0 (0.0%) | 42 (100.0%) |
| 3 or 4 Unit Apartments | 0 (0.0%) | 145 (100.0%) |
| 5 to 9 Unit Apartments | 0 (0.0%) | 33 (100.0%) |
| 10 or more Apartments | 0 (0.0%) | 32 (100.0%) |
| Mobile Home / Other | 72 (100.0%) | 0 (0.0%) |
| Total | 1,925 (73.3%) | 703 (26.8%) |
Housing Structures by Number of Rooms in Oelwein
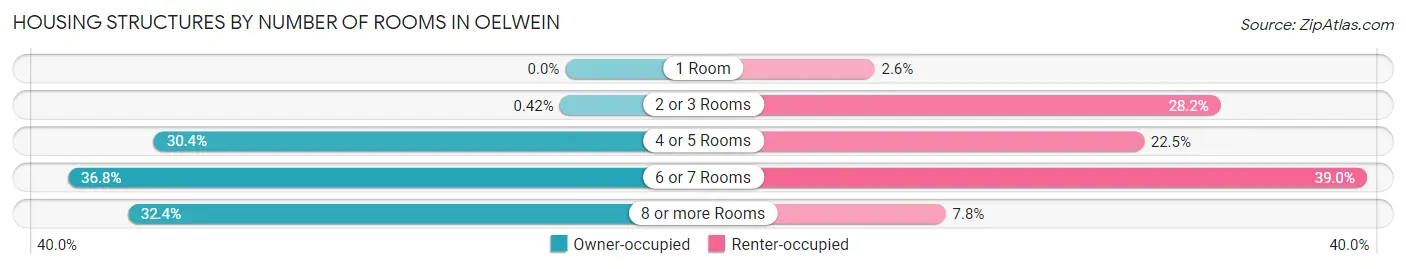
| Number of Rooms | Owner-occupied | Renter-occupied |
| 1 Room | 0 (0.0%) | 18 (2.6%) |
| 2 or 3 Rooms | 8 (0.4%) | 198 (28.2%) |
| 4 or 5 Rooms | 586 (30.4%) | 158 (22.5%) |
| 6 or 7 Rooms | 708 (36.8%) | 274 (39.0%) |
| 8 or more Rooms | 623 (32.4%) | 55 (7.8%) |
| Total | 1,925 (100.0%) | 703 (100.0%) |
Housing Structure by Heating Type in Oelwein
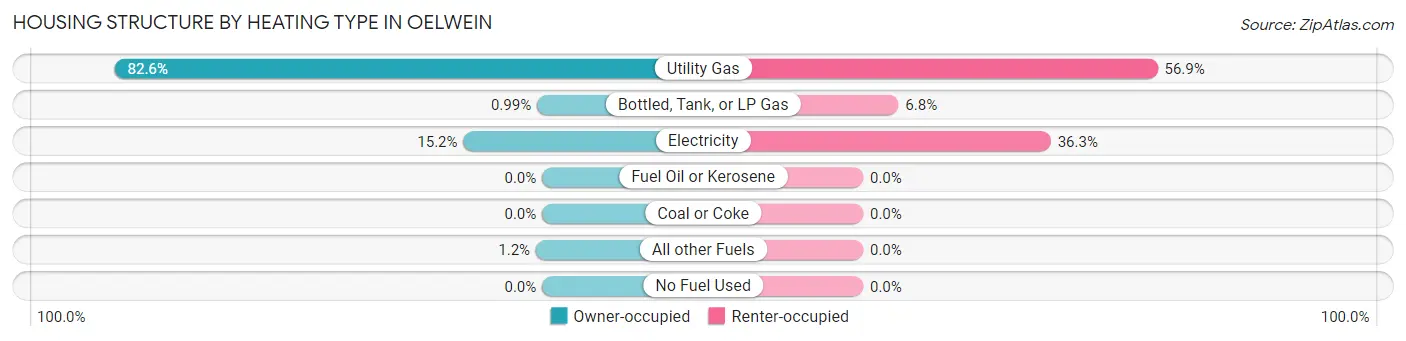
| Heating Type | Owner-occupied | Renter-occupied |
| Utility Gas | 1,590 (82.6%) | 400 (56.9%) |
| Bottled, Tank, or LP Gas | 19 (1.0%) | 48 (6.8%) |
| Electricity | 293 (15.2%) | 255 (36.3%) |
| Fuel Oil or Kerosene | 0 (0.0%) | 0 (0.0%) |
| Coal or Coke | 0 (0.0%) | 0 (0.0%) |
| All other Fuels | 23 (1.2%) | 0 (0.0%) |
| No Fuel Used | 0 (0.0%) | 0 (0.0%) |
| Total | 1,925 (100.0%) | 703 (100.0%) |
Household Vehicle Usage in Oelwein
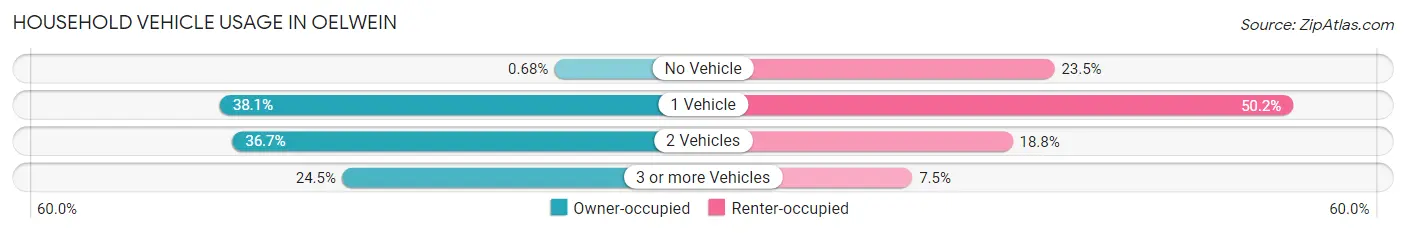
| Vehicles per Household | Owner-occupied | Renter-occupied |
| No Vehicle | 13 (0.7%) | 165 (23.5%) |
| 1 Vehicle | 734 (38.1%) | 353 (50.2%) |
| 2 Vehicles | 707 (36.7%) | 132 (18.8%) |
| 3 or more Vehicles | 471 (24.5%) | 53 (7.5%) |
| Total | 1,925 (100.0%) | 703 (100.0%) |
Real Estate & Mortgages in Oelwein
Real Estate and Mortgage Overview in Oelwein
| Characteristic | Without Mortgage | With Mortgage |
| Housing Units | 910 | 1,015 |
| Median Property Value | $83,500 | $117,300 |
| Median Household Income | $41,288 | $57 |
| Monthly Housing Costs | $470 | $0 |
| Real Estate Taxes | $1,241 | $0 |
Property Value by Mortgage Status in Oelwein
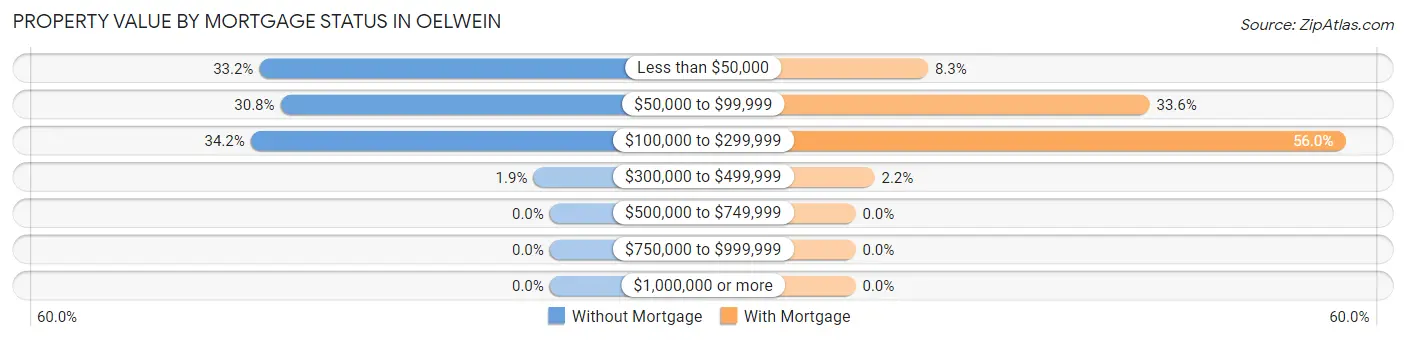
| Property Value | Without Mortgage | With Mortgage |
| Less than $50,000 | 302 (33.2%) | 84 (8.3%) |
| $50,000 to $99,999 | 280 (30.8%) | 341 (33.6%) |
| $100,000 to $299,999 | 311 (34.2%) | 568 (56.0%) |
| $300,000 to $499,999 | 17 (1.9%) | 22 (2.2%) |
| $500,000 to $749,999 | 0 (0.0%) | 0 (0.0%) |
| $750,000 to $999,999 | 0 (0.0%) | 0 (0.0%) |
| $1,000,000 or more | 0 (0.0%) | 0 (0.0%) |
| Total | 910 (100.0%) | 1,015 (100.0%) |
Household Income by Mortgage Status in Oelwein
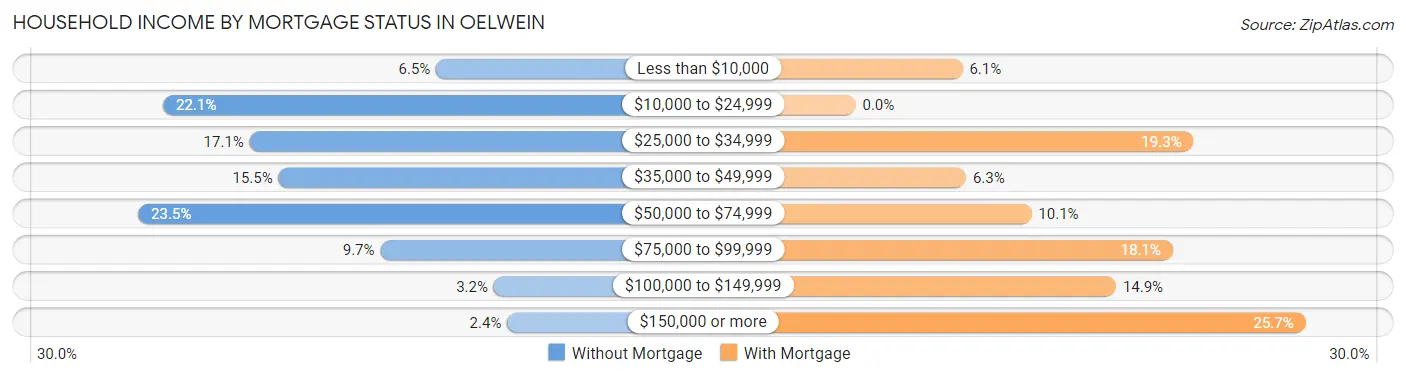
| Household Income | Without Mortgage | With Mortgage |
| Less than $10,000 | 59 (6.5%) | 62 (6.1%) |
| $10,000 to $24,999 | 201 (22.1%) | 0 (0.0%) |
| $25,000 to $34,999 | 156 (17.1%) | 196 (19.3%) |
| $35,000 to $49,999 | 141 (15.5%) | 64 (6.3%) |
| $50,000 to $74,999 | 214 (23.5%) | 102 (10.1%) |
| $75,000 to $99,999 | 88 (9.7%) | 184 (18.1%) |
| $100,000 to $149,999 | 29 (3.2%) | 151 (14.9%) |
| $150,000 or more | 22 (2.4%) | 261 (25.7%) |
| Total | 910 (100.0%) | 1,015 (100.0%) |
Property Value to Household Income Ratio in Oelwein
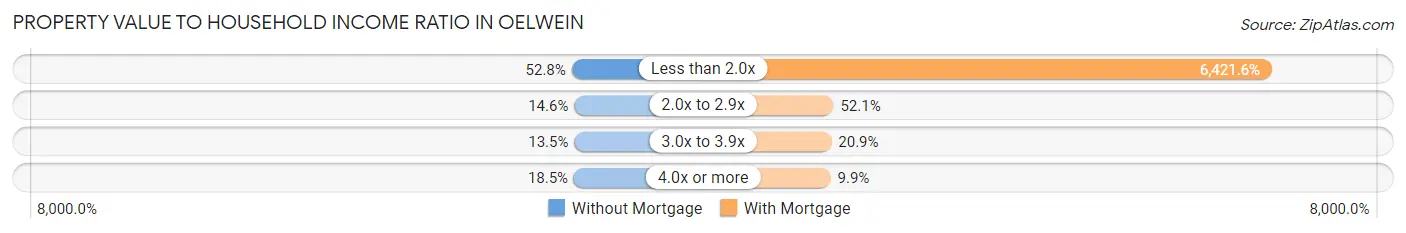
| Value-to-Income Ratio | Without Mortgage | With Mortgage |
| Less than 2.0x | 480 (52.7%) | 65,179 (6,421.6%) |
| 2.0x to 2.9x | 133 (14.6%) | 529 (52.1%) |
| 3.0x to 3.9x | 123 (13.5%) | 212 (20.9%) |
| 4.0x or more | 168 (18.5%) | 100 (9.9%) |
| Total | 910 (100.0%) | 1,015 (100.0%) |
Real Estate Taxes by Mortgage Status in Oelwein
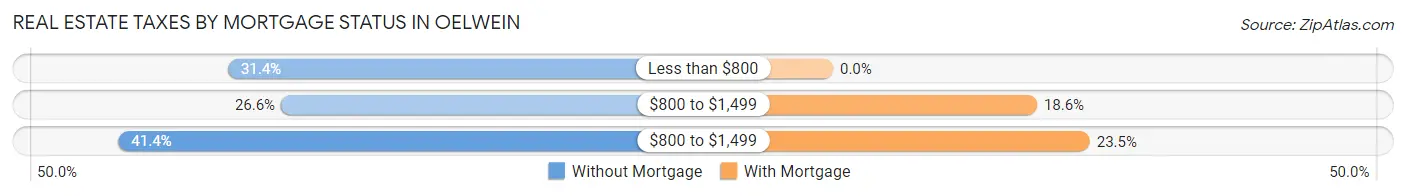
| Property Taxes | Without Mortgage | With Mortgage |
| Less than $800 | 286 (31.4%) | 0 (0.0%) |
| $800 to $1,499 | 242 (26.6%) | 189 (18.6%) |
| $800 to $1,499 | 377 (41.4%) | 238 (23.4%) |
| Total | 910 (100.0%) | 1,015 (100.0%) |
Health & Disability in Oelwein
Health Insurance Coverage by Age in Oelwein
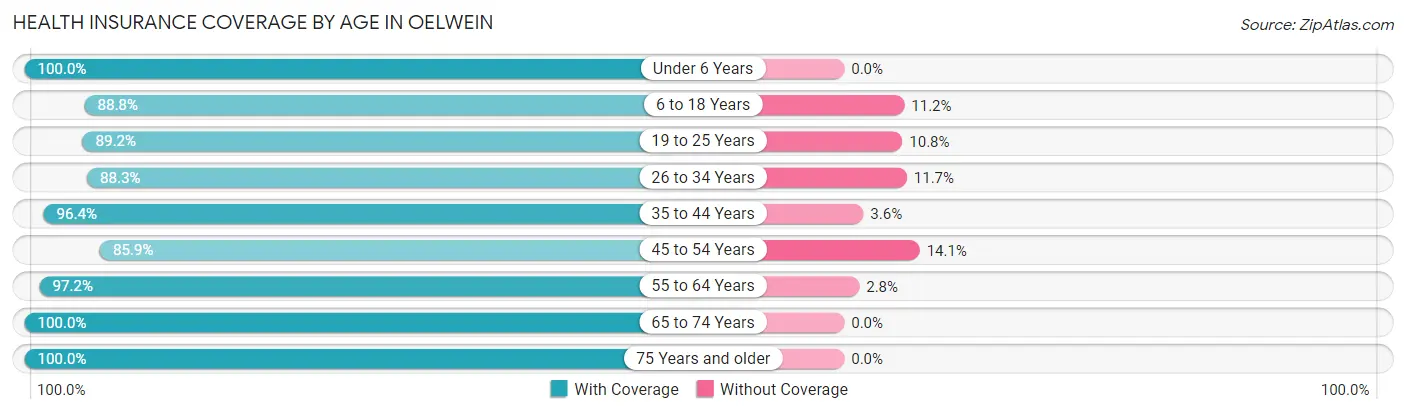
| Age Bracket | With Coverage | Without Coverage |
| Under 6 Years | 365 (100.0%) | 0 (0.0%) |
| 6 to 18 Years | 801 (88.8%) | 101 (11.2%) |
| 19 to 25 Years | 354 (89.2%) | 43 (10.8%) |
| 26 to 34 Years | 583 (88.3%) | 77 (11.7%) |
| 35 to 44 Years | 704 (96.4%) | 26 (3.6%) |
| 45 to 54 Years | 587 (85.9%) | 96 (14.1%) |
| 55 to 64 Years | 833 (97.2%) | 24 (2.8%) |
| 65 to 74 Years | 677 (100.0%) | 0 (0.0%) |
| 75 Years and older | 515 (100.0%) | 0 (0.0%) |
| Total | 5,419 (93.7%) | 367 (6.3%) |
Health Insurance Coverage by Citizenship Status in Oelwein
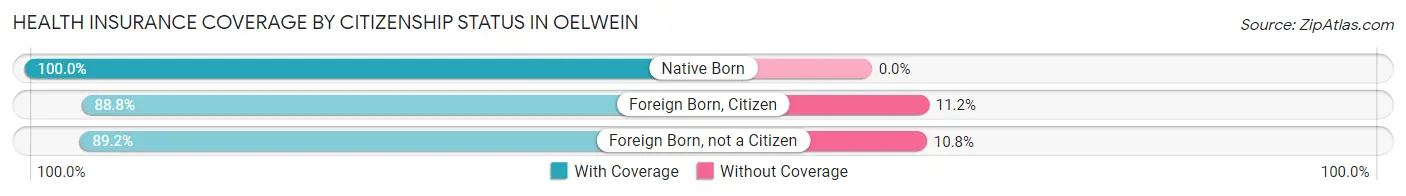
| Citizenship Status | With Coverage | Without Coverage |
| Native Born | 365 (100.0%) | 0 (0.0%) |
| Foreign Born, Citizen | 801 (88.8%) | 101 (11.2%) |
| Foreign Born, not a Citizen | 354 (89.2%) | 43 (10.8%) |
Health Insurance Coverage by Household Income in Oelwein
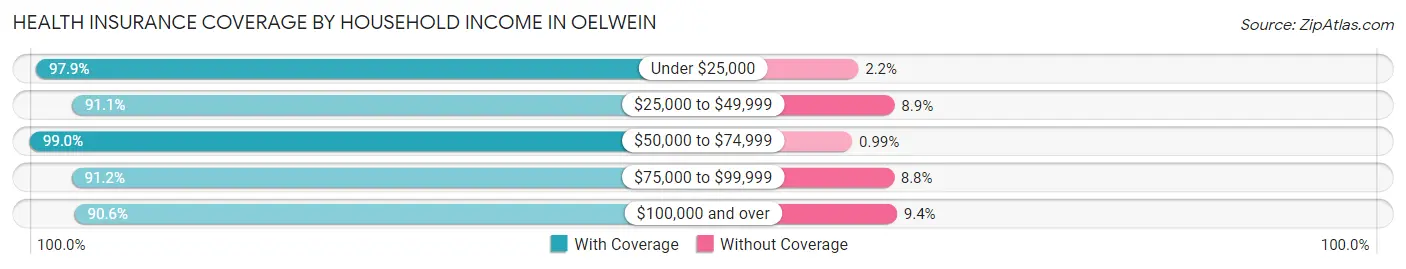
| Household Income | With Coverage | Without Coverage |
| Under $25,000 | 1,182 (97.9%) | 26 (2.1%) |
| $25,000 to $49,999 | 1,246 (91.1%) | 122 (8.9%) |
| $50,000 to $74,999 | 901 (99.0%) | 9 (1.0%) |
| $75,000 to $99,999 | 881 (91.2%) | 85 (8.8%) |
| $100,000 and over | 1,198 (90.6%) | 124 (9.4%) |
Public vs Private Health Insurance Coverage by Age in Oelwein
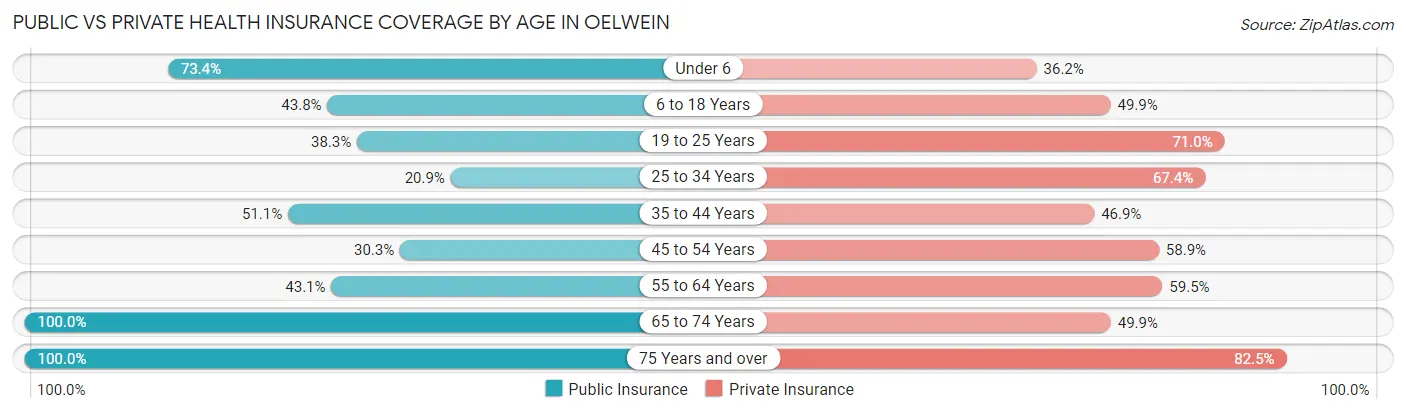
| Age Bracket | Public Insurance | Private Insurance |
| Under 6 | 268 (73.4%) | 132 (36.2%) |
| 6 to 18 Years | 395 (43.8%) | 450 (49.9%) |
| 19 to 25 Years | 152 (38.3%) | 282 (71.0%) |
| 25 to 34 Years | 138 (20.9%) | 445 (67.4%) |
| 35 to 44 Years | 373 (51.1%) | 342 (46.9%) |
| 45 to 54 Years | 207 (30.3%) | 402 (58.9%) |
| 55 to 64 Years | 369 (43.1%) | 510 (59.5%) |
| 65 to 74 Years | 677 (100.0%) | 338 (49.9%) |
| 75 Years and over | 515 (100.0%) | 425 (82.5%) |
| Total | 3,094 (53.5%) | 3,326 (57.5%) |
Disability Status by Sex by Age in Oelwein
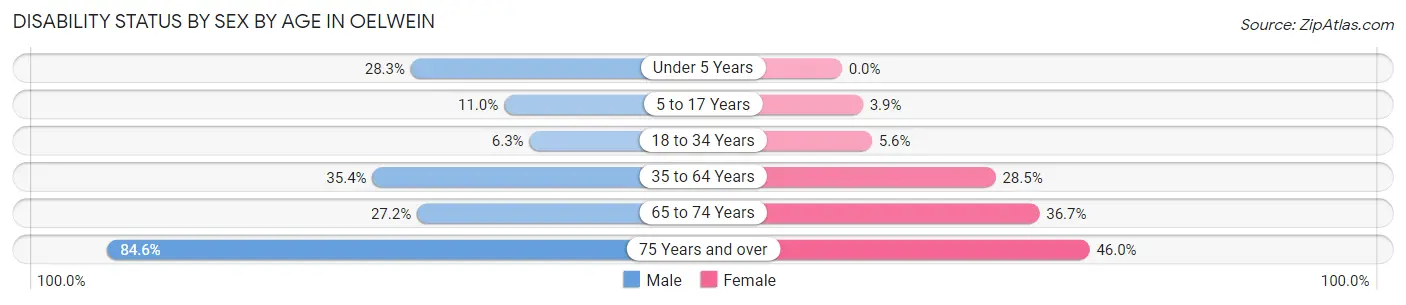
| Age Bracket | Male | Female |
| Under 5 Years | 47 (28.3%) | 0 (0.0%) |
| 5 to 17 Years | 59 (11.0%) | 13 (3.9%) |
| 18 to 34 Years | 36 (6.3%) | 32 (5.6%) |
| 35 to 64 Years | 438 (35.4%) | 295 (28.5%) |
| 65 to 74 Years | 75 (27.2%) | 147 (36.7%) |
| 75 Years and over | 121 (84.6%) | 171 (46.0%) |
Disability Class by Sex by Age in Oelwein
Disability Class: Hearing Difficulty
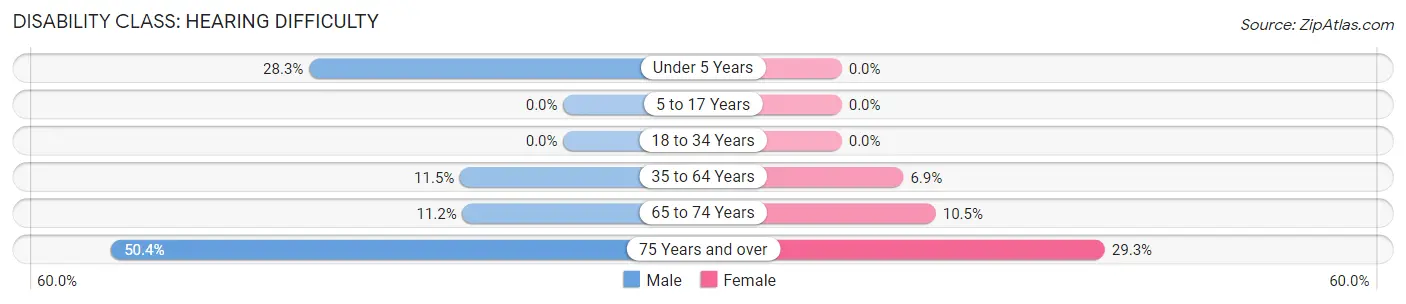
| Age Bracket | Male | Female |
| Under 5 Years | 47 (28.3%) | 0 (0.0%) |
| 5 to 17 Years | 0 (0.0%) | 0 (0.0%) |
| 18 to 34 Years | 0 (0.0%) | 0 (0.0%) |
| 35 to 64 Years | 142 (11.5%) | 71 (6.9%) |
| 65 to 74 Years | 31 (11.2%) | 42 (10.5%) |
| 75 Years and over | 72 (50.3%) | 109 (29.3%) |
Disability Class: Vision Difficulty
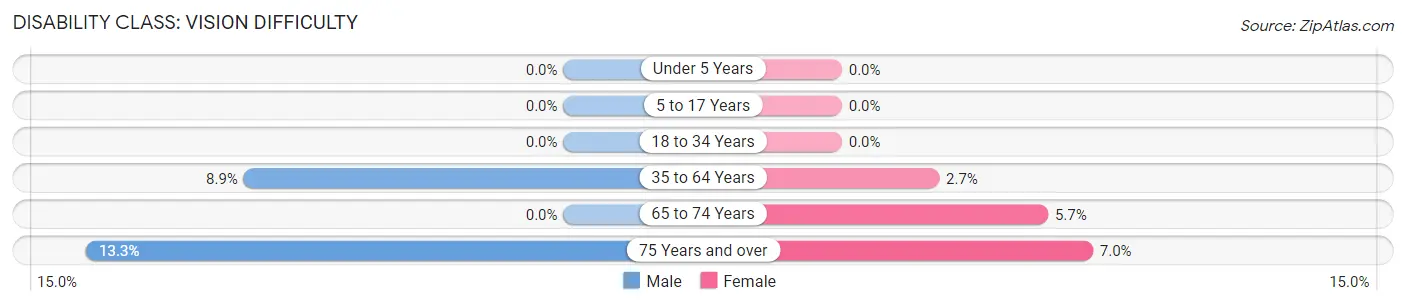
| Age Bracket | Male | Female |
| Under 5 Years | 0 (0.0%) | 0 (0.0%) |
| 5 to 17 Years | 0 (0.0%) | 0 (0.0%) |
| 18 to 34 Years | 0 (0.0%) | 0 (0.0%) |
| 35 to 64 Years | 110 (8.9%) | 28 (2.7%) |
| 65 to 74 Years | 0 (0.0%) | 23 (5.7%) |
| 75 Years and over | 19 (13.3%) | 26 (7.0%) |
Disability Class: Cognitive Difficulty
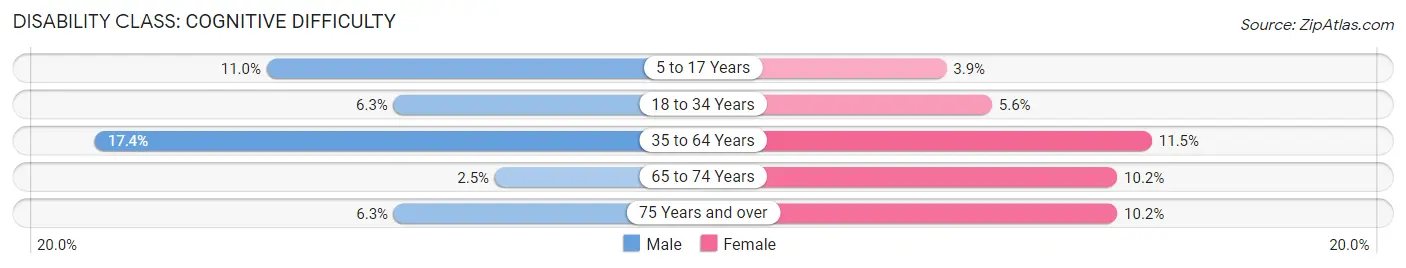
| Age Bracket | Male | Female |
| 5 to 17 Years | 59 (11.0%) | 13 (3.9%) |
| 18 to 34 Years | 36 (6.3%) | 32 (5.6%) |
| 35 to 64 Years | 215 (17.4%) | 119 (11.5%) |
| 65 to 74 Years | 7 (2.5%) | 41 (10.2%) |
| 75 Years and over | 9 (6.3%) | 38 (10.2%) |
Disability Class: Ambulatory Difficulty
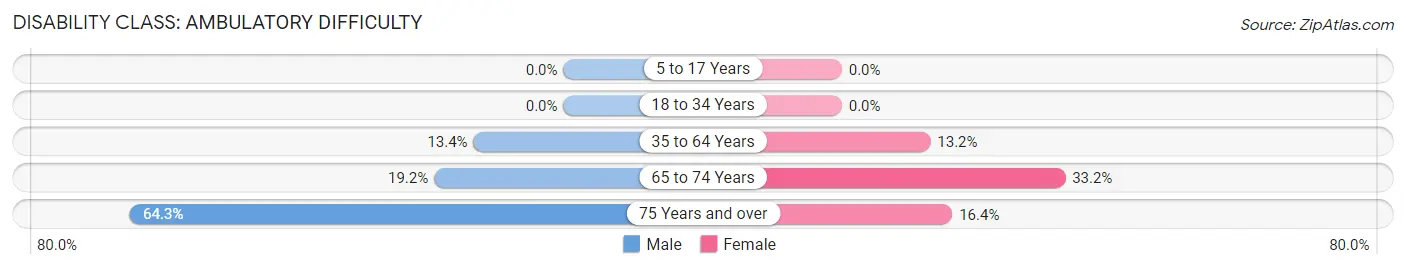
| Age Bracket | Male | Female |
| 5 to 17 Years | 0 (0.0%) | 0 (0.0%) |
| 18 to 34 Years | 0 (0.0%) | 0 (0.0%) |
| 35 to 64 Years | 165 (13.4%) | 136 (13.2%) |
| 65 to 74 Years | 53 (19.2%) | 133 (33.2%) |
| 75 Years and over | 92 (64.3%) | 61 (16.4%) |
Disability Class: Self-Care Difficulty
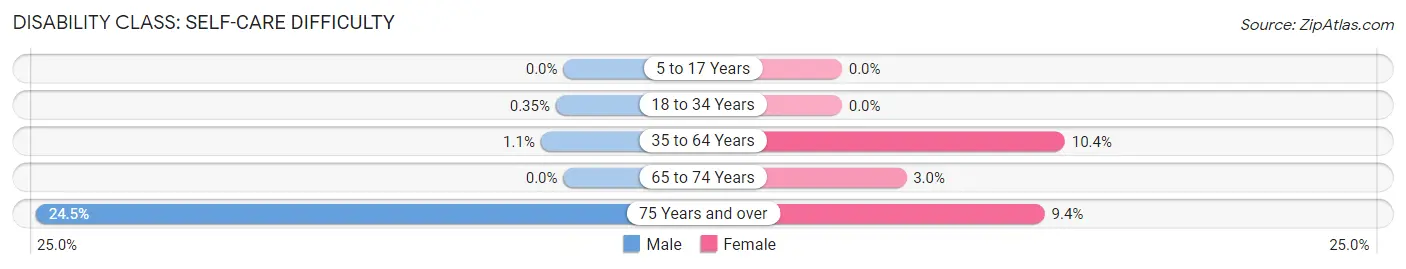
| Age Bracket | Male | Female |
| 5 to 17 Years | 0 (0.0%) | 0 (0.0%) |
| 18 to 34 Years | 2 (0.4%) | 0 (0.0%) |
| 35 to 64 Years | 13 (1.1%) | 107 (10.3%) |
| 65 to 74 Years | 0 (0.0%) | 12 (3.0%) |
| 75 Years and over | 35 (24.5%) | 35 (9.4%) |
Technology Access in Oelwein
Computing Device Access in Oelwein
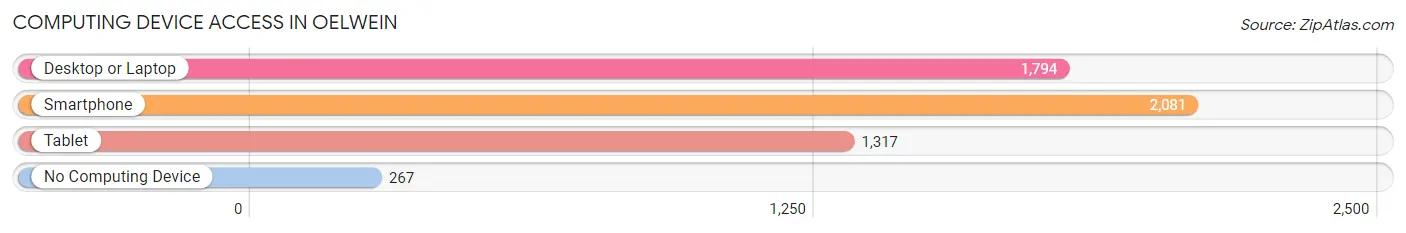
| Device Type | # Households | % Households |
| Desktop or Laptop | 1,794 | 68.3% |
| Smartphone | 2,081 | 79.2% |
| Tablet | 1,317 | 50.1% |
| No Computing Device | 267 | 10.2% |
| Total | 2,628 | 100.0% |
Internet Access in Oelwein
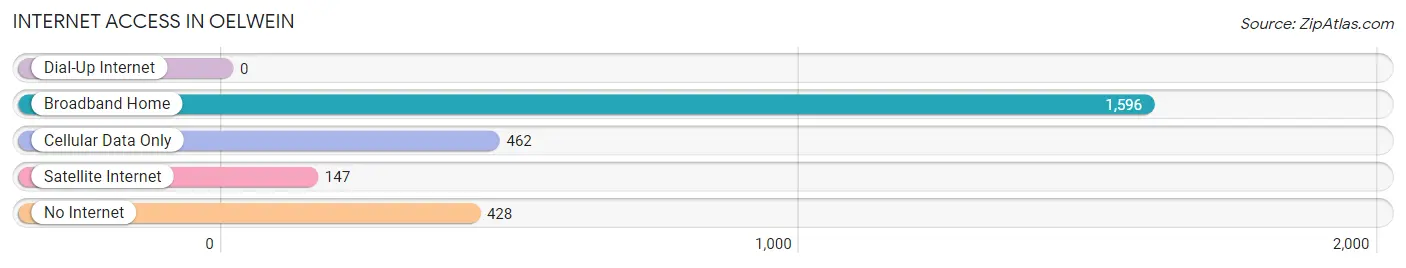
| Internet Type | # Households | % Households |
| Dial-Up Internet | 0 | 0.0% |
| Broadband Home | 1,596 | 60.7% |
| Cellular Data Only | 462 | 17.6% |
| Satellite Internet | 147 | 5.6% |
| No Internet | 428 | 16.3% |
| Total | 2,628 | 100.0% |
Oelwein Summary
Oelwein, Iowa is a small city located in Fayette County in the northeastern part of the state. It is situated along the Cedar River and is part of the Waterloo-Cedar Falls Metropolitan Statistical Area. The city has a population of approximately 6,000 people and is known for its strong sense of community and its commitment to preserving its historic downtown.
Geography
Oelwein is located in the northeastern part of Iowa, in Fayette County. It is situated along the Cedar River, which flows through the city and is a major source of recreation for the area. The city is located approximately 90 miles northeast of Des Moines and is part of the Waterloo-Cedar Falls Metropolitan Statistical Area. The city is surrounded by rolling hills and farmland, and is home to several parks and recreational areas.
History
Oelwein was founded in 1873 by German immigrants who were looking for a place to settle and start a new life. The city was named after Oelwein, Germany, and was incorporated in 1876. The city quickly grew and became a major hub for the railroad industry, with several major railroads running through the city. The city also became a major agricultural center, with several large farms located in the area.
In the early 1900s, Oelwein experienced a period of rapid growth and development. The city was home to several large factories, including a flour mill, a creamery, and a canning factory. The city also became a major center for the coal mining industry, with several large mines located in the area.
Economy
Oelwein’s economy is largely based on agriculture and manufacturing. The city is home to several large farms, and the surrounding area is known for its production of corn, soybeans, and other crops. The city is also home to several large manufacturing companies, including a flour mill, a creamery, and a canning factory. The city is also home to several small businesses, including restaurants, retail stores, and service providers.
Demographics
As of the 2010 census, Oelwein had a population of 6,073 people. The racial makeup of the city was 95.2% White, 0.7% African American, 0.3% Native American, 0.7% Asian, 0.1% Pacific Islander, 1.3% from other races, and 1.7% from two or more races. Hispanic or Latino of any race were 3.2% of the population.
The median income for a household in Oelwein was $37,917, and the median income for a family was $45,938. The per capita income for the city was $19,945. About 11.2% of families and 14.2% of the population were below the poverty line, including 19.2% of those under age 18 and 8.2% of those age 65 or over.
Oelwein is a small city with a strong sense of community and a commitment to preserving its historic downtown. The city is home to several large farms and manufacturing companies, and is a major center for the coal mining industry. The city is also home to several small businesses, and is known for its commitment to preserving its historic downtown.
Common Questions
What is Per Capita Income in Oelwein?
Per Capita income in Oelwein is $26,500.
What is the Median Family Income in Oelwein?
Median Family Income in Oelwein is $58,806.
What is the Median Household income in Oelwein?
Median Household Income in Oelwein is $41,629.
What is Income or Wage Gap in Oelwein?
Income or Wage Gap in Oelwein is 40.9%.
Women in Oelwein earn 59.1 cents for every dollar earned by a man.
What is Family Income Deficit in Oelwein?
Family Income Deficit in Oelwein is $17,088.
Families that are below poverty line in Oelwein earn $17,088 less on average than the poverty threshold level.
What is Inequality or Gini Index in Oelwein?
Inequality or Gini Index in Oelwein is 0.46.
What is the Total Population of Oelwein?
Total Population of Oelwein is 5,934.
What is the Total Male Population of Oelwein?
Total Male Population of Oelwein is 3,008.
What is the Total Female Population of Oelwein?
Total Female Population of Oelwein is 2,926.
What is the Ratio of Males per 100 Females in Oelwein?
There are 102.80 Males per 100 Females in Oelwein.
What is the Ratio of Females per 100 Males in Oelwein?
There are 97.27 Females per 100 Males in Oelwein.
What is the Median Population Age in Oelwein?
Median Population Age in Oelwein is 44.2 Years.
What is the Average Family Size in Oelwein
Average Family Size in Oelwein is 2.9 People.
What is the Average Household Size in Oelwein
Average Household Size in Oelwein is 2.2 People.
How Large is the Labor Force in Oelwein?
There are 2,507 People in the Labor Forcein in Oelwein.
What is the Percentage of People in the Labor Force in Oelwein?
51.6% of People are in the Labor Force in Oelwein.
What is the Unemployment Rate in Oelwein?
Unemployment Rate in Oelwein is 6.7%.