New Sharon, IA Map & Demographics
New Sharon Map
New Sharon Overview
$34,612
PER CAPITA INCOME
$87,679
AVG FAMILY INCOME
$62,679
AVG HOUSEHOLD INCOME
57.5%
WAGE / INCOME GAP [ % ]
42.5¢/ $1
WAGE / INCOME GAP [ $ ]
0.43
INEQUALITY / GINI INDEX
1,183
TOTAL POPULATION
548
MALE POPULATION
635
FEMALE POPULATION
86.30
MALES / 100 FEMALES
115.88
FEMALES / 100 MALES
39.9
MEDIAN AGE
2.8
AVG FAMILY SIZE
2.1
AVG HOUSEHOLD SIZE
653
LABOR FORCE [ PEOPLE ]
66.0%
PERCENT IN LABOR FORCE
2.6%
UNEMPLOYMENT RATE
New Sharon Zip Codes
New Sharon Area Codes
Income in New Sharon
Income Overview in New Sharon
Per Capita Income in New Sharon is $34,612, while median incomes of families and households are $87,679 and $62,679 respectively.
| Characteristic | Number | Measure |
| Per Capita Income | 1,183 | $34,612 |
| Median Family Income | 313 | $87,679 |
| Mean Family Income | 313 | $96,240 |
| Median Household Income | 553 | $62,679 |
| Mean Household Income | 553 | $72,701 |
| Income Deficit | 313 | $0 |
| Wage / Income Gap (%) | 1,183 | 57.49% |
| Wage / Income Gap ($) | 1,183 | 42.51¢ per $1 |
| Gini / Inequality Index | 1,183 | 0.43 |
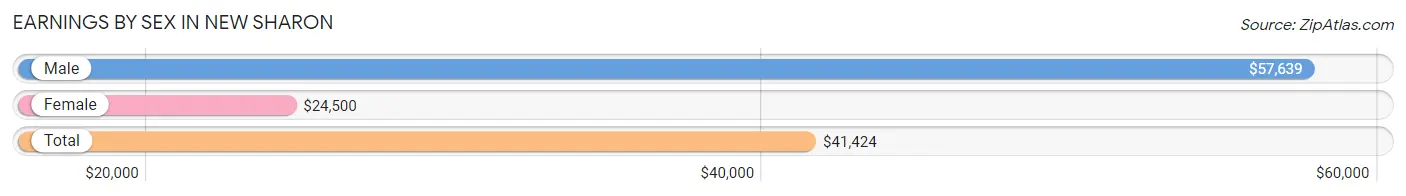
Earnings by Sex in New Sharon
Average Earnings in New Sharon are $41,424, $57,639 for men and $24,500 for women, a difference of 57.5%.
| Sex | Number | Average Earnings |
| Male | 335 (48.3%) | $57,639 |
| Female | 358 (51.7%) | $24,500 |
| Total | 693 (100.0%) | $41,424 |
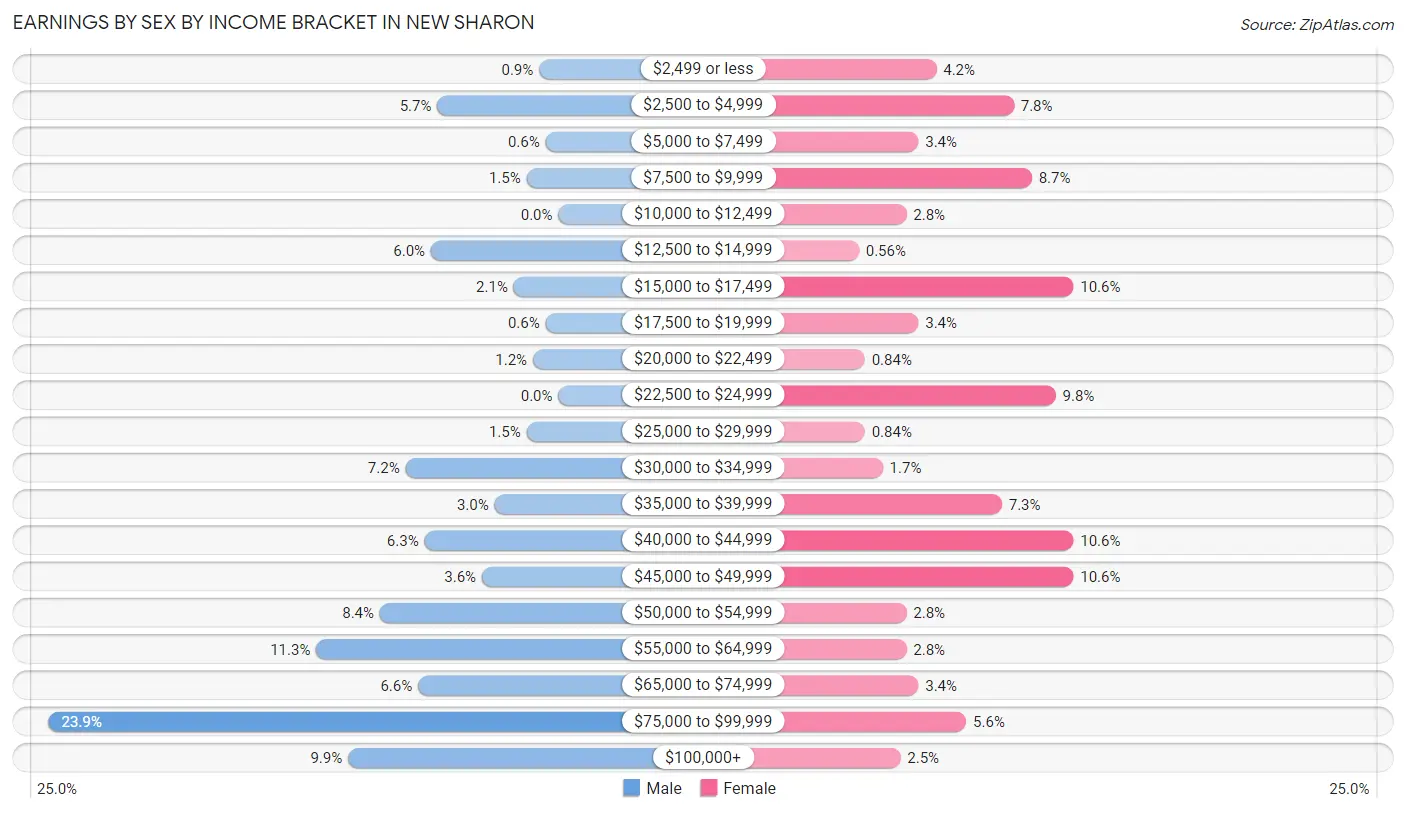
Earnings by Sex by Income Bracket in New Sharon
The most common earnings brackets in New Sharon are $75,000 to $99,999 for men (80 | 23.9%) and $15,000 to $17,499 for women (38 | 10.6%).
| Income | Male | Female |
| $2,499 or less | 3 (0.9%) | 15 (4.2%) |
| $2,500 to $4,999 | 19 (5.7%) | 28 (7.8%) |
| $5,000 to $7,499 | 2 (0.6%) | 12 (3.4%) |
| $7,500 to $9,999 | 5 (1.5%) | 31 (8.7%) |
| $10,000 to $12,499 | 0 (0.0%) | 10 (2.8%) |
| $12,500 to $14,999 | 20 (6.0%) | 2 (0.6%) |
| $15,000 to $17,499 | 7 (2.1%) | 38 (10.6%) |
| $17,500 to $19,999 | 2 (0.6%) | 12 (3.4%) |
| $20,000 to $22,499 | 4 (1.2%) | 3 (0.8%) |
| $22,500 to $24,999 | 0 (0.0%) | 35 (9.8%) |
| $25,000 to $29,999 | 5 (1.5%) | 3 (0.8%) |
| $30,000 to $34,999 | 24 (7.2%) | 6 (1.7%) |
| $35,000 to $39,999 | 10 (3.0%) | 26 (7.3%) |
| $40,000 to $44,999 | 21 (6.3%) | 38 (10.6%) |
| $45,000 to $49,999 | 12 (3.6%) | 38 (10.6%) |
| $50,000 to $54,999 | 28 (8.4%) | 10 (2.8%) |
| $55,000 to $64,999 | 38 (11.3%) | 10 (2.8%) |
| $65,000 to $74,999 | 22 (6.6%) | 12 (3.4%) |
| $75,000 to $99,999 | 80 (23.9%) | 20 (5.6%) |
| $100,000+ | 33 (9.9%) | 9 (2.5%) |
| Total | 335 (100.0%) | 358 (100.0%) |
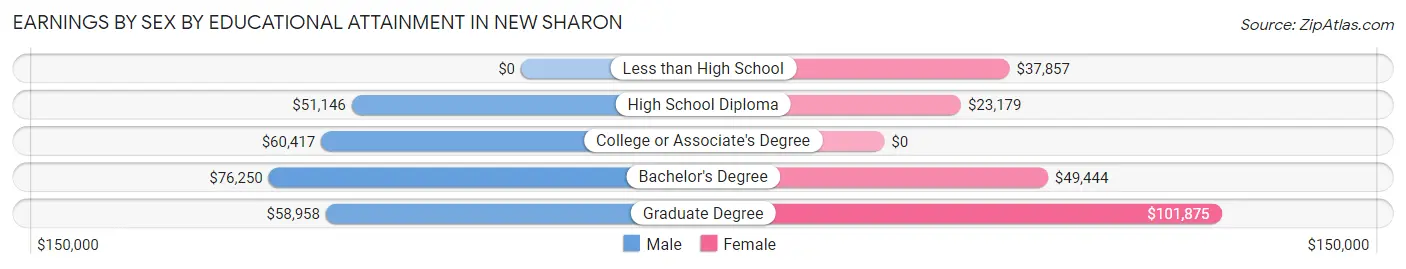
Earnings by Sex by Educational Attainment in New Sharon
Average earnings in New Sharon are $58,565 for men and $24,607 for women, a difference of 58.0%. Men with an educational attainment of bachelor's degree enjoy the highest average annual earnings of $76,250, while those with high school diploma education earn the least with $51,146. Women with an educational attainment of graduate degree earn the most with the average annual earnings of $101,875, while those with high school diploma education have the smallest earnings of $23,179.
| Educational Attainment | Male Income | Female Income |
| Less than High School | - | - |
| High School Diploma | $51,146 | $23,179 |
| College or Associate's Degree | $60,417 | $0 |
| Bachelor's Degree | $76,250 | $49,444 |
| Graduate Degree | $58,958 | $101,875 |
| Total | $58,565 | $24,607 |
Family Income in New Sharon
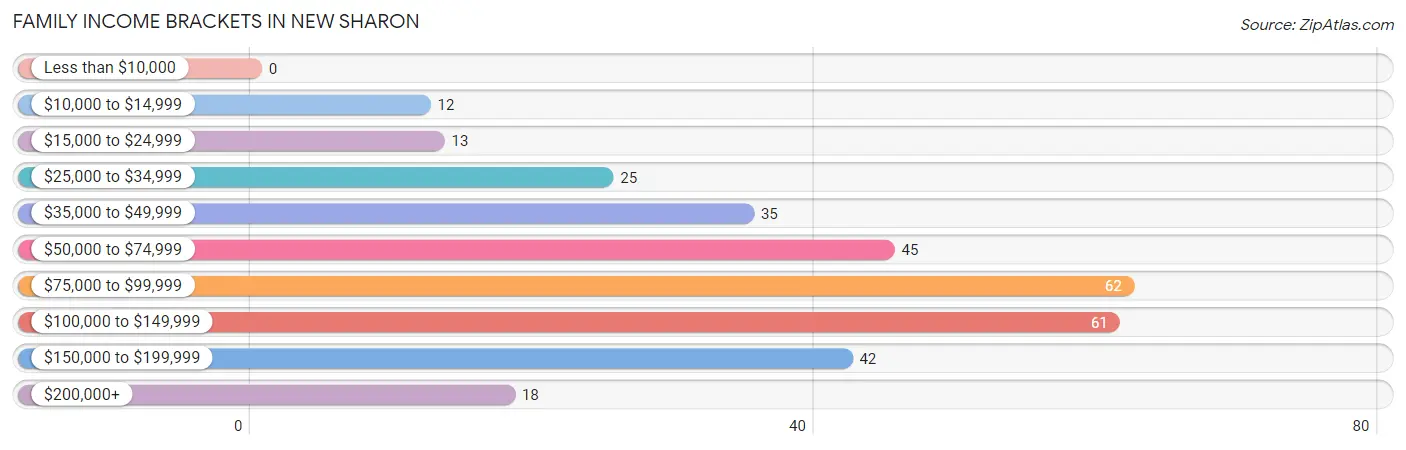
Family Income Brackets in New Sharon
According to the New Sharon family income data, there are 62 families falling into the $75,000 to $99,999 income range, which is the most common income bracket and makes up 19.8% of all families.
| Income Bracket | # Families | % Families |
| Less than $10,000 | 0 | 0.0% |
| $10,000 to $14,999 | 12 | 3.8% |
| $15,000 to $24,999 | 13 | 4.2% |
| $25,000 to $34,999 | 25 | 8.0% |
| $35,000 to $49,999 | 35 | 11.2% |
| $50,000 to $74,999 | 45 | 14.4% |
| $75,000 to $99,999 | 62 | 19.8% |
| $100,000 to $149,999 | 61 | 19.5% |
| $150,000 to $199,999 | 42 | 13.4% |
| $200,000+ | 18 | 5.8% |
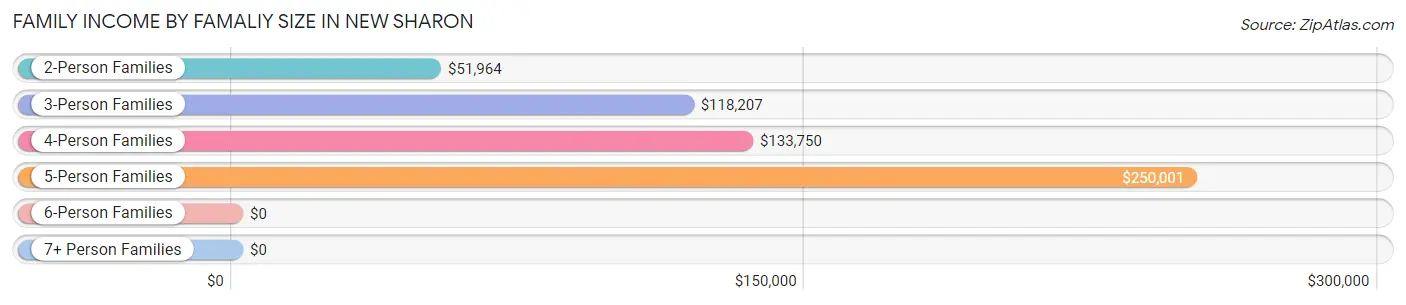
Family Income by Famaliy Size in New Sharon
5-person families (15 | 4.8%) account for the highest median family income in New Sharon with $250,001 per family, while 5-person families (15 | 4.8%) have the highest median income of $50,000 per family member.
| Income Bracket | # Families | Median Income |
| 2-Person Families | 166 (53.0%) | $51,964 |
| 3-Person Families | 75 (24.0%) | $118,207 |
| 4-Person Families | 50 (16.0%) | $133,750 |
| 5-Person Families | 15 (4.8%) | $250,001 |
| 6-Person Families | 7 (2.2%) | $0 |
| 7+ Person Families | 0 (0.0%) | $0 |
| Total | 313 (100.0%) | $87,679 |
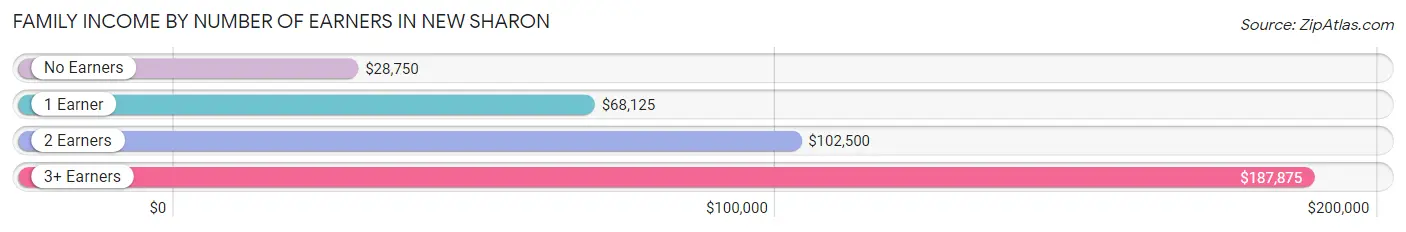
Family Income by Number of Earners in New Sharon
The median family income in New Sharon is $87,679, with families comprising 3+ earners (35) having the highest median family income of $187,875, while families with no earners (40) have the lowest median family income of $28,750, accounting for 11.2% and 12.8% of families, respectively.
| Number of Earners | # Families | Median Income |
| No Earners | 40 (12.8%) | $28,750 |
| 1 Earner | 114 (36.4%) | $68,125 |
| 2 Earners | 124 (39.6%) | $102,500 |
| 3+ Earners | 35 (11.2%) | $187,875 |
| Total | 313 (100.0%) | $87,679 |
Household Income in New Sharon
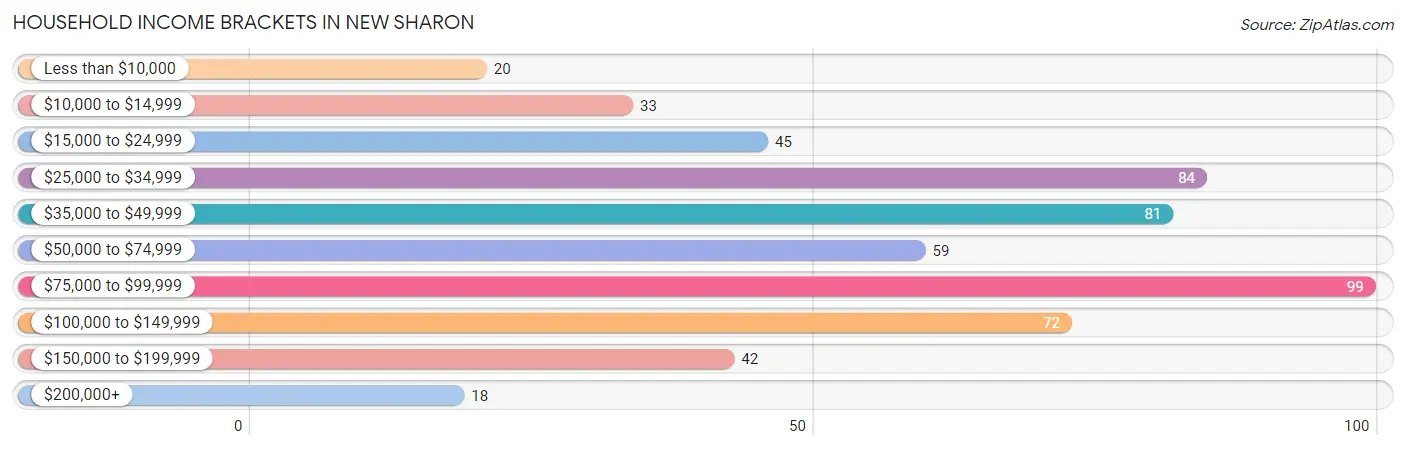
Household Income Brackets in New Sharon
With 99 households falling in the category, the $75,000 to $99,999 income range is the most frequent in New Sharon, accounting for 17.9% of all households. In contrast, only 18 households (3.3%) fall into the $200,000+ income bracket, making it the least populous group.
| Income Bracket | # Households | % Households |
| Less than $10,000 | 20 | 3.6% |
| $10,000 to $14,999 | 33 | 6.0% |
| $15,000 to $24,999 | 45 | 8.1% |
| $25,000 to $34,999 | 84 | 15.2% |
| $35,000 to $49,999 | 81 | 14.6% |
| $50,000 to $74,999 | 59 | 10.7% |
| $75,000 to $99,999 | 99 | 17.9% |
| $100,000 to $149,999 | 72 | 13.0% |
| $150,000 to $199,999 | 42 | 7.6% |
| $200,000+ | 18 | 3.3% |
Household Income by Householder Age in New Sharon
The median household income in New Sharon is $62,679, with the highest median household income of $92,778 found in the 15 to 24 years age bracket for the primary householder. A total of 34 households (6.1%) fall into this category. Meanwhile, the 65+ years age bracket for the primary householder has the lowest median household income of $32,250, with 167 households (30.2%) in this group.
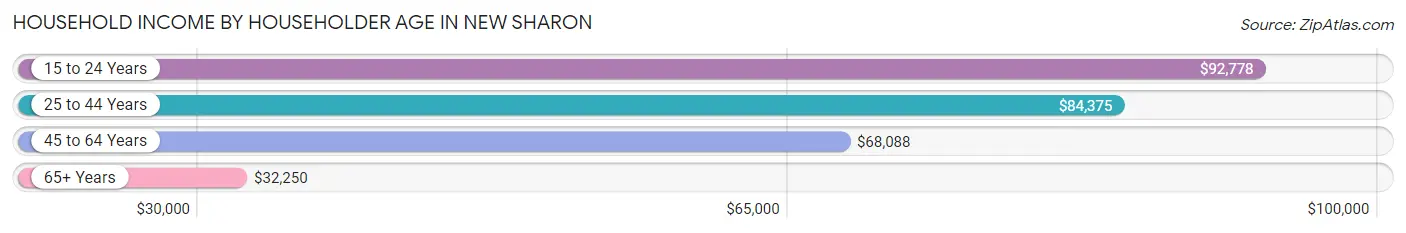
| Income Bracket | # Households | Median Income |
| 15 to 24 Years | 34 (6.1%) | $92,778 |
| 25 to 44 Years | 194 (35.1%) | $84,375 |
| 45 to 64 Years | 158 (28.6%) | $68,088 |
| 65+ Years | 167 (30.2%) | $32,250 |
| Total | 553 (100.0%) | $62,679 |
Poverty in New Sharon
Income Below Poverty by Sex and Age in New Sharon
With 12.3% poverty level for males and 9.8% for females among the residents of New Sharon, 55 to 64 year old males and 45 to 54 year old females are the most vulnerable to poverty, with 25 males (32.9%) and 19 females (38.8%) in their respective age groups living below the poverty level.
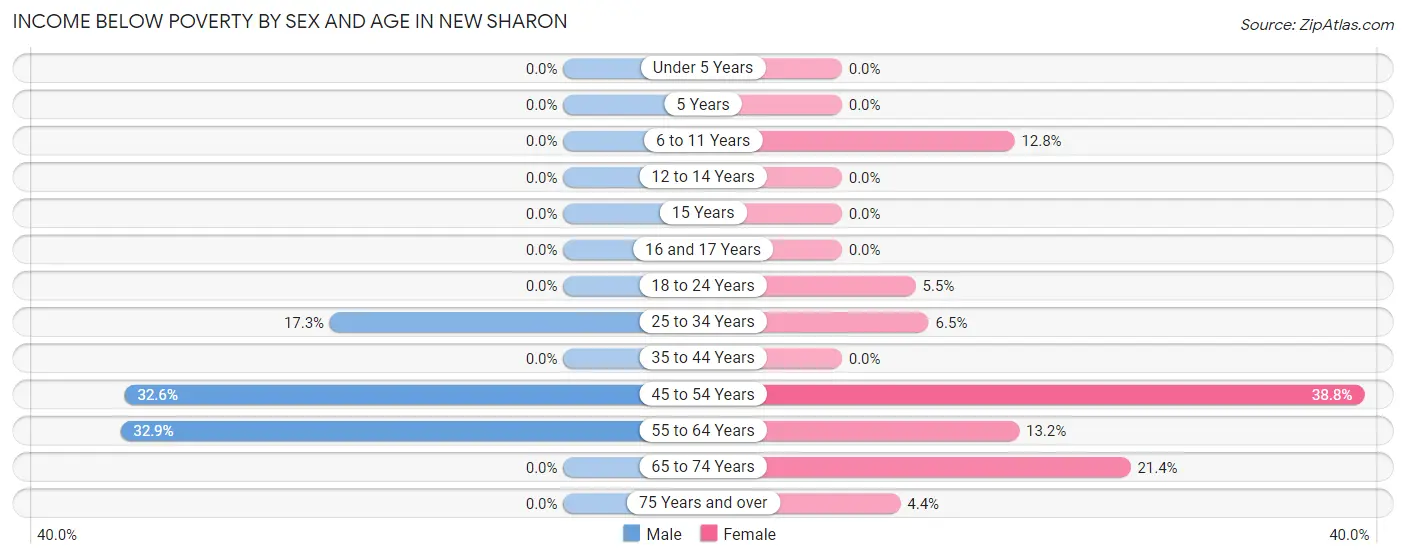
| Age Bracket | Male | Female |
| Under 5 Years | 0 (0.0%) | 0 (0.0%) |
| 5 Years | 0 (0.0%) | 0 (0.0%) |
| 6 to 11 Years | 0 (0.0%) | 5 (12.8%) |
| 12 to 14 Years | 0 (0.0%) | 0 (0.0%) |
| 15 Years | 0 (0.0%) | 0 (0.0%) |
| 16 and 17 Years | 0 (0.0%) | 0 (0.0%) |
| 18 to 24 Years | 0 (0.0%) | 4 (5.5%) |
| 25 to 34 Years | 13 (17.3%) | 6 (6.5%) |
| 35 to 44 Years | 0 (0.0%) | 0 (0.0%) |
| 45 to 54 Years | 29 (32.6%) | 19 (38.8%) |
| 55 to 64 Years | 25 (32.9%) | 10 (13.2%) |
| 65 to 74 Years | 0 (0.0%) | 15 (21.4%) |
| 75 Years and over | 0 (0.0%) | 3 (4.3%) |
| Total | 67 (12.3%) | 62 (9.8%) |
Income Above Poverty by Sex and Age in New Sharon
According to the poverty statistics in New Sharon, males aged under 5 years and females aged under 5 years are the age groups that are most secure financially, with 100.0% of males and 100.0% of females in these age groups living above the poverty line.
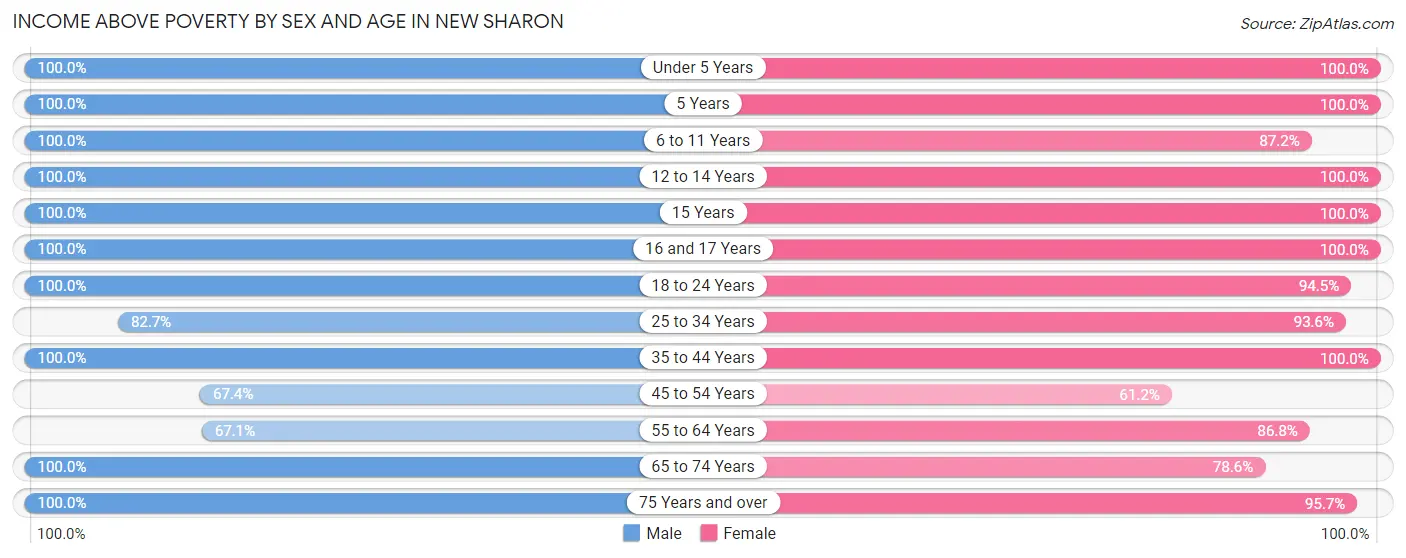
| Age Bracket | Male | Female |
| Under 5 Years | 22 (100.0%) | 26 (100.0%) |
| 5 Years | 14 (100.0%) | 2 (100.0%) |
| 6 to 11 Years | 33 (100.0%) | 34 (87.2%) |
| 12 to 14 Years | 22 (100.0%) | 13 (100.0%) |
| 15 Years | 7 (100.0%) | 12 (100.0%) |
| 16 and 17 Years | 7 (100.0%) | 25 (100.0%) |
| 18 to 24 Years | 24 (100.0%) | 69 (94.5%) |
| 25 to 34 Years | 62 (82.7%) | 87 (93.5%) |
| 35 to 44 Years | 88 (100.0%) | 88 (100.0%) |
| 45 to 54 Years | 60 (67.4%) | 30 (61.2%) |
| 55 to 64 Years | 51 (67.1%) | 66 (86.8%) |
| 65 to 74 Years | 66 (100.0%) | 55 (78.6%) |
| 75 Years and over | 21 (100.0%) | 66 (95.7%) |
| Total | 477 (87.7%) | 573 (90.2%) |
Income Below Poverty Among Married-Couple Families in New Sharon
The poverty statistics for married-couple families in New Sharon show that 7.9% or 19 of the total 240 families live below the poverty line. Families with no children have the highest poverty rate of 15.2%, comprising of 19 families. On the other hand, families with 1 or 2 children have the lowest poverty rate of 0.0%, which includes 0 families.
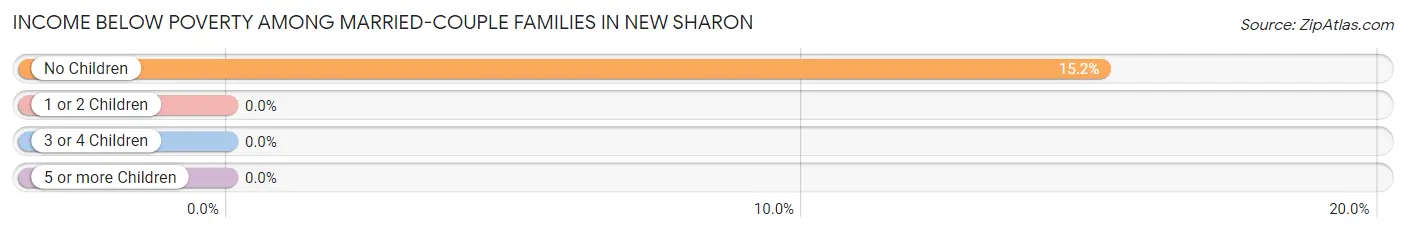
| Children | Above Poverty | Below Poverty |
| No Children | 106 (84.8%) | 19 (15.2%) |
| 1 or 2 Children | 103 (100.0%) | 0 (0.0%) |
| 3 or 4 Children | 12 (100.0%) | 0 (0.0%) |
| 5 or more Children | 0 (0.0%) | 0 (0.0%) |
| Total | 221 (92.1%) | 19 (7.9%) |
Income Below Poverty Among Single-Parent Households in New Sharon
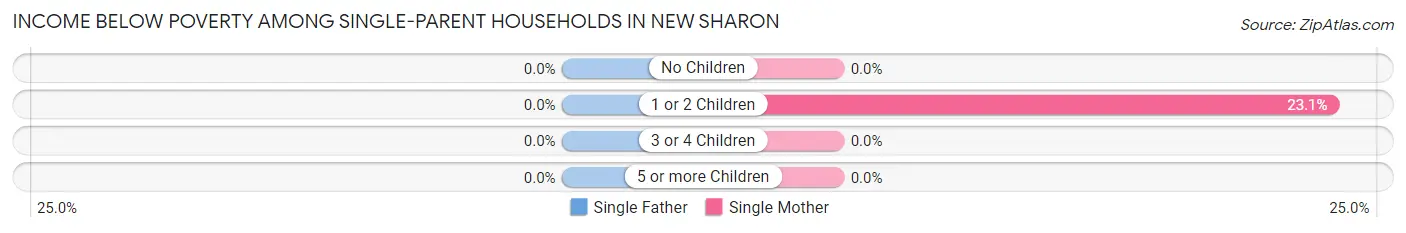
| Children | Single Father | Single Mother |
| No Children | 0 (0.0%) | 0 (0.0%) |
| 1 or 2 Children | 0 (0.0%) | 6 (23.1%) |
| 3 or 4 Children | 0 (0.0%) | 0 (0.0%) |
| 5 or more Children | 0 (0.0%) | 0 (0.0%) |
| Total | 0 (0.0%) | 6 (14.3%) |
Income Below Poverty Among Married-Couple vs Single-Parent Households in New Sharon
The poverty data for New Sharon shows that 19 of the married-couple family households (7.9%) and 6 of the single-parent households (8.2%) are living below the poverty level. Within the married-couple family households, those with no children have the highest poverty rate, with 19 households (15.2%) falling below the poverty line. Among the single-parent households, those with 1 or 2 children have the highest poverty rate, with 6 household (14.3%) living below poverty.
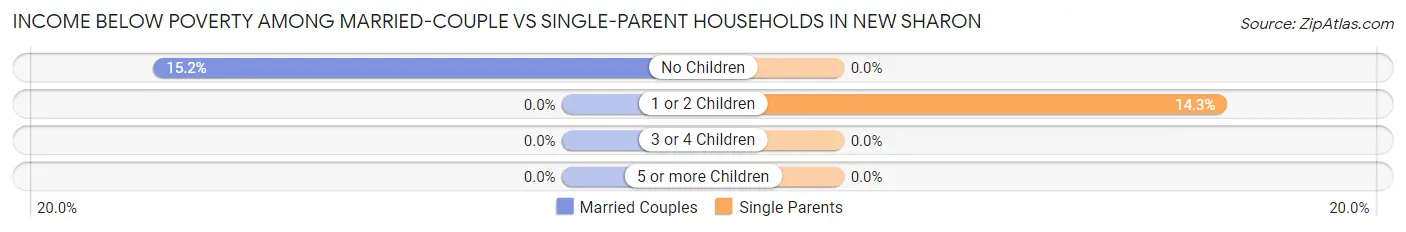
| Children | Married-Couple Families | Single-Parent Households |
| No Children | 19 (15.2%) | 0 (0.0%) |
| 1 or 2 Children | 0 (0.0%) | 6 (14.3%) |
| 3 or 4 Children | 0 (0.0%) | 0 (0.0%) |
| 5 or more Children | 0 (0.0%) | 0 (0.0%) |
| Total | 19 (7.9%) | 6 (8.2%) |
Race in New Sharon
The most populous races in New Sharon are White / Caucasian (1,138 | 96.2%), and Two or more Races (45 | 3.8%).
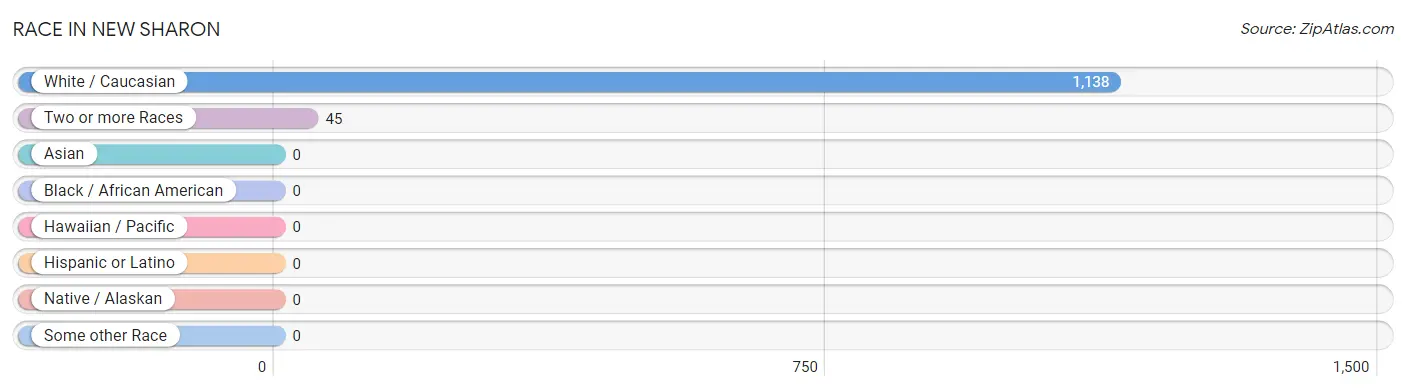
| Race | # Population | % Population |
| Asian | 0 | 0.0% |
| Black / African American | 0 | 0.0% |
| Hawaiian / Pacific | 0 | 0.0% |
| Hispanic or Latino | 0 | 0.0% |
| Native / Alaskan | 0 | 0.0% |
| White / Caucasian | 1,138 | 96.2% |
| Two or more Races | 45 | 3.8% |
| Some other Race | 0 | 0.0% |
| Total | 1,183 | 100.0% |
Ancestry in New Sharon
The most populous ancestries reported in New Sharon are German (248 | 21.0%), Irish (220 | 18.6%), English (128 | 10.8%), Dutch (120 | 10.1%), and Norwegian (59 | 5.0%), together accounting for 65.5% of all New Sharon residents.
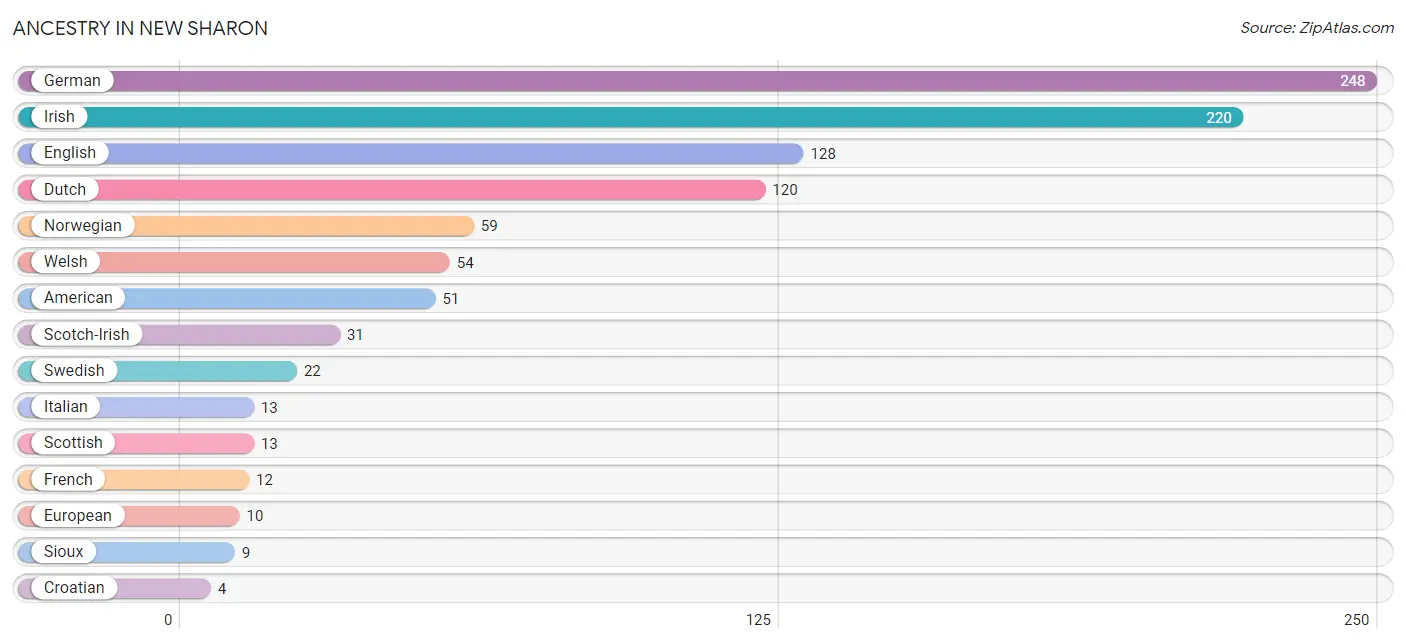
| Ancestry | # Population | % Population |
| American | 51 | 4.3% |
| Apache | 2 | 0.2% |
| Cherokee | 2 | 0.2% |
| Croatian | 4 | 0.3% |
| Danish | 4 | 0.3% |
| Dutch | 120 | 10.1% |
| English | 128 | 10.8% |
| European | 10 | 0.9% |
| French | 12 | 1.0% |
| German | 248 | 21.0% |
| Irish | 220 | 18.6% |
| Italian | 13 | 1.1% |
| Norwegian | 59 | 5.0% |
| Russian | 3 | 0.3% |
| Scandinavian | 3 | 0.3% |
| Scotch-Irish | 31 | 2.6% |
| Scottish | 13 | 1.1% |
| Sioux | 9 | 0.8% |
| Swedish | 22 | 1.9% |
| Swiss | 1 | 0.1% |
| Welsh | 54 | 4.6% | View All 21 Rows |
Immigrants in New Sharon

| Immigration Origin | # Population | % Population | View All 0 Rows |
Sex and Age in New Sharon
Sex and Age in New Sharon
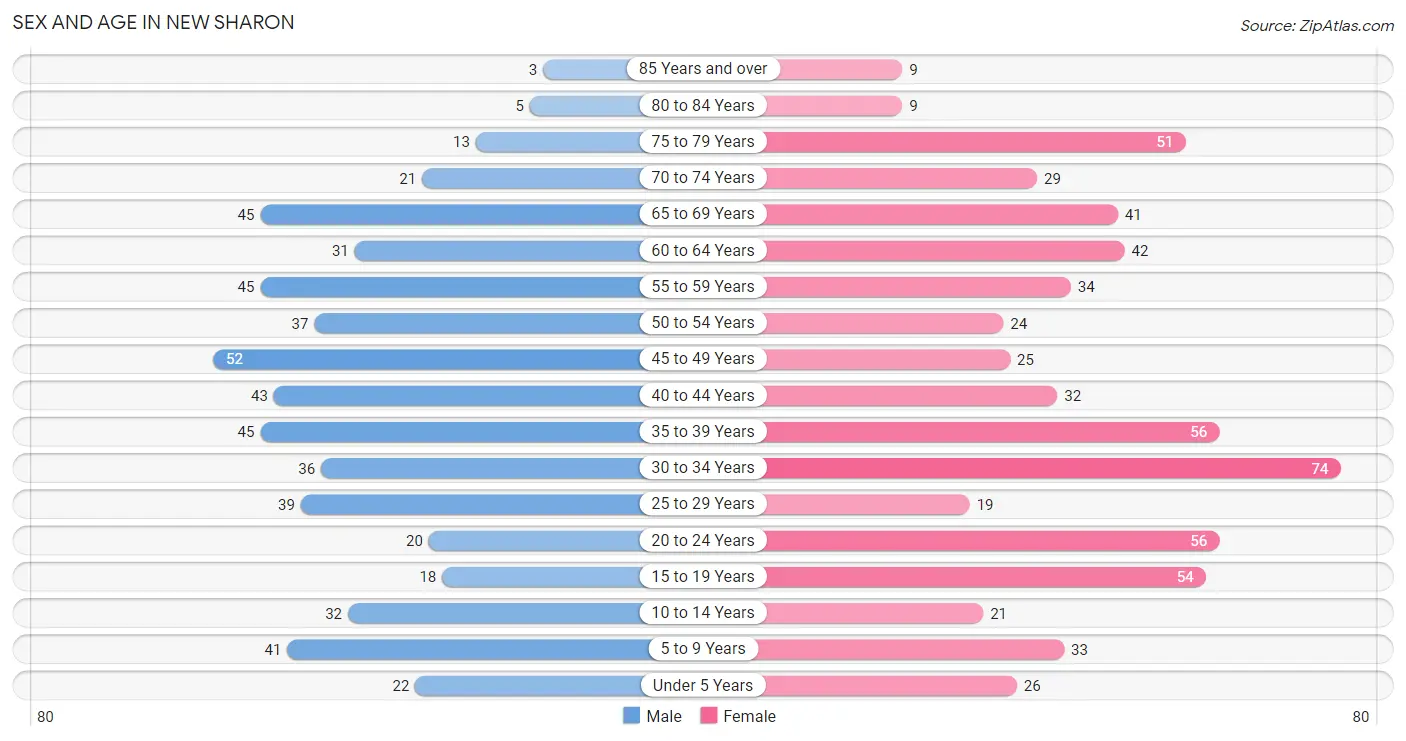
The most populous age groups in New Sharon are 45 to 49 Years (52 | 9.5%) for men and 30 to 34 Years (74 | 11.7%) for women.
| Age Bracket | Male | Female |
| Under 5 Years | 22 (4.0%) | 26 (4.1%) |
| 5 to 9 Years | 41 (7.5%) | 33 (5.2%) |
| 10 to 14 Years | 32 (5.8%) | 21 (3.3%) |
| 15 to 19 Years | 18 (3.3%) | 54 (8.5%) |
| 20 to 24 Years | 20 (3.6%) | 56 (8.8%) |
| 25 to 29 Years | 39 (7.1%) | 19 (3.0%) |
| 30 to 34 Years | 36 (6.6%) | 74 (11.7%) |
| 35 to 39 Years | 45 (8.2%) | 56 (8.8%) |
| 40 to 44 Years | 43 (7.9%) | 32 (5.0%) |
| 45 to 49 Years | 52 (9.5%) | 25 (3.9%) |
| 50 to 54 Years | 37 (6.8%) | 24 (3.8%) |
| 55 to 59 Years | 45 (8.2%) | 34 (5.3%) |
| 60 to 64 Years | 31 (5.7%) | 42 (6.6%) |
| 65 to 69 Years | 45 (8.2%) | 41 (6.5%) |
| 70 to 74 Years | 21 (3.8%) | 29 (4.6%) |
| 75 to 79 Years | 13 (2.4%) | 51 (8.0%) |
| 80 to 84 Years | 5 (0.9%) | 9 (1.4%) |
| 85 Years and over | 3 (0.5%) | 9 (1.4%) |
| Total | 548 (100.0%) | 635 (100.0%) |
Families and Households in New Sharon
Median Family Size in New Sharon
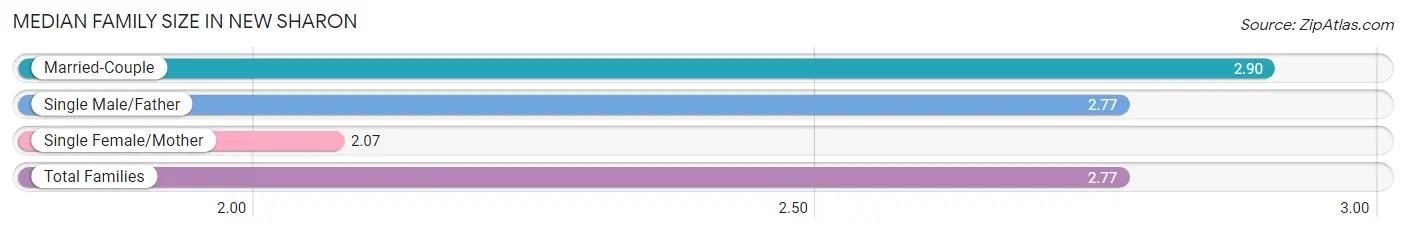
The median family size in New Sharon is 2.77 persons per family, with married-couple families (240 | 76.7%) accounting for the largest median family size of 2.9 persons per family. On the other hand, single female/mother families (42 | 13.4%) represent the smallest median family size with 2.07 persons per family.
| Family Type | # Families | Family Size |
| Married-Couple | 240 (76.7%) | 2.90 |
| Single Male/Father | 31 (9.9%) | 2.77 |
| Single Female/Mother | 42 (13.4%) | 2.07 |
| Total Families | 313 (100.0%) | 2.77 |
Median Household Size in New Sharon
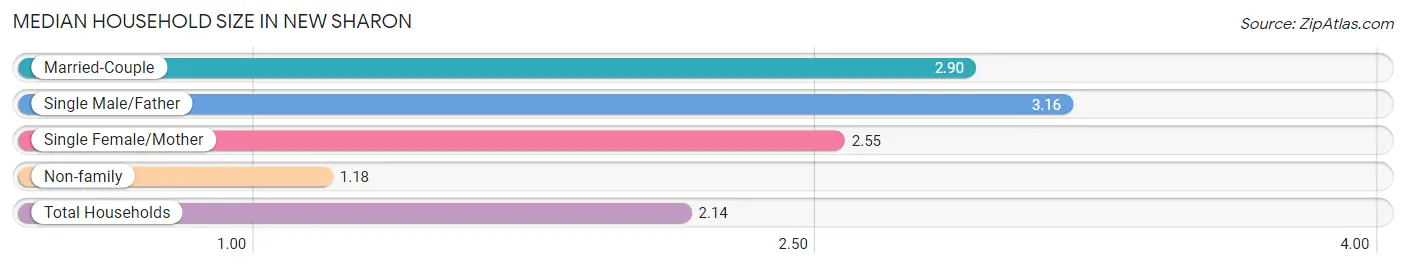
The median household size in New Sharon is 2.14 persons per household, with single male/father households (31 | 5.6%) accounting for the largest median household size of 3.16 persons per household. non-family households (240 | 43.4%) represent the smallest median household size with 1.18 persons per household.
| Household Type | # Households | Household Size |
| Married-Couple | 240 (43.4%) | 2.90 |
| Single Male/Father | 31 (5.6%) | 3.16 |
| Single Female/Mother | 42 (7.6%) | 2.55 |
| Non-family | 240 (43.4%) | 1.18 |
| Total Households | 553 (100.0%) | 2.14 |
Household Size by Marriage Status in New Sharon
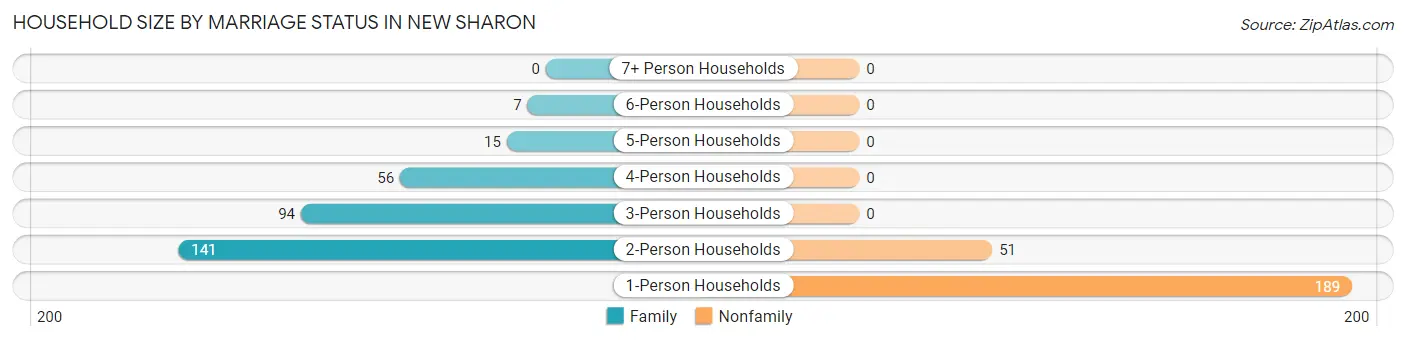
Out of a total of 553 households in New Sharon, 313 (56.6%) are family households, while 240 (43.4%) are nonfamily households. The most numerous type of family households are 2-person households, comprising 141, and the most common type of nonfamily households are 1-person households, comprising 189.
| Household Size | Family Households | Nonfamily Households |
| 1-Person Households | - | 189 (34.2%) |
| 2-Person Households | 141 (25.5%) | 51 (9.2%) |
| 3-Person Households | 94 (17.0%) | 0 (0.0%) |
| 4-Person Households | 56 (10.1%) | 0 (0.0%) |
| 5-Person Households | 15 (2.7%) | 0 (0.0%) |
| 6-Person Households | 7 (1.3%) | 0 (0.0%) |
| 7+ Person Households | 0 (0.0%) | 0 (0.0%) |
| Total | 313 (56.6%) | 240 (43.4%) |
Female Fertility in New Sharon
Fertility by Age in New Sharon
Average fertility rate in New Sharon is 25.0 births per 1,000 women. Women in the age bracket of 20 to 34 years have the highest fertility rate with 54.0 births per 1,000 women. Women in the age bracket of 20 to 34 years acount for 100.0% of all women with births.
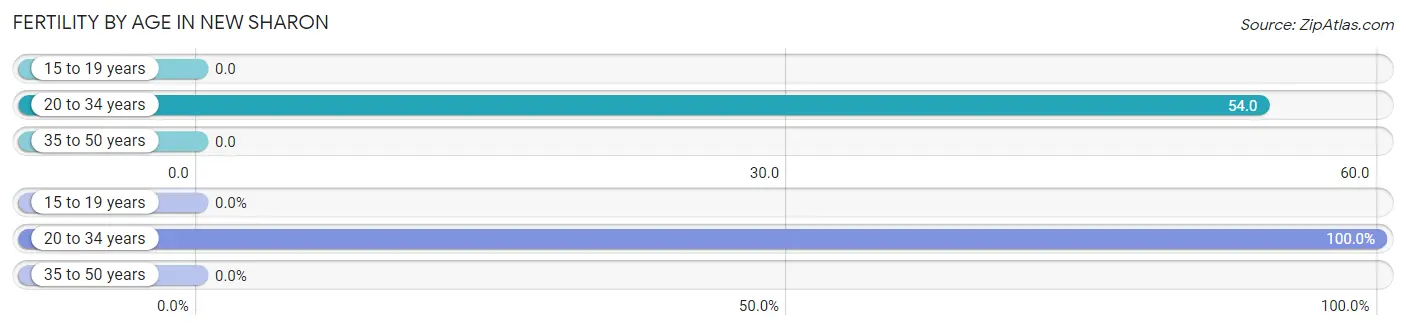
| Age Bracket | Women with Births | Births / 1,000 Women |
| 15 to 19 years | 0 (0.0%) | 0.0 |
| 20 to 34 years | 8 (100.0%) | 54.0 |
| 35 to 50 years | 0 (0.0%) | 0.0 |
| Total | 8 (100.0%) | 25.0 |
Fertility by Age by Marriage Status in New Sharon
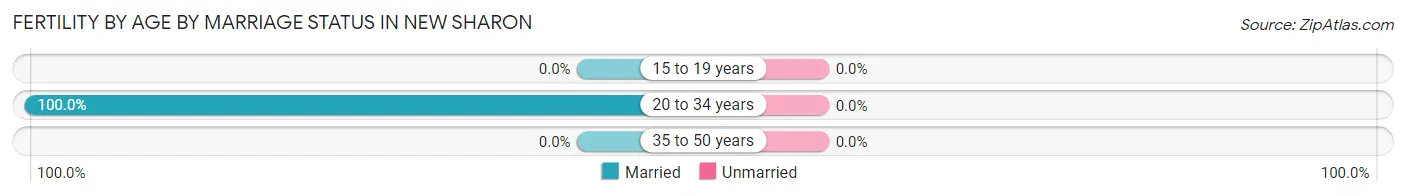
| Age Bracket | Married | Unmarried |
| 15 to 19 years | 0 (0.0%) | 0 (0.0%) |
| 20 to 34 years | 8 (100.0%) | 0 (0.0%) |
| 35 to 50 years | 0 (0.0%) | 0 (0.0%) |
| Total | 8 (100.0%) | 0 (0.0%) |
Fertility by Education in New Sharon
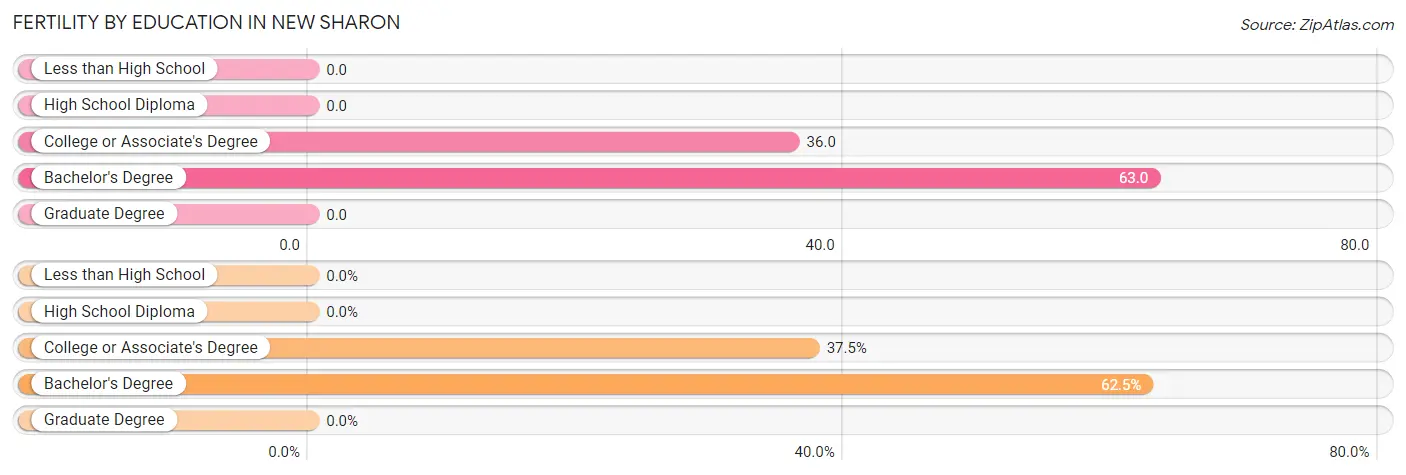
| Educational Attainment | Women with Births | Births / 1,000 Women |
| Less than High School | 0 (0.0%) | 0.0 |
| High School Diploma | 0 (0.0%) | 0.0 |
| College or Associate's Degree | 3 (37.5%) | 36.0 |
| Bachelor's Degree | 5 (62.5%) | 63.0 |
| Graduate Degree | 0 (0.0%) | 0.0 |
| Total | 8 (100.0%) | 25.0 |
Fertility by Education by Marriage Status in New Sharon
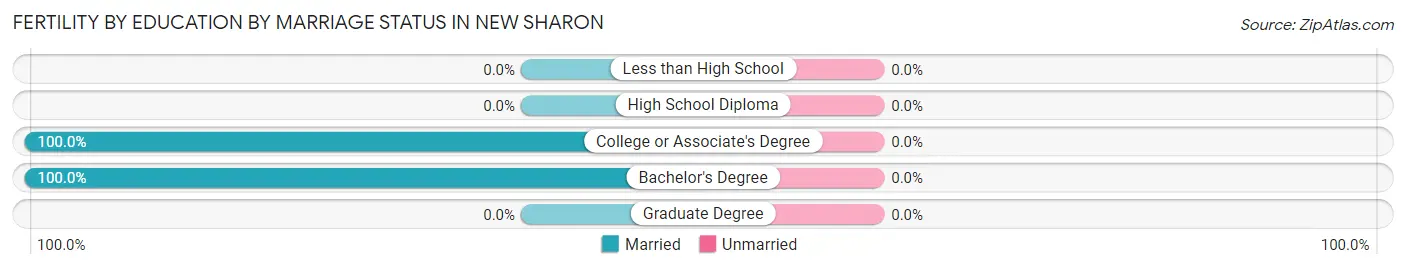
| Educational Attainment | Married | Unmarried |
| Less than High School | 0 (0.0%) | 0 (0.0%) |
| High School Diploma | 0 (0.0%) | 0 (0.0%) |
| College or Associate's Degree | 3 (100.0%) | 0 (0.0%) |
| Bachelor's Degree | 5 (100.0%) | 0 (0.0%) |
| Graduate Degree | 0 (0.0%) | 0 (0.0%) |
| Total | 8 (100.0%) | 0 (0.0%) |
Employment Characteristics in New Sharon
Employment by Class of Employer in New Sharon
Among the 629 employed individuals in New Sharon, private company employees (414 | 65.8%), not-for-profit organizations (105 | 16.7%), and local government employees (57 | 9.1%) make up the most common classes of employment.
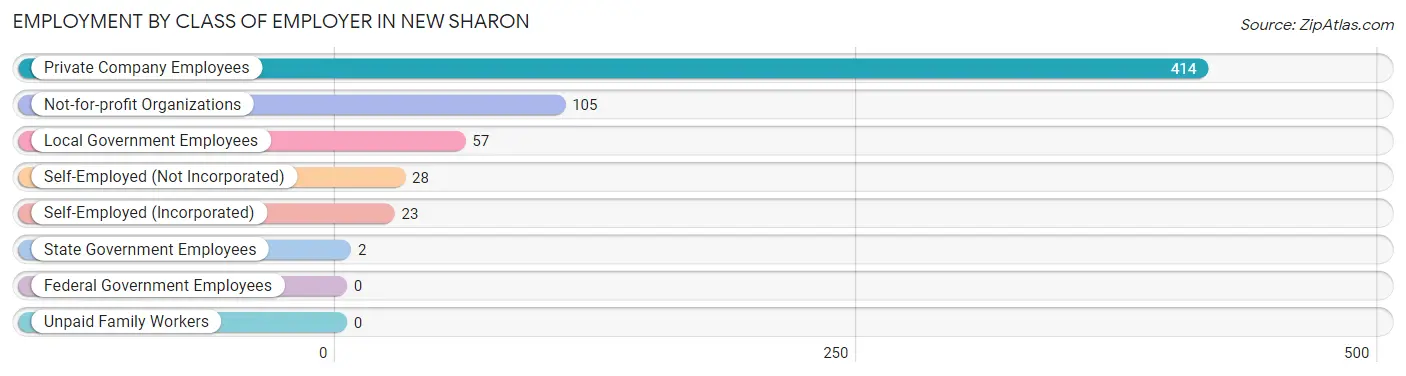
| Employer Class | # Employees | % Employees |
| Private Company Employees | 414 | 65.8% |
| Self-Employed (Incorporated) | 23 | 3.7% |
| Self-Employed (Not Incorporated) | 28 | 4.4% |
| Not-for-profit Organizations | 105 | 16.7% |
| Local Government Employees | 57 | 9.1% |
| State Government Employees | 2 | 0.3% |
| Federal Government Employees | 0 | 0.0% |
| Unpaid Family Workers | 0 | 0.0% |
| Total | 629 | 100.0% |
Employment Status by Age in New Sharon
According to the labor force statistics for New Sharon, out of the total population over 16 years of age (989), 66.0% or 653 individuals are in the labor force, with 2.6% or 17 of them unemployed. The age group with the highest labor force participation rate is 35 to 44 years, with 94.9% or 167 individuals in the labor force. Within the labor force, the 55 to 59 years age range has the highest percentage of unemployed individuals, with 7.5% or 5 of them being unemployed.
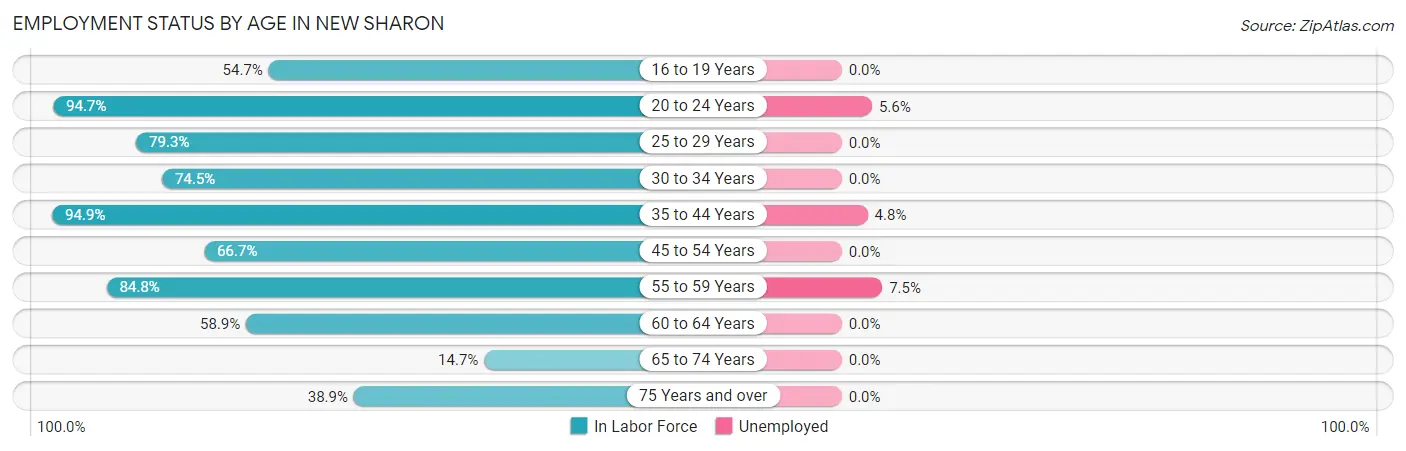
| Age Bracket | In Labor Force | Unemployed |
| 16 to 19 Years | 29 (54.7%) | 0 (0.0%) |
| 20 to 24 Years | 72 (94.7%) | 4 (5.6%) |
| 25 to 29 Years | 46 (79.3%) | 0 (0.0%) |
| 30 to 34 Years | 82 (74.5%) | 0 (0.0%) |
| 35 to 44 Years | 167 (94.9%) | 8 (4.8%) |
| 45 to 54 Years | 92 (66.7%) | 0 (0.0%) |
| 55 to 59 Years | 67 (84.8%) | 5 (7.5%) |
| 60 to 64 Years | 43 (58.9%) | 0 (0.0%) |
| 65 to 74 Years | 20 (14.7%) | 0 (0.0%) |
| 75 Years and over | 35 (38.9%) | 0 (0.0%) |
| Total | 653 (66.0%) | 17 (2.6%) |
Employment Status by Educational Attainment in New Sharon
According to labor force statistics for New Sharon, 78.4% of individuals (497) out of the total population between 25 and 64 years of age (634) are in the labor force, with 2.6% or 13 of them being unemployed. The group with the highest labor force participation rate are those with the educational attainment of bachelor's degree or higher, with 97.8% or 133 individuals in the labor force. Within the labor force, individuals with bachelor's degree or higher education have the highest percentage of unemployment, with 6.0% or 8 of them being unemployed.
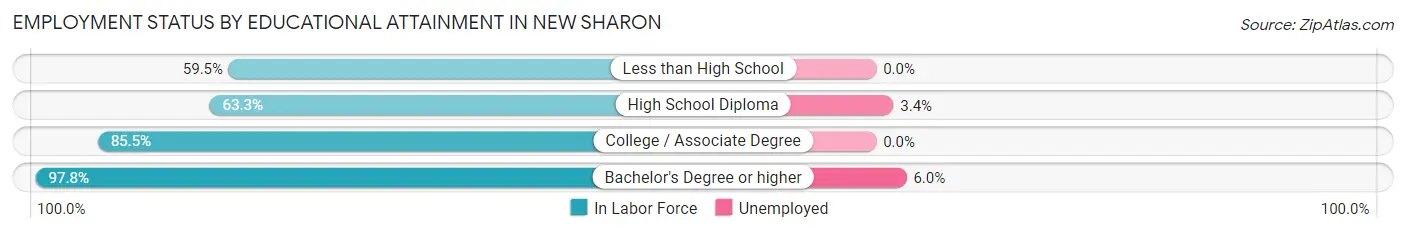
| Educational Attainment | In Labor Force | Unemployed |
| Less than High School | 25 (59.5%) | 0 (0.0%) |
| High School Diploma | 145 (63.3%) | 8 (3.4%) |
| College / Associate Degree | 194 (85.5%) | 0 (0.0%) |
| Bachelor's Degree or higher | 133 (97.8%) | 8 (6.0%) |
| Total | 497 (78.4%) | 16 (2.6%) |
Employment Occupations by Sex in New Sharon
Management, Business, Science and Arts Occupations
The most common Management, Business, Science and Arts occupations in New Sharon are Community & Social Service (104 | 16.4%), Education Instruction & Library (77 | 12.1%), Management (36 | 5.7%), Health Diagnosing & Treating (30 | 4.7%), and Business & Financial (26 | 4.1%).
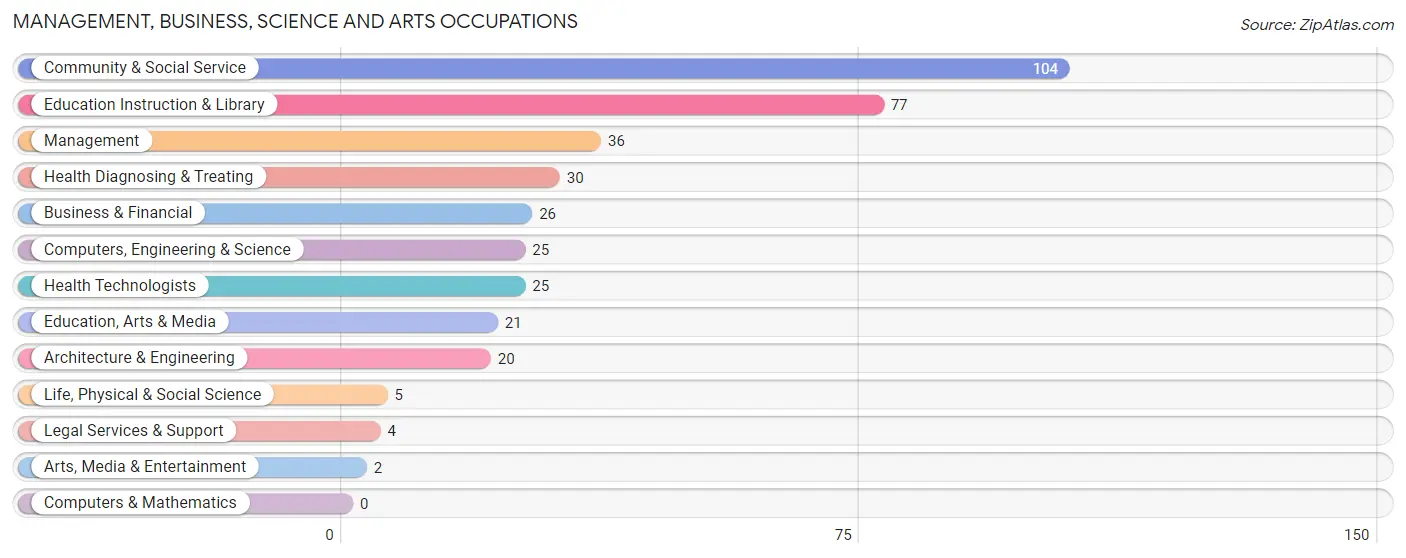
Management, Business, Science and Arts Occupations by Sex
Within the Management, Business, Science and Arts occupations in New Sharon, the most male-oriented occupations are Architecture & Engineering (100.0%), Legal Services & Support (100.0%), and Arts, Media & Entertainment (100.0%), while the most female-oriented occupations are Life, Physical & Social Science (100.0%), Education Instruction & Library (89.6%), and Health Diagnosing & Treating (80.0%).
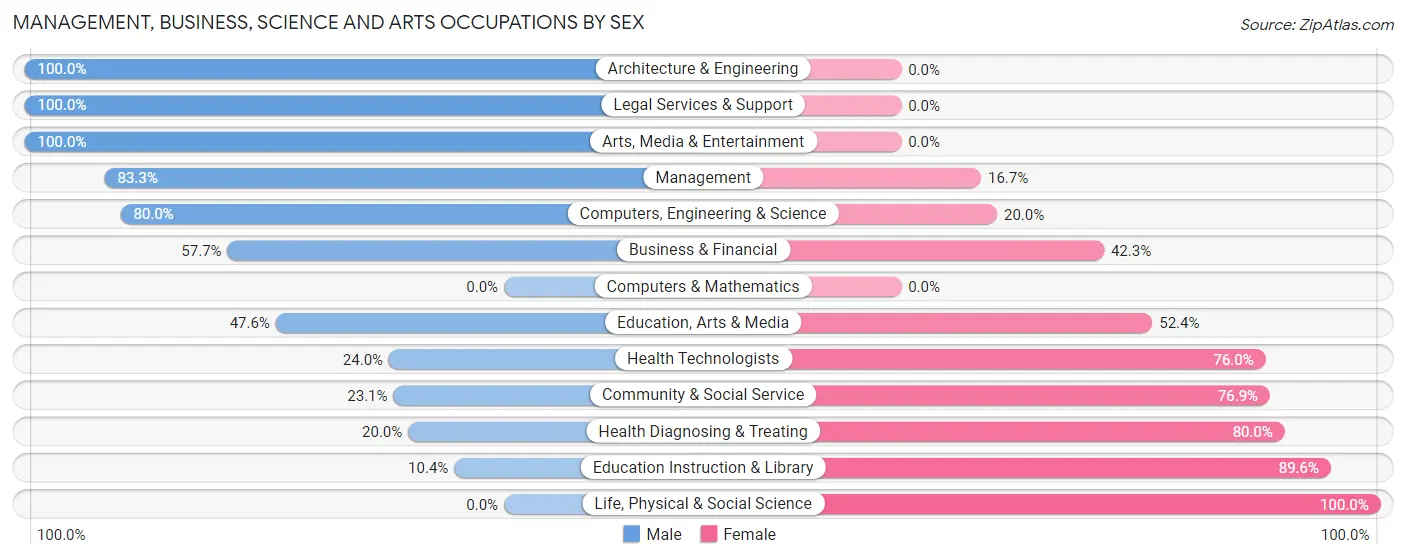
| Occupation | Male | Female |
| Management | 30 (83.3%) | 6 (16.7%) |
| Business & Financial | 15 (57.7%) | 11 (42.3%) |
| Computers, Engineering & Science | 20 (80.0%) | 5 (20.0%) |
| Computers & Mathematics | 0 (0.0%) | 0 (0.0%) |
| Architecture & Engineering | 20 (100.0%) | 0 (0.0%) |
| Life, Physical & Social Science | 0 (0.0%) | 5 (100.0%) |
| Community & Social Service | 24 (23.1%) | 80 (76.9%) |
| Education, Arts & Media | 10 (47.6%) | 11 (52.4%) |
| Legal Services & Support | 4 (100.0%) | 0 (0.0%) |
| Education Instruction & Library | 8 (10.4%) | 69 (89.6%) |
| Arts, Media & Entertainment | 2 (100.0%) | 0 (0.0%) |
| Health Diagnosing & Treating | 6 (20.0%) | 24 (80.0%) |
| Health Technologists | 6 (24.0%) | 19 (76.0%) |
| Total (Category) | 95 (43.0%) | 126 (57.0%) |
| Total (Overall) | 316 (49.7%) | 320 (50.3%) |
Services Occupations
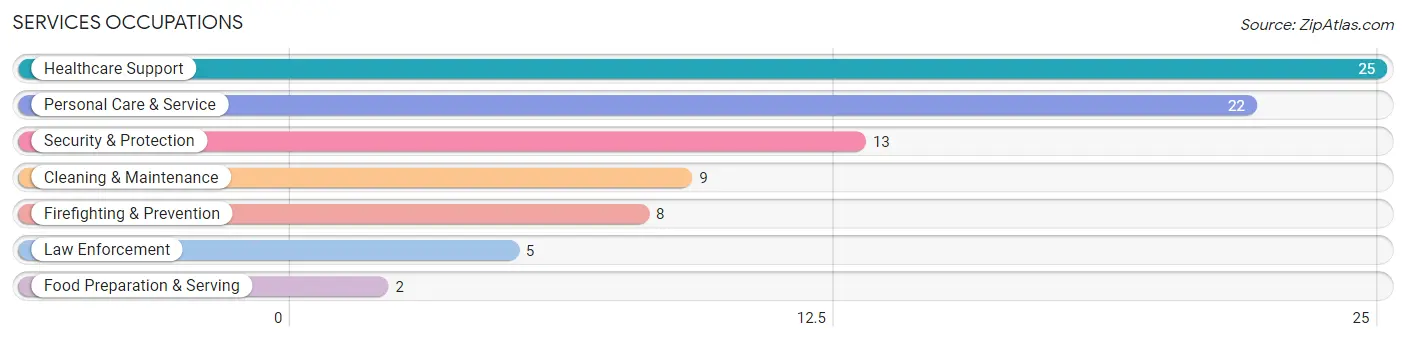
The most common Services occupations in New Sharon are Healthcare Support (25 | 3.9%), Personal Care & Service (22 | 3.5%), Security & Protection (13 | 2.0%), Cleaning & Maintenance (9 | 1.4%), and Firefighting & Prevention (8 | 1.3%).
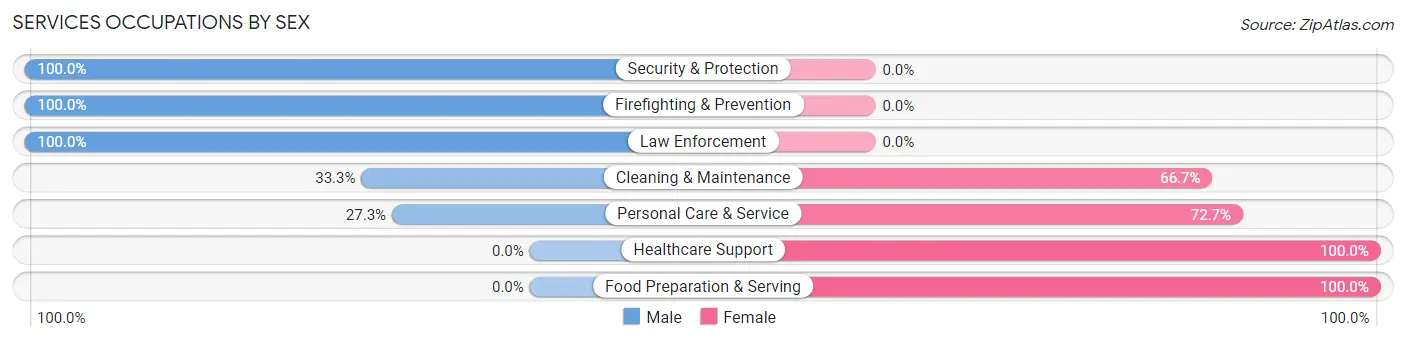
Services Occupations by Sex
Within the Services occupations in New Sharon, the most male-oriented occupations are Security & Protection (100.0%), Firefighting & Prevention (100.0%), and Law Enforcement (100.0%), while the most female-oriented occupations are Healthcare Support (100.0%), Food Preparation & Serving (100.0%), and Personal Care & Service (72.7%).
| Occupation | Male | Female |
| Healthcare Support | 0 (0.0%) | 25 (100.0%) |
| Security & Protection | 13 (100.0%) | 0 (0.0%) |
| Firefighting & Prevention | 8 (100.0%) | 0 (0.0%) |
| Law Enforcement | 5 (100.0%) | 0 (0.0%) |
| Food Preparation & Serving | 0 (0.0%) | 2 (100.0%) |
| Cleaning & Maintenance | 3 (33.3%) | 6 (66.7%) |
| Personal Care & Service | 6 (27.3%) | 16 (72.7%) |
| Total (Category) | 22 (31.0%) | 49 (69.0%) |
| Total (Overall) | 316 (49.7%) | 320 (50.3%) |
Sales and Office Occupations
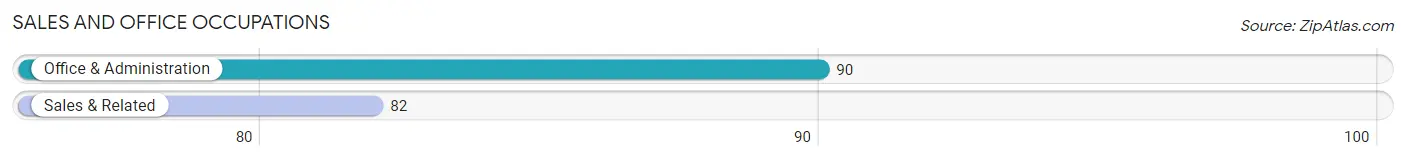
The most common Sales and Office occupations in New Sharon are Office & Administration (90 | 14.1%), and Sales & Related (82 | 12.9%).
Sales and Office Occupations by Sex
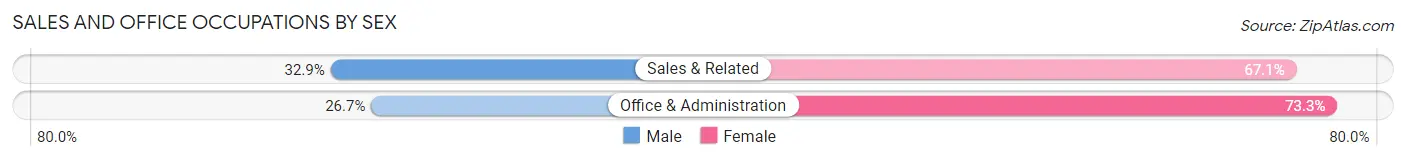
| Occupation | Male | Female |
| Sales & Related | 27 (32.9%) | 55 (67.1%) |
| Office & Administration | 24 (26.7%) | 66 (73.3%) |
| Total (Category) | 51 (29.6%) | 121 (70.4%) |
| Total (Overall) | 316 (49.7%) | 320 (50.3%) |
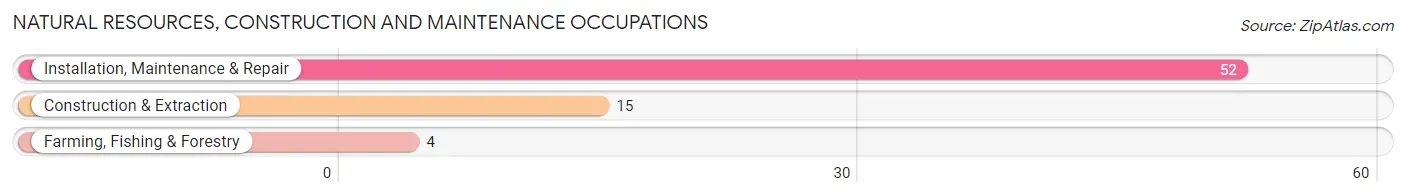
Natural Resources, Construction and Maintenance Occupations
The most common Natural Resources, Construction and Maintenance occupations in New Sharon are Installation, Maintenance & Repair (52 | 8.2%), Construction & Extraction (15 | 2.4%), and Farming, Fishing & Forestry (4 | 0.6%).
Natural Resources, Construction and Maintenance Occupations by Sex
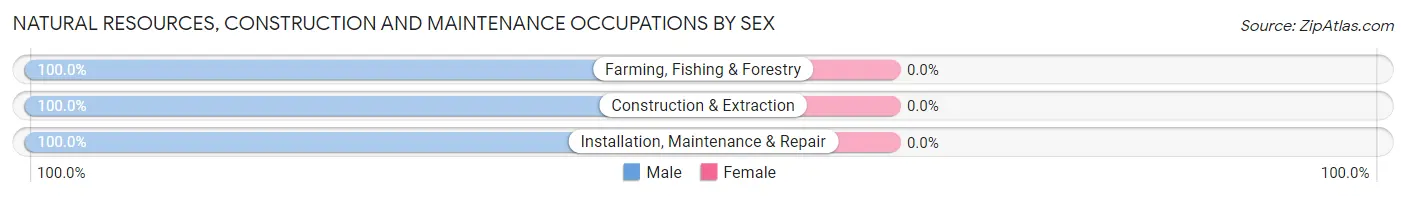
| Occupation | Male | Female |
| Farming, Fishing & Forestry | 4 (100.0%) | 0 (0.0%) |
| Construction & Extraction | 15 (100.0%) | 0 (0.0%) |
| Installation, Maintenance & Repair | 52 (100.0%) | 0 (0.0%) |
| Total (Category) | 71 (100.0%) | 0 (0.0%) |
| Total (Overall) | 316 (49.7%) | 320 (50.3%) |
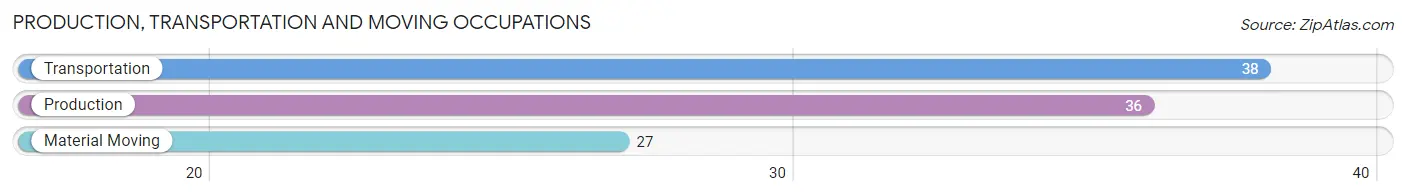
Production, Transportation and Moving Occupations
The most common Production, Transportation and Moving occupations in New Sharon are Transportation (38 | 6.0%), Production (36 | 5.7%), and Material Moving (27 | 4.3%).
Production, Transportation and Moving Occupations by Sex
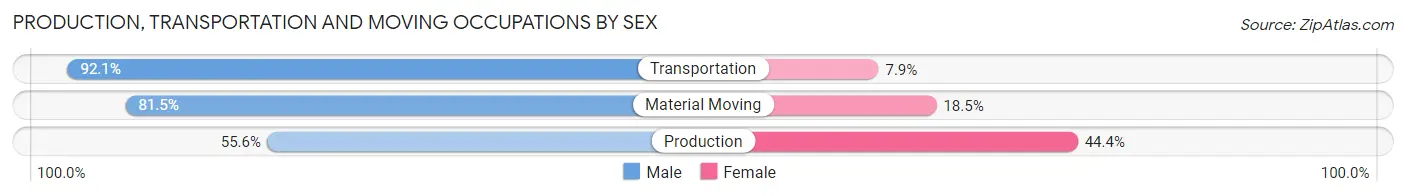
| Occupation | Male | Female |
| Production | 20 (55.6%) | 16 (44.4%) |
| Transportation | 35 (92.1%) | 3 (7.9%) |
| Material Moving | 22 (81.5%) | 5 (18.5%) |
| Total (Category) | 77 (76.2%) | 24 (23.8%) |
| Total (Overall) | 316 (49.7%) | 320 (50.3%) |
Employment Industries by Sex in New Sharon
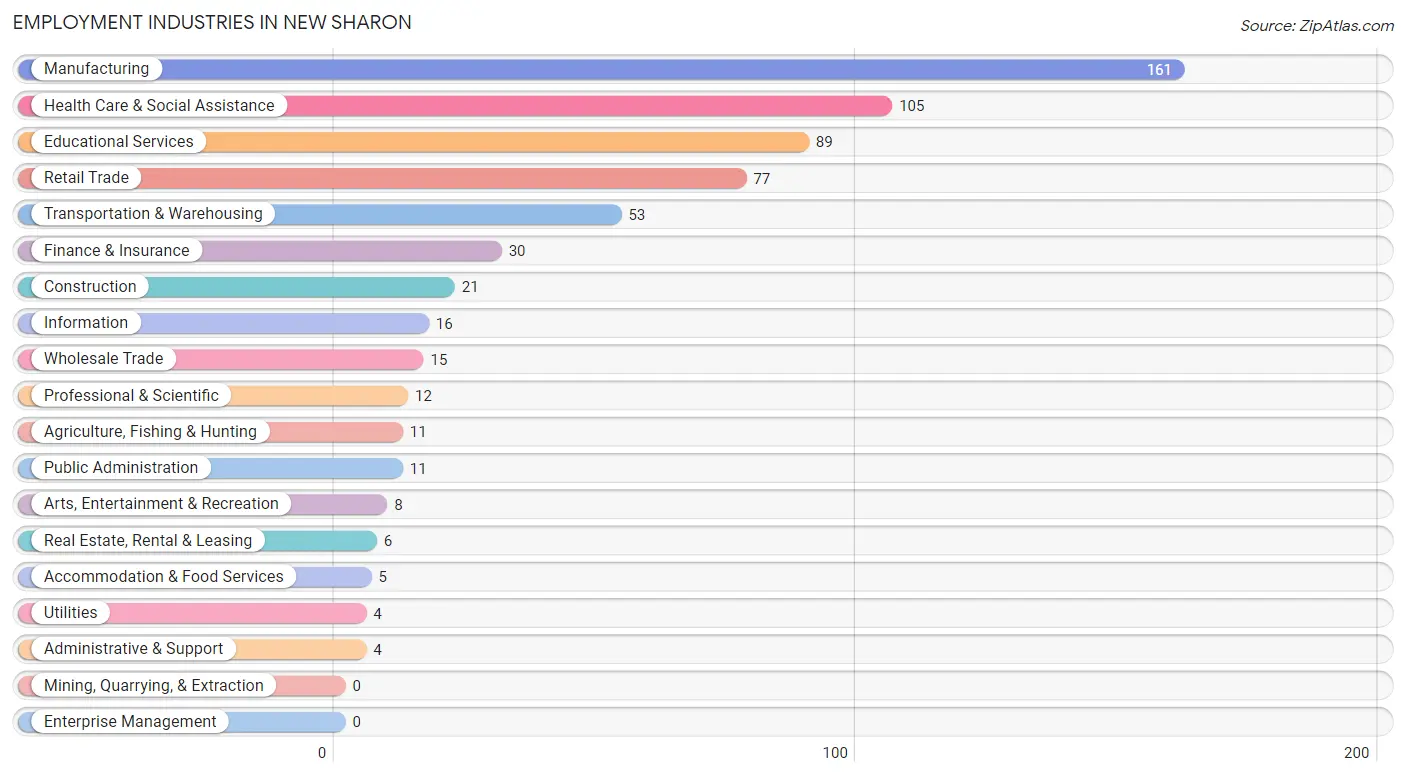
Employment Industries in New Sharon
The major employment industries in New Sharon include Manufacturing (161 | 25.3%), Health Care & Social Assistance (105 | 16.5%), Educational Services (89 | 14.0%), Retail Trade (77 | 12.1%), and Transportation & Warehousing (53 | 8.3%).
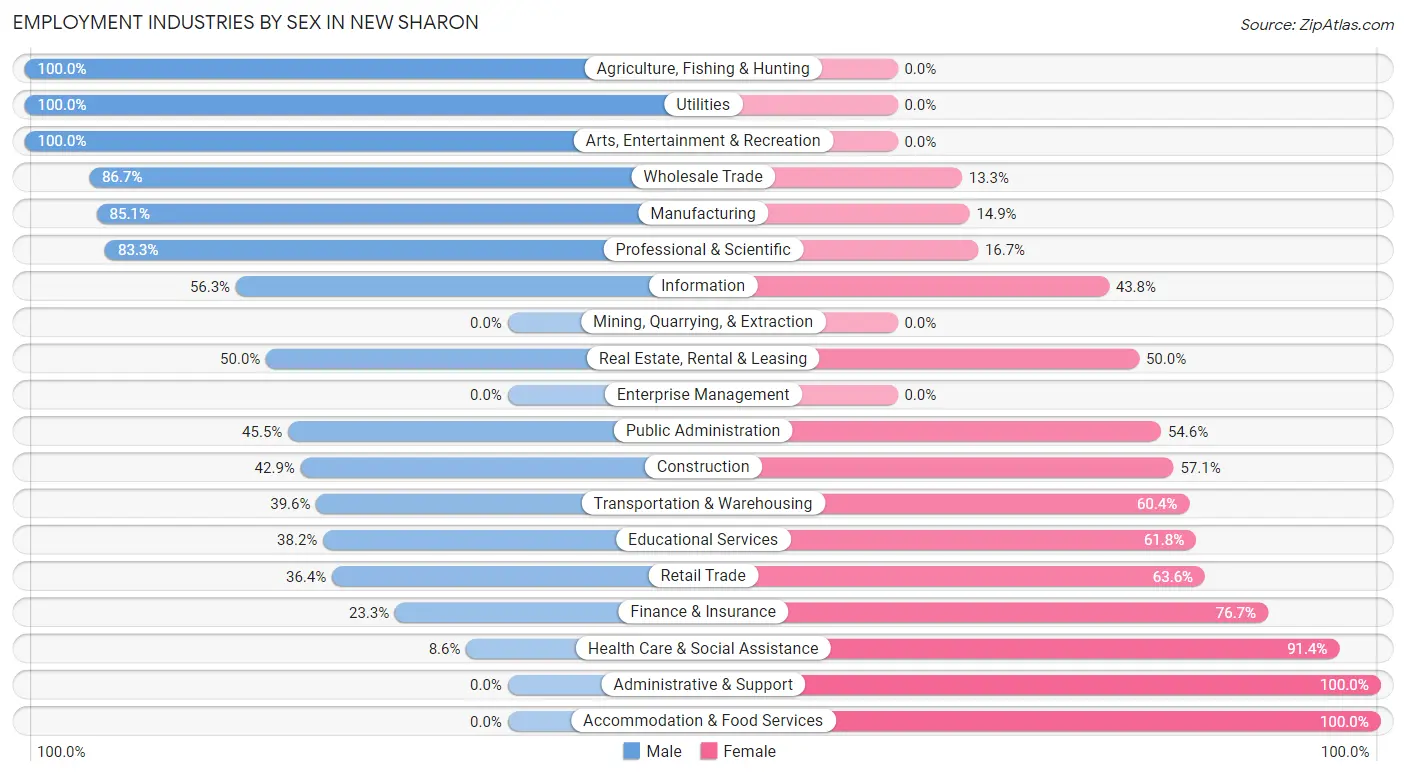
Employment Industries by Sex in New Sharon
The New Sharon industries that see more men than women are Agriculture, Fishing & Hunting (100.0%), Utilities (100.0%), and Arts, Entertainment & Recreation (100.0%), whereas the industries that tend to have a higher number of women are Administrative & Support (100.0%), Accommodation & Food Services (100.0%), and Health Care & Social Assistance (91.4%).
| Industry | Male | Female |
| Agriculture, Fishing & Hunting | 11 (100.0%) | 0 (0.0%) |
| Mining, Quarrying, & Extraction | 0 (0.0%) | 0 (0.0%) |
| Construction | 9 (42.9%) | 12 (57.1%) |
| Manufacturing | 137 (85.1%) | 24 (14.9%) |
| Wholesale Trade | 13 (86.7%) | 2 (13.3%) |
| Retail Trade | 28 (36.4%) | 49 (63.6%) |
| Transportation & Warehousing | 21 (39.6%) | 32 (60.4%) |
| Utilities | 4 (100.0%) | 0 (0.0%) |
| Information | 9 (56.2%) | 7 (43.8%) |
| Finance & Insurance | 7 (23.3%) | 23 (76.7%) |
| Real Estate, Rental & Leasing | 3 (50.0%) | 3 (50.0%) |
| Professional & Scientific | 10 (83.3%) | 2 (16.7%) |
| Enterprise Management | 0 (0.0%) | 0 (0.0%) |
| Administrative & Support | 0 (0.0%) | 4 (100.0%) |
| Educational Services | 34 (38.2%) | 55 (61.8%) |
| Health Care & Social Assistance | 9 (8.6%) | 96 (91.4%) |
| Arts, Entertainment & Recreation | 8 (100.0%) | 0 (0.0%) |
| Accommodation & Food Services | 0 (0.0%) | 5 (100.0%) |
| Public Administration | 5 (45.5%) | 6 (54.5%) |
| Total | 316 (49.7%) | 320 (50.3%) |
Education in New Sharon
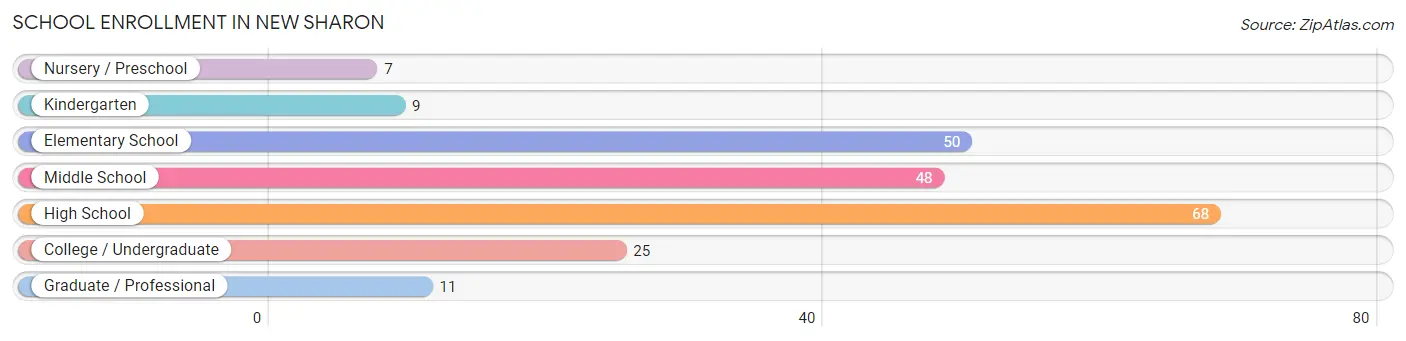
School Enrollment in New Sharon
The most common levels of schooling among the 218 students in New Sharon are high school (68 | 31.2%), elementary school (50 | 22.9%), and middle school (48 | 22.0%).
| School Level | # Students | % Students |
| Nursery / Preschool | 7 | 3.2% |
| Kindergarten | 9 | 4.1% |
| Elementary School | 50 | 22.9% |
| Middle School | 48 | 22.0% |
| High School | 68 | 31.2% |
| College / Undergraduate | 25 | 11.5% |
| Graduate / Professional | 11 | 5.1% |
| Total | 218 | 100.0% |
School Enrollment by Age by Funding Source in New Sharon
Out of a total of 218 students who are enrolled in schools in New Sharon, 22 (10.1%) attend a private institution, while the remaining 196 (89.9%) are enrolled in public schools. The age group of 20 to 24 year olds has the highest likelihood of being enrolled in private schools, with 6 (40.0% in the age bracket) enrolled. Conversely, the age group of 18 to 19 year olds has the lowest likelihood of being enrolled in a private school, with 17 (100.0% in the age bracket) attending a public institution.
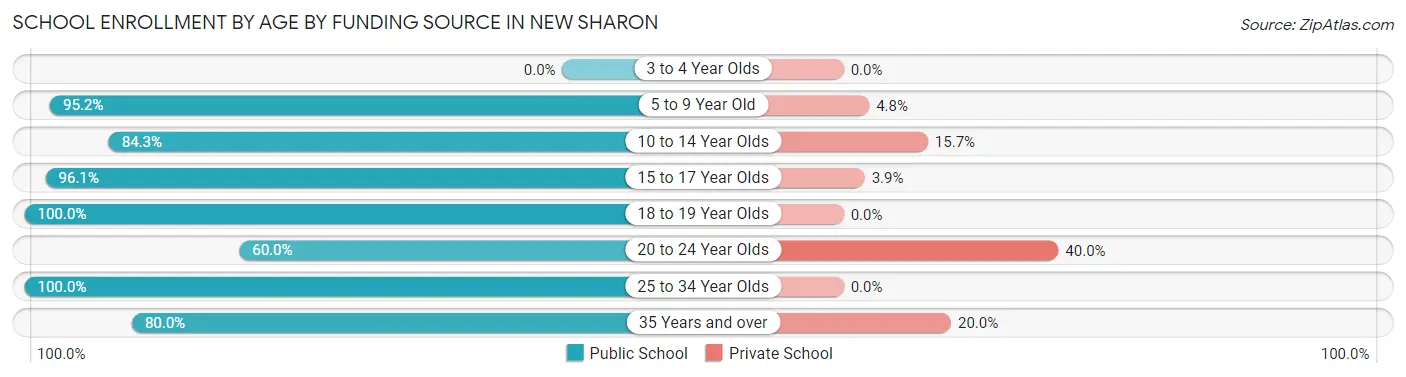
| Age Bracket | Public School | Private School |
| 3 to 4 Year Olds | 0 (0.0%) | 0 (0.0%) |
| 5 to 9 Year Old | 60 (95.2%) | 3 (4.8%) |
| 10 to 14 Year Olds | 43 (84.3%) | 8 (15.7%) |
| 15 to 17 Year Olds | 49 (96.1%) | 2 (3.9%) |
| 18 to 19 Year Olds | 17 (100.0%) | 0 (0.0%) |
| 20 to 24 Year Olds | 9 (60.0%) | 6 (40.0%) |
| 25 to 34 Year Olds | 6 (100.0%) | 0 (0.0%) |
| 35 Years and over | 12 (80.0%) | 3 (20.0%) |
| Total | 196 (89.9%) | 22 (10.1%) |
Educational Attainment by Field of Study in New Sharon
Education (53 | 28.8%), business (37 | 20.1%), arts & humanities (19 | 10.3%), psychology (13 | 7.1%), and social sciences (12 | 6.5%) are the most common fields of study among 184 individuals in New Sharon who have obtained a bachelor's degree or higher.
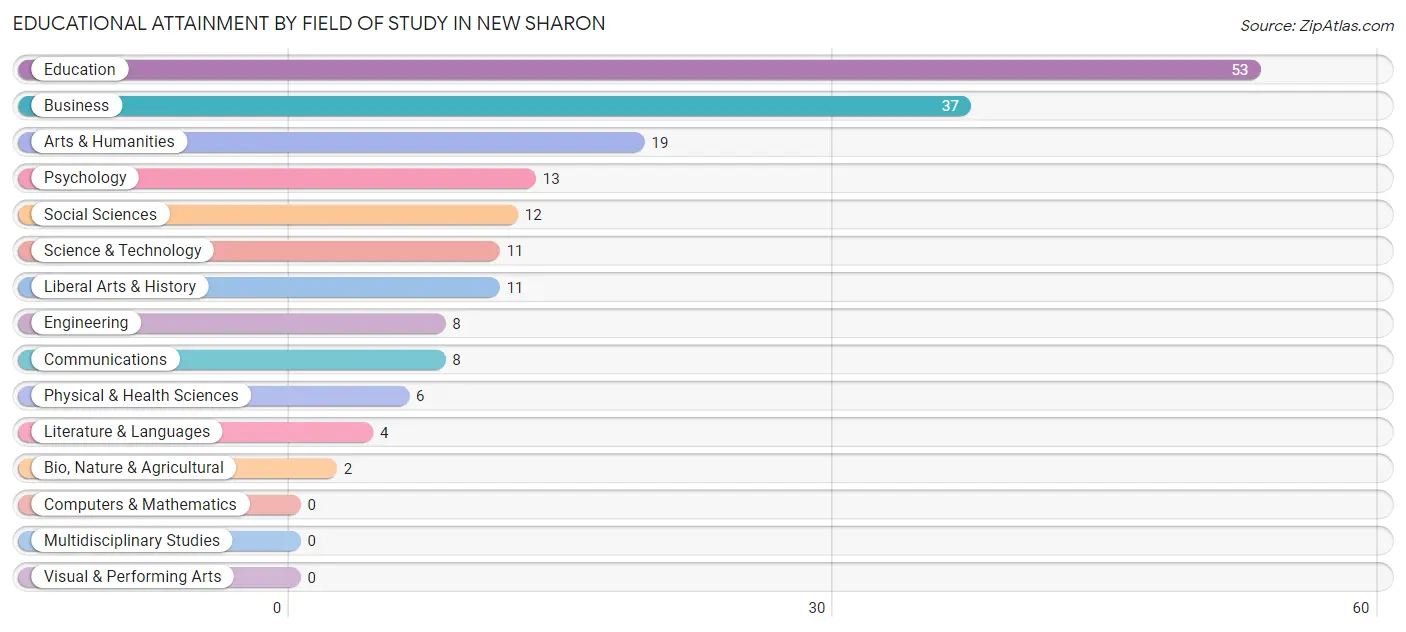
| Field of Study | # Graduates | % Graduates |
| Computers & Mathematics | 0 | 0.0% |
| Bio, Nature & Agricultural | 2 | 1.1% |
| Physical & Health Sciences | 6 | 3.3% |
| Psychology | 13 | 7.1% |
| Social Sciences | 12 | 6.5% |
| Engineering | 8 | 4.3% |
| Multidisciplinary Studies | 0 | 0.0% |
| Science & Technology | 11 | 6.0% |
| Business | 37 | 20.1% |
| Education | 53 | 28.8% |
| Literature & Languages | 4 | 2.2% |
| Liberal Arts & History | 11 | 6.0% |
| Visual & Performing Arts | 0 | 0.0% |
| Communications | 8 | 4.3% |
| Arts & Humanities | 19 | 10.3% |
| Total | 184 | 100.0% |
Transportation & Commute in New Sharon
Vehicle Availability by Sex in New Sharon
The most prevalent vehicle ownership categories in New Sharon are males with 3 vehicles (121, accounting for 38.3%) and females with 3 vehicles (86, making up 38.7%).
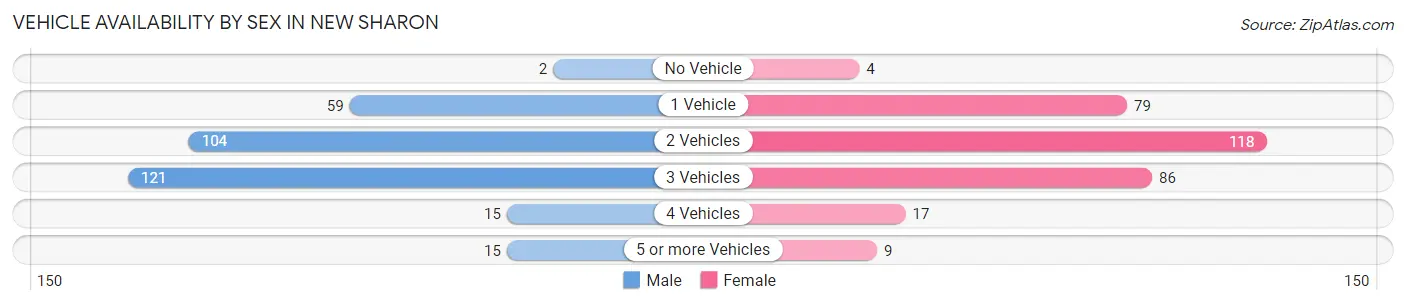
| Vehicles Available | Male | Female |
| No Vehicle | 2 (0.6%) | 4 (1.3%) |
| 1 Vehicle | 59 (18.7%) | 79 (25.2%) |
| 2 Vehicles | 104 (32.9%) | 118 (37.7%) |
| 3 Vehicles | 121 (38.3%) | 86 (27.5%) |
| 4 Vehicles | 15 (4.8%) | 17 (5.4%) |
| 5 or more Vehicles | 15 (4.8%) | 9 (2.9%) |
| Total | 316 (100.0%) | 313 (100.0%) |
Commute Time in New Sharon
The most frequently occuring commute durations in New Sharon are 20 to 24 minutes (121 commuters, 21.3%), 5 to 9 minutes (101 commuters, 17.7%), and less than 5 minutes (91 commuters, 16.0%).
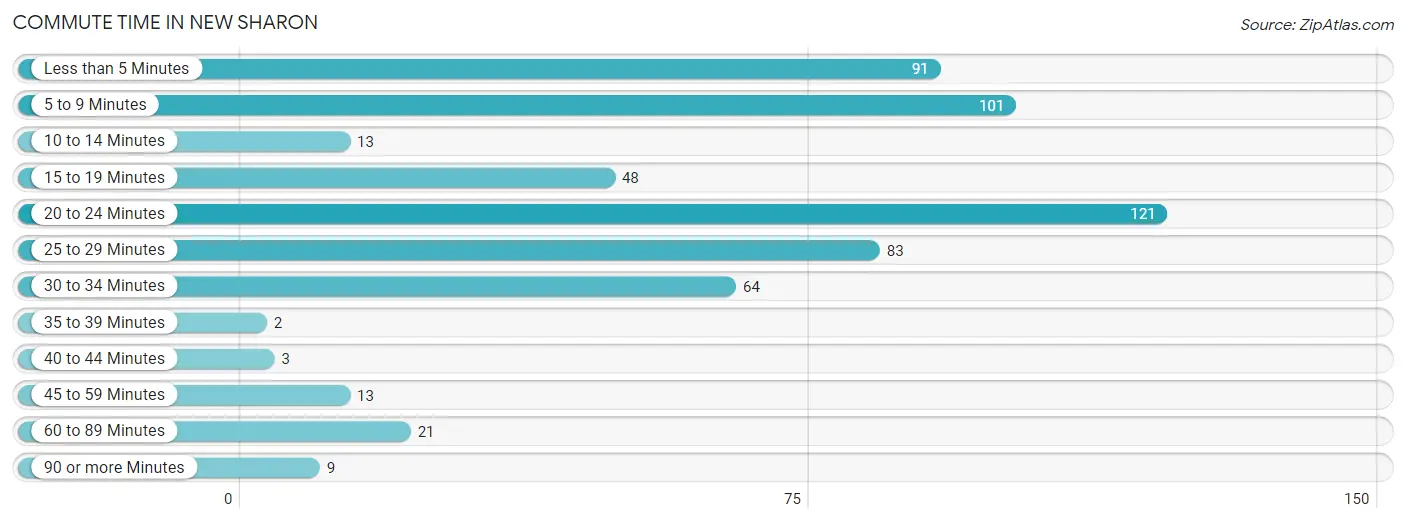
| Commute Time | # Commuters | % Commuters |
| Less than 5 Minutes | 91 | 16.0% |
| 5 to 9 Minutes | 101 | 17.7% |
| 10 to 14 Minutes | 13 | 2.3% |
| 15 to 19 Minutes | 48 | 8.4% |
| 20 to 24 Minutes | 121 | 21.3% |
| 25 to 29 Minutes | 83 | 14.6% |
| 30 to 34 Minutes | 64 | 11.3% |
| 35 to 39 Minutes | 2 | 0.4% |
| 40 to 44 Minutes | 3 | 0.5% |
| 45 to 59 Minutes | 13 | 2.3% |
| 60 to 89 Minutes | 21 | 3.7% |
| 90 or more Minutes | 9 | 1.6% |
Commute Time by Sex in New Sharon
The most common commute times in New Sharon are 20 to 24 minutes (89 commuters, 29.5%) for males and 5 to 9 minutes (63 commuters, 23.6%) for females.
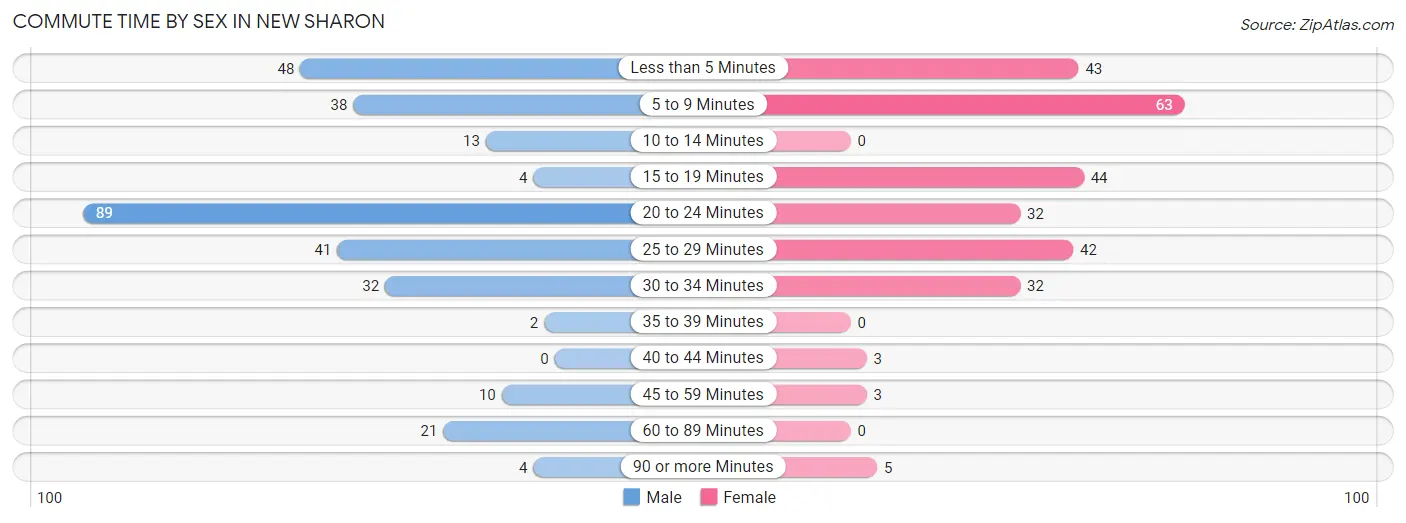
| Commute Time | Male | Female |
| Less than 5 Minutes | 48 (15.9%) | 43 (16.1%) |
| 5 to 9 Minutes | 38 (12.6%) | 63 (23.6%) |
| 10 to 14 Minutes | 13 (4.3%) | 0 (0.0%) |
| 15 to 19 Minutes | 4 (1.3%) | 44 (16.5%) |
| 20 to 24 Minutes | 89 (29.5%) | 32 (12.0%) |
| 25 to 29 Minutes | 41 (13.6%) | 42 (15.7%) |
| 30 to 34 Minutes | 32 (10.6%) | 32 (12.0%) |
| 35 to 39 Minutes | 2 (0.7%) | 0 (0.0%) |
| 40 to 44 Minutes | 0 (0.0%) | 3 (1.1%) |
| 45 to 59 Minutes | 10 (3.3%) | 3 (1.1%) |
| 60 to 89 Minutes | 21 (7.0%) | 0 (0.0%) |
| 90 or more Minutes | 4 (1.3%) | 5 (1.9%) |
Time of Departure to Work by Sex in New Sharon
The most frequent times of departure to work in New Sharon are 7:00 AM to 7:29 AM (77, 25.5%) for males and 7:30 AM to 7:59 AM (60, 22.5%) for females.
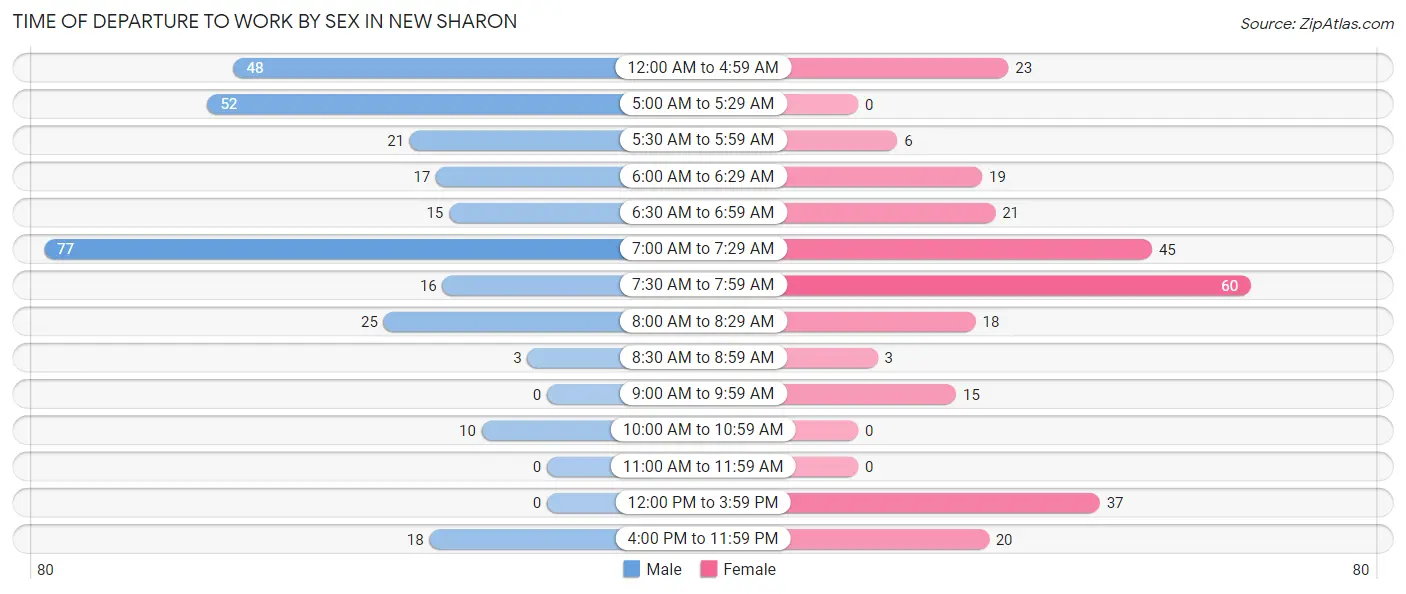
| Time of Departure | Male | Female |
| 12:00 AM to 4:59 AM | 48 (15.9%) | 23 (8.6%) |
| 5:00 AM to 5:29 AM | 52 (17.2%) | 0 (0.0%) |
| 5:30 AM to 5:59 AM | 21 (7.0%) | 6 (2.2%) |
| 6:00 AM to 6:29 AM | 17 (5.6%) | 19 (7.1%) |
| 6:30 AM to 6:59 AM | 15 (5.0%) | 21 (7.9%) |
| 7:00 AM to 7:29 AM | 77 (25.5%) | 45 (16.9%) |
| 7:30 AM to 7:59 AM | 16 (5.3%) | 60 (22.5%) |
| 8:00 AM to 8:29 AM | 25 (8.3%) | 18 (6.7%) |
| 8:30 AM to 8:59 AM | 3 (1.0%) | 3 (1.1%) |
| 9:00 AM to 9:59 AM | 0 (0.0%) | 15 (5.6%) |
| 10:00 AM to 10:59 AM | 10 (3.3%) | 0 (0.0%) |
| 11:00 AM to 11:59 AM | 0 (0.0%) | 0 (0.0%) |
| 12:00 PM to 3:59 PM | 0 (0.0%) | 37 (13.9%) |
| 4:00 PM to 11:59 PM | 18 (6.0%) | 20 (7.5%) |
| Total | 302 (100.0%) | 267 (100.0%) |
Housing Occupancy in New Sharon
Occupancy by Ownership in New Sharon
Of the total 553 dwellings in New Sharon, owner-occupied units account for 455 (82.3%), while renter-occupied units make up 98 (17.7%).
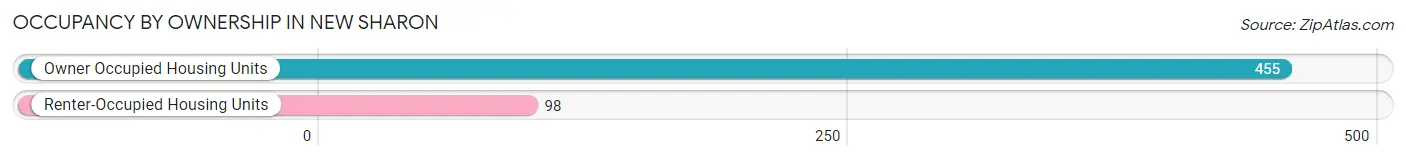
| Occupancy | # Housing Units | % Housing Units |
| Owner Occupied Housing Units | 455 | 82.3% |
| Renter-Occupied Housing Units | 98 | 17.7% |
| Total Occupied Housing Units | 553 | 100.0% |
Occupancy by Household Size in New Sharon
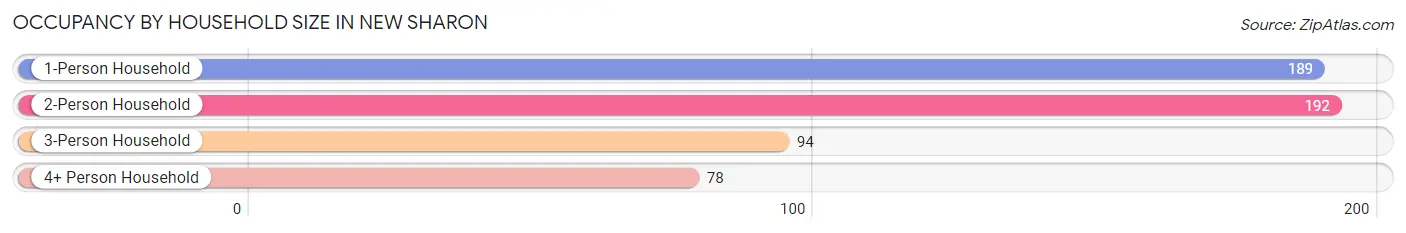
| Household Size | # Housing Units | % Housing Units |
| 1-Person Household | 189 | 34.2% |
| 2-Person Household | 192 | 34.7% |
| 3-Person Household | 94 | 17.0% |
| 4+ Person Household | 78 | 14.1% |
| Total Housing Units | 553 | 100.0% |
Occupancy by Ownership by Household Size in New Sharon
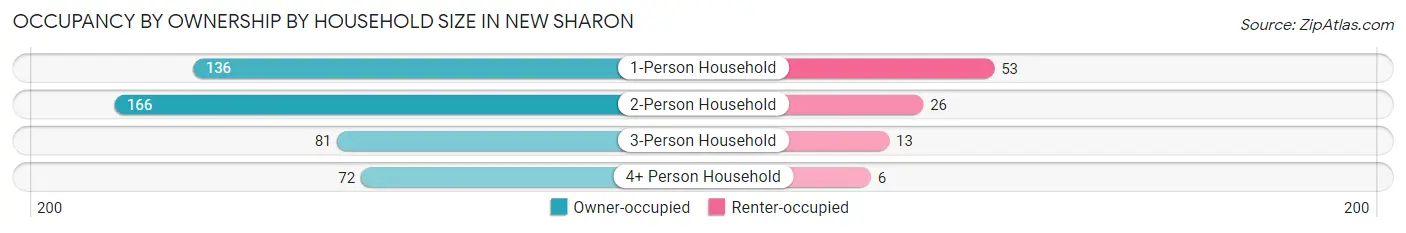
| Household Size | Owner-occupied | Renter-occupied |
| 1-Person Household | 136 (72.0%) | 53 (28.0%) |
| 2-Person Household | 166 (86.5%) | 26 (13.5%) |
| 3-Person Household | 81 (86.2%) | 13 (13.8%) |
| 4+ Person Household | 72 (92.3%) | 6 (7.7%) |
| Total Housing Units | 455 (82.3%) | 98 (17.7%) |
Occupancy by Educational Attainment in New Sharon
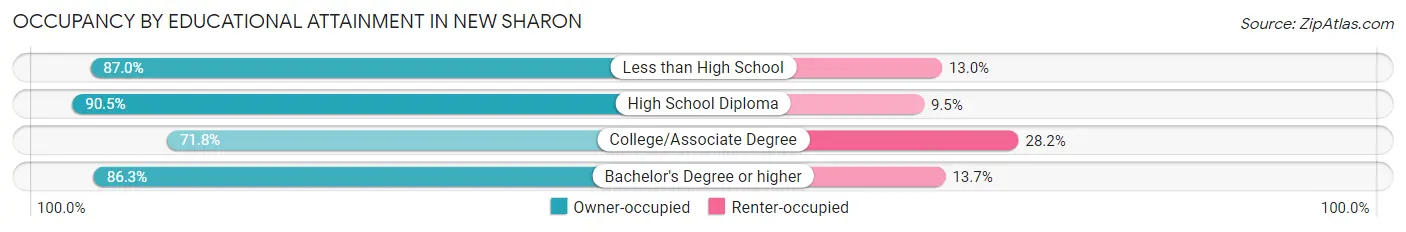
| Household Size | Owner-occupied | Renter-occupied |
| Less than High School | 20 (87.0%) | 3 (13.0%) |
| High School Diploma | 172 (90.5%) | 18 (9.5%) |
| College/Associate Degree | 150 (71.8%) | 59 (28.2%) |
| Bachelor's Degree or higher | 113 (86.3%) | 18 (13.7%) |
Occupancy by Age of Householder in New Sharon
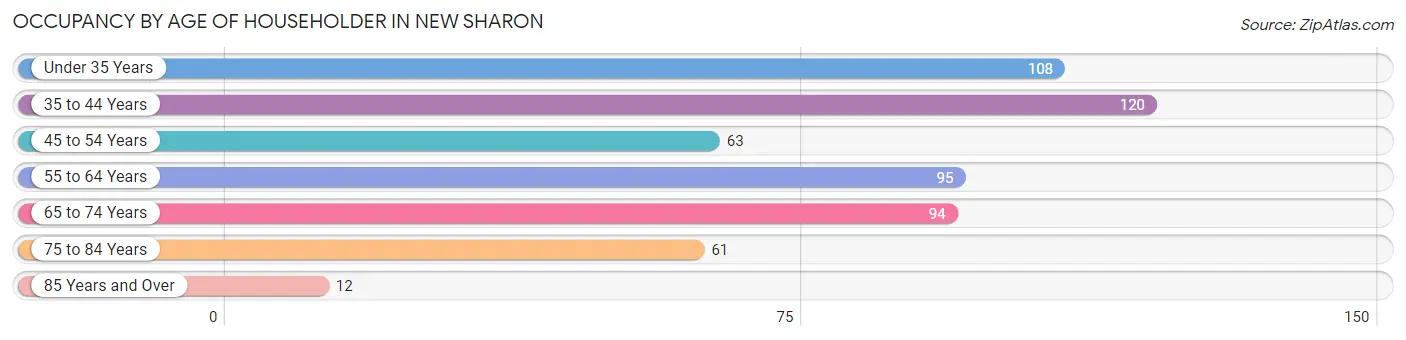
| Age Bracket | # Households | % Households |
| Under 35 Years | 108 | 19.5% |
| 35 to 44 Years | 120 | 21.7% |
| 45 to 54 Years | 63 | 11.4% |
| 55 to 64 Years | 95 | 17.2% |
| 65 to 74 Years | 94 | 17.0% |
| 75 to 84 Years | 61 | 11.0% |
| 85 Years and Over | 12 | 2.2% |
| Total | 553 | 100.0% |
Housing Finances in New Sharon
Median Income by Occupancy in New Sharon
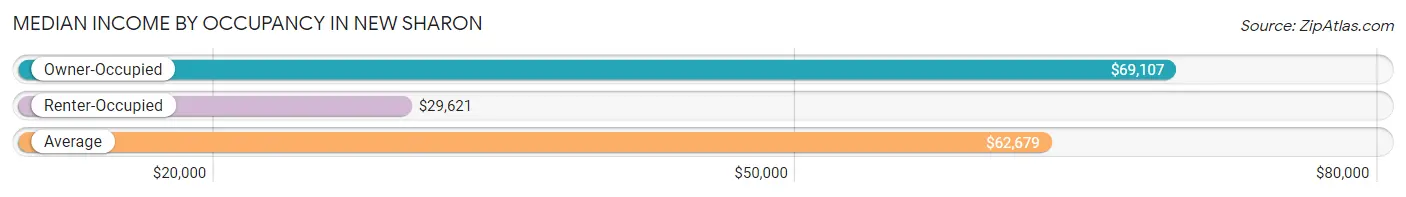
| Occupancy Type | # Households | Median Income |
| Owner-Occupied | 455 (82.3%) | $69,107 |
| Renter-Occupied | 98 (17.7%) | $29,621 |
| Average | 553 (100.0%) | $62,679 |
Occupancy by Householder Income Bracket in New Sharon
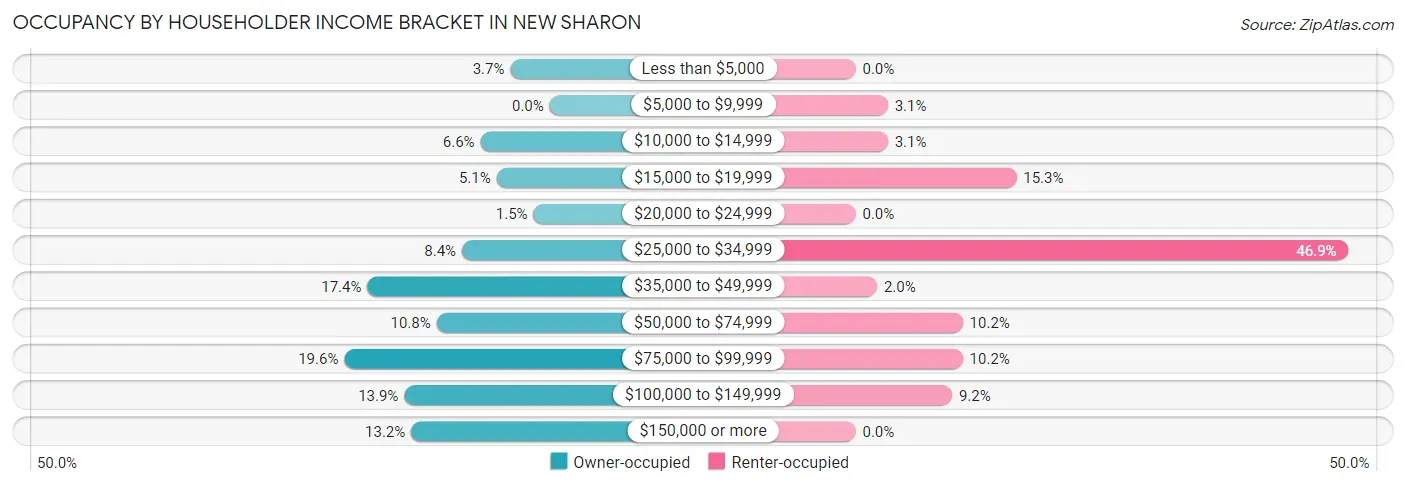
| Income Bracket | Owner-occupied | Renter-occupied |
| Less than $5,000 | 17 (3.7%) | 0 (0.0%) |
| $5,000 to $9,999 | 0 (0.0%) | 3 (3.1%) |
| $10,000 to $14,999 | 30 (6.6%) | 3 (3.1%) |
| $15,000 to $19,999 | 23 (5.1%) | 15 (15.3%) |
| $20,000 to $24,999 | 7 (1.5%) | 0 (0.0%) |
| $25,000 to $34,999 | 38 (8.4%) | 46 (46.9%) |
| $35,000 to $49,999 | 79 (17.4%) | 2 (2.0%) |
| $50,000 to $74,999 | 49 (10.8%) | 10 (10.2%) |
| $75,000 to $99,999 | 89 (19.6%) | 10 (10.2%) |
| $100,000 to $149,999 | 63 (13.9%) | 9 (9.2%) |
| $150,000 or more | 60 (13.2%) | 0 (0.0%) |
| Total | 455 (100.0%) | 98 (100.0%) |
Monthly Housing Cost Tiers in New Sharon
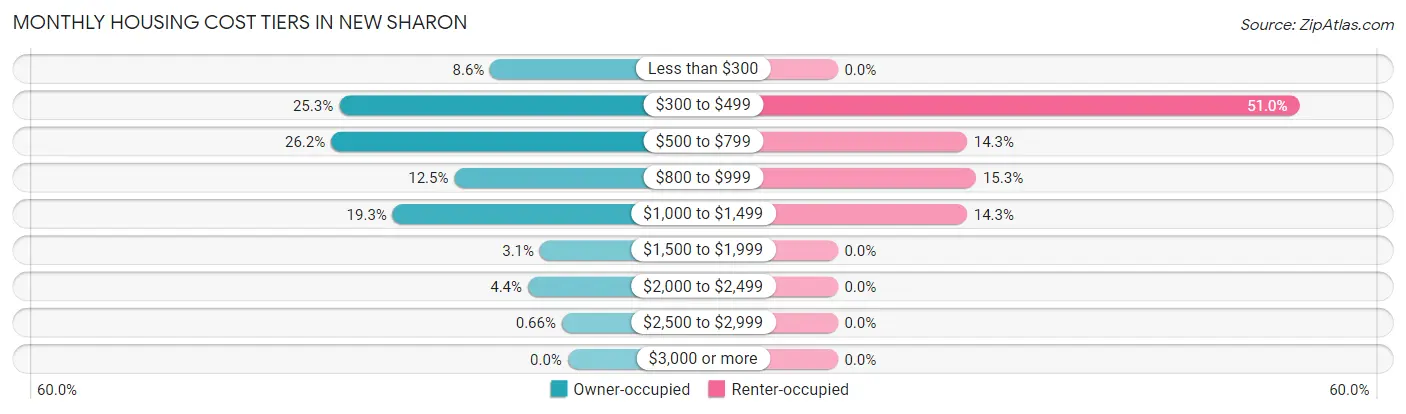
| Monthly Cost | Owner-occupied | Renter-occupied |
| Less than $300 | 39 (8.6%) | 0 (0.0%) |
| $300 to $499 | 115 (25.3%) | 50 (51.0%) |
| $500 to $799 | 119 (26.2%) | 14 (14.3%) |
| $800 to $999 | 57 (12.5%) | 15 (15.3%) |
| $1,000 to $1,499 | 88 (19.3%) | 14 (14.3%) |
| $1,500 to $1,999 | 14 (3.1%) | 0 (0.0%) |
| $2,000 to $2,499 | 20 (4.4%) | 0 (0.0%) |
| $2,500 to $2,999 | 3 (0.7%) | 0 (0.0%) |
| $3,000 or more | 0 (0.0%) | 0 (0.0%) |
| Total | 455 (100.0%) | 98 (100.0%) |
Physical Housing Characteristics in New Sharon
Housing Structures in New Sharon
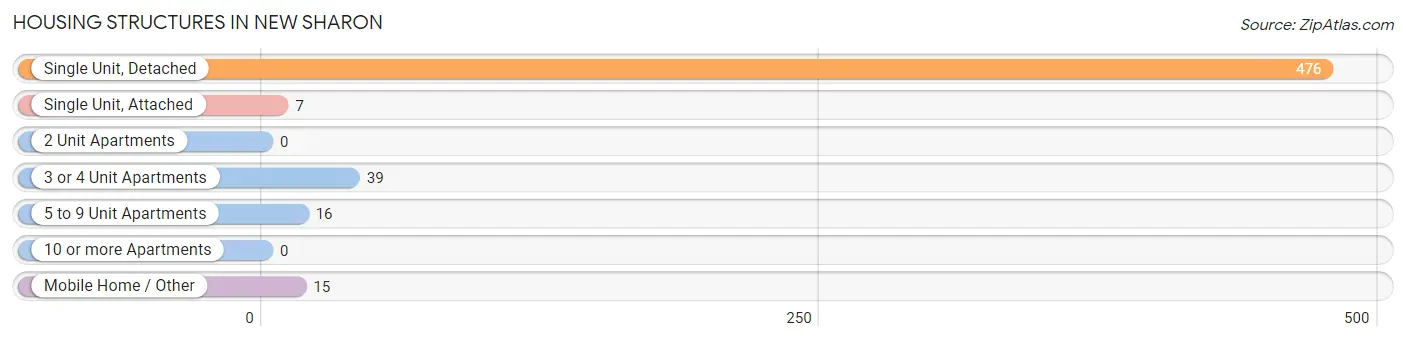
| Structure Type | # Housing Units | % Housing Units |
| Single Unit, Detached | 476 | 86.1% |
| Single Unit, Attached | 7 | 1.3% |
| 2 Unit Apartments | 0 | 0.0% |
| 3 or 4 Unit Apartments | 39 | 7.0% |
| 5 to 9 Unit Apartments | 16 | 2.9% |
| 10 or more Apartments | 0 | 0.0% |
| Mobile Home / Other | 15 | 2.7% |
| Total | 553 | 100.0% |
Housing Structures by Occupancy in New Sharon
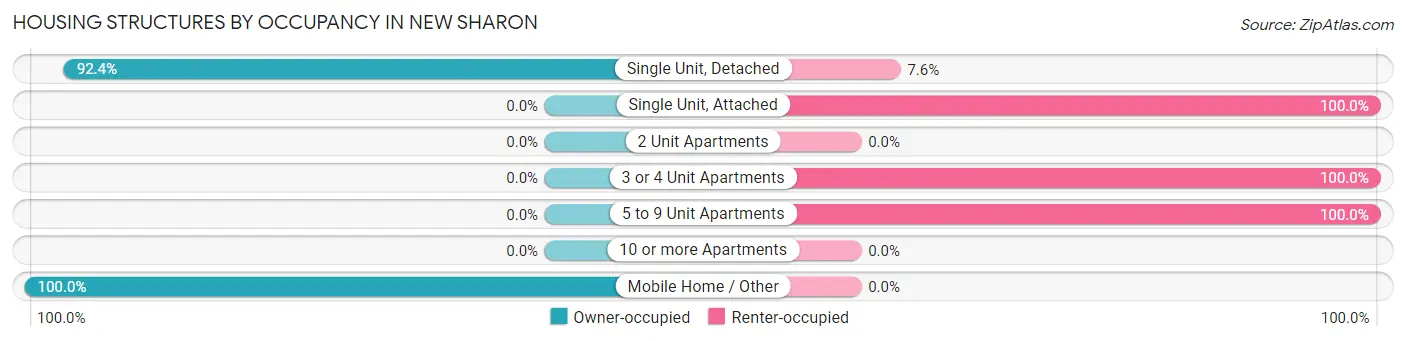
| Structure Type | Owner-occupied | Renter-occupied |
| Single Unit, Detached | 440 (92.4%) | 36 (7.6%) |
| Single Unit, Attached | 0 (0.0%) | 7 (100.0%) |
| 2 Unit Apartments | 0 (0.0%) | 0 (0.0%) |
| 3 or 4 Unit Apartments | 0 (0.0%) | 39 (100.0%) |
| 5 to 9 Unit Apartments | 0 (0.0%) | 16 (100.0%) |
| 10 or more Apartments | 0 (0.0%) | 0 (0.0%) |
| Mobile Home / Other | 15 (100.0%) | 0 (0.0%) |
| Total | 455 (82.3%) | 98 (17.7%) |
Housing Structures by Number of Rooms in New Sharon
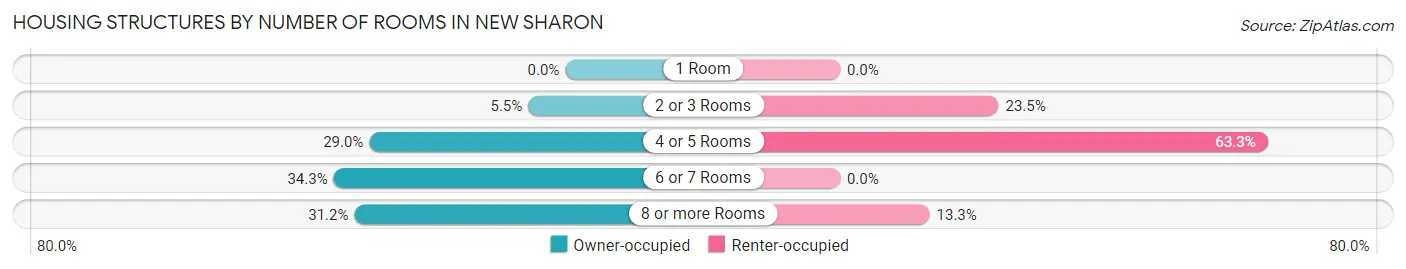
| Number of Rooms | Owner-occupied | Renter-occupied |
| 1 Room | 0 (0.0%) | 0 (0.0%) |
| 2 or 3 Rooms | 25 (5.5%) | 23 (23.5%) |
| 4 or 5 Rooms | 132 (29.0%) | 62 (63.3%) |
| 6 or 7 Rooms | 156 (34.3%) | 0 (0.0%) |
| 8 or more Rooms | 142 (31.2%) | 13 (13.3%) |
| Total | 455 (100.0%) | 98 (100.0%) |
Housing Structure by Heating Type in New Sharon
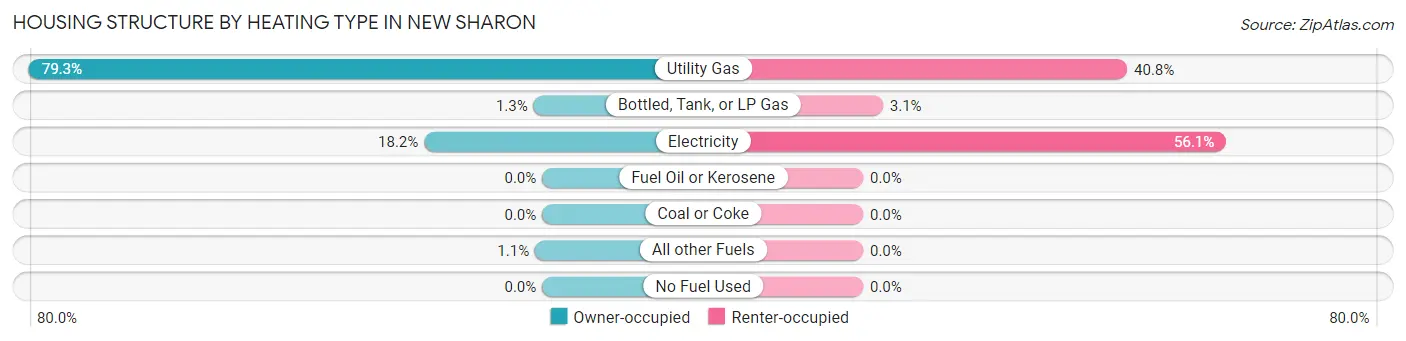
| Heating Type | Owner-occupied | Renter-occupied |
| Utility Gas | 361 (79.3%) | 40 (40.8%) |
| Bottled, Tank, or LP Gas | 6 (1.3%) | 3 (3.1%) |
| Electricity | 83 (18.2%) | 55 (56.1%) |
| Fuel Oil or Kerosene | 0 (0.0%) | 0 (0.0%) |
| Coal or Coke | 0 (0.0%) | 0 (0.0%) |
| All other Fuels | 5 (1.1%) | 0 (0.0%) |
| No Fuel Used | 0 (0.0%) | 0 (0.0%) |
| Total | 455 (100.0%) | 98 (100.0%) |
Household Vehicle Usage in New Sharon
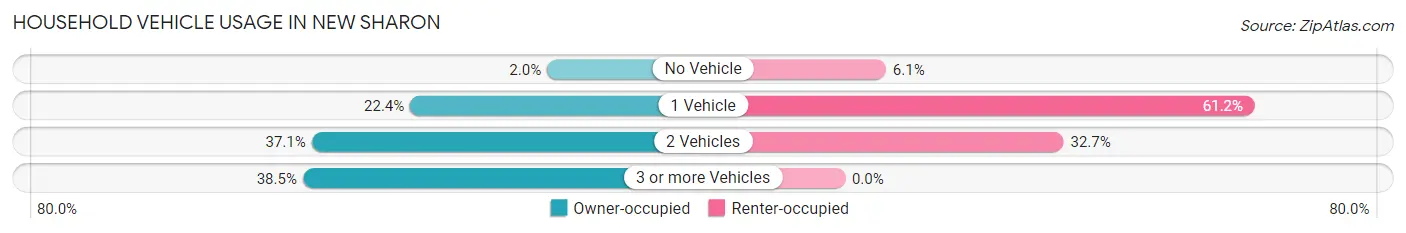
| Vehicles per Household | Owner-occupied | Renter-occupied |
| No Vehicle | 9 (2.0%) | 6 (6.1%) |
| 1 Vehicle | 102 (22.4%) | 60 (61.2%) |
| 2 Vehicles | 169 (37.1%) | 32 (32.7%) |
| 3 or more Vehicles | 175 (38.5%) | 0 (0.0%) |
| Total | 455 (100.0%) | 98 (100.0%) |
Real Estate & Mortgages in New Sharon
Real Estate and Mortgage Overview in New Sharon
| Characteristic | Without Mortgage | With Mortgage |
| Housing Units | 179 | 276 |
| Median Property Value | $116,400 | $126,600 |
| Median Household Income | $36,063 | $47 |
| Monthly Housing Costs | $426 | $0 |
| Real Estate Taxes | $1,870 | $17 |
Property Value by Mortgage Status in New Sharon
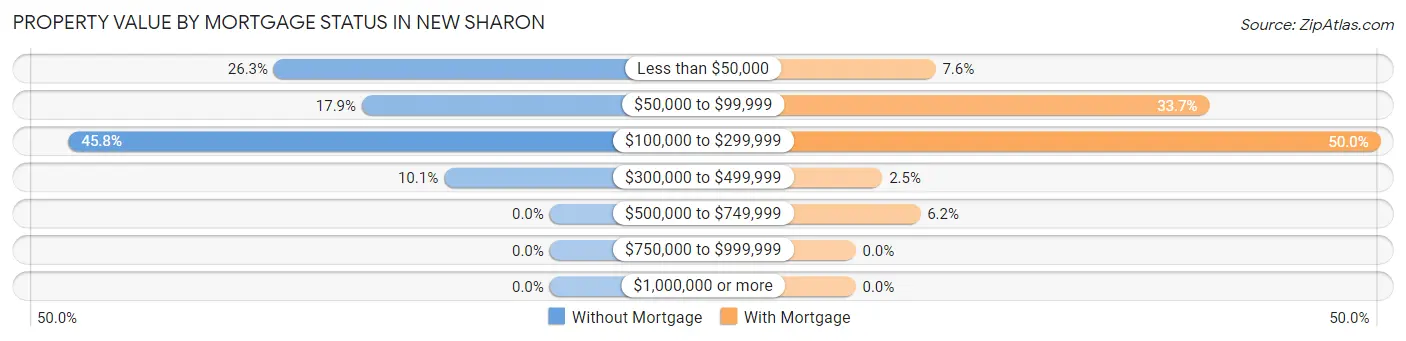
| Property Value | Without Mortgage | With Mortgage |
| Less than $50,000 | 47 (26.3%) | 21 (7.6%) |
| $50,000 to $99,999 | 32 (17.9%) | 93 (33.7%) |
| $100,000 to $299,999 | 82 (45.8%) | 138 (50.0%) |
| $300,000 to $499,999 | 18 (10.1%) | 7 (2.5%) |
| $500,000 to $749,999 | 0 (0.0%) | 17 (6.2%) |
| $750,000 to $999,999 | 0 (0.0%) | 0 (0.0%) |
| $1,000,000 or more | 0 (0.0%) | 0 (0.0%) |
| Total | 179 (100.0%) | 276 (100.0%) |
Household Income by Mortgage Status in New Sharon
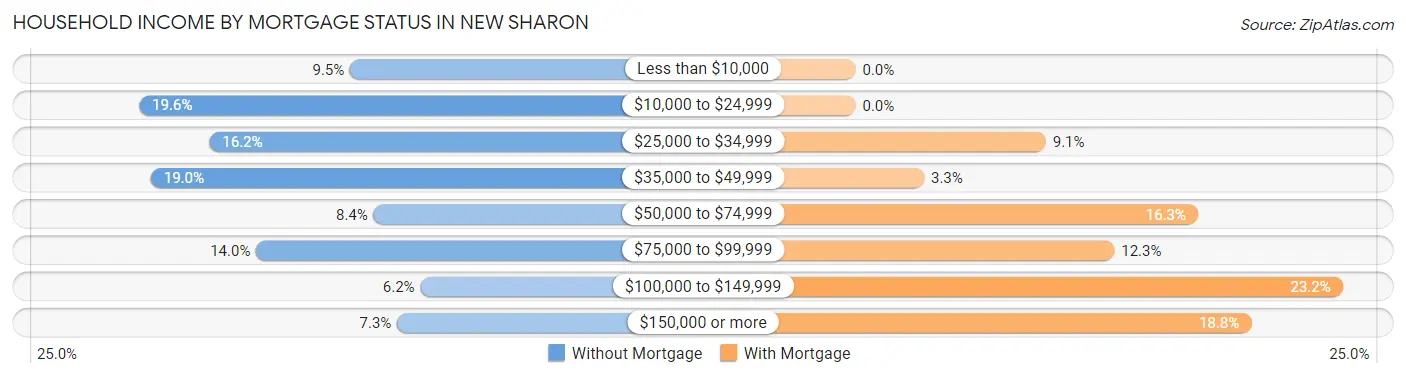
| Household Income | Without Mortgage | With Mortgage |
| Less than $10,000 | 17 (9.5%) | 0 (0.0%) |
| $10,000 to $24,999 | 35 (19.6%) | 0 (0.0%) |
| $25,000 to $34,999 | 29 (16.2%) | 25 (9.1%) |
| $35,000 to $49,999 | 34 (19.0%) | 9 (3.3%) |
| $50,000 to $74,999 | 15 (8.4%) | 45 (16.3%) |
| $75,000 to $99,999 | 25 (14.0%) | 34 (12.3%) |
| $100,000 to $149,999 | 11 (6.1%) | 64 (23.2%) |
| $150,000 or more | 13 (7.3%) | 52 (18.8%) |
| Total | 179 (100.0%) | 276 (100.0%) |
Property Value to Household Income Ratio in New Sharon
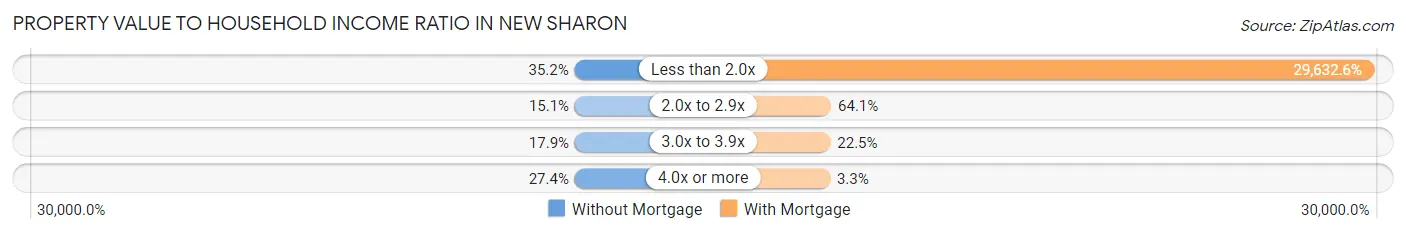
| Value-to-Income Ratio | Without Mortgage | With Mortgage |
| Less than 2.0x | 63 (35.2%) | 81,786 (29,632.6%) |
| 2.0x to 2.9x | 27 (15.1%) | 177 (64.1%) |
| 3.0x to 3.9x | 32 (17.9%) | 62 (22.5%) |
| 4.0x or more | 49 (27.4%) | 9 (3.3%) |
| Total | 179 (100.0%) | 276 (100.0%) |
Real Estate Taxes by Mortgage Status in New Sharon
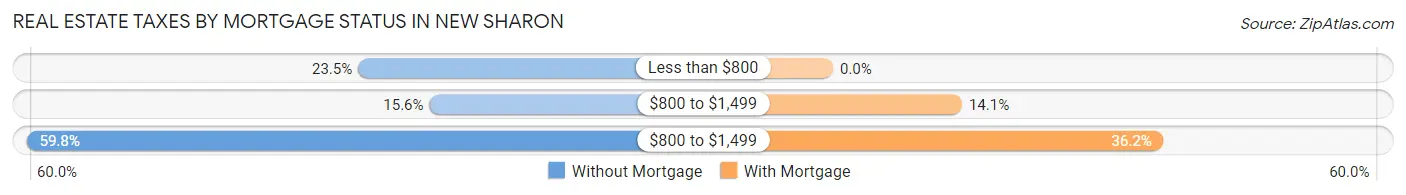
| Property Taxes | Without Mortgage | With Mortgage |
| Less than $800 | 42 (23.5%) | 0 (0.0%) |
| $800 to $1,499 | 28 (15.6%) | 39 (14.1%) |
| $800 to $1,499 | 107 (59.8%) | 100 (36.2%) |
| Total | 179 (100.0%) | 276 (100.0%) |
Health & Disability in New Sharon
Health Insurance Coverage by Age in New Sharon
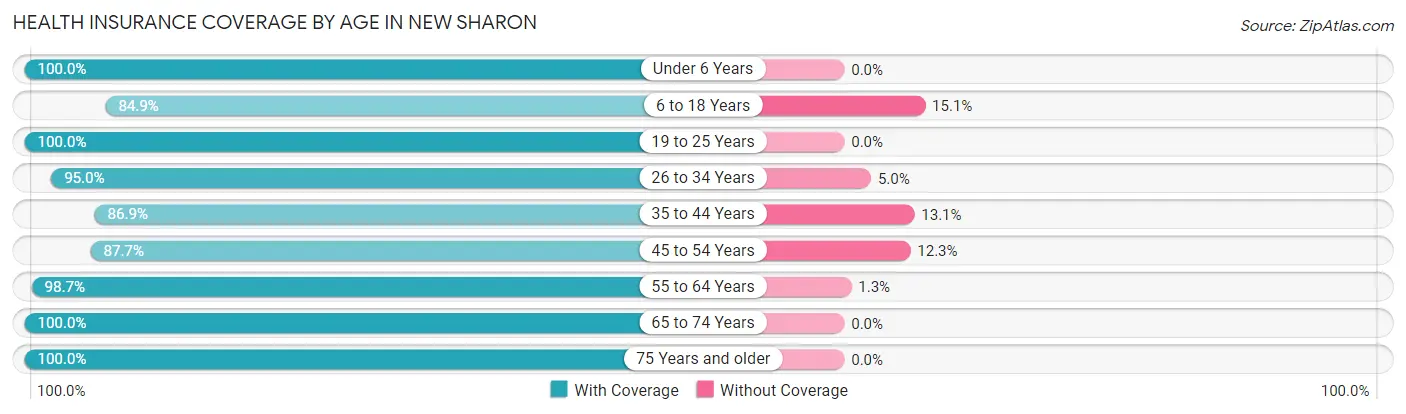
| Age Bracket | With Coverage | Without Coverage |
| Under 6 Years | 64 (100.0%) | 0 (0.0%) |
| 6 to 18 Years | 152 (84.9%) | 27 (15.1%) |
| 19 to 25 Years | 87 (100.0%) | 0 (0.0%) |
| 26 to 34 Years | 153 (95.0%) | 8 (5.0%) |
| 35 to 44 Years | 153 (86.9%) | 23 (13.1%) |
| 45 to 54 Years | 121 (87.7%) | 17 (12.3%) |
| 55 to 64 Years | 150 (98.7%) | 2 (1.3%) |
| 65 to 74 Years | 136 (100.0%) | 0 (0.0%) |
| 75 Years and older | 90 (100.0%) | 0 (0.0%) |
| Total | 1,106 (93.5%) | 77 (6.5%) |
Health Insurance Coverage by Citizenship Status in New Sharon
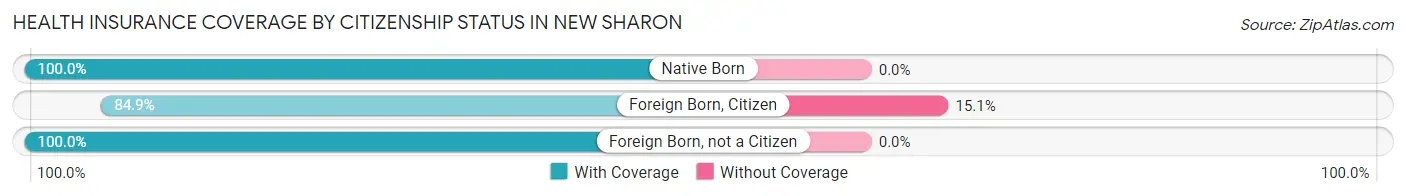
| Citizenship Status | With Coverage | Without Coverage |
| Native Born | 64 (100.0%) | 0 (0.0%) |
| Foreign Born, Citizen | 152 (84.9%) | 27 (15.1%) |
| Foreign Born, not a Citizen | 87 (100.0%) | 0 (0.0%) |
Health Insurance Coverage by Household Income in New Sharon
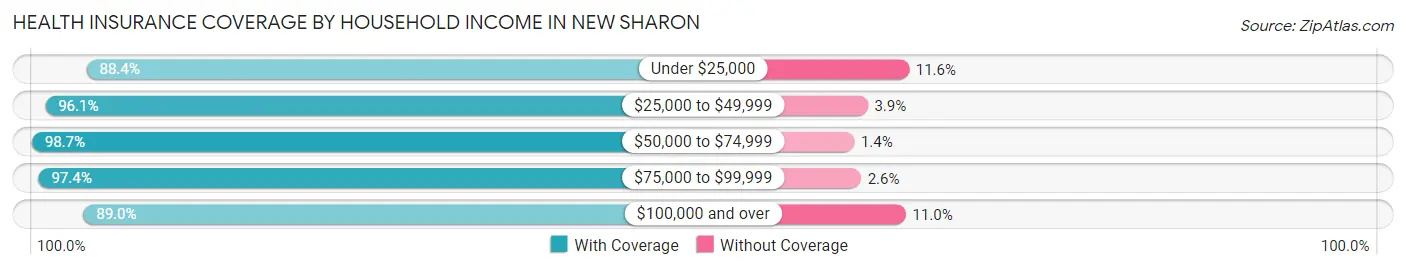
| Household Income | With Coverage | Without Coverage |
| Under $25,000 | 99 (88.4%) | 13 (11.6%) |
| $25,000 to $49,999 | 273 (96.1%) | 11 (3.9%) |
| $50,000 to $74,999 | 146 (98.7%) | 2 (1.3%) |
| $75,000 to $99,999 | 224 (97.4%) | 6 (2.6%) |
| $100,000 and over | 364 (89.0%) | 45 (11.0%) |
Public vs Private Health Insurance Coverage by Age in New Sharon
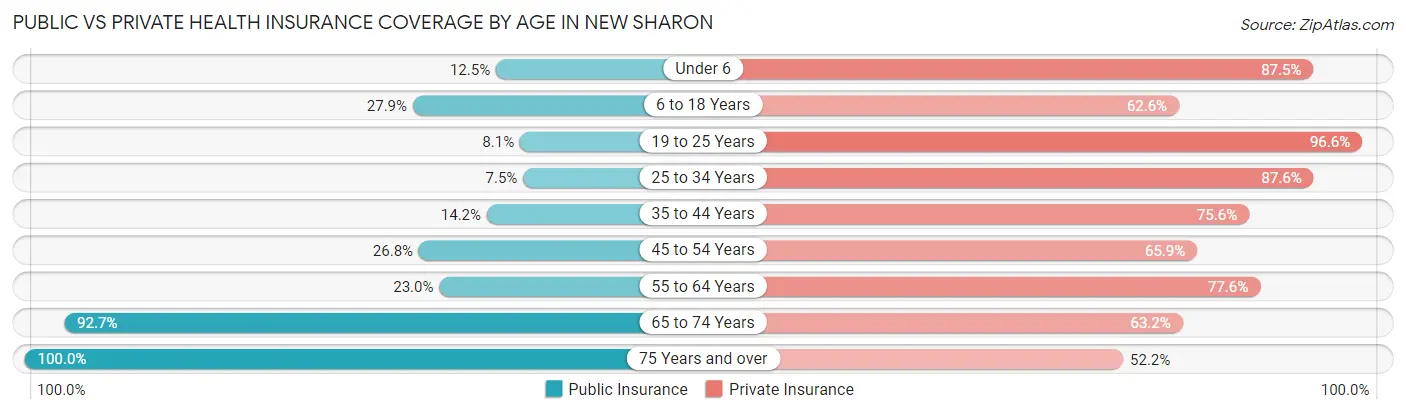
| Age Bracket | Public Insurance | Private Insurance |
| Under 6 | 8 (12.5%) | 56 (87.5%) |
| 6 to 18 Years | 50 (27.9%) | 112 (62.6%) |
| 19 to 25 Years | 7 (8.1%) | 84 (96.6%) |
| 25 to 34 Years | 12 (7.4%) | 141 (87.6%) |
| 35 to 44 Years | 25 (14.2%) | 133 (75.6%) |
| 45 to 54 Years | 37 (26.8%) | 91 (65.9%) |
| 55 to 64 Years | 35 (23.0%) | 118 (77.6%) |
| 65 to 74 Years | 126 (92.6%) | 86 (63.2%) |
| 75 Years and over | 90 (100.0%) | 47 (52.2%) |
| Total | 390 (33.0%) | 868 (73.4%) |
Disability Status by Sex by Age in New Sharon
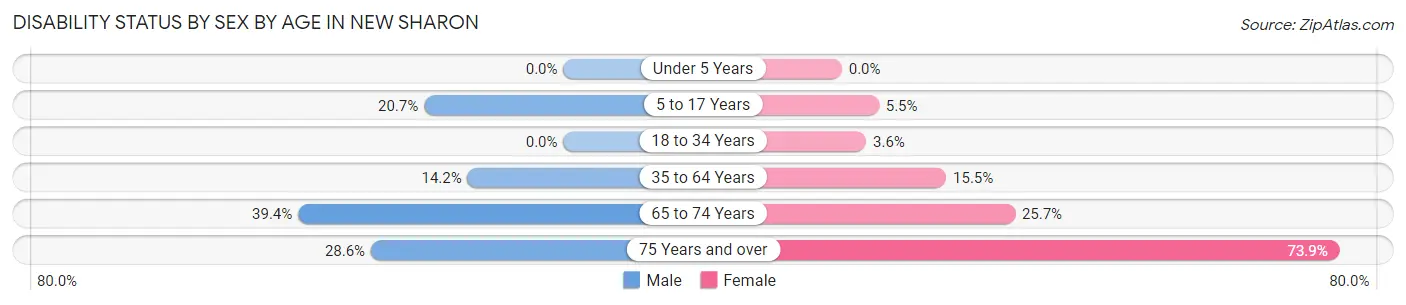
| Age Bracket | Male | Female |
| Under 5 Years | 0 (0.0%) | 0 (0.0%) |
| 5 to 17 Years | 18 (20.7%) | 5 (5.5%) |
| 18 to 34 Years | 0 (0.0%) | 6 (3.6%) |
| 35 to 64 Years | 36 (14.2%) | 33 (15.5%) |
| 65 to 74 Years | 26 (39.4%) | 18 (25.7%) |
| 75 Years and over | 6 (28.6%) | 51 (73.9%) |
Disability Class by Sex by Age in New Sharon
Disability Class: Hearing Difficulty
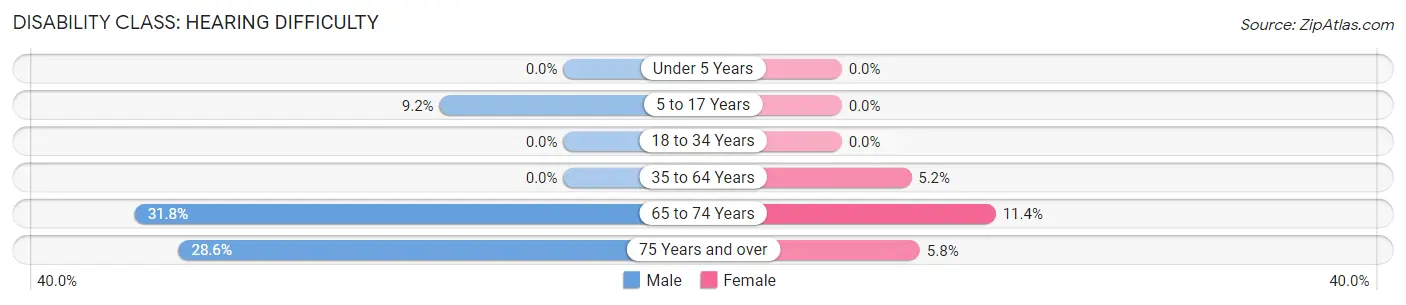
| Age Bracket | Male | Female |
| Under 5 Years | 0 (0.0%) | 0 (0.0%) |
| 5 to 17 Years | 8 (9.2%) | 0 (0.0%) |
| 18 to 34 Years | 0 (0.0%) | 0 (0.0%) |
| 35 to 64 Years | 0 (0.0%) | 11 (5.2%) |
| 65 to 74 Years | 21 (31.8%) | 8 (11.4%) |
| 75 Years and over | 6 (28.6%) | 4 (5.8%) |
Disability Class: Vision Difficulty
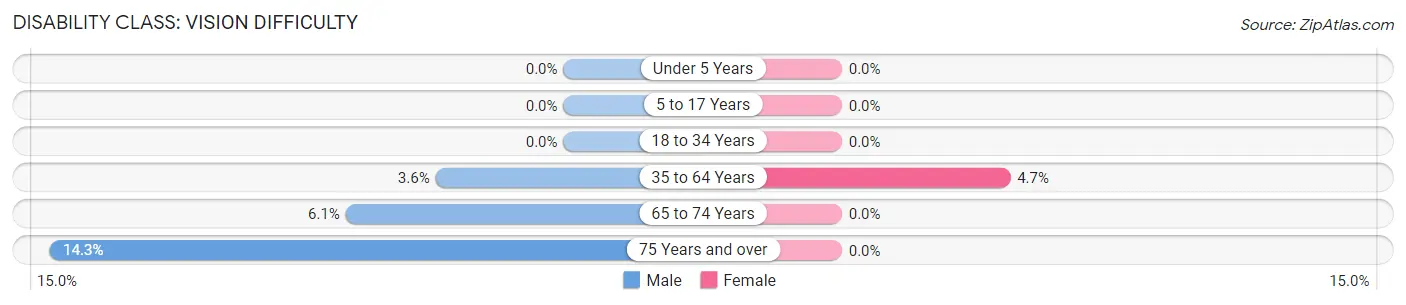
| Age Bracket | Male | Female |
| Under 5 Years | 0 (0.0%) | 0 (0.0%) |
| 5 to 17 Years | 0 (0.0%) | 0 (0.0%) |
| 18 to 34 Years | 0 (0.0%) | 0 (0.0%) |
| 35 to 64 Years | 9 (3.6%) | 10 (4.7%) |
| 65 to 74 Years | 4 (6.1%) | 0 (0.0%) |
| 75 Years and over | 3 (14.3%) | 0 (0.0%) |
Disability Class: Cognitive Difficulty
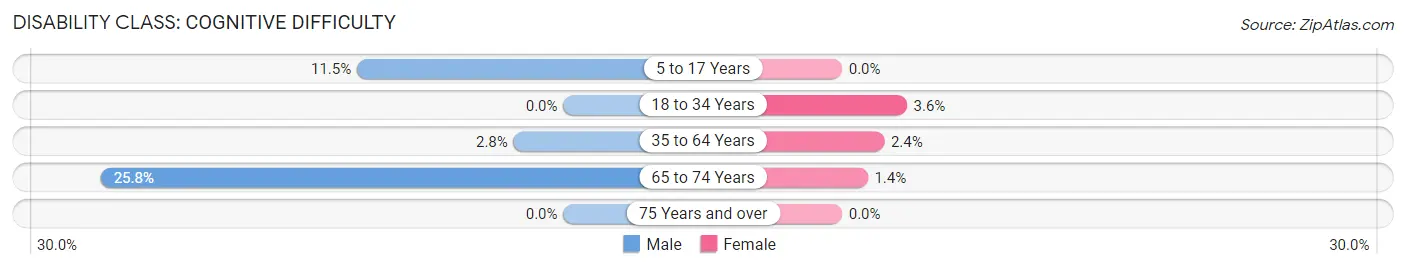
| Age Bracket | Male | Female |
| 5 to 17 Years | 10 (11.5%) | 0 (0.0%) |
| 18 to 34 Years | 0 (0.0%) | 6 (3.6%) |
| 35 to 64 Years | 7 (2.8%) | 5 (2.4%) |
| 65 to 74 Years | 17 (25.8%) | 1 (1.4%) |
| 75 Years and over | 0 (0.0%) | 0 (0.0%) |
Disability Class: Ambulatory Difficulty
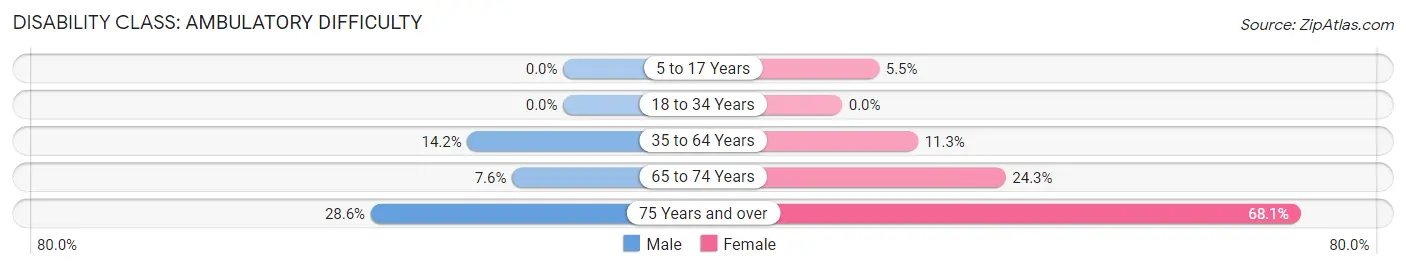
| Age Bracket | Male | Female |
| 5 to 17 Years | 0 (0.0%) | 5 (5.5%) |
| 18 to 34 Years | 0 (0.0%) | 0 (0.0%) |
| 35 to 64 Years | 36 (14.2%) | 24 (11.3%) |
| 65 to 74 Years | 5 (7.6%) | 17 (24.3%) |
| 75 Years and over | 6 (28.6%) | 47 (68.1%) |
Disability Class: Self-Care Difficulty
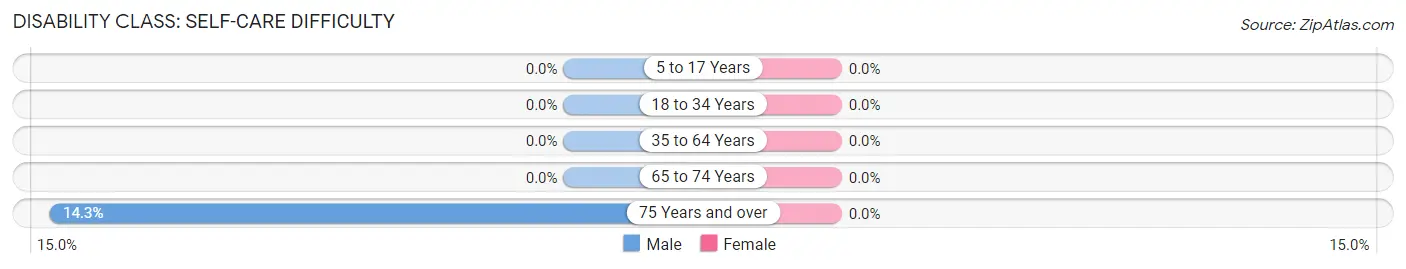
| Age Bracket | Male | Female |
| 5 to 17 Years | 0 (0.0%) | 0 (0.0%) |
| 18 to 34 Years | 0 (0.0%) | 0 (0.0%) |
| 35 to 64 Years | 0 (0.0%) | 0 (0.0%) |
| 65 to 74 Years | 0 (0.0%) | 0 (0.0%) |
| 75 Years and over | 3 (14.3%) | 0 (0.0%) |
Technology Access in New Sharon
Computing Device Access in New Sharon
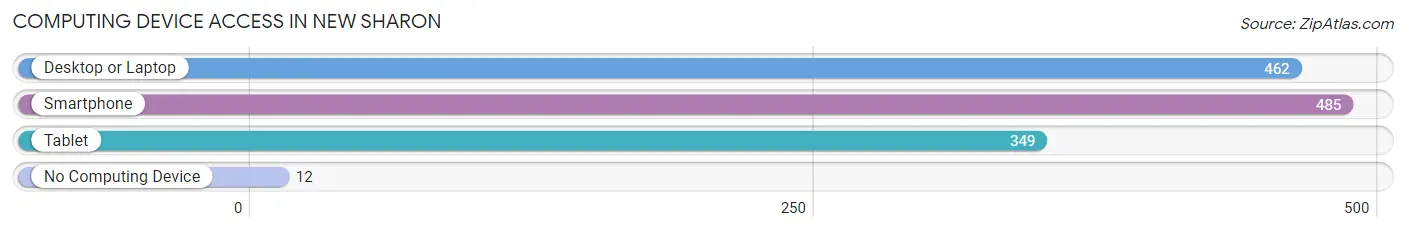
| Device Type | # Households | % Households |
| Desktop or Laptop | 462 | 83.5% |
| Smartphone | 485 | 87.7% |
| Tablet | 349 | 63.1% |
| No Computing Device | 12 | 2.2% |
| Total | 553 | 100.0% |
Internet Access in New Sharon
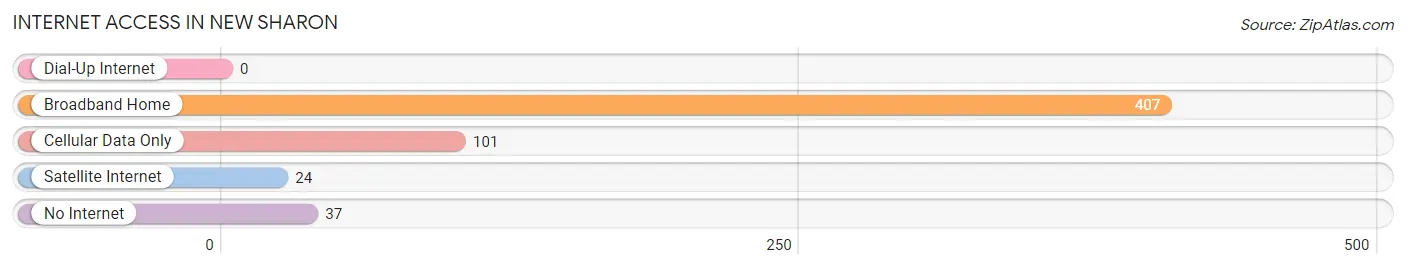
| Internet Type | # Households | % Households |
| Dial-Up Internet | 0 | 0.0% |
| Broadband Home | 407 | 73.6% |
| Cellular Data Only | 101 | 18.3% |
| Satellite Internet | 24 | 4.3% |
| No Internet | 37 | 6.7% |
| Total | 553 | 100.0% |
New Sharon Summary
Sharon, Iowa is a small town located in Mahaska County, Iowa. It is situated on the banks of the Skunk River and is home to approximately 1,000 people. The town was founded in 1854 and was named after the daughter of one of the original settlers.
History
Sharon, Iowa was founded in 1854 by a group of settlers from Ohio. The town was named after the daughter of one of the original settlers, Sharon Smith. The town was originally a farming community and the main crops grown were corn, oats, and hay. The town was also home to a number of small businesses, including a general store, a blacksmith shop, and a sawmill.
In the late 1800s, the town began to grow and the population increased. The railroad was built through the town in 1881, which helped to spur economic growth. The town also had a number of churches, including the Sharon Methodist Church, which was founded in 1867.
In the early 1900s, the town began to decline as the railroad was rerouted and the population began to move away. The town was nearly abandoned by the 1950s, but the population began to increase again in the 1970s.
Geography
Sharon, Iowa is located in Mahaska County, Iowa. It is situated on the banks of the Skunk River and is approximately 30 miles south of Des Moines. The town is located in a rural area and is surrounded by farmland. The town is located at an elevation of 890 feet above sea level.
Economy
The economy of Sharon, Iowa is largely based on agriculture. The town is home to a number of farms that grow corn, soybeans, and hay. The town is also home to a number of small businesses, including a general store, a hardware store, and a restaurant.
Demographics
As of the 2010 census, the population of Sharon, Iowa was 1,000. The racial makeup of the town was 97.2% White, 0.7% African American, 0.2% Native American, 0.2% Asian, 0.2% from other races, and 1.7% from two or more races. The median household income was $41,250 and the median family income was $50,000.
Conclusion
Sharon, Iowa is a small town located in Mahaska County, Iowa. It was founded in 1854 and was originally a farming community. The town has a population of 1,000 and the economy is largely based on agriculture. The town is home to a number of small businesses and is surrounded by farmland.
Common Questions
What is Per Capita Income in New Sharon?
Per Capita income in New Sharon is $34,612.
What is the Median Family Income in New Sharon?
Median Family Income in New Sharon is $87,679.
What is the Median Household income in New Sharon?
Median Household Income in New Sharon is $62,679.
What is Income or Wage Gap in New Sharon?
Income or Wage Gap in New Sharon is 57.5%.
Women in New Sharon earn 42.5 cents for every dollar earned by a man.
What is Inequality or Gini Index in New Sharon?
Inequality or Gini Index in New Sharon is 0.43.
What is the Total Population of New Sharon?
Total Population of New Sharon is 1,183.
What is the Total Male Population of New Sharon?
Total Male Population of New Sharon is 548.
What is the Total Female Population of New Sharon?
Total Female Population of New Sharon is 635.
What is the Ratio of Males per 100 Females in New Sharon?
There are 86.30 Males per 100 Females in New Sharon.
What is the Ratio of Females per 100 Males in New Sharon?
There are 115.88 Females per 100 Males in New Sharon.
What is the Median Population Age in New Sharon?
Median Population Age in New Sharon is 39.9 Years.
What is the Average Family Size in New Sharon
Average Family Size in New Sharon is 2.8 People.
What is the Average Household Size in New Sharon
Average Household Size in New Sharon is 2.1 People.
How Large is the Labor Force in New Sharon?
There are 653 People in the Labor Forcein in New Sharon.
What is the Percentage of People in the Labor Force in New Sharon?
66.0% of People are in the Labor Force in New Sharon.
What is the Unemployment Rate in New Sharon?
Unemployment Rate in New Sharon is 2.6%.