New London, IA Map & Demographics
New London Map
New London Overview
$26,946
PER CAPITA INCOME
$74,509
AVG FAMILY INCOME
$60,735
AVG HOUSEHOLD INCOME
32.9%
WAGE / INCOME GAP [ % ]
67.1¢/ $1
WAGE / INCOME GAP [ $ ]
$8,726
FAMILY INCOME DEFICIT
0.35
INEQUALITY / GINI INDEX
2,471
TOTAL POPULATION
1,166
MALE POPULATION
1,305
FEMALE POPULATION
89.35
MALES / 100 FEMALES
111.92
FEMALES / 100 MALES
34.7
MEDIAN AGE
3.4
AVG FAMILY SIZE
2.7
AVG HOUSEHOLD SIZE
1,322
LABOR FORCE [ PEOPLE ]
66.4%
PERCENT IN LABOR FORCE
2.5%
UNEMPLOYMENT RATE
New London Zip Codes
New London Area Codes
Income in New London
Income Overview in New London
Per Capita Income in New London is $26,946, while median incomes of families and households are $74,509 and $60,735 respectively.
| Characteristic | Number | Measure |
| Per Capita Income | 2,471 | $26,946 |
| Median Family Income | 589 | $74,509 |
| Mean Family Income | 589 | $74,141 |
| Median Household Income | 888 | $60,735 |
| Mean Household Income | 888 | $66,609 |
| Income Deficit | 589 | $8,726 |
| Wage / Income Gap (%) | 2,471 | 32.92% |
| Wage / Income Gap ($) | 2,471 | 67.08¢ per $1 |
| Gini / Inequality Index | 2,471 | 0.35 |
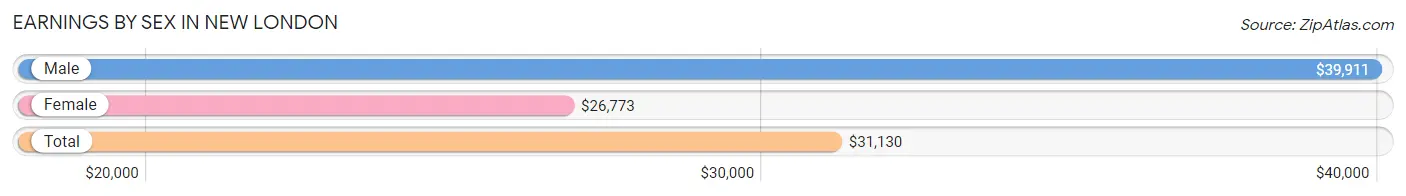
Earnings by Sex in New London
Average Earnings in New London are $31,130, $39,911 for men and $26,773 for women, a difference of 32.9%.
| Sex | Number | Average Earnings |
| Male | 686 (50.0%) | $39,911 |
| Female | 685 (50.0%) | $26,773 |
| Total | 1,371 (100.0%) | $31,130 |
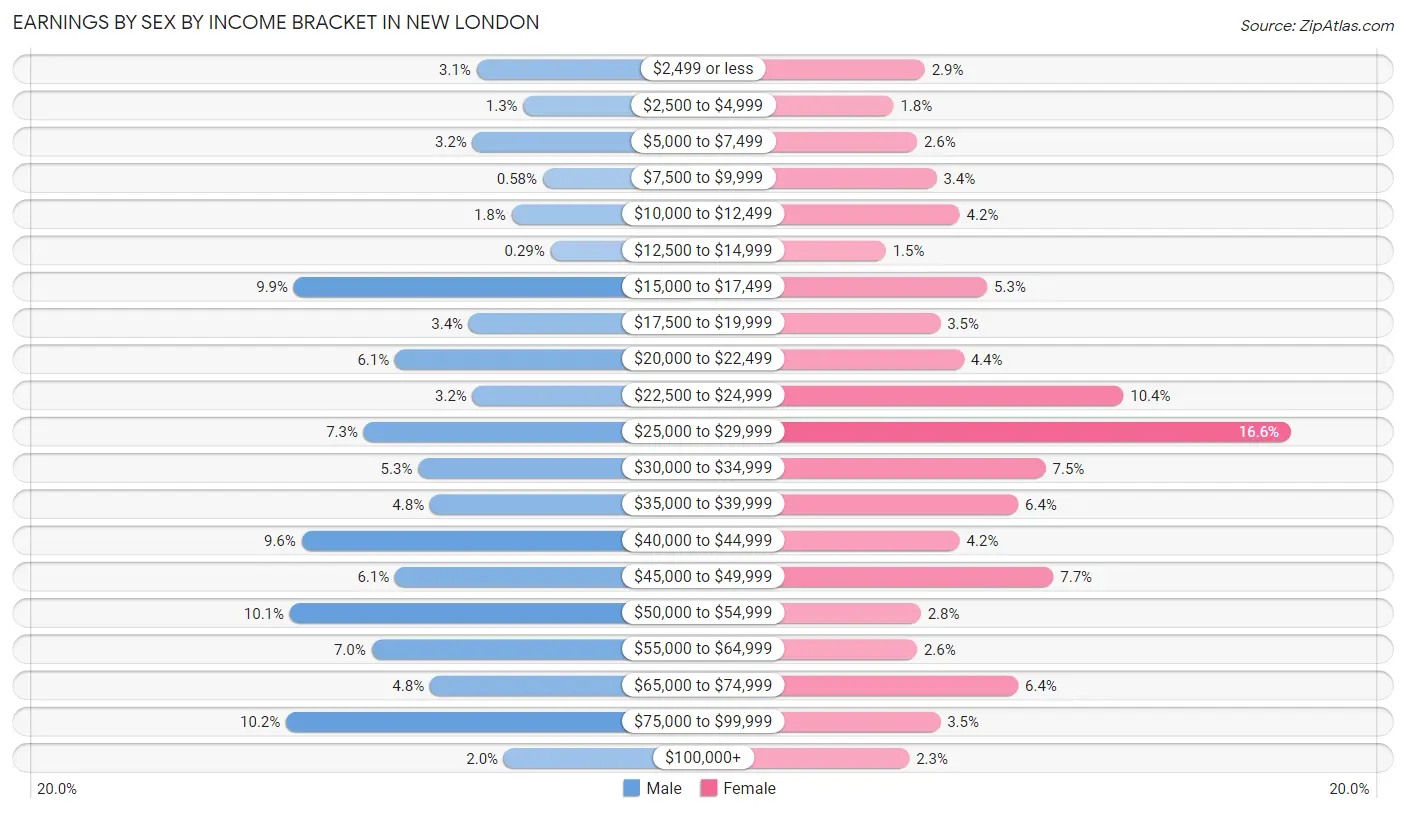
Earnings by Sex by Income Bracket in New London
The most common earnings brackets in New London are $75,000 to $99,999 for men (70 | 10.2%) and $25,000 to $29,999 for women (114 | 16.6%).
| Income | Male | Female |
| $2,499 or less | 21 (3.1%) | 20 (2.9%) |
| $2,500 to $4,999 | 9 (1.3%) | 12 (1.8%) |
| $5,000 to $7,499 | 22 (3.2%) | 18 (2.6%) |
| $7,500 to $9,999 | 4 (0.6%) | 23 (3.4%) |
| $10,000 to $12,499 | 12 (1.8%) | 29 (4.2%) |
| $12,500 to $14,999 | 2 (0.3%) | 10 (1.5%) |
| $15,000 to $17,499 | 68 (9.9%) | 36 (5.3%) |
| $17,500 to $19,999 | 23 (3.4%) | 24 (3.5%) |
| $20,000 to $22,499 | 42 (6.1%) | 30 (4.4%) |
| $22,500 to $24,999 | 22 (3.2%) | 71 (10.4%) |
| $25,000 to $29,999 | 50 (7.3%) | 114 (16.6%) |
| $30,000 to $34,999 | 36 (5.2%) | 51 (7.4%) |
| $35,000 to $39,999 | 33 (4.8%) | 44 (6.4%) |
| $40,000 to $44,999 | 66 (9.6%) | 29 (4.2%) |
| $45,000 to $49,999 | 42 (6.1%) | 53 (7.7%) |
| $50,000 to $54,999 | 69 (10.1%) | 19 (2.8%) |
| $55,000 to $64,999 | 48 (7.0%) | 18 (2.6%) |
| $65,000 to $74,999 | 33 (4.8%) | 44 (6.4%) |
| $75,000 to $99,999 | 70 (10.2%) | 24 (3.5%) |
| $100,000+ | 14 (2.0%) | 16 (2.3%) |
| Total | 686 (100.0%) | 685 (100.0%) |
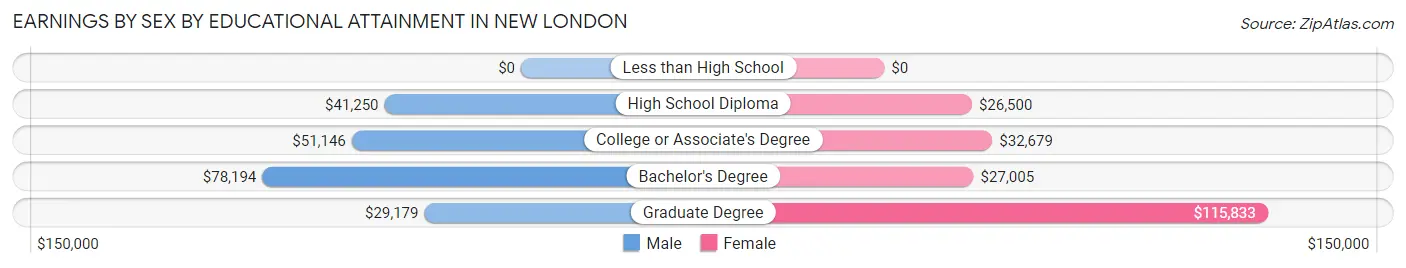
Earnings by Sex by Educational Attainment in New London
Average earnings in New London are $48,472 for men and $28,828 for women, a difference of 40.5%. Men with an educational attainment of bachelor's degree enjoy the highest average annual earnings of $78,194, while those with graduate degree education earn the least with $29,179. Women with an educational attainment of graduate degree earn the most with the average annual earnings of $115,833, while those with high school diploma education have the smallest earnings of $26,500.
| Educational Attainment | Male Income | Female Income |
| Less than High School | - | - |
| High School Diploma | $41,250 | $26,500 |
| College or Associate's Degree | $51,146 | $32,679 |
| Bachelor's Degree | $78,194 | $27,005 |
| Graduate Degree | $29,179 | $115,833 |
| Total | $48,472 | $28,828 |
Family Income in New London
Family Income Brackets in New London
According to the New London family income data, there are 147 families falling into the $100,000 to $149,999 income range, which is the most common income bracket and makes up 25.0% of all families.
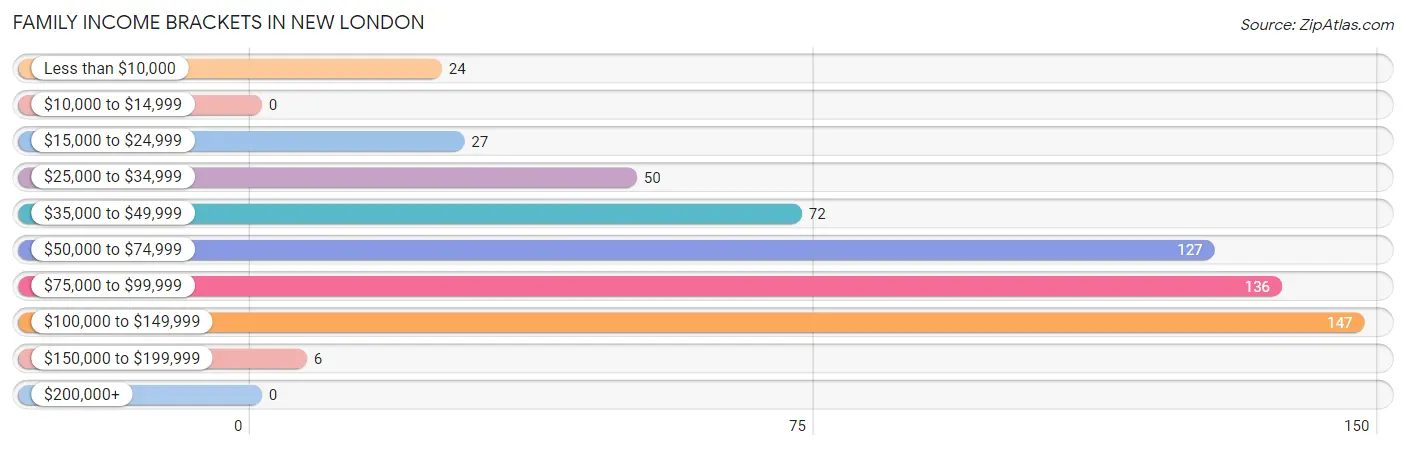
| Income Bracket | # Families | % Families |
| Less than $10,000 | 24 | 4.1% |
| $10,000 to $14,999 | 0 | 0.0% |
| $15,000 to $24,999 | 27 | 4.6% |
| $25,000 to $34,999 | 50 | 8.5% |
| $35,000 to $49,999 | 72 | 12.2% |
| $50,000 to $74,999 | 127 | 21.6% |
| $75,000 to $99,999 | 136 | 23.1% |
| $100,000 to $149,999 | 147 | 25.0% |
| $150,000 to $199,999 | 6 | 1.0% |
| $200,000+ | 0 | 0.0% |
Family Income by Famaliy Size in New London
5-person families (49 | 8.3%) account for the highest median family income in New London with $106,354 per family, while 2-person families (302 | 51.3%) have the highest median income of $29,643 per family member.
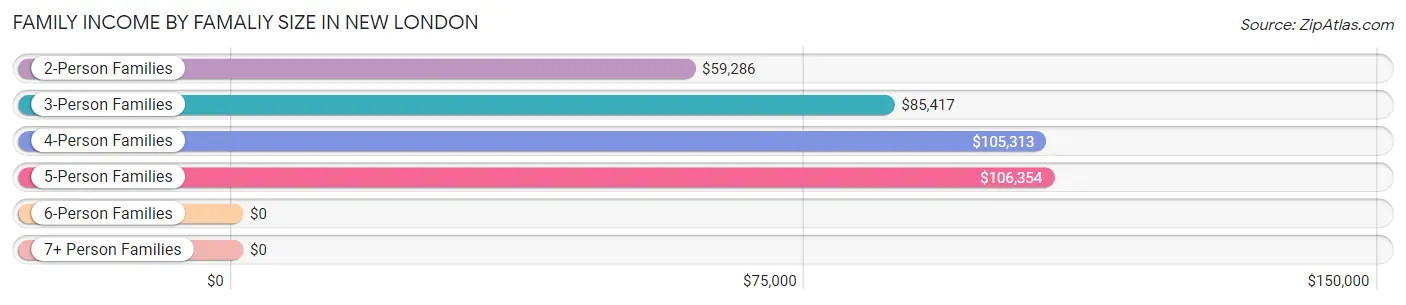
| Income Bracket | # Families | Median Income |
| 2-Person Families | 302 (51.3%) | $59,286 |
| 3-Person Families | 105 (17.8%) | $85,417 |
| 4-Person Families | 111 (18.9%) | $105,313 |
| 5-Person Families | 49 (8.3%) | $106,354 |
| 6-Person Families | 9 (1.5%) | $0 |
| 7+ Person Families | 13 (2.2%) | $0 |
| Total | 589 (100.0%) | $74,509 |
Family Income by Number of Earners in New London
The median family income in New London is $74,509, with families comprising 2 earners (283) having the highest median family income of $95,096, while families with no earners (80) have the lowest median family income of $35,000, accounting for 48.0% and 13.6% of families, respectively.
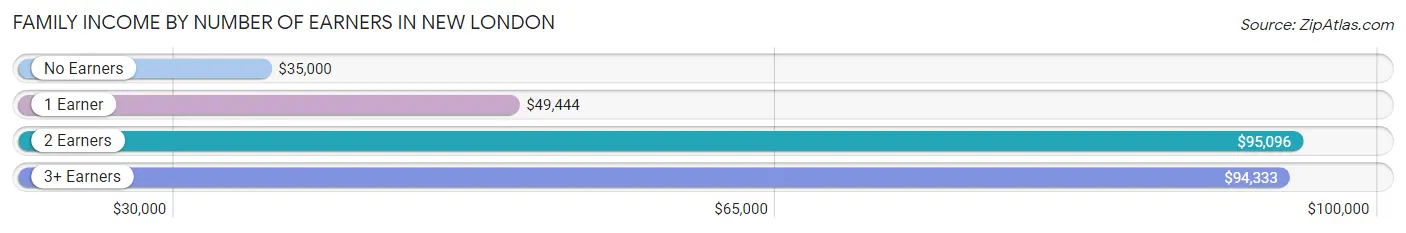
| Number of Earners | # Families | Median Income |
| No Earners | 80 (13.6%) | $35,000 |
| 1 Earner | 180 (30.6%) | $49,444 |
| 2 Earners | 283 (48.0%) | $95,096 |
| 3+ Earners | 46 (7.8%) | $94,333 |
| Total | 589 (100.0%) | $74,509 |
Household Income in New London
Household Income Brackets in New London
With 179 households falling in the category, the $50,000 to $74,999 income range is the most frequent in New London, accounting for 20.2% of all households. In contrast, only 3 households (0.3%) fall into the $200,000+ income bracket, making it the least populous group.
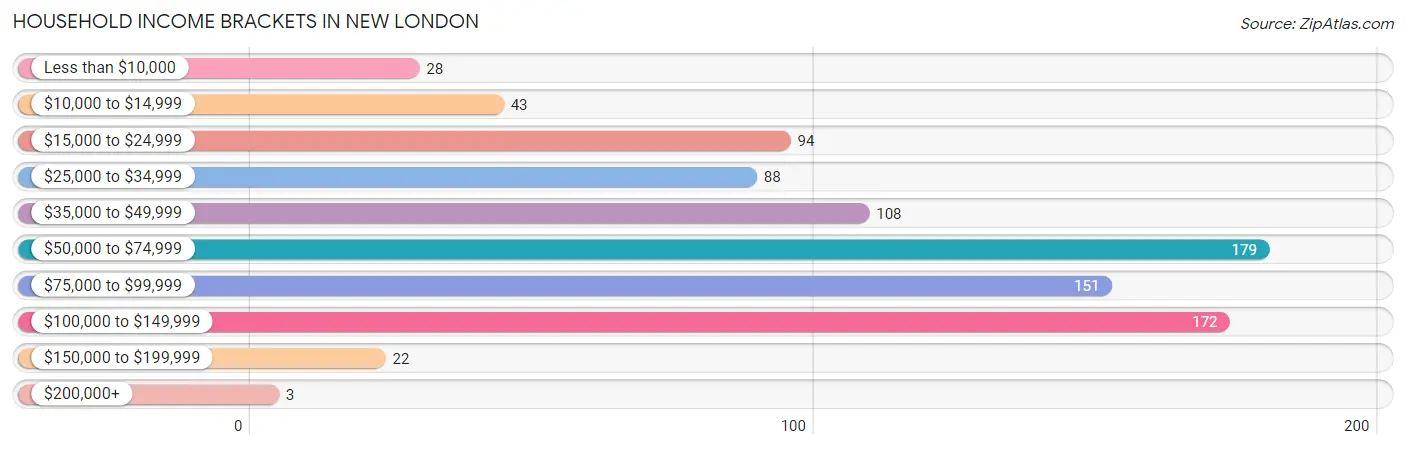
| Income Bracket | # Households | % Households |
| Less than $10,000 | 28 | 3.2% |
| $10,000 to $14,999 | 43 | 4.8% |
| $15,000 to $24,999 | 94 | 10.6% |
| $25,000 to $34,999 | 88 | 9.9% |
| $35,000 to $49,999 | 108 | 12.2% |
| $50,000 to $74,999 | 179 | 20.2% |
| $75,000 to $99,999 | 151 | 17.0% |
| $100,000 to $149,999 | 172 | 19.4% |
| $150,000 to $199,999 | 22 | 2.5% |
| $200,000+ | 3 | 0.3% |
Household Income by Householder Age in New London
The median household income in New London is $60,735, with the highest median household income of $84,375 found in the 45 to 64 years age bracket for the primary householder. A total of 324 households (36.5%) fall into this category. Meanwhile, the 65+ years age bracket for the primary householder has the lowest median household income of $40,972, with 265 households (29.8%) in this group.
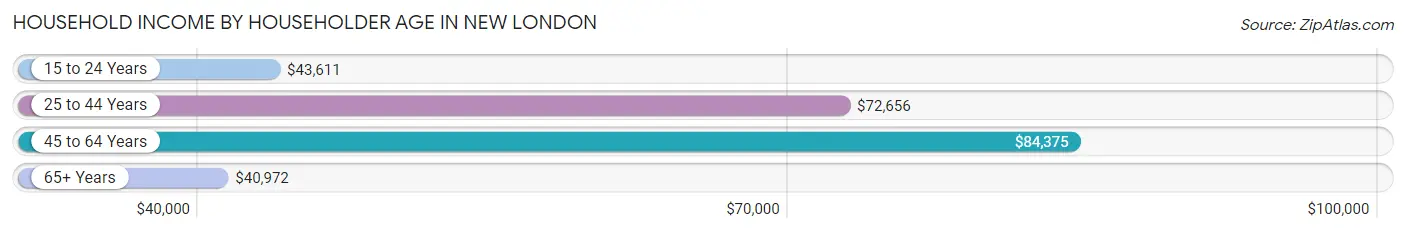
| Income Bracket | # Households | Median Income |
| 15 to 24 Years | 52 (5.9%) | $43,611 |
| 25 to 44 Years | 247 (27.8%) | $72,656 |
| 45 to 64 Years | 324 (36.5%) | $84,375 |
| 65+ Years | 265 (29.8%) | $40,972 |
| Total | 888 (100.0%) | $60,735 |
Poverty in New London
Income Below Poverty by Sex and Age in New London
With 7.4% poverty level for males and 10.7% for females among the residents of New London, 5 year old males and 16 and 17 year old females are the most vulnerable to poverty, with 5 males (71.4%) and 15 females (48.4%) in their respective age groups living below the poverty level.
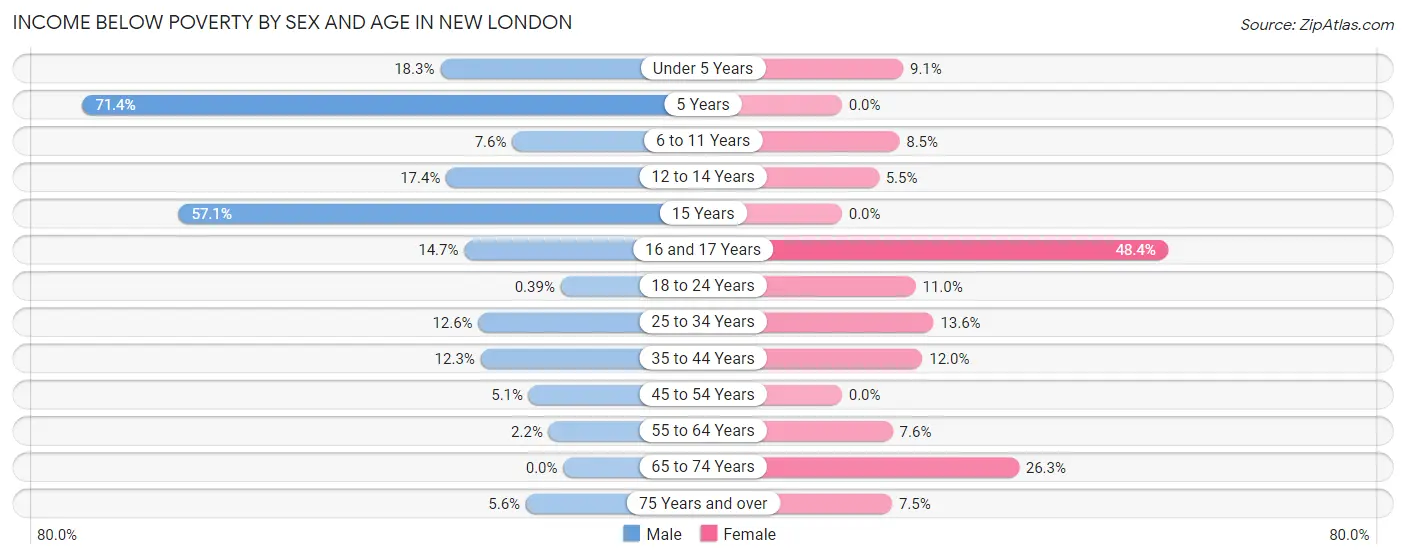
| Age Bracket | Male | Female |
| Under 5 Years | 17 (18.3%) | 9 (9.1%) |
| 5 Years | 5 (71.4%) | 0 (0.0%) |
| 6 to 11 Years | 5 (7.6%) | 7 (8.5%) |
| 12 to 14 Years | 4 (17.4%) | 4 (5.5%) |
| 15 Years | 4 (57.1%) | 0 (0.0%) |
| 16 and 17 Years | 5 (14.7%) | 15 (48.4%) |
| 18 to 24 Years | 1 (0.4%) | 15 (11.0%) |
| 25 to 34 Years | 14 (12.6%) | 26 (13.6%) |
| 35 to 44 Years | 14 (12.3%) | 11 (12.0%) |
| 45 to 54 Years | 11 (5.1%) | 0 (0.0%) |
| 55 to 64 Years | 2 (2.2%) | 8 (7.5%) |
| 65 to 74 Years | 0 (0.0%) | 36 (26.3%) |
| 75 Years and over | 3 (5.6%) | 7 (7.4%) |
| Total | 85 (7.4%) | 138 (10.7%) |
Income Above Poverty by Sex and Age in New London
According to the poverty statistics in New London, males aged 65 to 74 years and females aged 5 years are the age groups that are most secure financially, with 100.0% of males and 100.0% of females in these age groups living above the poverty line.
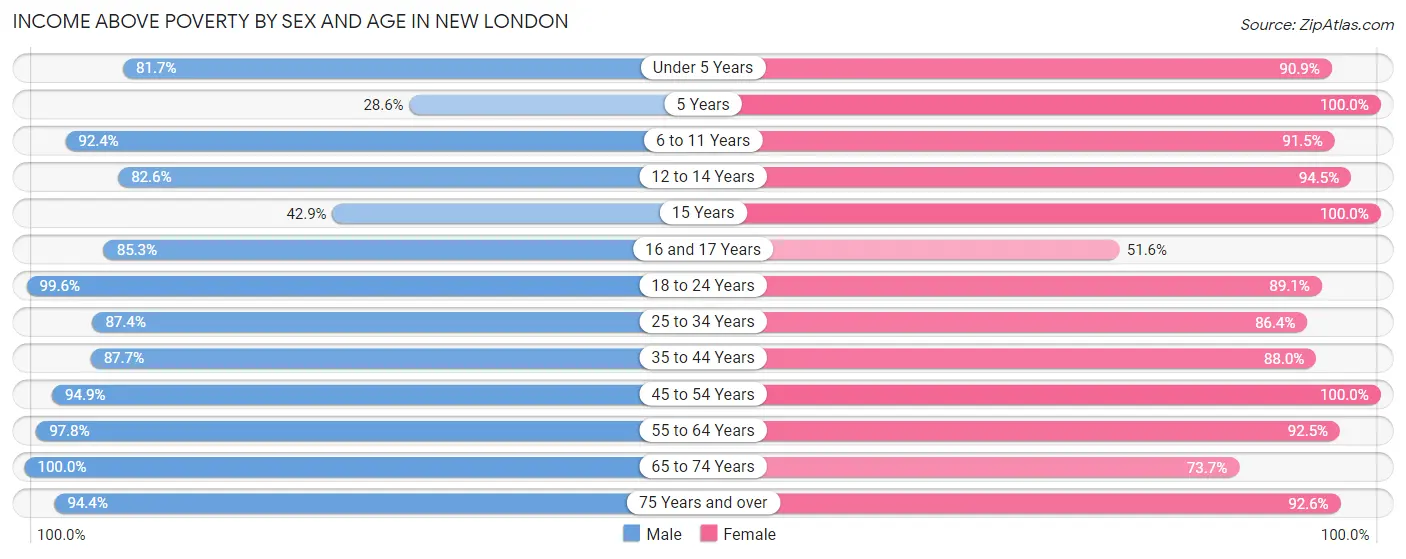
| Age Bracket | Male | Female |
| Under 5 Years | 76 (81.7%) | 90 (90.9%) |
| 5 Years | 2 (28.6%) | 7 (100.0%) |
| 6 to 11 Years | 61 (92.4%) | 75 (91.5%) |
| 12 to 14 Years | 19 (82.6%) | 69 (94.5%) |
| 15 Years | 3 (42.9%) | 23 (100.0%) |
| 16 and 17 Years | 29 (85.3%) | 16 (51.6%) |
| 18 to 24 Years | 253 (99.6%) | 122 (89.0%) |
| 25 to 34 Years | 97 (87.4%) | 165 (86.4%) |
| 35 to 44 Years | 100 (87.7%) | 81 (88.0%) |
| 45 to 54 Years | 204 (94.9%) | 218 (100.0%) |
| 55 to 64 Years | 90 (97.8%) | 98 (92.4%) |
| 65 to 74 Years | 73 (100.0%) | 101 (73.7%) |
| 75 Years and over | 51 (94.4%) | 87 (92.5%) |
| Total | 1,058 (92.6%) | 1,152 (89.3%) |
Income Below Poverty Among Married-Couple Families in New London
The poverty statistics for married-couple families in New London show that 4.1% or 16 of the total 395 families live below the poverty line. Families with no children have the highest poverty rate of 5.0%, comprising of 10 families. On the other hand, families with 3 or 4 children have the lowest poverty rate of 0.0%, which includes 0 families.
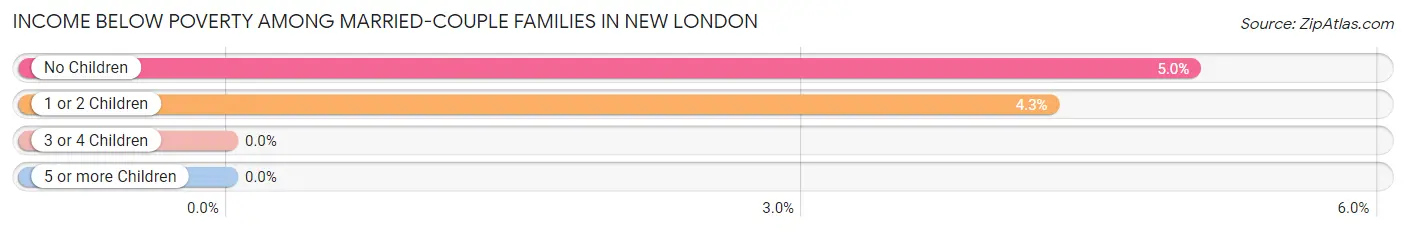
| Children | Above Poverty | Below Poverty |
| No Children | 189 (95.0%) | 10 (5.0%) |
| 1 or 2 Children | 134 (95.7%) | 6 (4.3%) |
| 3 or 4 Children | 56 (100.0%) | 0 (0.0%) |
| 5 or more Children | 0 (0.0%) | 0 (0.0%) |
| Total | 379 (96.0%) | 16 (4.1%) |
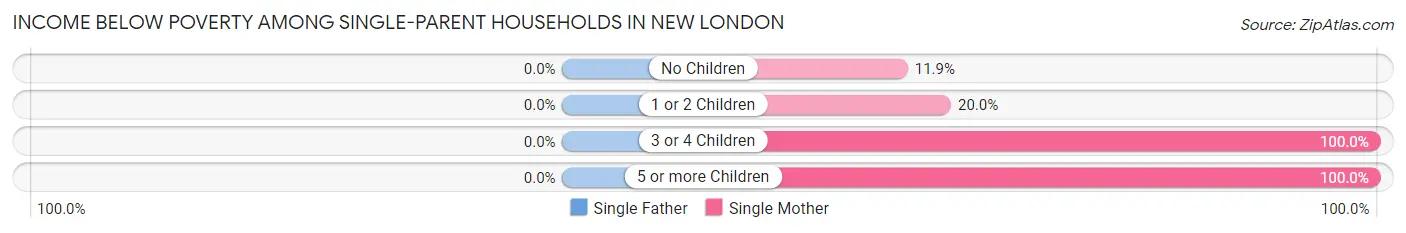
Income Below Poverty Among Single-Parent Households in New London
| Children | Single Father | Single Mother |
| No Children | 0 (0.0%) | 8 (11.9%) |
| 1 or 2 Children | 0 (0.0%) | 13 (20.0%) |
| 3 or 4 Children | 0 (0.0%) | 4 (100.0%) |
| 5 or more Children | 0 (0.0%) | 6 (100.0%) |
| Total | 0 (0.0%) | 31 (21.8%) |
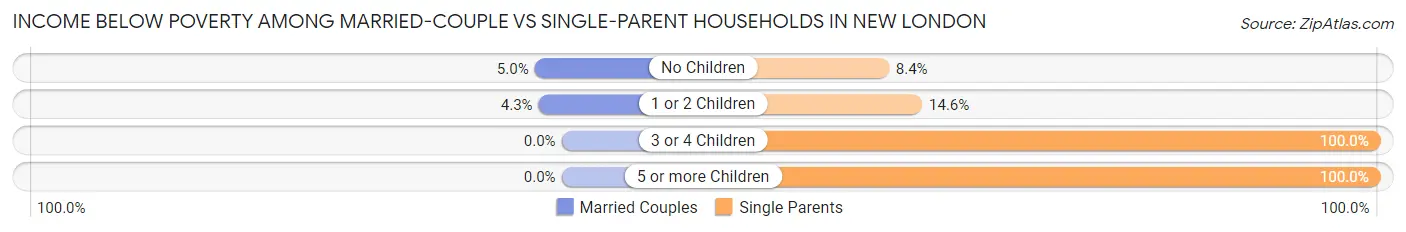
Income Below Poverty Among Married-Couple vs Single-Parent Households in New London
The poverty data for New London shows that 16 of the married-couple family households (4.1%) and 31 of the single-parent households (16.0%) are living below the poverty level. Within the married-couple family households, those with no children have the highest poverty rate, with 10 households (5.0%) falling below the poverty line. Among the single-parent households, those with 3 or 4 children have the highest poverty rate, with 4 household (100.0%) living below poverty.
| Children | Married-Couple Families | Single-Parent Households |
| No Children | 10 (5.0%) | 8 (8.4%) |
| 1 or 2 Children | 6 (4.3%) | 13 (14.6%) |
| 3 or 4 Children | 0 (0.0%) | 4 (100.0%) |
| 5 or more Children | 0 (0.0%) | 6 (100.0%) |
| Total | 16 (4.1%) | 31 (16.0%) |
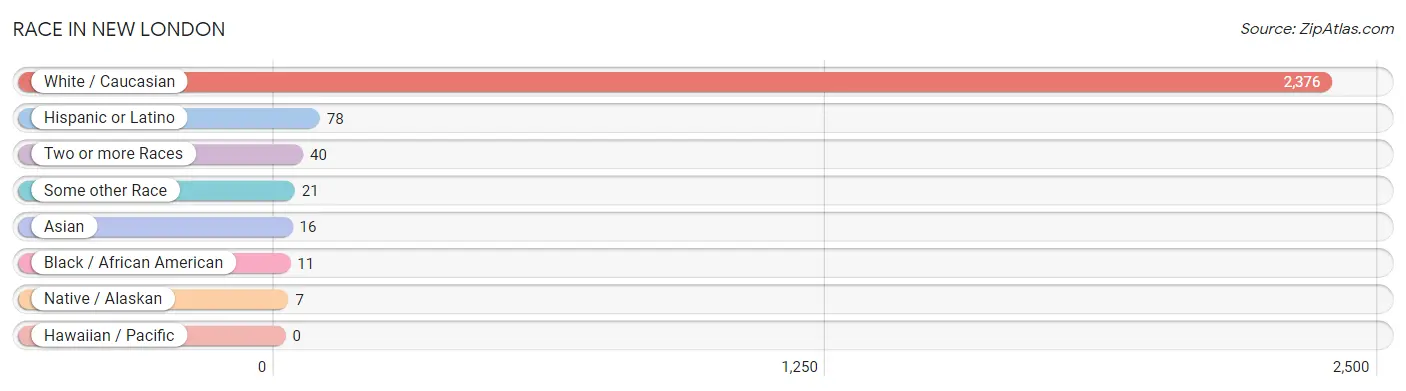
Race in New London
The most populous races in New London are White / Caucasian (2,376 | 96.2%), Hispanic or Latino (78 | 3.2%), and Two or more Races (40 | 1.6%).
| Race | # Population | % Population |
| Asian | 16 | 0.6% |
| Black / African American | 11 | 0.4% |
| Hawaiian / Pacific | 0 | 0.0% |
| Hispanic or Latino | 78 | 3.2% |
| Native / Alaskan | 7 | 0.3% |
| White / Caucasian | 2,376 | 96.2% |
| Two or more Races | 40 | 1.6% |
| Some other Race | 21 | 0.9% |
| Total | 2,471 | 100.0% |
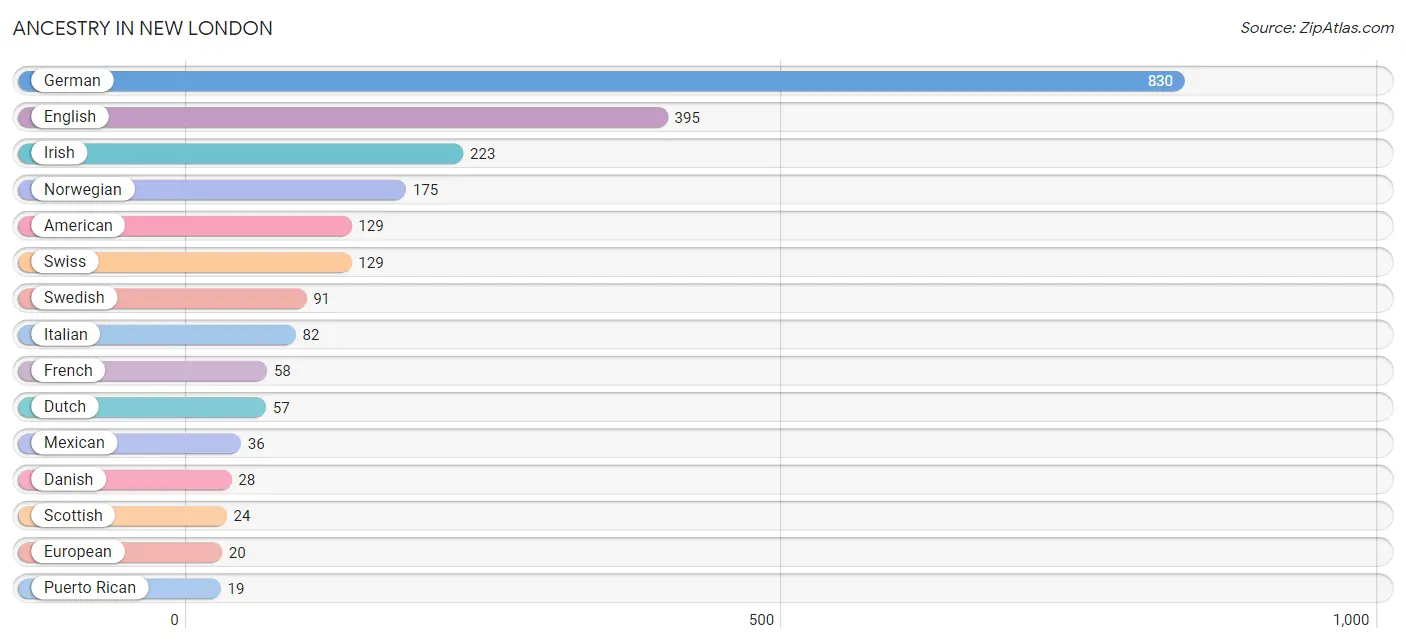
Ancestry in New London
The most populous ancestries reported in New London are German (830 | 33.6%), English (395 | 16.0%), Irish (223 | 9.0%), Norwegian (175 | 7.1%), and American (129 | 5.2%), together accounting for 70.9% of all New London residents.
| Ancestry | # Population | % Population |
| American | 129 | 5.2% |
| Burmese | 11 | 0.4% |
| Celtic | 9 | 0.4% |
| Colombian | 7 | 0.3% |
| Czech | 1 | 0.0% |
| Danish | 28 | 1.1% |
| Dutch | 57 | 2.3% |
| English | 395 | 16.0% |
| Ethiopian | 3 | 0.1% |
| European | 20 | 0.8% |
| French | 58 | 2.4% |
| German | 830 | 33.6% |
| Greek | 13 | 0.5% |
| Hungarian | 2 | 0.1% |
| Irish | 223 | 9.0% |
| Italian | 82 | 3.3% |
| Mexican | 36 | 1.5% |
| Norwegian | 175 | 7.1% |
| Puerto Rican | 19 | 0.8% |
| Russian | 6 | 0.2% |
| Scandinavian | 4 | 0.2% |
| Scotch-Irish | 8 | 0.3% |
| Scottish | 24 | 1.0% |
| South American | 7 | 0.3% |
| Subsaharan African | 3 | 0.1% |
| Swedish | 91 | 3.7% |
| Swiss | 129 | 5.2% |
| Welsh | 6 | 0.2% | View All 28 Rows |
Immigrants in New London
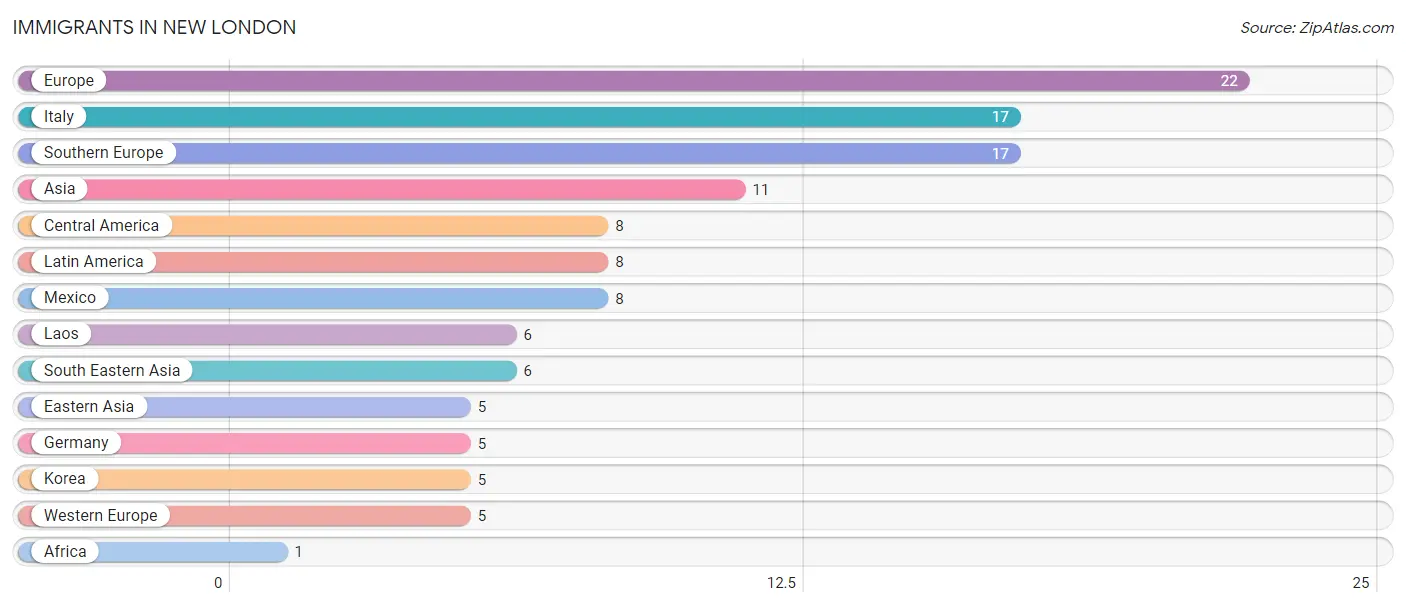
The most numerous immigrant groups reported in New London came from Europe (22 | 0.9%), Italy (17 | 0.7%), Southern Europe (17 | 0.7%), Asia (11 | 0.4%), and Central America (8 | 0.3%), together accounting for 3.0% of all New London residents.
| Immigration Origin | # Population | % Population |
| Africa | 1 | 0.0% |
| Asia | 11 | 0.4% |
| Central America | 8 | 0.3% |
| Eastern Asia | 5 | 0.2% |
| Europe | 22 | 0.9% |
| Germany | 5 | 0.2% |
| Italy | 17 | 0.7% |
| Korea | 5 | 0.2% |
| Laos | 6 | 0.2% |
| Latin America | 8 | 0.3% |
| Mexico | 8 | 0.3% |
| South Eastern Asia | 6 | 0.2% |
| Southern Europe | 17 | 0.7% |
| Western Europe | 5 | 0.2% | View All 14 Rows |
Sex and Age in New London
Sex and Age in New London
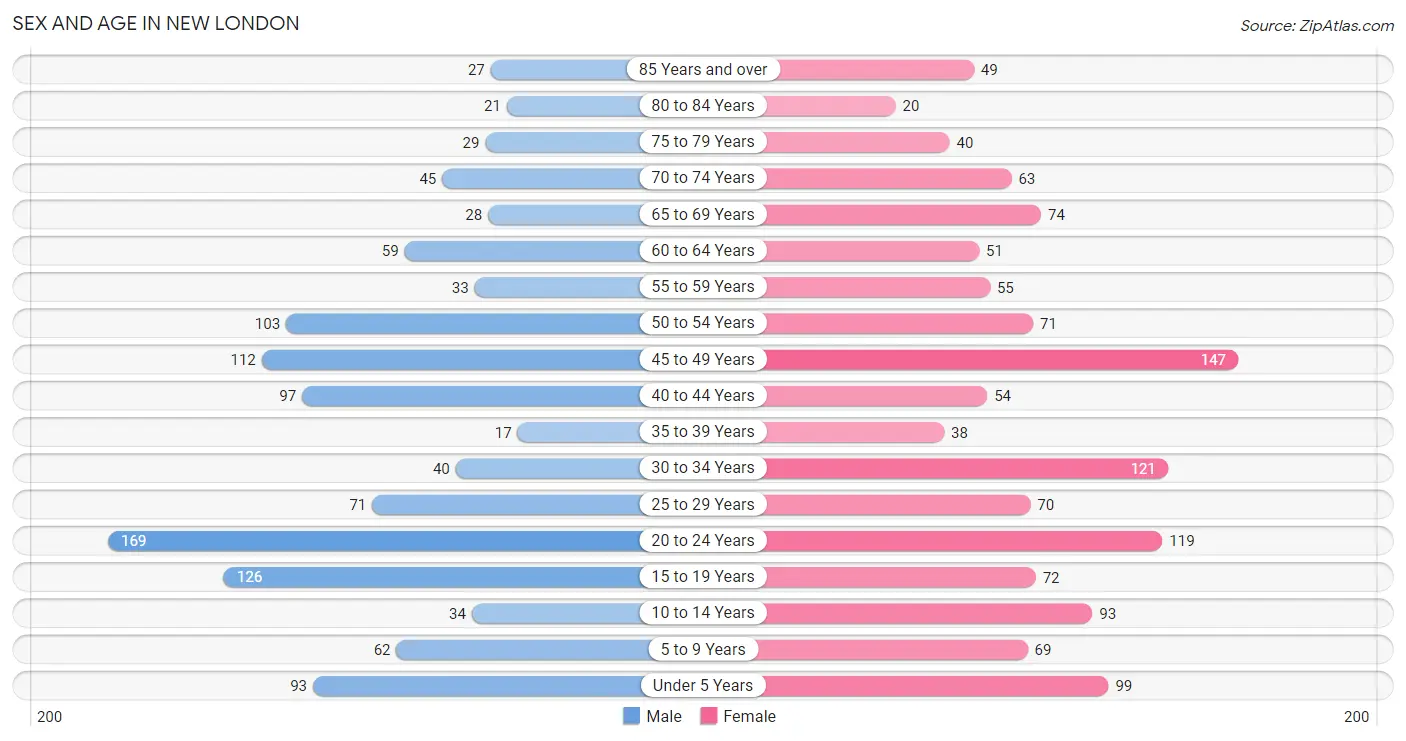
The most populous age groups in New London are 20 to 24 Years (169 | 14.5%) for men and 45 to 49 Years (147 | 11.3%) for women.
| Age Bracket | Male | Female |
| Under 5 Years | 93 (8.0%) | 99 (7.6%) |
| 5 to 9 Years | 62 (5.3%) | 69 (5.3%) |
| 10 to 14 Years | 34 (2.9%) | 93 (7.1%) |
| 15 to 19 Years | 126 (10.8%) | 72 (5.5%) |
| 20 to 24 Years | 169 (14.5%) | 119 (9.1%) |
| 25 to 29 Years | 71 (6.1%) | 70 (5.4%) |
| 30 to 34 Years | 40 (3.4%) | 121 (9.3%) |
| 35 to 39 Years | 17 (1.5%) | 38 (2.9%) |
| 40 to 44 Years | 97 (8.3%) | 54 (4.1%) |
| 45 to 49 Years | 112 (9.6%) | 147 (11.3%) |
| 50 to 54 Years | 103 (8.8%) | 71 (5.4%) |
| 55 to 59 Years | 33 (2.8%) | 55 (4.2%) |
| 60 to 64 Years | 59 (5.1%) | 51 (3.9%) |
| 65 to 69 Years | 28 (2.4%) | 74 (5.7%) |
| 70 to 74 Years | 45 (3.9%) | 63 (4.8%) |
| 75 to 79 Years | 29 (2.5%) | 40 (3.1%) |
| 80 to 84 Years | 21 (1.8%) | 20 (1.5%) |
| 85 Years and over | 27 (2.3%) | 49 (3.7%) |
| Total | 1,166 (100.0%) | 1,305 (100.0%) |
Families and Households in New London
Median Family Size in New London
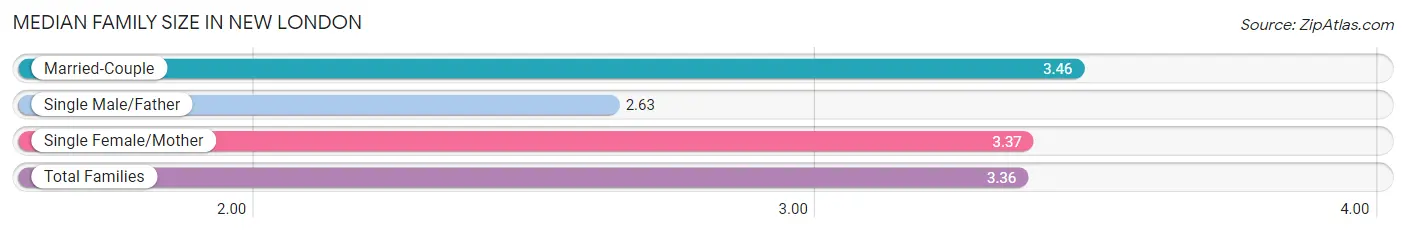
The median family size in New London is 3.36 persons per family, with married-couple families (395 | 67.1%) accounting for the largest median family size of 3.46 persons per family. On the other hand, single male/father families (52 | 8.8%) represent the smallest median family size with 2.63 persons per family.
| Family Type | # Families | Family Size |
| Married-Couple | 395 (67.1%) | 3.46 |
| Single Male/Father | 52 (8.8%) | 2.63 |
| Single Female/Mother | 142 (24.1%) | 3.37 |
| Total Families | 589 (100.0%) | 3.36 |
Median Household Size in New London
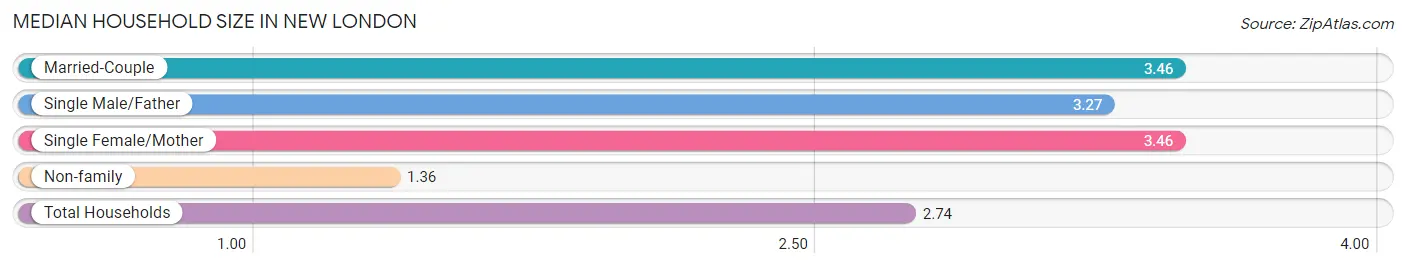
The median household size in New London is 2.74 persons per household, with married-couple households (395 | 44.5%) accounting for the largest median household size of 3.46 persons per household. non-family households (299 | 33.7%) represent the smallest median household size with 1.36 persons per household.
| Household Type | # Households | Household Size |
| Married-Couple | 395 (44.5%) | 3.46 |
| Single Male/Father | 52 (5.9%) | 3.27 |
| Single Female/Mother | 142 (16.0%) | 3.46 |
| Non-family | 299 (33.7%) | 1.36 |
| Total Households | 888 (100.0%) | 2.74 |
Household Size by Marriage Status in New London
Out of a total of 888 households in New London, 589 (66.3%) are family households, while 299 (33.7%) are nonfamily households. The most numerous type of family households are 2-person households, comprising 275, and the most common type of nonfamily households are 1-person households, comprising 225.
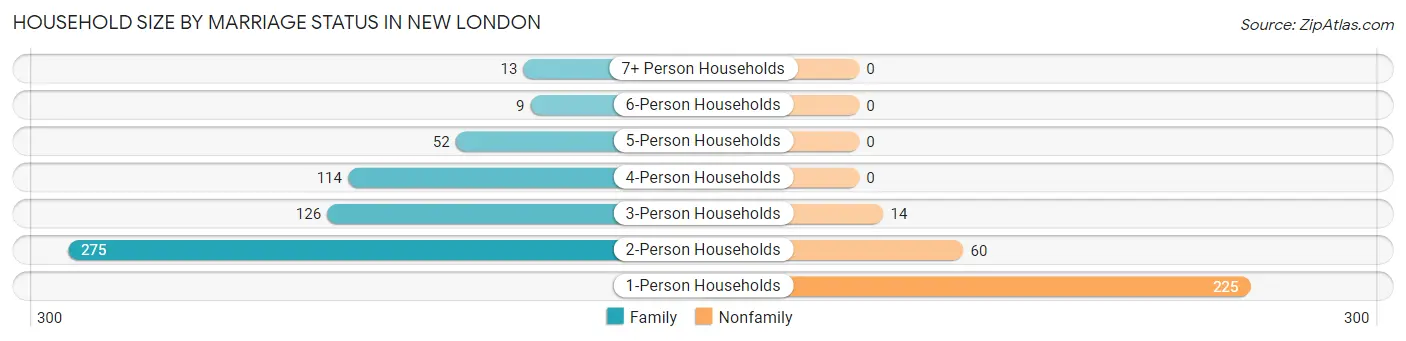
| Household Size | Family Households | Nonfamily Households |
| 1-Person Households | - | 225 (25.3%) |
| 2-Person Households | 275 (31.0%) | 60 (6.8%) |
| 3-Person Households | 126 (14.2%) | 14 (1.6%) |
| 4-Person Households | 114 (12.8%) | 0 (0.0%) |
| 5-Person Households | 52 (5.9%) | 0 (0.0%) |
| 6-Person Households | 9 (1.0%) | 0 (0.0%) |
| 7+ Person Households | 13 (1.5%) | 0 (0.0%) |
| Total | 589 (66.3%) | 299 (33.7%) |
Female Fertility in New London
Fertility by Age in New London
Average fertility rate in New London is 52.0 births per 1,000 women. Women in the age bracket of 20 to 34 years have the highest fertility rate with 106.0 births per 1,000 women. Women in the age bracket of 20 to 34 years acount for 100.0% of all women with births.
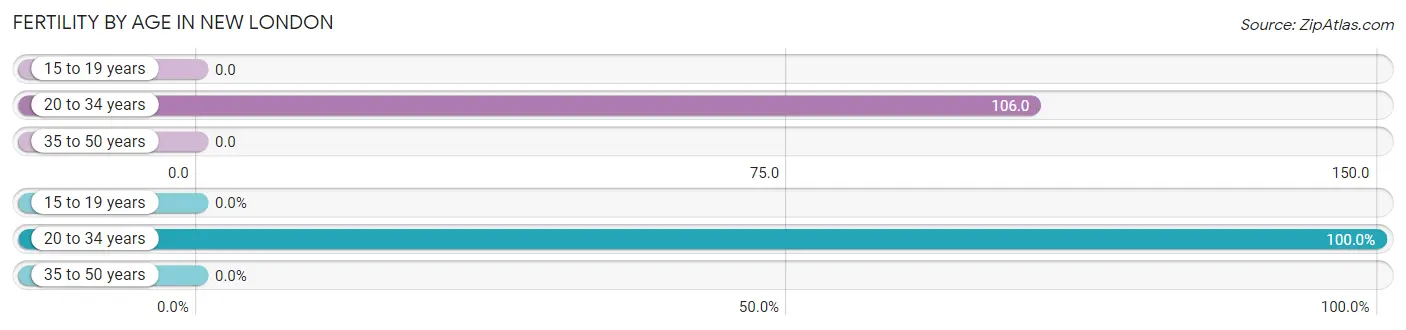
| Age Bracket | Women with Births | Births / 1,000 Women |
| 15 to 19 years | 0 (0.0%) | 0.0 |
| 20 to 34 years | 33 (100.0%) | 106.0 |
| 35 to 50 years | 0 (0.0%) | 0.0 |
| Total | 33 (100.0%) | 52.0 |
Fertility by Age by Marriage Status in New London
45.5% of women with births (33) in New London are married. The highest percentage of unmarried women with births falls into 20 to 34 years age bracket with 54.5% of them unmarried at the time of birth, while the lowest percentage of unmarried women with births belong to 20 to 34 years age bracket with 54.5% of them unmarried.
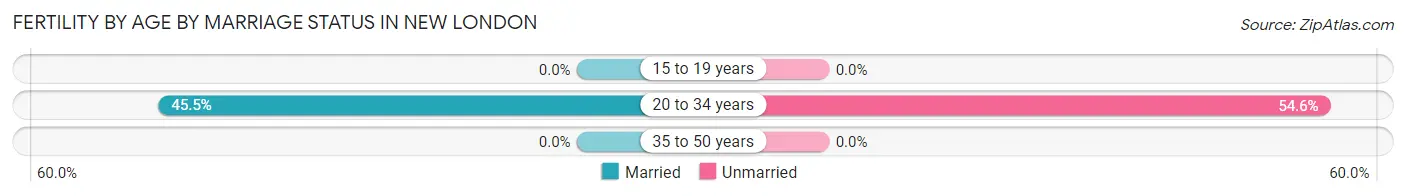
| Age Bracket | Married | Unmarried |
| 15 to 19 years | 0 (0.0%) | 0 (0.0%) |
| 20 to 34 years | 15 (45.5%) | 18 (54.5%) |
| 35 to 50 years | 0 (0.0%) | 0 (0.0%) |
| Total | 15 (45.5%) | 18 (54.5%) |
Fertility by Education in New London
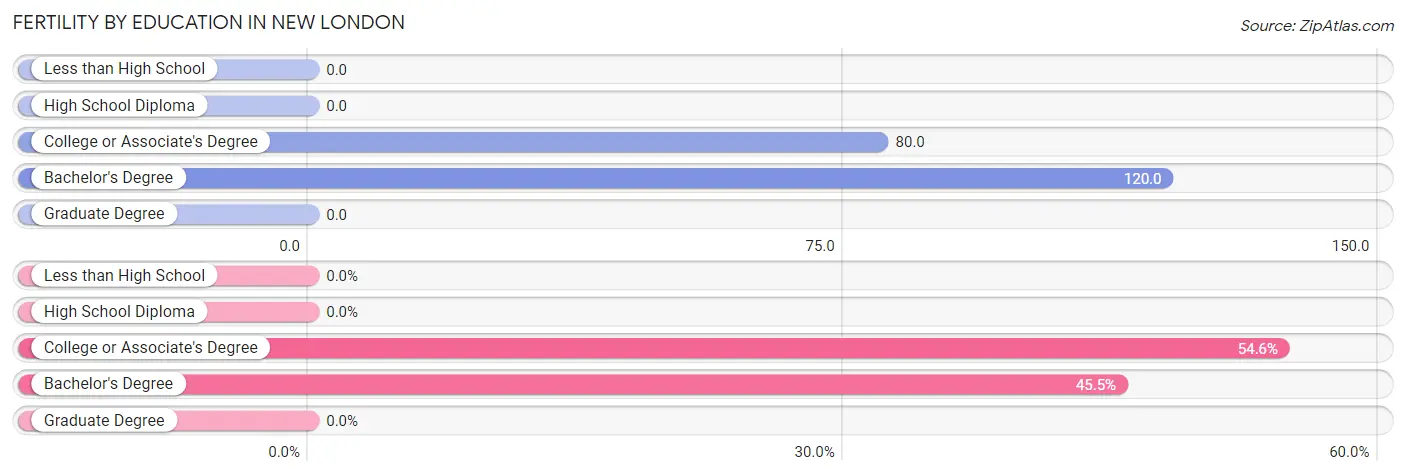
| Educational Attainment | Women with Births | Births / 1,000 Women |
| Less than High School | 0 (0.0%) | 0.0 |
| High School Diploma | 0 (0.0%) | 0.0 |
| College or Associate's Degree | 18 (54.5%) | 80.0 |
| Bachelor's Degree | 15 (45.5%) | 120.0 |
| Graduate Degree | 0 (0.0%) | 0.0 |
| Total | 33 (100.0%) | 52.0 |
Fertility by Education by Marriage Status in New London
54.5% of women with births in New London are unmarried. Women with the educational attainment of bachelor's degree are most likely to be married with 100.0% of them married at childbirth, while women with the educational attainment of college or associate's degree are least likely to be married with 100.0% of them unmarried at childbirth.
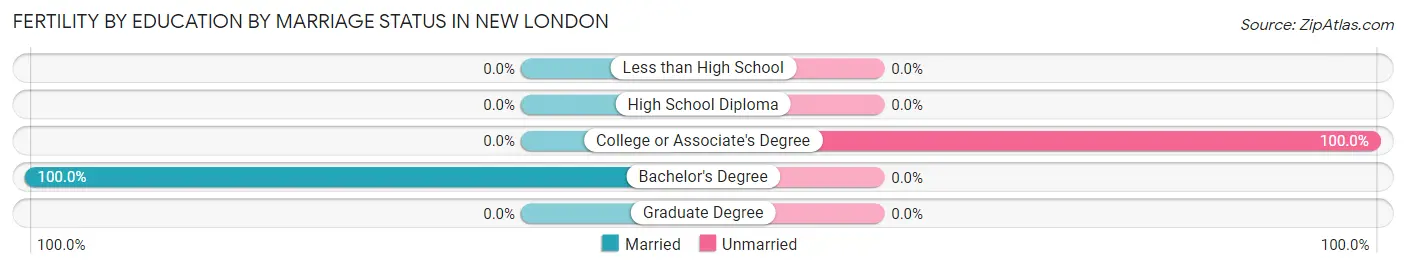
| Educational Attainment | Married | Unmarried |
| Less than High School | 0 (0.0%) | 0 (0.0%) |
| High School Diploma | 0 (0.0%) | 0 (0.0%) |
| College or Associate's Degree | 0 (0.0%) | 18 (100.0%) |
| Bachelor's Degree | 15 (100.0%) | 0 (0.0%) |
| Graduate Degree | 0 (0.0%) | 0 (0.0%) |
| Total | 15 (45.5%) | 18 (54.5%) |
Employment Characteristics in New London
Employment by Class of Employer in New London
Among the 1,286 employed individuals in New London, private company employees (895 | 69.6%), not-for-profit organizations (144 | 11.2%), and local government employees (83 | 6.5%) make up the most common classes of employment.
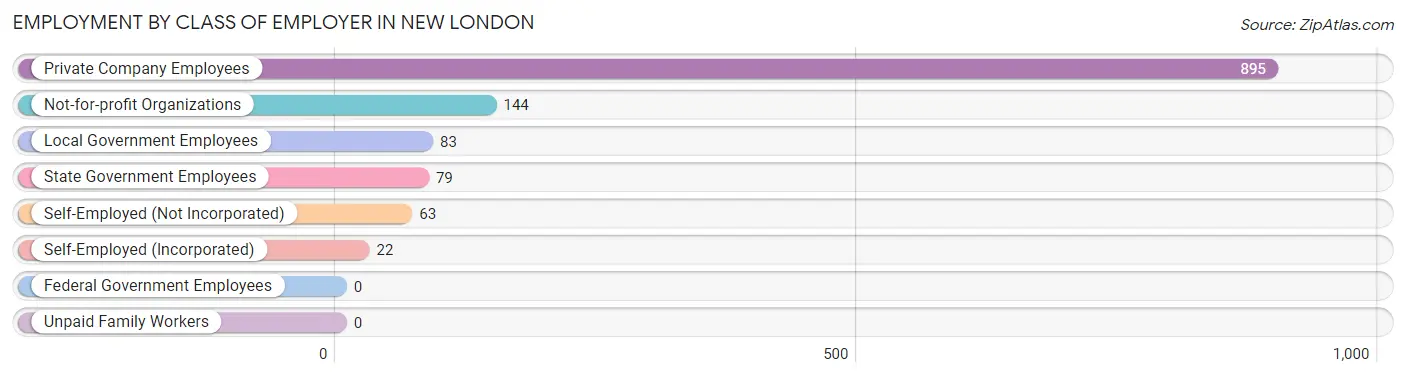
| Employer Class | # Employees | % Employees |
| Private Company Employees | 895 | 69.6% |
| Self-Employed (Incorporated) | 22 | 1.7% |
| Self-Employed (Not Incorporated) | 63 | 4.9% |
| Not-for-profit Organizations | 144 | 11.2% |
| Local Government Employees | 83 | 6.5% |
| State Government Employees | 79 | 6.1% |
| Federal Government Employees | 0 | 0.0% |
| Unpaid Family Workers | 0 | 0.0% |
| Total | 1,286 | 100.0% |
Employment Status by Age in New London
According to the labor force statistics for New London, out of the total population over 16 years of age (1,991), 66.4% or 1,322 individuals are in the labor force, with 2.5% or 33 of them unemployed. The age group with the highest labor force participation rate is 30 to 34 years, with 98.8% or 159 individuals in the labor force. Within the labor force, the 75 years and over age range has the highest percentage of unemployed individuals, with 13.0% or 3 of them being unemployed.
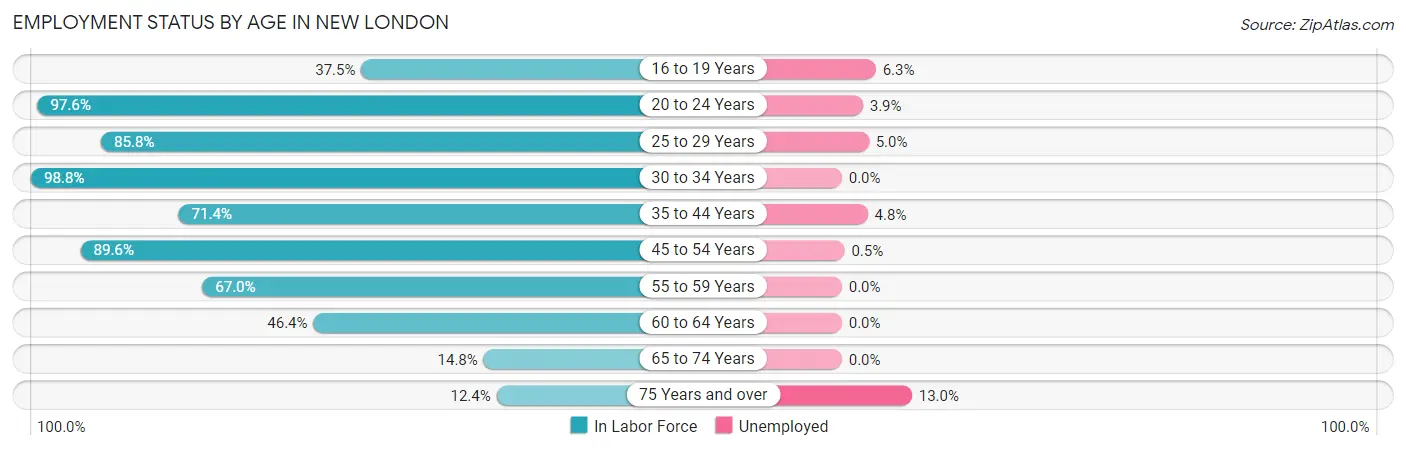
| Age Bracket | In Labor Force | Unemployed |
| 16 to 19 Years | 63 (37.5%) | 4 (6.3%) |
| 20 to 24 Years | 281 (97.6%) | 11 (3.9%) |
| 25 to 29 Years | 121 (85.8%) | 6 (5.0%) |
| 30 to 34 Years | 159 (98.8%) | 0 (0.0%) |
| 35 to 44 Years | 147 (71.4%) | 7 (4.8%) |
| 45 to 54 Years | 388 (89.6%) | 2 (0.5%) |
| 55 to 59 Years | 59 (67.0%) | 0 (0.0%) |
| 60 to 64 Years | 51 (46.4%) | 0 (0.0%) |
| 65 to 74 Years | 31 (14.8%) | 0 (0.0%) |
| 75 Years and over | 23 (12.4%) | 3 (13.0%) |
| Total | 1,322 (66.4%) | 33 (2.5%) |
Employment Status by Educational Attainment in New London
According to labor force statistics for New London, 81.2% of individuals (925) out of the total population between 25 and 64 years of age (1,139) are in the labor force, with 1.6% or 15 of them being unemployed. The group with the highest labor force participation rate are those with the educational attainment of bachelor's degree or higher, with 88.0% or 227 individuals in the labor force. Within the labor force, individuals with less than high school education have the highest percentage of unemployment, with 14.3% or 1 of them being unemployed.
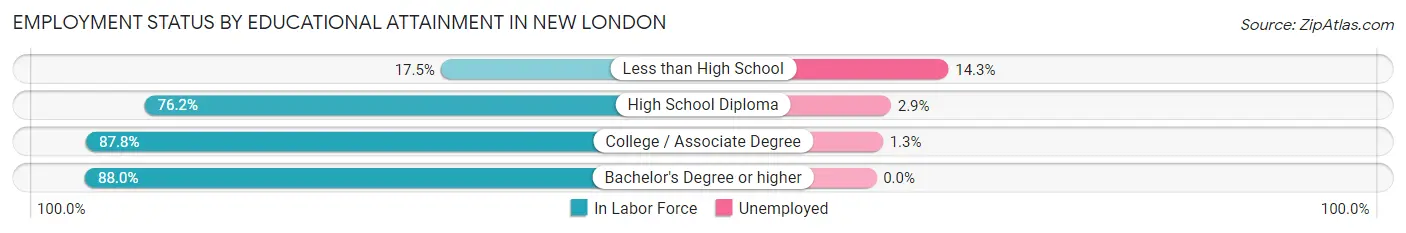
| Educational Attainment | In Labor Force | Unemployed |
| Less than High School | 7 (17.5%) | 6 (14.3%) |
| High School Diploma | 311 (76.2%) | 12 (2.9%) |
| College / Associate Degree | 380 (87.8%) | 6 (1.3%) |
| Bachelor's Degree or higher | 227 (88.0%) | 0 (0.0%) |
| Total | 925 (81.2%) | 18 (1.6%) |
Employment Occupations by Sex in New London
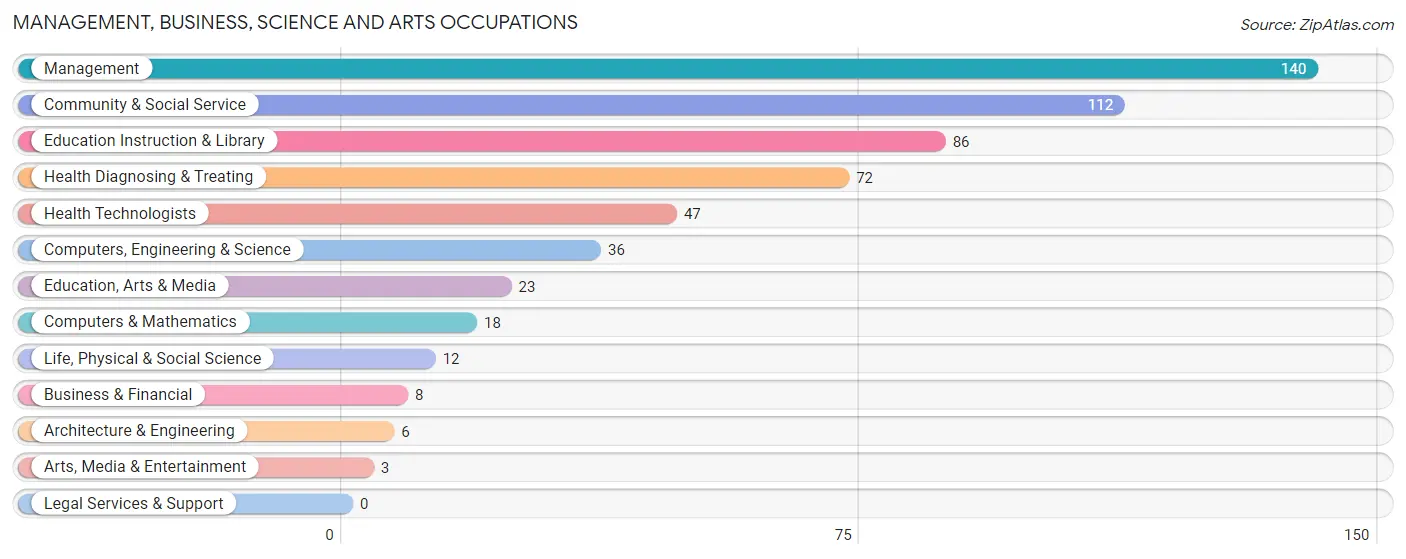
Management, Business, Science and Arts Occupations
The most common Management, Business, Science and Arts occupations in New London are Management (140 | 10.8%), Community & Social Service (112 | 8.7%), Education Instruction & Library (86 | 6.7%), Health Diagnosing & Treating (72 | 5.6%), and Health Technologists (47 | 3.6%).
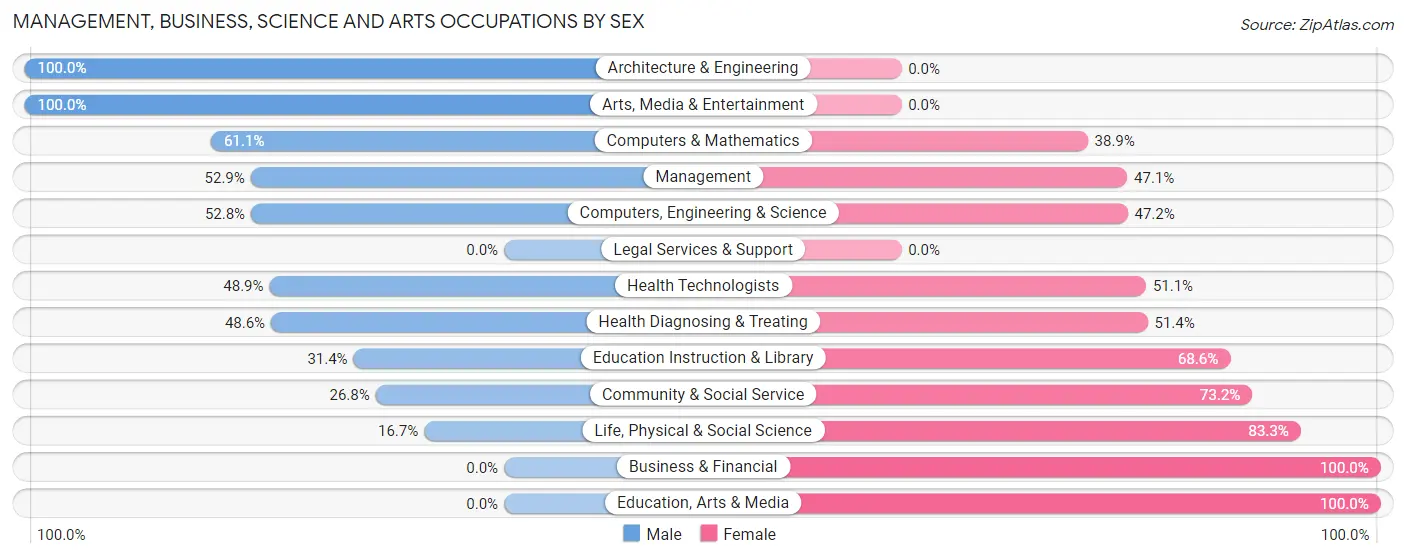
Management, Business, Science and Arts Occupations by Sex
Within the Management, Business, Science and Arts occupations in New London, the most male-oriented occupations are Architecture & Engineering (100.0%), Arts, Media & Entertainment (100.0%), and Computers & Mathematics (61.1%), while the most female-oriented occupations are Business & Financial (100.0%), Education, Arts & Media (100.0%), and Life, Physical & Social Science (83.3%).
| Occupation | Male | Female |
| Management | 74 (52.9%) | 66 (47.1%) |
| Business & Financial | 0 (0.0%) | 8 (100.0%) |
| Computers, Engineering & Science | 19 (52.8%) | 17 (47.2%) |
| Computers & Mathematics | 11 (61.1%) | 7 (38.9%) |
| Architecture & Engineering | 6 (100.0%) | 0 (0.0%) |
| Life, Physical & Social Science | 2 (16.7%) | 10 (83.3%) |
| Community & Social Service | 30 (26.8%) | 82 (73.2%) |
| Education, Arts & Media | 0 (0.0%) | 23 (100.0%) |
| Legal Services & Support | 0 (0.0%) | 0 (0.0%) |
| Education Instruction & Library | 27 (31.4%) | 59 (68.6%) |
| Arts, Media & Entertainment | 3 (100.0%) | 0 (0.0%) |
| Health Diagnosing & Treating | 35 (48.6%) | 37 (51.4%) |
| Health Technologists | 23 (48.9%) | 24 (51.1%) |
| Total (Category) | 158 (42.9%) | 210 (57.1%) |
| Total (Overall) | 661 (51.2%) | 629 (48.8%) |
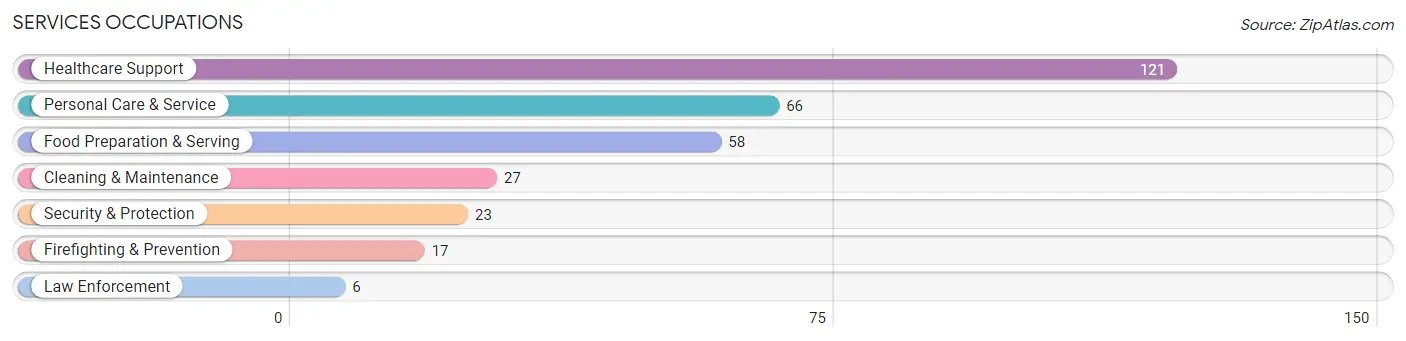
Services Occupations
The most common Services occupations in New London are Healthcare Support (121 | 9.4%), Personal Care & Service (66 | 5.1%), Food Preparation & Serving (58 | 4.5%), Cleaning & Maintenance (27 | 2.1%), and Security & Protection (23 | 1.8%).
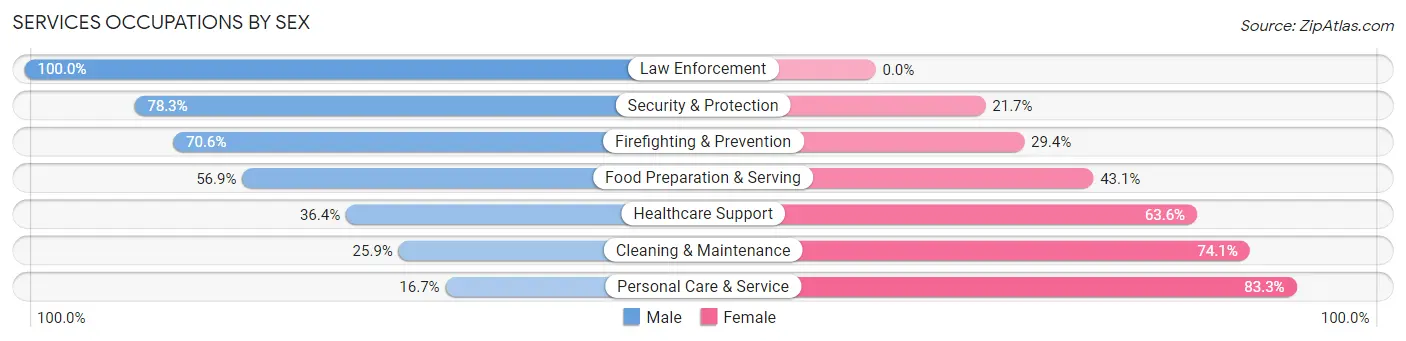
Services Occupations by Sex
Within the Services occupations in New London, the most male-oriented occupations are Law Enforcement (100.0%), Security & Protection (78.3%), and Firefighting & Prevention (70.6%), while the most female-oriented occupations are Personal Care & Service (83.3%), Cleaning & Maintenance (74.1%), and Healthcare Support (63.6%).
| Occupation | Male | Female |
| Healthcare Support | 44 (36.4%) | 77 (63.6%) |
| Security & Protection | 18 (78.3%) | 5 (21.7%) |
| Firefighting & Prevention | 12 (70.6%) | 5 (29.4%) |
| Law Enforcement | 6 (100.0%) | 0 (0.0%) |
| Food Preparation & Serving | 33 (56.9%) | 25 (43.1%) |
| Cleaning & Maintenance | 7 (25.9%) | 20 (74.1%) |
| Personal Care & Service | 11 (16.7%) | 55 (83.3%) |
| Total (Category) | 113 (38.3%) | 182 (61.7%) |
| Total (Overall) | 661 (51.2%) | 629 (48.8%) |
Sales and Office Occupations
The most common Sales and Office occupations in New London are Office & Administration (149 | 11.6%), and Sales & Related (93 | 7.2%).
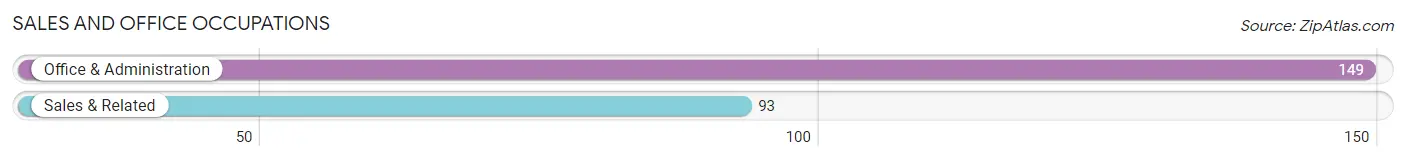
Sales and Office Occupations by Sex
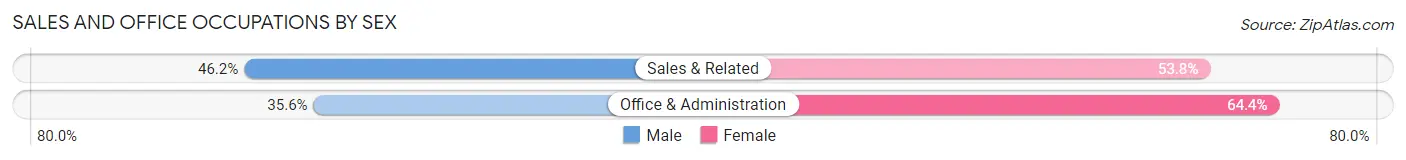
| Occupation | Male | Female |
| Sales & Related | 43 (46.2%) | 50 (53.8%) |
| Office & Administration | 53 (35.6%) | 96 (64.4%) |
| Total (Category) | 96 (39.7%) | 146 (60.3%) |
| Total (Overall) | 661 (51.2%) | 629 (48.8%) |
Natural Resources, Construction and Maintenance Occupations
The most common Natural Resources, Construction and Maintenance occupations in New London are Installation, Maintenance & Repair (70 | 5.4%), and Construction & Extraction (53 | 4.1%).
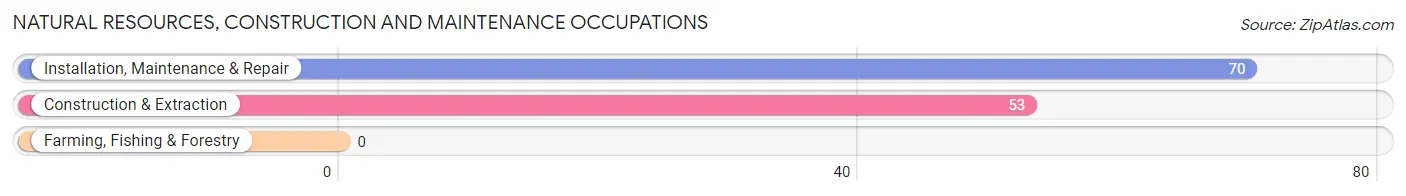
Natural Resources, Construction and Maintenance Occupations by Sex
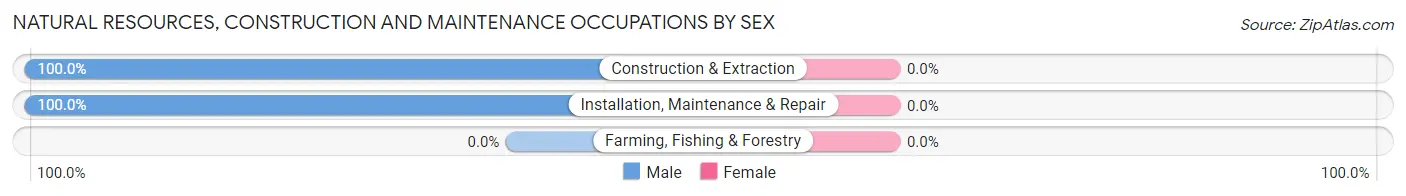
| Occupation | Male | Female |
| Farming, Fishing & Forestry | 0 (0.0%) | 0 (0.0%) |
| Construction & Extraction | 53 (100.0%) | 0 (0.0%) |
| Installation, Maintenance & Repair | 70 (100.0%) | 0 (0.0%) |
| Total (Category) | 123 (100.0%) | 0 (0.0%) |
| Total (Overall) | 661 (51.2%) | 629 (48.8%) |
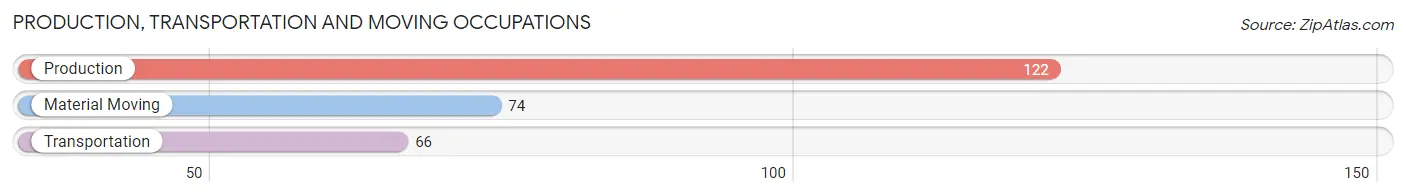
Production, Transportation and Moving Occupations
The most common Production, Transportation and Moving occupations in New London are Production (122 | 9.5%), Material Moving (74 | 5.7%), and Transportation (66 | 5.1%).
Production, Transportation and Moving Occupations by Sex
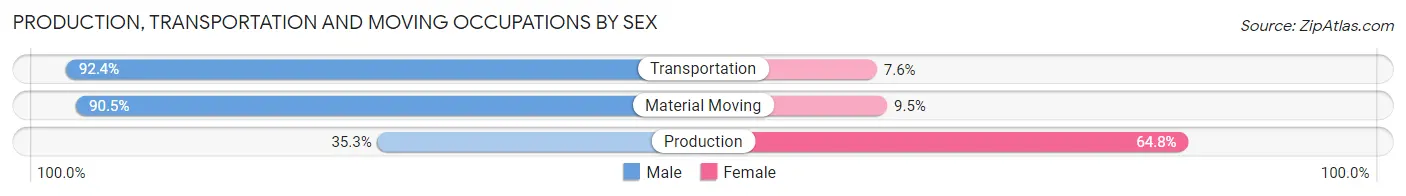
| Occupation | Male | Female |
| Production | 43 (35.2%) | 79 (64.7%) |
| Transportation | 61 (92.4%) | 5 (7.6%) |
| Material Moving | 67 (90.5%) | 7 (9.5%) |
| Total (Category) | 171 (65.3%) | 91 (34.7%) |
| Total (Overall) | 661 (51.2%) | 629 (48.8%) |
Employment Industries by Sex in New London
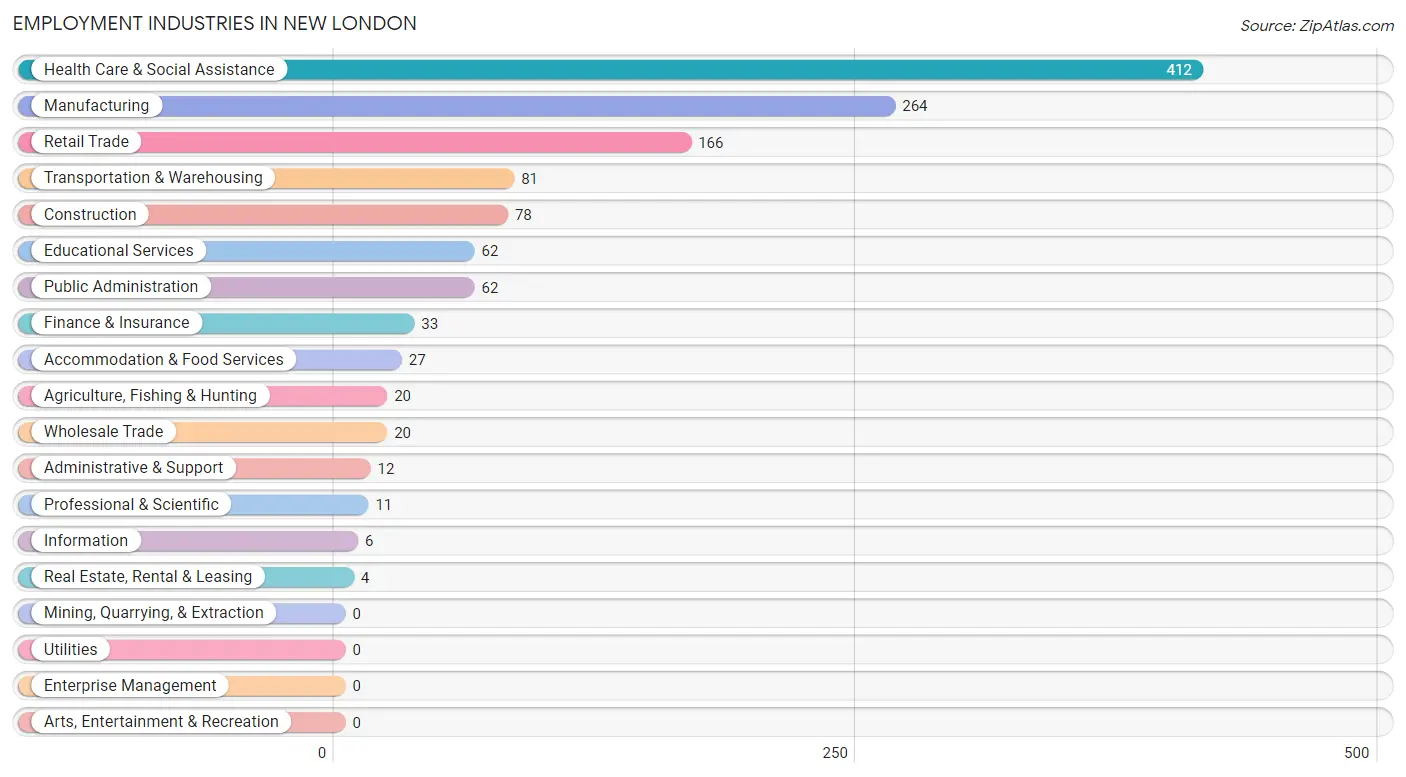
Employment Industries in New London
The major employment industries in New London include Health Care & Social Assistance (412 | 31.9%), Manufacturing (264 | 20.5%), Retail Trade (166 | 12.9%), Transportation & Warehousing (81 | 6.3%), and Construction (78 | 6.0%).
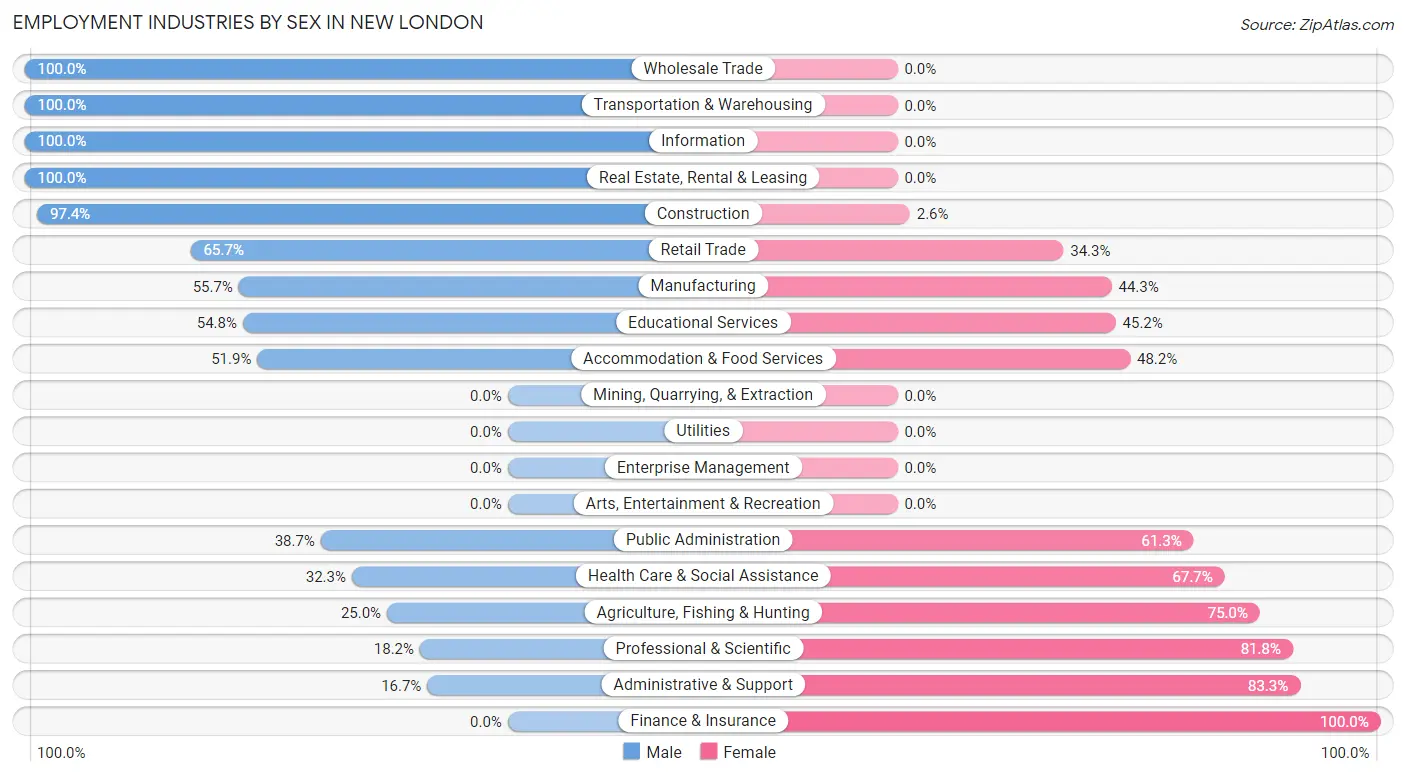
Employment Industries by Sex in New London
The New London industries that see more men than women are Wholesale Trade (100.0%), Transportation & Warehousing (100.0%), and Information (100.0%), whereas the industries that tend to have a higher number of women are Finance & Insurance (100.0%), Administrative & Support (83.3%), and Professional & Scientific (81.8%).
| Industry | Male | Female |
| Agriculture, Fishing & Hunting | 5 (25.0%) | 15 (75.0%) |
| Mining, Quarrying, & Extraction | 0 (0.0%) | 0 (0.0%) |
| Construction | 76 (97.4%) | 2 (2.6%) |
| Manufacturing | 147 (55.7%) | 117 (44.3%) |
| Wholesale Trade | 20 (100.0%) | 0 (0.0%) |
| Retail Trade | 109 (65.7%) | 57 (34.3%) |
| Transportation & Warehousing | 81 (100.0%) | 0 (0.0%) |
| Utilities | 0 (0.0%) | 0 (0.0%) |
| Information | 6 (100.0%) | 0 (0.0%) |
| Finance & Insurance | 0 (0.0%) | 33 (100.0%) |
| Real Estate, Rental & Leasing | 4 (100.0%) | 0 (0.0%) |
| Professional & Scientific | 2 (18.2%) | 9 (81.8%) |
| Enterprise Management | 0 (0.0%) | 0 (0.0%) |
| Administrative & Support | 2 (16.7%) | 10 (83.3%) |
| Educational Services | 34 (54.8%) | 28 (45.2%) |
| Health Care & Social Assistance | 133 (32.3%) | 279 (67.7%) |
| Arts, Entertainment & Recreation | 0 (0.0%) | 0 (0.0%) |
| Accommodation & Food Services | 14 (51.8%) | 13 (48.1%) |
| Public Administration | 24 (38.7%) | 38 (61.3%) |
| Total | 661 (51.2%) | 629 (48.8%) |
Education in New London
School Enrollment in New London
The most common levels of schooling among the 474 students in New London are college / undergraduate (120 | 25.3%), high school (113 | 23.8%), and elementary school (89 | 18.8%).
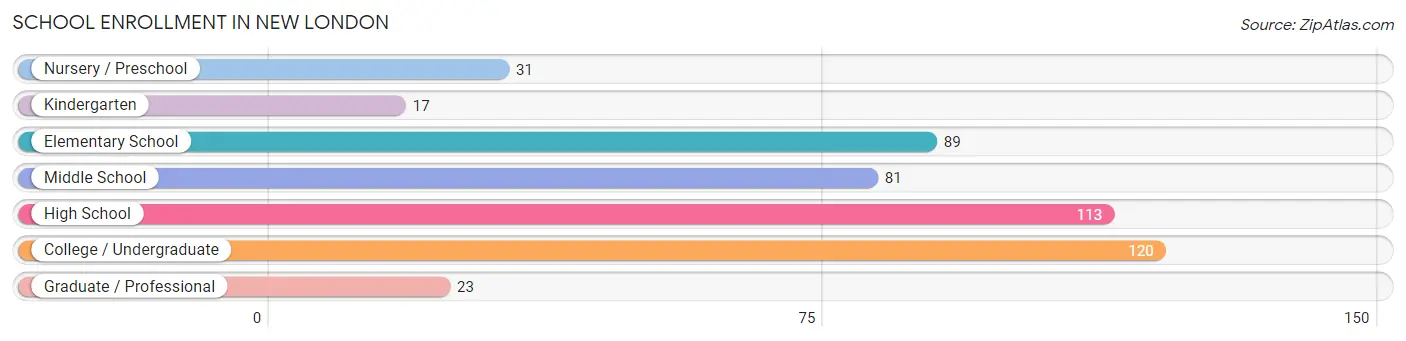
| School Level | # Students | % Students |
| Nursery / Preschool | 31 | 6.5% |
| Kindergarten | 17 | 3.6% |
| Elementary School | 89 | 18.8% |
| Middle School | 81 | 17.1% |
| High School | 113 | 23.8% |
| College / Undergraduate | 120 | 25.3% |
| Graduate / Professional | 23 | 4.9% |
| Total | 474 | 100.0% |
School Enrollment by Age by Funding Source in New London
Out of a total of 474 students who are enrolled in schools in New London, 41 (8.6%) attend a private institution, while the remaining 433 (91.4%) are enrolled in public schools. The age group of 3 to 4 year olds has the highest likelihood of being enrolled in private schools, with 16 (57.1% in the age bracket) enrolled. Conversely, the age group of 10 to 14 year olds has the lowest likelihood of being enrolled in a private school, with 102 (100.0% in the age bracket) attending a public institution.
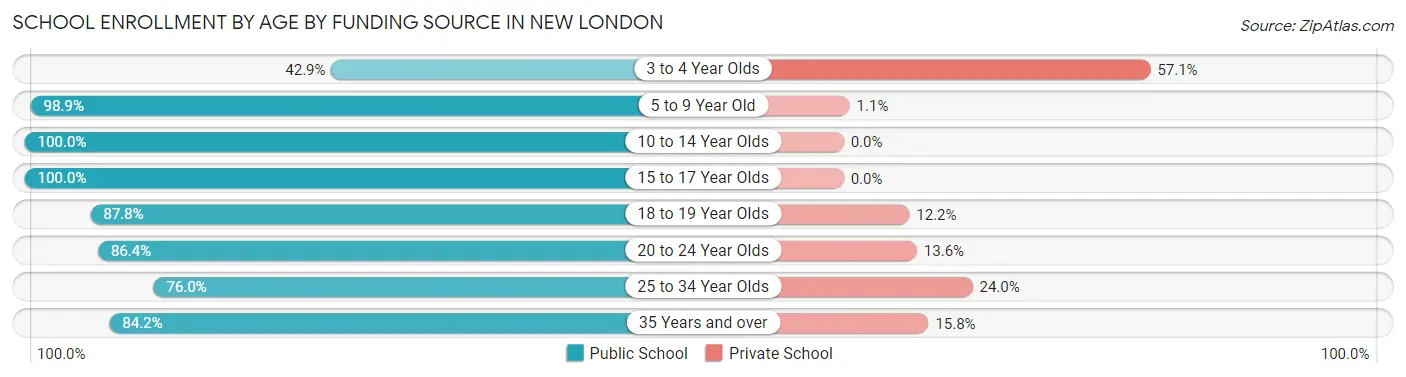
| Age Bracket | Public School | Private School |
| 3 to 4 Year Olds | 12 (42.9%) | 16 (57.1%) |
| 5 to 9 Year Old | 89 (98.9%) | 1 (1.1%) |
| 10 to 14 Year Olds | 102 (100.0%) | 0 (0.0%) |
| 15 to 17 Year Olds | 95 (100.0%) | 0 (0.0%) |
| 18 to 19 Year Olds | 43 (87.8%) | 6 (12.2%) |
| 20 to 24 Year Olds | 57 (86.4%) | 9 (13.6%) |
| 25 to 34 Year Olds | 19 (76.0%) | 6 (24.0%) |
| 35 Years and over | 16 (84.2%) | 3 (15.8%) |
| Total | 433 (91.4%) | 41 (8.6%) |
Educational Attainment by Field of Study in New London
Education (104 | 30.9%), business (71 | 21.1%), bio, nature & agricultural (32 | 9.5%), social sciences (24 | 7.1%), and science & technology (23 | 6.9%) are the most common fields of study among 336 individuals in New London who have obtained a bachelor's degree or higher.
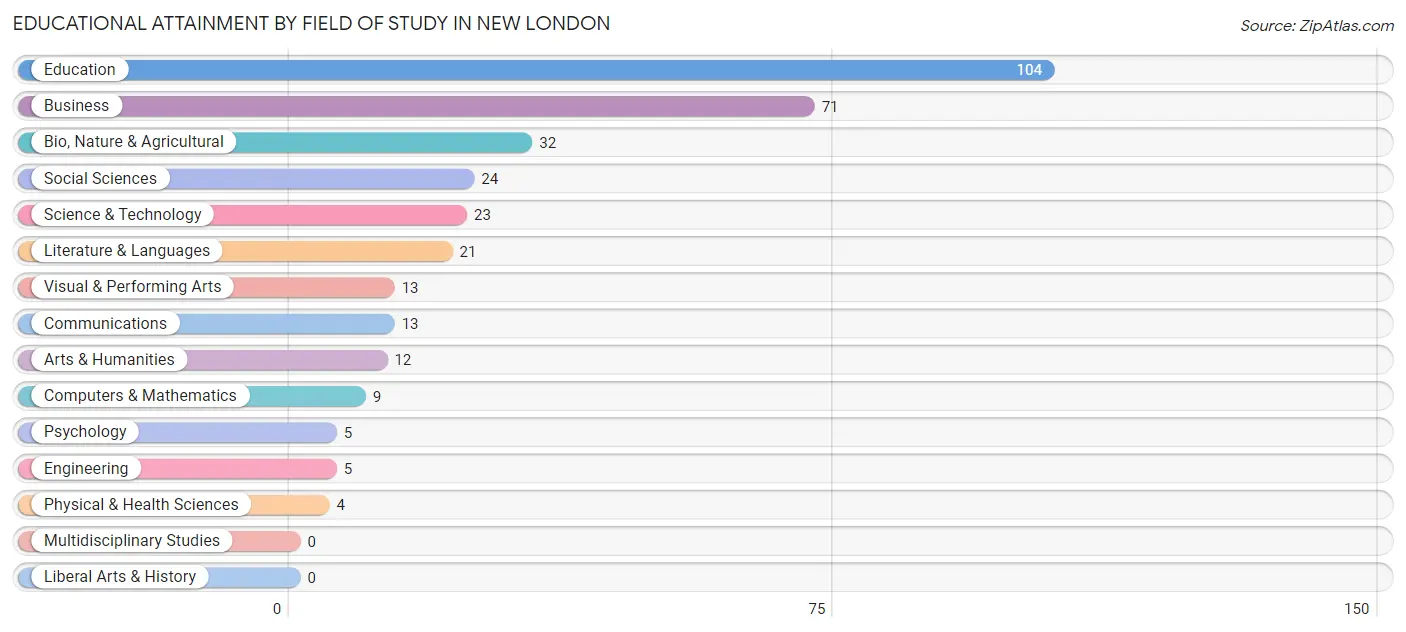
| Field of Study | # Graduates | % Graduates |
| Computers & Mathematics | 9 | 2.7% |
| Bio, Nature & Agricultural | 32 | 9.5% |
| Physical & Health Sciences | 4 | 1.2% |
| Psychology | 5 | 1.5% |
| Social Sciences | 24 | 7.1% |
| Engineering | 5 | 1.5% |
| Multidisciplinary Studies | 0 | 0.0% |
| Science & Technology | 23 | 6.9% |
| Business | 71 | 21.1% |
| Education | 104 | 30.9% |
| Literature & Languages | 21 | 6.2% |
| Liberal Arts & History | 0 | 0.0% |
| Visual & Performing Arts | 13 | 3.9% |
| Communications | 13 | 3.9% |
| Arts & Humanities | 12 | 3.6% |
| Total | 336 | 100.0% |
Transportation & Commute in New London
Vehicle Availability by Sex in New London
The most prevalent vehicle ownership categories in New London are males with 2 vehicles (278, accounting for 42.1%) and females with 2 vehicles (346, making up 44.5%).
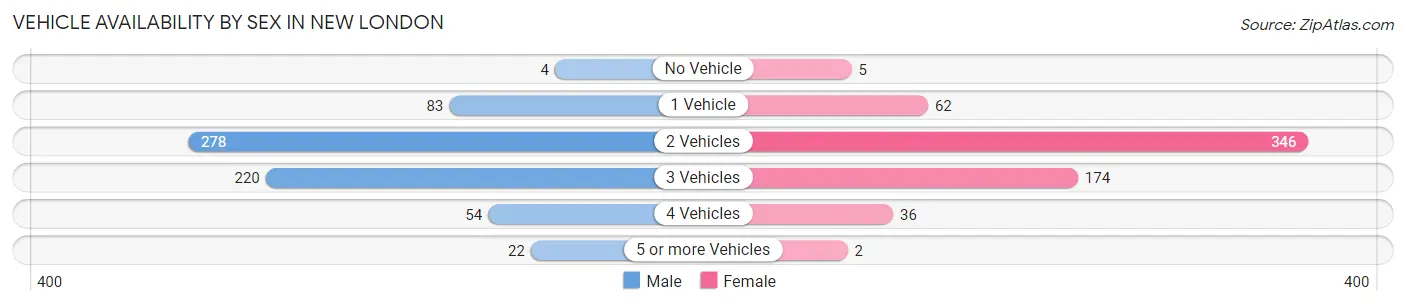
| Vehicles Available | Male | Female |
| No Vehicle | 4 (0.6%) | 5 (0.8%) |
| 1 Vehicle | 83 (12.6%) | 62 (9.9%) |
| 2 Vehicles | 278 (42.1%) | 346 (55.4%) |
| 3 Vehicles | 220 (33.3%) | 174 (27.8%) |
| 4 Vehicles | 54 (8.2%) | 36 (5.8%) |
| 5 or more Vehicles | 22 (3.3%) | 2 (0.3%) |
| Total | 661 (100.0%) | 625 (100.0%) |
Commute Time in New London
The most frequently occuring commute durations in New London are 15 to 19 minutes (253 commuters, 20.2%), 20 to 24 minutes (230 commuters, 18.3%), and less than 5 minutes (198 commuters, 15.8%).
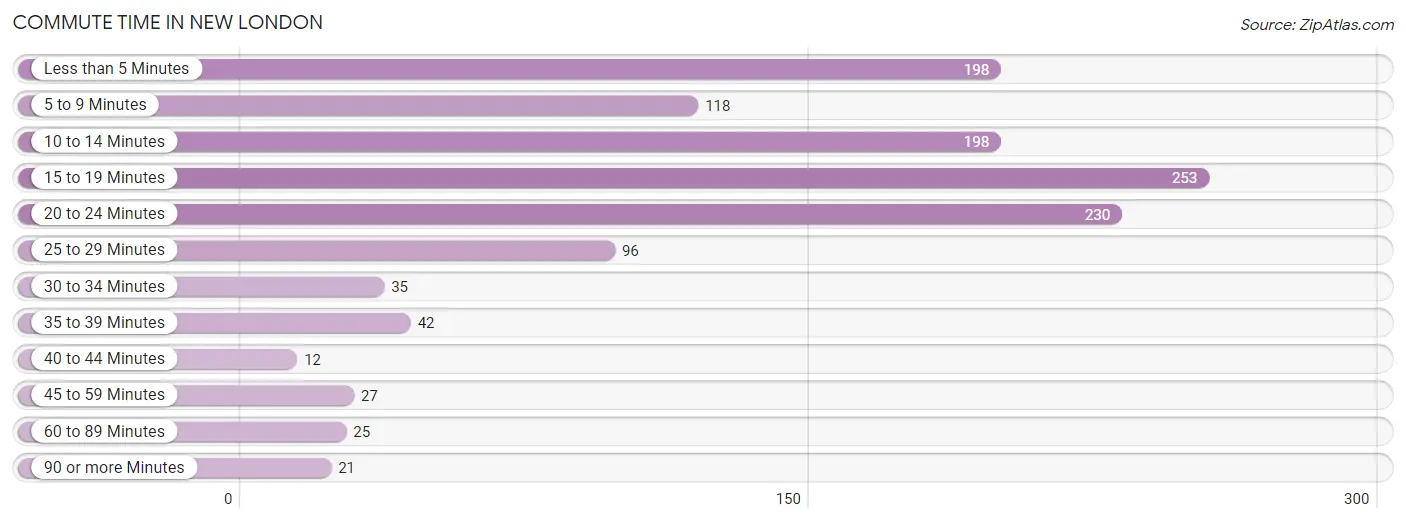
| Commute Time | # Commuters | % Commuters |
| Less than 5 Minutes | 198 | 15.8% |
| 5 to 9 Minutes | 118 | 9.4% |
| 10 to 14 Minutes | 198 | 15.8% |
| 15 to 19 Minutes | 253 | 20.2% |
| 20 to 24 Minutes | 230 | 18.3% |
| 25 to 29 Minutes | 96 | 7.6% |
| 30 to 34 Minutes | 35 | 2.8% |
| 35 to 39 Minutes | 42 | 3.4% |
| 40 to 44 Minutes | 12 | 1.0% |
| 45 to 59 Minutes | 27 | 2.1% |
| 60 to 89 Minutes | 25 | 2.0% |
| 90 or more Minutes | 21 | 1.7% |
Commute Time by Sex in New London
The most common commute times in New London are 10 to 14 minutes (131 commuters, 19.9%) for males and 15 to 19 minutes (144 commuters, 24.2%) for females.
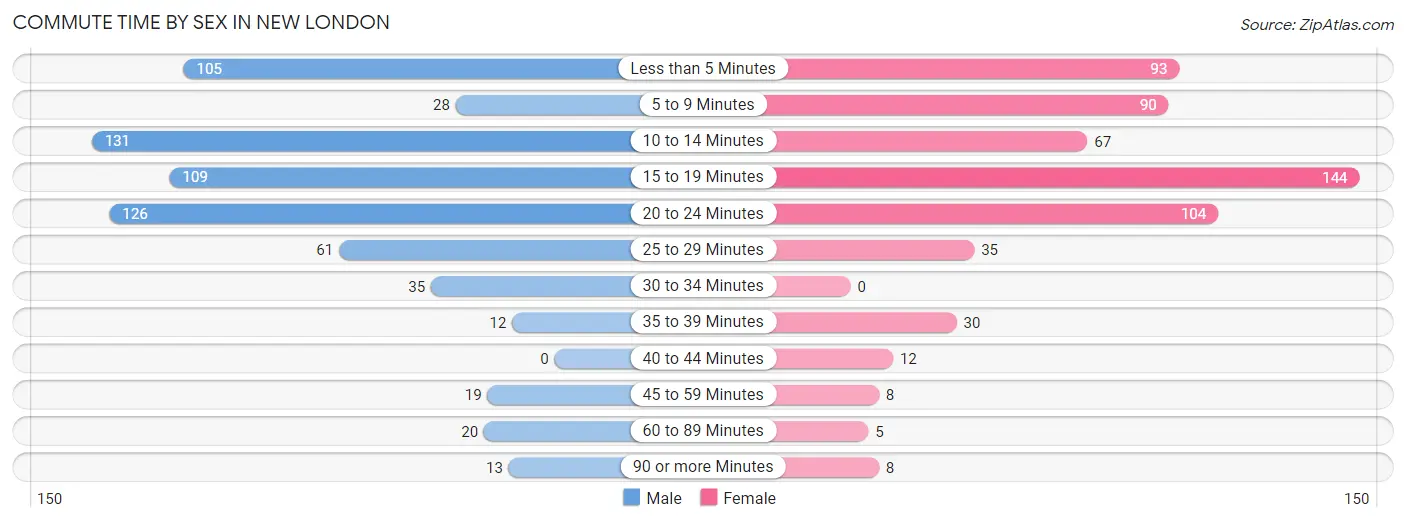
| Commute Time | Male | Female |
| Less than 5 Minutes | 105 (15.9%) | 93 (15.6%) |
| 5 to 9 Minutes | 28 (4.3%) | 90 (15.1%) |
| 10 to 14 Minutes | 131 (19.9%) | 67 (11.2%) |
| 15 to 19 Minutes | 109 (16.5%) | 144 (24.2%) |
| 20 to 24 Minutes | 126 (19.1%) | 104 (17.4%) |
| 25 to 29 Minutes | 61 (9.3%) | 35 (5.9%) |
| 30 to 34 Minutes | 35 (5.3%) | 0 (0.0%) |
| 35 to 39 Minutes | 12 (1.8%) | 30 (5.0%) |
| 40 to 44 Minutes | 0 (0.0%) | 12 (2.0%) |
| 45 to 59 Minutes | 19 (2.9%) | 8 (1.3%) |
| 60 to 89 Minutes | 20 (3.0%) | 5 (0.8%) |
| 90 or more Minutes | 13 (2.0%) | 8 (1.3%) |
Time of Departure to Work by Sex in New London
The most frequent times of departure to work in New London are 7:30 AM to 7:59 AM (149, 22.6%) for males and 5:00 AM to 5:29 AM (96, 16.1%) for females.
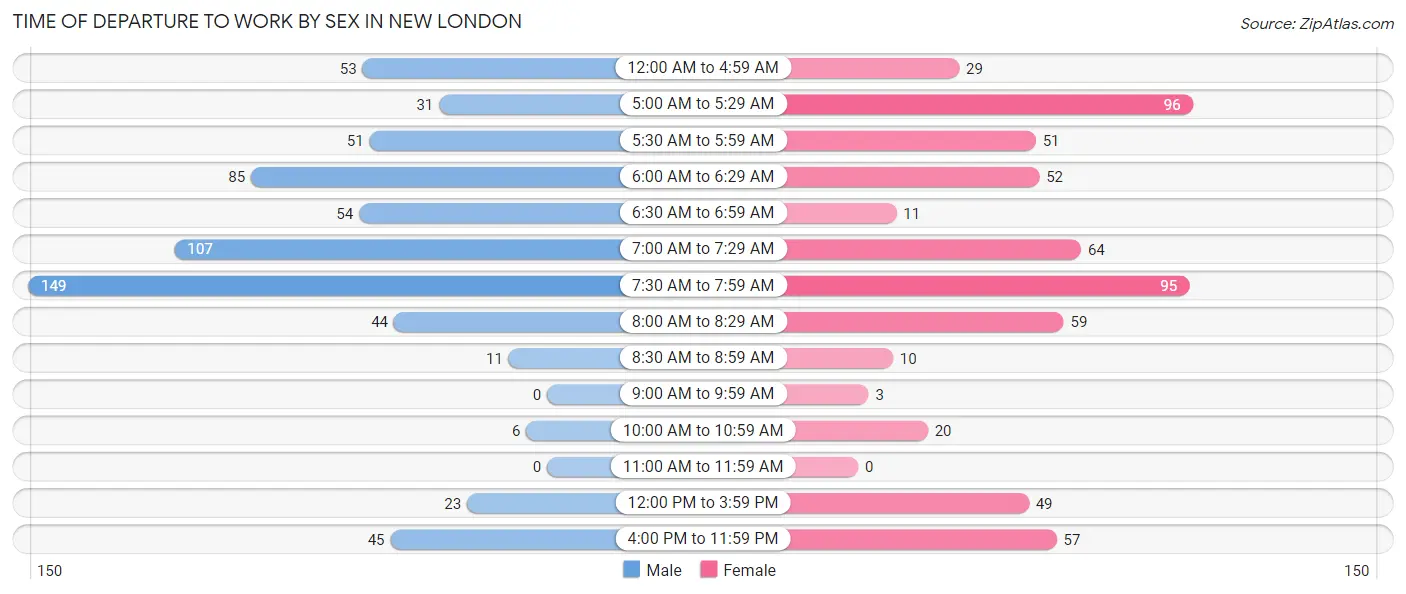
| Time of Departure | Male | Female |
| 12:00 AM to 4:59 AM | 53 (8.0%) | 29 (4.9%) |
| 5:00 AM to 5:29 AM | 31 (4.7%) | 96 (16.1%) |
| 5:30 AM to 5:59 AM | 51 (7.7%) | 51 (8.6%) |
| 6:00 AM to 6:29 AM | 85 (12.9%) | 52 (8.7%) |
| 6:30 AM to 6:59 AM | 54 (8.2%) | 11 (1.8%) |
| 7:00 AM to 7:29 AM | 107 (16.2%) | 64 (10.7%) |
| 7:30 AM to 7:59 AM | 149 (22.6%) | 95 (15.9%) |
| 8:00 AM to 8:29 AM | 44 (6.7%) | 59 (9.9%) |
| 8:30 AM to 8:59 AM | 11 (1.7%) | 10 (1.7%) |
| 9:00 AM to 9:59 AM | 0 (0.0%) | 3 (0.5%) |
| 10:00 AM to 10:59 AM | 6 (0.9%) | 20 (3.4%) |
| 11:00 AM to 11:59 AM | 0 (0.0%) | 0 (0.0%) |
| 12:00 PM to 3:59 PM | 23 (3.5%) | 49 (8.2%) |
| 4:00 PM to 11:59 PM | 45 (6.8%) | 57 (9.6%) |
| Total | 659 (100.0%) | 596 (100.0%) |
Housing Occupancy in New London
Occupancy by Ownership in New London
Of the total 888 dwellings in New London, owner-occupied units account for 630 (71.0%), while renter-occupied units make up 258 (29.0%).
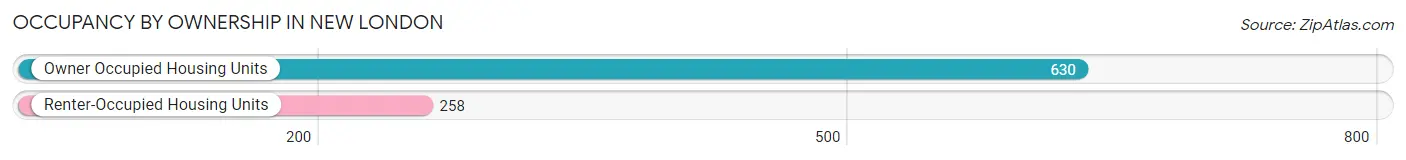
| Occupancy | # Housing Units | % Housing Units |
| Owner Occupied Housing Units | 630 | 71.0% |
| Renter-Occupied Housing Units | 258 | 29.0% |
| Total Occupied Housing Units | 888 | 100.0% |
Occupancy by Household Size in New London
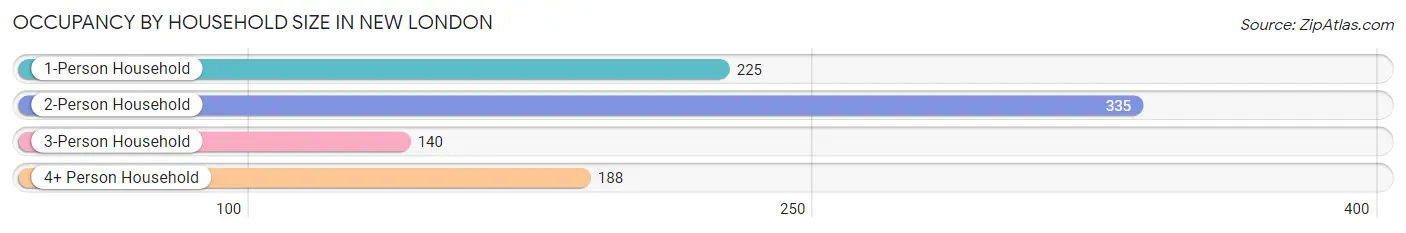
| Household Size | # Housing Units | % Housing Units |
| 1-Person Household | 225 | 25.3% |
| 2-Person Household | 335 | 37.7% |
| 3-Person Household | 140 | 15.8% |
| 4+ Person Household | 188 | 21.2% |
| Total Housing Units | 888 | 100.0% |
Occupancy by Ownership by Household Size in New London
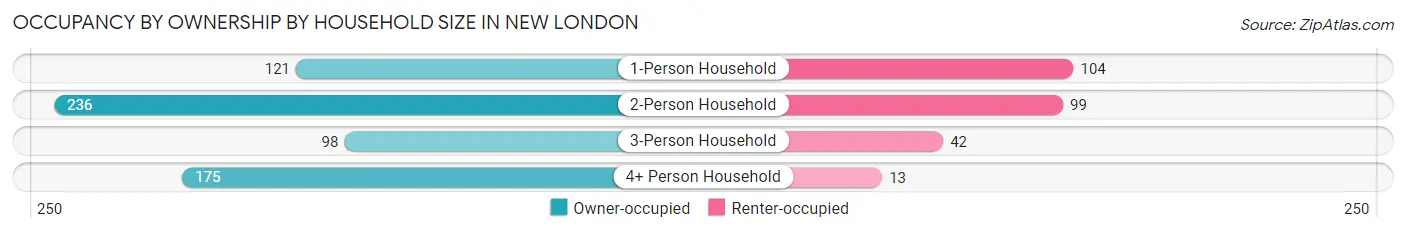
| Household Size | Owner-occupied | Renter-occupied |
| 1-Person Household | 121 (53.8%) | 104 (46.2%) |
| 2-Person Household | 236 (70.5%) | 99 (29.5%) |
| 3-Person Household | 98 (70.0%) | 42 (30.0%) |
| 4+ Person Household | 175 (93.1%) | 13 (6.9%) |
| Total Housing Units | 630 (71.0%) | 258 (29.0%) |
Occupancy by Educational Attainment in New London
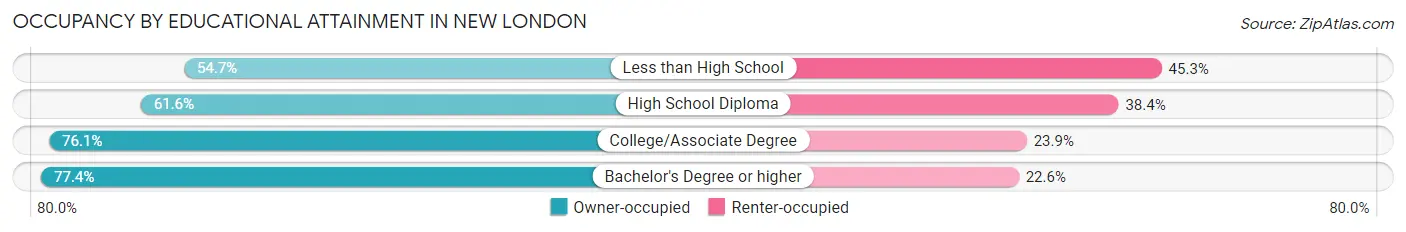
| Household Size | Owner-occupied | Renter-occupied |
| Less than High School | 29 (54.7%) | 24 (45.3%) |
| High School Diploma | 157 (61.6%) | 98 (38.4%) |
| College/Associate Degree | 290 (76.1%) | 91 (23.9%) |
| Bachelor's Degree or higher | 154 (77.4%) | 45 (22.6%) |
Occupancy by Age of Householder in New London
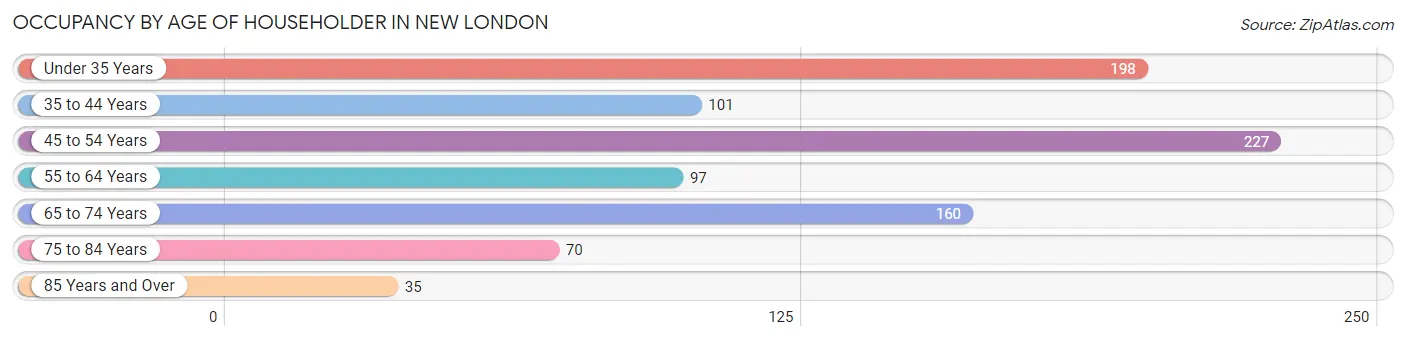
| Age Bracket | # Households | % Households |
| Under 35 Years | 198 | 22.3% |
| 35 to 44 Years | 101 | 11.4% |
| 45 to 54 Years | 227 | 25.6% |
| 55 to 64 Years | 97 | 10.9% |
| 65 to 74 Years | 160 | 18.0% |
| 75 to 84 Years | 70 | 7.9% |
| 85 Years and Over | 35 | 3.9% |
| Total | 888 | 100.0% |
Housing Finances in New London
Median Income by Occupancy in New London
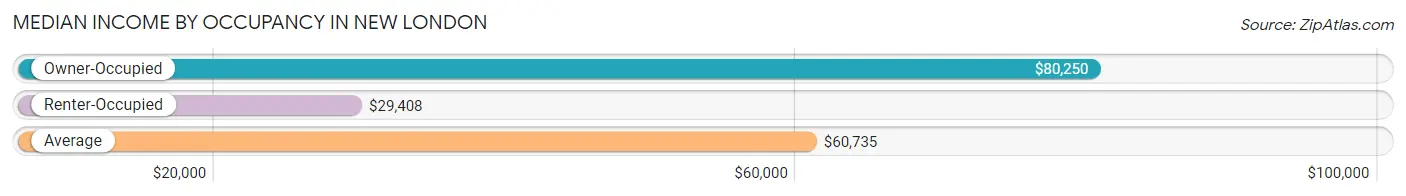
| Occupancy Type | # Households | Median Income |
| Owner-Occupied | 630 (71.0%) | $80,250 |
| Renter-Occupied | 258 (29.0%) | $29,408 |
| Average | 888 (100.0%) | $60,735 |
Occupancy by Householder Income Bracket in New London
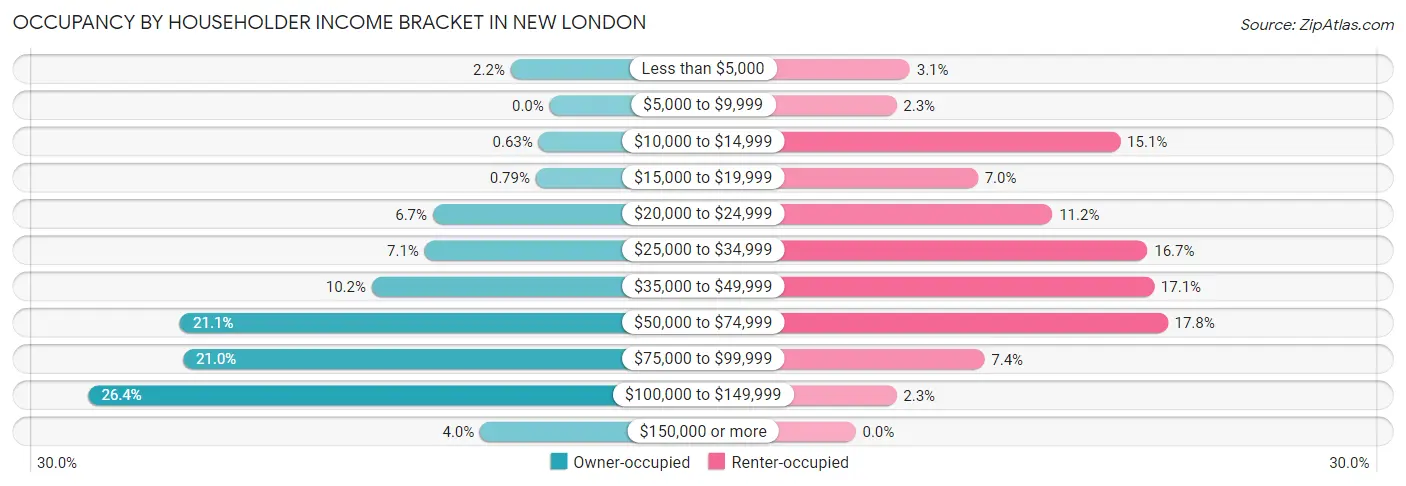
| Income Bracket | Owner-occupied | Renter-occupied |
| Less than $5,000 | 14 (2.2%) | 8 (3.1%) |
| $5,000 to $9,999 | 0 (0.0%) | 6 (2.3%) |
| $10,000 to $14,999 | 4 (0.6%) | 39 (15.1%) |
| $15,000 to $19,999 | 5 (0.8%) | 18 (7.0%) |
| $20,000 to $24,999 | 42 (6.7%) | 29 (11.2%) |
| $25,000 to $34,999 | 45 (7.1%) | 43 (16.7%) |
| $35,000 to $49,999 | 64 (10.2%) | 44 (17.1%) |
| $50,000 to $74,999 | 133 (21.1%) | 46 (17.8%) |
| $75,000 to $99,999 | 132 (20.9%) | 19 (7.4%) |
| $100,000 to $149,999 | 166 (26.4%) | 6 (2.3%) |
| $150,000 or more | 25 (4.0%) | 0 (0.0%) |
| Total | 630 (100.0%) | 258 (100.0%) |
Monthly Housing Cost Tiers in New London
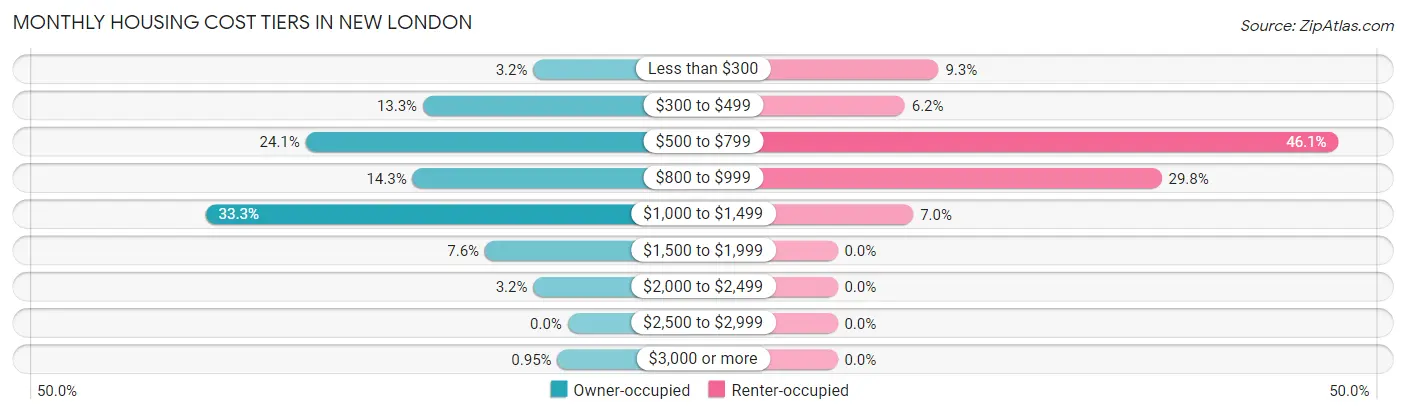
| Monthly Cost | Owner-occupied | Renter-occupied |
| Less than $300 | 20 (3.2%) | 24 (9.3%) |
| $300 to $499 | 84 (13.3%) | 16 (6.2%) |
| $500 to $799 | 152 (24.1%) | 119 (46.1%) |
| $800 to $999 | 90 (14.3%) | 77 (29.8%) |
| $1,000 to $1,499 | 210 (33.3%) | 18 (7.0%) |
| $1,500 to $1,999 | 48 (7.6%) | 0 (0.0%) |
| $2,000 to $2,499 | 20 (3.2%) | 0 (0.0%) |
| $2,500 to $2,999 | 0 (0.0%) | 0 (0.0%) |
| $3,000 or more | 6 (0.9%) | 0 (0.0%) |
| Total | 630 (100.0%) | 258 (100.0%) |
Physical Housing Characteristics in New London
Housing Structures in New London
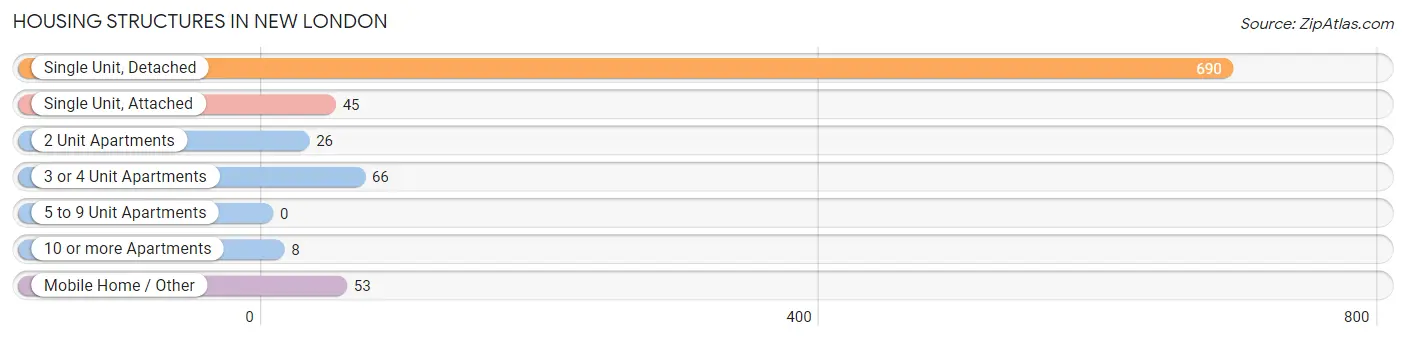
| Structure Type | # Housing Units | % Housing Units |
| Single Unit, Detached | 690 | 77.7% |
| Single Unit, Attached | 45 | 5.1% |
| 2 Unit Apartments | 26 | 2.9% |
| 3 or 4 Unit Apartments | 66 | 7.4% |
| 5 to 9 Unit Apartments | 0 | 0.0% |
| 10 or more Apartments | 8 | 0.9% |
| Mobile Home / Other | 53 | 6.0% |
| Total | 888 | 100.0% |
Housing Structures by Occupancy in New London
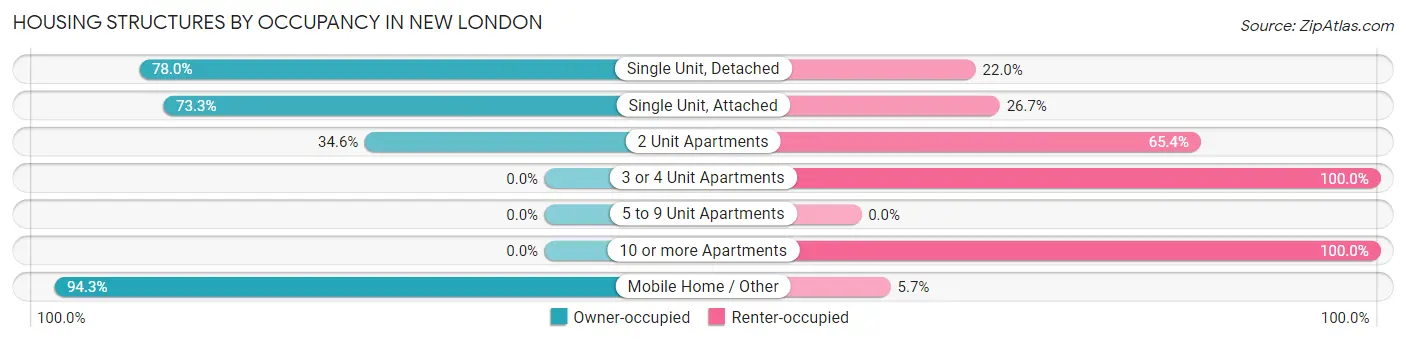
| Structure Type | Owner-occupied | Renter-occupied |
| Single Unit, Detached | 538 (78.0%) | 152 (22.0%) |
| Single Unit, Attached | 33 (73.3%) | 12 (26.7%) |
| 2 Unit Apartments | 9 (34.6%) | 17 (65.4%) |
| 3 or 4 Unit Apartments | 0 (0.0%) | 66 (100.0%) |
| 5 to 9 Unit Apartments | 0 (0.0%) | 0 (0.0%) |
| 10 or more Apartments | 0 (0.0%) | 8 (100.0%) |
| Mobile Home / Other | 50 (94.3%) | 3 (5.7%) |
| Total | 630 (71.0%) | 258 (29.0%) |
Housing Structures by Number of Rooms in New London
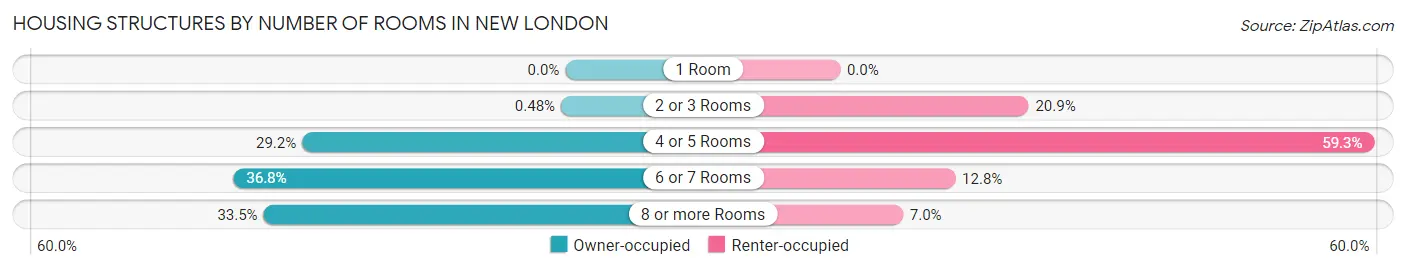
| Number of Rooms | Owner-occupied | Renter-occupied |
| 1 Room | 0 (0.0%) | 0 (0.0%) |
| 2 or 3 Rooms | 3 (0.5%) | 54 (20.9%) |
| 4 or 5 Rooms | 184 (29.2%) | 153 (59.3%) |
| 6 or 7 Rooms | 232 (36.8%) | 33 (12.8%) |
| 8 or more Rooms | 211 (33.5%) | 18 (7.0%) |
| Total | 630 (100.0%) | 258 (100.0%) |
Housing Structure by Heating Type in New London
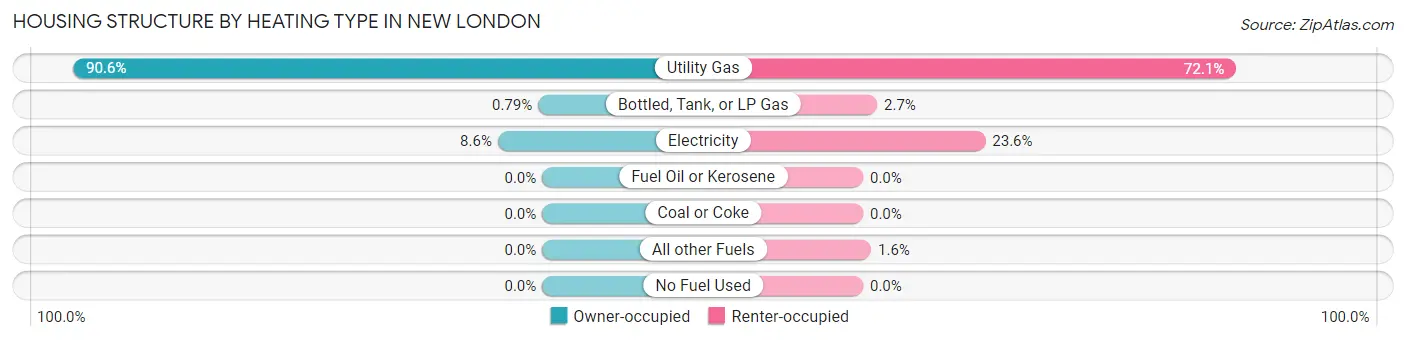
| Heating Type | Owner-occupied | Renter-occupied |
| Utility Gas | 571 (90.6%) | 186 (72.1%) |
| Bottled, Tank, or LP Gas | 5 (0.8%) | 7 (2.7%) |
| Electricity | 54 (8.6%) | 61 (23.6%) |
| Fuel Oil or Kerosene | 0 (0.0%) | 0 (0.0%) |
| Coal or Coke | 0 (0.0%) | 0 (0.0%) |
| All other Fuels | 0 (0.0%) | 4 (1.5%) |
| No Fuel Used | 0 (0.0%) | 0 (0.0%) |
| Total | 630 (100.0%) | 258 (100.0%) |
Household Vehicle Usage in New London
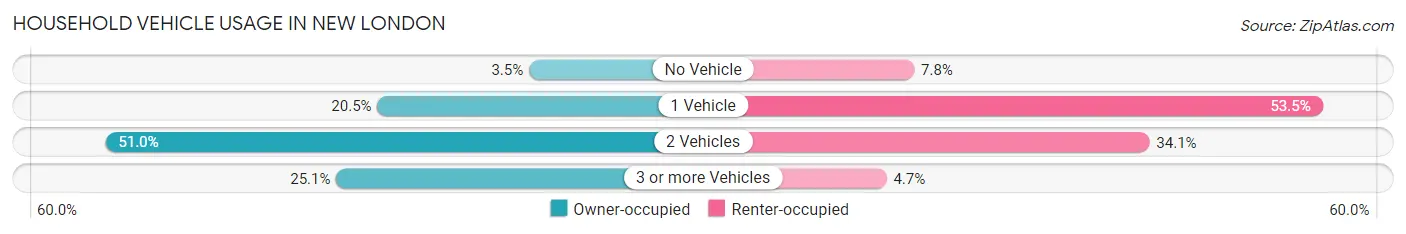
| Vehicles per Household | Owner-occupied | Renter-occupied |
| No Vehicle | 22 (3.5%) | 20 (7.7%) |
| 1 Vehicle | 129 (20.5%) | 138 (53.5%) |
| 2 Vehicles | 321 (50.9%) | 88 (34.1%) |
| 3 or more Vehicles | 158 (25.1%) | 12 (4.6%) |
| Total | 630 (100.0%) | 258 (100.0%) |
Real Estate & Mortgages in New London
Real Estate and Mortgage Overview in New London
| Characteristic | Without Mortgage | With Mortgage |
| Housing Units | 229 | 401 |
| Median Property Value | $107,700 | $123,000 |
| Median Household Income | $58,173 | $13 |
| Monthly Housing Costs | $523 | $6 |
| Real Estate Taxes | $1,989 | $9 |
Property Value by Mortgage Status in New London
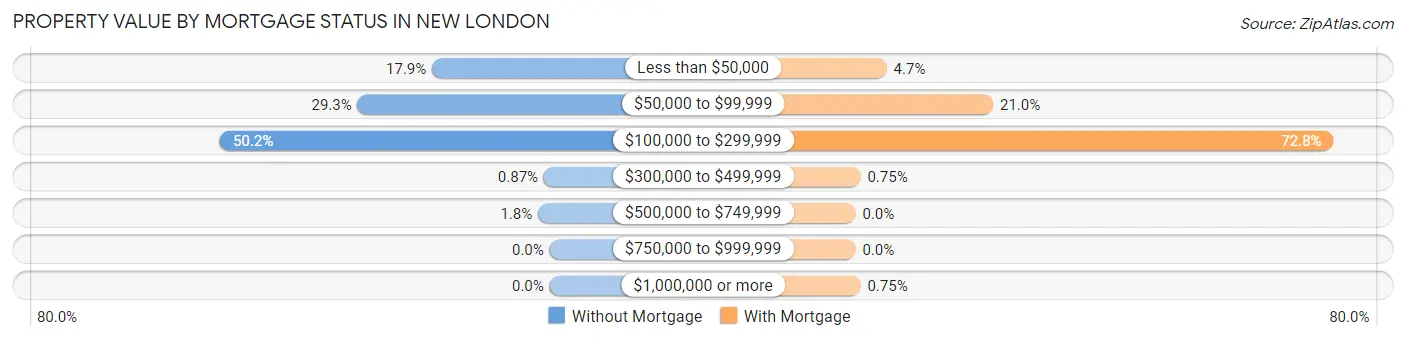
| Property Value | Without Mortgage | With Mortgage |
| Less than $50,000 | 41 (17.9%) | 19 (4.7%) |
| $50,000 to $99,999 | 67 (29.3%) | 84 (20.9%) |
| $100,000 to $299,999 | 115 (50.2%) | 292 (72.8%) |
| $300,000 to $499,999 | 2 (0.9%) | 3 (0.7%) |
| $500,000 to $749,999 | 4 (1.8%) | 0 (0.0%) |
| $750,000 to $999,999 | 0 (0.0%) | 0 (0.0%) |
| $1,000,000 or more | 0 (0.0%) | 3 (0.7%) |
| Total | 229 (100.0%) | 401 (100.0%) |
Household Income by Mortgage Status in New London
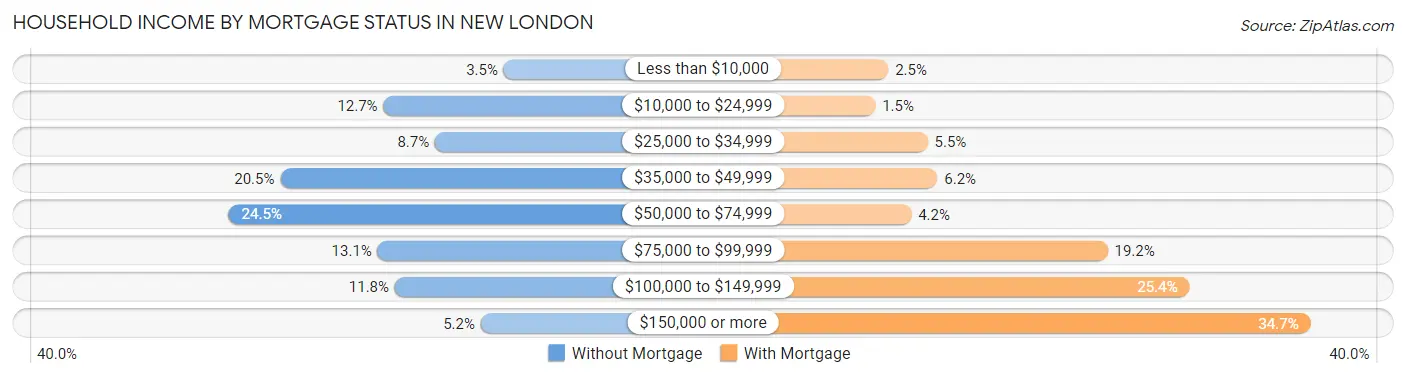
| Household Income | Without Mortgage | With Mortgage |
| Less than $10,000 | 8 (3.5%) | 10 (2.5%) |
| $10,000 to $24,999 | 29 (12.7%) | 6 (1.5%) |
| $25,000 to $34,999 | 20 (8.7%) | 22 (5.5%) |
| $35,000 to $49,999 | 47 (20.5%) | 25 (6.2%) |
| $50,000 to $74,999 | 56 (24.4%) | 17 (4.2%) |
| $75,000 to $99,999 | 30 (13.1%) | 77 (19.2%) |
| $100,000 to $149,999 | 27 (11.8%) | 102 (25.4%) |
| $150,000 or more | 12 (5.2%) | 139 (34.7%) |
| Total | 229 (100.0%) | 401 (100.0%) |
Property Value to Household Income Ratio in New London
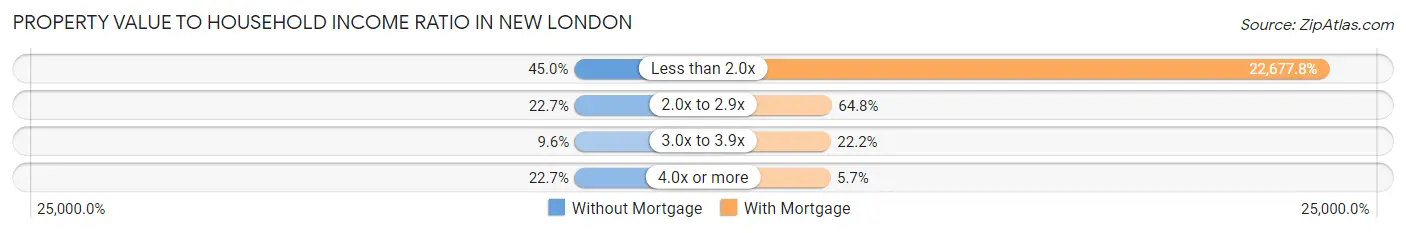
| Value-to-Income Ratio | Without Mortgage | With Mortgage |
| Less than 2.0x | 103 (45.0%) | 90,938 (22,677.8%) |
| 2.0x to 2.9x | 52 (22.7%) | 260 (64.8%) |
| 3.0x to 3.9x | 22 (9.6%) | 89 (22.2%) |
| 4.0x or more | 52 (22.7%) | 23 (5.7%) |
| Total | 229 (100.0%) | 401 (100.0%) |
Real Estate Taxes by Mortgage Status in New London
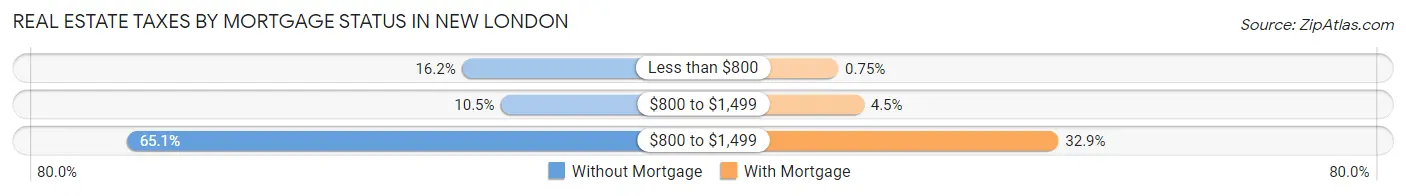
| Property Taxes | Without Mortgage | With Mortgage |
| Less than $800 | 37 (16.2%) | 3 (0.7%) |
| $800 to $1,499 | 24 (10.5%) | 18 (4.5%) |
| $800 to $1,499 | 149 (65.1%) | 132 (32.9%) |
| Total | 229 (100.0%) | 401 (100.0%) |
Health & Disability in New London
Health Insurance Coverage by Age in New London

| Age Bracket | With Coverage | Without Coverage |
| Under 6 Years | 206 (100.0%) | 0 (0.0%) |
| 6 to 18 Years | 382 (100.0%) | 0 (0.0%) |
| 19 to 25 Years | 383 (98.7%) | 5 (1.3%) |
| 26 to 34 Years | 192 (73.3%) | 70 (26.7%) |
| 35 to 44 Years | 185 (89.8%) | 21 (10.2%) |
| 45 to 54 Years | 383 (88.4%) | 50 (11.6%) |
| 55 to 64 Years | 195 (98.5%) | 3 (1.5%) |
| 65 to 74 Years | 210 (100.0%) | 0 (0.0%) |
| 75 Years and older | 145 (98.0%) | 3 (2.0%) |
| Total | 2,281 (93.8%) | 152 (6.2%) |
Health Insurance Coverage by Citizenship Status in New London
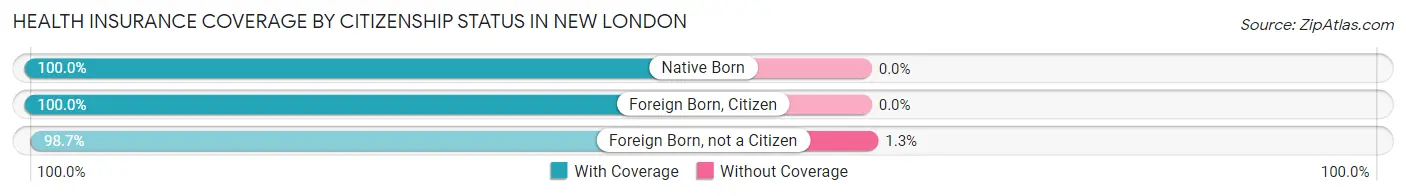
| Citizenship Status | With Coverage | Without Coverage |
| Native Born | 206 (100.0%) | 0 (0.0%) |
| Foreign Born, Citizen | 382 (100.0%) | 0 (0.0%) |
| Foreign Born, not a Citizen | 383 (98.7%) | 5 (1.3%) |
Health Insurance Coverage by Household Income in New London
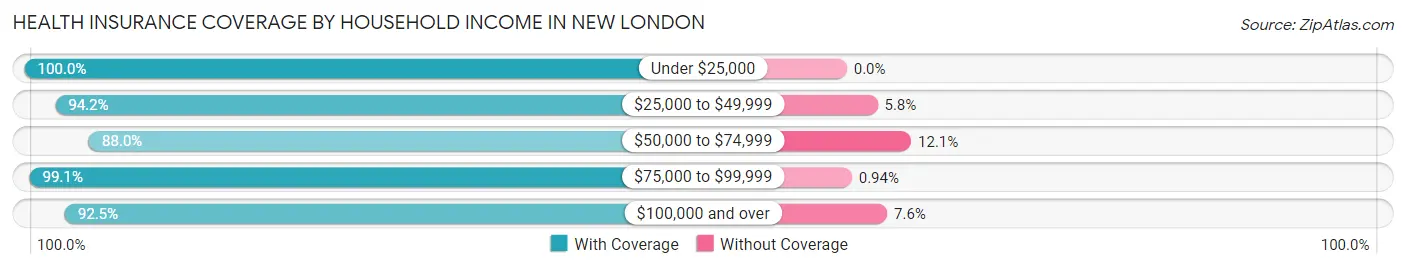
| Household Income | With Coverage | Without Coverage |
| Under $25,000 | 225 (100.0%) | 0 (0.0%) |
| $25,000 to $49,999 | 360 (94.2%) | 22 (5.8%) |
| $50,000 to $74,999 | 533 (87.9%) | 73 (12.0%) |
| $75,000 to $99,999 | 526 (99.1%) | 5 (0.9%) |
| $100,000 and over | 637 (92.4%) | 52 (7.5%) |
Public vs Private Health Insurance Coverage by Age in New London
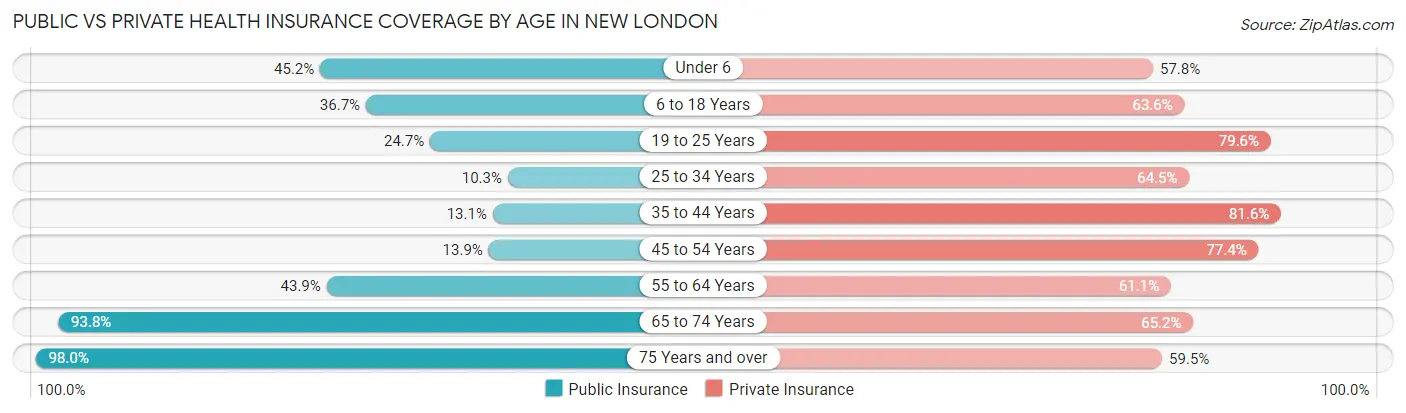
| Age Bracket | Public Insurance | Private Insurance |
| Under 6 | 93 (45.2%) | 119 (57.8%) |
| 6 to 18 Years | 140 (36.6%) | 243 (63.6%) |
| 19 to 25 Years | 96 (24.7%) | 309 (79.6%) |
| 25 to 34 Years | 27 (10.3%) | 169 (64.5%) |
| 35 to 44 Years | 27 (13.1%) | 168 (81.6%) |
| 45 to 54 Years | 60 (13.9%) | 335 (77.4%) |
| 55 to 64 Years | 87 (43.9%) | 121 (61.1%) |
| 65 to 74 Years | 197 (93.8%) | 137 (65.2%) |
| 75 Years and over | 145 (98.0%) | 88 (59.5%) |
| Total | 872 (35.8%) | 1,689 (69.4%) |
Disability Status by Sex by Age in New London
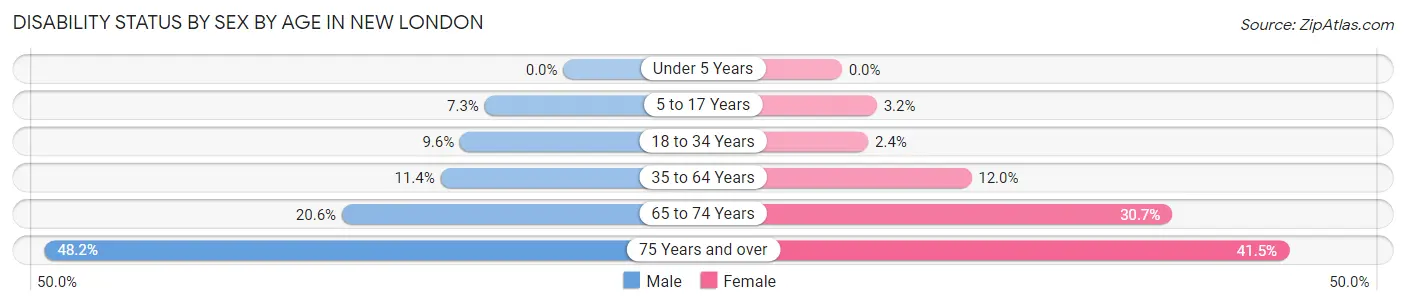
| Age Bracket | Male | Female |
| Under 5 Years | 0 (0.0%) | 0 (0.0%) |
| 5 to 17 Years | 10 (7.3%) | 7 (3.2%) |
| 18 to 34 Years | 35 (9.6%) | 8 (2.4%) |
| 35 to 64 Years | 48 (11.4%) | 50 (12.0%) |
| 65 to 74 Years | 15 (20.5%) | 42 (30.7%) |
| 75 Years and over | 26 (48.1%) | 39 (41.5%) |
Disability Class by Sex by Age in New London
Disability Class: Hearing Difficulty
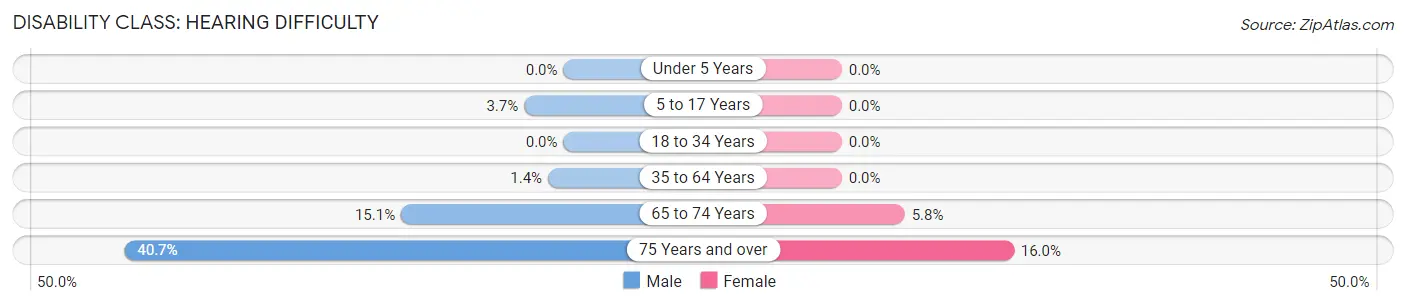
| Age Bracket | Male | Female |
| Under 5 Years | 0 (0.0%) | 0 (0.0%) |
| 5 to 17 Years | 5 (3.6%) | 0 (0.0%) |
| 18 to 34 Years | 0 (0.0%) | 0 (0.0%) |
| 35 to 64 Years | 6 (1.4%) | 0 (0.0%) |
| 65 to 74 Years | 11 (15.1%) | 8 (5.8%) |
| 75 Years and over | 22 (40.7%) | 15 (16.0%) |
Disability Class: Vision Difficulty
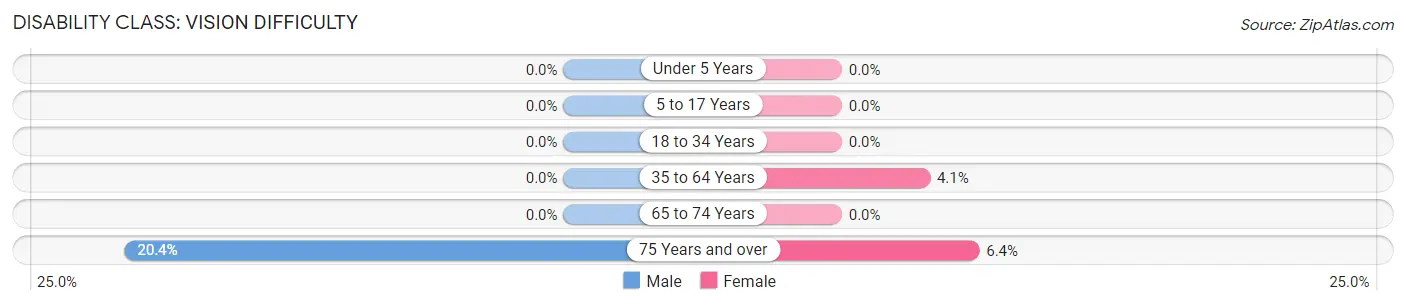
| Age Bracket | Male | Female |
| Under 5 Years | 0 (0.0%) | 0 (0.0%) |
| 5 to 17 Years | 0 (0.0%) | 0 (0.0%) |
| 18 to 34 Years | 0 (0.0%) | 0 (0.0%) |
| 35 to 64 Years | 0 (0.0%) | 17 (4.1%) |
| 65 to 74 Years | 0 (0.0%) | 0 (0.0%) |
| 75 Years and over | 11 (20.4%) | 6 (6.4%) |
Disability Class: Cognitive Difficulty
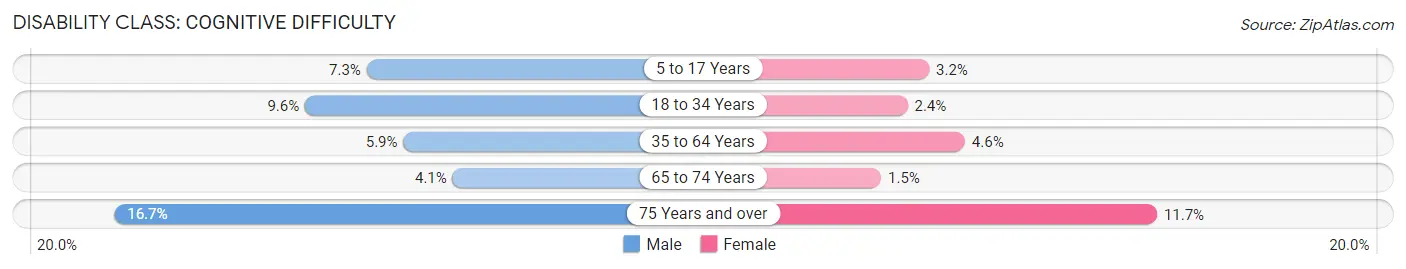
| Age Bracket | Male | Female |
| 5 to 17 Years | 10 (7.3%) | 7 (3.2%) |
| 18 to 34 Years | 35 (9.6%) | 8 (2.4%) |
| 35 to 64 Years | 25 (5.9%) | 19 (4.6%) |
| 65 to 74 Years | 3 (4.1%) | 2 (1.5%) |
| 75 Years and over | 9 (16.7%) | 11 (11.7%) |
Disability Class: Ambulatory Difficulty
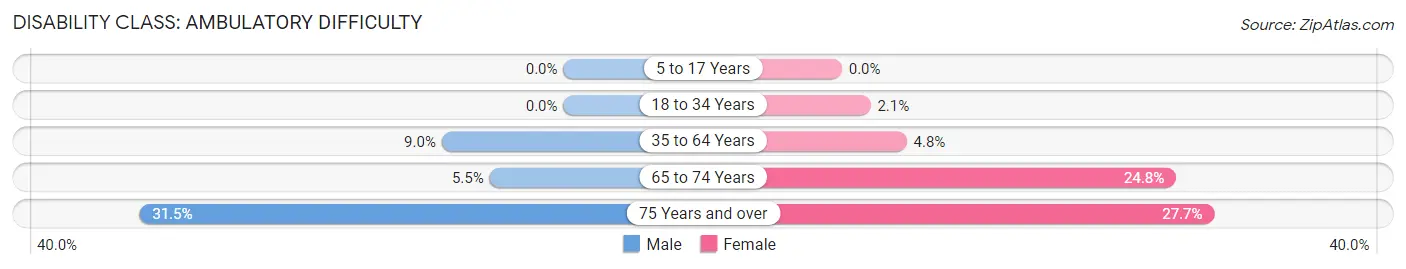
| Age Bracket | Male | Female |
| 5 to 17 Years | 0 (0.0%) | 0 (0.0%) |
| 18 to 34 Years | 0 (0.0%) | 7 (2.1%) |
| 35 to 64 Years | 38 (9.0%) | 20 (4.8%) |
| 65 to 74 Years | 4 (5.5%) | 34 (24.8%) |
| 75 Years and over | 17 (31.5%) | 26 (27.7%) |
Disability Class: Self-Care Difficulty
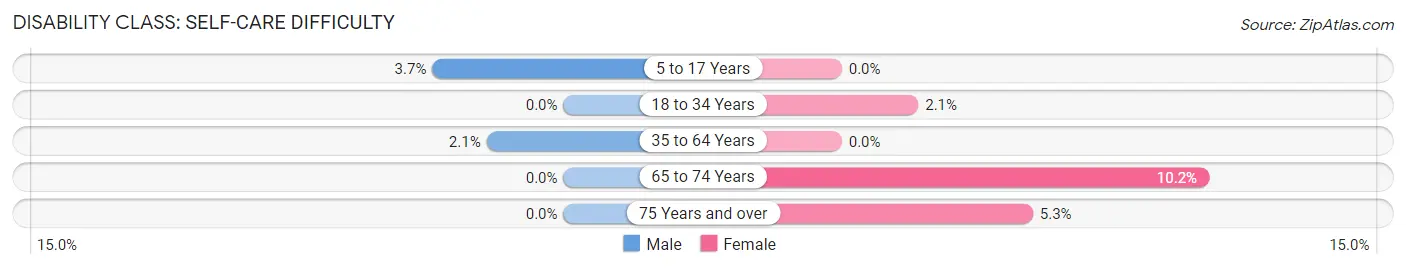
| Age Bracket | Male | Female |
| 5 to 17 Years | 5 (3.6%) | 0 (0.0%) |
| 18 to 34 Years | 0 (0.0%) | 7 (2.1%) |
| 35 to 64 Years | 9 (2.1%) | 0 (0.0%) |
| 65 to 74 Years | 0 (0.0%) | 14 (10.2%) |
| 75 Years and over | 0 (0.0%) | 5 (5.3%) |
Technology Access in New London
Computing Device Access in New London
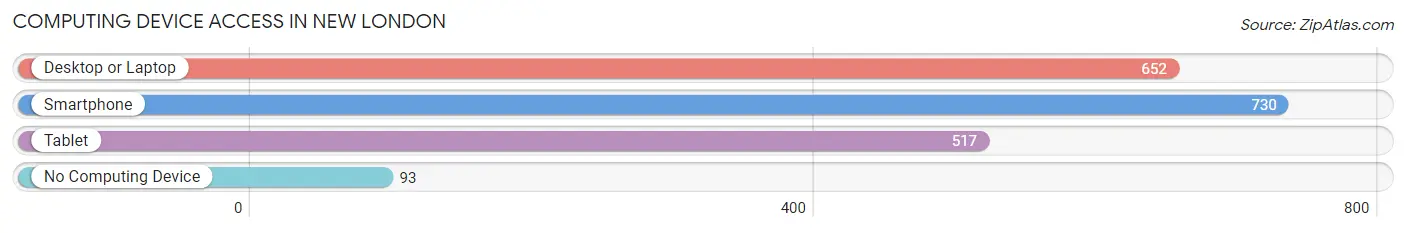
| Device Type | # Households | % Households |
| Desktop or Laptop | 652 | 73.4% |
| Smartphone | 730 | 82.2% |
| Tablet | 517 | 58.2% |
| No Computing Device | 93 | 10.5% |
| Total | 888 | 100.0% |
Internet Access in New London
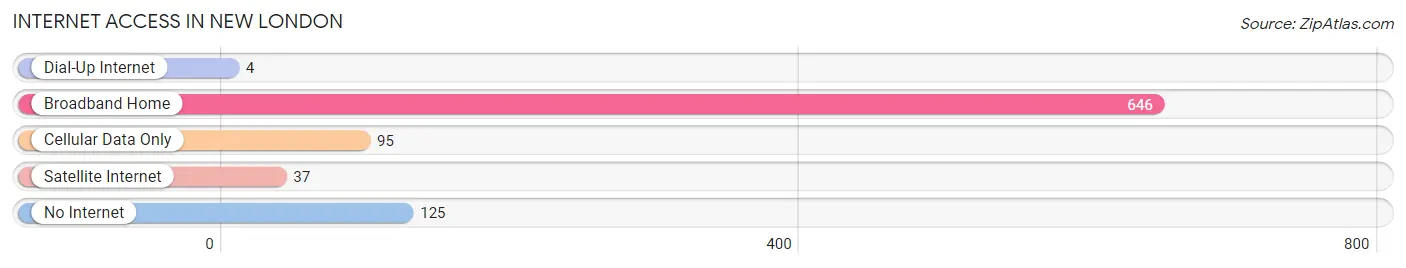
| Internet Type | # Households | % Households |
| Dial-Up Internet | 4 | 0.4% |
| Broadband Home | 646 | 72.8% |
| Cellular Data Only | 95 | 10.7% |
| Satellite Internet | 37 | 4.2% |
| No Internet | 125 | 14.1% |
| Total | 888 | 100.0% |
New London Summary
New London, Iowa is a small city located in Henry County, Iowa. It is situated on the banks of the Skunk River and is home to a population of 1,845 people as of the 2020 census. The city is known for its historic downtown area, which is home to a variety of businesses, restaurants, and other attractions.
History
New London was founded in 1836 by a group of settlers from New England. The city was named after the city of London, England, and was originally known as New London Mills. The city was incorporated in 1853 and was the first city in Henry County to be incorporated.
The city was an important stop on the Underground Railroad, and was home to a number of abolitionists. In 1859, the city was the site of the first public school in Henry County.
Geography
New London is located in the southeastern corner of Henry County, Iowa. It is situated on the banks of the Skunk River, which flows through the city. The city is located approximately 30 miles southeast of Iowa City and approximately 40 miles west of Davenport.
The city has a total area of 1.7 square miles, all of which is land. The city is located at an elevation of 845 feet above sea level.
Economy
New London is a small city with a diverse economy. The city is home to a variety of businesses, including manufacturing, retail, and service industries. The city is also home to a number of small businesses, including restaurants, shops, and other attractions.
The city is home to a number of manufacturing companies, including New London Manufacturing, which produces a variety of products, including furniture, cabinets, and other wood products. The city is also home to a number of retail stores, including a Walmart Supercenter, a Dollar General, and a variety of other stores.
Demographics
As of the 2020 census, the population of New London was 1,845. The city has a population density of 1,072 people per square mile. The median age of the population is 40.7 years, and the median household income is $45,945.
The racial makeup of the city is 97.2% White, 0.7% African American, 0.3% Native American, 0.2% Asian, 0.1% Pacific Islander, 0.4% from other races, and 1.1% from two or more races. The city is home to a variety of religious denominations, including Protestant, Catholic, and other faiths.
Conclusion
New London, Iowa is a small city located in Henry County, Iowa. It is situated on the banks of the Skunk River and is home to a population of 1,845 people as of the 2020 census. The city is known for its historic downtown area, which is home to a variety of businesses, restaurants, and other attractions. The city has a diverse economy, with a variety of manufacturing, retail, and service industries. The city is also home to a variety of religious denominations, including Protestant, Catholic, and other faiths.
Common Questions
What is Per Capita Income in New London?
Per Capita income in New London is $26,946.
What is the Median Family Income in New London?
Median Family Income in New London is $74,509.
What is the Median Household income in New London?
Median Household Income in New London is $60,735.
What is Income or Wage Gap in New London?
Income or Wage Gap in New London is 32.9%.
Women in New London earn 67.1 cents for every dollar earned by a man.
What is Family Income Deficit in New London?
Family Income Deficit in New London is $8,726.
Families that are below poverty line in New London earn $8,726 less on average than the poverty threshold level.
What is Inequality or Gini Index in New London?
Inequality or Gini Index in New London is 0.35.
What is the Total Population of New London?
Total Population of New London is 2,471.
What is the Total Male Population of New London?
Total Male Population of New London is 1,166.
What is the Total Female Population of New London?
Total Female Population of New London is 1,305.
What is the Ratio of Males per 100 Females in New London?
There are 89.35 Males per 100 Females in New London.
What is the Ratio of Females per 100 Males in New London?
There are 111.92 Females per 100 Males in New London.
What is the Median Population Age in New London?
Median Population Age in New London is 34.7 Years.
What is the Average Family Size in New London
Average Family Size in New London is 3.4 People.
What is the Average Household Size in New London
Average Household Size in New London is 2.7 People.
How Large is the Labor Force in New London?
There are 1,322 People in the Labor Forcein in New London.
What is the Percentage of People in the Labor Force in New London?
66.4% of People are in the Labor Force in New London.
What is the Unemployment Rate in New London?
Unemployment Rate in New London is 2.5%.