New Hampton, IA Map & Demographics
New Hampton Map
New Hampton Overview
$31,940
PER CAPITA INCOME
$76,667
AVG FAMILY INCOME
$60,052
AVG HOUSEHOLD INCOME
27.9%
WAGE / INCOME GAP [ % ]
72.1¢/ $1
WAGE / INCOME GAP [ $ ]
0.38
INEQUALITY / GINI INDEX
3,473
TOTAL POPULATION
1,669
MALE POPULATION
1,804
FEMALE POPULATION
92.52
MALES / 100 FEMALES
108.09
FEMALES / 100 MALES
44.3
MEDIAN AGE
3.0
AVG FAMILY SIZE
2.2
AVG HOUSEHOLD SIZE
1,824
LABOR FORCE [ PEOPLE ]
67.4%
PERCENT IN LABOR FORCE
3.6%
UNEMPLOYMENT RATE
New Hampton Zip Codes
New Hampton Area Codes
Income in New Hampton
Income Overview in New Hampton
Per Capita Income in New Hampton is $31,940, while median incomes of families and households are $76,667 and $60,052 respectively.
| Characteristic | Number | Measure |
| Per Capita Income | 3,473 | $31,940 |
| Median Family Income | 814 | $76,667 |
| Mean Family Income | 814 | $86,637 |
| Median Household Income | 1,491 | $60,052 |
| Mean Household Income | 1,491 | $71,044 |
| Income Deficit | 814 | $0 |
| Wage / Income Gap (%) | 3,473 | 27.91% |
| Wage / Income Gap ($) | 3,473 | 72.09¢ per $1 |
| Gini / Inequality Index | 3,473 | 0.38 |
Earnings by Sex in New Hampton
Average Earnings in New Hampton are $41,126, $46,980 for men and $33,868 for women, a difference of 27.9%.
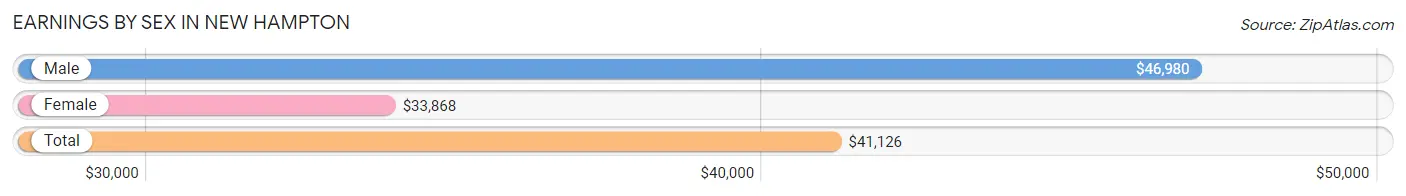
| Sex | Number | Average Earnings |
| Male | 1,043 (55.1%) | $46,980 |
| Female | 849 (44.9%) | $33,868 |
| Total | 1,892 (100.0%) | $41,126 |
Earnings by Sex by Income Bracket in New Hampton
The most common earnings brackets in New Hampton are $55,000 to $64,999 for men (156 | 15.0%) and $40,000 to $44,999 for women (136 | 16.0%).
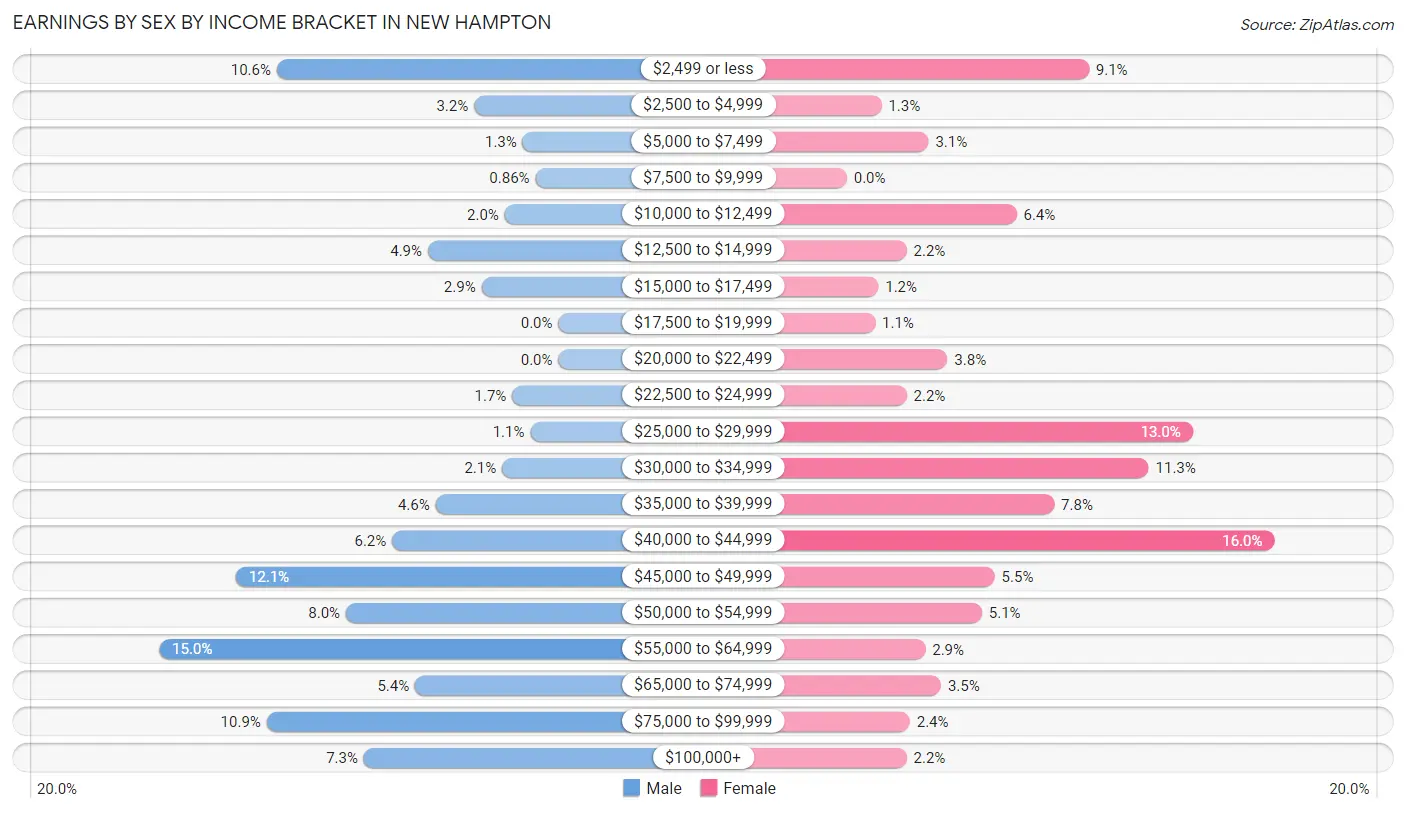
| Income | Male | Female |
| $2,499 or less | 110 (10.5%) | 77 (9.1%) |
| $2,500 to $4,999 | 33 (3.2%) | 11 (1.3%) |
| $5,000 to $7,499 | 14 (1.3%) | 26 (3.1%) |
| $7,500 to $9,999 | 9 (0.9%) | 0 (0.0%) |
| $10,000 to $12,499 | 21 (2.0%) | 54 (6.4%) |
| $12,500 to $14,999 | 51 (4.9%) | 19 (2.2%) |
| $15,000 to $17,499 | 30 (2.9%) | 10 (1.2%) |
| $17,500 to $19,999 | 0 (0.0%) | 9 (1.1%) |
| $20,000 to $22,499 | 0 (0.0%) | 32 (3.8%) |
| $22,500 to $24,999 | 18 (1.7%) | 19 (2.2%) |
| $25,000 to $29,999 | 11 (1.1%) | 110 (13.0%) |
| $30,000 to $34,999 | 22 (2.1%) | 96 (11.3%) |
| $35,000 to $39,999 | 48 (4.6%) | 66 (7.8%) |
| $40,000 to $44,999 | 65 (6.2%) | 136 (16.0%) |
| $45,000 to $49,999 | 126 (12.1%) | 47 (5.5%) |
| $50,000 to $54,999 | 83 (8.0%) | 43 (5.1%) |
| $55,000 to $64,999 | 156 (15.0%) | 25 (2.9%) |
| $65,000 to $74,999 | 56 (5.4%) | 30 (3.5%) |
| $75,000 to $99,999 | 114 (10.9%) | 20 (2.4%) |
| $100,000+ | 76 (7.3%) | 19 (2.2%) |
| Total | 1,043 (100.0%) | 849 (100.0%) |
Earnings by Sex by Educational Attainment in New Hampton
Average earnings in New Hampton are $52,188 for men and $36,757 for women, a difference of 29.6%. Men with an educational attainment of college or associate's degree enjoy the highest average annual earnings of $58,192, while those with less than high school education earn the least with $2,499. Women with an educational attainment of graduate degree earn the most with the average annual earnings of $80,714, while those with college or associate's degree education have the smallest earnings of $34,646.
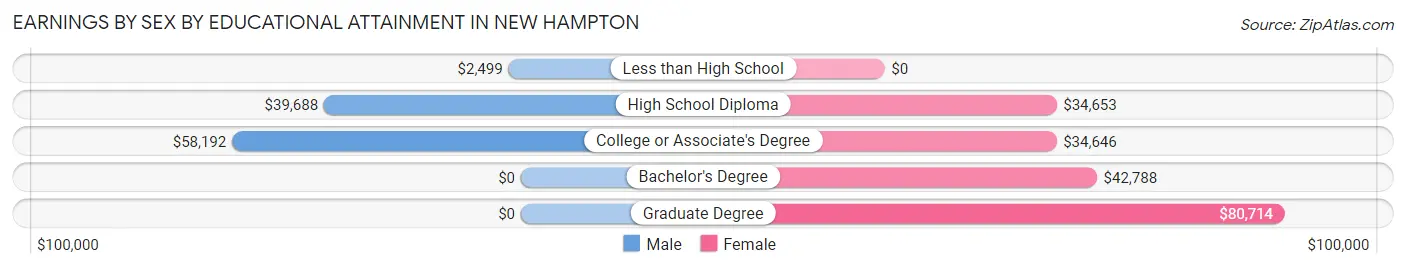
| Educational Attainment | Male Income | Female Income |
| Less than High School | $2,499 | $0 |
| High School Diploma | $39,688 | $34,653 |
| College or Associate's Degree | $58,192 | $34,646 |
| Bachelor's Degree | - | - |
| Graduate Degree | - | - |
| Total | $52,188 | $36,757 |
Family Income in New Hampton
Family Income Brackets in New Hampton
According to the New Hampton family income data, there are 192 families falling into the $75,000 to $99,999 income range, which is the most common income bracket and makes up 23.6% of all families. Conversely, the less than $10,000 income bracket is the least frequent group with only 8 families (1.0%) belonging to this category.
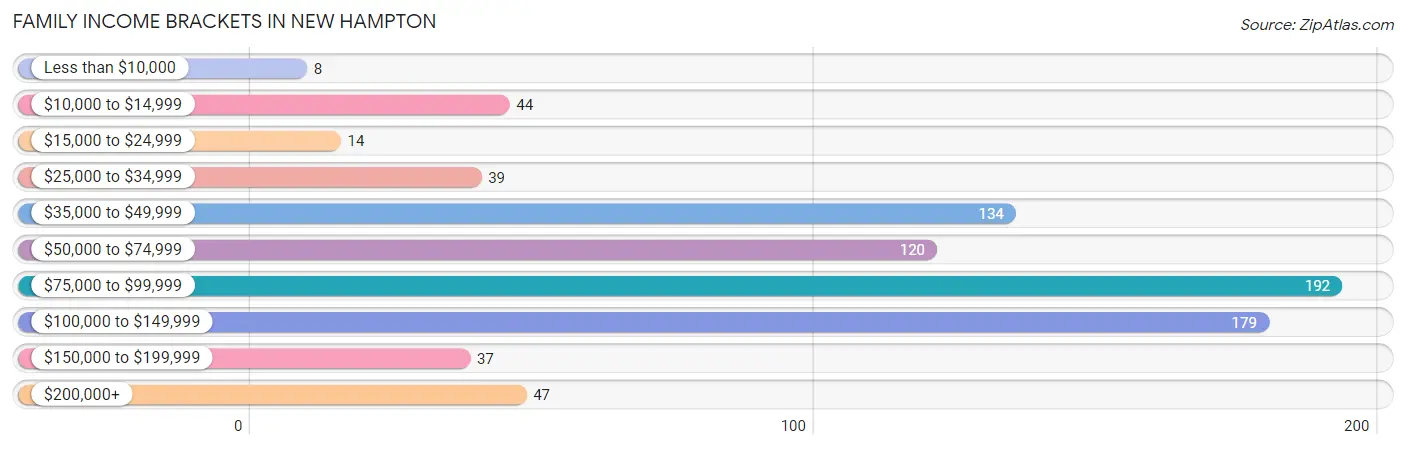
| Income Bracket | # Families | % Families |
| Less than $10,000 | 8 | 1.0% |
| $10,000 to $14,999 | 44 | 5.4% |
| $15,000 to $24,999 | 14 | 1.7% |
| $25,000 to $34,999 | 39 | 4.8% |
| $35,000 to $49,999 | 134 | 16.5% |
| $50,000 to $74,999 | 120 | 14.7% |
| $75,000 to $99,999 | 192 | 23.6% |
| $100,000 to $149,999 | 179 | 22.0% |
| $150,000 to $199,999 | 37 | 4.5% |
| $200,000+ | 47 | 5.8% |
Family Income by Famaliy Size in New Hampton
3-person families (94 | 11.6%) account for the highest median family income in New Hampton with $117,778 per family, while 3-person families (94 | 11.6%) have the highest median income of $39,259 per family member.
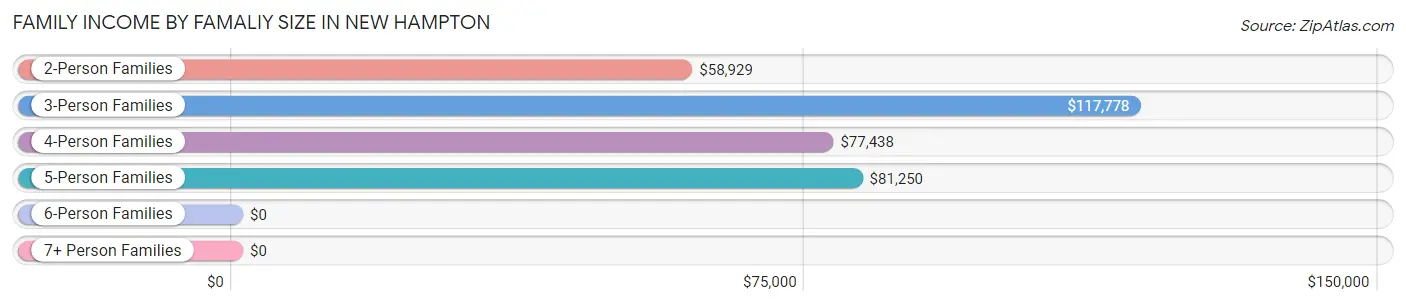
| Income Bracket | # Families | Median Income |
| 2-Person Families | 468 (57.5%) | $58,929 |
| 3-Person Families | 94 (11.6%) | $117,778 |
| 4-Person Families | 99 (12.2%) | $77,438 |
| 5-Person Families | 123 (15.1%) | $81,250 |
| 6-Person Families | 7 (0.9%) | $0 |
| 7+ Person Families | 23 (2.8%) | $0 |
| Total | 814 (100.0%) | $76,667 |
Family Income by Number of Earners in New Hampton
The median family income in New Hampton is $76,667, with families comprising 3+ earners (113) having the highest median family income of $112,569, while families with 1 earner (226) have the lowest median family income of $40,556, accounting for 13.9% and 27.8% of families, respectively.
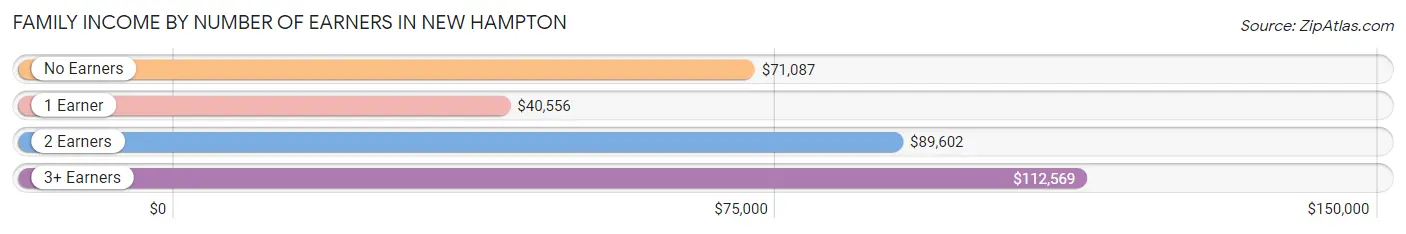
| Number of Earners | # Families | Median Income |
| No Earners | 84 (10.3%) | $71,087 |
| 1 Earner | 226 (27.8%) | $40,556 |
| 2 Earners | 391 (48.0%) | $89,602 |
| 3+ Earners | 113 (13.9%) | $112,569 |
| Total | 814 (100.0%) | $76,667 |
Household Income in New Hampton
Household Income Brackets in New Hampton
With 309 households falling in the category, the $75,000 to $99,999 income range is the most frequent in New Hampton, accounting for 20.7% of all households. In contrast, only 27 households (1.8%) fall into the less than $10,000 income bracket, making it the least populous group.
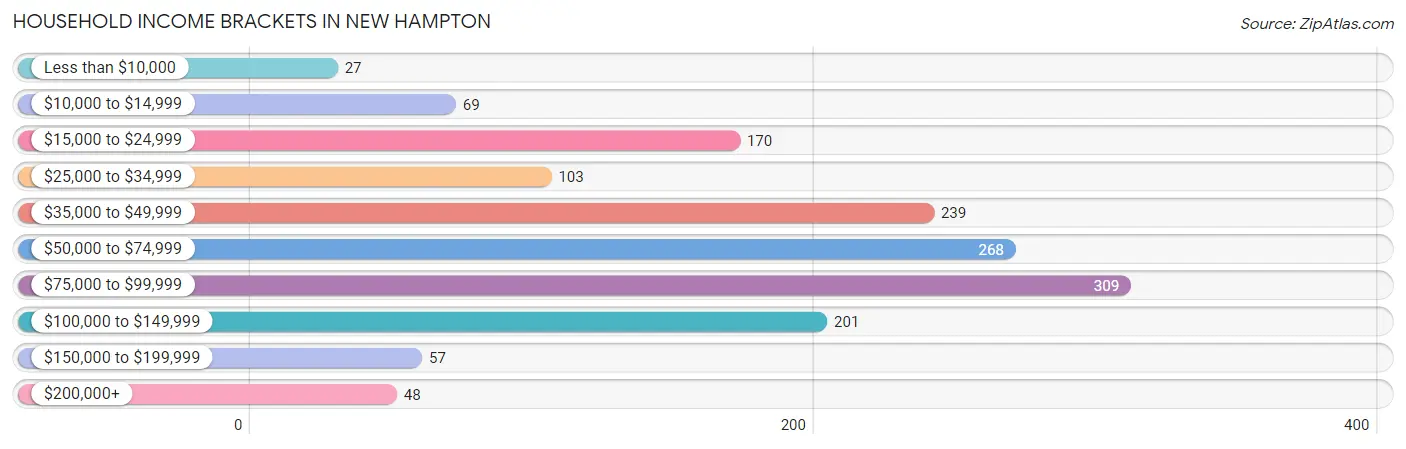
| Income Bracket | # Households | % Households |
| Less than $10,000 | 27 | 1.8% |
| $10,000 to $14,999 | 69 | 4.6% |
| $15,000 to $24,999 | 170 | 11.4% |
| $25,000 to $34,999 | 103 | 6.9% |
| $35,000 to $49,999 | 239 | 16.0% |
| $50,000 to $74,999 | 268 | 18.0% |
| $75,000 to $99,999 | 309 | 20.7% |
| $100,000 to $149,999 | 201 | 13.5% |
| $150,000 to $199,999 | 57 | 3.8% |
| $200,000+ | 48 | 3.2% |
Household Income by Householder Age in New Hampton
The median household income in New Hampton is $60,052, with the highest median household income of $75,727 found in the 25 to 44 years age bracket for the primary householder. A total of 369 households (24.7%) fall into this category. Meanwhile, the 15 to 24 years age bracket for the primary householder has the lowest median household income of $0, with 110 households (7.4%) in this group.
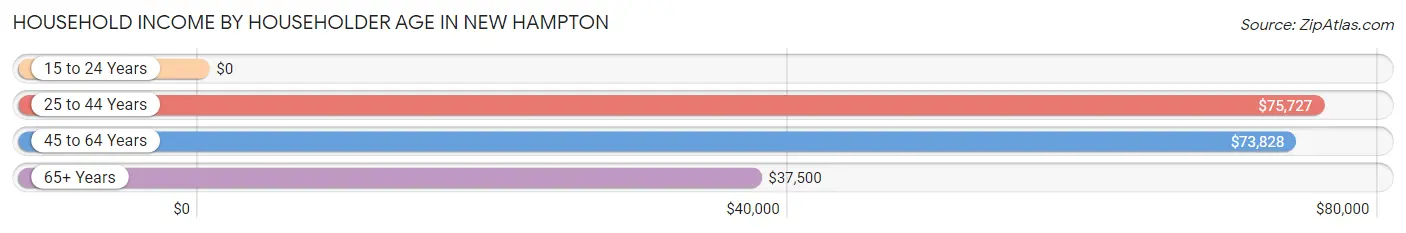
| Income Bracket | # Households | Median Income |
| 15 to 24 Years | 110 (7.4%) | $0 |
| 25 to 44 Years | 369 (24.7%) | $75,727 |
| 45 to 64 Years | 608 (40.8%) | $73,828 |
| 65+ Years | 404 (27.1%) | $37,500 |
| Total | 1,491 (100.0%) | $60,052 |
Poverty in New Hampton
Income Below Poverty by Sex and Age in New Hampton
With 9.6% poverty level for males and 9.5% for females among the residents of New Hampton, 18 to 24 year old males and 25 to 34 year old females are the most vulnerable to poverty, with 44 males (24.7%) and 42 females (23.2%) in their respective age groups living below the poverty level.
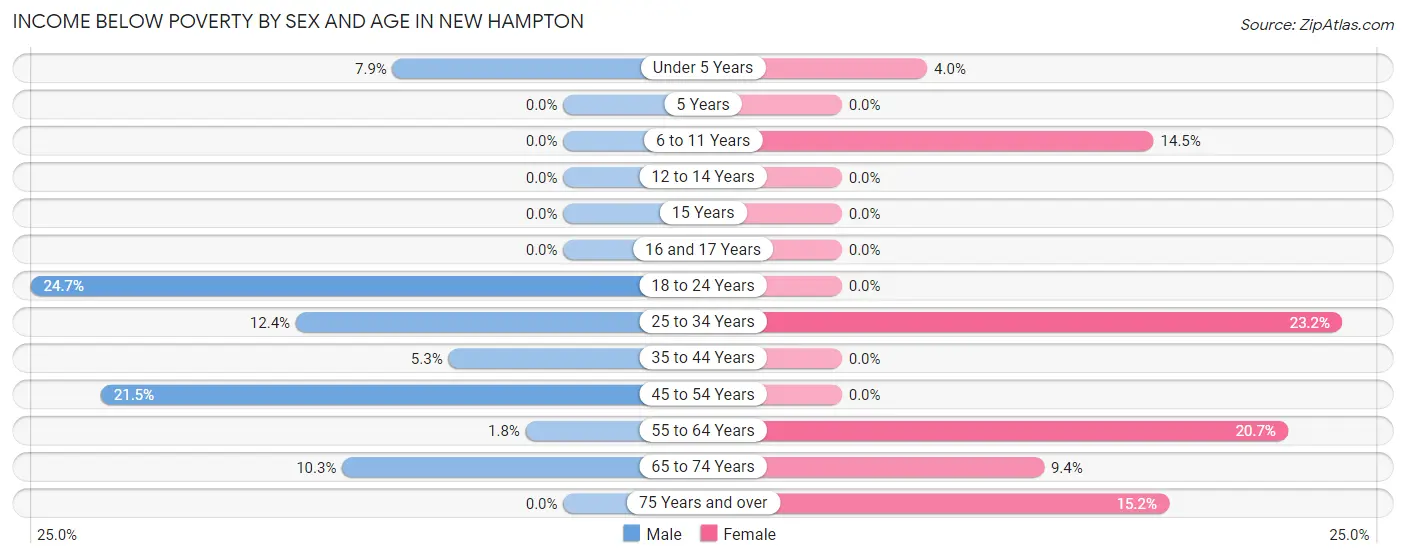
| Age Bracket | Male | Female |
| Under 5 Years | 8 (7.9%) | 8 (4.0%) |
| 5 Years | 0 (0.0%) | 0 (0.0%) |
| 6 to 11 Years | 0 (0.0%) | 22 (14.5%) |
| 12 to 14 Years | 0 (0.0%) | 0 (0.0%) |
| 15 Years | 0 (0.0%) | 0 (0.0%) |
| 16 and 17 Years | 0 (0.0%) | 0 (0.0%) |
| 18 to 24 Years | 44 (24.7%) | 0 (0.0%) |
| 25 to 34 Years | 17 (12.4%) | 42 (23.2%) |
| 35 to 44 Years | 9 (5.3%) | 0 (0.0%) |
| 45 to 54 Years | 47 (21.5%) | 0 (0.0%) |
| 55 to 64 Years | 5 (1.8%) | 48 (20.7%) |
| 65 to 74 Years | 24 (10.3%) | 18 (9.4%) |
| 75 Years and over | 0 (0.0%) | 22 (15.2%) |
| Total | 154 (9.6%) | 160 (9.5%) |
Income Above Poverty by Sex and Age in New Hampton
According to the poverty statistics in New Hampton, males aged 5 years and females aged 5 years are the age groups that are most secure financially, with 100.0% of males and 100.0% of females in these age groups living above the poverty line.
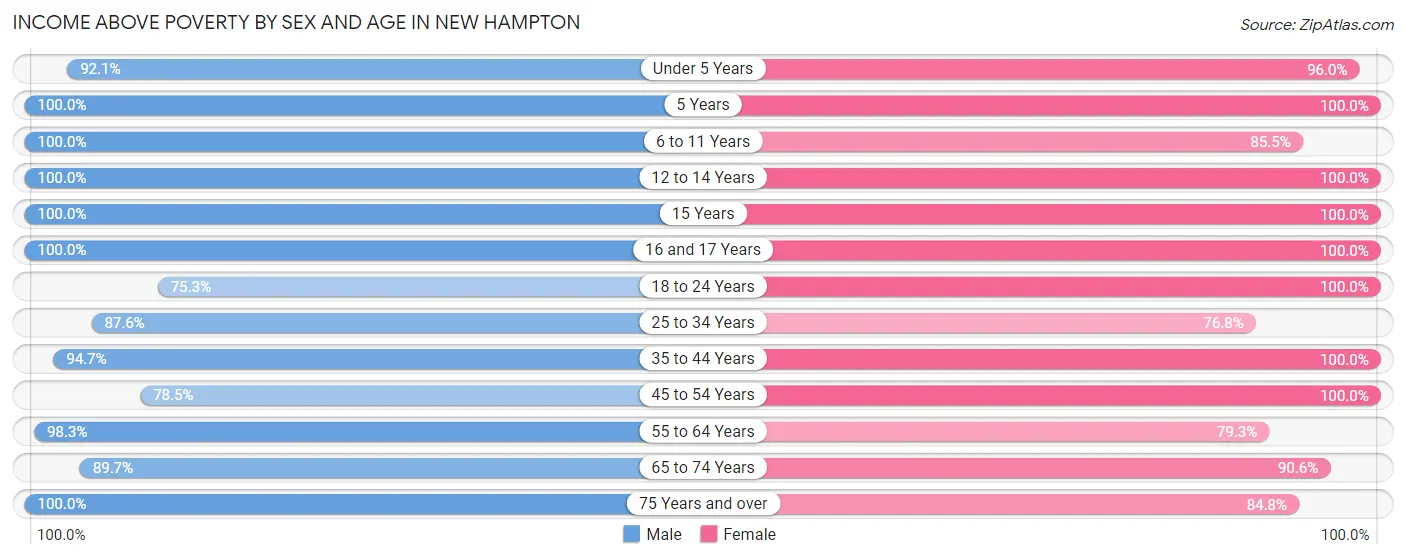
| Age Bracket | Male | Female |
| Under 5 Years | 93 (92.1%) | 194 (96.0%) |
| 5 Years | 36 (100.0%) | 11 (100.0%) |
| 6 to 11 Years | 57 (100.0%) | 130 (85.5%) |
| 12 to 14 Years | 83 (100.0%) | 19 (100.0%) |
| 15 Years | 21 (100.0%) | 13 (100.0%) |
| 16 and 17 Years | 24 (100.0%) | 69 (100.0%) |
| 18 to 24 Years | 134 (75.3%) | 119 (100.0%) |
| 25 to 34 Years | 120 (87.6%) | 139 (76.8%) |
| 35 to 44 Years | 160 (94.7%) | 140 (100.0%) |
| 45 to 54 Years | 172 (78.5%) | 212 (100.0%) |
| 55 to 64 Years | 281 (98.3%) | 184 (79.3%) |
| 65 to 74 Years | 210 (89.7%) | 174 (90.6%) |
| 75 Years and over | 56 (100.0%) | 123 (84.8%) |
| Total | 1,447 (90.4%) | 1,527 (90.5%) |
Income Below Poverty Among Married-Couple Families in New Hampton
The poverty statistics for married-couple families in New Hampton show that 1.4% or 9 of the total 656 families live below the poverty line. Families with 1 or 2 children have the highest poverty rate of 5.6%, comprising of 9 families. On the other hand, families with no children have the lowest poverty rate of 0.0%, which includes 0 families.
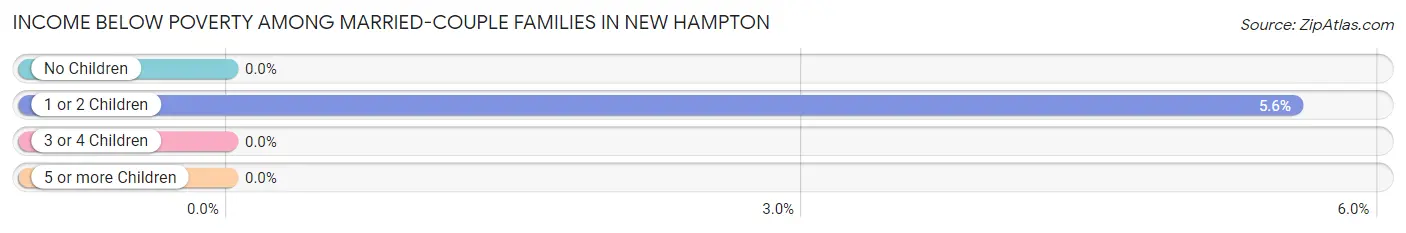
| Children | Above Poverty | Below Poverty |
| No Children | 388 (100.0%) | 0 (0.0%) |
| 1 or 2 Children | 153 (94.4%) | 9 (5.6%) |
| 3 or 4 Children | 83 (100.0%) | 0 (0.0%) |
| 5 or more Children | 23 (100.0%) | 0 (0.0%) |
| Total | 647 (98.6%) | 9 (1.4%) |
Income Below Poverty Among Single-Parent Households in New Hampton
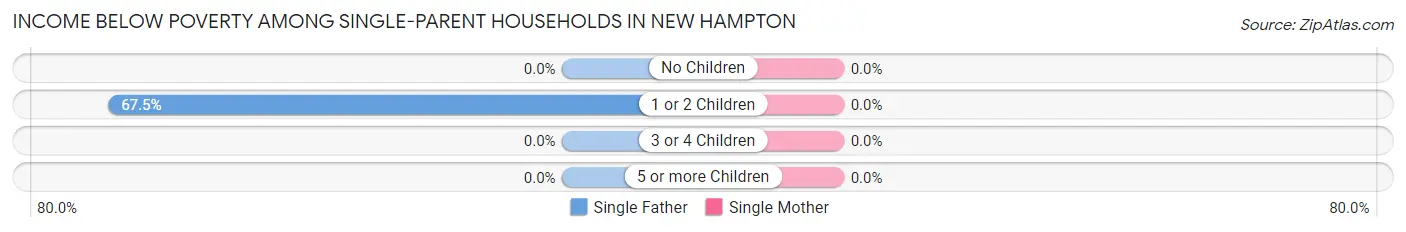
| Children | Single Father | Single Mother |
| No Children | 0 (0.0%) | 0 (0.0%) |
| 1 or 2 Children | 52 (67.5%) | 0 (0.0%) |
| 3 or 4 Children | 0 (0.0%) | 0 (0.0%) |
| 5 or more Children | 0 (0.0%) | 0 (0.0%) |
| Total | 52 (53.6%) | 0 (0.0%) |
Income Below Poverty Among Married-Couple vs Single-Parent Households in New Hampton
The poverty data for New Hampton shows that 9 of the married-couple family households (1.4%) and 52 of the single-parent households (32.9%) are living below the poverty level. Within the married-couple family households, those with 1 or 2 children have the highest poverty rate, with 9 households (5.6%) falling below the poverty line. Among the single-parent households, those with 1 or 2 children have the highest poverty rate, with 52 household (55.9%) living below poverty.
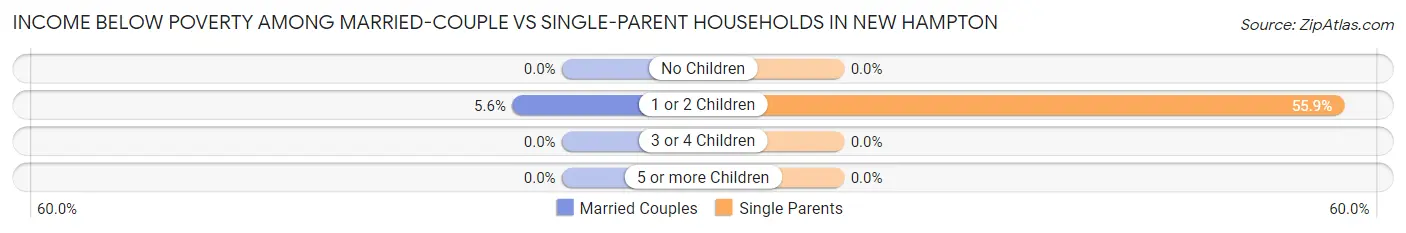
| Children | Married-Couple Families | Single-Parent Households |
| No Children | 0 (0.0%) | 0 (0.0%) |
| 1 or 2 Children | 9 (5.6%) | 52 (55.9%) |
| 3 or 4 Children | 0 (0.0%) | 0 (0.0%) |
| 5 or more Children | 0 (0.0%) | 0 (0.0%) |
| Total | 9 (1.4%) | 52 (32.9%) |
Race in New Hampton
The most populous races in New Hampton are White / Caucasian (3,436 | 98.9%), Hispanic or Latino (221 | 6.4%), and Black / African American (27 | 0.8%).
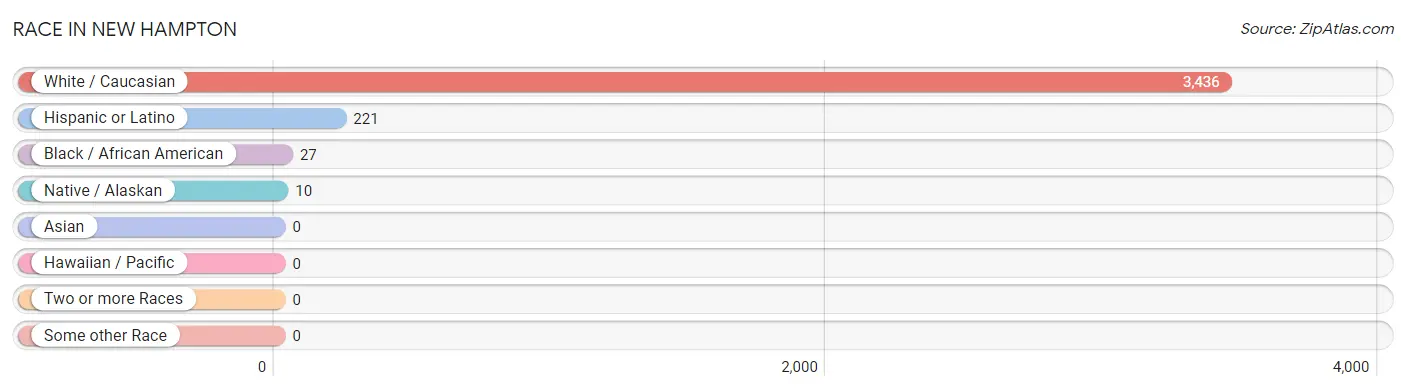
| Race | # Population | % Population |
| Asian | 0 | 0.0% |
| Black / African American | 27 | 0.8% |
| Hawaiian / Pacific | 0 | 0.0% |
| Hispanic or Latino | 221 | 6.4% |
| Native / Alaskan | 10 | 0.3% |
| White / Caucasian | 3,436 | 98.9% |
| Two or more Races | 0 | 0.0% |
| Some other Race | 0 | 0.0% |
| Total | 3,473 | 100.0% |
Ancestry in New Hampton
The most populous ancestries reported in New Hampton are German (1,727 | 49.7%), Irish (342 | 9.9%), Norwegian (339 | 9.8%), Mexican (208 | 6.0%), and English (175 | 5.0%), together accounting for 80.4% of all New Hampton residents.
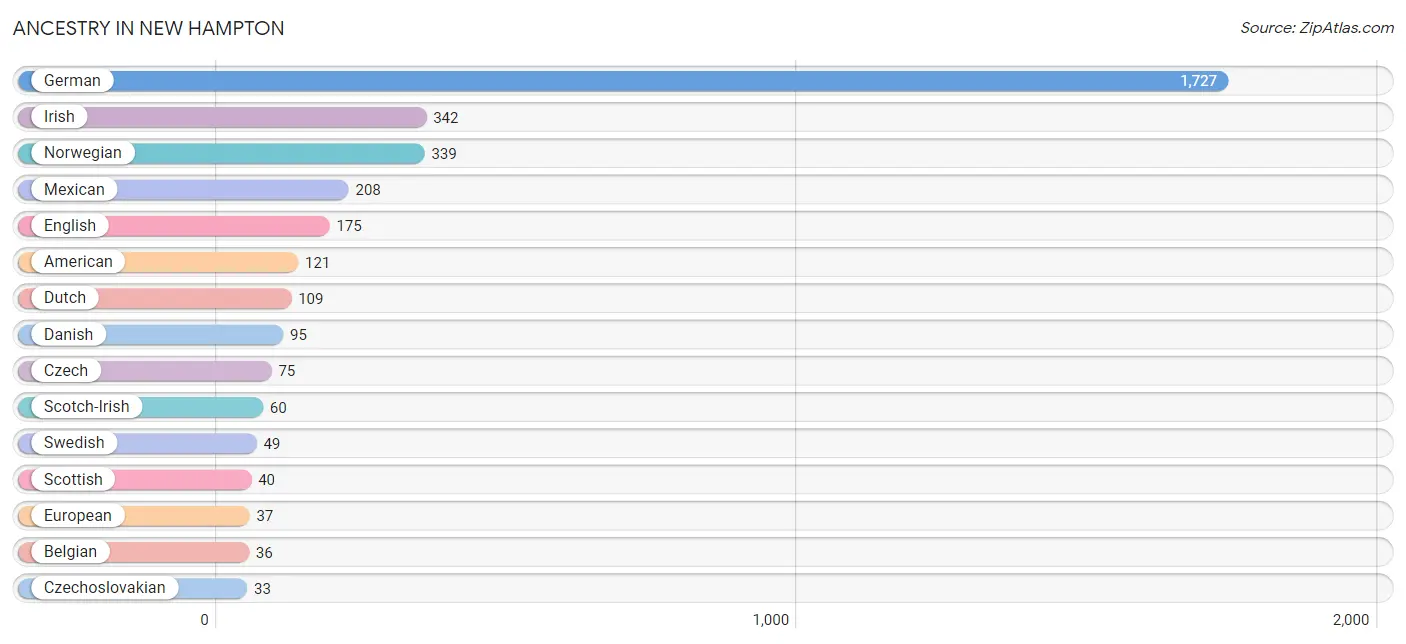
| Ancestry | # Population | % Population |
| American | 121 | 3.5% |
| Belgian | 36 | 1.0% |
| British | 9 | 0.3% |
| Czech | 75 | 2.2% |
| Czechoslovakian | 33 | 0.9% |
| Danish | 95 | 2.7% |
| Dutch | 109 | 3.1% |
| English | 175 | 5.0% |
| European | 37 | 1.1% |
| French | 10 | 0.3% |
| German | 1,727 | 49.7% |
| Hungarian | 4 | 0.1% |
| Irish | 342 | 9.9% |
| Italian | 5 | 0.1% |
| Mexican | 208 | 6.0% |
| Norwegian | 339 | 9.8% |
| Polish | 12 | 0.4% |
| Scandinavian | 28 | 0.8% |
| Scotch-Irish | 60 | 1.7% |
| Scottish | 40 | 1.1% |
| Sioux | 10 | 0.3% |
| Swedish | 49 | 1.4% | View All 22 Rows |
Immigrants in New Hampton
The most numerous immigrant groups reported in New Hampton came from Latin America (85 | 2.5%), Central America (72 | 2.1%), Mexico (72 | 2.1%), Ecuador (13 | 0.4%), and South America (13 | 0.4%), together accounting for 7.3% of all New Hampton residents.
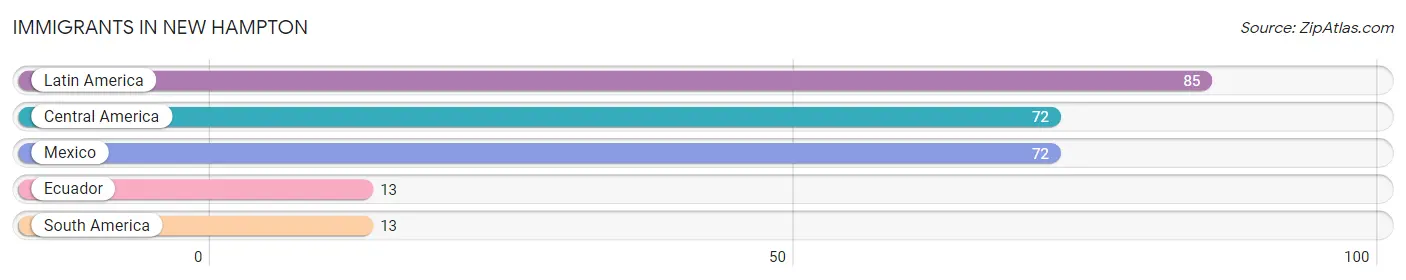
| Immigration Origin | # Population | % Population |
| Central America | 72 | 2.1% |
| Ecuador | 13 | 0.4% |
| Latin America | 85 | 2.5% |
| Mexico | 72 | 2.1% |
| South America | 13 | 0.4% | View All 5 Rows |
Sex and Age in New Hampton
Sex and Age in New Hampton
The most populous age groups in New Hampton are 60 to 64 Years (212 | 12.7%) for men and Under 5 Years (202 | 11.2%) for women.
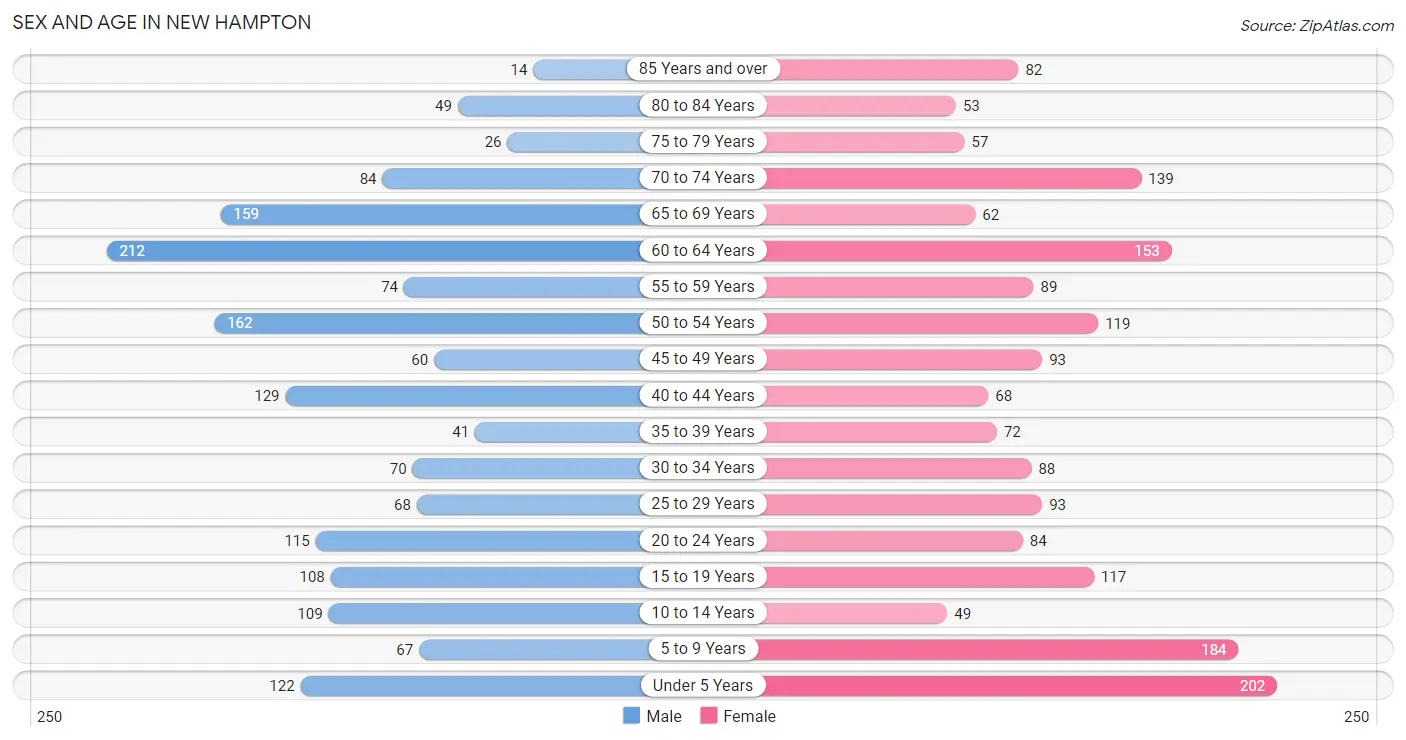
| Age Bracket | Male | Female |
| Under 5 Years | 122 (7.3%) | 202 (11.2%) |
| 5 to 9 Years | 67 (4.0%) | 184 (10.2%) |
| 10 to 14 Years | 109 (6.5%) | 49 (2.7%) |
| 15 to 19 Years | 108 (6.5%) | 117 (6.5%) |
| 20 to 24 Years | 115 (6.9%) | 84 (4.7%) |
| 25 to 29 Years | 68 (4.1%) | 93 (5.2%) |
| 30 to 34 Years | 70 (4.2%) | 88 (4.9%) |
| 35 to 39 Years | 41 (2.5%) | 72 (4.0%) |
| 40 to 44 Years | 129 (7.7%) | 68 (3.8%) |
| 45 to 49 Years | 60 (3.6%) | 93 (5.2%) |
| 50 to 54 Years | 162 (9.7%) | 119 (6.6%) |
| 55 to 59 Years | 74 (4.4%) | 89 (4.9%) |
| 60 to 64 Years | 212 (12.7%) | 153 (8.5%) |
| 65 to 69 Years | 159 (9.5%) | 62 (3.4%) |
| 70 to 74 Years | 84 (5.0%) | 139 (7.7%) |
| 75 to 79 Years | 26 (1.6%) | 57 (3.2%) |
| 80 to 84 Years | 49 (2.9%) | 53 (2.9%) |
| 85 Years and over | 14 (0.8%) | 82 (4.5%) |
| Total | 1,669 (100.0%) | 1,804 (100.0%) |
Families and Households in New Hampton
Median Family Size in New Hampton
The median family size in New Hampton is 3.01 persons per family, with single female/mother families (61 | 7.5%) accounting for the largest median family size of 3.56 persons per family. On the other hand, single male/father families (97 | 11.9%) represent the smallest median family size with 2.02 persons per family.
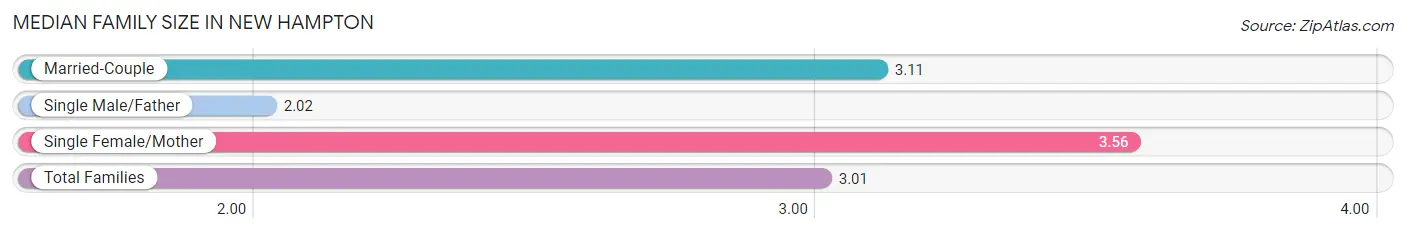
| Family Type | # Families | Family Size |
| Married-Couple | 656 (80.6%) | 3.11 |
| Single Male/Father | 97 (11.9%) | 2.02 |
| Single Female/Mother | 61 (7.5%) | 3.56 |
| Total Families | 814 (100.0%) | 3.01 |
Median Household Size in New Hampton
The median household size in New Hampton is 2.23 persons per household, with single female/mother households (61 | 4.1%) accounting for the largest median household size of 3.69 persons per household. non-family households (677 | 45.4%) represent the smallest median household size with 1.11 persons per household.
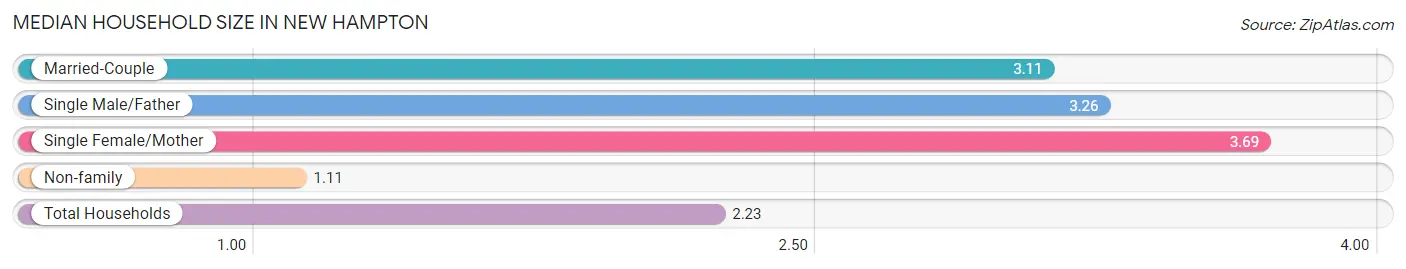
| Household Type | # Households | Household Size |
| Married-Couple | 656 (44.0%) | 3.11 |
| Single Male/Father | 97 (6.5%) | 3.26 |
| Single Female/Mother | 61 (4.1%) | 3.69 |
| Non-family | 677 (45.4%) | 1.11 |
| Total Households | 1,491 (100.0%) | 2.23 |
Household Size by Marriage Status in New Hampton
Out of a total of 1,491 households in New Hampton, 814 (54.6%) are family households, while 677 (45.4%) are nonfamily households. The most numerous type of family households are 2-person households, comprising 390, and the most common type of nonfamily households are 1-person households, comprising 602.
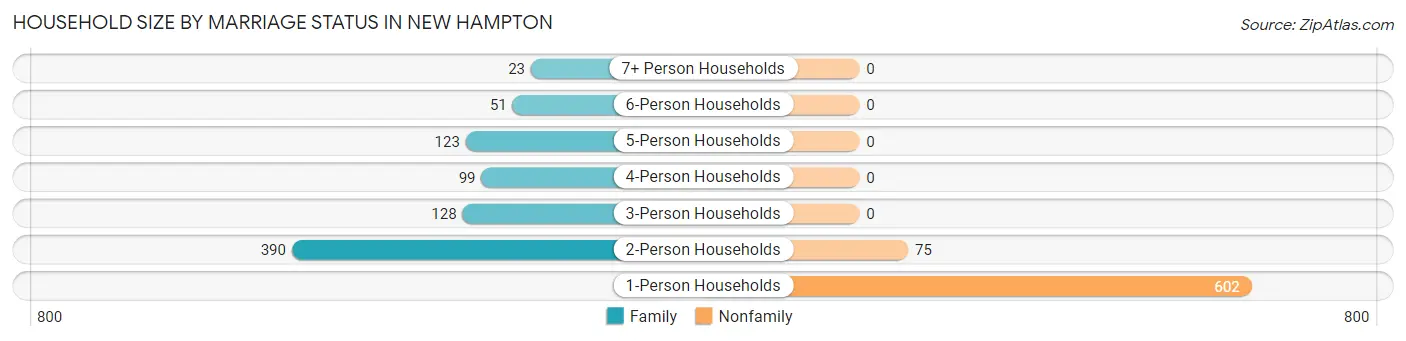
| Household Size | Family Households | Nonfamily Households |
| 1-Person Households | - | 602 (40.4%) |
| 2-Person Households | 390 (26.2%) | 75 (5.0%) |
| 3-Person Households | 128 (8.6%) | 0 (0.0%) |
| 4-Person Households | 99 (6.6%) | 0 (0.0%) |
| 5-Person Households | 123 (8.3%) | 0 (0.0%) |
| 6-Person Households | 51 (3.4%) | 0 (0.0%) |
| 7+ Person Households | 23 (1.5%) | 0 (0.0%) |
| Total | 814 (54.6%) | 677 (45.4%) |
Female Fertility in New Hampton
Fertility by Age in New Hampton
Average fertility rate in New Hampton is 153.0 births per 1,000 women. Women in the age bracket of 35 to 50 years have the highest fertility rate with 197.0 births per 1,000 women. Women in the age bracket of 35 to 50 years acount for 51.5% of all women with births.
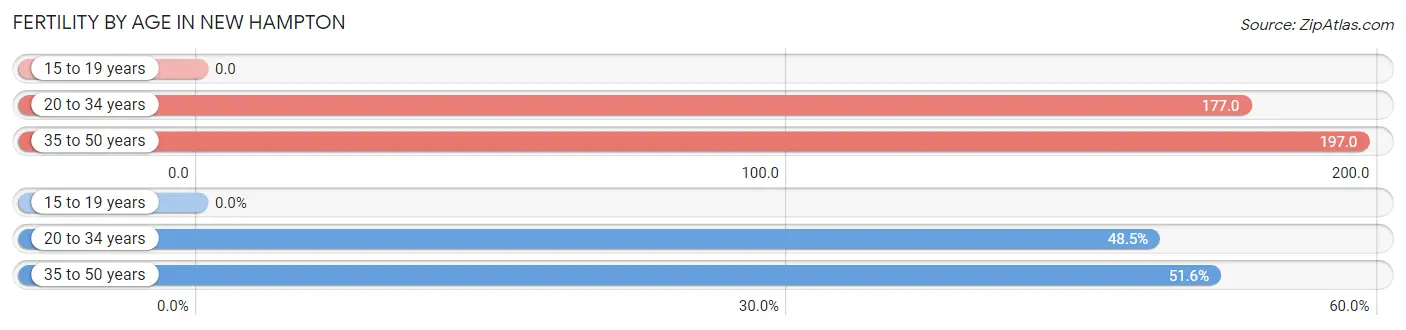
| Age Bracket | Women with Births | Births / 1,000 Women |
| 15 to 19 years | 0 (0.0%) | 0.0 |
| 20 to 34 years | 47 (48.4%) | 177.0 |
| 35 to 50 years | 50 (51.5%) | 197.0 |
| Total | 97 (100.0%) | 153.0 |
Fertility by Age by Marriage Status in New Hampton
82.5% of women with births (97) in New Hampton are married. The highest percentage of unmarried women with births falls into 20 to 34 years age bracket with 36.2% of them unmarried at the time of birth, while the lowest percentage of unmarried women with births belong to 35 to 50 years age bracket with 0.0% of them unmarried.
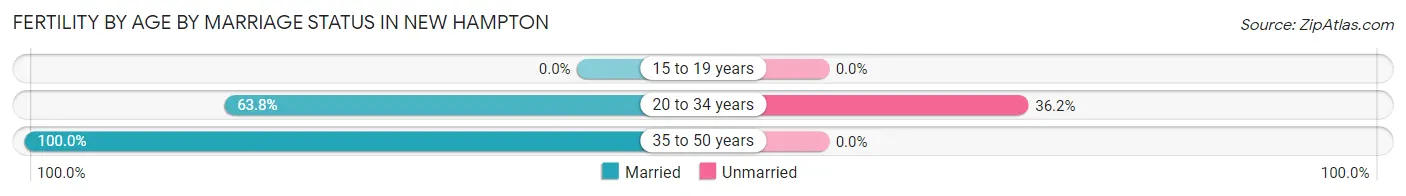
| Age Bracket | Married | Unmarried |
| 15 to 19 years | 0 (0.0%) | 0 (0.0%) |
| 20 to 34 years | 30 (63.8%) | 17 (36.2%) |
| 35 to 50 years | 50 (100.0%) | 0 (0.0%) |
| Total | 80 (82.5%) | 17 (17.5%) |
Fertility by Education in New Hampton
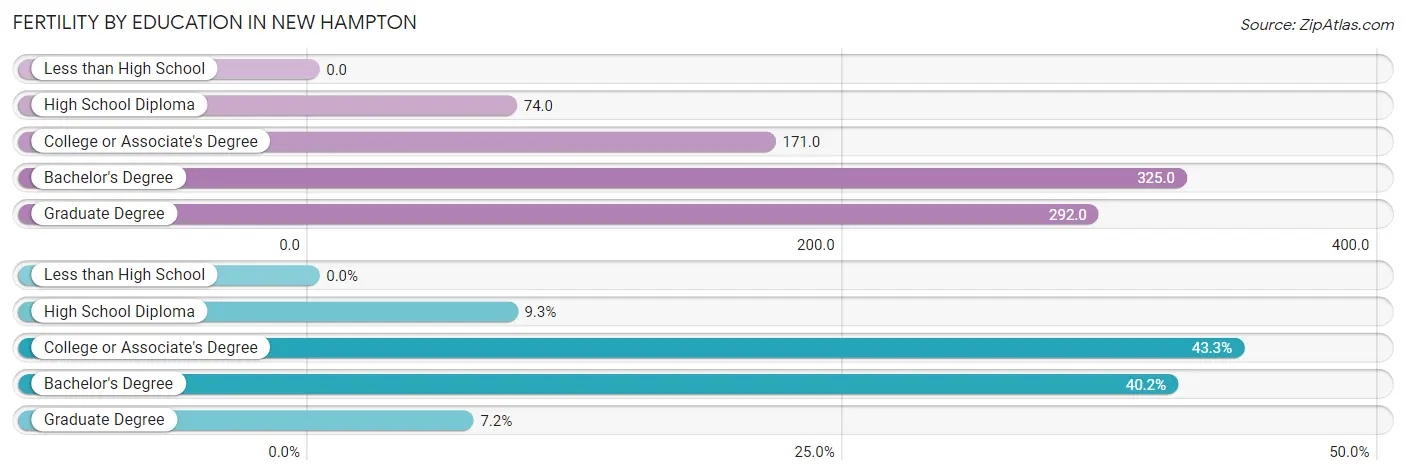
| Educational Attainment | Women with Births | Births / 1,000 Women |
| Less than High School | 0 (0.0%) | 0.0 |
| High School Diploma | 9 (9.3%) | 74.0 |
| College or Associate's Degree | 42 (43.3%) | 171.0 |
| Bachelor's Degree | 39 (40.2%) | 325.0 |
| Graduate Degree | 7 (7.2%) | 292.0 |
| Total | 97 (100.0%) | 153.0 |
Fertility by Education by Marriage Status in New Hampton
17.5% of women with births in New Hampton are unmarried. Women with the educational attainment of bachelor's degree are most likely to be married with 100.0% of them married at childbirth, while women with the educational attainment of high school diploma are least likely to be married with 100.0% of them unmarried at childbirth.
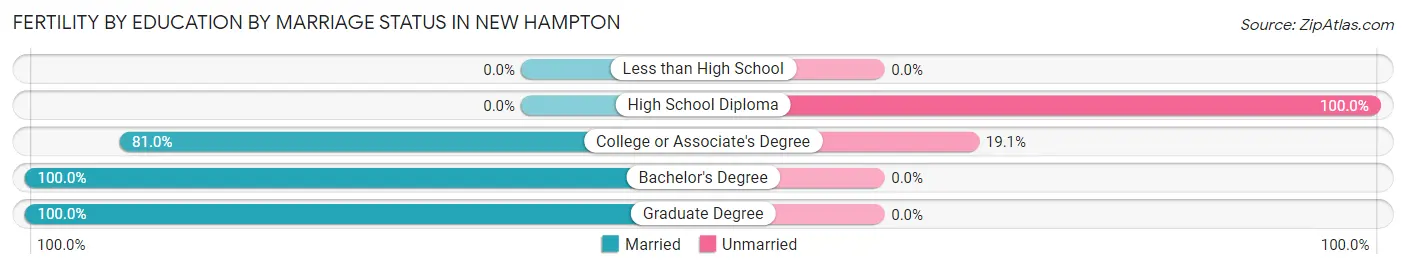
| Educational Attainment | Married | Unmarried |
| Less than High School | 0 (0.0%) | 0 (0.0%) |
| High School Diploma | 0 (0.0%) | 9 (100.0%) |
| College or Associate's Degree | 34 (80.9%) | 8 (19.1%) |
| Bachelor's Degree | 39 (100.0%) | 0 (0.0%) |
| Graduate Degree | 7 (100.0%) | 0 (0.0%) |
| Total | 80 (82.5%) | 17 (17.5%) |
Employment Characteristics in New Hampton
Employment by Class of Employer in New Hampton
Among the 1,653 employed individuals in New Hampton, private company employees (1,202 | 72.7%), not-for-profit organizations (166 | 10.0%), and local government employees (113 | 6.8%) make up the most common classes of employment.
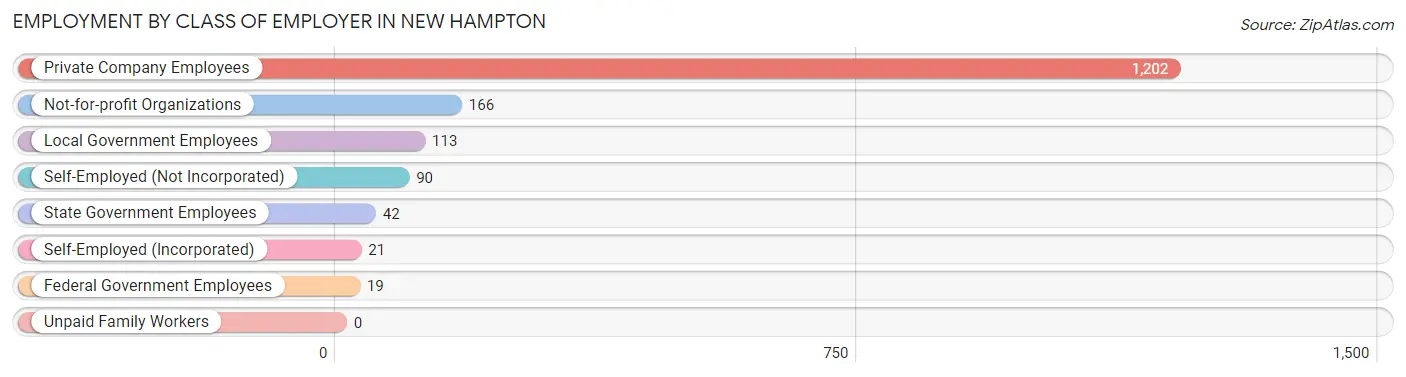
| Employer Class | # Employees | % Employees |
| Private Company Employees | 1,202 | 72.7% |
| Self-Employed (Incorporated) | 21 | 1.3% |
| Self-Employed (Not Incorporated) | 90 | 5.4% |
| Not-for-profit Organizations | 166 | 10.0% |
| Local Government Employees | 113 | 6.8% |
| State Government Employees | 42 | 2.5% |
| Federal Government Employees | 19 | 1.1% |
| Unpaid Family Workers | 0 | 0.0% |
| Total | 1,653 | 100.0% |
Employment Status by Age in New Hampton
According to the labor force statistics for New Hampton, out of the total population over 16 years of age (2,706), 67.4% or 1,824 individuals are in the labor force, with 3.6% or 66 of them unemployed. The age group with the highest labor force participation rate is 35 to 44 years, with 96.8% or 300 individuals in the labor force. Within the labor force, the 20 to 24 years age range has the highest percentage of unemployed individuals, with 24.7% or 44 of them being unemployed.
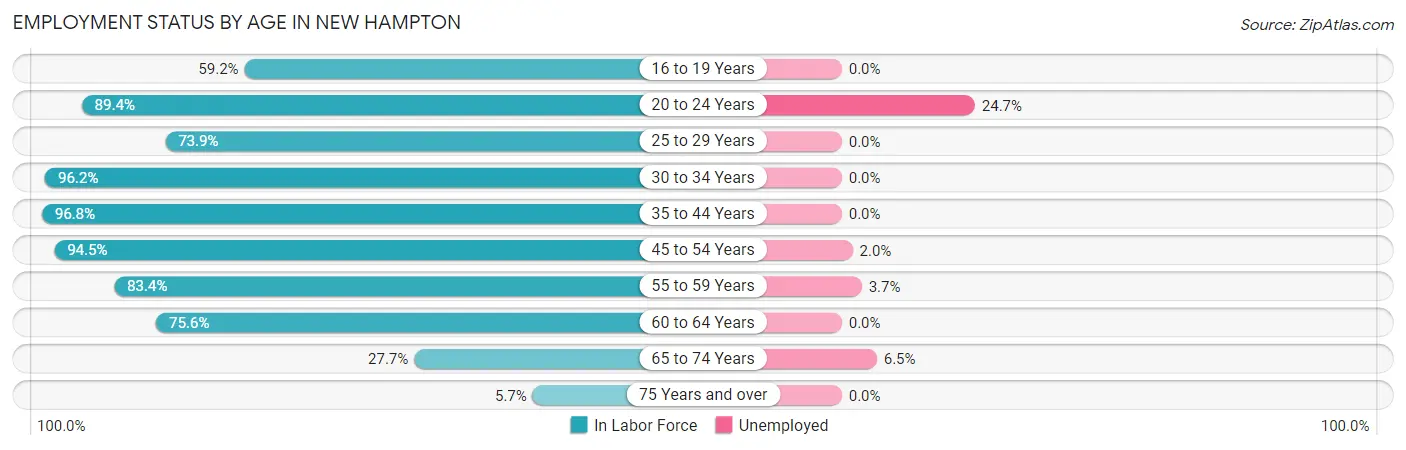
| Age Bracket | In Labor Force | Unemployed |
| 16 to 19 Years | 113 (59.2%) | 0 (0.0%) |
| 20 to 24 Years | 178 (89.4%) | 44 (24.7%) |
| 25 to 29 Years | 119 (73.9%) | 0 (0.0%) |
| 30 to 34 Years | 152 (96.2%) | 0 (0.0%) |
| 35 to 44 Years | 300 (96.8%) | 0 (0.0%) |
| 45 to 54 Years | 410 (94.5%) | 8 (2.0%) |
| 55 to 59 Years | 136 (83.4%) | 5 (3.7%) |
| 60 to 64 Years | 276 (75.6%) | 0 (0.0%) |
| 65 to 74 Years | 123 (27.7%) | 8 (6.5%) |
| 75 Years and over | 16 (5.7%) | 0 (0.0%) |
| Total | 1,824 (67.4%) | 66 (3.6%) |
Employment Status by Educational Attainment in New Hampton
According to labor force statistics for New Hampton, 87.6% of individuals (1,394) out of the total population between 25 and 64 years of age (1,591) are in the labor force, with 0.9% or 13 of them being unemployed. The group with the highest labor force participation rate are those with the educational attainment of college / associate degree, with 94.2% or 621 individuals in the labor force. Within the labor force, individuals with less than high school education have the highest percentage of unemployment, with 10.6% or 5 of them being unemployed.
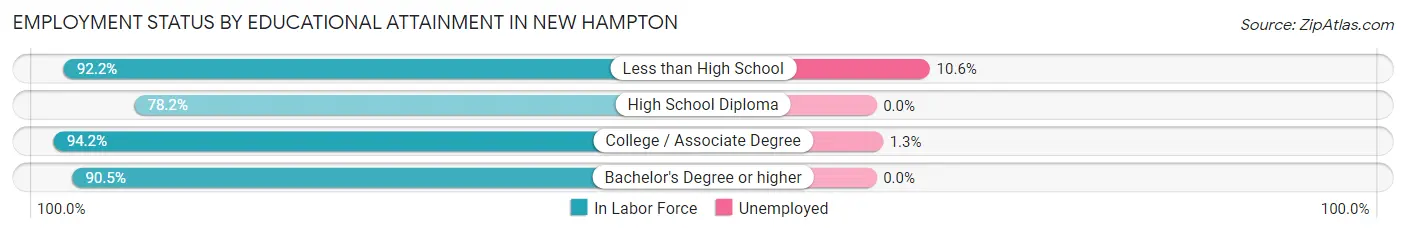
| Educational Attainment | In Labor Force | Unemployed |
| Less than High School | 47 (92.2%) | 5 (10.6%) |
| High School Diploma | 458 (78.2%) | 0 (0.0%) |
| College / Associate Degree | 621 (94.2%) | 9 (1.3%) |
| Bachelor's Degree or higher | 267 (90.5%) | 0 (0.0%) |
| Total | 1,394 (87.6%) | 14 (0.9%) |
Employment Occupations by Sex in New Hampton
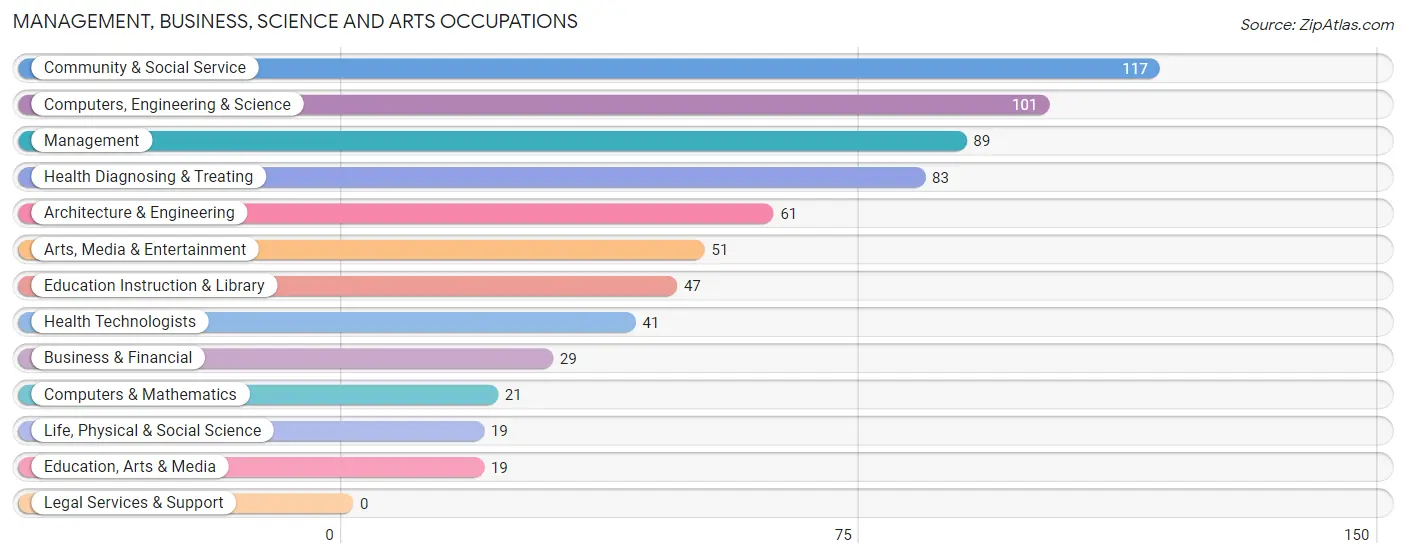
Management, Business, Science and Arts Occupations
The most common Management, Business, Science and Arts occupations in New Hampton are Community & Social Service (117 | 6.7%), Computers, Engineering & Science (101 | 5.8%), Management (89 | 5.1%), Health Diagnosing & Treating (83 | 4.7%), and Architecture & Engineering (61 | 3.5%).
Management, Business, Science and Arts Occupations by Sex
Within the Management, Business, Science and Arts occupations in New Hampton, the most male-oriented occupations are Computers & Mathematics (100.0%), Architecture & Engineering (100.0%), and Computers, Engineering & Science (93.1%), while the most female-oriented occupations are Arts, Media & Entertainment (100.0%), Health Diagnosing & Treating (100.0%), and Health Technologists (100.0%).
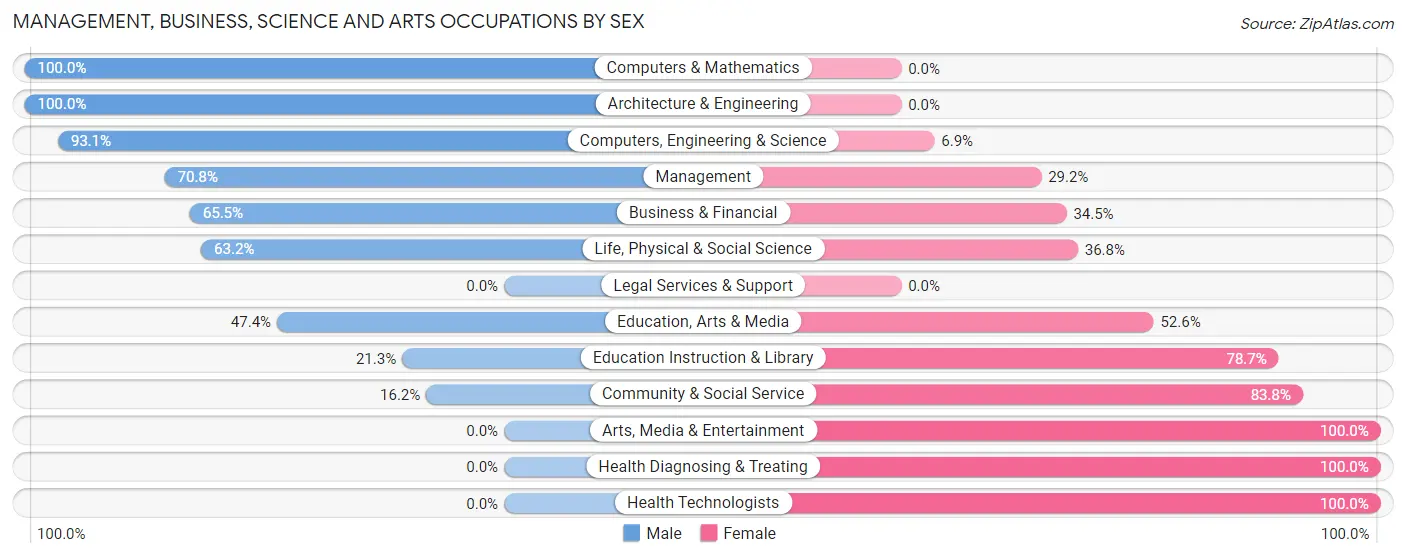
| Occupation | Male | Female |
| Management | 63 (70.8%) | 26 (29.2%) |
| Business & Financial | 19 (65.5%) | 10 (34.5%) |
| Computers, Engineering & Science | 94 (93.1%) | 7 (6.9%) |
| Computers & Mathematics | 21 (100.0%) | 0 (0.0%) |
| Architecture & Engineering | 61 (100.0%) | 0 (0.0%) |
| Life, Physical & Social Science | 12 (63.2%) | 7 (36.8%) |
| Community & Social Service | 19 (16.2%) | 98 (83.8%) |
| Education, Arts & Media | 9 (47.4%) | 10 (52.6%) |
| Legal Services & Support | 0 (0.0%) | 0 (0.0%) |
| Education Instruction & Library | 10 (21.3%) | 37 (78.7%) |
| Arts, Media & Entertainment | 0 (0.0%) | 51 (100.0%) |
| Health Diagnosing & Treating | 0 (0.0%) | 83 (100.0%) |
| Health Technologists | 0 (0.0%) | 41 (100.0%) |
| Total (Category) | 195 (46.5%) | 224 (53.5%) |
| Total (Overall) | 951 (54.1%) | 807 (45.9%) |
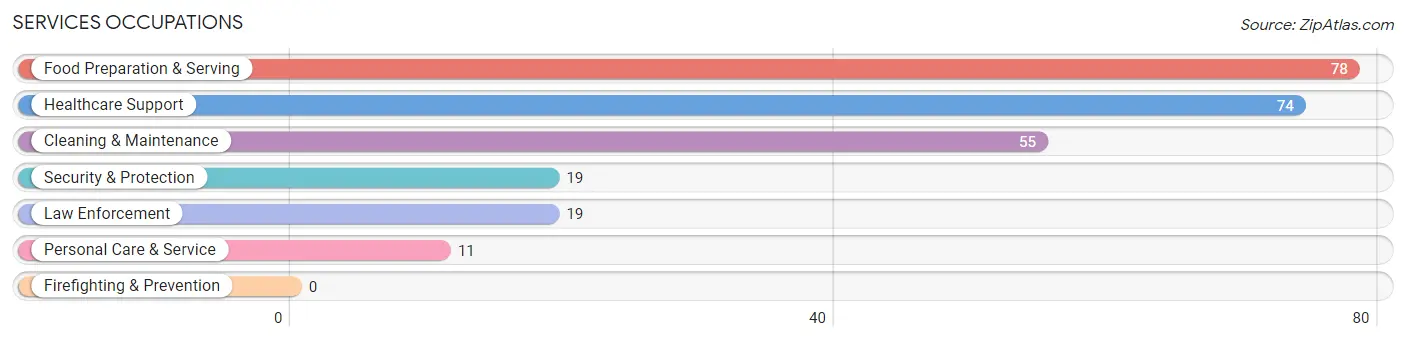
Services Occupations
The most common Services occupations in New Hampton are Food Preparation & Serving (78 | 4.4%), Healthcare Support (74 | 4.2%), Cleaning & Maintenance (55 | 3.1%), Security & Protection (19 | 1.1%), and Law Enforcement (19 | 1.1%).
Services Occupations by Sex
Within the Services occupations in New Hampton, the most male-oriented occupations are Security & Protection (57.9%), Law Enforcement (57.9%), and Cleaning & Maintenance (23.6%), while the most female-oriented occupations are Healthcare Support (100.0%), Personal Care & Service (100.0%), and Food Preparation & Serving (83.3%).
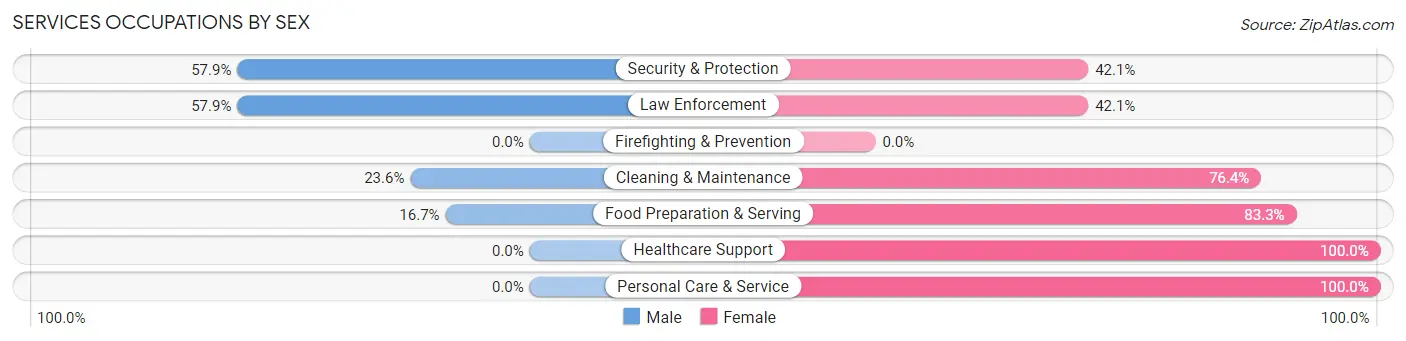
| Occupation | Male | Female |
| Healthcare Support | 0 (0.0%) | 74 (100.0%) |
| Security & Protection | 11 (57.9%) | 8 (42.1%) |
| Firefighting & Prevention | 0 (0.0%) | 0 (0.0%) |
| Law Enforcement | 11 (57.9%) | 8 (42.1%) |
| Food Preparation & Serving | 13 (16.7%) | 65 (83.3%) |
| Cleaning & Maintenance | 13 (23.6%) | 42 (76.4%) |
| Personal Care & Service | 0 (0.0%) | 11 (100.0%) |
| Total (Category) | 37 (15.6%) | 200 (84.4%) |
| Total (Overall) | 951 (54.1%) | 807 (45.9%) |
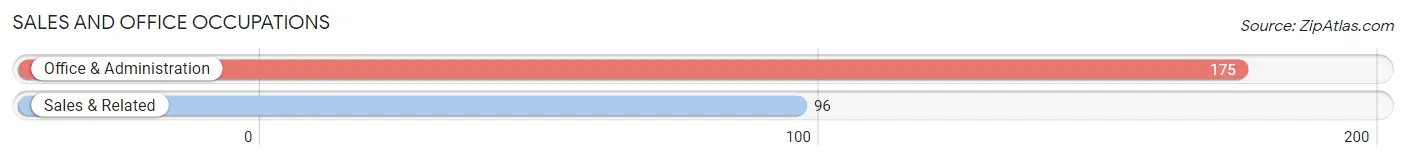
Sales and Office Occupations
The most common Sales and Office occupations in New Hampton are Office & Administration (175 | 10.0%), and Sales & Related (96 | 5.5%).
Sales and Office Occupations by Sex
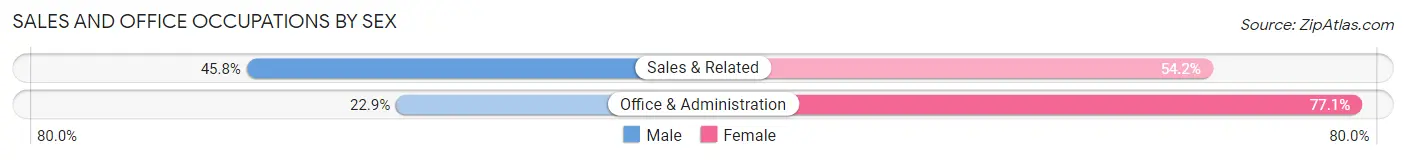
| Occupation | Male | Female |
| Sales & Related | 44 (45.8%) | 52 (54.2%) |
| Office & Administration | 40 (22.9%) | 135 (77.1%) |
| Total (Category) | 84 (31.0%) | 187 (69.0%) |
| Total (Overall) | 951 (54.1%) | 807 (45.9%) |
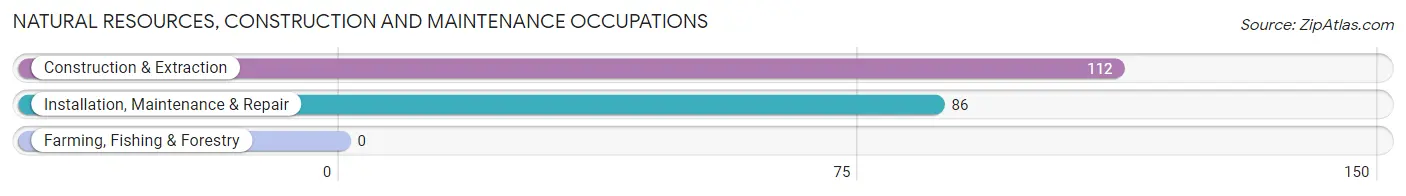
Natural Resources, Construction and Maintenance Occupations
The most common Natural Resources, Construction and Maintenance occupations in New Hampton are Construction & Extraction (112 | 6.4%), and Installation, Maintenance & Repair (86 | 4.9%).
Natural Resources, Construction and Maintenance Occupations by Sex
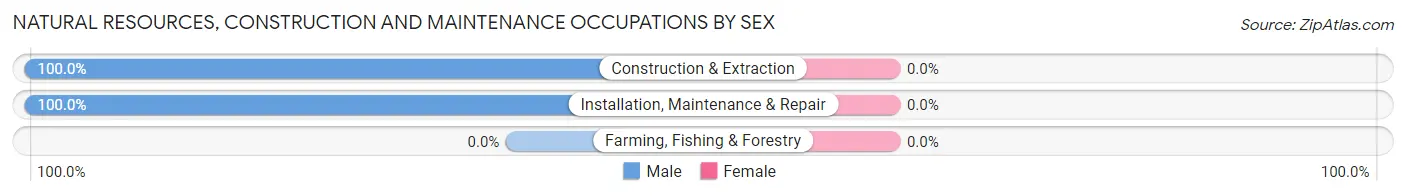
| Occupation | Male | Female |
| Farming, Fishing & Forestry | 0 (0.0%) | 0 (0.0%) |
| Construction & Extraction | 112 (100.0%) | 0 (0.0%) |
| Installation, Maintenance & Repair | 86 (100.0%) | 0 (0.0%) |
| Total (Category) | 198 (100.0%) | 0 (0.0%) |
| Total (Overall) | 951 (54.1%) | 807 (45.9%) |
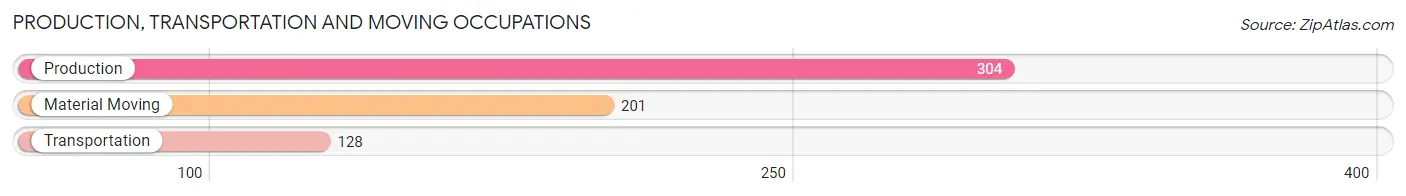
Production, Transportation and Moving Occupations
The most common Production, Transportation and Moving occupations in New Hampton are Production (304 | 17.3%), Material Moving (201 | 11.4%), and Transportation (128 | 7.3%).
Production, Transportation and Moving Occupations by Sex
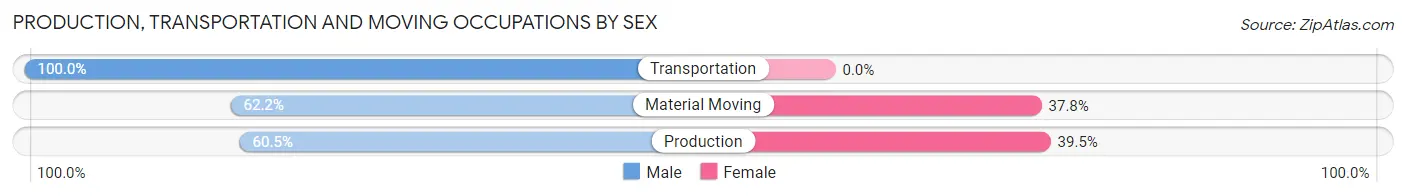
| Occupation | Male | Female |
| Production | 184 (60.5%) | 120 (39.5%) |
| Transportation | 128 (100.0%) | 0 (0.0%) |
| Material Moving | 125 (62.2%) | 76 (37.8%) |
| Total (Category) | 437 (69.0%) | 196 (31.0%) |
| Total (Overall) | 951 (54.1%) | 807 (45.9%) |
Employment Industries by Sex in New Hampton
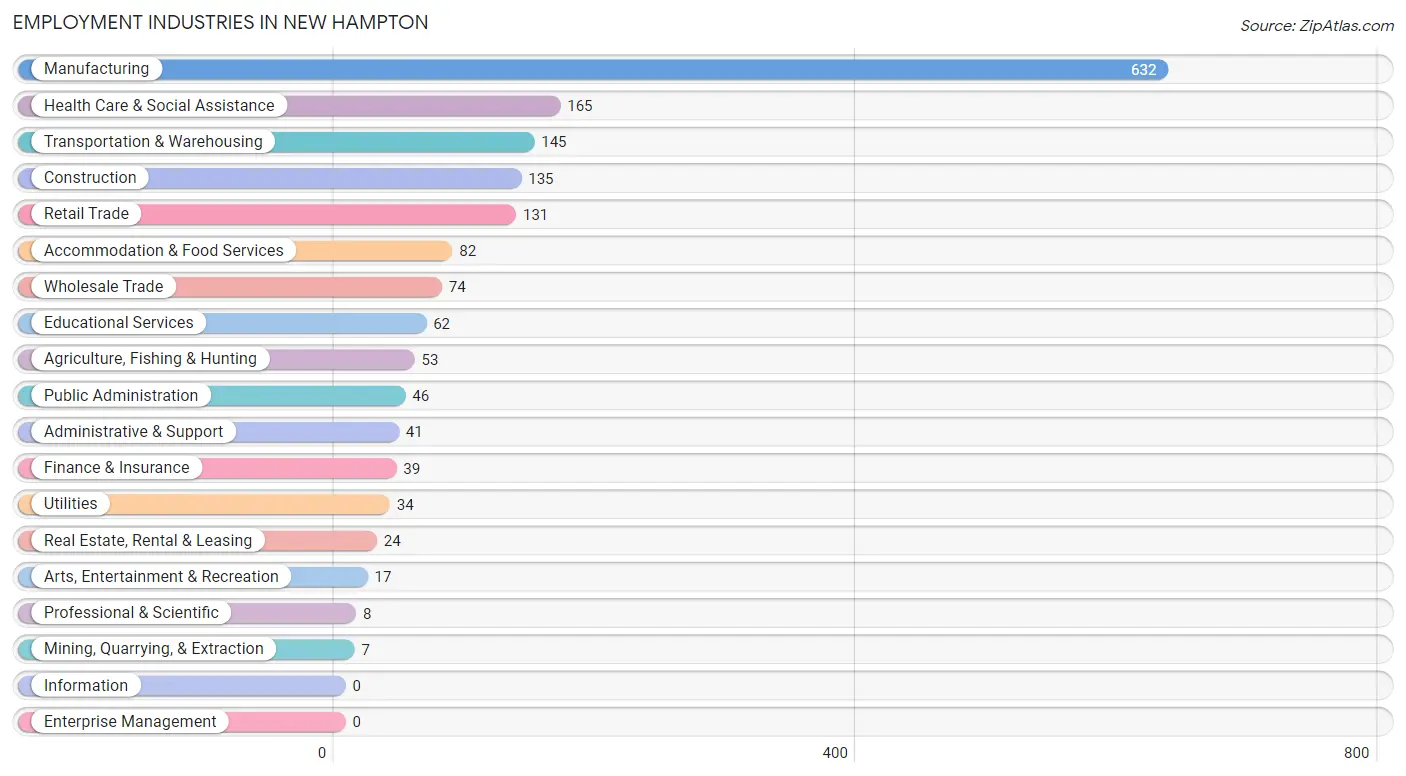
Employment Industries in New Hampton
The major employment industries in New Hampton include Manufacturing (632 | 35.9%), Health Care & Social Assistance (165 | 9.4%), Transportation & Warehousing (145 | 8.3%), Construction (135 | 7.7%), and Retail Trade (131 | 7.4%).
Employment Industries by Sex in New Hampton
The New Hampton industries that see more men than women are Agriculture, Fishing & Hunting (100.0%), Mining, Quarrying, & Extraction (100.0%), and Wholesale Trade (100.0%), whereas the industries that tend to have a higher number of women are Real Estate, Rental & Leasing (100.0%), Professional & Scientific (100.0%), and Arts, Entertainment & Recreation (100.0%).
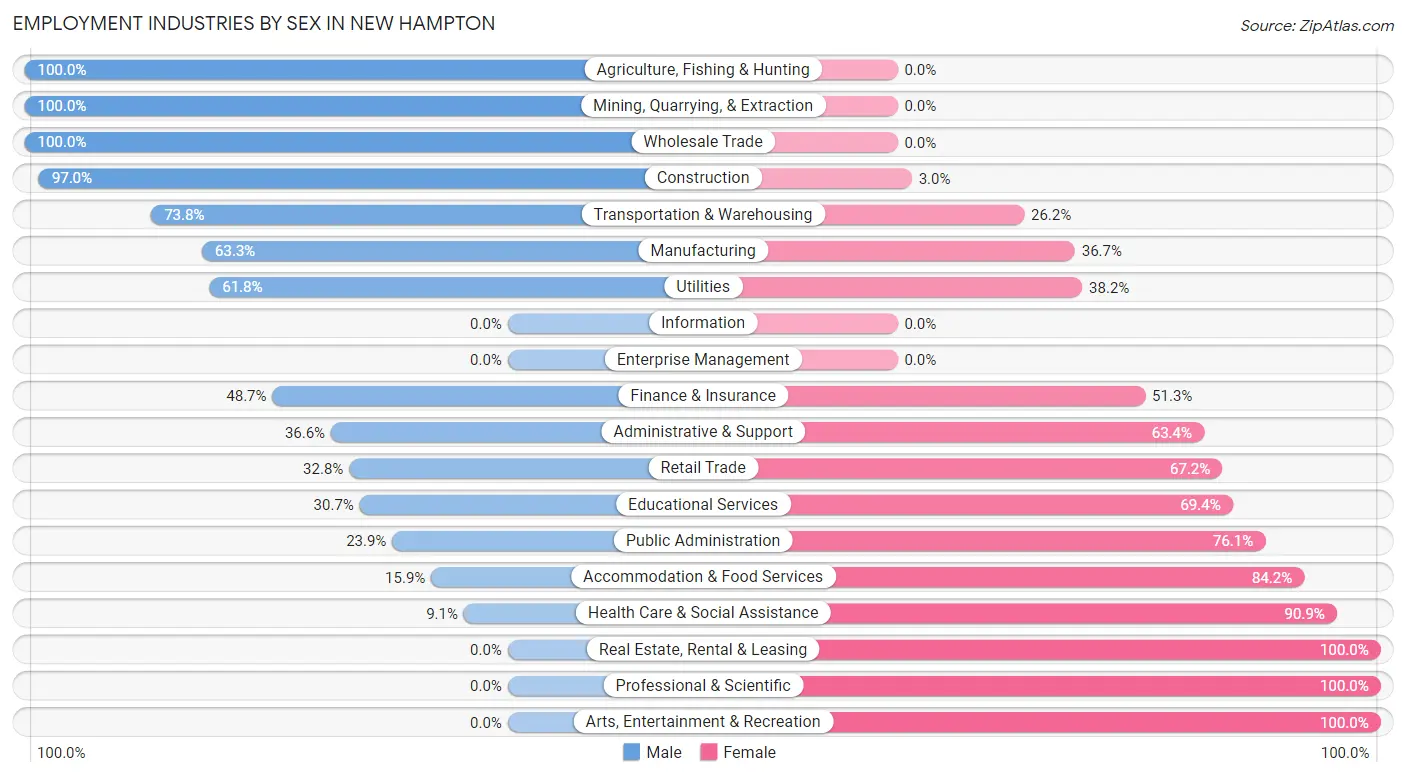
| Industry | Male | Female |
| Agriculture, Fishing & Hunting | 53 (100.0%) | 0 (0.0%) |
| Mining, Quarrying, & Extraction | 7 (100.0%) | 0 (0.0%) |
| Construction | 131 (97.0%) | 4 (3.0%) |
| Manufacturing | 400 (63.3%) | 232 (36.7%) |
| Wholesale Trade | 74 (100.0%) | 0 (0.0%) |
| Retail Trade | 43 (32.8%) | 88 (67.2%) |
| Transportation & Warehousing | 107 (73.8%) | 38 (26.2%) |
| Utilities | 21 (61.8%) | 13 (38.2%) |
| Information | 0 (0.0%) | 0 (0.0%) |
| Finance & Insurance | 19 (48.7%) | 20 (51.3%) |
| Real Estate, Rental & Leasing | 0 (0.0%) | 24 (100.0%) |
| Professional & Scientific | 0 (0.0%) | 8 (100.0%) |
| Enterprise Management | 0 (0.0%) | 0 (0.0%) |
| Administrative & Support | 15 (36.6%) | 26 (63.4%) |
| Educational Services | 19 (30.6%) | 43 (69.4%) |
| Health Care & Social Assistance | 15 (9.1%) | 150 (90.9%) |
| Arts, Entertainment & Recreation | 0 (0.0%) | 17 (100.0%) |
| Accommodation & Food Services | 13 (15.9%) | 69 (84.2%) |
| Public Administration | 11 (23.9%) | 35 (76.1%) |
| Total | 951 (54.1%) | 807 (45.9%) |
Education in New Hampton
School Enrollment in New Hampton
The most common levels of schooling among the 729 students in New Hampton are high school (206 | 28.3%), elementary school (181 | 24.8%), and middle school (110 | 15.1%).
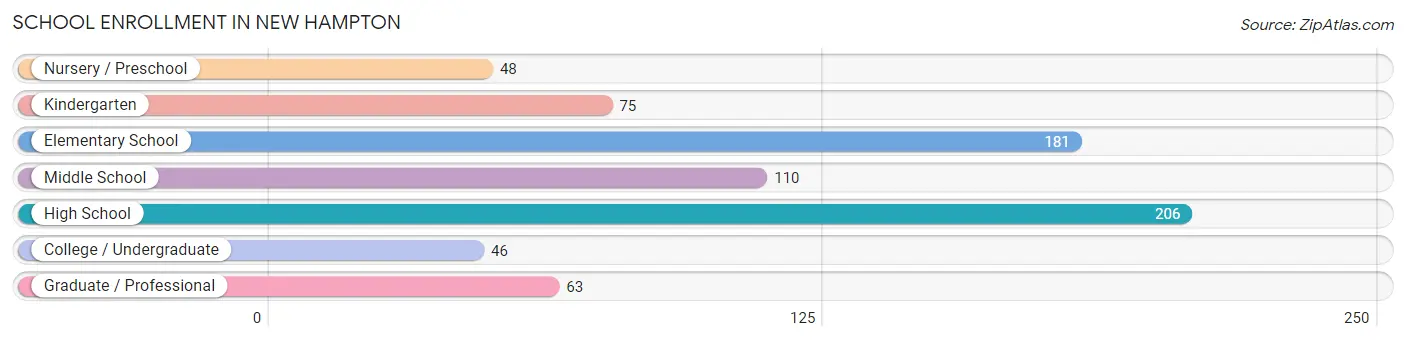
| School Level | # Students | % Students |
| Nursery / Preschool | 48 | 6.6% |
| Kindergarten | 75 | 10.3% |
| Elementary School | 181 | 24.8% |
| Middle School | 110 | 15.1% |
| High School | 206 | 28.3% |
| College / Undergraduate | 46 | 6.3% |
| Graduate / Professional | 63 | 8.6% |
| Total | 729 | 100.0% |
School Enrollment by Age by Funding Source in New Hampton
Out of a total of 729 students who are enrolled in schools in New Hampton, 123 (16.9%) attend a private institution, while the remaining 606 (83.1%) are enrolled in public schools. The age group of 35 years and over has the highest likelihood of being enrolled in private schools, with 40 (67.8% in the age bracket) enrolled. Conversely, the age group of 3 to 4 year olds has the lowest likelihood of being enrolled in a private school, with 21 (100.0% in the age bracket) attending a public institution.
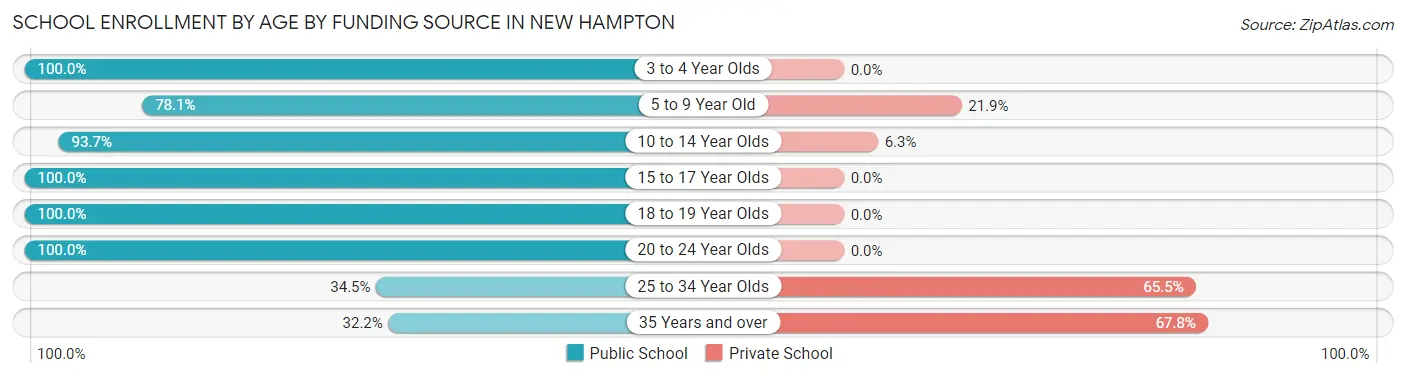
| Age Bracket | Public School | Private School |
| 3 to 4 Year Olds | 21 (100.0%) | 0 (0.0%) |
| 5 to 9 Year Old | 196 (78.1%) | 55 (21.9%) |
| 10 to 14 Year Olds | 133 (93.7%) | 9 (6.3%) |
| 15 to 17 Year Olds | 120 (100.0%) | 0 (0.0%) |
| 18 to 19 Year Olds | 86 (100.0%) | 0 (0.0%) |
| 20 to 24 Year Olds | 21 (100.0%) | 0 (0.0%) |
| 25 to 34 Year Olds | 10 (34.5%) | 19 (65.5%) |
| 35 Years and over | 19 (32.2%) | 40 (67.8%) |
| Total | 606 (83.1%) | 123 (16.9%) |
Educational Attainment by Field of Study in New Hampton
Education (179 | 37.6%), business (103 | 21.6%), science & technology (57 | 12.0%), bio, nature & agricultural (45 | 9.5%), and arts & humanities (35 | 7.3%) are the most common fields of study among 476 individuals in New Hampton who have obtained a bachelor's degree or higher.
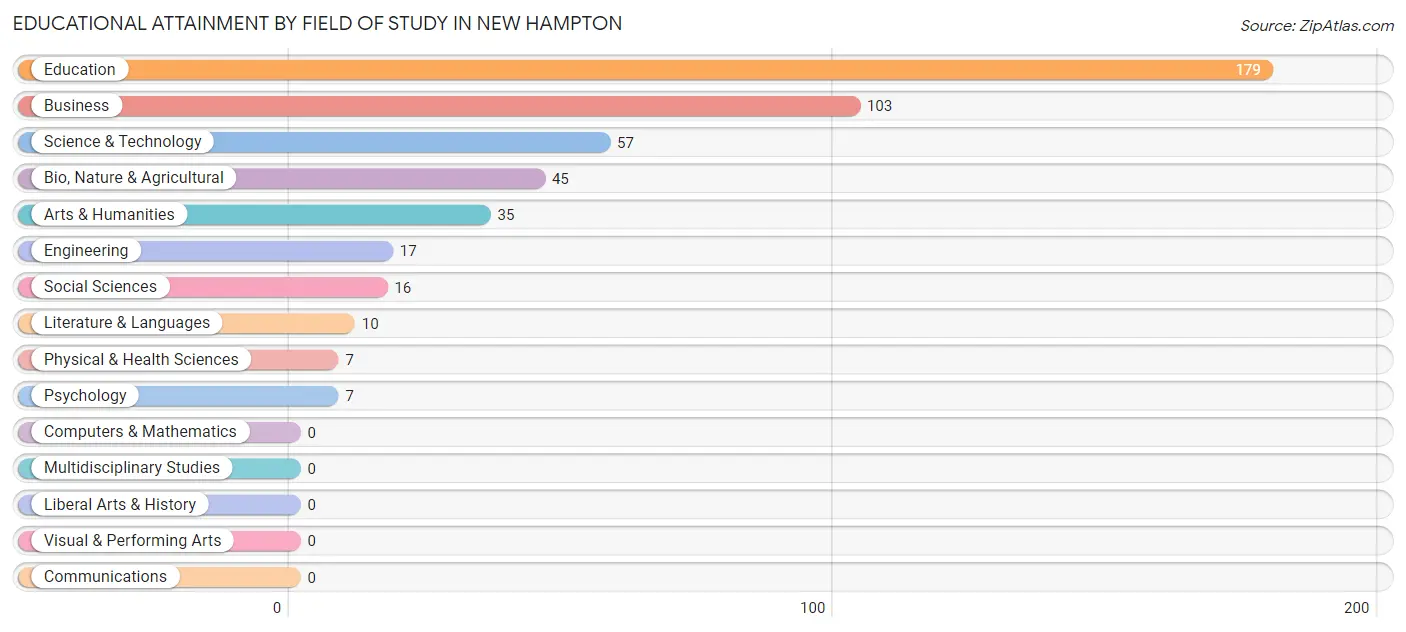
| Field of Study | # Graduates | % Graduates |
| Computers & Mathematics | 0 | 0.0% |
| Bio, Nature & Agricultural | 45 | 9.5% |
| Physical & Health Sciences | 7 | 1.5% |
| Psychology | 7 | 1.5% |
| Social Sciences | 16 | 3.4% |
| Engineering | 17 | 3.6% |
| Multidisciplinary Studies | 0 | 0.0% |
| Science & Technology | 57 | 12.0% |
| Business | 103 | 21.6% |
| Education | 179 | 37.6% |
| Literature & Languages | 10 | 2.1% |
| Liberal Arts & History | 0 | 0.0% |
| Visual & Performing Arts | 0 | 0.0% |
| Communications | 0 | 0.0% |
| Arts & Humanities | 35 | 7.3% |
| Total | 476 | 100.0% |
Transportation & Commute in New Hampton
Vehicle Availability by Sex in New Hampton
The most prevalent vehicle ownership categories in New Hampton are males with 2 vehicles (329, accounting for 39.0%) and females with 2 vehicles (266, making up 40.8%).
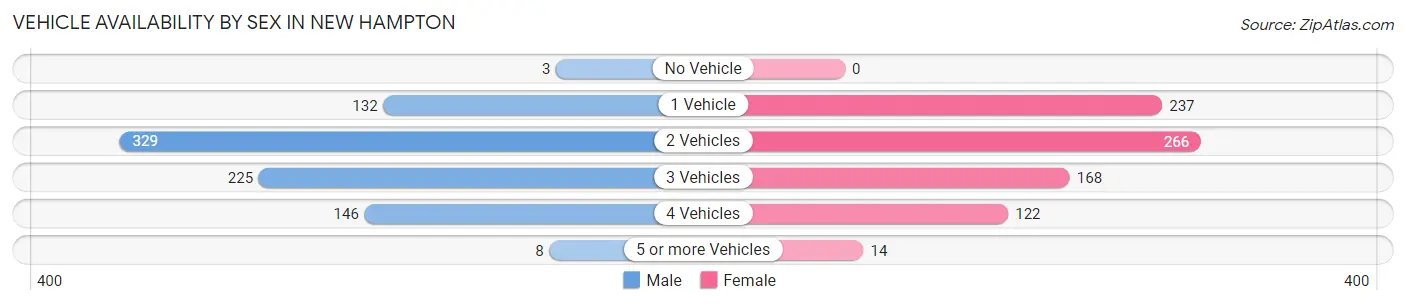
| Vehicles Available | Male | Female |
| No Vehicle | 3 (0.4%) | 0 (0.0%) |
| 1 Vehicle | 132 (15.7%) | 237 (29.4%) |
| 2 Vehicles | 329 (39.0%) | 266 (33.0%) |
| 3 Vehicles | 225 (26.7%) | 168 (20.8%) |
| 4 Vehicles | 146 (17.3%) | 122 (15.1%) |
| 5 or more Vehicles | 8 (0.9%) | 14 (1.7%) |
| Total | 843 (100.0%) | 807 (100.0%) |
Commute Time in New Hampton
The most frequently occuring commute durations in New Hampton are 5 to 9 minutes (533 commuters, 33.3%), less than 5 minutes (321 commuters, 20.1%), and 10 to 14 minutes (211 commuters, 13.2%).
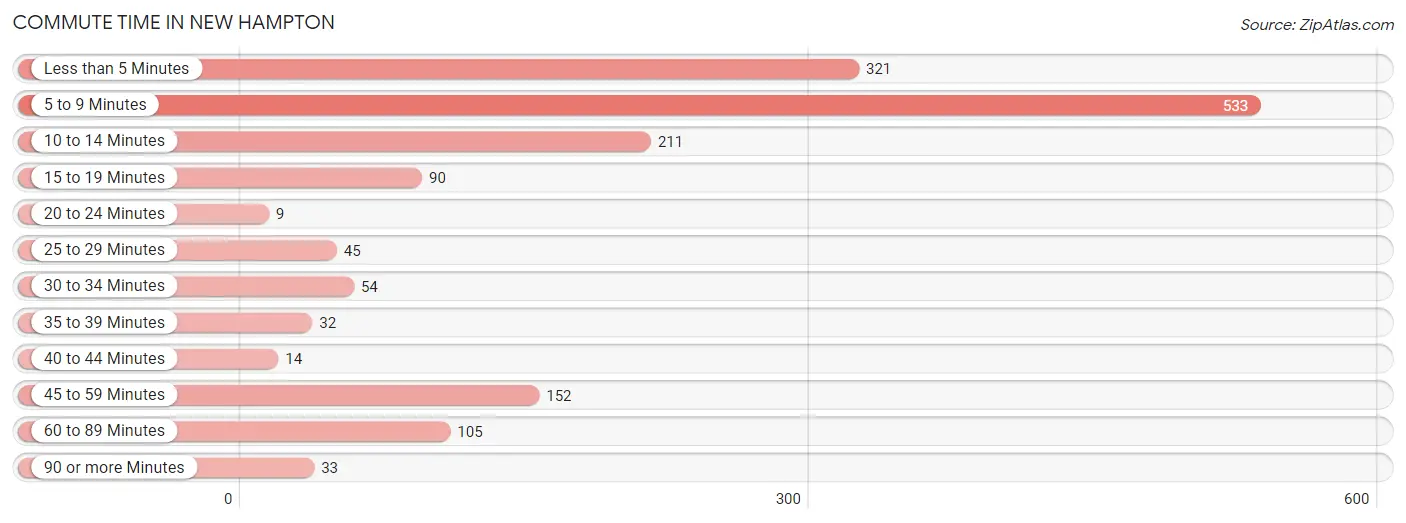
| Commute Time | # Commuters | % Commuters |
| Less than 5 Minutes | 321 | 20.1% |
| 5 to 9 Minutes | 533 | 33.3% |
| 10 to 14 Minutes | 211 | 13.2% |
| 15 to 19 Minutes | 90 | 5.6% |
| 20 to 24 Minutes | 9 | 0.6% |
| 25 to 29 Minutes | 45 | 2.8% |
| 30 to 34 Minutes | 54 | 3.4% |
| 35 to 39 Minutes | 32 | 2.0% |
| 40 to 44 Minutes | 14 | 0.9% |
| 45 to 59 Minutes | 152 | 9.5% |
| 60 to 89 Minutes | 105 | 6.6% |
| 90 or more Minutes | 33 | 2.1% |
Commute Time by Sex in New Hampton
The most common commute times in New Hampton are 5 to 9 minutes (232 commuters, 28.6%) for males and 5 to 9 minutes (301 commuters, 38.2%) for females.
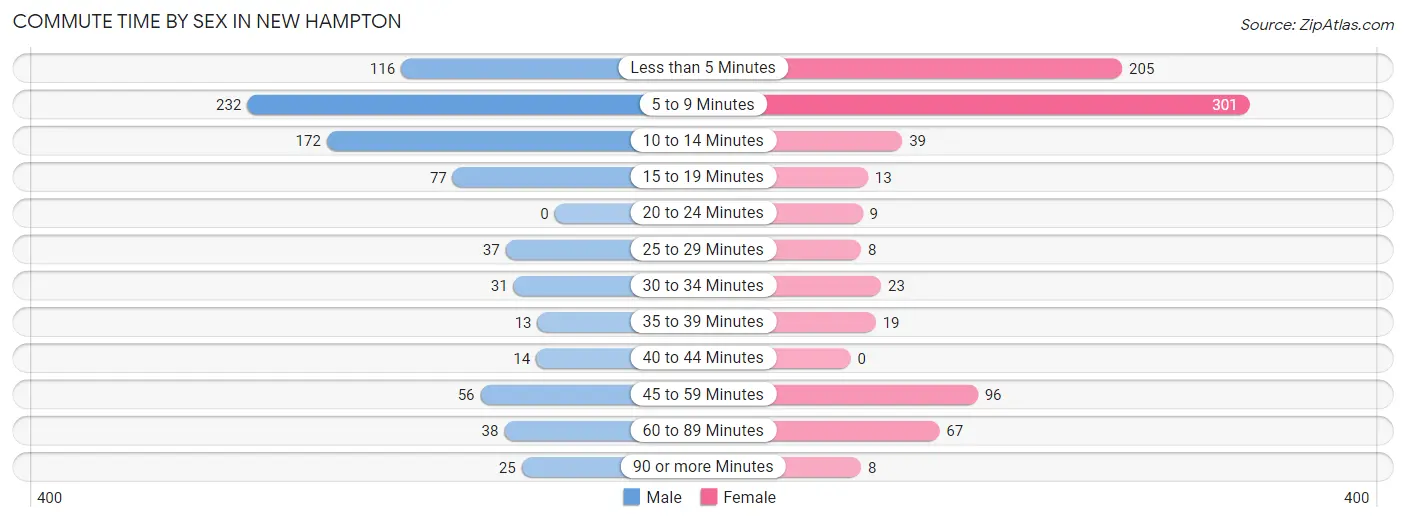
| Commute Time | Male | Female |
| Less than 5 Minutes | 116 (14.3%) | 205 (26.0%) |
| 5 to 9 Minutes | 232 (28.6%) | 301 (38.2%) |
| 10 to 14 Minutes | 172 (21.2%) | 39 (5.0%) |
| 15 to 19 Minutes | 77 (9.5%) | 13 (1.7%) |
| 20 to 24 Minutes | 0 (0.0%) | 9 (1.1%) |
| 25 to 29 Minutes | 37 (4.6%) | 8 (1.0%) |
| 30 to 34 Minutes | 31 (3.8%) | 23 (2.9%) |
| 35 to 39 Minutes | 13 (1.6%) | 19 (2.4%) |
| 40 to 44 Minutes | 14 (1.7%) | 0 (0.0%) |
| 45 to 59 Minutes | 56 (6.9%) | 96 (12.2%) |
| 60 to 89 Minutes | 38 (4.7%) | 67 (8.5%) |
| 90 or more Minutes | 25 (3.1%) | 8 (1.0%) |
Time of Departure to Work by Sex in New Hampton
The most frequent times of departure to work in New Hampton are 12:00 PM to 3:59 PM (158, 19.5%) for males and 4:00 PM to 11:59 PM (129, 16.4%) for females.
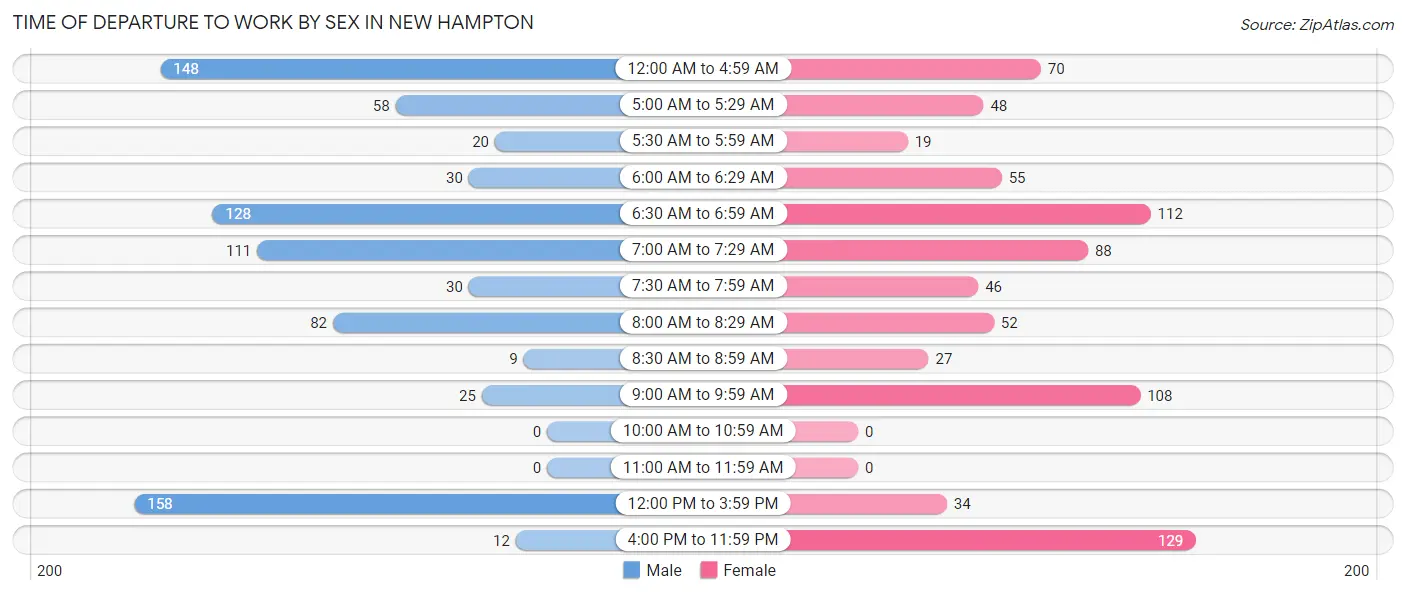
| Time of Departure | Male | Female |
| 12:00 AM to 4:59 AM | 148 (18.2%) | 70 (8.9%) |
| 5:00 AM to 5:29 AM | 58 (7.1%) | 48 (6.1%) |
| 5:30 AM to 5:59 AM | 20 (2.5%) | 19 (2.4%) |
| 6:00 AM to 6:29 AM | 30 (3.7%) | 55 (7.0%) |
| 6:30 AM to 6:59 AM | 128 (15.8%) | 112 (14.2%) |
| 7:00 AM to 7:29 AM | 111 (13.7%) | 88 (11.2%) |
| 7:30 AM to 7:59 AM | 30 (3.7%) | 46 (5.8%) |
| 8:00 AM to 8:29 AM | 82 (10.1%) | 52 (6.6%) |
| 8:30 AM to 8:59 AM | 9 (1.1%) | 27 (3.4%) |
| 9:00 AM to 9:59 AM | 25 (3.1%) | 108 (13.7%) |
| 10:00 AM to 10:59 AM | 0 (0.0%) | 0 (0.0%) |
| 11:00 AM to 11:59 AM | 0 (0.0%) | 0 (0.0%) |
| 12:00 PM to 3:59 PM | 158 (19.5%) | 34 (4.3%) |
| 4:00 PM to 11:59 PM | 12 (1.5%) | 129 (16.4%) |
| Total | 811 (100.0%) | 788 (100.0%) |
Housing Occupancy in New Hampton
Occupancy by Ownership in New Hampton
Of the total 1,491 dwellings in New Hampton, owner-occupied units account for 1,140 (76.5%), while renter-occupied units make up 351 (23.5%).
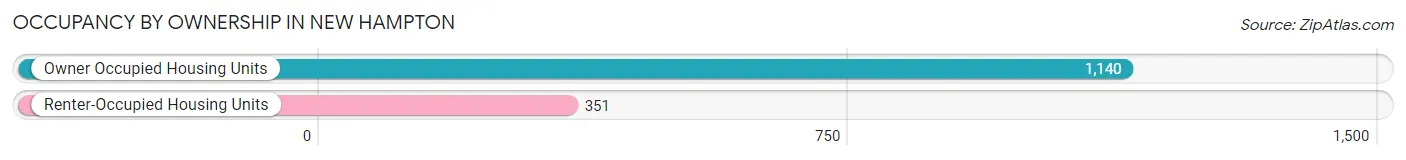
| Occupancy | # Housing Units | % Housing Units |
| Owner Occupied Housing Units | 1,140 | 76.5% |
| Renter-Occupied Housing Units | 351 | 23.5% |
| Total Occupied Housing Units | 1,491 | 100.0% |
Occupancy by Household Size in New Hampton
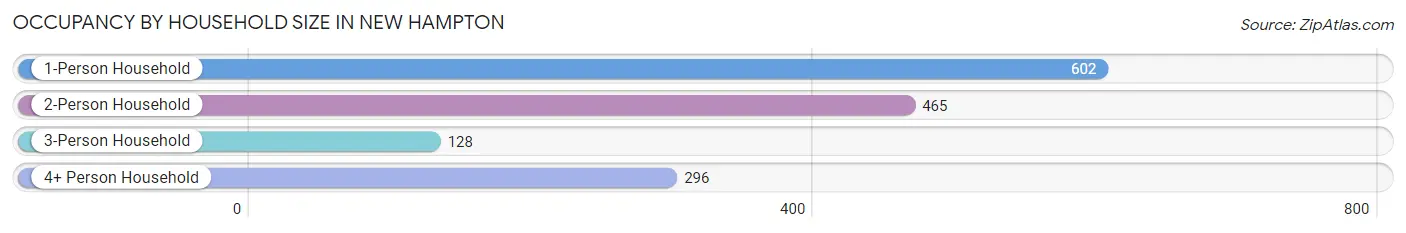
| Household Size | # Housing Units | % Housing Units |
| 1-Person Household | 602 | 40.4% |
| 2-Person Household | 465 | 31.2% |
| 3-Person Household | 128 | 8.6% |
| 4+ Person Household | 296 | 19.9% |
| Total Housing Units | 1,491 | 100.0% |
Occupancy by Ownership by Household Size in New Hampton
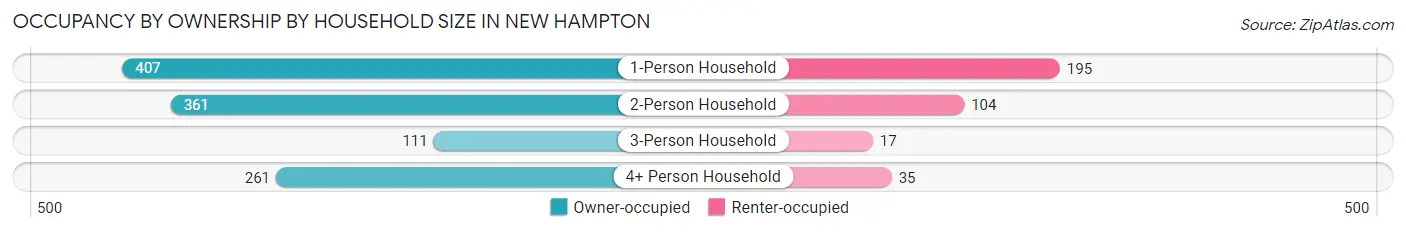
| Household Size | Owner-occupied | Renter-occupied |
| 1-Person Household | 407 (67.6%) | 195 (32.4%) |
| 2-Person Household | 361 (77.6%) | 104 (22.4%) |
| 3-Person Household | 111 (86.7%) | 17 (13.3%) |
| 4+ Person Household | 261 (88.2%) | 35 (11.8%) |
| Total Housing Units | 1,140 (76.5%) | 351 (23.5%) |
Occupancy by Educational Attainment in New Hampton
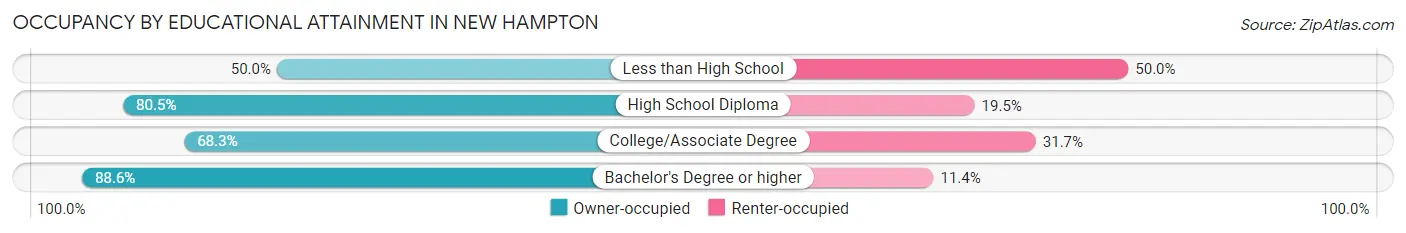
| Household Size | Owner-occupied | Renter-occupied |
| Less than High School | 24 (50.0%) | 24 (50.0%) |
| High School Diploma | 412 (80.5%) | 100 (19.5%) |
| College/Associate Degree | 408 (68.3%) | 189 (31.7%) |
| Bachelor's Degree or higher | 296 (88.6%) | 38 (11.4%) |
Occupancy by Age of Householder in New Hampton
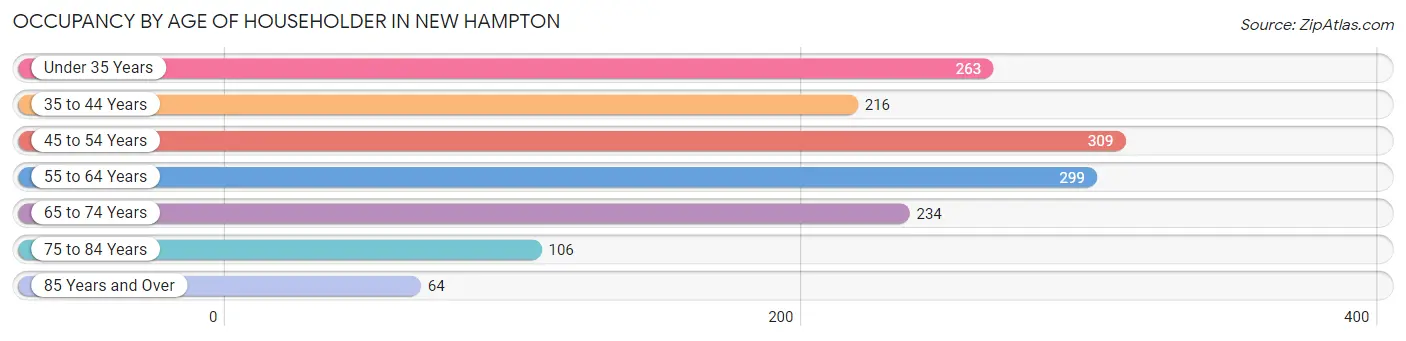
| Age Bracket | # Households | % Households |
| Under 35 Years | 263 | 17.6% |
| 35 to 44 Years | 216 | 14.5% |
| 45 to 54 Years | 309 | 20.7% |
| 55 to 64 Years | 299 | 20.1% |
| 65 to 74 Years | 234 | 15.7% |
| 75 to 84 Years | 106 | 7.1% |
| 85 Years and Over | 64 | 4.3% |
| Total | 1,491 | 100.0% |
Housing Finances in New Hampton
Median Income by Occupancy in New Hampton
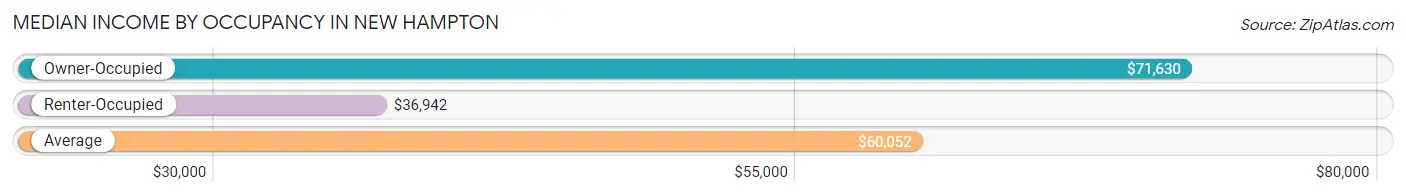
| Occupancy Type | # Households | Median Income |
| Owner-Occupied | 1,140 (76.5%) | $71,630 |
| Renter-Occupied | 351 (23.5%) | $36,942 |
| Average | 1,491 (100.0%) | $60,052 |
Occupancy by Householder Income Bracket in New Hampton
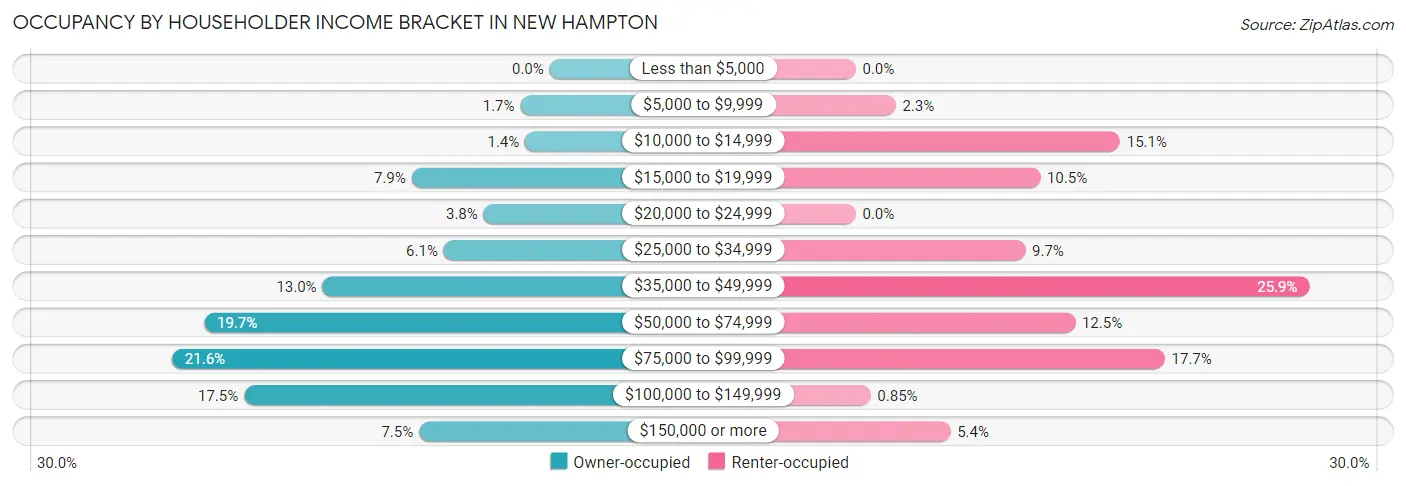
| Income Bracket | Owner-occupied | Renter-occupied |
| Less than $5,000 | 0 (0.0%) | 0 (0.0%) |
| $5,000 to $9,999 | 19 (1.7%) | 8 (2.3%) |
| $10,000 to $14,999 | 16 (1.4%) | 53 (15.1%) |
| $15,000 to $19,999 | 90 (7.9%) | 37 (10.5%) |
| $20,000 to $24,999 | 43 (3.8%) | 0 (0.0%) |
| $25,000 to $34,999 | 69 (6.0%) | 34 (9.7%) |
| $35,000 to $49,999 | 148 (13.0%) | 91 (25.9%) |
| $50,000 to $74,999 | 225 (19.7%) | 44 (12.5%) |
| $75,000 to $99,999 | 246 (21.6%) | 62 (17.7%) |
| $100,000 to $149,999 | 199 (17.5%) | 3 (0.9%) |
| $150,000 or more | 85 (7.5%) | 19 (5.4%) |
| Total | 1,140 (100.0%) | 351 (100.0%) |
Monthly Housing Cost Tiers in New Hampton
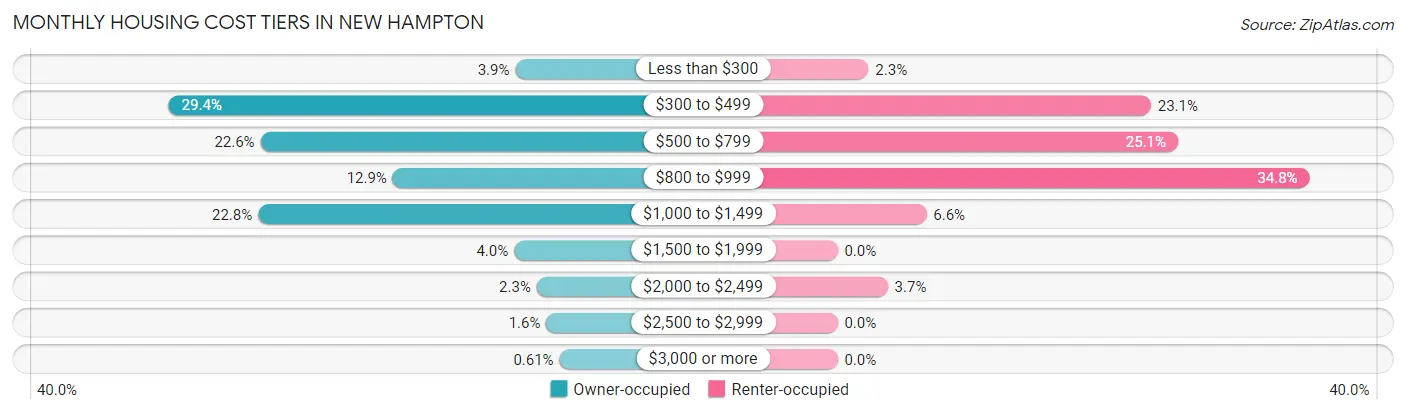
| Monthly Cost | Owner-occupied | Renter-occupied |
| Less than $300 | 44 (3.9%) | 8 (2.3%) |
| $300 to $499 | 335 (29.4%) | 81 (23.1%) |
| $500 to $799 | 258 (22.6%) | 88 (25.1%) |
| $800 to $999 | 147 (12.9%) | 122 (34.8%) |
| $1,000 to $1,499 | 260 (22.8%) | 23 (6.6%) |
| $1,500 to $1,999 | 45 (4.0%) | 0 (0.0%) |
| $2,000 to $2,499 | 26 (2.3%) | 13 (3.7%) |
| $2,500 to $2,999 | 18 (1.6%) | 0 (0.0%) |
| $3,000 or more | 7 (0.6%) | 0 (0.0%) |
| Total | 1,140 (100.0%) | 351 (100.0%) |
Physical Housing Characteristics in New Hampton
Housing Structures in New Hampton
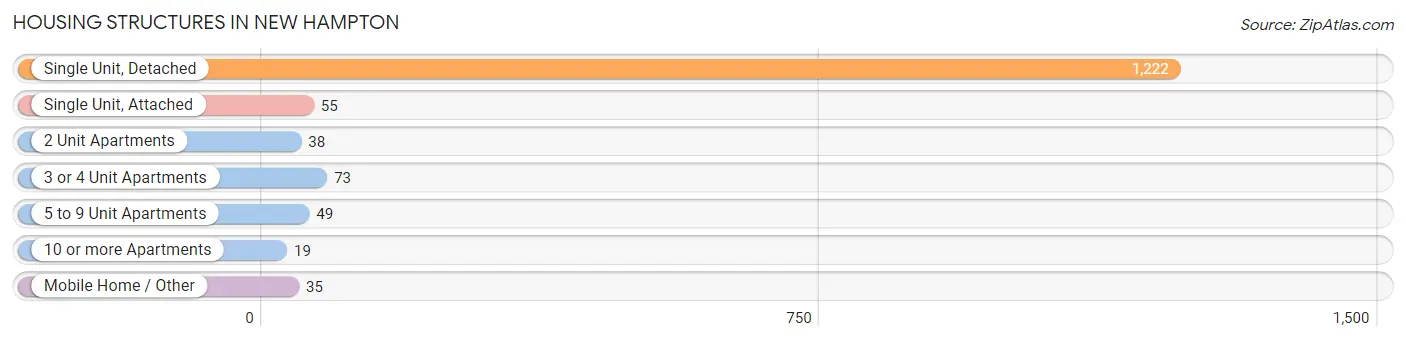
| Structure Type | # Housing Units | % Housing Units |
| Single Unit, Detached | 1,222 | 82.0% |
| Single Unit, Attached | 55 | 3.7% |
| 2 Unit Apartments | 38 | 2.5% |
| 3 or 4 Unit Apartments | 73 | 4.9% |
| 5 to 9 Unit Apartments | 49 | 3.3% |
| 10 or more Apartments | 19 | 1.3% |
| Mobile Home / Other | 35 | 2.4% |
| Total | 1,491 | 100.0% |
Housing Structures by Occupancy in New Hampton
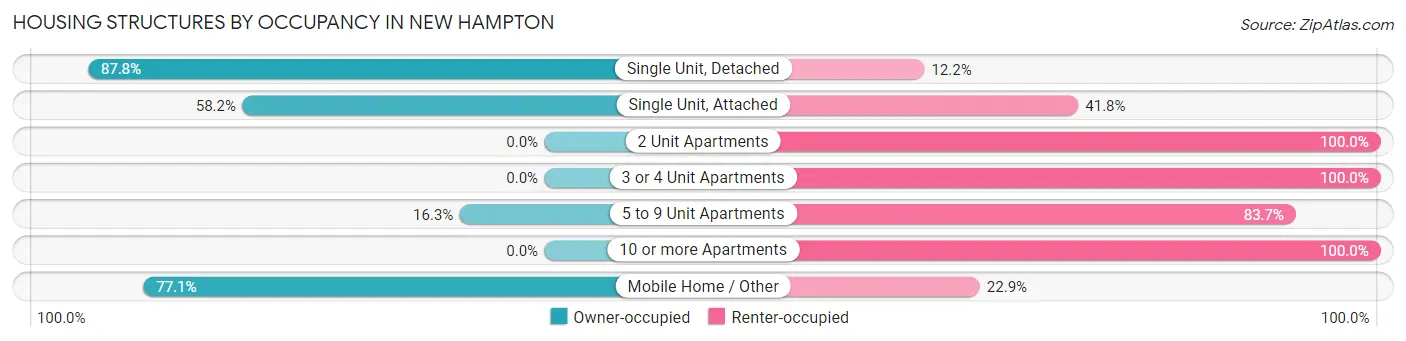
| Structure Type | Owner-occupied | Renter-occupied |
| Single Unit, Detached | 1,073 (87.8%) | 149 (12.2%) |
| Single Unit, Attached | 32 (58.2%) | 23 (41.8%) |
| 2 Unit Apartments | 0 (0.0%) | 38 (100.0%) |
| 3 or 4 Unit Apartments | 0 (0.0%) | 73 (100.0%) |
| 5 to 9 Unit Apartments | 8 (16.3%) | 41 (83.7%) |
| 10 or more Apartments | 0 (0.0%) | 19 (100.0%) |
| Mobile Home / Other | 27 (77.1%) | 8 (22.9%) |
| Total | 1,140 (76.5%) | 351 (23.5%) |
Housing Structures by Number of Rooms in New Hampton
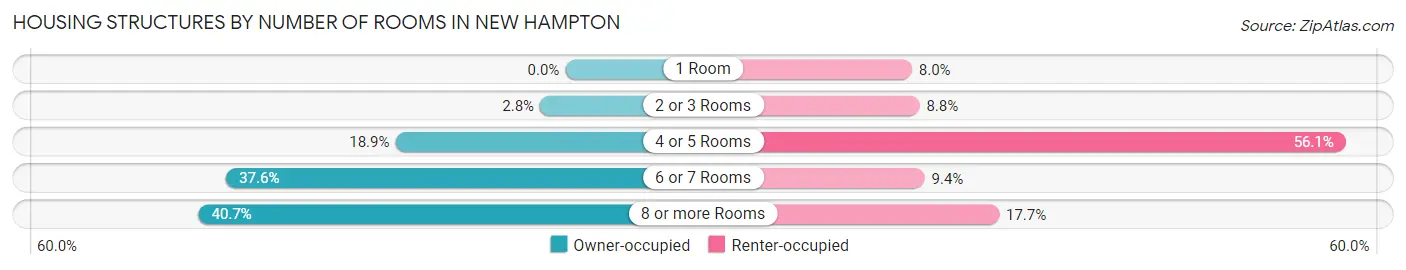
| Number of Rooms | Owner-occupied | Renter-occupied |
| 1 Room | 0 (0.0%) | 28 (8.0%) |
| 2 or 3 Rooms | 32 (2.8%) | 31 (8.8%) |
| 4 or 5 Rooms | 215 (18.9%) | 197 (56.1%) |
| 6 or 7 Rooms | 429 (37.6%) | 33 (9.4%) |
| 8 or more Rooms | 464 (40.7%) | 62 (17.7%) |
| Total | 1,140 (100.0%) | 351 (100.0%) |
Housing Structure by Heating Type in New Hampton
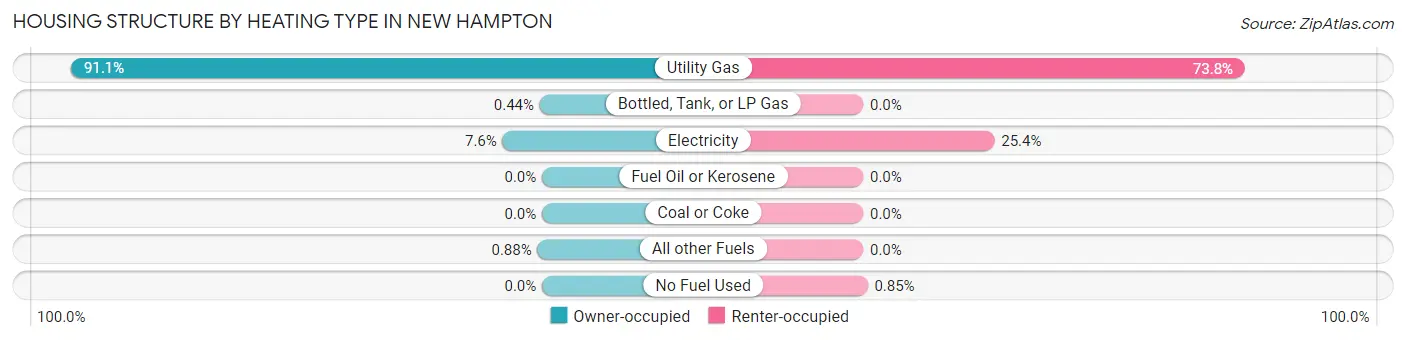
| Heating Type | Owner-occupied | Renter-occupied |
| Utility Gas | 1,038 (91.0%) | 259 (73.8%) |
| Bottled, Tank, or LP Gas | 5 (0.4%) | 0 (0.0%) |
| Electricity | 87 (7.6%) | 89 (25.4%) |
| Fuel Oil or Kerosene | 0 (0.0%) | 0 (0.0%) |
| Coal or Coke | 0 (0.0%) | 0 (0.0%) |
| All other Fuels | 10 (0.9%) | 0 (0.0%) |
| No Fuel Used | 0 (0.0%) | 3 (0.9%) |
| Total | 1,140 (100.0%) | 351 (100.0%) |
Household Vehicle Usage in New Hampton
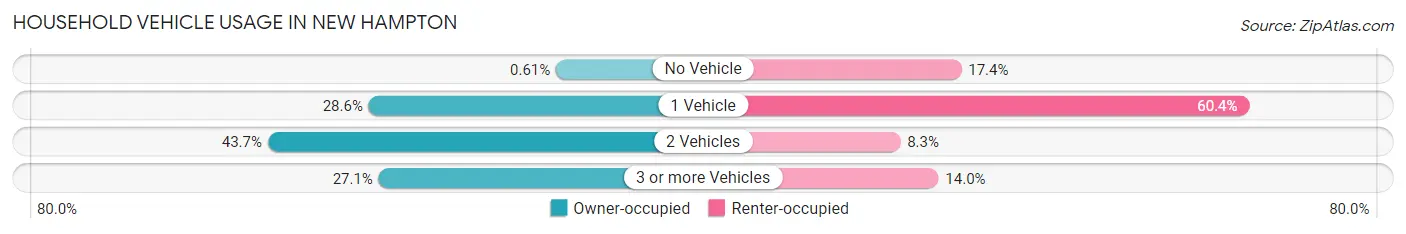
| Vehicles per Household | Owner-occupied | Renter-occupied |
| No Vehicle | 7 (0.6%) | 61 (17.4%) |
| 1 Vehicle | 326 (28.6%) | 212 (60.4%) |
| 2 Vehicles | 498 (43.7%) | 29 (8.3%) |
| 3 or more Vehicles | 309 (27.1%) | 49 (14.0%) |
| Total | 1,140 (100.0%) | 351 (100.0%) |
Real Estate & Mortgages in New Hampton
Real Estate and Mortgage Overview in New Hampton
| Characteristic | Without Mortgage | With Mortgage |
| Housing Units | 569 | 571 |
| Median Property Value | $158,500 | $140,000 |
| Median Household Income | $61,094 | $52 |
| Monthly Housing Costs | $451 | $7 |
| Real Estate Taxes | $2,233 | $0 |
Property Value by Mortgage Status in New Hampton
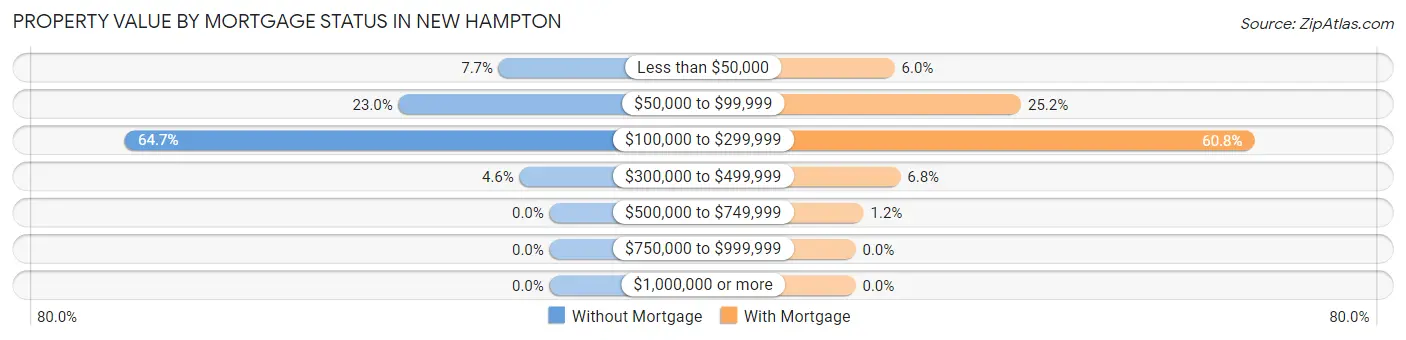
| Property Value | Without Mortgage | With Mortgage |
| Less than $50,000 | 44 (7.7%) | 34 (5.9%) |
| $50,000 to $99,999 | 131 (23.0%) | 144 (25.2%) |
| $100,000 to $299,999 | 368 (64.7%) | 347 (60.8%) |
| $300,000 to $499,999 | 26 (4.6%) | 39 (6.8%) |
| $500,000 to $749,999 | 0 (0.0%) | 7 (1.2%) |
| $750,000 to $999,999 | 0 (0.0%) | 0 (0.0%) |
| $1,000,000 or more | 0 (0.0%) | 0 (0.0%) |
| Total | 569 (100.0%) | 571 (100.0%) |
Household Income by Mortgage Status in New Hampton
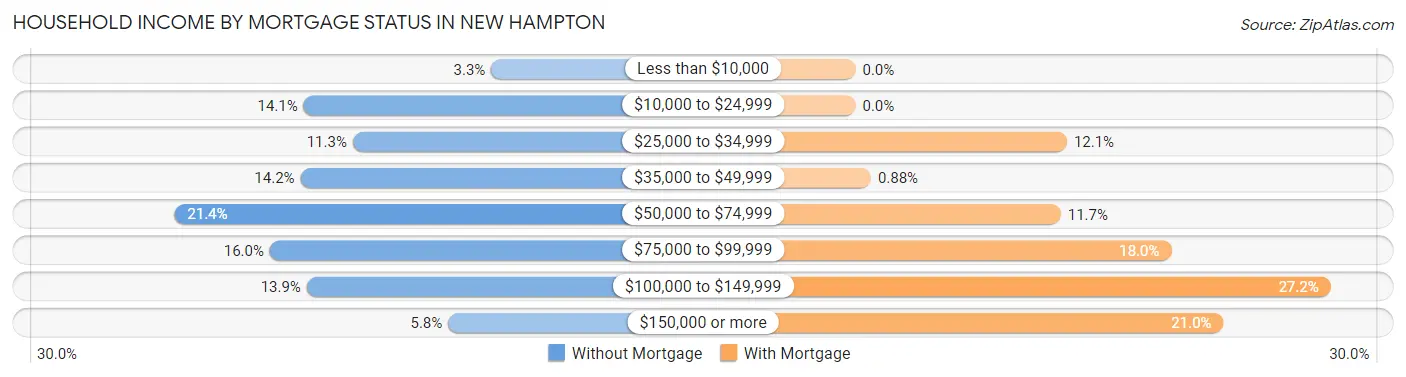
| Household Income | Without Mortgage | With Mortgage |
| Less than $10,000 | 19 (3.3%) | 0 (0.0%) |
| $10,000 to $24,999 | 80 (14.1%) | 0 (0.0%) |
| $25,000 to $34,999 | 64 (11.3%) | 69 (12.1%) |
| $35,000 to $49,999 | 81 (14.2%) | 5 (0.9%) |
| $50,000 to $74,999 | 122 (21.4%) | 67 (11.7%) |
| $75,000 to $99,999 | 91 (16.0%) | 103 (18.0%) |
| $100,000 to $149,999 | 79 (13.9%) | 155 (27.2%) |
| $150,000 or more | 33 (5.8%) | 120 (21.0%) |
| Total | 569 (100.0%) | 571 (100.0%) |
Property Value to Household Income Ratio in New Hampton
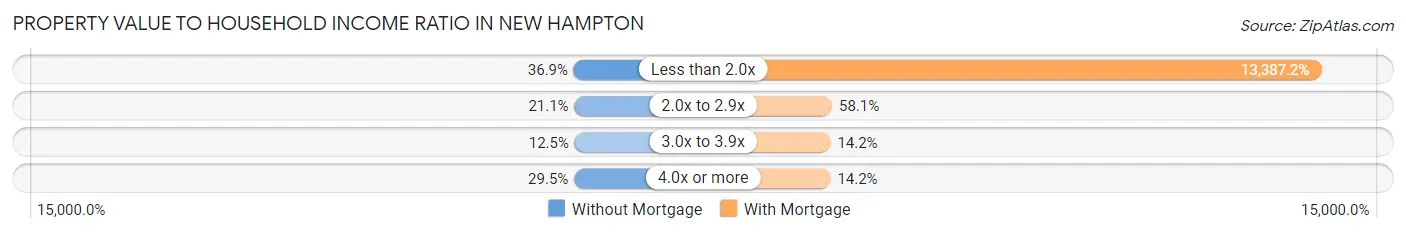
| Value-to-Income Ratio | Without Mortgage | With Mortgage |
| Less than 2.0x | 210 (36.9%) | 76,441 (13,387.2%) |
| 2.0x to 2.9x | 120 (21.1%) | 332 (58.1%) |
| 3.0x to 3.9x | 71 (12.5%) | 81 (14.2%) |
| 4.0x or more | 168 (29.5%) | 81 (14.2%) |
| Total | 569 (100.0%) | 571 (100.0%) |
Real Estate Taxes by Mortgage Status in New Hampton
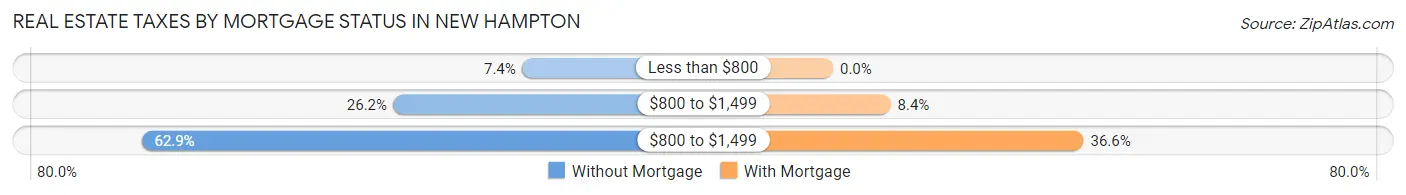
| Property Taxes | Without Mortgage | With Mortgage |
| Less than $800 | 42 (7.4%) | 0 (0.0%) |
| $800 to $1,499 | 149 (26.2%) | 48 (8.4%) |
| $800 to $1,499 | 358 (62.9%) | 209 (36.6%) |
| Total | 569 (100.0%) | 571 (100.0%) |
Health & Disability in New Hampton
Health Insurance Coverage by Age in New Hampton
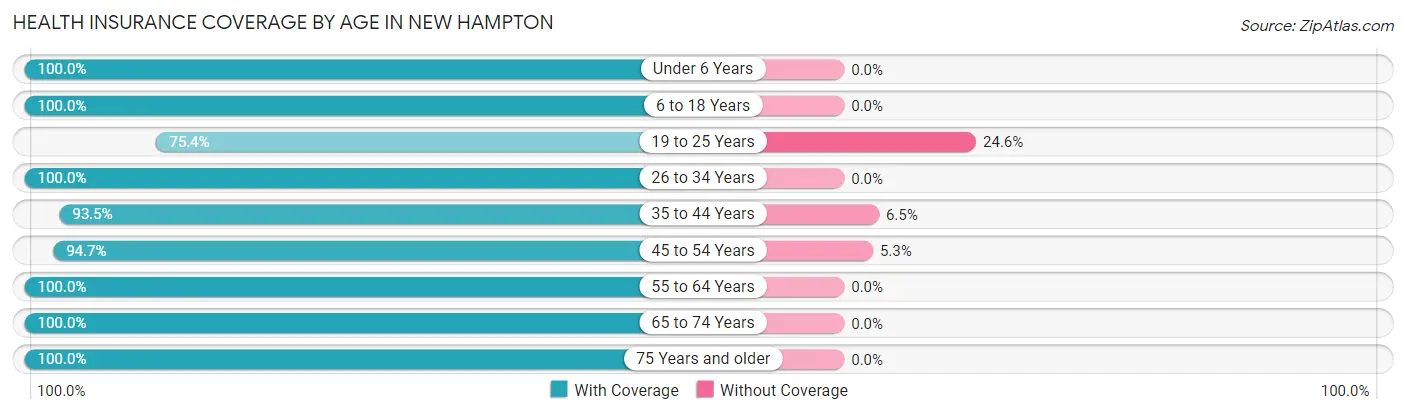
| Age Bracket | With Coverage | Without Coverage |
| Under 6 Years | 371 (100.0%) | 0 (0.0%) |
| 6 to 18 Years | 565 (100.0%) | 0 (0.0%) |
| 19 to 25 Years | 181 (75.4%) | 59 (24.6%) |
| 26 to 34 Years | 299 (100.0%) | 0 (0.0%) |
| 35 to 44 Years | 289 (93.5%) | 20 (6.5%) |
| 45 to 54 Years | 408 (94.7%) | 23 (5.3%) |
| 55 to 64 Years | 518 (100.0%) | 0 (0.0%) |
| 65 to 74 Years | 426 (100.0%) | 0 (0.0%) |
| 75 Years and older | 201 (100.0%) | 0 (0.0%) |
| Total | 3,258 (97.0%) | 102 (3.0%) |
Health Insurance Coverage by Citizenship Status in New Hampton
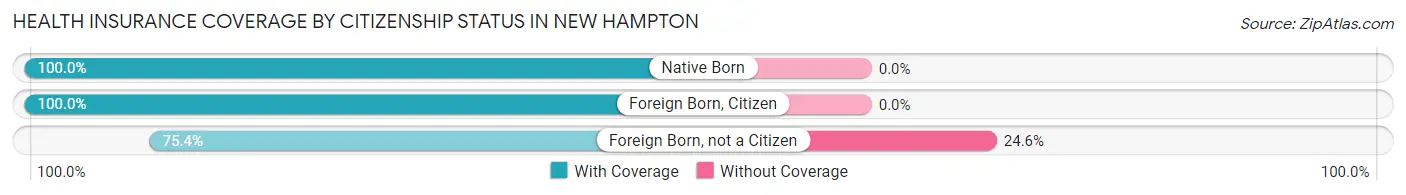
| Citizenship Status | With Coverage | Without Coverage |
| Native Born | 371 (100.0%) | 0 (0.0%) |
| Foreign Born, Citizen | 565 (100.0%) | 0 (0.0%) |
| Foreign Born, not a Citizen | 181 (75.4%) | 59 (24.6%) |
Health Insurance Coverage by Household Income in New Hampton
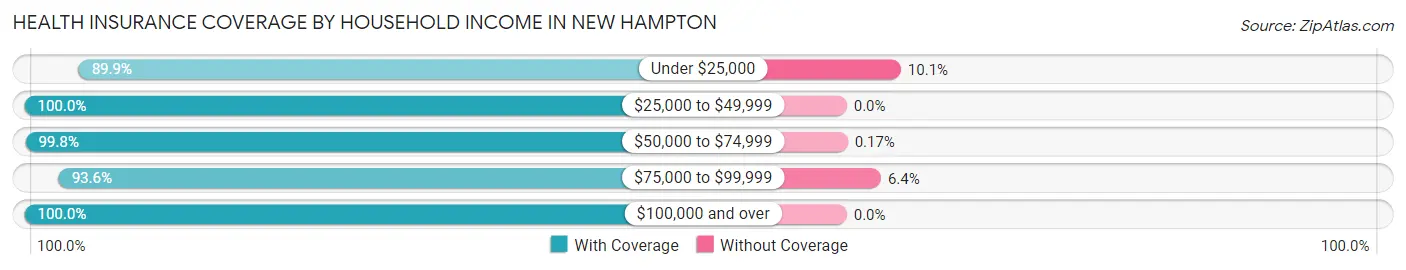
| Household Income | With Coverage | Without Coverage |
| Under $25,000 | 390 (89.9%) | 44 (10.1%) |
| $25,000 to $49,999 | 550 (100.0%) | 0 (0.0%) |
| $50,000 to $74,999 | 578 (99.8%) | 1 (0.2%) |
| $75,000 to $99,999 | 833 (93.6%) | 57 (6.4%) |
| $100,000 and over | 876 (100.0%) | 0 (0.0%) |
Public vs Private Health Insurance Coverage by Age in New Hampton
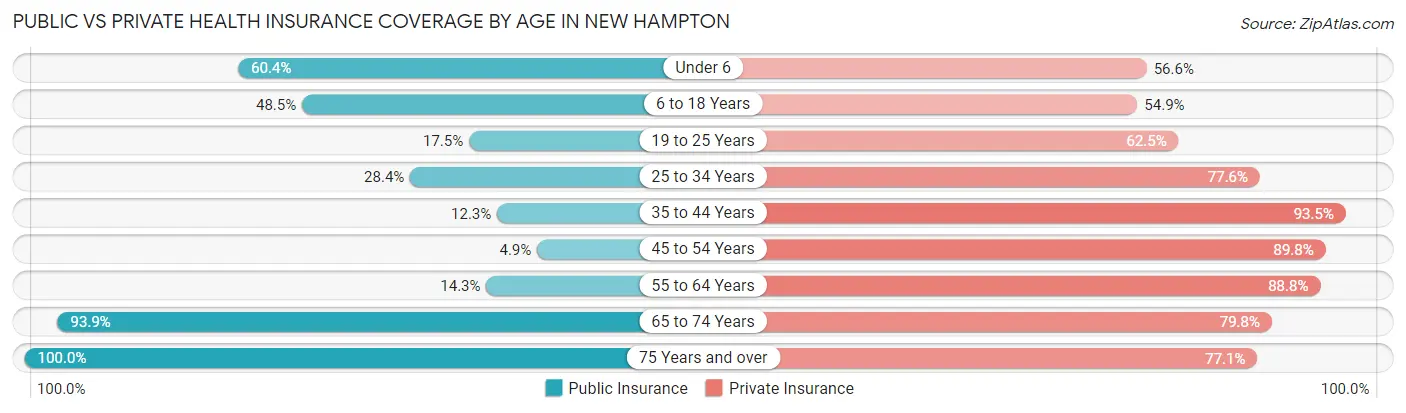
| Age Bracket | Public Insurance | Private Insurance |
| Under 6 | 224 (60.4%) | 210 (56.6%) |
| 6 to 18 Years | 274 (48.5%) | 310 (54.9%) |
| 19 to 25 Years | 42 (17.5%) | 150 (62.5%) |
| 25 to 34 Years | 85 (28.4%) | 232 (77.6%) |
| 35 to 44 Years | 38 (12.3%) | 289 (93.5%) |
| 45 to 54 Years | 21 (4.9%) | 387 (89.8%) |
| 55 to 64 Years | 74 (14.3%) | 460 (88.8%) |
| 65 to 74 Years | 400 (93.9%) | 340 (79.8%) |
| 75 Years and over | 201 (100.0%) | 155 (77.1%) |
| Total | 1,359 (40.5%) | 2,533 (75.4%) |
Disability Status by Sex by Age in New Hampton
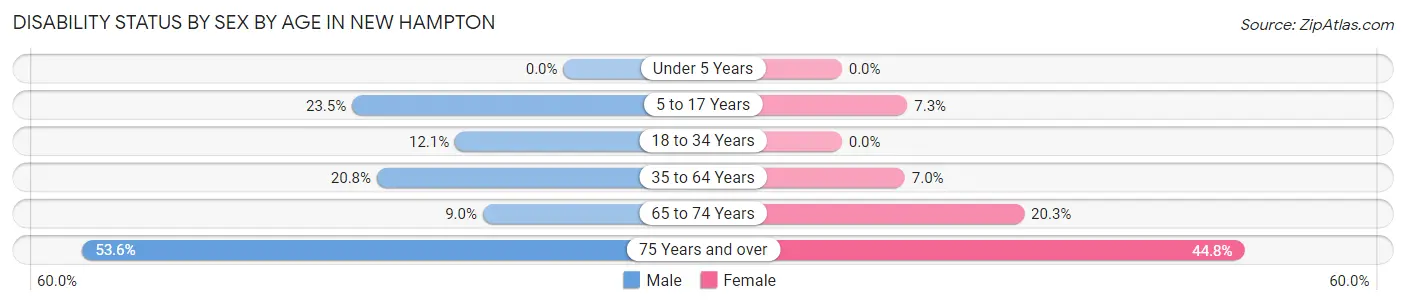
| Age Bracket | Male | Female |
| Under 5 Years | 0 (0.0%) | 0 (0.0%) |
| 5 to 17 Years | 52 (23.5%) | 23 (7.3%) |
| 18 to 34 Years | 38 (12.1%) | 0 (0.0%) |
| 35 to 64 Years | 140 (20.8%) | 41 (7.0%) |
| 65 to 74 Years | 21 (9.0%) | 39 (20.3%) |
| 75 Years and over | 30 (53.6%) | 65 (44.8%) |
Disability Class by Sex by Age in New Hampton
Disability Class: Hearing Difficulty
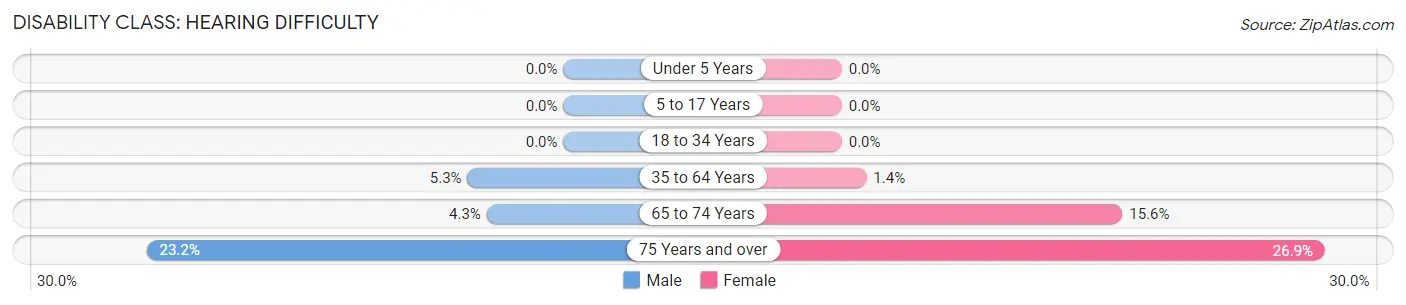
| Age Bracket | Male | Female |
| Under 5 Years | 0 (0.0%) | 0 (0.0%) |
| 5 to 17 Years | 0 (0.0%) | 0 (0.0%) |
| 18 to 34 Years | 0 (0.0%) | 0 (0.0%) |
| 35 to 64 Years | 36 (5.3%) | 8 (1.4%) |
| 65 to 74 Years | 10 (4.3%) | 30 (15.6%) |
| 75 Years and over | 13 (23.2%) | 39 (26.9%) |
Disability Class: Vision Difficulty
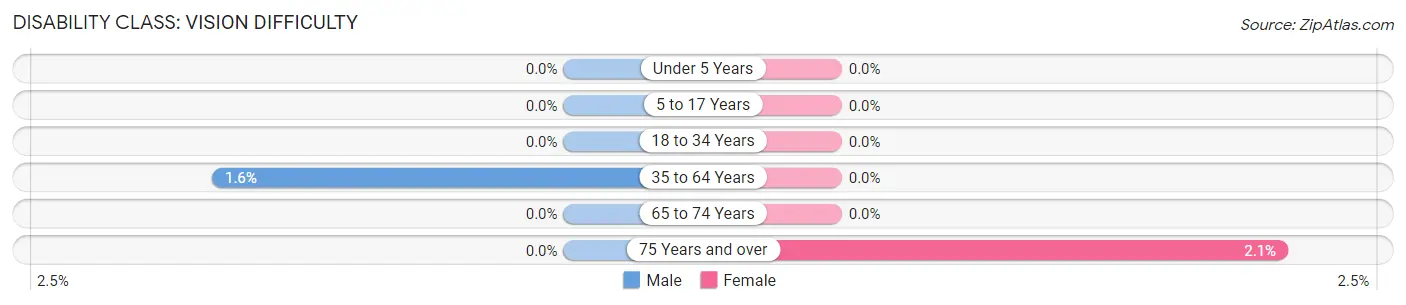
| Age Bracket | Male | Female |
| Under 5 Years | 0 (0.0%) | 0 (0.0%) |
| 5 to 17 Years | 0 (0.0%) | 0 (0.0%) |
| 18 to 34 Years | 0 (0.0%) | 0 (0.0%) |
| 35 to 64 Years | 11 (1.6%) | 0 (0.0%) |
| 65 to 74 Years | 0 (0.0%) | 0 (0.0%) |
| 75 Years and over | 0 (0.0%) | 3 (2.1%) |
Disability Class: Cognitive Difficulty
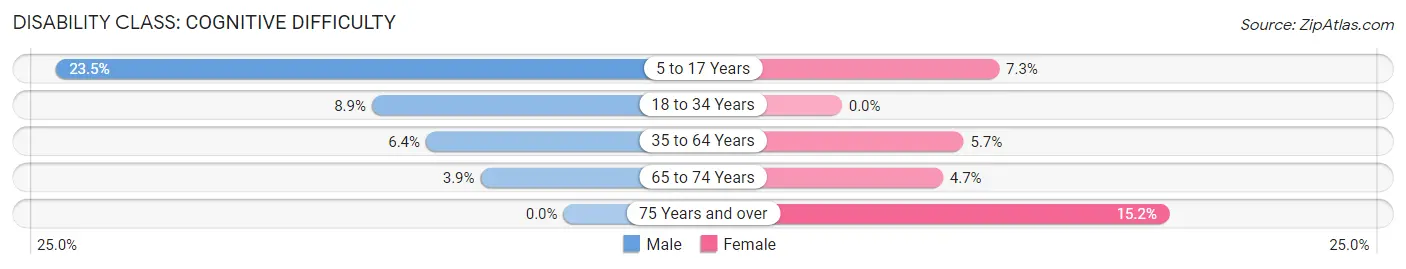
| Age Bracket | Male | Female |
| 5 to 17 Years | 52 (23.5%) | 23 (7.3%) |
| 18 to 34 Years | 28 (8.9%) | 0 (0.0%) |
| 35 to 64 Years | 43 (6.4%) | 33 (5.7%) |
| 65 to 74 Years | 9 (3.8%) | 9 (4.7%) |
| 75 Years and over | 0 (0.0%) | 22 (15.2%) |
Disability Class: Ambulatory Difficulty
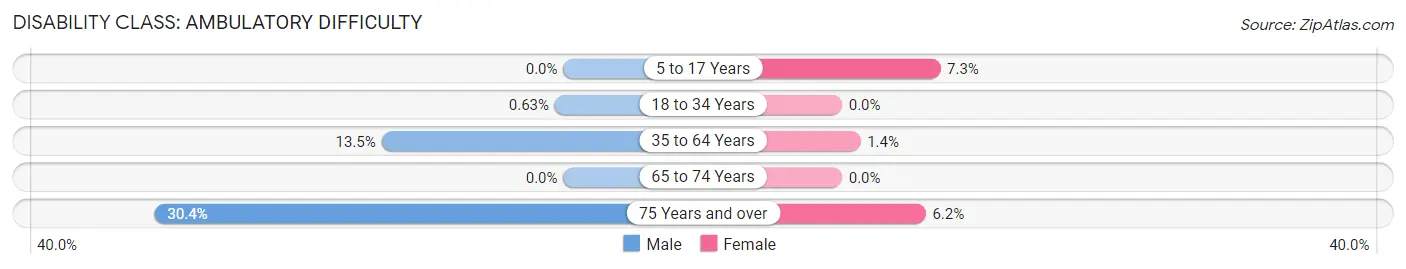
| Age Bracket | Male | Female |
| 5 to 17 Years | 0 (0.0%) | 23 (7.3%) |
| 18 to 34 Years | 2 (0.6%) | 0 (0.0%) |
| 35 to 64 Years | 91 (13.5%) | 8 (1.4%) |
| 65 to 74 Years | 0 (0.0%) | 0 (0.0%) |
| 75 Years and over | 17 (30.4%) | 9 (6.2%) |
Disability Class: Self-Care Difficulty

| Age Bracket | Male | Female |
| 5 to 17 Years | 0 (0.0%) | 23 (7.3%) |
| 18 to 34 Years | 0 (0.0%) | 0 (0.0%) |
| 35 to 64 Years | 20 (3.0%) | 8 (1.4%) |
| 65 to 74 Years | 0 (0.0%) | 0 (0.0%) |
| 75 Years and over | 0 (0.0%) | 8 (5.5%) |
Technology Access in New Hampton
Computing Device Access in New Hampton
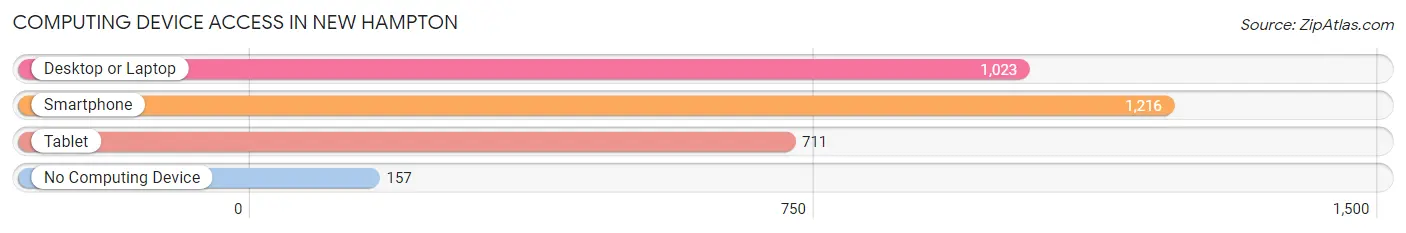
| Device Type | # Households | % Households |
| Desktop or Laptop | 1,023 | 68.6% |
| Smartphone | 1,216 | 81.6% |
| Tablet | 711 | 47.7% |
| No Computing Device | 157 | 10.5% |
| Total | 1,491 | 100.0% |
Internet Access in New Hampton
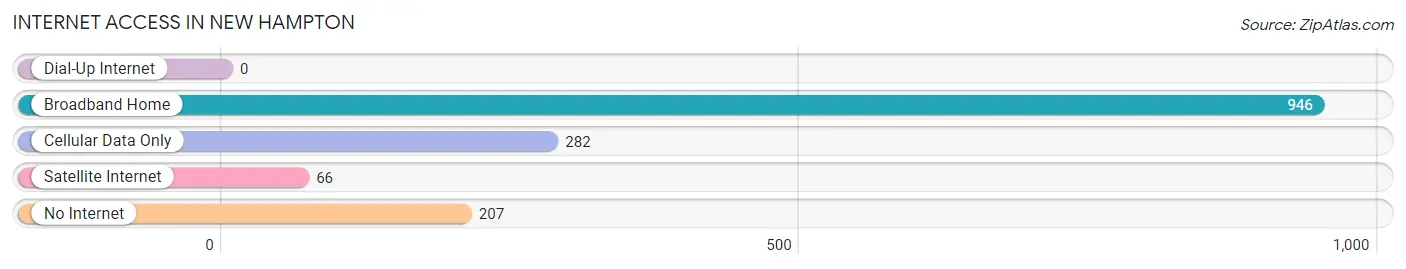
| Internet Type | # Households | % Households |
| Dial-Up Internet | 0 | 0.0% |
| Broadband Home | 946 | 63.4% |
| Cellular Data Only | 282 | 18.9% |
| Satellite Internet | 66 | 4.4% |
| No Internet | 207 | 13.9% |
| Total | 1,491 | 100.0% |
New Hampton Summary
Hampton, Iowa is a small city located in Chickasaw County, Iowa. It is situated on the banks of the Cedar River and is home to a population of approximately 2,500 people. The city was founded in 1854 and has a rich history of industry, agriculture, and education.
Geography
Hampton is located in the northeast corner of Iowa, approximately 50 miles from the state capital of Des Moines. It is situated on the banks of the Cedar River, which is a tributary of the Mississippi River. The city is surrounded by rolling hills and farmland, and is home to a variety of wildlife. The climate in Hampton is generally mild, with temperatures ranging from the low 30s in the winter to the mid-80s in the summer.
Economy
Hampton’s economy is largely based on agriculture and manufacturing. The city is home to several large agricultural companies, including Cargill, Tyson Foods, and Land O’Lakes. These companies provide employment for many of the city’s residents. In addition, Hampton is home to several manufacturing companies, including John Deere, Case IH, and New Holland. These companies provide a variety of products, including tractors, combines, and other agricultural equipment.
Demographics
As of the 2010 census, the population of Hampton was 2,521. The racial makeup of the city was 97.2% White, 0.7% African American, 0.3% Native American, 0.3% Asian, 0.2% from other races, and 1.5% from two or more races. Hispanic or Latino of any race were 1.2% of the population.
The median income for a household in Hampton was $45,938, and the median income for a family was $54,844. The per capita income for the city was $20,945. About 8.2% of families and 10.2% of the population were below the poverty line, including 14.2% of those under age 18 and 8.2% of those age 65 or over.
Education
Hampton is served by the Hampton-Dumont Community School District, which consists of two elementary schools, one middle school, and one high school. The district also operates a preschool and an alternative learning center. The city is also home to a branch of the North Iowa Area Community College, which offers a variety of courses and programs.
Conclusion
Hampton, Iowa is a small city located in Chickasaw County, Iowa. It is situated on the banks of the Cedar River and is home to a population of approximately 2,500 people. The city was founded in 1854 and has a rich history of industry, agriculture, and education. The economy of Hampton is largely based on agriculture and manufacturing, and the city is served by the Hampton-Dumont Community School District. Hampton is a great place to live, work, and raise a family.
Common Questions
What is Per Capita Income in New Hampton?
Per Capita income in New Hampton is $31,940.
What is the Median Family Income in New Hampton?
Median Family Income in New Hampton is $76,667.
What is the Median Household income in New Hampton?
Median Household Income in New Hampton is $60,052.
What is Income or Wage Gap in New Hampton?
Income or Wage Gap in New Hampton is 27.9%.
Women in New Hampton earn 72.1 cents for every dollar earned by a man.
What is Inequality or Gini Index in New Hampton?
Inequality or Gini Index in New Hampton is 0.38.
What is the Total Population of New Hampton?
Total Population of New Hampton is 3,473.
What is the Total Male Population of New Hampton?
Total Male Population of New Hampton is 1,669.
What is the Total Female Population of New Hampton?
Total Female Population of New Hampton is 1,804.
What is the Ratio of Males per 100 Females in New Hampton?
There are 92.52 Males per 100 Females in New Hampton.
What is the Ratio of Females per 100 Males in New Hampton?
There are 108.09 Females per 100 Males in New Hampton.
What is the Median Population Age in New Hampton?
Median Population Age in New Hampton is 44.3 Years.
What is the Average Family Size in New Hampton
Average Family Size in New Hampton is 3.0 People.
What is the Average Household Size in New Hampton
Average Household Size in New Hampton is 2.2 People.
How Large is the Labor Force in New Hampton?
There are 1,824 People in the Labor Forcein in New Hampton.
What is the Percentage of People in the Labor Force in New Hampton?
67.4% of People are in the Labor Force in New Hampton.
What is the Unemployment Rate in New Hampton?
Unemployment Rate in New Hampton is 3.6%.