Mystic, IA Map & Demographics
Mystic Map
Mystic Overview
$20,811
PER CAPITA INCOME
$58,438
AVG FAMILY INCOME
$46,250
AVG HOUSEHOLD INCOME
1.0%
WAGE / INCOME GAP [ % ]
99.0¢/ $1
WAGE / INCOME GAP [ $ ]
0.31
INEQUALITY / GINI INDEX
335
TOTAL POPULATION
185
MALE POPULATION
150
FEMALE POPULATION
123.33
MALES / 100 FEMALES
81.08
FEMALES / 100 MALES
37.1
MEDIAN AGE
3.6
AVG FAMILY SIZE
2.6
AVG HOUSEHOLD SIZE
147
LABOR FORCE [ PEOPLE ]
62.3%
PERCENT IN LABOR FORCE
6.8%
UNEMPLOYMENT RATE
Mystic Zip Codes
Mystic Area Codes
Income in Mystic
Income Overview in Mystic
Per Capita Income in Mystic is $20,811, while median incomes of families and households are $58,438 and $46,250 respectively.
| Characteristic | Number | Measure |
| Per Capita Income | 335 | $20,811 |
| Median Family Income | 76 | $58,438 |
| Mean Family Income | 76 | $61,846 |
| Median Household Income | 128 | $46,250 |
| Mean Household Income | 128 | $50,913 |
| Income Deficit | 76 | $0 |
| Wage / Income Gap (%) | 335 | 0.95% |
| Wage / Income Gap ($) | 335 | 99.05¢ per $1 |
| Gini / Inequality Index | 335 | 0.31 |
Earnings by Sex in Mystic
Average Earnings in Mystic are $32,614, $32,500 for men and $32,813 for women, a difference of 0.9%.
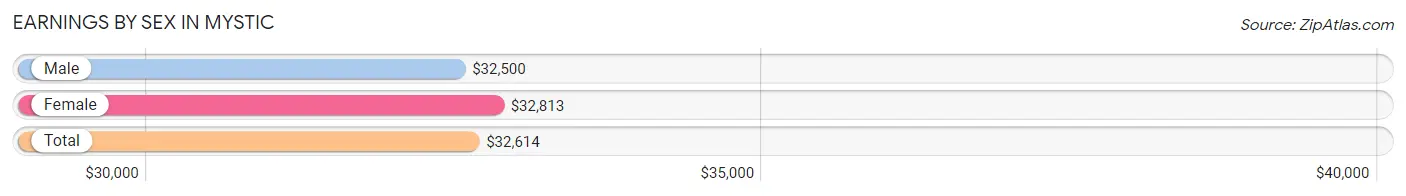
| Sex | Number | Average Earnings |
| Male | 90 (55.9%) | $32,500 |
| Female | 71 (44.1%) | $32,813 |
| Total | 161 (100.0%) | $32,614 |
Earnings by Sex by Income Bracket in Mystic
The most common earnings brackets in Mystic are $30,000 to $34,999 for men (14 | 15.6%) and $35,000 to $39,999 for women (11 | 15.5%).
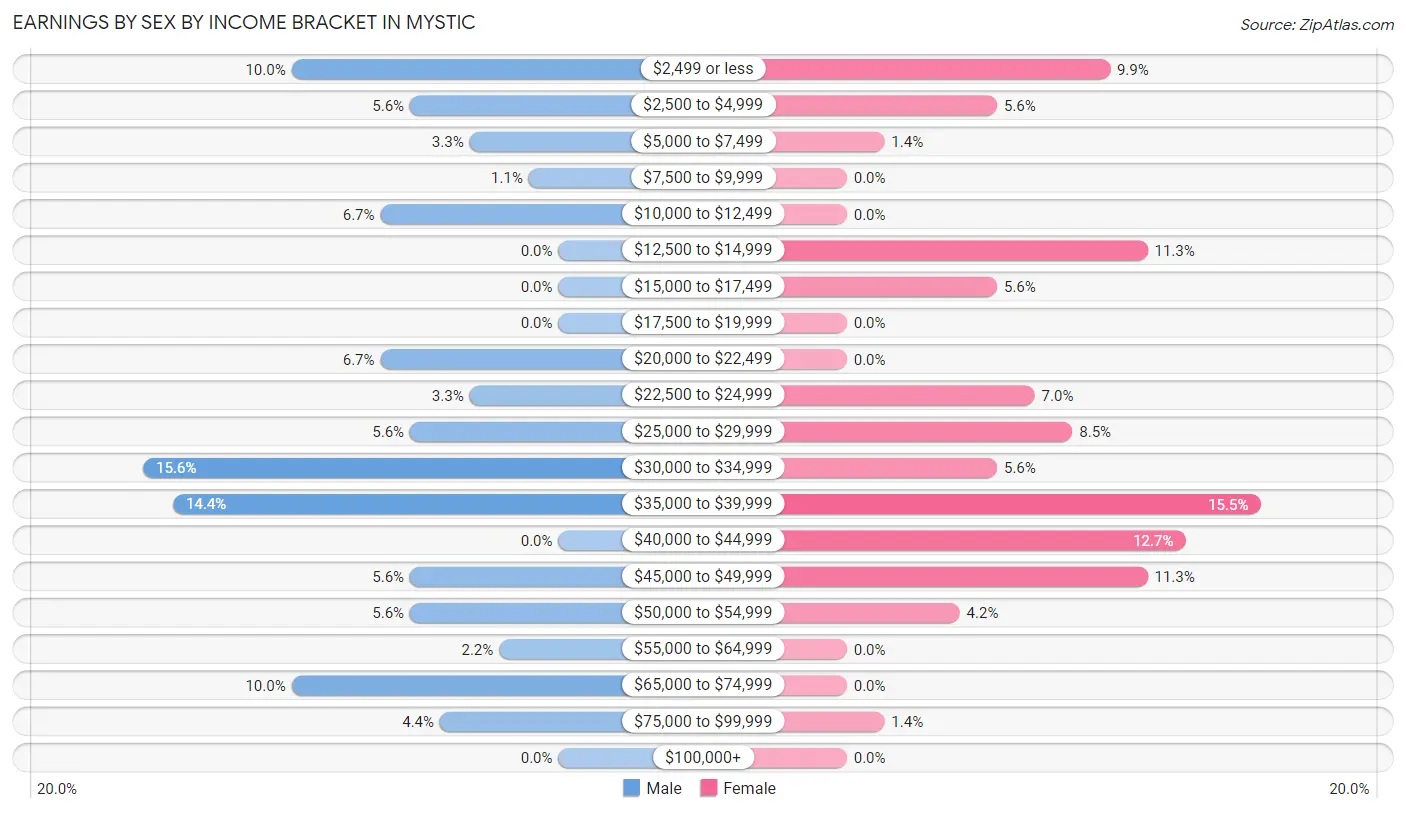
| Income | Male | Female |
| $2,499 or less | 9 (10.0%) | 7 (9.9%) |
| $2,500 to $4,999 | 5 (5.6%) | 4 (5.6%) |
| $5,000 to $7,499 | 3 (3.3%) | 1 (1.4%) |
| $7,500 to $9,999 | 1 (1.1%) | 0 (0.0%) |
| $10,000 to $12,499 | 6 (6.7%) | 0 (0.0%) |
| $12,500 to $14,999 | 0 (0.0%) | 8 (11.3%) |
| $15,000 to $17,499 | 0 (0.0%) | 4 (5.6%) |
| $17,500 to $19,999 | 0 (0.0%) | 0 (0.0%) |
| $20,000 to $22,499 | 6 (6.7%) | 0 (0.0%) |
| $22,500 to $24,999 | 3 (3.3%) | 5 (7.0%) |
| $25,000 to $29,999 | 5 (5.6%) | 6 (8.5%) |
| $30,000 to $34,999 | 14 (15.6%) | 4 (5.6%) |
| $35,000 to $39,999 | 13 (14.4%) | 11 (15.5%) |
| $40,000 to $44,999 | 0 (0.0%) | 9 (12.7%) |
| $45,000 to $49,999 | 5 (5.6%) | 8 (11.3%) |
| $50,000 to $54,999 | 5 (5.6%) | 3 (4.2%) |
| $55,000 to $64,999 | 2 (2.2%) | 0 (0.0%) |
| $65,000 to $74,999 | 9 (10.0%) | 0 (0.0%) |
| $75,000 to $99,999 | 4 (4.4%) | 1 (1.4%) |
| $100,000+ | 0 (0.0%) | 0 (0.0%) |
| Total | 90 (100.0%) | 71 (100.0%) |
Earnings by Sex by Educational Attainment in Mystic
Average earnings in Mystic are $38,125 for men and $28,750 for women, a difference of 24.6%. Men with an educational attainment of college or associate's degree enjoy the highest average annual earnings of $70,000, while those with high school diploma education earn the least with $35,000. Women with an educational attainment of college or associate's degree earn the most with the average annual earnings of $35,938, while those with high school diploma education have the smallest earnings of $23,000.
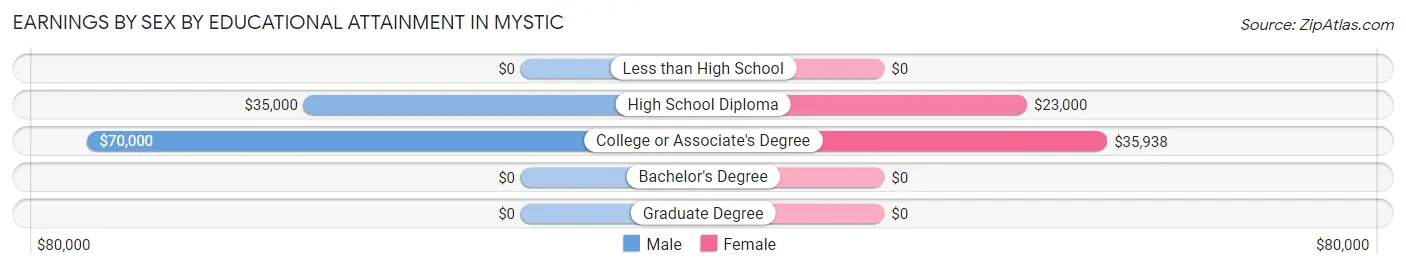
| Educational Attainment | Male Income | Female Income |
| Less than High School | - | - |
| High School Diploma | $35,000 | $23,000 |
| College or Associate's Degree | $70,000 | $35,938 |
| Bachelor's Degree | - | - |
| Graduate Degree | - | - |
| Total | $38,125 | $28,750 |
Family Income in Mystic
Family Income Brackets in Mystic
According to the Mystic family income data, there are 28 families falling into the $50,000 to $74,999 income range, which is the most common income bracket and makes up 36.8% of all families.
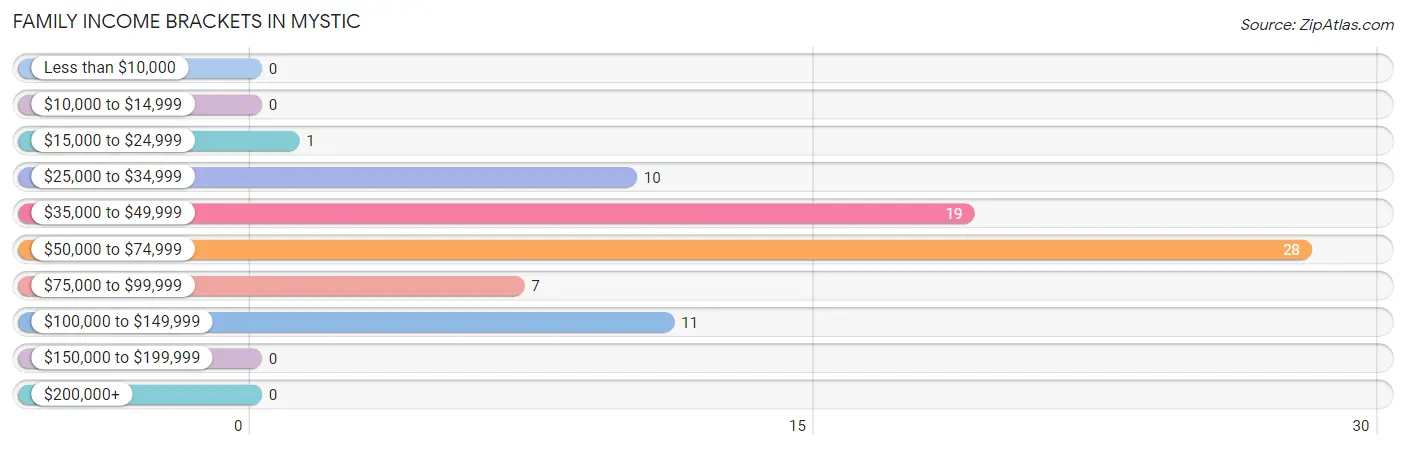
| Income Bracket | # Families | % Families |
| Less than $10,000 | 0 | 0.0% |
| $10,000 to $14,999 | 0 | 0.0% |
| $15,000 to $24,999 | 1 | 1.3% |
| $25,000 to $34,999 | 10 | 13.2% |
| $35,000 to $49,999 | 19 | 25.0% |
| $50,000 to $74,999 | 28 | 36.8% |
| $75,000 to $99,999 | 7 | 9.2% |
| $100,000 to $149,999 | 11 | 14.5% |
| $150,000 to $199,999 | 0 | 0.0% |
| $200,000+ | 0 | 0.0% |
Family Income by Famaliy Size in Mystic
3-person families (15 | 19.7%) account for the highest median family income in Mystic with $59,375 per family, while 2-person families (41 | 53.9%) have the highest median income of $22,812 per family member.
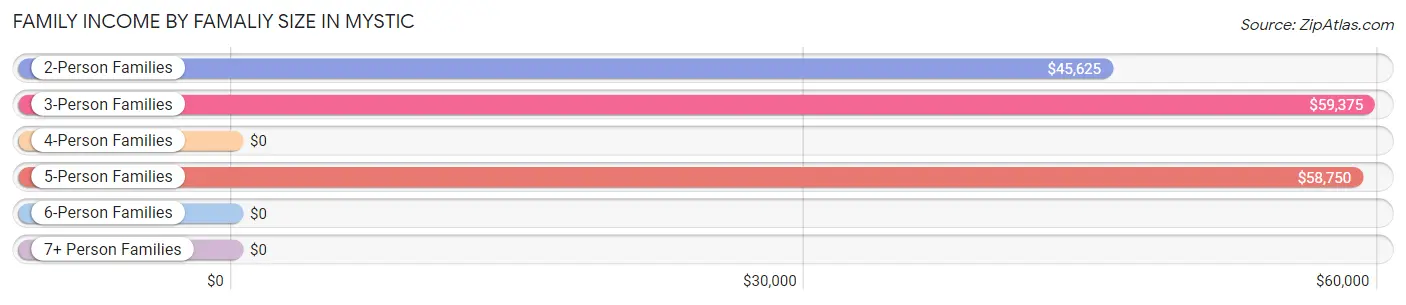
| Income Bracket | # Families | Median Income |
| 2-Person Families | 41 (53.9%) | $45,625 |
| 3-Person Families | 15 (19.7%) | $59,375 |
| 4-Person Families | 13 (17.1%) | $0 |
| 5-Person Families | 6 (7.9%) | $58,750 |
| 6-Person Families | 1 (1.3%) | $0 |
| 7+ Person Families | 0 (0.0%) | $0 |
| Total | 76 (100.0%) | $58,438 |
Family Income by Number of Earners in Mystic
The median family income in Mystic is $58,438, with families comprising 3+ earners (10) having the highest median family income of $105,625, while families with no earners (12) have the lowest median family income of $43,750, accounting for 13.2% and 15.8% of families, respectively.
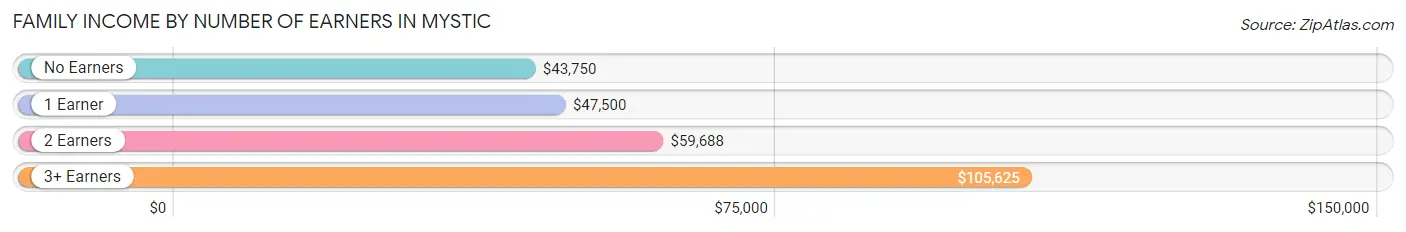
| Number of Earners | # Families | Median Income |
| No Earners | 12 (15.8%) | $43,750 |
| 1 Earner | 28 (36.8%) | $47,500 |
| 2 Earners | 26 (34.2%) | $59,688 |
| 3+ Earners | 10 (13.2%) | $105,625 |
| Total | 76 (100.0%) | $58,438 |
Household Income in Mystic
Household Income Brackets in Mystic
With 38 households falling in the category, the $50,000 to $74,999 income range is the most frequent in Mystic, accounting for 29.7% of all households.
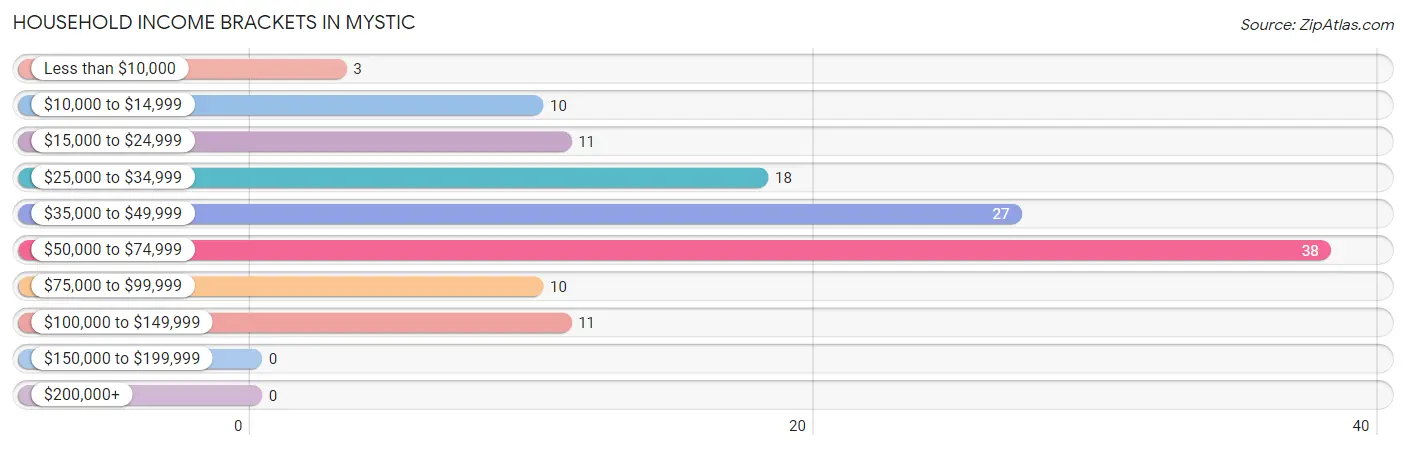
| Income Bracket | # Households | % Households |
| Less than $10,000 | 3 | 2.3% |
| $10,000 to $14,999 | 10 | 7.8% |
| $15,000 to $24,999 | 11 | 8.6% |
| $25,000 to $34,999 | 18 | 14.1% |
| $35,000 to $49,999 | 27 | 21.1% |
| $50,000 to $74,999 | 38 | 29.7% |
| $75,000 to $99,999 | 10 | 7.8% |
| $100,000 to $149,999 | 11 | 8.6% |
| $150,000 to $199,999 | 0 | 0.0% |
| $200,000+ | 0 | 0.0% |
Household Income by Householder Age in Mystic
The median household income in Mystic is $46,250, with the highest median household income of $64,500 found in the 25 to 44 years age bracket for the primary householder. A total of 28 households (21.9%) fall into this category.
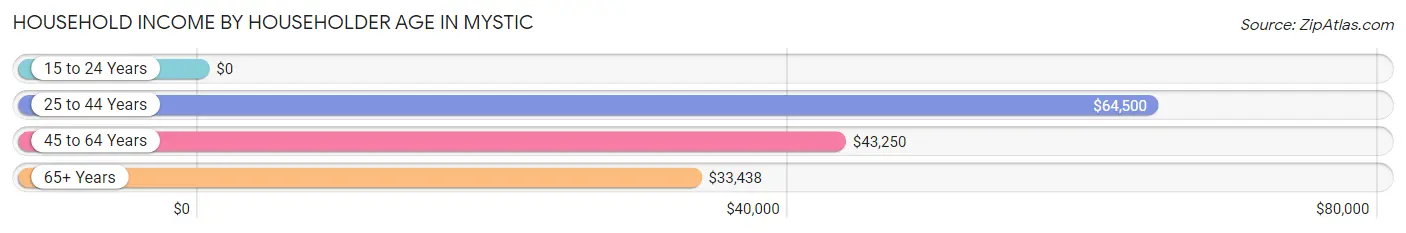
| Income Bracket | # Households | Median Income |
| 15 to 24 Years | 0 (0.0%) | $0 |
| 25 to 44 Years | 28 (21.9%) | $64,500 |
| 45 to 64 Years | 59 (46.1%) | $43,250 |
| 65+ Years | 41 (32.0%) | $33,438 |
| Total | 128 (100.0%) | $46,250 |
Poverty in Mystic
Income Below Poverty by Sex and Age in Mystic
With 4.3% poverty level for males and 10.7% for females among the residents of Mystic, 75 year old and over males and 75 year old and over females are the most vulnerable to poverty, with 4 males (23.5%) and 2 females (50.0%) in their respective age groups living below the poverty level.
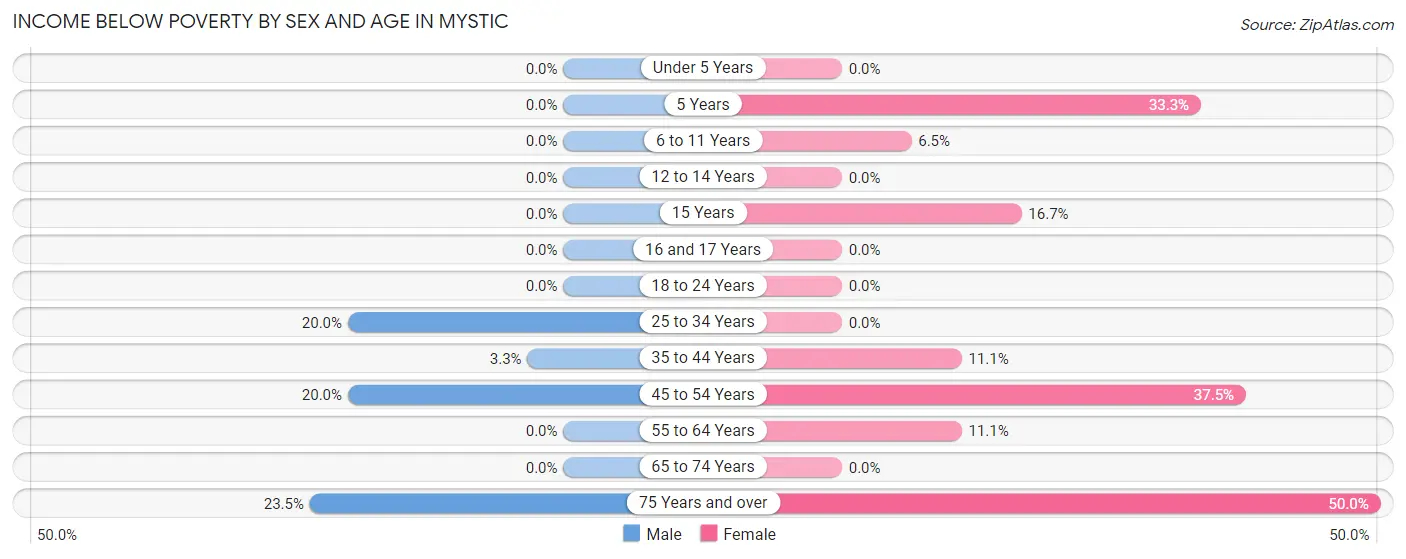
| Age Bracket | Male | Female |
| Under 5 Years | 0 (0.0%) | 0 (0.0%) |
| 5 Years | 0 (0.0%) | 2 (33.3%) |
| 6 to 11 Years | 0 (0.0%) | 2 (6.5%) |
| 12 to 14 Years | 0 (0.0%) | 0 (0.0%) |
| 15 Years | 0 (0.0%) | 1 (16.7%) |
| 16 and 17 Years | 0 (0.0%) | 0 (0.0%) |
| 18 to 24 Years | 0 (0.0%) | 0 (0.0%) |
| 25 to 34 Years | 1 (20.0%) | 0 (0.0%) |
| 35 to 44 Years | 1 (3.3%) | 2 (11.1%) |
| 45 to 54 Years | 2 (20.0%) | 3 (37.5%) |
| 55 to 64 Years | 0 (0.0%) | 4 (11.1%) |
| 65 to 74 Years | 0 (0.0%) | 0 (0.0%) |
| 75 Years and over | 4 (23.5%) | 2 (50.0%) |
| Total | 8 (4.3%) | 16 (10.7%) |
Income Above Poverty by Sex and Age in Mystic
According to the poverty statistics in Mystic, males aged under 5 years and females aged 12 to 14 years are the age groups that are most secure financially, with 100.0% of males and 100.0% of females in these age groups living above the poverty line.
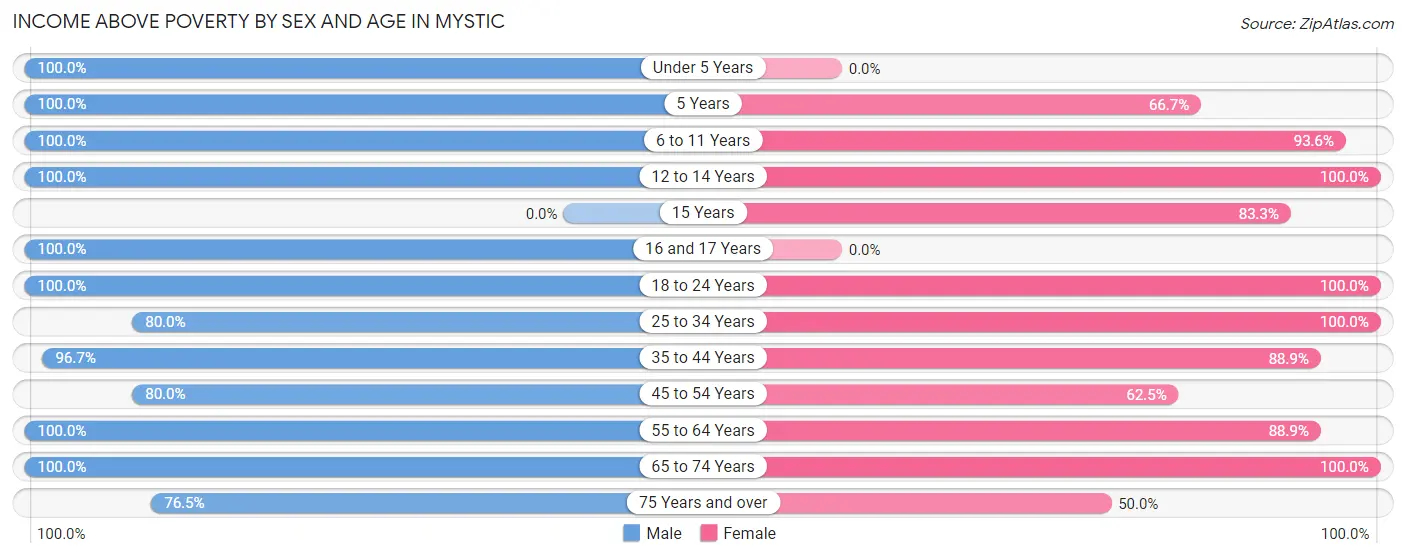
| Age Bracket | Male | Female |
| Under 5 Years | 1 (100.0%) | 0 (0.0%) |
| 5 Years | 14 (100.0%) | 4 (66.7%) |
| 6 to 11 Years | 32 (100.0%) | 29 (93.5%) |
| 12 to 14 Years | 1 (100.0%) | 8 (100.0%) |
| 15 Years | 0 (0.0%) | 5 (83.3%) |
| 16 and 17 Years | 4 (100.0%) | 0 (0.0%) |
| 18 to 24 Years | 21 (100.0%) | 3 (100.0%) |
| 25 to 34 Years | 4 (80.0%) | 18 (100.0%) |
| 35 to 44 Years | 29 (96.7%) | 16 (88.9%) |
| 45 to 54 Years | 8 (80.0%) | 5 (62.5%) |
| 55 to 64 Years | 30 (100.0%) | 32 (88.9%) |
| 65 to 74 Years | 20 (100.0%) | 12 (100.0%) |
| 75 Years and over | 13 (76.5%) | 2 (50.0%) |
| Total | 177 (95.7%) | 134 (89.3%) |
Income Below Poverty Among Married-Couple Families in Mystic
The poverty statistics for married-couple families in Mystic show that 4.0% or 2 of the total 50 families live below the poverty line. Families with 1 or 2 children have the highest poverty rate of 16.7%, comprising of 2 families. On the other hand, families with no children have the lowest poverty rate of 0.0%, which includes 0 families.
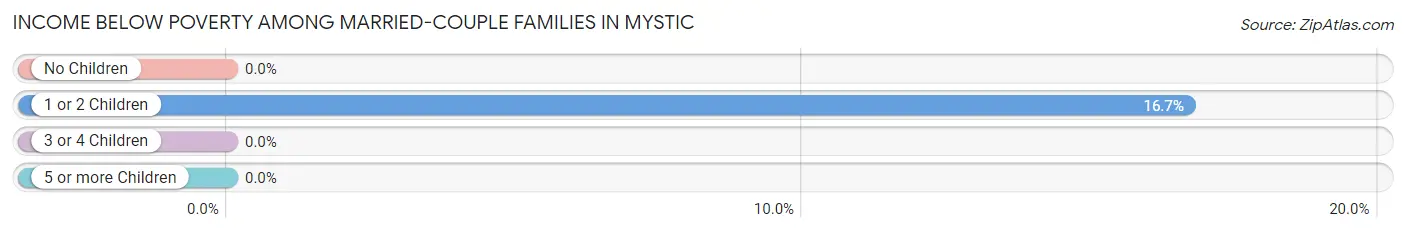
| Children | Above Poverty | Below Poverty |
| No Children | 35 (100.0%) | 0 (0.0%) |
| 1 or 2 Children | 10 (83.3%) | 2 (16.7%) |
| 3 or 4 Children | 3 (100.0%) | 0 (0.0%) |
| 5 or more Children | 0 (0.0%) | 0 (0.0%) |
| Total | 48 (96.0%) | 2 (4.0%) |
Income Below Poverty Among Single-Parent Households in Mystic
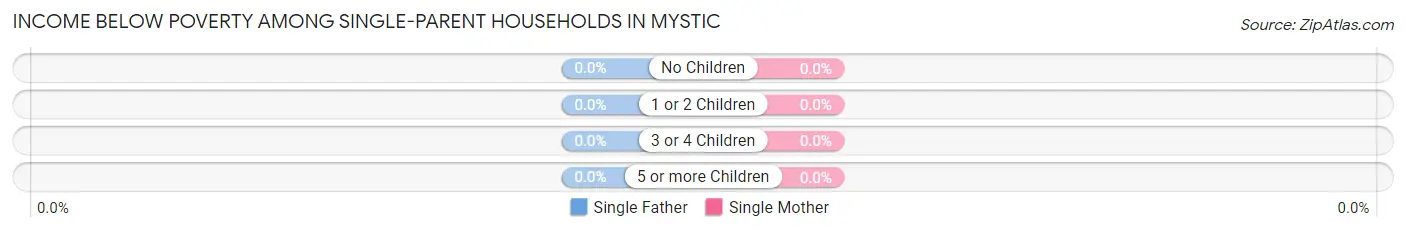
| Children | Single Father | Single Mother |
| No Children | 0 (0.0%) | 0 (0.0%) |
| 1 or 2 Children | 0 (0.0%) | 0 (0.0%) |
| 3 or 4 Children | 0 (0.0%) | 0 (0.0%) |
| 5 or more Children | 0 (0.0%) | 0 (0.0%) |
| Total | 0 (0.0%) | 0 (0.0%) |
Income Below Poverty Among Married-Couple vs Single-Parent Households in Mystic
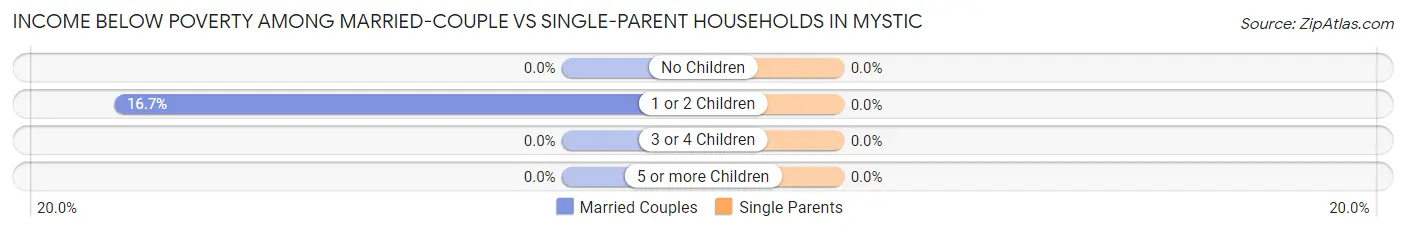
| Children | Married-Couple Families | Single-Parent Households |
| No Children | 0 (0.0%) | 0 (0.0%) |
| 1 or 2 Children | 2 (16.7%) | 0 (0.0%) |
| 3 or 4 Children | 0 (0.0%) | 0 (0.0%) |
| 5 or more Children | 0 (0.0%) | 0 (0.0%) |
| Total | 2 (4.0%) | 0 (0.0%) |
Race in Mystic
The most populous races in Mystic are White / Caucasian (283 | 84.5%), Two or more Races (52 | 15.5%), and Hispanic or Latino (49 | 14.6%).
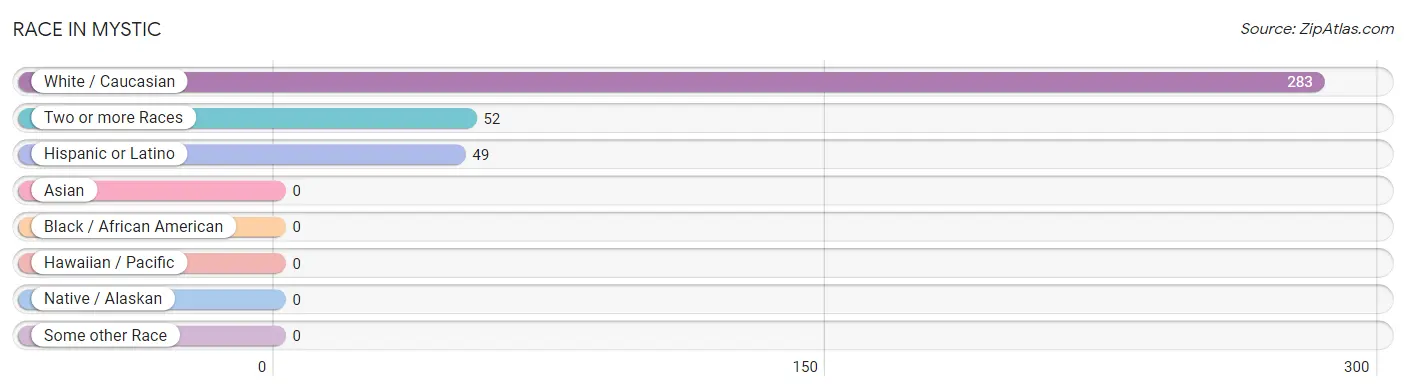
| Race | # Population | % Population |
| Asian | 0 | 0.0% |
| Black / African American | 0 | 0.0% |
| Hawaiian / Pacific | 0 | 0.0% |
| Hispanic or Latino | 49 | 14.6% |
| Native / Alaskan | 0 | 0.0% |
| White / Caucasian | 283 | 84.5% |
| Two or more Races | 52 | 15.5% |
| Some other Race | 0 | 0.0% |
| Total | 335 | 100.0% |
Ancestry in Mystic
The most populous ancestries reported in Mystic are English (70 | 20.9%), Mexican (49 | 14.6%), German (48 | 14.3%), Sioux (37 | 11.0%), and American (33 | 9.9%), together accounting for 70.8% of all Mystic residents.
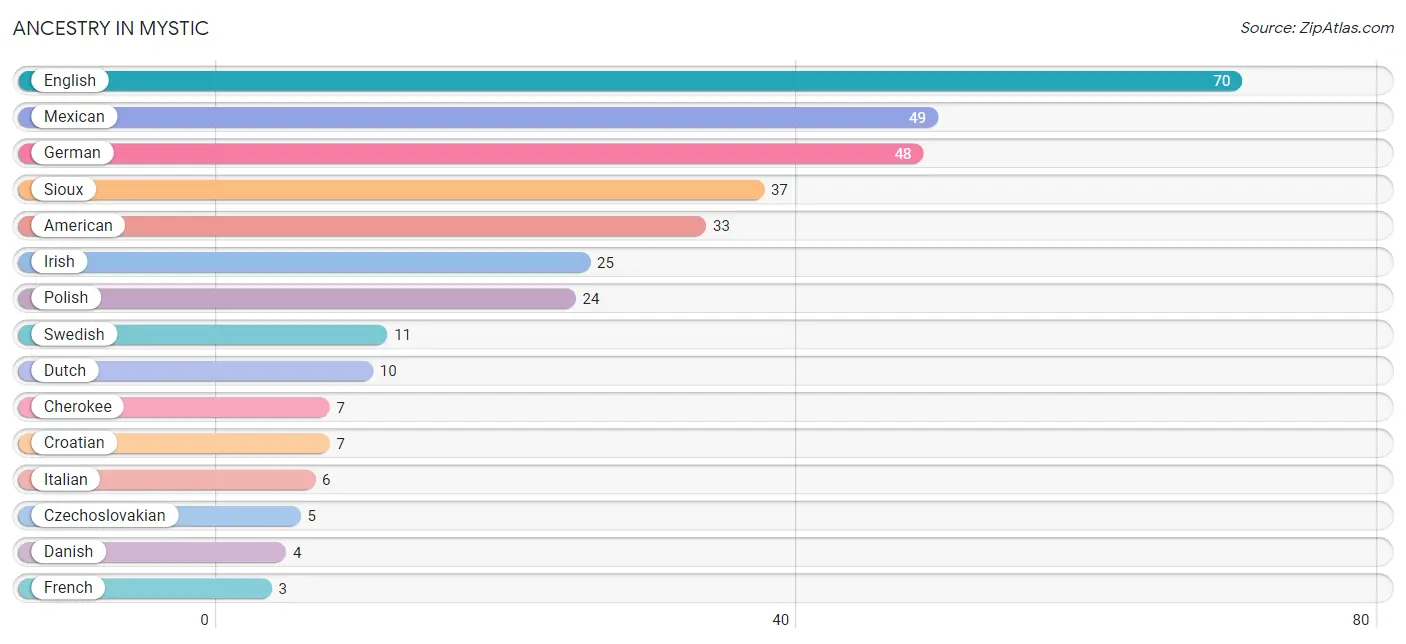
| Ancestry | # Population | % Population |
| American | 33 | 9.9% |
| Cherokee | 7 | 2.1% |
| Croatian | 7 | 2.1% |
| Czechoslovakian | 5 | 1.5% |
| Danish | 4 | 1.2% |
| Dutch | 10 | 3.0% |
| English | 70 | 20.9% |
| French | 3 | 0.9% |
| German | 48 | 14.3% |
| Greek | 1 | 0.3% |
| Irish | 25 | 7.5% |
| Italian | 6 | 1.8% |
| Mexican | 49 | 14.6% |
| Norwegian | 1 | 0.3% |
| Polish | 24 | 7.2% |
| Sioux | 37 | 11.0% |
| Swedish | 11 | 3.3% | View All 17 Rows |
Immigrants in Mystic

| Immigration Origin | # Population | % Population | View All 0 Rows |
Sex and Age in Mystic
Sex and Age in Mystic
The most populous age groups in Mystic are 5 to 9 Years (45 | 24.3%) for men and 10 to 14 Years (24 | 16.0%) for women.
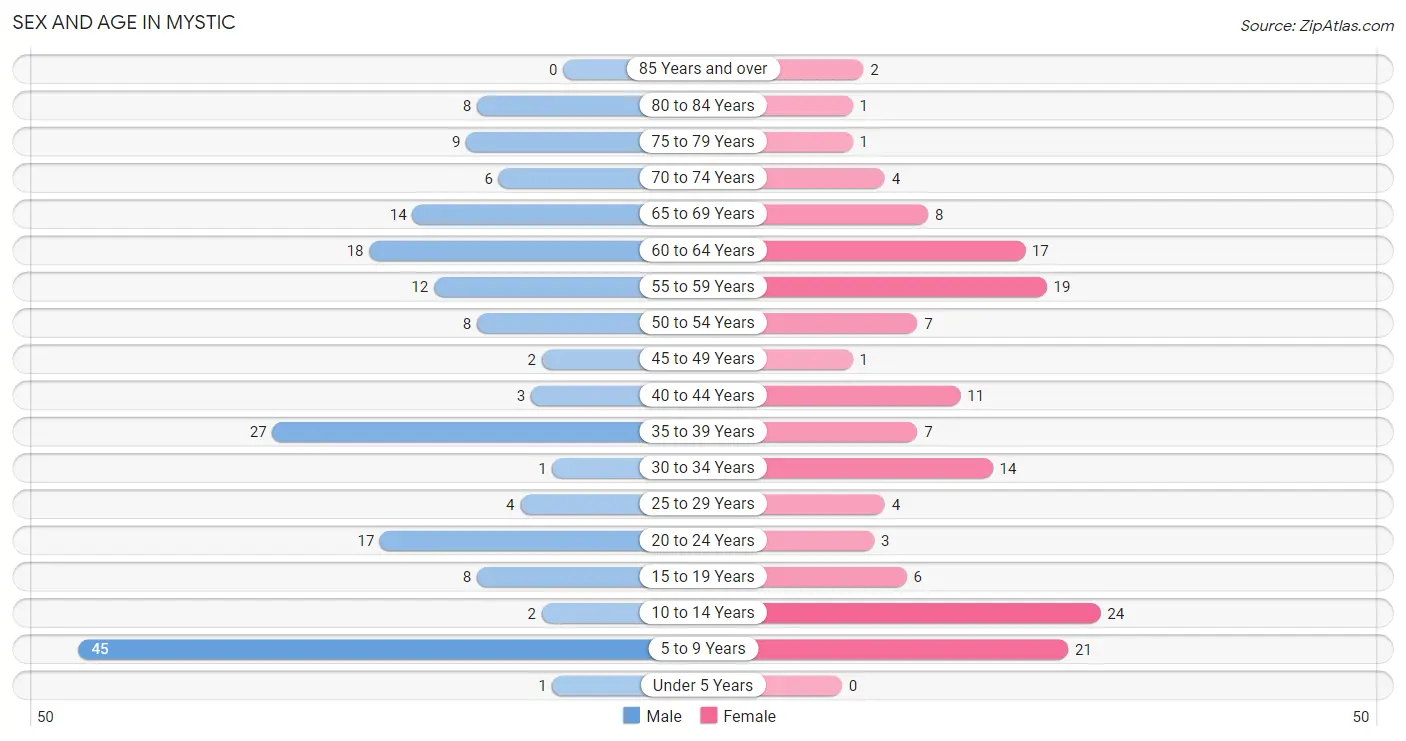
| Age Bracket | Male | Female |
| Under 5 Years | 1 (0.5%) | 0 (0.0%) |
| 5 to 9 Years | 45 (24.3%) | 21 (14.0%) |
| 10 to 14 Years | 2 (1.1%) | 24 (16.0%) |
| 15 to 19 Years | 8 (4.3%) | 6 (4.0%) |
| 20 to 24 Years | 17 (9.2%) | 3 (2.0%) |
| 25 to 29 Years | 4 (2.2%) | 4 (2.7%) |
| 30 to 34 Years | 1 (0.5%) | 14 (9.3%) |
| 35 to 39 Years | 27 (14.6%) | 7 (4.7%) |
| 40 to 44 Years | 3 (1.6%) | 11 (7.3%) |
| 45 to 49 Years | 2 (1.1%) | 1 (0.7%) |
| 50 to 54 Years | 8 (4.3%) | 7 (4.7%) |
| 55 to 59 Years | 12 (6.5%) | 19 (12.7%) |
| 60 to 64 Years | 18 (9.7%) | 17 (11.3%) |
| 65 to 69 Years | 14 (7.6%) | 8 (5.3%) |
| 70 to 74 Years | 6 (3.2%) | 4 (2.7%) |
| 75 to 79 Years | 9 (4.9%) | 1 (0.7%) |
| 80 to 84 Years | 8 (4.3%) | 1 (0.7%) |
| 85 Years and over | 0 (0.0%) | 2 (1.3%) |
| Total | 185 (100.0%) | 150 (100.0%) |
Families and Households in Mystic
Median Family Size in Mystic
The median family size in Mystic is 3.57 persons per family, with single male/father families (13 | 17.1%) accounting for the largest median family size of 3.85 persons per family. On the other hand, single female/mother families (13 | 17.1%) represent the smallest median family size with 2.69 persons per family.
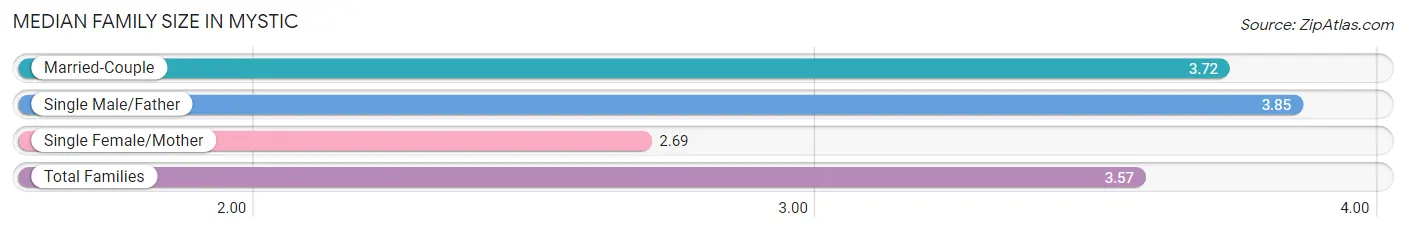
| Family Type | # Families | Family Size |
| Married-Couple | 50 (65.8%) | 3.72 |
| Single Male/Father | 13 (17.1%) | 3.85 |
| Single Female/Mother | 13 (17.1%) | 2.69 |
| Total Families | 76 (100.0%) | 3.57 |
Median Household Size in Mystic
The median household size in Mystic is 2.62 persons per household, with single male/father households (13 | 10.2%) accounting for the largest median household size of 4.23 persons per household. non-family households (52 | 40.6%) represent the smallest median household size with 1.06 persons per household.
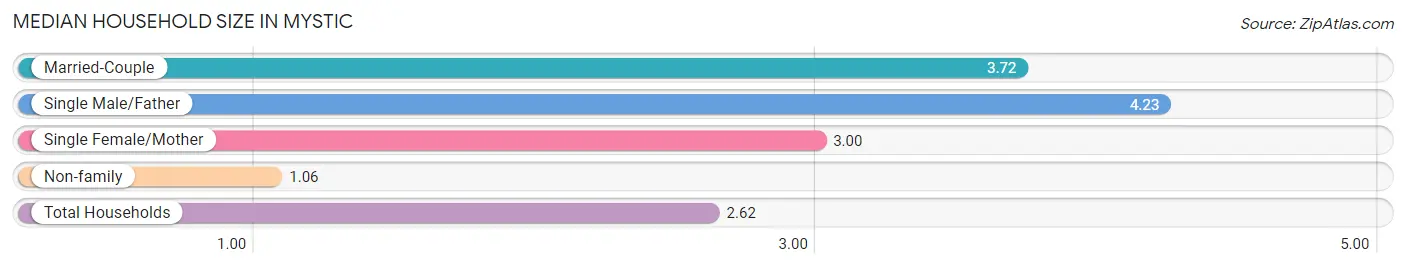
| Household Type | # Households | Household Size |
| Married-Couple | 50 (39.1%) | 3.72 |
| Single Male/Father | 13 (10.2%) | 4.23 |
| Single Female/Mother | 13 (10.2%) | 3.00 |
| Non-family | 52 (40.6%) | 1.06 |
| Total Households | 128 (100.0%) | 2.62 |
Household Size by Marriage Status in Mystic
Out of a total of 128 households in Mystic, 76 (59.4%) are family households, while 52 (40.6%) are nonfamily households. The most numerous type of family households are 2-person households, comprising 36, and the most common type of nonfamily households are 1-person households, comprising 51.
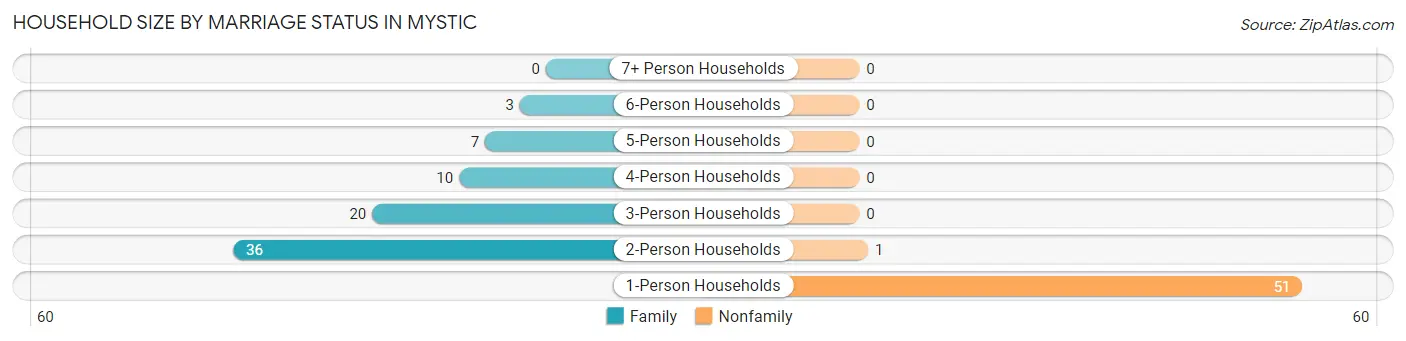
| Household Size | Family Households | Nonfamily Households |
| 1-Person Households | - | 51 (39.8%) |
| 2-Person Households | 36 (28.1%) | 1 (0.8%) |
| 3-Person Households | 20 (15.6%) | 0 (0.0%) |
| 4-Person Households | 10 (7.8%) | 0 (0.0%) |
| 5-Person Households | 7 (5.5%) | 0 (0.0%) |
| 6-Person Households | 3 (2.3%) | 0 (0.0%) |
| 7+ Person Households | 0 (0.0%) | 0 (0.0%) |
| Total | 76 (59.4%) | 52 (40.6%) |
Female Fertility in Mystic
Fertility by Age in Mystic
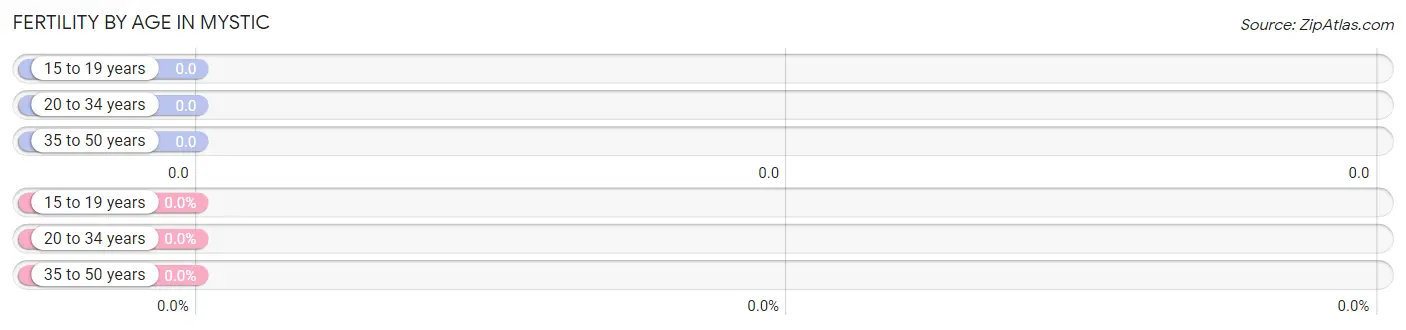
| Age Bracket | Women with Births | Births / 1,000 Women |
| 15 to 19 years | 0 (0.0%) | 0.0 |
| 20 to 34 years | 0 (0.0%) | 0.0 |
| 35 to 50 years | 0 (0.0%) | 0.0 |
| Total | 0 (0.0%) | 0.0 |
Fertility by Age by Marriage Status in Mystic
| Age Bracket | Married | Unmarried |
| 15 to 19 years | 0 (0.0%) | 0 (0.0%) |
| 20 to 34 years | 0 (0.0%) | 0 (0.0%) |
| 35 to 50 years | 0 (0.0%) | 0 (0.0%) |
| Total | 0 (0.0%) | 0 (0.0%) |
Fertility by Education in Mystic
| Educational Attainment | Women with Births | Births / 1,000 Women |
| Less than High School | 0 (0.0%) | 0.0 |
| High School Diploma | 0 (0.0%) | 0.0 |
| College or Associate's Degree | 0 (0.0%) | 0.0 |
| Bachelor's Degree | 0 (0.0%) | 0.0 |
| Graduate Degree | 0 (0.0%) | 0.0 |
| Total | 0 (0.0%) | 0.0 |
Fertility by Education by Marriage Status in Mystic
| Educational Attainment | Married | Unmarried |
| Less than High School | 0 (0.0%) | 0 (0.0%) |
| High School Diploma | 0 (0.0%) | 0 (0.0%) |
| College or Associate's Degree | 0 (0.0%) | 0 (0.0%) |
| Bachelor's Degree | 0 (0.0%) | 0 (0.0%) |
| Graduate Degree | 0 (0.0%) | 0 (0.0%) |
| Total | 0 (0.0%) | 0 (0.0%) |
Employment Characteristics in Mystic
Employment by Class of Employer in Mystic
Among the 134 employed individuals in Mystic, private company employees (105 | 78.4%), not-for-profit organizations (12 | 9.0%), and self-employed (not incorporated) (7 | 5.2%) make up the most common classes of employment.
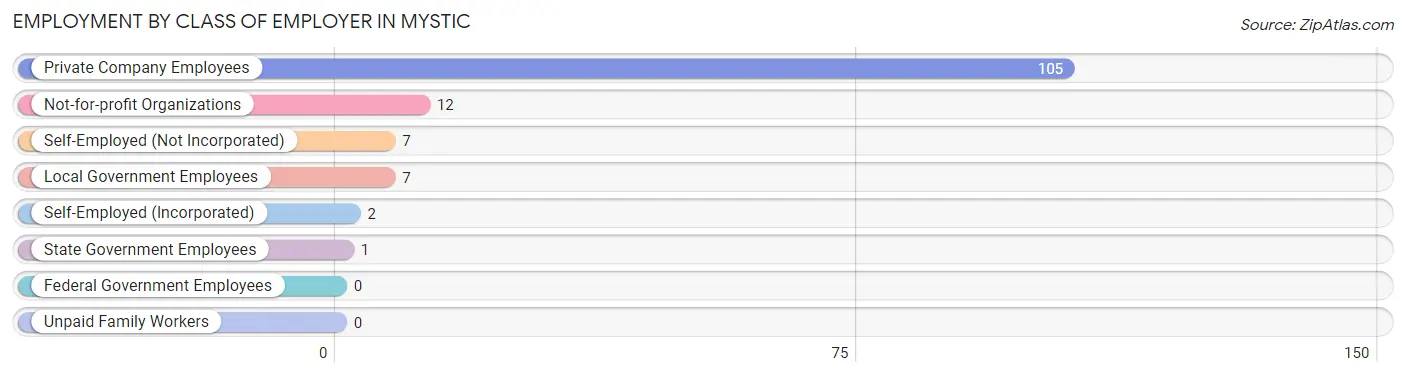
| Employer Class | # Employees | % Employees |
| Private Company Employees | 105 | 78.4% |
| Self-Employed (Incorporated) | 2 | 1.5% |
| Self-Employed (Not Incorporated) | 7 | 5.2% |
| Not-for-profit Organizations | 12 | 9.0% |
| Local Government Employees | 7 | 5.2% |
| State Government Employees | 1 | 0.7% |
| Federal Government Employees | 0 | 0.0% |
| Unpaid Family Workers | 0 | 0.0% |
| Total | 134 | 100.0% |
Employment Status by Age in Mystic
According to the labor force statistics for Mystic, out of the total population over 16 years of age (236), 62.3% or 147 individuals are in the labor force, with 6.8% or 10 of them unemployed. The age group with the highest labor force participation rate is 16 to 19 years, with 100.0% or 8 individuals in the labor force. Within the labor force, the 20 to 24 years age range has the highest percentage of unemployed individuals, with 35.0% or 7 of them being unemployed.
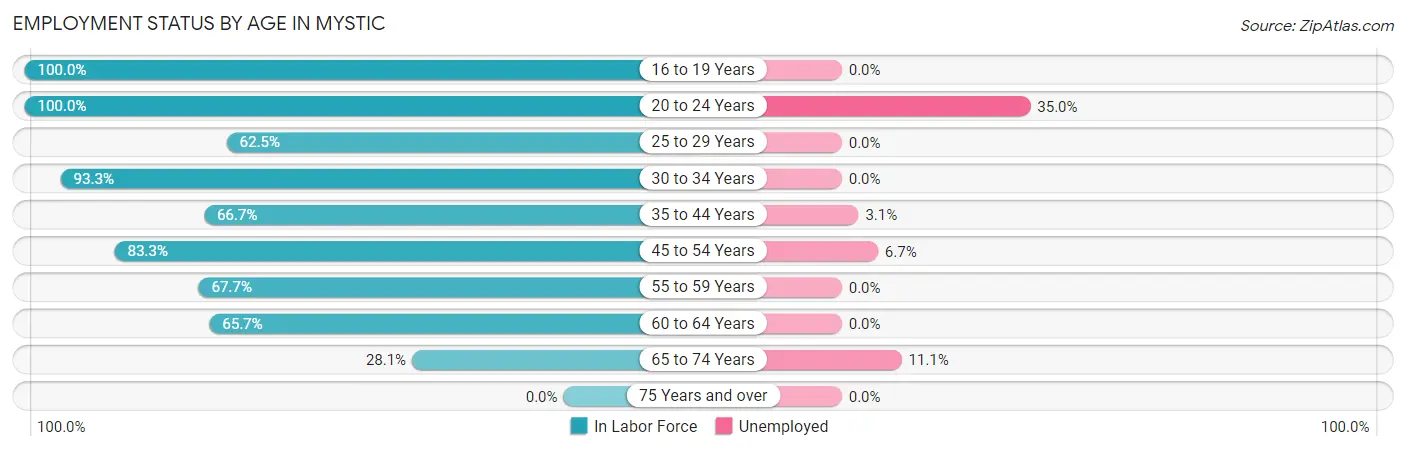
| Age Bracket | In Labor Force | Unemployed |
| 16 to 19 Years | 8 (100.0%) | 0 (0.0%) |
| 20 to 24 Years | 20 (100.0%) | 7 (35.0%) |
| 25 to 29 Years | 5 (62.5%) | 0 (0.0%) |
| 30 to 34 Years | 14 (93.3%) | 0 (0.0%) |
| 35 to 44 Years | 32 (66.7%) | 1 (3.1%) |
| 45 to 54 Years | 15 (83.3%) | 1 (6.7%) |
| 55 to 59 Years | 21 (67.7%) | 0 (0.0%) |
| 60 to 64 Years | 23 (65.7%) | 0 (0.0%) |
| 65 to 74 Years | 9 (28.1%) | 1 (11.1%) |
| 75 Years and over | 0 (0.0%) | 0 (0.0%) |
| Total | 147 (62.3%) | 10 (6.8%) |
Employment Status by Educational Attainment in Mystic
According to labor force statistics for Mystic, 71.0% of individuals (110) out of the total population between 25 and 64 years of age (155) are in the labor force, with 1.8% or 2 of them being unemployed. The group with the highest labor force participation rate are those with the educational attainment of college / associate degree, with 78.1% or 50 individuals in the labor force. Within the labor force, individuals with high school diploma education have the highest percentage of unemployment, with 3.6% or 2 of them being unemployed.
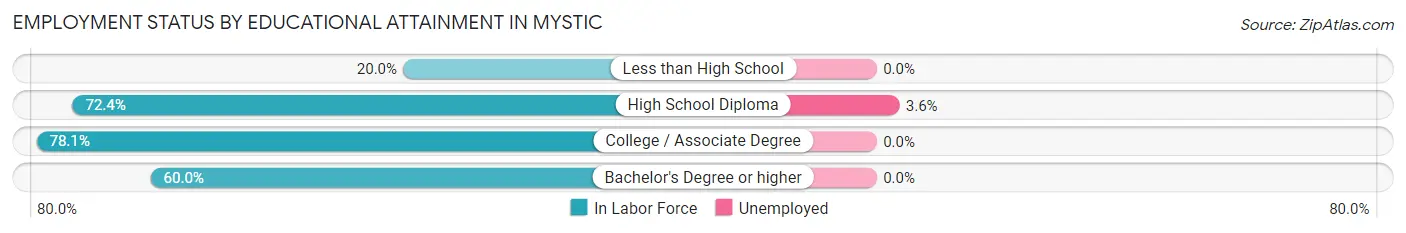
| Educational Attainment | In Labor Force | Unemployed |
| Less than High School | 2 (20.0%) | 0 (0.0%) |
| High School Diploma | 55 (72.4%) | 3 (3.6%) |
| College / Associate Degree | 50 (78.1%) | 0 (0.0%) |
| Bachelor's Degree or higher | 3 (60.0%) | 0 (0.0%) |
| Total | 110 (71.0%) | 3 (1.8%) |
Employment Occupations by Sex in Mystic
Management, Business, Science and Arts Occupations
The most common Management, Business, Science and Arts occupations in Mystic are Community & Social Service (5 | 3.6%), Health Diagnosing & Treating (5 | 3.6%), Health Technologists (5 | 3.6%), Management (4 | 2.9%), and Computers, Engineering & Science (4 | 2.9%).
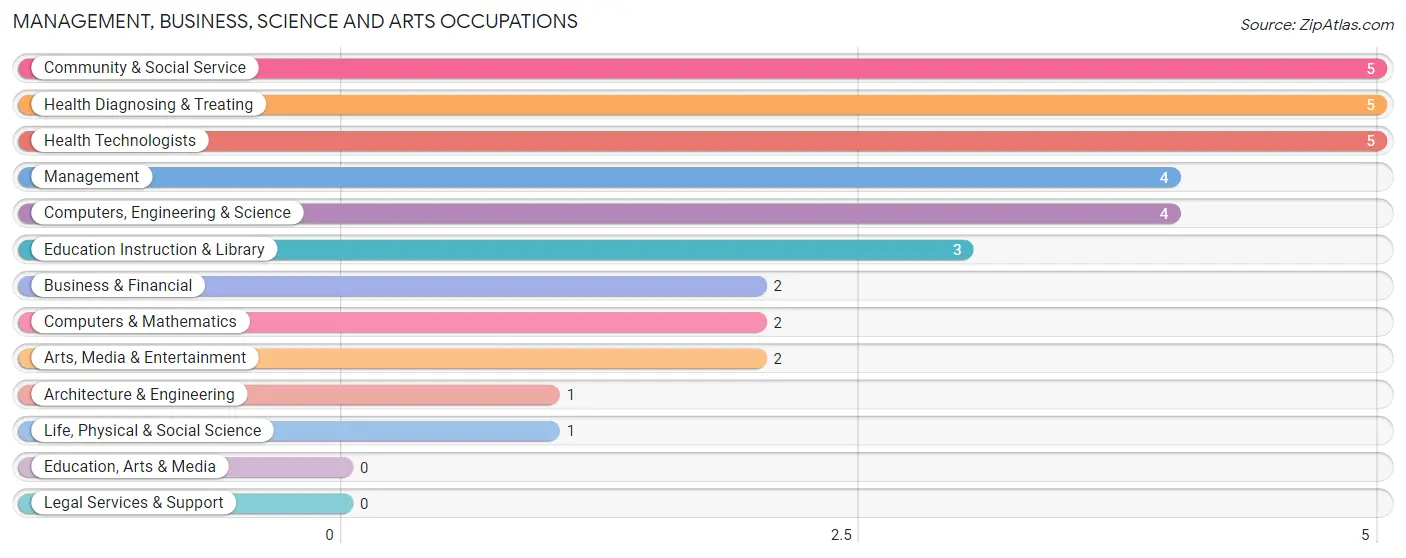
Management, Business, Science and Arts Occupations by Sex
Within the Management, Business, Science and Arts occupations in Mystic, the most male-oriented occupations are Management (100.0%), Business & Financial (100.0%), and Computers & Mathematics (100.0%), while the most female-oriented occupations are Architecture & Engineering (100.0%), Education Instruction & Library (100.0%), and Health Diagnosing & Treating (100.0%).
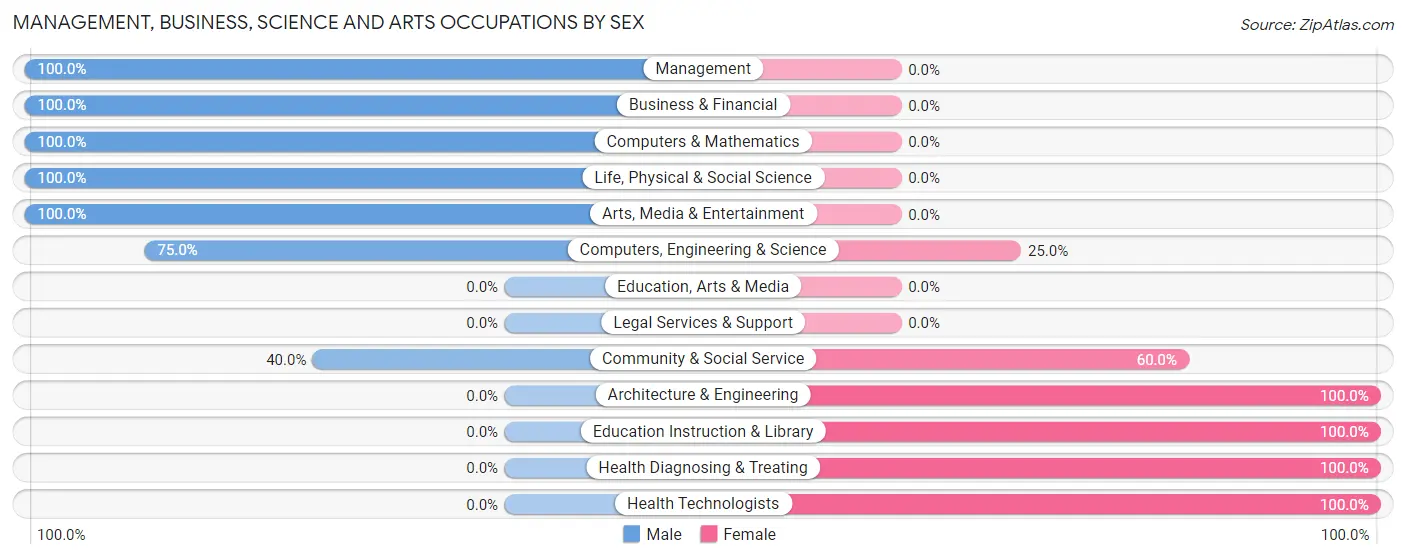
| Occupation | Male | Female |
| Management | 4 (100.0%) | 0 (0.0%) |
| Business & Financial | 2 (100.0%) | 0 (0.0%) |
| Computers, Engineering & Science | 3 (75.0%) | 1 (25.0%) |
| Computers & Mathematics | 2 (100.0%) | 0 (0.0%) |
| Architecture & Engineering | 0 (0.0%) | 1 (100.0%) |
| Life, Physical & Social Science | 1 (100.0%) | 0 (0.0%) |
| Community & Social Service | 2 (40.0%) | 3 (60.0%) |
| Education, Arts & Media | 0 (0.0%) | 0 (0.0%) |
| Legal Services & Support | 0 (0.0%) | 0 (0.0%) |
| Education Instruction & Library | 0 (0.0%) | 3 (100.0%) |
| Arts, Media & Entertainment | 2 (100.0%) | 0 (0.0%) |
| Health Diagnosing & Treating | 0 (0.0%) | 5 (100.0%) |
| Health Technologists | 0 (0.0%) | 5 (100.0%) |
| Total (Category) | 11 (55.0%) | 9 (45.0%) |
| Total (Overall) | 74 (54.0%) | 63 (46.0%) |
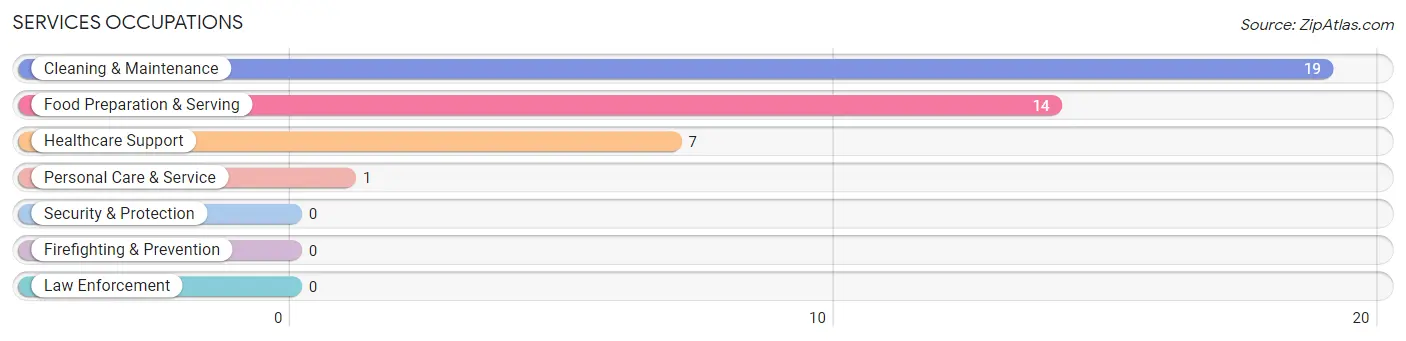
Services Occupations
The most common Services occupations in Mystic are Cleaning & Maintenance (19 | 13.9%), Food Preparation & Serving (14 | 10.2%), Healthcare Support (7 | 5.1%), and Personal Care & Service (1 | 0.7%).
Services Occupations by Sex
Within the Services occupations in Mystic, the most male-oriented occupations are Cleaning & Maintenance (78.9%), and Food Preparation & Serving (35.7%), while the most female-oriented occupations are Healthcare Support (100.0%), Personal Care & Service (100.0%), and Food Preparation & Serving (64.3%).
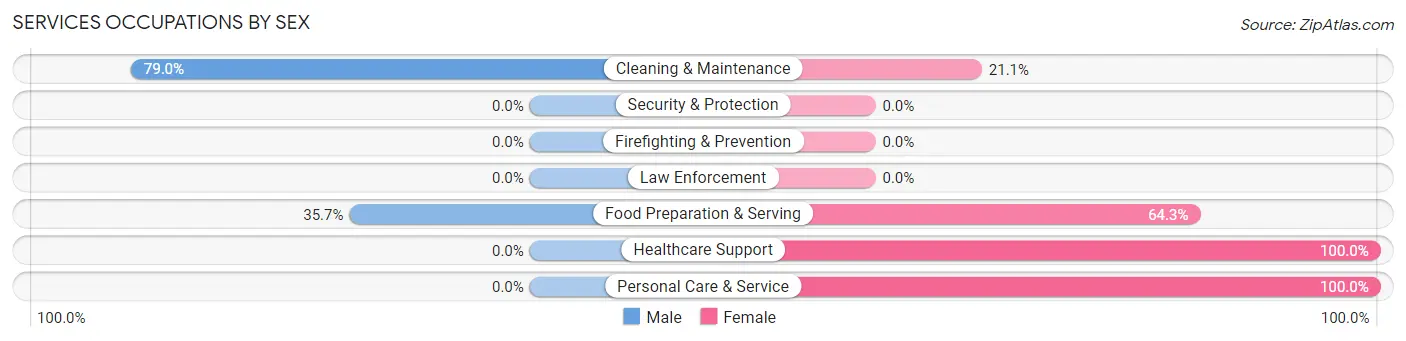
| Occupation | Male | Female |
| Healthcare Support | 0 (0.0%) | 7 (100.0%) |
| Security & Protection | 0 (0.0%) | 0 (0.0%) |
| Firefighting & Prevention | 0 (0.0%) | 0 (0.0%) |
| Law Enforcement | 0 (0.0%) | 0 (0.0%) |
| Food Preparation & Serving | 5 (35.7%) | 9 (64.3%) |
| Cleaning & Maintenance | 15 (78.9%) | 4 (21.0%) |
| Personal Care & Service | 0 (0.0%) | 1 (100.0%) |
| Total (Category) | 20 (48.8%) | 21 (51.2%) |
| Total (Overall) | 74 (54.0%) | 63 (46.0%) |
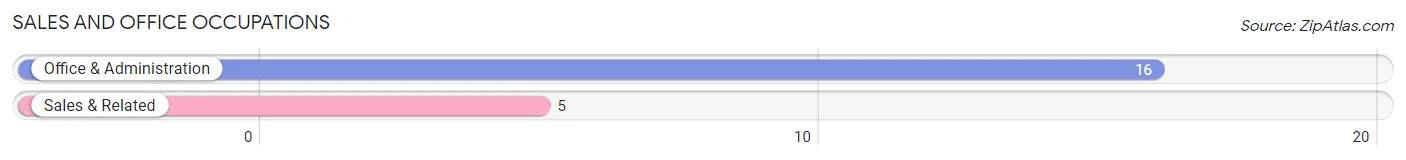
Sales and Office Occupations
The most common Sales and Office occupations in Mystic are Office & Administration (16 | 11.7%), and Sales & Related (5 | 3.6%).
Sales and Office Occupations by Sex
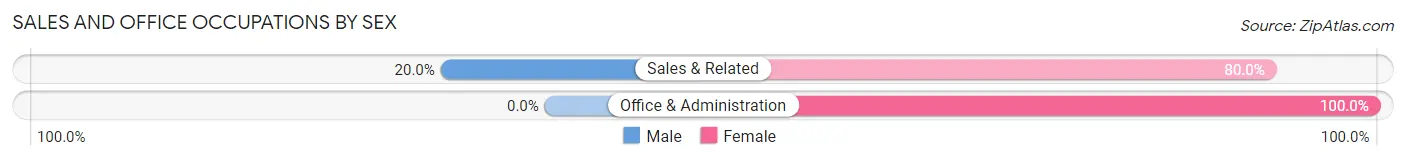
| Occupation | Male | Female |
| Sales & Related | 1 (20.0%) | 4 (80.0%) |
| Office & Administration | 0 (0.0%) | 16 (100.0%) |
| Total (Category) | 1 (4.8%) | 20 (95.2%) |
| Total (Overall) | 74 (54.0%) | 63 (46.0%) |
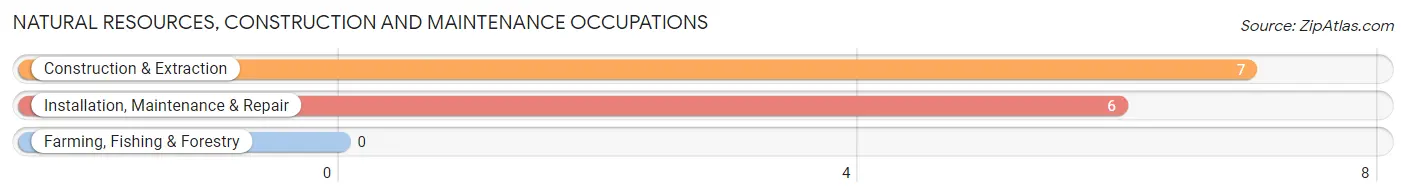
Natural Resources, Construction and Maintenance Occupations
The most common Natural Resources, Construction and Maintenance occupations in Mystic are Construction & Extraction (7 | 5.1%), and Installation, Maintenance & Repair (6 | 4.4%).
Natural Resources, Construction and Maintenance Occupations by Sex
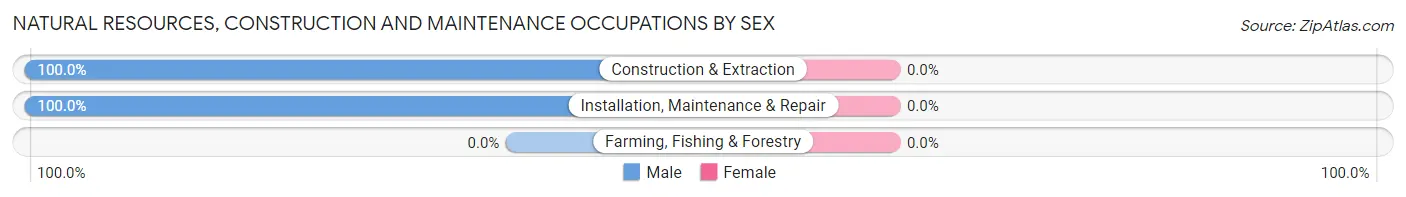
| Occupation | Male | Female |
| Farming, Fishing & Forestry | 0 (0.0%) | 0 (0.0%) |
| Construction & Extraction | 7 (100.0%) | 0 (0.0%) |
| Installation, Maintenance & Repair | 6 (100.0%) | 0 (0.0%) |
| Total (Category) | 13 (100.0%) | 0 (0.0%) |
| Total (Overall) | 74 (54.0%) | 63 (46.0%) |
Production, Transportation and Moving Occupations
The most common Production, Transportation and Moving occupations in Mystic are Production (29 | 21.2%), Material Moving (8 | 5.8%), and Transportation (5 | 3.6%).
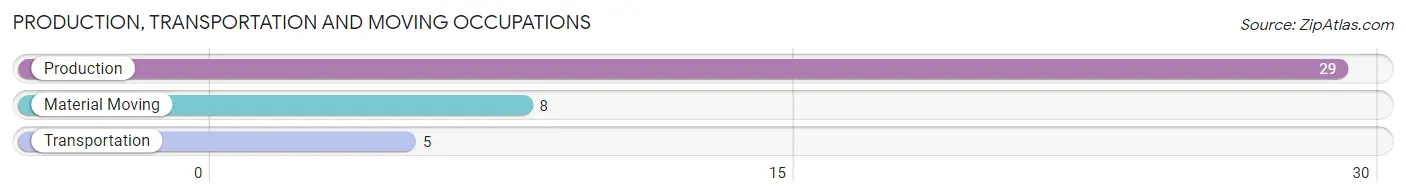
Production, Transportation and Moving Occupations by Sex
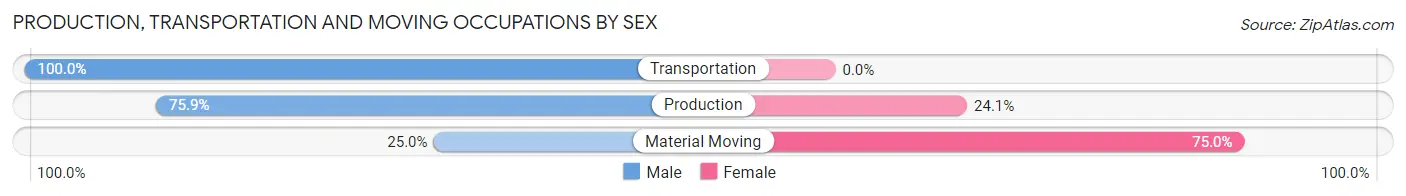
| Occupation | Male | Female |
| Production | 22 (75.9%) | 7 (24.1%) |
| Transportation | 5 (100.0%) | 0 (0.0%) |
| Material Moving | 2 (25.0%) | 6 (75.0%) |
| Total (Category) | 29 (69.1%) | 13 (30.9%) |
| Total (Overall) | 74 (54.0%) | 63 (46.0%) |
Employment Industries by Sex in Mystic
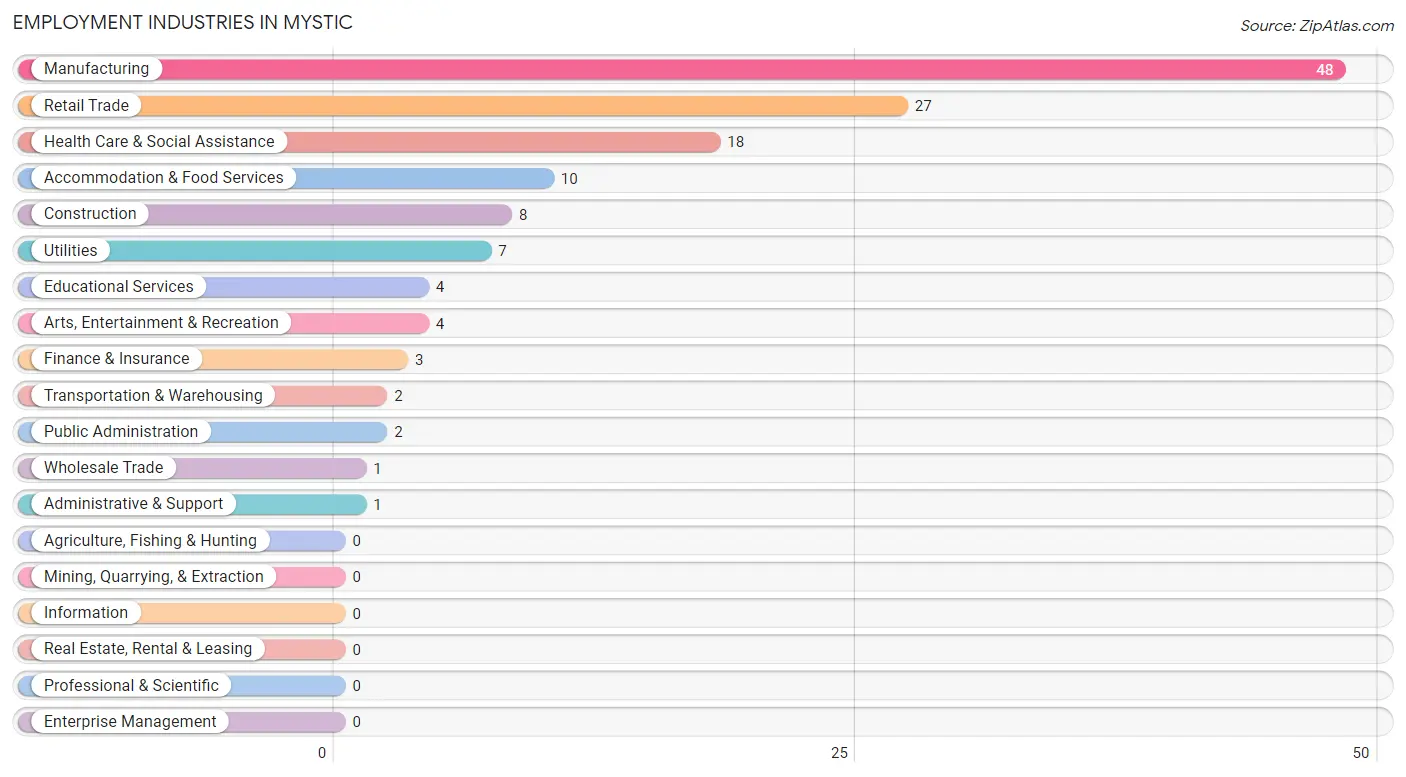
Employment Industries in Mystic
The major employment industries in Mystic include Manufacturing (48 | 35.0%), Retail Trade (27 | 19.7%), Health Care & Social Assistance (18 | 13.1%), Accommodation & Food Services (10 | 7.3%), and Construction (8 | 5.8%).
Employment Industries by Sex in Mystic
The Mystic industries that see more men than women are Construction (100.0%), Wholesale Trade (100.0%), and Transportation & Warehousing (100.0%), whereas the industries that tend to have a higher number of women are Utilities (100.0%), Finance & Insurance (100.0%), and Health Care & Social Assistance (100.0%).
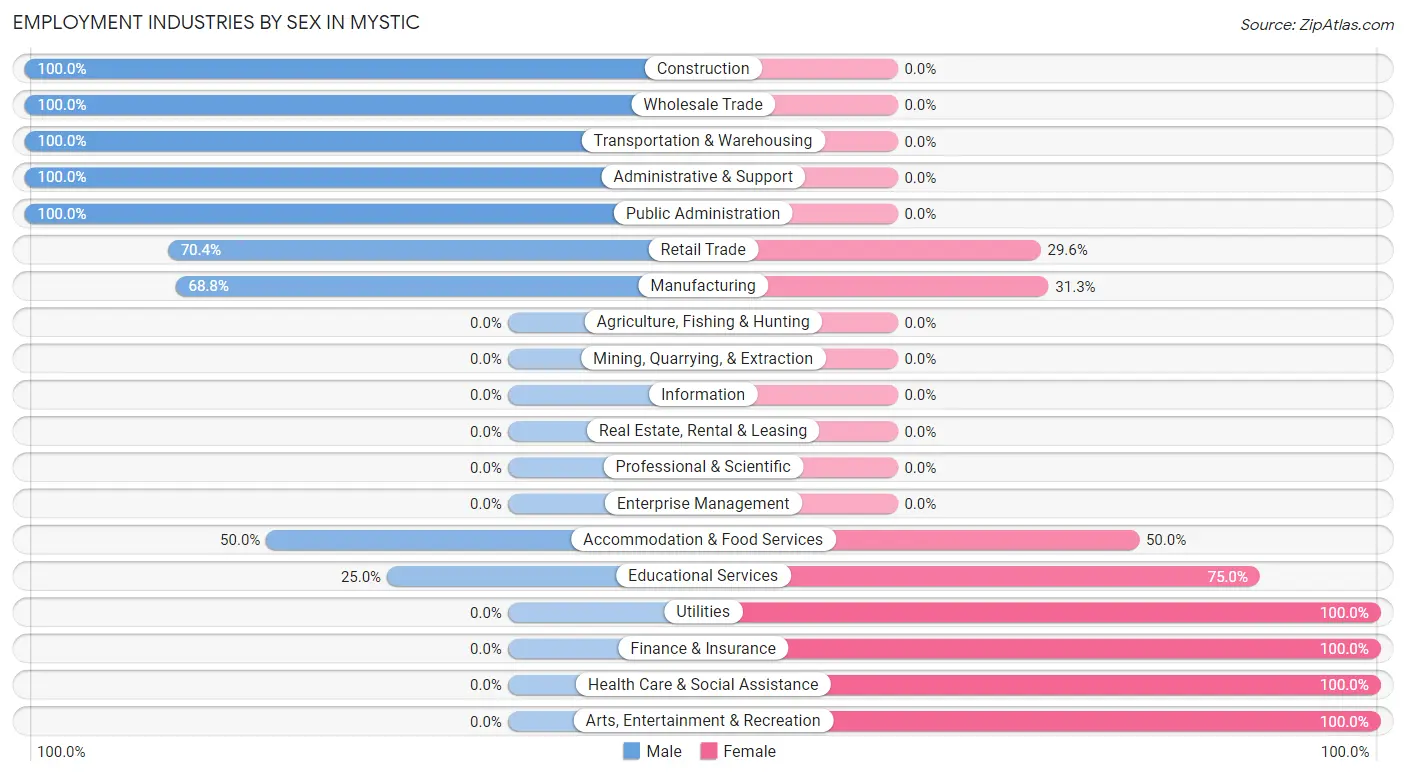
| Industry | Male | Female |
| Agriculture, Fishing & Hunting | 0 (0.0%) | 0 (0.0%) |
| Mining, Quarrying, & Extraction | 0 (0.0%) | 0 (0.0%) |
| Construction | 8 (100.0%) | 0 (0.0%) |
| Manufacturing | 33 (68.8%) | 15 (31.2%) |
| Wholesale Trade | 1 (100.0%) | 0 (0.0%) |
| Retail Trade | 19 (70.4%) | 8 (29.6%) |
| Transportation & Warehousing | 2 (100.0%) | 0 (0.0%) |
| Utilities | 0 (0.0%) | 7 (100.0%) |
| Information | 0 (0.0%) | 0 (0.0%) |
| Finance & Insurance | 0 (0.0%) | 3 (100.0%) |
| Real Estate, Rental & Leasing | 0 (0.0%) | 0 (0.0%) |
| Professional & Scientific | 0 (0.0%) | 0 (0.0%) |
| Enterprise Management | 0 (0.0%) | 0 (0.0%) |
| Administrative & Support | 1 (100.0%) | 0 (0.0%) |
| Educational Services | 1 (25.0%) | 3 (75.0%) |
| Health Care & Social Assistance | 0 (0.0%) | 18 (100.0%) |
| Arts, Entertainment & Recreation | 0 (0.0%) | 4 (100.0%) |
| Accommodation & Food Services | 5 (50.0%) | 5 (50.0%) |
| Public Administration | 2 (100.0%) | 0 (0.0%) |
| Total | 74 (54.0%) | 63 (46.0%) |
Education in Mystic
School Enrollment in Mystic
The most common levels of schooling among the 102 students in Mystic are elementary school (44 | 43.1%), middle school (22 | 21.6%), and kindergarten (18 | 17.6%).
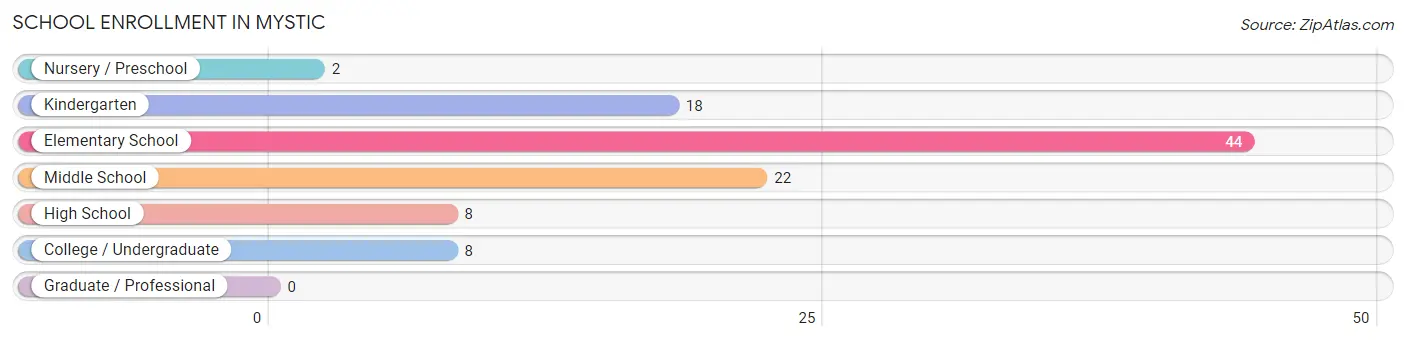
| School Level | # Students | % Students |
| Nursery / Preschool | 2 | 2.0% |
| Kindergarten | 18 | 17.6% |
| Elementary School | 44 | 43.1% |
| Middle School | 22 | 21.6% |
| High School | 8 | 7.8% |
| College / Undergraduate | 8 | 7.8% |
| Graduate / Professional | 0 | 0.0% |
| Total | 102 | 100.0% |
School Enrollment by Age by Funding Source in Mystic
Out of a total of 102 students who are enrolled in schools in Mystic, 3 (2.9%) attend a private institution, while the remaining 99 (97.1%) are enrolled in public schools. The age group of 25 to 34 year olds has the highest likelihood of being enrolled in private schools, with 3 (60.0% in the age bracket) enrolled. Conversely, the age group of 5 to 9 year old has the lowest likelihood of being enrolled in a private school, with 64 (100.0% in the age bracket) attending a public institution.
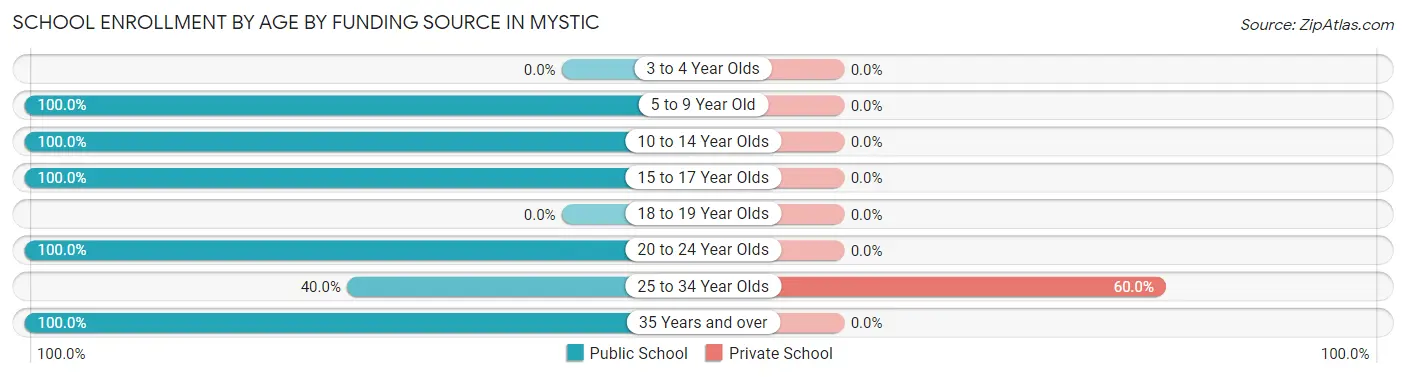
| Age Bracket | Public School | Private School |
| 3 to 4 Year Olds | 0 (0.0%) | 0 (0.0%) |
| 5 to 9 Year Old | 64 (100.0%) | 0 (0.0%) |
| 10 to 14 Year Olds | 22 (100.0%) | 0 (0.0%) |
| 15 to 17 Year Olds | 8 (100.0%) | 0 (0.0%) |
| 18 to 19 Year Olds | 0 (0.0%) | 0 (0.0%) |
| 20 to 24 Year Olds | 2 (100.0%) | 0 (0.0%) |
| 25 to 34 Year Olds | 2 (40.0%) | 3 (60.0%) |
| 35 Years and over | 1 (100.0%) | 0 (0.0%) |
| Total | 99 (97.1%) | 3 (2.9%) |
Educational Attainment by Field of Study in Mystic
Business (2 | 40.0%), education (2 | 40.0%), and bio, nature & agricultural (1 | 20.0%) are the most common fields of study among 5 individuals in Mystic who have obtained a bachelor's degree or higher.
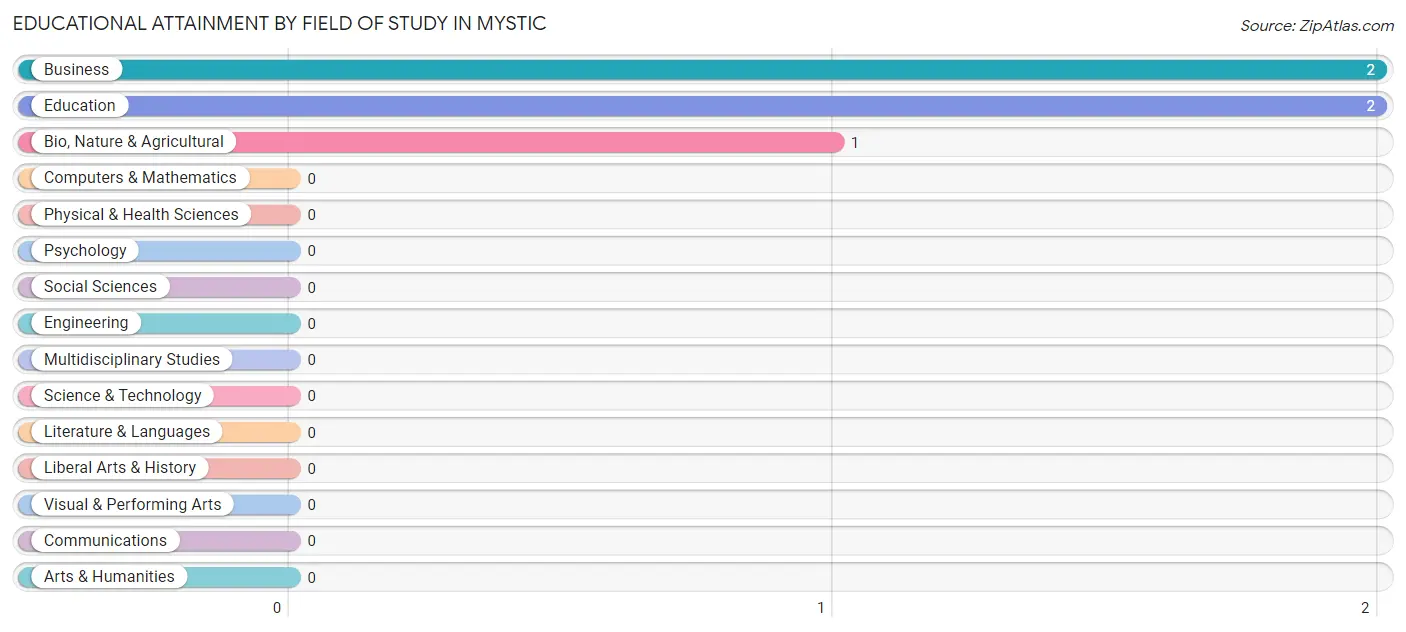
| Field of Study | # Graduates | % Graduates |
| Computers & Mathematics | 0 | 0.0% |
| Bio, Nature & Agricultural | 1 | 20.0% |
| Physical & Health Sciences | 0 | 0.0% |
| Psychology | 0 | 0.0% |
| Social Sciences | 0 | 0.0% |
| Engineering | 0 | 0.0% |
| Multidisciplinary Studies | 0 | 0.0% |
| Science & Technology | 0 | 0.0% |
| Business | 2 | 40.0% |
| Education | 2 | 40.0% |
| Literature & Languages | 0 | 0.0% |
| Liberal Arts & History | 0 | 0.0% |
| Visual & Performing Arts | 0 | 0.0% |
| Communications | 0 | 0.0% |
| Arts & Humanities | 0 | 0.0% |
| Total | 5 | 100.0% |
Transportation & Commute in Mystic
Vehicle Availability by Sex in Mystic
The most prevalent vehicle ownership categories in Mystic are males with 2 vehicles (22, accounting for 29.7%) and females with 2 vehicles (26, making up 36.7%).
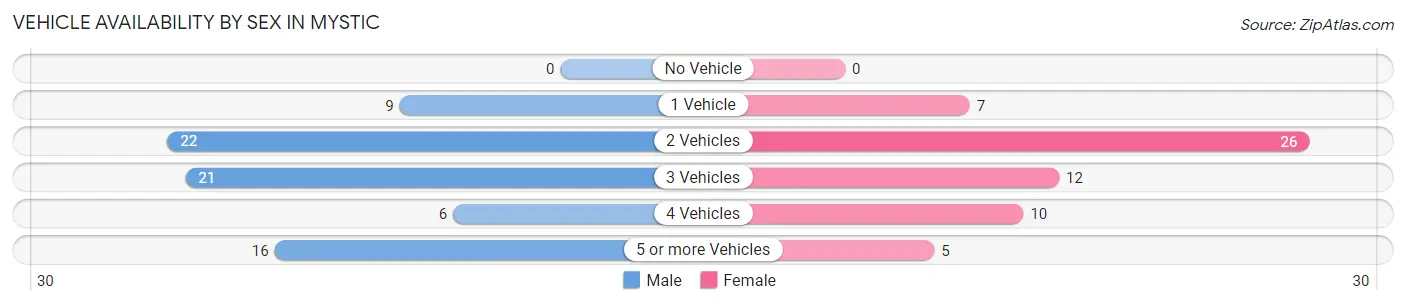
| Vehicles Available | Male | Female |
| No Vehicle | 0 (0.0%) | 0 (0.0%) |
| 1 Vehicle | 9 (12.2%) | 7 (11.7%) |
| 2 Vehicles | 22 (29.7%) | 26 (43.3%) |
| 3 Vehicles | 21 (28.4%) | 12 (20.0%) |
| 4 Vehicles | 6 (8.1%) | 10 (16.7%) |
| 5 or more Vehicles | 16 (21.6%) | 5 (8.3%) |
| Total | 74 (100.0%) | 60 (100.0%) |
Commute Time in Mystic
The most frequently occuring commute durations in Mystic are 15 to 19 minutes (49 commuters, 37.4%), 10 to 14 minutes (27 commuters, 20.6%), and 20 to 24 minutes (13 commuters, 9.9%).
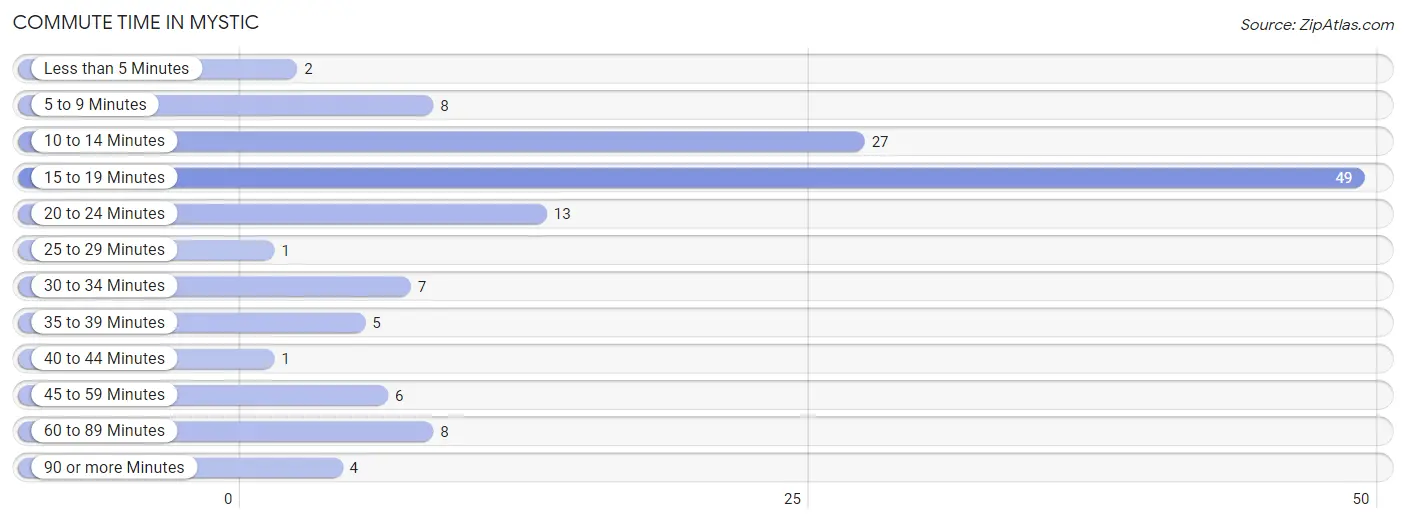
| Commute Time | # Commuters | % Commuters |
| Less than 5 Minutes | 2 | 1.5% |
| 5 to 9 Minutes | 8 | 6.1% |
| 10 to 14 Minutes | 27 | 20.6% |
| 15 to 19 Minutes | 49 | 37.4% |
| 20 to 24 Minutes | 13 | 9.9% |
| 25 to 29 Minutes | 1 | 0.8% |
| 30 to 34 Minutes | 7 | 5.3% |
| 35 to 39 Minutes | 5 | 3.8% |
| 40 to 44 Minutes | 1 | 0.8% |
| 45 to 59 Minutes | 6 | 4.6% |
| 60 to 89 Minutes | 8 | 6.1% |
| 90 or more Minutes | 4 | 3.0% |
Commute Time by Sex in Mystic
The most common commute times in Mystic are 15 to 19 minutes (34 commuters, 46.0%) for males and 10 to 14 minutes (21 commuters, 36.8%) for females.
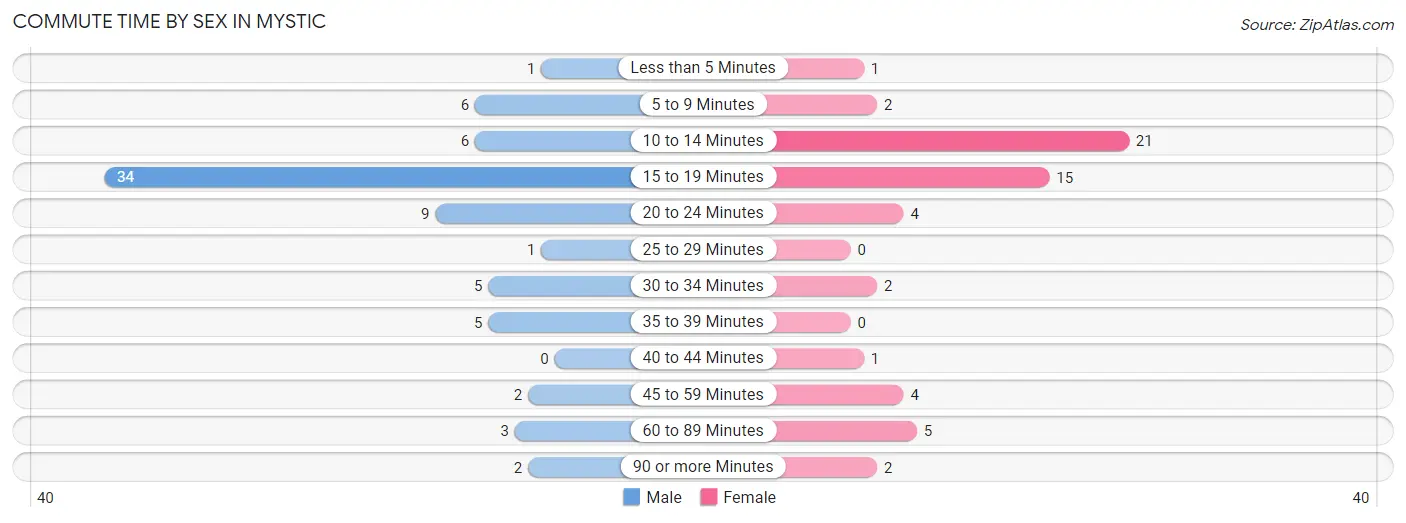
| Commute Time | Male | Female |
| Less than 5 Minutes | 1 (1.3%) | 1 (1.8%) |
| 5 to 9 Minutes | 6 (8.1%) | 2 (3.5%) |
| 10 to 14 Minutes | 6 (8.1%) | 21 (36.8%) |
| 15 to 19 Minutes | 34 (46.0%) | 15 (26.3%) |
| 20 to 24 Minutes | 9 (12.2%) | 4 (7.0%) |
| 25 to 29 Minutes | 1 (1.3%) | 0 (0.0%) |
| 30 to 34 Minutes | 5 (6.8%) | 2 (3.5%) |
| 35 to 39 Minutes | 5 (6.8%) | 0 (0.0%) |
| 40 to 44 Minutes | 0 (0.0%) | 1 (1.8%) |
| 45 to 59 Minutes | 2 (2.7%) | 4 (7.0%) |
| 60 to 89 Minutes | 3 (4.1%) | 5 (8.8%) |
| 90 or more Minutes | 2 (2.7%) | 2 (3.5%) |
Time of Departure to Work by Sex in Mystic
The most frequent times of departure to work in Mystic are 6:30 AM to 6:59 AM (13, 17.6%) for males and 6:30 AM to 6:59 AM (12, 21.0%) for females.
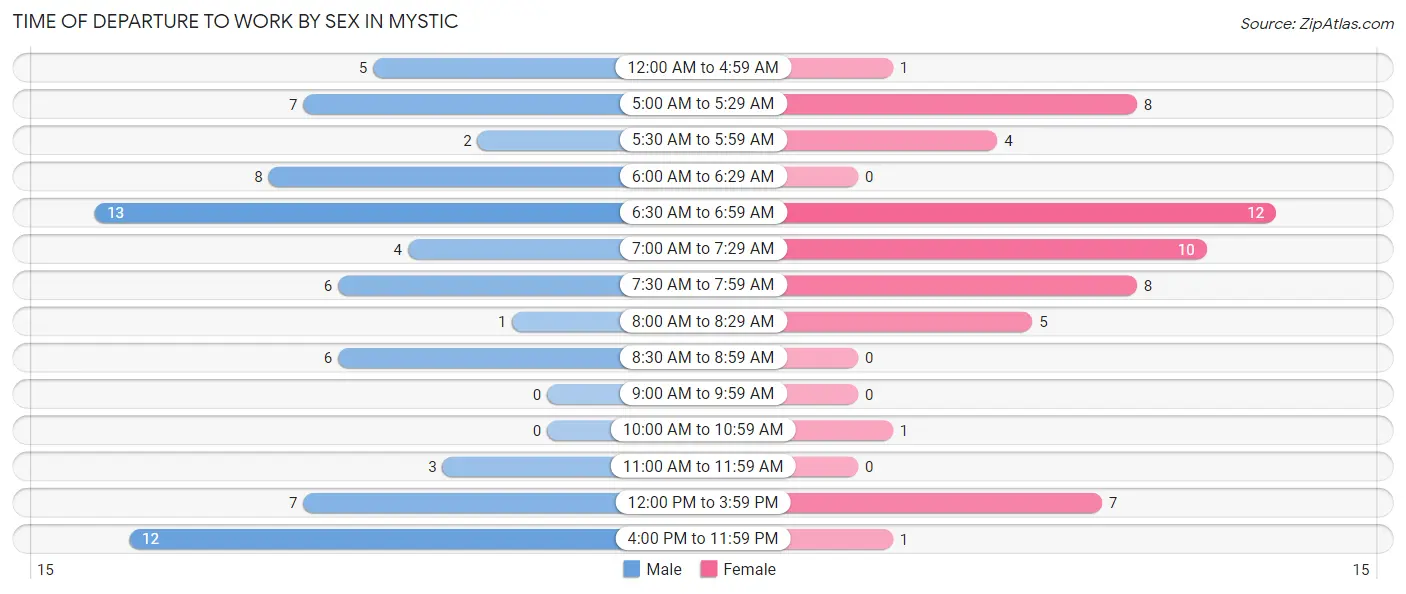
| Time of Departure | Male | Female |
| 12:00 AM to 4:59 AM | 5 (6.8%) | 1 (1.8%) |
| 5:00 AM to 5:29 AM | 7 (9.5%) | 8 (14.0%) |
| 5:30 AM to 5:59 AM | 2 (2.7%) | 4 (7.0%) |
| 6:00 AM to 6:29 AM | 8 (10.8%) | 0 (0.0%) |
| 6:30 AM to 6:59 AM | 13 (17.6%) | 12 (21.0%) |
| 7:00 AM to 7:29 AM | 4 (5.4%) | 10 (17.5%) |
| 7:30 AM to 7:59 AM | 6 (8.1%) | 8 (14.0%) |
| 8:00 AM to 8:29 AM | 1 (1.3%) | 5 (8.8%) |
| 8:30 AM to 8:59 AM | 6 (8.1%) | 0 (0.0%) |
| 9:00 AM to 9:59 AM | 0 (0.0%) | 0 (0.0%) |
| 10:00 AM to 10:59 AM | 0 (0.0%) | 1 (1.8%) |
| 11:00 AM to 11:59 AM | 3 (4.1%) | 0 (0.0%) |
| 12:00 PM to 3:59 PM | 7 (9.5%) | 7 (12.3%) |
| 4:00 PM to 11:59 PM | 12 (16.2%) | 1 (1.8%) |
| Total | 74 (100.0%) | 57 (100.0%) |
Housing Occupancy in Mystic
Occupancy by Ownership in Mystic
Of the total 128 dwellings in Mystic, owner-occupied units account for 104 (81.2%), while renter-occupied units make up 24 (18.8%).
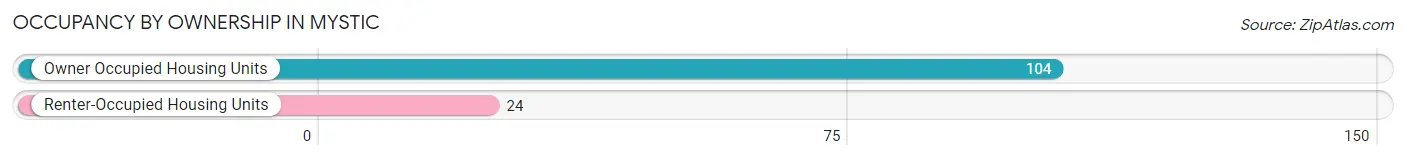
| Occupancy | # Housing Units | % Housing Units |
| Owner Occupied Housing Units | 104 | 81.2% |
| Renter-Occupied Housing Units | 24 | 18.8% |
| Total Occupied Housing Units | 128 | 100.0% |
Occupancy by Household Size in Mystic
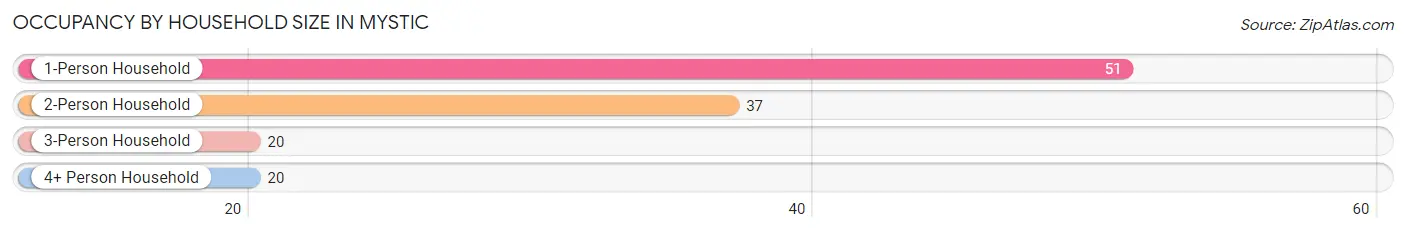
| Household Size | # Housing Units | % Housing Units |
| 1-Person Household | 51 | 39.8% |
| 2-Person Household | 37 | 28.9% |
| 3-Person Household | 20 | 15.6% |
| 4+ Person Household | 20 | 15.6% |
| Total Housing Units | 128 | 100.0% |
Occupancy by Ownership by Household Size in Mystic
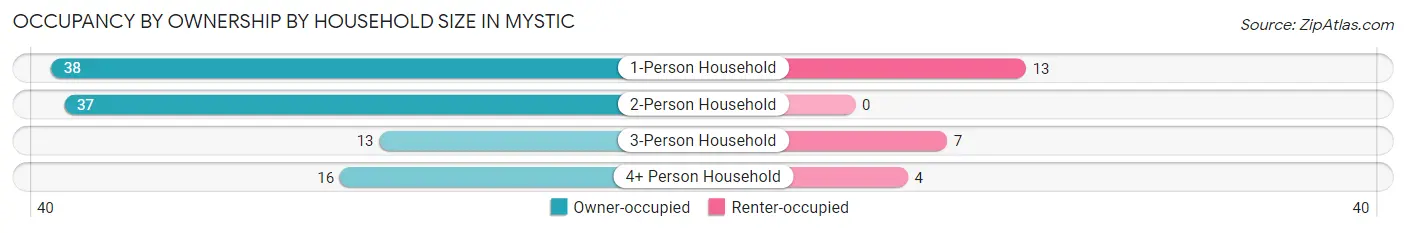
| Household Size | Owner-occupied | Renter-occupied |
| 1-Person Household | 38 (74.5%) | 13 (25.5%) |
| 2-Person Household | 37 (100.0%) | 0 (0.0%) |
| 3-Person Household | 13 (65.0%) | 7 (35.0%) |
| 4+ Person Household | 16 (80.0%) | 4 (20.0%) |
| Total Housing Units | 104 (81.2%) | 24 (18.8%) |
Occupancy by Educational Attainment in Mystic
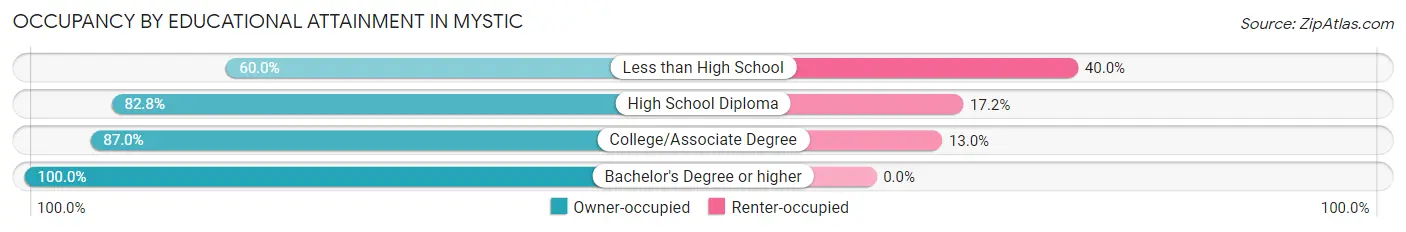
| Household Size | Owner-occupied | Renter-occupied |
| Less than High School | 12 (60.0%) | 8 (40.0%) |
| High School Diploma | 48 (82.8%) | 10 (17.2%) |
| College/Associate Degree | 40 (87.0%) | 6 (13.0%) |
| Bachelor's Degree or higher | 4 (100.0%) | 0 (0.0%) |
Occupancy by Age of Householder in Mystic
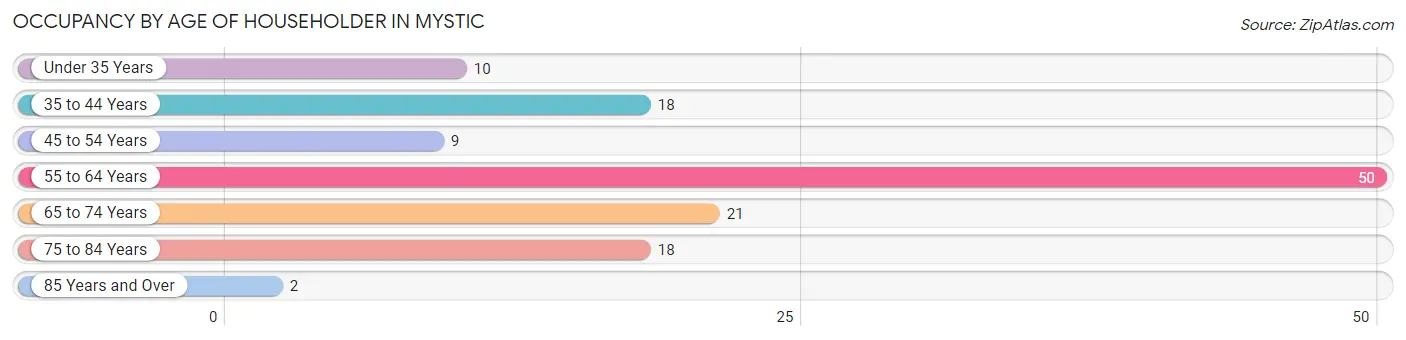
| Age Bracket | # Households | % Households |
| Under 35 Years | 10 | 7.8% |
| 35 to 44 Years | 18 | 14.1% |
| 45 to 54 Years | 9 | 7.0% |
| 55 to 64 Years | 50 | 39.1% |
| 65 to 74 Years | 21 | 16.4% |
| 75 to 84 Years | 18 | 14.1% |
| 85 Years and Over | 2 | 1.6% |
| Total | 128 | 100.0% |
Housing Finances in Mystic
Median Income by Occupancy in Mystic
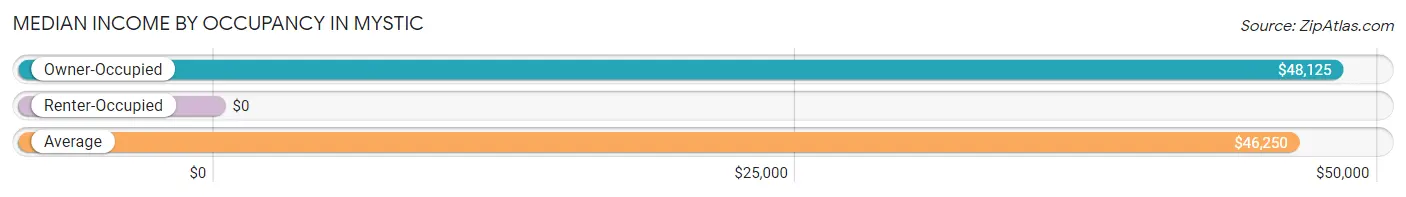
| Occupancy Type | # Households | Median Income |
| Owner-Occupied | 104 (81.2%) | $48,125 |
| Renter-Occupied | 24 (18.8%) | $0 |
| Average | 128 (100.0%) | $46,250 |
Occupancy by Householder Income Bracket in Mystic
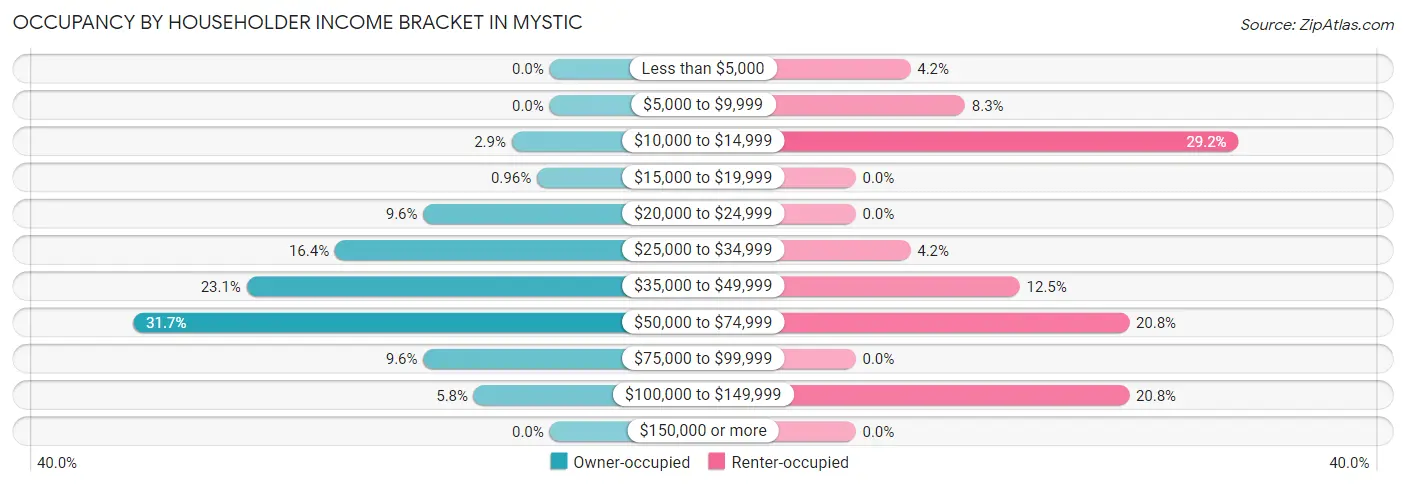
| Income Bracket | Owner-occupied | Renter-occupied |
| Less than $5,000 | 0 (0.0%) | 1 (4.2%) |
| $5,000 to $9,999 | 0 (0.0%) | 2 (8.3%) |
| $10,000 to $14,999 | 3 (2.9%) | 7 (29.2%) |
| $15,000 to $19,999 | 1 (1.0%) | 0 (0.0%) |
| $20,000 to $24,999 | 10 (9.6%) | 0 (0.0%) |
| $25,000 to $34,999 | 17 (16.4%) | 1 (4.2%) |
| $35,000 to $49,999 | 24 (23.1%) | 3 (12.5%) |
| $50,000 to $74,999 | 33 (31.7%) | 5 (20.8%) |
| $75,000 to $99,999 | 10 (9.6%) | 0 (0.0%) |
| $100,000 to $149,999 | 6 (5.8%) | 5 (20.8%) |
| $150,000 or more | 0 (0.0%) | 0 (0.0%) |
| Total | 104 (100.0%) | 24 (100.0%) |
Monthly Housing Cost Tiers in Mystic
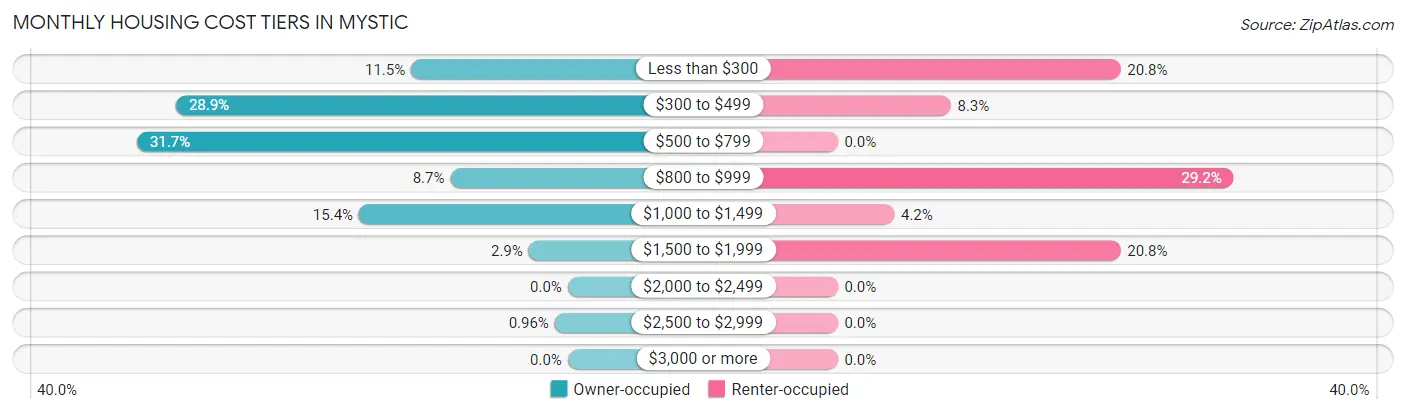
| Monthly Cost | Owner-occupied | Renter-occupied |
| Less than $300 | 12 (11.5%) | 5 (20.8%) |
| $300 to $499 | 30 (28.8%) | 2 (8.3%) |
| $500 to $799 | 33 (31.7%) | 0 (0.0%) |
| $800 to $999 | 9 (8.6%) | 7 (29.2%) |
| $1,000 to $1,499 | 16 (15.4%) | 1 (4.2%) |
| $1,500 to $1,999 | 3 (2.9%) | 5 (20.8%) |
| $2,000 to $2,499 | 0 (0.0%) | 0 (0.0%) |
| $2,500 to $2,999 | 1 (1.0%) | 0 (0.0%) |
| $3,000 or more | 0 (0.0%) | 0 (0.0%) |
| Total | 104 (100.0%) | 24 (100.0%) |
Physical Housing Characteristics in Mystic
Housing Structures in Mystic
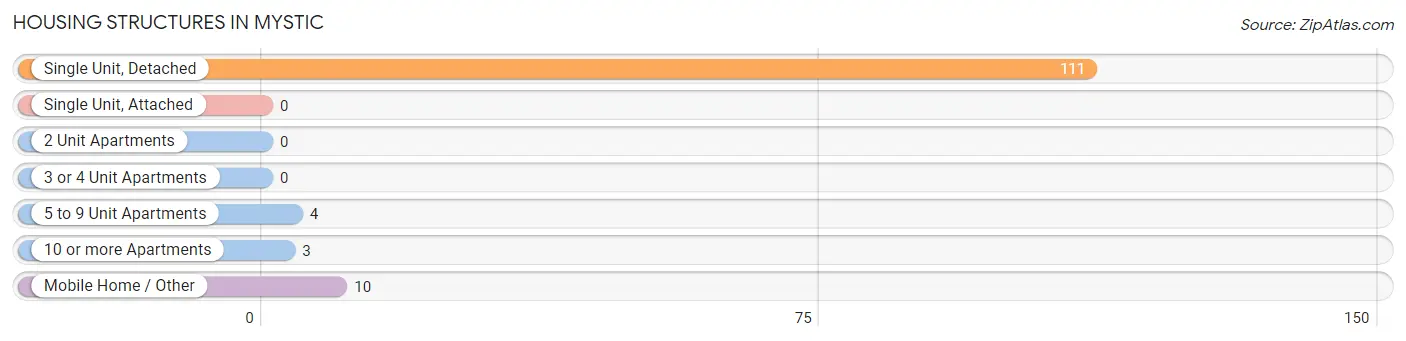
| Structure Type | # Housing Units | % Housing Units |
| Single Unit, Detached | 111 | 86.7% |
| Single Unit, Attached | 0 | 0.0% |
| 2 Unit Apartments | 0 | 0.0% |
| 3 or 4 Unit Apartments | 0 | 0.0% |
| 5 to 9 Unit Apartments | 4 | 3.1% |
| 10 or more Apartments | 3 | 2.3% |
| Mobile Home / Other | 10 | 7.8% |
| Total | 128 | 100.0% |
Housing Structures by Occupancy in Mystic
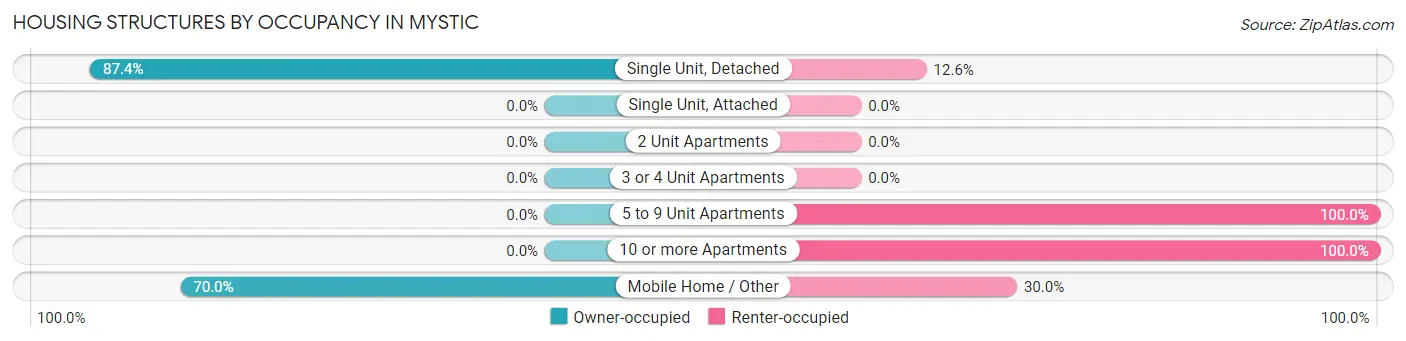
| Structure Type | Owner-occupied | Renter-occupied |
| Single Unit, Detached | 97 (87.4%) | 14 (12.6%) |
| Single Unit, Attached | 0 (0.0%) | 0 (0.0%) |
| 2 Unit Apartments | 0 (0.0%) | 0 (0.0%) |
| 3 or 4 Unit Apartments | 0 (0.0%) | 0 (0.0%) |
| 5 to 9 Unit Apartments | 0 (0.0%) | 4 (100.0%) |
| 10 or more Apartments | 0 (0.0%) | 3 (100.0%) |
| Mobile Home / Other | 7 (70.0%) | 3 (30.0%) |
| Total | 104 (81.2%) | 24 (18.8%) |
Housing Structures by Number of Rooms in Mystic
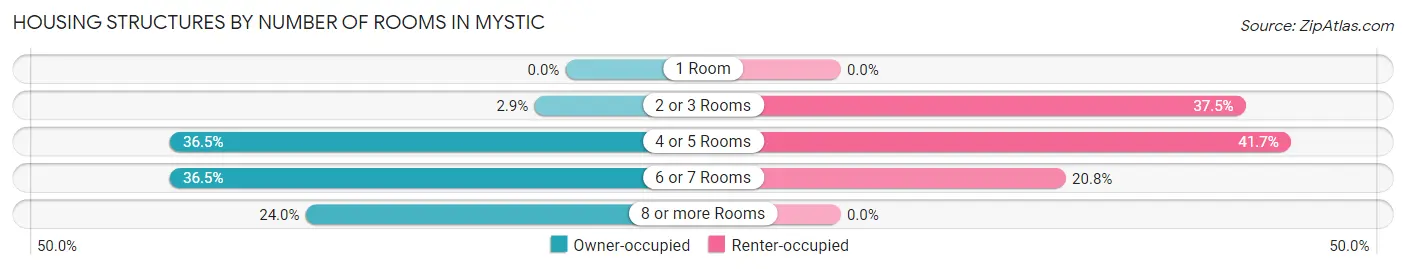
| Number of Rooms | Owner-occupied | Renter-occupied |
| 1 Room | 0 (0.0%) | 0 (0.0%) |
| 2 or 3 Rooms | 3 (2.9%) | 9 (37.5%) |
| 4 or 5 Rooms | 38 (36.5%) | 10 (41.7%) |
| 6 or 7 Rooms | 38 (36.5%) | 5 (20.8%) |
| 8 or more Rooms | 25 (24.0%) | 0 (0.0%) |
| Total | 104 (100.0%) | 24 (100.0%) |
Housing Structure by Heating Type in Mystic
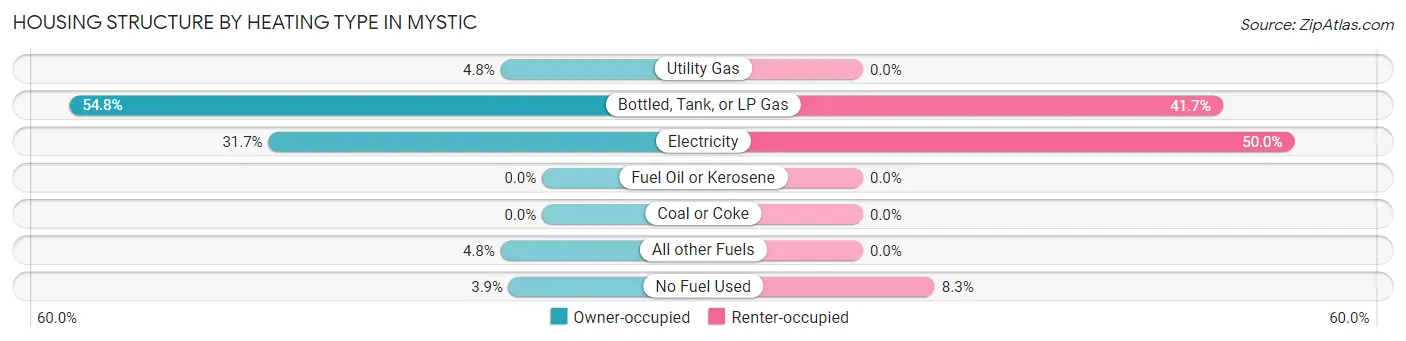
| Heating Type | Owner-occupied | Renter-occupied |
| Utility Gas | 5 (4.8%) | 0 (0.0%) |
| Bottled, Tank, or LP Gas | 57 (54.8%) | 10 (41.7%) |
| Electricity | 33 (31.7%) | 12 (50.0%) |
| Fuel Oil or Kerosene | 0 (0.0%) | 0 (0.0%) |
| Coal or Coke | 0 (0.0%) | 0 (0.0%) |
| All other Fuels | 5 (4.8%) | 0 (0.0%) |
| No Fuel Used | 4 (3.8%) | 2 (8.3%) |
| Total | 104 (100.0%) | 24 (100.0%) |
Household Vehicle Usage in Mystic
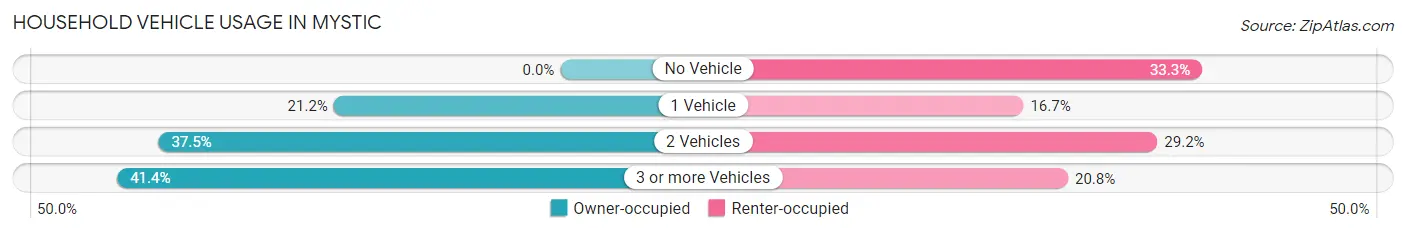
| Vehicles per Household | Owner-occupied | Renter-occupied |
| No Vehicle | 0 (0.0%) | 8 (33.3%) |
| 1 Vehicle | 22 (21.1%) | 4 (16.7%) |
| 2 Vehicles | 39 (37.5%) | 7 (29.2%) |
| 3 or more Vehicles | 43 (41.3%) | 5 (20.8%) |
| Total | 104 (100.0%) | 24 (100.0%) |
Real Estate & Mortgages in Mystic
Real Estate and Mortgage Overview in Mystic
| Characteristic | Without Mortgage | With Mortgage |
| Housing Units | 72 | 32 |
| Median Property Value | $53,300 | $97,500 |
| Median Household Income | $46,250 | $0 |
| Monthly Housing Costs | $490 | $0 |
| Real Estate Taxes | $942 | $0 |
Property Value by Mortgage Status in Mystic
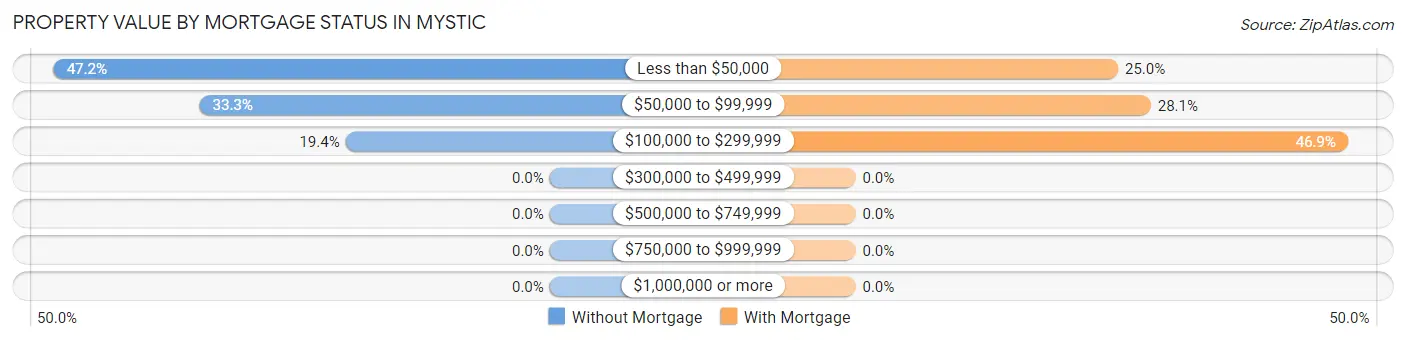
| Property Value | Without Mortgage | With Mortgage |
| Less than $50,000 | 34 (47.2%) | 8 (25.0%) |
| $50,000 to $99,999 | 24 (33.3%) | 9 (28.1%) |
| $100,000 to $299,999 | 14 (19.4%) | 15 (46.9%) |
| $300,000 to $499,999 | 0 (0.0%) | 0 (0.0%) |
| $500,000 to $749,999 | 0 (0.0%) | 0 (0.0%) |
| $750,000 to $999,999 | 0 (0.0%) | 0 (0.0%) |
| $1,000,000 or more | 0 (0.0%) | 0 (0.0%) |
| Total | 72 (100.0%) | 32 (100.0%) |
Household Income by Mortgage Status in Mystic
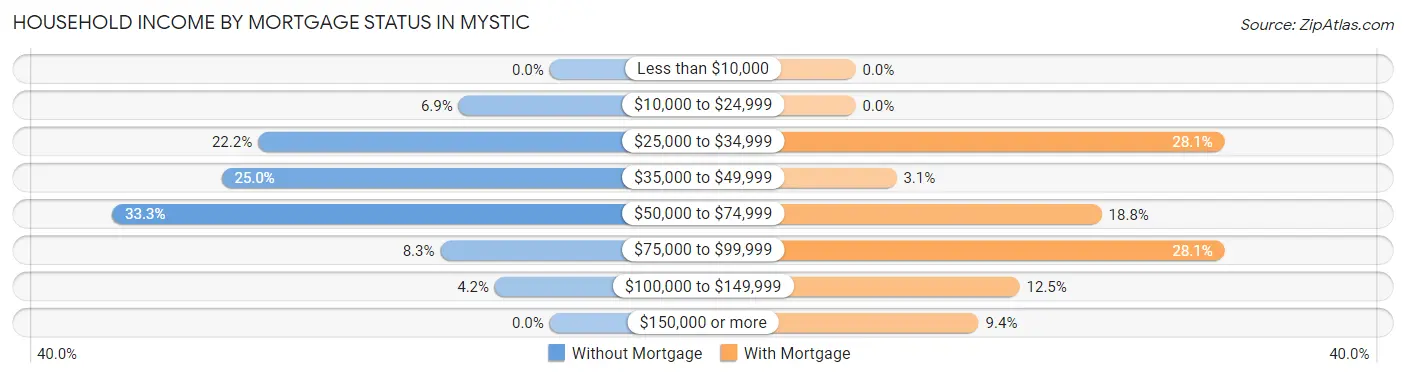
| Household Income | Without Mortgage | With Mortgage |
| Less than $10,000 | 0 (0.0%) | 0 (0.0%) |
| $10,000 to $24,999 | 5 (6.9%) | 0 (0.0%) |
| $25,000 to $34,999 | 16 (22.2%) | 9 (28.1%) |
| $35,000 to $49,999 | 18 (25.0%) | 1 (3.1%) |
| $50,000 to $74,999 | 24 (33.3%) | 6 (18.8%) |
| $75,000 to $99,999 | 6 (8.3%) | 9 (28.1%) |
| $100,000 to $149,999 | 3 (4.2%) | 4 (12.5%) |
| $150,000 or more | 0 (0.0%) | 3 (9.4%) |
| Total | 72 (100.0%) | 32 (100.0%) |
Property Value to Household Income Ratio in Mystic
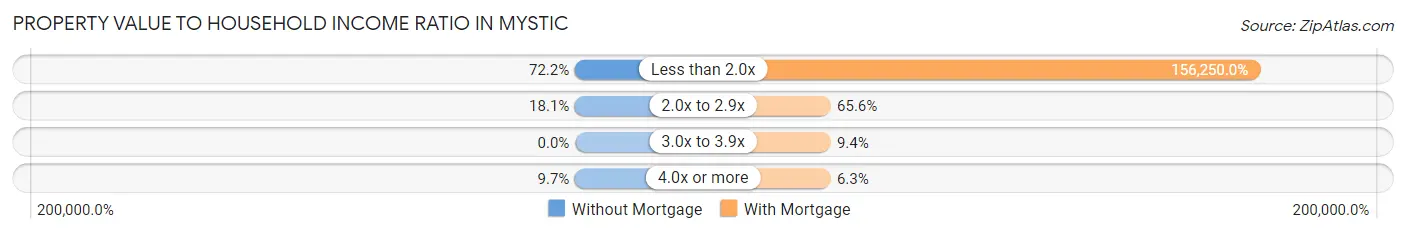
| Value-to-Income Ratio | Without Mortgage | With Mortgage |
| Less than 2.0x | 52 (72.2%) | 50,000 (156,250.0%) |
| 2.0x to 2.9x | 13 (18.1%) | 21 (65.6%) |
| 3.0x to 3.9x | 0 (0.0%) | 3 (9.4%) |
| 4.0x or more | 7 (9.7%) | 2 (6.2%) |
| Total | 72 (100.0%) | 32 (100.0%) |
Real Estate Taxes by Mortgage Status in Mystic
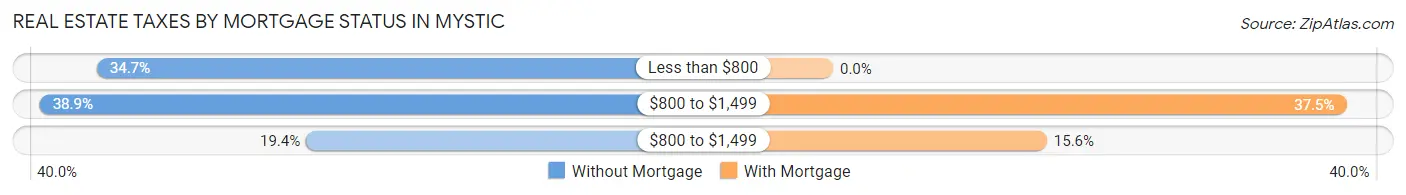
| Property Taxes | Without Mortgage | With Mortgage |
| Less than $800 | 25 (34.7%) | 0 (0.0%) |
| $800 to $1,499 | 28 (38.9%) | 12 (37.5%) |
| $800 to $1,499 | 14 (19.4%) | 5 (15.6%) |
| Total | 72 (100.0%) | 32 (100.0%) |
Health & Disability in Mystic
Health Insurance Coverage by Age in Mystic
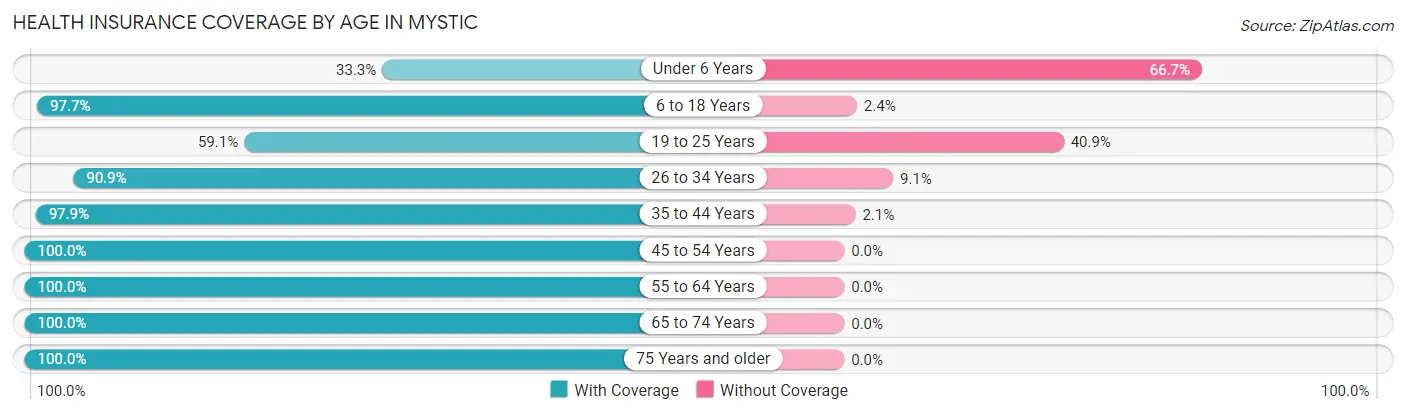
| Age Bracket | With Coverage | Without Coverage |
| Under 6 Years | 7 (33.3%) | 14 (66.7%) |
| 6 to 18 Years | 83 (97.7%) | 2 (2.4%) |
| 19 to 25 Years | 13 (59.1%) | 9 (40.9%) |
| 26 to 34 Years | 20 (90.9%) | 2 (9.1%) |
| 35 to 44 Years | 47 (97.9%) | 1 (2.1%) |
| 45 to 54 Years | 18 (100.0%) | 0 (0.0%) |
| 55 to 64 Years | 66 (100.0%) | 0 (0.0%) |
| 65 to 74 Years | 32 (100.0%) | 0 (0.0%) |
| 75 Years and older | 21 (100.0%) | 0 (0.0%) |
| Total | 307 (91.6%) | 28 (8.4%) |
Health Insurance Coverage by Citizenship Status in Mystic
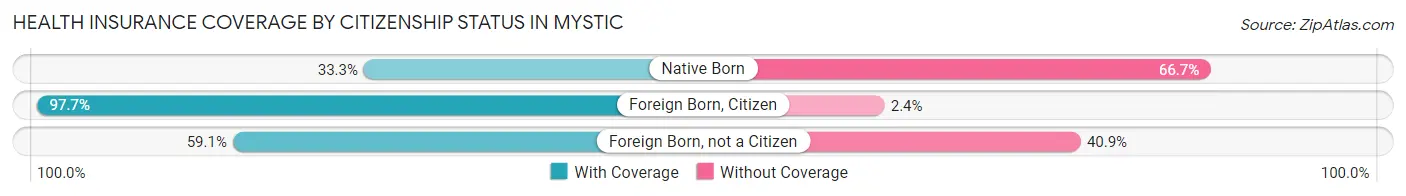
| Citizenship Status | With Coverage | Without Coverage |
| Native Born | 7 (33.3%) | 14 (66.7%) |
| Foreign Born, Citizen | 83 (97.7%) | 2 (2.4%) |
| Foreign Born, not a Citizen | 13 (59.1%) | 9 (40.9%) |
Health Insurance Coverage by Household Income in Mystic
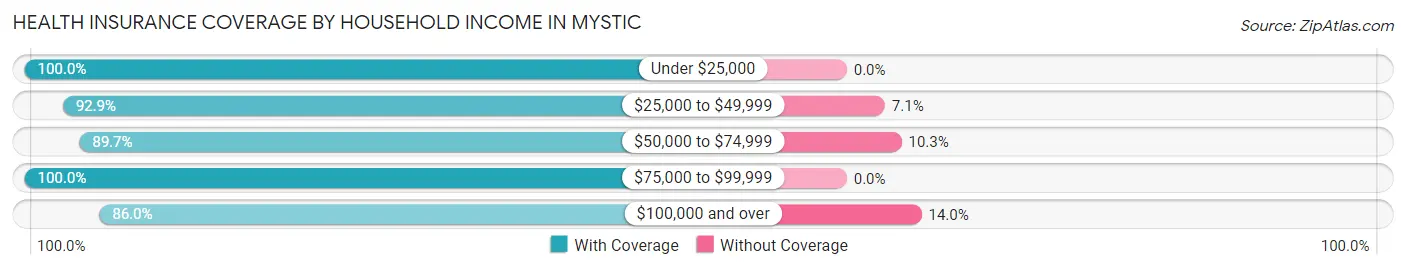
| Household Income | With Coverage | Without Coverage |
| Under $25,000 | 27 (100.0%) | 0 (0.0%) |
| $25,000 to $49,999 | 65 (92.9%) | 5 (7.1%) |
| $50,000 to $74,999 | 140 (89.7%) | 16 (10.3%) |
| $75,000 to $99,999 | 32 (100.0%) | 0 (0.0%) |
| $100,000 and over | 43 (86.0%) | 7 (14.0%) |
Public vs Private Health Insurance Coverage by Age in Mystic
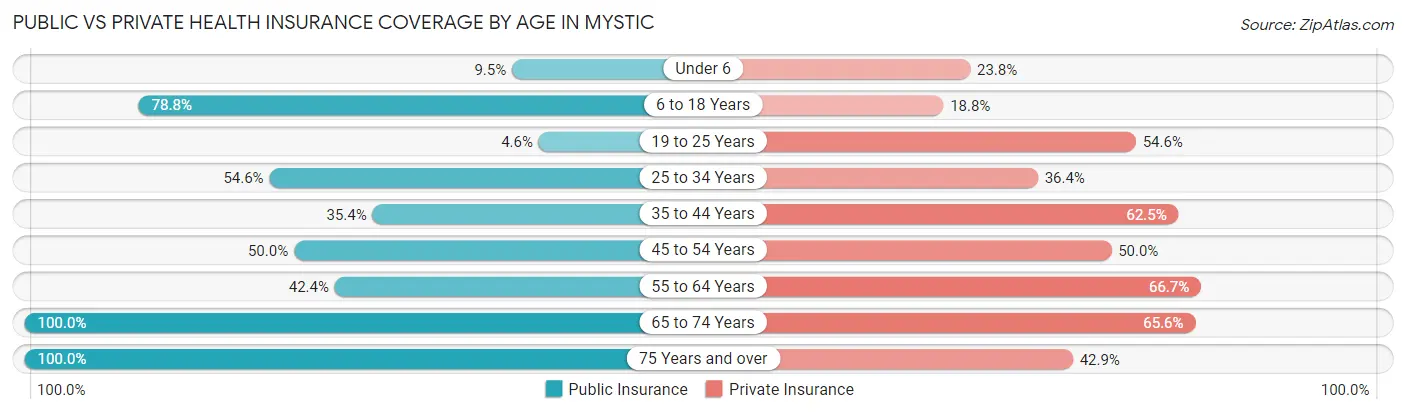
| Age Bracket | Public Insurance | Private Insurance |
| Under 6 | 2 (9.5%) | 5 (23.8%) |
| 6 to 18 Years | 67 (78.8%) | 16 (18.8%) |
| 19 to 25 Years | 1 (4.5%) | 12 (54.5%) |
| 25 to 34 Years | 12 (54.5%) | 8 (36.4%) |
| 35 to 44 Years | 17 (35.4%) | 30 (62.5%) |
| 45 to 54 Years | 9 (50.0%) | 9 (50.0%) |
| 55 to 64 Years | 28 (42.4%) | 44 (66.7%) |
| 65 to 74 Years | 32 (100.0%) | 21 (65.6%) |
| 75 Years and over | 21 (100.0%) | 9 (42.9%) |
| Total | 189 (56.4%) | 154 (46.0%) |
Disability Status by Sex by Age in Mystic
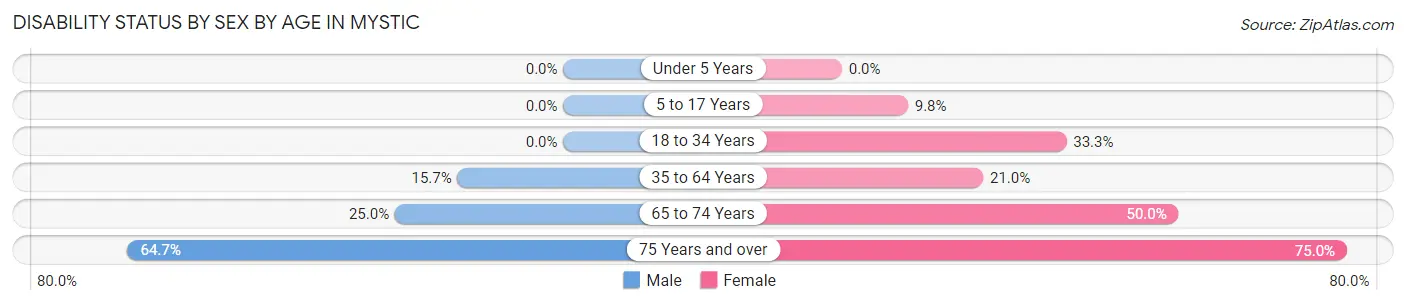
| Age Bracket | Male | Female |
| Under 5 Years | 0 (0.0%) | 0 (0.0%) |
| 5 to 17 Years | 0 (0.0%) | 5 (9.8%) |
| 18 to 34 Years | 0 (0.0%) | 7 (33.3%) |
| 35 to 64 Years | 11 (15.7%) | 13 (21.0%) |
| 65 to 74 Years | 5 (25.0%) | 6 (50.0%) |
| 75 Years and over | 11 (64.7%) | 3 (75.0%) |
Disability Class by Sex by Age in Mystic
Disability Class: Hearing Difficulty
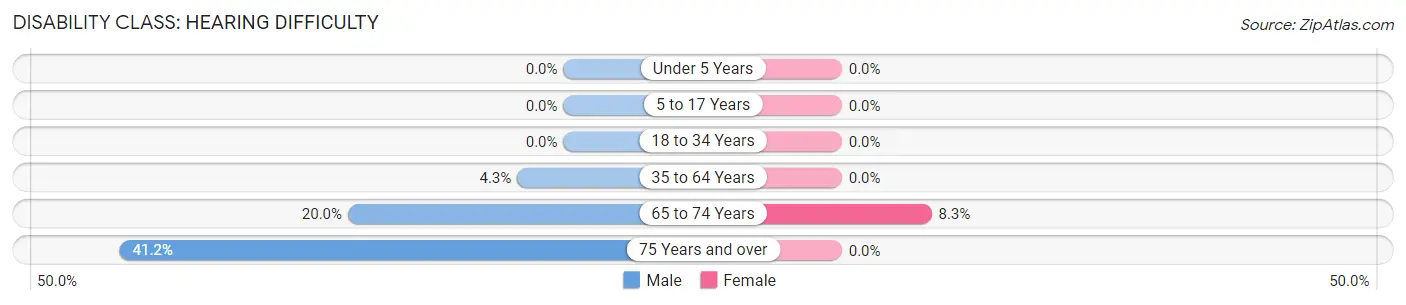
| Age Bracket | Male | Female |
| Under 5 Years | 0 (0.0%) | 0 (0.0%) |
| 5 to 17 Years | 0 (0.0%) | 0 (0.0%) |
| 18 to 34 Years | 0 (0.0%) | 0 (0.0%) |
| 35 to 64 Years | 3 (4.3%) | 0 (0.0%) |
| 65 to 74 Years | 4 (20.0%) | 1 (8.3%) |
| 75 Years and over | 7 (41.2%) | 0 (0.0%) |
Disability Class: Vision Difficulty
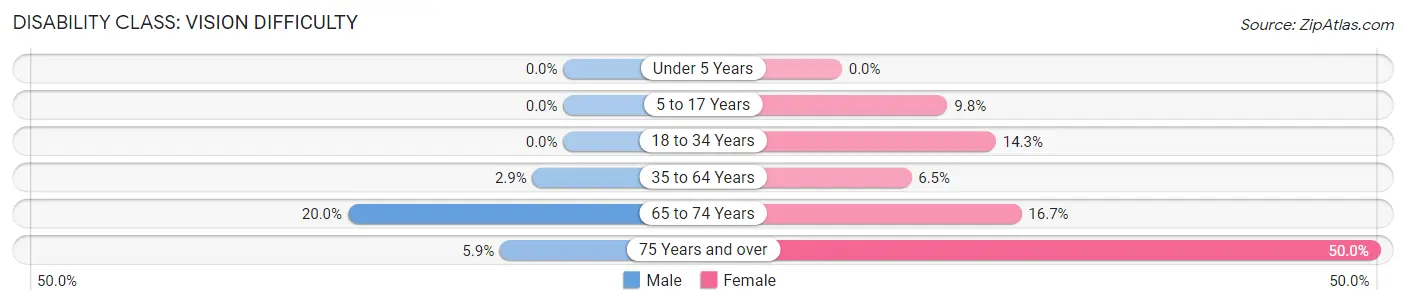
| Age Bracket | Male | Female |
| Under 5 Years | 0 (0.0%) | 0 (0.0%) |
| 5 to 17 Years | 0 (0.0%) | 5 (9.8%) |
| 18 to 34 Years | 0 (0.0%) | 3 (14.3%) |
| 35 to 64 Years | 2 (2.9%) | 4 (6.5%) |
| 65 to 74 Years | 4 (20.0%) | 2 (16.7%) |
| 75 Years and over | 1 (5.9%) | 2 (50.0%) |
Disability Class: Cognitive Difficulty
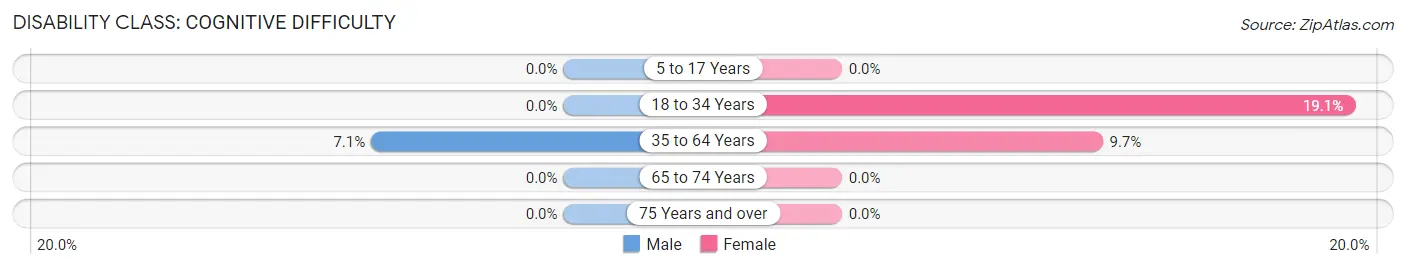
| Age Bracket | Male | Female |
| 5 to 17 Years | 0 (0.0%) | 0 (0.0%) |
| 18 to 34 Years | 0 (0.0%) | 4 (19.1%) |
| 35 to 64 Years | 5 (7.1%) | 6 (9.7%) |
| 65 to 74 Years | 0 (0.0%) | 0 (0.0%) |
| 75 Years and over | 0 (0.0%) | 0 (0.0%) |
Disability Class: Ambulatory Difficulty
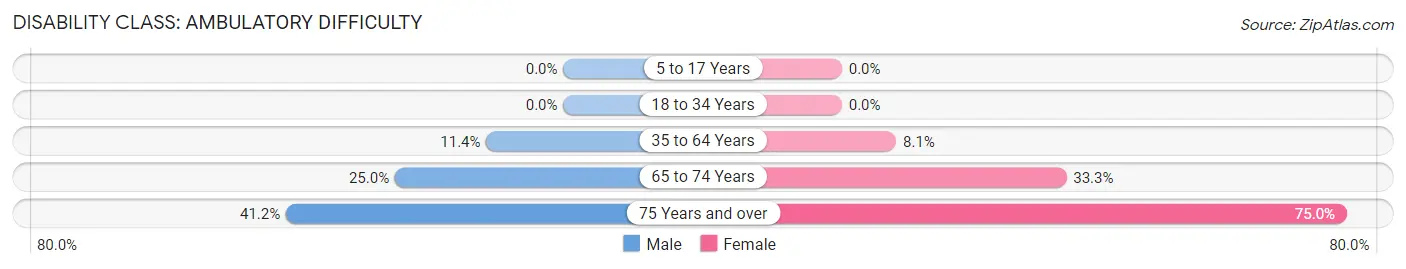
| Age Bracket | Male | Female |
| 5 to 17 Years | 0 (0.0%) | 0 (0.0%) |
| 18 to 34 Years | 0 (0.0%) | 0 (0.0%) |
| 35 to 64 Years | 8 (11.4%) | 5 (8.1%) |
| 65 to 74 Years | 5 (25.0%) | 4 (33.3%) |
| 75 Years and over | 7 (41.2%) | 3 (75.0%) |
Disability Class: Self-Care Difficulty
| Age Bracket | Male | Female |
| 5 to 17 Years | 0 (0.0%) | 0 (0.0%) |
| 18 to 34 Years | 0 (0.0%) | 0 (0.0%) |
| 35 to 64 Years | 1 (1.4%) | 6 (9.7%) |
| 65 to 74 Years | 0 (0.0%) | 0 (0.0%) |
| 75 Years and over | 0 (0.0%) | 0 (0.0%) |
Technology Access in Mystic
Computing Device Access in Mystic
| Device Type | # Households | % Households |
| Desktop or Laptop | 93 | 72.7% |
| Smartphone | 97 | 75.8% |
| Tablet | 43 | 33.6% |
| No Computing Device | 17 | 13.3% |
| Total | 128 | 100.0% |
Internet Access in Mystic
| Internet Type | # Households | % Households |
| Dial-Up Internet | 4 | 3.1% |
| Broadband Home | 61 | 47.7% |
| Cellular Data Only | 13 | 10.2% |
| Satellite Internet | 10 | 7.8% |
| No Internet | 36 | 28.1% |
| Total | 128 | 100.0% |
Mystic Summary
Mystic, Iowa is a small town located in Appanoose County in the southeastern part of the state. It is situated along the Chariton River, about 20 miles south of the county seat of Centerville. The population of Mystic was estimated to be 545 in the year 2000, making it one of the smallest towns in the county.
History
Mystic was founded in 1854 by a group of settlers from Ohio. The town was named after the nearby Mystic Creek, which was named by a local Native American tribe. The town was originally a farming community, but it soon developed into a small manufacturing center. The first industry in Mystic was a sawmill, which was built in 1856. This was followed by a grist mill, a woolen mill, and a brickyard.
In the late 19th century, Mystic was a thriving community with a population of over 1,000. It had several churches, a school, a bank, a newspaper, and a variety of stores and businesses. The town was also home to a number of fraternal organizations, including the Odd Fellows, the Masons, and the Knights of Pythias.
Geography
Mystic is located in the southeastern part of Appanoose County, about 20 miles south of the county seat of Centerville. The town is situated along the Chariton River, which flows through the center of town. The terrain around Mystic is mostly flat, with some rolling hills in the surrounding area. The town is located in the Central Lowland region of Iowa, which is characterized by fertile soils and abundant rainfall.
Economy
Mystic’s economy is largely based on agriculture. The town is home to several farms, which produce a variety of crops, including corn, soybeans, and hay. The town also has a few small businesses, including a grocery store, a hardware store, and a restaurant.
Demographics
As of the 2000 census, the population of Mystic was 545. The racial makeup of the town was 97.3% White, 0.2% African American, 0.2% Native American, 0.4% Asian, 0.2% from other races, and 1.7% from two or more races. Hispanic or Latino of any race were 0.7% of the population.
The median income for a household in Mystic was $35,625, and the median income for a family was $41,250. The per capita income for the town was $17,845. About 11.2% of families and 13.2% of the population were below the poverty line, including 16.7% of those under age 18 and 8.3% of those age 65 or over.
Mystic is a small town with a rich history and a strong agricultural economy. It is a peaceful and friendly community, with a population that is largely white and of middle-class income. The town is a great place to live and work, and it offers a variety of amenities and activities for its residents.
Common Questions
What is Per Capita Income in Mystic?
Per Capita income in Mystic is $20,811.
What is the Median Family Income in Mystic?
Median Family Income in Mystic is $58,438.
What is the Median Household income in Mystic?
Median Household Income in Mystic is $46,250.
What is Income or Wage Gap in Mystic?
Income or Wage Gap in Mystic is 1.0%.
Women in Mystic earn 99.0 cents for every dollar earned by a man.
What is Inequality or Gini Index in Mystic?
Inequality or Gini Index in Mystic is 0.31.
What is the Total Population of Mystic?
Total Population of Mystic is 335.
What is the Total Male Population of Mystic?
Total Male Population of Mystic is 185.
What is the Total Female Population of Mystic?
Total Female Population of Mystic is 150.
What is the Ratio of Males per 100 Females in Mystic?
There are 123.33 Males per 100 Females in Mystic.
What is the Ratio of Females per 100 Males in Mystic?
There are 81.08 Females per 100 Males in Mystic.
What is the Median Population Age in Mystic?
Median Population Age in Mystic is 37.1 Years.
What is the Average Family Size in Mystic
Average Family Size in Mystic is 3.6 People.
What is the Average Household Size in Mystic
Average Household Size in Mystic is 2.6 People.
How Large is the Labor Force in Mystic?
There are 147 People in the Labor Forcein in Mystic.
What is the Percentage of People in the Labor Force in Mystic?
62.3% of People are in the Labor Force in Mystic.
What is the Unemployment Rate in Mystic?
Unemployment Rate in Mystic is 6.8%.