Mount Pleasant, IA Map & Demographics
Mount Pleasant Map
Mount Pleasant Overview
$27,116
PER CAPITA INCOME
$73,651
AVG FAMILY INCOME
$58,895
AVG HOUSEHOLD INCOME
36.0%
WAGE / INCOME GAP [ % ]
64.0¢/ $1
WAGE / INCOME GAP [ $ ]
0.40
INEQUALITY / GINI INDEX
9,214
TOTAL POPULATION
5,129
MALE POPULATION
4,085
FEMALE POPULATION
125.56
MALES / 100 FEMALES
79.65
FEMALES / 100 MALES
36.5
MEDIAN AGE
2.9
AVG FAMILY SIZE
2.4
AVG HOUSEHOLD SIZE
4,448
LABOR FORCE [ PEOPLE ]
56.5%
PERCENT IN LABOR FORCE
2.7%
UNEMPLOYMENT RATE
Mount Pleasant Zip Codes
Mount Pleasant Area Codes
Income in Mount Pleasant
Income Overview in Mount Pleasant
Per Capita Income in Mount Pleasant is $27,116, while median incomes of families and households are $73,651 and $58,895 respectively.
| Characteristic | Number | Measure |
| Per Capita Income | 9,214 | $27,116 |
| Median Family Income | 2,119 | $73,651 |
| Mean Family Income | 2,119 | $87,422 |
| Median Household Income | 3,294 | $58,895 |
| Mean Household Income | 3,294 | $71,801 |
| Income Deficit | 2,119 | $0 |
| Wage / Income Gap (%) | 9,214 | 36.02% |
| Wage / Income Gap ($) | 9,214 | 63.98¢ per $1 |
| Gini / Inequality Index | 9,214 | 0.40 |
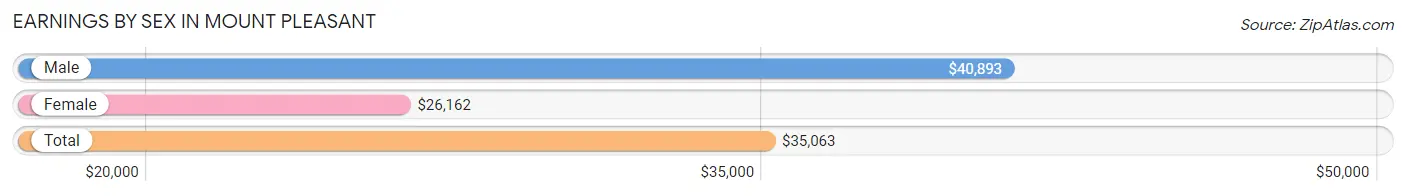
Earnings by Sex in Mount Pleasant
Average Earnings in Mount Pleasant are $35,063, $40,893 for men and $26,162 for women, a difference of 36.0%.
| Sex | Number | Average Earnings |
| Male | 2,664 (55.4%) | $40,893 |
| Female | 2,146 (44.6%) | $26,162 |
| Total | 4,810 (100.0%) | $35,063 |
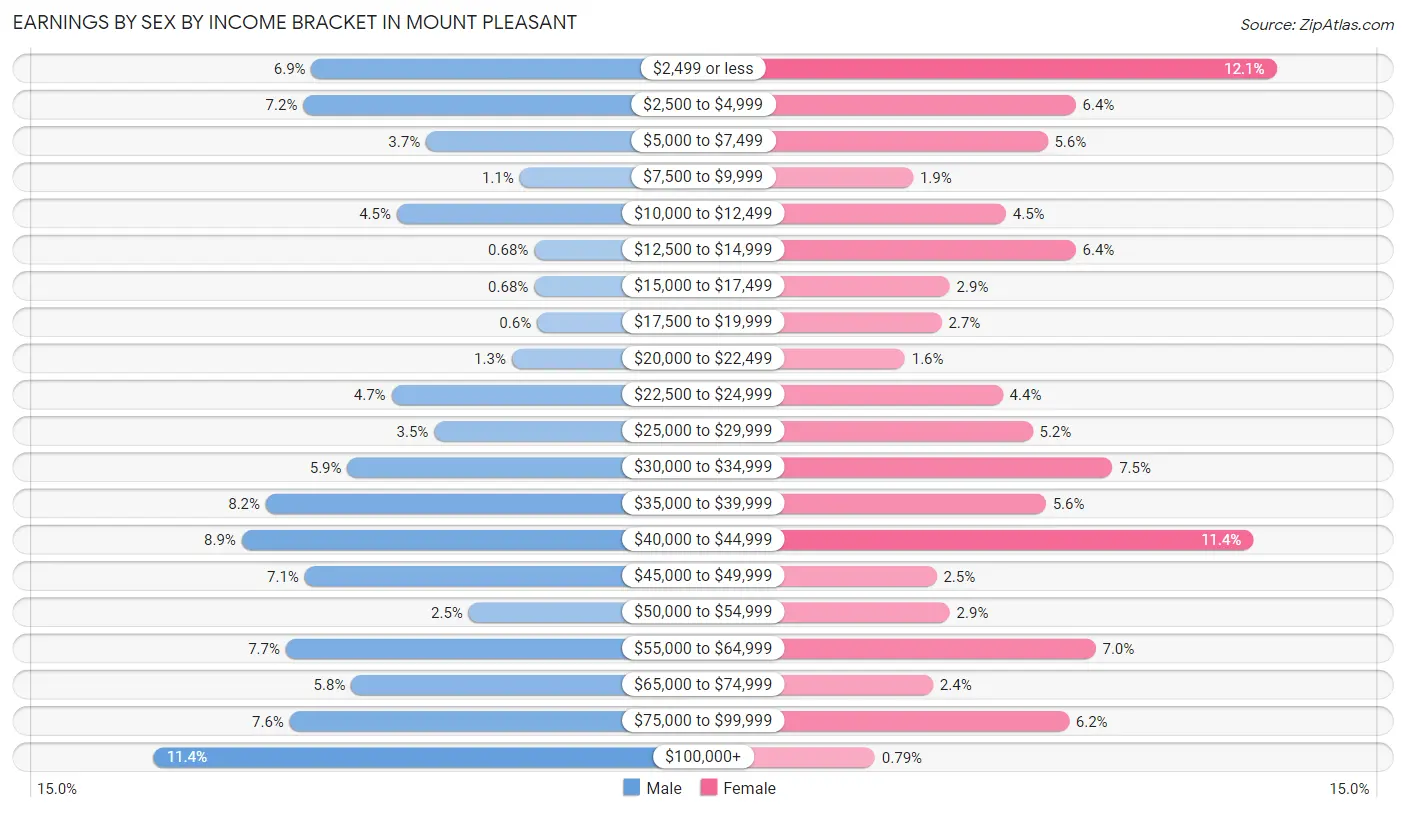
Earnings by Sex by Income Bracket in Mount Pleasant
The most common earnings brackets in Mount Pleasant are $100,000+ for men (303 | 11.4%) and $2,499 or less for women (259 | 12.1%).
| Income | Male | Female |
| $2,499 or less | 185 (6.9%) | 259 (12.1%) |
| $2,500 to $4,999 | 191 (7.2%) | 138 (6.4%) |
| $5,000 to $7,499 | 99 (3.7%) | 121 (5.6%) |
| $7,500 to $9,999 | 29 (1.1%) | 40 (1.9%) |
| $10,000 to $12,499 | 121 (4.5%) | 96 (4.5%) |
| $12,500 to $14,999 | 18 (0.7%) | 138 (6.4%) |
| $15,000 to $17,499 | 18 (0.7%) | 62 (2.9%) |
| $17,500 to $19,999 | 16 (0.6%) | 57 (2.7%) |
| $20,000 to $22,499 | 35 (1.3%) | 35 (1.6%) |
| $22,500 to $24,999 | 125 (4.7%) | 94 (4.4%) |
| $25,000 to $29,999 | 93 (3.5%) | 112 (5.2%) |
| $30,000 to $34,999 | 158 (5.9%) | 160 (7.5%) |
| $35,000 to $39,999 | 219 (8.2%) | 120 (5.6%) |
| $40,000 to $44,999 | 237 (8.9%) | 245 (11.4%) |
| $45,000 to $49,999 | 190 (7.1%) | 54 (2.5%) |
| $50,000 to $54,999 | 67 (2.5%) | 62 (2.9%) |
| $55,000 to $64,999 | 204 (7.7%) | 150 (7.0%) |
| $65,000 to $74,999 | 155 (5.8%) | 52 (2.4%) |
| $75,000 to $99,999 | 201 (7.5%) | 134 (6.2%) |
| $100,000+ | 303 (11.4%) | 17 (0.8%) |
| Total | 2,664 (100.0%) | 2,146 (100.0%) |
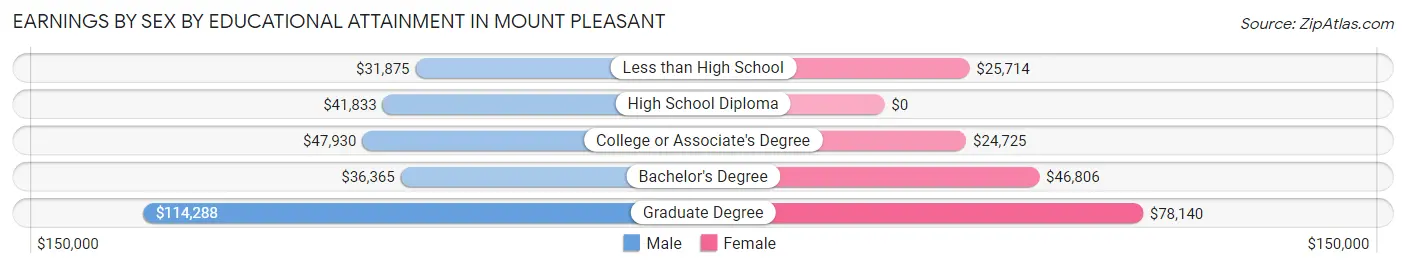
Earnings by Sex by Educational Attainment in Mount Pleasant
Average earnings in Mount Pleasant are $45,704 for men and $38,025 for women, a difference of 16.8%. Men with an educational attainment of graduate degree enjoy the highest average annual earnings of $114,288, while those with less than high school education earn the least with $31,875. Women with an educational attainment of graduate degree earn the most with the average annual earnings of $78,140, while those with college or associate's degree education have the smallest earnings of $24,725.
| Educational Attainment | Male Income | Female Income |
| Less than High School | $31,875 | $25,714 |
| High School Diploma | $41,833 | $0 |
| College or Associate's Degree | $47,930 | $24,725 |
| Bachelor's Degree | $36,365 | $46,806 |
| Graduate Degree | $114,288 | $78,140 |
| Total | $45,704 | $38,025 |
Family Income in Mount Pleasant
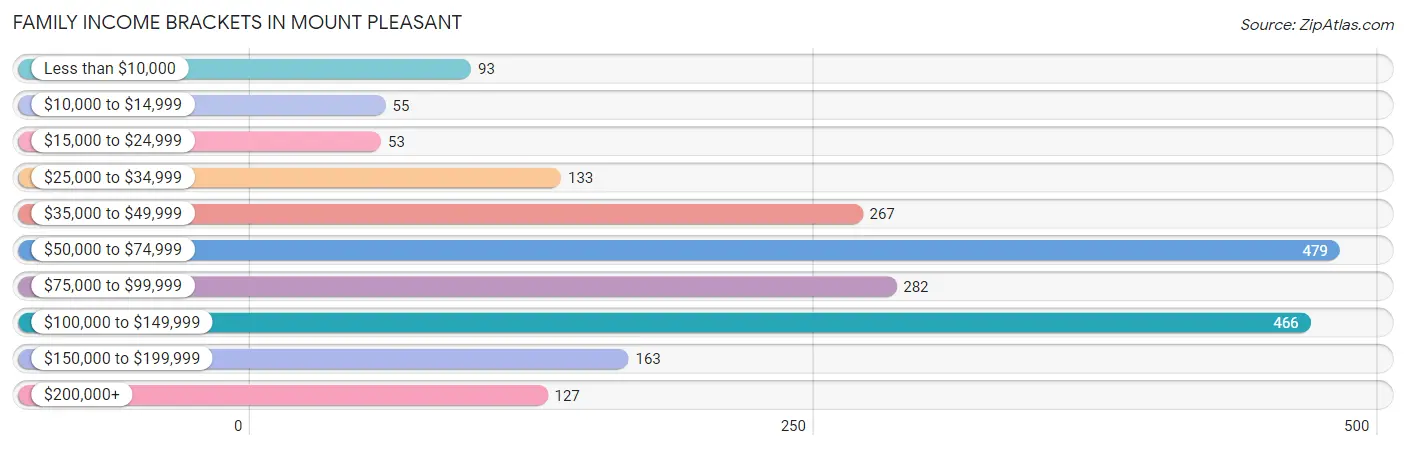
Family Income Brackets in Mount Pleasant
According to the Mount Pleasant family income data, there are 479 families falling into the $50,000 to $74,999 income range, which is the most common income bracket and makes up 22.6% of all families. Conversely, the $15,000 to $24,999 income bracket is the least frequent group with only 53 families (2.5%) belonging to this category.
| Income Bracket | # Families | % Families |
| Less than $10,000 | 93 | 4.4% |
| $10,000 to $14,999 | 55 | 2.6% |
| $15,000 to $24,999 | 53 | 2.5% |
| $25,000 to $34,999 | 133 | 6.3% |
| $35,000 to $49,999 | 267 | 12.6% |
| $50,000 to $74,999 | 479 | 22.6% |
| $75,000 to $99,999 | 282 | 13.3% |
| $100,000 to $149,999 | 466 | 22.0% |
| $150,000 to $199,999 | 163 | 7.7% |
| $200,000+ | 127 | 6.0% |
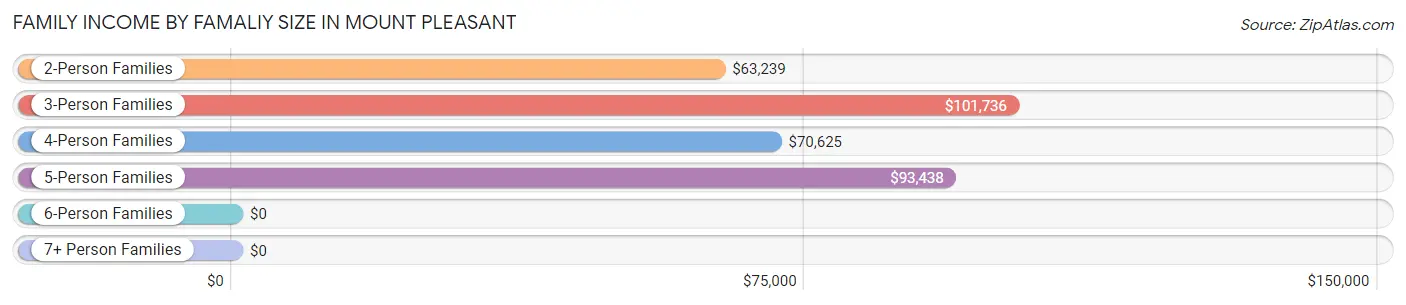
Family Income by Famaliy Size in Mount Pleasant
3-person families (470 | 22.2%) account for the highest median family income in Mount Pleasant with $101,736 per family, while 3-person families (470 | 22.2%) have the highest median income of $33,912 per family member.
| Income Bracket | # Families | Median Income |
| 2-Person Families | 1,191 (56.2%) | $63,239 |
| 3-Person Families | 470 (22.2%) | $101,736 |
| 4-Person Families | 334 (15.8%) | $70,625 |
| 5-Person Families | 42 (2.0%) | $93,438 |
| 6-Person Families | 74 (3.5%) | $0 |
| 7+ Person Families | 8 (0.4%) | $0 |
| Total | 2,119 (100.0%) | $73,651 |
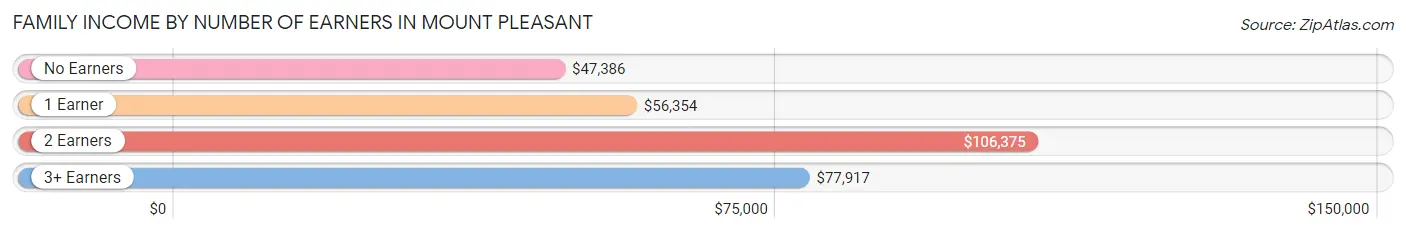
Family Income by Number of Earners in Mount Pleasant
The median family income in Mount Pleasant is $73,651, with families comprising 2 earners (995) having the highest median family income of $106,375, while families with no earners (304) have the lowest median family income of $47,386, accounting for 47.0% and 14.3% of families, respectively.
| Number of Earners | # Families | Median Income |
| No Earners | 304 (14.3%) | $47,386 |
| 1 Earner | 628 (29.6%) | $56,354 |
| 2 Earners | 995 (47.0%) | $106,375 |
| 3+ Earners | 192 (9.1%) | $77,917 |
| Total | 2,119 (100.0%) | $73,651 |
Household Income in Mount Pleasant
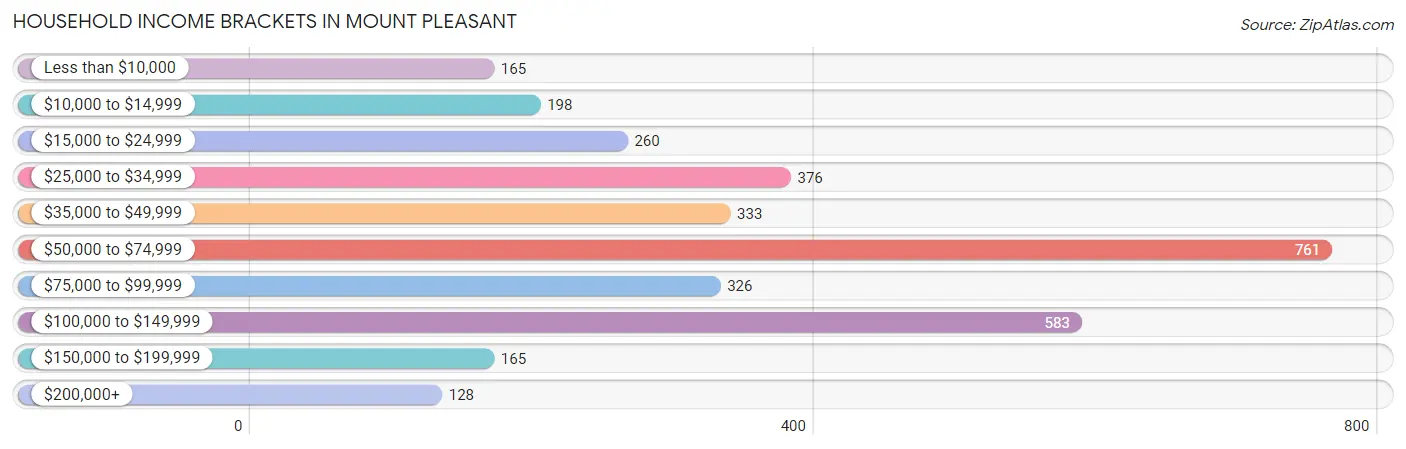
Household Income Brackets in Mount Pleasant
With 761 households falling in the category, the $50,000 to $74,999 income range is the most frequent in Mount Pleasant, accounting for 23.1% of all households. In contrast, only 128 households (3.9%) fall into the $200,000+ income bracket, making it the least populous group.
| Income Bracket | # Households | % Households |
| Less than $10,000 | 165 | 5.0% |
| $10,000 to $14,999 | 198 | 6.0% |
| $15,000 to $24,999 | 260 | 7.9% |
| $25,000 to $34,999 | 376 | 11.4% |
| $35,000 to $49,999 | 333 | 10.1% |
| $50,000 to $74,999 | 761 | 23.1% |
| $75,000 to $99,999 | 326 | 9.9% |
| $100,000 to $149,999 | 583 | 17.7% |
| $150,000 to $199,999 | 165 | 5.0% |
| $200,000+ | 128 | 3.9% |
Household Income by Householder Age in Mount Pleasant
The median household income in Mount Pleasant is $58,895, with the highest median household income of $71,875 found in the 45 to 64 years age bracket for the primary householder. A total of 1,155 households (35.1%) fall into this category. Meanwhile, the 15 to 24 years age bracket for the primary householder has the lowest median household income of $31,975, with 263 households (8.0%) in this group.
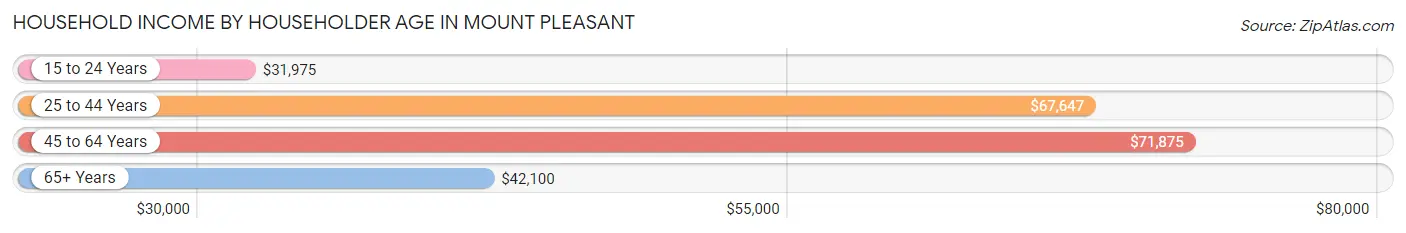
| Income Bracket | # Households | Median Income |
| 15 to 24 Years | 263 (8.0%) | $31,975 |
| 25 to 44 Years | 876 (26.6%) | $67,647 |
| 45 to 64 Years | 1,155 (35.1%) | $71,875 |
| 65+ Years | 1,000 (30.4%) | $42,100 |
| Total | 3,294 (100.0%) | $58,895 |
Poverty in Mount Pleasant
Income Below Poverty by Sex and Age in Mount Pleasant
With 16.4% poverty level for males and 15.1% for females among the residents of Mount Pleasant, under 5 year old males and 12 to 14 year old females are the most vulnerable to poverty, with 86 males (43.9%) and 41 females (33.6%) in their respective age groups living below the poverty level.
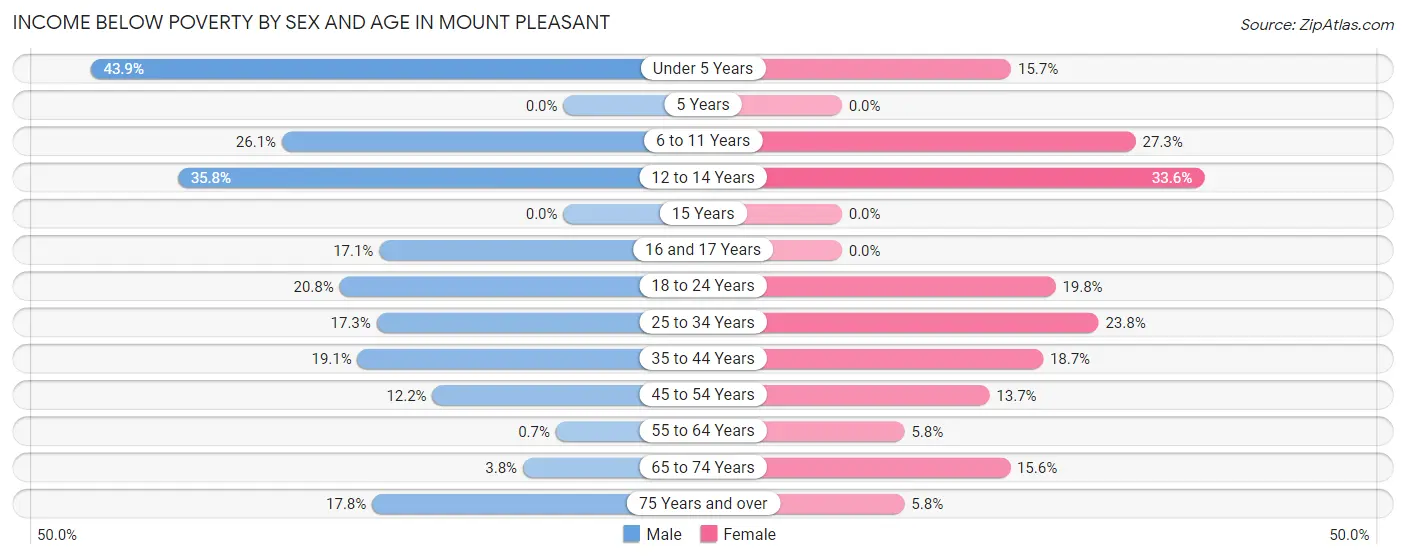
| Age Bracket | Male | Female |
| Under 5 Years | 86 (43.9%) | 33 (15.7%) |
| 5 Years | 0 (0.0%) | 0 (0.0%) |
| 6 to 11 Years | 76 (26.1%) | 63 (27.3%) |
| 12 to 14 Years | 68 (35.8%) | 41 (33.6%) |
| 15 Years | 0 (0.0%) | 0 (0.0%) |
| 16 and 17 Years | 27 (17.1%) | 0 (0.0%) |
| 18 to 24 Years | 103 (20.8%) | 91 (19.8%) |
| 25 to 34 Years | 104 (17.3%) | 91 (23.8%) |
| 35 to 44 Years | 64 (19.1%) | 62 (18.7%) |
| 45 to 54 Years | 57 (12.1%) | 64 (13.7%) |
| 55 to 64 Years | 4 (0.7%) | 33 (5.8%) |
| 65 to 74 Years | 13 (3.7%) | 76 (15.6%) |
| 75 Years and over | 49 (17.7%) | 20 (5.8%) |
| Total | 651 (16.4%) | 574 (15.1%) |
Income Above Poverty by Sex and Age in Mount Pleasant
According to the poverty statistics in Mount Pleasant, males aged 5 years and females aged 15 years are the age groups that are most secure financially, with 100.0% of males and 100.0% of females in these age groups living above the poverty line.
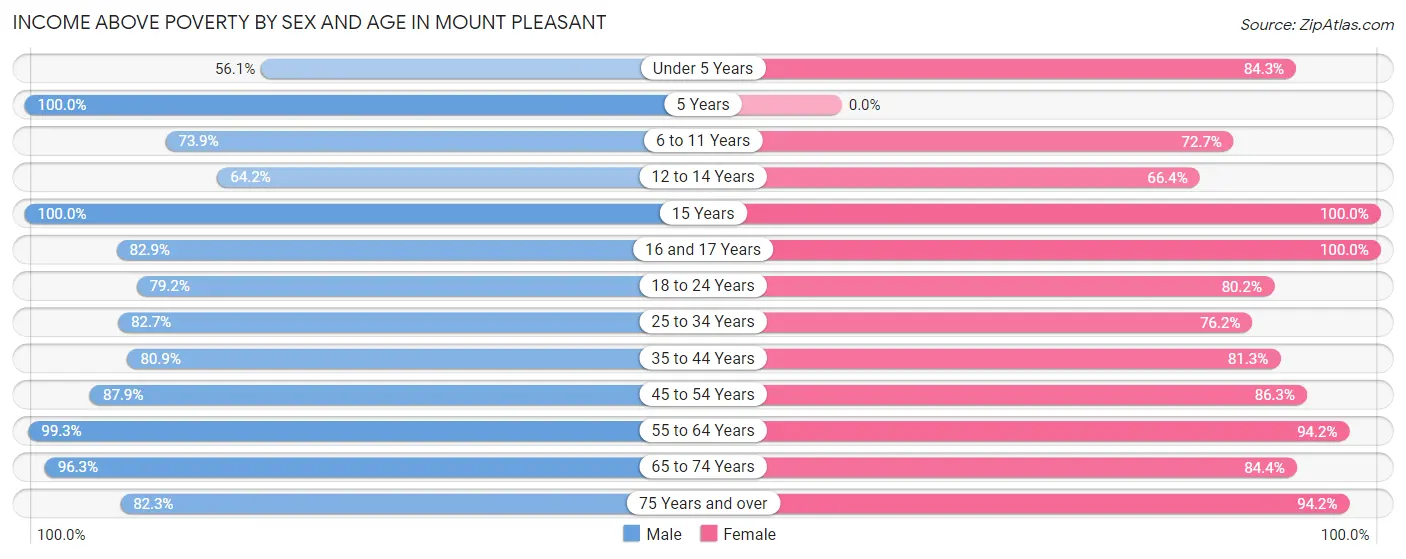
| Age Bracket | Male | Female |
| Under 5 Years | 110 (56.1%) | 177 (84.3%) |
| 5 Years | 24 (100.0%) | 0 (0.0%) |
| 6 to 11 Years | 215 (73.9%) | 168 (72.7%) |
| 12 to 14 Years | 122 (64.2%) | 81 (66.4%) |
| 15 Years | 17 (100.0%) | 41 (100.0%) |
| 16 and 17 Years | 131 (82.9%) | 159 (100.0%) |
| 18 to 24 Years | 393 (79.2%) | 368 (80.2%) |
| 25 to 34 Years | 496 (82.7%) | 291 (76.2%) |
| 35 to 44 Years | 271 (80.9%) | 270 (81.3%) |
| 45 to 54 Years | 412 (87.8%) | 403 (86.3%) |
| 55 to 64 Years | 566 (99.3%) | 534 (94.2%) |
| 65 to 74 Years | 334 (96.3%) | 411 (84.4%) |
| 75 Years and over | 227 (82.3%) | 324 (94.2%) |
| Total | 3,318 (83.6%) | 3,227 (84.9%) |
Income Below Poverty Among Married-Couple Families in Mount Pleasant
The poverty statistics for married-couple families in Mount Pleasant show that 5.1% or 84 of the total 1,631 families live below the poverty line. Families with 3 or 4 children have the highest poverty rate of 71.8%, comprising of 61 families. On the other hand, families with 1 or 2 children have the lowest poverty rate of 0.0%, which includes 0 families.
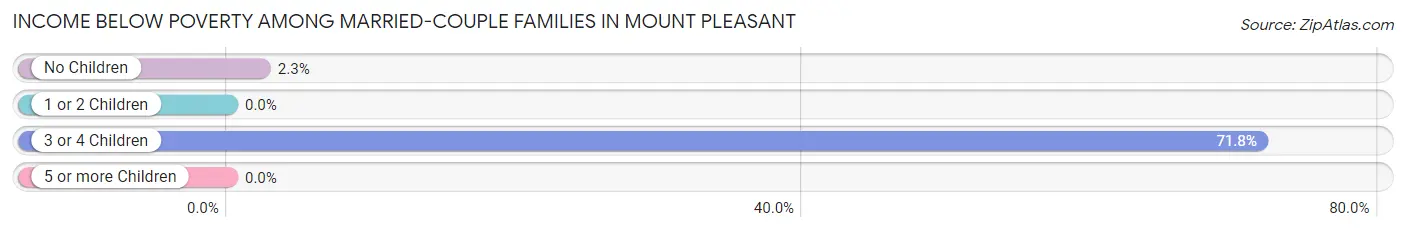
| Children | Above Poverty | Below Poverty |
| No Children | 983 (97.7%) | 23 (2.3%) |
| 1 or 2 Children | 532 (100.0%) | 0 (0.0%) |
| 3 or 4 Children | 24 (28.2%) | 61 (71.8%) |
| 5 or more Children | 8 (100.0%) | 0 (0.0%) |
| Total | 1,547 (94.9%) | 84 (5.1%) |
Income Below Poverty Among Single-Parent Households in Mount Pleasant
According to the poverty data in Mount Pleasant, 25.0% or 41 single-father households and 28.7% or 93 single-mother households are living below the poverty line. Among single-father households, those with 1 or 2 children have the highest poverty rate, with 41 households (58.6%) experiencing poverty. Likewise, among single-mother households, those with 1 or 2 children have the highest poverty rate, with 65 households (37.4%) falling below the poverty line.
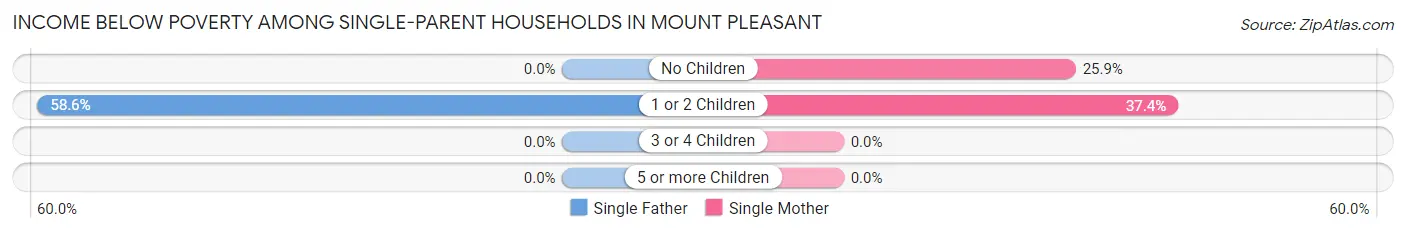
| Children | Single Father | Single Mother |
| No Children | 0 (0.0%) | 28 (25.9%) |
| 1 or 2 Children | 41 (58.6%) | 65 (37.4%) |
| 3 or 4 Children | 0 (0.0%) | 0 (0.0%) |
| 5 or more Children | 0 (0.0%) | 0 (0.0%) |
| Total | 41 (25.0%) | 93 (28.7%) |
Income Below Poverty Among Married-Couple vs Single-Parent Households in Mount Pleasant
The poverty data for Mount Pleasant shows that 84 of the married-couple family households (5.1%) and 134 of the single-parent households (27.5%) are living below the poverty level. Within the married-couple family households, those with 3 or 4 children have the highest poverty rate, with 61 households (71.8%) falling below the poverty line. Among the single-parent households, those with 1 or 2 children have the highest poverty rate, with 106 household (43.4%) living below poverty.
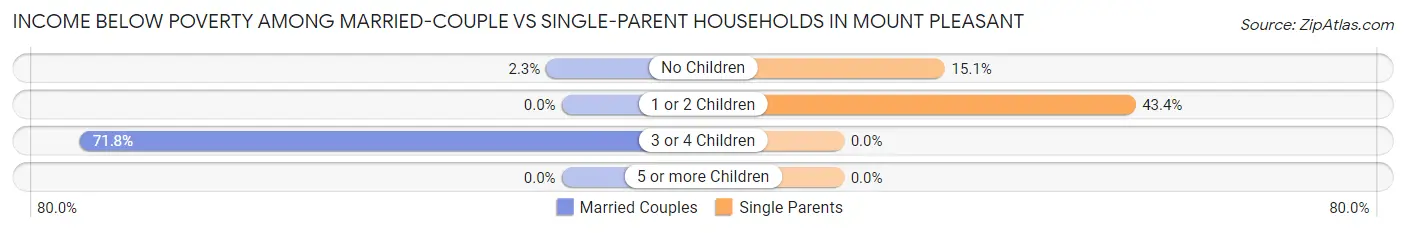
| Children | Married-Couple Families | Single-Parent Households |
| No Children | 23 (2.3%) | 28 (15.0%) |
| 1 or 2 Children | 0 (0.0%) | 106 (43.4%) |
| 3 or 4 Children | 61 (71.8%) | 0 (0.0%) |
| 5 or more Children | 0 (0.0%) | 0 (0.0%) |
| Total | 84 (5.1%) | 134 (27.5%) |
Race in Mount Pleasant
The most populous races in Mount Pleasant are White / Caucasian (7,487 | 81.3%), Hispanic or Latino (771 | 8.4%), and Two or more Races (518 | 5.6%).
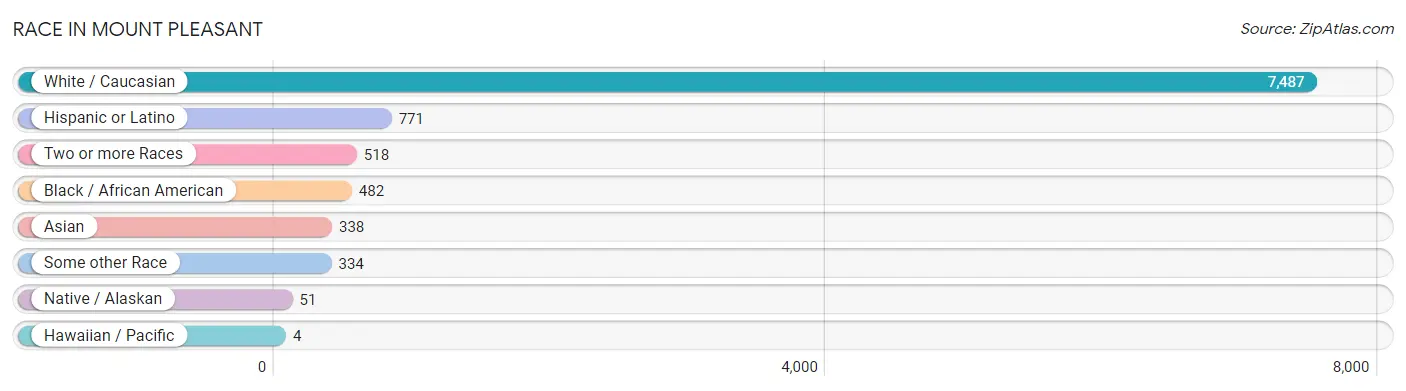
| Race | # Population | % Population |
| Asian | 338 | 3.7% |
| Black / African American | 482 | 5.2% |
| Hawaiian / Pacific | 4 | 0.0% |
| Hispanic or Latino | 771 | 8.4% |
| Native / Alaskan | 51 | 0.5% |
| White / Caucasian | 7,487 | 81.3% |
| Two or more Races | 518 | 5.6% |
| Some other Race | 334 | 3.6% |
| Total | 9,214 | 100.0% |
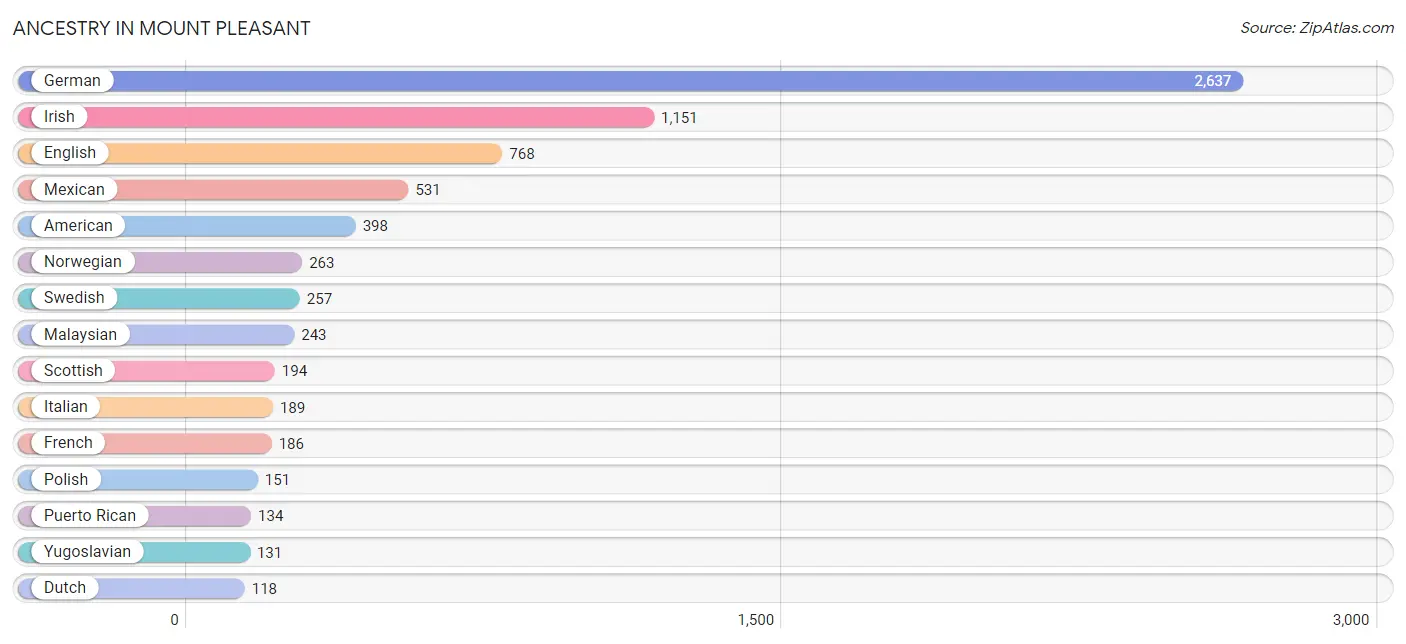
Ancestry in Mount Pleasant
The most populous ancestries reported in Mount Pleasant are German (2,637 | 28.6%), Irish (1,151 | 12.5%), English (768 | 8.3%), Mexican (531 | 5.8%), and American (398 | 4.3%), together accounting for 59.5% of all Mount Pleasant residents.
| Ancestry | # Population | % Population |
| African | 1 | 0.0% |
| American | 398 | 4.3% |
| Australian | 7 | 0.1% |
| Austrian | 1 | 0.0% |
| Belgian | 6 | 0.1% |
| Bhutanese | 3 | 0.0% |
| Brazilian | 1 | 0.0% |
| British | 41 | 0.4% |
| Burmese | 4 | 0.0% |
| Central American | 64 | 0.7% |
| Chippewa | 5 | 0.1% |
| Czechoslovakian | 6 | 0.1% |
| Danish | 44 | 0.5% |
| Delaware | 7 | 0.1% |
| Dutch | 118 | 1.3% |
| Eastern European | 12 | 0.1% |
| English | 768 | 8.3% |
| European | 51 | 0.5% |
| Finnish | 67 | 0.7% |
| French | 186 | 2.0% |
| French Canadian | 110 | 1.2% |
| German | 2,637 | 28.6% |
| Greek | 18 | 0.2% |
| Guatemalan | 64 | 0.7% |
| Indian (Asian) | 76 | 0.8% |
| Irish | 1,151 | 12.5% |
| Italian | 189 | 2.1% |
| Kenyan | 3 | 0.0% |
| Korean | 54 | 0.6% |
| Luxembourger | 5 | 0.1% |
| Malaysian | 243 | 2.6% |
| Mexican | 531 | 5.8% |
| Native Hawaiian | 3 | 0.0% |
| Nigerian | 17 | 0.2% |
| Norwegian | 263 | 2.9% |
| Pakistani | 37 | 0.4% |
| Pennsylvania German | 16 | 0.2% |
| Peruvian | 12 | 0.1% |
| Polish | 151 | 1.6% |
| Potawatomi | 5 | 0.1% |
| Puerto Rican | 134 | 1.5% |
| Romanian | 10 | 0.1% |
| Russian | 10 | 0.1% |
| Samoan | 4 | 0.0% |
| Scandinavian | 9 | 0.1% |
| Scotch-Irish | 103 | 1.1% |
| Scottish | 194 | 2.1% |
| Sioux | 6 | 0.1% |
| Somali | 4 | 0.0% |
| South American | 12 | 0.1% |
| Sri Lankan | 17 | 0.2% |
| Subsaharan African | 25 | 0.3% |
| Swedish | 257 | 2.8% |
| Swiss | 52 | 0.6% |
| Ukrainian | 5 | 0.1% |
| Welsh | 39 | 0.4% |
| Yugoslavian | 131 | 1.4% | View All 57 Rows |
Immigrants in Mount Pleasant
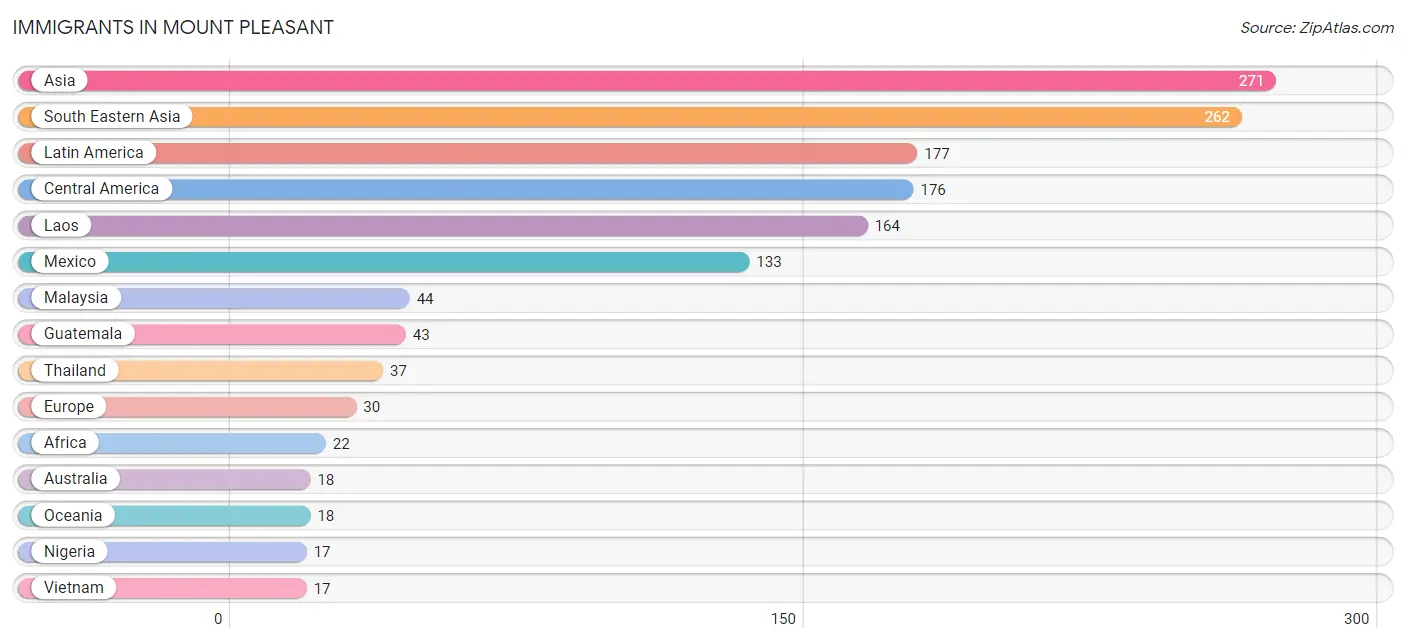
The most numerous immigrant groups reported in Mount Pleasant came from Asia (271 | 2.9%), South Eastern Asia (262 | 2.8%), Latin America (177 | 1.9%), Central America (176 | 1.9%), and Laos (164 | 1.8%), together accounting for 11.4% of all Mount Pleasant residents.
| Immigration Origin | # Population | % Population |
| Africa | 22 | 0.2% |
| Asia | 271 | 2.9% |
| Australia | 18 | 0.2% |
| Brazil | 1 | 0.0% |
| Central America | 176 | 1.9% |
| China | 5 | 0.1% |
| Eastern Africa | 4 | 0.0% |
| Eastern Asia | 9 | 0.1% |
| Eastern Europe | 15 | 0.2% |
| Europe | 30 | 0.3% |
| Germany | 6 | 0.1% |
| Guatemala | 43 | 0.5% |
| Italy | 1 | 0.0% |
| Korea | 4 | 0.0% |
| Laos | 164 | 1.8% |
| Latin America | 177 | 1.9% |
| Malaysia | 44 | 0.5% |
| Mexico | 133 | 1.4% |
| Nigeria | 17 | 0.2% |
| Northern Europe | 8 | 0.1% |
| Oceania | 18 | 0.2% |
| Romania | 10 | 0.1% |
| Somalia | 4 | 0.0% |
| South America | 1 | 0.0% |
| South Eastern Asia | 262 | 2.8% |
| Southern Europe | 1 | 0.0% |
| Thailand | 37 | 0.4% |
| Ukraine | 5 | 0.1% |
| Vietnam | 17 | 0.2% |
| Western Africa | 17 | 0.2% |
| Western Europe | 6 | 0.1% | View All 31 Rows |
Sex and Age in Mount Pleasant
Sex and Age in Mount Pleasant
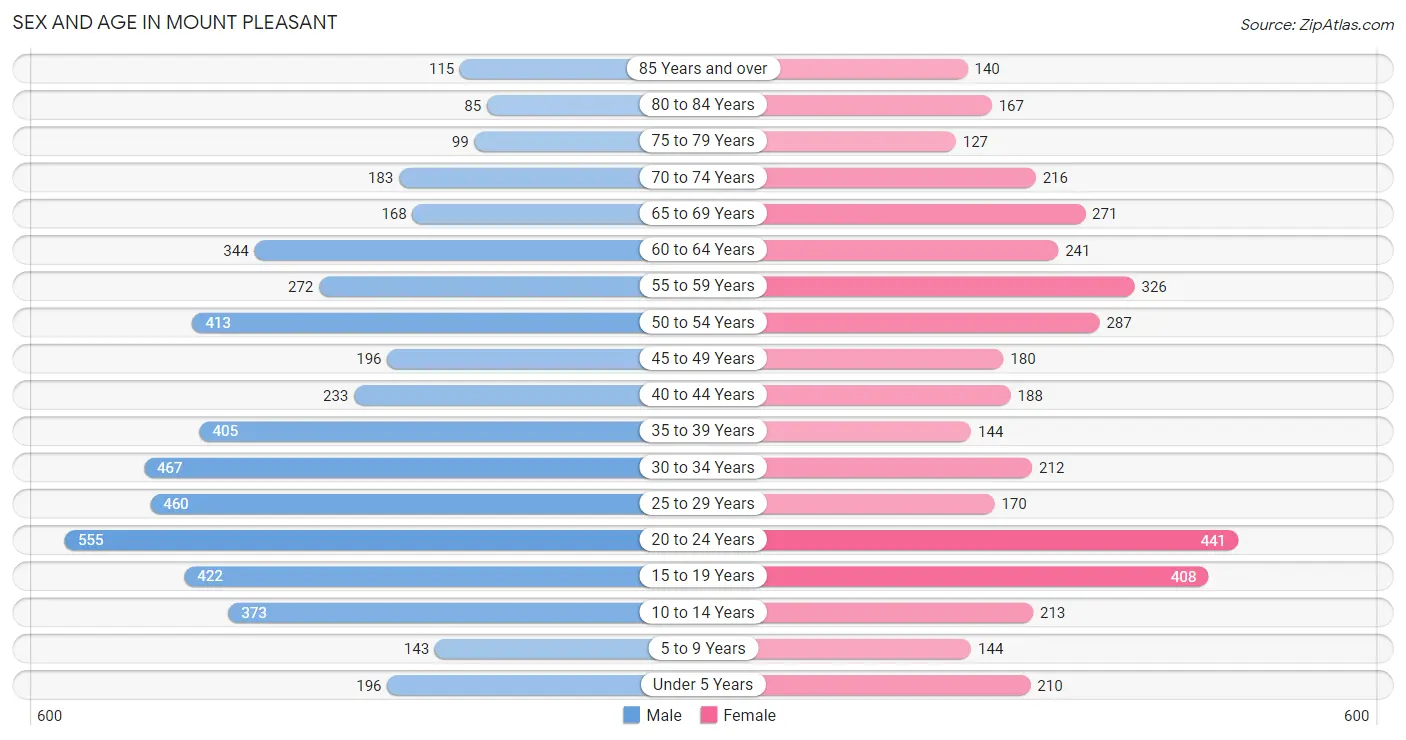
The most populous age groups in Mount Pleasant are 20 to 24 Years (555 | 10.8%) for men and 20 to 24 Years (441 | 10.8%) for women.
| Age Bracket | Male | Female |
| Under 5 Years | 196 (3.8%) | 210 (5.1%) |
| 5 to 9 Years | 143 (2.8%) | 144 (3.5%) |
| 10 to 14 Years | 373 (7.3%) | 213 (5.2%) |
| 15 to 19 Years | 422 (8.2%) | 408 (10.0%) |
| 20 to 24 Years | 555 (10.8%) | 441 (10.8%) |
| 25 to 29 Years | 460 (9.0%) | 170 (4.2%) |
| 30 to 34 Years | 467 (9.1%) | 212 (5.2%) |
| 35 to 39 Years | 405 (7.9%) | 144 (3.5%) |
| 40 to 44 Years | 233 (4.5%) | 188 (4.6%) |
| 45 to 49 Years | 196 (3.8%) | 180 (4.4%) |
| 50 to 54 Years | 413 (8.1%) | 287 (7.0%) |
| 55 to 59 Years | 272 (5.3%) | 326 (8.0%) |
| 60 to 64 Years | 344 (6.7%) | 241 (5.9%) |
| 65 to 69 Years | 168 (3.3%) | 271 (6.6%) |
| 70 to 74 Years | 183 (3.6%) | 216 (5.3%) |
| 75 to 79 Years | 99 (1.9%) | 127 (3.1%) |
| 80 to 84 Years | 85 (1.7%) | 167 (4.1%) |
| 85 Years and over | 115 (2.2%) | 140 (3.4%) |
| Total | 5,129 (100.0%) | 4,085 (100.0%) |
Families and Households in Mount Pleasant
Median Family Size in Mount Pleasant
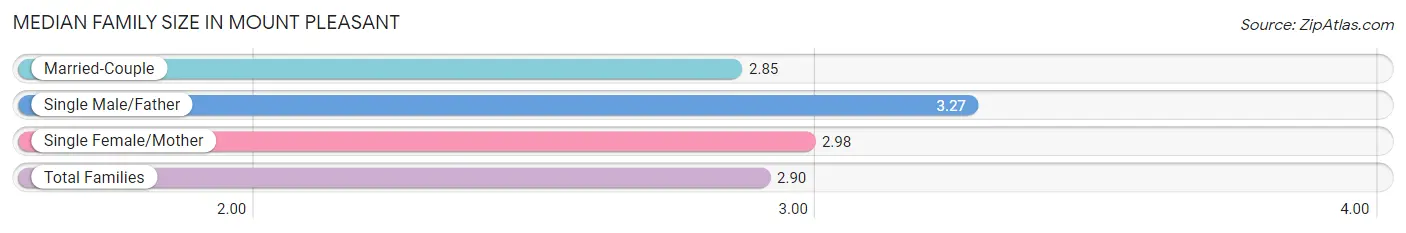
The median family size in Mount Pleasant is 2.90 persons per family, with single male/father families (164 | 7.7%) accounting for the largest median family size of 3.27 persons per family. On the other hand, married-couple families (1,631 | 77.0%) represent the smallest median family size with 2.85 persons per family.
| Family Type | # Families | Family Size |
| Married-Couple | 1,631 (77.0%) | 2.85 |
| Single Male/Father | 164 (7.7%) | 3.27 |
| Single Female/Mother | 324 (15.3%) | 2.98 |
| Total Families | 2,119 (100.0%) | 2.90 |
Median Household Size in Mount Pleasant
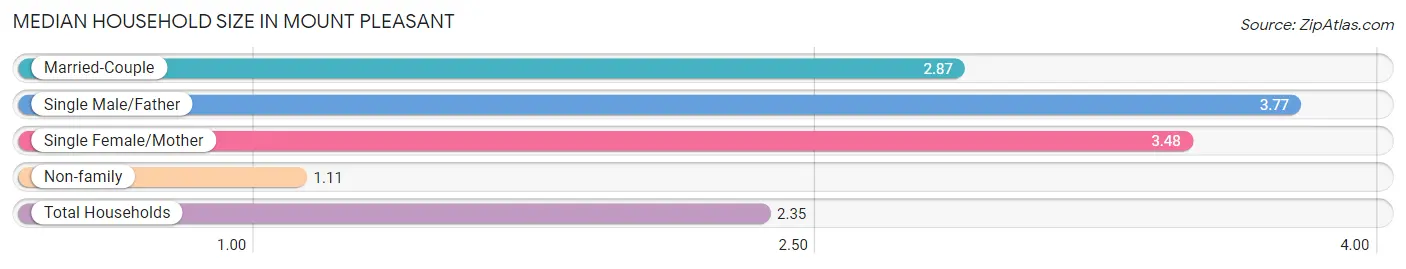
The median household size in Mount Pleasant is 2.35 persons per household, with single male/father households (164 | 5.0%) accounting for the largest median household size of 3.77 persons per household. non-family households (1,175 | 35.7%) represent the smallest median household size with 1.11 persons per household.
| Household Type | # Households | Household Size |
| Married-Couple | 1,631 (49.5%) | 2.87 |
| Single Male/Father | 164 (5.0%) | 3.77 |
| Single Female/Mother | 324 (9.8%) | 3.48 |
| Non-family | 1,175 (35.7%) | 1.11 |
| Total Households | 3,294 (100.0%) | 2.35 |
Household Size by Marriage Status in Mount Pleasant
Out of a total of 3,294 households in Mount Pleasant, 2,119 (64.3%) are family households, while 1,175 (35.7%) are nonfamily households. The most numerous type of family households are 2-person households, comprising 1,112, and the most common type of nonfamily households are 1-person households, comprising 1,070.
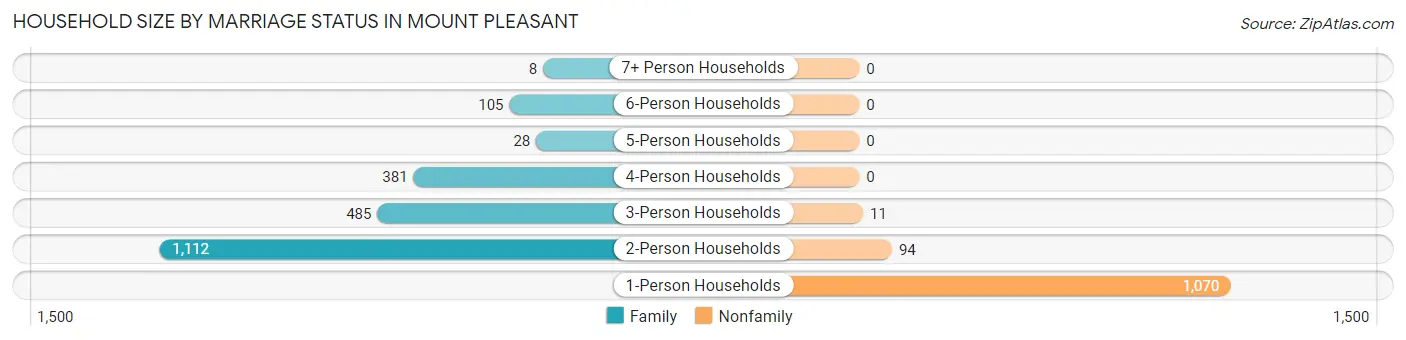
| Household Size | Family Households | Nonfamily Households |
| 1-Person Households | - | 1,070 (32.5%) |
| 2-Person Households | 1,112 (33.8%) | 94 (2.9%) |
| 3-Person Households | 485 (14.7%) | 11 (0.3%) |
| 4-Person Households | 381 (11.6%) | 0 (0.0%) |
| 5-Person Households | 28 (0.9%) | 0 (0.0%) |
| 6-Person Households | 105 (3.2%) | 0 (0.0%) |
| 7+ Person Households | 8 (0.2%) | 0 (0.0%) |
| Total | 2,119 (64.3%) | 1,175 (35.7%) |
Female Fertility in Mount Pleasant
Fertility by Age in Mount Pleasant
Average fertility rate in Mount Pleasant is 62.0 births per 1,000 women. Women in the age bracket of 15 to 19 years have the highest fertility rate with 105.0 births per 1,000 women. Women in the age bracket of 20 to 34 years acount for 61.3% of all women with births.
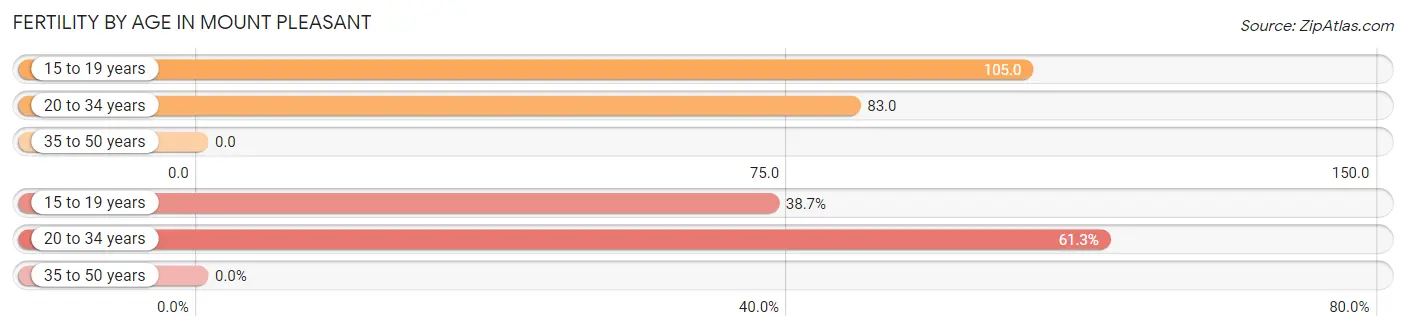
| Age Bracket | Women with Births | Births / 1,000 Women |
| 15 to 19 years | 43 (38.7%) | 105.0 |
| 20 to 34 years | 68 (61.3%) | 83.0 |
| 35 to 50 years | 0 (0.0%) | 0.0 |
| Total | 111 (100.0%) | 62.0 |
Fertility by Age by Marriage Status in Mount Pleasant
61.3% of women with births (111) in Mount Pleasant are married. The highest percentage of unmarried women with births falls into 15 to 19 years age bracket with 100.0% of them unmarried at the time of birth, while the lowest percentage of unmarried women with births belong to 20 to 34 years age bracket with 0.0% of them unmarried.
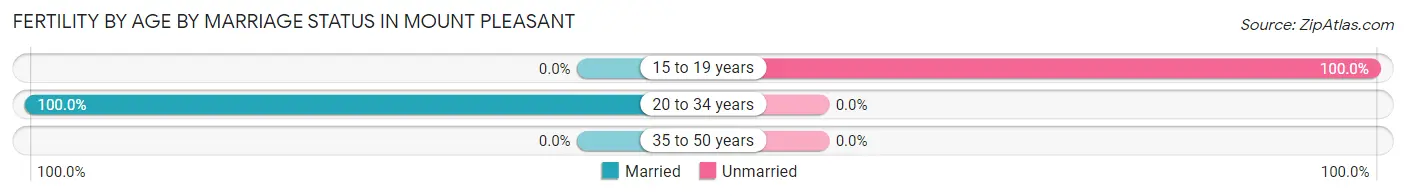
| Age Bracket | Married | Unmarried |
| 15 to 19 years | 0 (0.0%) | 43 (100.0%) |
| 20 to 34 years | 68 (100.0%) | 0 (0.0%) |
| 35 to 50 years | 0 (0.0%) | 0 (0.0%) |
| Total | 68 (61.3%) | 43 (38.7%) |
Fertility by Education in Mount Pleasant
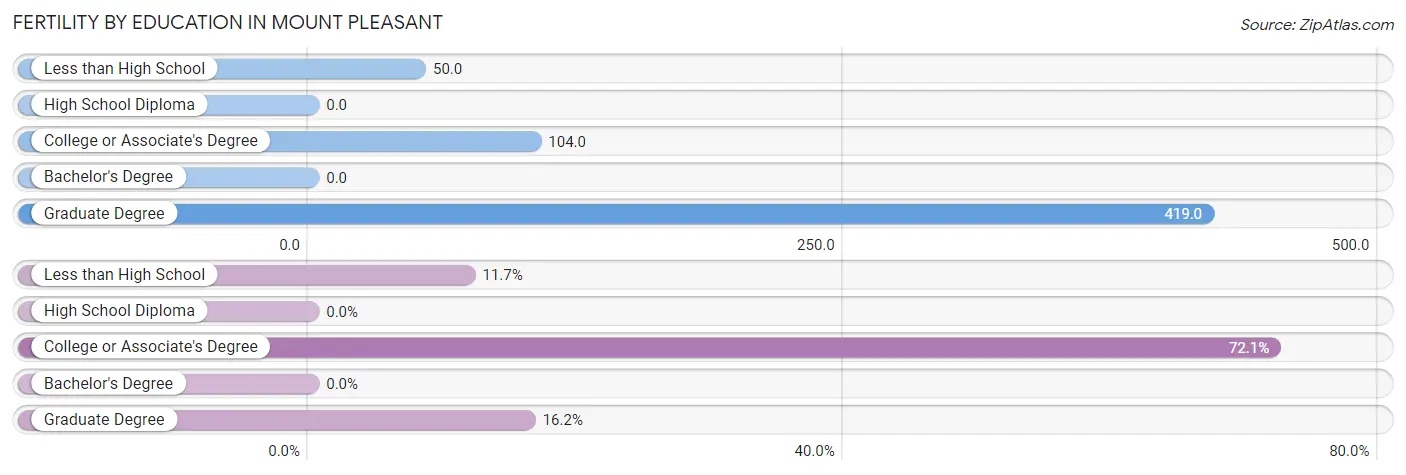
| Educational Attainment | Women with Births | Births / 1,000 Women |
| Less than High School | 13 (11.7%) | 50.0 |
| High School Diploma | 0 (0.0%) | 0.0 |
| College or Associate's Degree | 80 (72.1%) | 104.0 |
| Bachelor's Degree | 0 (0.0%) | 0.0 |
| Graduate Degree | 18 (16.2%) | 419.0 |
| Total | 111 (100.0%) | 62.0 |
Fertility by Education by Marriage Status in Mount Pleasant
38.7% of women with births in Mount Pleasant are unmarried. Women with the educational attainment of graduate degree are most likely to be married with 100.0% of them married at childbirth, while women with the educational attainment of less than high school are least likely to be married with 100.0% of them unmarried at childbirth.
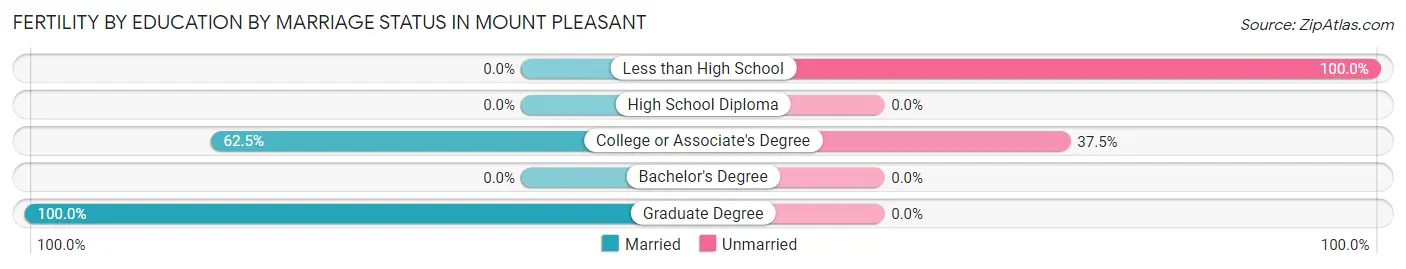
| Educational Attainment | Married | Unmarried |
| Less than High School | 0 (0.0%) | 13 (100.0%) |
| High School Diploma | 0 (0.0%) | 0 (0.0%) |
| College or Associate's Degree | 50 (62.5%) | 30 (37.5%) |
| Bachelor's Degree | 0 (0.0%) | 0 (0.0%) |
| Graduate Degree | 18 (100.0%) | 0 (0.0%) |
| Total | 68 (61.3%) | 43 (38.7%) |
Employment Characteristics in Mount Pleasant
Employment by Class of Employer in Mount Pleasant
Among the 4,274 employed individuals in Mount Pleasant, private company employees (3,010 | 70.4%), local government employees (670 | 15.7%), and not-for-profit organizations (257 | 6.0%) make up the most common classes of employment.
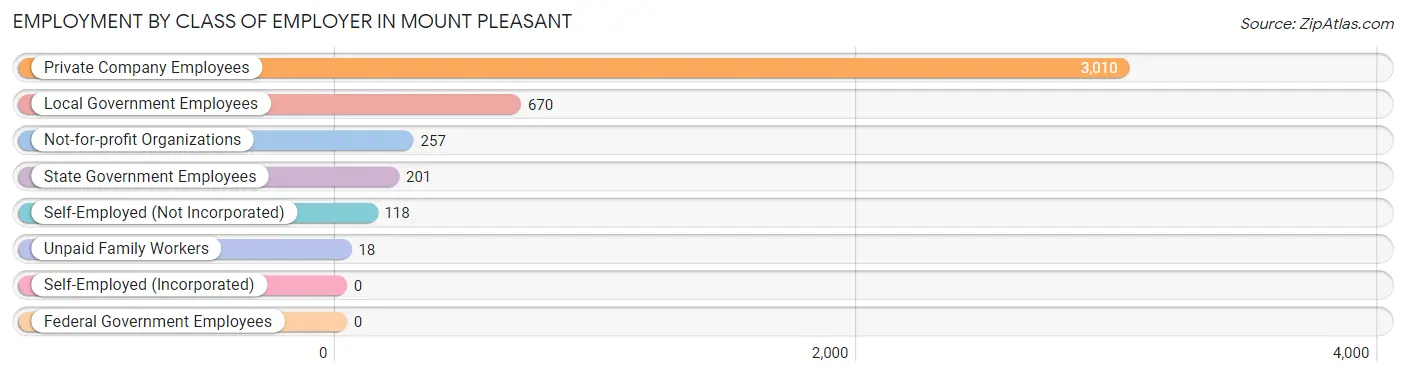
| Employer Class | # Employees | % Employees |
| Private Company Employees | 3,010 | 70.4% |
| Self-Employed (Incorporated) | 0 | 0.0% |
| Self-Employed (Not Incorporated) | 118 | 2.8% |
| Not-for-profit Organizations | 257 | 6.0% |
| Local Government Employees | 670 | 15.7% |
| State Government Employees | 201 | 4.7% |
| Federal Government Employees | 0 | 0.0% |
| Unpaid Family Workers | 18 | 0.4% |
| Total | 4,274 | 100.0% |
Employment Status by Age in Mount Pleasant
According to the labor force statistics for Mount Pleasant, out of the total population over 16 years of age (7,873), 56.5% or 4,448 individuals are in the labor force, with 2.7% or 120 of them unemployed. The age group with the highest labor force participation rate is 55 to 59 years, with 84.6% or 506 individuals in the labor force. Within the labor force, the 75 years and over age range has the highest percentage of unemployed individuals, with 17.4% or 8 of them being unemployed.
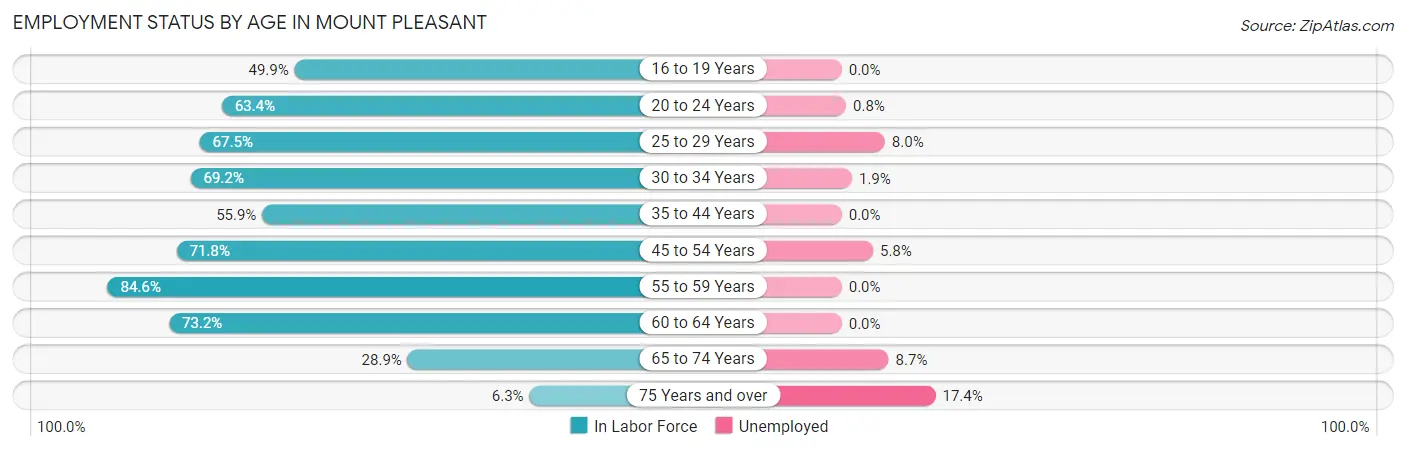
| Age Bracket | In Labor Force | Unemployed |
| 16 to 19 Years | 383 (49.9%) | 0 (0.0%) |
| 20 to 24 Years | 631 (63.4%) | 5 (0.8%) |
| 25 to 29 Years | 425 (67.5%) | 34 (8.0%) |
| 30 to 34 Years | 470 (69.2%) | 9 (1.9%) |
| 35 to 44 Years | 542 (55.9%) | 0 (0.0%) |
| 45 to 54 Years | 773 (71.8%) | 45 (5.8%) |
| 55 to 59 Years | 506 (84.6%) | 0 (0.0%) |
| 60 to 64 Years | 428 (73.2%) | 0 (0.0%) |
| 65 to 74 Years | 242 (28.9%) | 21 (8.7%) |
| 75 Years and over | 46 (6.3%) | 8 (17.4%) |
| Total | 4,448 (56.5%) | 120 (2.7%) |
Employment Status by Educational Attainment in Mount Pleasant
According to labor force statistics for Mount Pleasant, 69.3% of individuals (3,145) out of the total population between 25 and 64 years of age (4,538) are in the labor force, with 2.8% or 88 of them being unemployed. The group with the highest labor force participation rate are those with the educational attainment of bachelor's degree or higher, with 92.5% or 1,106 individuals in the labor force. Within the labor force, individuals with high school diploma education have the highest percentage of unemployment, with 6.6% or 43 of them being unemployed.
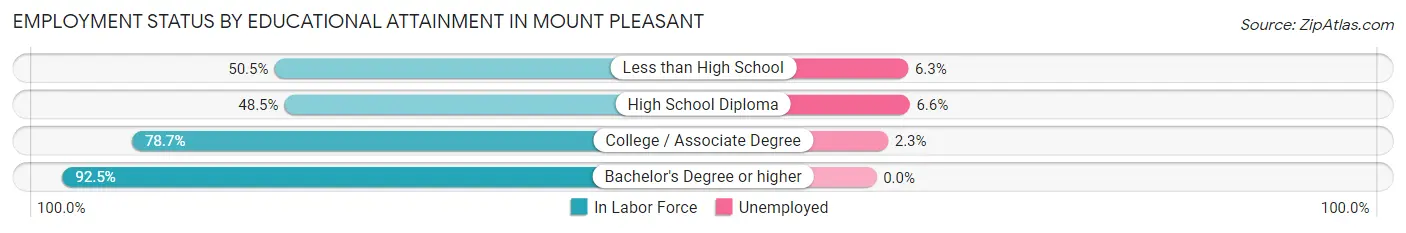
| Educational Attainment | In Labor Force | Unemployed |
| Less than High School | 336 (50.5%) | 42 (6.3%) |
| High School Diploma | 649 (48.5%) | 88 (6.6%) |
| College / Associate Degree | 1,053 (78.7%) | 31 (2.3%) |
| Bachelor's Degree or higher | 1,106 (92.5%) | 0 (0.0%) |
| Total | 3,145 (69.3%) | 127 (2.8%) |
Employment Occupations by Sex in Mount Pleasant
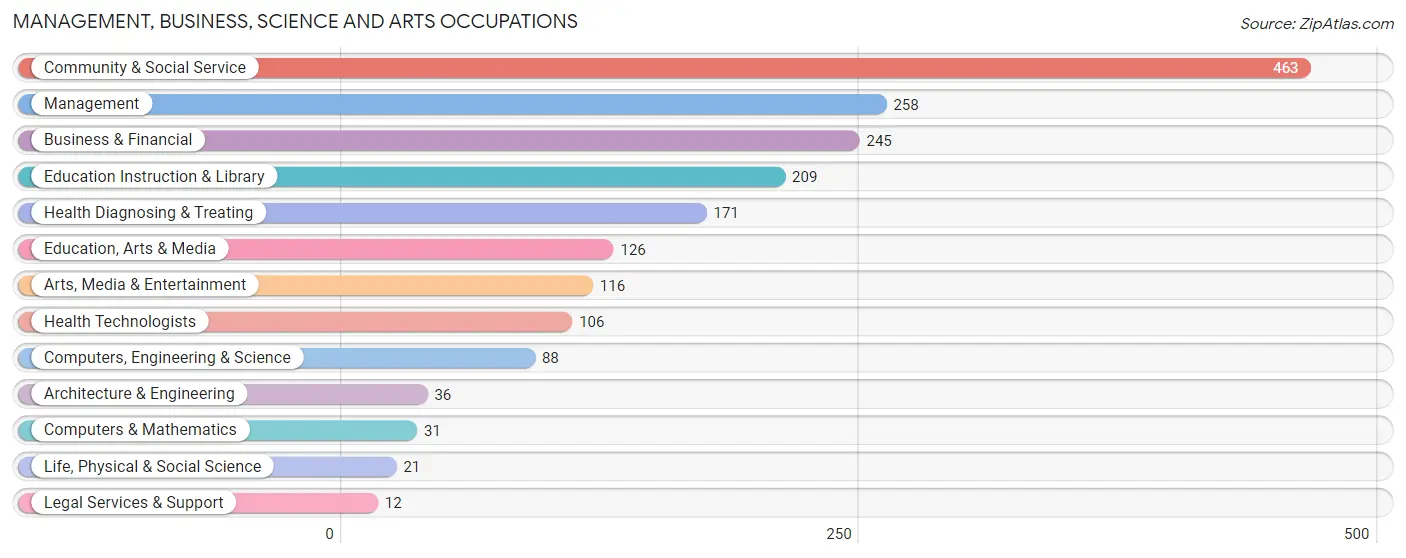
Management, Business, Science and Arts Occupations
The most common Management, Business, Science and Arts occupations in Mount Pleasant are Community & Social Service (463 | 10.7%), Management (258 | 6.0%), Business & Financial (245 | 5.7%), Education Instruction & Library (209 | 4.8%), and Health Diagnosing & Treating (171 | 4.0%).
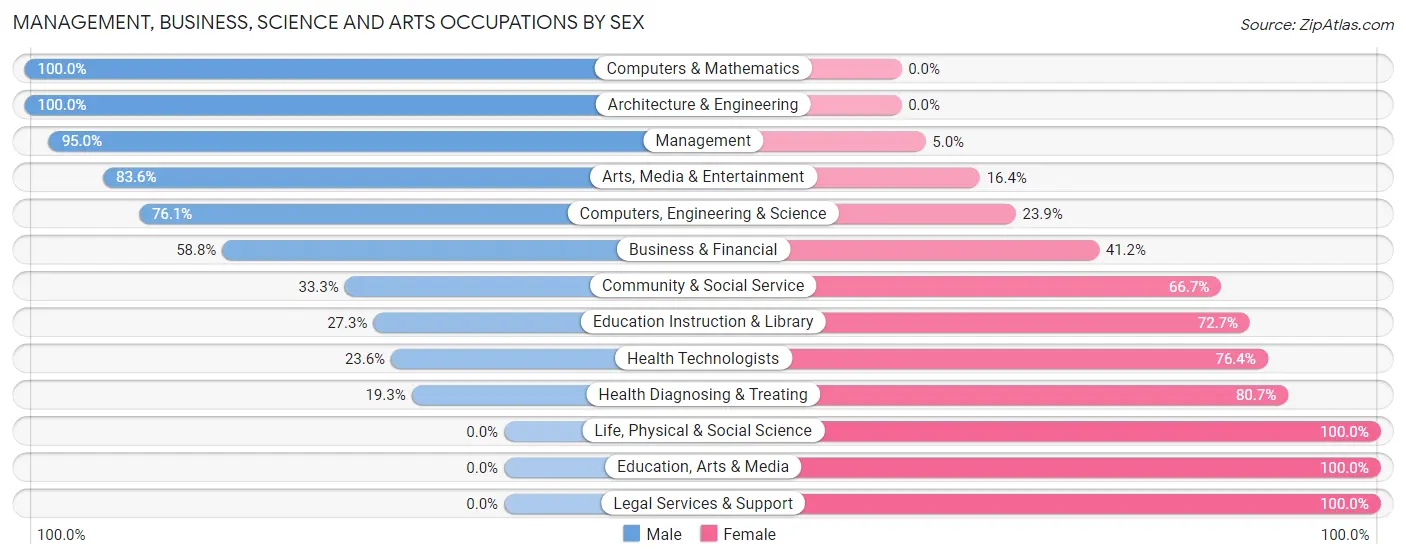
Management, Business, Science and Arts Occupations by Sex
Within the Management, Business, Science and Arts occupations in Mount Pleasant, the most male-oriented occupations are Computers & Mathematics (100.0%), Architecture & Engineering (100.0%), and Management (95.0%), while the most female-oriented occupations are Life, Physical & Social Science (100.0%), Education, Arts & Media (100.0%), and Legal Services & Support (100.0%).
| Occupation | Male | Female |
| Management | 245 (95.0%) | 13 (5.0%) |
| Business & Financial | 144 (58.8%) | 101 (41.2%) |
| Computers, Engineering & Science | 67 (76.1%) | 21 (23.9%) |
| Computers & Mathematics | 31 (100.0%) | 0 (0.0%) |
| Architecture & Engineering | 36 (100.0%) | 0 (0.0%) |
| Life, Physical & Social Science | 0 (0.0%) | 21 (100.0%) |
| Community & Social Service | 154 (33.3%) | 309 (66.7%) |
| Education, Arts & Media | 0 (0.0%) | 126 (100.0%) |
| Legal Services & Support | 0 (0.0%) | 12 (100.0%) |
| Education Instruction & Library | 57 (27.3%) | 152 (72.7%) |
| Arts, Media & Entertainment | 97 (83.6%) | 19 (16.4%) |
| Health Diagnosing & Treating | 33 (19.3%) | 138 (80.7%) |
| Health Technologists | 25 (23.6%) | 81 (76.4%) |
| Total (Category) | 643 (52.5%) | 582 (47.5%) |
| Total (Overall) | 2,358 (54.5%) | 1,966 (45.5%) |
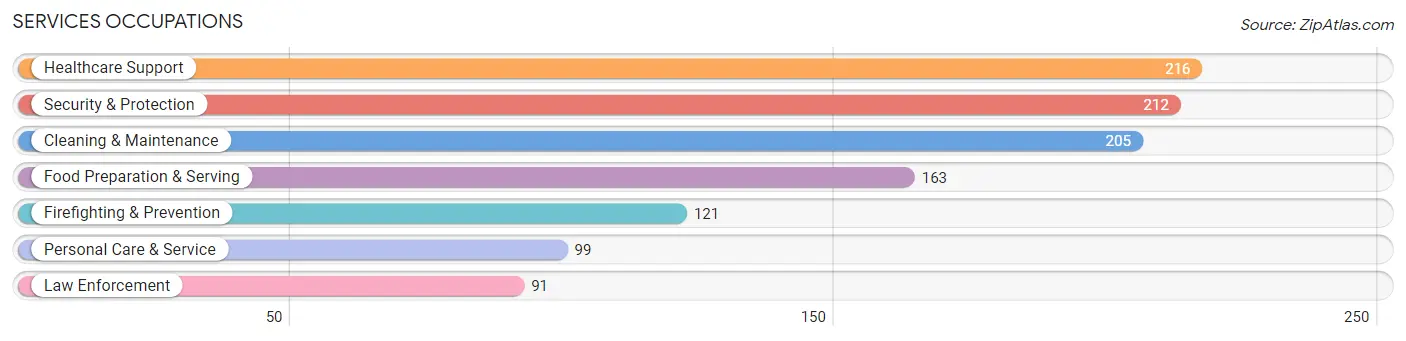
Services Occupations
The most common Services occupations in Mount Pleasant are Healthcare Support (216 | 5.0%), Security & Protection (212 | 4.9%), Cleaning & Maintenance (205 | 4.7%), Food Preparation & Serving (163 | 3.8%), and Firefighting & Prevention (121 | 2.8%).
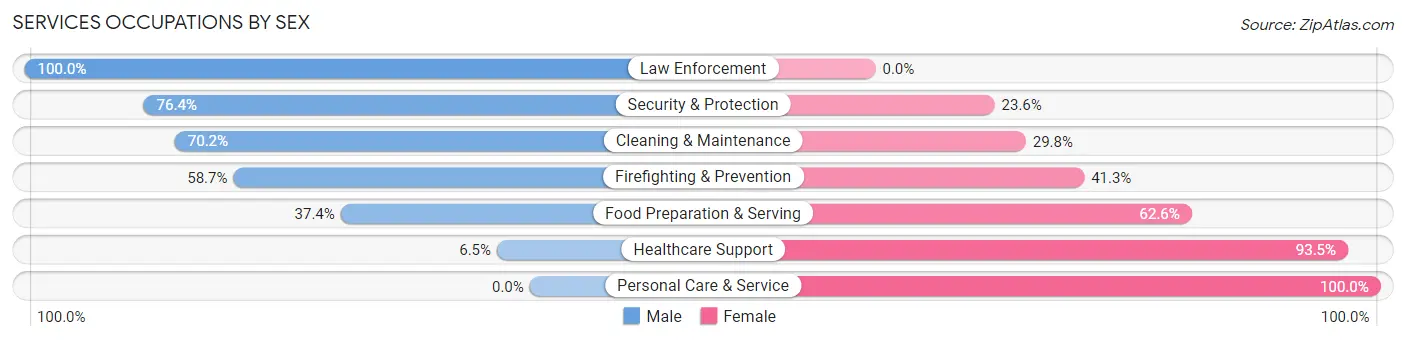
Services Occupations by Sex
Within the Services occupations in Mount Pleasant, the most male-oriented occupations are Law Enforcement (100.0%), Security & Protection (76.4%), and Cleaning & Maintenance (70.2%), while the most female-oriented occupations are Personal Care & Service (100.0%), Healthcare Support (93.5%), and Food Preparation & Serving (62.6%).
| Occupation | Male | Female |
| Healthcare Support | 14 (6.5%) | 202 (93.5%) |
| Security & Protection | 162 (76.4%) | 50 (23.6%) |
| Firefighting & Prevention | 71 (58.7%) | 50 (41.3%) |
| Law Enforcement | 91 (100.0%) | 0 (0.0%) |
| Food Preparation & Serving | 61 (37.4%) | 102 (62.6%) |
| Cleaning & Maintenance | 144 (70.2%) | 61 (29.8%) |
| Personal Care & Service | 0 (0.0%) | 99 (100.0%) |
| Total (Category) | 381 (42.6%) | 514 (57.4%) |
| Total (Overall) | 2,358 (54.5%) | 1,966 (45.5%) |
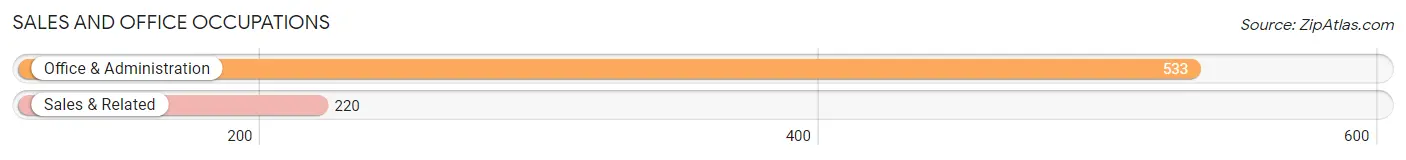
Sales and Office Occupations
The most common Sales and Office occupations in Mount Pleasant are Office & Administration (533 | 12.3%), and Sales & Related (220 | 5.1%).
Sales and Office Occupations by Sex
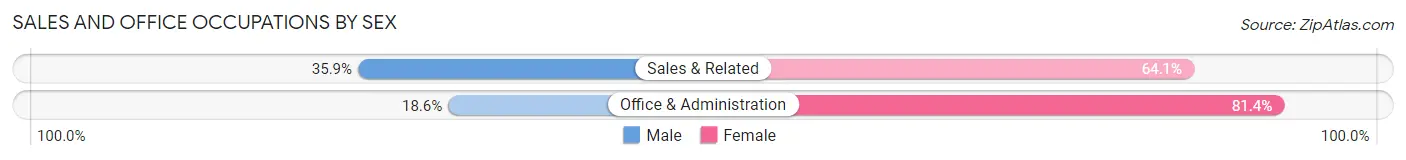
| Occupation | Male | Female |
| Sales & Related | 79 (35.9%) | 141 (64.1%) |
| Office & Administration | 99 (18.6%) | 434 (81.4%) |
| Total (Category) | 178 (23.6%) | 575 (76.4%) |
| Total (Overall) | 2,358 (54.5%) | 1,966 (45.5%) |
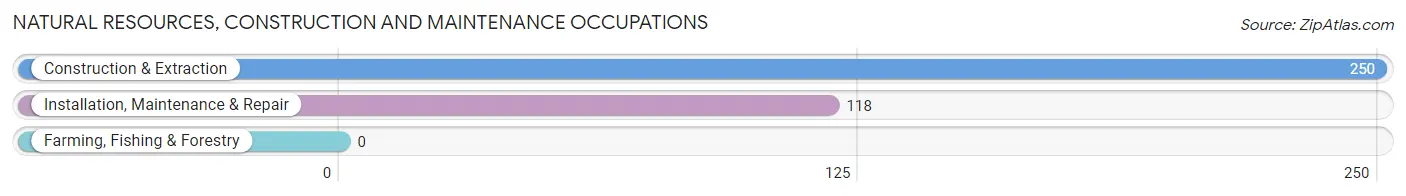
Natural Resources, Construction and Maintenance Occupations
The most common Natural Resources, Construction and Maintenance occupations in Mount Pleasant are Construction & Extraction (250 | 5.8%), and Installation, Maintenance & Repair (118 | 2.7%).
Natural Resources, Construction and Maintenance Occupations by Sex
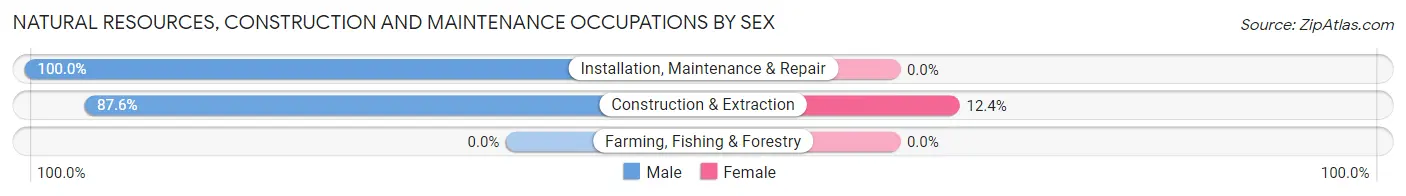
| Occupation | Male | Female |
| Farming, Fishing & Forestry | 0 (0.0%) | 0 (0.0%) |
| Construction & Extraction | 219 (87.6%) | 31 (12.4%) |
| Installation, Maintenance & Repair | 118 (100.0%) | 0 (0.0%) |
| Total (Category) | 337 (91.6%) | 31 (8.4%) |
| Total (Overall) | 2,358 (54.5%) | 1,966 (45.5%) |
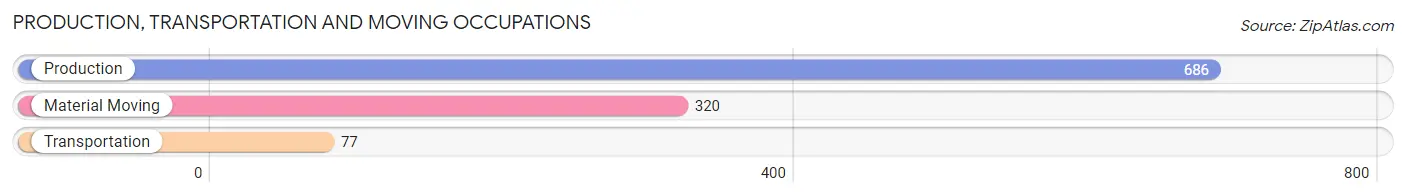
Production, Transportation and Moving Occupations
The most common Production, Transportation and Moving occupations in Mount Pleasant are Production (686 | 15.9%), Material Moving (320 | 7.4%), and Transportation (77 | 1.8%).
Production, Transportation and Moving Occupations by Sex
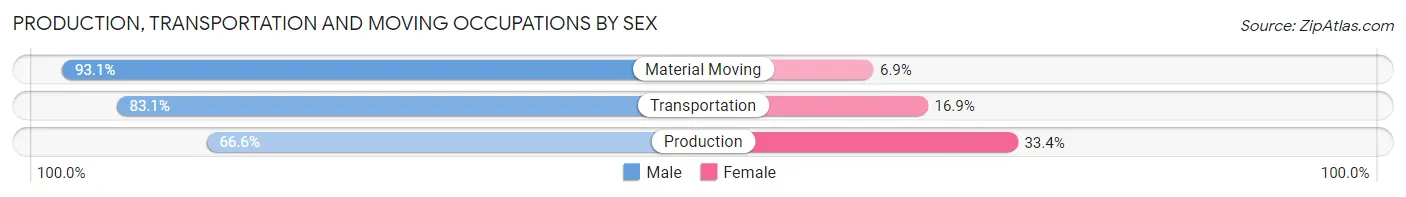
| Occupation | Male | Female |
| Production | 457 (66.6%) | 229 (33.4%) |
| Transportation | 64 (83.1%) | 13 (16.9%) |
| Material Moving | 298 (93.1%) | 22 (6.9%) |
| Total (Category) | 819 (75.6%) | 264 (24.4%) |
| Total (Overall) | 2,358 (54.5%) | 1,966 (45.5%) |
Employment Industries by Sex in Mount Pleasant
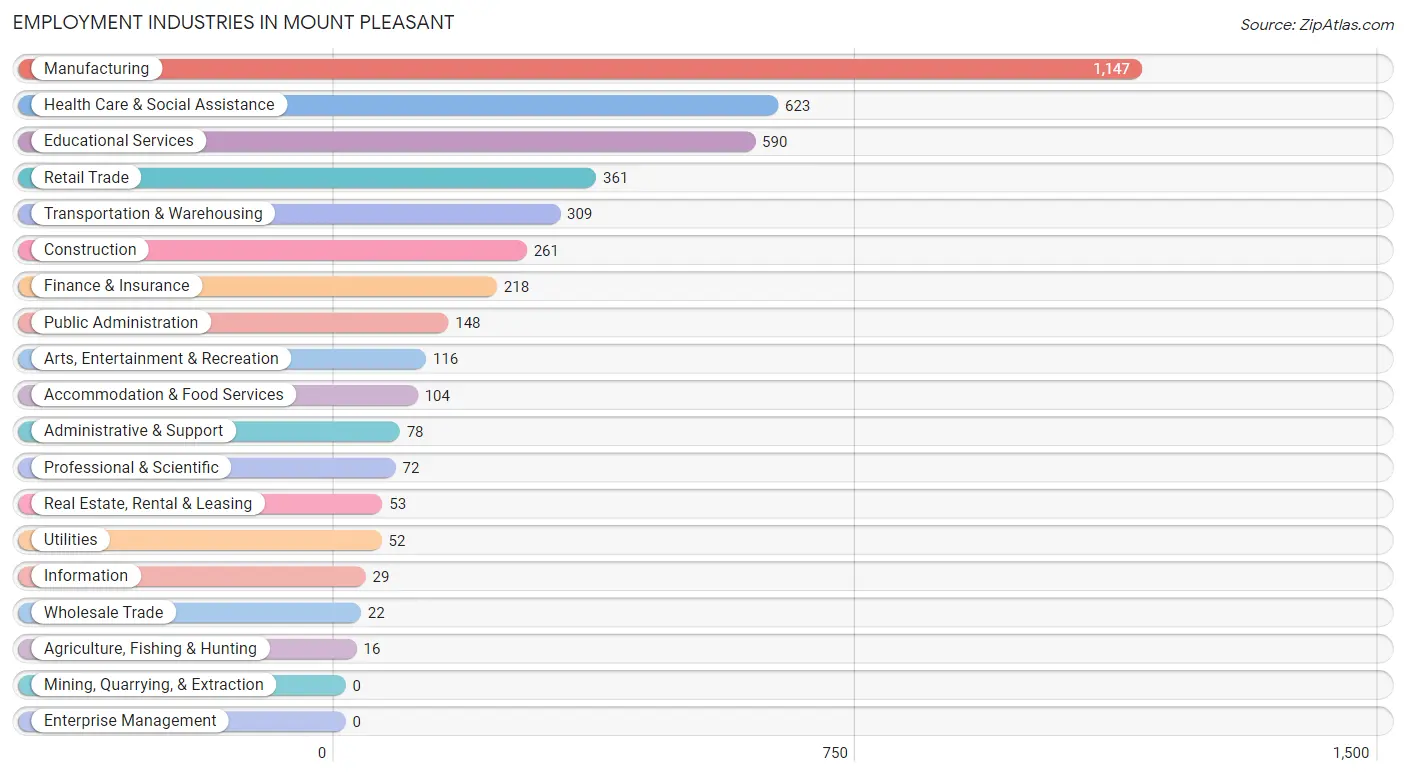
Employment Industries in Mount Pleasant
The major employment industries in Mount Pleasant include Manufacturing (1,147 | 26.5%), Health Care & Social Assistance (623 | 14.4%), Educational Services (590 | 13.6%), Retail Trade (361 | 8.4%), and Transportation & Warehousing (309 | 7.1%).
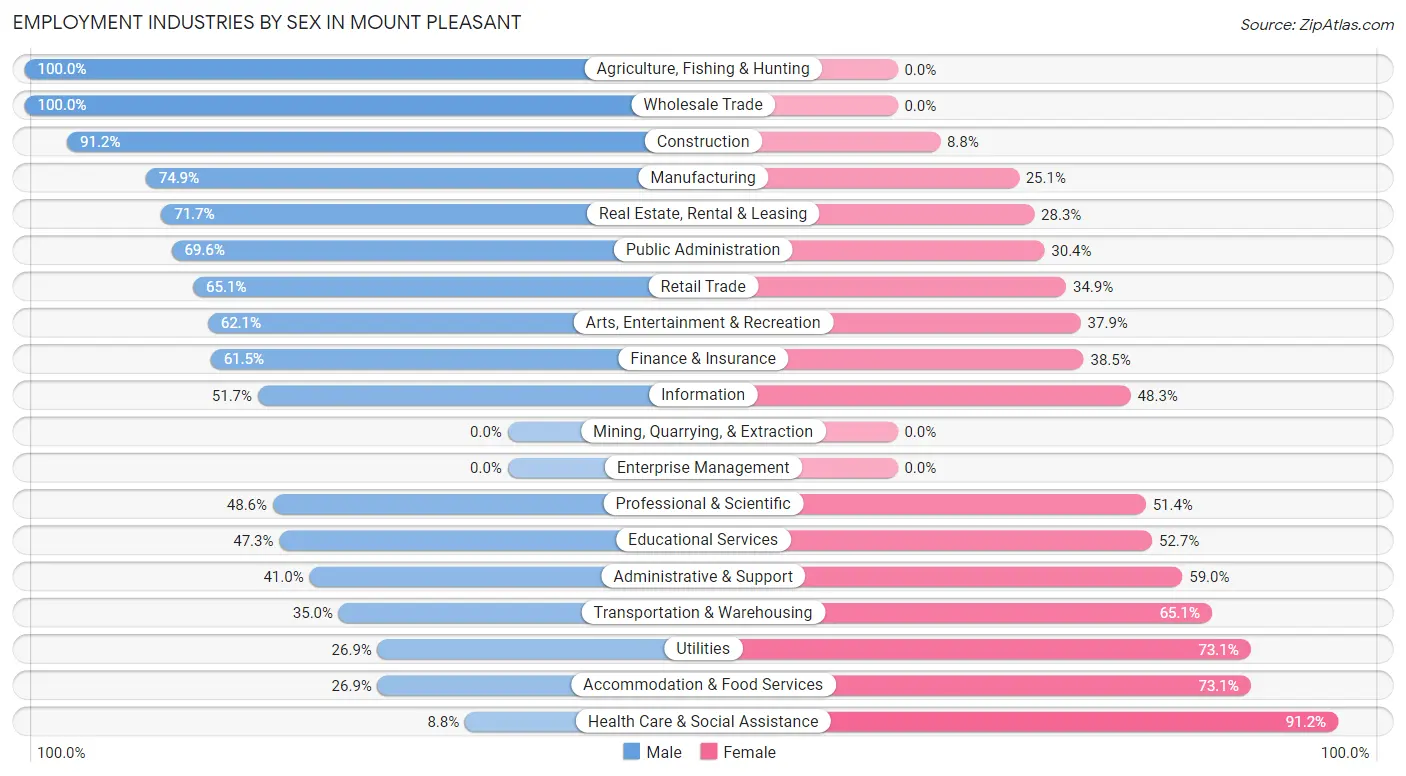
Employment Industries by Sex in Mount Pleasant
The Mount Pleasant industries that see more men than women are Agriculture, Fishing & Hunting (100.0%), Wholesale Trade (100.0%), and Construction (91.2%), whereas the industries that tend to have a higher number of women are Health Care & Social Assistance (91.2%), Utilities (73.1%), and Accommodation & Food Services (73.1%).
| Industry | Male | Female |
| Agriculture, Fishing & Hunting | 16 (100.0%) | 0 (0.0%) |
| Mining, Quarrying, & Extraction | 0 (0.0%) | 0 (0.0%) |
| Construction | 238 (91.2%) | 23 (8.8%) |
| Manufacturing | 859 (74.9%) | 288 (25.1%) |
| Wholesale Trade | 22 (100.0%) | 0 (0.0%) |
| Retail Trade | 235 (65.1%) | 126 (34.9%) |
| Transportation & Warehousing | 108 (34.9%) | 201 (65.0%) |
| Utilities | 14 (26.9%) | 38 (73.1%) |
| Information | 15 (51.7%) | 14 (48.3%) |
| Finance & Insurance | 134 (61.5%) | 84 (38.5%) |
| Real Estate, Rental & Leasing | 38 (71.7%) | 15 (28.3%) |
| Professional & Scientific | 35 (48.6%) | 37 (51.4%) |
| Enterprise Management | 0 (0.0%) | 0 (0.0%) |
| Administrative & Support | 32 (41.0%) | 46 (59.0%) |
| Educational Services | 279 (47.3%) | 311 (52.7%) |
| Health Care & Social Assistance | 55 (8.8%) | 568 (91.2%) |
| Arts, Entertainment & Recreation | 72 (62.1%) | 44 (37.9%) |
| Accommodation & Food Services | 28 (26.9%) | 76 (73.1%) |
| Public Administration | 103 (69.6%) | 45 (30.4%) |
| Total | 2,358 (54.5%) | 1,966 (45.5%) |
Education in Mount Pleasant
School Enrollment in Mount Pleasant
The most common levels of schooling among the 2,195 students in Mount Pleasant are college / undergraduate (710 | 32.4%), middle school (544 | 24.8%), and high school (429 | 19.5%).
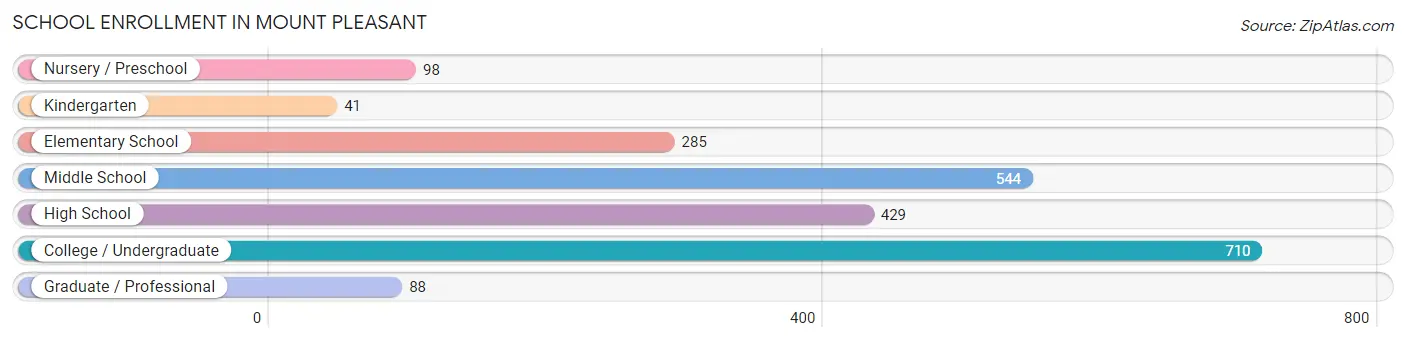
| School Level | # Students | % Students |
| Nursery / Preschool | 98 | 4.5% |
| Kindergarten | 41 | 1.9% |
| Elementary School | 285 | 13.0% |
| Middle School | 544 | 24.8% |
| High School | 429 | 19.5% |
| College / Undergraduate | 710 | 32.4% |
| Graduate / Professional | 88 | 4.0% |
| Total | 2,195 | 100.0% |
School Enrollment by Age by Funding Source in Mount Pleasant
Out of a total of 2,195 students who are enrolled in schools in Mount Pleasant, 654 (29.8%) attend a private institution, while the remaining 1,541 (70.2%) are enrolled in public schools. The age group of 20 to 24 year olds has the highest likelihood of being enrolled in private schools, with 324 (70.9% in the age bracket) enrolled. Conversely, the age group of 3 to 4 year olds has the lowest likelihood of being enrolled in a private school, with 98 (100.0% in the age bracket) attending a public institution.
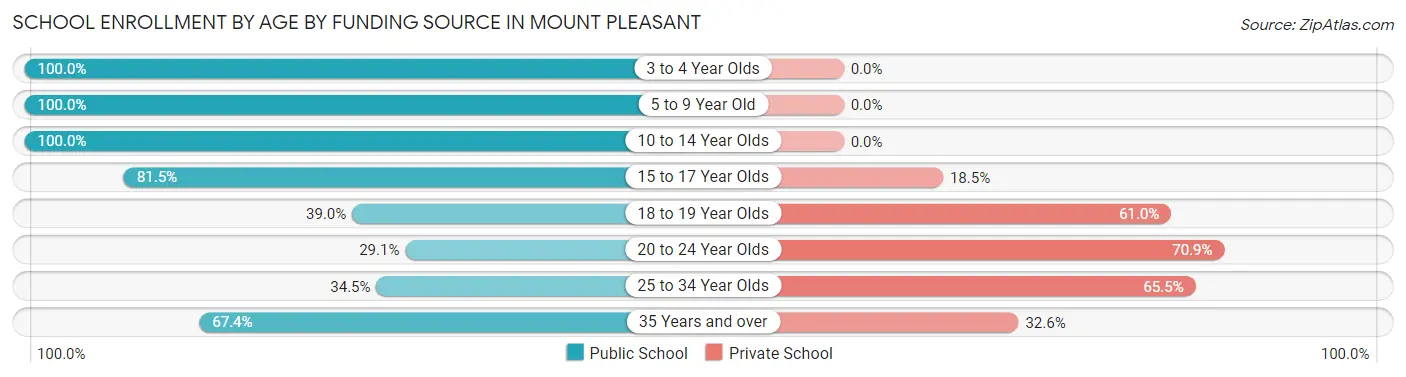
| Age Bracket | Public School | Private School |
| 3 to 4 Year Olds | 98 (100.0%) | 0 (0.0%) |
| 5 to 9 Year Old | 275 (100.0%) | 0 (0.0%) |
| 10 to 14 Year Olds | 586 (100.0%) | 0 (0.0%) |
| 15 to 17 Year Olds | 260 (81.5%) | 59 (18.5%) |
| 18 to 19 Year Olds | 140 (39.0%) | 219 (61.0%) |
| 20 to 24 Year Olds | 133 (29.1%) | 324 (70.9%) |
| 25 to 34 Year Olds | 20 (34.5%) | 38 (65.5%) |
| 35 Years and over | 29 (67.4%) | 14 (32.6%) |
| Total | 1,541 (70.2%) | 654 (29.8%) |
Educational Attainment by Field of Study in Mount Pleasant
Business (414 | 22.9%), education (327 | 18.1%), psychology (186 | 10.3%), arts & humanities (166 | 9.2%), and science & technology (143 | 7.9%) are the most common fields of study among 1,808 individuals in Mount Pleasant who have obtained a bachelor's degree or higher.
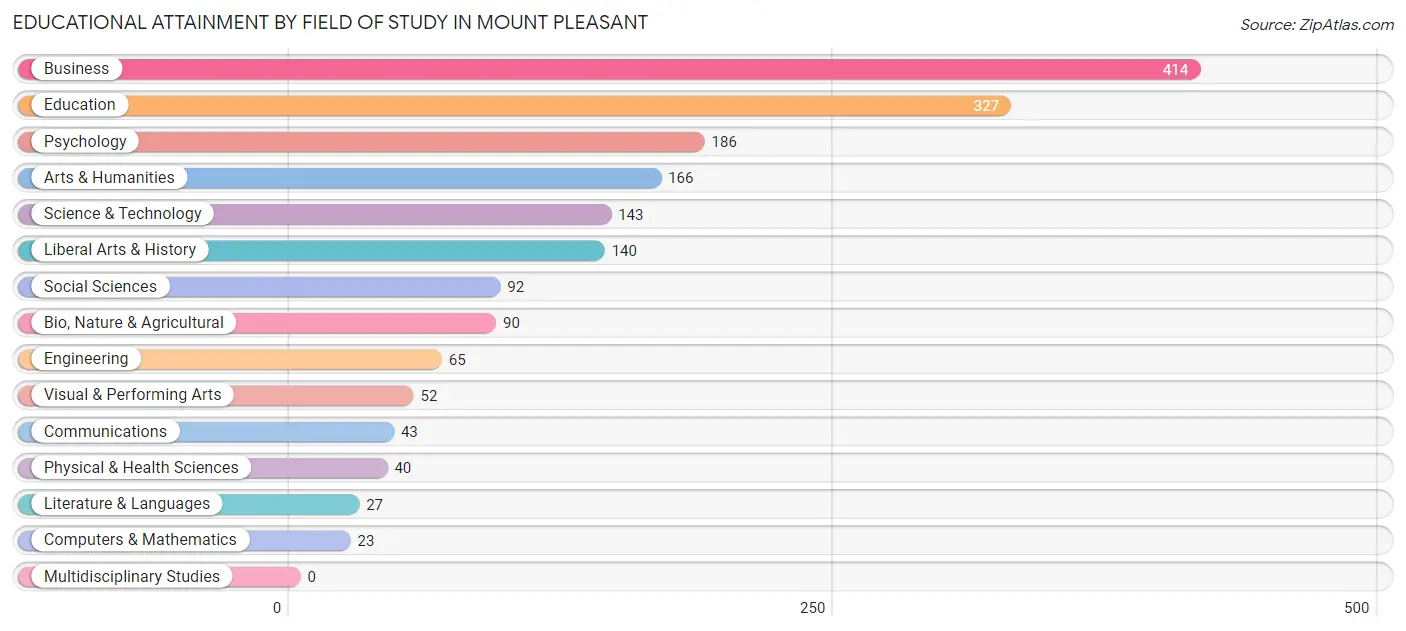
| Field of Study | # Graduates | % Graduates |
| Computers & Mathematics | 23 | 1.3% |
| Bio, Nature & Agricultural | 90 | 5.0% |
| Physical & Health Sciences | 40 | 2.2% |
| Psychology | 186 | 10.3% |
| Social Sciences | 92 | 5.1% |
| Engineering | 65 | 3.6% |
| Multidisciplinary Studies | 0 | 0.0% |
| Science & Technology | 143 | 7.9% |
| Business | 414 | 22.9% |
| Education | 327 | 18.1% |
| Literature & Languages | 27 | 1.5% |
| Liberal Arts & History | 140 | 7.7% |
| Visual & Performing Arts | 52 | 2.9% |
| Communications | 43 | 2.4% |
| Arts & Humanities | 166 | 9.2% |
| Total | 1,808 | 100.0% |
Transportation & Commute in Mount Pleasant
Vehicle Availability by Sex in Mount Pleasant
The most prevalent vehicle ownership categories in Mount Pleasant are males with 2 vehicles (1,016, accounting for 44.6%) and females with 2 vehicles (759, making up 57.0%).
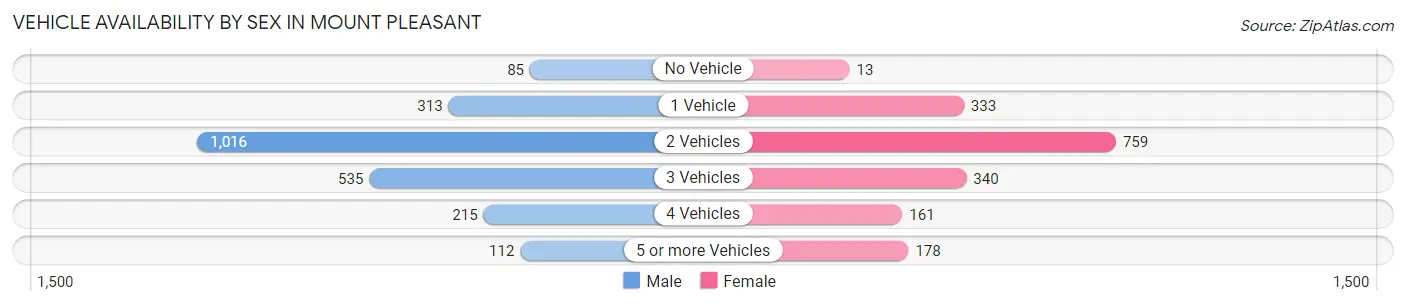
| Vehicles Available | Male | Female |
| No Vehicle | 85 (3.7%) | 13 (0.7%) |
| 1 Vehicle | 313 (13.8%) | 333 (18.7%) |
| 2 Vehicles | 1,016 (44.6%) | 759 (42.5%) |
| 3 Vehicles | 535 (23.5%) | 340 (19.1%) |
| 4 Vehicles | 215 (9.5%) | 161 (9.0%) |
| 5 or more Vehicles | 112 (4.9%) | 178 (10.0%) |
| Total | 2,276 (100.0%) | 1,784 (100.0%) |
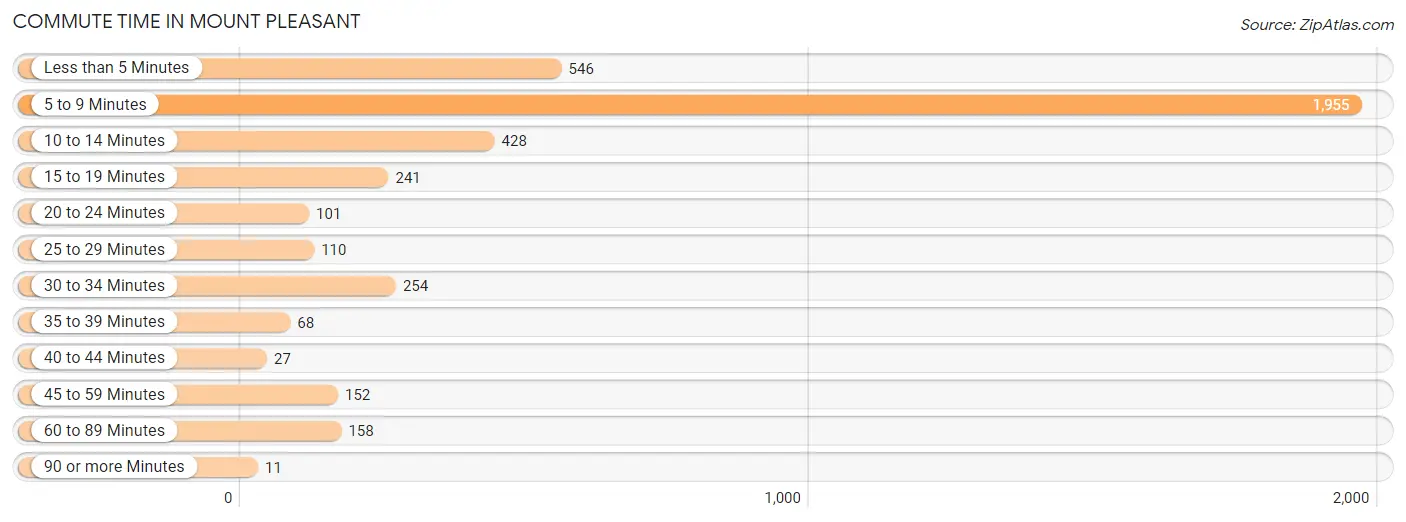
Commute Time in Mount Pleasant
The most frequently occuring commute durations in Mount Pleasant are 5 to 9 minutes (1,955 commuters, 48.3%), less than 5 minutes (546 commuters, 13.5%), and 10 to 14 minutes (428 commuters, 10.6%).
| Commute Time | # Commuters | % Commuters |
| Less than 5 Minutes | 546 | 13.5% |
| 5 to 9 Minutes | 1,955 | 48.3% |
| 10 to 14 Minutes | 428 | 10.6% |
| 15 to 19 Minutes | 241 | 5.9% |
| 20 to 24 Minutes | 101 | 2.5% |
| 25 to 29 Minutes | 110 | 2.7% |
| 30 to 34 Minutes | 254 | 6.3% |
| 35 to 39 Minutes | 68 | 1.7% |
| 40 to 44 Minutes | 27 | 0.7% |
| 45 to 59 Minutes | 152 | 3.7% |
| 60 to 89 Minutes | 158 | 3.9% |
| 90 or more Minutes | 11 | 0.3% |
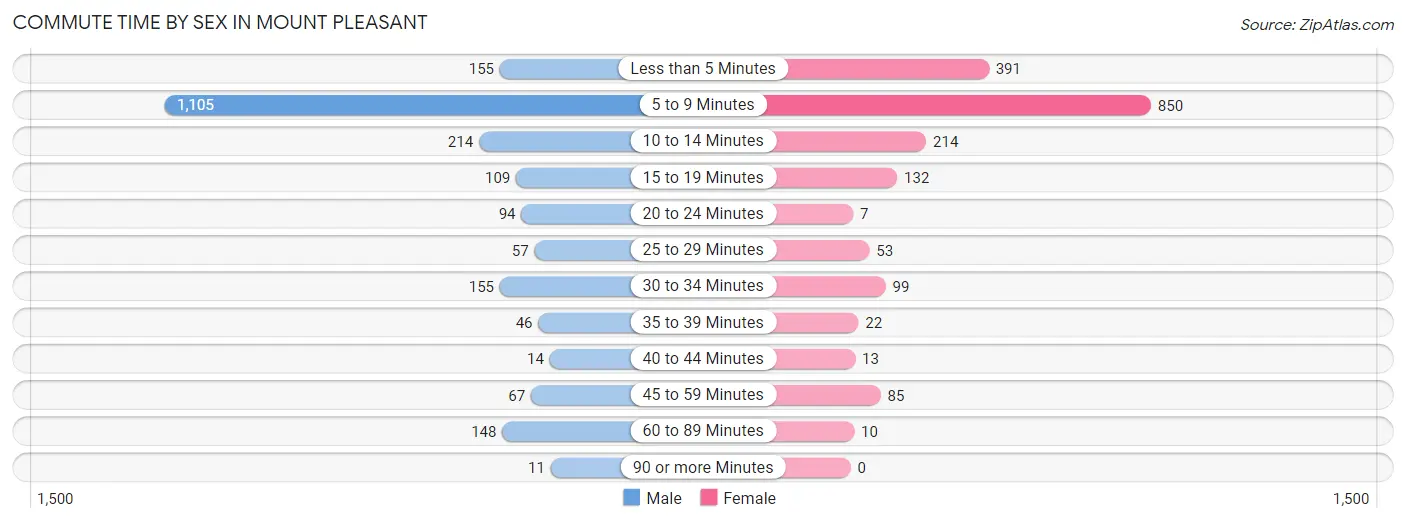
Commute Time by Sex in Mount Pleasant
The most common commute times in Mount Pleasant are 5 to 9 minutes (1,105 commuters, 50.8%) for males and 5 to 9 minutes (850 commuters, 45.3%) for females.
| Commute Time | Male | Female |
| Less than 5 Minutes | 155 (7.1%) | 391 (20.8%) |
| 5 to 9 Minutes | 1,105 (50.8%) | 850 (45.3%) |
| 10 to 14 Minutes | 214 (9.8%) | 214 (11.4%) |
| 15 to 19 Minutes | 109 (5.0%) | 132 (7.0%) |
| 20 to 24 Minutes | 94 (4.3%) | 7 (0.4%) |
| 25 to 29 Minutes | 57 (2.6%) | 53 (2.8%) |
| 30 to 34 Minutes | 155 (7.1%) | 99 (5.3%) |
| 35 to 39 Minutes | 46 (2.1%) | 22 (1.2%) |
| 40 to 44 Minutes | 14 (0.6%) | 13 (0.7%) |
| 45 to 59 Minutes | 67 (3.1%) | 85 (4.5%) |
| 60 to 89 Minutes | 148 (6.8%) | 10 (0.5%) |
| 90 or more Minutes | 11 (0.5%) | 0 (0.0%) |
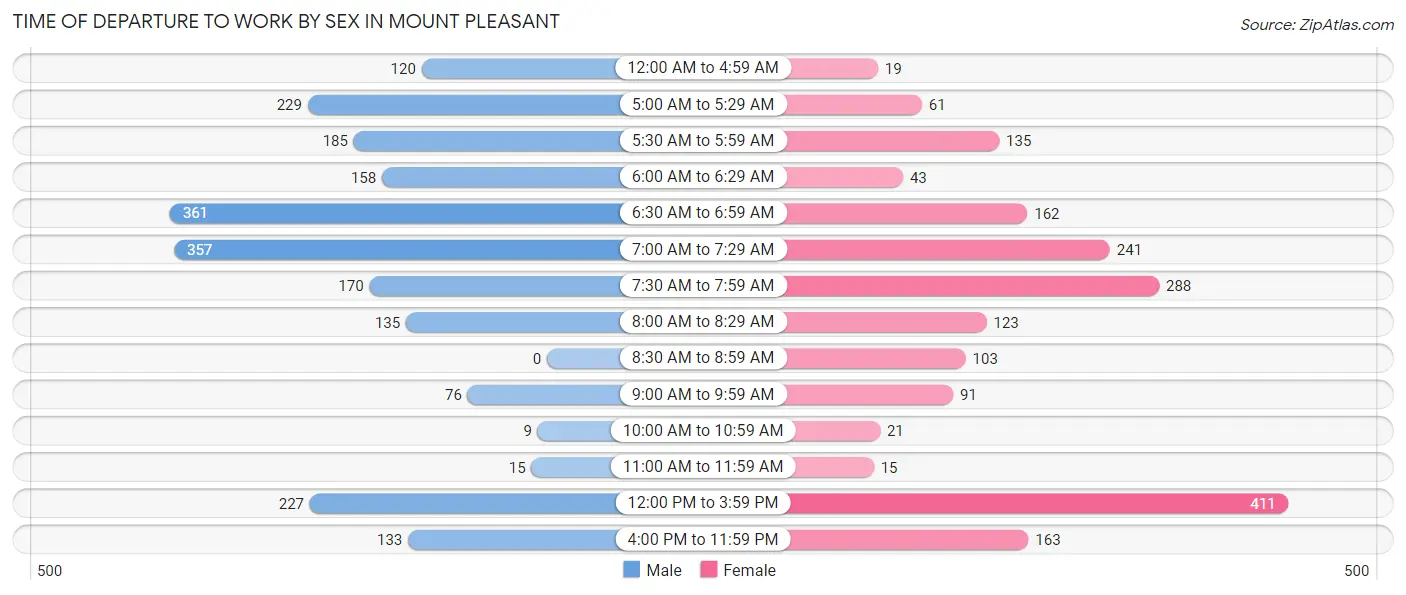
Time of Departure to Work by Sex in Mount Pleasant
The most frequent times of departure to work in Mount Pleasant are 6:30 AM to 6:59 AM (361, 16.6%) for males and 12:00 PM to 3:59 PM (411, 21.9%) for females.
| Time of Departure | Male | Female |
| 12:00 AM to 4:59 AM | 120 (5.5%) | 19 (1.0%) |
| 5:00 AM to 5:29 AM | 229 (10.5%) | 61 (3.3%) |
| 5:30 AM to 5:59 AM | 185 (8.5%) | 135 (7.2%) |
| 6:00 AM to 6:29 AM | 158 (7.3%) | 43 (2.3%) |
| 6:30 AM to 6:59 AM | 361 (16.6%) | 162 (8.6%) |
| 7:00 AM to 7:29 AM | 357 (16.4%) | 241 (12.9%) |
| 7:30 AM to 7:59 AM | 170 (7.8%) | 288 (15.3%) |
| 8:00 AM to 8:29 AM | 135 (6.2%) | 123 (6.6%) |
| 8:30 AM to 8:59 AM | 0 (0.0%) | 103 (5.5%) |
| 9:00 AM to 9:59 AM | 76 (3.5%) | 91 (4.9%) |
| 10:00 AM to 10:59 AM | 9 (0.4%) | 21 (1.1%) |
| 11:00 AM to 11:59 AM | 15 (0.7%) | 15 (0.8%) |
| 12:00 PM to 3:59 PM | 227 (10.4%) | 411 (21.9%) |
| 4:00 PM to 11:59 PM | 133 (6.1%) | 163 (8.7%) |
| Total | 2,175 (100.0%) | 1,876 (100.0%) |
Housing Occupancy in Mount Pleasant
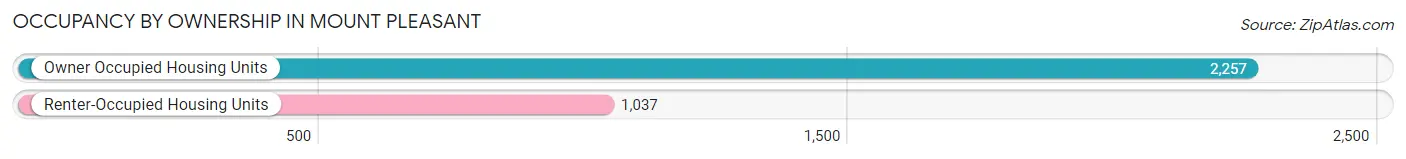
Occupancy by Ownership in Mount Pleasant
Of the total 3,294 dwellings in Mount Pleasant, owner-occupied units account for 2,257 (68.5%), while renter-occupied units make up 1,037 (31.5%).
| Occupancy | # Housing Units | % Housing Units |
| Owner Occupied Housing Units | 2,257 | 68.5% |
| Renter-Occupied Housing Units | 1,037 | 31.5% |
| Total Occupied Housing Units | 3,294 | 100.0% |
Occupancy by Household Size in Mount Pleasant
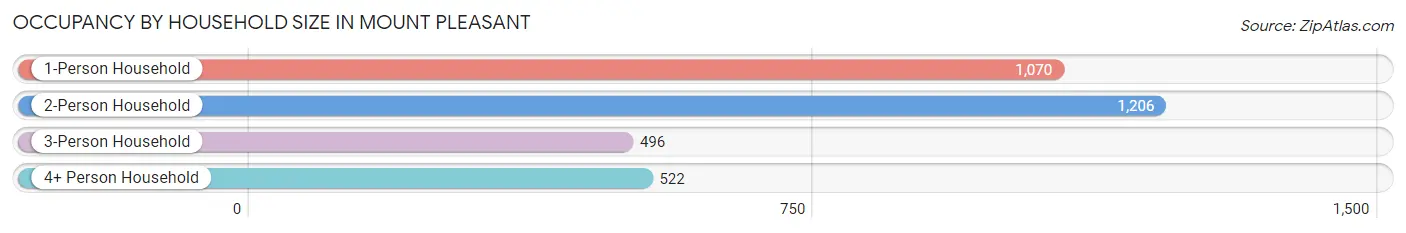
| Household Size | # Housing Units | % Housing Units |
| 1-Person Household | 1,070 | 32.5% |
| 2-Person Household | 1,206 | 36.6% |
| 3-Person Household | 496 | 15.1% |
| 4+ Person Household | 522 | 15.9% |
| Total Housing Units | 3,294 | 100.0% |
Occupancy by Ownership by Household Size in Mount Pleasant
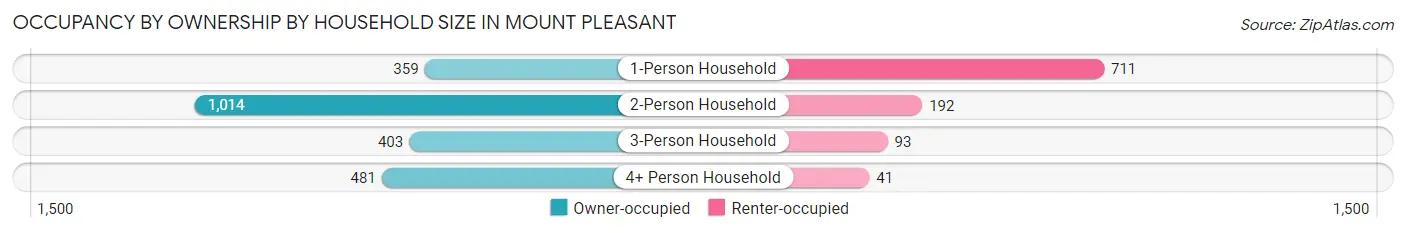
| Household Size | Owner-occupied | Renter-occupied |
| 1-Person Household | 359 (33.6%) | 711 (66.4%) |
| 2-Person Household | 1,014 (84.1%) | 192 (15.9%) |
| 3-Person Household | 403 (81.2%) | 93 (18.8%) |
| 4+ Person Household | 481 (92.1%) | 41 (7.9%) |
| Total Housing Units | 2,257 (68.5%) | 1,037 (31.5%) |
Occupancy by Educational Attainment in Mount Pleasant
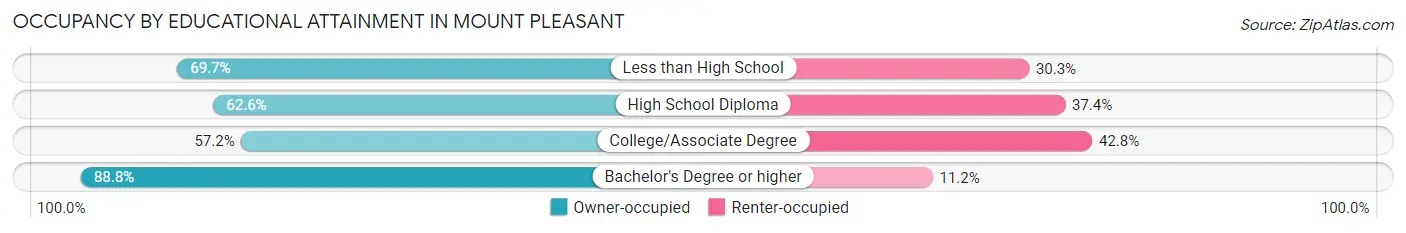
| Household Size | Owner-occupied | Renter-occupied |
| Less than High School | 214 (69.7%) | 93 (30.3%) |
| High School Diploma | 533 (62.6%) | 319 (37.4%) |
| College/Associate Degree | 699 (57.2%) | 523 (42.8%) |
| Bachelor's Degree or higher | 811 (88.8%) | 102 (11.2%) |
Occupancy by Age of Householder in Mount Pleasant
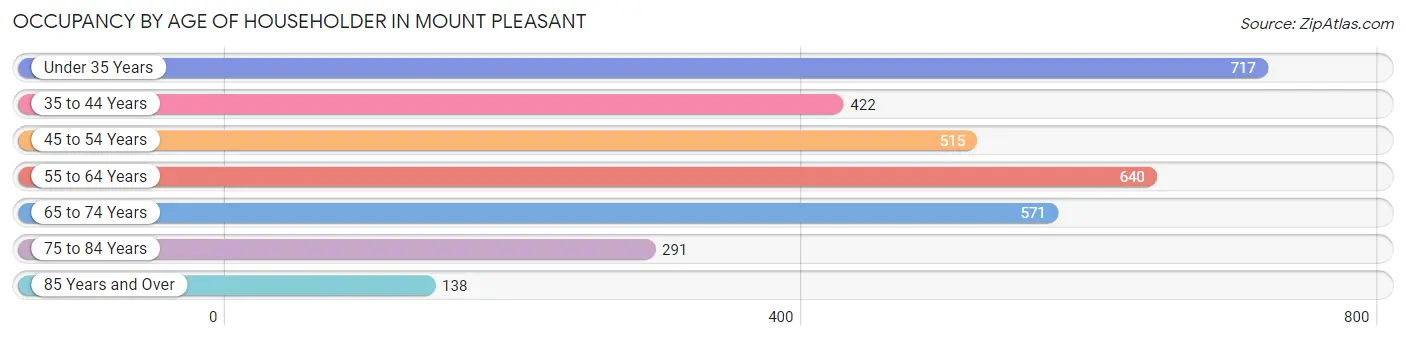
| Age Bracket | # Households | % Households |
| Under 35 Years | 717 | 21.8% |
| 35 to 44 Years | 422 | 12.8% |
| 45 to 54 Years | 515 | 15.6% |
| 55 to 64 Years | 640 | 19.4% |
| 65 to 74 Years | 571 | 17.3% |
| 75 to 84 Years | 291 | 8.8% |
| 85 Years and Over | 138 | 4.2% |
| Total | 3,294 | 100.0% |
Housing Finances in Mount Pleasant
Median Income by Occupancy in Mount Pleasant
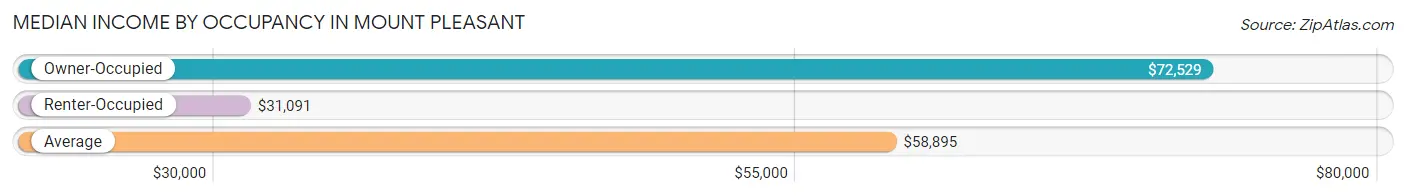
| Occupancy Type | # Households | Median Income |
| Owner-Occupied | 2,257 (68.5%) | $72,529 |
| Renter-Occupied | 1,037 (31.5%) | $31,091 |
| Average | 3,294 (100.0%) | $58,895 |
Occupancy by Householder Income Bracket in Mount Pleasant
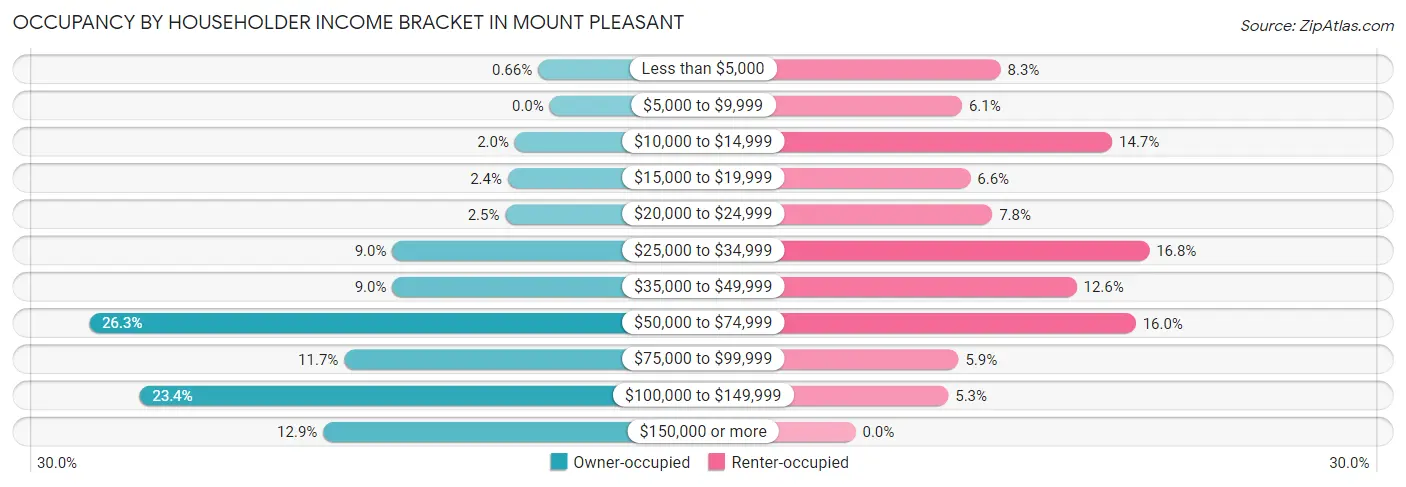
| Income Bracket | Owner-occupied | Renter-occupied |
| Less than $5,000 | 15 (0.7%) | 86 (8.3%) |
| $5,000 to $9,999 | 0 (0.0%) | 63 (6.1%) |
| $10,000 to $14,999 | 45 (2.0%) | 152 (14.7%) |
| $15,000 to $19,999 | 54 (2.4%) | 68 (6.6%) |
| $20,000 to $24,999 | 57 (2.5%) | 81 (7.8%) |
| $25,000 to $34,999 | 203 (9.0%) | 174 (16.8%) |
| $35,000 to $49,999 | 203 (9.0%) | 131 (12.6%) |
| $50,000 to $74,999 | 594 (26.3%) | 166 (16.0%) |
| $75,000 to $99,999 | 265 (11.7%) | 61 (5.9%) |
| $100,000 to $149,999 | 529 (23.4%) | 55 (5.3%) |
| $150,000 or more | 292 (12.9%) | 0 (0.0%) |
| Total | 2,257 (100.0%) | 1,037 (100.0%) |
Monthly Housing Cost Tiers in Mount Pleasant
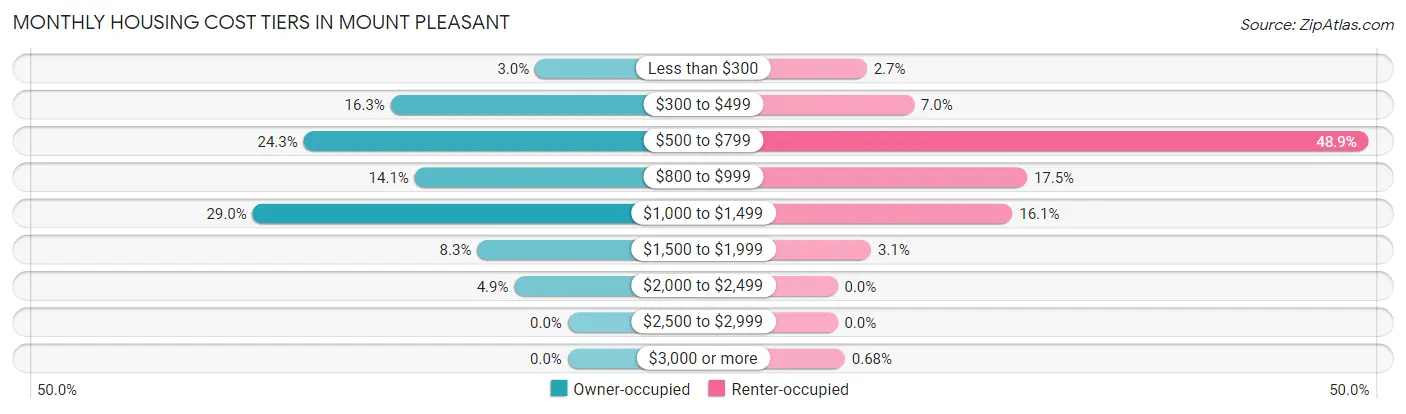
| Monthly Cost | Owner-occupied | Renter-occupied |
| Less than $300 | 68 (3.0%) | 28 (2.7%) |
| $300 to $499 | 368 (16.3%) | 73 (7.0%) |
| $500 to $799 | 549 (24.3%) | 507 (48.9%) |
| $800 to $999 | 318 (14.1%) | 181 (17.4%) |
| $1,000 to $1,499 | 655 (29.0%) | 167 (16.1%) |
| $1,500 to $1,999 | 188 (8.3%) | 32 (3.1%) |
| $2,000 to $2,499 | 111 (4.9%) | 0 (0.0%) |
| $2,500 to $2,999 | 0 (0.0%) | 0 (0.0%) |
| $3,000 or more | 0 (0.0%) | 7 (0.7%) |
| Total | 2,257 (100.0%) | 1,037 (100.0%) |
Physical Housing Characteristics in Mount Pleasant
Housing Structures in Mount Pleasant
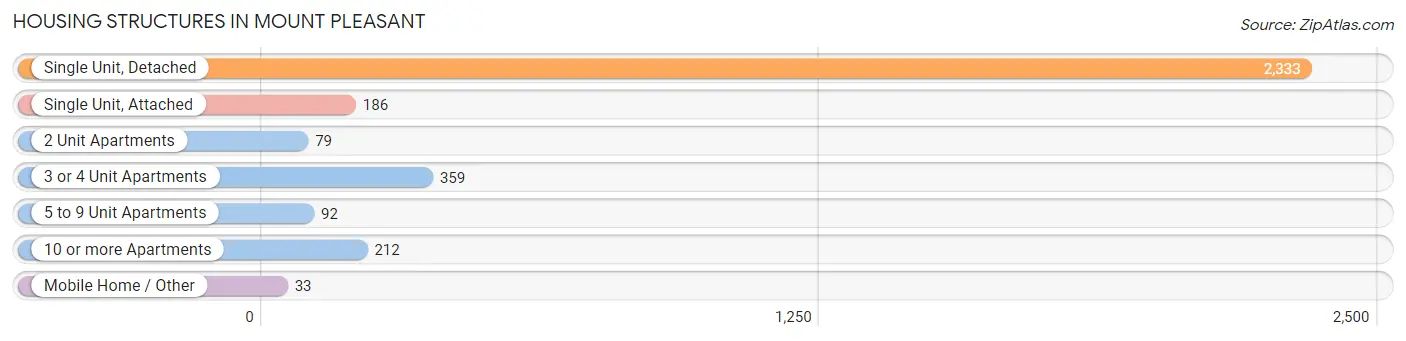
| Structure Type | # Housing Units | % Housing Units |
| Single Unit, Detached | 2,333 | 70.8% |
| Single Unit, Attached | 186 | 5.7% |
| 2 Unit Apartments | 79 | 2.4% |
| 3 or 4 Unit Apartments | 359 | 10.9% |
| 5 to 9 Unit Apartments | 92 | 2.8% |
| 10 or more Apartments | 212 | 6.4% |
| Mobile Home / Other | 33 | 1.0% |
| Total | 3,294 | 100.0% |
Housing Structures by Occupancy in Mount Pleasant
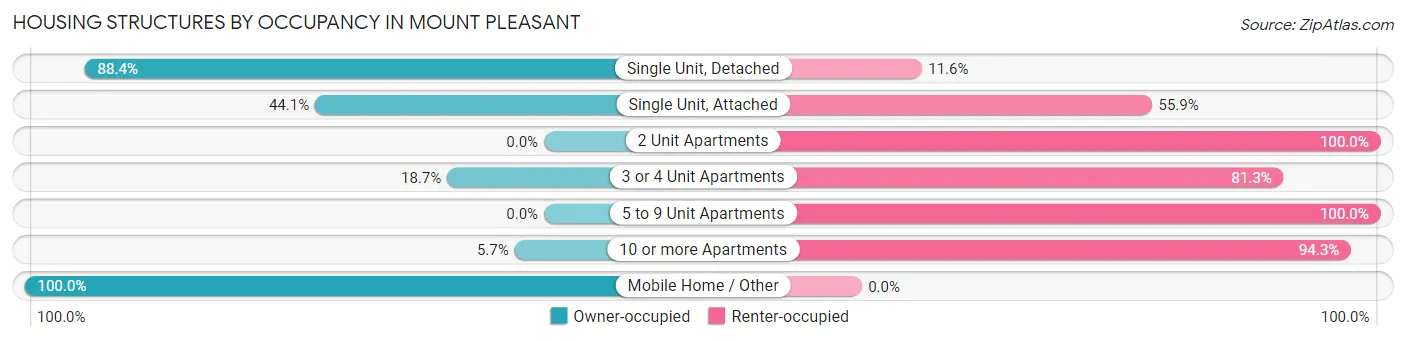
| Structure Type | Owner-occupied | Renter-occupied |
| Single Unit, Detached | 2,063 (88.4%) | 270 (11.6%) |
| Single Unit, Attached | 82 (44.1%) | 104 (55.9%) |
| 2 Unit Apartments | 0 (0.0%) | 79 (100.0%) |
| 3 or 4 Unit Apartments | 67 (18.7%) | 292 (81.3%) |
| 5 to 9 Unit Apartments | 0 (0.0%) | 92 (100.0%) |
| 10 or more Apartments | 12 (5.7%) | 200 (94.3%) |
| Mobile Home / Other | 33 (100.0%) | 0 (0.0%) |
| Total | 2,257 (68.5%) | 1,037 (31.5%) |
Housing Structures by Number of Rooms in Mount Pleasant
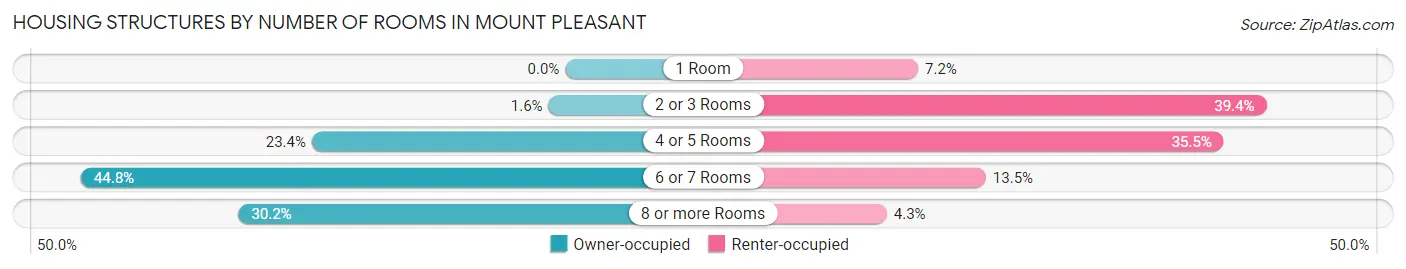
| Number of Rooms | Owner-occupied | Renter-occupied |
| 1 Room | 0 (0.0%) | 75 (7.2%) |
| 2 or 3 Rooms | 35 (1.5%) | 409 (39.4%) |
| 4 or 5 Rooms | 529 (23.4%) | 368 (35.5%) |
| 6 or 7 Rooms | 1,011 (44.8%) | 140 (13.5%) |
| 8 or more Rooms | 682 (30.2%) | 45 (4.3%) |
| Total | 2,257 (100.0%) | 1,037 (100.0%) |
Housing Structure by Heating Type in Mount Pleasant
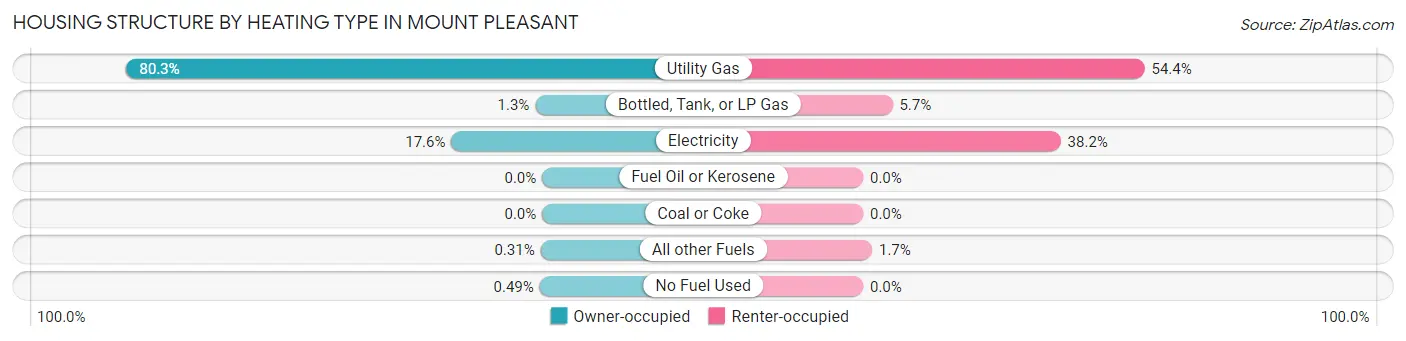
| Heating Type | Owner-occupied | Renter-occupied |
| Utility Gas | 1,813 (80.3%) | 564 (54.4%) |
| Bottled, Tank, or LP Gas | 30 (1.3%) | 59 (5.7%) |
| Electricity | 396 (17.5%) | 396 (38.2%) |
| Fuel Oil or Kerosene | 0 (0.0%) | 0 (0.0%) |
| Coal or Coke | 0 (0.0%) | 0 (0.0%) |
| All other Fuels | 7 (0.3%) | 18 (1.7%) |
| No Fuel Used | 11 (0.5%) | 0 (0.0%) |
| Total | 2,257 (100.0%) | 1,037 (100.0%) |
Household Vehicle Usage in Mount Pleasant
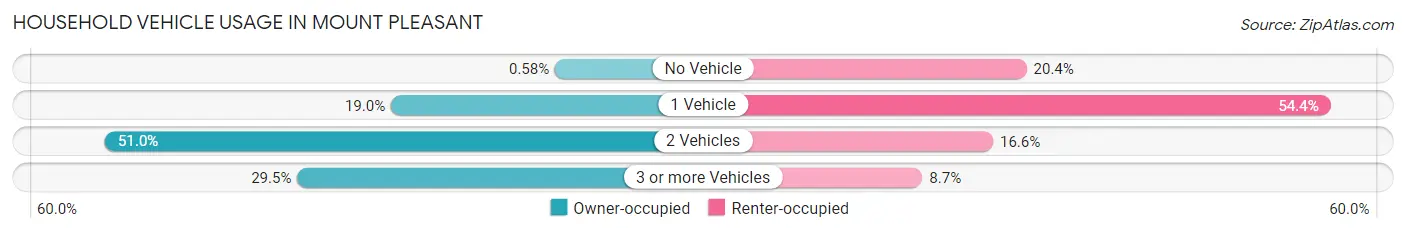
| Vehicles per Household | Owner-occupied | Renter-occupied |
| No Vehicle | 13 (0.6%) | 211 (20.3%) |
| 1 Vehicle | 428 (19.0%) | 564 (54.4%) |
| 2 Vehicles | 1,151 (51.0%) | 172 (16.6%) |
| 3 or more Vehicles | 665 (29.5%) | 90 (8.7%) |
| Total | 2,257 (100.0%) | 1,037 (100.0%) |
Real Estate & Mortgages in Mount Pleasant
Real Estate and Mortgage Overview in Mount Pleasant
| Characteristic | Without Mortgage | With Mortgage |
| Housing Units | 1,027 | 1,230 |
| Median Property Value | $146,900 | $139,300 |
| Median Household Income | $62,321 | $176 |
| Monthly Housing Costs | $535 | $0 |
| Real Estate Taxes | $2,548 | $10 |
Property Value by Mortgage Status in Mount Pleasant
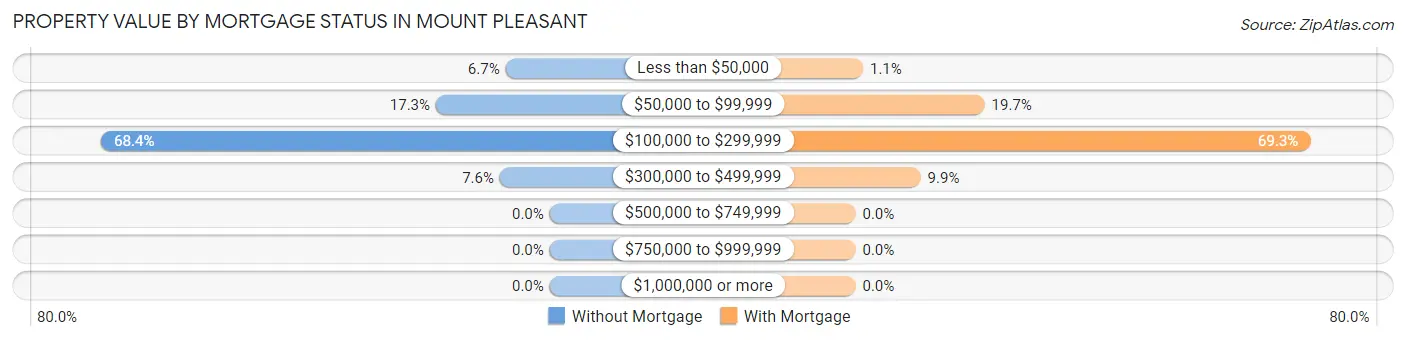
| Property Value | Without Mortgage | With Mortgage |
| Less than $50,000 | 69 (6.7%) | 14 (1.1%) |
| $50,000 to $99,999 | 178 (17.3%) | 242 (19.7%) |
| $100,000 to $299,999 | 702 (68.3%) | 852 (69.3%) |
| $300,000 to $499,999 | 78 (7.6%) | 122 (9.9%) |
| $500,000 to $749,999 | 0 (0.0%) | 0 (0.0%) |
| $750,000 to $999,999 | 0 (0.0%) | 0 (0.0%) |
| $1,000,000 or more | 0 (0.0%) | 0 (0.0%) |
| Total | 1,027 (100.0%) | 1,230 (100.0%) |
Household Income by Mortgage Status in Mount Pleasant
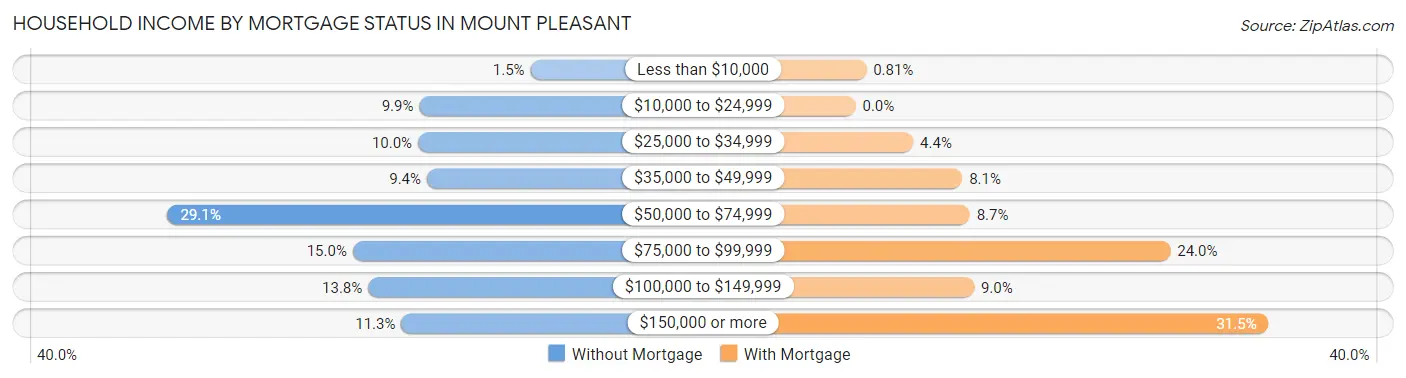
| Household Income | Without Mortgage | With Mortgage |
| Less than $10,000 | 15 (1.5%) | 10 (0.8%) |
| $10,000 to $24,999 | 102 (9.9%) | 0 (0.0%) |
| $25,000 to $34,999 | 103 (10.0%) | 54 (4.4%) |
| $35,000 to $49,999 | 96 (9.3%) | 100 (8.1%) |
| $50,000 to $74,999 | 299 (29.1%) | 107 (8.7%) |
| $75,000 to $99,999 | 154 (15.0%) | 295 (24.0%) |
| $100,000 to $149,999 | 142 (13.8%) | 111 (9.0%) |
| $150,000 or more | 116 (11.3%) | 387 (31.5%) |
| Total | 1,027 (100.0%) | 1,230 (100.0%) |
Property Value to Household Income Ratio in Mount Pleasant
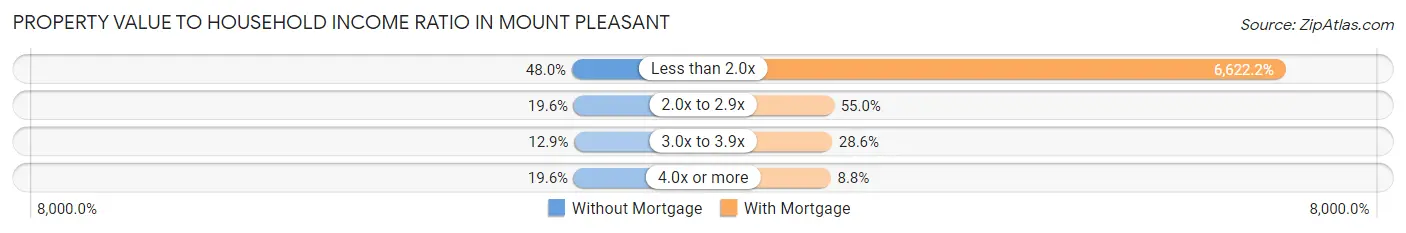
| Value-to-Income Ratio | Without Mortgage | With Mortgage |
| Less than 2.0x | 493 (48.0%) | 81,453 (6,622.2%) |
| 2.0x to 2.9x | 201 (19.6%) | 676 (55.0%) |
| 3.0x to 3.9x | 132 (12.9%) | 352 (28.6%) |
| 4.0x or more | 201 (19.6%) | 108 (8.8%) |
| Total | 1,027 (100.0%) | 1,230 (100.0%) |
Real Estate Taxes by Mortgage Status in Mount Pleasant
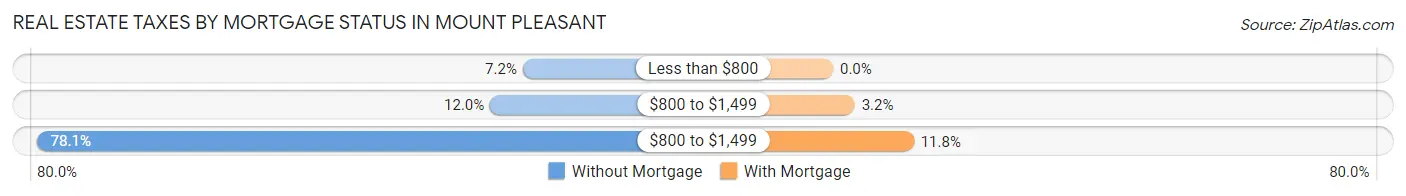
| Property Taxes | Without Mortgage | With Mortgage |
| Less than $800 | 74 (7.2%) | 0 (0.0%) |
| $800 to $1,499 | 123 (12.0%) | 39 (3.2%) |
| $800 to $1,499 | 802 (78.1%) | 145 (11.8%) |
| Total | 1,027 (100.0%) | 1,230 (100.0%) |
Health & Disability in Mount Pleasant
Health Insurance Coverage by Age in Mount Pleasant
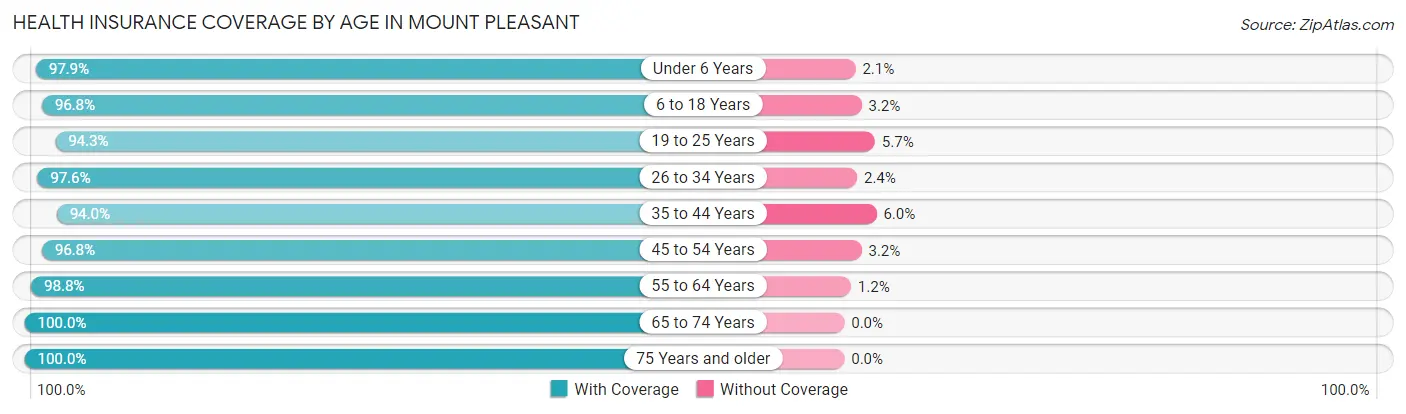
| Age Bracket | With Coverage | Without Coverage |
| Under 6 Years | 421 (97.9%) | 9 (2.1%) |
| 6 to 18 Years | 1,359 (96.8%) | 45 (3.2%) |
| 19 to 25 Years | 1,272 (94.3%) | 77 (5.7%) |
| 26 to 34 Years | 778 (97.6%) | 19 (2.4%) |
| 35 to 44 Years | 627 (94.0%) | 40 (6.0%) |
| 45 to 54 Years | 906 (96.8%) | 30 (3.2%) |
| 55 to 64 Years | 1,123 (98.8%) | 14 (1.2%) |
| 65 to 74 Years | 834 (100.0%) | 0 (0.0%) |
| 75 Years and older | 620 (100.0%) | 0 (0.0%) |
| Total | 7,940 (97.1%) | 234 (2.9%) |
Health Insurance Coverage by Citizenship Status in Mount Pleasant
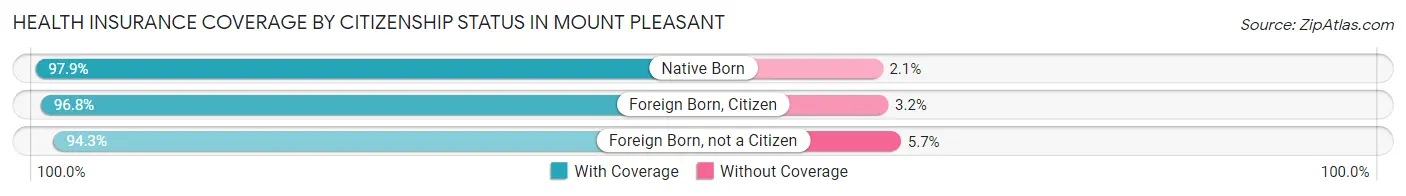
| Citizenship Status | With Coverage | Without Coverage |
| Native Born | 421 (97.9%) | 9 (2.1%) |
| Foreign Born, Citizen | 1,359 (96.8%) | 45 (3.2%) |
| Foreign Born, not a Citizen | 1,272 (94.3%) | 77 (5.7%) |
Health Insurance Coverage by Household Income in Mount Pleasant
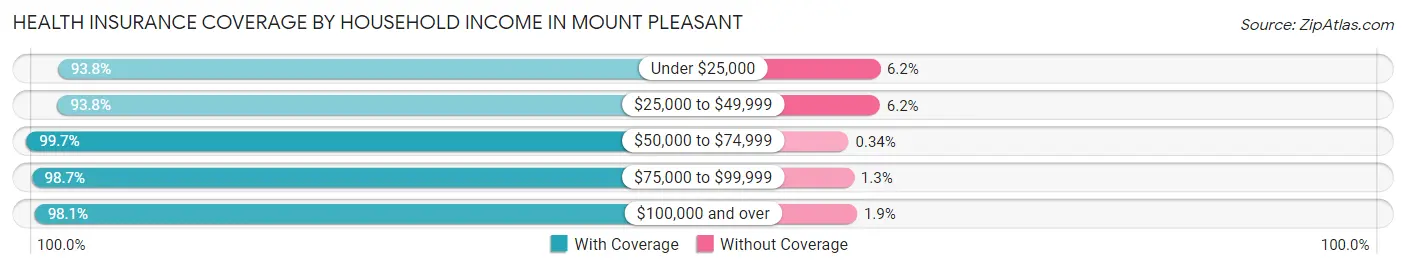
| Household Income | With Coverage | Without Coverage |
| Under $25,000 | 1,040 (93.8%) | 69 (6.2%) |
| $25,000 to $49,999 | 1,272 (93.8%) | 84 (6.2%) |
| $50,000 to $74,999 | 1,781 (99.7%) | 6 (0.3%) |
| $75,000 to $99,999 | 888 (98.7%) | 12 (1.3%) |
| $100,000 and over | 2,535 (98.1%) | 49 (1.9%) |
Public vs Private Health Insurance Coverage by Age in Mount Pleasant
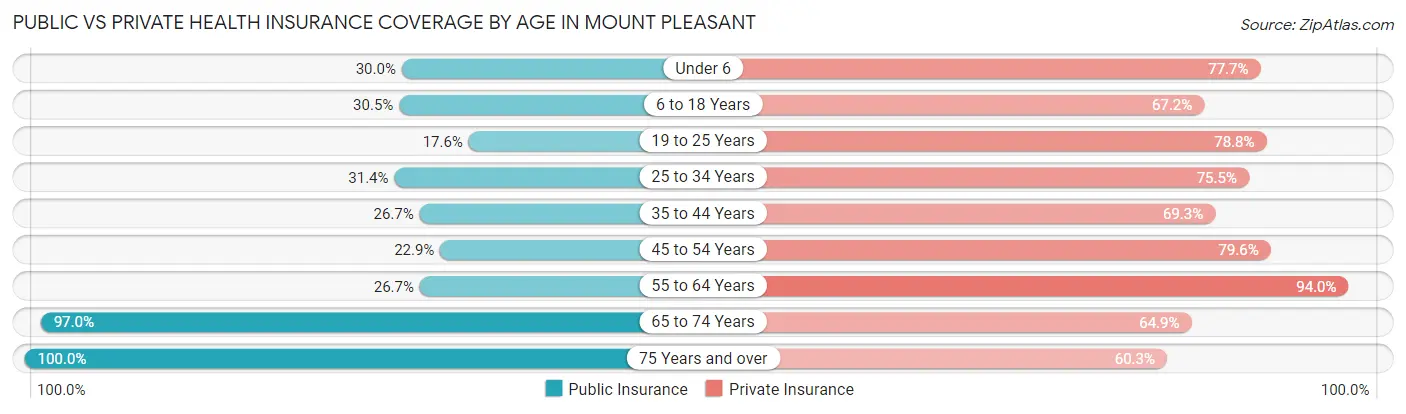
| Age Bracket | Public Insurance | Private Insurance |
| Under 6 | 129 (30.0%) | 334 (77.7%) |
| 6 to 18 Years | 428 (30.5%) | 944 (67.2%) |
| 19 to 25 Years | 237 (17.6%) | 1,063 (78.8%) |
| 25 to 34 Years | 250 (31.4%) | 602 (75.5%) |
| 35 to 44 Years | 178 (26.7%) | 462 (69.3%) |
| 45 to 54 Years | 214 (22.9%) | 745 (79.6%) |
| 55 to 64 Years | 303 (26.7%) | 1,069 (94.0%) |
| 65 to 74 Years | 809 (97.0%) | 541 (64.9%) |
| 75 Years and over | 620 (100.0%) | 374 (60.3%) |
| Total | 3,168 (38.8%) | 6,134 (75.0%) |
Disability Status by Sex by Age in Mount Pleasant
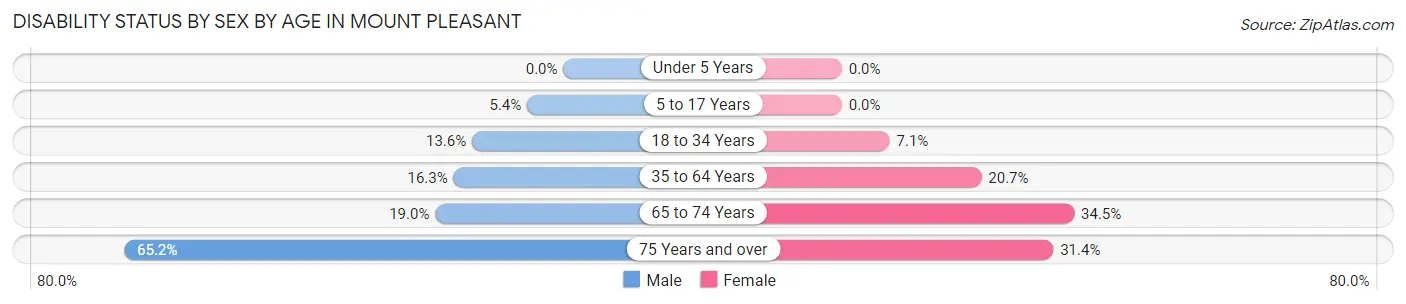
| Age Bracket | Male | Female |
| Under 5 Years | 0 (0.0%) | 0 (0.0%) |
| 5 to 17 Years | 37 (5.4%) | 0 (0.0%) |
| 18 to 34 Years | 177 (13.6%) | 73 (7.1%) |
| 35 to 64 Years | 224 (16.3%) | 283 (20.7%) |
| 65 to 74 Years | 66 (19.0%) | 168 (34.5%) |
| 75 Years and over | 180 (65.2%) | 108 (31.4%) |
Disability Class by Sex by Age in Mount Pleasant
Disability Class: Hearing Difficulty
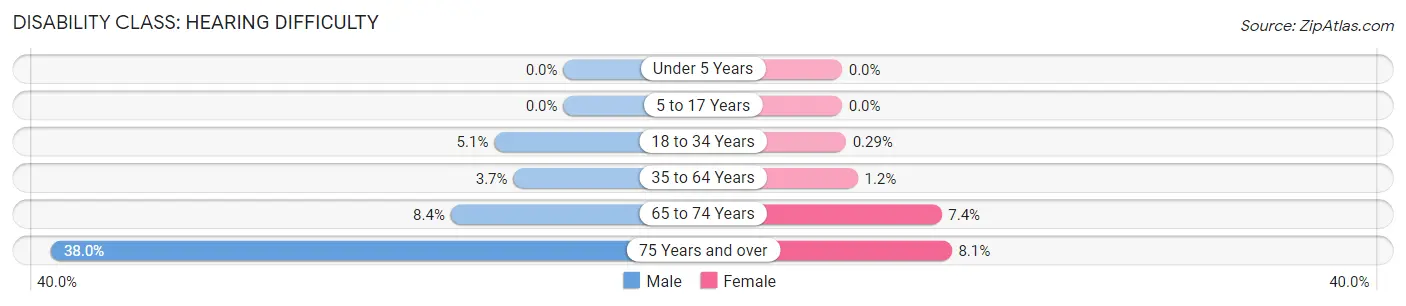
| Age Bracket | Male | Female |
| Under 5 Years | 0 (0.0%) | 0 (0.0%) |
| 5 to 17 Years | 0 (0.0%) | 0 (0.0%) |
| 18 to 34 Years | 67 (5.1%) | 3 (0.3%) |
| 35 to 64 Years | 51 (3.7%) | 16 (1.2%) |
| 65 to 74 Years | 29 (8.4%) | 36 (7.4%) |
| 75 Years and over | 105 (38.0%) | 28 (8.1%) |
Disability Class: Vision Difficulty
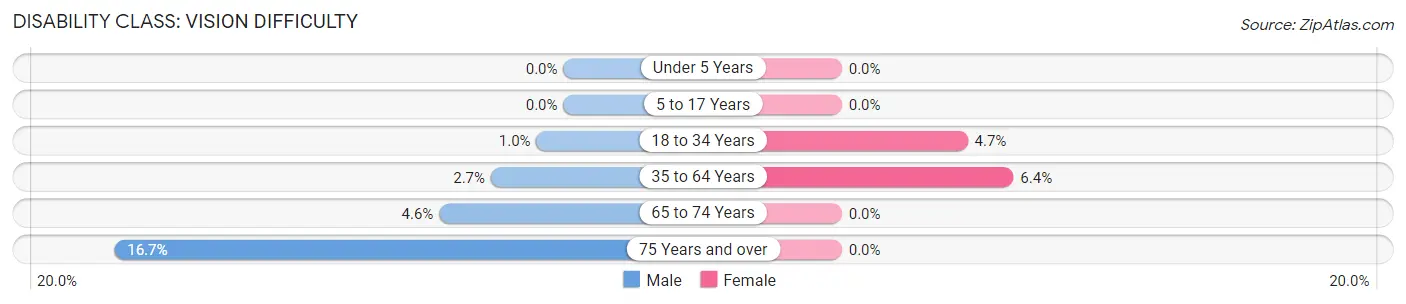
| Age Bracket | Male | Female |
| Under 5 Years | 0 (0.0%) | 0 (0.0%) |
| 5 to 17 Years | 0 (0.0%) | 0 (0.0%) |
| 18 to 34 Years | 13 (1.0%) | 48 (4.7%) |
| 35 to 64 Years | 37 (2.7%) | 87 (6.4%) |
| 65 to 74 Years | 16 (4.6%) | 0 (0.0%) |
| 75 Years and over | 46 (16.7%) | 0 (0.0%) |
Disability Class: Cognitive Difficulty
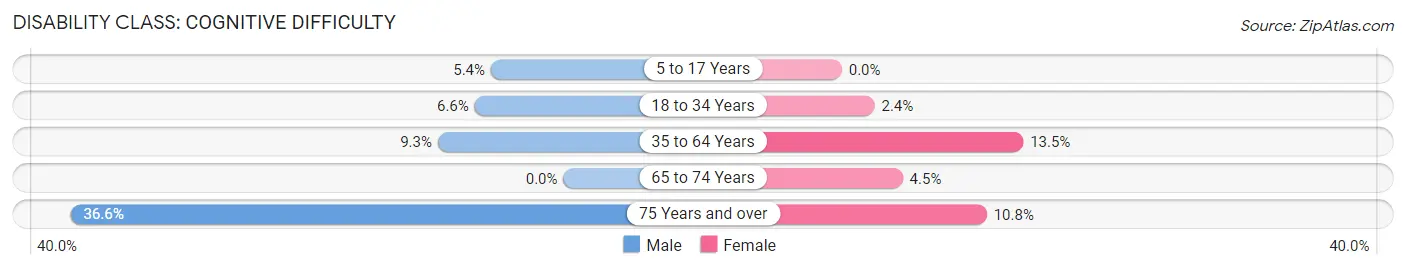
| Age Bracket | Male | Female |
| 5 to 17 Years | 37 (5.4%) | 0 (0.0%) |
| 18 to 34 Years | 86 (6.6%) | 25 (2.4%) |
| 35 to 64 Years | 128 (9.3%) | 184 (13.5%) |
| 65 to 74 Years | 0 (0.0%) | 22 (4.5%) |
| 75 Years and over | 101 (36.6%) | 37 (10.8%) |
Disability Class: Ambulatory Difficulty
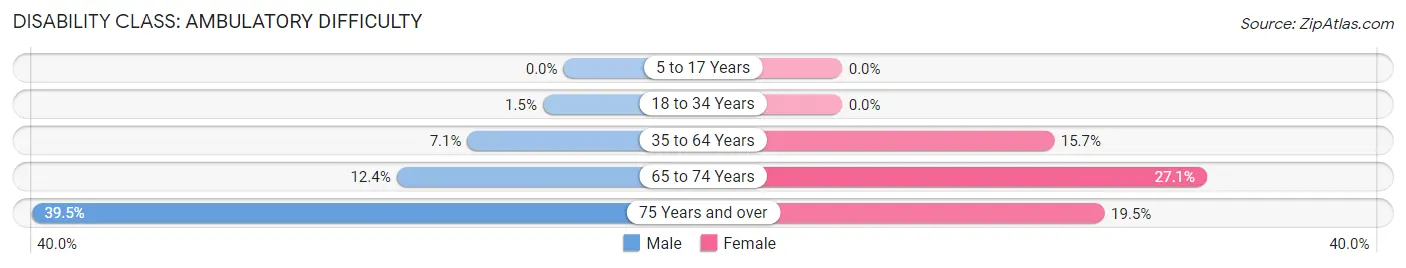
| Age Bracket | Male | Female |
| 5 to 17 Years | 0 (0.0%) | 0 (0.0%) |
| 18 to 34 Years | 20 (1.5%) | 0 (0.0%) |
| 35 to 64 Years | 98 (7.1%) | 215 (15.7%) |
| 65 to 74 Years | 43 (12.4%) | 132 (27.1%) |
| 75 Years and over | 109 (39.5%) | 67 (19.5%) |
Disability Class: Self-Care Difficulty
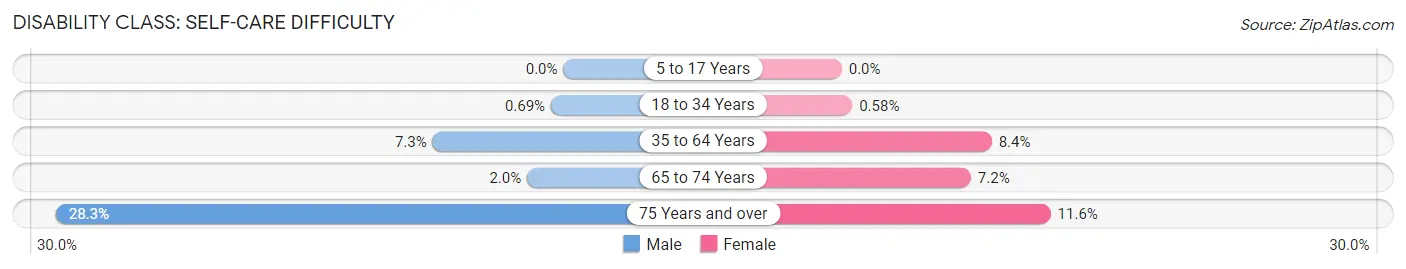
| Age Bracket | Male | Female |
| 5 to 17 Years | 0 (0.0%) | 0 (0.0%) |
| 18 to 34 Years | 9 (0.7%) | 6 (0.6%) |
| 35 to 64 Years | 100 (7.3%) | 114 (8.4%) |
| 65 to 74 Years | 7 (2.0%) | 35 (7.2%) |
| 75 Years and over | 78 (28.3%) | 40 (11.6%) |
Technology Access in Mount Pleasant
Computing Device Access in Mount Pleasant
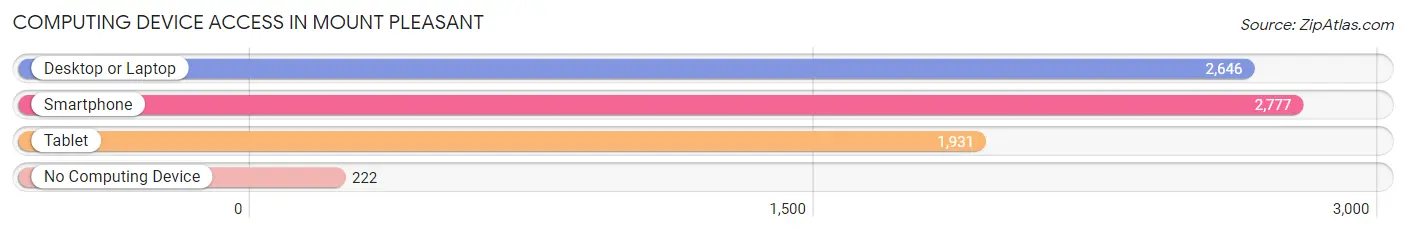
| Device Type | # Households | % Households |
| Desktop or Laptop | 2,646 | 80.3% |
| Smartphone | 2,777 | 84.3% |
| Tablet | 1,931 | 58.6% |
| No Computing Device | 222 | 6.7% |
| Total | 3,294 | 100.0% |
Internet Access in Mount Pleasant
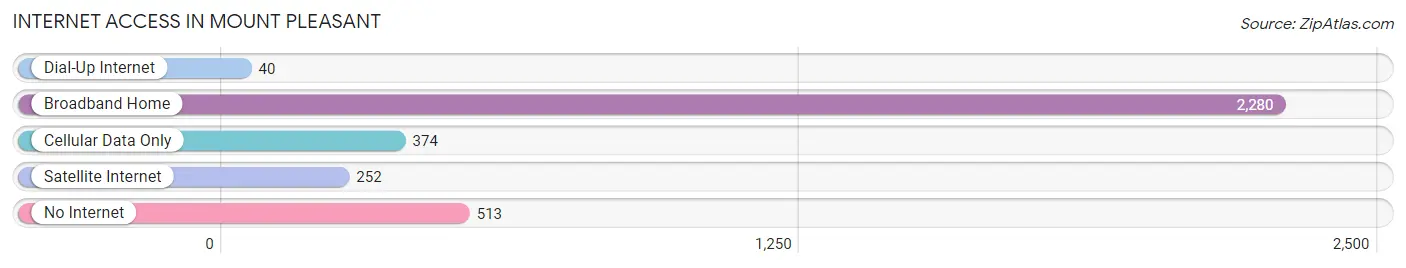
| Internet Type | # Households | % Households |
| Dial-Up Internet | 40 | 1.2% |
| Broadband Home | 2,280 | 69.2% |
| Cellular Data Only | 374 | 11.4% |
| Satellite Internet | 252 | 7.6% |
| No Internet | 513 | 15.6% |
| Total | 3,294 | 100.0% |
Mount Pleasant Summary
Introduction
Mount Pleasant is a city located in Henry County, Iowa, United States. It is the county seat of Henry County and is located in the southeastern part of the state. The city is situated on the banks of the Skunk River and is home to a population of 8,668 people as of the 2010 census. The city is known for its historic downtown, which is home to a variety of shops, restaurants, and other businesses.
History
Mount Pleasant was founded in 1835 by a group of settlers from Ohio. The city was named after the nearby Mount Pleasant Methodist Church, which was built in 1834. The city was incorporated in 1839 and quickly became a center of commerce and industry. The city was home to a variety of businesses, including a flour mill, a sawmill, a woolen mill, and a brickyard.
In 1851, the city was connected to the rest of the state by the Burlington and Missouri River Railroad. This allowed the city to become a major shipping hub for the region. The city was also home to a variety of educational institutions, including Iowa Wesleyan College, which was founded in 1842.
Geography
Mount Pleasant is located in southeastern Iowa, in Henry County. The city is situated on the banks of the Skunk River and is located about 40 miles southeast of Iowa City and about 80 miles west of Davenport. The city has a total area of 5.3 square miles, all of which is land.
The city is located in the Central Lowland region of the United States, which is characterized by rolling hills and fertile soil. The climate in Mount Pleasant is humid continental, with hot summers and cold winters. The average annual temperature is around 50 degrees Fahrenheit.
Economy
Mount Pleasant is home to a variety of businesses and industries. The city is home to a number of manufacturing companies, including a steel mill, a paper mill, and a plastics plant. The city is also home to a variety of retail stores, restaurants, and other businesses.
The city is home to a number of educational institutions, including Iowa Wesleyan College, which is a private liberal arts college. The college is home to a variety of academic programs, including business, education, and nursing.
Demographics
As of the 2010 census, the population of Mount Pleasant was 8,668. The racial makeup of the city was 92.3% White, 4.2% African American, 0.4% Native American, 0.7% Asian, 0.1% Pacific Islander, and 1.3% from other races. The median household income was $41,945 and the median family income was $50,945.
Conclusion
Mount Pleasant is a city located in Henry County, Iowa. The city is situated on the banks of the Skunk River and is home to a population of 8,668 people as of the 2010 census. The city is known for its historic downtown, which is home to a variety of shops, restaurants, and other businesses. The city is home to a variety of businesses and industries, including a steel mill, a paper mill, and a plastics plant. The city is also home to a number of educational institutions, including Iowa Wesleyan College. The racial makeup of the city is 92.3% White, 4.2% African American, 0.4% Native American, 0.7% Asian, 0.1% Pacific Islander, and 1.3% from other races. The median household income was $41,945 and the median family income was $50,945.
Common Questions
What is Per Capita Income in Mount Pleasant?
Per Capita income in Mount Pleasant is $27,116.
What is the Median Family Income in Mount Pleasant?
Median Family Income in Mount Pleasant is $73,651.
What is the Median Household income in Mount Pleasant?
Median Household Income in Mount Pleasant is $58,895.
What is Income or Wage Gap in Mount Pleasant?
Income or Wage Gap in Mount Pleasant is 36.0%.
Women in Mount Pleasant earn 64.0 cents for every dollar earned by a man.
What is Inequality or Gini Index in Mount Pleasant?
Inequality or Gini Index in Mount Pleasant is 0.40.
What is the Total Population of Mount Pleasant?
Total Population of Mount Pleasant is 9,214.
What is the Total Male Population of Mount Pleasant?
Total Male Population of Mount Pleasant is 5,129.
What is the Total Female Population of Mount Pleasant?
Total Female Population of Mount Pleasant is 4,085.
What is the Ratio of Males per 100 Females in Mount Pleasant?
There are 125.56 Males per 100 Females in Mount Pleasant.
What is the Ratio of Females per 100 Males in Mount Pleasant?
There are 79.65 Females per 100 Males in Mount Pleasant.
What is the Median Population Age in Mount Pleasant?
Median Population Age in Mount Pleasant is 36.5 Years.
What is the Average Family Size in Mount Pleasant
Average Family Size in Mount Pleasant is 2.9 People.
What is the Average Household Size in Mount Pleasant
Average Household Size in Mount Pleasant is 2.4 People.
How Large is the Labor Force in Mount Pleasant?
There are 4,448 People in the Labor Forcein in Mount Pleasant.
What is the Percentage of People in the Labor Force in Mount Pleasant?
56.5% of People are in the Labor Force in Mount Pleasant.
What is the Unemployment Rate in Mount Pleasant?
Unemployment Rate in Mount Pleasant is 2.7%.