Montour, IA Map & Demographics
Montour Map
Montour Overview
$45,888
PER CAPITA INCOME
$112,500
AVG FAMILY INCOME
$73,750
AVG HOUSEHOLD INCOME
38.2%
WAGE / INCOME GAP [ % ]
61.8¢/ $1
WAGE / INCOME GAP [ $ ]
0.38
INEQUALITY / GINI INDEX
193
TOTAL POPULATION
108
MALE POPULATION
85
FEMALE POPULATION
127.06
MALES / 100 FEMALES
78.70
FEMALES / 100 MALES
49.8
MEDIAN AGE
2.4
AVG FAMILY SIZE
2.0
AVG HOUSEHOLD SIZE
125
LABOR FORCE [ PEOPLE ]
70.6%
PERCENT IN LABOR FORCE
2.4%
UNEMPLOYMENT RATE
Montour Zip Codes
Montour Area Codes
Income in Montour
Income Overview in Montour
Per Capita Income in Montour is $45,888, while median incomes of families and households are $112,500 and $73,750 respectively.
| Characteristic | Number | Measure |
| Per Capita Income | 193 | $45,888 |
| Median Family Income | 62 | $112,500 |
| Mean Family Income | 62 | $102,813 |
| Median Household Income | 94 | $73,750 |
| Mean Household Income | 94 | $84,185 |
| Income Deficit | 62 | $0 |
| Wage / Income Gap (%) | 193 | 38.17% |
| Wage / Income Gap ($) | 193 | 61.83¢ per $1 |
| Gini / Inequality Index | 193 | 0.38 |
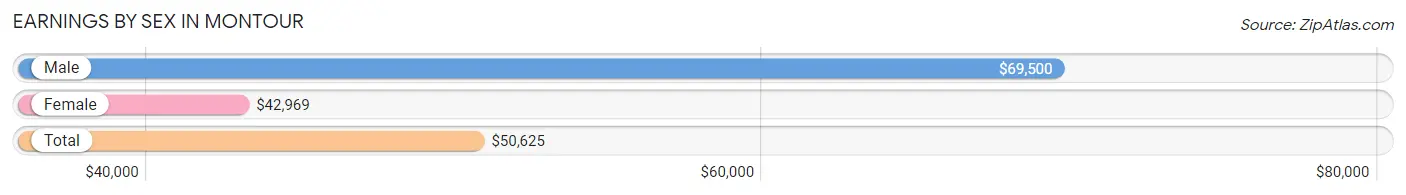
Earnings by Sex in Montour
Average Earnings in Montour are $50,625, $69,500 for men and $42,969 for women, a difference of 38.2%.
| Sex | Number | Average Earnings |
| Male | 80 (65.0%) | $69,500 |
| Female | 43 (35.0%) | $42,969 |
| Total | 123 (100.0%) | $50,625 |
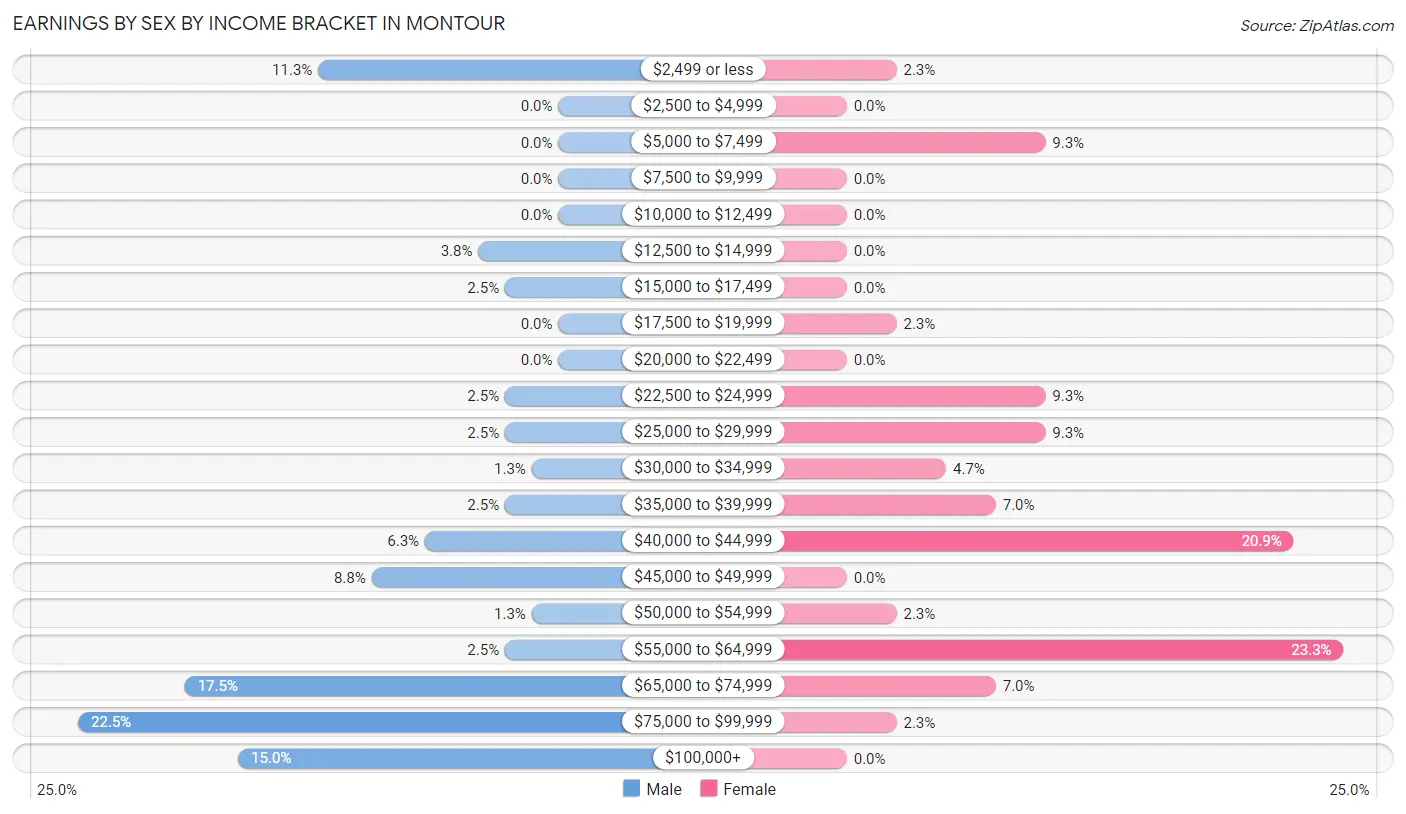
Earnings by Sex by Income Bracket in Montour
The most common earnings brackets in Montour are $75,000 to $99,999 for men (18 | 22.5%) and $55,000 to $64,999 for women (10 | 23.3%).
| Income | Male | Female |
| $2,499 or less | 9 (11.3%) | 1 (2.3%) |
| $2,500 to $4,999 | 0 (0.0%) | 0 (0.0%) |
| $5,000 to $7,499 | 0 (0.0%) | 4 (9.3%) |
| $7,500 to $9,999 | 0 (0.0%) | 0 (0.0%) |
| $10,000 to $12,499 | 0 (0.0%) | 0 (0.0%) |
| $12,500 to $14,999 | 3 (3.7%) | 0 (0.0%) |
| $15,000 to $17,499 | 2 (2.5%) | 0 (0.0%) |
| $17,500 to $19,999 | 0 (0.0%) | 1 (2.3%) |
| $20,000 to $22,499 | 0 (0.0%) | 0 (0.0%) |
| $22,500 to $24,999 | 2 (2.5%) | 4 (9.3%) |
| $25,000 to $29,999 | 2 (2.5%) | 4 (9.3%) |
| $30,000 to $34,999 | 1 (1.3%) | 2 (4.6%) |
| $35,000 to $39,999 | 2 (2.5%) | 3 (7.0%) |
| $40,000 to $44,999 | 5 (6.2%) | 9 (20.9%) |
| $45,000 to $49,999 | 7 (8.7%) | 0 (0.0%) |
| $50,000 to $54,999 | 1 (1.3%) | 1 (2.3%) |
| $55,000 to $64,999 | 2 (2.5%) | 10 (23.3%) |
| $65,000 to $74,999 | 14 (17.5%) | 3 (7.0%) |
| $75,000 to $99,999 | 18 (22.5%) | 1 (2.3%) |
| $100,000+ | 12 (15.0%) | 0 (0.0%) |
| Total | 80 (100.0%) | 43 (100.0%) |
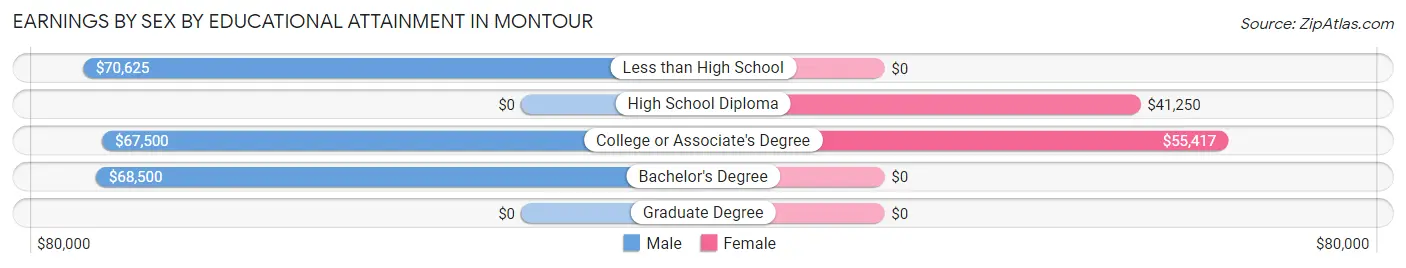
Earnings by Sex by Educational Attainment in Montour
Average earnings in Montour are $70,000 for men and $43,438 for women, a difference of 38.0%. Men with an educational attainment of less than high school enjoy the highest average annual earnings of $70,625, while those with college or associate's degree education earn the least with $67,500. Women with an educational attainment of college or associate's degree earn the most with the average annual earnings of $55,417, while those with high school diploma education have the smallest earnings of $41,250.
| Educational Attainment | Male Income | Female Income |
| Less than High School | $70,625 | $0 |
| High School Diploma | - | - |
| College or Associate's Degree | $67,500 | $55,417 |
| Bachelor's Degree | $68,500 | $0 |
| Graduate Degree | - | - |
| Total | $70,000 | $43,438 |
Family Income in Montour
Family Income Brackets in Montour
According to the Montour family income data, there are 32 families falling into the $100,000 to $149,999 income range, which is the most common income bracket and makes up 51.6% of all families.
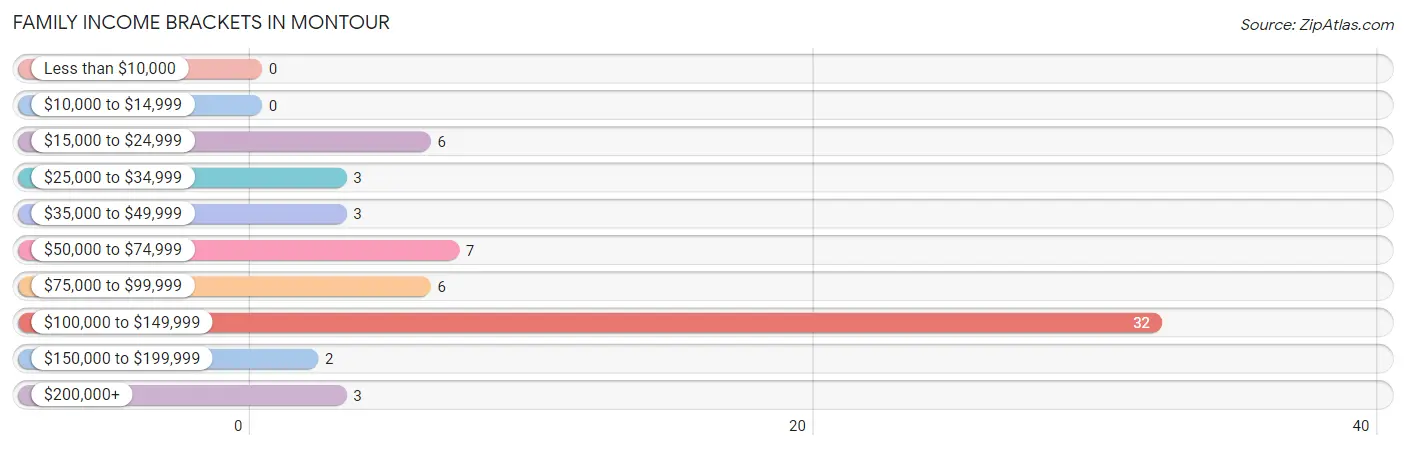
| Income Bracket | # Families | % Families |
| Less than $10,000 | 0 | 0.0% |
| $10,000 to $14,999 | 0 | 0.0% |
| $15,000 to $24,999 | 6 | 9.7% |
| $25,000 to $34,999 | 3 | 4.8% |
| $35,000 to $49,999 | 3 | 4.8% |
| $50,000 to $74,999 | 7 | 11.3% |
| $75,000 to $99,999 | 6 | 9.7% |
| $100,000 to $149,999 | 32 | 51.6% |
| $150,000 to $199,999 | 2 | 3.2% |
| $200,000+ | 3 | 4.8% |
Family Income by Famaliy Size in Montour
3-person families (17 | 27.4%) account for the highest median family income in Montour with $125,750 per family, while 2-person families (43 | 69.4%) have the highest median income of $55,375 per family member.
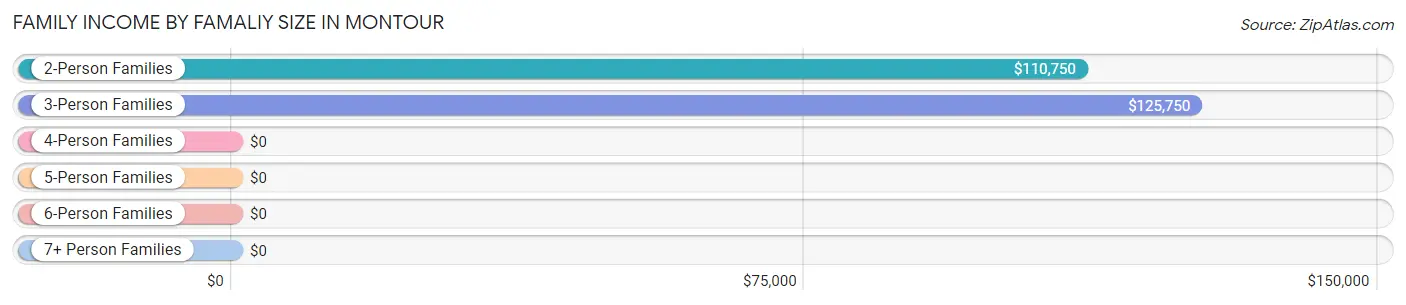
| Income Bracket | # Families | Median Income |
| 2-Person Families | 43 (69.4%) | $110,750 |
| 3-Person Families | 17 (27.4%) | $125,750 |
| 4-Person Families | 2 (3.2%) | $0 |
| 5-Person Families | 0 (0.0%) | $0 |
| 6-Person Families | 0 (0.0%) | $0 |
| 7+ Person Families | 0 (0.0%) | $0 |
| Total | 62 (100.0%) | $112,500 |
Family Income by Number of Earners in Montour
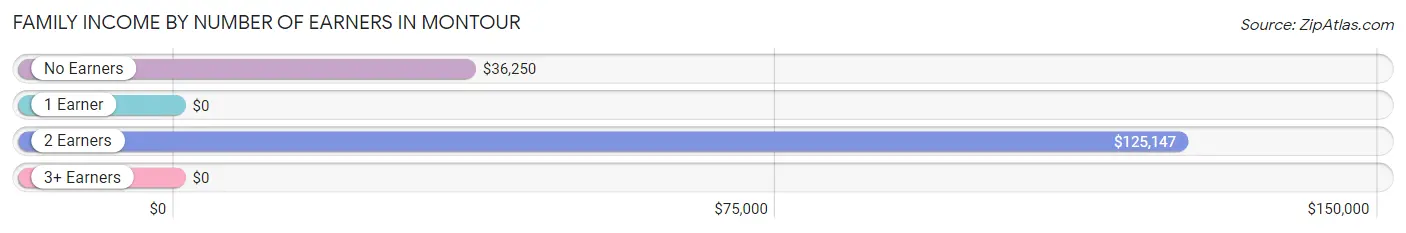
| Number of Earners | # Families | Median Income |
| No Earners | 8 (12.9%) | $36,250 |
| 1 Earner | 13 (21.0%) | $0 |
| 2 Earners | 36 (58.1%) | $125,147 |
| 3+ Earners | 5 (8.1%) | $0 |
| Total | 62 (100.0%) | $112,500 |
Household Income in Montour
Household Income Brackets in Montour
With 32 households falling in the category, the $100,000 to $149,999 income range is the most frequent in Montour, accounting for 34.0% of all households. In contrast, only 3 households (3.2%) fall into the less than $10,000 income bracket, making it the least populous group.
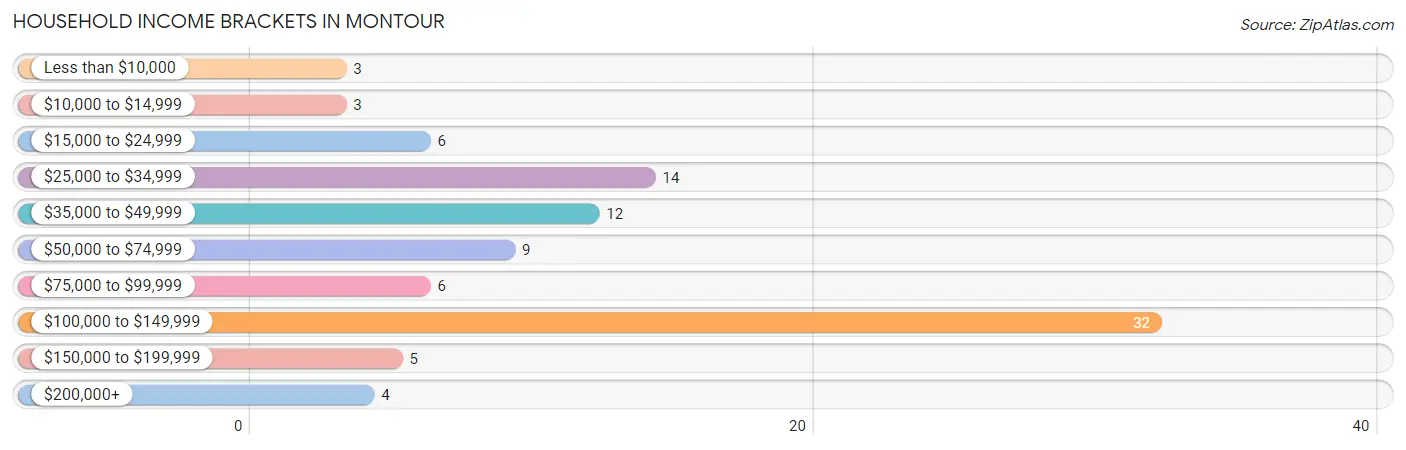
| Income Bracket | # Households | % Households |
| Less than $10,000 | 3 | 3.2% |
| $10,000 to $14,999 | 3 | 3.2% |
| $15,000 to $24,999 | 6 | 6.4% |
| $25,000 to $34,999 | 14 | 14.9% |
| $35,000 to $49,999 | 12 | 12.8% |
| $50,000 to $74,999 | 9 | 9.6% |
| $75,000 to $99,999 | 6 | 6.4% |
| $100,000 to $149,999 | 32 | 34.0% |
| $150,000 to $199,999 | 5 | 5.3% |
| $200,000+ | 4 | 4.3% |
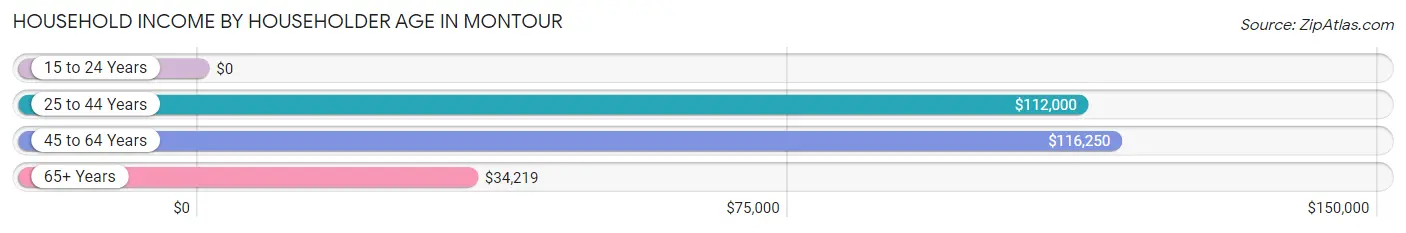
Household Income by Householder Age in Montour
The median household income in Montour is $73,750, with the highest median household income of $116,250 found in the 45 to 64 years age bracket for the primary householder. A total of 47 households (50.0%) fall into this category.
| Income Bracket | # Households | Median Income |
| 15 to 24 Years | 0 (0.0%) | $0 |
| 25 to 44 Years | 20 (21.3%) | $112,000 |
| 45 to 64 Years | 47 (50.0%) | $116,250 |
| 65+ Years | 27 (28.7%) | $34,219 |
| Total | 94 (100.0%) | $73,750 |
Poverty in Montour
Income Below Poverty by Sex and Age in Montour
With 12.0% poverty level for males and 3.5% for females among the residents of Montour, 35 to 44 year old males and 16 and 17 year old females are the most vulnerable to poverty, with 7 males (25.0%) and 3 females (42.9%) in their respective age groups living below the poverty level.
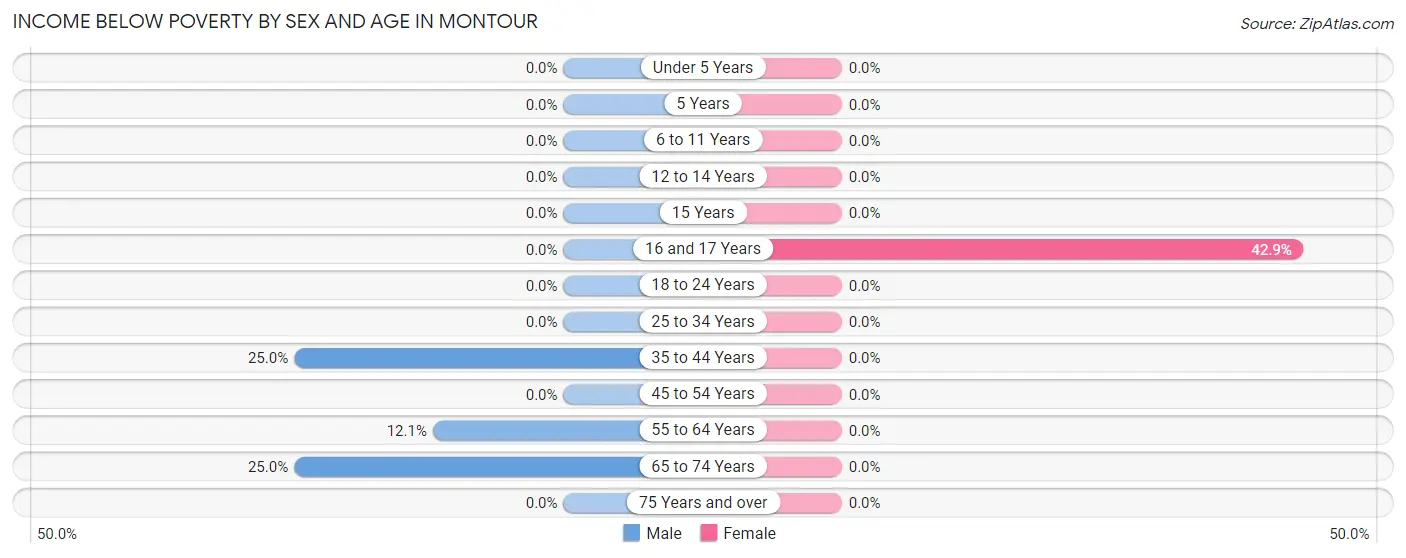
| Age Bracket | Male | Female |
| Under 5 Years | 0 (0.0%) | 0 (0.0%) |
| 5 Years | 0 (0.0%) | 0 (0.0%) |
| 6 to 11 Years | 0 (0.0%) | 0 (0.0%) |
| 12 to 14 Years | 0 (0.0%) | 0 (0.0%) |
| 15 Years | 0 (0.0%) | 0 (0.0%) |
| 16 and 17 Years | 0 (0.0%) | 3 (42.9%) |
| 18 to 24 Years | 0 (0.0%) | 0 (0.0%) |
| 25 to 34 Years | 0 (0.0%) | 0 (0.0%) |
| 35 to 44 Years | 7 (25.0%) | 0 (0.0%) |
| 45 to 54 Years | 0 (0.0%) | 0 (0.0%) |
| 55 to 64 Years | 4 (12.1%) | 0 (0.0%) |
| 65 to 74 Years | 2 (25.0%) | 0 (0.0%) |
| 75 Years and over | 0 (0.0%) | 0 (0.0%) |
| Total | 13 (12.0%) | 3 (3.5%) |
Income Above Poverty by Sex and Age in Montour
According to the poverty statistics in Montour, males aged 6 to 11 years and females aged 6 to 11 years are the age groups that are most secure financially, with 100.0% of males and 100.0% of females in these age groups living above the poverty line.
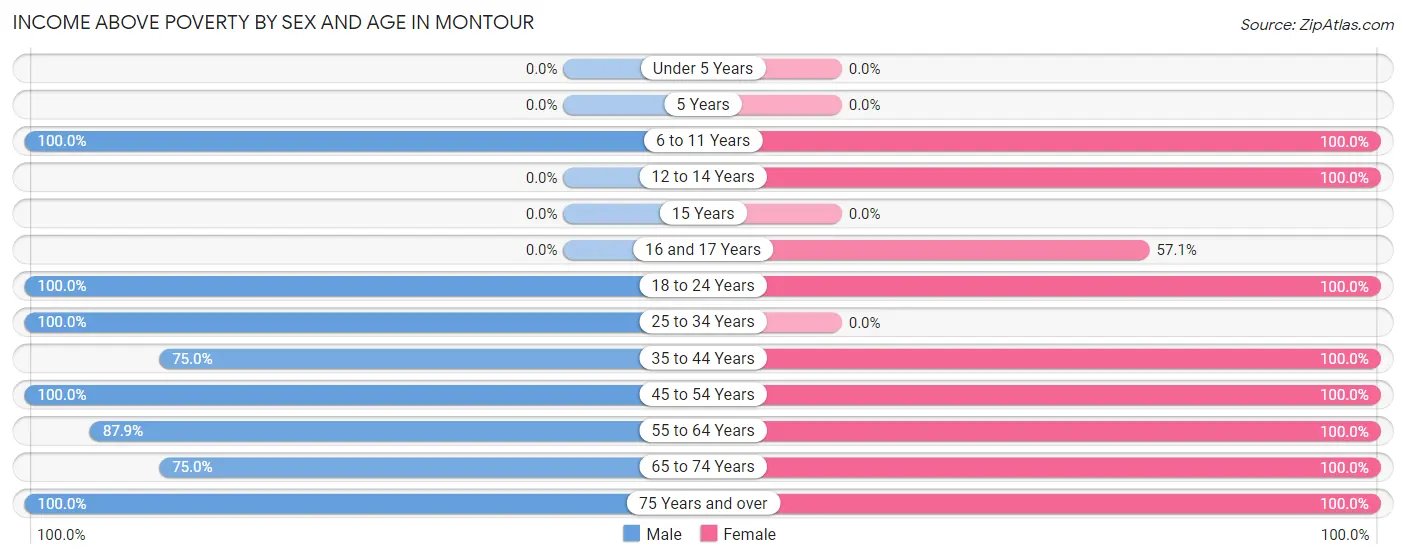
| Age Bracket | Male | Female |
| Under 5 Years | 0 (0.0%) | 0 (0.0%) |
| 5 Years | 0 (0.0%) | 0 (0.0%) |
| 6 to 11 Years | 12 (100.0%) | 2 (100.0%) |
| 12 to 14 Years | 0 (0.0%) | 2 (100.0%) |
| 15 Years | 0 (0.0%) | 0 (0.0%) |
| 16 and 17 Years | 0 (0.0%) | 4 (57.1%) |
| 18 to 24 Years | 2 (100.0%) | 3 (100.0%) |
| 25 to 34 Years | 2 (100.0%) | 0 (0.0%) |
| 35 to 44 Years | 21 (75.0%) | 20 (100.0%) |
| 45 to 54 Years | 19 (100.0%) | 12 (100.0%) |
| 55 to 64 Years | 29 (87.9%) | 14 (100.0%) |
| 65 to 74 Years | 6 (75.0%) | 20 (100.0%) |
| 75 Years and over | 4 (100.0%) | 5 (100.0%) |
| Total | 95 (88.0%) | 82 (96.5%) |
Income Below Poverty Among Married-Couple Families in Montour
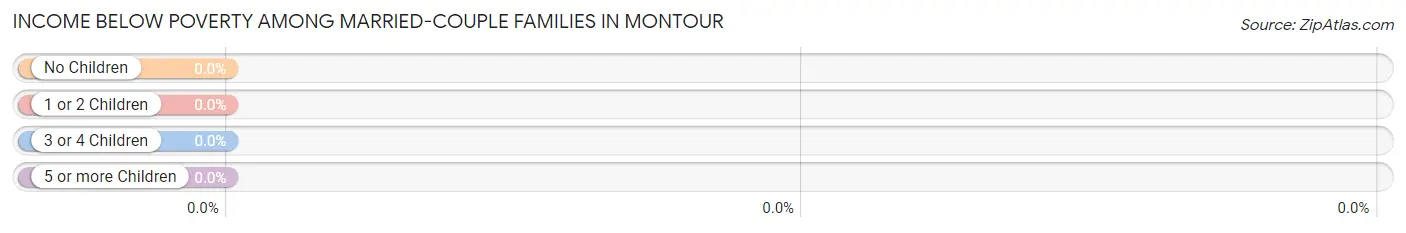
| Children | Above Poverty | Below Poverty |
| No Children | 49 (100.0%) | 0 (0.0%) |
| 1 or 2 Children | 7 (100.0%) | 0 (0.0%) |
| 3 or 4 Children | 0 (0.0%) | 0 (0.0%) |
| 5 or more Children | 0 (0.0%) | 0 (0.0%) |
| Total | 56 (100.0%) | 0 (0.0%) |
Income Below Poverty Among Single-Parent Households in Montour
| Children | Single Father | Single Mother |
| No Children | 0 (0.0%) | 0 (0.0%) |
| 1 or 2 Children | 0 (0.0%) | 0 (0.0%) |
| 3 or 4 Children | 0 (0.0%) | 0 (0.0%) |
| 5 or more Children | 0 (0.0%) | 0 (0.0%) |
| Total | 0 (0.0%) | 0 (0.0%) |
Income Below Poverty Among Married-Couple vs Single-Parent Households in Montour
| Children | Married-Couple Families | Single-Parent Households |
| No Children | 0 (0.0%) | 0 (0.0%) |
| 1 or 2 Children | 0 (0.0%) | 0 (0.0%) |
| 3 or 4 Children | 0 (0.0%) | 0 (0.0%) |
| 5 or more Children | 0 (0.0%) | 0 (0.0%) |
| Total | 0 (0.0%) | 0 (0.0%) |
Race in Montour
The most populous races in Montour are White / Caucasian (169 | 87.6%), Hispanic or Latino (21 | 10.9%), and Two or more Races (12 | 6.2%).
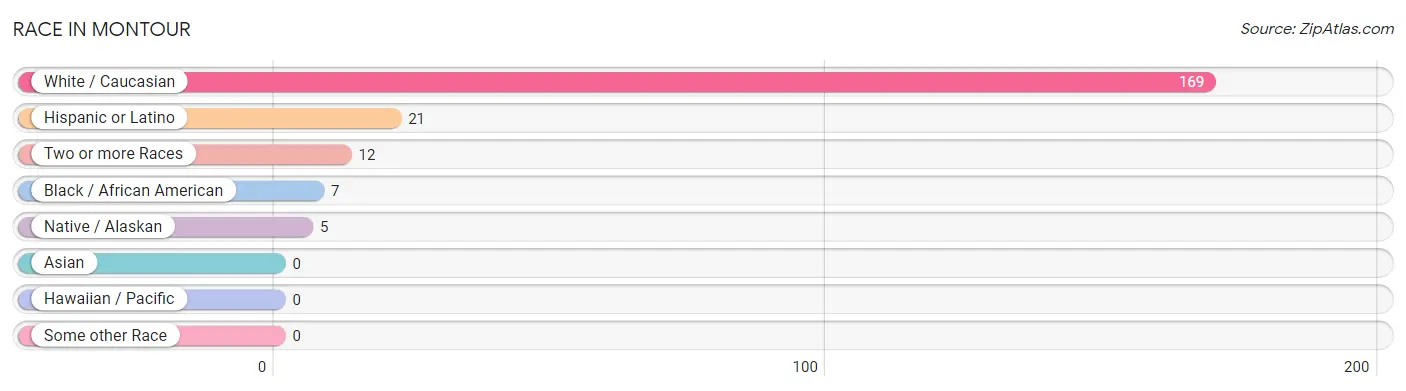
| Race | # Population | % Population |
| Asian | 0 | 0.0% |
| Black / African American | 7 | 3.6% |
| Hawaiian / Pacific | 0 | 0.0% |
| Hispanic or Latino | 21 | 10.9% |
| Native / Alaskan | 5 | 2.6% |
| White / Caucasian | 169 | 87.6% |
| Two or more Races | 12 | 6.2% |
| Some other Race | 0 | 0.0% |
| Total | 193 | 100.0% |
Ancestry in Montour
The most populous ancestries reported in Montour are German (44 | 22.8%), Irish (39 | 20.2%), Czech (18 | 9.3%), Central American (12 | 6.2%), and Guatemalan (12 | 6.2%), together accounting for 64.8% of all Montour residents.
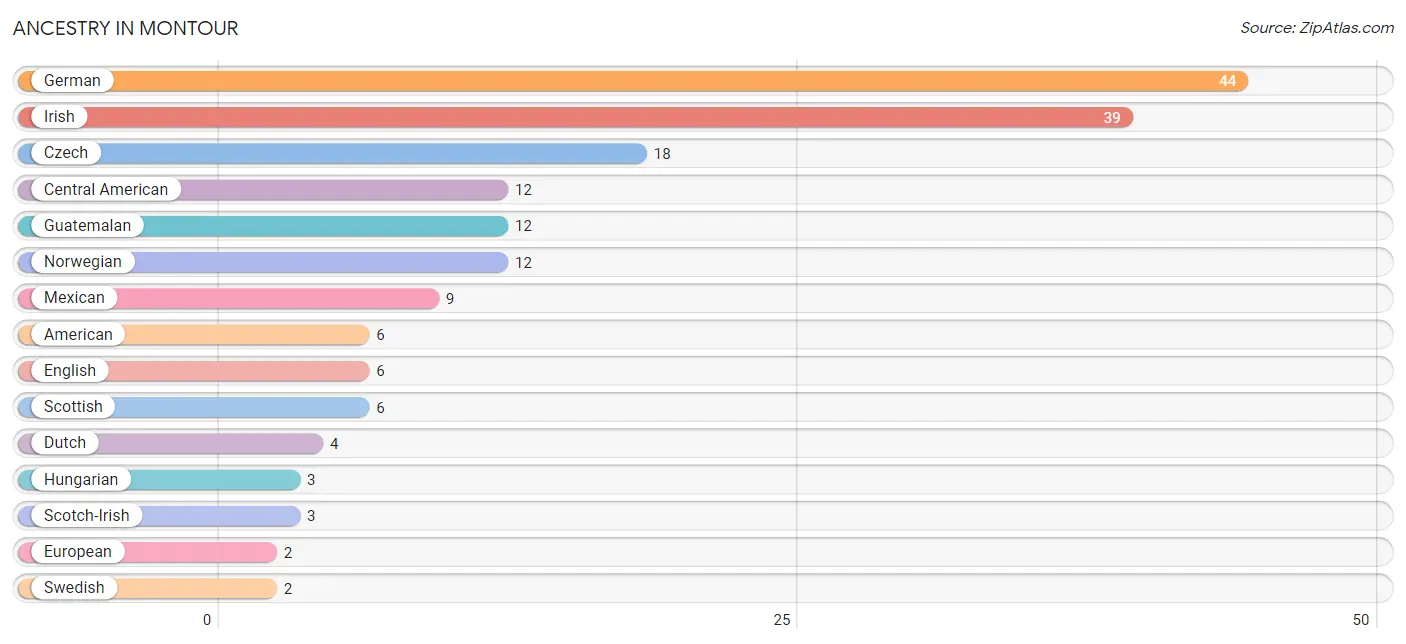
| Ancestry | # Population | % Population |
| American | 6 | 3.1% |
| British | 1 | 0.5% |
| Central American | 12 | 6.2% |
| Czech | 18 | 9.3% |
| Dutch | 4 | 2.1% |
| English | 6 | 3.1% |
| European | 2 | 1.0% |
| German | 44 | 22.8% |
| Guatemalan | 12 | 6.2% |
| Hungarian | 3 | 1.5% |
| Irish | 39 | 20.2% |
| Italian | 1 | 0.5% |
| Mexican | 9 | 4.7% |
| Norwegian | 12 | 6.2% |
| Polish | 1 | 0.5% |
| Scotch-Irish | 3 | 1.5% |
| Scottish | 6 | 3.1% |
| Swedish | 2 | 1.0% | View All 18 Rows |
Immigrants in Montour
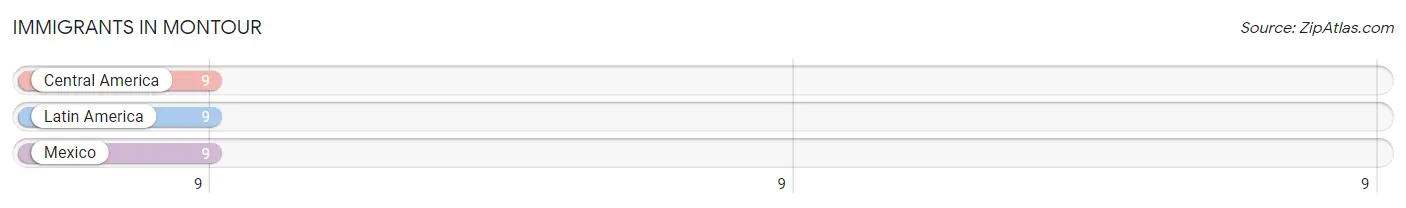
The most numerous immigrant groups reported in Montour came from Central America (9 | 4.7%), Latin America (9 | 4.7%), and Mexico (9 | 4.7%), together accounting for 14.0% of all Montour residents.
| Immigration Origin | # Population | % Population |
| Central America | 9 | 4.7% |
| Latin America | 9 | 4.7% |
| Mexico | 9 | 4.7% | View All 3 Rows |
Sex and Age in Montour
Sex and Age in Montour
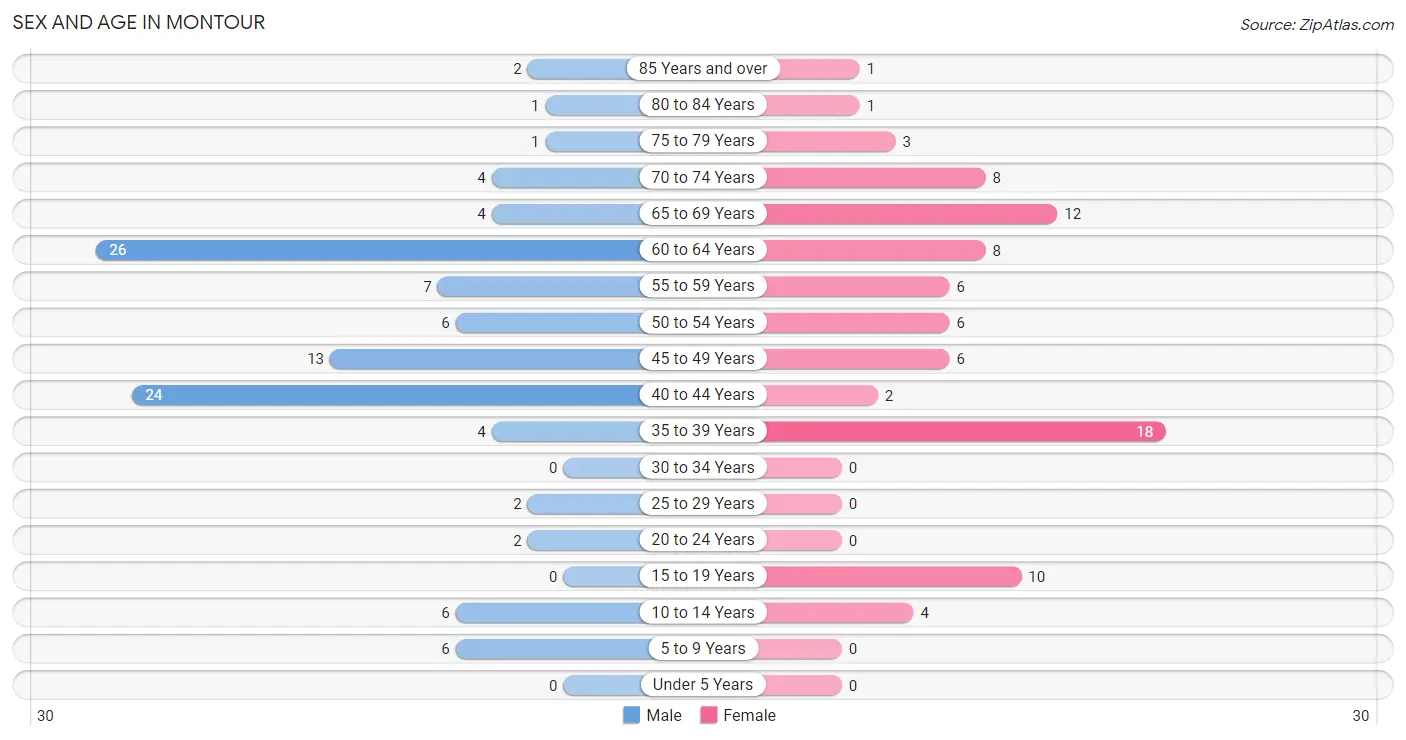
The most populous age groups in Montour are 60 to 64 Years (26 | 24.1%) for men and 35 to 39 Years (18 | 21.2%) for women.
| Age Bracket | Male | Female |
| Under 5 Years | 0 (0.0%) | 0 (0.0%) |
| 5 to 9 Years | 6 (5.6%) | 0 (0.0%) |
| 10 to 14 Years | 6 (5.6%) | 4 (4.7%) |
| 15 to 19 Years | 0 (0.0%) | 10 (11.8%) |
| 20 to 24 Years | 2 (1.8%) | 0 (0.0%) |
| 25 to 29 Years | 2 (1.8%) | 0 (0.0%) |
| 30 to 34 Years | 0 (0.0%) | 0 (0.0%) |
| 35 to 39 Years | 4 (3.7%) | 18 (21.2%) |
| 40 to 44 Years | 24 (22.2%) | 2 (2.4%) |
| 45 to 49 Years | 13 (12.0%) | 6 (7.1%) |
| 50 to 54 Years | 6 (5.6%) | 6 (7.1%) |
| 55 to 59 Years | 7 (6.5%) | 6 (7.1%) |
| 60 to 64 Years | 26 (24.1%) | 8 (9.4%) |
| 65 to 69 Years | 4 (3.7%) | 12 (14.1%) |
| 70 to 74 Years | 4 (3.7%) | 8 (9.4%) |
| 75 to 79 Years | 1 (0.9%) | 3 (3.5%) |
| 80 to 84 Years | 1 (0.9%) | 1 (1.2%) |
| 85 Years and over | 2 (1.8%) | 1 (1.2%) |
| Total | 108 (100.0%) | 85 (100.0%) |
Families and Households in Montour
Median Family Size in Montour
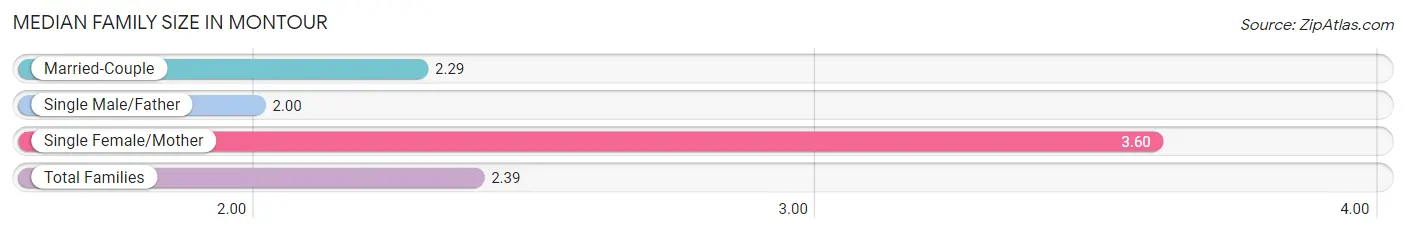
The median family size in Montour is 2.39 persons per family, with single female/mother families (5 | 8.1%) accounting for the largest median family size of 3.6 persons per family. On the other hand, single male/father families (1 | 1.6%) represent the smallest median family size with 2.00 persons per family.
| Family Type | # Families | Family Size |
| Married-Couple | 56 (90.3%) | 2.29 |
| Single Male/Father | 1 (1.6%) | 2.00 |
| Single Female/Mother | 5 (8.1%) | 3.60 |
| Total Families | 62 (100.0%) | 2.39 |
Median Household Size in Montour
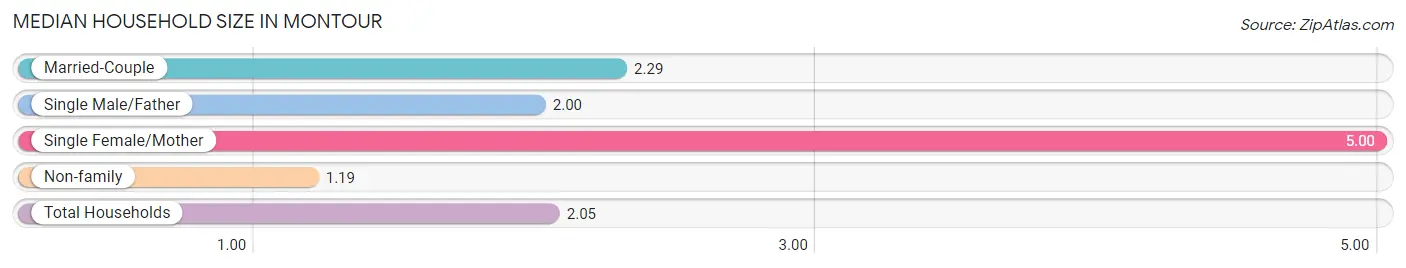
The median household size in Montour is 2.05 persons per household, with single female/mother households (5 | 5.3%) accounting for the largest median household size of 5 persons per household. non-family households (32 | 34.0%) represent the smallest median household size with 1.19 persons per household.
| Household Type | # Households | Household Size |
| Married-Couple | 56 (59.6%) | 2.29 |
| Single Male/Father | 1 (1.1%) | 2.00 |
| Single Female/Mother | 5 (5.3%) | 5.00 |
| Non-family | 32 (34.0%) | 1.19 |
| Total Households | 94 (100.0%) | 2.05 |
Household Size by Marriage Status in Montour
Out of a total of 94 households in Montour, 62 (66.0%) are family households, while 32 (34.0%) are nonfamily households. The most numerous type of family households are 2-person households, comprising 43, and the most common type of nonfamily households are 1-person households, comprising 29.
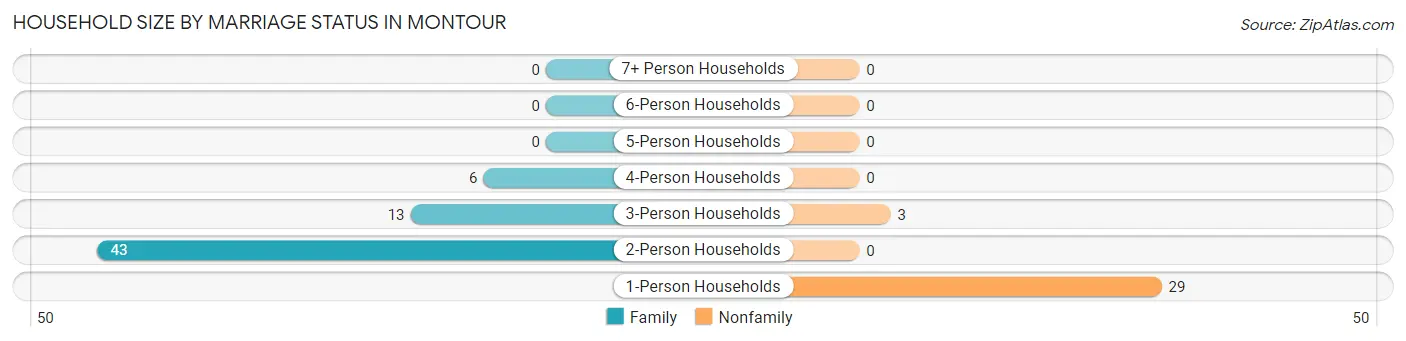
| Household Size | Family Households | Nonfamily Households |
| 1-Person Households | - | 29 (30.8%) |
| 2-Person Households | 43 (45.7%) | 0 (0.0%) |
| 3-Person Households | 13 (13.8%) | 3 (3.2%) |
| 4-Person Households | 6 (6.4%) | 0 (0.0%) |
| 5-Person Households | 0 (0.0%) | 0 (0.0%) |
| 6-Person Households | 0 (0.0%) | 0 (0.0%) |
| 7+ Person Households | 0 (0.0%) | 0 (0.0%) |
| Total | 62 (66.0%) | 32 (34.0%) |
Female Fertility in Montour
Fertility by Age in Montour
| Age Bracket | Women with Births | Births / 1,000 Women |
| 15 to 19 years | 0 (0.0%) | 0.0 |
| 20 to 34 years | 0 (0.0%) | 0.0 |
| 35 to 50 years | 0 (0.0%) | 0.0 |
| Total | 0 (0.0%) | 0.0 |
Fertility by Age by Marriage Status in Montour
| Age Bracket | Married | Unmarried |
| 15 to 19 years | 0 (0.0%) | 0 (0.0%) |
| 20 to 34 years | 0 (0.0%) | 0 (0.0%) |
| 35 to 50 years | 0 (0.0%) | 0 (0.0%) |
| Total | 0 (0.0%) | 0 (0.0%) |
Fertility by Education in Montour
| Educational Attainment | Women with Births | Births / 1,000 Women |
| Less than High School | 0 (0.0%) | 0.0 |
| High School Diploma | 0 (0.0%) | 0.0 |
| College or Associate's Degree | 0 (0.0%) | 0.0 |
| Bachelor's Degree | 0 (0.0%) | 0.0 |
| Graduate Degree | 0 (0.0%) | 0.0 |
| Total | 0 (0.0%) | 0.0 |
Fertility by Education by Marriage Status in Montour
| Educational Attainment | Married | Unmarried |
| Less than High School | 0 (0.0%) | 0 (0.0%) |
| High School Diploma | 0 (0.0%) | 0 (0.0%) |
| College or Associate's Degree | 0 (0.0%) | 0 (0.0%) |
| Bachelor's Degree | 0 (0.0%) | 0 (0.0%) |
| Graduate Degree | 0 (0.0%) | 0 (0.0%) |
| Total | 0 (0.0%) | 0 (0.0%) |
Employment Characteristics in Montour
Employment by Class of Employer in Montour
Among the 122 employed individuals in Montour, private company employees (93 | 76.2%), not-for-profit organizations (14 | 11.5%), and local government employees (5 | 4.1%) make up the most common classes of employment.
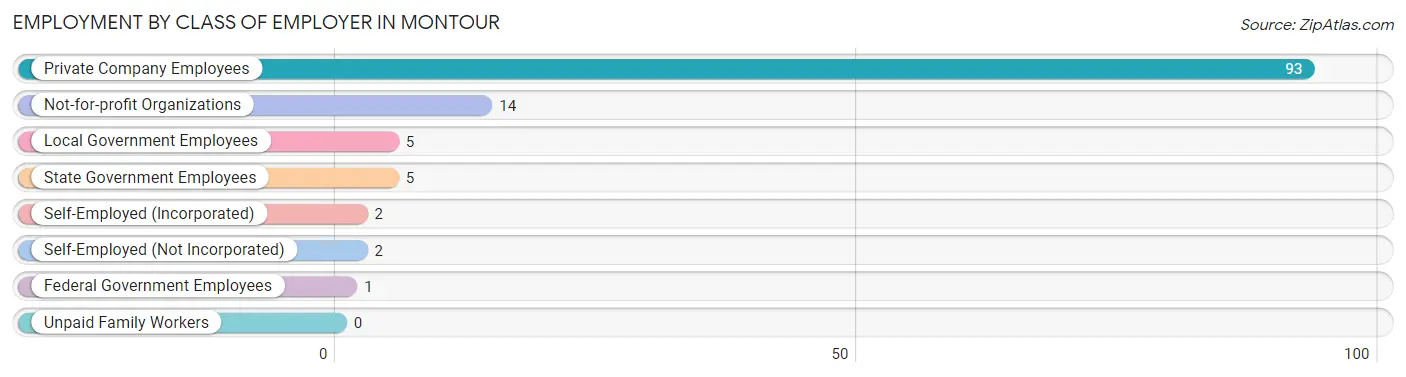
| Employer Class | # Employees | % Employees |
| Private Company Employees | 93 | 76.2% |
| Self-Employed (Incorporated) | 2 | 1.6% |
| Self-Employed (Not Incorporated) | 2 | 1.6% |
| Not-for-profit Organizations | 14 | 11.5% |
| Local Government Employees | 5 | 4.1% |
| State Government Employees | 5 | 4.1% |
| Federal Government Employees | 1 | 0.8% |
| Unpaid Family Workers | 0 | 0.0% |
| Total | 122 | 100.0% |
Employment Status by Age in Montour
According to the labor force statistics for Montour, out of the total population over 16 years of age (177), 70.6% or 125 individuals are in the labor force, with 2.4% or 3 of them unemployed. The age group with the highest labor force participation rate is 20 to 24 years, with 100.0% or 2 individuals in the labor force. Within the labor force, the 16 to 19 years age range has the highest percentage of unemployed individuals, with 50.0% or 3 of them being unemployed.
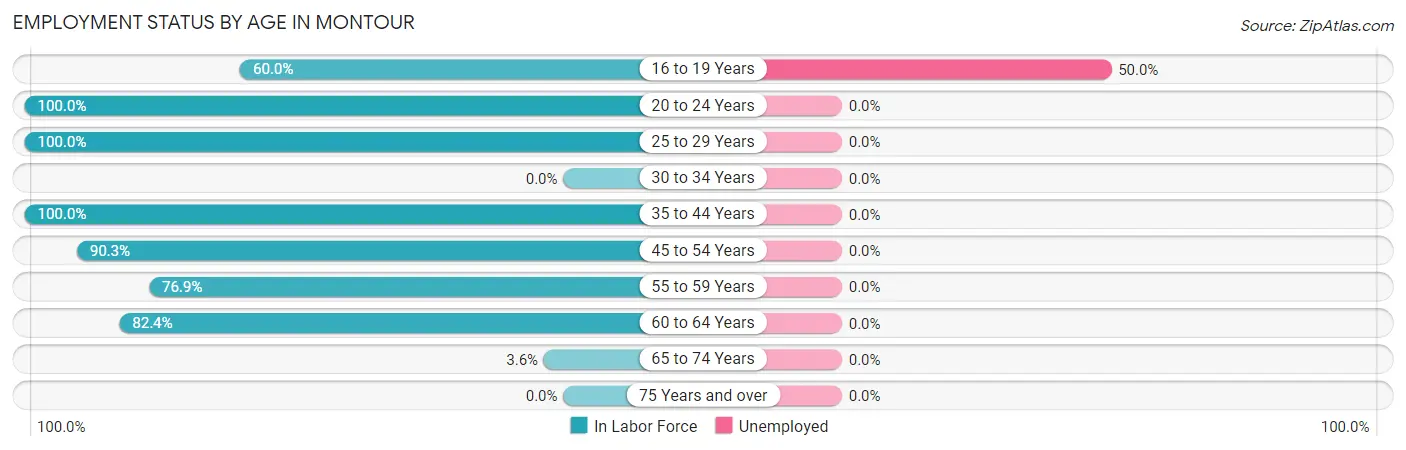
| Age Bracket | In Labor Force | Unemployed |
| 16 to 19 Years | 6 (60.0%) | 3 (50.0%) |
| 20 to 24 Years | 2 (100.0%) | 0 (0.0%) |
| 25 to 29 Years | 2 (100.0%) | 0 (0.0%) |
| 30 to 34 Years | 0 (0.0%) | 0 (0.0%) |
| 35 to 44 Years | 48 (100.0%) | 0 (0.0%) |
| 45 to 54 Years | 28 (90.3%) | 0 (0.0%) |
| 55 to 59 Years | 10 (76.9%) | 0 (0.0%) |
| 60 to 64 Years | 28 (82.4%) | 0 (0.0%) |
| 65 to 74 Years | 1 (3.6%) | 0 (0.0%) |
| 75 Years and over | 0 (0.0%) | 0 (0.0%) |
| Total | 125 (70.6%) | 3 (2.4%) |
Employment Status by Educational Attainment in Montour
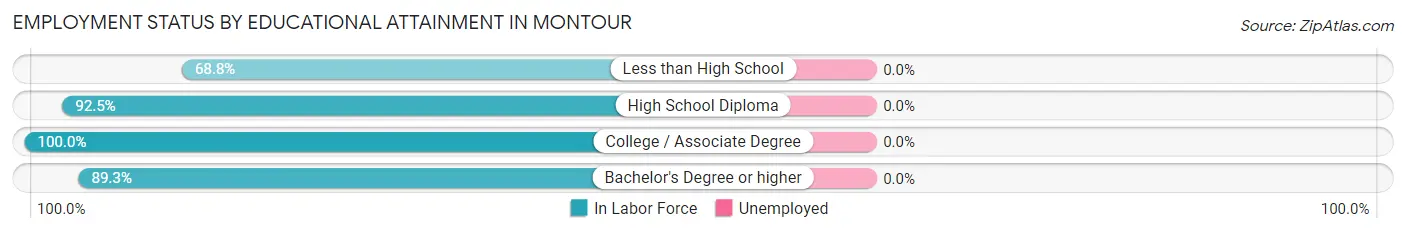
| Educational Attainment | In Labor Force | Unemployed |
| Less than High School | 11 (68.8%) | 0 (0.0%) |
| High School Diploma | 49 (92.5%) | 0 (0.0%) |
| College / Associate Degree | 31 (100.0%) | 0 (0.0%) |
| Bachelor's Degree or higher | 25 (89.3%) | 0 (0.0%) |
| Total | 116 (90.6%) | 0 (0.0%) |
Employment Occupations by Sex in Montour
Management, Business, Science and Arts Occupations
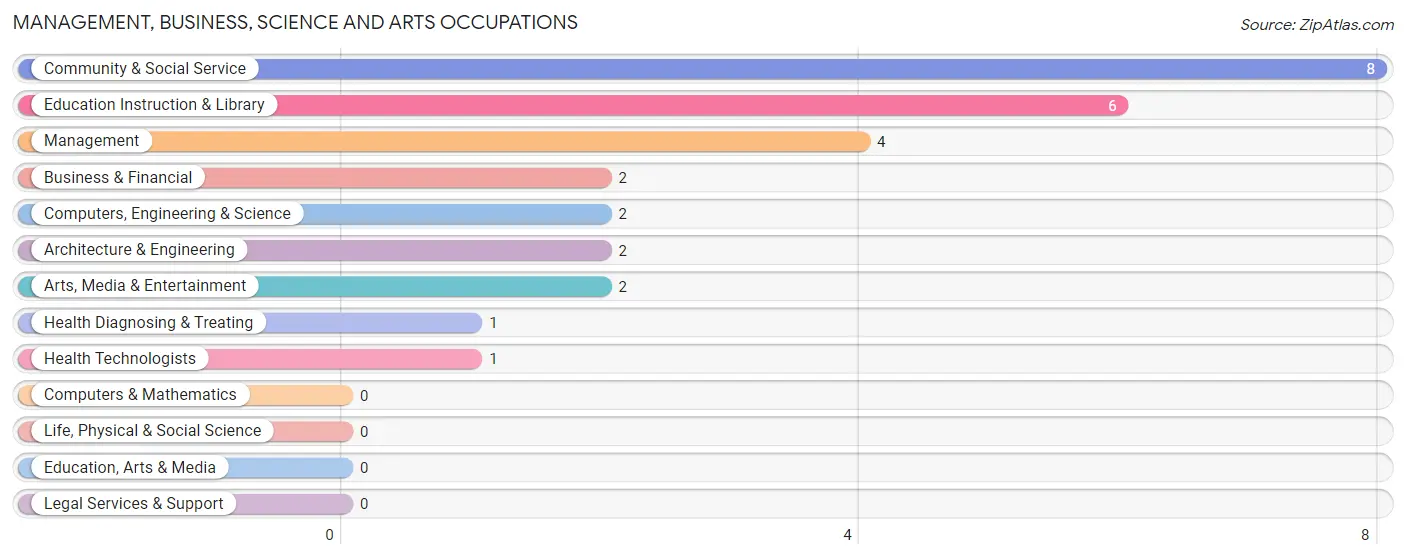
The most common Management, Business, Science and Arts occupations in Montour are Community & Social Service (8 | 6.6%), Education Instruction & Library (6 | 4.9%), Management (4 | 3.3%), Business & Financial (2 | 1.6%), and Computers, Engineering & Science (2 | 1.6%).
Management, Business, Science and Arts Occupations by Sex
Within the Management, Business, Science and Arts occupations in Montour, the most male-oriented occupations are Management (100.0%), Computers, Engineering & Science (100.0%), and Architecture & Engineering (100.0%), while the most female-oriented occupations are Business & Financial (50.0%), Education Instruction & Library (16.7%), and Community & Social Service (12.5%).
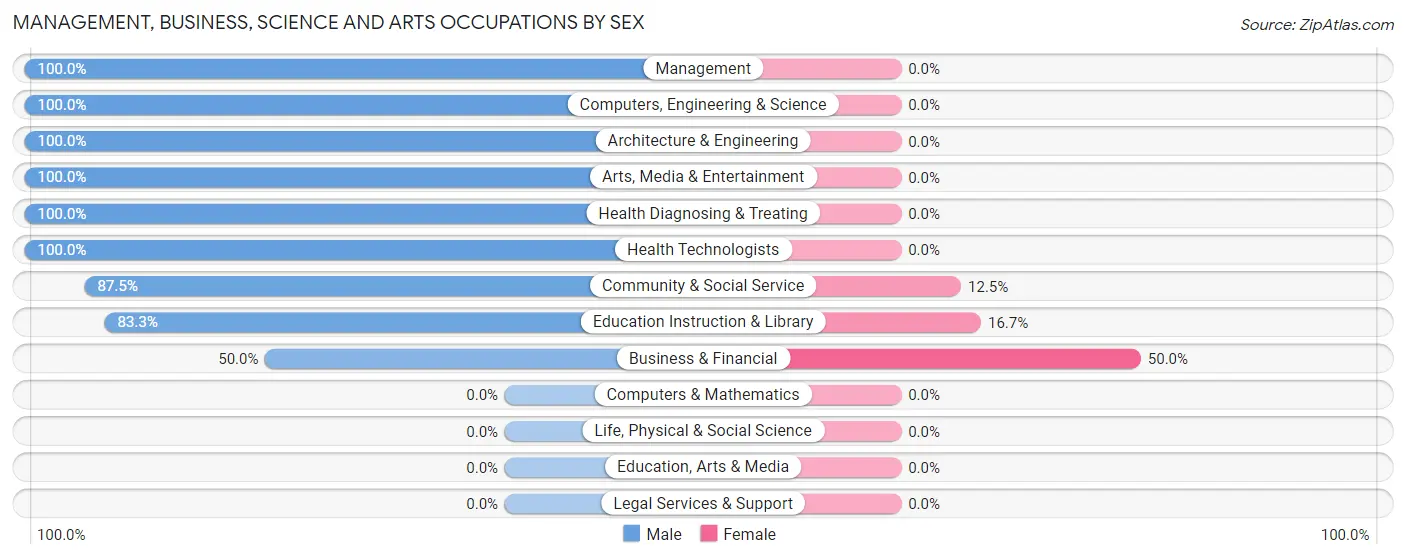
| Occupation | Male | Female |
| Management | 4 (100.0%) | 0 (0.0%) |
| Business & Financial | 1 (50.0%) | 1 (50.0%) |
| Computers, Engineering & Science | 2 (100.0%) | 0 (0.0%) |
| Computers & Mathematics | 0 (0.0%) | 0 (0.0%) |
| Architecture & Engineering | 2 (100.0%) | 0 (0.0%) |
| Life, Physical & Social Science | 0 (0.0%) | 0 (0.0%) |
| Community & Social Service | 7 (87.5%) | 1 (12.5%) |
| Education, Arts & Media | 0 (0.0%) | 0 (0.0%) |
| Legal Services & Support | 0 (0.0%) | 0 (0.0%) |
| Education Instruction & Library | 5 (83.3%) | 1 (16.7%) |
| Arts, Media & Entertainment | 2 (100.0%) | 0 (0.0%) |
| Health Diagnosing & Treating | 1 (100.0%) | 0 (0.0%) |
| Health Technologists | 1 (100.0%) | 0 (0.0%) |
| Total (Category) | 15 (88.2%) | 2 (11.8%) |
| Total (Overall) | 79 (64.7%) | 43 (35.2%) |
Services Occupations
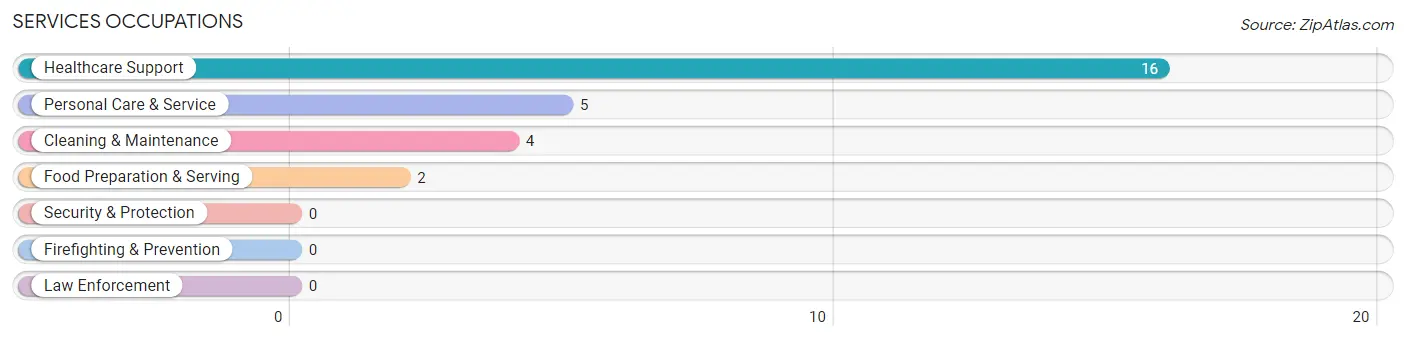
The most common Services occupations in Montour are Healthcare Support (16 | 13.1%), Personal Care & Service (5 | 4.1%), Cleaning & Maintenance (4 | 3.3%), and Food Preparation & Serving (2 | 1.6%).
Services Occupations by Sex
Within the Services occupations in Montour, the most male-oriented occupations are Food Preparation & Serving (100.0%), Personal Care & Service (40.0%), and Healthcare Support (6.2%), while the most female-oriented occupations are Cleaning & Maintenance (100.0%), Healthcare Support (93.8%), and Personal Care & Service (60.0%).
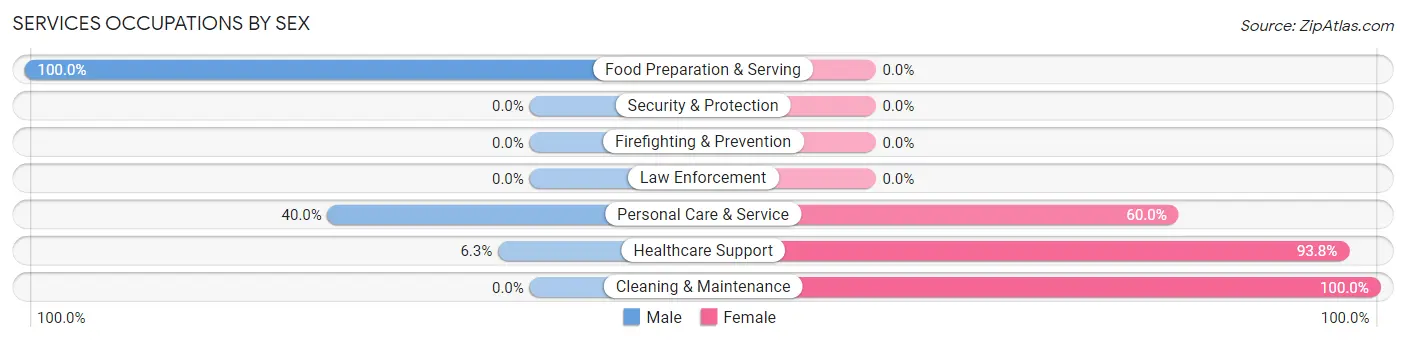
| Occupation | Male | Female |
| Healthcare Support | 1 (6.2%) | 15 (93.8%) |
| Security & Protection | 0 (0.0%) | 0 (0.0%) |
| Firefighting & Prevention | 0 (0.0%) | 0 (0.0%) |
| Law Enforcement | 0 (0.0%) | 0 (0.0%) |
| Food Preparation & Serving | 2 (100.0%) | 0 (0.0%) |
| Cleaning & Maintenance | 0 (0.0%) | 4 (100.0%) |
| Personal Care & Service | 2 (40.0%) | 3 (60.0%) |
| Total (Category) | 5 (18.5%) | 22 (81.5%) |
| Total (Overall) | 79 (64.7%) | 43 (35.2%) |
Sales and Office Occupations
The most common Sales and Office occupations in Montour are Sales & Related (11 | 9.0%), and Office & Administration (3 | 2.5%).
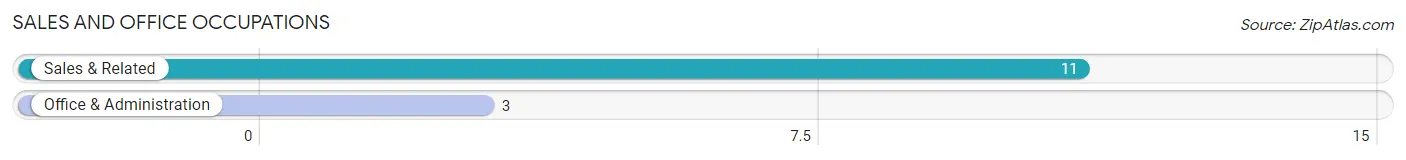
Sales and Office Occupations by Sex
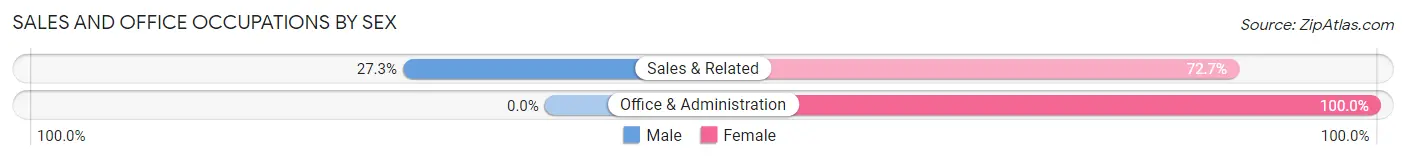
| Occupation | Male | Female |
| Sales & Related | 3 (27.3%) | 8 (72.7%) |
| Office & Administration | 0 (0.0%) | 3 (100.0%) |
| Total (Category) | 3 (21.4%) | 11 (78.6%) |
| Total (Overall) | 79 (64.7%) | 43 (35.2%) |
Natural Resources, Construction and Maintenance Occupations
The most common Natural Resources, Construction and Maintenance occupations in Montour are Construction & Extraction (14 | 11.5%), and Installation, Maintenance & Repair (2 | 1.6%).
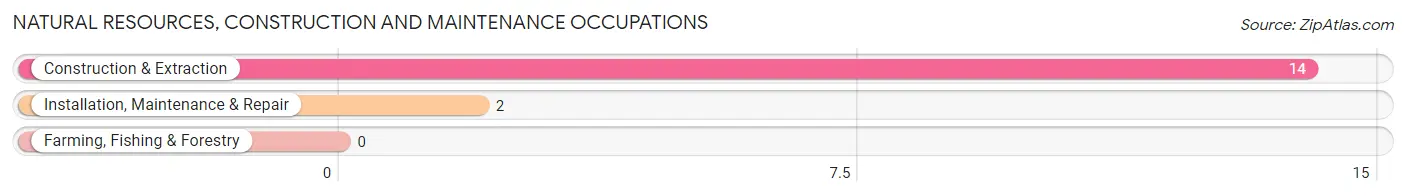
Natural Resources, Construction and Maintenance Occupations by Sex
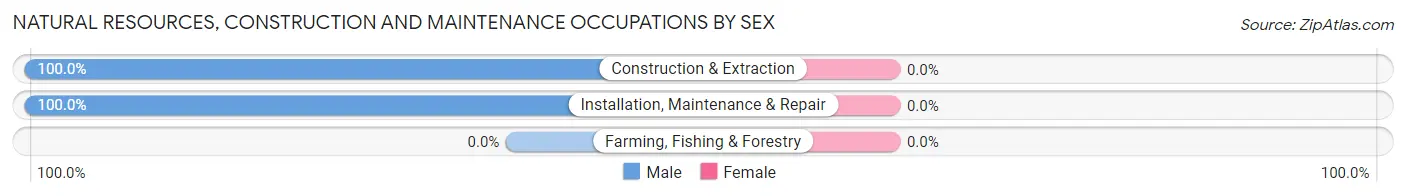
| Occupation | Male | Female |
| Farming, Fishing & Forestry | 0 (0.0%) | 0 (0.0%) |
| Construction & Extraction | 14 (100.0%) | 0 (0.0%) |
| Installation, Maintenance & Repair | 2 (100.0%) | 0 (0.0%) |
| Total (Category) | 16 (100.0%) | 0 (0.0%) |
| Total (Overall) | 79 (64.7%) | 43 (35.2%) |
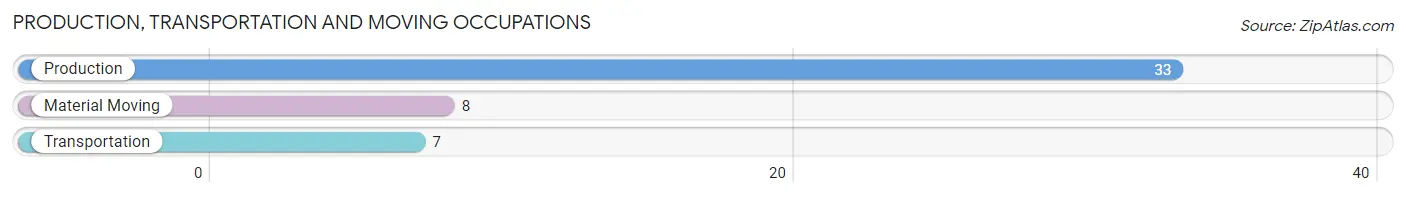
Production, Transportation and Moving Occupations
The most common Production, Transportation and Moving occupations in Montour are Production (33 | 27.1%), Material Moving (8 | 6.6%), and Transportation (7 | 5.7%).
Production, Transportation and Moving Occupations by Sex
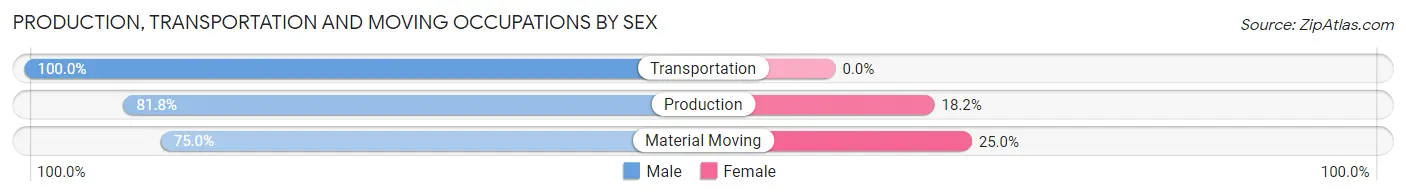
| Occupation | Male | Female |
| Production | 27 (81.8%) | 6 (18.2%) |
| Transportation | 7 (100.0%) | 0 (0.0%) |
| Material Moving | 6 (75.0%) | 2 (25.0%) |
| Total (Category) | 40 (83.3%) | 8 (16.7%) |
| Total (Overall) | 79 (64.7%) | 43 (35.2%) |
Employment Industries by Sex in Montour
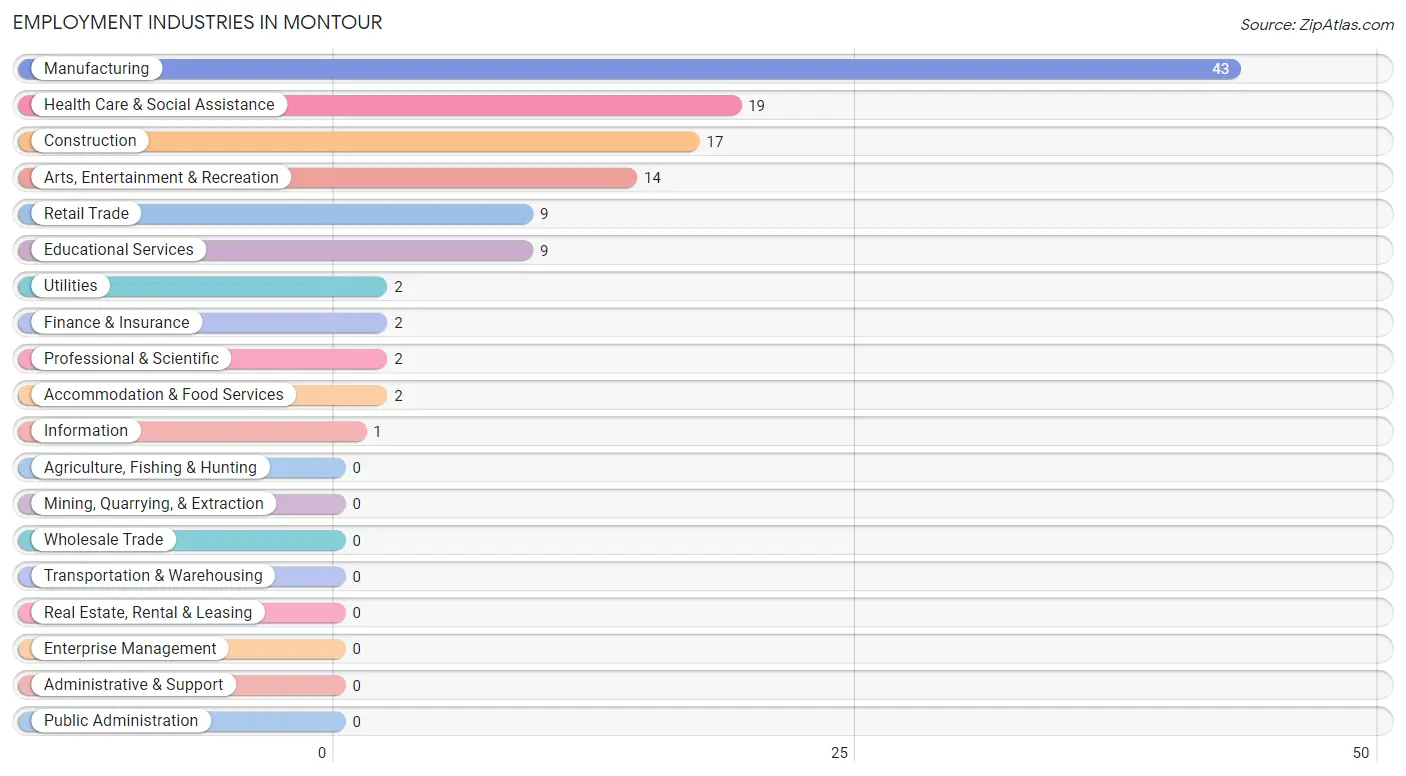
Employment Industries in Montour
The major employment industries in Montour include Manufacturing (43 | 35.2%), Health Care & Social Assistance (19 | 15.6%), Construction (17 | 13.9%), Arts, Entertainment & Recreation (14 | 11.5%), and Retail Trade (9 | 7.4%).
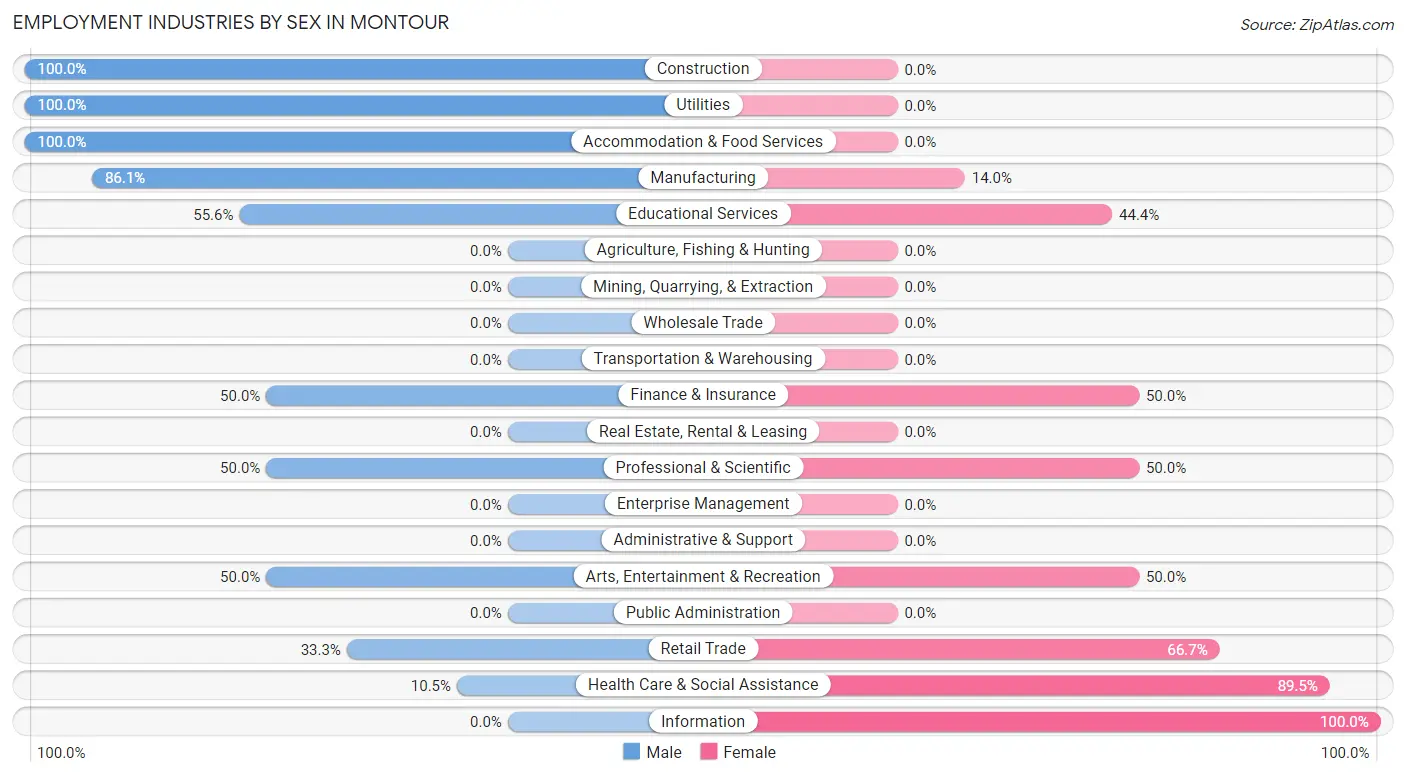
Employment Industries by Sex in Montour
The Montour industries that see more men than women are Construction (100.0%), Utilities (100.0%), and Accommodation & Food Services (100.0%), whereas the industries that tend to have a higher number of women are Information (100.0%), Health Care & Social Assistance (89.5%), and Retail Trade (66.7%).
| Industry | Male | Female |
| Agriculture, Fishing & Hunting | 0 (0.0%) | 0 (0.0%) |
| Mining, Quarrying, & Extraction | 0 (0.0%) | 0 (0.0%) |
| Construction | 17 (100.0%) | 0 (0.0%) |
| Manufacturing | 37 (86.1%) | 6 (14.0%) |
| Wholesale Trade | 0 (0.0%) | 0 (0.0%) |
| Retail Trade | 3 (33.3%) | 6 (66.7%) |
| Transportation & Warehousing | 0 (0.0%) | 0 (0.0%) |
| Utilities | 2 (100.0%) | 0 (0.0%) |
| Information | 0 (0.0%) | 1 (100.0%) |
| Finance & Insurance | 1 (50.0%) | 1 (50.0%) |
| Real Estate, Rental & Leasing | 0 (0.0%) | 0 (0.0%) |
| Professional & Scientific | 1 (50.0%) | 1 (50.0%) |
| Enterprise Management | 0 (0.0%) | 0 (0.0%) |
| Administrative & Support | 0 (0.0%) | 0 (0.0%) |
| Educational Services | 5 (55.6%) | 4 (44.4%) |
| Health Care & Social Assistance | 2 (10.5%) | 17 (89.5%) |
| Arts, Entertainment & Recreation | 7 (50.0%) | 7 (50.0%) |
| Accommodation & Food Services | 2 (100.0%) | 0 (0.0%) |
| Public Administration | 0 (0.0%) | 0 (0.0%) |
| Total | 79 (64.7%) | 43 (35.2%) |
Education in Montour
School Enrollment in Montour
The most common levels of schooling among the 27 students in Montour are middle school (10 | 37.0%), high school (10 | 37.0%), and elementary school (6 | 22.2%).
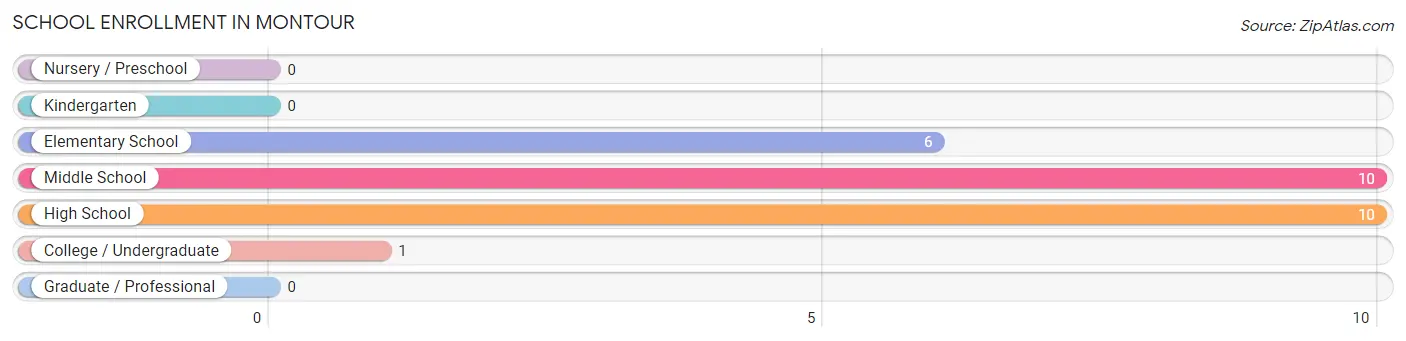
| School Level | # Students | % Students |
| Nursery / Preschool | 0 | 0.0% |
| Kindergarten | 0 | 0.0% |
| Elementary School | 6 | 22.2% |
| Middle School | 10 | 37.0% |
| High School | 10 | 37.0% |
| College / Undergraduate | 1 | 3.7% |
| Graduate / Professional | 0 | 0.0% |
| Total | 27 | 100.0% |
School Enrollment by Age by Funding Source in Montour
Out of a total of 27 students who are enrolled in schools in Montour, 10 (37.0%) attend a private institution, while the remaining 17 (63.0%) are enrolled in public schools. The age group of 10 to 14 year olds has the highest likelihood of being enrolled in private schools, with 10 (100.0% in the age bracket) enrolled. Conversely, the age group of 5 to 9 year old has the lowest likelihood of being enrolled in a private school, with 6 (100.0% in the age bracket) attending a public institution.
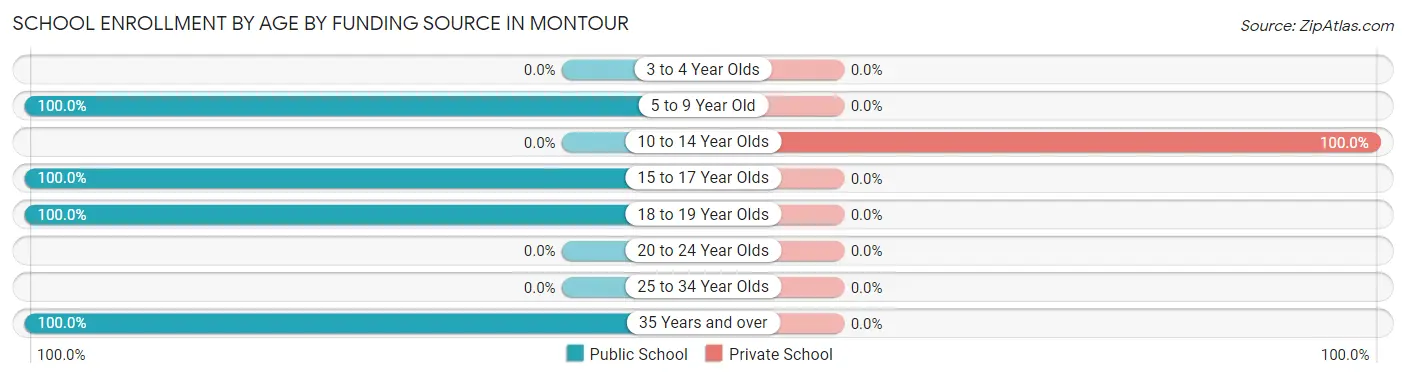
| Age Bracket | Public School | Private School |
| 3 to 4 Year Olds | 0 (0.0%) | 0 (0.0%) |
| 5 to 9 Year Old | 6 (100.0%) | 0 (0.0%) |
| 10 to 14 Year Olds | 0 (0.0%) | 10 (100.0%) |
| 15 to 17 Year Olds | 7 (100.0%) | 0 (0.0%) |
| 18 to 19 Year Olds | 3 (100.0%) | 0 (0.0%) |
| 20 to 24 Year Olds | 0 (0.0%) | 0 (0.0%) |
| 25 to 34 Year Olds | 0 (0.0%) | 0 (0.0%) |
| 35 Years and over | 1 (100.0%) | 0 (0.0%) |
| Total | 17 (63.0%) | 10 (37.0%) |
Educational Attainment by Field of Study in Montour
Physical & health sciences (12 | 38.7%), business (8 | 25.8%), visual & performing arts (4 | 12.9%), education (3 | 9.7%), and bio, nature & agricultural (2 | 6.5%) are the most common fields of study among 31 individuals in Montour who have obtained a bachelor's degree or higher.
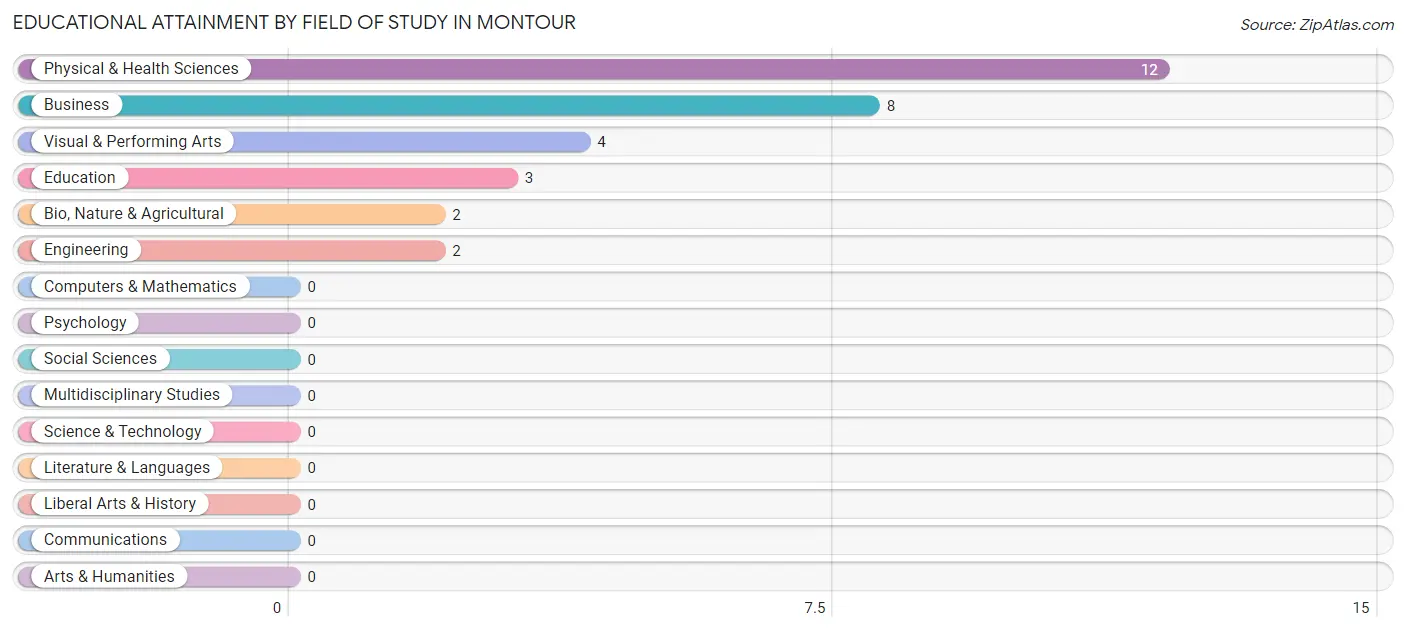
| Field of Study | # Graduates | % Graduates |
| Computers & Mathematics | 0 | 0.0% |
| Bio, Nature & Agricultural | 2 | 6.5% |
| Physical & Health Sciences | 12 | 38.7% |
| Psychology | 0 | 0.0% |
| Social Sciences | 0 | 0.0% |
| Engineering | 2 | 6.5% |
| Multidisciplinary Studies | 0 | 0.0% |
| Science & Technology | 0 | 0.0% |
| Business | 8 | 25.8% |
| Education | 3 | 9.7% |
| Literature & Languages | 0 | 0.0% |
| Liberal Arts & History | 0 | 0.0% |
| Visual & Performing Arts | 4 | 12.9% |
| Communications | 0 | 0.0% |
| Arts & Humanities | 0 | 0.0% |
| Total | 31 | 100.0% |
Transportation & Commute in Montour
Vehicle Availability by Sex in Montour
The most prevalent vehicle ownership categories in Montour are males with 3 vehicles (28, accounting for 35.4%) and females with 3 vehicles (23, making up 65.1%).
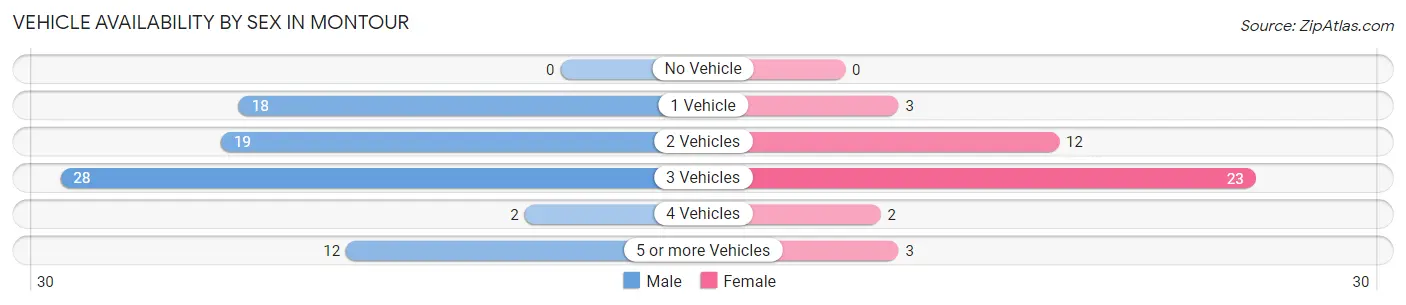
| Vehicles Available | Male | Female |
| No Vehicle | 0 (0.0%) | 0 (0.0%) |
| 1 Vehicle | 18 (22.8%) | 3 (7.0%) |
| 2 Vehicles | 19 (24.0%) | 12 (27.9%) |
| 3 Vehicles | 28 (35.4%) | 23 (53.5%) |
| 4 Vehicles | 2 (2.5%) | 2 (4.6%) |
| 5 or more Vehicles | 12 (15.2%) | 3 (7.0%) |
| Total | 79 (100.0%) | 43 (100.0%) |
Commute Time in Montour
The most frequently occuring commute durations in Montour are 15 to 19 minutes (28 commuters, 26.4%), 30 to 34 minutes (22 commuters, 20.7%), and 20 to 24 minutes (18 commuters, 17.0%).
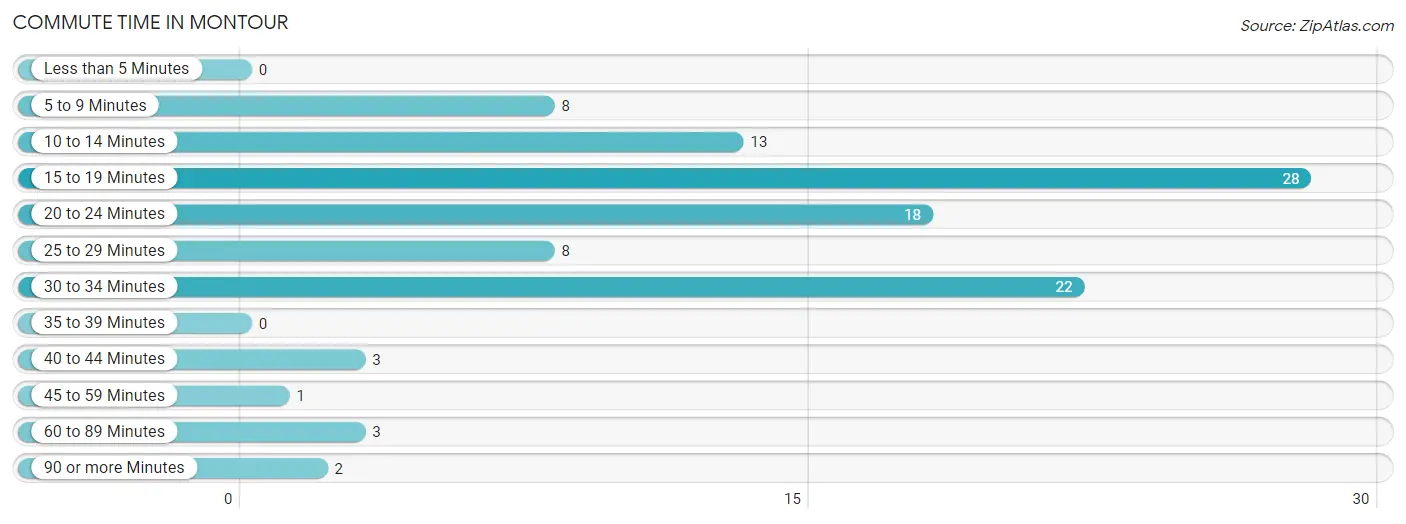
| Commute Time | # Commuters | % Commuters |
| Less than 5 Minutes | 0 | 0.0% |
| 5 to 9 Minutes | 8 | 7.5% |
| 10 to 14 Minutes | 13 | 12.3% |
| 15 to 19 Minutes | 28 | 26.4% |
| 20 to 24 Minutes | 18 | 17.0% |
| 25 to 29 Minutes | 8 | 7.5% |
| 30 to 34 Minutes | 22 | 20.7% |
| 35 to 39 Minutes | 0 | 0.0% |
| 40 to 44 Minutes | 3 | 2.8% |
| 45 to 59 Minutes | 1 | 0.9% |
| 60 to 89 Minutes | 3 | 2.8% |
| 90 or more Minutes | 2 | 1.9% |
Commute Time by Sex in Montour
The most common commute times in Montour are 15 to 19 minutes (20 commuters, 31.2%) for males and 15 to 19 minutes (8 commuters, 19.1%) for females.
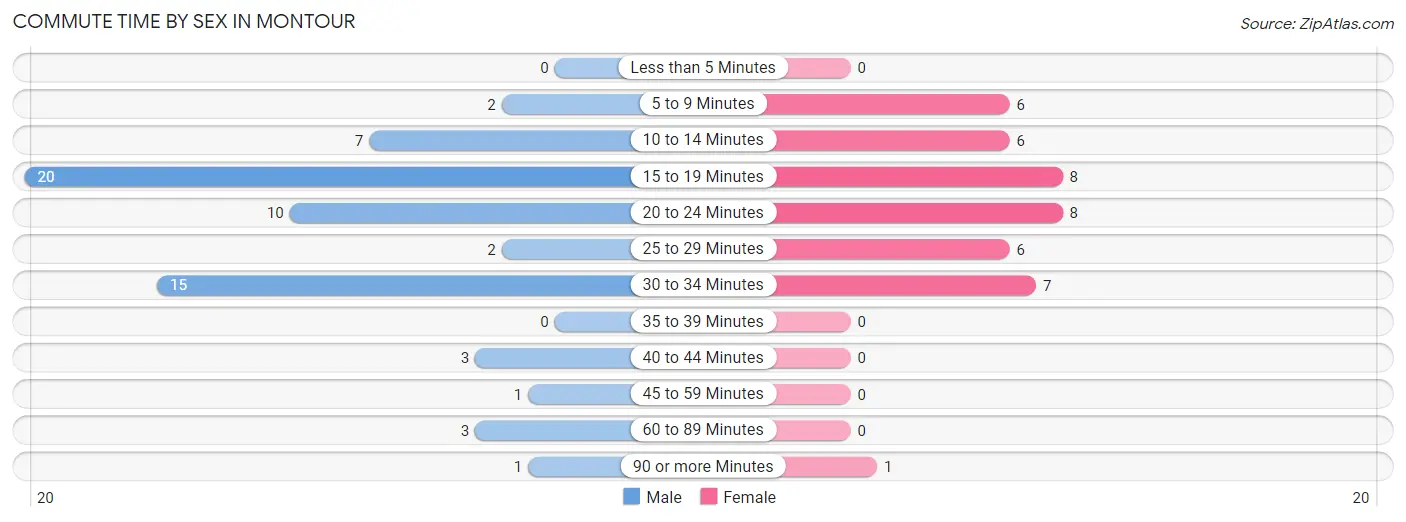
| Commute Time | Male | Female |
| Less than 5 Minutes | 0 (0.0%) | 0 (0.0%) |
| 5 to 9 Minutes | 2 (3.1%) | 6 (14.3%) |
| 10 to 14 Minutes | 7 (10.9%) | 6 (14.3%) |
| 15 to 19 Minutes | 20 (31.2%) | 8 (19.1%) |
| 20 to 24 Minutes | 10 (15.6%) | 8 (19.1%) |
| 25 to 29 Minutes | 2 (3.1%) | 6 (14.3%) |
| 30 to 34 Minutes | 15 (23.4%) | 7 (16.7%) |
| 35 to 39 Minutes | 0 (0.0%) | 0 (0.0%) |
| 40 to 44 Minutes | 3 (4.7%) | 0 (0.0%) |
| 45 to 59 Minutes | 1 (1.6%) | 0 (0.0%) |
| 60 to 89 Minutes | 3 (4.7%) | 0 (0.0%) |
| 90 or more Minutes | 1 (1.6%) | 1 (2.4%) |
Time of Departure to Work by Sex in Montour
The most frequent times of departure to work in Montour are 5:00 AM to 5:29 AM (14, 21.9%) for males and 6:30 AM to 6:59 AM (8, 19.1%) for females.
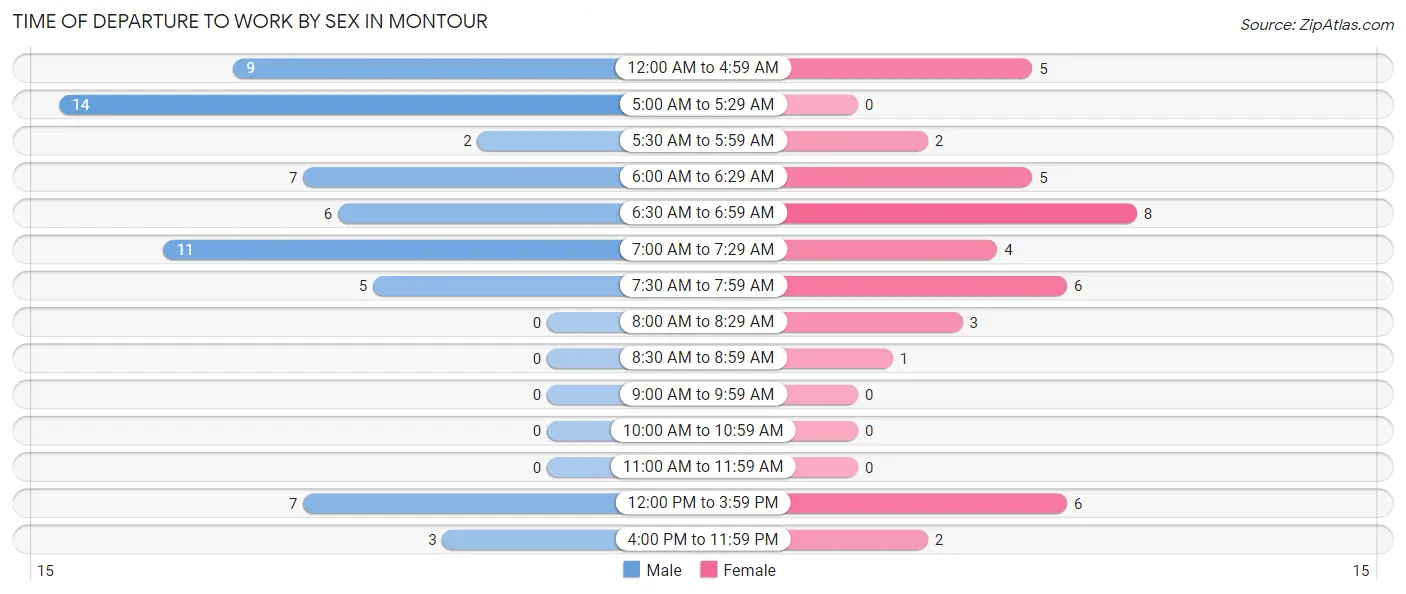
| Time of Departure | Male | Female |
| 12:00 AM to 4:59 AM | 9 (14.1%) | 5 (11.9%) |
| 5:00 AM to 5:29 AM | 14 (21.9%) | 0 (0.0%) |
| 5:30 AM to 5:59 AM | 2 (3.1%) | 2 (4.8%) |
| 6:00 AM to 6:29 AM | 7 (10.9%) | 5 (11.9%) |
| 6:30 AM to 6:59 AM | 6 (9.4%) | 8 (19.1%) |
| 7:00 AM to 7:29 AM | 11 (17.2%) | 4 (9.5%) |
| 7:30 AM to 7:59 AM | 5 (7.8%) | 6 (14.3%) |
| 8:00 AM to 8:29 AM | 0 (0.0%) | 3 (7.1%) |
| 8:30 AM to 8:59 AM | 0 (0.0%) | 1 (2.4%) |
| 9:00 AM to 9:59 AM | 0 (0.0%) | 0 (0.0%) |
| 10:00 AM to 10:59 AM | 0 (0.0%) | 0 (0.0%) |
| 11:00 AM to 11:59 AM | 0 (0.0%) | 0 (0.0%) |
| 12:00 PM to 3:59 PM | 7 (10.9%) | 6 (14.3%) |
| 4:00 PM to 11:59 PM | 3 (4.7%) | 2 (4.8%) |
| Total | 64 (100.0%) | 42 (100.0%) |
Housing Occupancy in Montour
Occupancy by Ownership in Montour
Of the total 94 dwellings in Montour, owner-occupied units account for 89 (94.7%), while renter-occupied units make up 5 (5.3%).

| Occupancy | # Housing Units | % Housing Units |
| Owner Occupied Housing Units | 89 | 94.7% |
| Renter-Occupied Housing Units | 5 | 5.3% |
| Total Occupied Housing Units | 94 | 100.0% |
Occupancy by Household Size in Montour
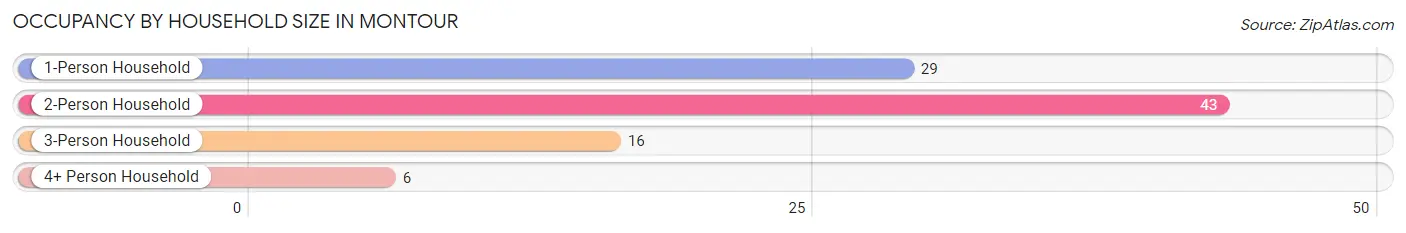
| Household Size | # Housing Units | % Housing Units |
| 1-Person Household | 29 | 30.8% |
| 2-Person Household | 43 | 45.7% |
| 3-Person Household | 16 | 17.0% |
| 4+ Person Household | 6 | 6.4% |
| Total Housing Units | 94 | 100.0% |
Occupancy by Ownership by Household Size in Montour
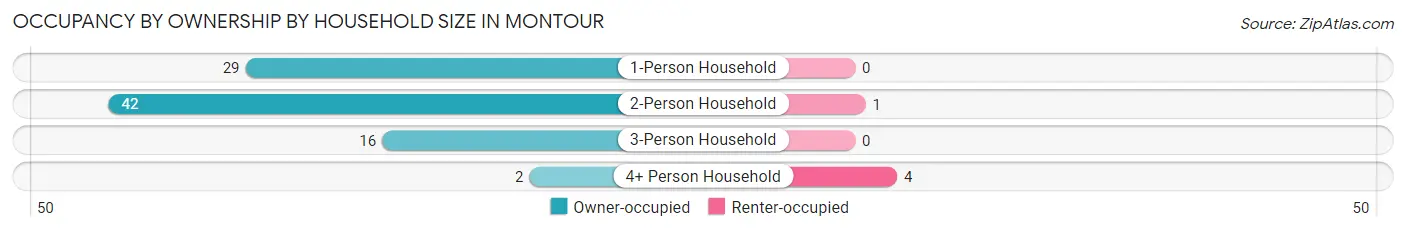
| Household Size | Owner-occupied | Renter-occupied |
| 1-Person Household | 29 (100.0%) | 0 (0.0%) |
| 2-Person Household | 42 (97.7%) | 1 (2.3%) |
| 3-Person Household | 16 (100.0%) | 0 (0.0%) |
| 4+ Person Household | 2 (33.3%) | 4 (66.7%) |
| Total Housing Units | 89 (94.7%) | 5 (5.3%) |
Occupancy by Educational Attainment in Montour
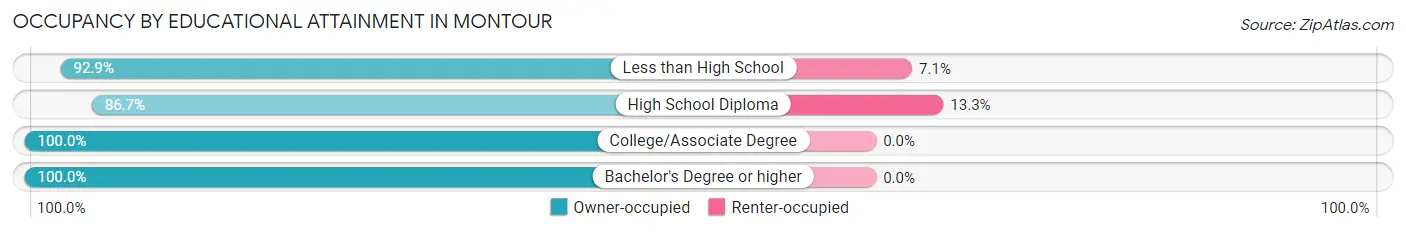
| Household Size | Owner-occupied | Renter-occupied |
| Less than High School | 13 (92.9%) | 1 (7.1%) |
| High School Diploma | 26 (86.7%) | 4 (13.3%) |
| College/Associate Degree | 26 (100.0%) | 0 (0.0%) |
| Bachelor's Degree or higher | 24 (100.0%) | 0 (0.0%) |
Occupancy by Age of Householder in Montour
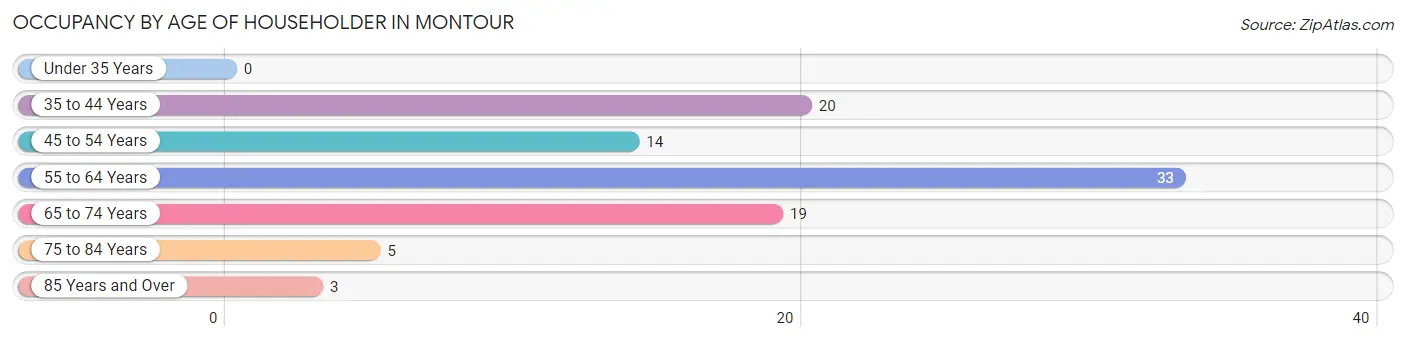
| Age Bracket | # Households | % Households |
| Under 35 Years | 0 | 0.0% |
| 35 to 44 Years | 20 | 21.3% |
| 45 to 54 Years | 14 | 14.9% |
| 55 to 64 Years | 33 | 35.1% |
| 65 to 74 Years | 19 | 20.2% |
| 75 to 84 Years | 5 | 5.3% |
| 85 Years and Over | 3 | 3.2% |
| Total | 94 | 100.0% |
Housing Finances in Montour
Median Income by Occupancy in Montour
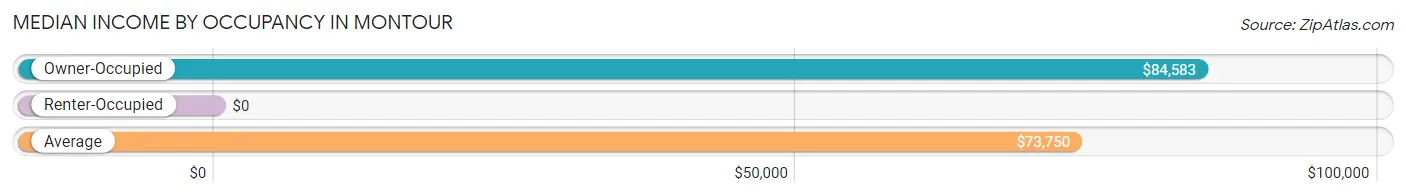
| Occupancy Type | # Households | Median Income |
| Owner-Occupied | 89 (94.7%) | $84,583 |
| Renter-Occupied | 5 (5.3%) | $0 |
| Average | 94 (100.0%) | $73,750 |
Occupancy by Householder Income Bracket in Montour
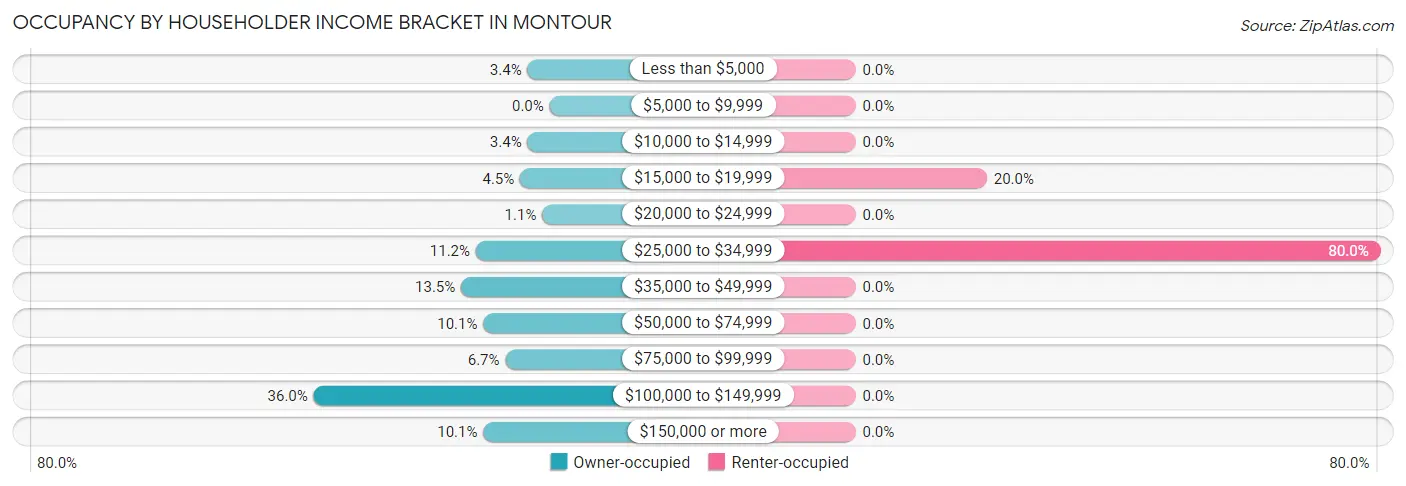
| Income Bracket | Owner-occupied | Renter-occupied |
| Less than $5,000 | 3 (3.4%) | 0 (0.0%) |
| $5,000 to $9,999 | 0 (0.0%) | 0 (0.0%) |
| $10,000 to $14,999 | 3 (3.4%) | 0 (0.0%) |
| $15,000 to $19,999 | 4 (4.5%) | 1 (20.0%) |
| $20,000 to $24,999 | 1 (1.1%) | 0 (0.0%) |
| $25,000 to $34,999 | 10 (11.2%) | 4 (80.0%) |
| $35,000 to $49,999 | 12 (13.5%) | 0 (0.0%) |
| $50,000 to $74,999 | 9 (10.1%) | 0 (0.0%) |
| $75,000 to $99,999 | 6 (6.7%) | 0 (0.0%) |
| $100,000 to $149,999 | 32 (36.0%) | 0 (0.0%) |
| $150,000 or more | 9 (10.1%) | 0 (0.0%) |
| Total | 89 (100.0%) | 5 (100.0%) |
Monthly Housing Cost Tiers in Montour
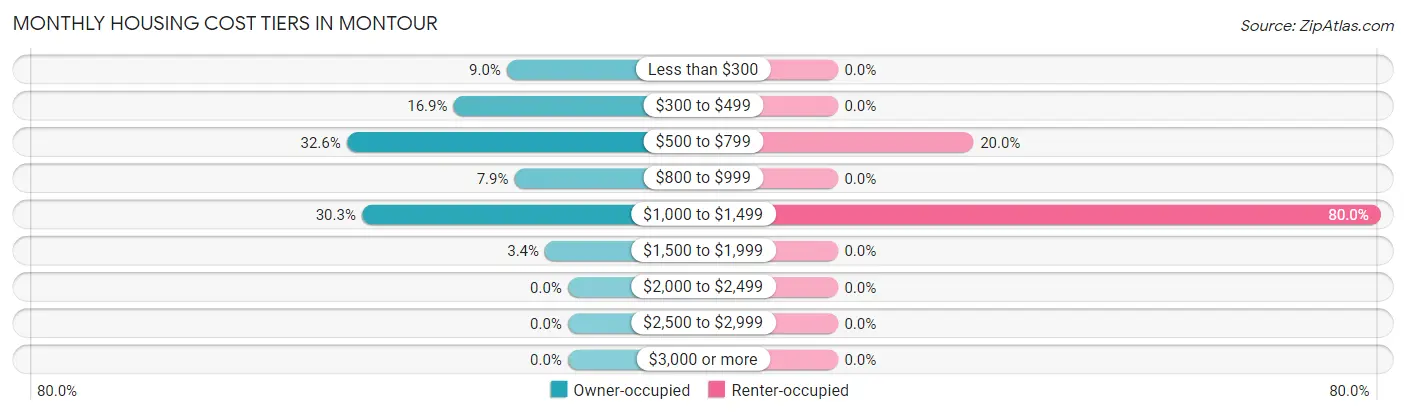
| Monthly Cost | Owner-occupied | Renter-occupied |
| Less than $300 | 8 (9.0%) | 0 (0.0%) |
| $300 to $499 | 15 (16.9%) | 0 (0.0%) |
| $500 to $799 | 29 (32.6%) | 1 (20.0%) |
| $800 to $999 | 7 (7.9%) | 0 (0.0%) |
| $1,000 to $1,499 | 27 (30.3%) | 4 (80.0%) |
| $1,500 to $1,999 | 3 (3.4%) | 0 (0.0%) |
| $2,000 to $2,499 | 0 (0.0%) | 0 (0.0%) |
| $2,500 to $2,999 | 0 (0.0%) | 0 (0.0%) |
| $3,000 or more | 0 (0.0%) | 0 (0.0%) |
| Total | 89 (100.0%) | 5 (100.0%) |
Physical Housing Characteristics in Montour
Housing Structures in Montour
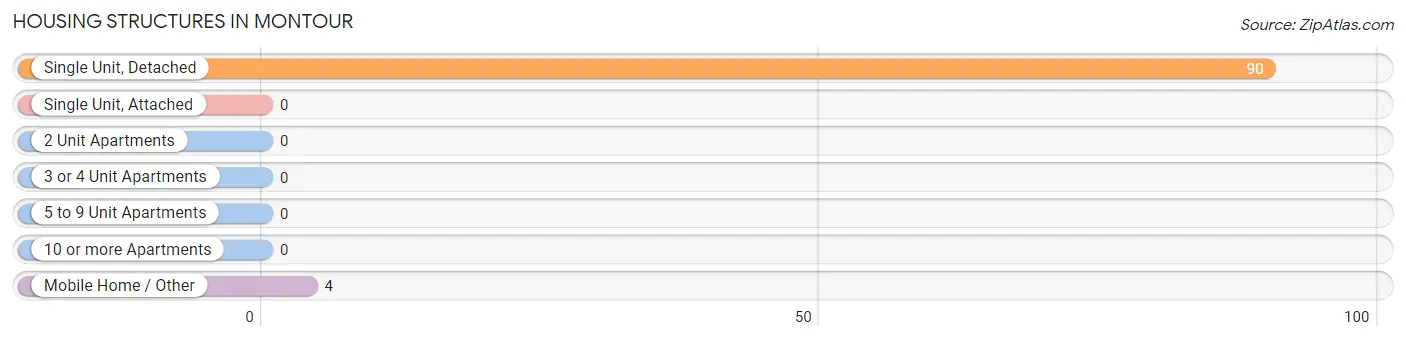
| Structure Type | # Housing Units | % Housing Units |
| Single Unit, Detached | 90 | 95.7% |
| Single Unit, Attached | 0 | 0.0% |
| 2 Unit Apartments | 0 | 0.0% |
| 3 or 4 Unit Apartments | 0 | 0.0% |
| 5 to 9 Unit Apartments | 0 | 0.0% |
| 10 or more Apartments | 0 | 0.0% |
| Mobile Home / Other | 4 | 4.3% |
| Total | 94 | 100.0% |
Housing Structures by Occupancy in Montour
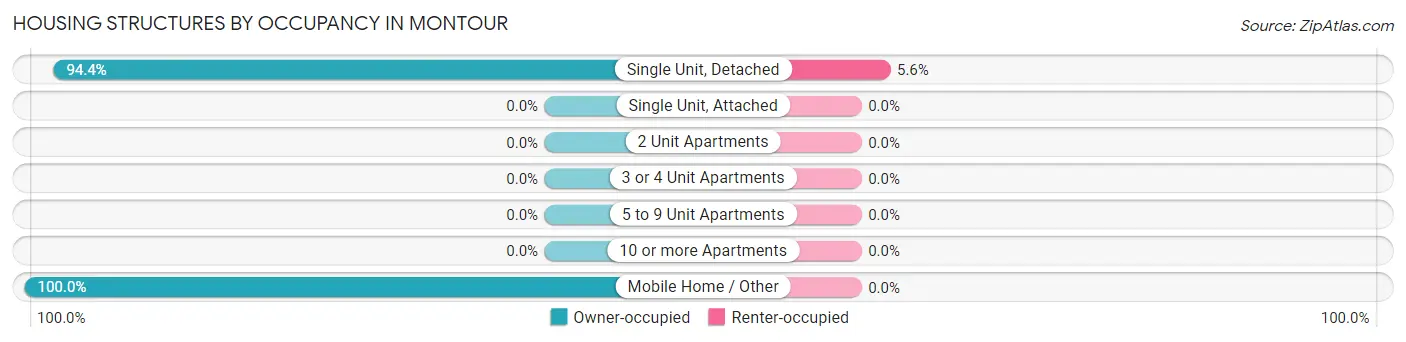
| Structure Type | Owner-occupied | Renter-occupied |
| Single Unit, Detached | 85 (94.4%) | 5 (5.6%) |
| Single Unit, Attached | 0 (0.0%) | 0 (0.0%) |
| 2 Unit Apartments | 0 (0.0%) | 0 (0.0%) |
| 3 or 4 Unit Apartments | 0 (0.0%) | 0 (0.0%) |
| 5 to 9 Unit Apartments | 0 (0.0%) | 0 (0.0%) |
| 10 or more Apartments | 0 (0.0%) | 0 (0.0%) |
| Mobile Home / Other | 4 (100.0%) | 0 (0.0%) |
| Total | 89 (94.7%) | 5 (5.3%) |
Housing Structures by Number of Rooms in Montour
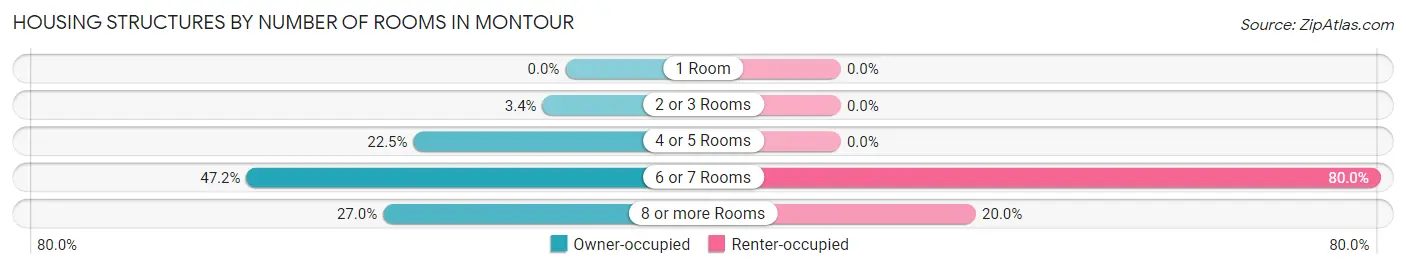
| Number of Rooms | Owner-occupied | Renter-occupied |
| 1 Room | 0 (0.0%) | 0 (0.0%) |
| 2 or 3 Rooms | 3 (3.4%) | 0 (0.0%) |
| 4 or 5 Rooms | 20 (22.5%) | 0 (0.0%) |
| 6 or 7 Rooms | 42 (47.2%) | 4 (80.0%) |
| 8 or more Rooms | 24 (27.0%) | 1 (20.0%) |
| Total | 89 (100.0%) | 5 (100.0%) |
Housing Structure by Heating Type in Montour
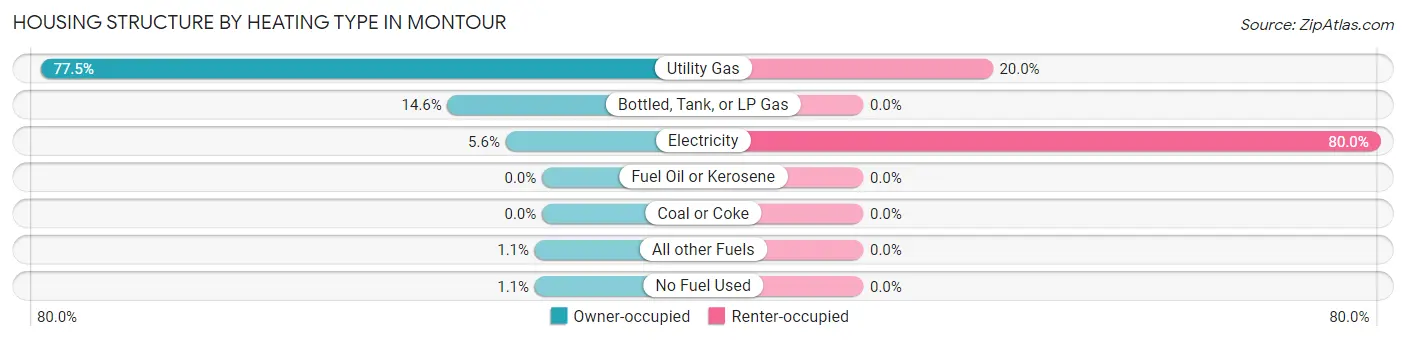
| Heating Type | Owner-occupied | Renter-occupied |
| Utility Gas | 69 (77.5%) | 1 (20.0%) |
| Bottled, Tank, or LP Gas | 13 (14.6%) | 0 (0.0%) |
| Electricity | 5 (5.6%) | 4 (80.0%) |
| Fuel Oil or Kerosene | 0 (0.0%) | 0 (0.0%) |
| Coal or Coke | 0 (0.0%) | 0 (0.0%) |
| All other Fuels | 1 (1.1%) | 0 (0.0%) |
| No Fuel Used | 1 (1.1%) | 0 (0.0%) |
| Total | 89 (100.0%) | 5 (100.0%) |
Household Vehicle Usage in Montour
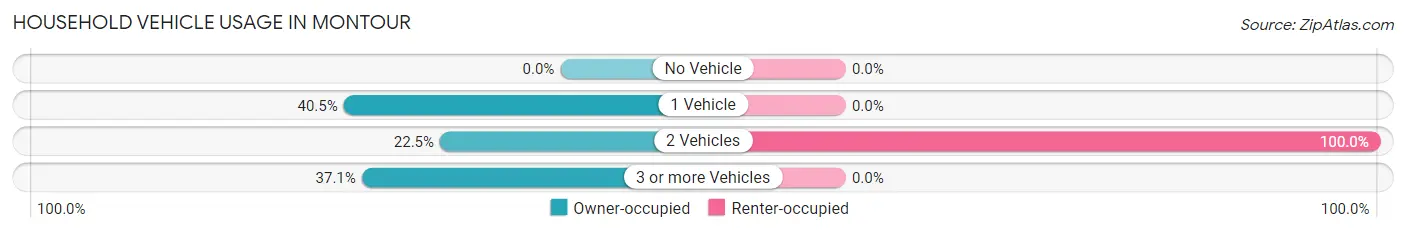
| Vehicles per Household | Owner-occupied | Renter-occupied |
| No Vehicle | 0 (0.0%) | 0 (0.0%) |
| 1 Vehicle | 36 (40.5%) | 0 (0.0%) |
| 2 Vehicles | 20 (22.5%) | 5 (100.0%) |
| 3 or more Vehicles | 33 (37.1%) | 0 (0.0%) |
| Total | 89 (100.0%) | 5 (100.0%) |
Real Estate & Mortgages in Montour
Real Estate and Mortgage Overview in Montour
| Characteristic | Without Mortgage | With Mortgage |
| Housing Units | 47 | 42 |
| Median Property Value | $96,100 | $88,300 |
| Median Household Income | $58,750 | $6 |
| Monthly Housing Costs | $505 | $0 |
| Real Estate Taxes | $1,477 | $0 |
Property Value by Mortgage Status in Montour
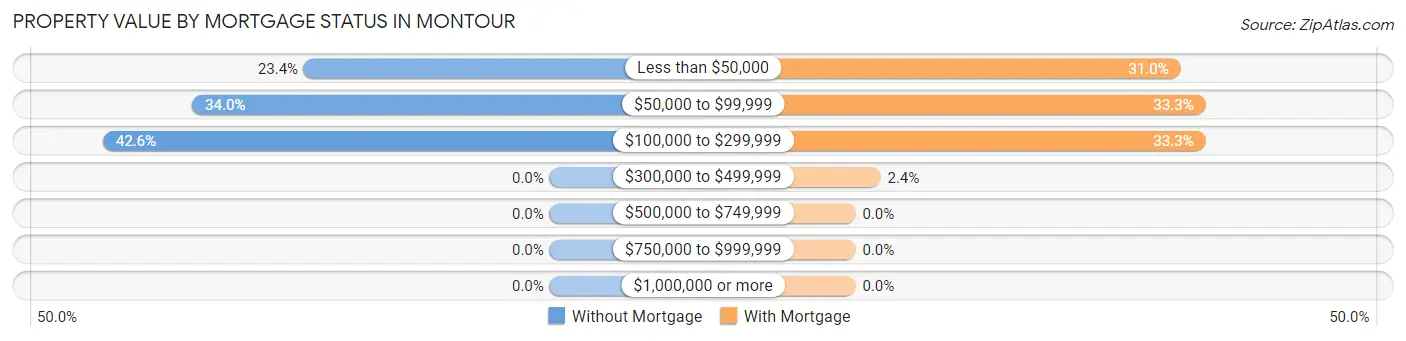
| Property Value | Without Mortgage | With Mortgage |
| Less than $50,000 | 11 (23.4%) | 13 (30.9%) |
| $50,000 to $99,999 | 16 (34.0%) | 14 (33.3%) |
| $100,000 to $299,999 | 20 (42.5%) | 14 (33.3%) |
| $300,000 to $499,999 | 0 (0.0%) | 1 (2.4%) |
| $500,000 to $749,999 | 0 (0.0%) | 0 (0.0%) |
| $750,000 to $999,999 | 0 (0.0%) | 0 (0.0%) |
| $1,000,000 or more | 0 (0.0%) | 0 (0.0%) |
| Total | 47 (100.0%) | 42 (100.0%) |
Household Income by Mortgage Status in Montour
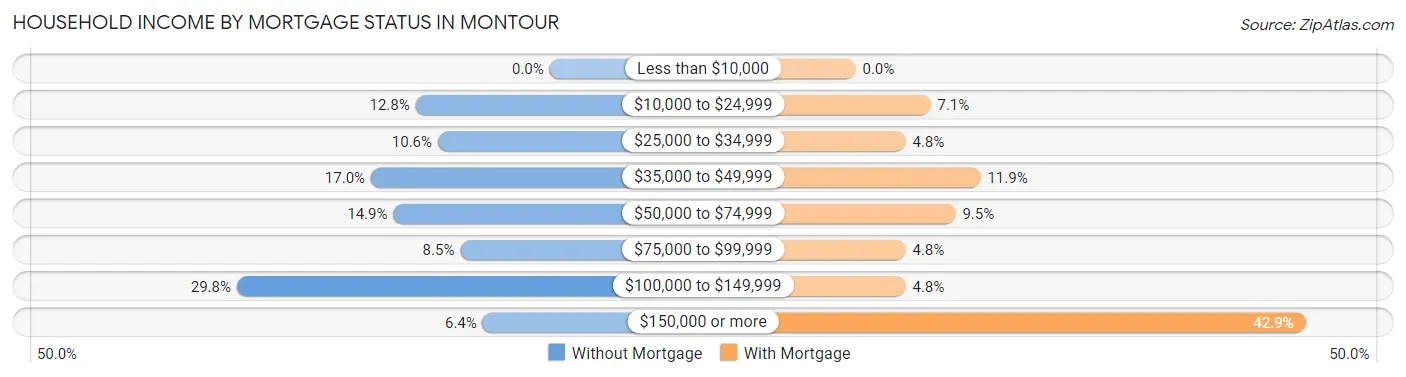
| Household Income | Without Mortgage | With Mortgage |
| Less than $10,000 | 0 (0.0%) | 0 (0.0%) |
| $10,000 to $24,999 | 6 (12.8%) | 3 (7.1%) |
| $25,000 to $34,999 | 5 (10.6%) | 2 (4.8%) |
| $35,000 to $49,999 | 8 (17.0%) | 5 (11.9%) |
| $50,000 to $74,999 | 7 (14.9%) | 4 (9.5%) |
| $75,000 to $99,999 | 4 (8.5%) | 2 (4.8%) |
| $100,000 to $149,999 | 14 (29.8%) | 2 (4.8%) |
| $150,000 or more | 3 (6.4%) | 18 (42.9%) |
| Total | 47 (100.0%) | 42 (100.0%) |
Property Value to Household Income Ratio in Montour
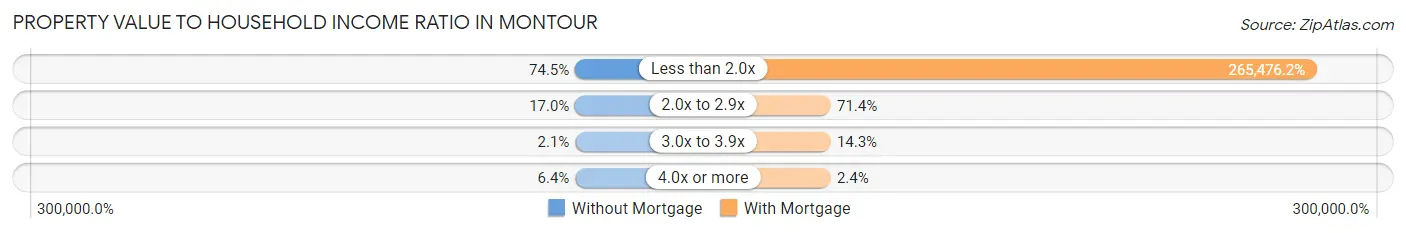
| Value-to-Income Ratio | Without Mortgage | With Mortgage |
| Less than 2.0x | 35 (74.5%) | 111,500 (265,476.2%) |
| 2.0x to 2.9x | 8 (17.0%) | 30 (71.4%) |
| 3.0x to 3.9x | 1 (2.1%) | 6 (14.3%) |
| 4.0x or more | 3 (6.4%) | 1 (2.4%) |
| Total | 47 (100.0%) | 42 (100.0%) |
Real Estate Taxes by Mortgage Status in Montour
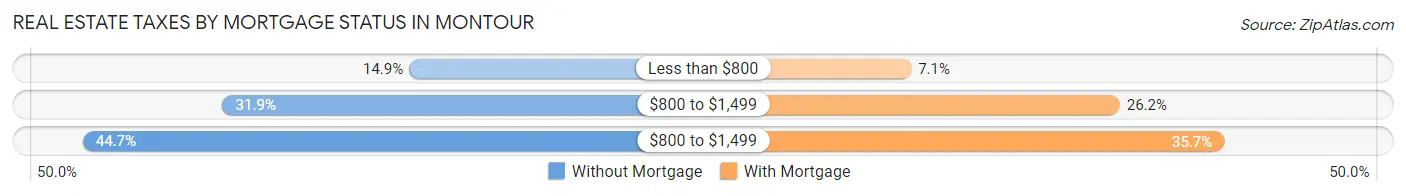
| Property Taxes | Without Mortgage | With Mortgage |
| Less than $800 | 7 (14.9%) | 3 (7.1%) |
| $800 to $1,499 | 15 (31.9%) | 11 (26.2%) |
| $800 to $1,499 | 21 (44.7%) | 15 (35.7%) |
| Total | 47 (100.0%) | 42 (100.0%) |
Health & Disability in Montour
Health Insurance Coverage by Age in Montour
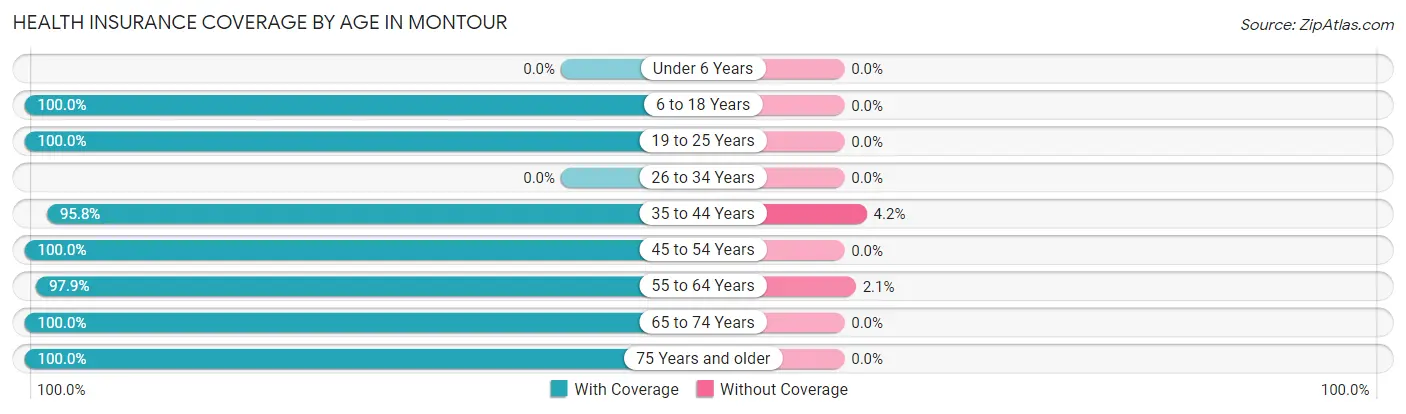
| Age Bracket | With Coverage | Without Coverage |
| Under 6 Years | 0 (0.0%) | 0 (0.0%) |
| 6 to 18 Years | 26 (100.0%) | 0 (0.0%) |
| 19 to 25 Years | 4 (100.0%) | 0 (0.0%) |
| 26 to 34 Years | 0 (0.0%) | 0 (0.0%) |
| 35 to 44 Years | 46 (95.8%) | 2 (4.2%) |
| 45 to 54 Years | 31 (100.0%) | 0 (0.0%) |
| 55 to 64 Years | 46 (97.9%) | 1 (2.1%) |
| 65 to 74 Years | 28 (100.0%) | 0 (0.0%) |
| 75 Years and older | 9 (100.0%) | 0 (0.0%) |
| Total | 190 (98.5%) | 3 (1.5%) |
Health Insurance Coverage by Citizenship Status in Montour
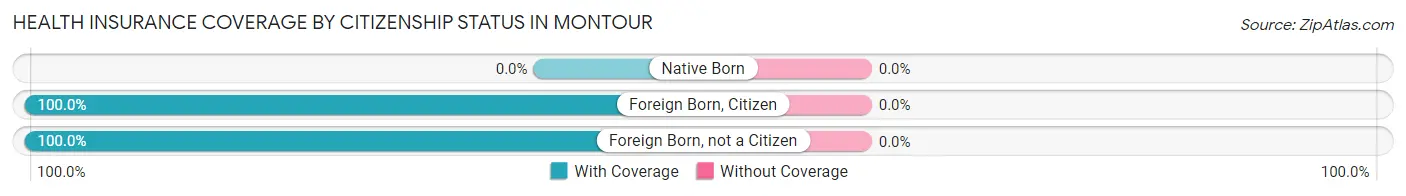
| Citizenship Status | With Coverage | Without Coverage |
| Native Born | 0 (0.0%) | 0 (0.0%) |
| Foreign Born, Citizen | 26 (100.0%) | 0 (0.0%) |
| Foreign Born, not a Citizen | 4 (100.0%) | 0 (0.0%) |
Health Insurance Coverage by Household Income in Montour
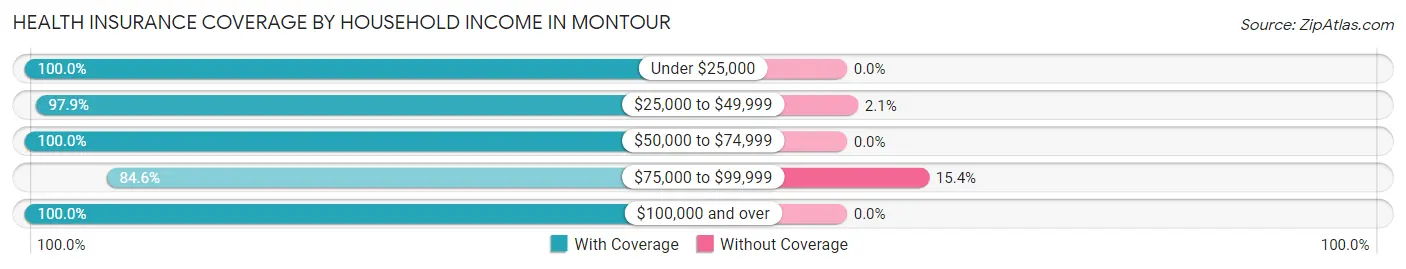
| Household Income | With Coverage | Without Coverage |
| Under $25,000 | 14 (100.0%) | 0 (0.0%) |
| $25,000 to $49,999 | 47 (97.9%) | 1 (2.1%) |
| $50,000 to $74,999 | 18 (100.0%) | 0 (0.0%) |
| $75,000 to $99,999 | 11 (84.6%) | 2 (15.4%) |
| $100,000 and over | 100 (100.0%) | 0 (0.0%) |
Public vs Private Health Insurance Coverage by Age in Montour
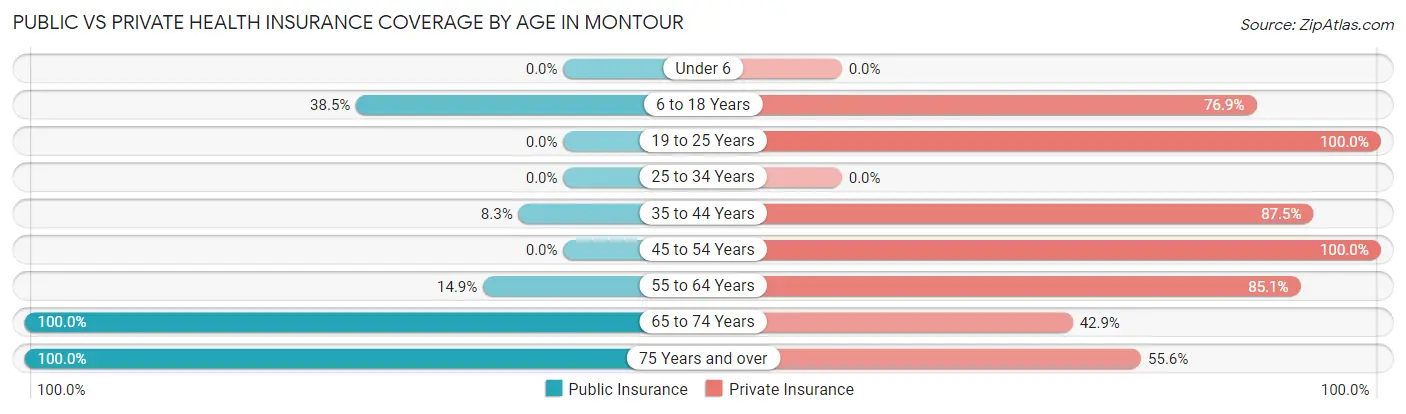
| Age Bracket | Public Insurance | Private Insurance |
| Under 6 | 0 (0.0%) | 0 (0.0%) |
| 6 to 18 Years | 10 (38.5%) | 20 (76.9%) |
| 19 to 25 Years | 0 (0.0%) | 4 (100.0%) |
| 25 to 34 Years | 0 (0.0%) | 0 (0.0%) |
| 35 to 44 Years | 4 (8.3%) | 42 (87.5%) |
| 45 to 54 Years | 0 (0.0%) | 31 (100.0%) |
| 55 to 64 Years | 7 (14.9%) | 40 (85.1%) |
| 65 to 74 Years | 28 (100.0%) | 12 (42.9%) |
| 75 Years and over | 9 (100.0%) | 5 (55.6%) |
| Total | 58 (30.0%) | 154 (79.8%) |
Disability Status by Sex by Age in Montour
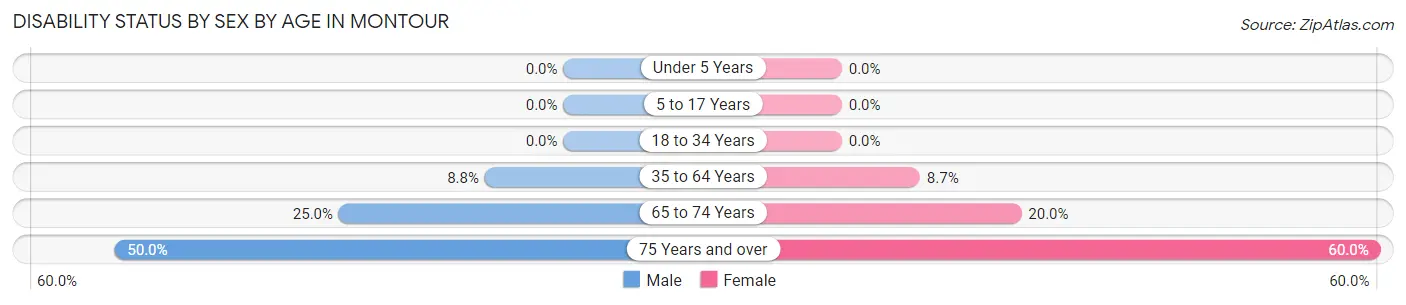
| Age Bracket | Male | Female |
| Under 5 Years | 0 (0.0%) | 0 (0.0%) |
| 5 to 17 Years | 0 (0.0%) | 0 (0.0%) |
| 18 to 34 Years | 0 (0.0%) | 0 (0.0%) |
| 35 to 64 Years | 7 (8.7%) | 4 (8.7%) |
| 65 to 74 Years | 2 (25.0%) | 4 (20.0%) |
| 75 Years and over | 2 (50.0%) | 3 (60.0%) |
Disability Class by Sex by Age in Montour
Disability Class: Hearing Difficulty
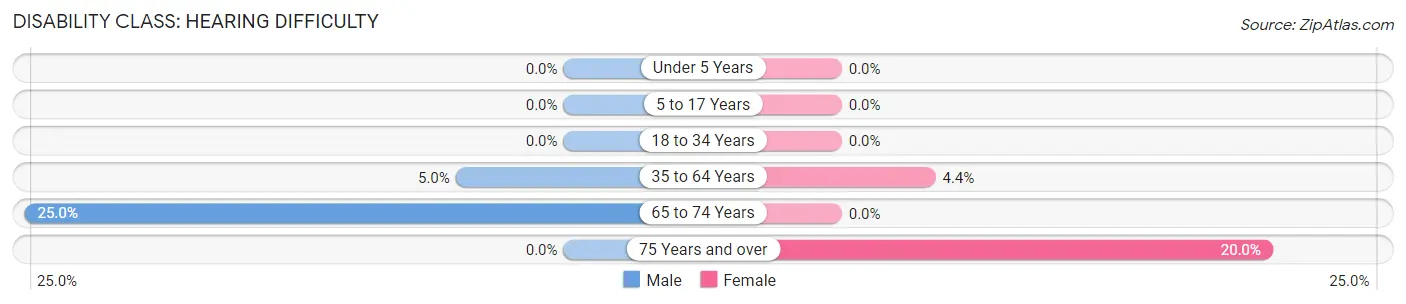
| Age Bracket | Male | Female |
| Under 5 Years | 0 (0.0%) | 0 (0.0%) |
| 5 to 17 Years | 0 (0.0%) | 0 (0.0%) |
| 18 to 34 Years | 0 (0.0%) | 0 (0.0%) |
| 35 to 64 Years | 4 (5.0%) | 2 (4.3%) |
| 65 to 74 Years | 2 (25.0%) | 0 (0.0%) |
| 75 Years and over | 0 (0.0%) | 1 (20.0%) |
Disability Class: Vision Difficulty
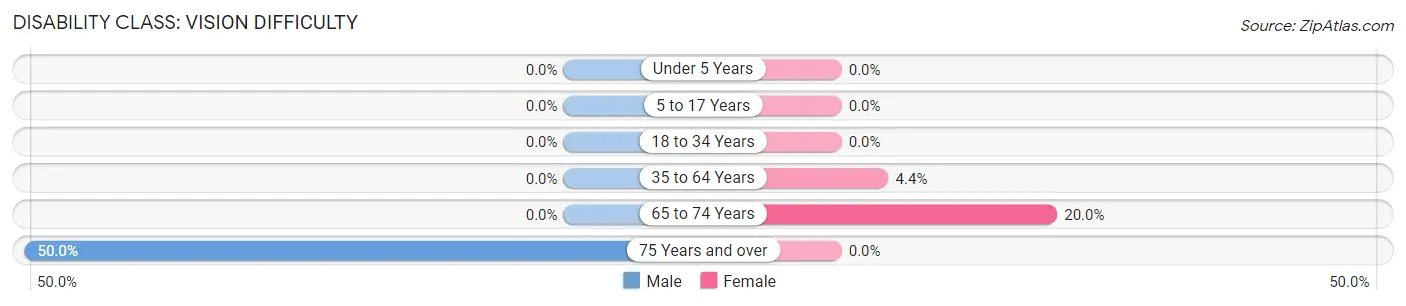
| Age Bracket | Male | Female |
| Under 5 Years | 0 (0.0%) | 0 (0.0%) |
| 5 to 17 Years | 0 (0.0%) | 0 (0.0%) |
| 18 to 34 Years | 0 (0.0%) | 0 (0.0%) |
| 35 to 64 Years | 0 (0.0%) | 2 (4.3%) |
| 65 to 74 Years | 0 (0.0%) | 4 (20.0%) |
| 75 Years and over | 2 (50.0%) | 0 (0.0%) |
Disability Class: Cognitive Difficulty
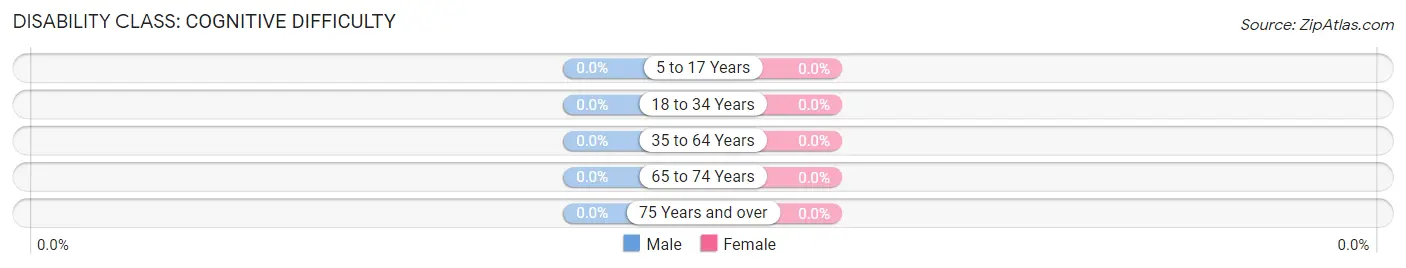
| Age Bracket | Male | Female |
| 5 to 17 Years | 0 (0.0%) | 0 (0.0%) |
| 18 to 34 Years | 0 (0.0%) | 0 (0.0%) |
| 35 to 64 Years | 0 (0.0%) | 0 (0.0%) |
| 65 to 74 Years | 0 (0.0%) | 0 (0.0%) |
| 75 Years and over | 0 (0.0%) | 0 (0.0%) |
Disability Class: Ambulatory Difficulty
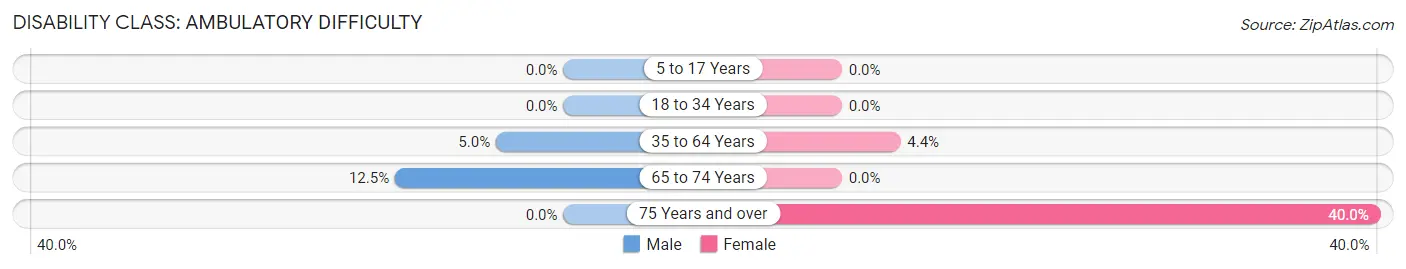
| Age Bracket | Male | Female |
| 5 to 17 Years | 0 (0.0%) | 0 (0.0%) |
| 18 to 34 Years | 0 (0.0%) | 0 (0.0%) |
| 35 to 64 Years | 4 (5.0%) | 2 (4.3%) |
| 65 to 74 Years | 1 (12.5%) | 0 (0.0%) |
| 75 Years and over | 0 (0.0%) | 2 (40.0%) |
Disability Class: Self-Care Difficulty
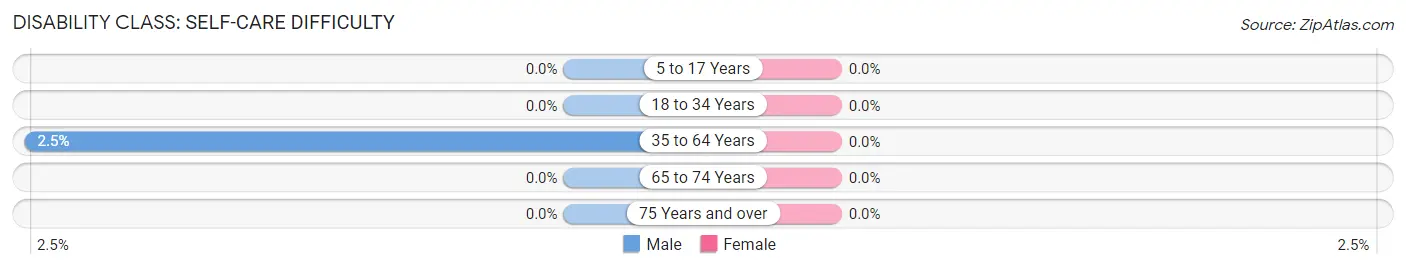
| Age Bracket | Male | Female |
| 5 to 17 Years | 0 (0.0%) | 0 (0.0%) |
| 18 to 34 Years | 0 (0.0%) | 0 (0.0%) |
| 35 to 64 Years | 2 (2.5%) | 0 (0.0%) |
| 65 to 74 Years | 0 (0.0%) | 0 (0.0%) |
| 75 Years and over | 0 (0.0%) | 0 (0.0%) |
Technology Access in Montour
Computing Device Access in Montour
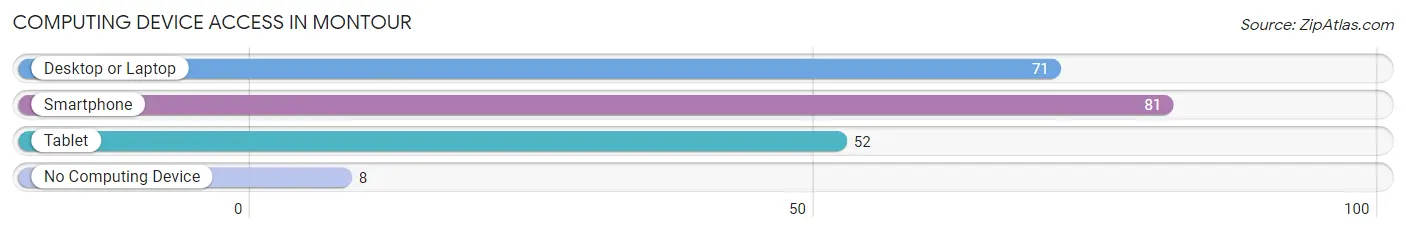
| Device Type | # Households | % Households |
| Desktop or Laptop | 71 | 75.5% |
| Smartphone | 81 | 86.2% |
| Tablet | 52 | 55.3% |
| No Computing Device | 8 | 8.5% |
| Total | 94 | 100.0% |
Internet Access in Montour
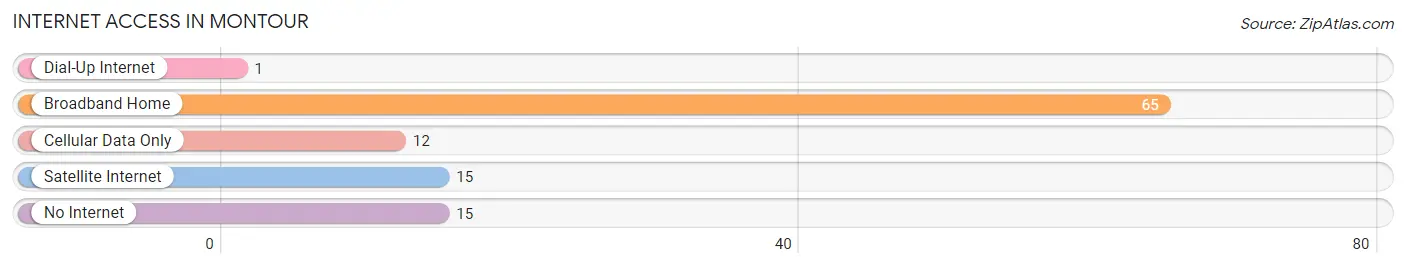
| Internet Type | # Households | % Households |
| Dial-Up Internet | 1 | 1.1% |
| Broadband Home | 65 | 69.2% |
| Cellular Data Only | 12 | 12.8% |
| Satellite Internet | 15 | 16.0% |
| No Internet | 15 | 16.0% |
| Total | 94 | 100.0% |
Montour Summary
History
The small town of Montour, Iowa is located in Tama County, Iowa, and is part of the Cedar Rapids Metropolitan Statistical Area. The town was founded in 1854 by a group of settlers from Ohio, led by William and Mary Montour. The town was named after the Montours, who were of Native American descent. The town was originally a farming community, and the first settlers were primarily of German and Irish descent.
The town grew slowly over the years, and by the early 1900s, it had a population of around 500 people. The town was primarily an agricultural community, with a few small businesses. The town was also home to a few churches, including the United Methodist Church, which was founded in 1871.
In the early 1900s, the town began to experience a period of growth. The population increased to around 1,000 people by the 1920s, and the town began to develop more businesses and services. The town also had a school, which was built in the early 1900s.
In the 1950s, the town experienced a period of decline, as many of the town's residents moved away to larger cities. The population decreased to around 500 people by the 1970s. However, in the 1980s, the town began to experience a period of growth again, and the population increased to around 1,000 people by the 1990s.
Today, Montour is a small town with a population of around 1,000 people. The town is still primarily an agricultural community, but it also has a few small businesses and services. The town is also home to a few churches, including the United Methodist Church, which was founded in 1871.
Geography
Montour is located in Tama County, Iowa, and is part of the Cedar Rapids Metropolitan Statistical Area. The town is situated on the banks of the Iowa River, and is surrounded by rolling hills and farmland. The town is located about 25 miles east of Cedar Rapids, and about 50 miles west of Iowa City.
The town has a total area of 0.7 square miles, all of which is land. The town has a humid continental climate, with hot summers and cold winters. The average temperature in the summer is around 75 degrees Fahrenheit, and the average temperature in the winter is around 25 degrees Fahrenheit.
Economy
Montour is a small town with a population of around 1,000 people. The town is primarily an agricultural community, and the main industries are farming and livestock production. The town also has a few small businesses, including a grocery store, a hardware store, and a few restaurants.
The town is also home to a few churches, including the United Methodist Church, which was founded in 1871. The town also has a few parks and recreational areas, including a public swimming pool and a golf course.
Demographics
As of the 2010 census, the population of Montour was 1,039 people. The racial makeup of the town was 97.3% White, 0.4% African American, 0.2% Native American, 0.2% Asian, 0.1% Pacific Islander, 0.7% from other races, and 1.1% from two or more races. Hispanic or Latino of any race were 1.7% of the population.
The median household income in Montour was $45,833, and the median family income was $50,000. The per capita income in Montour was $20,845. About 8.3% of families and 10.2% of the population were below the poverty line, including 14.3% of those under age 18 and 6.3% of those age 65 or over.
Common Questions
What is Per Capita Income in Montour?
Per Capita income in Montour is $45,888.
What is the Median Family Income in Montour?
Median Family Income in Montour is $112,500.
What is the Median Household income in Montour?
Median Household Income in Montour is $73,750.
What is Income or Wage Gap in Montour?
Income or Wage Gap in Montour is 38.2%.
Women in Montour earn 61.8 cents for every dollar earned by a man.
What is Inequality or Gini Index in Montour?
Inequality or Gini Index in Montour is 0.38.
What is the Total Population of Montour?
Total Population of Montour is 193.
What is the Total Male Population of Montour?
Total Male Population of Montour is 108.
What is the Total Female Population of Montour?
Total Female Population of Montour is 85.
What is the Ratio of Males per 100 Females in Montour?
There are 127.06 Males per 100 Females in Montour.
What is the Ratio of Females per 100 Males in Montour?
There are 78.70 Females per 100 Males in Montour.
What is the Median Population Age in Montour?
Median Population Age in Montour is 49.8 Years.
What is the Average Family Size in Montour
Average Family Size in Montour is 2.4 People.
What is the Average Household Size in Montour
Average Household Size in Montour is 2.0 People.
How Large is the Labor Force in Montour?
There are 125 People in the Labor Forcein in Montour.
What is the Percentage of People in the Labor Force in Montour?
70.6% of People are in the Labor Force in Montour.
What is the Unemployment Rate in Montour?
Unemployment Rate in Montour is 2.4%.