Mitchellville, IA Map & Demographics
Mitchellville Map
Mitchellville Overview
$24,639
PER CAPITA INCOME
$92,228
AVG FAMILY INCOME
$75,278
AVG HOUSEHOLD INCOME
60.0%
WAGE / INCOME GAP [ % ]
40.0¢/ $1
WAGE / INCOME GAP [ $ ]
0.35
INEQUALITY / GINI INDEX
2,506
TOTAL POPULATION
867
MALE POPULATION
1,639
FEMALE POPULATION
52.90
MALES / 100 FEMALES
189.04
FEMALES / 100 MALES
36.8
MEDIAN AGE
3.1
AVG FAMILY SIZE
2.6
AVG HOUSEHOLD SIZE
1,018
LABOR FORCE [ PEOPLE ]
48.2%
PERCENT IN LABOR FORCE
1.0%
UNEMPLOYMENT RATE
Mitchellville Zip Codes
Income in Mitchellville
Income Overview in Mitchellville
Per Capita Income in Mitchellville is $24,639, while median incomes of families and households are $92,228 and $75,278 respectively.
| Characteristic | Number | Measure |
| Per Capita Income | 2,506 | $24,639 |
| Median Family Income | 459 | $92,228 |
| Mean Family Income | 459 | $96,935 |
| Median Household Income | 666 | $75,278 |
| Mean Household Income | 666 | $85,593 |
| Income Deficit | 459 | $0 |
| Wage / Income Gap (%) | 2,506 | 59.96% |
| Wage / Income Gap ($) | 2,506 | 40.04¢ per $1 |
| Gini / Inequality Index | 2,506 | 0.35 |
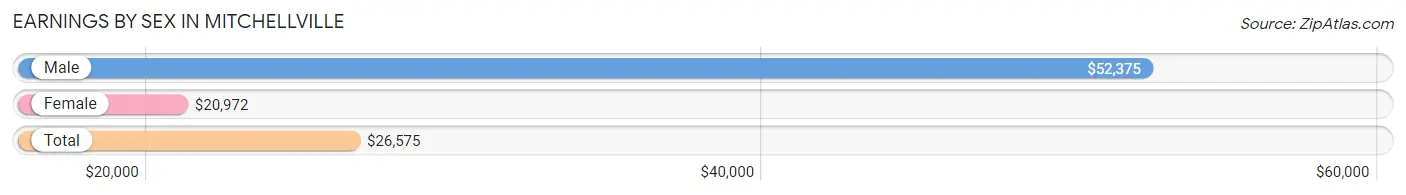
Earnings by Sex in Mitchellville
Average Earnings in Mitchellville are $26,575, $52,375 for men and $20,972 for women, a difference of 60.0%.
| Sex | Number | Average Earnings |
| Male | 567 (41.5%) | $52,375 |
| Female | 798 (58.5%) | $20,972 |
| Total | 1,365 (100.0%) | $26,575 |
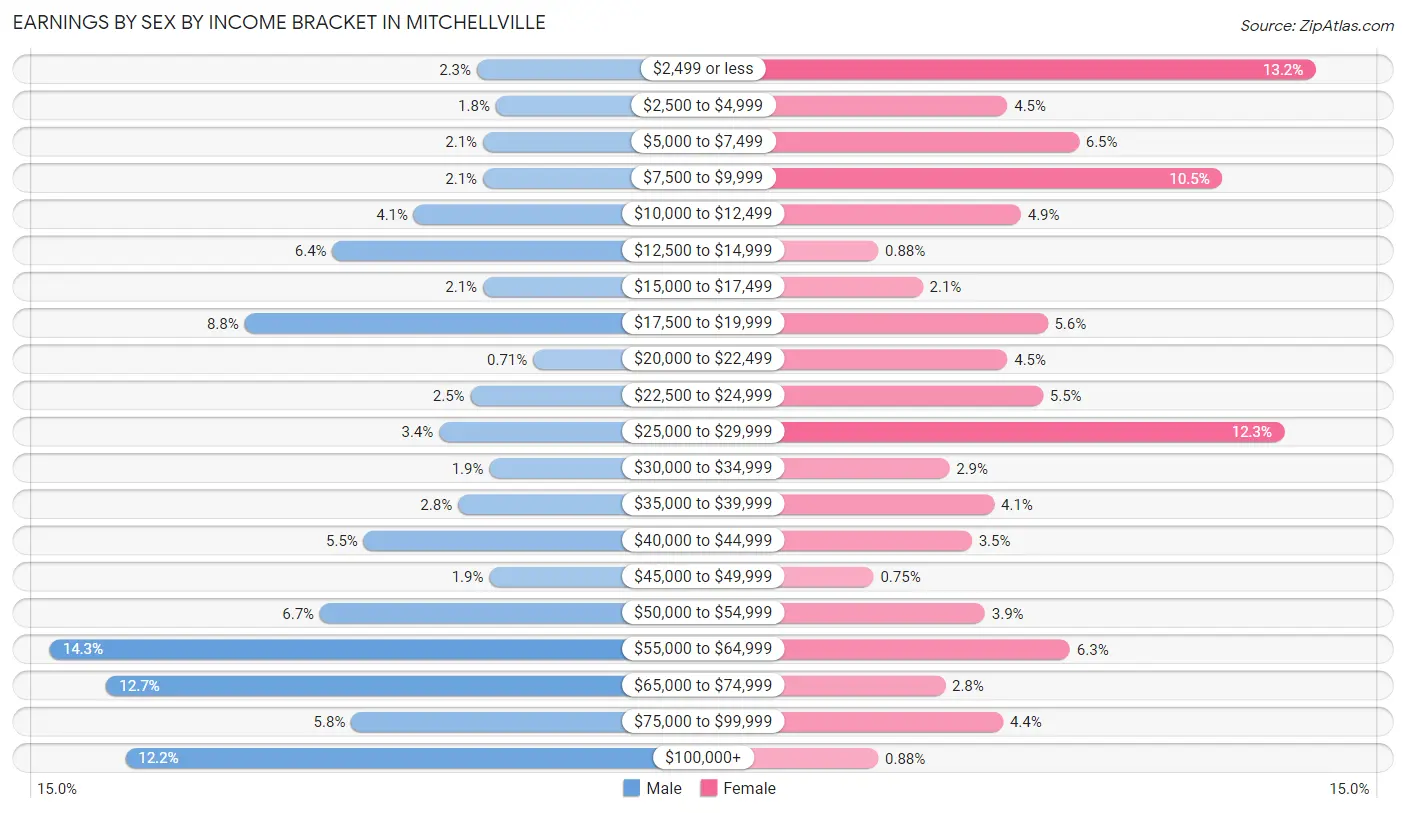
Earnings by Sex by Income Bracket in Mitchellville
The most common earnings brackets in Mitchellville are $55,000 to $64,999 for men (81 | 14.3%) and $2,499 or less for women (105 | 13.2%).
| Income | Male | Female |
| $2,499 or less | 13 (2.3%) | 105 (13.2%) |
| $2,500 to $4,999 | 10 (1.8%) | 36 (4.5%) |
| $5,000 to $7,499 | 12 (2.1%) | 52 (6.5%) |
| $7,500 to $9,999 | 12 (2.1%) | 84 (10.5%) |
| $10,000 to $12,499 | 23 (4.1%) | 39 (4.9%) |
| $12,500 to $14,999 | 36 (6.4%) | 7 (0.9%) |
| $15,000 to $17,499 | 12 (2.1%) | 17 (2.1%) |
| $17,500 to $19,999 | 50 (8.8%) | 45 (5.6%) |
| $20,000 to $22,499 | 4 (0.7%) | 36 (4.5%) |
| $22,500 to $24,999 | 14 (2.5%) | 44 (5.5%) |
| $25,000 to $29,999 | 19 (3.4%) | 98 (12.3%) |
| $30,000 to $34,999 | 11 (1.9%) | 23 (2.9%) |
| $35,000 to $39,999 | 16 (2.8%) | 33 (4.1%) |
| $40,000 to $44,999 | 31 (5.5%) | 28 (3.5%) |
| $45,000 to $49,999 | 11 (1.9%) | 6 (0.7%) |
| $50,000 to $54,999 | 38 (6.7%) | 31 (3.9%) |
| $55,000 to $64,999 | 81 (14.3%) | 50 (6.3%) |
| $65,000 to $74,999 | 72 (12.7%) | 22 (2.8%) |
| $75,000 to $99,999 | 33 (5.8%) | 35 (4.4%) |
| $100,000+ | 69 (12.2%) | 7 (0.9%) |
| Total | 567 (100.0%) | 798 (100.0%) |
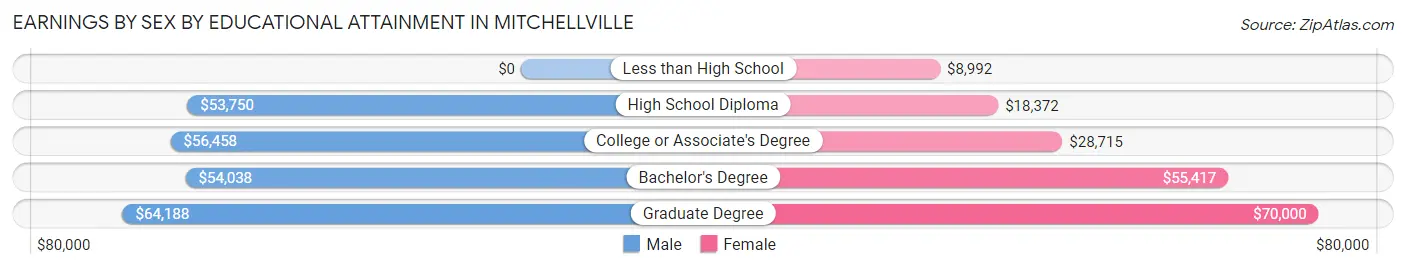
Earnings by Sex by Educational Attainment in Mitchellville
Average earnings in Mitchellville are $55,333 for men and $21,007 for women, a difference of 62.0%. Men with an educational attainment of graduate degree enjoy the highest average annual earnings of $64,188, while those with high school diploma education earn the least with $53,750. Women with an educational attainment of graduate degree earn the most with the average annual earnings of $70,000, while those with less than high school education have the smallest earnings of $8,992.
| Educational Attainment | Male Income | Female Income |
| Less than High School | - | - |
| High School Diploma | $53,750 | $18,372 |
| College or Associate's Degree | $56,458 | $28,715 |
| Bachelor's Degree | $54,038 | $55,417 |
| Graduate Degree | $64,188 | $70,000 |
| Total | $55,333 | $21,007 |
Family Income in Mitchellville
Family Income Brackets in Mitchellville
According to the Mitchellville family income data, there are 160 families falling into the $100,000 to $149,999 income range, which is the most common income bracket and makes up 34.9% of all families. Conversely, the less than $10,000 income bracket is the least frequent group with only 2 families (0.4%) belonging to this category.
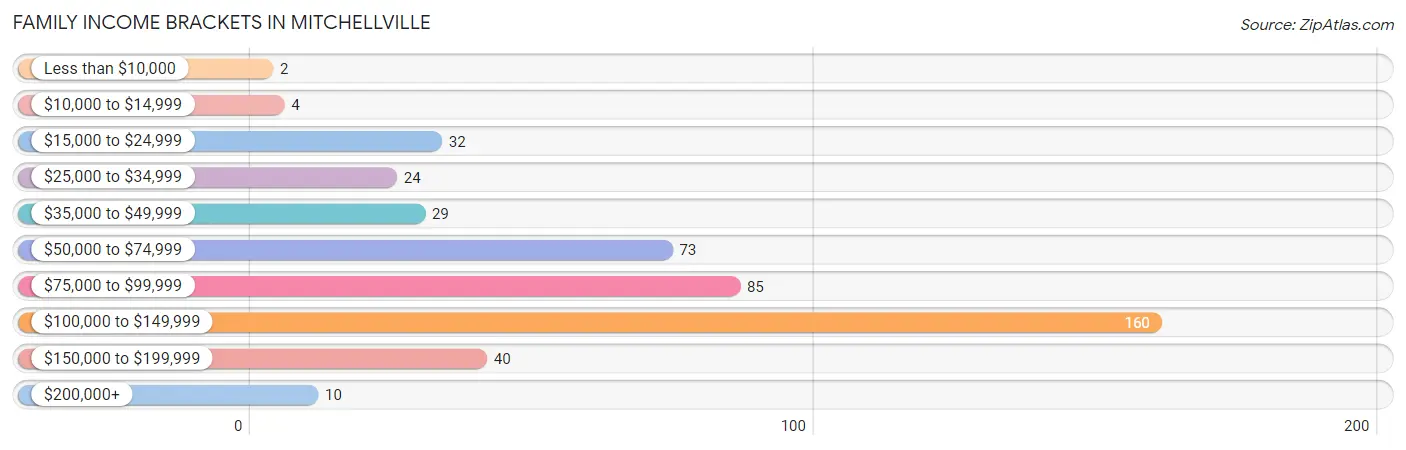
| Income Bracket | # Families | % Families |
| Less than $10,000 | 2 | 0.4% |
| $10,000 to $14,999 | 4 | 0.9% |
| $15,000 to $24,999 | 32 | 7.0% |
| $25,000 to $34,999 | 24 | 5.2% |
| $35,000 to $49,999 | 29 | 6.3% |
| $50,000 to $74,999 | 73 | 15.9% |
| $75,000 to $99,999 | 85 | 18.5% |
| $100,000 to $149,999 | 160 | 34.9% |
| $150,000 to $199,999 | 40 | 8.7% |
| $200,000+ | 10 | 2.2% |
Family Income by Famaliy Size in Mitchellville
3-person families (67 | 14.6%) account for the highest median family income in Mitchellville with $125,563 per family, while 3-person families (67 | 14.6%) have the highest median income of $41,854 per family member.
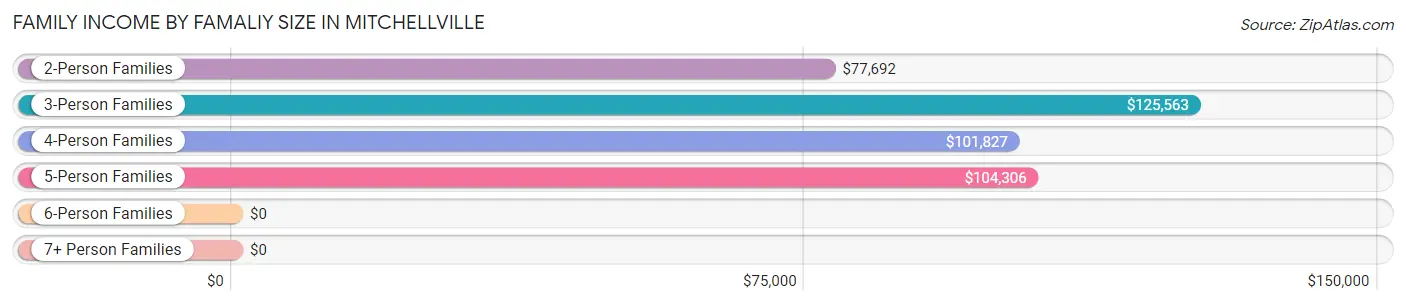
| Income Bracket | # Families | Median Income |
| 2-Person Families | 208 (45.3%) | $77,692 |
| 3-Person Families | 67 (14.6%) | $125,563 |
| 4-Person Families | 111 (24.2%) | $101,827 |
| 5-Person Families | 65 (14.2%) | $104,306 |
| 6-Person Families | 0 (0.0%) | $0 |
| 7+ Person Families | 8 (1.7%) | $0 |
| Total | 459 (100.0%) | $92,228 |
Family Income by Number of Earners in Mitchellville
The median family income in Mitchellville is $92,228, with families comprising 3+ earners (93) having the highest median family income of $121,250, while families with 1 earner (139) have the lowest median family income of $53,092, accounting for 20.3% and 30.3% of families, respectively.
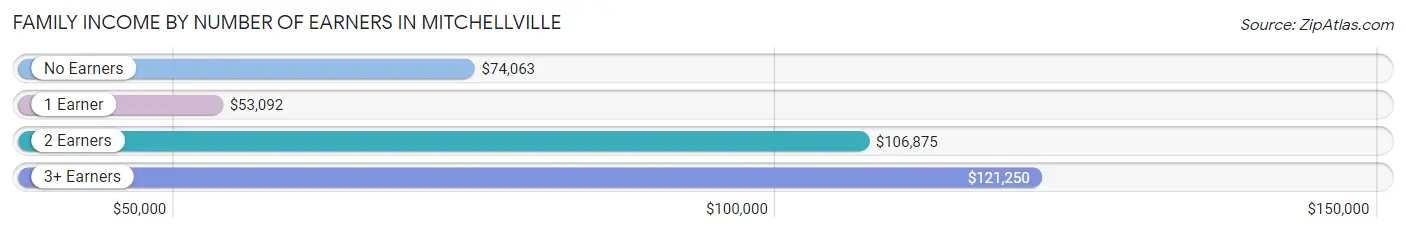
| Number of Earners | # Families | Median Income |
| No Earners | 31 (6.8%) | $74,063 |
| 1 Earner | 139 (30.3%) | $53,092 |
| 2 Earners | 196 (42.7%) | $106,875 |
| 3+ Earners | 93 (20.3%) | $121,250 |
| Total | 459 (100.0%) | $92,228 |
Household Income in Mitchellville
Household Income Brackets in Mitchellville
With 167 households falling in the category, the $100,000 to $149,999 income range is the most frequent in Mitchellville, accounting for 25.1% of all households. In contrast, only 5 households (0.7%) fall into the less than $10,000 income bracket, making it the least populous group.
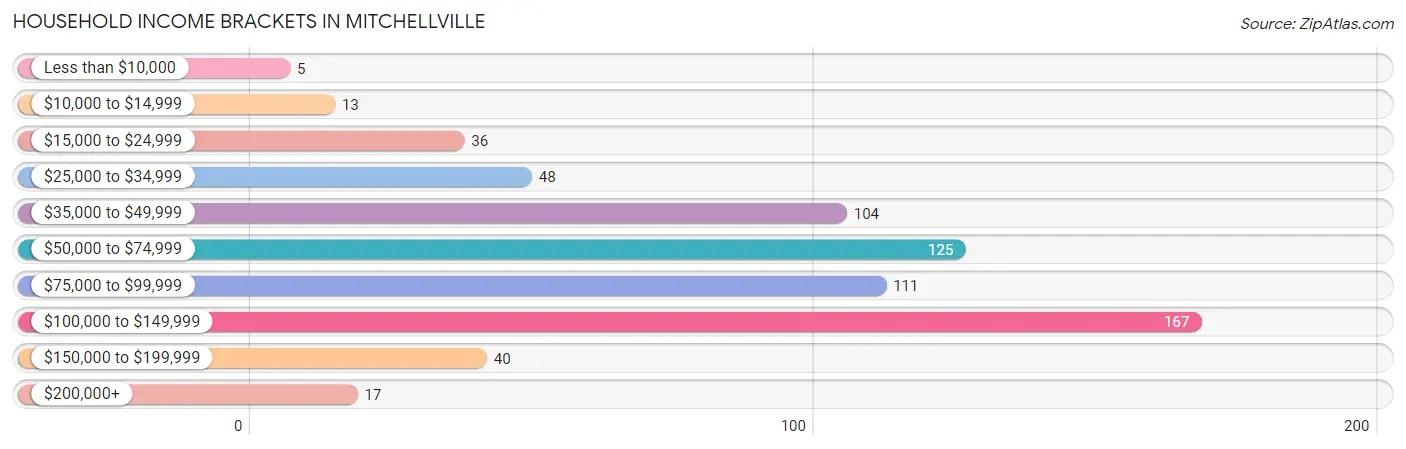
| Income Bracket | # Households | % Households |
| Less than $10,000 | 5 | 0.8% |
| $10,000 to $14,999 | 13 | 2.0% |
| $15,000 to $24,999 | 36 | 5.4% |
| $25,000 to $34,999 | 48 | 7.2% |
| $35,000 to $49,999 | 104 | 15.6% |
| $50,000 to $74,999 | 125 | 18.8% |
| $75,000 to $99,999 | 111 | 16.7% |
| $100,000 to $149,999 | 167 | 25.1% |
| $150,000 to $199,999 | 40 | 6.0% |
| $200,000+ | 17 | 2.6% |
Household Income by Householder Age in Mitchellville
The median household income in Mitchellville is $75,278, with the highest median household income of $103,529 found in the 25 to 44 years age bracket for the primary householder. A total of 238 households (35.7%) fall into this category. Meanwhile, the 15 to 24 years age bracket for the primary householder has the lowest median household income of $0, with 7 households (1.1%) in this group.
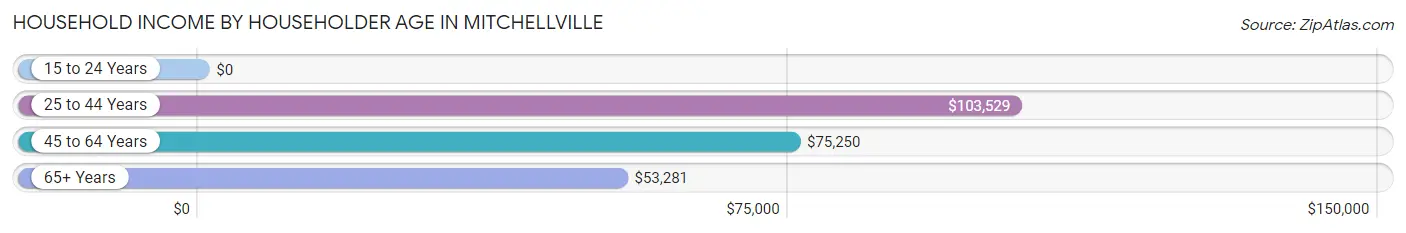
| Income Bracket | # Households | Median Income |
| 15 to 24 Years | 7 (1.1%) | $0 |
| 25 to 44 Years | 238 (35.7%) | $103,529 |
| 45 to 64 Years | 250 (37.5%) | $75,250 |
| 65+ Years | 171 (25.7%) | $53,281 |
| Total | 666 (100.0%) | $75,278 |
Poverty in Mitchellville
Income Below Poverty by Sex and Age in Mitchellville
With 6.2% poverty level for males and 6.7% for females among the residents of Mitchellville, 16 and 17 year old males and 18 to 24 year old females are the most vulnerable to poverty, with 10 males (34.5%) and 15 females (19.0%) in their respective age groups living below the poverty level.

| Age Bracket | Male | Female |
| Under 5 Years | 12 (19.7%) | 9 (18.0%) |
| 5 Years | 0 (0.0%) | 0 (0.0%) |
| 6 to 11 Years | 14 (17.5%) | 0 (0.0%) |
| 12 to 14 Years | 0 (0.0%) | 0 (0.0%) |
| 15 Years | 0 (0.0%) | 2 (8.7%) |
| 16 and 17 Years | 10 (34.5%) | 0 (0.0%) |
| 18 to 24 Years | 0 (0.0%) | 15 (19.0%) |
| 25 to 34 Years | 5 (3.3%) | 8 (6.8%) |
| 35 to 44 Years | 0 (0.0%) | 15 (13.9%) |
| 45 to 54 Years | 0 (0.0%) | 0 (0.0%) |
| 55 to 64 Years | 9 (9.3%) | 5 (5.8%) |
| 65 to 74 Years | 0 (0.0%) | 3 (2.9%) |
| 75 Years and over | 2 (5.4%) | 2 (3.7%) |
| Total | 52 (6.2%) | 59 (6.7%) |
Income Above Poverty by Sex and Age in Mitchellville
According to the poverty statistics in Mitchellville, males aged 12 to 14 years and females aged 5 years are the age groups that are most secure financially, with 100.0% of males and 100.0% of females in these age groups living above the poverty line.
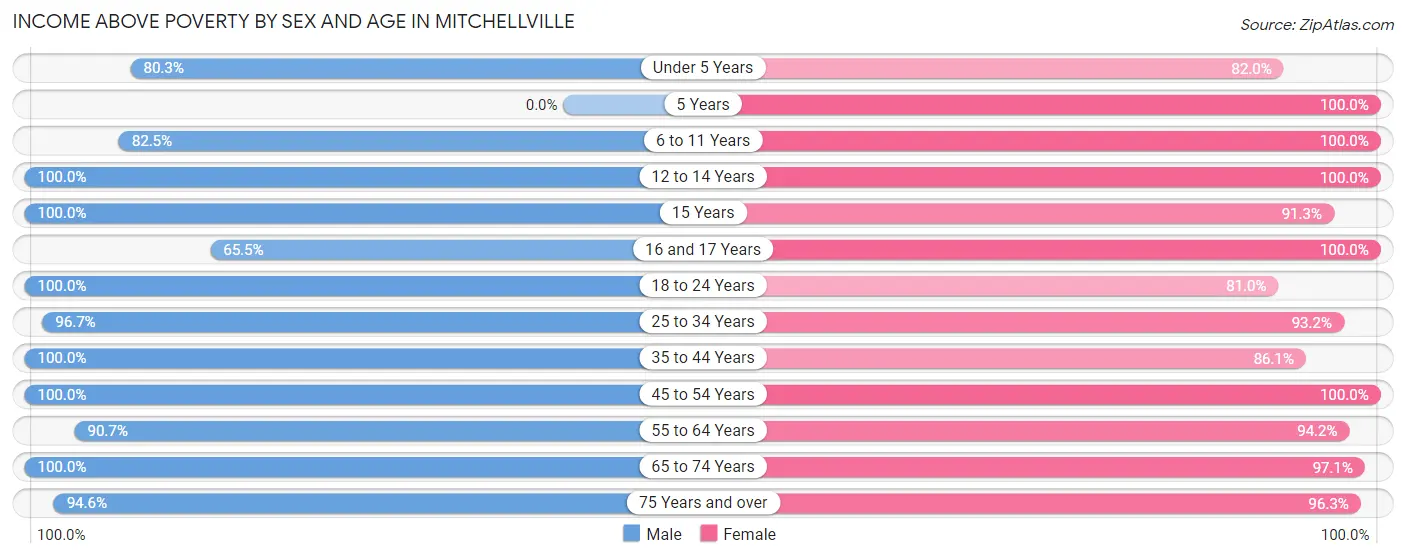
| Age Bracket | Male | Female |
| Under 5 Years | 49 (80.3%) | 41 (82.0%) |
| 5 Years | 0 (0.0%) | 4 (100.0%) |
| 6 to 11 Years | 66 (82.5%) | 97 (100.0%) |
| 12 to 14 Years | 23 (100.0%) | 36 (100.0%) |
| 15 Years | 12 (100.0%) | 21 (91.3%) |
| 16 and 17 Years | 19 (65.5%) | 22 (100.0%) |
| 18 to 24 Years | 49 (100.0%) | 64 (81.0%) |
| 25 to 34 Years | 146 (96.7%) | 109 (93.2%) |
| 35 to 44 Years | 107 (100.0%) | 93 (86.1%) |
| 45 to 54 Years | 134 (100.0%) | 102 (100.0%) |
| 55 to 64 Years | 88 (90.7%) | 81 (94.2%) |
| 65 to 74 Years | 62 (100.0%) | 99 (97.1%) |
| 75 Years and over | 35 (94.6%) | 52 (96.3%) |
| Total | 790 (93.8%) | 821 (93.3%) |
Income Below Poverty Among Married-Couple Families in Mitchellville
The poverty statistics for married-couple families in Mitchellville show that 2.3% or 8 of the total 348 families live below the poverty line. Families with 1 or 2 children have the highest poverty rate of 4.5%, comprising of 6 families. On the other hand, families with 3 or 4 children have the lowest poverty rate of 0.0%, which includes 0 families.
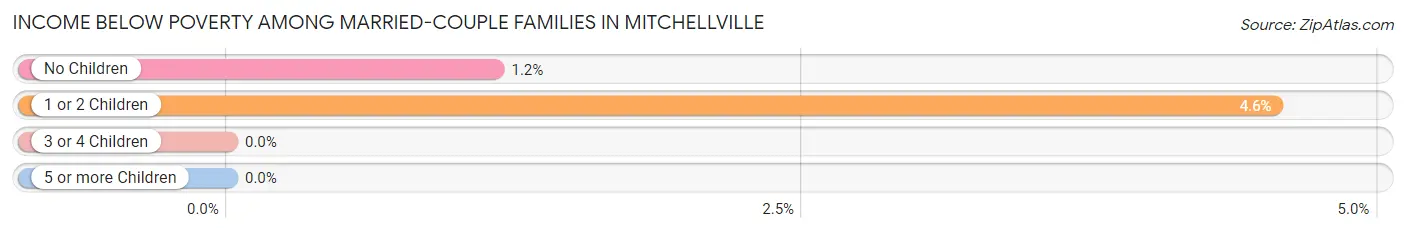
| Children | Above Poverty | Below Poverty |
| No Children | 170 (98.8%) | 2 (1.2%) |
| 1 or 2 Children | 126 (95.5%) | 6 (4.5%) |
| 3 or 4 Children | 39 (100.0%) | 0 (0.0%) |
| 5 or more Children | 5 (100.0%) | 0 (0.0%) |
| Total | 340 (97.7%) | 8 (2.3%) |
Income Below Poverty Among Single-Parent Households in Mitchellville
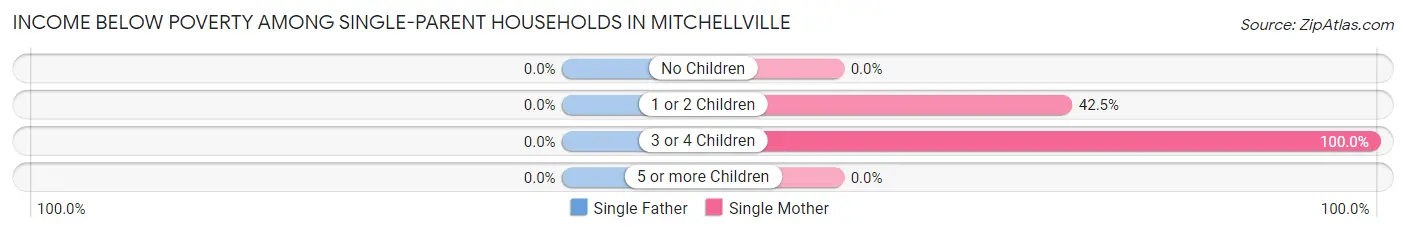
| Children | Single Father | Single Mother |
| No Children | 0 (0.0%) | 0 (0.0%) |
| 1 or 2 Children | 0 (0.0%) | 17 (42.5%) |
| 3 or 4 Children | 0 (0.0%) | 2 (100.0%) |
| 5 or more Children | 0 (0.0%) | 0 (0.0%) |
| Total | 0 (0.0%) | 19 (30.6%) |
Income Below Poverty Among Married-Couple vs Single-Parent Households in Mitchellville
The poverty data for Mitchellville shows that 8 of the married-couple family households (2.3%) and 19 of the single-parent households (17.1%) are living below the poverty level. Within the married-couple family households, those with 1 or 2 children have the highest poverty rate, with 6 households (4.5%) falling below the poverty line. Among the single-parent households, those with 3 or 4 children have the highest poverty rate, with 2 household (100.0%) living below poverty.
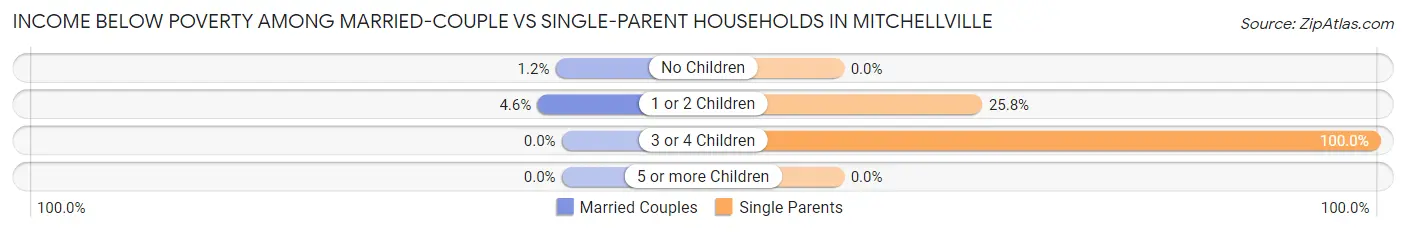
| Children | Married-Couple Families | Single-Parent Households |
| No Children | 2 (1.2%) | 0 (0.0%) |
| 1 or 2 Children | 6 (4.5%) | 17 (25.8%) |
| 3 or 4 Children | 0 (0.0%) | 2 (100.0%) |
| 5 or more Children | 0 (0.0%) | 0 (0.0%) |
| Total | 8 (2.3%) | 19 (17.1%) |
Race in Mitchellville
The most populous races in Mitchellville are White / Caucasian (2,264 | 90.3%), Two or more Races (144 | 5.8%), and Hispanic or Latino (88 | 3.5%).
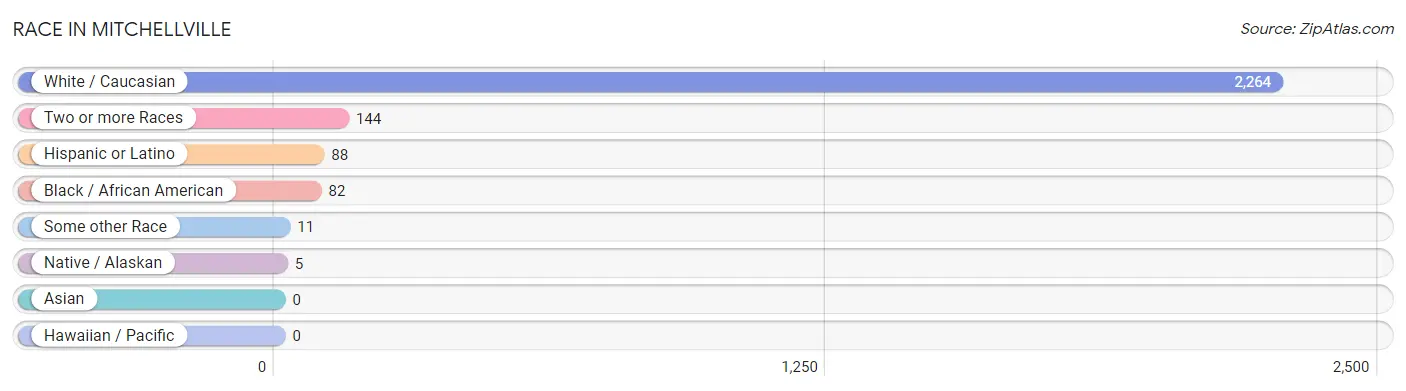
| Race | # Population | % Population |
| Asian | 0 | 0.0% |
| Black / African American | 82 | 3.3% |
| Hawaiian / Pacific | 0 | 0.0% |
| Hispanic or Latino | 88 | 3.5% |
| Native / Alaskan | 5 | 0.2% |
| White / Caucasian | 2,264 | 90.3% |
| Two or more Races | 144 | 5.8% |
| Some other Race | 11 | 0.4% |
| Total | 2,506 | 100.0% |
Ancestry in Mitchellville
The most populous ancestries reported in Mitchellville are German (519 | 20.7%), Irish (285 | 11.4%), English (185 | 7.4%), American (142 | 5.7%), and European (115 | 4.6%), together accounting for 49.7% of all Mitchellville residents.
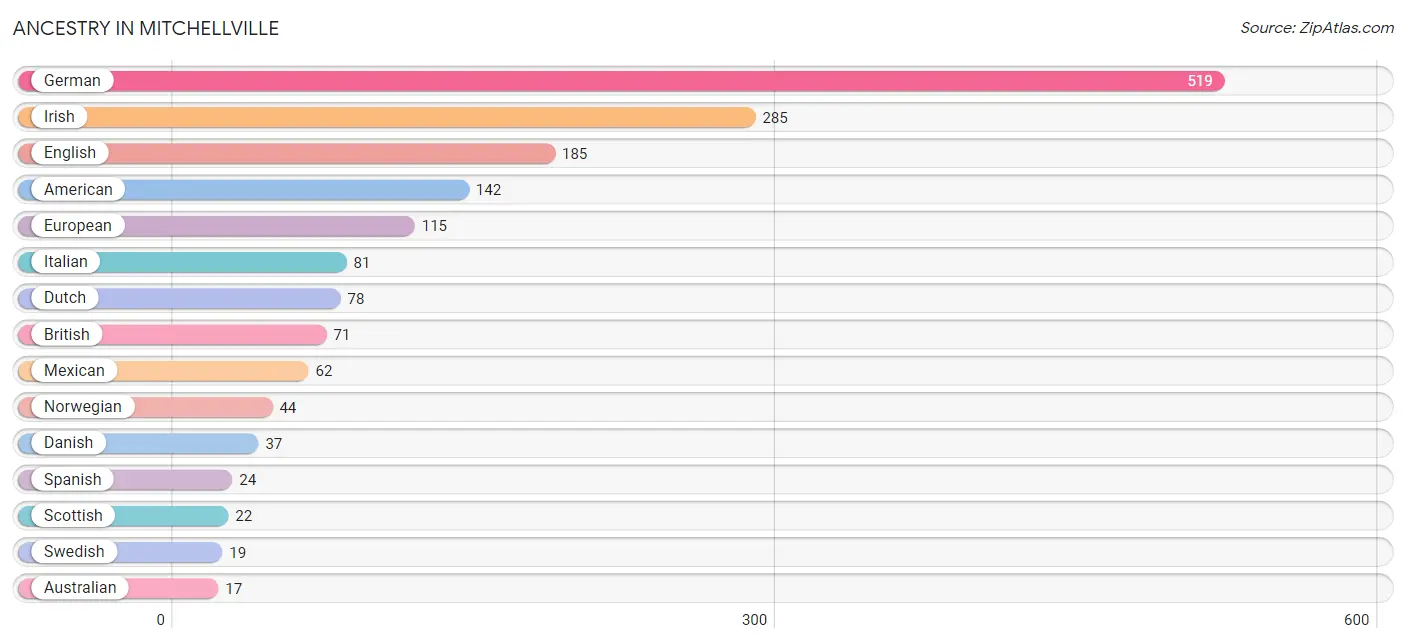
| Ancestry | # Population | % Population |
| American | 142 | 5.7% |
| Apache | 3 | 0.1% |
| Australian | 17 | 0.7% |
| Belgian | 5 | 0.2% |
| Bhutanese | 2 | 0.1% |
| British | 71 | 2.8% |
| Czech | 3 | 0.1% |
| Czechoslovakian | 14 | 0.6% |
| Danish | 37 | 1.5% |
| Dutch | 78 | 3.1% |
| Eastern European | 6 | 0.2% |
| English | 185 | 7.4% |
| European | 115 | 4.6% |
| French | 17 | 0.7% |
| German | 519 | 20.7% |
| Icelander | 9 | 0.4% |
| Irish | 285 | 11.4% |
| Italian | 81 | 3.2% |
| Mexican | 62 | 2.5% |
| Norwegian | 44 | 1.8% |
| Polish | 3 | 0.1% |
| Russian | 6 | 0.2% |
| Scandinavian | 16 | 0.6% |
| Scotch-Irish | 10 | 0.4% |
| Scottish | 22 | 0.9% |
| Sioux | 10 | 0.4% |
| Slovak | 3 | 0.1% |
| Spaniard | 2 | 0.1% |
| Spanish | 24 | 1.0% |
| Swedish | 19 | 0.8% |
| Ukrainian | 13 | 0.5% |
| Welsh | 15 | 0.6% | View All 32 Rows |
Immigrants in Mitchellville
The most numerous immigrant groups reported in Mitchellville came from Europe (7 | 0.3%), England (3 | 0.1%), Germany (3 | 0.1%), Northern Europe (3 | 0.1%), and Western Europe (3 | 0.1%), together accounting for 0.8% of all Mitchellville residents.
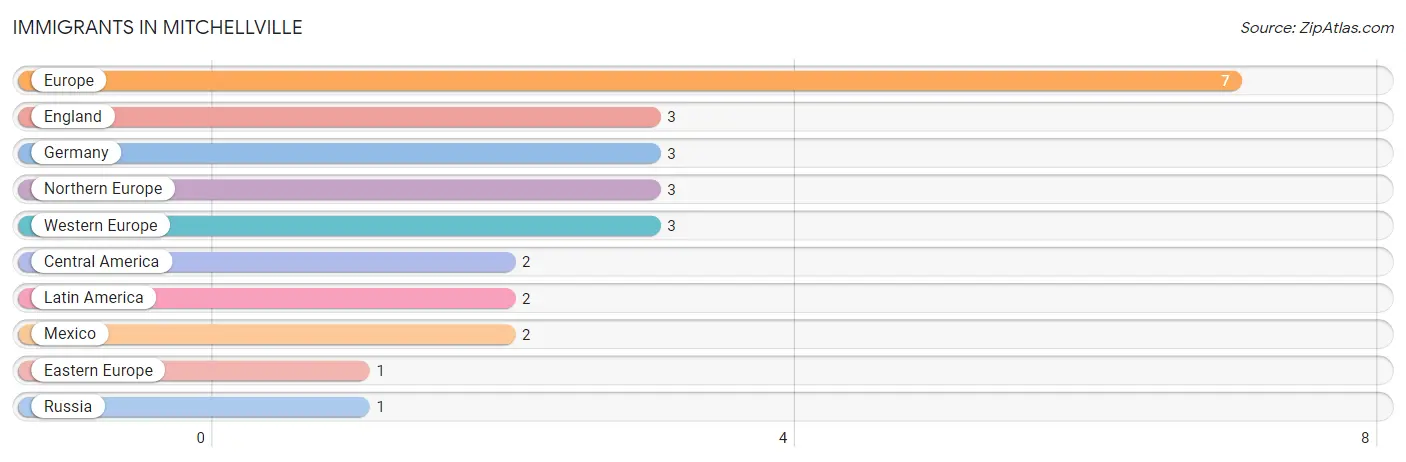
| Immigration Origin | # Population | % Population |
| Central America | 2 | 0.1% |
| Eastern Europe | 1 | 0.0% |
| England | 3 | 0.1% |
| Europe | 7 | 0.3% |
| Germany | 3 | 0.1% |
| Latin America | 2 | 0.1% |
| Mexico | 2 | 0.1% |
| Northern Europe | 3 | 0.1% |
| Russia | 1 | 0.0% |
| Western Europe | 3 | 0.1% | View All 10 Rows |
Sex and Age in Mitchellville
Sex and Age in Mitchellville
The most populous age groups in Mitchellville are 30 to 34 Years (84 | 9.7%) for men and 35 to 39 Years (323 | 19.7%) for women.
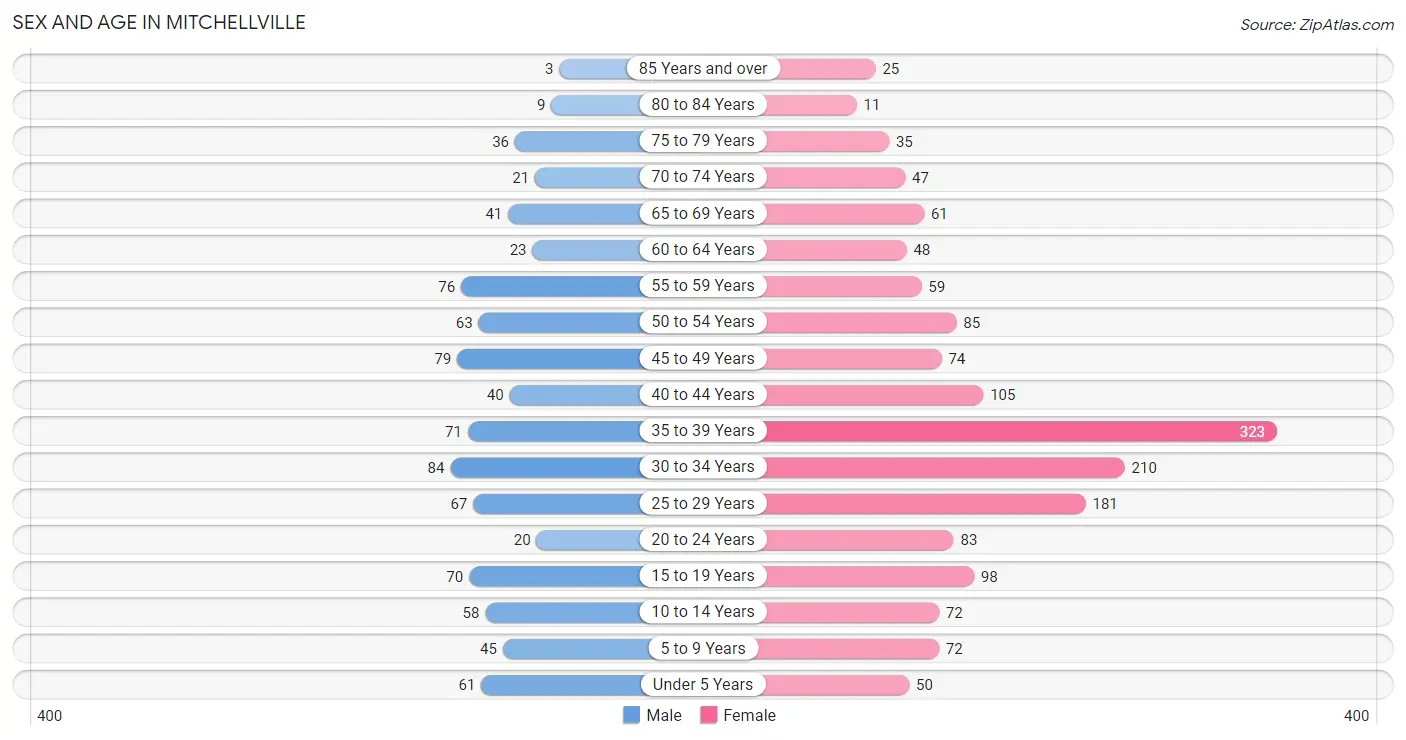
| Age Bracket | Male | Female |
| Under 5 Years | 61 (7.0%) | 50 (3.0%) |
| 5 to 9 Years | 45 (5.2%) | 72 (4.4%) |
| 10 to 14 Years | 58 (6.7%) | 72 (4.4%) |
| 15 to 19 Years | 70 (8.1%) | 98 (6.0%) |
| 20 to 24 Years | 20 (2.3%) | 83 (5.1%) |
| 25 to 29 Years | 67 (7.7%) | 181 (11.0%) |
| 30 to 34 Years | 84 (9.7%) | 210 (12.8%) |
| 35 to 39 Years | 71 (8.2%) | 323 (19.7%) |
| 40 to 44 Years | 40 (4.6%) | 105 (6.4%) |
| 45 to 49 Years | 79 (9.1%) | 74 (4.5%) |
| 50 to 54 Years | 63 (7.3%) | 85 (5.2%) |
| 55 to 59 Years | 76 (8.8%) | 59 (3.6%) |
| 60 to 64 Years | 23 (2.6%) | 48 (2.9%) |
| 65 to 69 Years | 41 (4.7%) | 61 (3.7%) |
| 70 to 74 Years | 21 (2.4%) | 47 (2.9%) |
| 75 to 79 Years | 36 (4.2%) | 35 (2.1%) |
| 80 to 84 Years | 9 (1.0%) | 11 (0.7%) |
| 85 Years and over | 3 (0.4%) | 25 (1.5%) |
| Total | 867 (100.0%) | 1,639 (100.0%) |
Families and Households in Mitchellville
Median Family Size in Mitchellville
The median family size in Mitchellville is 3.12 persons per family, with married-couple families (348 | 75.8%) accounting for the largest median family size of 3.26 persons per family. On the other hand, single female/mother families (62 | 13.5%) represent the smallest median family size with 2.56 persons per family.
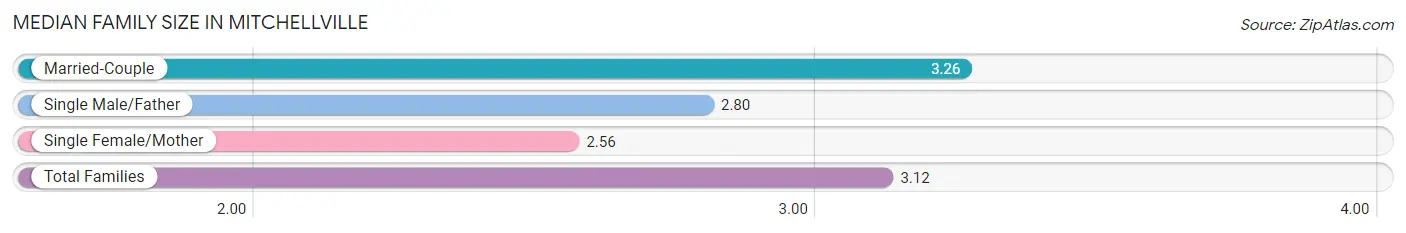
| Family Type | # Families | Family Size |
| Married-Couple | 348 (75.8%) | 3.26 |
| Single Male/Father | 49 (10.7%) | 2.80 |
| Single Female/Mother | 62 (13.5%) | 2.56 |
| Total Families | 459 (100.0%) | 3.12 |
Median Household Size in Mitchellville
The median household size in Mitchellville is 2.60 persons per household, with single male/father households (49 | 7.4%) accounting for the largest median household size of 3.27 persons per household. non-family households (207 | 31.1%) represent the smallest median household size with 1.15 persons per household.
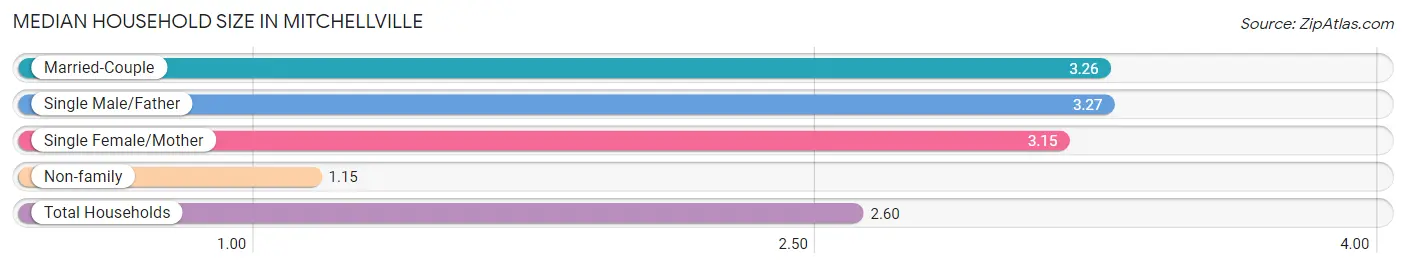
| Household Type | # Households | Household Size |
| Married-Couple | 348 (52.2%) | 3.26 |
| Single Male/Father | 49 (7.4%) | 3.27 |
| Single Female/Mother | 62 (9.3%) | 3.15 |
| Non-family | 207 (31.1%) | 1.15 |
| Total Households | 666 (100.0%) | 2.60 |
Household Size by Marriage Status in Mitchellville
Out of a total of 666 households in Mitchellville, 459 (68.9%) are family households, while 207 (31.1%) are nonfamily households. The most numerous type of family households are 2-person households, comprising 186, and the most common type of nonfamily households are 1-person households, comprising 178.
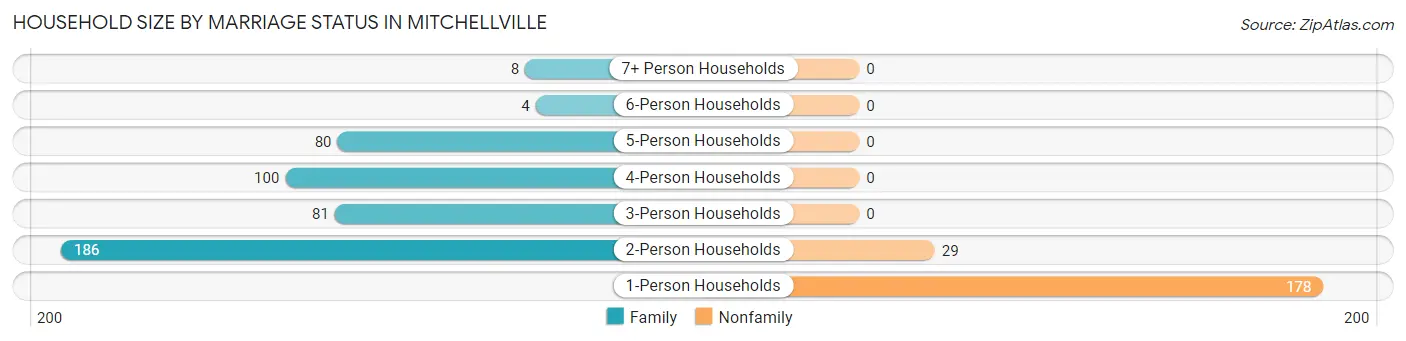
| Household Size | Family Households | Nonfamily Households |
| 1-Person Households | - | 178 (26.7%) |
| 2-Person Households | 186 (27.9%) | 29 (4.3%) |
| 3-Person Households | 81 (12.2%) | 0 (0.0%) |
| 4-Person Households | 100 (15.0%) | 0 (0.0%) |
| 5-Person Households | 80 (12.0%) | 0 (0.0%) |
| 6-Person Households | 4 (0.6%) | 0 (0.0%) |
| 7+ Person Households | 8 (1.2%) | 0 (0.0%) |
| Total | 459 (68.9%) | 207 (31.1%) |
Female Fertility in Mitchellville
Fertility by Age in Mitchellville
Average fertility rate in Mitchellville is 97.0 births per 1,000 women. Women in the age bracket of 20 to 34 years have the highest fertility rate with 122.0 births per 1,000 women. Women in the age bracket of 20 to 34 years acount for 54.2% of all women with births.
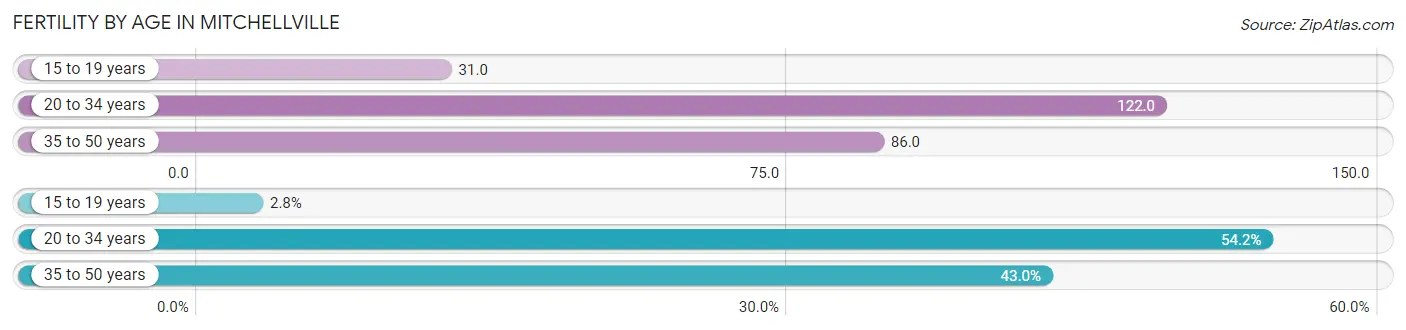
| Age Bracket | Women with Births | Births / 1,000 Women |
| 15 to 19 years | 3 (2.8%) | 31.0 |
| 20 to 34 years | 58 (54.2%) | 122.0 |
| 35 to 50 years | 46 (43.0%) | 86.0 |
| Total | 107 (100.0%) | 97.0 |
Fertility by Age by Marriage Status in Mitchellville
14.0% of women with births (107) in Mitchellville are married. The highest percentage of unmarried women with births falls into 15 to 19 years age bracket with 100.0% of them unmarried at the time of birth, while the lowest percentage of unmarried women with births belong to 20 to 34 years age bracket with 74.1% of them unmarried.
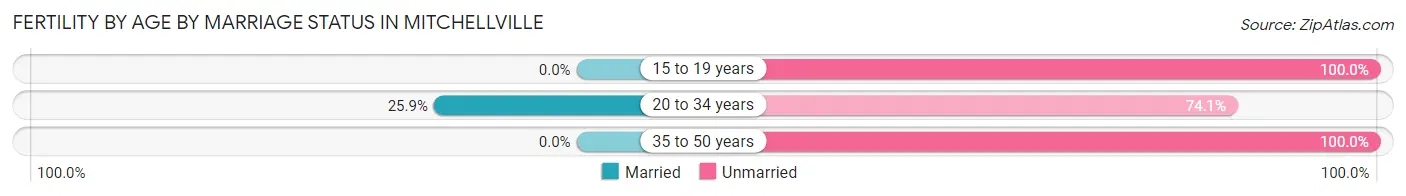
| Age Bracket | Married | Unmarried |
| 15 to 19 years | 0 (0.0%) | 3 (100.0%) |
| 20 to 34 years | 15 (25.9%) | 43 (74.1%) |
| 35 to 50 years | 0 (0.0%) | 46 (100.0%) |
| Total | 15 (14.0%) | 92 (86.0%) |
Fertility by Education in Mitchellville
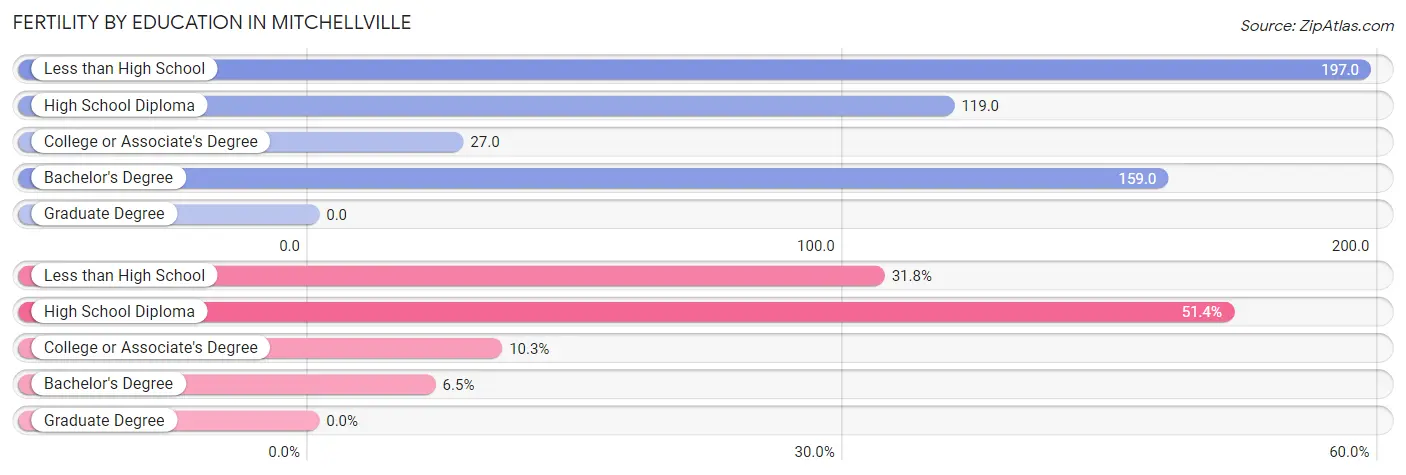
| Educational Attainment | Women with Births | Births / 1,000 Women |
| Less than High School | 34 (31.8%) | 197.0 |
| High School Diploma | 55 (51.4%) | 119.0 |
| College or Associate's Degree | 11 (10.3%) | 27.0 |
| Bachelor's Degree | 7 (6.5%) | 159.0 |
| Graduate Degree | 0 (0.0%) | 0.0 |
| Total | 107 (100.0%) | 97.0 |
Fertility by Education by Marriage Status in Mitchellville
86.0% of women with births in Mitchellville are unmarried. Women with the educational attainment of college or associate's degree are most likely to be married with 81.8% of them married at childbirth, while women with the educational attainment of less than high school are least likely to be married with 100.0% of them unmarried at childbirth.
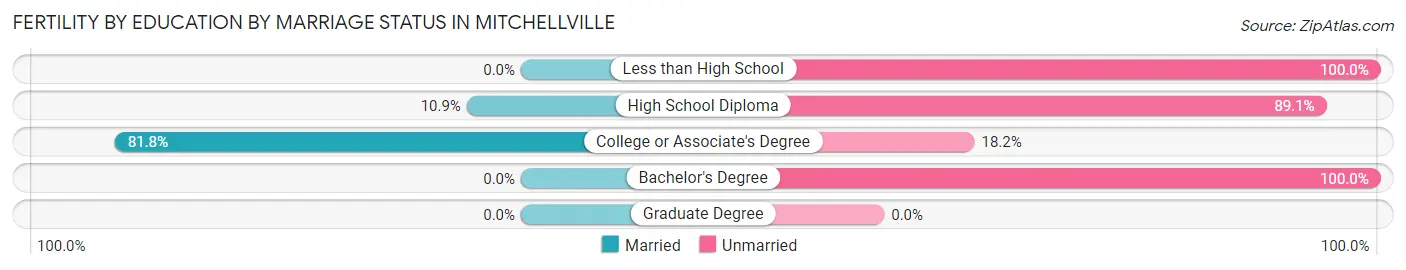
| Educational Attainment | Married | Unmarried |
| Less than High School | 0 (0.0%) | 34 (100.0%) |
| High School Diploma | 6 (10.9%) | 49 (89.1%) |
| College or Associate's Degree | 9 (81.8%) | 2 (18.2%) |
| Bachelor's Degree | 0 (0.0%) | 7 (100.0%) |
| Graduate Degree | 0 (0.0%) | 0 (0.0%) |
| Total | 15 (14.0%) | 92 (86.0%) |
Employment Characteristics in Mitchellville
Employment by Class of Employer in Mitchellville
Among the 975 employed individuals in Mitchellville, private company employees (678 | 69.5%), not-for-profit organizations (88 | 9.0%), and local government employees (84 | 8.6%) make up the most common classes of employment.
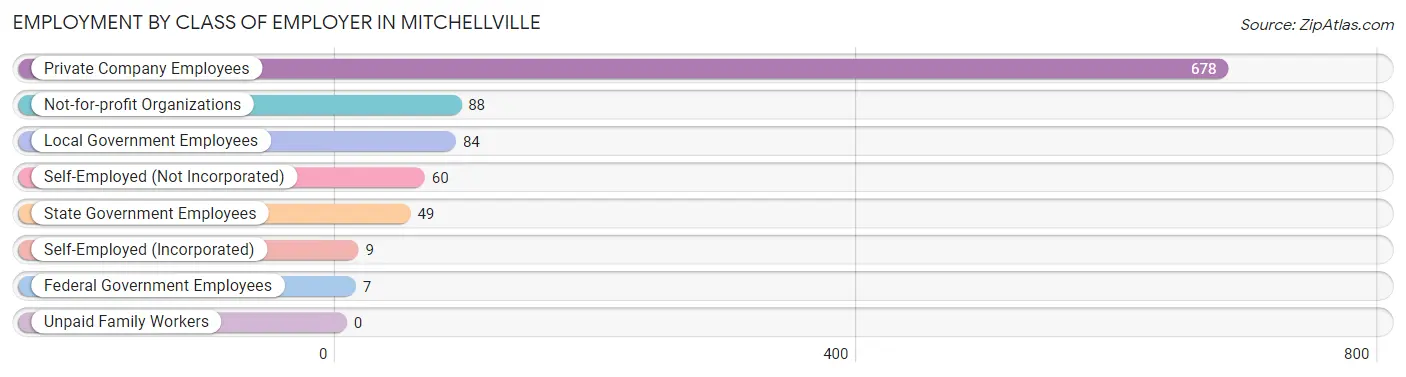
| Employer Class | # Employees | % Employees |
| Private Company Employees | 678 | 69.5% |
| Self-Employed (Incorporated) | 9 | 0.9% |
| Self-Employed (Not Incorporated) | 60 | 6.1% |
| Not-for-profit Organizations | 88 | 9.0% |
| Local Government Employees | 84 | 8.6% |
| State Government Employees | 49 | 5.0% |
| Federal Government Employees | 7 | 0.7% |
| Unpaid Family Workers | 0 | 0.0% |
| Total | 975 | 100.0% |
Employment Status by Age in Mitchellville
According to the labor force statistics for Mitchellville, out of the total population over 16 years of age (2,113), 48.2% or 1,018 individuals are in the labor force, with 1.0% or 10 of them unemployed. The age group with the highest labor force participation rate is 55 to 59 years, with 84.4% or 114 individuals in the labor force. Within the labor force, the 75 years and over age range has the highest percentage of unemployed individuals, with 11.5% or 3 of them being unemployed.
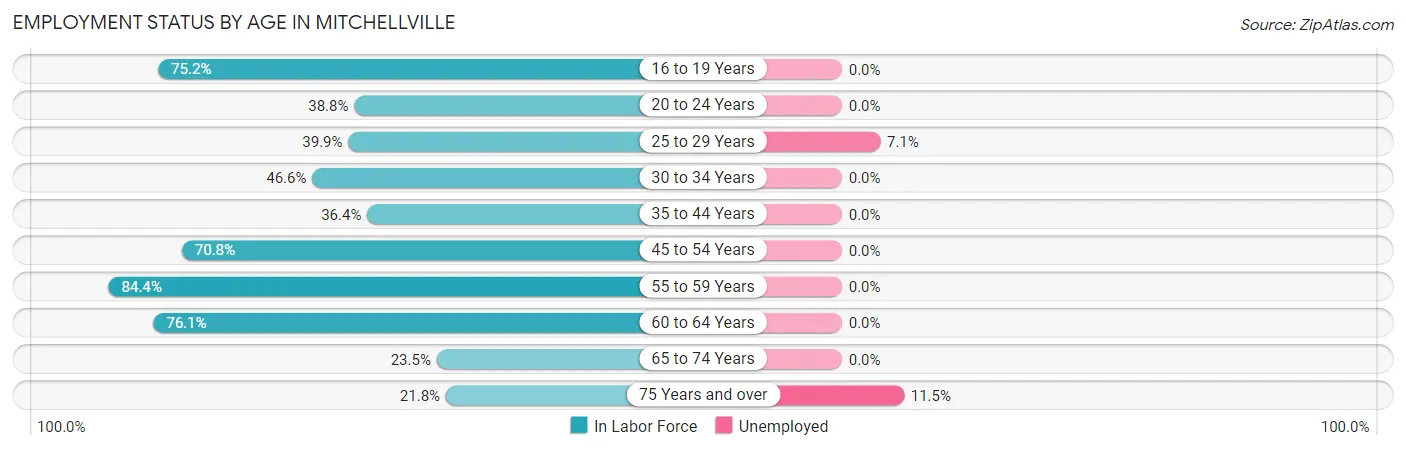
| Age Bracket | In Labor Force | Unemployed |
| 16 to 19 Years | 100 (75.2%) | 0 (0.0%) |
| 20 to 24 Years | 40 (38.8%) | 0 (0.0%) |
| 25 to 29 Years | 99 (39.9%) | 7 (7.1%) |
| 30 to 34 Years | 137 (46.6%) | 0 (0.0%) |
| 35 to 44 Years | 196 (36.4%) | 0 (0.0%) |
| 45 to 54 Years | 213 (70.8%) | 0 (0.0%) |
| 55 to 59 Years | 114 (84.4%) | 0 (0.0%) |
| 60 to 64 Years | 54 (76.1%) | 0 (0.0%) |
| 65 to 74 Years | 40 (23.5%) | 0 (0.0%) |
| 75 Years and over | 26 (21.8%) | 3 (11.5%) |
| Total | 1,018 (48.2%) | 10 (1.0%) |
Employment Status by Educational Attainment in Mitchellville
According to labor force statistics for Mitchellville, 51.2% of individuals (813) out of the total population between 25 and 64 years of age (1,588) are in the labor force, with 0.9% or 7 of them being unemployed. The group with the highest labor force participation rate are those with the educational attainment of bachelor's degree or higher, with 84.9% or 141 individuals in the labor force. Within the labor force, individuals with high school diploma education have the highest percentage of unemployment, with 2.5% or 7 of them being unemployed.
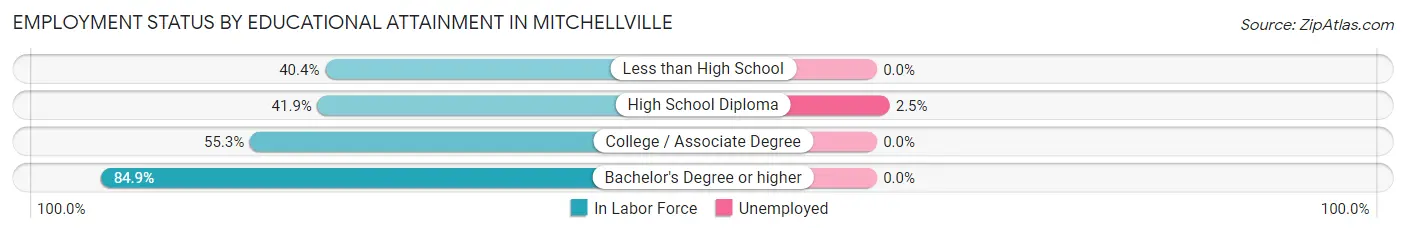
| Educational Attainment | In Labor Force | Unemployed |
| Less than High School | 67 (40.4%) | 0 (0.0%) |
| High School Diploma | 280 (41.9%) | 17 (2.5%) |
| College / Associate Degree | 325 (55.3%) | 0 (0.0%) |
| Bachelor's Degree or higher | 141 (84.9%) | 0 (0.0%) |
| Total | 813 (51.2%) | 14 (0.9%) |
Employment Occupations by Sex in Mitchellville
Management, Business, Science and Arts Occupations
The most common Management, Business, Science and Arts occupations in Mitchellville are Management (87 | 8.6%), Community & Social Service (86 | 8.5%), Business & Financial (79 | 7.8%), Education Instruction & Library (46 | 4.6%), and Computers, Engineering & Science (36 | 3.6%).
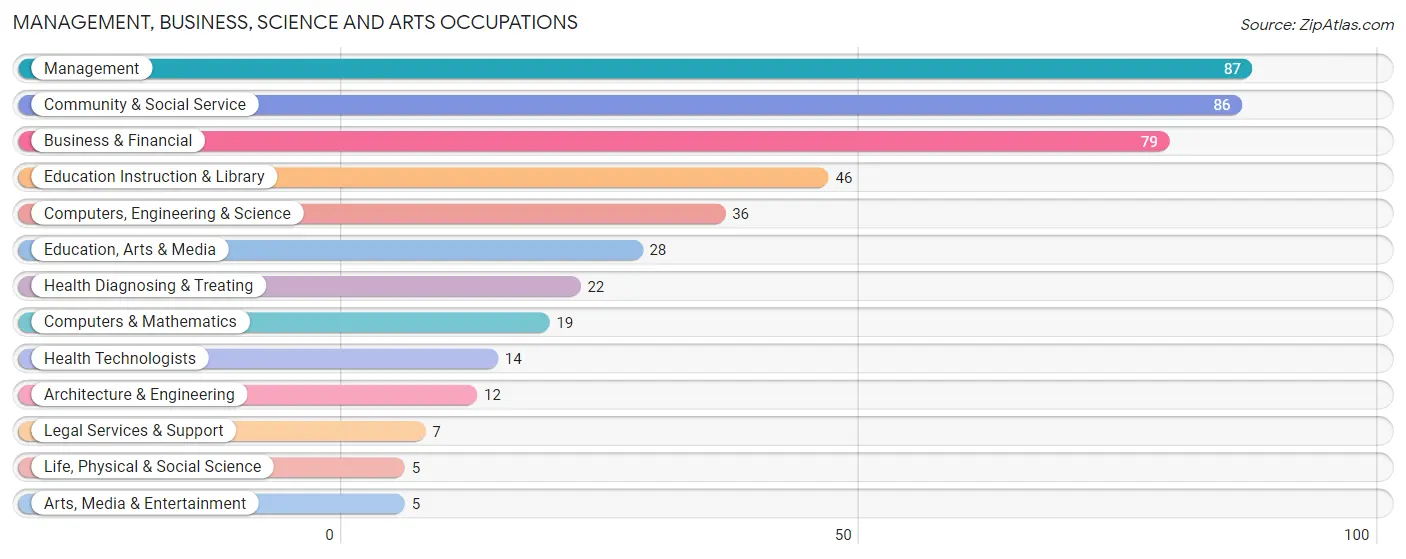
Management, Business, Science and Arts Occupations by Sex
Within the Management, Business, Science and Arts occupations in Mitchellville, the most male-oriented occupations are Life, Physical & Social Science (100.0%), Arts, Media & Entertainment (100.0%), and Computers, Engineering & Science (77.8%), while the most female-oriented occupations are Health Diagnosing & Treating (100.0%), Health Technologists (100.0%), and Education Instruction & Library (91.3%).
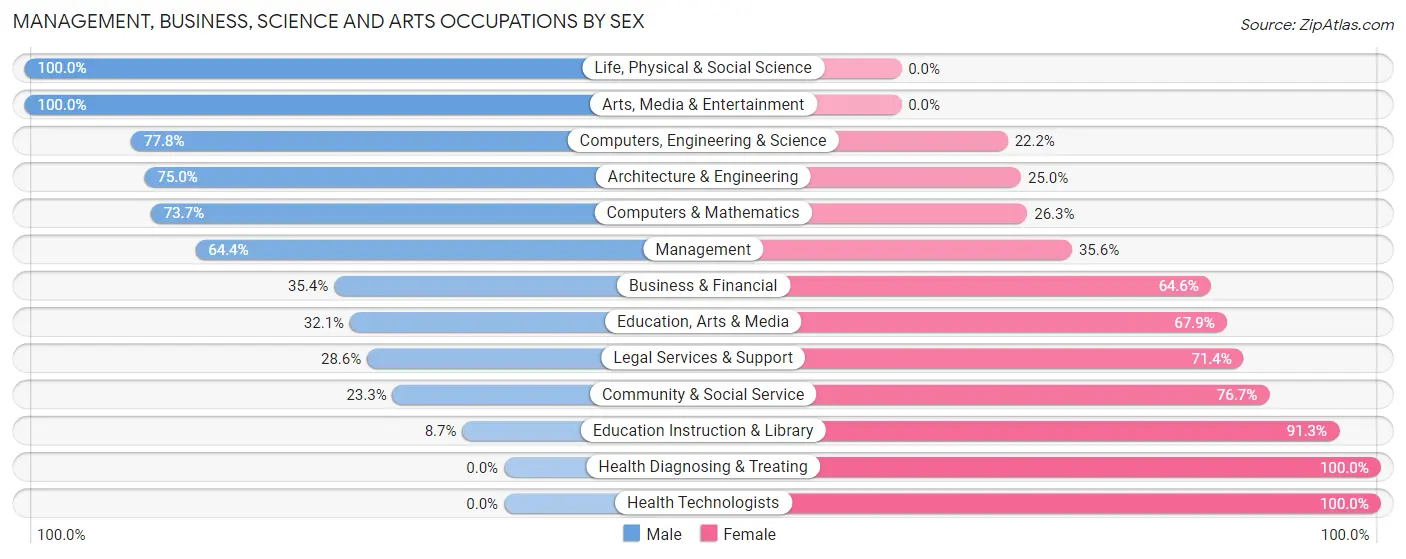
| Occupation | Male | Female |
| Management | 56 (64.4%) | 31 (35.6%) |
| Business & Financial | 28 (35.4%) | 51 (64.6%) |
| Computers, Engineering & Science | 28 (77.8%) | 8 (22.2%) |
| Computers & Mathematics | 14 (73.7%) | 5 (26.3%) |
| Architecture & Engineering | 9 (75.0%) | 3 (25.0%) |
| Life, Physical & Social Science | 5 (100.0%) | 0 (0.0%) |
| Community & Social Service | 20 (23.3%) | 66 (76.7%) |
| Education, Arts & Media | 9 (32.1%) | 19 (67.9%) |
| Legal Services & Support | 2 (28.6%) | 5 (71.4%) |
| Education Instruction & Library | 4 (8.7%) | 42 (91.3%) |
| Arts, Media & Entertainment | 5 (100.0%) | 0 (0.0%) |
| Health Diagnosing & Treating | 0 (0.0%) | 22 (100.0%) |
| Health Technologists | 0 (0.0%) | 14 (100.0%) |
| Total (Category) | 132 (42.6%) | 178 (57.4%) |
| Total (Overall) | 548 (54.3%) | 461 (45.7%) |
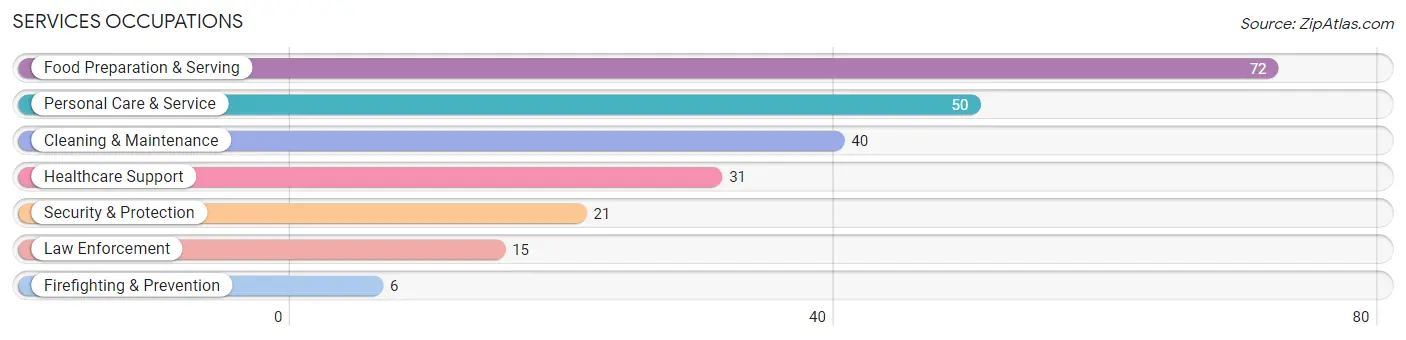
Services Occupations
The most common Services occupations in Mitchellville are Food Preparation & Serving (72 | 7.1%), Personal Care & Service (50 | 5.0%), Cleaning & Maintenance (40 | 4.0%), Healthcare Support (31 | 3.1%), and Security & Protection (21 | 2.1%).
Services Occupations by Sex
Within the Services occupations in Mitchellville, the most male-oriented occupations are Security & Protection (100.0%), Firefighting & Prevention (100.0%), and Law Enforcement (100.0%), while the most female-oriented occupations are Healthcare Support (100.0%), Personal Care & Service (76.0%), and Food Preparation & Serving (54.2%).
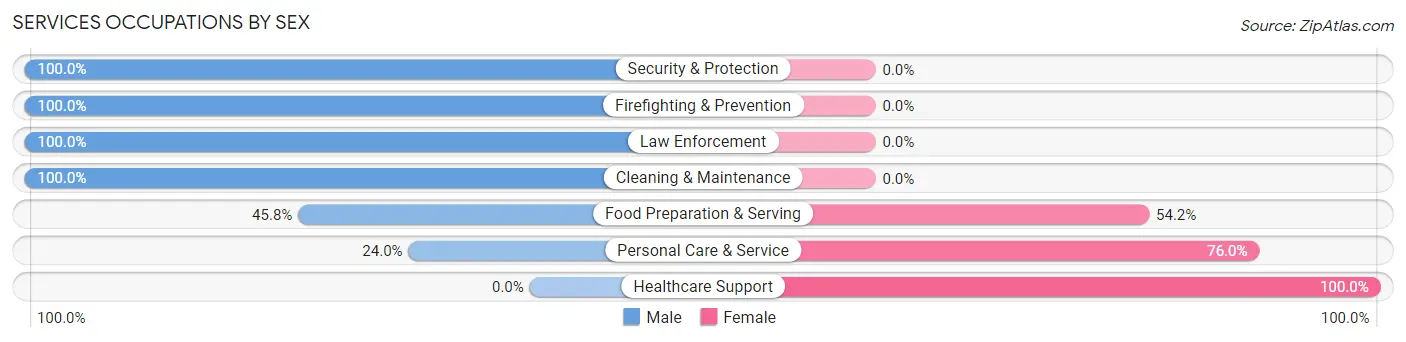
| Occupation | Male | Female |
| Healthcare Support | 0 (0.0%) | 31 (100.0%) |
| Security & Protection | 21 (100.0%) | 0 (0.0%) |
| Firefighting & Prevention | 6 (100.0%) | 0 (0.0%) |
| Law Enforcement | 15 (100.0%) | 0 (0.0%) |
| Food Preparation & Serving | 33 (45.8%) | 39 (54.2%) |
| Cleaning & Maintenance | 40 (100.0%) | 0 (0.0%) |
| Personal Care & Service | 12 (24.0%) | 38 (76.0%) |
| Total (Category) | 106 (49.5%) | 108 (50.5%) |
| Total (Overall) | 548 (54.3%) | 461 (45.7%) |
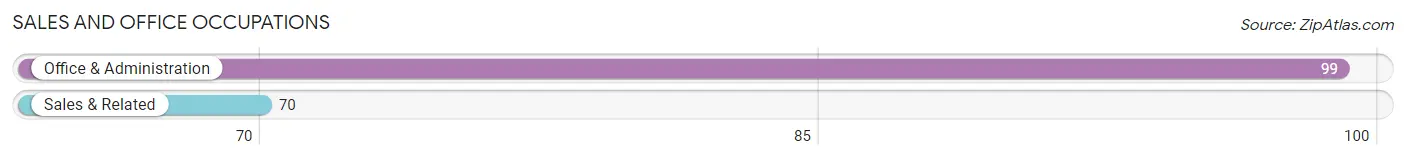
Sales and Office Occupations
The most common Sales and Office occupations in Mitchellville are Office & Administration (99 | 9.8%), and Sales & Related (70 | 6.9%).
Sales and Office Occupations by Sex
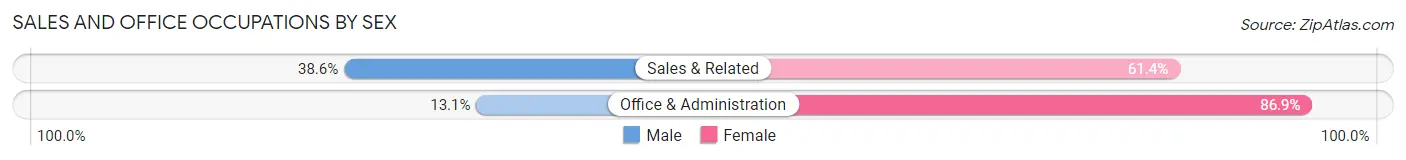
| Occupation | Male | Female |
| Sales & Related | 27 (38.6%) | 43 (61.4%) |
| Office & Administration | 13 (13.1%) | 86 (86.9%) |
| Total (Category) | 40 (23.7%) | 129 (76.3%) |
| Total (Overall) | 548 (54.3%) | 461 (45.7%) |
Natural Resources, Construction and Maintenance Occupations
The most common Natural Resources, Construction and Maintenance occupations in Mitchellville are Construction & Extraction (86 | 8.5%), Installation, Maintenance & Repair (67 | 6.6%), and Farming, Fishing & Forestry (10 | 1.0%).
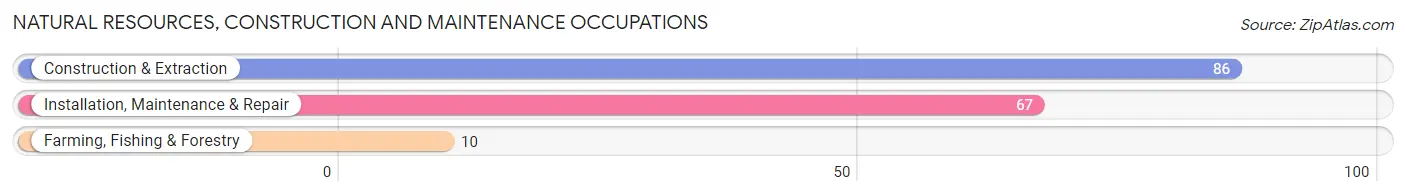
Natural Resources, Construction and Maintenance Occupations by Sex

| Occupation | Male | Female |
| Farming, Fishing & Forestry | 10 (100.0%) | 0 (0.0%) |
| Construction & Extraction | 81 (94.2%) | 5 (5.8%) |
| Installation, Maintenance & Repair | 67 (100.0%) | 0 (0.0%) |
| Total (Category) | 158 (96.9%) | 5 (3.1%) |
| Total (Overall) | 548 (54.3%) | 461 (45.7%) |
Production, Transportation and Moving Occupations
The most common Production, Transportation and Moving occupations in Mitchellville are Production (55 | 5.4%), Material Moving (52 | 5.1%), and Transportation (46 | 4.6%).
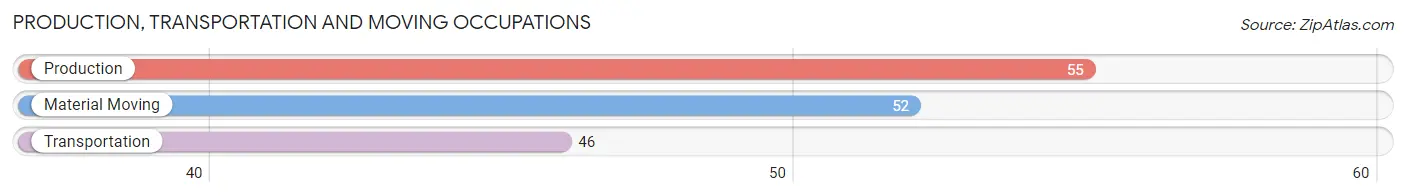
Production, Transportation and Moving Occupations by Sex
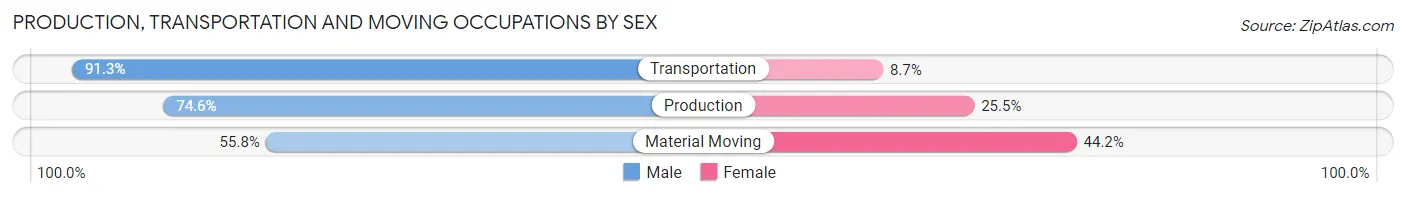
| Occupation | Male | Female |
| Production | 41 (74.6%) | 14 (25.5%) |
| Transportation | 42 (91.3%) | 4 (8.7%) |
| Material Moving | 29 (55.8%) | 23 (44.2%) |
| Total (Category) | 112 (73.2%) | 41 (26.8%) |
| Total (Overall) | 548 (54.3%) | 461 (45.7%) |
Employment Industries by Sex in Mitchellville
Employment Industries in Mitchellville
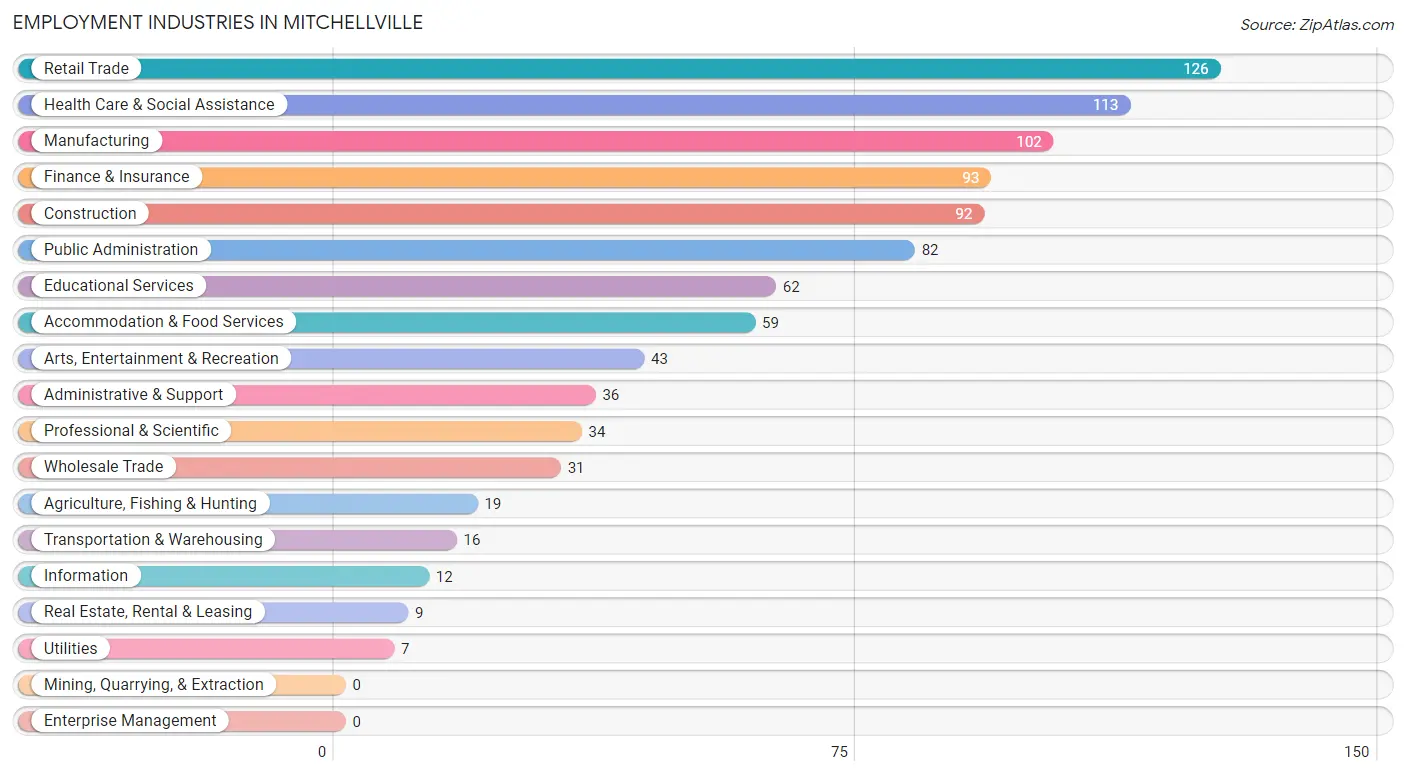
The major employment industries in Mitchellville include Retail Trade (126 | 12.5%), Health Care & Social Assistance (113 | 11.2%), Manufacturing (102 | 10.1%), Finance & Insurance (93 | 9.2%), and Construction (92 | 9.1%).
Employment Industries by Sex in Mitchellville
The Mitchellville industries that see more men than women are Wholesale Trade (100.0%), Utilities (100.0%), and Real Estate, Rental & Leasing (100.0%), whereas the industries that tend to have a higher number of women are Health Care & Social Assistance (92.0%), Educational Services (87.1%), and Finance & Insurance (64.5%).
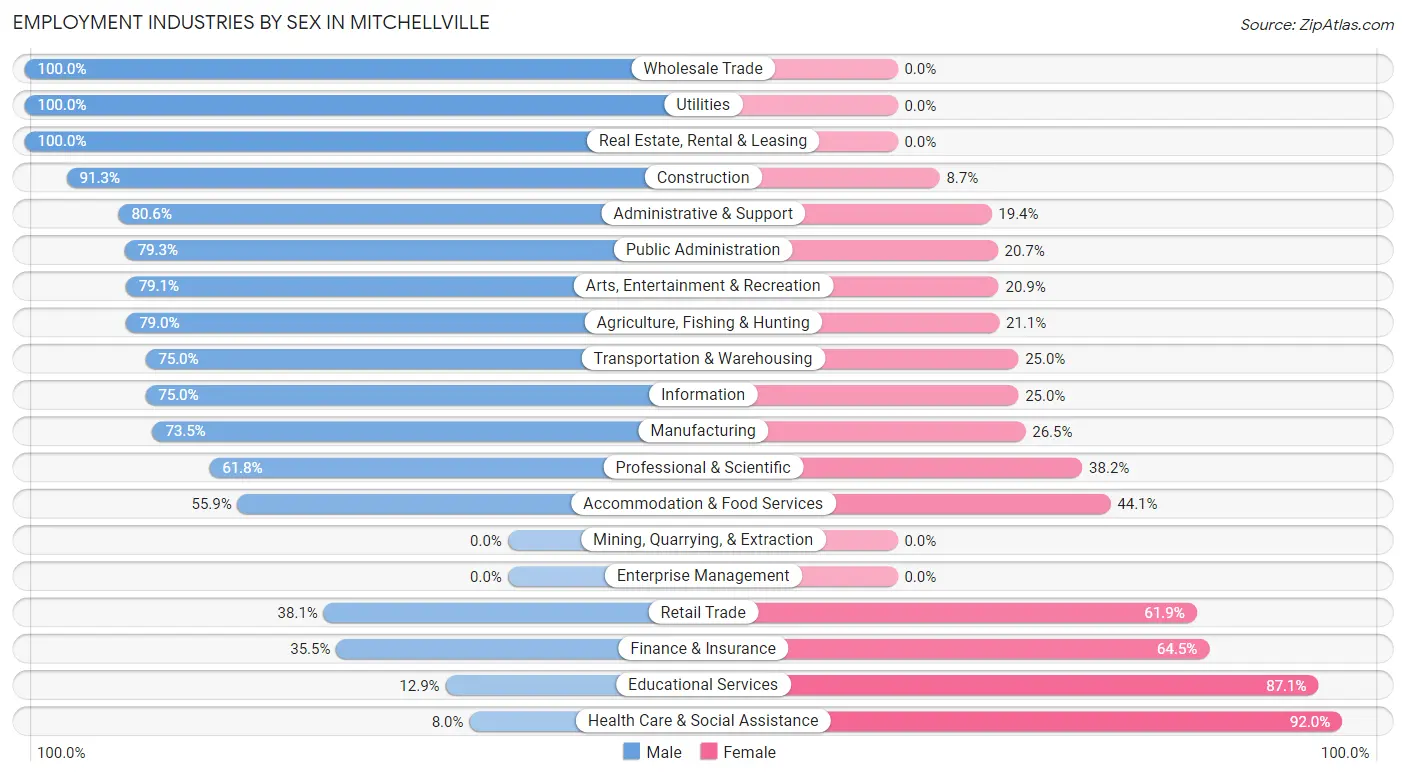
| Industry | Male | Female |
| Agriculture, Fishing & Hunting | 15 (78.9%) | 4 (21.0%) |
| Mining, Quarrying, & Extraction | 0 (0.0%) | 0 (0.0%) |
| Construction | 84 (91.3%) | 8 (8.7%) |
| Manufacturing | 75 (73.5%) | 27 (26.5%) |
| Wholesale Trade | 31 (100.0%) | 0 (0.0%) |
| Retail Trade | 48 (38.1%) | 78 (61.9%) |
| Transportation & Warehousing | 12 (75.0%) | 4 (25.0%) |
| Utilities | 7 (100.0%) | 0 (0.0%) |
| Information | 9 (75.0%) | 3 (25.0%) |
| Finance & Insurance | 33 (35.5%) | 60 (64.5%) |
| Real Estate, Rental & Leasing | 9 (100.0%) | 0 (0.0%) |
| Professional & Scientific | 21 (61.8%) | 13 (38.2%) |
| Enterprise Management | 0 (0.0%) | 0 (0.0%) |
| Administrative & Support | 29 (80.6%) | 7 (19.4%) |
| Educational Services | 8 (12.9%) | 54 (87.1%) |
| Health Care & Social Assistance | 9 (8.0%) | 104 (92.0%) |
| Arts, Entertainment & Recreation | 34 (79.1%) | 9 (20.9%) |
| Accommodation & Food Services | 33 (55.9%) | 26 (44.1%) |
| Public Administration | 65 (79.3%) | 17 (20.7%) |
| Total | 548 (54.3%) | 461 (45.7%) |
Education in Mitchellville
School Enrollment in Mitchellville
The most common levels of schooling among the 482 students in Mitchellville are high school (176 | 36.5%), middle school (118 | 24.5%), and elementary school (116 | 24.1%).
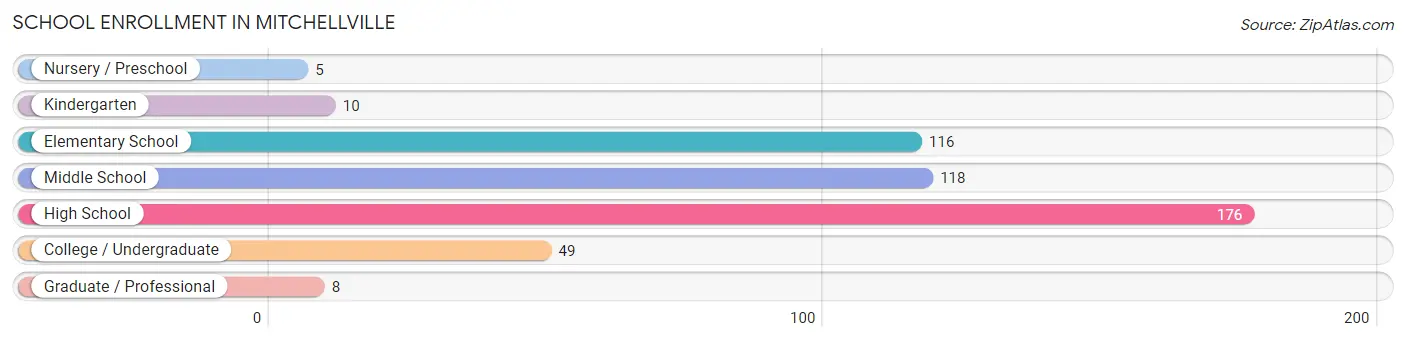
| School Level | # Students | % Students |
| Nursery / Preschool | 5 | 1.0% |
| Kindergarten | 10 | 2.1% |
| Elementary School | 116 | 24.1% |
| Middle School | 118 | 24.5% |
| High School | 176 | 36.5% |
| College / Undergraduate | 49 | 10.2% |
| Graduate / Professional | 8 | 1.7% |
| Total | 482 | 100.0% |
School Enrollment by Age by Funding Source in Mitchellville
Out of a total of 482 students who are enrolled in schools in Mitchellville, 16 (3.3%) attend a private institution, while the remaining 466 (96.7%) are enrolled in public schools. The age group of 18 to 19 year olds has the highest likelihood of being enrolled in private schools, with 10 (25.6% in the age bracket) enrolled. Conversely, the age group of 3 to 4 year olds has the lowest likelihood of being enrolled in a private school, with 9 (100.0% in the age bracket) attending a public institution.
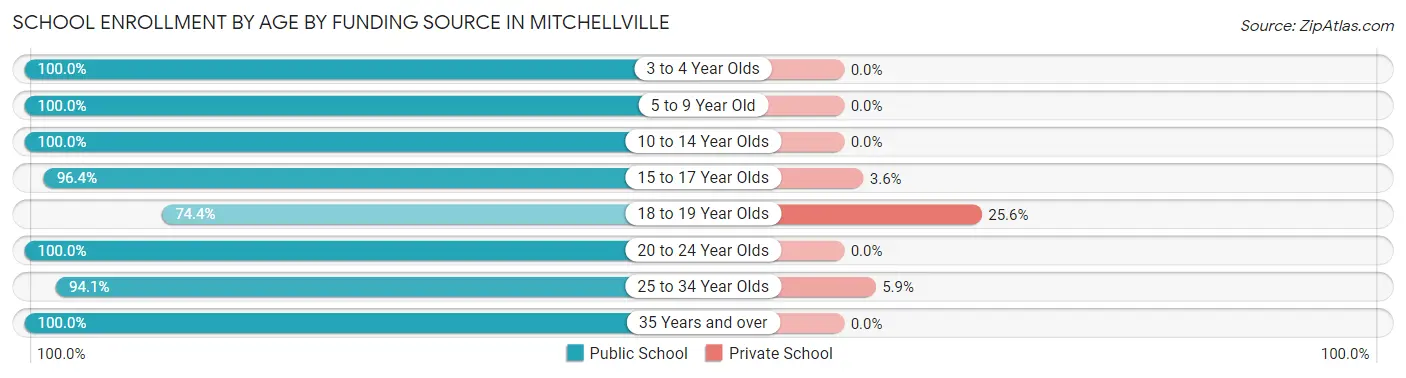
| Age Bracket | Public School | Private School |
| 3 to 4 Year Olds | 9 (100.0%) | 0 (0.0%) |
| 5 to 9 Year Old | 113 (100.0%) | 0 (0.0%) |
| 10 to 14 Year Olds | 127 (100.0%) | 0 (0.0%) |
| 15 to 17 Year Olds | 81 (96.4%) | 3 (3.6%) |
| 18 to 19 Year Olds | 29 (74.4%) | 10 (25.6%) |
| 20 to 24 Year Olds | 13 (100.0%) | 0 (0.0%) |
| 25 to 34 Year Olds | 48 (94.1%) | 3 (5.9%) |
| 35 Years and over | 46 (100.0%) | 0 (0.0%) |
| Total | 466 (96.7%) | 16 (3.3%) |
Educational Attainment by Field of Study in Mitchellville
Education (41 | 18.1%), psychology (28 | 12.4%), social sciences (24 | 10.6%), literature & languages (21 | 9.3%), and business (19 | 8.4%) are the most common fields of study among 226 individuals in Mitchellville who have obtained a bachelor's degree or higher.
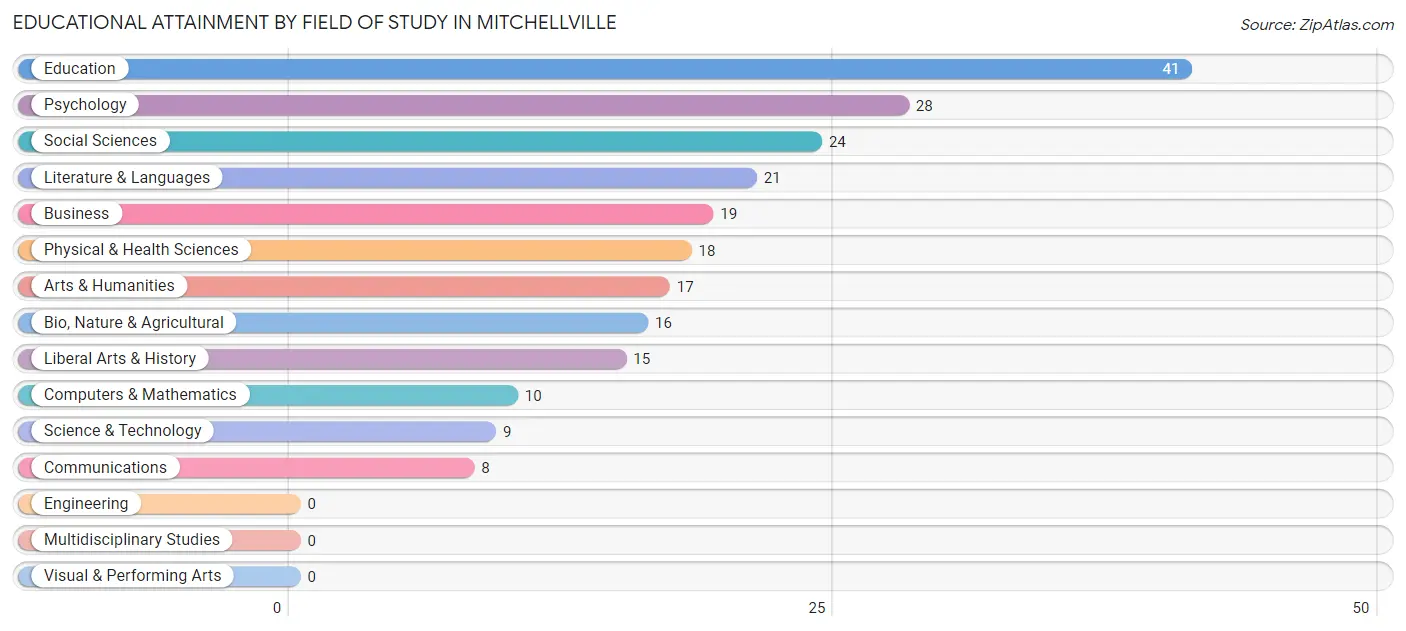
| Field of Study | # Graduates | % Graduates |
| Computers & Mathematics | 10 | 4.4% |
| Bio, Nature & Agricultural | 16 | 7.1% |
| Physical & Health Sciences | 18 | 8.0% |
| Psychology | 28 | 12.4% |
| Social Sciences | 24 | 10.6% |
| Engineering | 0 | 0.0% |
| Multidisciplinary Studies | 0 | 0.0% |
| Science & Technology | 9 | 4.0% |
| Business | 19 | 8.4% |
| Education | 41 | 18.1% |
| Literature & Languages | 21 | 9.3% |
| Liberal Arts & History | 15 | 6.6% |
| Visual & Performing Arts | 0 | 0.0% |
| Communications | 8 | 3.5% |
| Arts & Humanities | 17 | 7.5% |
| Total | 226 | 100.0% |
Transportation & Commute in Mitchellville
Vehicle Availability by Sex in Mitchellville
The most prevalent vehicle ownership categories in Mitchellville are males with 2 vehicles (252, accounting for 48.5%) and females with 2 vehicles (158, making up 55.3%).
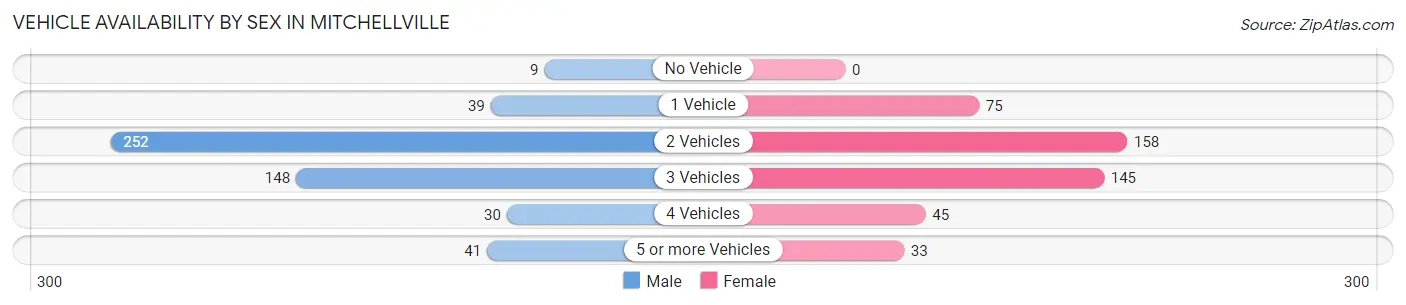
| Vehicles Available | Male | Female |
| No Vehicle | 9 (1.7%) | 0 (0.0%) |
| 1 Vehicle | 39 (7.5%) | 75 (16.5%) |
| 2 Vehicles | 252 (48.5%) | 158 (34.6%) |
| 3 Vehicles | 148 (28.5%) | 145 (31.8%) |
| 4 Vehicles | 30 (5.8%) | 45 (9.9%) |
| 5 or more Vehicles | 41 (7.9%) | 33 (7.2%) |
| Total | 519 (100.0%) | 456 (100.0%) |
Commute Time in Mitchellville
The most frequently occuring commute durations in Mitchellville are 20 to 24 minutes (224 commuters, 24.5%), 15 to 19 minutes (140 commuters, 15.3%), and 30 to 34 minutes (138 commuters, 15.1%).
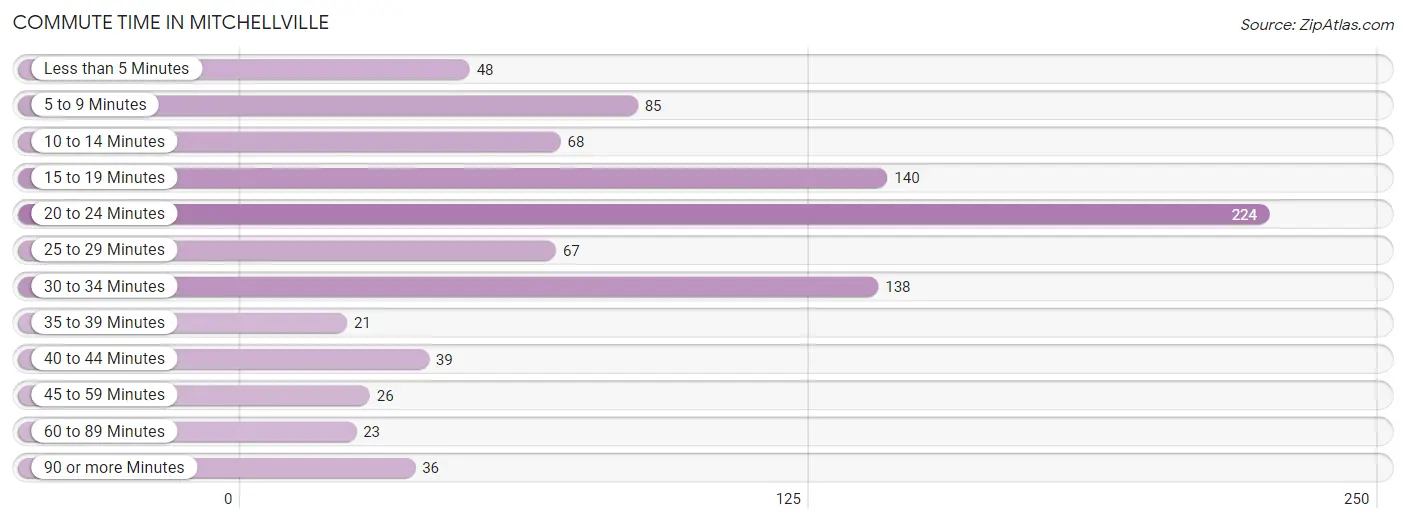
| Commute Time | # Commuters | % Commuters |
| Less than 5 Minutes | 48 | 5.2% |
| 5 to 9 Minutes | 85 | 9.3% |
| 10 to 14 Minutes | 68 | 7.4% |
| 15 to 19 Minutes | 140 | 15.3% |
| 20 to 24 Minutes | 224 | 24.5% |
| 25 to 29 Minutes | 67 | 7.3% |
| 30 to 34 Minutes | 138 | 15.1% |
| 35 to 39 Minutes | 21 | 2.3% |
| 40 to 44 Minutes | 39 | 4.3% |
| 45 to 59 Minutes | 26 | 2.8% |
| 60 to 89 Minutes | 23 | 2.5% |
| 90 or more Minutes | 36 | 3.9% |
Commute Time by Sex in Mitchellville
The most common commute times in Mitchellville are 20 to 24 minutes (121 commuters, 24.2%) for males and 20 to 24 minutes (103 commuters, 24.8%) for females.
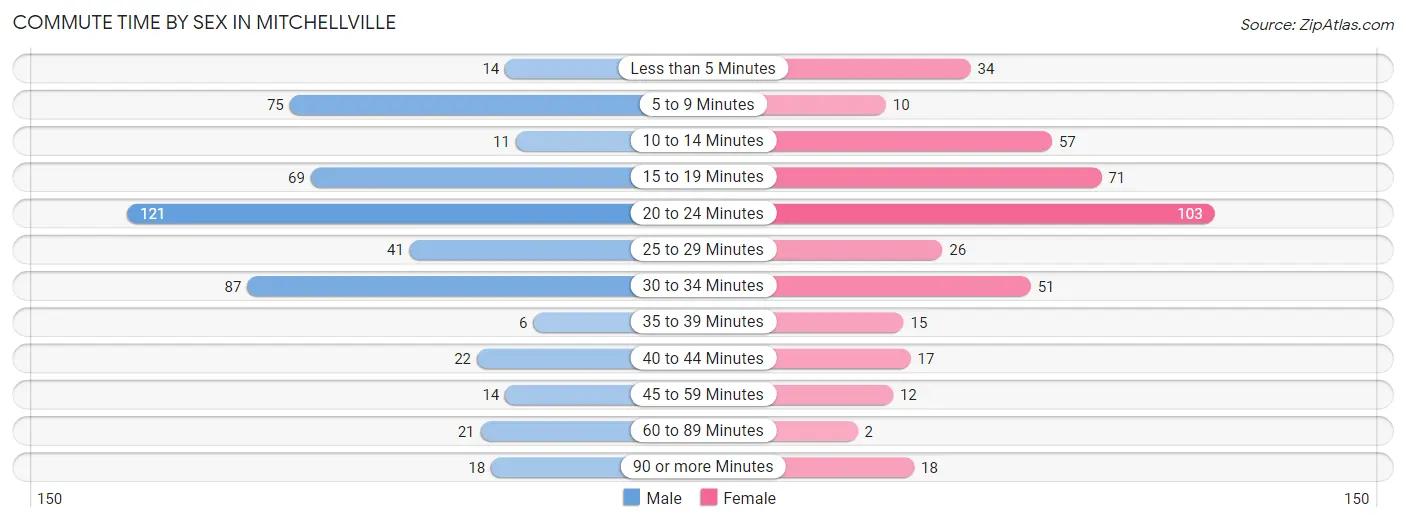
| Commute Time | Male | Female |
| Less than 5 Minutes | 14 (2.8%) | 34 (8.2%) |
| 5 to 9 Minutes | 75 (15.0%) | 10 (2.4%) |
| 10 to 14 Minutes | 11 (2.2%) | 57 (13.7%) |
| 15 to 19 Minutes | 69 (13.8%) | 71 (17.1%) |
| 20 to 24 Minutes | 121 (24.2%) | 103 (24.8%) |
| 25 to 29 Minutes | 41 (8.2%) | 26 (6.2%) |
| 30 to 34 Minutes | 87 (17.4%) | 51 (12.3%) |
| 35 to 39 Minutes | 6 (1.2%) | 15 (3.6%) |
| 40 to 44 Minutes | 22 (4.4%) | 17 (4.1%) |
| 45 to 59 Minutes | 14 (2.8%) | 12 (2.9%) |
| 60 to 89 Minutes | 21 (4.2%) | 2 (0.5%) |
| 90 or more Minutes | 18 (3.6%) | 18 (4.3%) |
Time of Departure to Work by Sex in Mitchellville
The most frequent times of departure to work in Mitchellville are 6:30 AM to 6:59 AM (139, 27.9%) for males and 7:00 AM to 7:29 AM (99, 23.8%) for females.
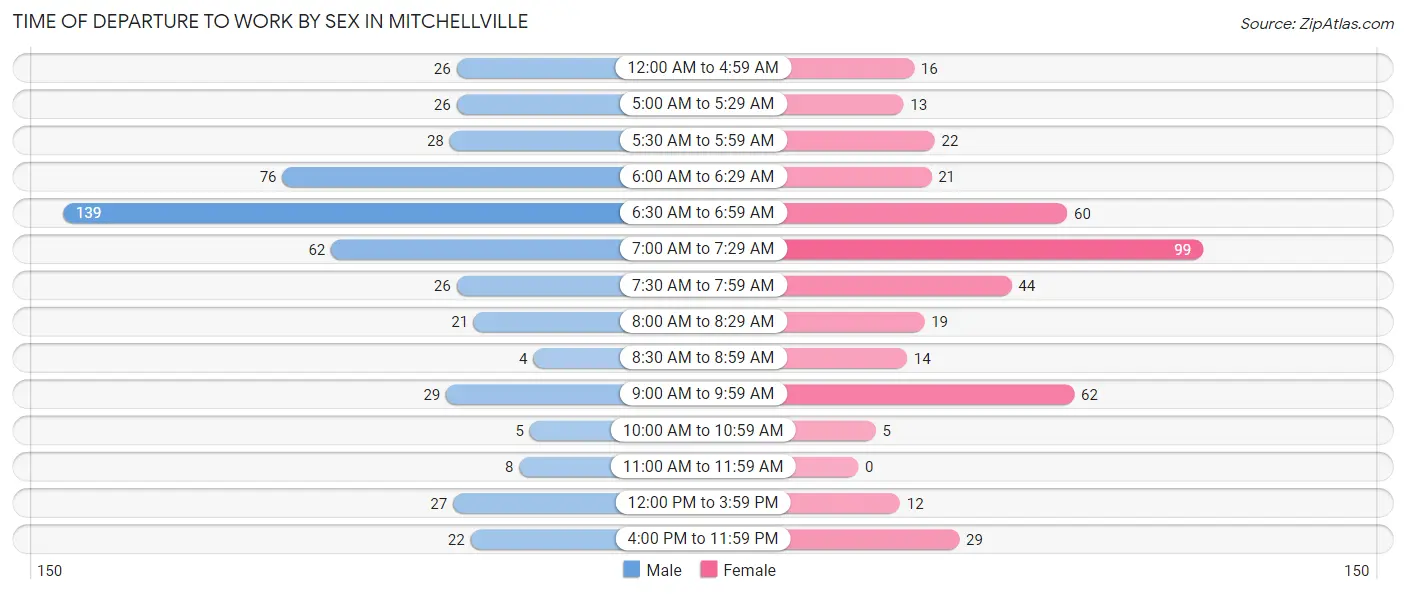
| Time of Departure | Male | Female |
| 12:00 AM to 4:59 AM | 26 (5.2%) | 16 (3.8%) |
| 5:00 AM to 5:29 AM | 26 (5.2%) | 13 (3.1%) |
| 5:30 AM to 5:59 AM | 28 (5.6%) | 22 (5.3%) |
| 6:00 AM to 6:29 AM | 76 (15.2%) | 21 (5.1%) |
| 6:30 AM to 6:59 AM | 139 (27.9%) | 60 (14.4%) |
| 7:00 AM to 7:29 AM | 62 (12.4%) | 99 (23.8%) |
| 7:30 AM to 7:59 AM | 26 (5.2%) | 44 (10.6%) |
| 8:00 AM to 8:29 AM | 21 (4.2%) | 19 (4.6%) |
| 8:30 AM to 8:59 AM | 4 (0.8%) | 14 (3.4%) |
| 9:00 AM to 9:59 AM | 29 (5.8%) | 62 (14.9%) |
| 10:00 AM to 10:59 AM | 5 (1.0%) | 5 (1.2%) |
| 11:00 AM to 11:59 AM | 8 (1.6%) | 0 (0.0%) |
| 12:00 PM to 3:59 PM | 27 (5.4%) | 12 (2.9%) |
| 4:00 PM to 11:59 PM | 22 (4.4%) | 29 (7.0%) |
| Total | 499 (100.0%) | 416 (100.0%) |
Housing Occupancy in Mitchellville
Occupancy by Ownership in Mitchellville
Of the total 666 dwellings in Mitchellville, owner-occupied units account for 534 (80.2%), while renter-occupied units make up 132 (19.8%).
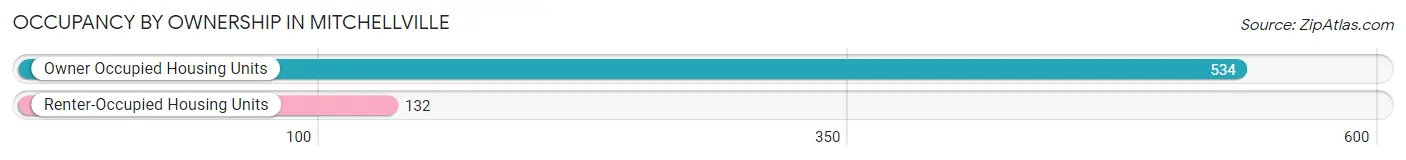
| Occupancy | # Housing Units | % Housing Units |
| Owner Occupied Housing Units | 534 | 80.2% |
| Renter-Occupied Housing Units | 132 | 19.8% |
| Total Occupied Housing Units | 666 | 100.0% |
Occupancy by Household Size in Mitchellville
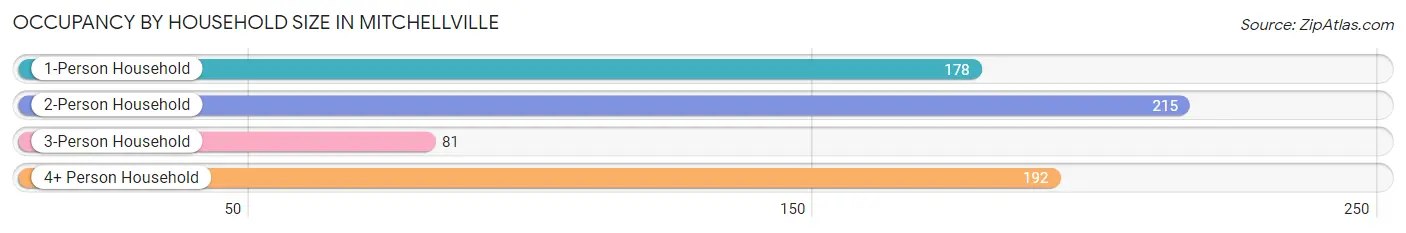
| Household Size | # Housing Units | % Housing Units |
| 1-Person Household | 178 | 26.7% |
| 2-Person Household | 215 | 32.3% |
| 3-Person Household | 81 | 12.2% |
| 4+ Person Household | 192 | 28.8% |
| Total Housing Units | 666 | 100.0% |
Occupancy by Ownership by Household Size in Mitchellville
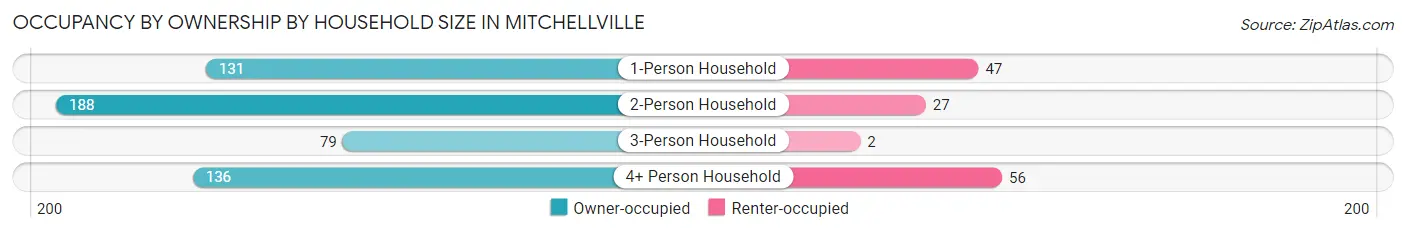
| Household Size | Owner-occupied | Renter-occupied |
| 1-Person Household | 131 (73.6%) | 47 (26.4%) |
| 2-Person Household | 188 (87.4%) | 27 (12.6%) |
| 3-Person Household | 79 (97.5%) | 2 (2.5%) |
| 4+ Person Household | 136 (70.8%) | 56 (29.2%) |
| Total Housing Units | 534 (80.2%) | 132 (19.8%) |
Occupancy by Educational Attainment in Mitchellville
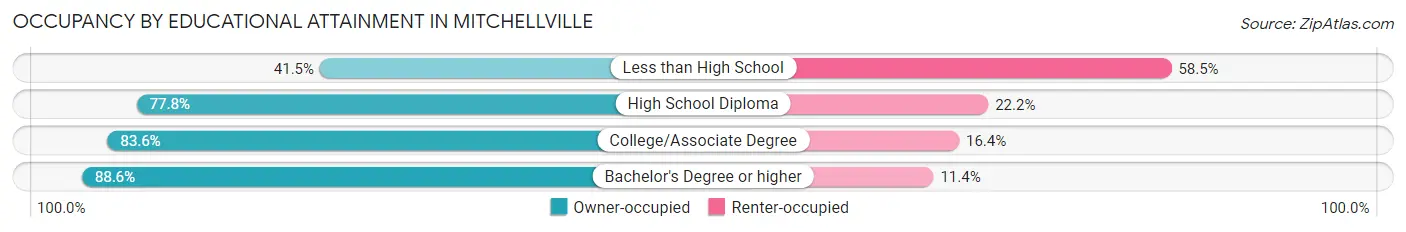
| Household Size | Owner-occupied | Renter-occupied |
| Less than High School | 17 (41.5%) | 24 (58.5%) |
| High School Diploma | 161 (77.8%) | 46 (22.2%) |
| College/Associate Degree | 239 (83.6%) | 47 (16.4%) |
| Bachelor's Degree or higher | 117 (88.6%) | 15 (11.4%) |
Occupancy by Age of Householder in Mitchellville
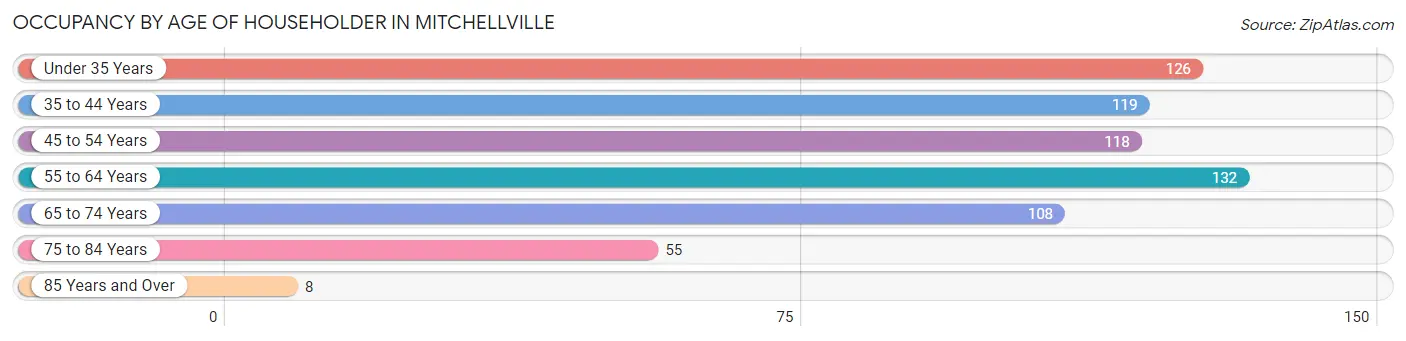
| Age Bracket | # Households | % Households |
| Under 35 Years | 126 | 18.9% |
| 35 to 44 Years | 119 | 17.9% |
| 45 to 54 Years | 118 | 17.7% |
| 55 to 64 Years | 132 | 19.8% |
| 65 to 74 Years | 108 | 16.2% |
| 75 to 84 Years | 55 | 8.3% |
| 85 Years and Over | 8 | 1.2% |
| Total | 666 | 100.0% |
Housing Finances in Mitchellville
Median Income by Occupancy in Mitchellville
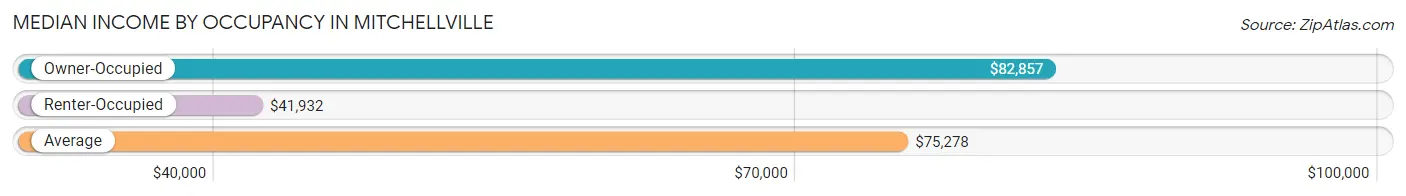
| Occupancy Type | # Households | Median Income |
| Owner-Occupied | 534 (80.2%) | $82,857 |
| Renter-Occupied | 132 (19.8%) | $41,932 |
| Average | 666 (100.0%) | $75,278 |
Occupancy by Householder Income Bracket in Mitchellville
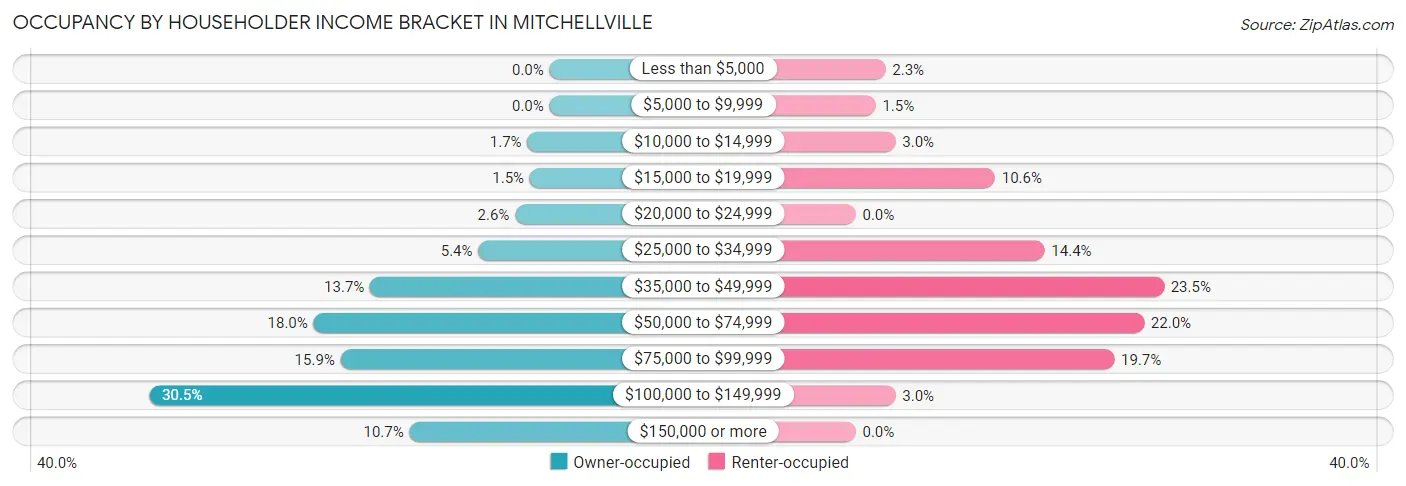
| Income Bracket | Owner-occupied | Renter-occupied |
| Less than $5,000 | 0 (0.0%) | 3 (2.3%) |
| $5,000 to $9,999 | 0 (0.0%) | 2 (1.5%) |
| $10,000 to $14,999 | 9 (1.7%) | 4 (3.0%) |
| $15,000 to $19,999 | 8 (1.5%) | 14 (10.6%) |
| $20,000 to $24,999 | 14 (2.6%) | 0 (0.0%) |
| $25,000 to $34,999 | 29 (5.4%) | 19 (14.4%) |
| $35,000 to $49,999 | 73 (13.7%) | 31 (23.5%) |
| $50,000 to $74,999 | 96 (18.0%) | 29 (22.0%) |
| $75,000 to $99,999 | 85 (15.9%) | 26 (19.7%) |
| $100,000 to $149,999 | 163 (30.5%) | 4 (3.0%) |
| $150,000 or more | 57 (10.7%) | 0 (0.0%) |
| Total | 534 (100.0%) | 132 (100.0%) |
Monthly Housing Cost Tiers in Mitchellville
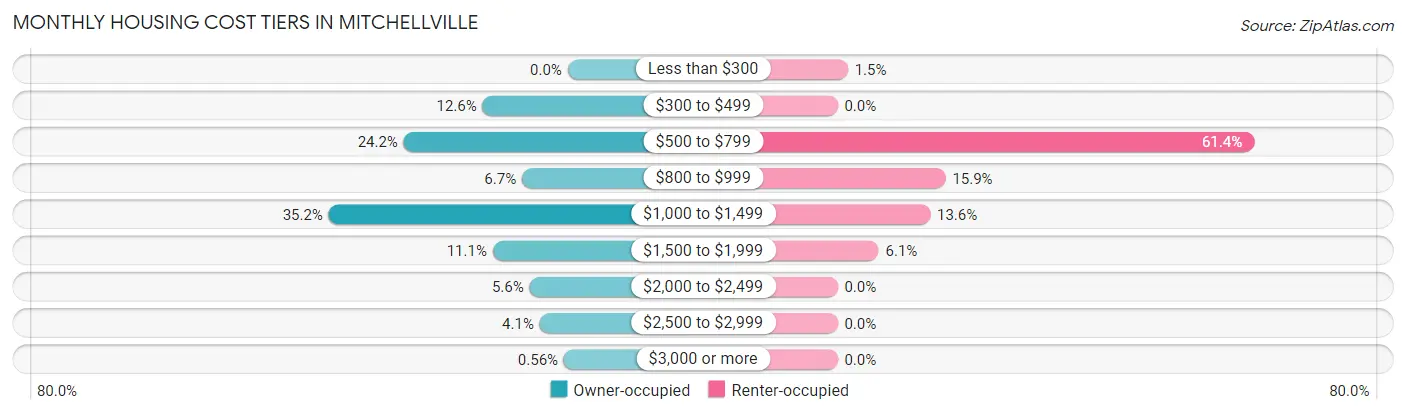
| Monthly Cost | Owner-occupied | Renter-occupied |
| Less than $300 | 0 (0.0%) | 2 (1.5%) |
| $300 to $499 | 67 (12.6%) | 0 (0.0%) |
| $500 to $799 | 129 (24.2%) | 81 (61.4%) |
| $800 to $999 | 36 (6.7%) | 21 (15.9%) |
| $1,000 to $1,499 | 188 (35.2%) | 18 (13.6%) |
| $1,500 to $1,999 | 59 (11.1%) | 8 (6.1%) |
| $2,000 to $2,499 | 30 (5.6%) | 0 (0.0%) |
| $2,500 to $2,999 | 22 (4.1%) | 0 (0.0%) |
| $3,000 or more | 3 (0.6%) | 0 (0.0%) |
| Total | 534 (100.0%) | 132 (100.0%) |
Physical Housing Characteristics in Mitchellville
Housing Structures in Mitchellville
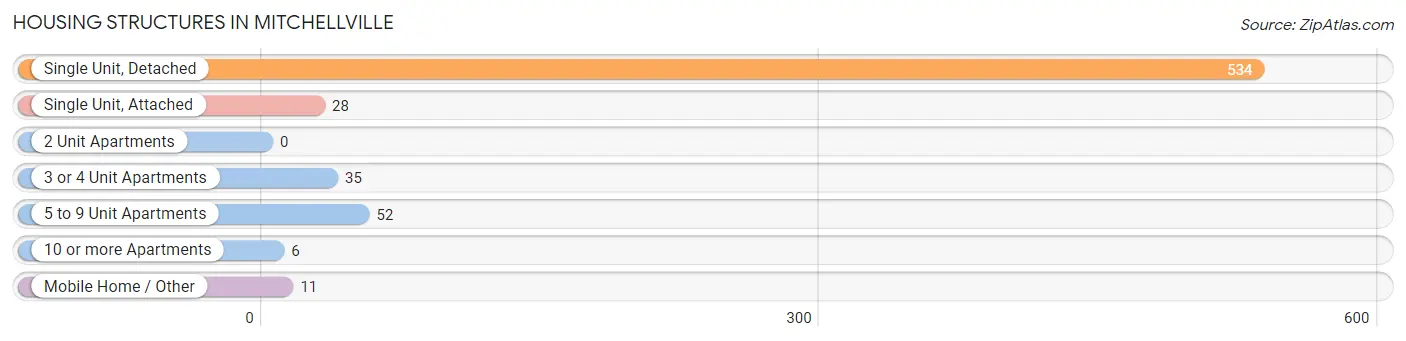
| Structure Type | # Housing Units | % Housing Units |
| Single Unit, Detached | 534 | 80.2% |
| Single Unit, Attached | 28 | 4.2% |
| 2 Unit Apartments | 0 | 0.0% |
| 3 or 4 Unit Apartments | 35 | 5.3% |
| 5 to 9 Unit Apartments | 52 | 7.8% |
| 10 or more Apartments | 6 | 0.9% |
| Mobile Home / Other | 11 | 1.7% |
| Total | 666 | 100.0% |
Housing Structures by Occupancy in Mitchellville
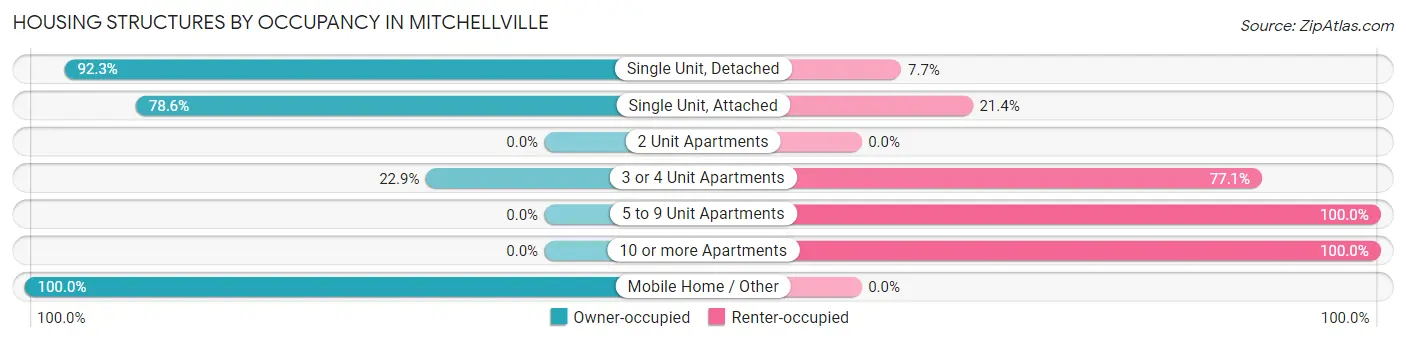
| Structure Type | Owner-occupied | Renter-occupied |
| Single Unit, Detached | 493 (92.3%) | 41 (7.7%) |
| Single Unit, Attached | 22 (78.6%) | 6 (21.4%) |
| 2 Unit Apartments | 0 (0.0%) | 0 (0.0%) |
| 3 or 4 Unit Apartments | 8 (22.9%) | 27 (77.1%) |
| 5 to 9 Unit Apartments | 0 (0.0%) | 52 (100.0%) |
| 10 or more Apartments | 0 (0.0%) | 6 (100.0%) |
| Mobile Home / Other | 11 (100.0%) | 0 (0.0%) |
| Total | 534 (80.2%) | 132 (19.8%) |
Housing Structures by Number of Rooms in Mitchellville
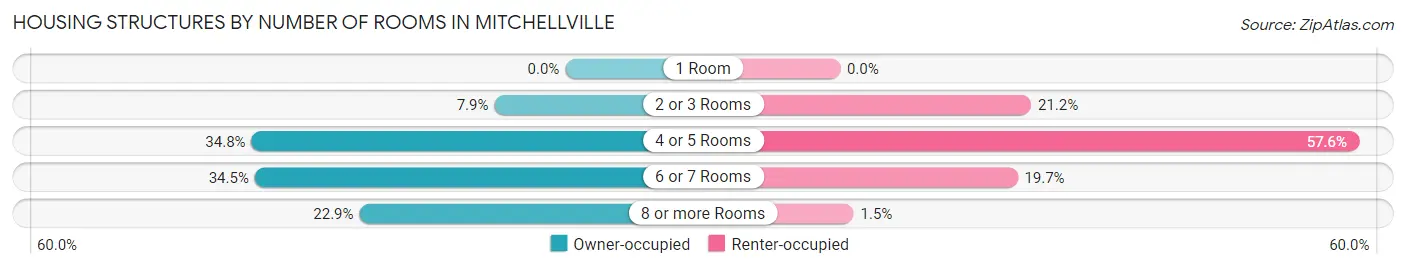
| Number of Rooms | Owner-occupied | Renter-occupied |
| 1 Room | 0 (0.0%) | 0 (0.0%) |
| 2 or 3 Rooms | 42 (7.9%) | 28 (21.2%) |
| 4 or 5 Rooms | 186 (34.8%) | 76 (57.6%) |
| 6 or 7 Rooms | 184 (34.5%) | 26 (19.7%) |
| 8 or more Rooms | 122 (22.9%) | 2 (1.5%) |
| Total | 534 (100.0%) | 132 (100.0%) |
Housing Structure by Heating Type in Mitchellville
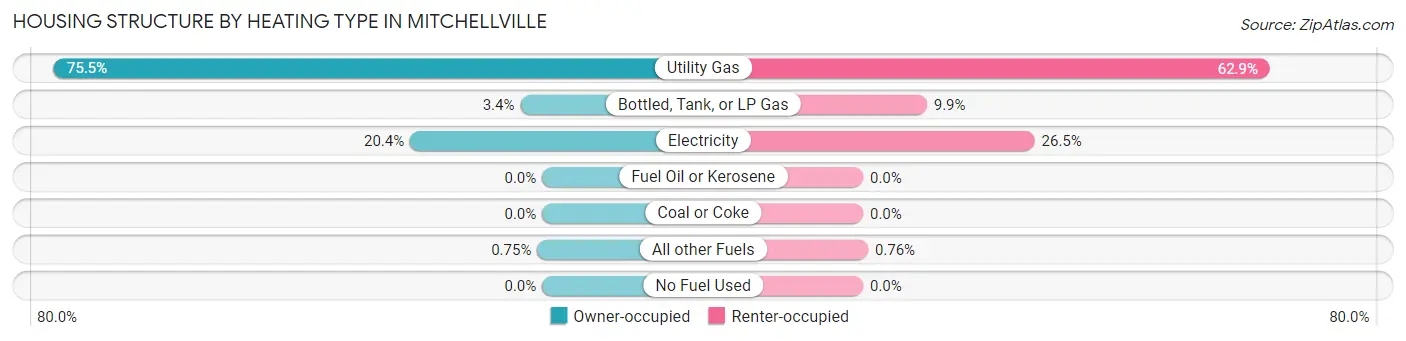
| Heating Type | Owner-occupied | Renter-occupied |
| Utility Gas | 403 (75.5%) | 83 (62.9%) |
| Bottled, Tank, or LP Gas | 18 (3.4%) | 13 (9.9%) |
| Electricity | 109 (20.4%) | 35 (26.5%) |
| Fuel Oil or Kerosene | 0 (0.0%) | 0 (0.0%) |
| Coal or Coke | 0 (0.0%) | 0 (0.0%) |
| All other Fuels | 4 (0.7%) | 1 (0.8%) |
| No Fuel Used | 0 (0.0%) | 0 (0.0%) |
| Total | 534 (100.0%) | 132 (100.0%) |
Household Vehicle Usage in Mitchellville
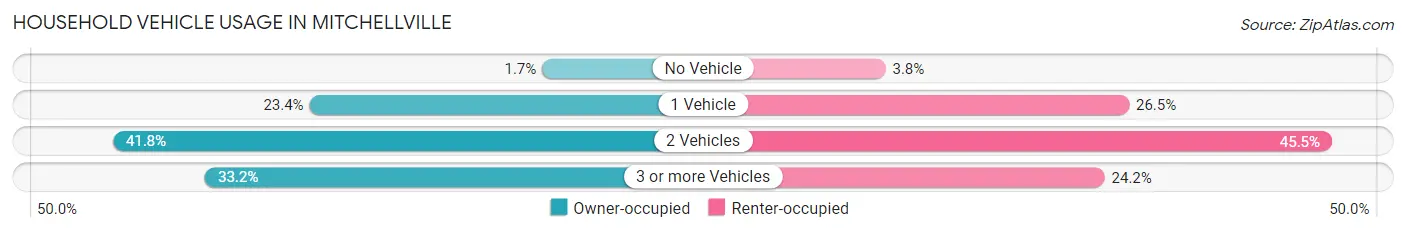
| Vehicles per Household | Owner-occupied | Renter-occupied |
| No Vehicle | 9 (1.7%) | 5 (3.8%) |
| 1 Vehicle | 125 (23.4%) | 35 (26.5%) |
| 2 Vehicles | 223 (41.8%) | 60 (45.5%) |
| 3 or more Vehicles | 177 (33.2%) | 32 (24.2%) |
| Total | 534 (100.0%) | 132 (100.0%) |
Real Estate & Mortgages in Mitchellville
Real Estate and Mortgage Overview in Mitchellville
| Characteristic | Without Mortgage | With Mortgage |
| Housing Units | 164 | 370 |
| Median Property Value | $156,500 | $178,400 |
| Median Household Income | $51,563 | $47 |
| Monthly Housing Costs | $575 | $3 |
| Real Estate Taxes | $2,688 | $4 |
Property Value by Mortgage Status in Mitchellville
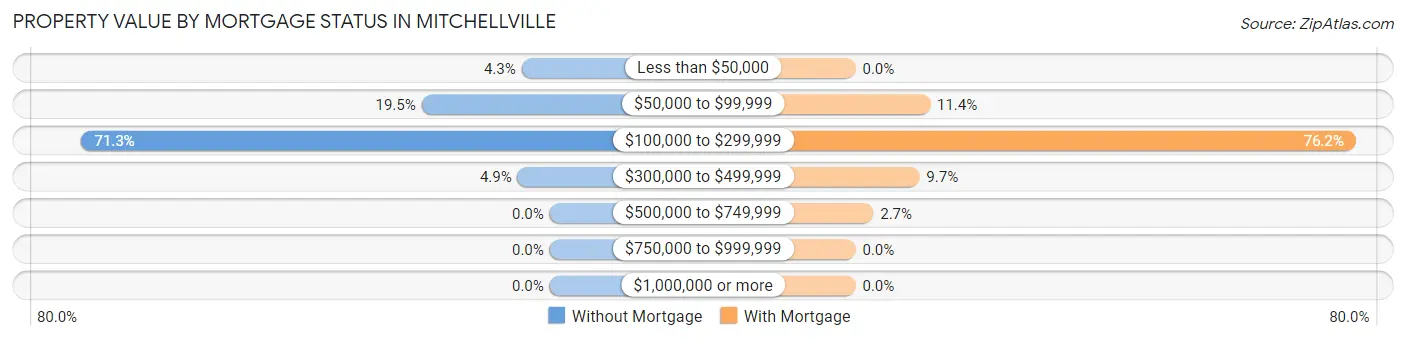
| Property Value | Without Mortgage | With Mortgage |
| Less than $50,000 | 7 (4.3%) | 0 (0.0%) |
| $50,000 to $99,999 | 32 (19.5%) | 42 (11.4%) |
| $100,000 to $299,999 | 117 (71.3%) | 282 (76.2%) |
| $300,000 to $499,999 | 8 (4.9%) | 36 (9.7%) |
| $500,000 to $749,999 | 0 (0.0%) | 10 (2.7%) |
| $750,000 to $999,999 | 0 (0.0%) | 0 (0.0%) |
| $1,000,000 or more | 0 (0.0%) | 0 (0.0%) |
| Total | 164 (100.0%) | 370 (100.0%) |
Household Income by Mortgage Status in Mitchellville
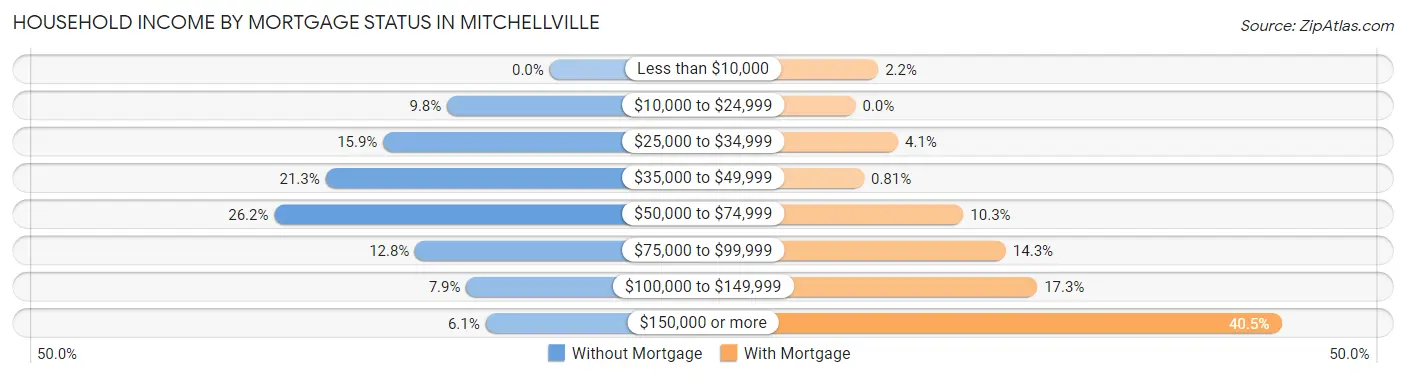
| Household Income | Without Mortgage | With Mortgage |
| Less than $10,000 | 0 (0.0%) | 8 (2.2%) |
| $10,000 to $24,999 | 16 (9.8%) | 0 (0.0%) |
| $25,000 to $34,999 | 26 (15.9%) | 15 (4.1%) |
| $35,000 to $49,999 | 35 (21.3%) | 3 (0.8%) |
| $50,000 to $74,999 | 43 (26.2%) | 38 (10.3%) |
| $75,000 to $99,999 | 21 (12.8%) | 53 (14.3%) |
| $100,000 to $149,999 | 13 (7.9%) | 64 (17.3%) |
| $150,000 or more | 10 (6.1%) | 150 (40.5%) |
| Total | 164 (100.0%) | 370 (100.0%) |
Property Value to Household Income Ratio in Mitchellville
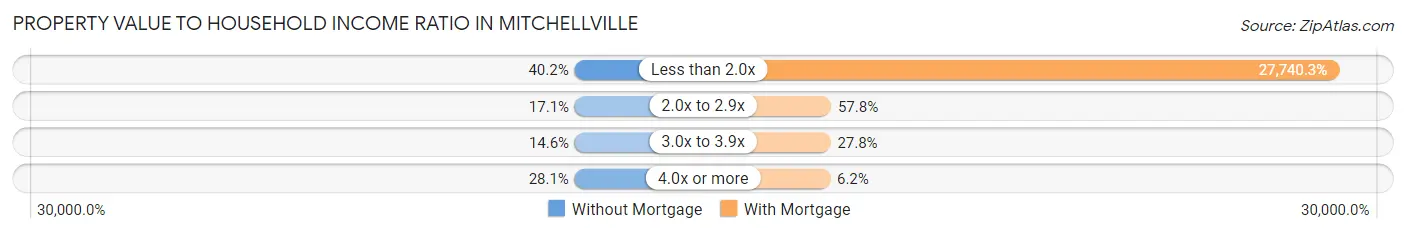
| Value-to-Income Ratio | Without Mortgage | With Mortgage |
| Less than 2.0x | 66 (40.2%) | 102,639 (27,740.3%) |
| 2.0x to 2.9x | 28 (17.1%) | 214 (57.8%) |
| 3.0x to 3.9x | 24 (14.6%) | 103 (27.8%) |
| 4.0x or more | 46 (28.1%) | 23 (6.2%) |
| Total | 164 (100.0%) | 370 (100.0%) |
Real Estate Taxes by Mortgage Status in Mitchellville
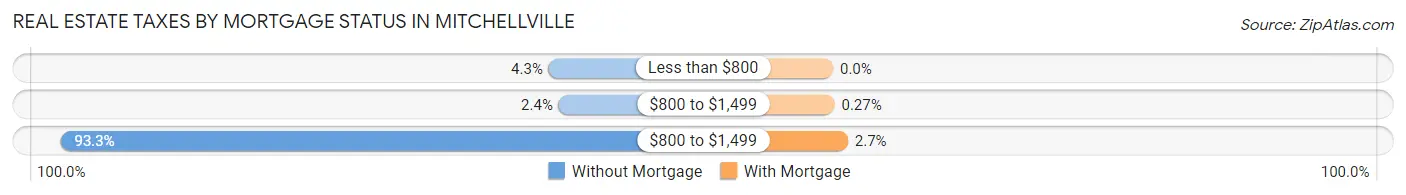
| Property Taxes | Without Mortgage | With Mortgage |
| Less than $800 | 7 (4.3%) | 0 (0.0%) |
| $800 to $1,499 | 4 (2.4%) | 1 (0.3%) |
| $800 to $1,499 | 153 (93.3%) | 10 (2.7%) |
| Total | 164 (100.0%) | 370 (100.0%) |
Health & Disability in Mitchellville
Health Insurance Coverage by Age in Mitchellville
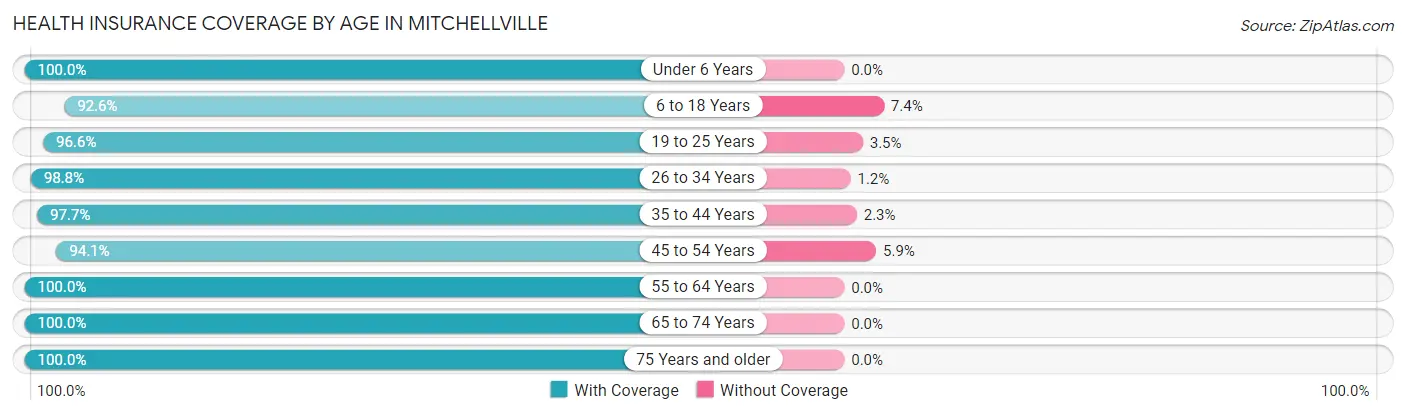
| Age Bracket | With Coverage | Without Coverage |
| Under 6 Years | 115 (100.0%) | 0 (0.0%) |
| 6 to 18 Years | 351 (92.6%) | 28 (7.4%) |
| 19 to 25 Years | 84 (96.6%) | 3 (3.5%) |
| 26 to 34 Years | 256 (98.8%) | 3 (1.2%) |
| 35 to 44 Years | 210 (97.7%) | 5 (2.3%) |
| 45 to 54 Years | 222 (94.1%) | 14 (5.9%) |
| 55 to 64 Years | 183 (100.0%) | 0 (0.0%) |
| 65 to 74 Years | 164 (100.0%) | 0 (0.0%) |
| 75 Years and older | 91 (100.0%) | 0 (0.0%) |
| Total | 1,676 (96.9%) | 53 (3.1%) |
Health Insurance Coverage by Citizenship Status in Mitchellville
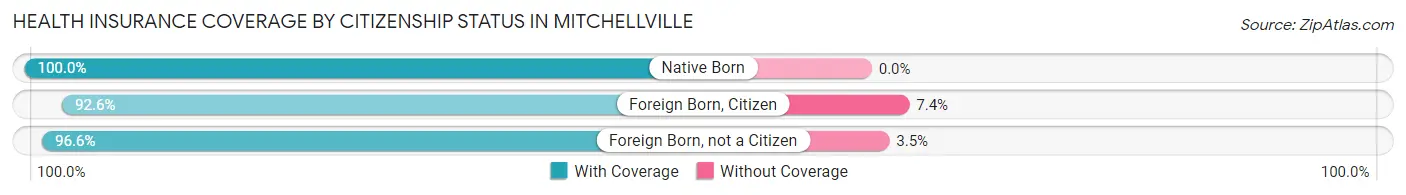
| Citizenship Status | With Coverage | Without Coverage |
| Native Born | 115 (100.0%) | 0 (0.0%) |
| Foreign Born, Citizen | 351 (92.6%) | 28 (7.4%) |
| Foreign Born, not a Citizen | 84 (96.6%) | 3 (3.5%) |
Health Insurance Coverage by Household Income in Mitchellville
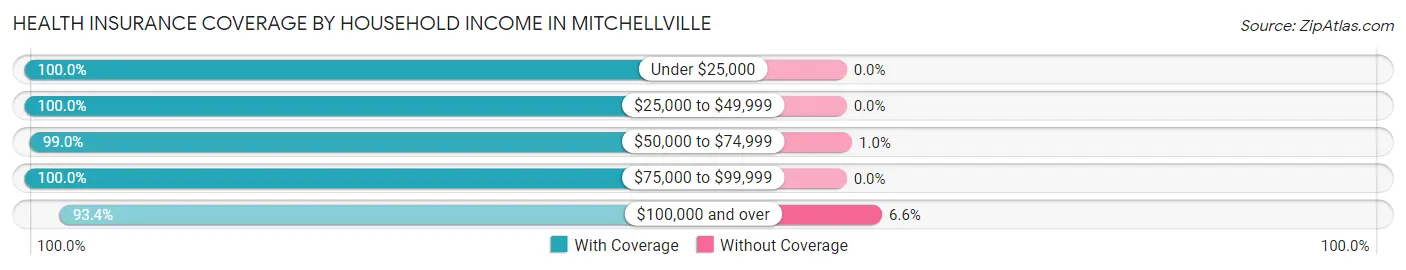
| Household Income | With Coverage | Without Coverage |
| Under $25,000 | 94 (100.0%) | 0 (0.0%) |
| $25,000 to $49,999 | 285 (100.0%) | 0 (0.0%) |
| $50,000 to $74,999 | 296 (99.0%) | 3 (1.0%) |
| $75,000 to $99,999 | 295 (100.0%) | 0 (0.0%) |
| $100,000 and over | 706 (93.4%) | 50 (6.6%) |
Public vs Private Health Insurance Coverage by Age in Mitchellville
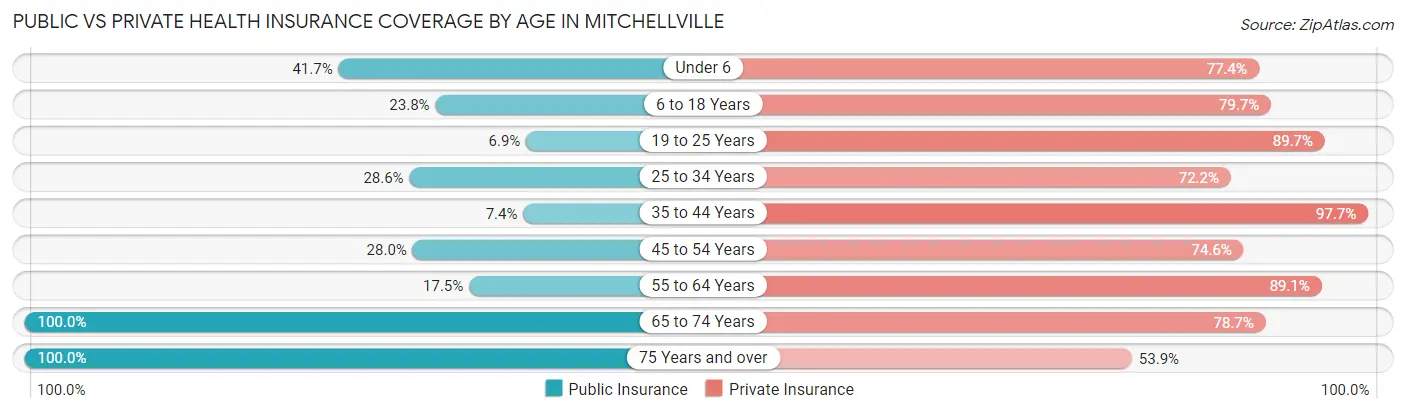
| Age Bracket | Public Insurance | Private Insurance |
| Under 6 | 48 (41.7%) | 89 (77.4%) |
| 6 to 18 Years | 90 (23.7%) | 302 (79.7%) |
| 19 to 25 Years | 6 (6.9%) | 78 (89.7%) |
| 25 to 34 Years | 74 (28.6%) | 187 (72.2%) |
| 35 to 44 Years | 16 (7.4%) | 210 (97.7%) |
| 45 to 54 Years | 66 (28.0%) | 176 (74.6%) |
| 55 to 64 Years | 32 (17.5%) | 163 (89.1%) |
| 65 to 74 Years | 164 (100.0%) | 129 (78.7%) |
| 75 Years and over | 91 (100.0%) | 49 (53.8%) |
| Total | 587 (34.0%) | 1,383 (80.0%) |
Disability Status by Sex by Age in Mitchellville
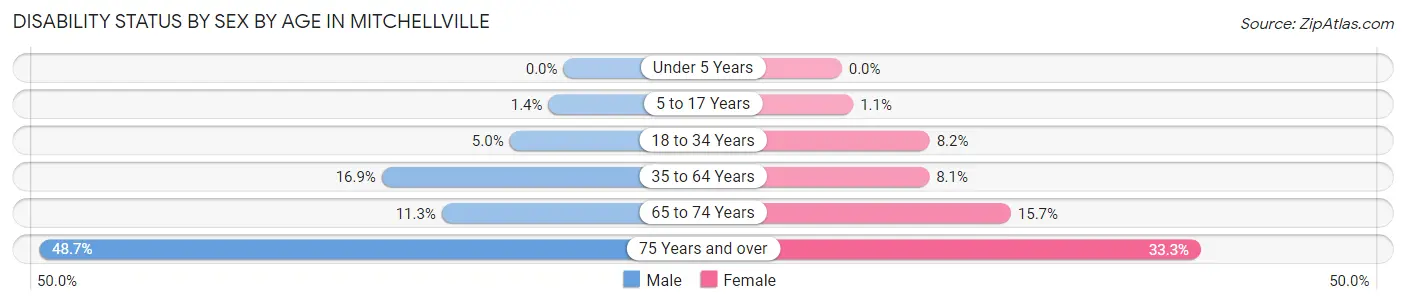
| Age Bracket | Male | Female |
| Under 5 Years | 0 (0.0%) | 0 (0.0%) |
| 5 to 17 Years | 2 (1.4%) | 2 (1.1%) |
| 18 to 34 Years | 10 (5.0%) | 16 (8.2%) |
| 35 to 64 Years | 57 (16.9%) | 24 (8.1%) |
| 65 to 74 Years | 7 (11.3%) | 16 (15.7%) |
| 75 Years and over | 18 (48.6%) | 18 (33.3%) |
Disability Class by Sex by Age in Mitchellville
Disability Class: Hearing Difficulty
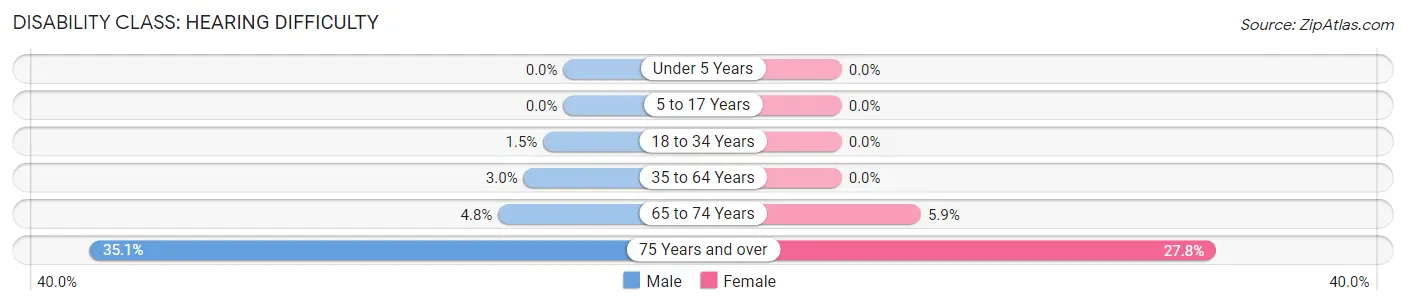
| Age Bracket | Male | Female |
| Under 5 Years | 0 (0.0%) | 0 (0.0%) |
| 5 to 17 Years | 0 (0.0%) | 0 (0.0%) |
| 18 to 34 Years | 3 (1.5%) | 0 (0.0%) |
| 35 to 64 Years | 10 (3.0%) | 0 (0.0%) |
| 65 to 74 Years | 3 (4.8%) | 6 (5.9%) |
| 75 Years and over | 13 (35.1%) | 15 (27.8%) |
Disability Class: Vision Difficulty
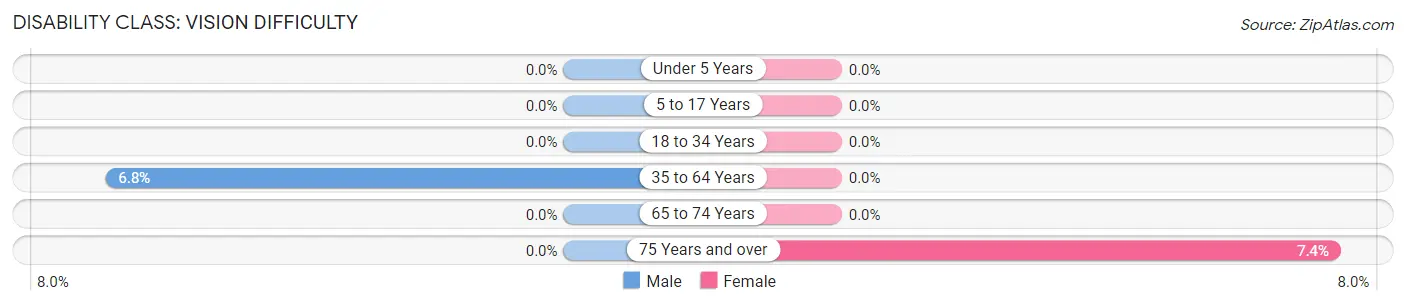
| Age Bracket | Male | Female |
| Under 5 Years | 0 (0.0%) | 0 (0.0%) |
| 5 to 17 Years | 0 (0.0%) | 0 (0.0%) |
| 18 to 34 Years | 0 (0.0%) | 0 (0.0%) |
| 35 to 64 Years | 23 (6.8%) | 0 (0.0%) |
| 65 to 74 Years | 0 (0.0%) | 0 (0.0%) |
| 75 Years and over | 0 (0.0%) | 4 (7.4%) |
Disability Class: Cognitive Difficulty
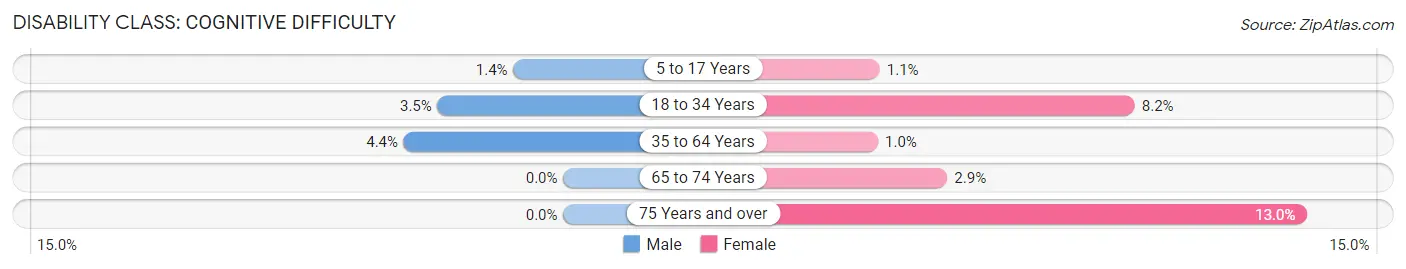
| Age Bracket | Male | Female |
| 5 to 17 Years | 2 (1.4%) | 2 (1.1%) |
| 18 to 34 Years | 7 (3.5%) | 16 (8.2%) |
| 35 to 64 Years | 15 (4.4%) | 3 (1.0%) |
| 65 to 74 Years | 0 (0.0%) | 3 (2.9%) |
| 75 Years and over | 0 (0.0%) | 7 (13.0%) |
Disability Class: Ambulatory Difficulty
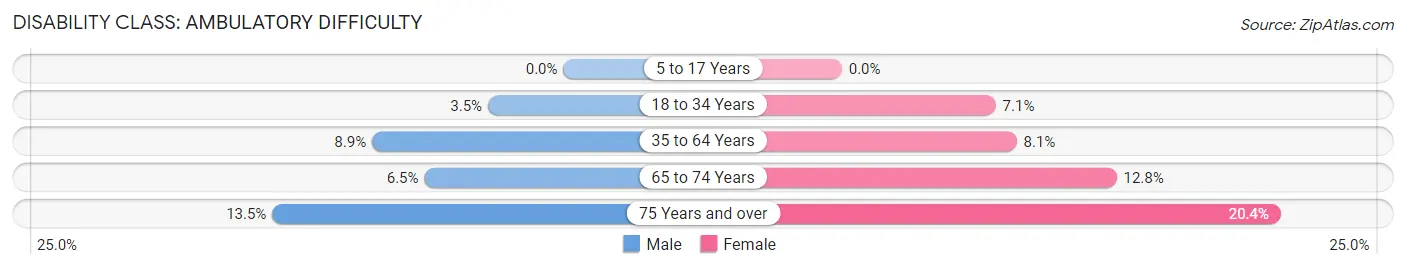
| Age Bracket | Male | Female |
| 5 to 17 Years | 0 (0.0%) | 0 (0.0%) |
| 18 to 34 Years | 7 (3.5%) | 14 (7.1%) |
| 35 to 64 Years | 30 (8.9%) | 24 (8.1%) |
| 65 to 74 Years | 4 (6.5%) | 13 (12.8%) |
| 75 Years and over | 5 (13.5%) | 11 (20.4%) |
Disability Class: Self-Care Difficulty
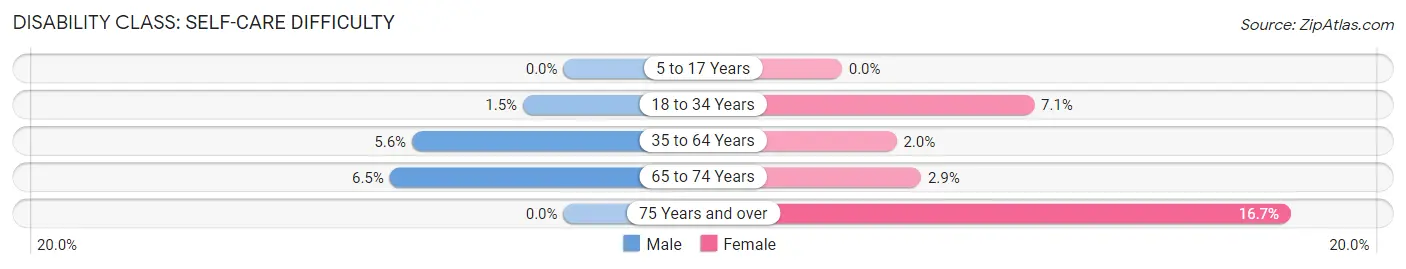
| Age Bracket | Male | Female |
| 5 to 17 Years | 0 (0.0%) | 0 (0.0%) |
| 18 to 34 Years | 3 (1.5%) | 14 (7.1%) |
| 35 to 64 Years | 19 (5.6%) | 6 (2.0%) |
| 65 to 74 Years | 4 (6.5%) | 3 (2.9%) |
| 75 Years and over | 0 (0.0%) | 9 (16.7%) |
Technology Access in Mitchellville
Computing Device Access in Mitchellville
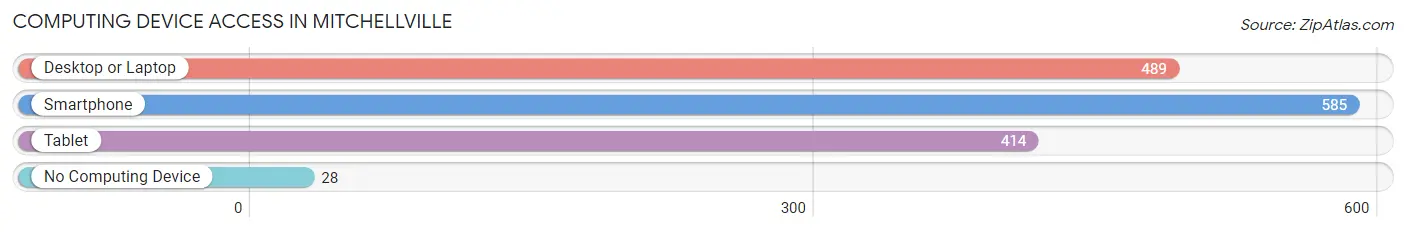
| Device Type | # Households | % Households |
| Desktop or Laptop | 489 | 73.4% |
| Smartphone | 585 | 87.8% |
| Tablet | 414 | 62.2% |
| No Computing Device | 28 | 4.2% |
| Total | 666 | 100.0% |
Internet Access in Mitchellville
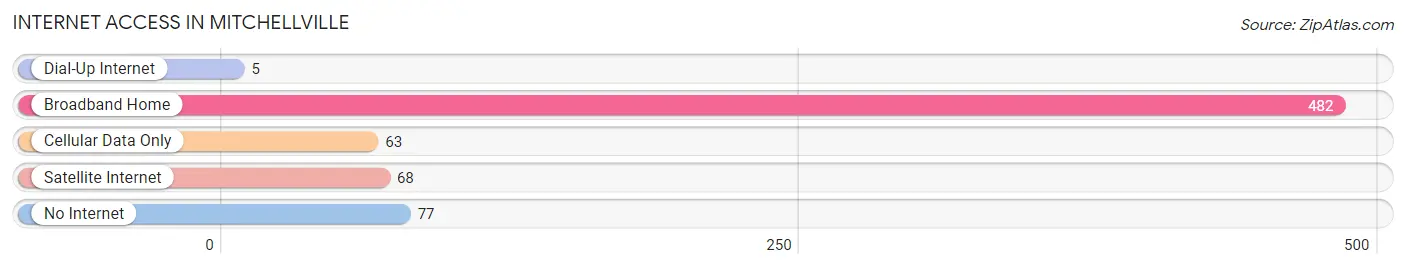
| Internet Type | # Households | % Households |
| Dial-Up Internet | 5 | 0.7% |
| Broadband Home | 482 | 72.4% |
| Cellular Data Only | 63 | 9.5% |
| Satellite Internet | 68 | 10.2% |
| No Internet | 77 | 11.6% |
| Total | 666 | 100.0% |
Mitchellville Summary
Mitchellville, Iowa is a small city located in Polk County, Iowa. It is situated approximately 20 miles northeast of Des Moines, the state capital. The city has a population of approximately 3,000 people and is part of the Des Moines-West Des Moines Metropolitan Statistical Area.
History
The area that is now Mitchellville was first settled in 1845 by a group of settlers from Ohio. The town was originally known as “Newburg” and was later renamed “Mitchellville” in honor of the first settler, William Mitchell. The town was officially incorporated in 1876.
In the late 19th century, Mitchellville was a thriving agricultural community. The town was home to several grain elevators, a creamery, a flour mill, and a sawmill. The town also had a railroad station, which connected it to Des Moines and other nearby towns.
In the early 20th century, Mitchellville began to experience a period of growth and development. The town was home to several businesses, including a bank, a hotel, a movie theater, and a variety of stores. The town also had a public library, a post office, and a fire station.
Geography
Mitchellville is located in central Iowa, approximately 20 miles northeast of Des Moines. The city is situated in the Des Moines River Valley, which is part of the larger Central Iowa Plains region. The city is surrounded by rolling hills and farmland.
The climate in Mitchellville is typical of the Midwest, with hot summers and cold winters. The average temperature in the summer is around 80 degrees Fahrenheit, while the average temperature in the winter is around 20 degrees Fahrenheit. The city receives an average of 36 inches of precipitation per year.
Economy
The economy of Mitchellville is largely based on agriculture. The city is home to several farms, which produce a variety of crops, including corn, soybeans, and hay. The city is also home to several businesses, including a bank, a hotel, a movie theater, and a variety of stores.
The city is also home to several manufacturing companies, including a plastics manufacturer and a metal fabrication company. The city is also home to a variety of service-based businesses, including a medical clinic, a veterinary clinic, and a variety of restaurants.
Demographics
As of the 2010 census, the population of Mitchellville was 3,000. The racial makeup of the city was 97.2% White, 0.7% African American, 0.3% Native American, 0.3% Asian, 0.1% Pacific Islander, and 1.4% from other races. The median household income in the city was $45,000, and the median family income was $50,000.
The city is home to a variety of religious denominations, including Baptist, Methodist, Lutheran, and Catholic. The city is also home to a variety of educational institutions, including a public elementary school, a public middle school, and a public high school.
Common Questions
What is Per Capita Income in Mitchellville?
Per Capita income in Mitchellville is $24,639.
What is the Median Family Income in Mitchellville?
Median Family Income in Mitchellville is $92,228.
What is the Median Household income in Mitchellville?
Median Household Income in Mitchellville is $75,278.
What is Income or Wage Gap in Mitchellville?
Income or Wage Gap in Mitchellville is 60.0%.
Women in Mitchellville earn 40.0 cents for every dollar earned by a man.
What is Inequality or Gini Index in Mitchellville?
Inequality or Gini Index in Mitchellville is 0.35.
What is the Total Population of Mitchellville?
Total Population of Mitchellville is 2,506.
What is the Total Male Population of Mitchellville?
Total Male Population of Mitchellville is 867.
What is the Total Female Population of Mitchellville?
Total Female Population of Mitchellville is 1,639.
What is the Ratio of Males per 100 Females in Mitchellville?
There are 52.90 Males per 100 Females in Mitchellville.
What is the Ratio of Females per 100 Males in Mitchellville?
There are 189.04 Females per 100 Males in Mitchellville.
What is the Median Population Age in Mitchellville?
Median Population Age in Mitchellville is 36.8 Years.
What is the Average Family Size in Mitchellville
Average Family Size in Mitchellville is 3.1 People.
What is the Average Household Size in Mitchellville
Average Household Size in Mitchellville is 2.6 People.
How Large is the Labor Force in Mitchellville?
There are 1,018 People in the Labor Forcein in Mitchellville.
What is the Percentage of People in the Labor Force in Mitchellville?
48.2% of People are in the Labor Force in Mitchellville.
What is the Unemployment Rate in Mitchellville?
Unemployment Rate in Mitchellville is 1.0%.