Middle Amana, IA Map & Demographics
Middle Amana Map
Middle Amana Overview
$40,656
PER CAPITA INCOME
$94,320
AVG FAMILY INCOME
$93,503
AVG HOUSEHOLD INCOME
0.31
INEQUALITY / GINI INDEX
578
TOTAL POPULATION
302
MALE POPULATION
276
FEMALE POPULATION
109.42
MALES / 100 FEMALES
91.39
FEMALES / 100 MALES
51.3
MEDIAN AGE
3.3
AVG FAMILY SIZE
2.2
AVG HOUSEHOLD SIZE
272
LABOR FORCE [ PEOPLE ]
55.5%
PERCENT IN LABOR FORCE
Middle Amana Zip Codes
Middle Amana Area Codes
Income in Middle Amana
Income Overview in Middle Amana
Per Capita Income in Middle Amana is $40,656, while median incomes of families and households are $94,320 and $93,503 respectively.
| Characteristic | Number | Measure |
| Per Capita Income | 578 | $40,656 |
| Median Family Income | 121 | $94,320 |
| Mean Family Income | 121 | $119,664 |
| Median Household Income | 239 | $93,503 |
| Mean Household Income | 239 | $94,232 |
| Income Deficit | 121 | $0 |
| Wage / Income Gap (%) | 578 | 0.00% |
| Wage / Income Gap ($) | 578 | 100.00¢ per $1 |
| Gini / Inequality Index | 578 | 0.31 |
Earnings by Sex in Middle Amana
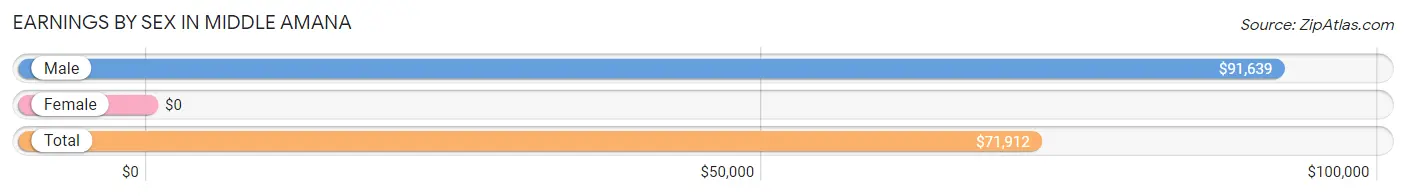
| Sex | Number | Average Earnings |
| Male | 167 (50.3%) | $91,639 |
| Female | 165 (49.7%) | $0 |
| Total | 332 (100.0%) | $71,912 |
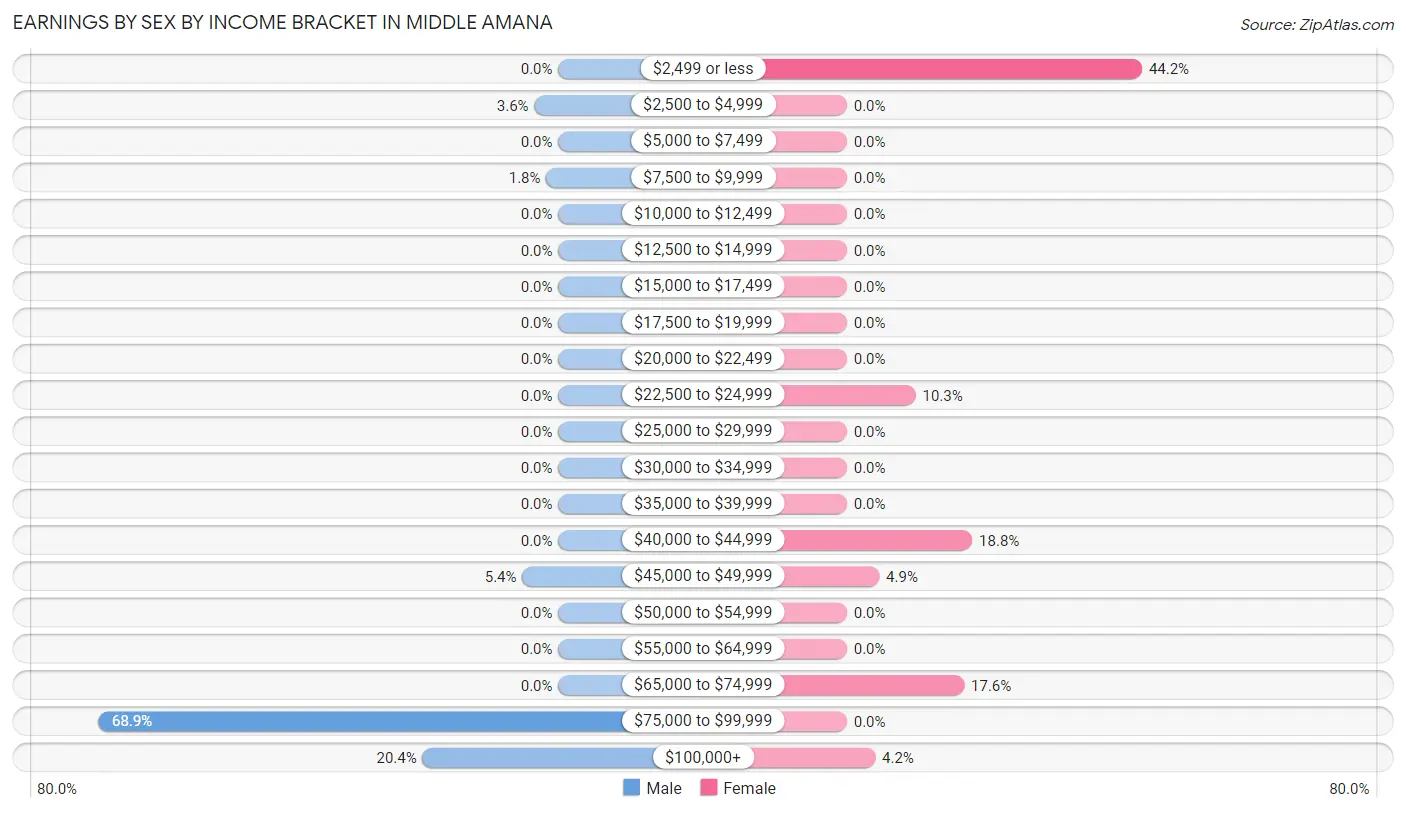
Earnings by Sex by Income Bracket in Middle Amana
The most common earnings brackets in Middle Amana are $75,000 to $99,999 for men (115 | 68.9%) and $2,499 or less for women (73 | 44.2%).
| Income | Male | Female |
| $2,499 or less | 0 (0.0%) | 73 (44.2%) |
| $2,500 to $4,999 | 6 (3.6%) | 0 (0.0%) |
| $5,000 to $7,499 | 0 (0.0%) | 0 (0.0%) |
| $7,500 to $9,999 | 3 (1.8%) | 0 (0.0%) |
| $10,000 to $12,499 | 0 (0.0%) | 0 (0.0%) |
| $12,500 to $14,999 | 0 (0.0%) | 0 (0.0%) |
| $15,000 to $17,499 | 0 (0.0%) | 0 (0.0%) |
| $17,500 to $19,999 | 0 (0.0%) | 0 (0.0%) |
| $20,000 to $22,499 | 0 (0.0%) | 0 (0.0%) |
| $22,500 to $24,999 | 0 (0.0%) | 17 (10.3%) |
| $25,000 to $29,999 | 0 (0.0%) | 0 (0.0%) |
| $30,000 to $34,999 | 0 (0.0%) | 0 (0.0%) |
| $35,000 to $39,999 | 0 (0.0%) | 0 (0.0%) |
| $40,000 to $44,999 | 0 (0.0%) | 31 (18.8%) |
| $45,000 to $49,999 | 9 (5.4%) | 8 (4.9%) |
| $50,000 to $54,999 | 0 (0.0%) | 0 (0.0%) |
| $55,000 to $64,999 | 0 (0.0%) | 0 (0.0%) |
| $65,000 to $74,999 | 0 (0.0%) | 29 (17.6%) |
| $75,000 to $99,999 | 115 (68.9%) | 0 (0.0%) |
| $100,000+ | 34 (20.4%) | 7 (4.2%) |
| Total | 167 (100.0%) | 165 (100.0%) |
Earnings by Sex by Educational Attainment in Middle Amana
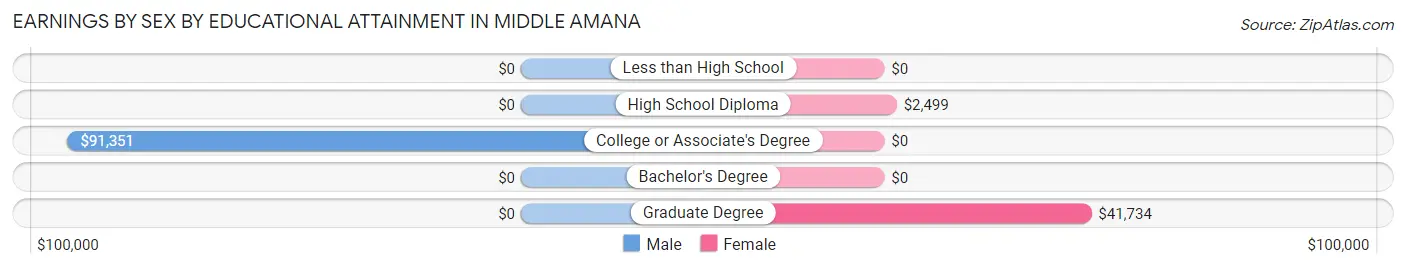
| Educational Attainment | Male Income | Female Income |
| Less than High School | - | - |
| High School Diploma | - | - |
| College or Associate's Degree | $91,351 | $0 |
| Bachelor's Degree | - | - |
| Graduate Degree | - | - |
| Total | $91,791 | $0 |
Family Income in Middle Amana
Family Income Brackets in Middle Amana
According to the Middle Amana family income data, there are 57 families falling into the $75,000 to $99,999 income range, which is the most common income bracket and makes up 47.1% of all families.
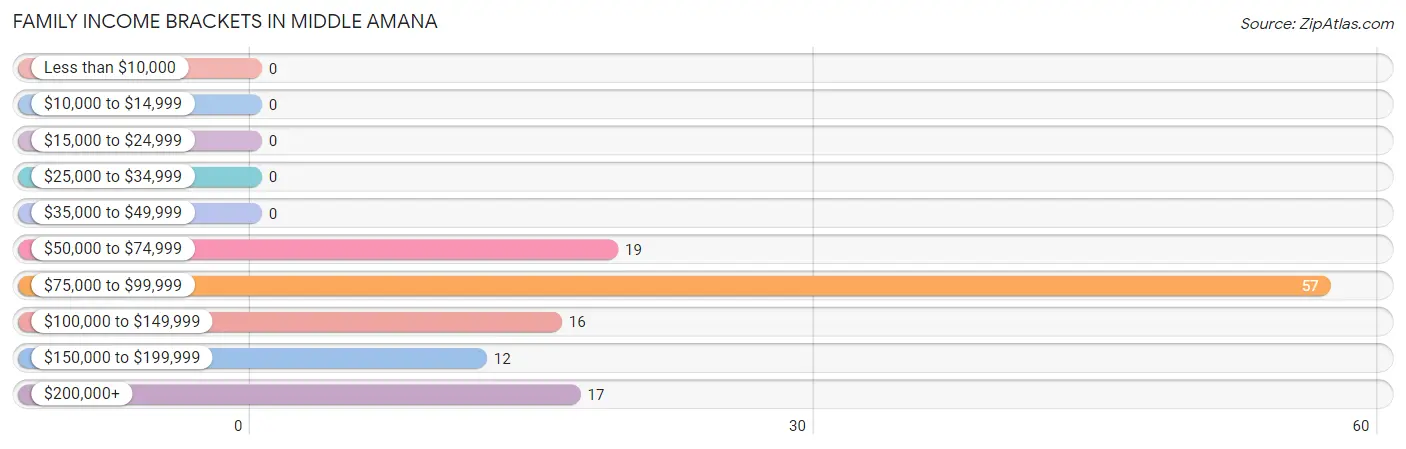
| Income Bracket | # Families | % Families |
| Less than $10,000 | 0 | 0.0% |
| $10,000 to $14,999 | 0 | 0.0% |
| $15,000 to $24,999 | 0 | 0.0% |
| $25,000 to $34,999 | 0 | 0.0% |
| $35,000 to $49,999 | 0 | 0.0% |
| $50,000 to $74,999 | 19 | 15.7% |
| $75,000 to $99,999 | 57 | 47.1% |
| $100,000 to $149,999 | 16 | 13.2% |
| $150,000 to $199,999 | 12 | 9.9% |
| $200,000+ | 17 | 14.0% |
Family Income by Famaliy Size in Middle Amana
4-person families (24 | 19.8%) account for the highest median family income in Middle Amana with $158,333 per family, while 4-person families (24 | 19.8%) have the highest median income of $39,583 per family member.
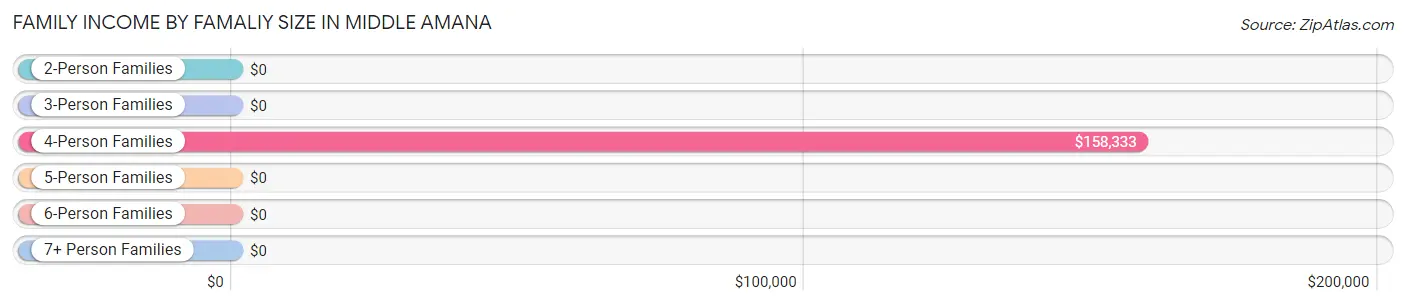
| Income Bracket | # Families | Median Income |
| 2-Person Families | 19 (15.7%) | $0 |
| 3-Person Families | 66 (54.5%) | $0 |
| 4-Person Families | 24 (19.8%) | $158,333 |
| 5-Person Families | 6 (5.0%) | $0 |
| 6-Person Families | 6 (5.0%) | $0 |
| 7+ Person Families | 0 (0.0%) | $0 |
| Total | 121 (100.0%) | $94,320 |
Family Income by Number of Earners in Middle Amana
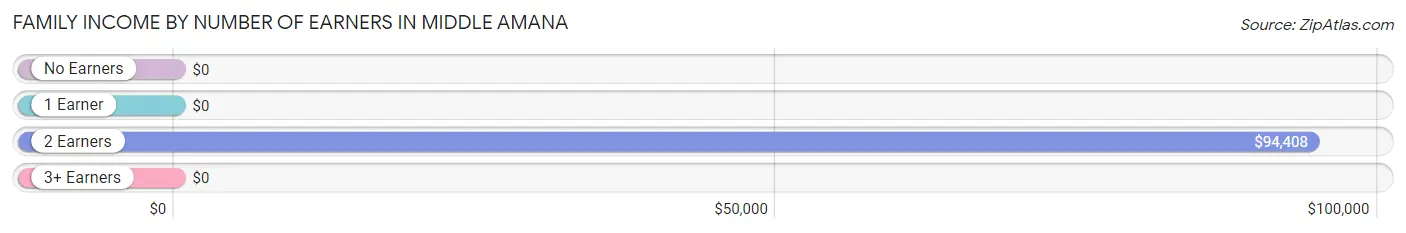
| Number of Earners | # Families | Median Income |
| No Earners | 9 (7.4%) | $0 |
| 1 Earner | 10 (8.3%) | $0 |
| 2 Earners | 87 (71.9%) | $94,408 |
| 3+ Earners | 15 (12.4%) | $0 |
| Total | 121 (100.0%) | $94,320 |
Household Income in Middle Amana
Household Income Brackets in Middle Amana
With 81 households falling in the category, the $75,000 to $99,999 income range is the most frequent in Middle Amana, accounting for 33.9% of all households.
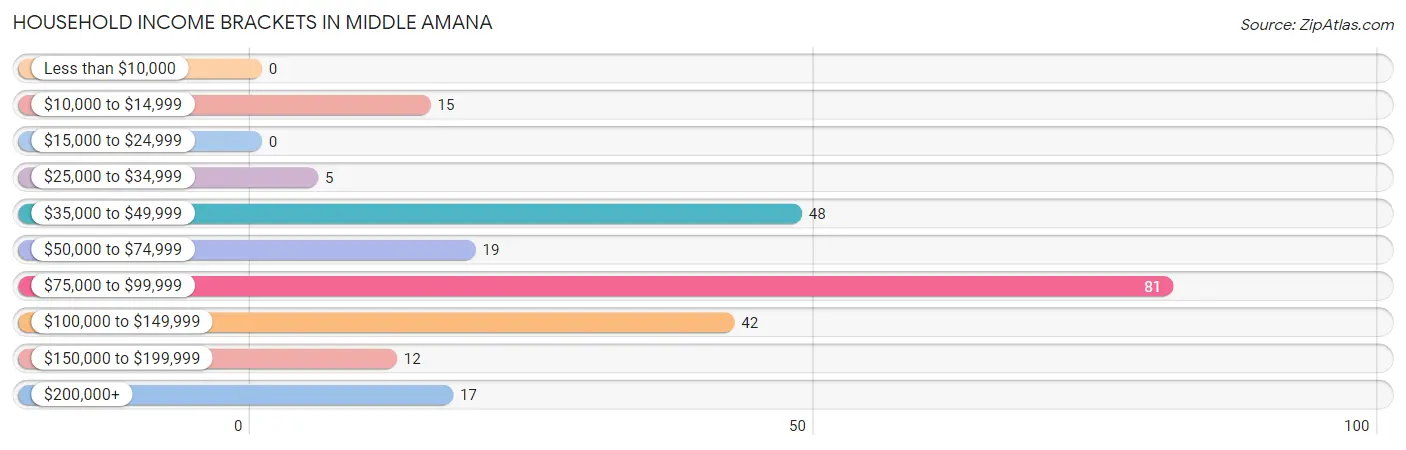
| Income Bracket | # Households | % Households |
| Less than $10,000 | 0 | 0.0% |
| $10,000 to $14,999 | 15 | 6.3% |
| $15,000 to $24,999 | 0 | 0.0% |
| $25,000 to $34,999 | 5 | 2.1% |
| $35,000 to $49,999 | 48 | 20.1% |
| $50,000 to $74,999 | 19 | 7.9% |
| $75,000 to $99,999 | 81 | 33.9% |
| $100,000 to $149,999 | 42 | 17.6% |
| $150,000 to $199,999 | 12 | 5.0% |
| $200,000+ | 17 | 7.1% |
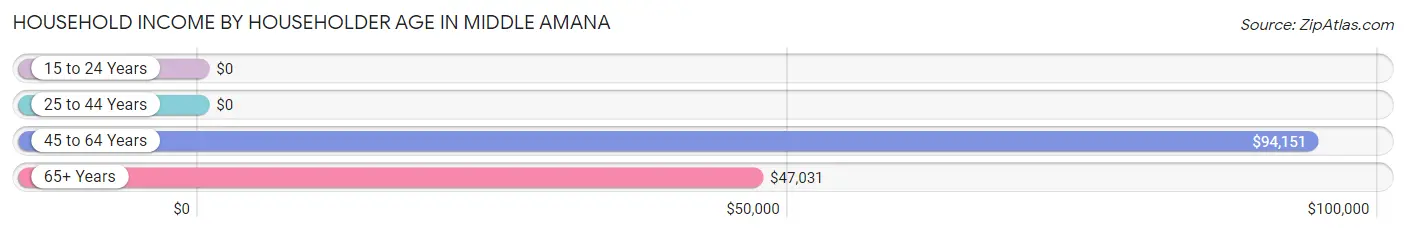
Household Income by Householder Age in Middle Amana
The median household income in Middle Amana is $93,503, with the highest median household income of $94,151 found in the 45 to 64 years age bracket for the primary householder. A total of 125 households (52.3%) fall into this category.
| Income Bracket | # Households | Median Income |
| 15 to 24 Years | 0 (0.0%) | $0 |
| 25 to 44 Years | 61 (25.5%) | $0 |
| 45 to 64 Years | 125 (52.3%) | $94,151 |
| 65+ Years | 53 (22.2%) | $47,031 |
| Total | 239 (100.0%) | $93,503 |
Poverty in Middle Amana
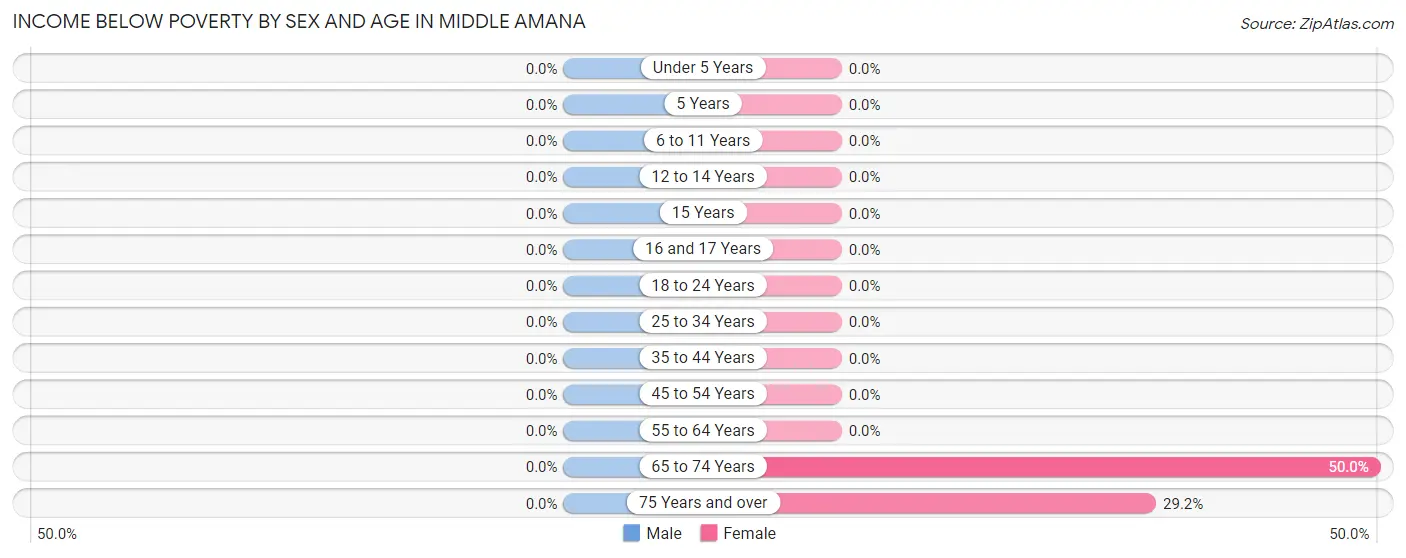
Income Below Poverty by Sex and Age in Middle Amana
| Age Bracket | Male | Female |
| Under 5 Years | 0 (0.0%) | 0 (0.0%) |
| 5 Years | 0 (0.0%) | 0 (0.0%) |
| 6 to 11 Years | 0 (0.0%) | 0 (0.0%) |
| 12 to 14 Years | 0 (0.0%) | 0 (0.0%) |
| 15 Years | 0 (0.0%) | 0 (0.0%) |
| 16 and 17 Years | 0 (0.0%) | 0 (0.0%) |
| 18 to 24 Years | 0 (0.0%) | 0 (0.0%) |
| 25 to 34 Years | 0 (0.0%) | 0 (0.0%) |
| 35 to 44 Years | 0 (0.0%) | 0 (0.0%) |
| 45 to 54 Years | 0 (0.0%) | 0 (0.0%) |
| 55 to 64 Years | 0 (0.0%) | 0 (0.0%) |
| 65 to 74 Years | 0 (0.0%) | 8 (50.0%) |
| 75 Years and over | 0 (0.0%) | 7 (29.2%) |
| Total | 0 (0.0%) | 15 (6.5%) |
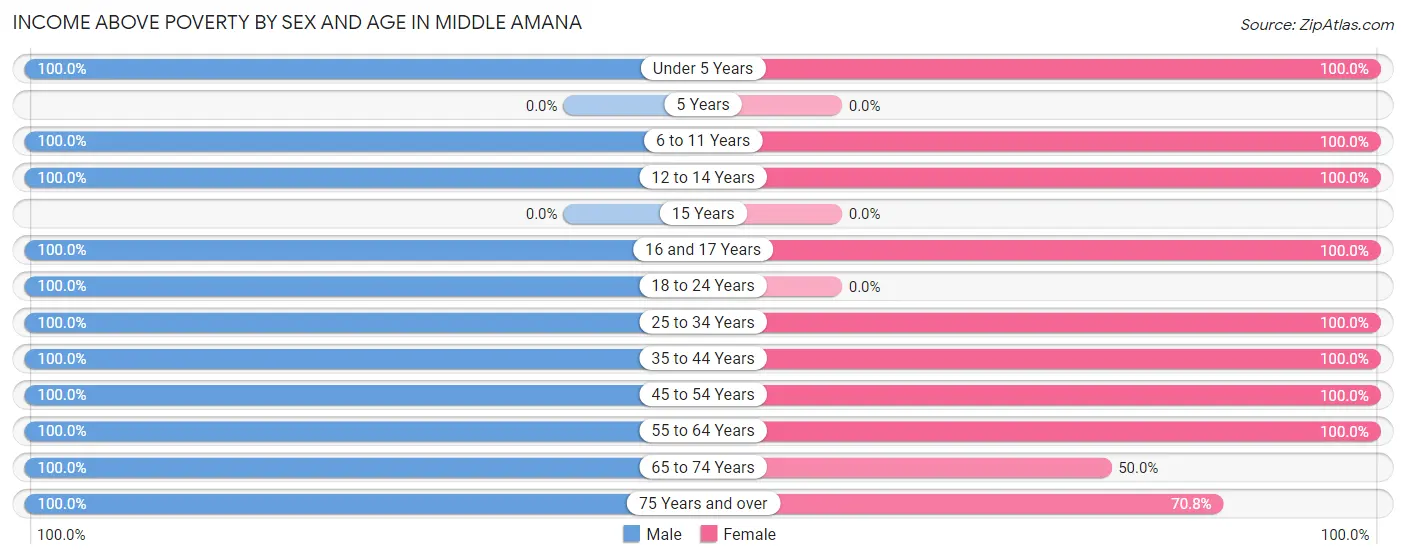
Income Above Poverty by Sex and Age in Middle Amana
According to the poverty statistics in Middle Amana, males aged under 5 years and females aged under 5 years are the age groups that are most secure financially, with 100.0% of males and 100.0% of females in these age groups living above the poverty line.
| Age Bracket | Male | Female |
| Under 5 Years | 12 (100.0%) | 11 (100.0%) |
| 5 Years | 0 (0.0%) | 0 (0.0%) |
| 6 to 11 Years | 21 (100.0%) | 23 (100.0%) |
| 12 to 14 Years | 13 (100.0%) | 8 (100.0%) |
| 15 Years | 0 (0.0%) | 0 (0.0%) |
| 16 and 17 Years | 6 (100.0%) | 11 (100.0%) |
| 18 to 24 Years | 61 (100.0%) | 0 (0.0%) |
| 25 to 34 Years | 6 (100.0%) | 31 (100.0%) |
| 35 to 44 Years | 27 (100.0%) | 29 (100.0%) |
| 45 to 54 Years | 105 (100.0%) | 67 (100.0%) |
| 55 to 64 Years | 20 (100.0%) | 11 (100.0%) |
| 65 to 74 Years | 10 (100.0%) | 8 (50.0%) |
| 75 Years and over | 9 (100.0%) | 17 (70.8%) |
| Total | 290 (100.0%) | 216 (93.5%) |
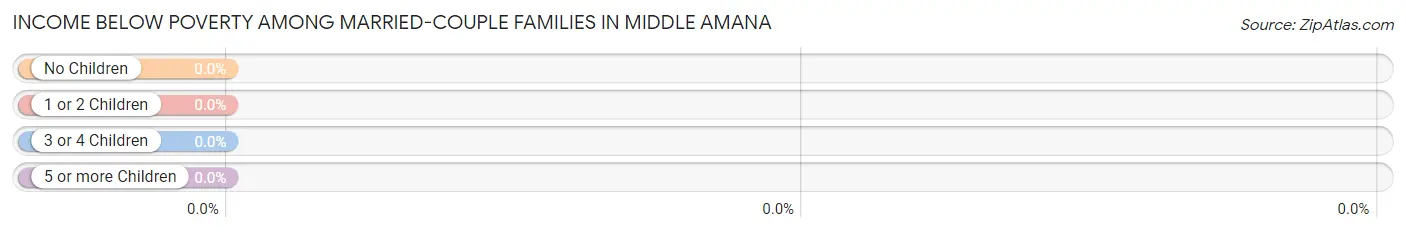
Income Below Poverty Among Married-Couple Families in Middle Amana
| Children | Above Poverty | Below Poverty |
| No Children | 76 (100.0%) | 0 (0.0%) |
| 1 or 2 Children | 33 (100.0%) | 0 (0.0%) |
| 3 or 4 Children | 12 (100.0%) | 0 (0.0%) |
| 5 or more Children | 0 (0.0%) | 0 (0.0%) |
| Total | 121 (100.0%) | 0 (0.0%) |
Income Below Poverty Among Single-Parent Households in Middle Amana
| Children | Single Father | Single Mother |
| No Children | 0 (0.0%) | 0 (0.0%) |
| 1 or 2 Children | 0 (0.0%) | 0 (0.0%) |
| 3 or 4 Children | 0 (0.0%) | 0 (0.0%) |
| 5 or more Children | 0 (0.0%) | 0 (0.0%) |
| Total | 0 (0.0%) | 0 (0.0%) |
Income Below Poverty Among Married-Couple vs Single-Parent Households in Middle Amana
| Children | Married-Couple Families | Single-Parent Households |
| No Children | 0 (0.0%) | 0 (0.0%) |
| 1 or 2 Children | 0 (0.0%) | 0 (0.0%) |
| 3 or 4 Children | 0 (0.0%) | 0 (0.0%) |
| 5 or more Children | 0 (0.0%) | 0 (0.0%) |
| Total | 0 (0.0%) | 0 (0.0%) |
Race in Middle Amana
The most populous races in Middle Amana are White / Caucasian (560 | 96.9%), and Two or more Races (18 | 3.1%).
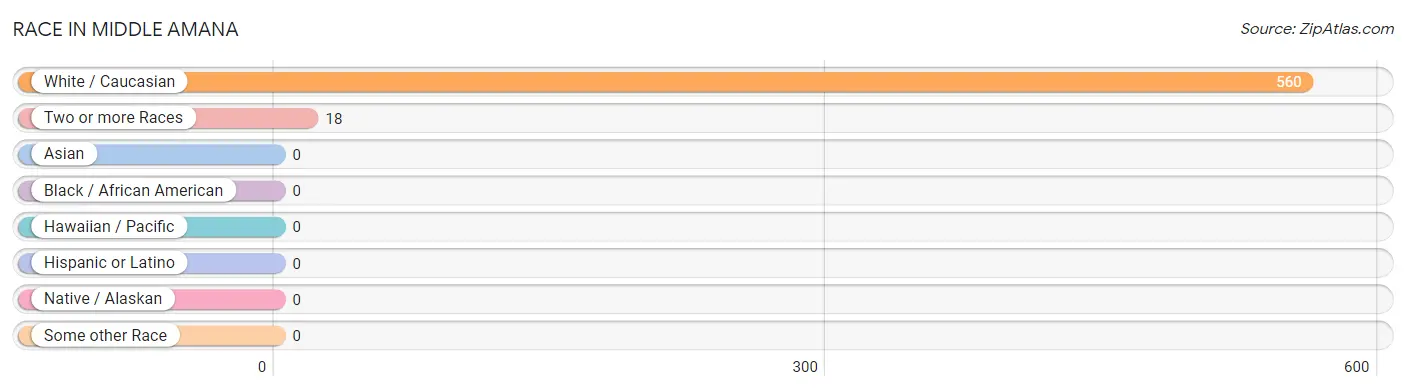
| Race | # Population | % Population |
| Asian | 0 | 0.0% |
| Black / African American | 0 | 0.0% |
| Hawaiian / Pacific | 0 | 0.0% |
| Hispanic or Latino | 0 | 0.0% |
| Native / Alaskan | 0 | 0.0% |
| White / Caucasian | 560 | 96.9% |
| Two or more Races | 18 | 3.1% |
| Some other Race | 0 | 0.0% |
| Total | 578 | 100.0% |
Ancestry in Middle Amana
The most populous ancestries reported in Middle Amana are German (250 | 43.2%), English (39 | 6.8%), Irish (33 | 5.7%), European (24 | 4.2%), and Norwegian (20 | 3.5%), together accounting for 63.3% of all Middle Amana residents.
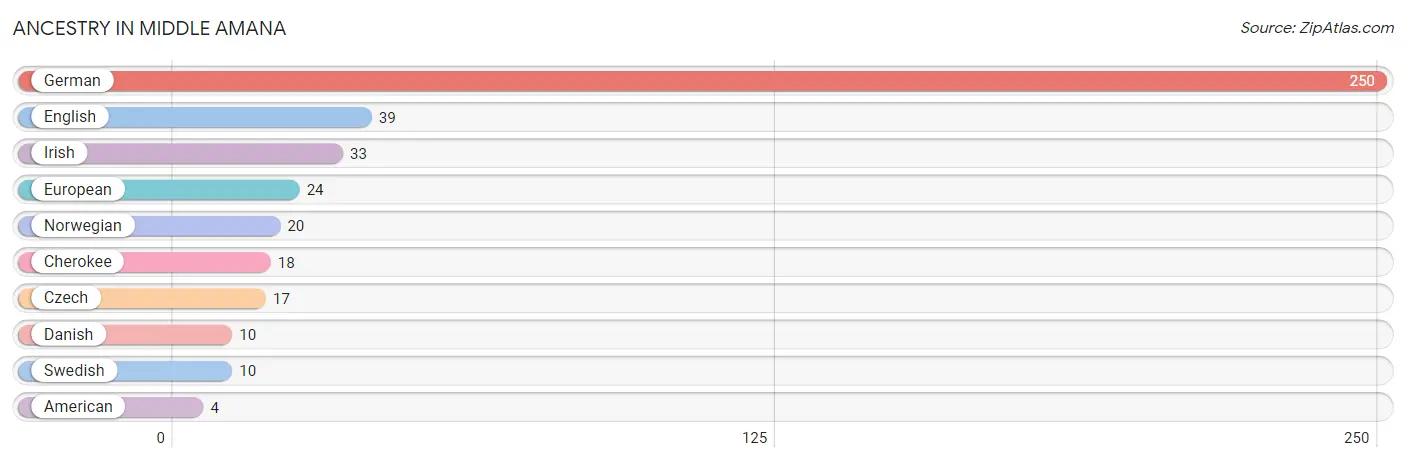
| Ancestry | # Population | % Population |
| American | 4 | 0.7% |
| Cherokee | 18 | 3.1% |
| Czech | 17 | 2.9% |
| Danish | 10 | 1.7% |
| English | 39 | 6.8% |
| European | 24 | 4.2% |
| German | 250 | 43.2% |
| Irish | 33 | 5.7% |
| Norwegian | 20 | 3.5% |
| Swedish | 10 | 1.7% | View All 10 Rows |
Immigrants in Middle Amana

| Immigration Origin | # Population | % Population | View All 0 Rows |
Sex and Age in Middle Amana
Sex and Age in Middle Amana
The most populous age groups in Middle Amana are 50 to 54 Years (90 | 29.8%) for men and 50 to 54 Years (61 | 22.1%) for women.
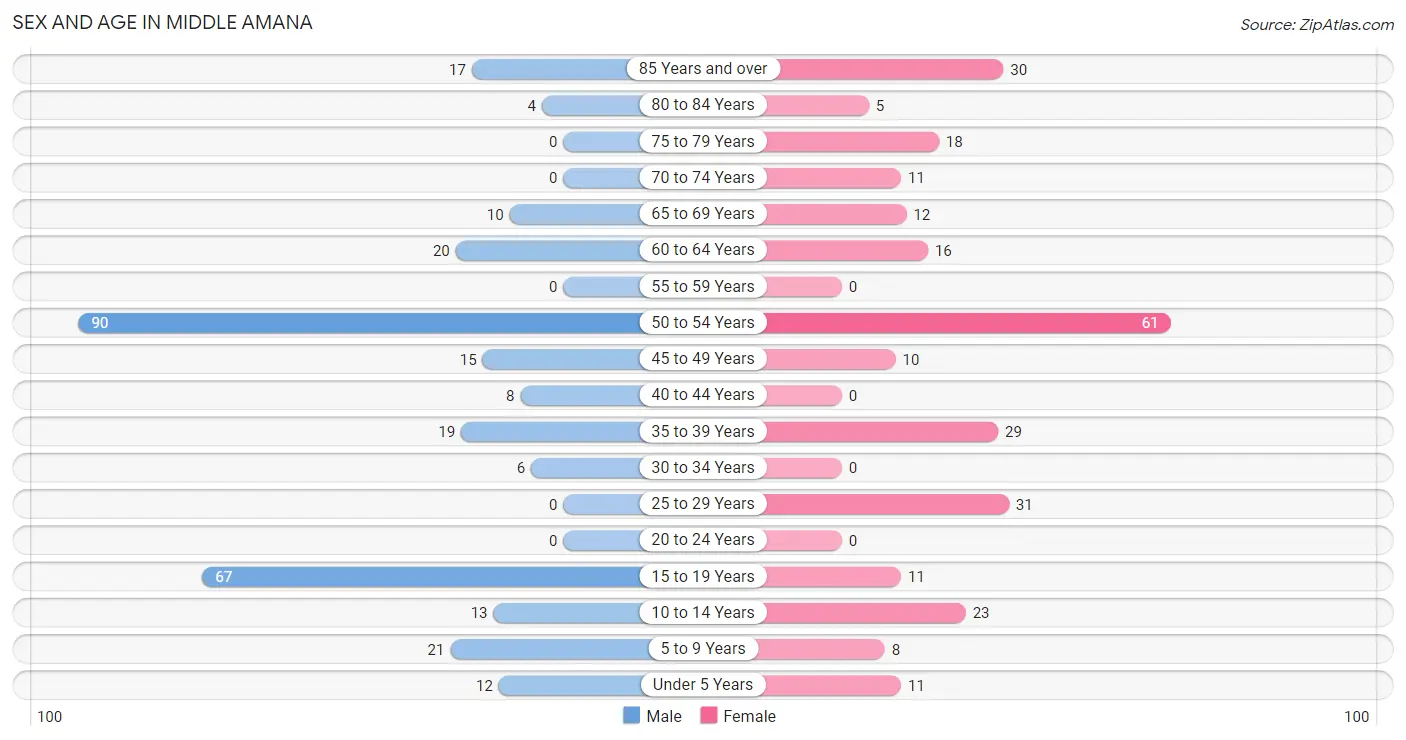
| Age Bracket | Male | Female |
| Under 5 Years | 12 (4.0%) | 11 (4.0%) |
| 5 to 9 Years | 21 (7.0%) | 8 (2.9%) |
| 10 to 14 Years | 13 (4.3%) | 23 (8.3%) |
| 15 to 19 Years | 67 (22.2%) | 11 (4.0%) |
| 20 to 24 Years | 0 (0.0%) | 0 (0.0%) |
| 25 to 29 Years | 0 (0.0%) | 31 (11.2%) |
| 30 to 34 Years | 6 (2.0%) | 0 (0.0%) |
| 35 to 39 Years | 19 (6.3%) | 29 (10.5%) |
| 40 to 44 Years | 8 (2.6%) | 0 (0.0%) |
| 45 to 49 Years | 15 (5.0%) | 10 (3.6%) |
| 50 to 54 Years | 90 (29.8%) | 61 (22.1%) |
| 55 to 59 Years | 0 (0.0%) | 0 (0.0%) |
| 60 to 64 Years | 20 (6.6%) | 16 (5.8%) |
| 65 to 69 Years | 10 (3.3%) | 12 (4.3%) |
| 70 to 74 Years | 0 (0.0%) | 11 (4.0%) |
| 75 to 79 Years | 0 (0.0%) | 18 (6.5%) |
| 80 to 84 Years | 4 (1.3%) | 5 (1.8%) |
| 85 Years and over | 17 (5.6%) | 30 (10.9%) |
| Total | 302 (100.0%) | 276 (100.0%) |
Families and Households in Middle Amana
Median Family Size in Middle Amana
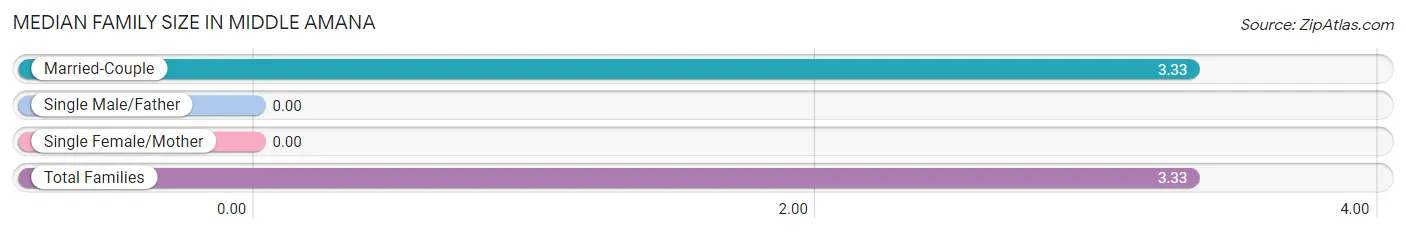
| Family Type | # Families | Family Size |
| Married-Couple | 121 (100.0%) | 3.33 |
| Single Male/Father | 0 (0.0%) | - |
| Single Female/Mother | 0 (0.0%) | - |
| Total Families | 121 (100.0%) | 3.33 |
Median Household Size in Middle Amana
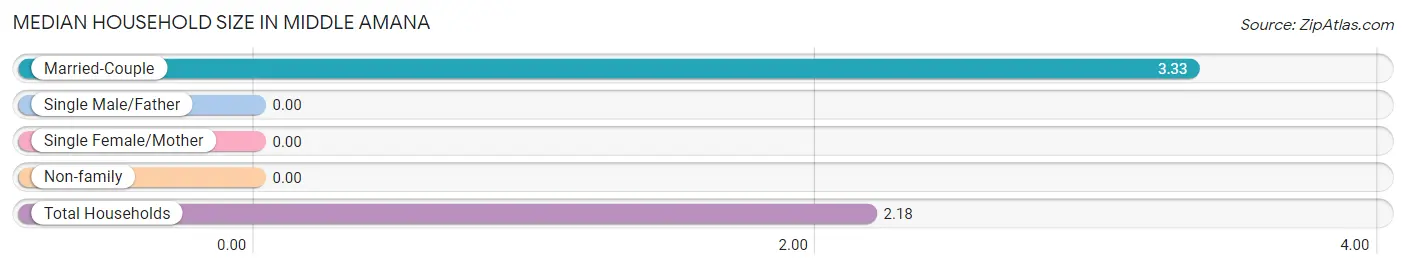
| Household Type | # Households | Household Size |
| Married-Couple | 121 (50.6%) | 3.33 |
| Single Male/Father | 0 (0.0%) | - |
| Single Female/Mother | 0 (0.0%) | - |
| Non-family | 118 (49.4%) | - |
| Total Households | 239 (100.0%) | 2.18 |
Household Size by Marriage Status in Middle Amana
Out of a total of 239 households in Middle Amana, 121 (50.6%) are family households, while 118 (49.4%) are nonfamily households. The most numerous type of family households are 3-person households, comprising 66, and the most common type of nonfamily households are 1-person households, comprising 118.
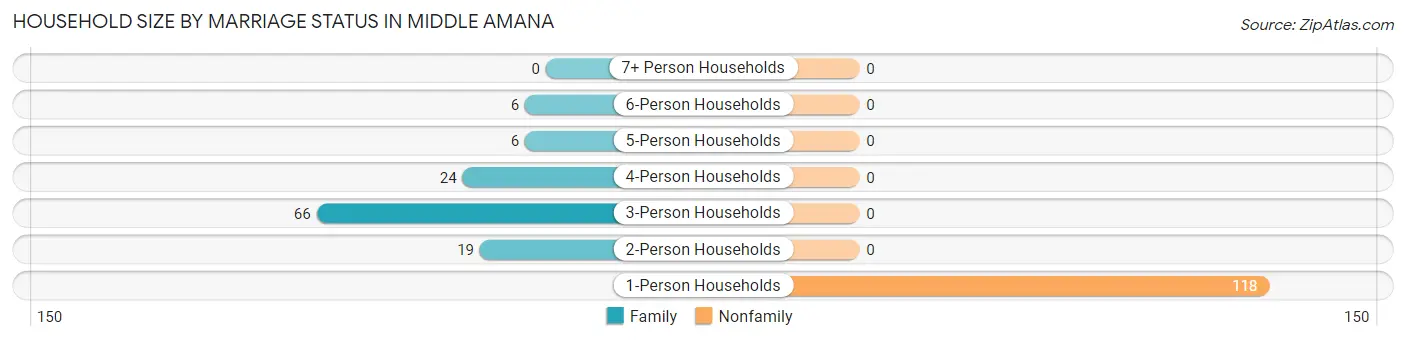
| Household Size | Family Households | Nonfamily Households |
| 1-Person Households | - | 118 (49.4%) |
| 2-Person Households | 19 (8.0%) | 0 (0.0%) |
| 3-Person Households | 66 (27.6%) | 0 (0.0%) |
| 4-Person Households | 24 (10.0%) | 0 (0.0%) |
| 5-Person Households | 6 (2.5%) | 0 (0.0%) |
| 6-Person Households | 6 (2.5%) | 0 (0.0%) |
| 7+ Person Households | 0 (0.0%) | 0 (0.0%) |
| Total | 121 (50.6%) | 118 (49.4%) |
Female Fertility in Middle Amana
Fertility by Age in Middle Amana
| Age Bracket | Women with Births | Births / 1,000 Women |
| 15 to 19 years | 0 (0.0%) | 0.0 |
| 20 to 34 years | 0 (0.0%) | 0.0 |
| 35 to 50 years | 0 (0.0%) | 0.0 |
| Total | 0 (0.0%) | 0.0 |
Fertility by Age by Marriage Status in Middle Amana
| Age Bracket | Married | Unmarried |
| 15 to 19 years | 0 (0.0%) | 0 (0.0%) |
| 20 to 34 years | 0 (0.0%) | 0 (0.0%) |
| 35 to 50 years | 0 (0.0%) | 0 (0.0%) |
| Total | 0 (0.0%) | 0 (0.0%) |
Fertility by Education in Middle Amana
| Educational Attainment | Women with Births | Births / 1,000 Women |
| Less than High School | 0 (0.0%) | 0.0 |
| High School Diploma | 0 (0.0%) | 0.0 |
| College or Associate's Degree | 0 (0.0%) | 0.0 |
| Bachelor's Degree | 0 (0.0%) | 0.0 |
| Graduate Degree | 0 (0.0%) | 0.0 |
| Total | 0 (0.0%) | 0.0 |
Fertility by Education by Marriage Status in Middle Amana
| Educational Attainment | Married | Unmarried |
| Less than High School | 0 (0.0%) | 0 (0.0%) |
| High School Diploma | 0 (0.0%) | 0 (0.0%) |
| College or Associate's Degree | 0 (0.0%) | 0 (0.0%) |
| Bachelor's Degree | 0 (0.0%) | 0 (0.0%) |
| Graduate Degree | 0 (0.0%) | 0 (0.0%) |
| Total | 0 (0.0%) | 0 (0.0%) |
Employment Characteristics in Middle Amana
Employment by Class of Employer in Middle Amana
Among the 272 employed individuals in Middle Amana, private company employees (142 | 52.2%), local government employees (72 | 26.5%), and not-for-profit organizations (46 | 16.9%) make up the most common classes of employment.
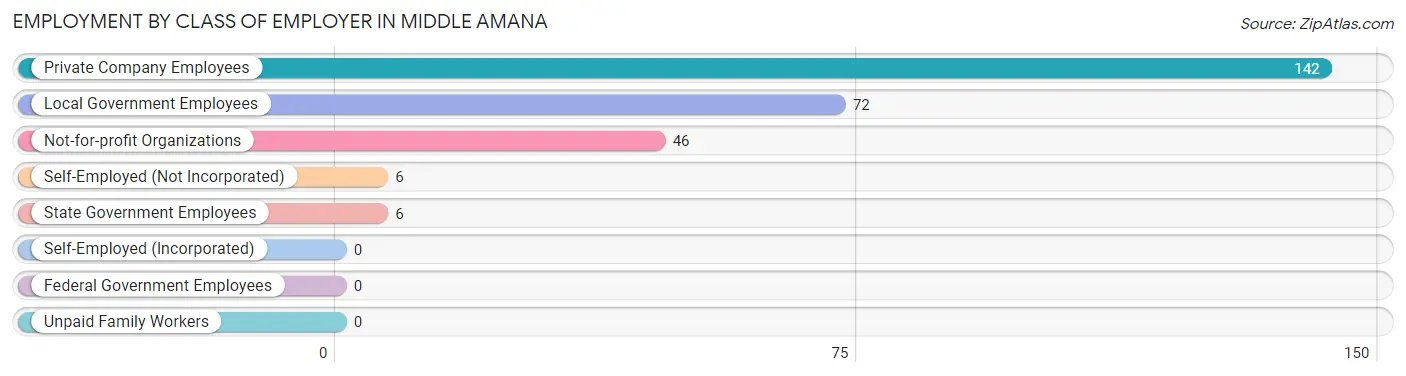
| Employer Class | # Employees | % Employees |
| Private Company Employees | 142 | 52.2% |
| Self-Employed (Incorporated) | 0 | 0.0% |
| Self-Employed (Not Incorporated) | 6 | 2.2% |
| Not-for-profit Organizations | 46 | 16.9% |
| Local Government Employees | 72 | 26.5% |
| State Government Employees | 6 | 2.2% |
| Federal Government Employees | 0 | 0.0% |
| Unpaid Family Workers | 0 | 0.0% |
| Total | 272 | 100.0% |
Employment Status by Age in Middle Amana
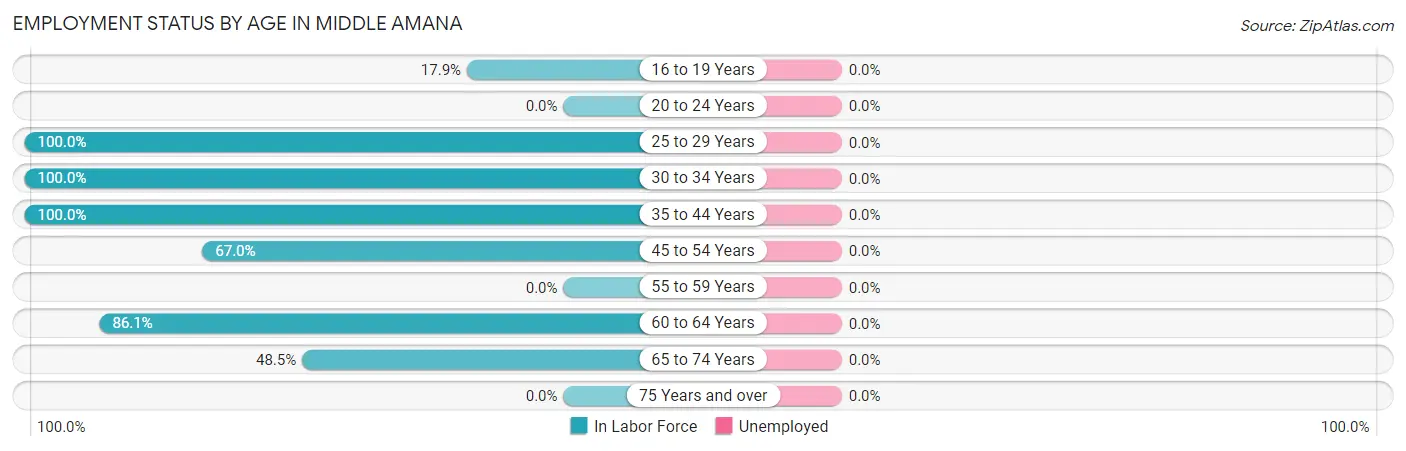
| Age Bracket | In Labor Force | Unemployed |
| 16 to 19 Years | 14 (17.9%) | 0 (0.0%) |
| 20 to 24 Years | 0 (0.0%) | 0 (0.0%) |
| 25 to 29 Years | 31 (100.0%) | 0 (0.0%) |
| 30 to 34 Years | 6 (100.0%) | 0 (0.0%) |
| 35 to 44 Years | 56 (100.0%) | 0 (0.0%) |
| 45 to 54 Years | 118 (67.0%) | 0 (0.0%) |
| 55 to 59 Years | 0 (0.0%) | 0 (0.0%) |
| 60 to 64 Years | 31 (86.1%) | 0 (0.0%) |
| 65 to 74 Years | 16 (48.5%) | 0 (0.0%) |
| 75 Years and over | 0 (0.0%) | 0 (0.0%) |
| Total | 272 (55.5%) | 0 (0.0%) |
Employment Status by Educational Attainment in Middle Amana
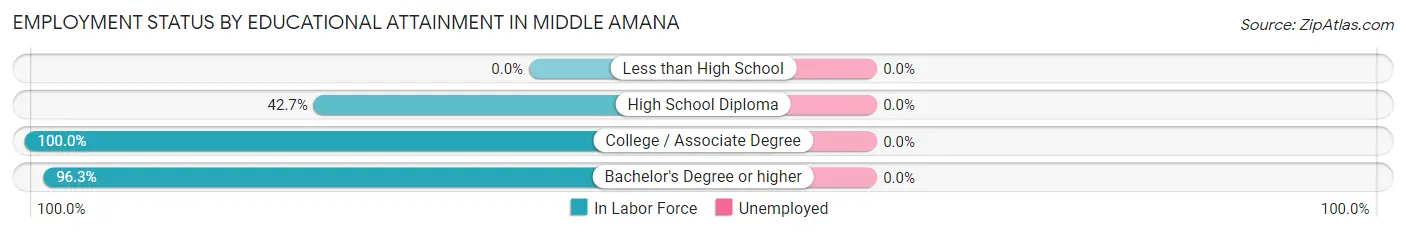
| Educational Attainment | In Labor Force | Unemployed |
| Less than High School | 0 (0.0%) | 0 (0.0%) |
| High School Diploma | 44 (42.7%) | 0 (0.0%) |
| College / Associate Degree | 93 (100.0%) | 0 (0.0%) |
| Bachelor's Degree or higher | 105 (96.3%) | 0 (0.0%) |
| Total | 242 (79.3%) | 0 (0.0%) |
Employment Occupations by Sex in Middle Amana
Management, Business, Science and Arts Occupations
The most common Management, Business, Science and Arts occupations in Middle Amana are Management (66 | 24.3%), Community & Social Service (51 | 18.8%), Education Instruction & Library (43 | 15.8%), Computers, Engineering & Science (20 | 7.3%), and Computers & Mathematics (20 | 7.3%).
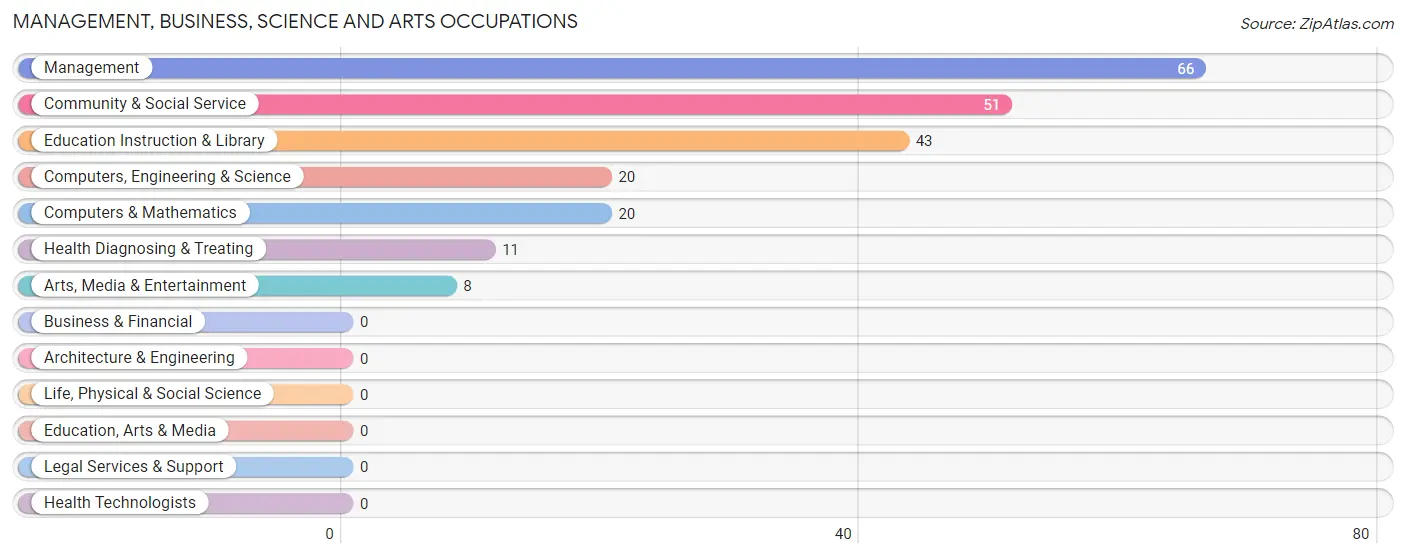
Management, Business, Science and Arts Occupations by Sex
Within the Management, Business, Science and Arts occupations in Middle Amana, the most male-oriented occupations are Management (100.0%), Computers, Engineering & Science (100.0%), and Computers & Mathematics (100.0%), while the most female-oriented occupations are Education Instruction & Library (100.0%), and Community & Social Service (84.3%).
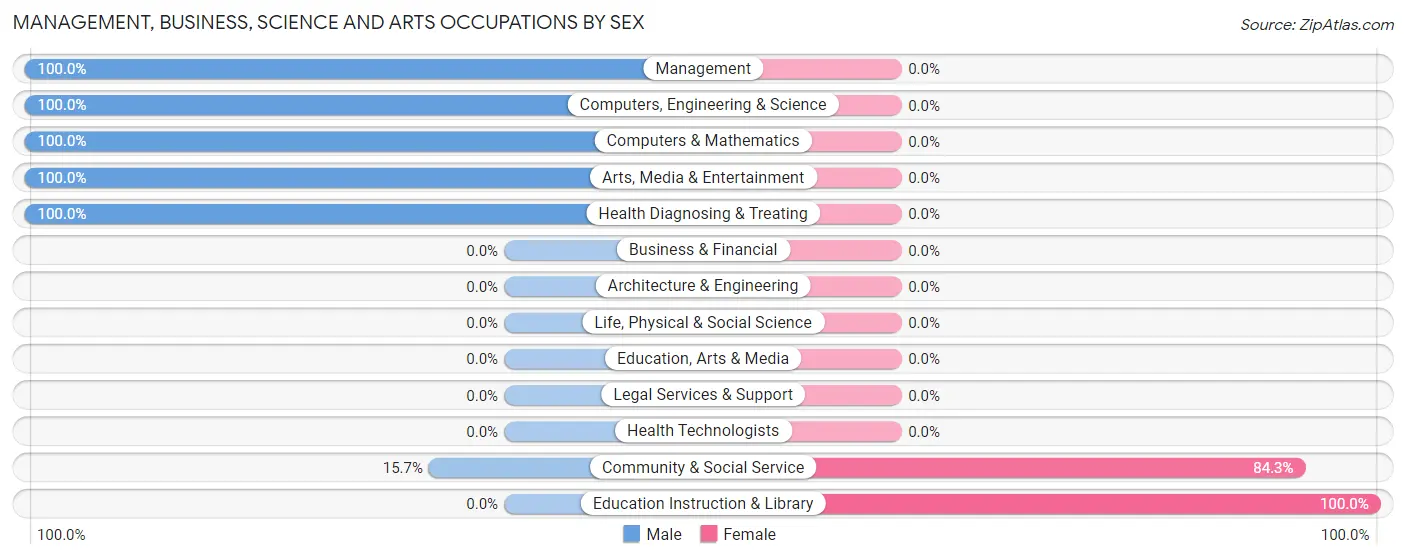
| Occupation | Male | Female |
| Management | 66 (100.0%) | 0 (0.0%) |
| Business & Financial | 0 (0.0%) | 0 (0.0%) |
| Computers, Engineering & Science | 20 (100.0%) | 0 (0.0%) |
| Computers & Mathematics | 20 (100.0%) | 0 (0.0%) |
| Architecture & Engineering | 0 (0.0%) | 0 (0.0%) |
| Life, Physical & Social Science | 0 (0.0%) | 0 (0.0%) |
| Community & Social Service | 8 (15.7%) | 43 (84.3%) |
| Education, Arts & Media | 0 (0.0%) | 0 (0.0%) |
| Legal Services & Support | 0 (0.0%) | 0 (0.0%) |
| Education Instruction & Library | 0 (0.0%) | 43 (100.0%) |
| Arts, Media & Entertainment | 8 (100.0%) | 0 (0.0%) |
| Health Diagnosing & Treating | 11 (100.0%) | 0 (0.0%) |
| Health Technologists | 0 (0.0%) | 0 (0.0%) |
| Total (Category) | 105 (71.0%) | 43 (29.0%) |
| Total (Overall) | 161 (59.2%) | 111 (40.8%) |
Services Occupations
The most common Services occupations in Middle Amana are Personal Care & Service (25 | 9.2%), Security & Protection (10 | 3.7%), and Firefighting & Prevention (10 | 3.7%).
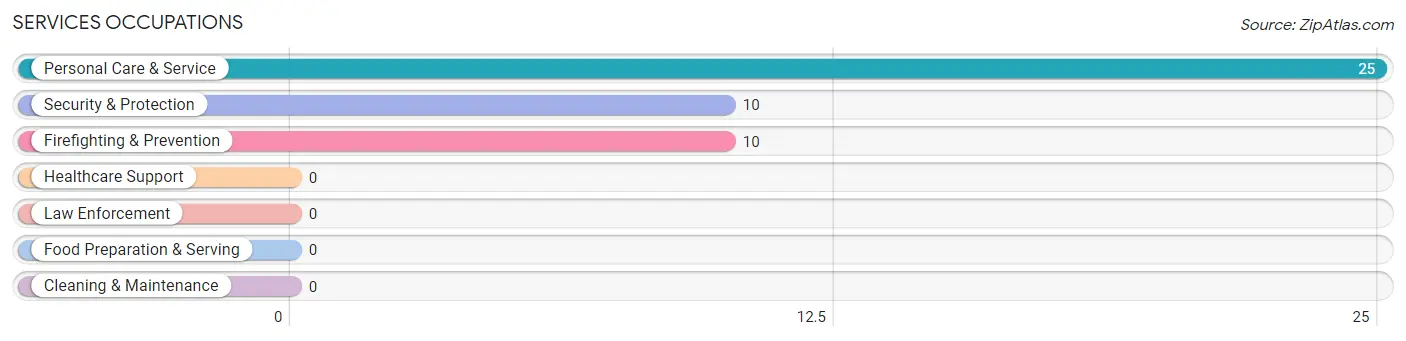
Services Occupations by Sex
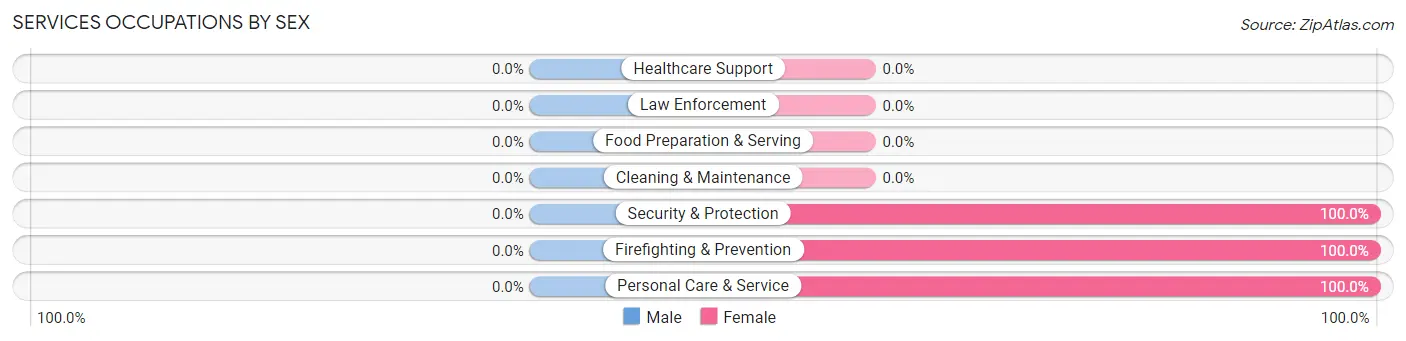
| Occupation | Male | Female |
| Healthcare Support | 0 (0.0%) | 0 (0.0%) |
| Security & Protection | 0 (0.0%) | 10 (100.0%) |
| Firefighting & Prevention | 0 (0.0%) | 10 (100.0%) |
| Law Enforcement | 0 (0.0%) | 0 (0.0%) |
| Food Preparation & Serving | 0 (0.0%) | 0 (0.0%) |
| Cleaning & Maintenance | 0 (0.0%) | 0 (0.0%) |
| Personal Care & Service | 0 (0.0%) | 25 (100.0%) |
| Total (Category) | 0 (0.0%) | 35 (100.0%) |
| Total (Overall) | 161 (59.2%) | 111 (40.8%) |
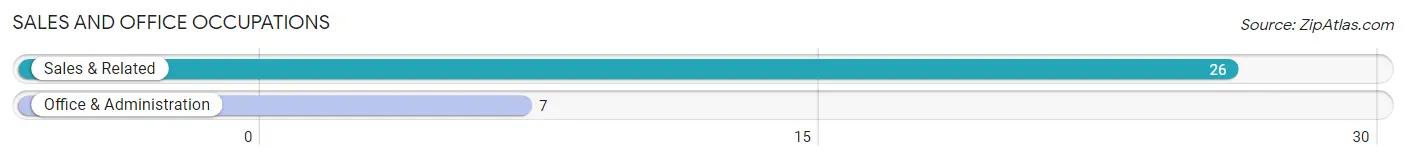
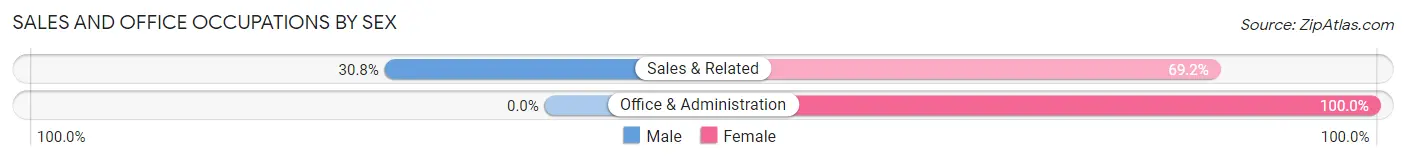
Sales and Office Occupations
The most common Sales and Office occupations in Middle Amana are Sales & Related (26 | 9.6%), and Office & Administration (7 | 2.6%).
Sales and Office Occupations by Sex
| Occupation | Male | Female |
| Sales & Related | 8 (30.8%) | 18 (69.2%) |
| Office & Administration | 0 (0.0%) | 7 (100.0%) |
| Total (Category) | 8 (24.2%) | 25 (75.8%) |
| Total (Overall) | 161 (59.2%) | 111 (40.8%) |
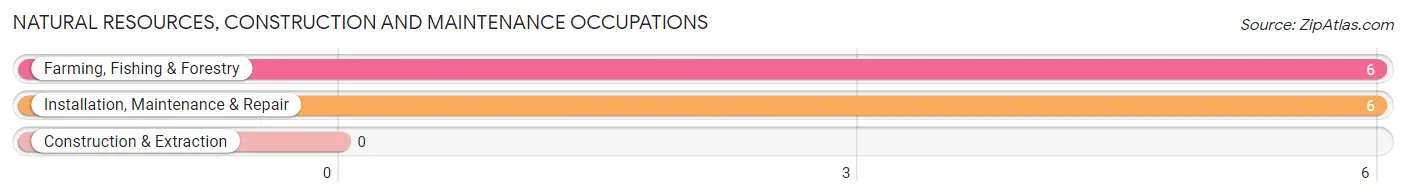
Natural Resources, Construction and Maintenance Occupations
The most common Natural Resources, Construction and Maintenance occupations in Middle Amana are Farming, Fishing & Forestry (6 | 2.2%), and Installation, Maintenance & Repair (6 | 2.2%).
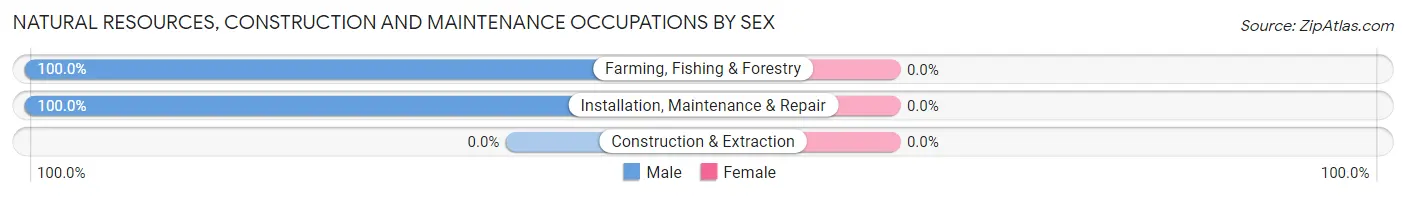
Natural Resources, Construction and Maintenance Occupations by Sex
| Occupation | Male | Female |
| Farming, Fishing & Forestry | 6 (100.0%) | 0 (0.0%) |
| Construction & Extraction | 0 (0.0%) | 0 (0.0%) |
| Installation, Maintenance & Repair | 6 (100.0%) | 0 (0.0%) |
| Total (Category) | 12 (100.0%) | 0 (0.0%) |
| Total (Overall) | 161 (59.2%) | 111 (40.8%) |
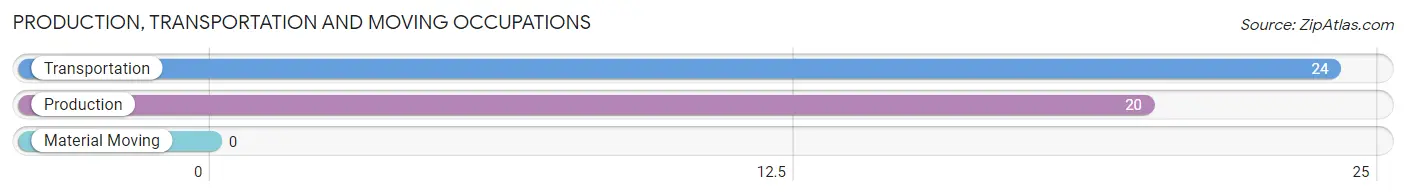
Production, Transportation and Moving Occupations
The most common Production, Transportation and Moving occupations in Middle Amana are Transportation (24 | 8.8%), and Production (20 | 7.3%).
Production, Transportation and Moving Occupations by Sex
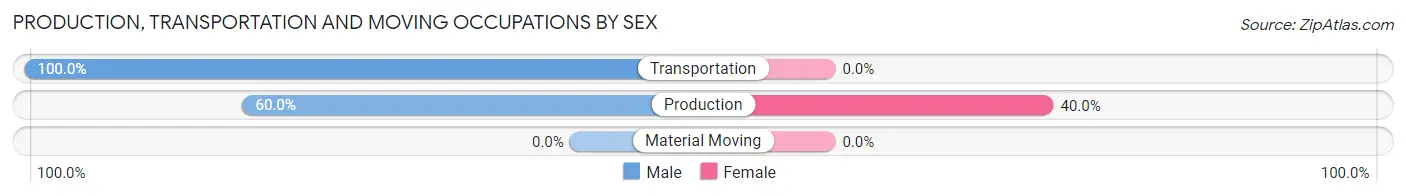
| Occupation | Male | Female |
| Production | 12 (60.0%) | 8 (40.0%) |
| Transportation | 24 (100.0%) | 0 (0.0%) |
| Material Moving | 0 (0.0%) | 0 (0.0%) |
| Total (Category) | 36 (81.8%) | 8 (18.2%) |
| Total (Overall) | 161 (59.2%) | 111 (40.8%) |
Employment Industries by Sex in Middle Amana
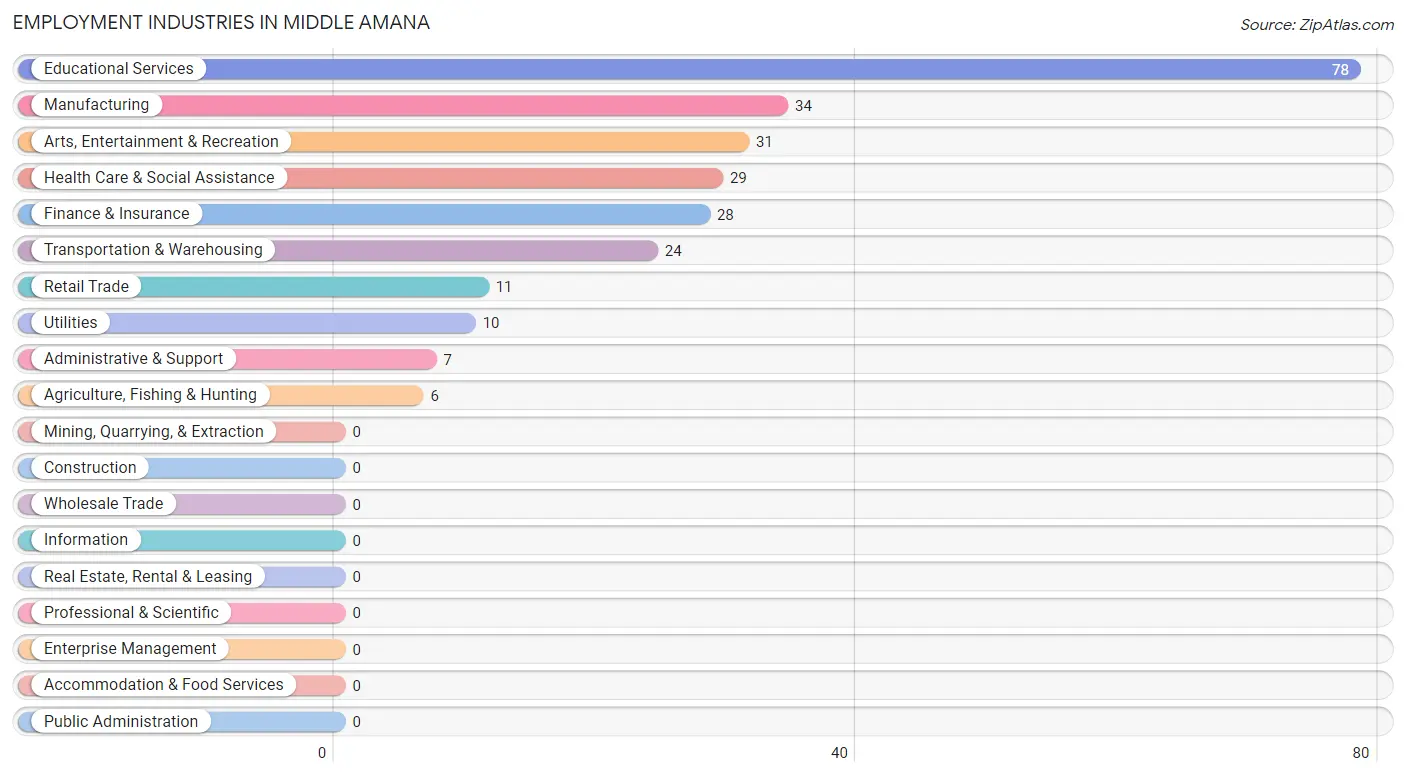
Employment Industries in Middle Amana
The major employment industries in Middle Amana include Educational Services (78 | 28.7%), Manufacturing (34 | 12.5%), Arts, Entertainment & Recreation (31 | 11.4%), Health Care & Social Assistance (29 | 10.7%), and Finance & Insurance (28 | 10.3%).
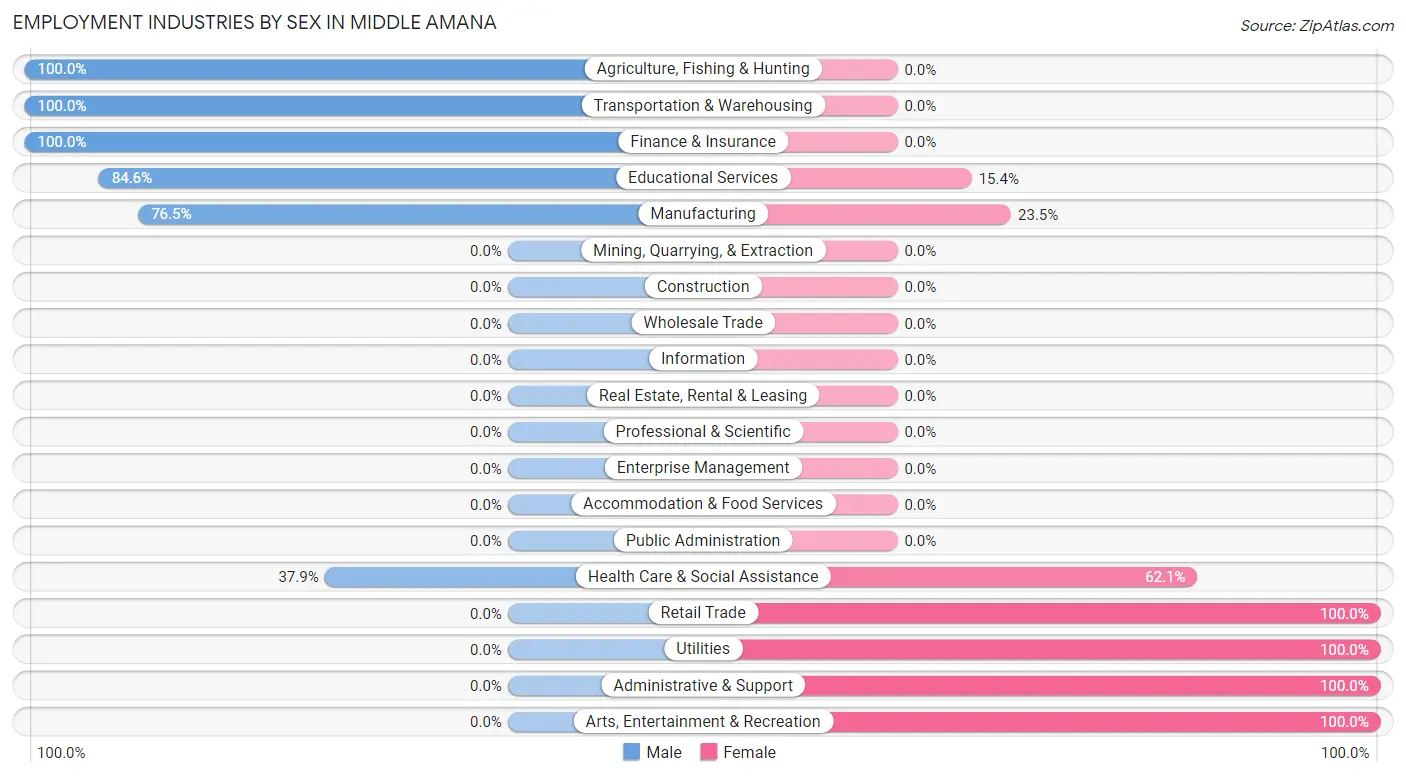
Employment Industries by Sex in Middle Amana
The Middle Amana industries that see more men than women are Agriculture, Fishing & Hunting (100.0%), Transportation & Warehousing (100.0%), and Finance & Insurance (100.0%), whereas the industries that tend to have a higher number of women are Retail Trade (100.0%), Utilities (100.0%), and Administrative & Support (100.0%).
| Industry | Male | Female |
| Agriculture, Fishing & Hunting | 6 (100.0%) | 0 (0.0%) |
| Mining, Quarrying, & Extraction | 0 (0.0%) | 0 (0.0%) |
| Construction | 0 (0.0%) | 0 (0.0%) |
| Manufacturing | 26 (76.5%) | 8 (23.5%) |
| Wholesale Trade | 0 (0.0%) | 0 (0.0%) |
| Retail Trade | 0 (0.0%) | 11 (100.0%) |
| Transportation & Warehousing | 24 (100.0%) | 0 (0.0%) |
| Utilities | 0 (0.0%) | 10 (100.0%) |
| Information | 0 (0.0%) | 0 (0.0%) |
| Finance & Insurance | 28 (100.0%) | 0 (0.0%) |
| Real Estate, Rental & Leasing | 0 (0.0%) | 0 (0.0%) |
| Professional & Scientific | 0 (0.0%) | 0 (0.0%) |
| Enterprise Management | 0 (0.0%) | 0 (0.0%) |
| Administrative & Support | 0 (0.0%) | 7 (100.0%) |
| Educational Services | 66 (84.6%) | 12 (15.4%) |
| Health Care & Social Assistance | 11 (37.9%) | 18 (62.1%) |
| Arts, Entertainment & Recreation | 0 (0.0%) | 31 (100.0%) |
| Accommodation & Food Services | 0 (0.0%) | 0 (0.0%) |
| Public Administration | 0 (0.0%) | 0 (0.0%) |
| Total | 161 (59.2%) | 111 (40.8%) |
Education in Middle Amana
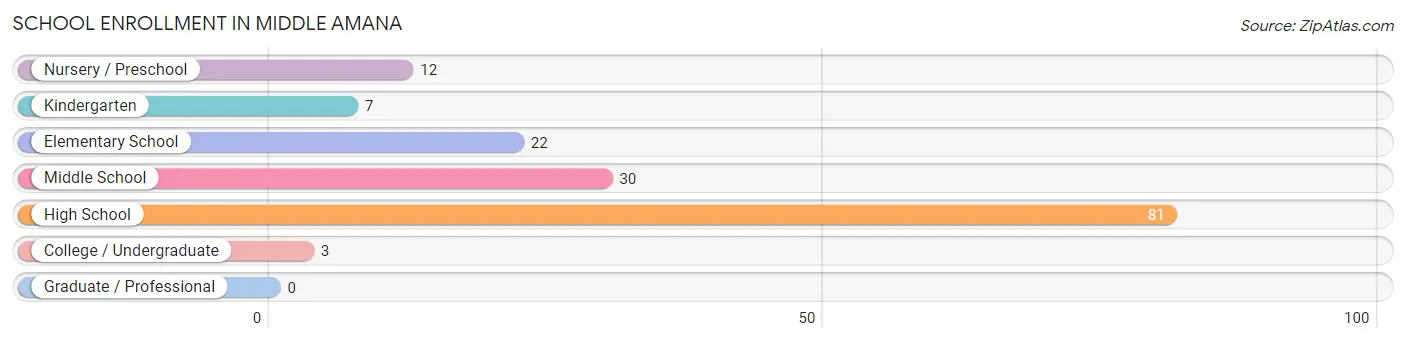
School Enrollment in Middle Amana
The most common levels of schooling among the 155 students in Middle Amana are high school (81 | 52.3%), middle school (30 | 19.4%), and elementary school (22 | 14.2%).
| School Level | # Students | % Students |
| Nursery / Preschool | 12 | 7.7% |
| Kindergarten | 7 | 4.5% |
| Elementary School | 22 | 14.2% |
| Middle School | 30 | 19.4% |
| High School | 81 | 52.3% |
| College / Undergraduate | 3 | 1.9% |
| Graduate / Professional | 0 | 0.0% |
| Total | 155 | 100.0% |
School Enrollment by Age by Funding Source in Middle Amana
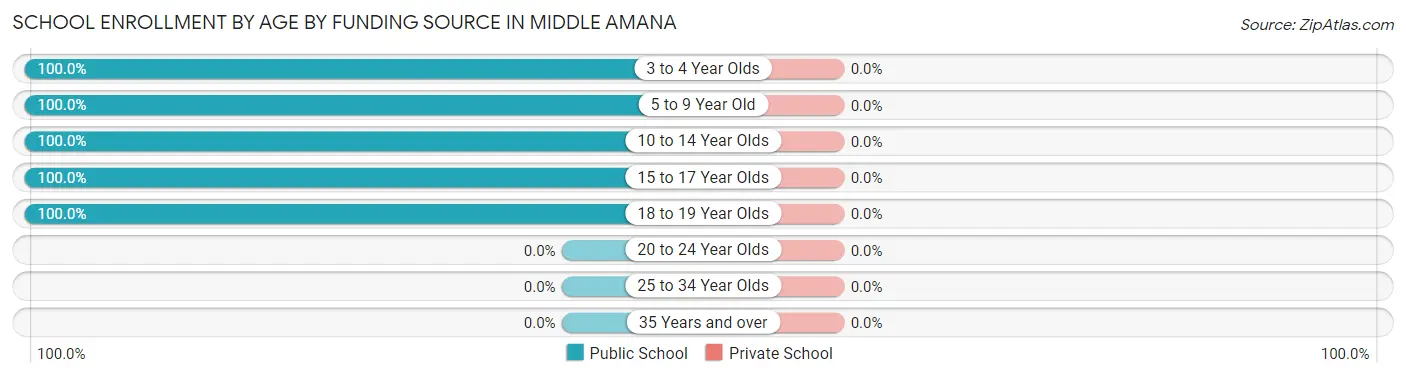
| Age Bracket | Public School | Private School |
| 3 to 4 Year Olds | 12 (100.0%) | 0 (0.0%) |
| 5 to 9 Year Old | 29 (100.0%) | 0 (0.0%) |
| 10 to 14 Year Olds | 36 (100.0%) | 0 (0.0%) |
| 15 to 17 Year Olds | 17 (100.0%) | 0 (0.0%) |
| 18 to 19 Year Olds | 61 (100.0%) | 0 (0.0%) |
| 20 to 24 Year Olds | 0 (0.0%) | 0 (0.0%) |
| 25 to 34 Year Olds | 0 (0.0%) | 0 (0.0%) |
| 35 Years and over | 0 (0.0%) | 0 (0.0%) |
| Total | 155 (100.0%) | 0 (0.0%) |
Educational Attainment by Field of Study in Middle Amana
Liberal arts & history (35 | 19.9%), social sciences (31 | 17.6%), business (30 | 17.1%), education (30 | 17.1%), and computers & mathematics (28 | 15.9%) are the most common fields of study among 176 individuals in Middle Amana who have obtained a bachelor's degree or higher.
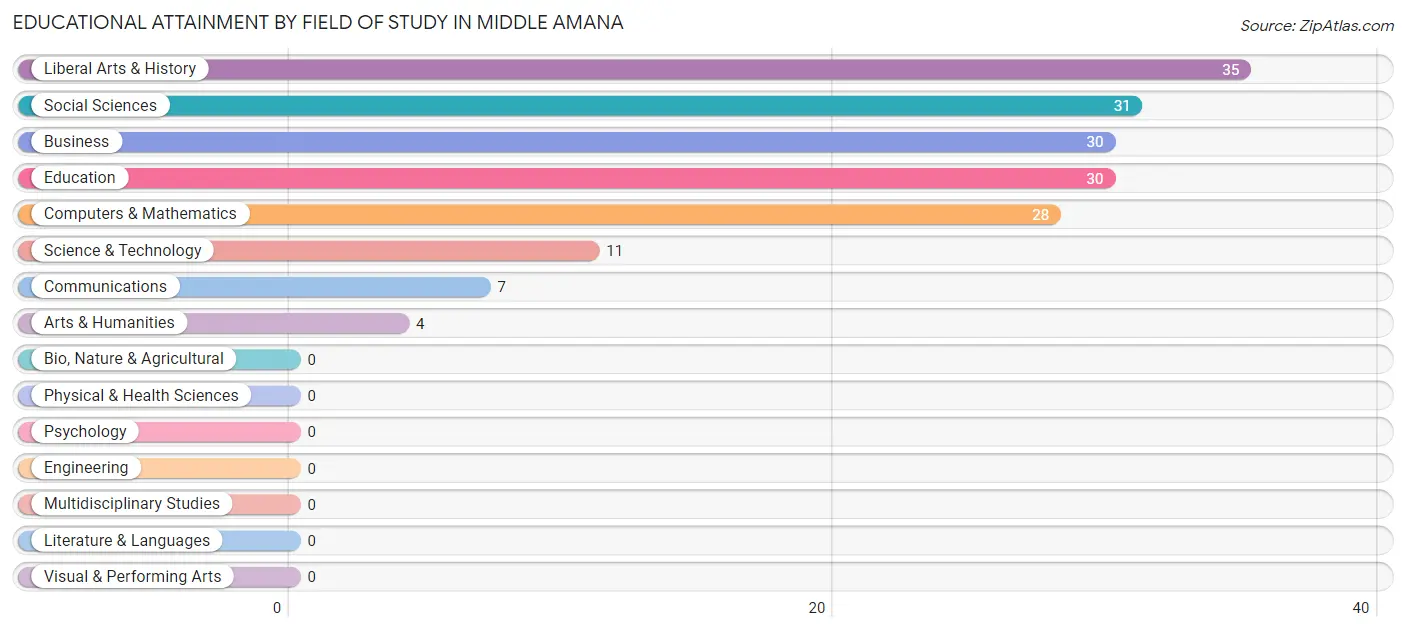
| Field of Study | # Graduates | % Graduates |
| Computers & Mathematics | 28 | 15.9% |
| Bio, Nature & Agricultural | 0 | 0.0% |
| Physical & Health Sciences | 0 | 0.0% |
| Psychology | 0 | 0.0% |
| Social Sciences | 31 | 17.6% |
| Engineering | 0 | 0.0% |
| Multidisciplinary Studies | 0 | 0.0% |
| Science & Technology | 11 | 6.2% |
| Business | 30 | 17.1% |
| Education | 30 | 17.1% |
| Literature & Languages | 0 | 0.0% |
| Liberal Arts & History | 35 | 19.9% |
| Visual & Performing Arts | 0 | 0.0% |
| Communications | 7 | 4.0% |
| Arts & Humanities | 4 | 2.3% |
| Total | 176 | 100.0% |
Transportation & Commute in Middle Amana
Vehicle Availability by Sex in Middle Amana
The most prevalent vehicle ownership categories in Middle Amana are males with 3 vehicles (72, accounting for 44.7%) and females with 3 vehicles (24, making up 64.9%).
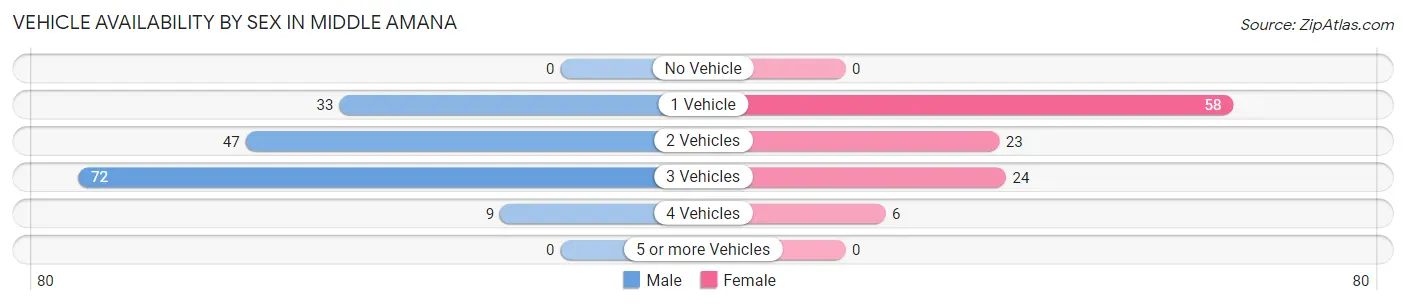
| Vehicles Available | Male | Female |
| No Vehicle | 0 (0.0%) | 0 (0.0%) |
| 1 Vehicle | 33 (20.5%) | 58 (52.2%) |
| 2 Vehicles | 47 (29.2%) | 23 (20.7%) |
| 3 Vehicles | 72 (44.7%) | 24 (21.6%) |
| 4 Vehicles | 9 (5.6%) | 6 (5.4%) |
| 5 or more Vehicles | 0 (0.0%) | 0 (0.0%) |
| Total | 161 (100.0%) | 111 (100.0%) |
Commute Time in Middle Amana
The most frequently occuring commute durations in Middle Amana are 10 to 14 minutes (75 commuters, 28.4%), 5 to 9 minutes (68 commuters, 25.8%), and 25 to 29 minutes (43 commuters, 16.3%).
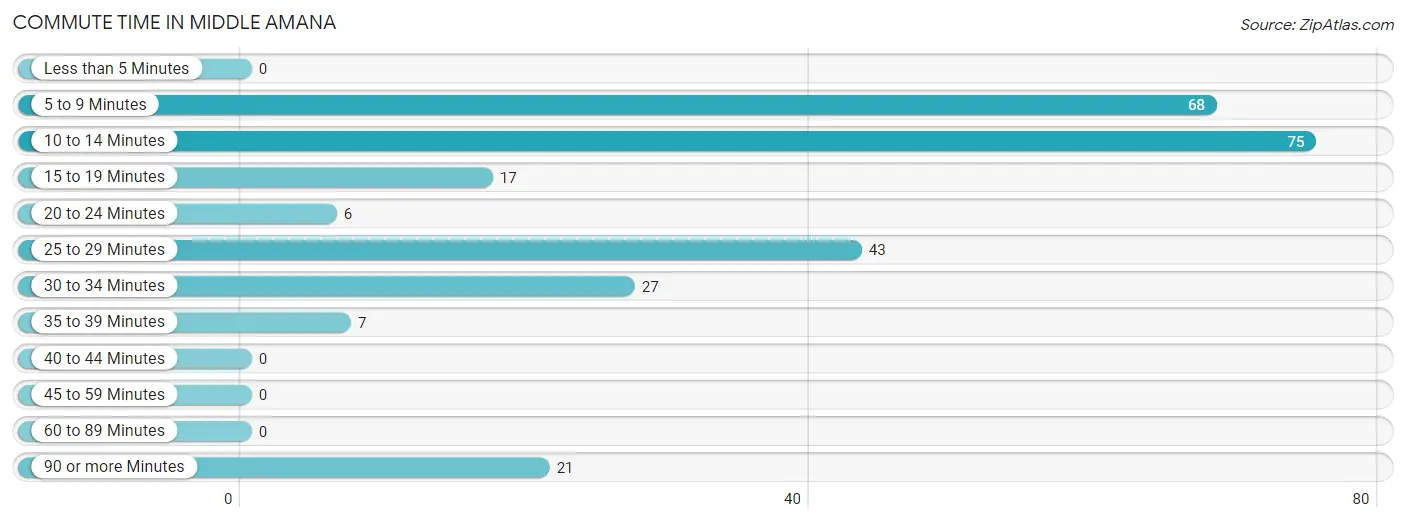
| Commute Time | # Commuters | % Commuters |
| Less than 5 Minutes | 0 | 0.0% |
| 5 to 9 Minutes | 68 | 25.8% |
| 10 to 14 Minutes | 75 | 28.4% |
| 15 to 19 Minutes | 17 | 6.4% |
| 20 to 24 Minutes | 6 | 2.3% |
| 25 to 29 Minutes | 43 | 16.3% |
| 30 to 34 Minutes | 27 | 10.2% |
| 35 to 39 Minutes | 7 | 2.6% |
| 40 to 44 Minutes | 0 | 0.0% |
| 45 to 59 Minutes | 0 | 0.0% |
| 60 to 89 Minutes | 0 | 0.0% |
| 90 or more Minutes | 21 | 8.0% |
Commute Time by Sex in Middle Amana
The most common commute times in Middle Amana are 10 to 14 minutes (75 commuters, 49.0%) for males and 5 to 9 minutes (62 commuters, 55.9%) for females.
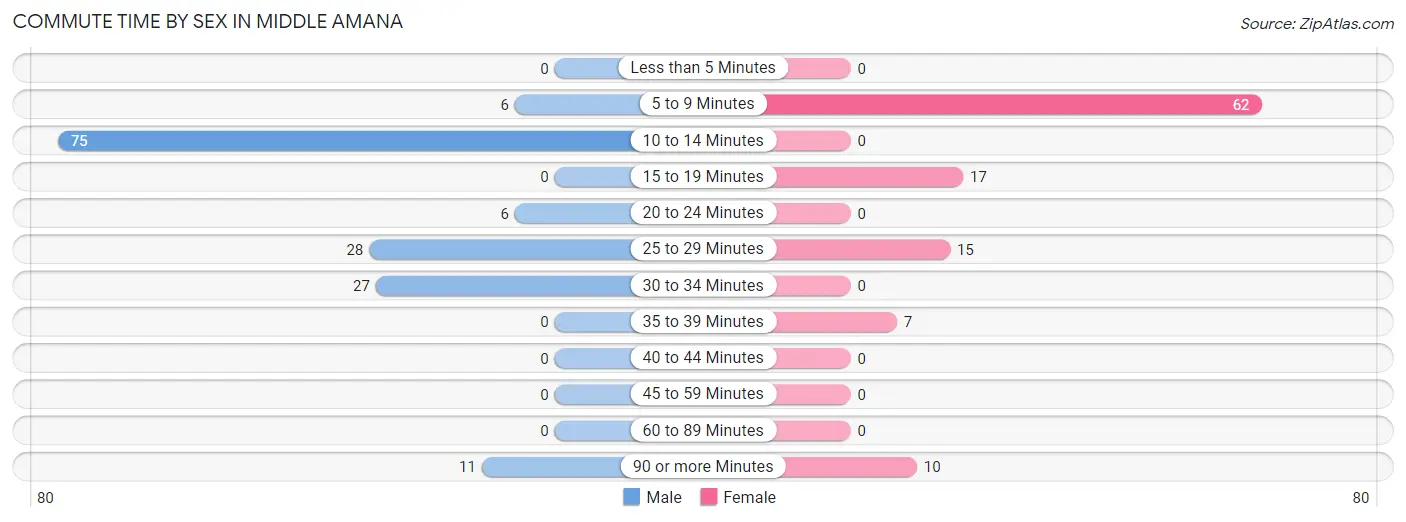
| Commute Time | Male | Female |
| Less than 5 Minutes | 0 (0.0%) | 0 (0.0%) |
| 5 to 9 Minutes | 6 (3.9%) | 62 (55.9%) |
| 10 to 14 Minutes | 75 (49.0%) | 0 (0.0%) |
| 15 to 19 Minutes | 0 (0.0%) | 17 (15.3%) |
| 20 to 24 Minutes | 6 (3.9%) | 0 (0.0%) |
| 25 to 29 Minutes | 28 (18.3%) | 15 (13.5%) |
| 30 to 34 Minutes | 27 (17.6%) | 0 (0.0%) |
| 35 to 39 Minutes | 0 (0.0%) | 7 (6.3%) |
| 40 to 44 Minutes | 0 (0.0%) | 0 (0.0%) |
| 45 to 59 Minutes | 0 (0.0%) | 0 (0.0%) |
| 60 to 89 Minutes | 0 (0.0%) | 0 (0.0%) |
| 90 or more Minutes | 11 (7.2%) | 10 (9.0%) |
Time of Departure to Work by Sex in Middle Amana
The most frequent times of departure to work in Middle Amana are 8:00 AM to 8:29 AM (77, 50.3%) for males and 9:00 AM to 9:59 AM (39, 35.1%) for females.
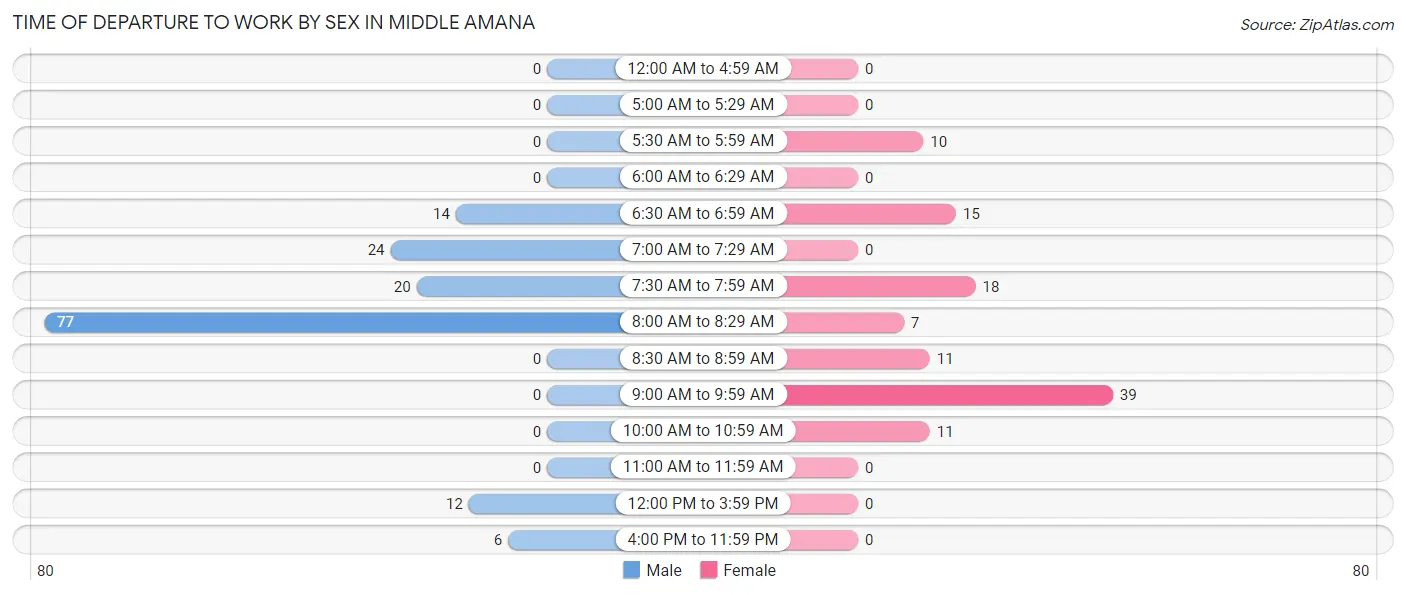
| Time of Departure | Male | Female |
| 12:00 AM to 4:59 AM | 0 (0.0%) | 0 (0.0%) |
| 5:00 AM to 5:29 AM | 0 (0.0%) | 0 (0.0%) |
| 5:30 AM to 5:59 AM | 0 (0.0%) | 10 (9.0%) |
| 6:00 AM to 6:29 AM | 0 (0.0%) | 0 (0.0%) |
| 6:30 AM to 6:59 AM | 14 (9.1%) | 15 (13.5%) |
| 7:00 AM to 7:29 AM | 24 (15.7%) | 0 (0.0%) |
| 7:30 AM to 7:59 AM | 20 (13.1%) | 18 (16.2%) |
| 8:00 AM to 8:29 AM | 77 (50.3%) | 7 (6.3%) |
| 8:30 AM to 8:59 AM | 0 (0.0%) | 11 (9.9%) |
| 9:00 AM to 9:59 AM | 0 (0.0%) | 39 (35.1%) |
| 10:00 AM to 10:59 AM | 0 (0.0%) | 11 (9.9%) |
| 11:00 AM to 11:59 AM | 0 (0.0%) | 0 (0.0%) |
| 12:00 PM to 3:59 PM | 12 (7.8%) | 0 (0.0%) |
| 4:00 PM to 11:59 PM | 6 (3.9%) | 0 (0.0%) |
| Total | 153 (100.0%) | 111 (100.0%) |
Housing Occupancy in Middle Amana
Occupancy by Ownership in Middle Amana
Of the total 239 dwellings in Middle Amana, owner-occupied units account for 167 (69.9%), while renter-occupied units make up 72 (30.1%).
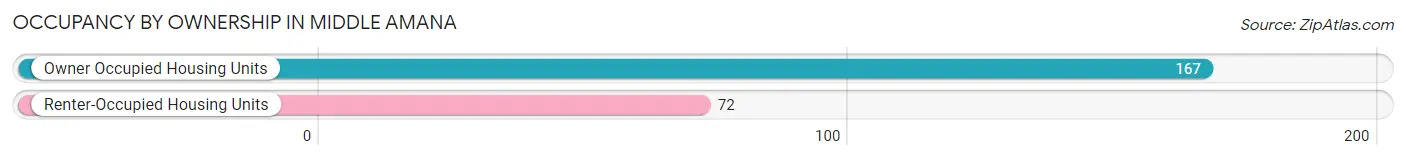
| Occupancy | # Housing Units | % Housing Units |
| Owner Occupied Housing Units | 167 | 69.9% |
| Renter-Occupied Housing Units | 72 | 30.1% |
| Total Occupied Housing Units | 239 | 100.0% |
Occupancy by Household Size in Middle Amana
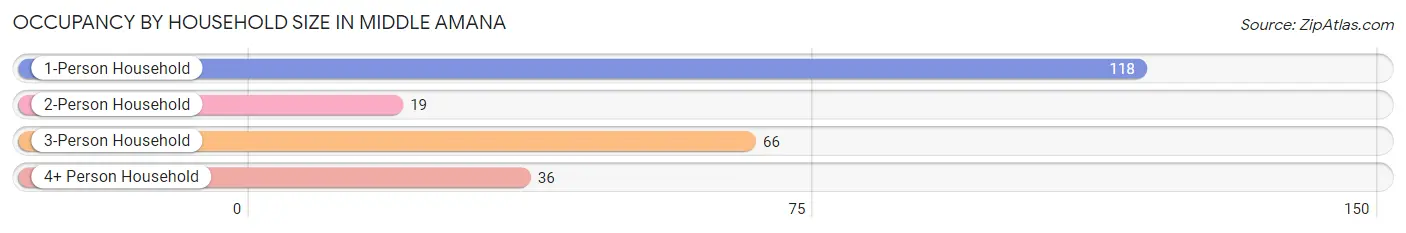
| Household Size | # Housing Units | % Housing Units |
| 1-Person Household | 118 | 49.4% |
| 2-Person Household | 19 | 8.0% |
| 3-Person Household | 66 | 27.6% |
| 4+ Person Household | 36 | 15.1% |
| Total Housing Units | 239 | 100.0% |
Occupancy by Ownership by Household Size in Middle Amana
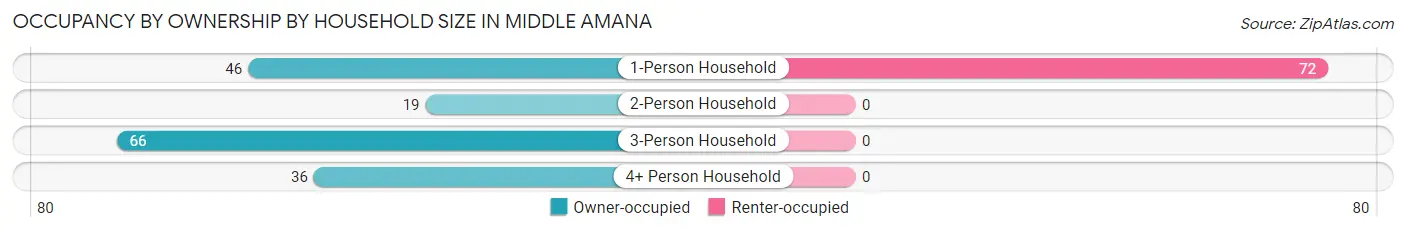
| Household Size | Owner-occupied | Renter-occupied |
| 1-Person Household | 46 (39.0%) | 72 (61.0%) |
| 2-Person Household | 19 (100.0%) | 0 (0.0%) |
| 3-Person Household | 66 (100.0%) | 0 (0.0%) |
| 4+ Person Household | 36 (100.0%) | 0 (0.0%) |
| Total Housing Units | 167 (69.9%) | 72 (30.1%) |
Occupancy by Educational Attainment in Middle Amana
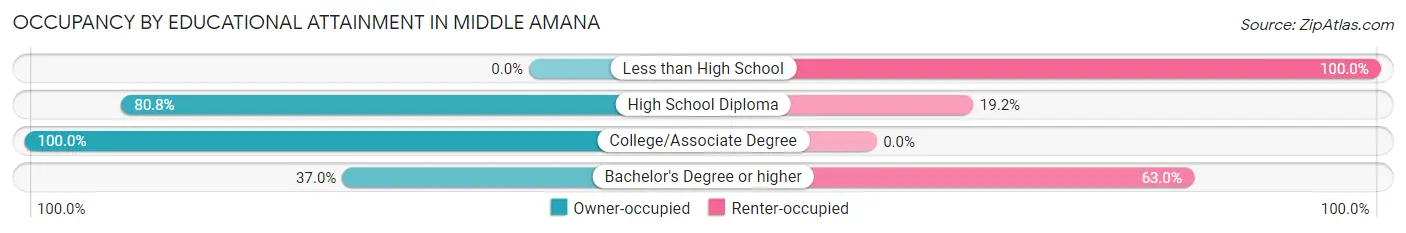
| Household Size | Owner-occupied | Renter-occupied |
| Less than High School | 0 (0.0%) | 7 (100.0%) |
| High School Diploma | 59 (80.8%) | 14 (19.2%) |
| College/Associate Degree | 78 (100.0%) | 0 (0.0%) |
| Bachelor's Degree or higher | 30 (37.0%) | 51 (63.0%) |
Occupancy by Age of Householder in Middle Amana
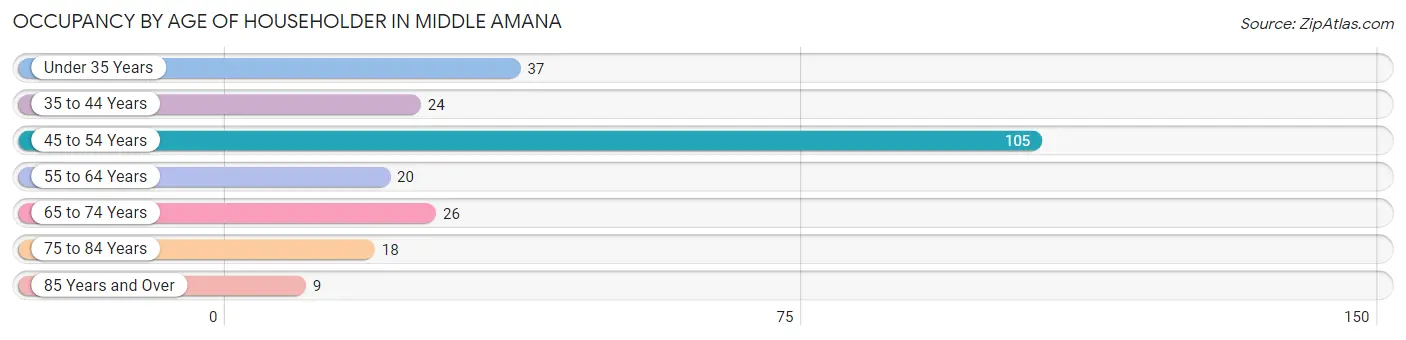
| Age Bracket | # Households | % Households |
| Under 35 Years | 37 | 15.5% |
| 35 to 44 Years | 24 | 10.0% |
| 45 to 54 Years | 105 | 43.9% |
| 55 to 64 Years | 20 | 8.4% |
| 65 to 74 Years | 26 | 10.9% |
| 75 to 84 Years | 18 | 7.5% |
| 85 Years and Over | 9 | 3.8% |
| Total | 239 | 100.0% |
Housing Finances in Middle Amana
Median Income by Occupancy in Middle Amana
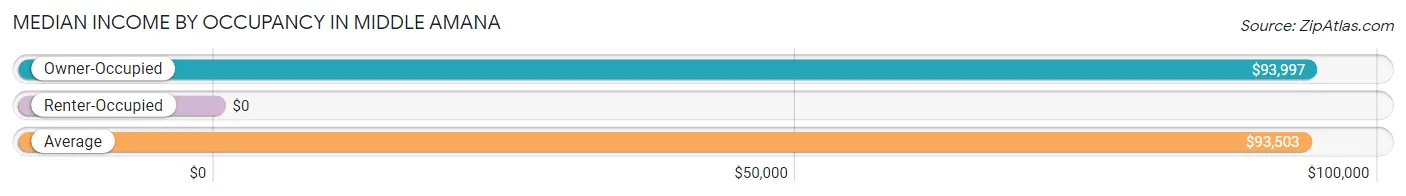
| Occupancy Type | # Households | Median Income |
| Owner-Occupied | 167 (69.9%) | $93,997 |
| Renter-Occupied | 72 (30.1%) | $0 |
| Average | 239 (100.0%) | $93,503 |
Occupancy by Householder Income Bracket in Middle Amana
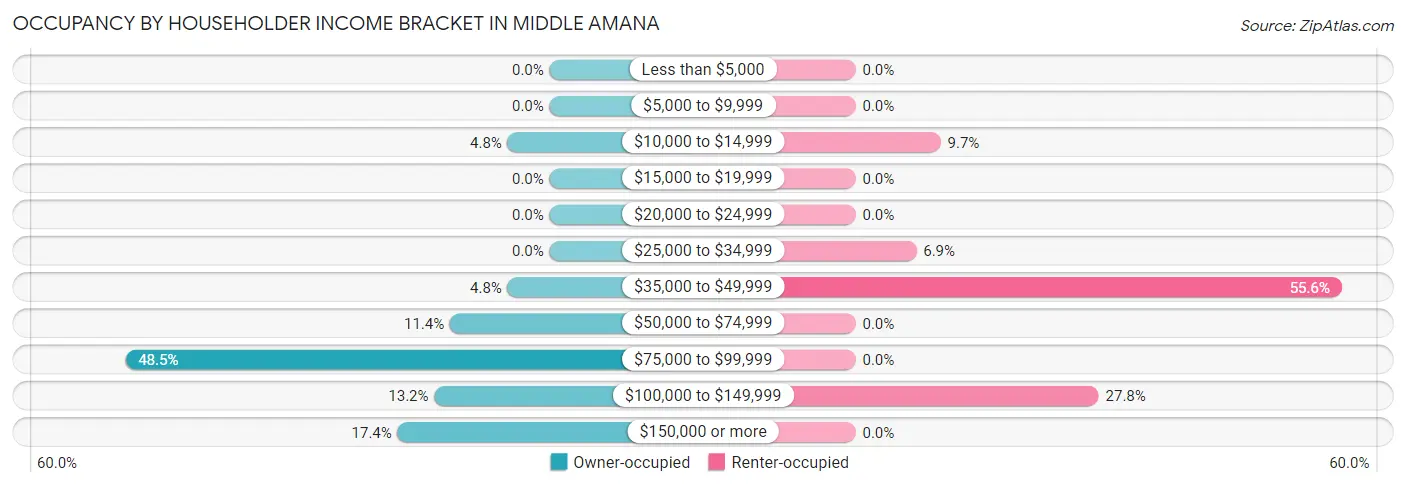
| Income Bracket | Owner-occupied | Renter-occupied |
| Less than $5,000 | 0 (0.0%) | 0 (0.0%) |
| $5,000 to $9,999 | 0 (0.0%) | 0 (0.0%) |
| $10,000 to $14,999 | 8 (4.8%) | 7 (9.7%) |
| $15,000 to $19,999 | 0 (0.0%) | 0 (0.0%) |
| $20,000 to $24,999 | 0 (0.0%) | 0 (0.0%) |
| $25,000 to $34,999 | 0 (0.0%) | 5 (6.9%) |
| $35,000 to $49,999 | 8 (4.8%) | 40 (55.6%) |
| $50,000 to $74,999 | 19 (11.4%) | 0 (0.0%) |
| $75,000 to $99,999 | 81 (48.5%) | 0 (0.0%) |
| $100,000 to $149,999 | 22 (13.2%) | 20 (27.8%) |
| $150,000 or more | 29 (17.4%) | 0 (0.0%) |
| Total | 167 (100.0%) | 72 (100.0%) |
Monthly Housing Cost Tiers in Middle Amana
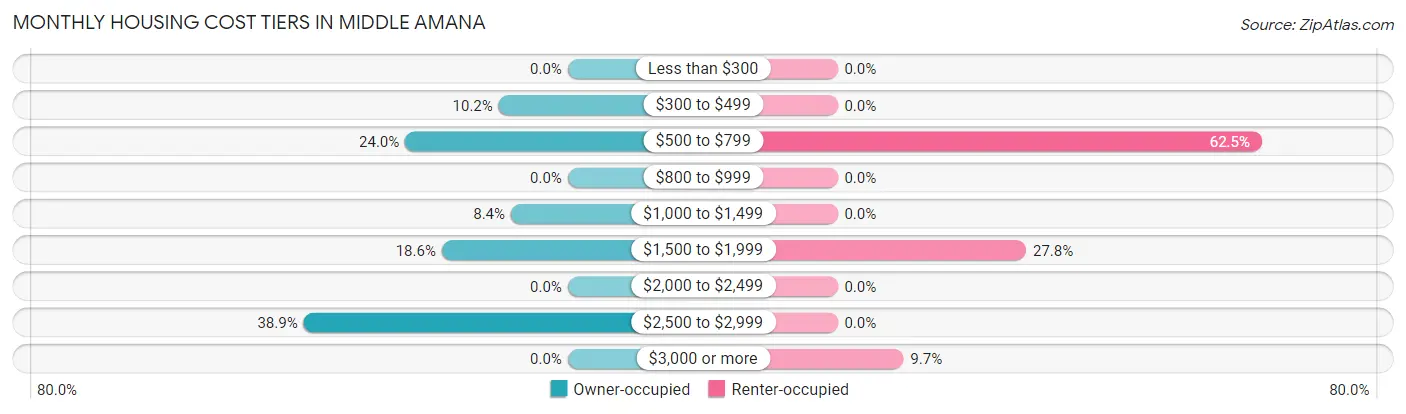
| Monthly Cost | Owner-occupied | Renter-occupied |
| Less than $300 | 0 (0.0%) | 0 (0.0%) |
| $300 to $499 | 17 (10.2%) | 0 (0.0%) |
| $500 to $799 | 40 (23.9%) | 45 (62.5%) |
| $800 to $999 | 0 (0.0%) | 0 (0.0%) |
| $1,000 to $1,499 | 14 (8.4%) | 0 (0.0%) |
| $1,500 to $1,999 | 31 (18.6%) | 20 (27.8%) |
| $2,000 to $2,499 | 0 (0.0%) | 0 (0.0%) |
| $2,500 to $2,999 | 65 (38.9%) | 0 (0.0%) |
| $3,000 or more | 0 (0.0%) | 7 (9.7%) |
| Total | 167 (100.0%) | 72 (100.0%) |
Physical Housing Characteristics in Middle Amana
Housing Structures in Middle Amana
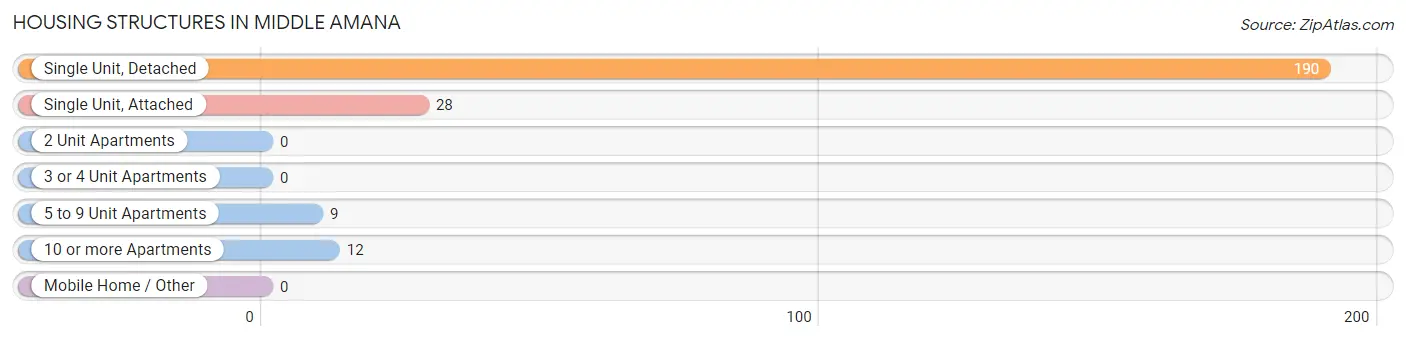
| Structure Type | # Housing Units | % Housing Units |
| Single Unit, Detached | 190 | 79.5% |
| Single Unit, Attached | 28 | 11.7% |
| 2 Unit Apartments | 0 | 0.0% |
| 3 or 4 Unit Apartments | 0 | 0.0% |
| 5 to 9 Unit Apartments | 9 | 3.8% |
| 10 or more Apartments | 12 | 5.0% |
| Mobile Home / Other | 0 | 0.0% |
| Total | 239 | 100.0% |
Housing Structures by Occupancy in Middle Amana
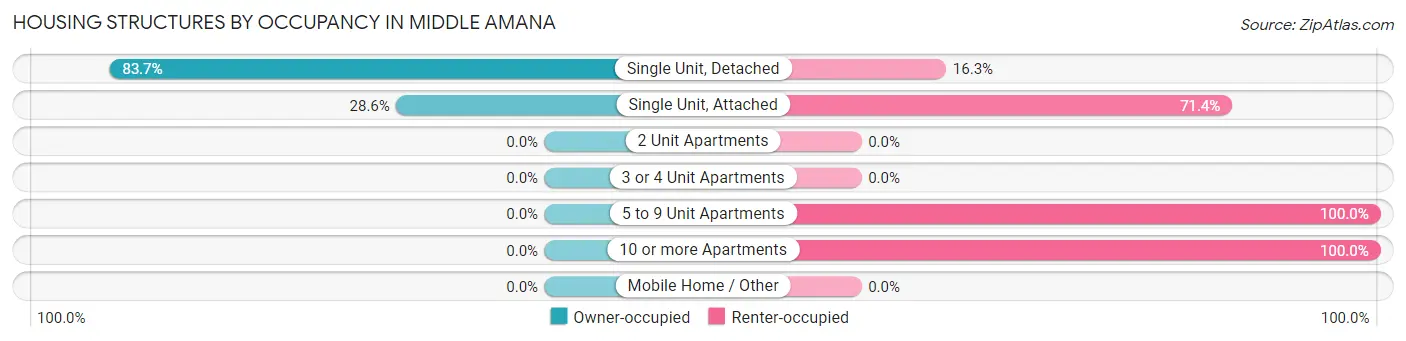
| Structure Type | Owner-occupied | Renter-occupied |
| Single Unit, Detached | 159 (83.7%) | 31 (16.3%) |
| Single Unit, Attached | 8 (28.6%) | 20 (71.4%) |
| 2 Unit Apartments | 0 (0.0%) | 0 (0.0%) |
| 3 or 4 Unit Apartments | 0 (0.0%) | 0 (0.0%) |
| 5 to 9 Unit Apartments | 0 (0.0%) | 9 (100.0%) |
| 10 or more Apartments | 0 (0.0%) | 12 (100.0%) |
| Mobile Home / Other | 0 (0.0%) | 0 (0.0%) |
| Total | 167 (69.9%) | 72 (30.1%) |
Housing Structures by Number of Rooms in Middle Amana
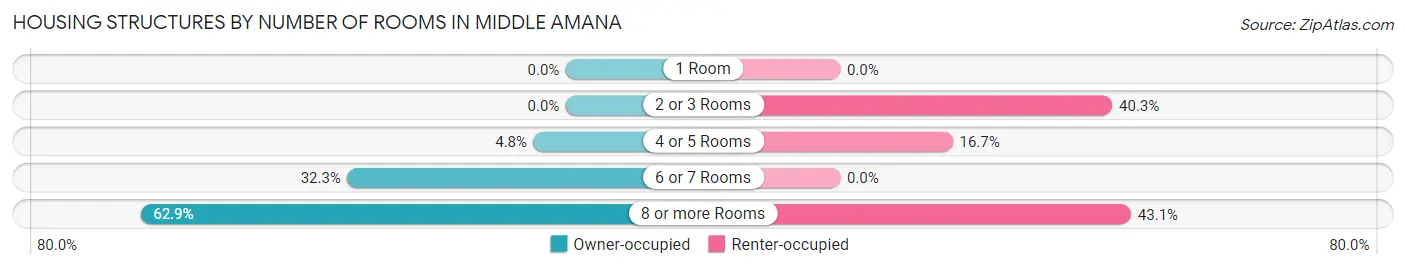
| Number of Rooms | Owner-occupied | Renter-occupied |
| 1 Room | 0 (0.0%) | 0 (0.0%) |
| 2 or 3 Rooms | 0 (0.0%) | 29 (40.3%) |
| 4 or 5 Rooms | 8 (4.8%) | 12 (16.7%) |
| 6 or 7 Rooms | 54 (32.3%) | 0 (0.0%) |
| 8 or more Rooms | 105 (62.9%) | 31 (43.1%) |
| Total | 167 (100.0%) | 72 (100.0%) |
Housing Structure by Heating Type in Middle Amana
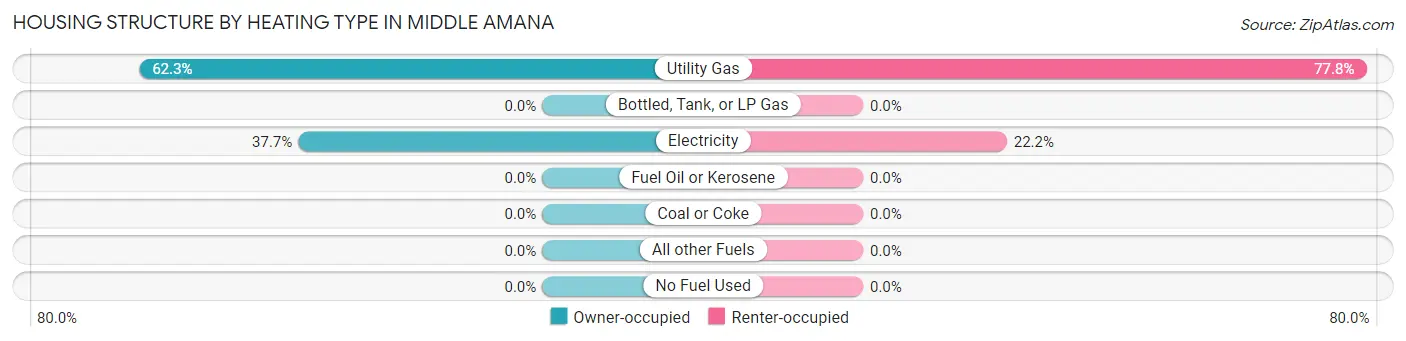
| Heating Type | Owner-occupied | Renter-occupied |
| Utility Gas | 104 (62.3%) | 56 (77.8%) |
| Bottled, Tank, or LP Gas | 0 (0.0%) | 0 (0.0%) |
| Electricity | 63 (37.7%) | 16 (22.2%) |
| Fuel Oil or Kerosene | 0 (0.0%) | 0 (0.0%) |
| Coal or Coke | 0 (0.0%) | 0 (0.0%) |
| All other Fuels | 0 (0.0%) | 0 (0.0%) |
| No Fuel Used | 0 (0.0%) | 0 (0.0%) |
| Total | 167 (100.0%) | 72 (100.0%) |
Household Vehicle Usage in Middle Amana
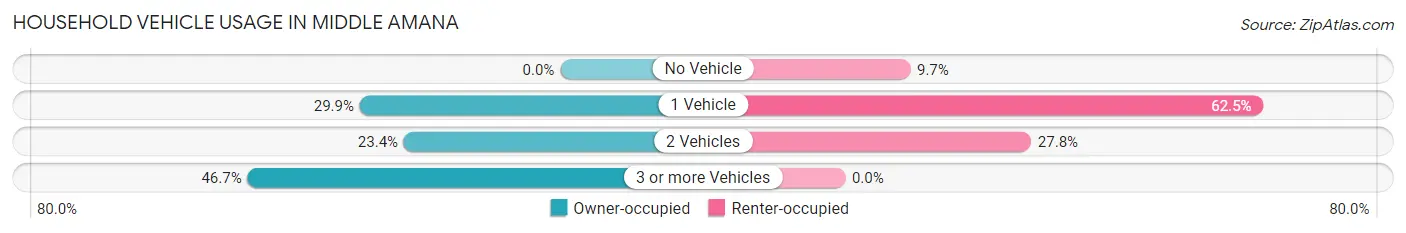
| Vehicles per Household | Owner-occupied | Renter-occupied |
| No Vehicle | 0 (0.0%) | 7 (9.7%) |
| 1 Vehicle | 50 (29.9%) | 45 (62.5%) |
| 2 Vehicles | 39 (23.4%) | 20 (27.8%) |
| 3 or more Vehicles | 78 (46.7%) | 0 (0.0%) |
| Total | 167 (100.0%) | 72 (100.0%) |
Real Estate & Mortgages in Middle Amana
Real Estate and Mortgage Overview in Middle Amana
| Characteristic | Without Mortgage | With Mortgage |
| Housing Units | 33 | 134 |
| Median Property Value | $149,300 | $259,000 |
| Median Household Income | $52,361 | $29 |
| Monthly Housing Costs | $497 | $0 |
| Real Estate Taxes | - | - |
Property Value by Mortgage Status in Middle Amana
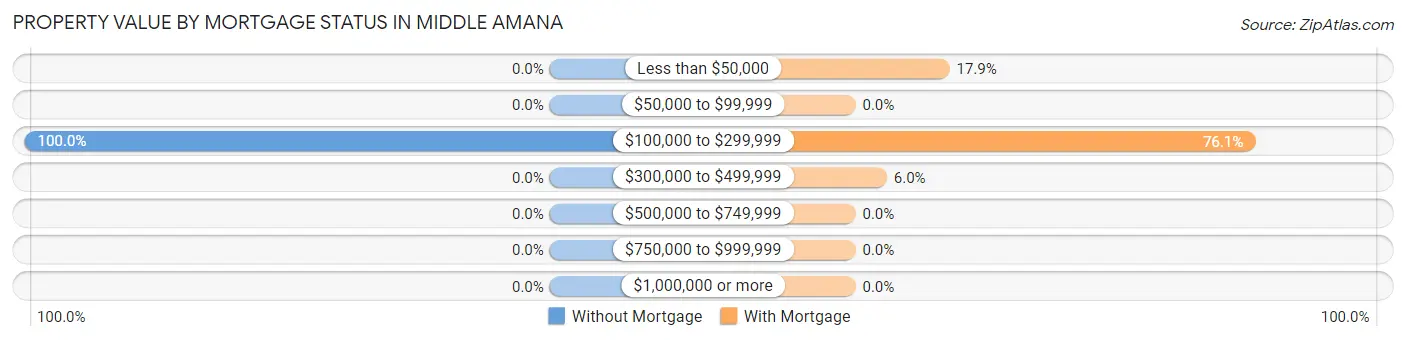
| Property Value | Without Mortgage | With Mortgage |
| Less than $50,000 | 0 (0.0%) | 24 (17.9%) |
| $50,000 to $99,999 | 0 (0.0%) | 0 (0.0%) |
| $100,000 to $299,999 | 33 (100.0%) | 102 (76.1%) |
| $300,000 to $499,999 | 0 (0.0%) | 8 (6.0%) |
| $500,000 to $749,999 | 0 (0.0%) | 0 (0.0%) |
| $750,000 to $999,999 | 0 (0.0%) | 0 (0.0%) |
| $1,000,000 or more | 0 (0.0%) | 0 (0.0%) |
| Total | 33 (100.0%) | 134 (100.0%) |
Household Income by Mortgage Status in Middle Amana
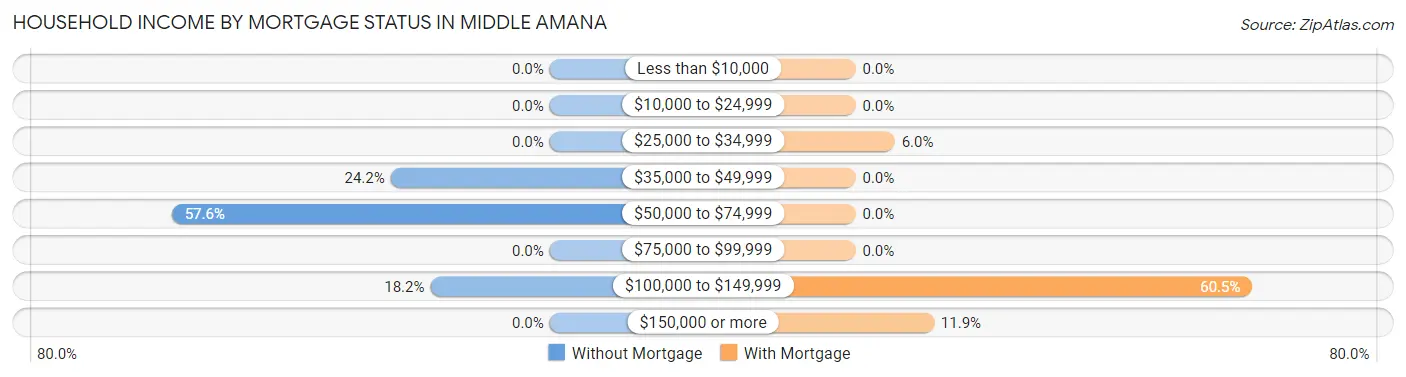
| Household Income | Without Mortgage | With Mortgage |
| Less than $10,000 | 0 (0.0%) | 0 (0.0%) |
| $10,000 to $24,999 | 0 (0.0%) | 0 (0.0%) |
| $25,000 to $34,999 | 0 (0.0%) | 8 (6.0%) |
| $35,000 to $49,999 | 8 (24.2%) | 0 (0.0%) |
| $50,000 to $74,999 | 19 (57.6%) | 0 (0.0%) |
| $75,000 to $99,999 | 0 (0.0%) | 0 (0.0%) |
| $100,000 to $149,999 | 6 (18.2%) | 81 (60.5%) |
| $150,000 or more | 0 (0.0%) | 16 (11.9%) |
| Total | 33 (100.0%) | 134 (100.0%) |
Property Value to Household Income Ratio in Middle Amana
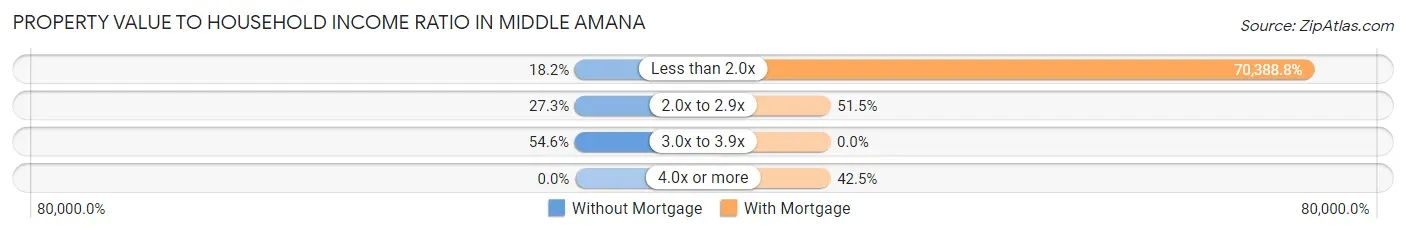
| Value-to-Income Ratio | Without Mortgage | With Mortgage |
| Less than 2.0x | 6 (18.2%) | 94,321 (70,388.8%) |
| 2.0x to 2.9x | 9 (27.3%) | 69 (51.5%) |
| 3.0x to 3.9x | 18 (54.5%) | 0 (0.0%) |
| 4.0x or more | 0 (0.0%) | 57 (42.5%) |
| Total | 33 (100.0%) | 134 (100.0%) |
Real Estate Taxes by Mortgage Status in Middle Amana
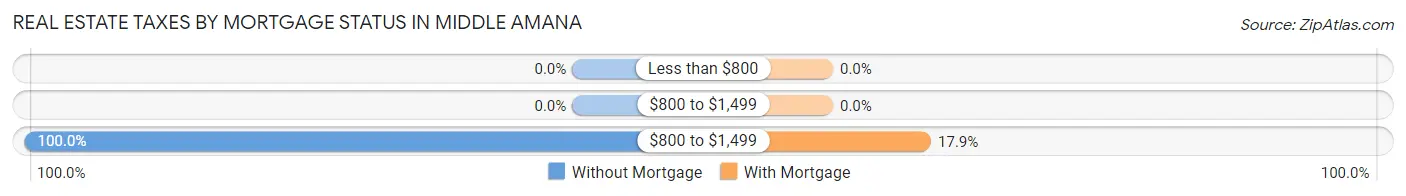
| Property Taxes | Without Mortgage | With Mortgage |
| Less than $800 | 0 (0.0%) | 0 (0.0%) |
| $800 to $1,499 | 0 (0.0%) | 0 (0.0%) |
| $800 to $1,499 | 33 (100.0%) | 24 (17.9%) |
| Total | 33 (100.0%) | 134 (100.0%) |
Health & Disability in Middle Amana
Health Insurance Coverage by Age in Middle Amana
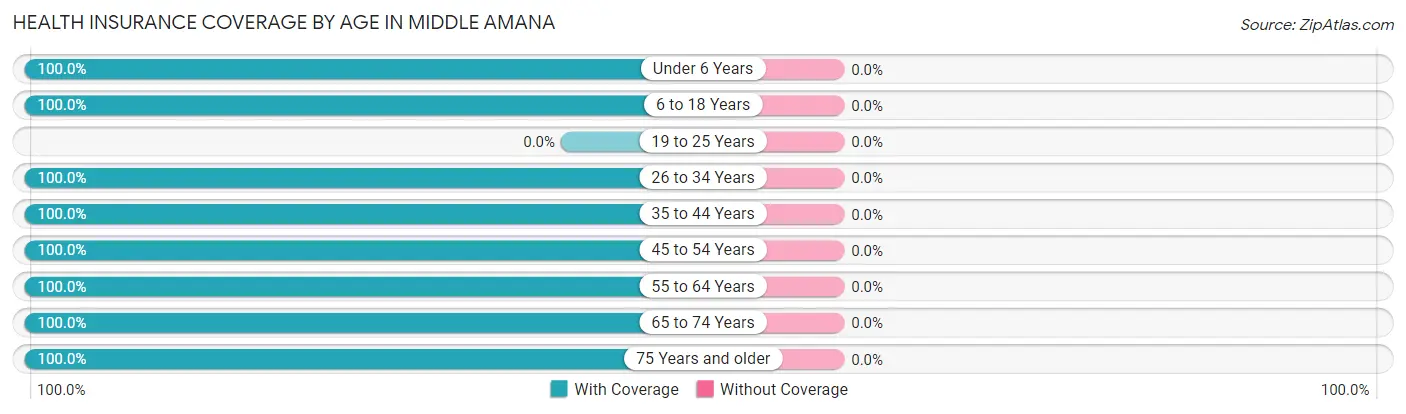
| Age Bracket | With Coverage | Without Coverage |
| Under 6 Years | 23 (100.0%) | 0 (0.0%) |
| 6 to 18 Years | 143 (100.0%) | 0 (0.0%) |
| 19 to 25 Years | 0 (0.0%) | 0 (0.0%) |
| 26 to 34 Years | 37 (100.0%) | 0 (0.0%) |
| 35 to 44 Years | 56 (100.0%) | 0 (0.0%) |
| 45 to 54 Years | 172 (100.0%) | 0 (0.0%) |
| 55 to 64 Years | 31 (100.0%) | 0 (0.0%) |
| 65 to 74 Years | 26 (100.0%) | 0 (0.0%) |
| 75 Years and older | 33 (100.0%) | 0 (0.0%) |
| Total | 521 (100.0%) | 0 (0.0%) |
Health Insurance Coverage by Citizenship Status in Middle Amana
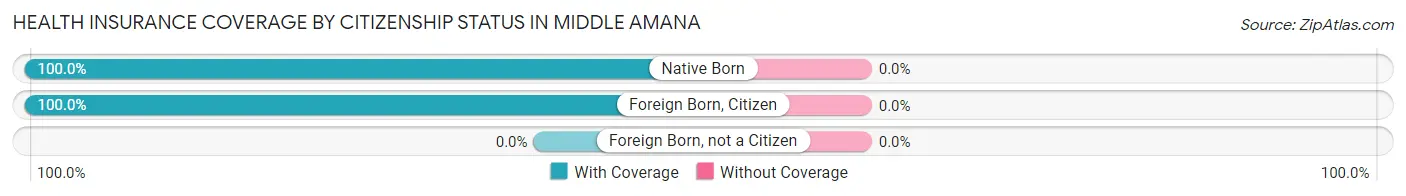
| Citizenship Status | With Coverage | Without Coverage |
| Native Born | 23 (100.0%) | 0 (0.0%) |
| Foreign Born, Citizen | 143 (100.0%) | 0 (0.0%) |
| Foreign Born, not a Citizen | 0 (0.0%) | 0 (0.0%) |
Health Insurance Coverage by Household Income in Middle Amana
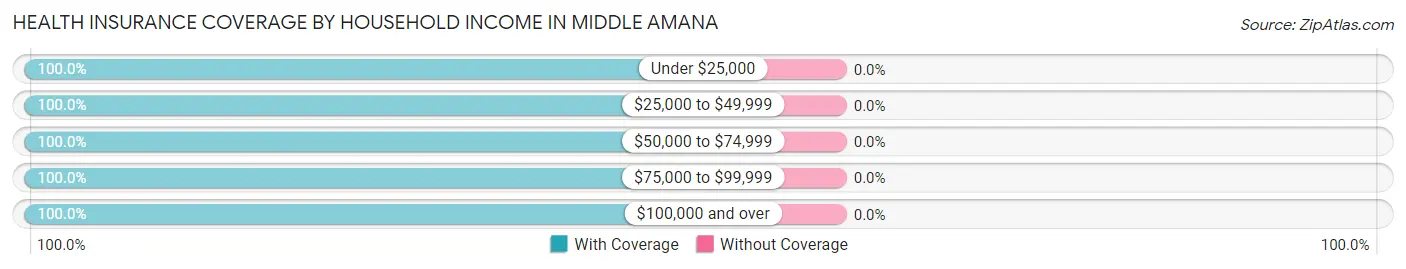
| Household Income | With Coverage | Without Coverage |
| Under $25,000 | 15 (100.0%) | 0 (0.0%) |
| $25,000 to $49,999 | 53 (100.0%) | 0 (0.0%) |
| $50,000 to $74,999 | 36 (100.0%) | 0 (0.0%) |
| $75,000 to $99,999 | 193 (100.0%) | 0 (0.0%) |
| $100,000 and over | 224 (100.0%) | 0 (0.0%) |
Public vs Private Health Insurance Coverage by Age in Middle Amana
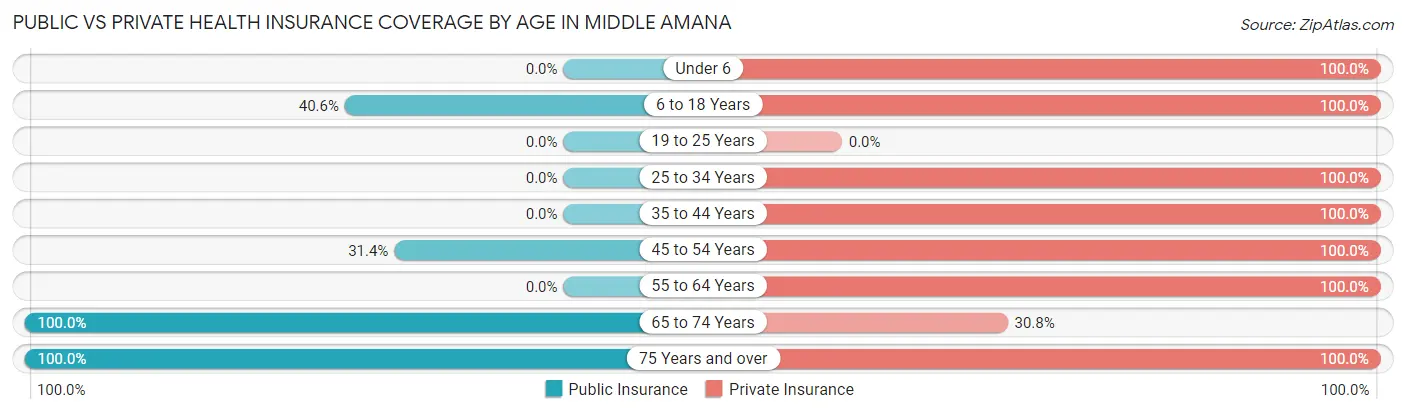
| Age Bracket | Public Insurance | Private Insurance |
| Under 6 | 0 (0.0%) | 23 (100.0%) |
| 6 to 18 Years | 58 (40.6%) | 143 (100.0%) |
| 19 to 25 Years | 0 (0.0%) | 0 (0.0%) |
| 25 to 34 Years | 0 (0.0%) | 37 (100.0%) |
| 35 to 44 Years | 0 (0.0%) | 56 (100.0%) |
| 45 to 54 Years | 54 (31.4%) | 172 (100.0%) |
| 55 to 64 Years | 0 (0.0%) | 31 (100.0%) |
| 65 to 74 Years | 26 (100.0%) | 8 (30.8%) |
| 75 Years and over | 33 (100.0%) | 33 (100.0%) |
| Total | 171 (32.8%) | 503 (96.6%) |
Disability Status by Sex by Age in Middle Amana
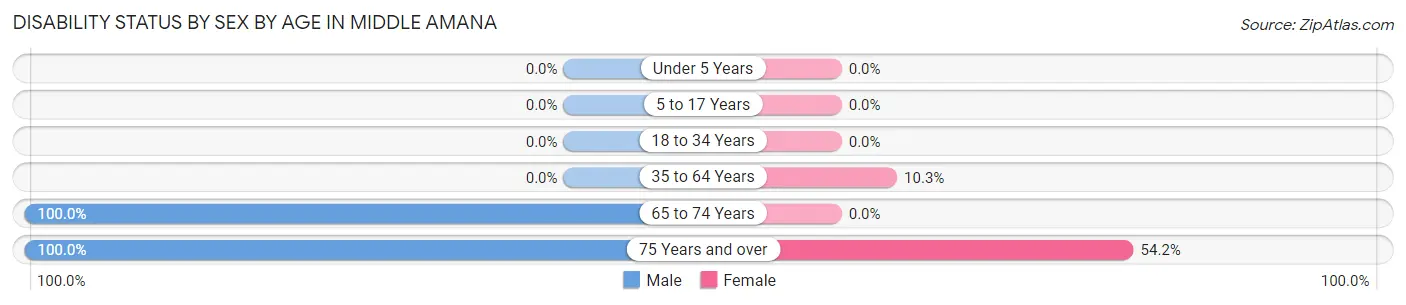
| Age Bracket | Male | Female |
| Under 5 Years | 0 (0.0%) | 0 (0.0%) |
| 5 to 17 Years | 0 (0.0%) | 0 (0.0%) |
| 18 to 34 Years | 0 (0.0%) | 0 (0.0%) |
| 35 to 64 Years | 0 (0.0%) | 11 (10.3%) |
| 65 to 74 Years | 10 (100.0%) | 0 (0.0%) |
| 75 Years and over | 9 (100.0%) | 13 (54.2%) |
Disability Class by Sex by Age in Middle Amana
Disability Class: Hearing Difficulty
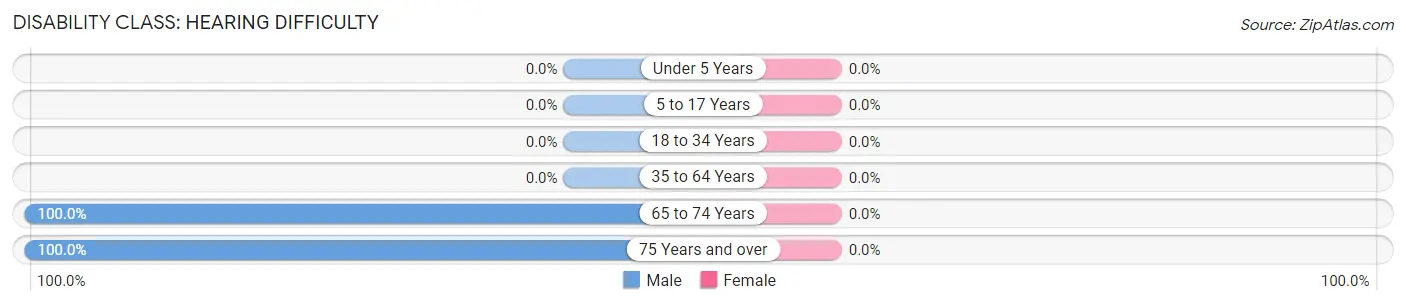
| Age Bracket | Male | Female |
| Under 5 Years | 0 (0.0%) | 0 (0.0%) |
| 5 to 17 Years | 0 (0.0%) | 0 (0.0%) |
| 18 to 34 Years | 0 (0.0%) | 0 (0.0%) |
| 35 to 64 Years | 0 (0.0%) | 0 (0.0%) |
| 65 to 74 Years | 10 (100.0%) | 0 (0.0%) |
| 75 Years and over | 9 (100.0%) | 0 (0.0%) |
Disability Class: Vision Difficulty
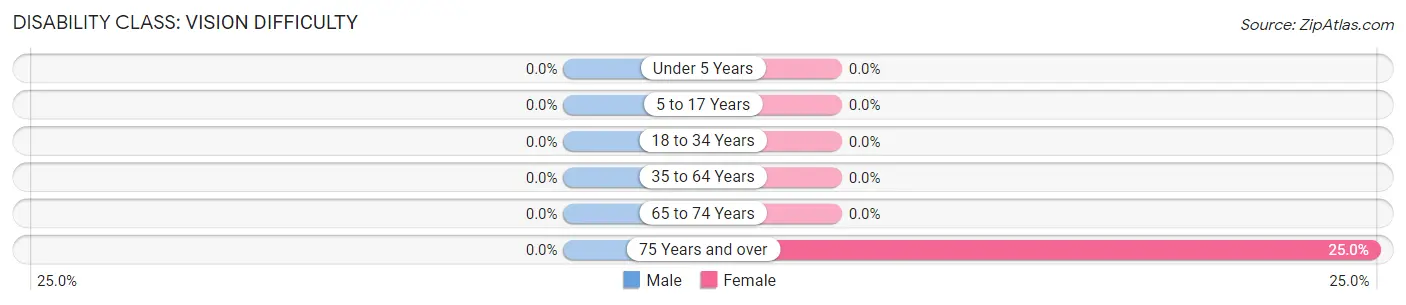
| Age Bracket | Male | Female |
| Under 5 Years | 0 (0.0%) | 0 (0.0%) |
| 5 to 17 Years | 0 (0.0%) | 0 (0.0%) |
| 18 to 34 Years | 0 (0.0%) | 0 (0.0%) |
| 35 to 64 Years | 0 (0.0%) | 0 (0.0%) |
| 65 to 74 Years | 0 (0.0%) | 0 (0.0%) |
| 75 Years and over | 0 (0.0%) | 6 (25.0%) |
Disability Class: Cognitive Difficulty
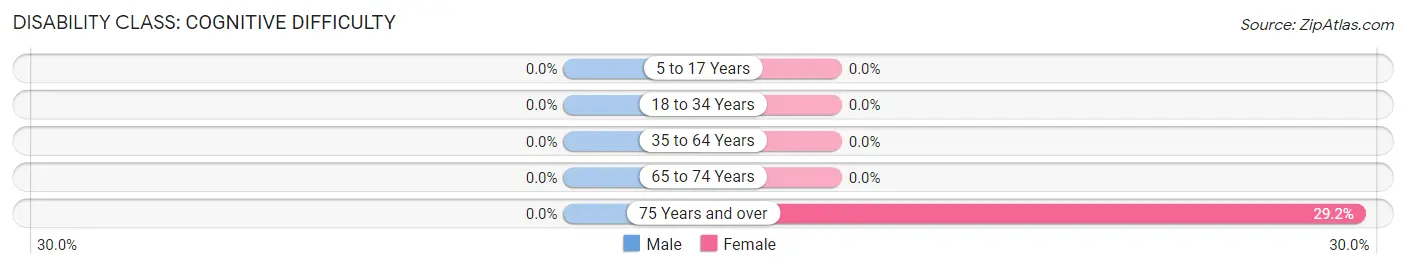
| Age Bracket | Male | Female |
| 5 to 17 Years | 0 (0.0%) | 0 (0.0%) |
| 18 to 34 Years | 0 (0.0%) | 0 (0.0%) |
| 35 to 64 Years | 0 (0.0%) | 0 (0.0%) |
| 65 to 74 Years | 0 (0.0%) | 0 (0.0%) |
| 75 Years and over | 0 (0.0%) | 7 (29.2%) |
Disability Class: Ambulatory Difficulty
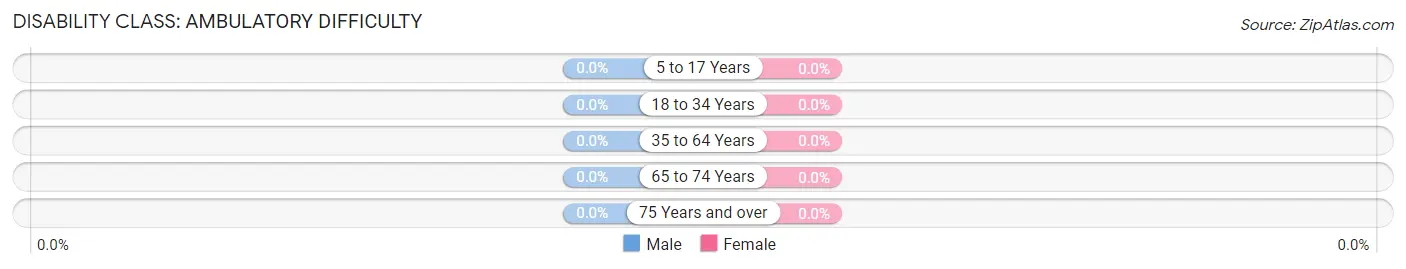
| Age Bracket | Male | Female |
| 5 to 17 Years | 0 (0.0%) | 0 (0.0%) |
| 18 to 34 Years | 0 (0.0%) | 0 (0.0%) |
| 35 to 64 Years | 0 (0.0%) | 0 (0.0%) |
| 65 to 74 Years | 0 (0.0%) | 0 (0.0%) |
| 75 Years and over | 0 (0.0%) | 0 (0.0%) |
Disability Class: Self-Care Difficulty
| Age Bracket | Male | Female |
| 5 to 17 Years | 0 (0.0%) | 0 (0.0%) |
| 18 to 34 Years | 0 (0.0%) | 0 (0.0%) |
| 35 to 64 Years | 0 (0.0%) | 0 (0.0%) |
| 65 to 74 Years | 0 (0.0%) | 0 (0.0%) |
| 75 Years and over | 0 (0.0%) | 0 (0.0%) |
Technology Access in Middle Amana
Computing Device Access in Middle Amana
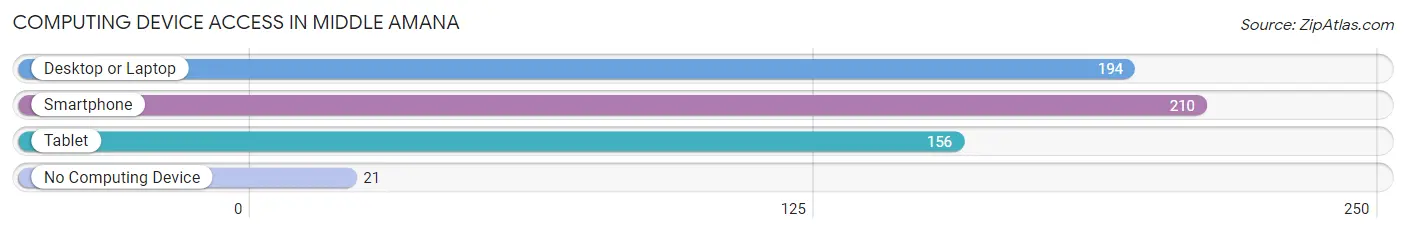
| Device Type | # Households | % Households |
| Desktop or Laptop | 194 | 81.2% |
| Smartphone | 210 | 87.9% |
| Tablet | 156 | 65.3% |
| No Computing Device | 21 | 8.8% |
| Total | 239 | 100.0% |
Internet Access in Middle Amana
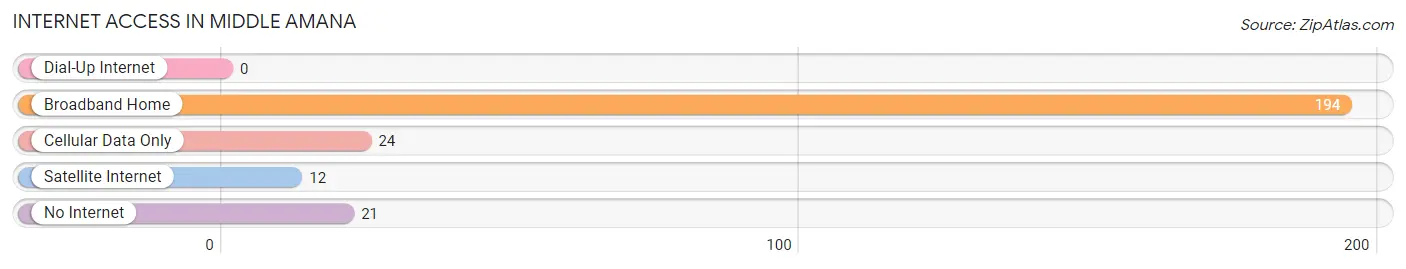
| Internet Type | # Households | % Households |
| Dial-Up Internet | 0 | 0.0% |
| Broadband Home | 194 | 81.2% |
| Cellular Data Only | 24 | 10.0% |
| Satellite Internet | 12 | 5.0% |
| No Internet | 21 | 8.8% |
| Total | 239 | 100.0% |
Middle Amana Summary
Amana Colonies
The Amana Colonies are a group of seven villages located in Iowa County, Iowa, United States. The villages are Amana, East Amana, High Amana, Middle Amana, South Amana, West Amana, and Homestead. The Amana Colonies were founded in 1855 by German Pietists who were seeking religious freedom and communal living. The Amana Colonies are listed on the National Register of Historic Places and are a National Historic Landmark.
History
The Amana Colonies were founded in 1855 by German Pietists who were seeking religious freedom and communal living. The Amana Colonies were founded by a group of German Pietists who were members of the Community of True Inspiration, a religious sect that had been persecuted in Germany. The group had previously settled in New York and Pennsylvania, but they were looking for a place where they could practice their faith without interference. They chose the Amana Colonies because of its remote location and its proximity to the Mississippi River.
The Amana Colonies were founded on the principles of communal living, where all members of the community shared in the work and the rewards. The Amana Colonies were divided into seven villages, each with its own church, school, and communal kitchen. The Amana Colonies were self-sufficient, with members growing their own food, making their own clothing, and building their own homes.
The Amana Colonies were a successful experiment in communal living, and the community flourished for nearly a century. In 1932, the Amana Colonies adopted a more modern lifestyle, and the communal system was gradually phased out. The Amana Colonies are now a popular tourist destination, and the villages are home to a variety of shops, restaurants, and other businesses.
Geography
The Amana Colonies are located in Iowa County, Iowa, in the United States. The villages are situated in the rolling hills of the Iowa River Valley, about 25 miles southwest of Cedar Rapids. The Amana Colonies are located on the banks of the Iowa River, and the villages are surrounded by farmland and woodlands.
The Amana Colonies are divided into seven villages: Amana, East Amana, High Amana, Middle Amana, South Amana, West Amana, and Homestead. Each village has its own church, school, and communal kitchen. The villages are connected by a network of roads and trails, and the Amana Colonies are accessible by car or by bike.
Economy
The Amana Colonies are a popular tourist destination, and the villages are home to a variety of shops, restaurants, and other businesses. The Amana Colonies are also home to a number of manufacturing companies, including Amana Refrigeration, Amana Furniture, and Amana Appliances. The Amana Colonies are also home to a number of wineries, breweries, and distilleries.
The Amana Colonies are also home to a number of farms, and the villages are surrounded by farmland and woodlands. The Amana Colonies are home to a variety of crops, including corn, soybeans, wheat, and hay. The Amana Colonies are also home to a number of livestock, including cattle, sheep, and pigs.
Demographics
The Amana Colonies are home to a population of approximately 2,500 people. The population is predominantly white, with a small minority of African Americans, Hispanics, and Asians. The median age of the population is 44.5 years, and the median household income is $50,000.
The Amana Colonies are home to a variety of religious denominations, including Lutheran, Catholic, and Methodist. The Amana Colonies are also home to a number of non-denominational churches. The Amana Colonies are home to a variety of educational institutions, including the Amana Academy, the Amana School District, and the Amana Community College.
Conclusion
The Amana Colonies are a unique and historic community located in Iowa County, Iowa. The Amana Colonies were founded in 1855 by German Pietists who were seeking religious freedom and communal living. The Amana Colonies are listed on the National Register of Historic Places and are a National Historic Landmark. The Amana Colonies are a popular tourist destination, and the villages are home to a variety of shops, restaurants, and other businesses. The Amana Colonies are home to a population of approximately 2,500 people, and the population is predominantly white. The Amana Colonies are home to a variety of religious denominations, and the villages are surrounded by farmland and woodlands.
Common Questions
What is Per Capita Income in Middle Amana?
Per Capita income in Middle Amana is $40,656.
What is the Median Family Income in Middle Amana?
Median Family Income in Middle Amana is $94,320.
What is the Median Household income in Middle Amana?
Median Household Income in Middle Amana is $93,503.
What is Inequality or Gini Index in Middle Amana?
Inequality or Gini Index in Middle Amana is 0.31.
What is the Total Population of Middle Amana?
Total Population of Middle Amana is 578.
What is the Total Male Population of Middle Amana?
Total Male Population of Middle Amana is 302.
What is the Total Female Population of Middle Amana?
Total Female Population of Middle Amana is 276.
What is the Ratio of Males per 100 Females in Middle Amana?
There are 109.42 Males per 100 Females in Middle Amana.
What is the Ratio of Females per 100 Males in Middle Amana?
There are 91.39 Females per 100 Males in Middle Amana.
What is the Median Population Age in Middle Amana?
Median Population Age in Middle Amana is 51.3 Years.
What is the Average Family Size in Middle Amana
Average Family Size in Middle Amana is 3.3 People.
What is the Average Household Size in Middle Amana
Average Household Size in Middle Amana is 2.2 People.
How Large is the Labor Force in Middle Amana?
There are 272 People in the Labor Forcein in Middle Amana.
What is the Percentage of People in the Labor Force in Middle Amana?
55.5% of People are in the Labor Force in Middle Amana.