Maquoketa, IA Map & Demographics
Maquoketa Map
Maquoketa Overview
$29,241
PER CAPITA INCOME
$78,450
AVG FAMILY INCOME
$53,462
AVG HOUSEHOLD INCOME
38.9%
WAGE / INCOME GAP [ % ]
61.1¢/ $1
WAGE / INCOME GAP [ $ ]
0.42
INEQUALITY / GINI INDEX
6,123
TOTAL POPULATION
3,088
MALE POPULATION
3,035
FEMALE POPULATION
101.75
MALES / 100 FEMALES
98.28
FEMALES / 100 MALES
40.8
MEDIAN AGE
2.9
AVG FAMILY SIZE
2.3
AVG HOUSEHOLD SIZE
2,894
LABOR FORCE [ PEOPLE ]
58.9%
PERCENT IN LABOR FORCE
7.4%
UNEMPLOYMENT RATE
Maquoketa Zip Codes
Maquoketa Area Codes
Income in Maquoketa
Income Overview in Maquoketa
Per Capita Income in Maquoketa is $29,241, while median incomes of families and households are $78,450 and $53,462 respectively.
| Characteristic | Number | Measure |
| Per Capita Income | 6,123 | $29,241 |
| Median Family Income | 1,553 | $78,450 |
| Mean Family Income | 1,553 | $86,511 |
| Median Household Income | 2,560 | $53,462 |
| Mean Household Income | 2,560 | $68,720 |
| Income Deficit | 1,553 | $0 |
| Wage / Income Gap (%) | 6,123 | 38.92% |
| Wage / Income Gap ($) | 6,123 | 61.08¢ per $1 |
| Gini / Inequality Index | 6,123 | 0.42 |
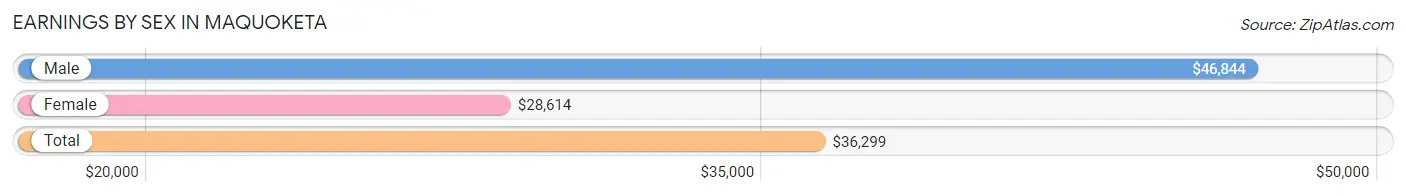
Earnings by Sex in Maquoketa
Average Earnings in Maquoketa are $36,299, $46,844 for men and $28,614 for women, a difference of 38.9%.
| Sex | Number | Average Earnings |
| Male | 1,569 (54.3%) | $46,844 |
| Female | 1,321 (45.7%) | $28,614 |
| Total | 2,890 (100.0%) | $36,299 |
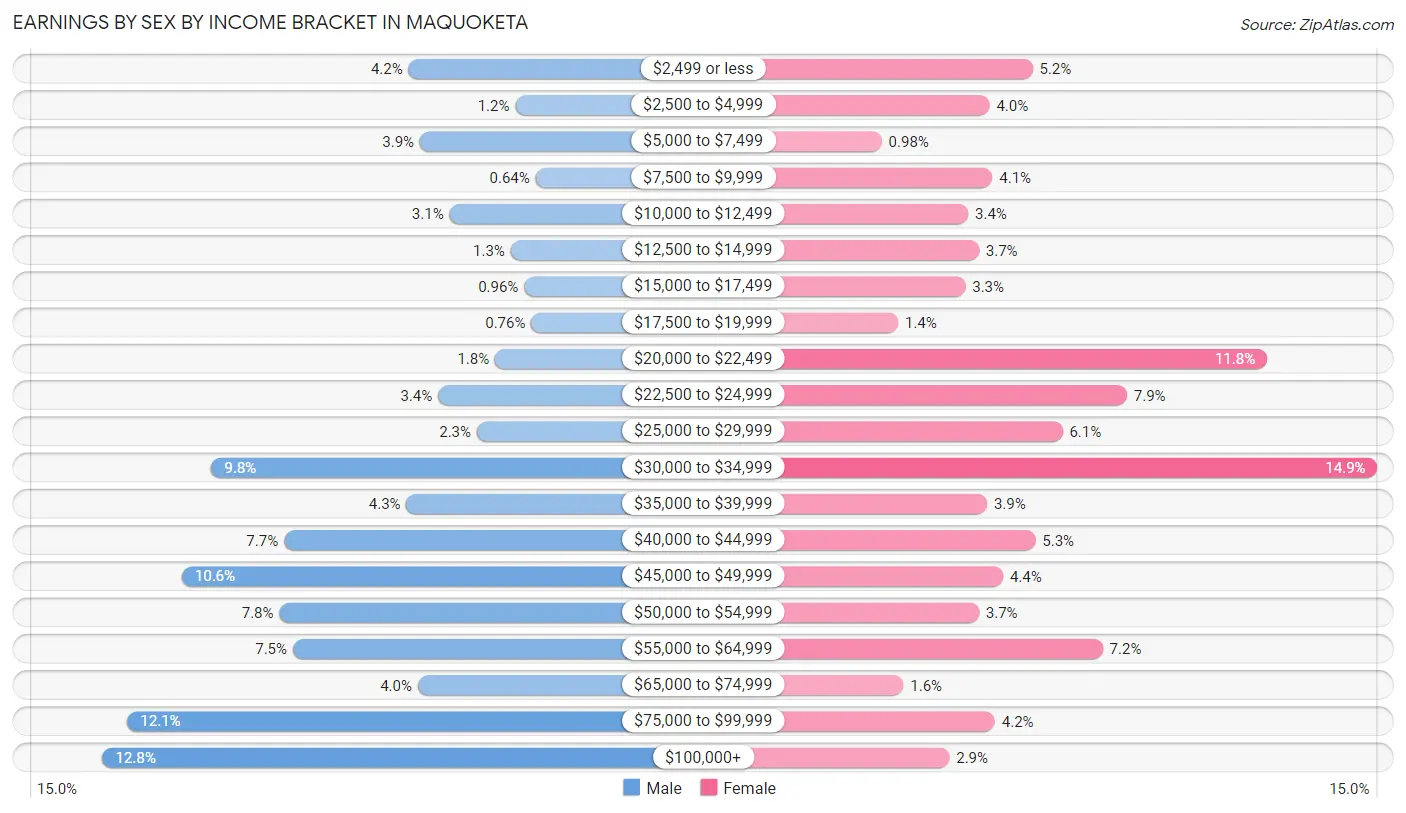
Earnings by Sex by Income Bracket in Maquoketa
The most common earnings brackets in Maquoketa are $100,000+ for men (201 | 12.8%) and $30,000 to $34,999 for women (197 | 14.9%).
| Income | Male | Female |
| $2,499 or less | 66 (4.2%) | 69 (5.2%) |
| $2,500 to $4,999 | 19 (1.2%) | 53 (4.0%) |
| $5,000 to $7,499 | 61 (3.9%) | 13 (1.0%) |
| $7,500 to $9,999 | 10 (0.6%) | 54 (4.1%) |
| $10,000 to $12,499 | 48 (3.1%) | 45 (3.4%) |
| $12,500 to $14,999 | 21 (1.3%) | 49 (3.7%) |
| $15,000 to $17,499 | 15 (1.0%) | 44 (3.3%) |
| $17,500 to $19,999 | 12 (0.8%) | 19 (1.4%) |
| $20,000 to $22,499 | 28 (1.8%) | 156 (11.8%) |
| $22,500 to $24,999 | 53 (3.4%) | 104 (7.9%) |
| $25,000 to $29,999 | 36 (2.3%) | 80 (6.1%) |
| $30,000 to $34,999 | 153 (9.8%) | 197 (14.9%) |
| $35,000 to $39,999 | 67 (4.3%) | 52 (3.9%) |
| $40,000 to $44,999 | 121 (7.7%) | 70 (5.3%) |
| $45,000 to $49,999 | 166 (10.6%) | 58 (4.4%) |
| $50,000 to $54,999 | 123 (7.8%) | 49 (3.7%) |
| $55,000 to $64,999 | 117 (7.5%) | 95 (7.2%) |
| $65,000 to $74,999 | 62 (4.0%) | 21 (1.6%) |
| $75,000 to $99,999 | 190 (12.1%) | 55 (4.2%) |
| $100,000+ | 201 (12.8%) | 38 (2.9%) |
| Total | 1,569 (100.0%) | 1,321 (100.0%) |
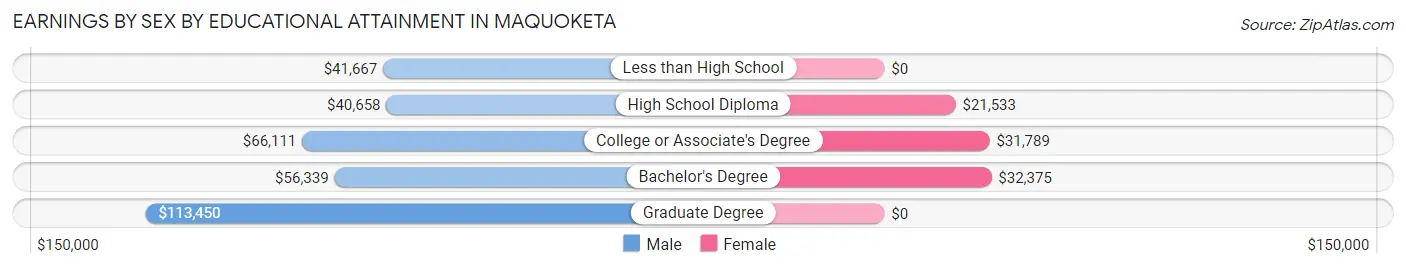
Earnings by Sex by Educational Attainment in Maquoketa
Average earnings in Maquoketa are $48,808 for men and $30,253 for women, a difference of 38.0%. Men with an educational attainment of graduate degree enjoy the highest average annual earnings of $113,450, while those with high school diploma education earn the least with $40,658. Women with an educational attainment of bachelor's degree earn the most with the average annual earnings of $32,375, while those with high school diploma education have the smallest earnings of $21,533.
| Educational Attainment | Male Income | Female Income |
| Less than High School | $41,667 | $0 |
| High School Diploma | $40,658 | $21,533 |
| College or Associate's Degree | $66,111 | $31,789 |
| Bachelor's Degree | $56,339 | $32,375 |
| Graduate Degree | $113,450 | $0 |
| Total | $48,808 | $30,253 |
Family Income in Maquoketa
Family Income Brackets in Maquoketa
According to the Maquoketa family income data, there are 429 families falling into the $100,000 to $149,999 income range, which is the most common income bracket and makes up 27.6% of all families. Conversely, the $25,000 to $34,999 income bracket is the least frequent group with only 12 families (0.8%) belonging to this category.
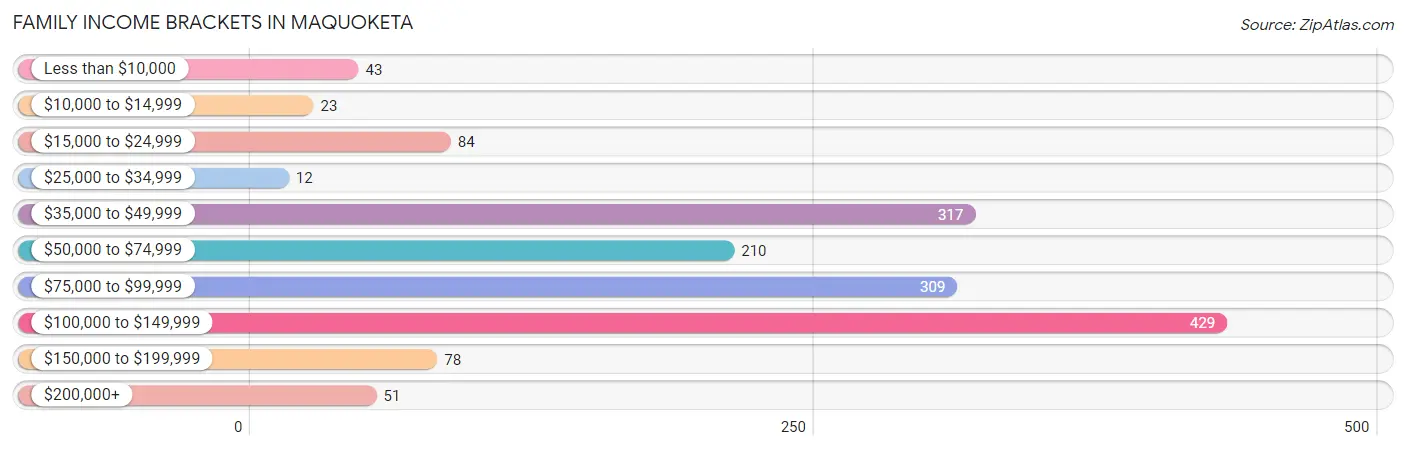
| Income Bracket | # Families | % Families |
| Less than $10,000 | 43 | 2.8% |
| $10,000 to $14,999 | 23 | 1.5% |
| $15,000 to $24,999 | 84 | 5.4% |
| $25,000 to $34,999 | 12 | 0.8% |
| $35,000 to $49,999 | 317 | 20.4% |
| $50,000 to $74,999 | 210 | 13.5% |
| $75,000 to $99,999 | 309 | 19.9% |
| $100,000 to $149,999 | 429 | 27.6% |
| $150,000 to $199,999 | 78 | 5.0% |
| $200,000+ | 51 | 3.3% |
Family Income by Famaliy Size in Maquoketa
4-person families (245 | 15.8%) account for the highest median family income in Maquoketa with $101,458 per family, while 2-person families (793 | 51.1%) have the highest median income of $39,431 per family member.
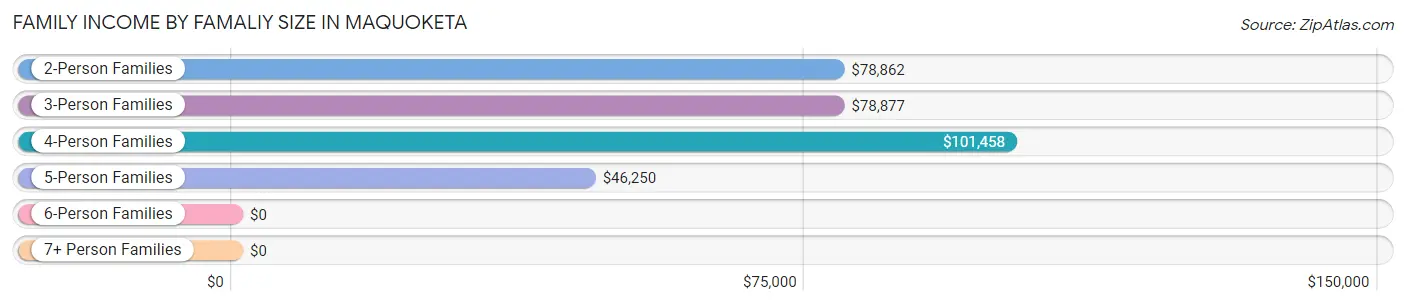
| Income Bracket | # Families | Median Income |
| 2-Person Families | 793 (51.1%) | $78,862 |
| 3-Person Families | 338 (21.8%) | $78,877 |
| 4-Person Families | 245 (15.8%) | $101,458 |
| 5-Person Families | 130 (8.4%) | $46,250 |
| 6-Person Families | 26 (1.7%) | $0 |
| 7+ Person Families | 21 (1.3%) | $0 |
| Total | 1,553 (100.0%) | $78,450 |
Family Income by Number of Earners in Maquoketa
The median family income in Maquoketa is $78,450, with families comprising 3+ earners (91) having the highest median family income of $117,375, while families with no earners (291) have the lowest median family income of $41,250, accounting for 5.9% and 18.7% of families, respectively.
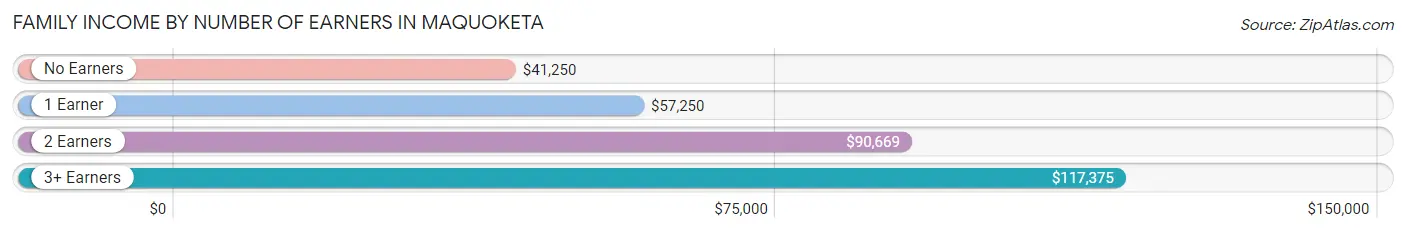
| Number of Earners | # Families | Median Income |
| No Earners | 291 (18.7%) | $41,250 |
| 1 Earner | 482 (31.0%) | $57,250 |
| 2 Earners | 689 (44.4%) | $90,669 |
| 3+ Earners | 91 (5.9%) | $117,375 |
| Total | 1,553 (100.0%) | $78,450 |
Household Income in Maquoketa
Household Income Brackets in Maquoketa
With 451 households falling in the category, the $35,000 to $49,999 income range is the most frequent in Maquoketa, accounting for 17.6% of all households. In contrast, only 69 households (2.7%) fall into the $200,000+ income bracket, making it the least populous group.
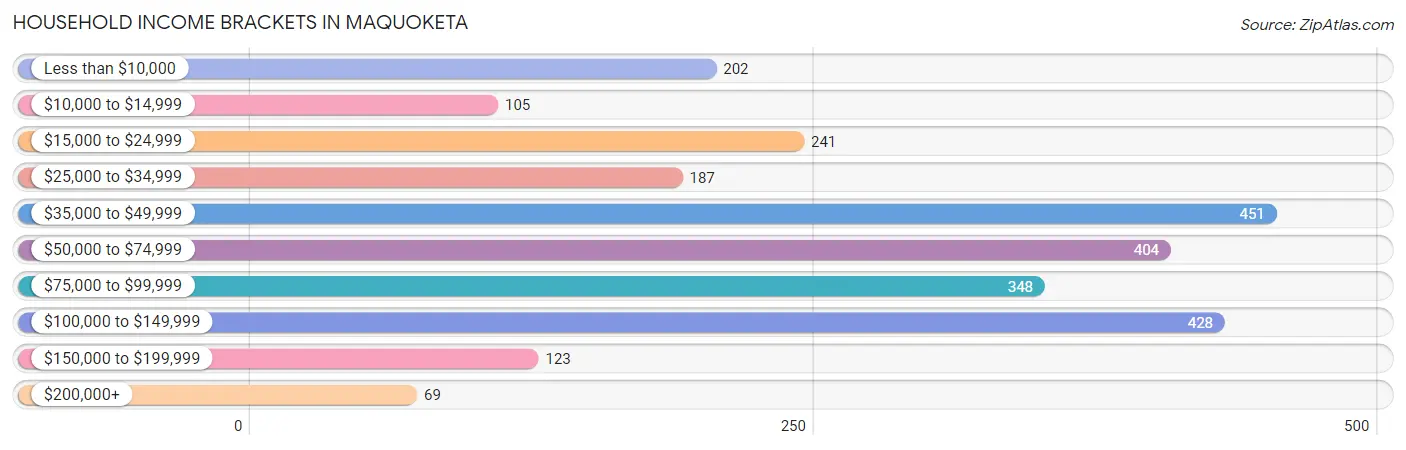
| Income Bracket | # Households | % Households |
| Less than $10,000 | 202 | 7.9% |
| $10,000 to $14,999 | 105 | 4.1% |
| $15,000 to $24,999 | 241 | 9.4% |
| $25,000 to $34,999 | 187 | 7.3% |
| $35,000 to $49,999 | 451 | 17.6% |
| $50,000 to $74,999 | 404 | 15.8% |
| $75,000 to $99,999 | 348 | 13.6% |
| $100,000 to $149,999 | 428 | 16.7% |
| $150,000 to $199,999 | 123 | 4.8% |
| $200,000+ | 69 | 2.7% |
Household Income by Householder Age in Maquoketa
The median household income in Maquoketa is $53,462, with the highest median household income of $60,208 found in the 25 to 44 years age bracket for the primary householder. A total of 730 households (28.5%) fall into this category. Meanwhile, the 15 to 24 years age bracket for the primary householder has the lowest median household income of $45,568, with 98 households (3.8%) in this group.
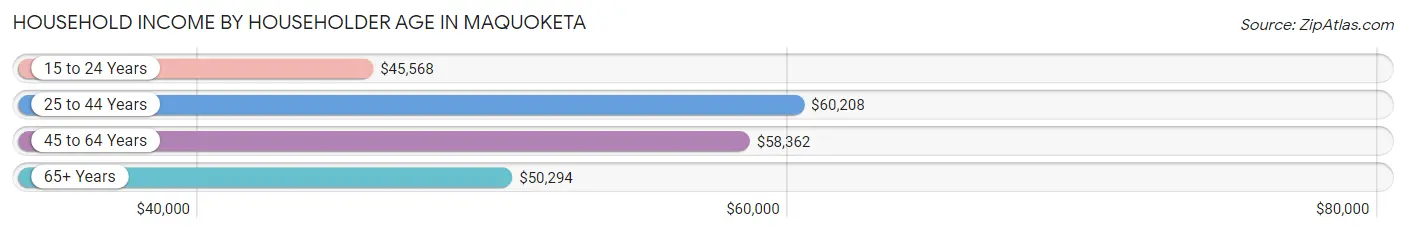
| Income Bracket | # Households | Median Income |
| 15 to 24 Years | 98 (3.8%) | $45,568 |
| 25 to 44 Years | 730 (28.5%) | $60,208 |
| 45 to 64 Years | 900 (35.2%) | $58,362 |
| 65+ Years | 832 (32.5%) | $50,294 |
| Total | 2,560 (100.0%) | $53,462 |
Poverty in Maquoketa
Income Below Poverty by Sex and Age in Maquoketa
With 18.9% poverty level for males and 14.6% for females among the residents of Maquoketa, 5 year old males and 5 year old females are the most vulnerable to poverty, with 22 males (62.9%) and 19 females (100.0%) in their respective age groups living below the poverty level.
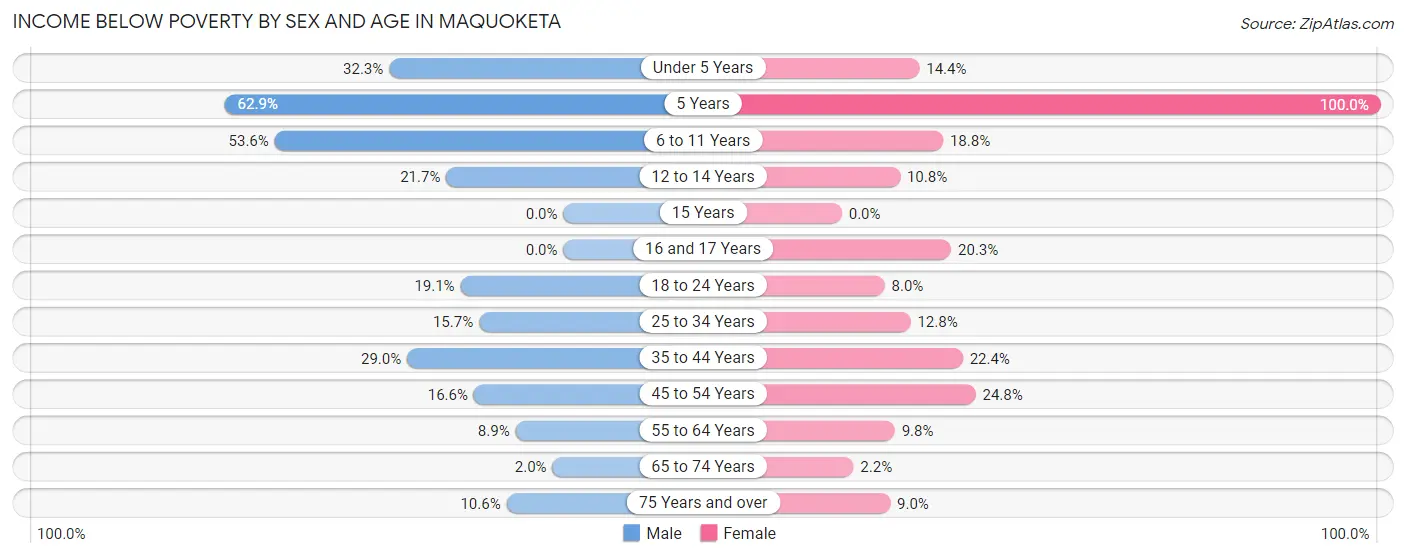
| Age Bracket | Male | Female |
| Under 5 Years | 65 (32.3%) | 22 (14.4%) |
| 5 Years | 22 (62.9%) | 19 (100.0%) |
| 6 to 11 Years | 127 (53.6%) | 34 (18.8%) |
| 12 to 14 Years | 15 (21.7%) | 23 (10.8%) |
| 15 Years | 0 (0.0%) | 0 (0.0%) |
| 16 and 17 Years | 0 (0.0%) | 28 (20.3%) |
| 18 to 24 Years | 38 (19.1%) | 14 (8.0%) |
| 25 to 34 Years | 57 (15.7%) | 39 (12.8%) |
| 35 to 44 Years | 112 (29.0%) | 79 (22.4%) |
| 45 to 54 Years | 56 (16.6%) | 106 (24.8%) |
| 55 to 64 Years | 35 (8.9%) | 34 (9.8%) |
| 65 to 74 Years | 7 (2.0%) | 7 (2.2%) |
| 75 Years and over | 27 (10.5%) | 26 (9.0%) |
| Total | 561 (18.9%) | 431 (14.6%) |
Income Above Poverty by Sex and Age in Maquoketa
According to the poverty statistics in Maquoketa, males aged 15 years and females aged 15 years are the age groups that are most secure financially, with 100.0% of males and 100.0% of females in these age groups living above the poverty line.
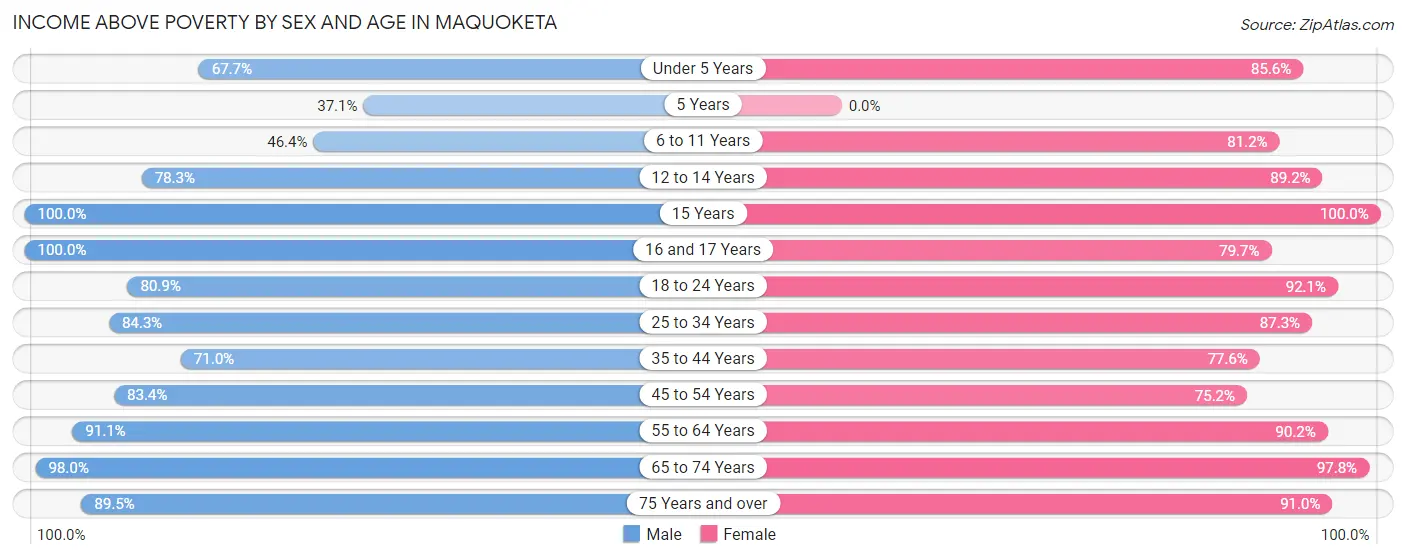
| Age Bracket | Male | Female |
| Under 5 Years | 136 (67.7%) | 131 (85.6%) |
| 5 Years | 13 (37.1%) | 0 (0.0%) |
| 6 to 11 Years | 110 (46.4%) | 147 (81.2%) |
| 12 to 14 Years | 54 (78.3%) | 190 (89.2%) |
| 15 Years | 34 (100.0%) | 25 (100.0%) |
| 16 and 17 Years | 117 (100.0%) | 110 (79.7%) |
| 18 to 24 Years | 161 (80.9%) | 162 (92.0%) |
| 25 to 34 Years | 307 (84.3%) | 267 (87.3%) |
| 35 to 44 Years | 274 (71.0%) | 273 (77.6%) |
| 45 to 54 Years | 281 (83.4%) | 321 (75.2%) |
| 55 to 64 Years | 359 (91.1%) | 312 (90.2%) |
| 65 to 74 Years | 338 (98.0%) | 317 (97.8%) |
| 75 Years and over | 229 (89.4%) | 264 (91.0%) |
| Total | 2,413 (81.1%) | 2,519 (85.4%) |
Income Below Poverty Among Married-Couple Families in Maquoketa
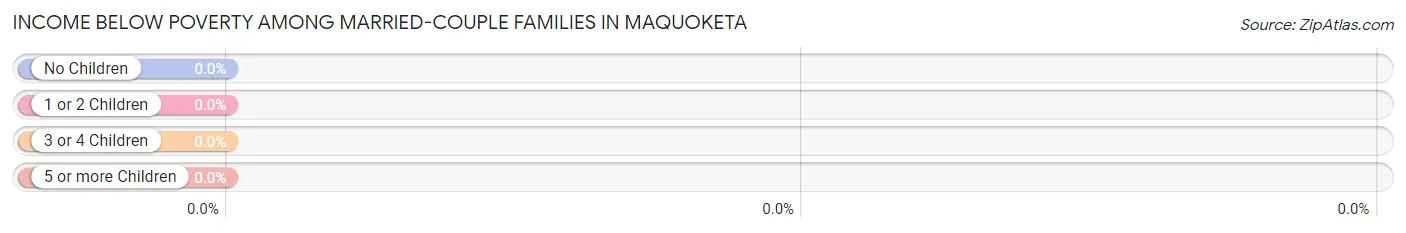
| Children | Above Poverty | Below Poverty |
| No Children | 689 (100.0%) | 0 (0.0%) |
| 1 or 2 Children | 355 (100.0%) | 0 (0.0%) |
| 3 or 4 Children | 67 (100.0%) | 0 (0.0%) |
| 5 or more Children | 0 (0.0%) | 0 (0.0%) |
| Total | 1,111 (100.0%) | 0 (0.0%) |
Income Below Poverty Among Single-Parent Households in Maquoketa
According to the poverty data in Maquoketa, 19.3% or 38 single-father households and 44.1% or 108 single-mother households are living below the poverty line. Among single-father households, those with 3 or 4 children have the highest poverty rate, with 26 households (42.6%) experiencing poverty. Likewise, among single-mother households, those with 3 or 4 children have the highest poverty rate, with 15 households (100.0%) falling below the poverty line.
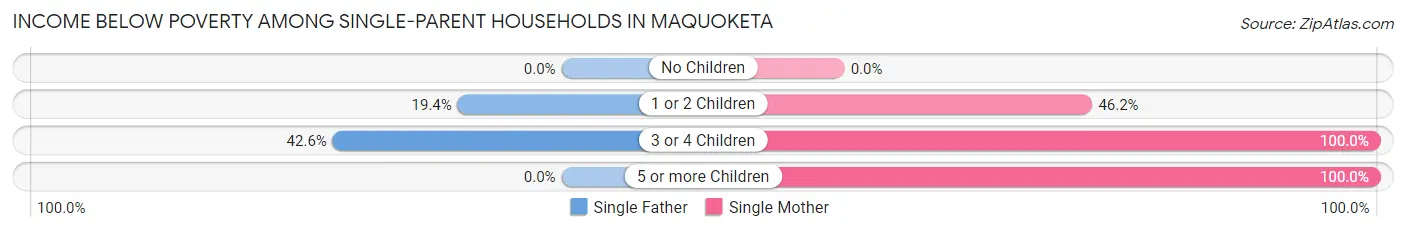
| Children | Single Father | Single Mother |
| No Children | 0 (0.0%) | 0 (0.0%) |
| 1 or 2 Children | 12 (19.4%) | 72 (46.2%) |
| 3 or 4 Children | 26 (42.6%) | 15 (100.0%) |
| 5 or more Children | 0 (0.0%) | 21 (100.0%) |
| Total | 38 (19.3%) | 108 (44.1%) |
Income Below Poverty Among Married-Couple vs Single-Parent Households in Maquoketa
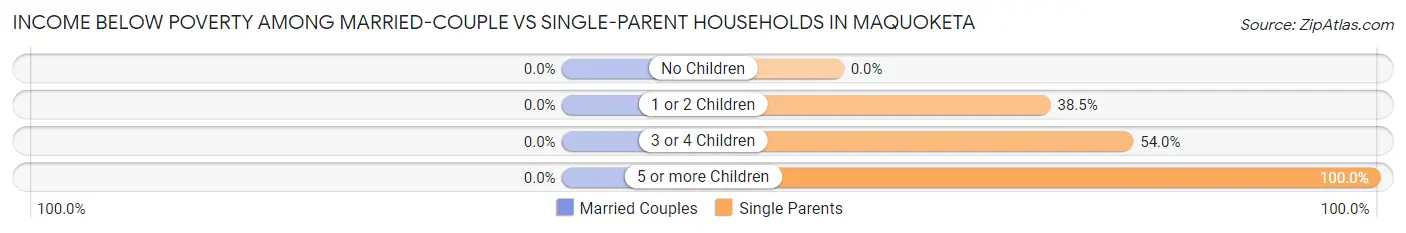
| Children | Married-Couple Families | Single-Parent Households |
| No Children | 0 (0.0%) | 0 (0.0%) |
| 1 or 2 Children | 0 (0.0%) | 84 (38.5%) |
| 3 or 4 Children | 0 (0.0%) | 41 (53.9%) |
| 5 or more Children | 0 (0.0%) | 21 (100.0%) |
| Total | 0 (0.0%) | 146 (33.0%) |
Race in Maquoketa
The most populous races in Maquoketa are White / Caucasian (5,738 | 93.7%), Hawaiian / Pacific (142 | 2.3%), and Black / African American (125 | 2.0%).
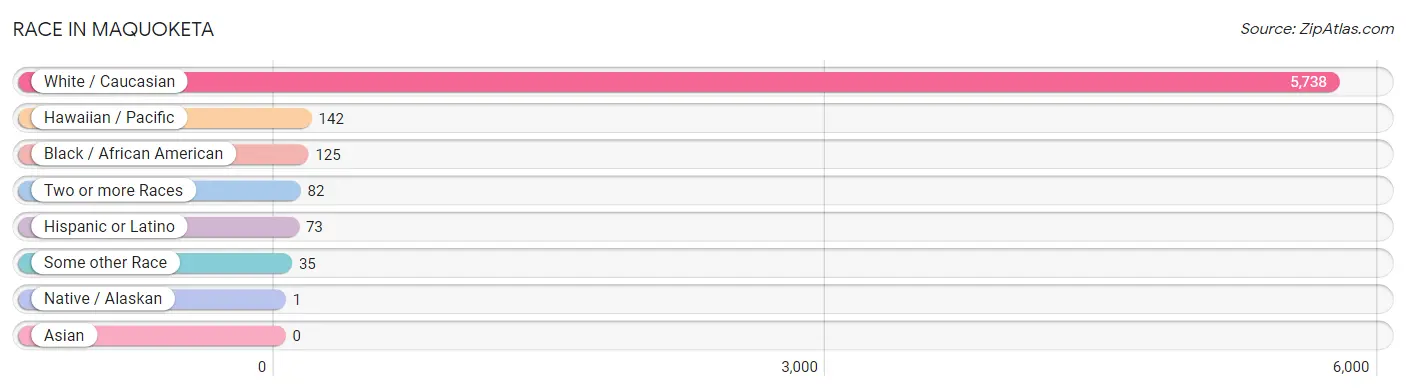
| Race | # Population | % Population |
| Asian | 0 | 0.0% |
| Black / African American | 125 | 2.0% |
| Hawaiian / Pacific | 142 | 2.3% |
| Hispanic or Latino | 73 | 1.2% |
| Native / Alaskan | 1 | 0.0% |
| White / Caucasian | 5,738 | 93.7% |
| Two or more Races | 82 | 1.3% |
| Some other Race | 35 | 0.6% |
| Total | 6,123 | 100.0% |
Ancestry in Maquoketa
The most populous ancestries reported in Maquoketa are German (2,423 | 39.6%), Irish (732 | 11.9%), American (447 | 7.3%), English (371 | 6.1%), and Swedish (201 | 3.3%), together accounting for 68.2% of all Maquoketa residents.
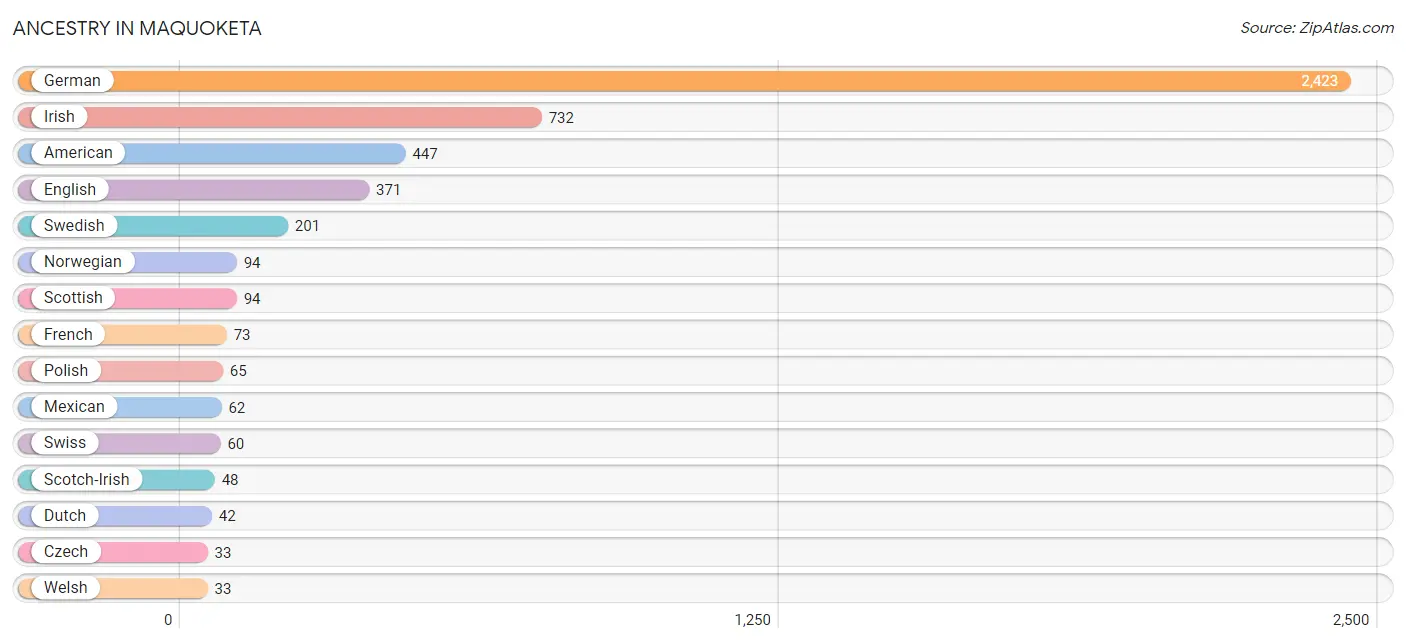
| Ancestry | # Population | % Population |
| American | 447 | 7.3% |
| Austrian | 9 | 0.2% |
| Belgian | 11 | 0.2% |
| British | 14 | 0.2% |
| Czech | 33 | 0.5% |
| Czechoslovakian | 11 | 0.2% |
| Danish | 22 | 0.4% |
| Dutch | 42 | 0.7% |
| Eastern European | 12 | 0.2% |
| English | 371 | 6.1% |
| European | 11 | 0.2% |
| French | 73 | 1.2% |
| German | 2,423 | 39.6% |
| Irish | 732 | 11.9% |
| Italian | 26 | 0.4% |
| Korean | 10 | 0.2% |
| Luxembourger | 6 | 0.1% |
| Mexican | 62 | 1.0% |
| Native Hawaiian | 8 | 0.1% |
| Nigerian | 2 | 0.0% |
| Norwegian | 94 | 1.5% |
| Pennsylvania German | 24 | 0.4% |
| Polish | 65 | 1.1% |
| Romanian | 10 | 0.2% |
| Russian | 10 | 0.2% |
| Scotch-Irish | 48 | 0.8% |
| Scottish | 94 | 1.5% |
| Sioux | 1 | 0.0% |
| Spaniard | 11 | 0.2% |
| Subsaharan African | 2 | 0.0% |
| Swedish | 201 | 3.3% |
| Swiss | 60 | 1.0% |
| Welsh | 33 | 0.5% | View All 33 Rows |
Immigrants in Maquoketa
The most numerous immigrant groups reported in Maquoketa came from Micronesia (92 | 1.5%), Oceania (92 | 1.5%), Central America (15 | 0.2%), Latin America (15 | 0.2%), and Mexico (15 | 0.2%), together accounting for 3.7% of all Maquoketa residents.
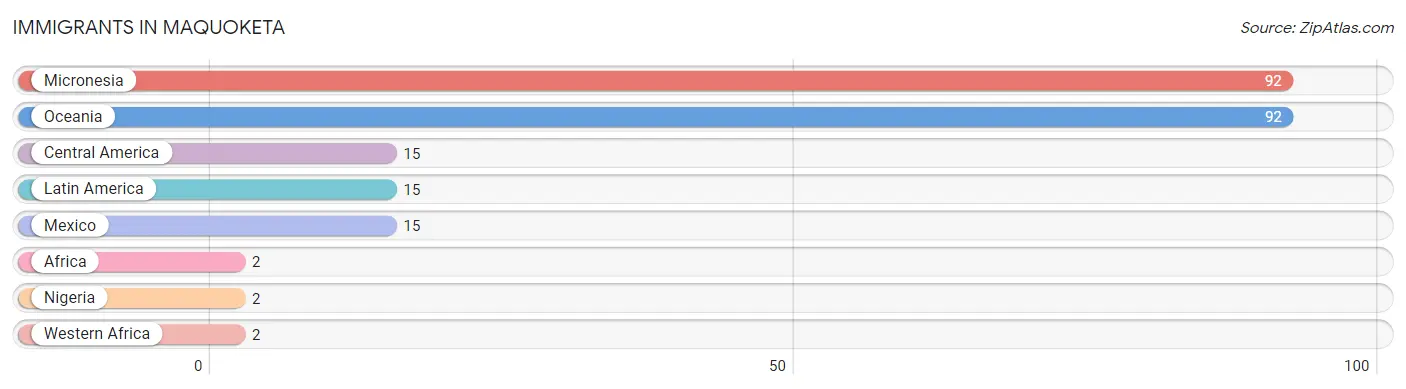
| Immigration Origin | # Population | % Population |
| Africa | 2 | 0.0% |
| Central America | 15 | 0.2% |
| Latin America | 15 | 0.2% |
| Mexico | 15 | 0.2% |
| Micronesia | 92 | 1.5% |
| Nigeria | 2 | 0.0% |
| Oceania | 92 | 1.5% |
| Western Africa | 2 | 0.0% | View All 8 Rows |
Sex and Age in Maquoketa
Sex and Age in Maquoketa
The most populous age groups in Maquoketa are 35 to 39 Years (338 | 11.0%) for men and 10 to 14 Years (292 | 9.6%) for women.
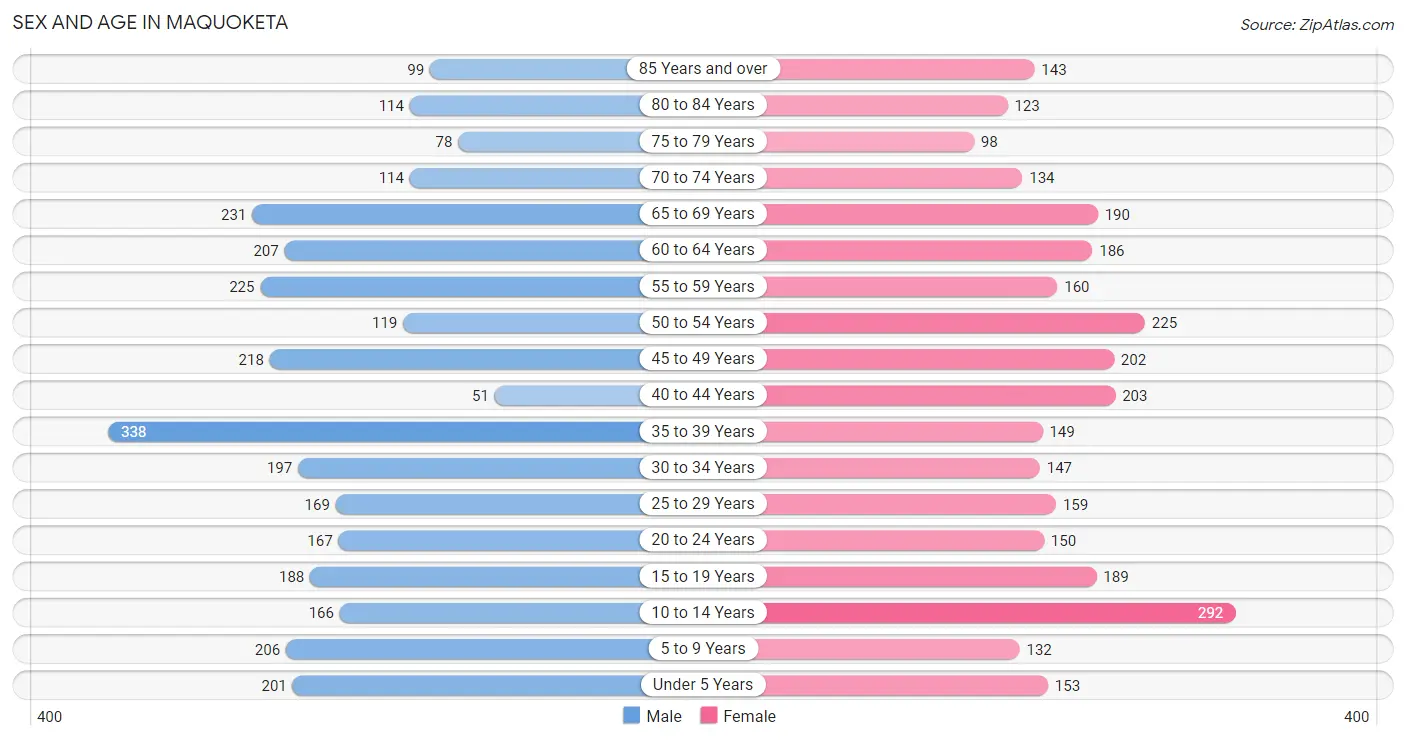
| Age Bracket | Male | Female |
| Under 5 Years | 201 (6.5%) | 153 (5.0%) |
| 5 to 9 Years | 206 (6.7%) | 132 (4.3%) |
| 10 to 14 Years | 166 (5.4%) | 292 (9.6%) |
| 15 to 19 Years | 188 (6.1%) | 189 (6.2%) |
| 20 to 24 Years | 167 (5.4%) | 150 (4.9%) |
| 25 to 29 Years | 169 (5.5%) | 159 (5.2%) |
| 30 to 34 Years | 197 (6.4%) | 147 (4.8%) |
| 35 to 39 Years | 338 (11.0%) | 149 (4.9%) |
| 40 to 44 Years | 51 (1.7%) | 203 (6.7%) |
| 45 to 49 Years | 218 (7.1%) | 202 (6.7%) |
| 50 to 54 Years | 119 (3.8%) | 225 (7.4%) |
| 55 to 59 Years | 225 (7.3%) | 160 (5.3%) |
| 60 to 64 Years | 207 (6.7%) | 186 (6.1%) |
| 65 to 69 Years | 231 (7.5%) | 190 (6.3%) |
| 70 to 74 Years | 114 (3.7%) | 134 (4.4%) |
| 75 to 79 Years | 78 (2.5%) | 98 (3.2%) |
| 80 to 84 Years | 114 (3.7%) | 123 (4.1%) |
| 85 Years and over | 99 (3.2%) | 143 (4.7%) |
| Total | 3,088 (100.0%) | 3,035 (100.0%) |
Families and Households in Maquoketa
Median Family Size in Maquoketa
The median family size in Maquoketa is 2.88 persons per family, with single female/mother families (245 | 15.8%) accounting for the largest median family size of 3 persons per family. On the other hand, single male/father families (197 | 12.7%) represent the smallest median family size with 2.85 persons per family.
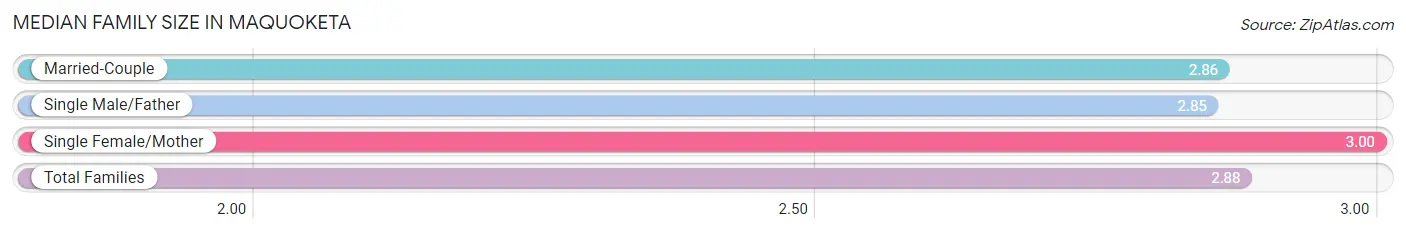
| Family Type | # Families | Family Size |
| Married-Couple | 1,111 (71.5%) | 2.86 |
| Single Male/Father | 197 (12.7%) | 2.85 |
| Single Female/Mother | 245 (15.8%) | 3.00 |
| Total Families | 1,553 (100.0%) | 2.88 |
Median Household Size in Maquoketa
The median household size in Maquoketa is 2.32 persons per household, with single male/father households (197 | 7.7%) accounting for the largest median household size of 3.14 persons per household. non-family households (1,007 | 39.3%) represent the smallest median household size with 1.36 persons per household.
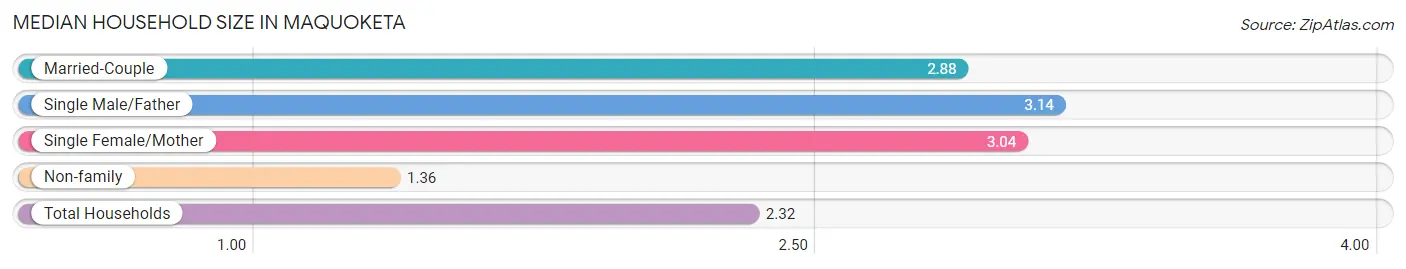
| Household Type | # Households | Household Size |
| Married-Couple | 1,111 (43.4%) | 2.88 |
| Single Male/Father | 197 (7.7%) | 3.14 |
| Single Female/Mother | 245 (9.6%) | 3.04 |
| Non-family | 1,007 (39.3%) | 1.36 |
| Total Households | 2,560 (100.0%) | 2.32 |
Household Size by Marriage Status in Maquoketa
Out of a total of 2,560 households in Maquoketa, 1,553 (60.7%) are family households, while 1,007 (39.3%) are nonfamily households. The most numerous type of family households are 2-person households, comprising 741, and the most common type of nonfamily households are 1-person households, comprising 772.
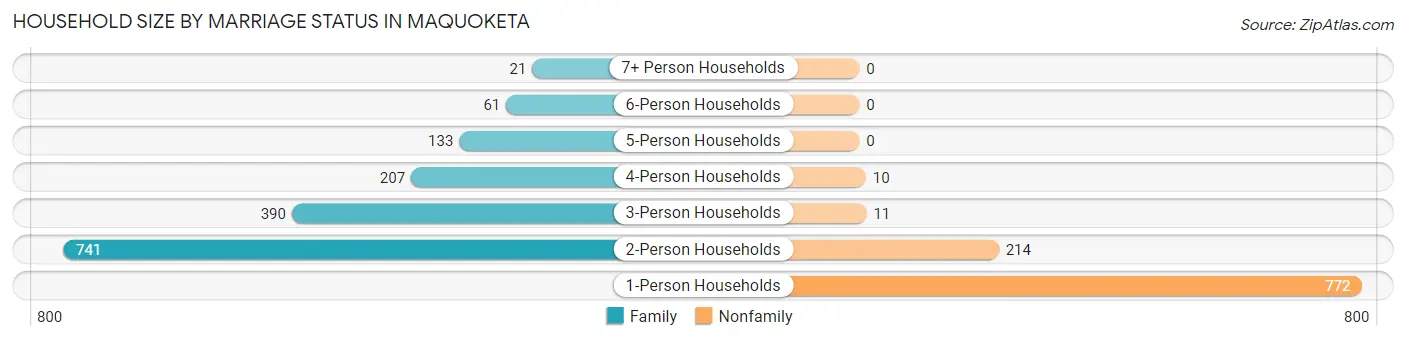
| Household Size | Family Households | Nonfamily Households |
| 1-Person Households | - | 772 (30.2%) |
| 2-Person Households | 741 (28.9%) | 214 (8.4%) |
| 3-Person Households | 390 (15.2%) | 11 (0.4%) |
| 4-Person Households | 207 (8.1%) | 10 (0.4%) |
| 5-Person Households | 133 (5.2%) | 0 (0.0%) |
| 6-Person Households | 61 (2.4%) | 0 (0.0%) |
| 7+ Person Households | 21 (0.8%) | 0 (0.0%) |
| Total | 1,553 (60.7%) | 1,007 (39.3%) |
Female Fertility in Maquoketa
Fertility by Age in Maquoketa
Average fertility rate in Maquoketa is 63.0 births per 1,000 women. Women in the age bracket of 20 to 34 years have the highest fertility rate with 169.0 births per 1,000 women. Women in the age bracket of 20 to 34 years acount for 100.0% of all women with births.
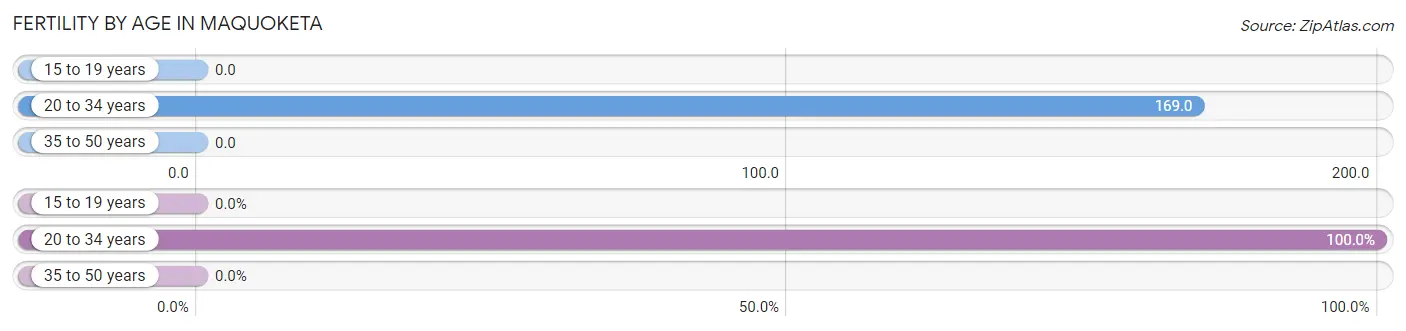
| Age Bracket | Women with Births | Births / 1,000 Women |
| 15 to 19 years | 0 (0.0%) | 0.0 |
| 20 to 34 years | 77 (100.0%) | 169.0 |
| 35 to 50 years | 0 (0.0%) | 0.0 |
| Total | 77 (100.0%) | 63.0 |
Fertility by Age by Marriage Status in Maquoketa
71.4% of women with births (77) in Maquoketa are married. The highest percentage of unmarried women with births falls into 20 to 34 years age bracket with 28.6% of them unmarried at the time of birth, while the lowest percentage of unmarried women with births belong to 20 to 34 years age bracket with 28.6% of them unmarried.
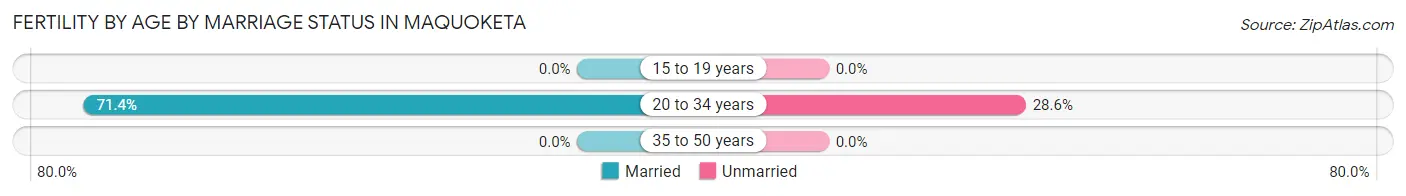
| Age Bracket | Married | Unmarried |
| 15 to 19 years | 0 (0.0%) | 0 (0.0%) |
| 20 to 34 years | 55 (71.4%) | 22 (28.6%) |
| 35 to 50 years | 0 (0.0%) | 0 (0.0%) |
| Total | 55 (71.4%) | 22 (28.6%) |
Fertility by Education in Maquoketa
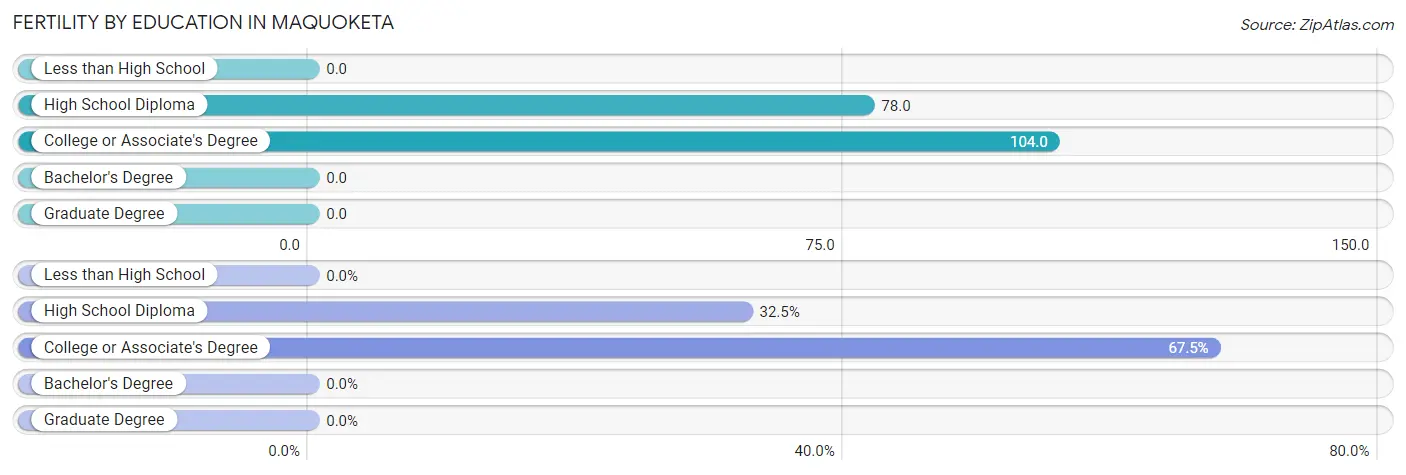
| Educational Attainment | Women with Births | Births / 1,000 Women |
| Less than High School | 0 (0.0%) | 0.0 |
| High School Diploma | 25 (32.5%) | 78.0 |
| College or Associate's Degree | 52 (67.5%) | 104.0 |
| Bachelor's Degree | 0 (0.0%) | 0.0 |
| Graduate Degree | 0 (0.0%) | 0.0 |
| Total | 77 (100.0%) | 63.0 |
Fertility by Education by Marriage Status in Maquoketa
28.6% of women with births in Maquoketa are unmarried. Women with the educational attainment of college or associate's degree are most likely to be married with 76.9% of them married at childbirth, while women with the educational attainment of high school diploma are least likely to be married with 40.0% of them unmarried at childbirth.
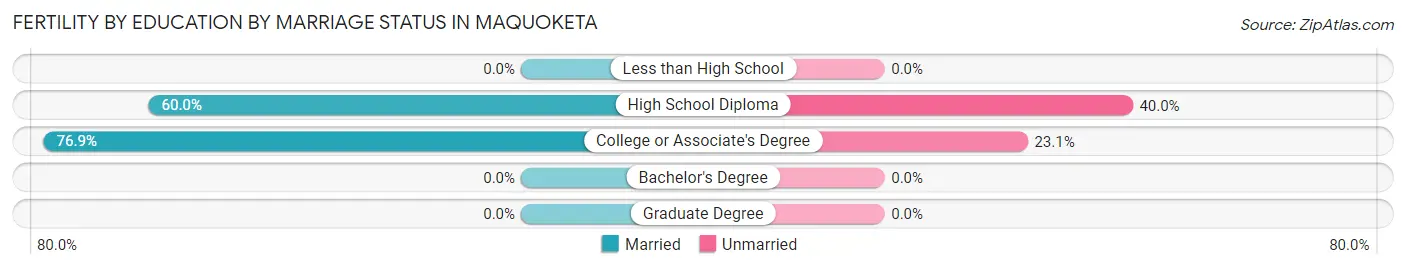
| Educational Attainment | Married | Unmarried |
| Less than High School | 0 (0.0%) | 0 (0.0%) |
| High School Diploma | 15 (60.0%) | 10 (40.0%) |
| College or Associate's Degree | 40 (76.9%) | 12 (23.1%) |
| Bachelor's Degree | 0 (0.0%) | 0 (0.0%) |
| Graduate Degree | 0 (0.0%) | 0 (0.0%) |
| Total | 55 (71.4%) | 22 (28.6%) |
Employment Characteristics in Maquoketa
Employment by Class of Employer in Maquoketa
Among the 2,633 employed individuals in Maquoketa, private company employees (1,823 | 69.2%), local government employees (209 | 7.9%), and not-for-profit organizations (183 | 7.0%) make up the most common classes of employment.
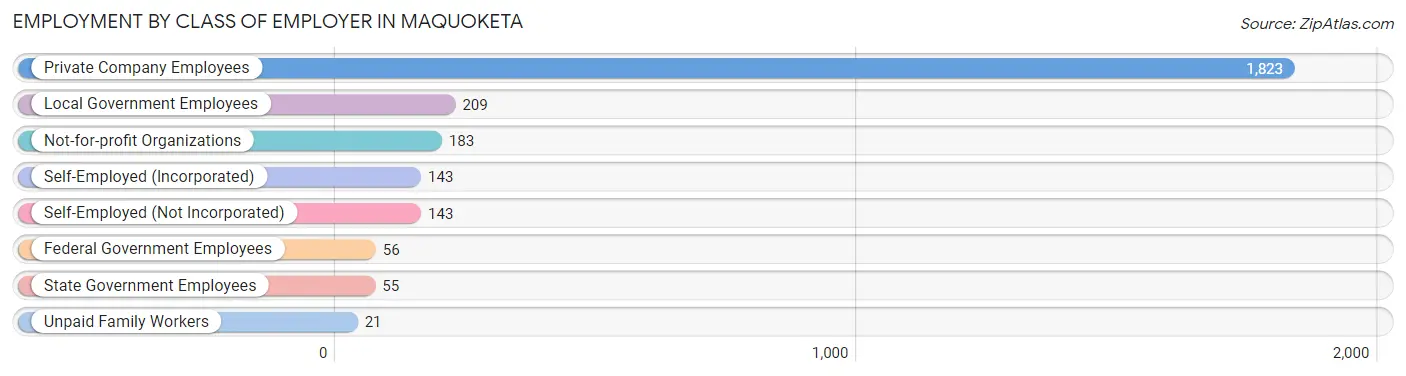
| Employer Class | # Employees | % Employees |
| Private Company Employees | 1,823 | 69.2% |
| Self-Employed (Incorporated) | 143 | 5.4% |
| Self-Employed (Not Incorporated) | 143 | 5.4% |
| Not-for-profit Organizations | 183 | 7.0% |
| Local Government Employees | 209 | 7.9% |
| State Government Employees | 55 | 2.1% |
| Federal Government Employees | 56 | 2.1% |
| Unpaid Family Workers | 21 | 0.8% |
| Total | 2,633 | 100.0% |
Employment Status by Age in Maquoketa
According to the labor force statistics for Maquoketa, out of the total population over 16 years of age (4,914), 58.9% or 2,894 individuals are in the labor force, with 7.4% or 214 of them unemployed. The age group with the highest labor force participation rate is 30 to 34 years, with 87.5% or 301 individuals in the labor force. Within the labor force, the 45 to 54 years age range has the highest percentage of unemployed individuals, with 15.5% or 101 of them being unemployed.
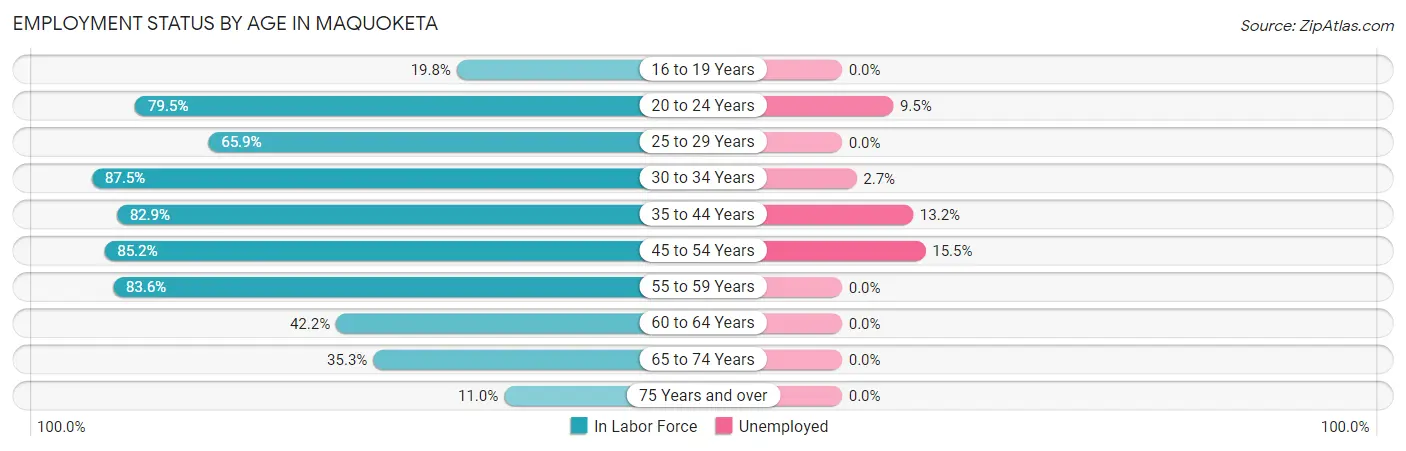
| Age Bracket | In Labor Force | Unemployed |
| 16 to 19 Years | 63 (19.8%) | 0 (0.0%) |
| 20 to 24 Years | 252 (79.5%) | 24 (9.5%) |
| 25 to 29 Years | 216 (65.9%) | 0 (0.0%) |
| 30 to 34 Years | 301 (87.5%) | 8 (2.7%) |
| 35 to 44 Years | 614 (82.9%) | 81 (13.2%) |
| 45 to 54 Years | 651 (85.2%) | 101 (15.5%) |
| 55 to 59 Years | 322 (83.6%) | 0 (0.0%) |
| 60 to 64 Years | 166 (42.2%) | 0 (0.0%) |
| 65 to 74 Years | 236 (35.3%) | 0 (0.0%) |
| 75 Years and over | 72 (11.0%) | 0 (0.0%) |
| Total | 2,894 (58.9%) | 214 (7.4%) |
Employment Status by Educational Attainment in Maquoketa
According to labor force statistics for Maquoketa, 76.8% of individuals (2,269) out of the total population between 25 and 64 years of age (2,955) are in the labor force, with 8.4% or 191 of them being unemployed. The group with the highest labor force participation rate are those with the educational attainment of bachelor's degree or higher, with 79.9% or 358 individuals in the labor force. Within the labor force, individuals with high school diploma education have the highest percentage of unemployment, with 18.9% or 170 of them being unemployed.
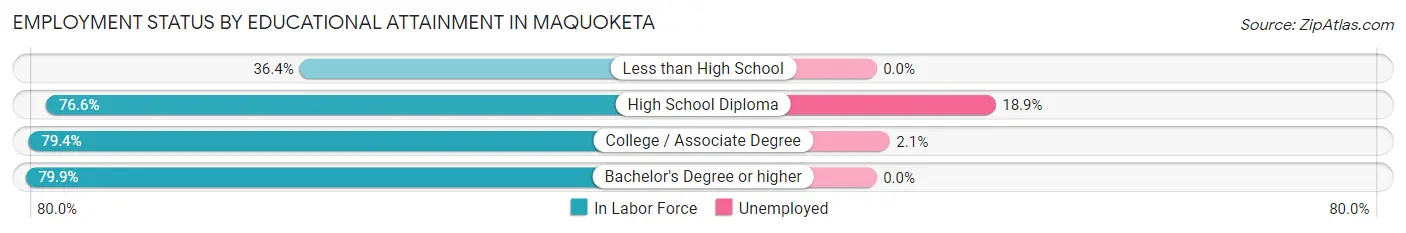
| Educational Attainment | In Labor Force | Unemployed |
| Less than High School | 39 (36.4%) | 0 (0.0%) |
| High School Diploma | 901 (76.6%) | 222 (18.9%) |
| College / Associate Degree | 972 (79.4%) | 26 (2.1%) |
| Bachelor's Degree or higher | 358 (79.9%) | 0 (0.0%) |
| Total | 2,269 (76.8%) | 248 (8.4%) |
Employment Occupations by Sex in Maquoketa
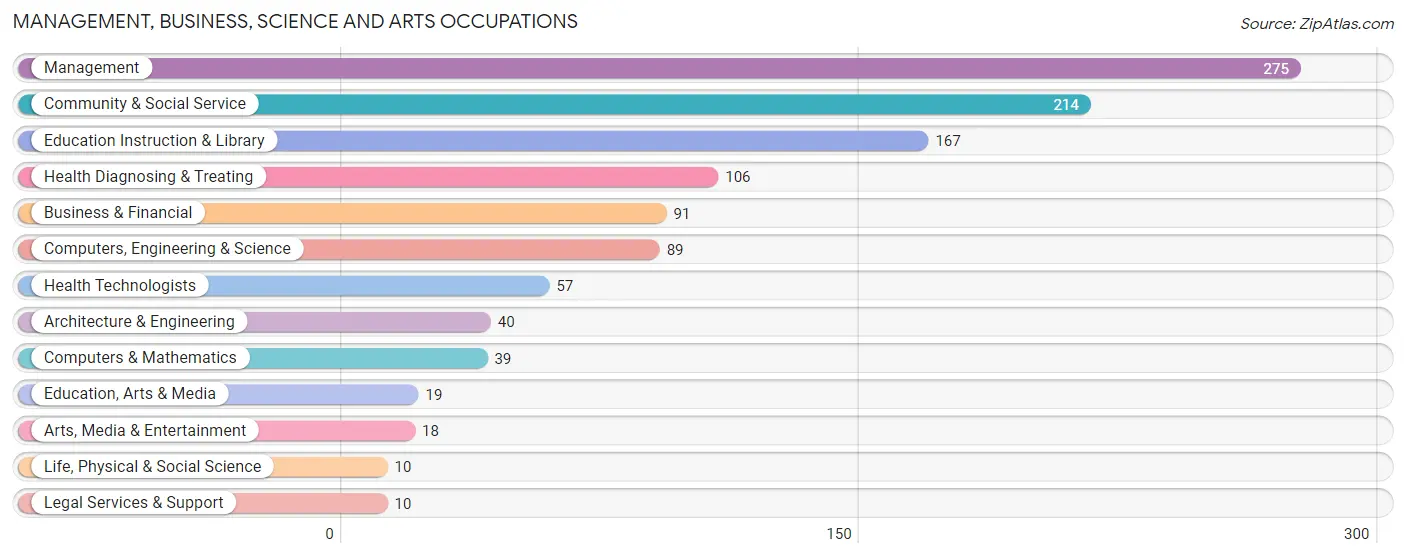
Management, Business, Science and Arts Occupations
The most common Management, Business, Science and Arts occupations in Maquoketa are Management (275 | 10.3%), Community & Social Service (214 | 8.0%), Education Instruction & Library (167 | 6.2%), Health Diagnosing & Treating (106 | 4.0%), and Business & Financial (91 | 3.4%).
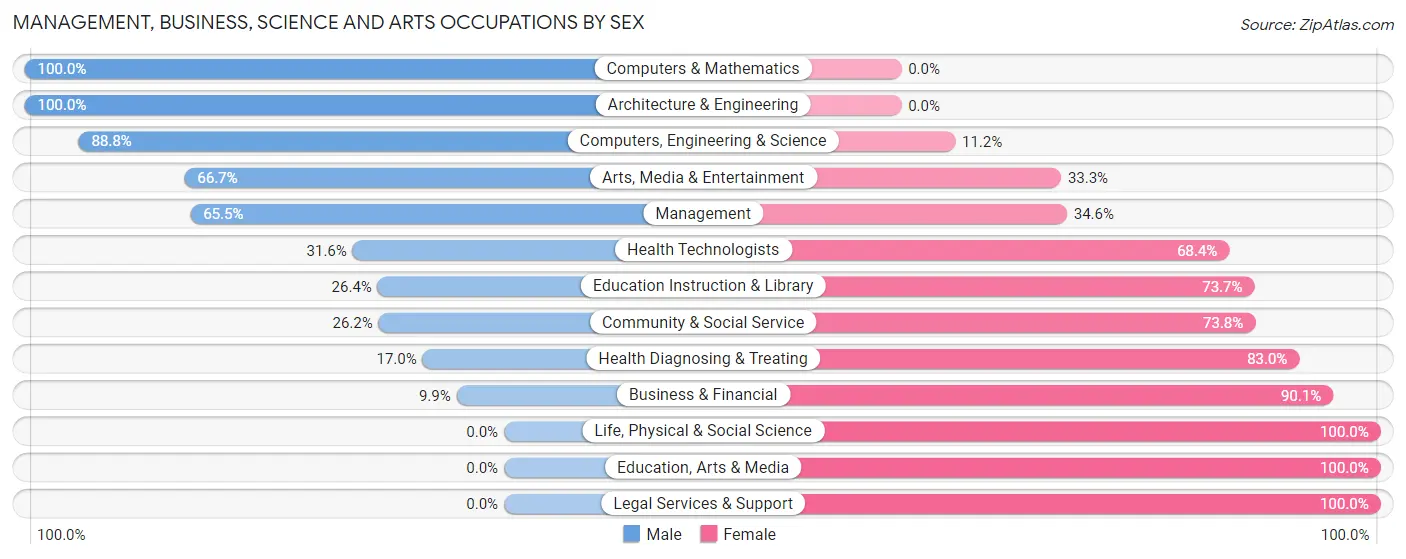
Management, Business, Science and Arts Occupations by Sex
Within the Management, Business, Science and Arts occupations in Maquoketa, the most male-oriented occupations are Computers & Mathematics (100.0%), Architecture & Engineering (100.0%), and Computers, Engineering & Science (88.8%), while the most female-oriented occupations are Life, Physical & Social Science (100.0%), Education, Arts & Media (100.0%), and Legal Services & Support (100.0%).
| Occupation | Male | Female |
| Management | 180 (65.4%) | 95 (34.5%) |
| Business & Financial | 9 (9.9%) | 82 (90.1%) |
| Computers, Engineering & Science | 79 (88.8%) | 10 (11.2%) |
| Computers & Mathematics | 39 (100.0%) | 0 (0.0%) |
| Architecture & Engineering | 40 (100.0%) | 0 (0.0%) |
| Life, Physical & Social Science | 0 (0.0%) | 10 (100.0%) |
| Community & Social Service | 56 (26.2%) | 158 (73.8%) |
| Education, Arts & Media | 0 (0.0%) | 19 (100.0%) |
| Legal Services & Support | 0 (0.0%) | 10 (100.0%) |
| Education Instruction & Library | 44 (26.4%) | 123 (73.7%) |
| Arts, Media & Entertainment | 12 (66.7%) | 6 (33.3%) |
| Health Diagnosing & Treating | 18 (17.0%) | 88 (83.0%) |
| Health Technologists | 18 (31.6%) | 39 (68.4%) |
| Total (Category) | 342 (44.1%) | 433 (55.9%) |
| Total (Overall) | 1,478 (55.2%) | 1,201 (44.8%) |
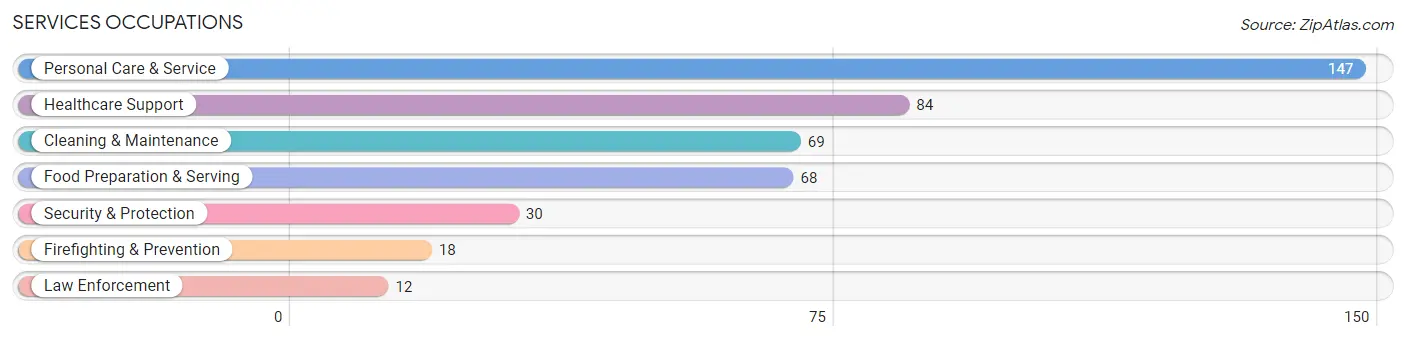
Services Occupations
The most common Services occupations in Maquoketa are Personal Care & Service (147 | 5.5%), Healthcare Support (84 | 3.1%), Cleaning & Maintenance (69 | 2.6%), Food Preparation & Serving (68 | 2.5%), and Security & Protection (30 | 1.1%).
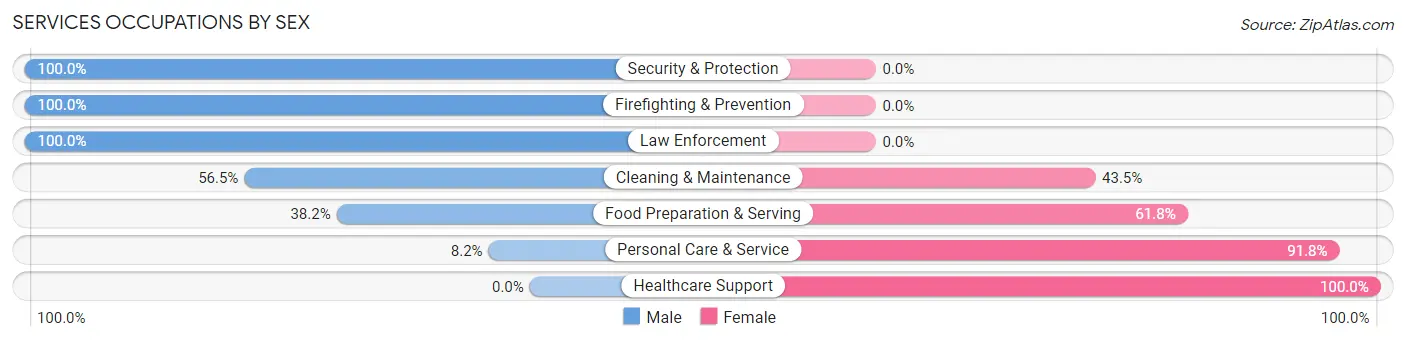
Services Occupations by Sex
Within the Services occupations in Maquoketa, the most male-oriented occupations are Security & Protection (100.0%), Firefighting & Prevention (100.0%), and Law Enforcement (100.0%), while the most female-oriented occupations are Healthcare Support (100.0%), Personal Care & Service (91.8%), and Food Preparation & Serving (61.8%).
| Occupation | Male | Female |
| Healthcare Support | 0 (0.0%) | 84 (100.0%) |
| Security & Protection | 30 (100.0%) | 0 (0.0%) |
| Firefighting & Prevention | 18 (100.0%) | 0 (0.0%) |
| Law Enforcement | 12 (100.0%) | 0 (0.0%) |
| Food Preparation & Serving | 26 (38.2%) | 42 (61.8%) |
| Cleaning & Maintenance | 39 (56.5%) | 30 (43.5%) |
| Personal Care & Service | 12 (8.2%) | 135 (91.8%) |
| Total (Category) | 107 (26.9%) | 291 (73.1%) |
| Total (Overall) | 1,478 (55.2%) | 1,201 (44.8%) |
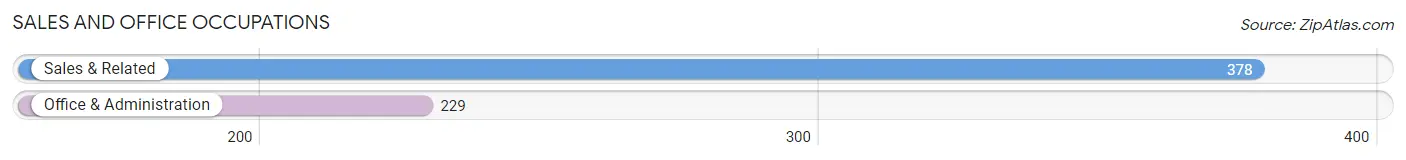
Sales and Office Occupations
The most common Sales and Office occupations in Maquoketa are Sales & Related (378 | 14.1%), and Office & Administration (229 | 8.6%).
Sales and Office Occupations by Sex
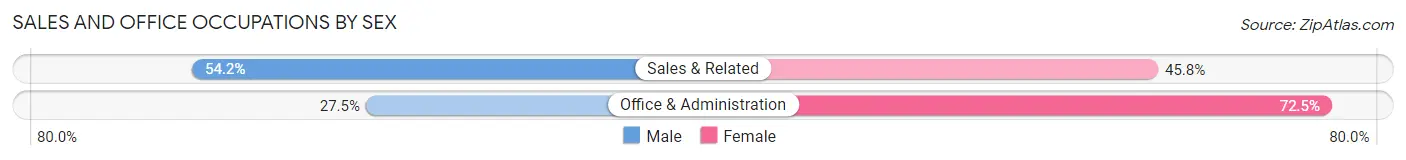
| Occupation | Male | Female |
| Sales & Related | 205 (54.2%) | 173 (45.8%) |
| Office & Administration | 63 (27.5%) | 166 (72.5%) |
| Total (Category) | 268 (44.2%) | 339 (55.8%) |
| Total (Overall) | 1,478 (55.2%) | 1,201 (44.8%) |
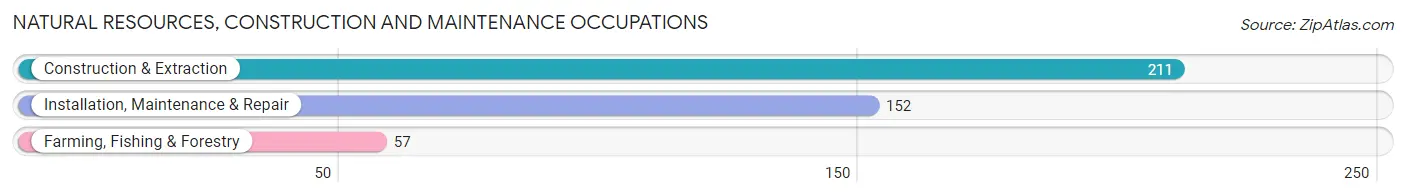
Natural Resources, Construction and Maintenance Occupations
The most common Natural Resources, Construction and Maintenance occupations in Maquoketa are Construction & Extraction (211 | 7.9%), Installation, Maintenance & Repair (152 | 5.7%), and Farming, Fishing & Forestry (57 | 2.1%).
Natural Resources, Construction and Maintenance Occupations by Sex
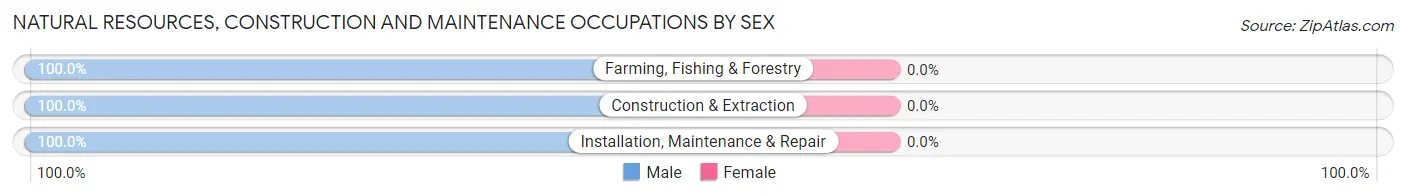
| Occupation | Male | Female |
| Farming, Fishing & Forestry | 57 (100.0%) | 0 (0.0%) |
| Construction & Extraction | 211 (100.0%) | 0 (0.0%) |
| Installation, Maintenance & Repair | 152 (100.0%) | 0 (0.0%) |
| Total (Category) | 420 (100.0%) | 0 (0.0%) |
| Total (Overall) | 1,478 (55.2%) | 1,201 (44.8%) |
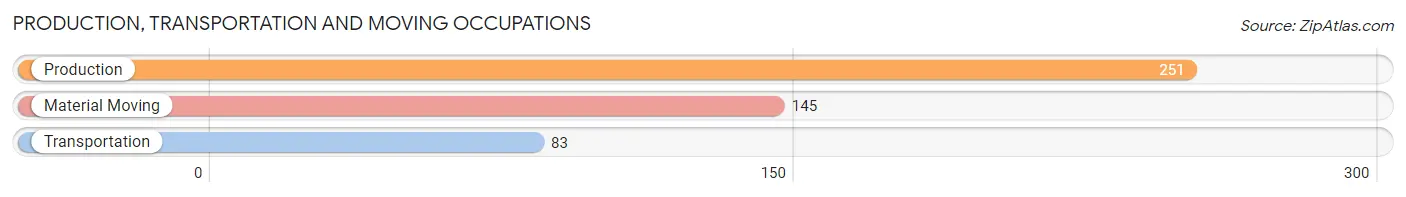
Production, Transportation and Moving Occupations
The most common Production, Transportation and Moving occupations in Maquoketa are Production (251 | 9.4%), Material Moving (145 | 5.4%), and Transportation (83 | 3.1%).
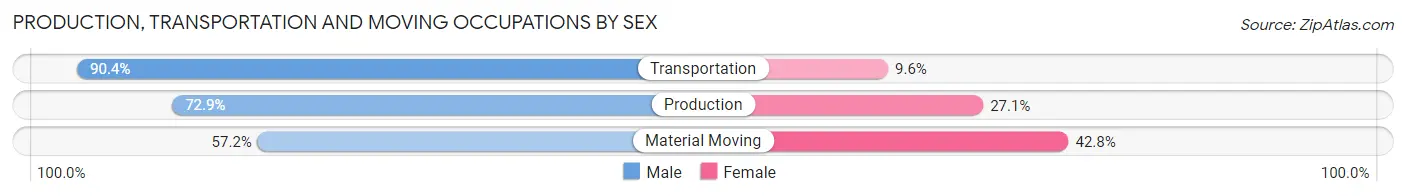
Production, Transportation and Moving Occupations by Sex
| Occupation | Male | Female |
| Production | 183 (72.9%) | 68 (27.1%) |
| Transportation | 75 (90.4%) | 8 (9.6%) |
| Material Moving | 83 (57.2%) | 62 (42.8%) |
| Total (Category) | 341 (71.2%) | 138 (28.8%) |
| Total (Overall) | 1,478 (55.2%) | 1,201 (44.8%) |
Employment Industries by Sex in Maquoketa
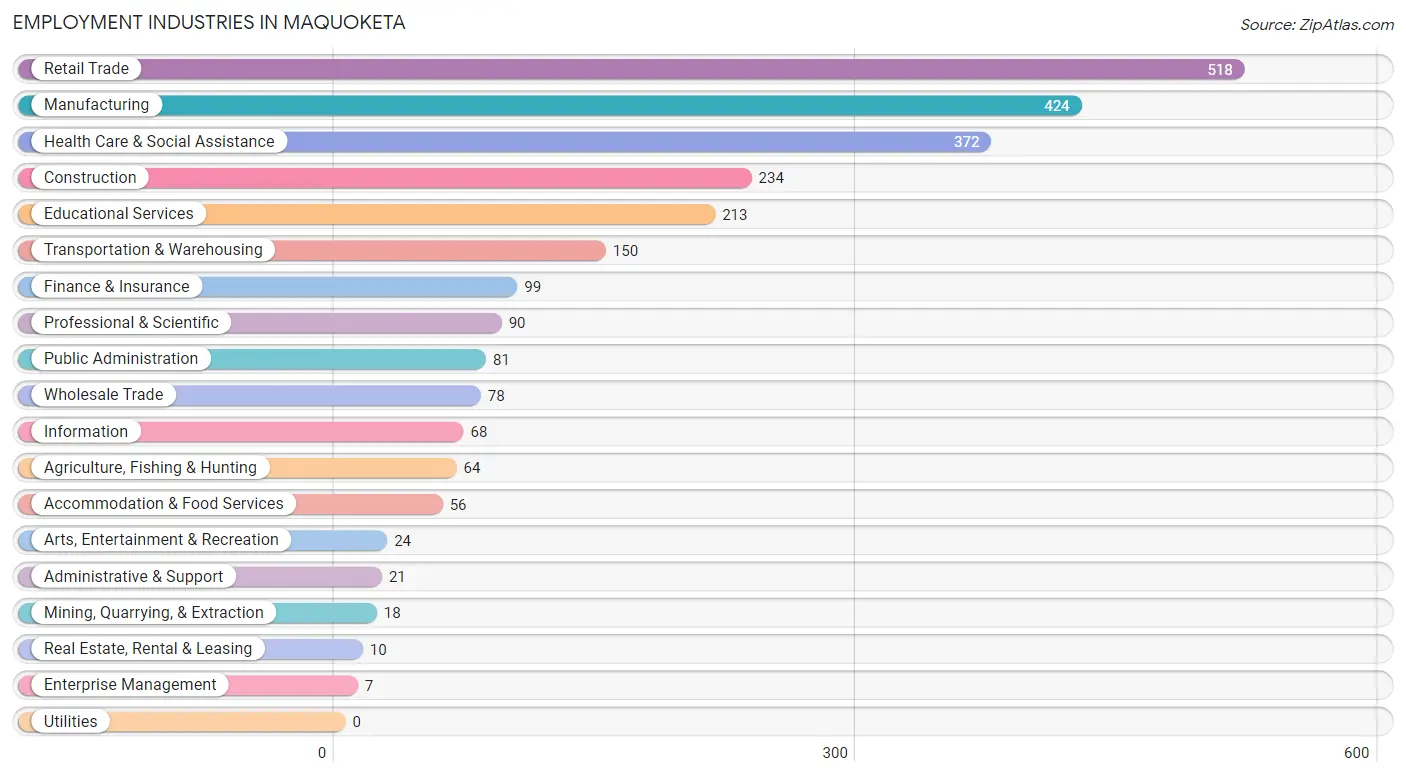
Employment Industries in Maquoketa
The major employment industries in Maquoketa include Retail Trade (518 | 19.3%), Manufacturing (424 | 15.8%), Health Care & Social Assistance (372 | 13.9%), Construction (234 | 8.7%), and Educational Services (213 | 8.0%).
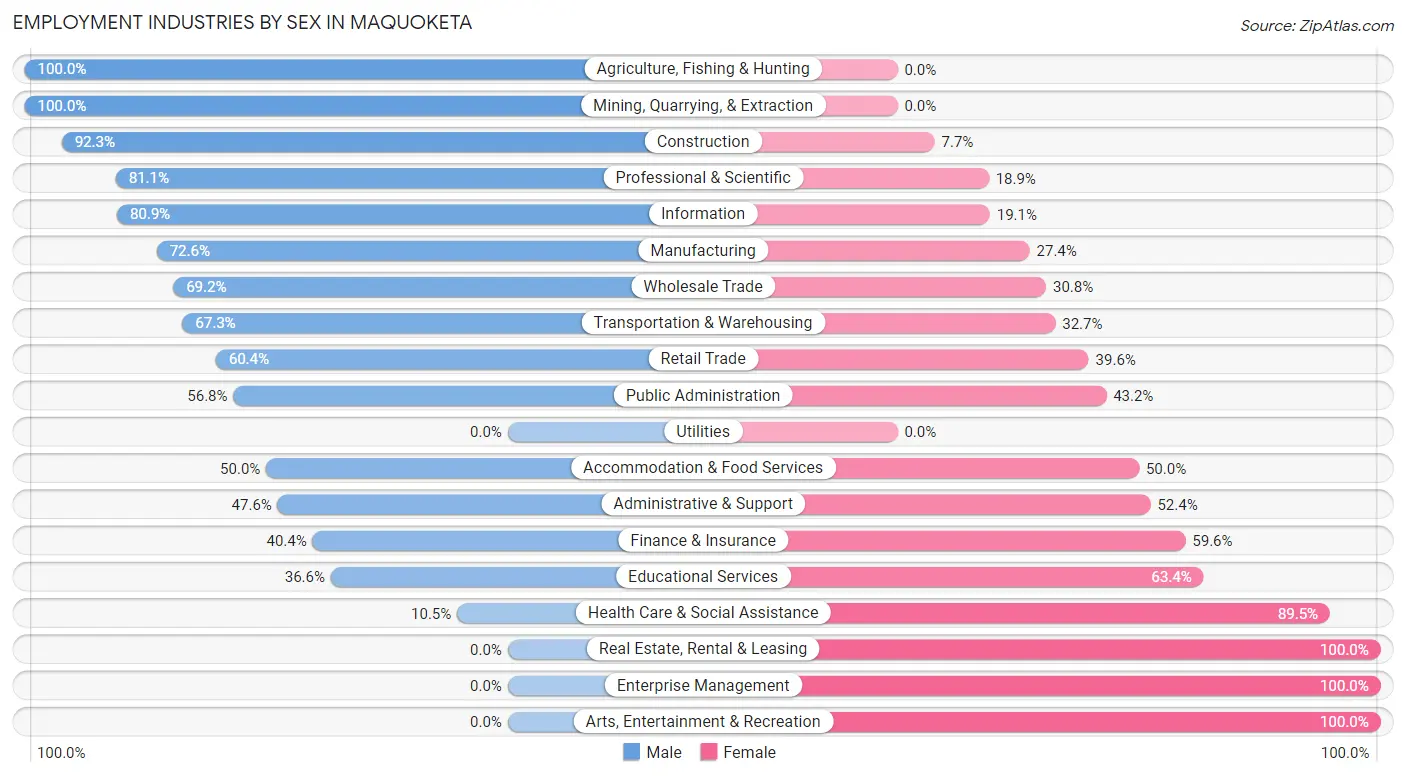
Employment Industries by Sex in Maquoketa
The Maquoketa industries that see more men than women are Agriculture, Fishing & Hunting (100.0%), Mining, Quarrying, & Extraction (100.0%), and Construction (92.3%), whereas the industries that tend to have a higher number of women are Real Estate, Rental & Leasing (100.0%), Enterprise Management (100.0%), and Arts, Entertainment & Recreation (100.0%).
| Industry | Male | Female |
| Agriculture, Fishing & Hunting | 64 (100.0%) | 0 (0.0%) |
| Mining, Quarrying, & Extraction | 18 (100.0%) | 0 (0.0%) |
| Construction | 216 (92.3%) | 18 (7.7%) |
| Manufacturing | 308 (72.6%) | 116 (27.4%) |
| Wholesale Trade | 54 (69.2%) | 24 (30.8%) |
| Retail Trade | 313 (60.4%) | 205 (39.6%) |
| Transportation & Warehousing | 101 (67.3%) | 49 (32.7%) |
| Utilities | 0 (0.0%) | 0 (0.0%) |
| Information | 55 (80.9%) | 13 (19.1%) |
| Finance & Insurance | 40 (40.4%) | 59 (59.6%) |
| Real Estate, Rental & Leasing | 0 (0.0%) | 10 (100.0%) |
| Professional & Scientific | 73 (81.1%) | 17 (18.9%) |
| Enterprise Management | 0 (0.0%) | 7 (100.0%) |
| Administrative & Support | 10 (47.6%) | 11 (52.4%) |
| Educational Services | 78 (36.6%) | 135 (63.4%) |
| Health Care & Social Assistance | 39 (10.5%) | 333 (89.5%) |
| Arts, Entertainment & Recreation | 0 (0.0%) | 24 (100.0%) |
| Accommodation & Food Services | 28 (50.0%) | 28 (50.0%) |
| Public Administration | 46 (56.8%) | 35 (43.2%) |
| Total | 1,478 (55.2%) | 1,201 (44.8%) |
Education in Maquoketa
School Enrollment in Maquoketa
The most common levels of schooling among the 1,305 students in Maquoketa are middle school (384 | 29.4%), high school (367 | 28.1%), and elementary school (262 | 20.1%).
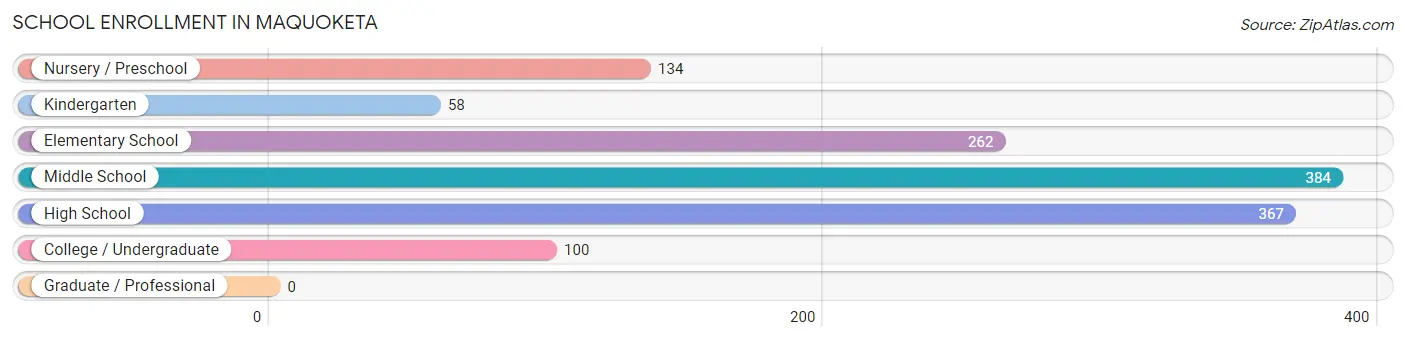
| School Level | # Students | % Students |
| Nursery / Preschool | 134 | 10.3% |
| Kindergarten | 58 | 4.4% |
| Elementary School | 262 | 20.1% |
| Middle School | 384 | 29.4% |
| High School | 367 | 28.1% |
| College / Undergraduate | 100 | 7.7% |
| Graduate / Professional | 0 | 0.0% |
| Total | 1,305 | 100.0% |
School Enrollment by Age by Funding Source in Maquoketa
Out of a total of 1,305 students who are enrolled in schools in Maquoketa, 78 (6.0%) attend a private institution, while the remaining 1,227 (94.0%) are enrolled in public schools. The age group of 35 years and over has the highest likelihood of being enrolled in private schools, with 9 (42.9% in the age bracket) enrolled. Conversely, the age group of 15 to 17 year olds has the lowest likelihood of being enrolled in a private school, with 314 (100.0% in the age bracket) attending a public institution.
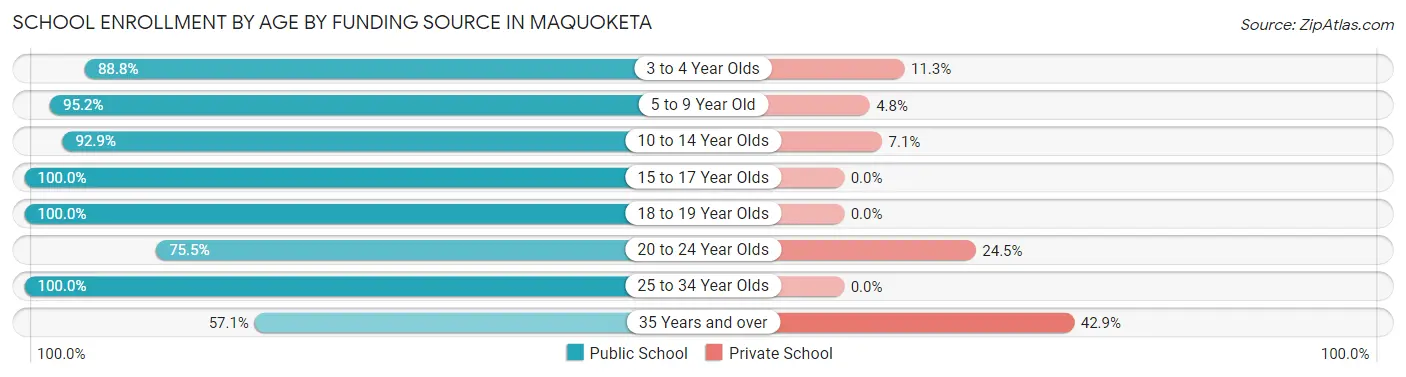
| Age Bracket | Public School | Private School |
| 3 to 4 Year Olds | 71 (88.7%) | 9 (11.3%) |
| 5 to 9 Year Old | 320 (95.2%) | 16 (4.8%) |
| 10 to 14 Year Olds | 408 (92.9%) | 31 (7.1%) |
| 15 to 17 Year Olds | 314 (100.0%) | 0 (0.0%) |
| 18 to 19 Year Olds | 36 (100.0%) | 0 (0.0%) |
| 20 to 24 Year Olds | 40 (75.5%) | 13 (24.5%) |
| 25 to 34 Year Olds | 26 (100.0%) | 0 (0.0%) |
| 35 Years and over | 12 (57.1%) | 9 (42.9%) |
| Total | 1,227 (94.0%) | 78 (6.0%) |
Educational Attainment by Field of Study in Maquoketa
Education (151 | 20.0%), literature & languages (67 | 8.9%), bio, nature & agricultural (63 | 8.3%), science & technology (63 | 8.3%), and physical & health sciences (55 | 7.3%) are the most common fields of study among 755 individuals in Maquoketa who have obtained a bachelor's degree or higher.
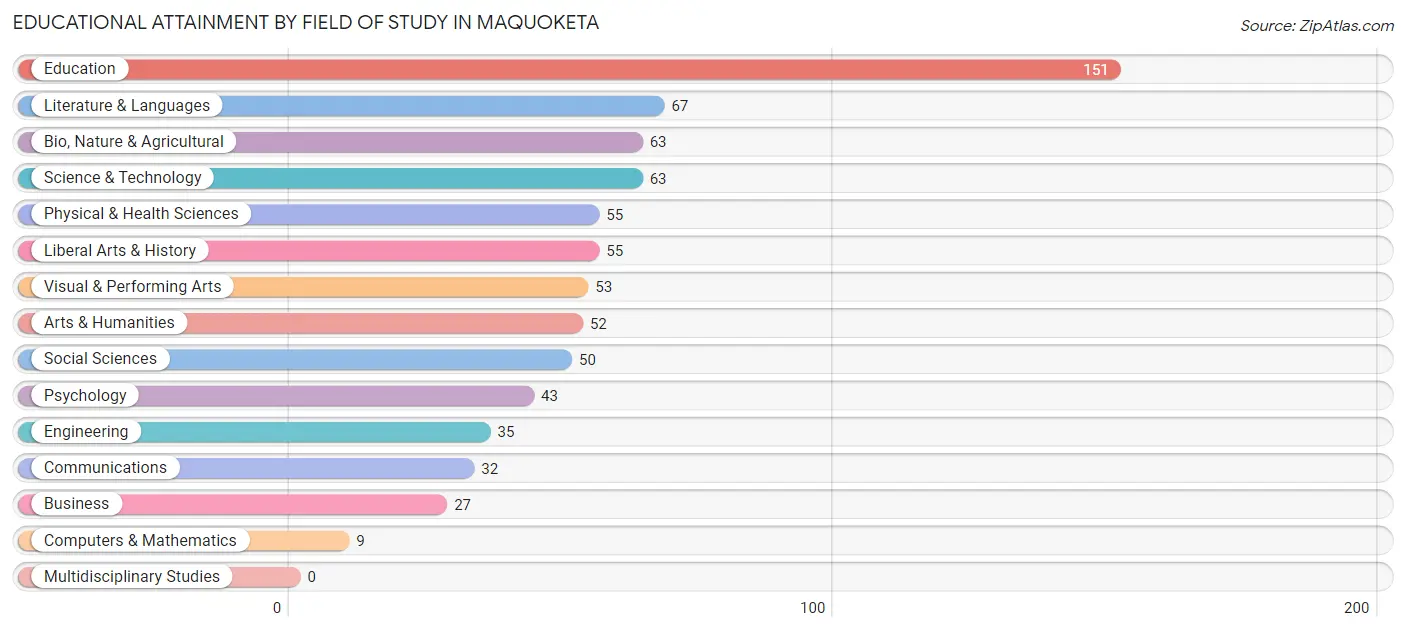
| Field of Study | # Graduates | % Graduates |
| Computers & Mathematics | 9 | 1.2% |
| Bio, Nature & Agricultural | 63 | 8.3% |
| Physical & Health Sciences | 55 | 7.3% |
| Psychology | 43 | 5.7% |
| Social Sciences | 50 | 6.6% |
| Engineering | 35 | 4.6% |
| Multidisciplinary Studies | 0 | 0.0% |
| Science & Technology | 63 | 8.3% |
| Business | 27 | 3.6% |
| Education | 151 | 20.0% |
| Literature & Languages | 67 | 8.9% |
| Liberal Arts & History | 55 | 7.3% |
| Visual & Performing Arts | 53 | 7.0% |
| Communications | 32 | 4.2% |
| Arts & Humanities | 52 | 6.9% |
| Total | 755 | 100.0% |
Transportation & Commute in Maquoketa
Vehicle Availability by Sex in Maquoketa
The most prevalent vehicle ownership categories in Maquoketa are males with 2 vehicles (533, accounting for 36.1%) and females with 2 vehicles (382, making up 46.4%).
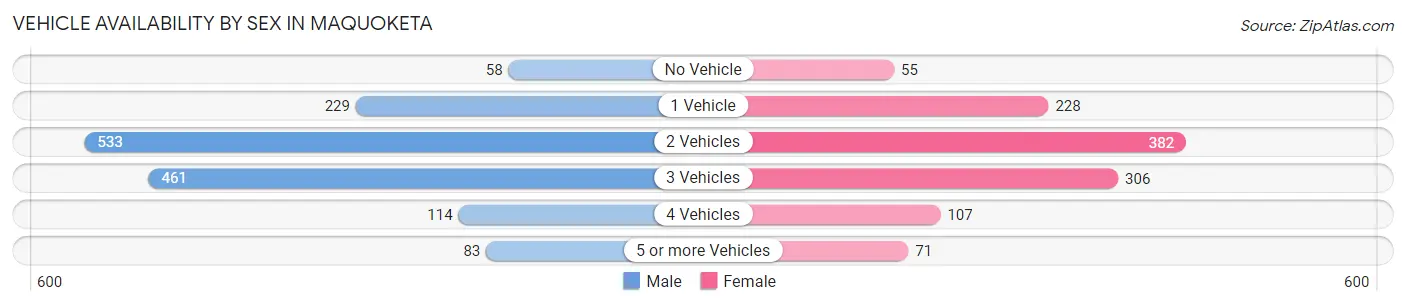
| Vehicles Available | Male | Female |
| No Vehicle | 58 (3.9%) | 55 (4.8%) |
| 1 Vehicle | 229 (15.5%) | 228 (19.8%) |
| 2 Vehicles | 533 (36.1%) | 382 (33.3%) |
| 3 Vehicles | 461 (31.2%) | 306 (26.6%) |
| 4 Vehicles | 114 (7.7%) | 107 (9.3%) |
| 5 or more Vehicles | 83 (5.6%) | 71 (6.2%) |
| Total | 1,478 (100.0%) | 1,149 (100.0%) |
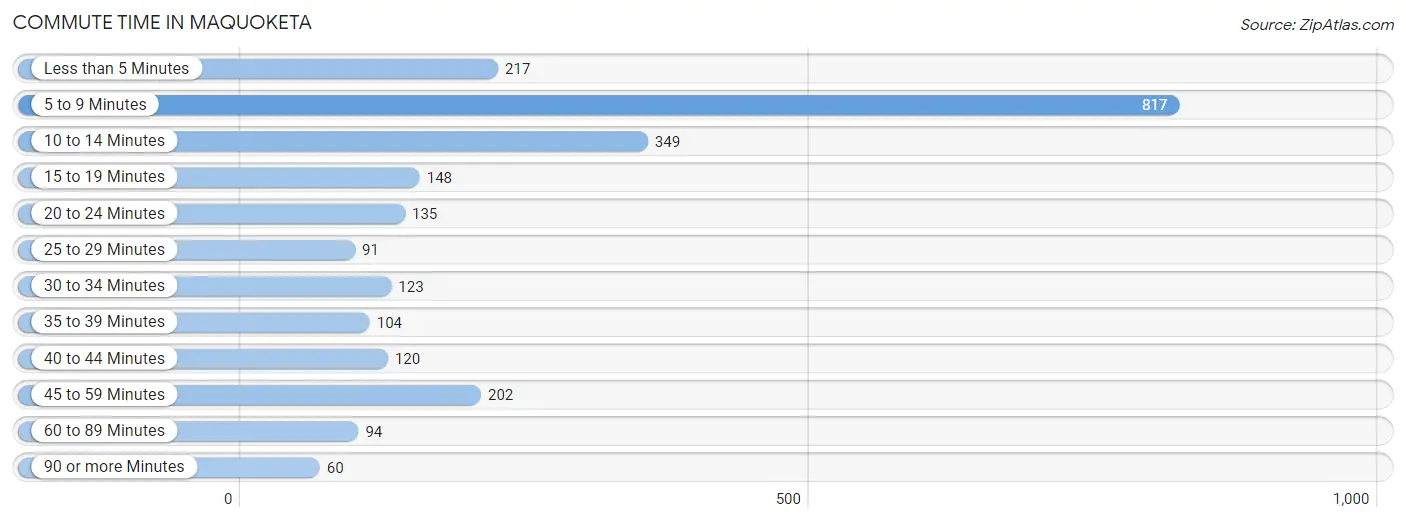
Commute Time in Maquoketa
The most frequently occuring commute durations in Maquoketa are 5 to 9 minutes (817 commuters, 33.2%), 10 to 14 minutes (349 commuters, 14.2%), and less than 5 minutes (217 commuters, 8.8%).
| Commute Time | # Commuters | % Commuters |
| Less than 5 Minutes | 217 | 8.8% |
| 5 to 9 Minutes | 817 | 33.2% |
| 10 to 14 Minutes | 349 | 14.2% |
| 15 to 19 Minutes | 148 | 6.0% |
| 20 to 24 Minutes | 135 | 5.5% |
| 25 to 29 Minutes | 91 | 3.7% |
| 30 to 34 Minutes | 123 | 5.0% |
| 35 to 39 Minutes | 104 | 4.2% |
| 40 to 44 Minutes | 120 | 4.9% |
| 45 to 59 Minutes | 202 | 8.2% |
| 60 to 89 Minutes | 94 | 3.8% |
| 90 or more Minutes | 60 | 2.4% |
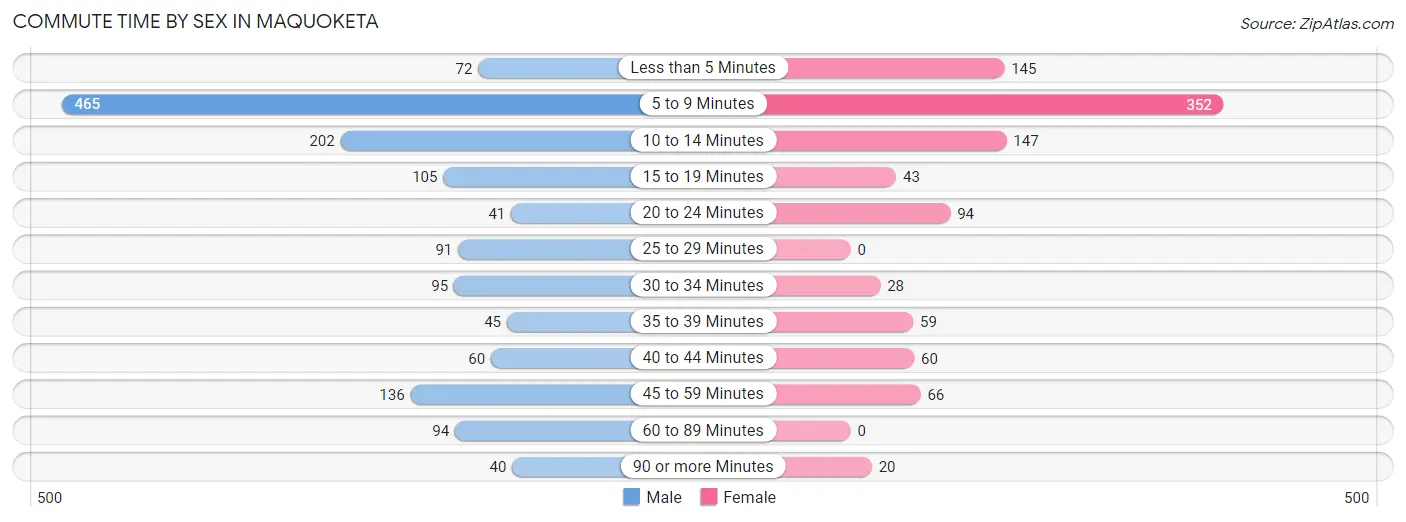
Commute Time by Sex in Maquoketa
The most common commute times in Maquoketa are 5 to 9 minutes (465 commuters, 32.2%) for males and 5 to 9 minutes (352 commuters, 34.7%) for females.
| Commute Time | Male | Female |
| Less than 5 Minutes | 72 (5.0%) | 145 (14.3%) |
| 5 to 9 Minutes | 465 (32.2%) | 352 (34.7%) |
| 10 to 14 Minutes | 202 (14.0%) | 147 (14.5%) |
| 15 to 19 Minutes | 105 (7.3%) | 43 (4.2%) |
| 20 to 24 Minutes | 41 (2.8%) | 94 (9.3%) |
| 25 to 29 Minutes | 91 (6.3%) | 0 (0.0%) |
| 30 to 34 Minutes | 95 (6.6%) | 28 (2.8%) |
| 35 to 39 Minutes | 45 (3.1%) | 59 (5.8%) |
| 40 to 44 Minutes | 60 (4.2%) | 60 (5.9%) |
| 45 to 59 Minutes | 136 (9.4%) | 66 (6.5%) |
| 60 to 89 Minutes | 94 (6.5%) | 0 (0.0%) |
| 90 or more Minutes | 40 (2.8%) | 20 (2.0%) |
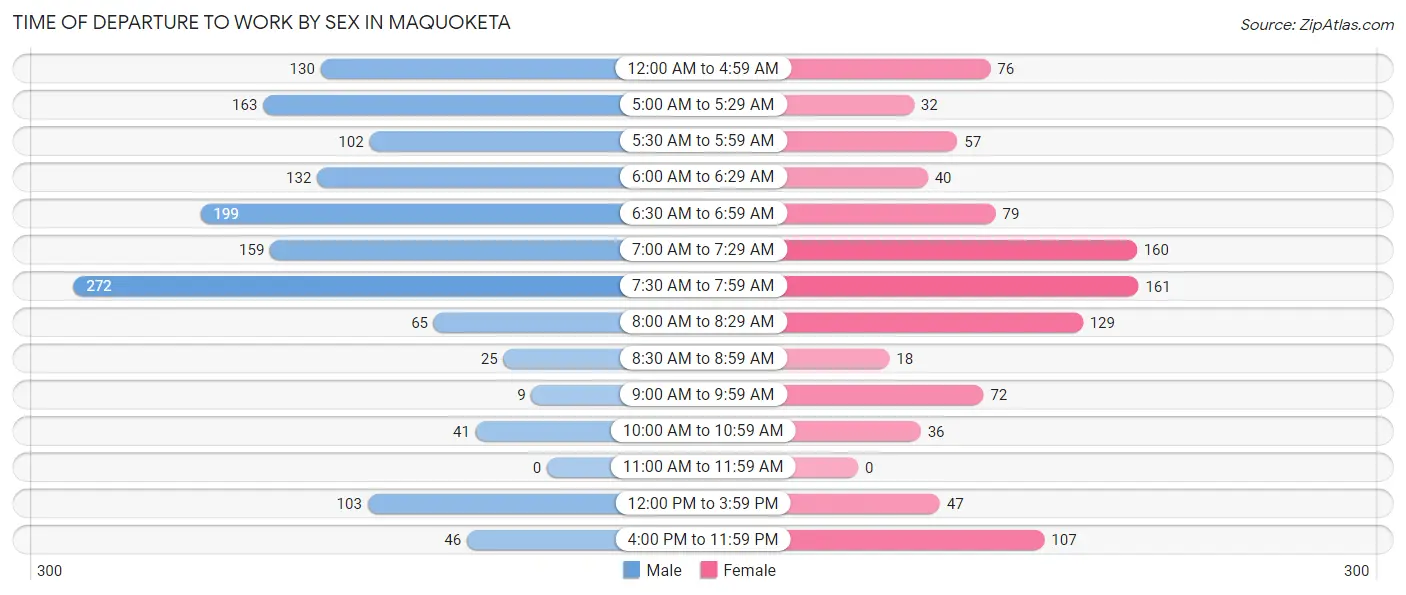
Time of Departure to Work by Sex in Maquoketa
The most frequent times of departure to work in Maquoketa are 7:30 AM to 7:59 AM (272, 18.8%) for males and 7:30 AM to 7:59 AM (161, 15.9%) for females.
| Time of Departure | Male | Female |
| 12:00 AM to 4:59 AM | 130 (9.0%) | 76 (7.5%) |
| 5:00 AM to 5:29 AM | 163 (11.3%) | 32 (3.2%) |
| 5:30 AM to 5:59 AM | 102 (7.0%) | 57 (5.6%) |
| 6:00 AM to 6:29 AM | 132 (9.1%) | 40 (3.9%) |
| 6:30 AM to 6:59 AM | 199 (13.8%) | 79 (7.8%) |
| 7:00 AM to 7:29 AM | 159 (11.0%) | 160 (15.8%) |
| 7:30 AM to 7:59 AM | 272 (18.8%) | 161 (15.9%) |
| 8:00 AM to 8:29 AM | 65 (4.5%) | 129 (12.7%) |
| 8:30 AM to 8:59 AM | 25 (1.7%) | 18 (1.8%) |
| 9:00 AM to 9:59 AM | 9 (0.6%) | 72 (7.1%) |
| 10:00 AM to 10:59 AM | 41 (2.8%) | 36 (3.5%) |
| 11:00 AM to 11:59 AM | 0 (0.0%) | 0 (0.0%) |
| 12:00 PM to 3:59 PM | 103 (7.1%) | 47 (4.6%) |
| 4:00 PM to 11:59 PM | 46 (3.2%) | 107 (10.5%) |
| Total | 1,446 (100.0%) | 1,014 (100.0%) |
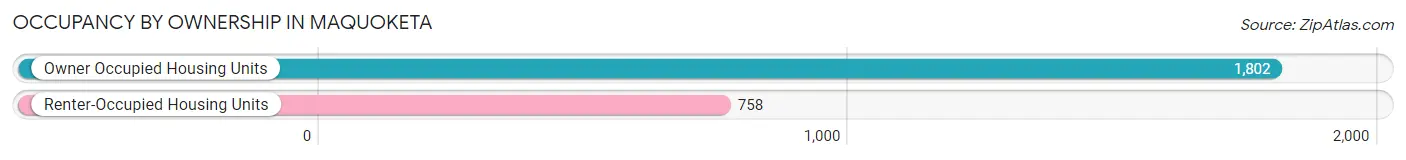
Housing Occupancy in Maquoketa
Occupancy by Ownership in Maquoketa
Of the total 2,560 dwellings in Maquoketa, owner-occupied units account for 1,802 (70.4%), while renter-occupied units make up 758 (29.6%).
| Occupancy | # Housing Units | % Housing Units |
| Owner Occupied Housing Units | 1,802 | 70.4% |
| Renter-Occupied Housing Units | 758 | 29.6% |
| Total Occupied Housing Units | 2,560 | 100.0% |
Occupancy by Household Size in Maquoketa
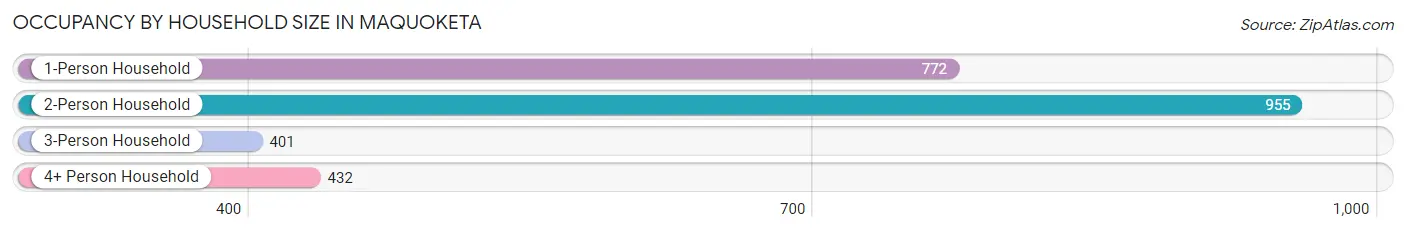
| Household Size | # Housing Units | % Housing Units |
| 1-Person Household | 772 | 30.2% |
| 2-Person Household | 955 | 37.3% |
| 3-Person Household | 401 | 15.7% |
| 4+ Person Household | 432 | 16.9% |
| Total Housing Units | 2,560 | 100.0% |
Occupancy by Ownership by Household Size in Maquoketa
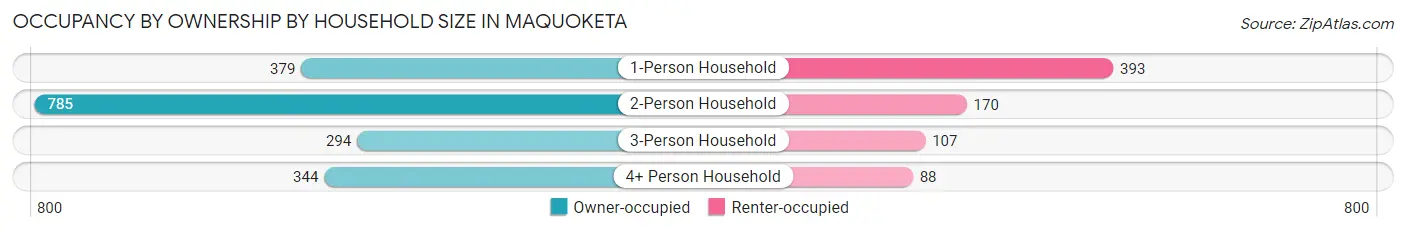
| Household Size | Owner-occupied | Renter-occupied |
| 1-Person Household | 379 (49.1%) | 393 (50.9%) |
| 2-Person Household | 785 (82.2%) | 170 (17.8%) |
| 3-Person Household | 294 (73.3%) | 107 (26.7%) |
| 4+ Person Household | 344 (79.6%) | 88 (20.4%) |
| Total Housing Units | 1,802 (70.4%) | 758 (29.6%) |
Occupancy by Educational Attainment in Maquoketa
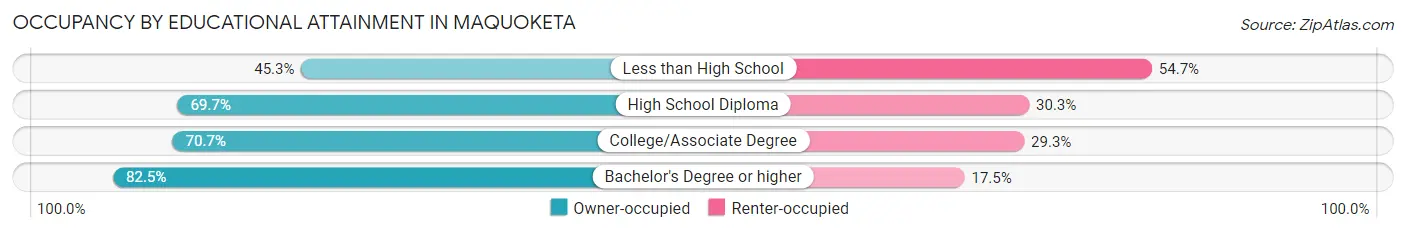
| Household Size | Owner-occupied | Renter-occupied |
| Less than High School | 68 (45.3%) | 82 (54.7%) |
| High School Diploma | 710 (69.7%) | 309 (30.3%) |
| College/Associate Degree | 737 (70.7%) | 306 (29.3%) |
| Bachelor's Degree or higher | 287 (82.5%) | 61 (17.5%) |
Occupancy by Age of Householder in Maquoketa
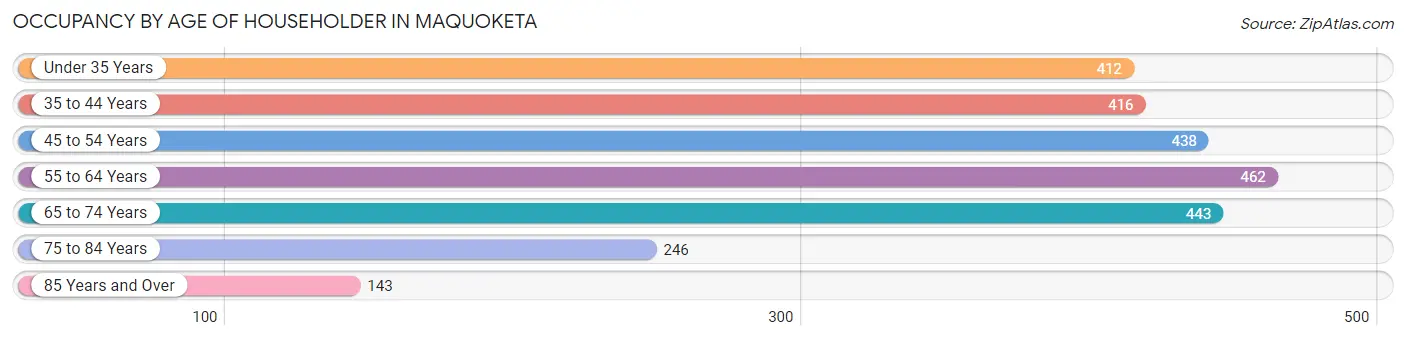
| Age Bracket | # Households | % Households |
| Under 35 Years | 412 | 16.1% |
| 35 to 44 Years | 416 | 16.3% |
| 45 to 54 Years | 438 | 17.1% |
| 55 to 64 Years | 462 | 18.0% |
| 65 to 74 Years | 443 | 17.3% |
| 75 to 84 Years | 246 | 9.6% |
| 85 Years and Over | 143 | 5.6% |
| Total | 2,560 | 100.0% |
Housing Finances in Maquoketa
Median Income by Occupancy in Maquoketa
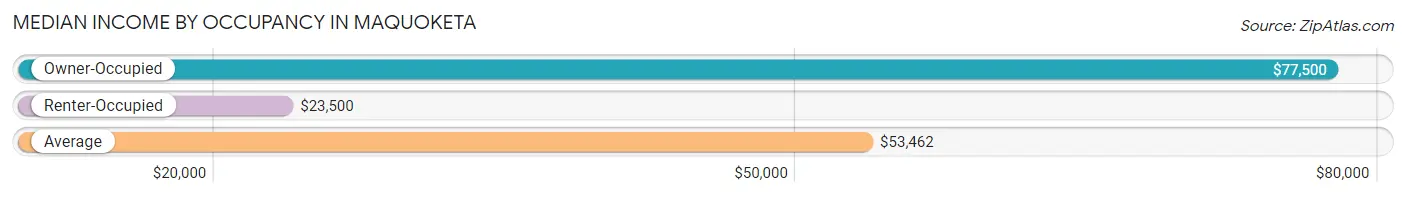
| Occupancy Type | # Households | Median Income |
| Owner-Occupied | 1,802 (70.4%) | $77,500 |
| Renter-Occupied | 758 (29.6%) | $23,500 |
| Average | 2,560 (100.0%) | $53,462 |
Occupancy by Householder Income Bracket in Maquoketa
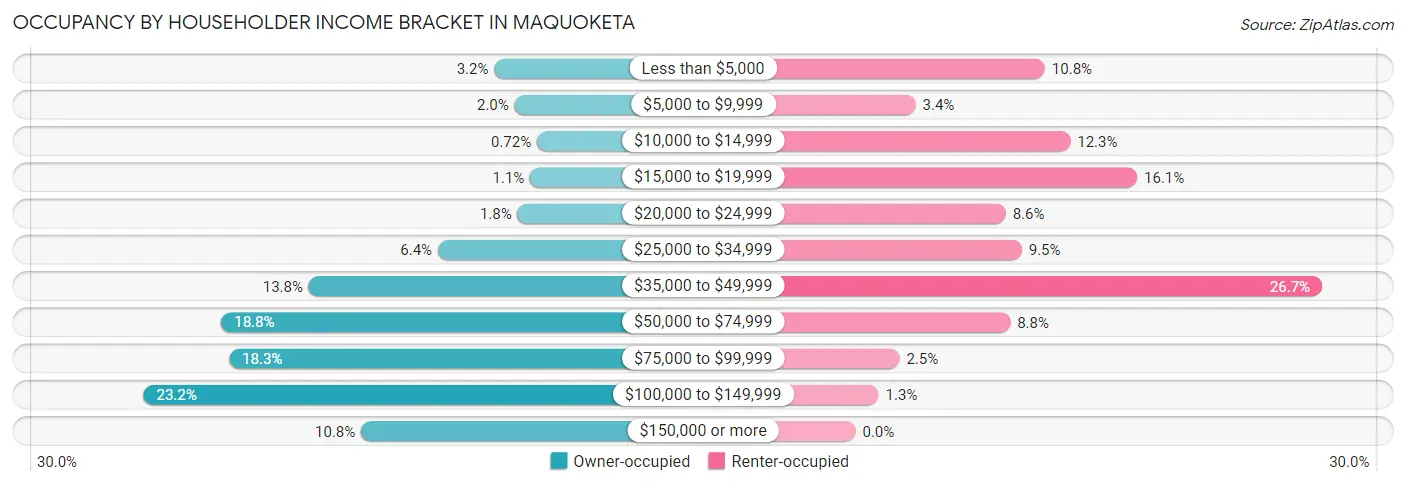
| Income Bracket | Owner-occupied | Renter-occupied |
| Less than $5,000 | 57 (3.2%) | 82 (10.8%) |
| $5,000 to $9,999 | 36 (2.0%) | 26 (3.4%) |
| $10,000 to $14,999 | 13 (0.7%) | 93 (12.3%) |
| $15,000 to $19,999 | 20 (1.1%) | 122 (16.1%) |
| $20,000 to $24,999 | 33 (1.8%) | 65 (8.6%) |
| $25,000 to $34,999 | 115 (6.4%) | 72 (9.5%) |
| $35,000 to $49,999 | 248 (13.8%) | 202 (26.7%) |
| $50,000 to $74,999 | 338 (18.8%) | 67 (8.8%) |
| $75,000 to $99,999 | 330 (18.3%) | 19 (2.5%) |
| $100,000 to $149,999 | 418 (23.2%) | 10 (1.3%) |
| $150,000 or more | 194 (10.8%) | 0 (0.0%) |
| Total | 1,802 (100.0%) | 758 (100.0%) |
Monthly Housing Cost Tiers in Maquoketa
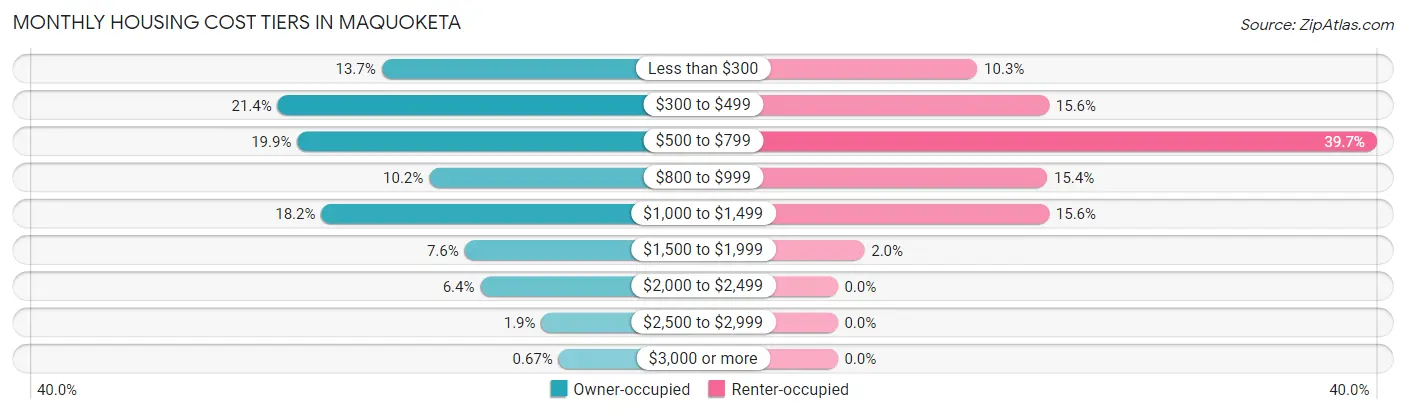
| Monthly Cost | Owner-occupied | Renter-occupied |
| Less than $300 | 247 (13.7%) | 78 (10.3%) |
| $300 to $499 | 385 (21.4%) | 118 (15.6%) |
| $500 to $799 | 359 (19.9%) | 301 (39.7%) |
| $800 to $999 | 184 (10.2%) | 117 (15.4%) |
| $1,000 to $1,499 | 327 (18.1%) | 118 (15.6%) |
| $1,500 to $1,999 | 137 (7.6%) | 15 (2.0%) |
| $2,000 to $2,499 | 116 (6.4%) | 0 (0.0%) |
| $2,500 to $2,999 | 35 (1.9%) | 0 (0.0%) |
| $3,000 or more | 12 (0.7%) | 0 (0.0%) |
| Total | 1,802 (100.0%) | 758 (100.0%) |
Physical Housing Characteristics in Maquoketa
Housing Structures in Maquoketa
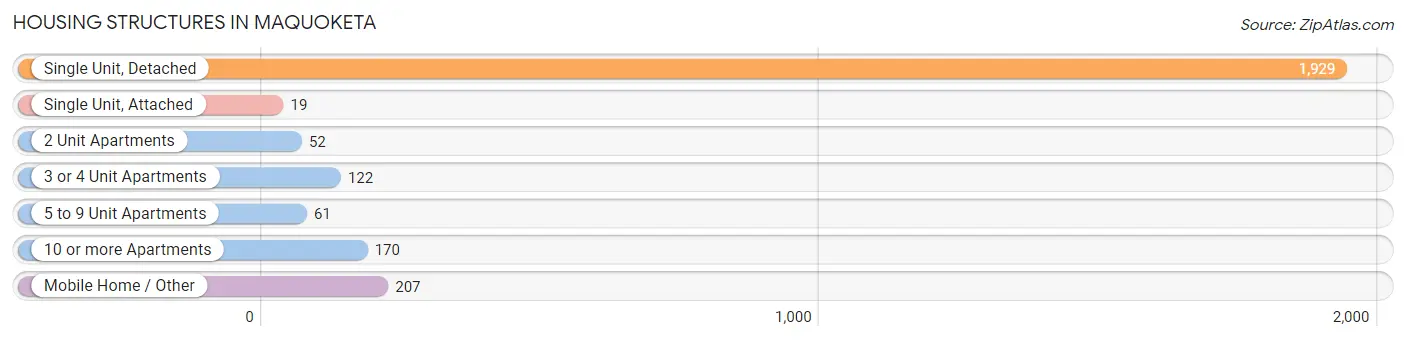
| Structure Type | # Housing Units | % Housing Units |
| Single Unit, Detached | 1,929 | 75.3% |
| Single Unit, Attached | 19 | 0.7% |
| 2 Unit Apartments | 52 | 2.0% |
| 3 or 4 Unit Apartments | 122 | 4.8% |
| 5 to 9 Unit Apartments | 61 | 2.4% |
| 10 or more Apartments | 170 | 6.6% |
| Mobile Home / Other | 207 | 8.1% |
| Total | 2,560 | 100.0% |
Housing Structures by Occupancy in Maquoketa
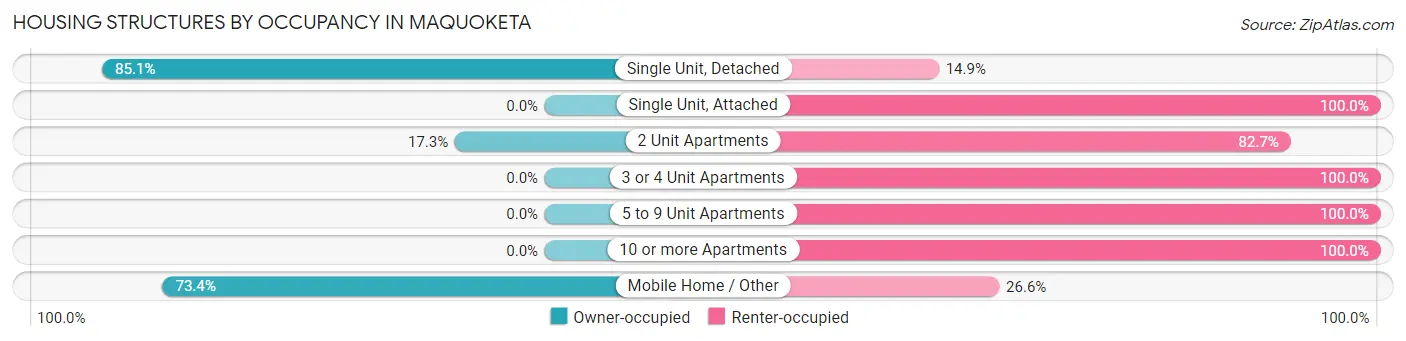
| Structure Type | Owner-occupied | Renter-occupied |
| Single Unit, Detached | 1,641 (85.1%) | 288 (14.9%) |
| Single Unit, Attached | 0 (0.0%) | 19 (100.0%) |
| 2 Unit Apartments | 9 (17.3%) | 43 (82.7%) |
| 3 or 4 Unit Apartments | 0 (0.0%) | 122 (100.0%) |
| 5 to 9 Unit Apartments | 0 (0.0%) | 61 (100.0%) |
| 10 or more Apartments | 0 (0.0%) | 170 (100.0%) |
| Mobile Home / Other | 152 (73.4%) | 55 (26.6%) |
| Total | 1,802 (70.4%) | 758 (29.6%) |
Housing Structures by Number of Rooms in Maquoketa
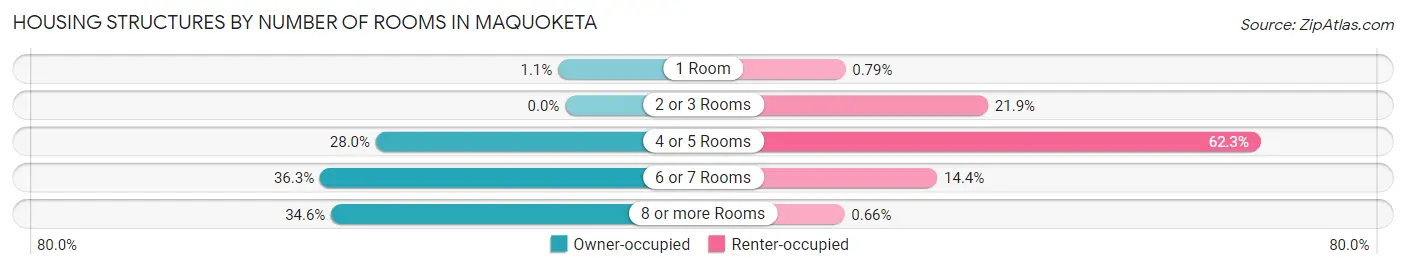
| Number of Rooms | Owner-occupied | Renter-occupied |
| 1 Room | 19 (1.1%) | 6 (0.8%) |
| 2 or 3 Rooms | 0 (0.0%) | 166 (21.9%) |
| 4 or 5 Rooms | 505 (28.0%) | 472 (62.3%) |
| 6 or 7 Rooms | 654 (36.3%) | 109 (14.4%) |
| 8 or more Rooms | 624 (34.6%) | 5 (0.7%) |
| Total | 1,802 (100.0%) | 758 (100.0%) |
Housing Structure by Heating Type in Maquoketa
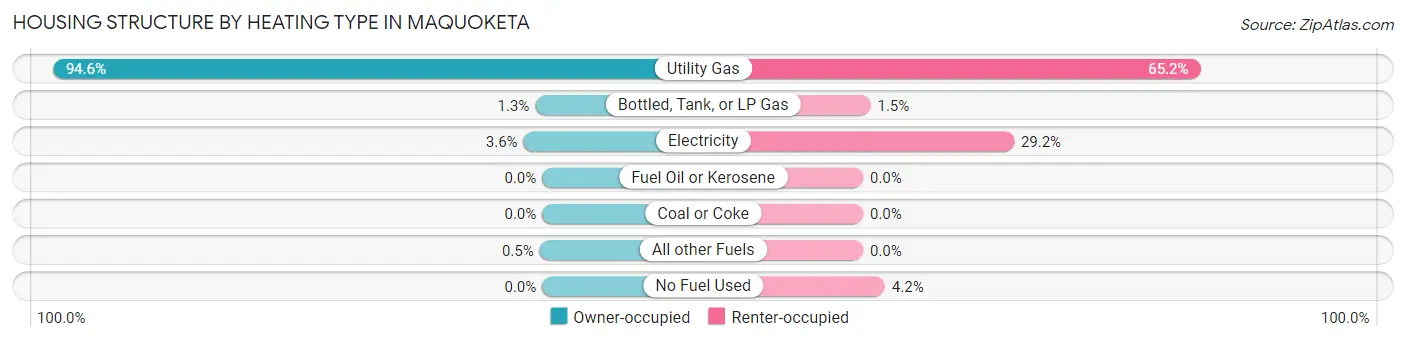
| Heating Type | Owner-occupied | Renter-occupied |
| Utility Gas | 1,704 (94.6%) | 494 (65.2%) |
| Bottled, Tank, or LP Gas | 24 (1.3%) | 11 (1.5%) |
| Electricity | 65 (3.6%) | 221 (29.2%) |
| Fuel Oil or Kerosene | 0 (0.0%) | 0 (0.0%) |
| Coal or Coke | 0 (0.0%) | 0 (0.0%) |
| All other Fuels | 9 (0.5%) | 0 (0.0%) |
| No Fuel Used | 0 (0.0%) | 32 (4.2%) |
| Total | 1,802 (100.0%) | 758 (100.0%) |
Household Vehicle Usage in Maquoketa
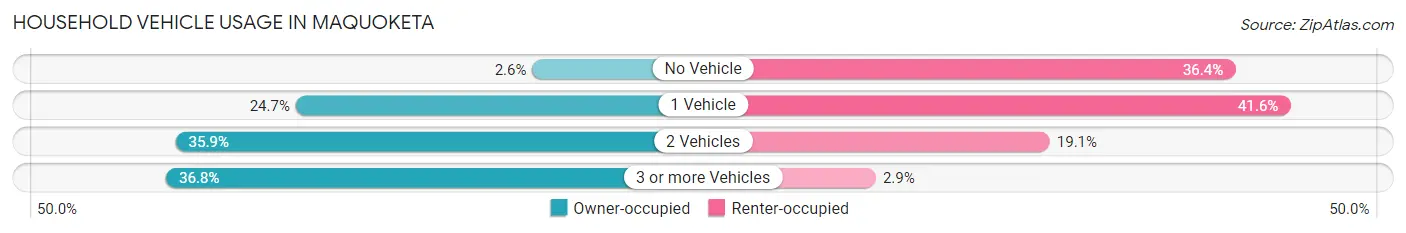
| Vehicles per Household | Owner-occupied | Renter-occupied |
| No Vehicle | 47 (2.6%) | 276 (36.4%) |
| 1 Vehicle | 445 (24.7%) | 315 (41.6%) |
| 2 Vehicles | 647 (35.9%) | 145 (19.1%) |
| 3 or more Vehicles | 663 (36.8%) | 22 (2.9%) |
| Total | 1,802 (100.0%) | 758 (100.0%) |
Real Estate & Mortgages in Maquoketa
Real Estate and Mortgage Overview in Maquoketa
| Characteristic | Without Mortgage | With Mortgage |
| Housing Units | 923 | 879 |
| Median Property Value | $96,500 | $141,500 |
| Median Household Income | $75,054 | $156 |
| Monthly Housing Costs | $431 | $12 |
| Real Estate Taxes | $1,280 | $9 |
Property Value by Mortgage Status in Maquoketa
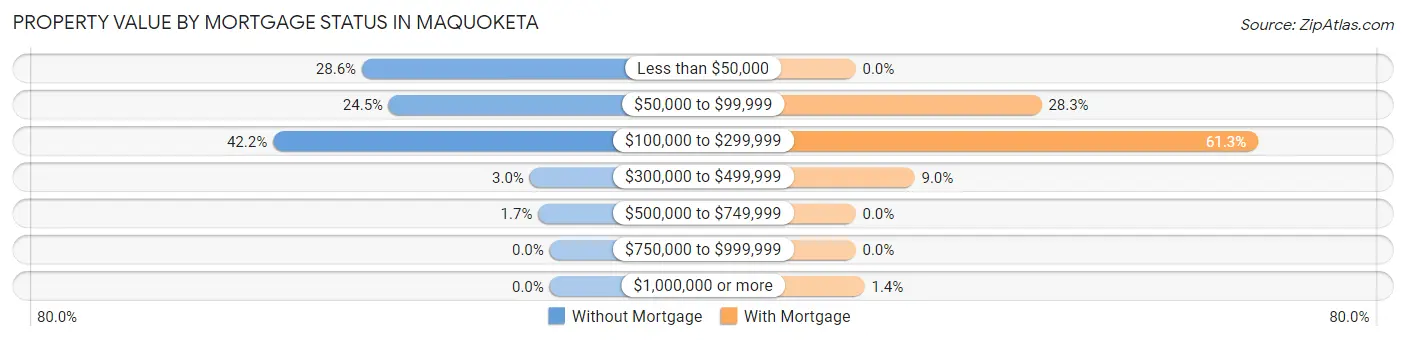
| Property Value | Without Mortgage | With Mortgage |
| Less than $50,000 | 264 (28.6%) | 0 (0.0%) |
| $50,000 to $99,999 | 226 (24.5%) | 249 (28.3%) |
| $100,000 to $299,999 | 389 (42.1%) | 539 (61.3%) |
| $300,000 to $499,999 | 28 (3.0%) | 79 (9.0%) |
| $500,000 to $749,999 | 16 (1.7%) | 0 (0.0%) |
| $750,000 to $999,999 | 0 (0.0%) | 0 (0.0%) |
| $1,000,000 or more | 0 (0.0%) | 12 (1.4%) |
| Total | 923 (100.0%) | 879 (100.0%) |
Household Income by Mortgage Status in Maquoketa
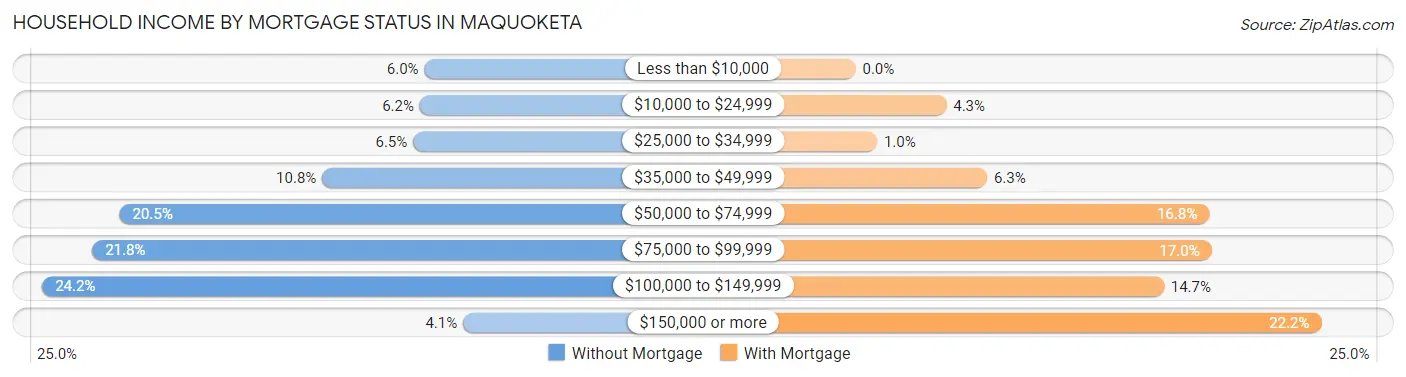
| Household Income | Without Mortgage | With Mortgage |
| Less than $10,000 | 55 (6.0%) | 0 (0.0%) |
| $10,000 to $24,999 | 57 (6.2%) | 38 (4.3%) |
| $25,000 to $34,999 | 60 (6.5%) | 9 (1.0%) |
| $35,000 to $49,999 | 100 (10.8%) | 55 (6.3%) |
| $50,000 to $74,999 | 189 (20.5%) | 148 (16.8%) |
| $75,000 to $99,999 | 201 (21.8%) | 149 (17.0%) |
| $100,000 to $149,999 | 223 (24.2%) | 129 (14.7%) |
| $150,000 or more | 38 (4.1%) | 195 (22.2%) |
| Total | 923 (100.0%) | 879 (100.0%) |
Property Value to Household Income Ratio in Maquoketa
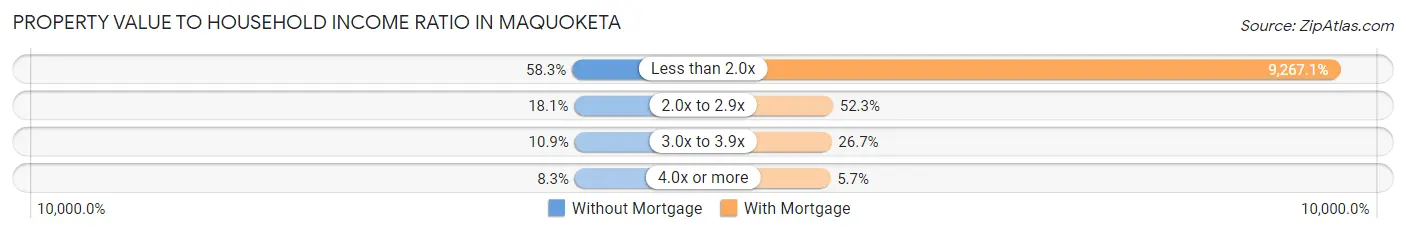
| Value-to-Income Ratio | Without Mortgage | With Mortgage |
| Less than 2.0x | 538 (58.3%) | 81,458 (9,267.1%) |
| 2.0x to 2.9x | 167 (18.1%) | 460 (52.3%) |
| 3.0x to 3.9x | 101 (10.9%) | 235 (26.7%) |
| 4.0x or more | 77 (8.3%) | 50 (5.7%) |
| Total | 923 (100.0%) | 879 (100.0%) |
Real Estate Taxes by Mortgage Status in Maquoketa
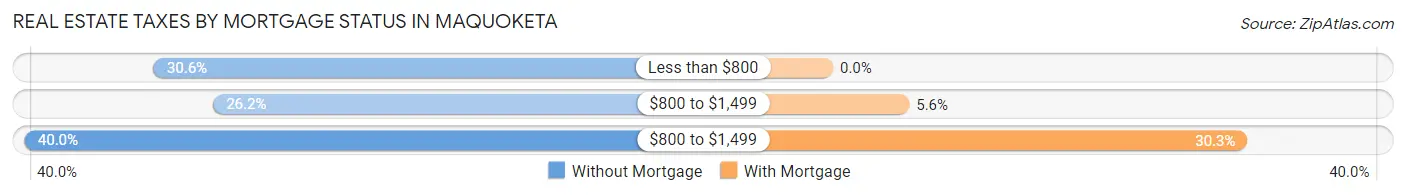
| Property Taxes | Without Mortgage | With Mortgage |
| Less than $800 | 282 (30.5%) | 0 (0.0%) |
| $800 to $1,499 | 242 (26.2%) | 49 (5.6%) |
| $800 to $1,499 | 369 (40.0%) | 266 (30.3%) |
| Total | 923 (100.0%) | 879 (100.0%) |
Health & Disability in Maquoketa
Health Insurance Coverage by Age in Maquoketa
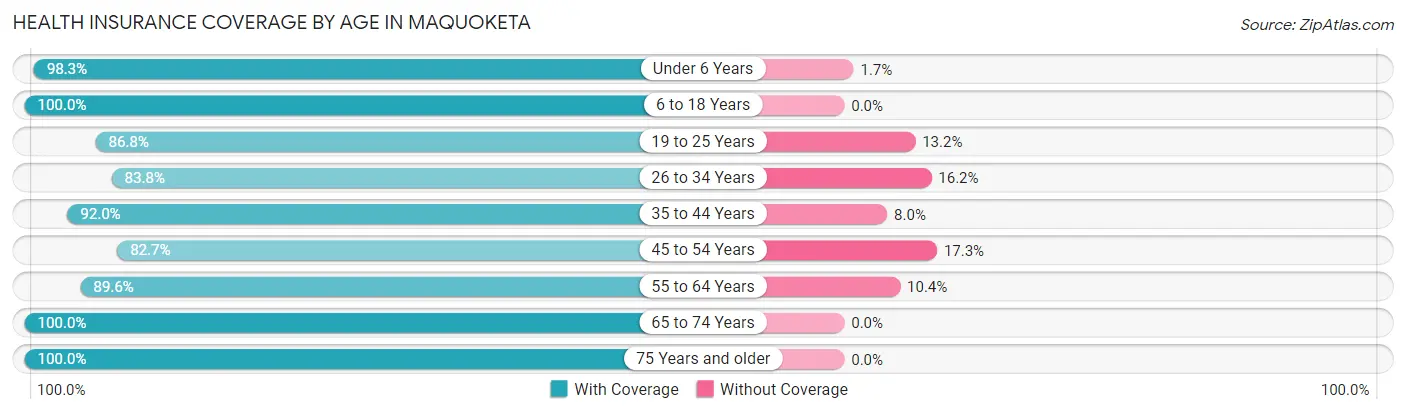
| Age Bracket | With Coverage | Without Coverage |
| Under 6 Years | 401 (98.3%) | 7 (1.7%) |
| 6 to 18 Years | 1,092 (100.0%) | 0 (0.0%) |
| 19 to 25 Years | 341 (86.8%) | 52 (13.2%) |
| 26 to 34 Years | 516 (83.8%) | 100 (16.2%) |
| 35 to 44 Years | 679 (92.0%) | 59 (8.0%) |
| 45 to 54 Years | 632 (82.7%) | 132 (17.3%) |
| 55 to 64 Years | 663 (89.6%) | 77 (10.4%) |
| 65 to 74 Years | 669 (100.0%) | 0 (0.0%) |
| 75 Years and older | 546 (100.0%) | 0 (0.0%) |
| Total | 5,539 (92.8%) | 427 (7.2%) |
Health Insurance Coverage by Citizenship Status in Maquoketa
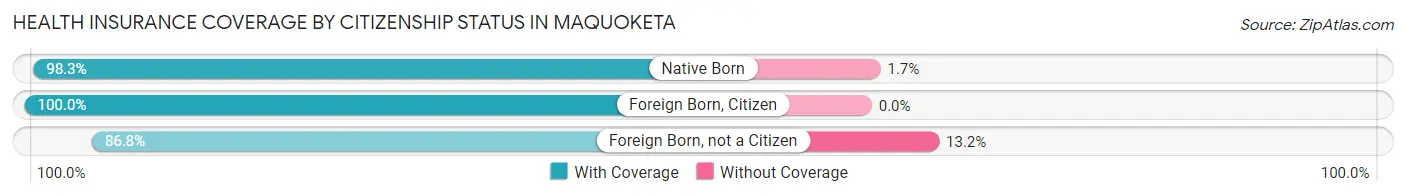
| Citizenship Status | With Coverage | Without Coverage |
| Native Born | 401 (98.3%) | 7 (1.7%) |
| Foreign Born, Citizen | 1,092 (100.0%) | 0 (0.0%) |
| Foreign Born, not a Citizen | 341 (86.8%) | 52 (13.2%) |
Health Insurance Coverage by Household Income in Maquoketa
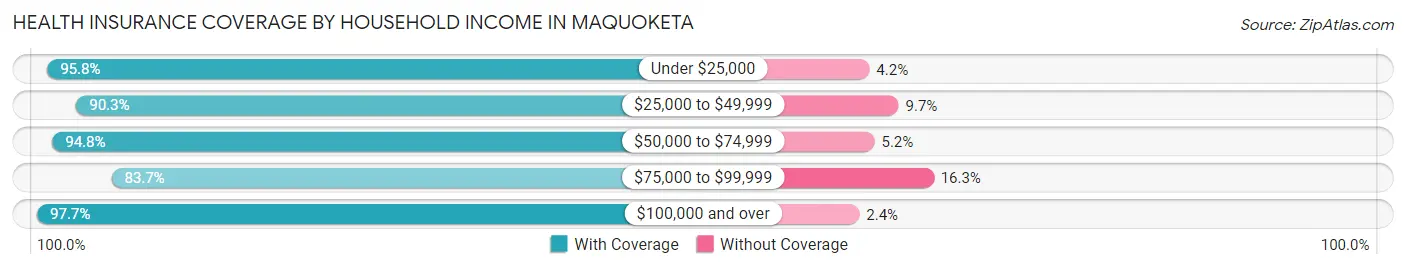
| Household Income | With Coverage | Without Coverage |
| Under $25,000 | 836 (95.8%) | 37 (4.2%) |
| $25,000 to $49,999 | 1,248 (90.3%) | 134 (9.7%) |
| $50,000 to $74,999 | 857 (94.8%) | 47 (5.2%) |
| $75,000 to $99,999 | 864 (83.7%) | 168 (16.3%) |
| $100,000 and over | 1,700 (97.7%) | 41 (2.4%) |
Public vs Private Health Insurance Coverage by Age in Maquoketa
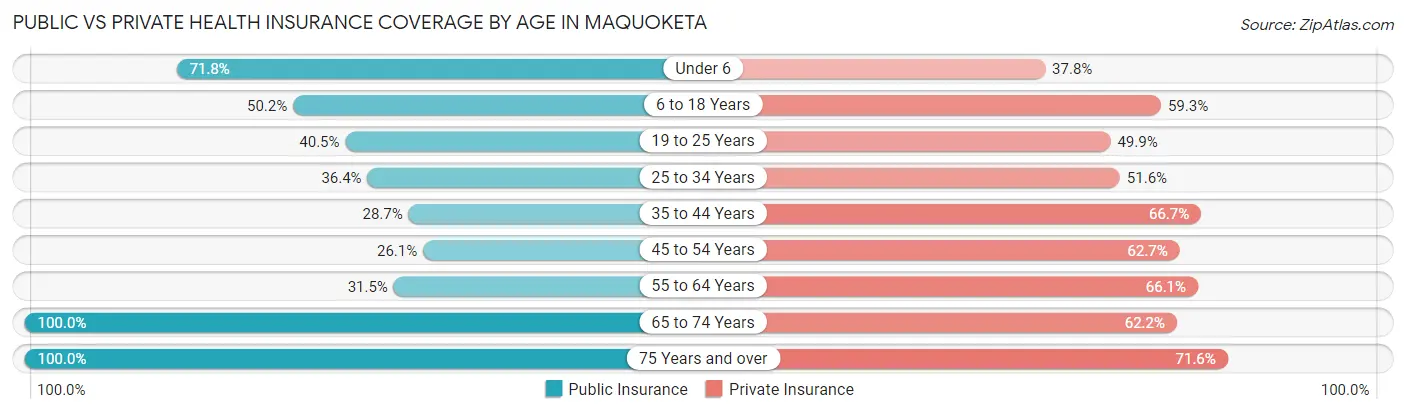
| Age Bracket | Public Insurance | Private Insurance |
| Under 6 | 293 (71.8%) | 154 (37.8%) |
| 6 to 18 Years | 548 (50.2%) | 647 (59.3%) |
| 19 to 25 Years | 159 (40.5%) | 196 (49.9%) |
| 25 to 34 Years | 224 (36.4%) | 318 (51.6%) |
| 35 to 44 Years | 212 (28.7%) | 492 (66.7%) |
| 45 to 54 Years | 199 (26.1%) | 479 (62.7%) |
| 55 to 64 Years | 233 (31.5%) | 489 (66.1%) |
| 65 to 74 Years | 669 (100.0%) | 416 (62.2%) |
| 75 Years and over | 546 (100.0%) | 391 (71.6%) |
| Total | 3,083 (51.7%) | 3,582 (60.0%) |
Disability Status by Sex by Age in Maquoketa
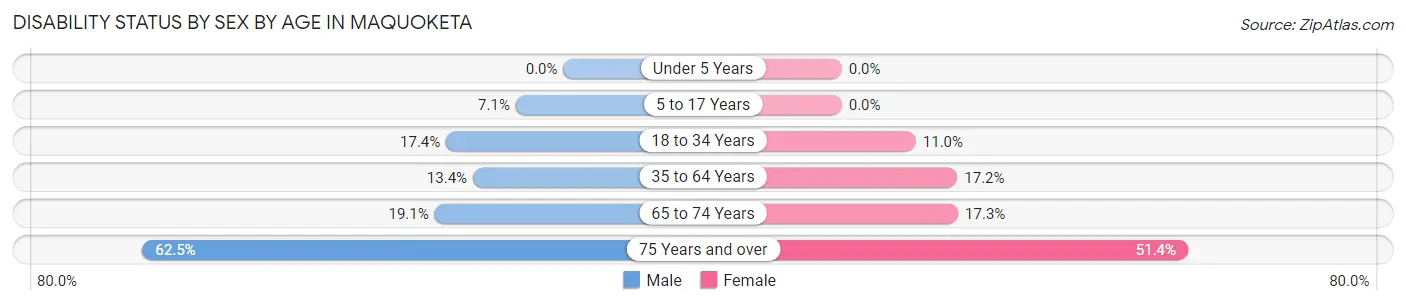
| Age Bracket | Male | Female |
| Under 5 Years | 0 (0.0%) | 0 (0.0%) |
| 5 to 17 Years | 37 (7.1%) | 0 (0.0%) |
| 18 to 34 Years | 98 (17.4%) | 53 (11.0%) |
| 35 to 64 Years | 150 (13.4%) | 193 (17.2%) |
| 65 to 74 Years | 66 (19.1%) | 56 (17.3%) |
| 75 Years and over | 160 (62.5%) | 149 (51.4%) |
Disability Class by Sex by Age in Maquoketa
Disability Class: Hearing Difficulty
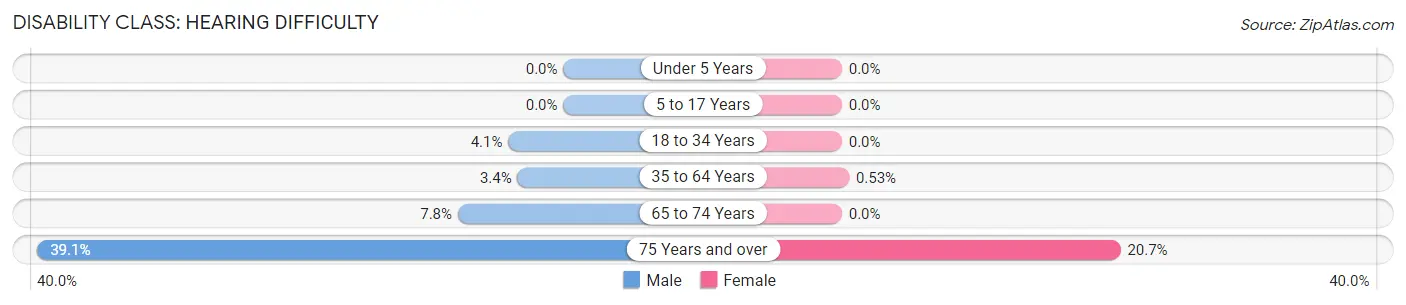
| Age Bracket | Male | Female |
| Under 5 Years | 0 (0.0%) | 0 (0.0%) |
| 5 to 17 Years | 0 (0.0%) | 0 (0.0%) |
| 18 to 34 Years | 23 (4.1%) | 0 (0.0%) |
| 35 to 64 Years | 38 (3.4%) | 6 (0.5%) |
| 65 to 74 Years | 27 (7.8%) | 0 (0.0%) |
| 75 Years and over | 100 (39.1%) | 60 (20.7%) |
Disability Class: Vision Difficulty
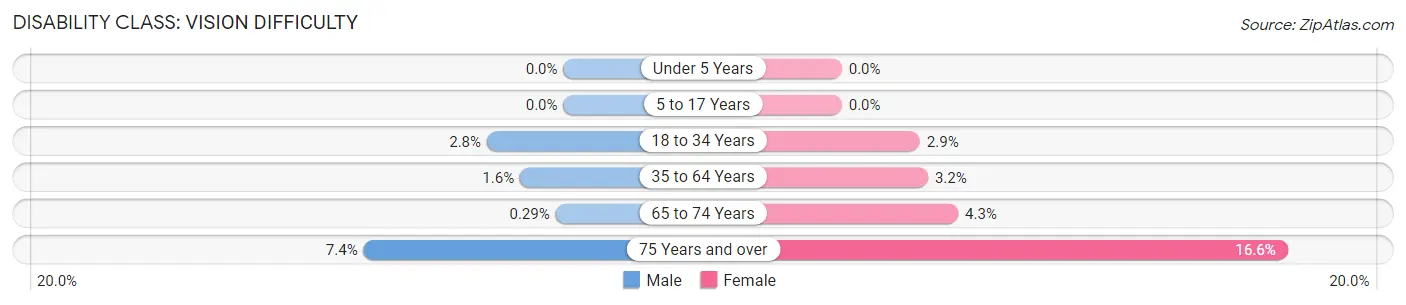
| Age Bracket | Male | Female |
| Under 5 Years | 0 (0.0%) | 0 (0.0%) |
| 5 to 17 Years | 0 (0.0%) | 0 (0.0%) |
| 18 to 34 Years | 16 (2.8%) | 14 (2.9%) |
| 35 to 64 Years | 18 (1.6%) | 36 (3.2%) |
| 65 to 74 Years | 1 (0.3%) | 14 (4.3%) |
| 75 Years and over | 19 (7.4%) | 48 (16.6%) |
Disability Class: Cognitive Difficulty
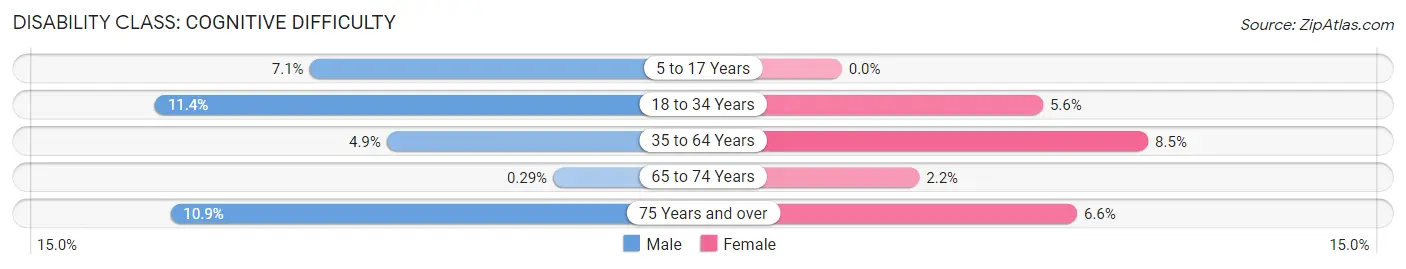
| Age Bracket | Male | Female |
| 5 to 17 Years | 37 (7.1%) | 0 (0.0%) |
| 18 to 34 Years | 64 (11.4%) | 27 (5.6%) |
| 35 to 64 Years | 55 (4.9%) | 96 (8.5%) |
| 65 to 74 Years | 1 (0.3%) | 7 (2.2%) |
| 75 Years and over | 28 (10.9%) | 19 (6.6%) |
Disability Class: Ambulatory Difficulty
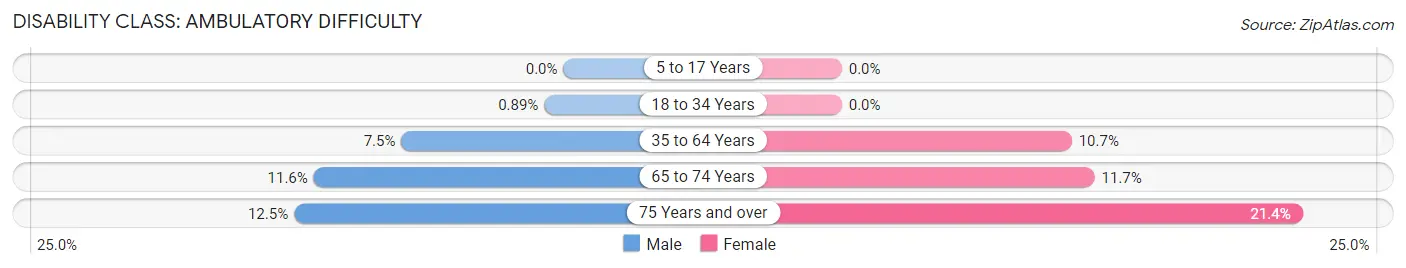
| Age Bracket | Male | Female |
| 5 to 17 Years | 0 (0.0%) | 0 (0.0%) |
| 18 to 34 Years | 5 (0.9%) | 0 (0.0%) |
| 35 to 64 Years | 84 (7.5%) | 120 (10.7%) |
| 65 to 74 Years | 40 (11.6%) | 38 (11.7%) |
| 75 Years and over | 32 (12.5%) | 62 (21.4%) |
Disability Class: Self-Care Difficulty
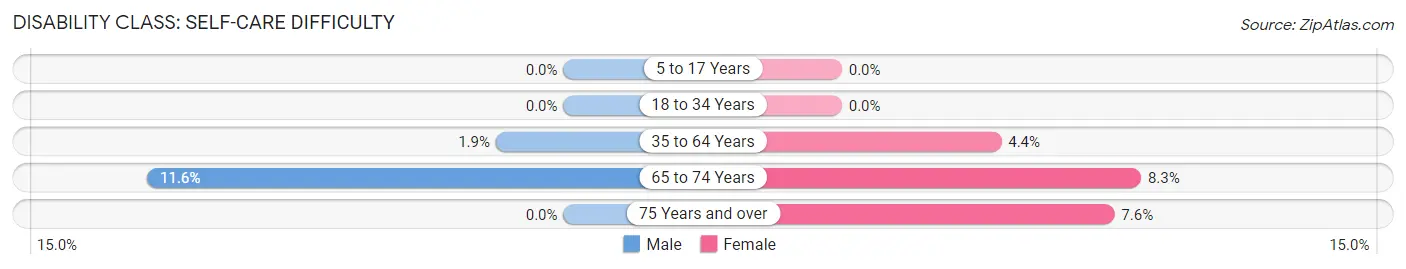
| Age Bracket | Male | Female |
| 5 to 17 Years | 0 (0.0%) | 0 (0.0%) |
| 18 to 34 Years | 0 (0.0%) | 0 (0.0%) |
| 35 to 64 Years | 21 (1.9%) | 50 (4.4%) |
| 65 to 74 Years | 40 (11.6%) | 27 (8.3%) |
| 75 Years and over | 0 (0.0%) | 22 (7.6%) |
Technology Access in Maquoketa
Computing Device Access in Maquoketa
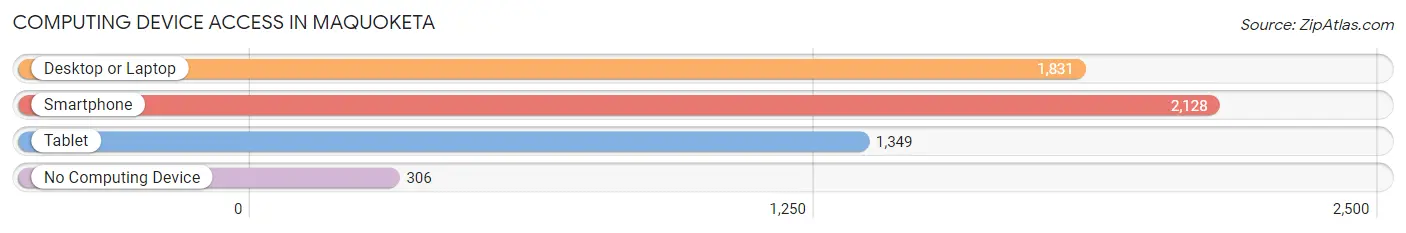
| Device Type | # Households | % Households |
| Desktop or Laptop | 1,831 | 71.5% |
| Smartphone | 2,128 | 83.1% |
| Tablet | 1,349 | 52.7% |
| No Computing Device | 306 | 11.9% |
| Total | 2,560 | 100.0% |
Internet Access in Maquoketa
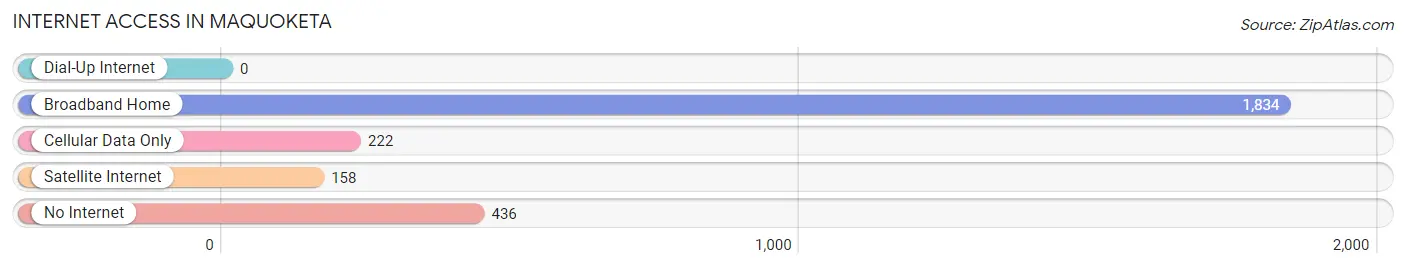
| Internet Type | # Households | % Households |
| Dial-Up Internet | 0 | 0.0% |
| Broadband Home | 1,834 | 71.6% |
| Cellular Data Only | 222 | 8.7% |
| Satellite Internet | 158 | 6.2% |
| No Internet | 436 | 17.0% |
| Total | 2,560 | 100.0% |
Maquoketa Summary
Maquoketa, Iowa is a small city located in Jackson County in the northeastern part of the state. It is situated along the Maquoketa River, which is a tributary of the Mississippi River. The city has a population of 6,141 as of the 2020 census, making it the largest city in Jackson County.
History
Maquoketa was founded in 1837 by settlers from New York and Pennsylvania. The city was named after the Maquoketa River, which was named after the Sauk and Fox Indians who lived in the area. The city was incorporated in 1855 and was the county seat of Jackson County until 1873.
The city was an important stop on the Chicago, Rock Island and Pacific Railroad, which ran through the city from 1854 to 1980. The railroad was a major factor in the city's growth and development.
Geography
Maquoketa is located in the northeastern part of Iowa, in Jackson County. It is situated along the Maquoketa River, which is a tributary of the Mississippi River. The city is located about 40 miles east of Dubuque and about 60 miles west of Davenport.
The city has a total area of 4.3 square miles, all of which is land. The city is located at an elevation of 845 feet above sea level.
Economy
Maquoketa's economy is largely based on agriculture and manufacturing. The city is home to several manufacturing companies, including a John Deere plant, a Tyson Foods plant, and a Nestle plant.
The city is also home to several retail stores, restaurants, and other businesses. The city is also home to a number of small businesses, including a winery, a brewery, and a distillery.
Demographics
As of the 2020 census, Maquoketa had a population of 6,141. The racial makeup of the city was 95.2% White, 0.7% African American, 0.3% Native American, 0.7% Asian, 0.1% Pacific Islander, 1.2% from other races, and 1.8% from two or more races. Hispanic or Latino of any race were 3.2% of the population.
The median household income in Maquoketa was $45,945 in 2019. The median age of the city was 40.7 years. The city had a poverty rate of 11.3%.
Conclusion
Maquoketa, Iowa is a small city located in Jackson County in the northeastern part of the state. It is situated along the Maquoketa River, which is a tributary of the Mississippi River. The city has a population of 6,141 as of the 2020 census, making it the largest city in Jackson County. The city's economy is largely based on agriculture and manufacturing, and it is home to several retail stores, restaurants, and other businesses. The city has a diverse population, with a median household income of $45,945 and a poverty rate of 11.3%. Maquoketa is a vibrant city with a rich history and a bright future.
Common Questions
What is Per Capita Income in Maquoketa?
Per Capita income in Maquoketa is $29,241.
What is the Median Family Income in Maquoketa?
Median Family Income in Maquoketa is $78,450.
What is the Median Household income in Maquoketa?
Median Household Income in Maquoketa is $53,462.
What is Income or Wage Gap in Maquoketa?
Income or Wage Gap in Maquoketa is 38.9%.
Women in Maquoketa earn 61.1 cents for every dollar earned by a man.
What is Inequality or Gini Index in Maquoketa?
Inequality or Gini Index in Maquoketa is 0.42.
What is the Total Population of Maquoketa?
Total Population of Maquoketa is 6,123.
What is the Total Male Population of Maquoketa?
Total Male Population of Maquoketa is 3,088.
What is the Total Female Population of Maquoketa?
Total Female Population of Maquoketa is 3,035.
What is the Ratio of Males per 100 Females in Maquoketa?
There are 101.75 Males per 100 Females in Maquoketa.
What is the Ratio of Females per 100 Males in Maquoketa?
There are 98.28 Females per 100 Males in Maquoketa.
What is the Median Population Age in Maquoketa?
Median Population Age in Maquoketa is 40.8 Years.
What is the Average Family Size in Maquoketa
Average Family Size in Maquoketa is 2.9 People.
What is the Average Household Size in Maquoketa
Average Household Size in Maquoketa is 2.3 People.
How Large is the Labor Force in Maquoketa?
There are 2,894 People in the Labor Forcein in Maquoketa.
What is the Percentage of People in the Labor Force in Maquoketa?
58.9% of People are in the Labor Force in Maquoketa.
What is the Unemployment Rate in Maquoketa?
Unemployment Rate in Maquoketa is 7.4%.