Manchester, IA Map & Demographics
Manchester Map
Manchester Overview
$33,783
PER CAPITA INCOME
$76,074
AVG FAMILY INCOME
$57,969
AVG HOUSEHOLD INCOME
37.1%
WAGE / INCOME GAP [ % ]
62.9¢/ $1
WAGE / INCOME GAP [ $ ]
0.39
INEQUALITY / GINI INDEX
5,112
TOTAL POPULATION
2,616
MALE POPULATION
2,496
FEMALE POPULATION
104.81
MALES / 100 FEMALES
95.41
FEMALES / 100 MALES
49.9
MEDIAN AGE
2.8
AVG FAMILY SIZE
2.2
AVG HOUSEHOLD SIZE
2,819
LABOR FORCE [ PEOPLE ]
66.6%
PERCENT IN LABOR FORCE
2.8%
UNEMPLOYMENT RATE
Manchester Zip Codes
Manchester Area Codes
Income in Manchester
Income Overview in Manchester
Per Capita Income in Manchester is $33,783, while median incomes of families and households are $76,074 and $57,969 respectively.
| Characteristic | Number | Measure |
| Per Capita Income | 5,112 | $33,783 |
| Median Family Income | 1,372 | $76,074 |
| Mean Family Income | 1,372 | $89,704 |
| Median Household Income | 2,281 | $57,969 |
| Mean Household Income | 2,281 | $73,674 |
| Income Deficit | 1,372 | $0 |
| Wage / Income Gap (%) | 5,112 | 37.07% |
| Wage / Income Gap ($) | 5,112 | 62.93¢ per $1 |
| Gini / Inequality Index | 5,112 | 0.39 |
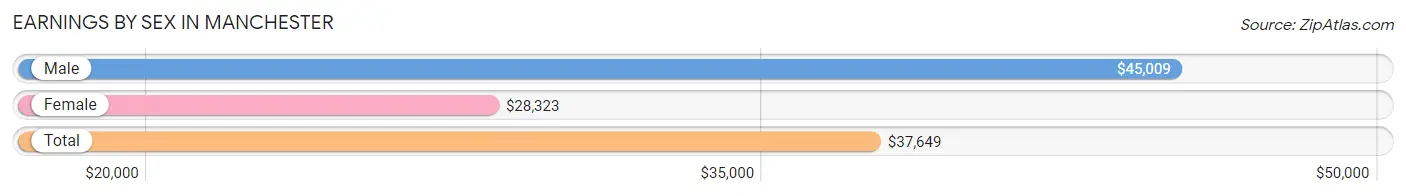
Earnings by Sex in Manchester
Average Earnings in Manchester are $37,649, $45,009 for men and $28,323 for women, a difference of 37.1%.
| Sex | Number | Average Earnings |
| Male | 1,641 (56.5%) | $45,009 |
| Female | 1,266 (43.5%) | $28,323 |
| Total | 2,907 (100.0%) | $37,649 |
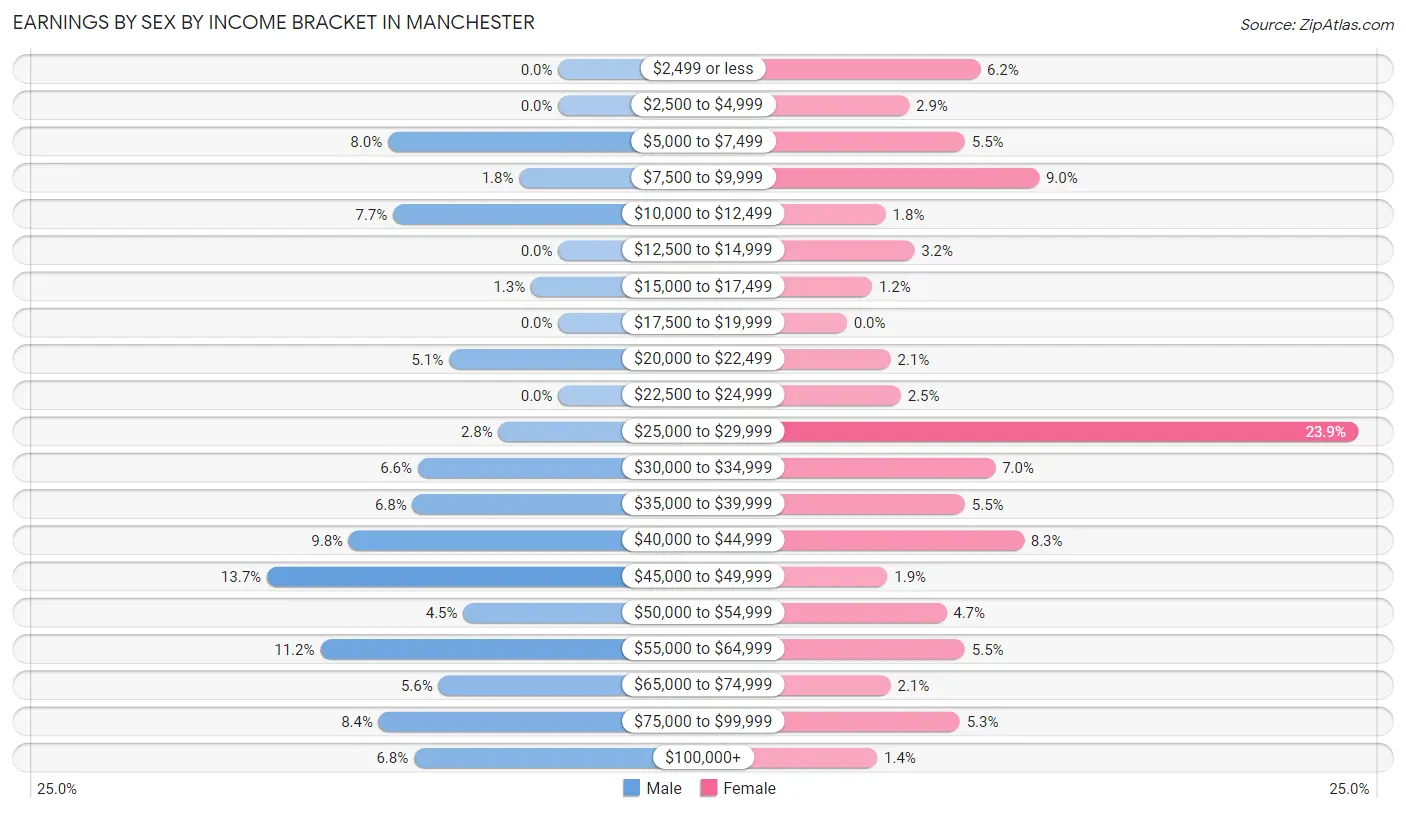
Earnings by Sex by Income Bracket in Manchester
The most common earnings brackets in Manchester are $45,000 to $49,999 for men (224 | 13.7%) and $25,000 to $29,999 for women (303 | 23.9%).
| Income | Male | Female |
| $2,499 or less | 0 (0.0%) | 79 (6.2%) |
| $2,500 to $4,999 | 0 (0.0%) | 37 (2.9%) |
| $5,000 to $7,499 | 131 (8.0%) | 70 (5.5%) |
| $7,500 to $9,999 | 30 (1.8%) | 114 (9.0%) |
| $10,000 to $12,499 | 127 (7.7%) | 23 (1.8%) |
| $12,500 to $14,999 | 0 (0.0%) | 40 (3.2%) |
| $15,000 to $17,499 | 21 (1.3%) | 15 (1.2%) |
| $17,500 to $19,999 | 0 (0.0%) | 0 (0.0%) |
| $20,000 to $22,499 | 84 (5.1%) | 26 (2.1%) |
| $22,500 to $24,999 | 0 (0.0%) | 32 (2.5%) |
| $25,000 to $29,999 | 46 (2.8%) | 303 (23.9%) |
| $30,000 to $34,999 | 108 (6.6%) | 88 (7.0%) |
| $35,000 to $39,999 | 112 (6.8%) | 70 (5.5%) |
| $40,000 to $44,999 | 161 (9.8%) | 105 (8.3%) |
| $45,000 to $49,999 | 224 (13.7%) | 24 (1.9%) |
| $50,000 to $54,999 | 73 (4.4%) | 59 (4.7%) |
| $55,000 to $64,999 | 183 (11.2%) | 70 (5.5%) |
| $65,000 to $74,999 | 92 (5.6%) | 26 (2.1%) |
| $75,000 to $99,999 | 138 (8.4%) | 67 (5.3%) |
| $100,000+ | 111 (6.8%) | 18 (1.4%) |
| Total | 1,641 (100.0%) | 1,266 (100.0%) |
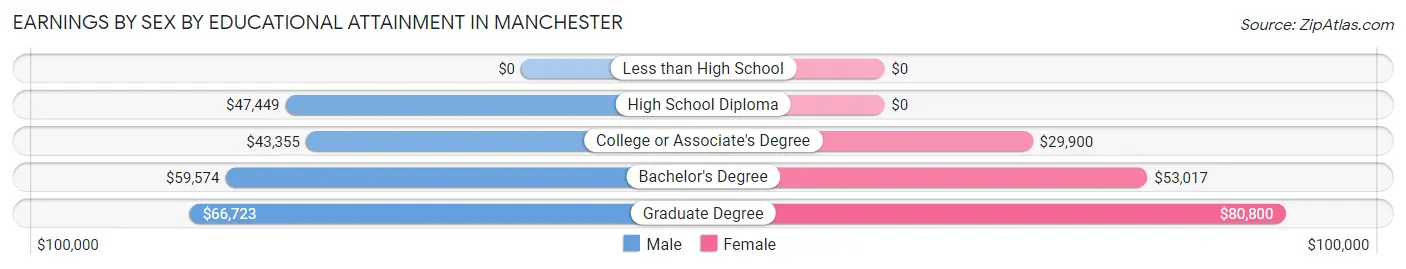
Earnings by Sex by Educational Attainment in Manchester
Average earnings in Manchester are $47,089 for men and $29,763 for women, a difference of 36.8%. Men with an educational attainment of graduate degree enjoy the highest average annual earnings of $66,723, while those with college or associate's degree education earn the least with $43,355. Women with an educational attainment of graduate degree earn the most with the average annual earnings of $80,800, while those with college or associate's degree education have the smallest earnings of $29,900.
| Educational Attainment | Male Income | Female Income |
| Less than High School | - | - |
| High School Diploma | $47,449 | $0 |
| College or Associate's Degree | $43,355 | $29,900 |
| Bachelor's Degree | $59,574 | $53,017 |
| Graduate Degree | $66,723 | $80,800 |
| Total | $47,089 | $29,763 |
Family Income in Manchester
Family Income Brackets in Manchester
According to the Manchester family income data, there are 348 families falling into the $50,000 to $74,999 income range, which is the most common income bracket and makes up 25.4% of all families. Conversely, the less than $10,000 income bracket is the least frequent group with only 21 families (1.5%) belonging to this category.
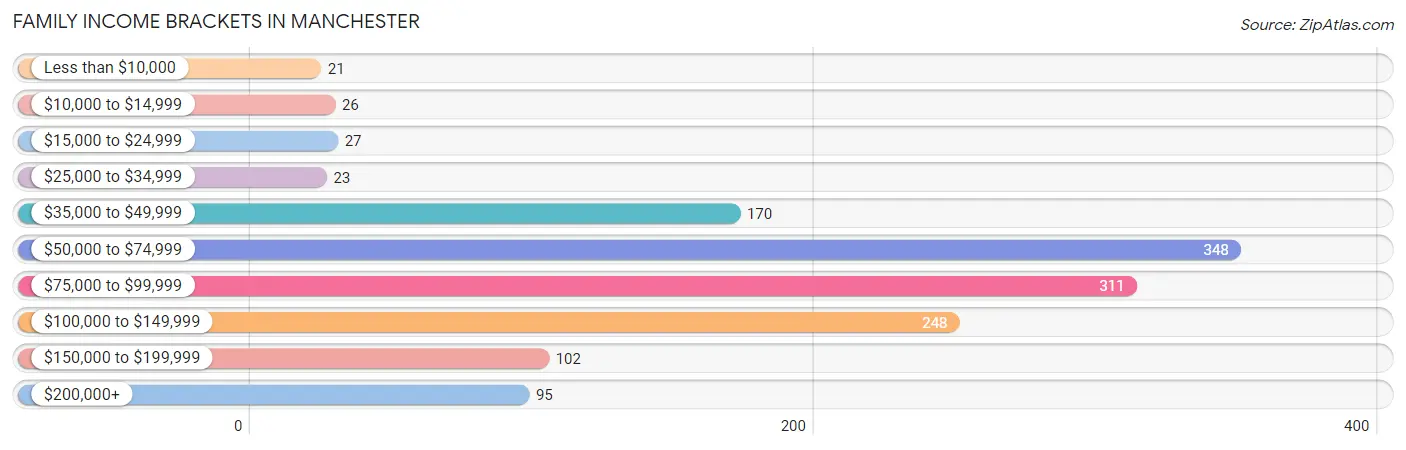
| Income Bracket | # Families | % Families |
| Less than $10,000 | 21 | 1.5% |
| $10,000 to $14,999 | 26 | 1.9% |
| $15,000 to $24,999 | 27 | 2.0% |
| $25,000 to $34,999 | 23 | 1.7% |
| $35,000 to $49,999 | 170 | 12.4% |
| $50,000 to $74,999 | 348 | 25.4% |
| $75,000 to $99,999 | 311 | 22.7% |
| $100,000 to $149,999 | 248 | 18.1% |
| $150,000 to $199,999 | 102 | 7.4% |
| $200,000+ | 95 | 6.9% |
Family Income by Famaliy Size in Manchester
4-person families (168 | 12.2%) account for the highest median family income in Manchester with $77,027 per family, while 2-person families (882 | 64.3%) have the highest median income of $35,178 per family member.
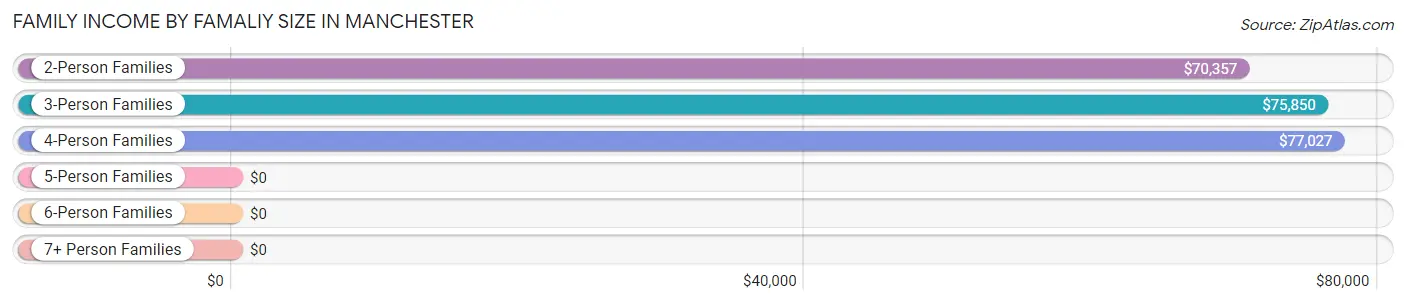
| Income Bracket | # Families | Median Income |
| 2-Person Families | 882 (64.3%) | $70,357 |
| 3-Person Families | 223 (16.3%) | $75,850 |
| 4-Person Families | 168 (12.2%) | $77,027 |
| 5-Person Families | 35 (2.5%) | $0 |
| 6-Person Families | 64 (4.7%) | $0 |
| 7+ Person Families | 0 (0.0%) | $0 |
| Total | 1,372 (100.0%) | $76,074 |
Family Income by Number of Earners in Manchester
The median family income in Manchester is $76,074, with families comprising 3+ earners (90) having the highest median family income of $156,934, while families with 1 earner (332) have the lowest median family income of $56,659, accounting for 6.6% and 24.2% of families, respectively.
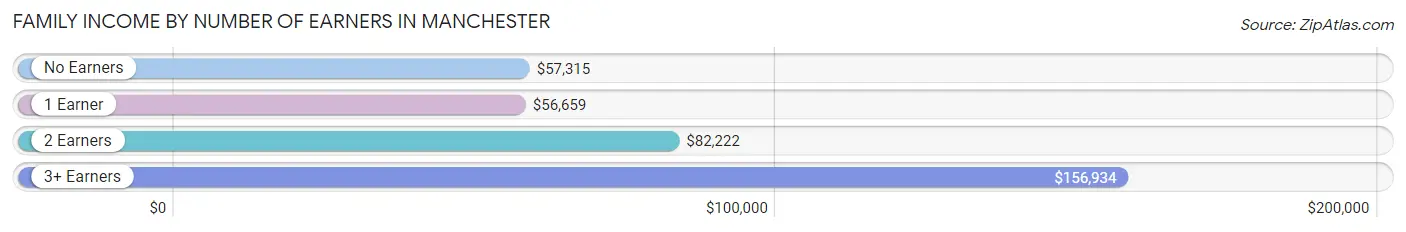
| Number of Earners | # Families | Median Income |
| No Earners | 210 (15.3%) | $57,315 |
| 1 Earner | 332 (24.2%) | $56,659 |
| 2 Earners | 740 (53.9%) | $82,222 |
| 3+ Earners | 90 (6.6%) | $156,934 |
| Total | 1,372 (100.0%) | $76,074 |
Household Income in Manchester
Household Income Brackets in Manchester
With 458 households falling in the category, the $50,000 to $74,999 income range is the most frequent in Manchester, accounting for 20.1% of all households. In contrast, only 36 households (1.6%) fall into the less than $10,000 income bracket, making it the least populous group.
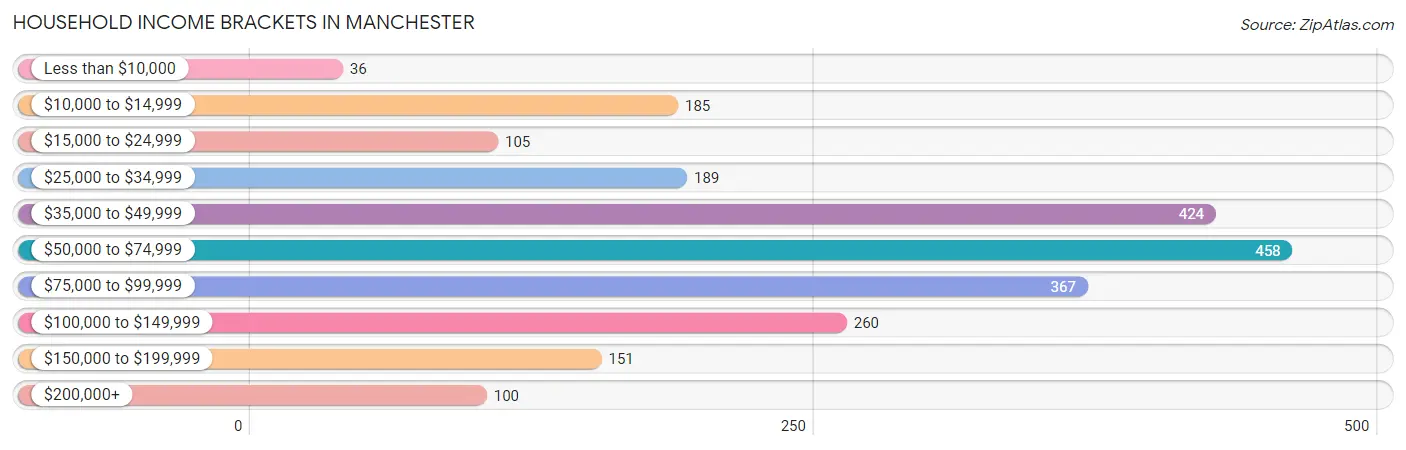
| Income Bracket | # Households | % Households |
| Less than $10,000 | 36 | 1.6% |
| $10,000 to $14,999 | 185 | 8.1% |
| $15,000 to $24,999 | 105 | 4.6% |
| $25,000 to $34,999 | 189 | 8.3% |
| $35,000 to $49,999 | 424 | 18.6% |
| $50,000 to $74,999 | 458 | 20.1% |
| $75,000 to $99,999 | 367 | 16.1% |
| $100,000 to $149,999 | 260 | 11.4% |
| $150,000 to $199,999 | 151 | 6.6% |
| $200,000+ | 100 | 4.4% |
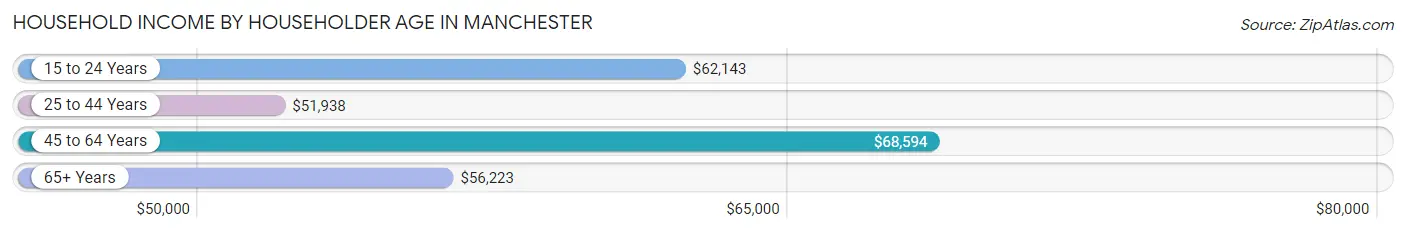
Household Income by Householder Age in Manchester
The median household income in Manchester is $57,969, with the highest median household income of $68,594 found in the 45 to 64 years age bracket for the primary householder. A total of 961 households (42.1%) fall into this category. Meanwhile, the 25 to 44 years age bracket for the primary householder has the lowest median household income of $51,938, with 453 households (19.9%) in this group.
| Income Bracket | # Households | Median Income |
| 15 to 24 Years | 110 (4.8%) | $62,143 |
| 25 to 44 Years | 453 (19.9%) | $51,938 |
| 45 to 64 Years | 961 (42.1%) | $68,594 |
| 65+ Years | 757 (33.2%) | $56,223 |
| Total | 2,281 (100.0%) | $57,969 |
Poverty in Manchester
Income Below Poverty by Sex and Age in Manchester
With 4.6% poverty level for males and 12.9% for females among the residents of Manchester, 16 and 17 year old males and 75 year old and over females are the most vulnerable to poverty, with 39 males (44.3%) and 68 females (18.9%) in their respective age groups living below the poverty level.
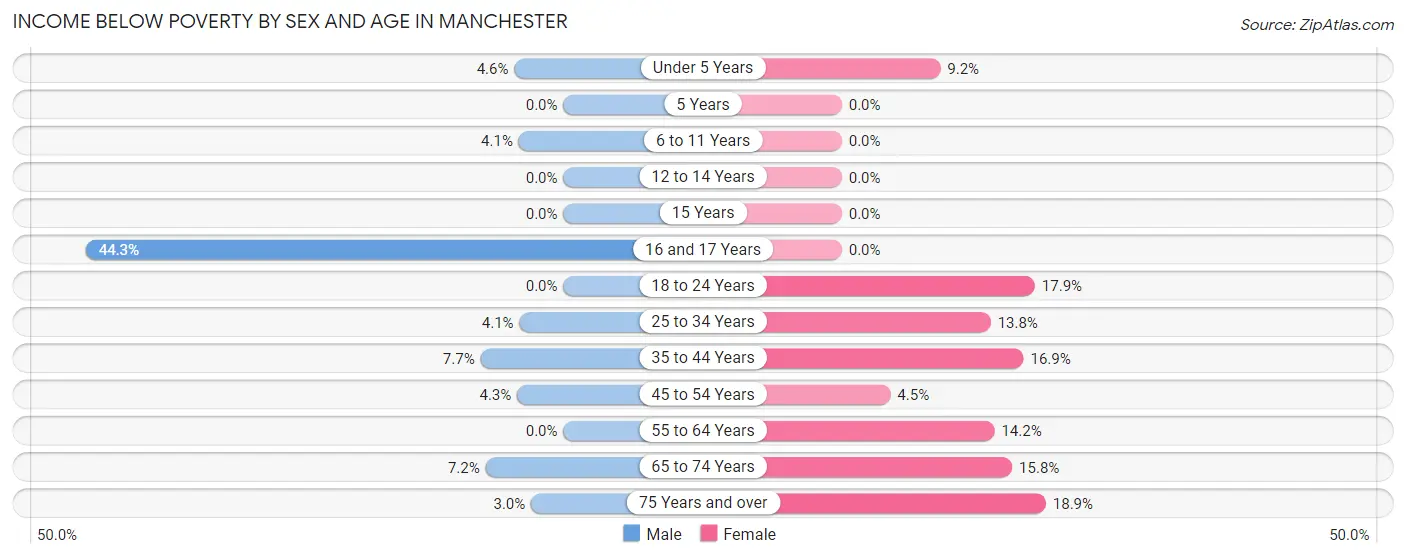
| Age Bracket | Male | Female |
| Under 5 Years | 7 (4.5%) | 15 (9.1%) |
| 5 Years | 0 (0.0%) | 0 (0.0%) |
| 6 to 11 Years | 6 (4.1%) | 0 (0.0%) |
| 12 to 14 Years | 0 (0.0%) | 0 (0.0%) |
| 15 Years | 0 (0.0%) | 0 (0.0%) |
| 16 and 17 Years | 39 (44.3%) | 0 (0.0%) |
| 18 to 24 Years | 0 (0.0%) | 38 (17.9%) |
| 25 to 34 Years | 10 (4.1%) | 30 (13.8%) |
| 35 to 44 Years | 18 (7.7%) | 28 (16.9%) |
| 45 to 54 Years | 10 (4.3%) | 11 (4.5%) |
| 55 to 64 Years | 0 (0.0%) | 69 (14.2%) |
| 65 to 74 Years | 21 (7.2%) | 52 (15.8%) |
| 75 Years and over | 9 (3.0%) | 68 (18.9%) |
| Total | 120 (4.6%) | 311 (12.9%) |
Income Above Poverty by Sex and Age in Manchester
According to the poverty statistics in Manchester, males aged 5 years and females aged 6 to 11 years are the age groups that are most secure financially, with 100.0% of males and 100.0% of females in these age groups living above the poverty line.
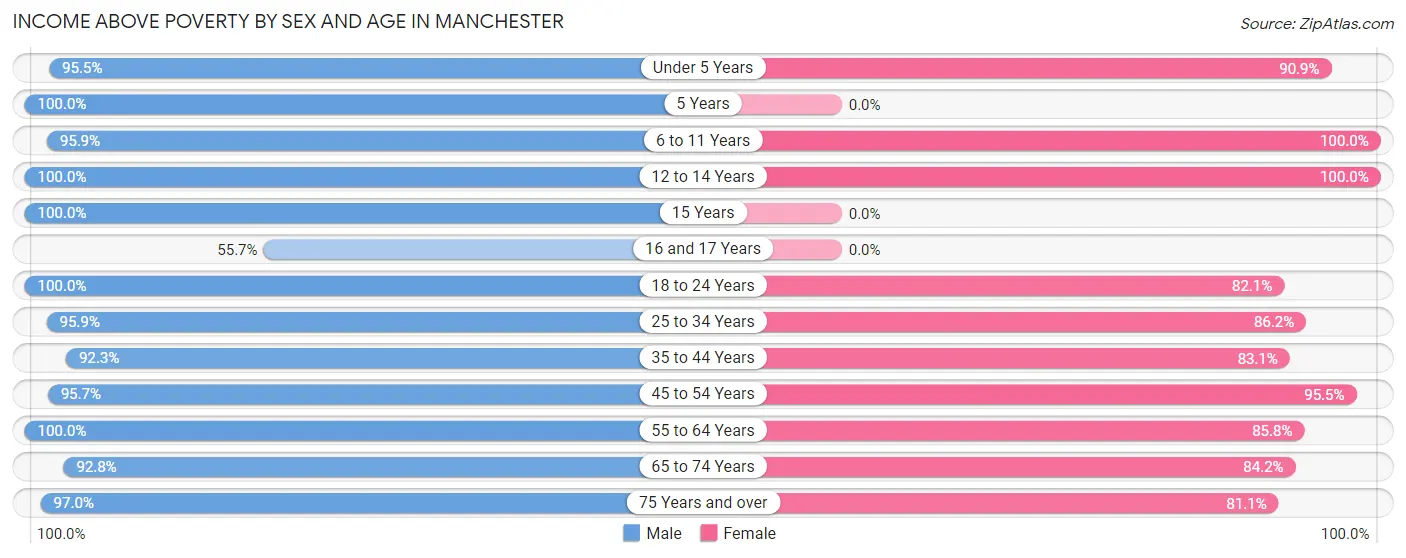
| Age Bracket | Male | Female |
| Under 5 Years | 147 (95.5%) | 149 (90.8%) |
| 5 Years | 66 (100.0%) | 0 (0.0%) |
| 6 to 11 Years | 139 (95.9%) | 146 (100.0%) |
| 12 to 14 Years | 86 (100.0%) | 85 (100.0%) |
| 15 Years | 33 (100.0%) | 0 (0.0%) |
| 16 and 17 Years | 49 (55.7%) | 0 (0.0%) |
| 18 to 24 Years | 252 (100.0%) | 174 (82.1%) |
| 25 to 34 Years | 235 (95.9%) | 187 (86.2%) |
| 35 to 44 Years | 216 (92.3%) | 138 (83.1%) |
| 45 to 54 Years | 223 (95.7%) | 233 (95.5%) |
| 55 to 64 Years | 457 (100.0%) | 418 (85.8%) |
| 65 to 74 Years | 270 (92.8%) | 277 (84.2%) |
| 75 Years and over | 292 (97.0%) | 291 (81.1%) |
| Total | 2,465 (95.4%) | 2,098 (87.1%) |
Income Below Poverty Among Married-Couple Families in Manchester
The poverty statistics for married-couple families in Manchester show that 1.8% or 21 of the total 1,175 families live below the poverty line. Families with 1 or 2 children have the highest poverty rate of 3.6%, comprising of 11 families. On the other hand, families with 3 or 4 children have the lowest poverty rate of 0.0%, which includes 0 families.
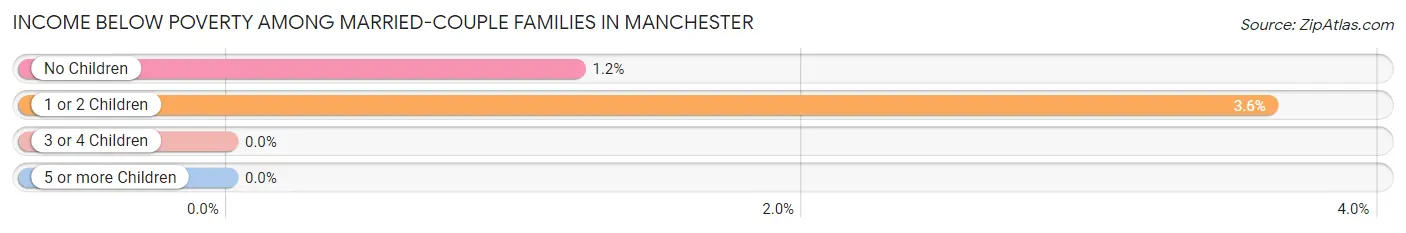
| Children | Above Poverty | Below Poverty |
| No Children | 815 (98.8%) | 10 (1.2%) |
| 1 or 2 Children | 293 (96.4%) | 11 (3.6%) |
| 3 or 4 Children | 46 (100.0%) | 0 (0.0%) |
| 5 or more Children | 0 (0.0%) | 0 (0.0%) |
| Total | 1,154 (98.2%) | 21 (1.8%) |
Income Below Poverty Among Single-Parent Households in Manchester
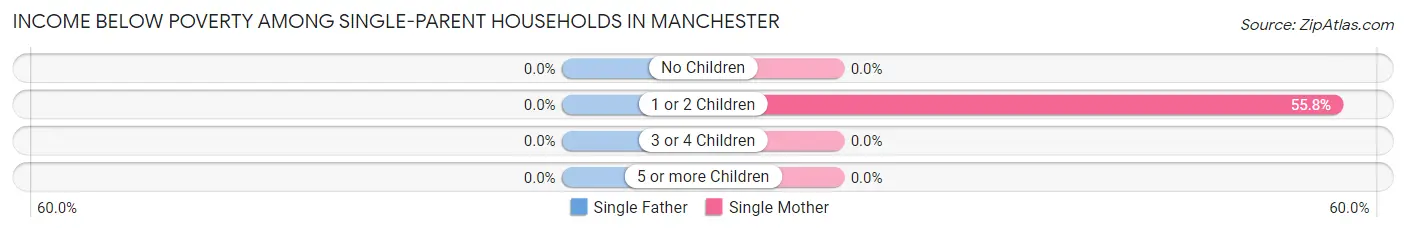
| Children | Single Father | Single Mother |
| No Children | 0 (0.0%) | 0 (0.0%) |
| 1 or 2 Children | 0 (0.0%) | 53 (55.8%) |
| 3 or 4 Children | 0 (0.0%) | 0 (0.0%) |
| 5 or more Children | 0 (0.0%) | 0 (0.0%) |
| Total | 0 (0.0%) | 53 (41.1%) |
Income Below Poverty Among Married-Couple vs Single-Parent Households in Manchester
The poverty data for Manchester shows that 21 of the married-couple family households (1.8%) and 53 of the single-parent households (26.9%) are living below the poverty level. Within the married-couple family households, those with 1 or 2 children have the highest poverty rate, with 11 households (3.6%) falling below the poverty line. Among the single-parent households, those with 1 or 2 children have the highest poverty rate, with 53 household (42.4%) living below poverty.
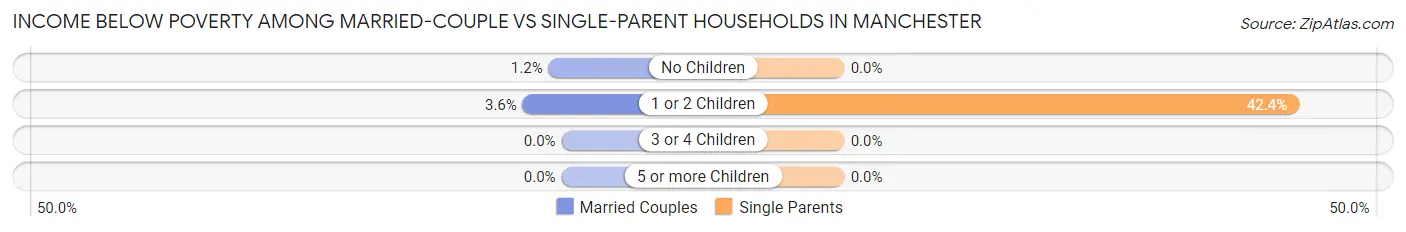
| Children | Married-Couple Families | Single-Parent Households |
| No Children | 10 (1.2%) | 0 (0.0%) |
| 1 or 2 Children | 11 (3.6%) | 53 (42.4%) |
| 3 or 4 Children | 0 (0.0%) | 0 (0.0%) |
| 5 or more Children | 0 (0.0%) | 0 (0.0%) |
| Total | 21 (1.8%) | 53 (26.9%) |
Race in Manchester
The most populous races in Manchester are White / Caucasian (4,846 | 94.8%), Two or more Races (226 | 4.4%), and Hispanic or Latino (109 | 2.1%).
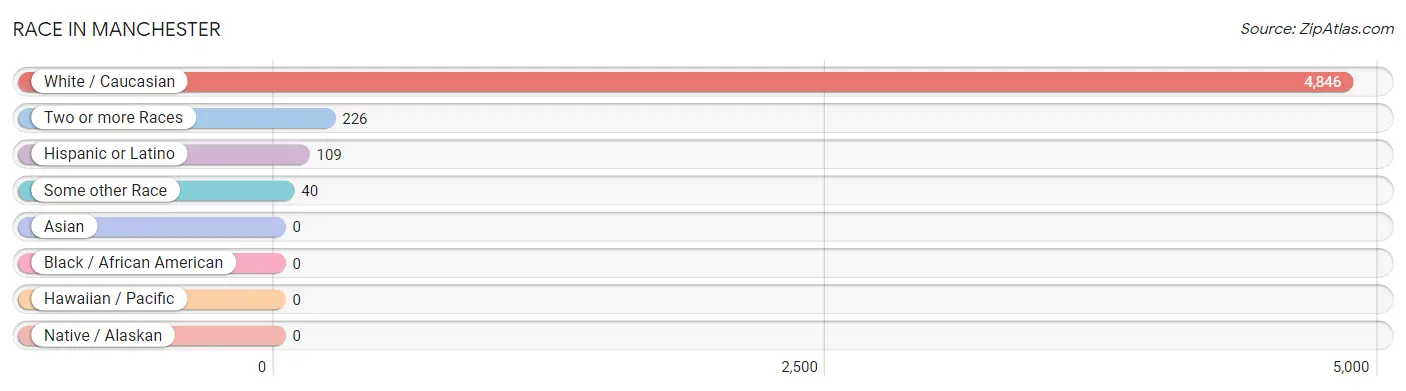
| Race | # Population | % Population |
| Asian | 0 | 0.0% |
| Black / African American | 0 | 0.0% |
| Hawaiian / Pacific | 0 | 0.0% |
| Hispanic or Latino | 109 | 2.1% |
| Native / Alaskan | 0 | 0.0% |
| White / Caucasian | 4,846 | 94.8% |
| Two or more Races | 226 | 4.4% |
| Some other Race | 40 | 0.8% |
| Total | 5,112 | 100.0% |
Ancestry in Manchester
The most populous ancestries reported in Manchester are German (2,410 | 47.1%), Irish (877 | 17.2%), English (697 | 13.6%), Swedish (289 | 5.7%), and Czech (165 | 3.2%), together accounting for 86.8% of all Manchester residents.
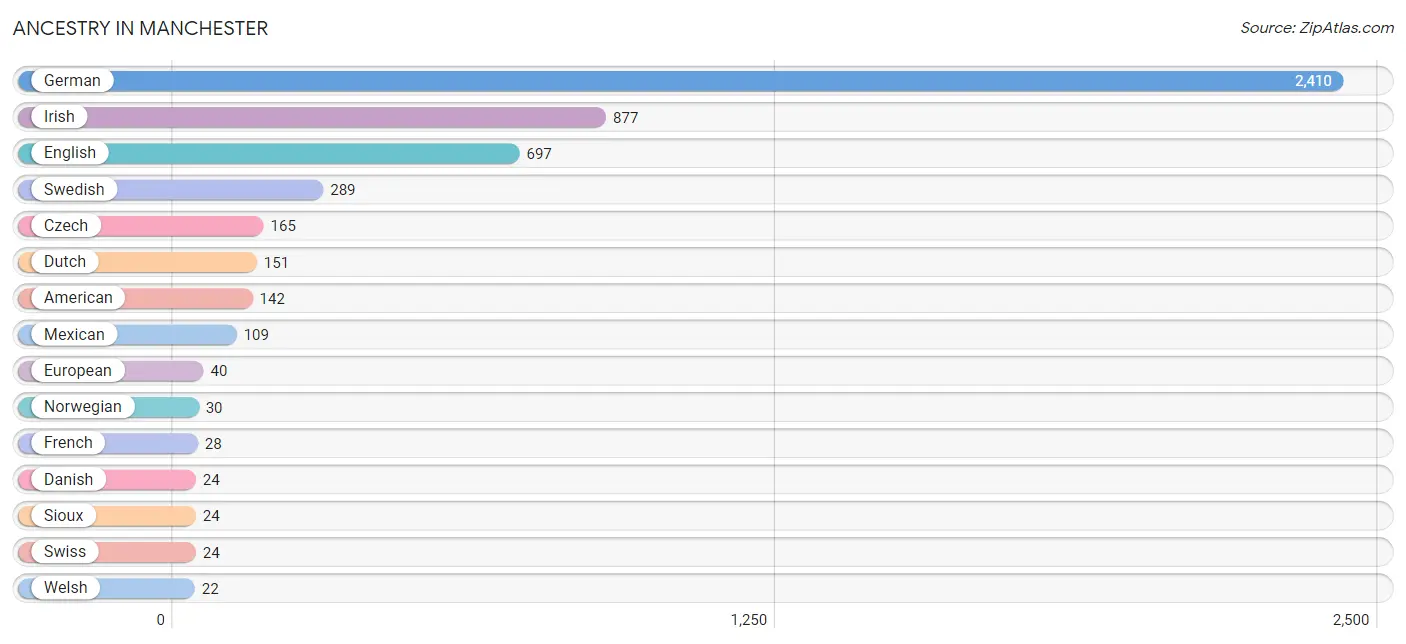
| Ancestry | # Population | % Population |
| American | 142 | 2.8% |
| Cherokee | 16 | 0.3% |
| Czech | 165 | 3.2% |
| Czechoslovakian | 5 | 0.1% |
| Danish | 24 | 0.5% |
| Dutch | 151 | 2.9% |
| English | 697 | 13.6% |
| European | 40 | 0.8% |
| French | 28 | 0.5% |
| German | 2,410 | 47.1% |
| Greek | 10 | 0.2% |
| Irish | 877 | 17.2% |
| Italian | 18 | 0.4% |
| Mexican | 109 | 2.1% |
| Norwegian | 30 | 0.6% |
| Polish | 5 | 0.1% |
| Scottish | 9 | 0.2% |
| Sioux | 24 | 0.5% |
| Swedish | 289 | 5.7% |
| Swiss | 24 | 0.5% |
| Welsh | 22 | 0.4% | View All 21 Rows |
Immigrants in Manchester

| Immigration Origin | # Population | % Population | View All 0 Rows |
Sex and Age in Manchester
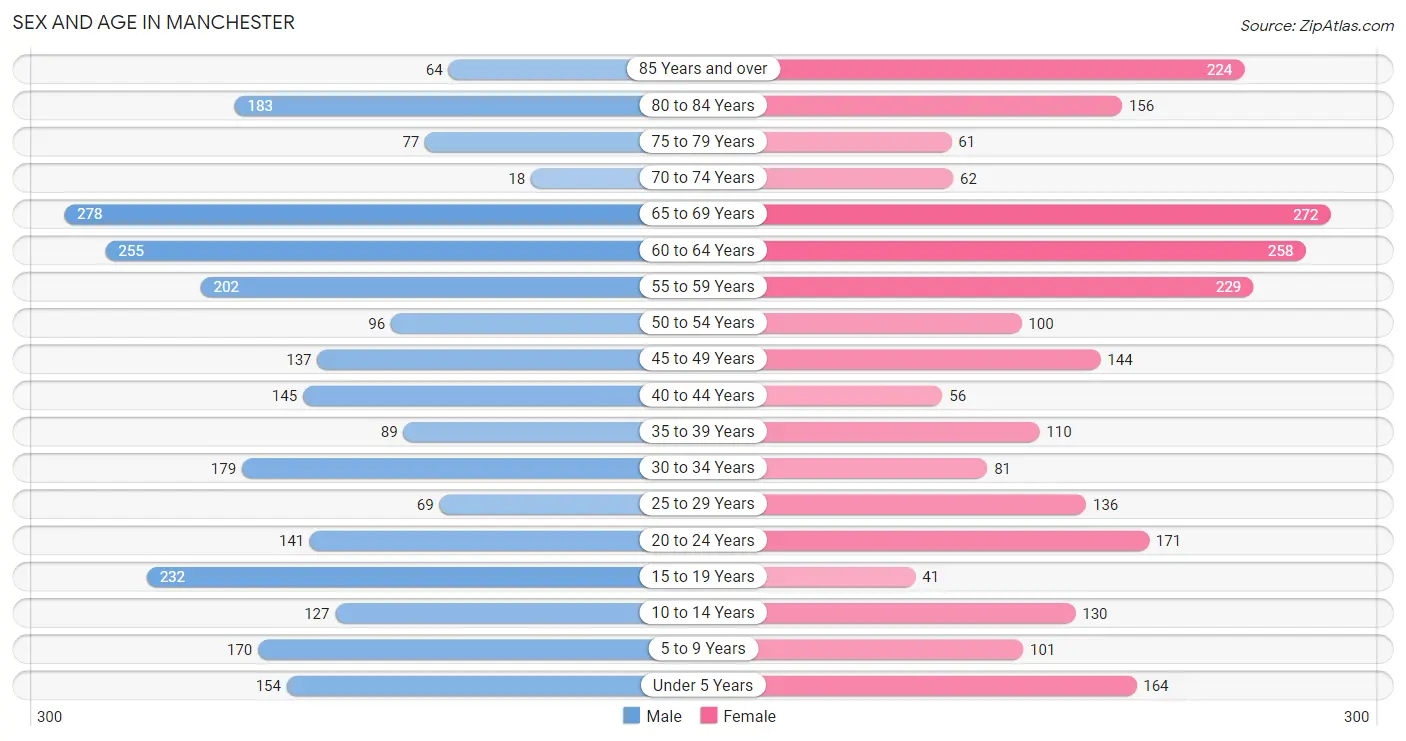
Sex and Age in Manchester
The most populous age groups in Manchester are 65 to 69 Years (278 | 10.6%) for men and 65 to 69 Years (272 | 10.9%) for women.
| Age Bracket | Male | Female |
| Under 5 Years | 154 (5.9%) | 164 (6.6%) |
| 5 to 9 Years | 170 (6.5%) | 101 (4.1%) |
| 10 to 14 Years | 127 (4.9%) | 130 (5.2%) |
| 15 to 19 Years | 232 (8.9%) | 41 (1.6%) |
| 20 to 24 Years | 141 (5.4%) | 171 (6.9%) |
| 25 to 29 Years | 69 (2.6%) | 136 (5.4%) |
| 30 to 34 Years | 179 (6.8%) | 81 (3.3%) |
| 35 to 39 Years | 89 (3.4%) | 110 (4.4%) |
| 40 to 44 Years | 145 (5.5%) | 56 (2.2%) |
| 45 to 49 Years | 137 (5.2%) | 144 (5.8%) |
| 50 to 54 Years | 96 (3.7%) | 100 (4.0%) |
| 55 to 59 Years | 202 (7.7%) | 229 (9.2%) |
| 60 to 64 Years | 255 (9.8%) | 258 (10.3%) |
| 65 to 69 Years | 278 (10.6%) | 272 (10.9%) |
| 70 to 74 Years | 18 (0.7%) | 62 (2.5%) |
| 75 to 79 Years | 77 (2.9%) | 61 (2.4%) |
| 80 to 84 Years | 183 (7.0%) | 156 (6.2%) |
| 85 Years and over | 64 (2.5%) | 224 (9.0%) |
| Total | 2,616 (100.0%) | 2,496 (100.0%) |
Families and Households in Manchester
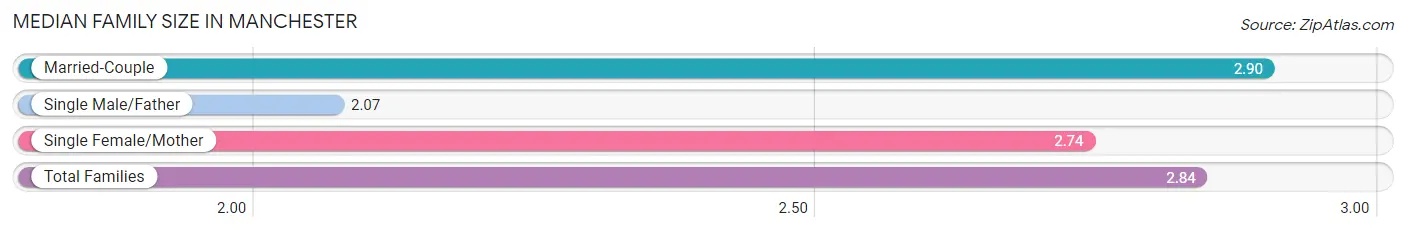
Median Family Size in Manchester
The median family size in Manchester is 2.84 persons per family, with married-couple families (1,175 | 85.6%) accounting for the largest median family size of 2.9 persons per family. On the other hand, single male/father families (68 | 5.0%) represent the smallest median family size with 2.07 persons per family.
| Family Type | # Families | Family Size |
| Married-Couple | 1,175 (85.6%) | 2.90 |
| Single Male/Father | 68 (5.0%) | 2.07 |
| Single Female/Mother | 129 (9.4%) | 2.74 |
| Total Families | 1,372 (100.0%) | 2.84 |
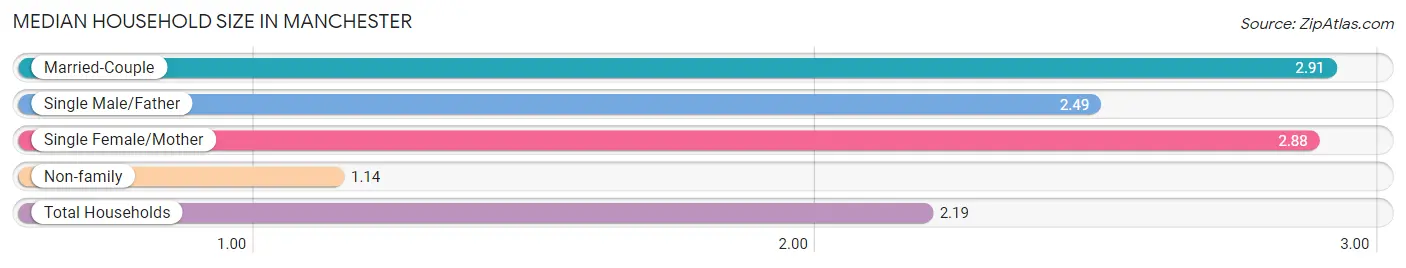
Median Household Size in Manchester
The median household size in Manchester is 2.19 persons per household, with married-couple households (1,175 | 51.5%) accounting for the largest median household size of 2.91 persons per household. non-family households (909 | 39.9%) represent the smallest median household size with 1.14 persons per household.
| Household Type | # Households | Household Size |
| Married-Couple | 1,175 (51.5%) | 2.91 |
| Single Male/Father | 68 (3.0%) | 2.49 |
| Single Female/Mother | 129 (5.7%) | 2.88 |
| Non-family | 909 (39.9%) | 1.14 |
| Total Households | 2,281 (100.0%) | 2.19 |
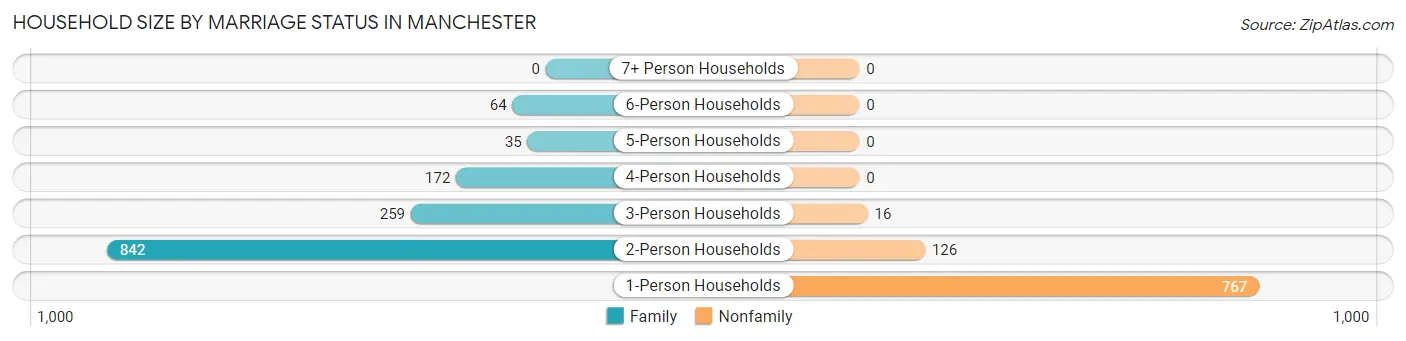
Household Size by Marriage Status in Manchester
Out of a total of 2,281 households in Manchester, 1,372 (60.2%) are family households, while 909 (39.9%) are nonfamily households. The most numerous type of family households are 2-person households, comprising 842, and the most common type of nonfamily households are 1-person households, comprising 767.
| Household Size | Family Households | Nonfamily Households |
| 1-Person Households | - | 767 (33.6%) |
| 2-Person Households | 842 (36.9%) | 126 (5.5%) |
| 3-Person Households | 259 (11.4%) | 16 (0.7%) |
| 4-Person Households | 172 (7.5%) | 0 (0.0%) |
| 5-Person Households | 35 (1.5%) | 0 (0.0%) |
| 6-Person Households | 64 (2.8%) | 0 (0.0%) |
| 7+ Person Households | 0 (0.0%) | 0 (0.0%) |
| Total | 1,372 (60.2%) | 909 (39.9%) |
Female Fertility in Manchester
Fertility by Age in Manchester
Average fertility rate in Manchester is 72.0 births per 1,000 women. Women in the age bracket of 20 to 34 years have the highest fertility rate with 142.0 births per 1,000 women. Women in the age bracket of 20 to 34 years acount for 100.0% of all women with births.
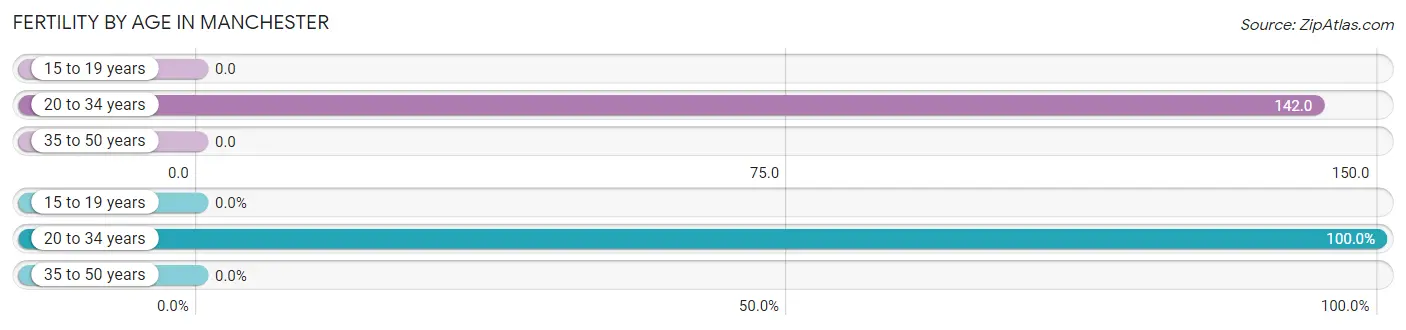
| Age Bracket | Women with Births | Births / 1,000 Women |
| 15 to 19 years | 0 (0.0%) | 0.0 |
| 20 to 34 years | 55 (100.0%) | 142.0 |
| 35 to 50 years | 0 (0.0%) | 0.0 |
| Total | 55 (100.0%) | 72.0 |
Fertility by Age by Marriage Status in Manchester
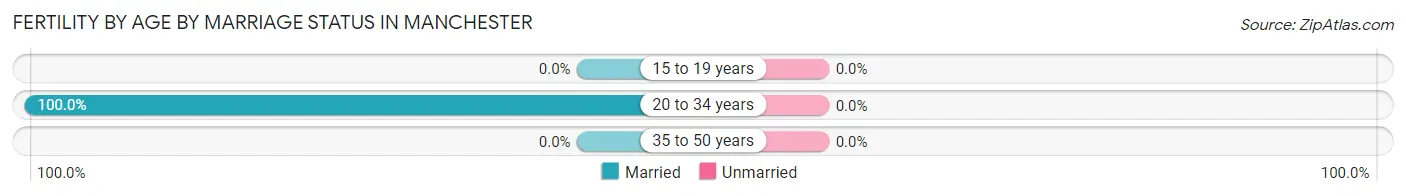
| Age Bracket | Married | Unmarried |
| 15 to 19 years | 0 (0.0%) | 0 (0.0%) |
| 20 to 34 years | 55 (100.0%) | 0 (0.0%) |
| 35 to 50 years | 0 (0.0%) | 0 (0.0%) |
| Total | 55 (100.0%) | 0 (0.0%) |
Fertility by Education in Manchester
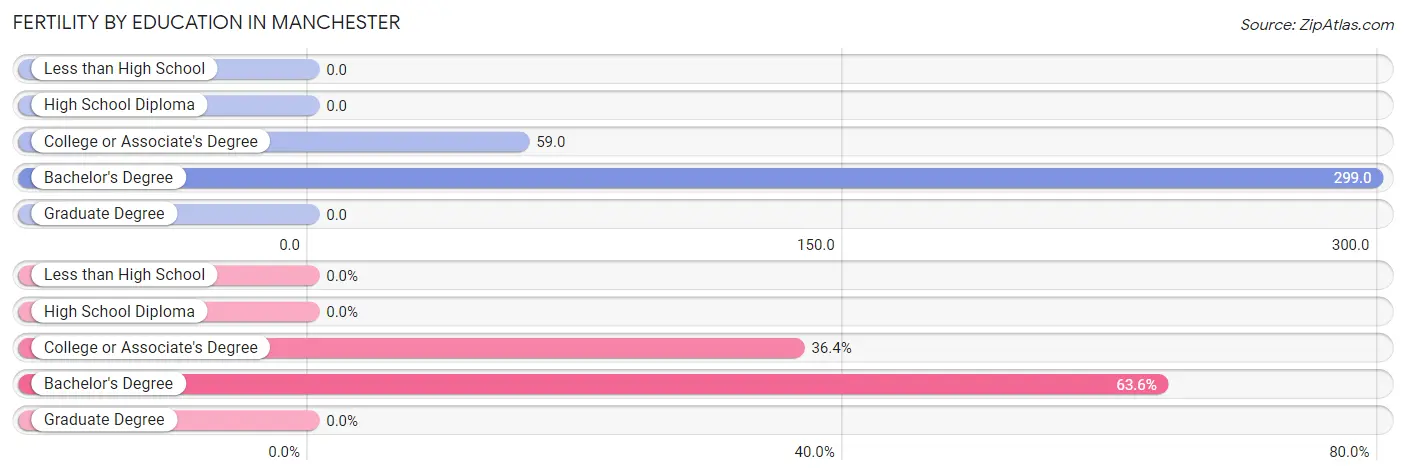
| Educational Attainment | Women with Births | Births / 1,000 Women |
| Less than High School | 0 (0.0%) | 0.0 |
| High School Diploma | 0 (0.0%) | 0.0 |
| College or Associate's Degree | 20 (36.4%) | 59.0 |
| Bachelor's Degree | 35 (63.6%) | 299.0 |
| Graduate Degree | 0 (0.0%) | 0.0 |
| Total | 55 (100.0%) | 72.0 |
Fertility by Education by Marriage Status in Manchester
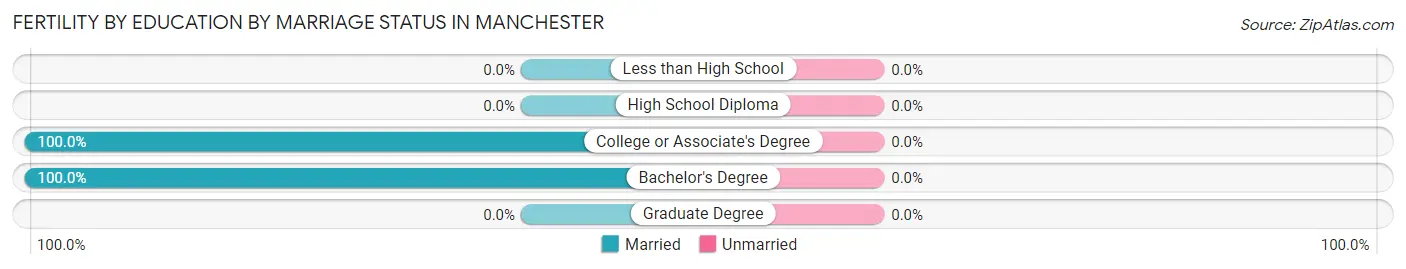
| Educational Attainment | Married | Unmarried |
| Less than High School | 0 (0.0%) | 0 (0.0%) |
| High School Diploma | 0 (0.0%) | 0 (0.0%) |
| College or Associate's Degree | 20 (100.0%) | 0 (0.0%) |
| Bachelor's Degree | 35 (100.0%) | 0 (0.0%) |
| Graduate Degree | 0 (0.0%) | 0 (0.0%) |
| Total | 55 (100.0%) | 0 (0.0%) |
Employment Characteristics in Manchester
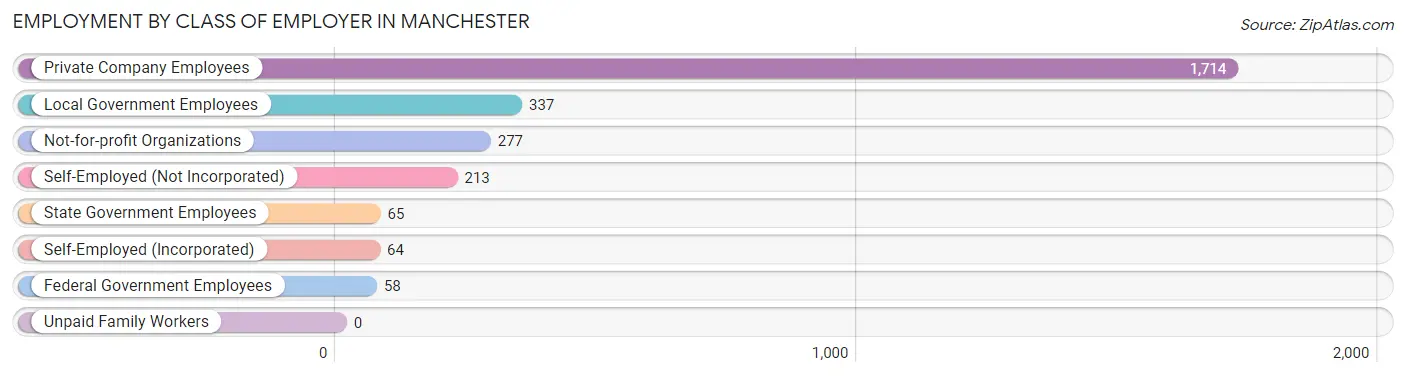
Employment by Class of Employer in Manchester
Among the 2,728 employed individuals in Manchester, private company employees (1,714 | 62.8%), local government employees (337 | 12.3%), and not-for-profit organizations (277 | 10.2%) make up the most common classes of employment.
| Employer Class | # Employees | % Employees |
| Private Company Employees | 1,714 | 62.8% |
| Self-Employed (Incorporated) | 64 | 2.4% |
| Self-Employed (Not Incorporated) | 213 | 7.8% |
| Not-for-profit Organizations | 277 | 10.2% |
| Local Government Employees | 337 | 12.3% |
| State Government Employees | 65 | 2.4% |
| Federal Government Employees | 58 | 2.1% |
| Unpaid Family Workers | 0 | 0.0% |
| Total | 2,728 | 100.0% |
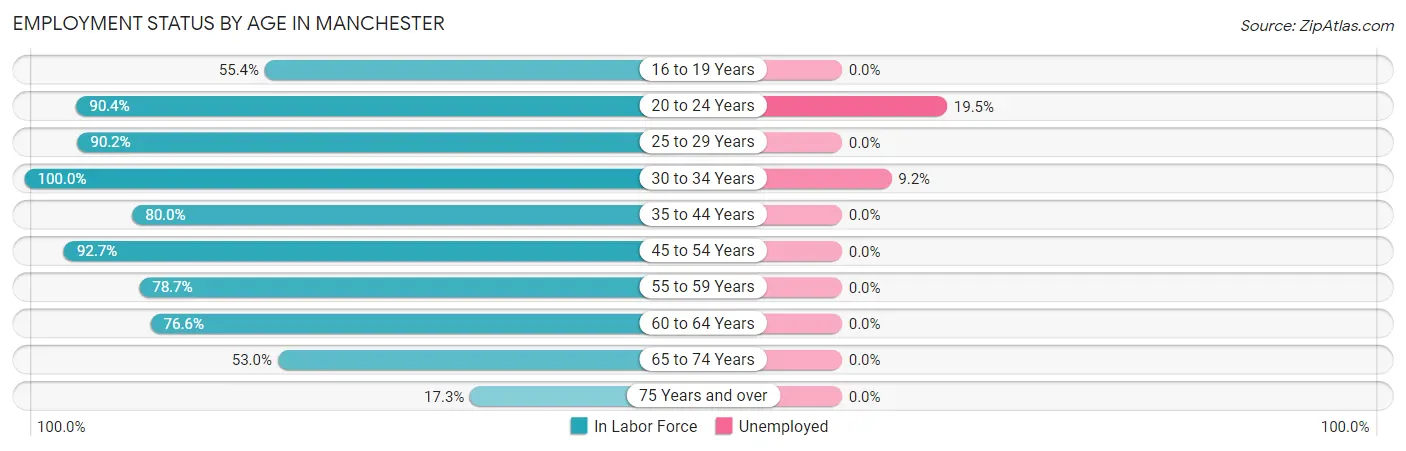
Employment Status by Age in Manchester
According to the labor force statistics for Manchester, out of the total population over 16 years of age (4,233), 66.6% or 2,819 individuals are in the labor force, with 2.8% or 79 of them unemployed. The age group with the highest labor force participation rate is 30 to 34 years, with 100.0% or 260 individuals in the labor force. Within the labor force, the 20 to 24 years age range has the highest percentage of unemployed individuals, with 19.5% or 55 of them being unemployed.
| Age Bracket | In Labor Force | Unemployed |
| 16 to 19 Years | 133 (55.4%) | 0 (0.0%) |
| 20 to 24 Years | 282 (90.4%) | 55 (19.5%) |
| 25 to 29 Years | 185 (90.2%) | 0 (0.0%) |
| 30 to 34 Years | 260 (100.0%) | 24 (9.2%) |
| 35 to 44 Years | 320 (80.0%) | 0 (0.0%) |
| 45 to 54 Years | 442 (92.7%) | 0 (0.0%) |
| 55 to 59 Years | 339 (78.7%) | 0 (0.0%) |
| 60 to 64 Years | 393 (76.6%) | 0 (0.0%) |
| 65 to 74 Years | 334 (53.0%) | 0 (0.0%) |
| 75 Years and over | 132 (17.3%) | 0 (0.0%) |
| Total | 2,819 (66.6%) | 79 (2.8%) |
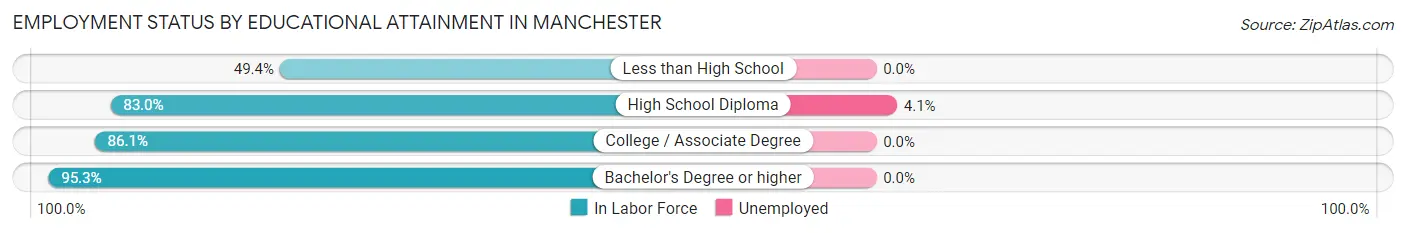
Employment Status by Educational Attainment in Manchester
According to labor force statistics for Manchester, 84.8% of individuals (1,939) out of the total population between 25 and 64 years of age (2,286) are in the labor force, with 1.2% or 23 of them being unemployed. The group with the highest labor force participation rate are those with the educational attainment of bachelor's degree or higher, with 95.3% or 505 individuals in the labor force. Within the labor force, individuals with high school diploma education have the highest percentage of unemployment, with 4.1% or 24 of them being unemployed.
| Educational Attainment | In Labor Force | Unemployed |
| Less than High School | 76 (49.4%) | 0 (0.0%) |
| High School Diploma | 581 (83.0%) | 29 (4.1%) |
| College / Associate Degree | 777 (86.1%) | 0 (0.0%) |
| Bachelor's Degree or higher | 505 (95.3%) | 0 (0.0%) |
| Total | 1,939 (84.8%) | 27 (1.2%) |
Employment Occupations by Sex in Manchester
Management, Business, Science and Arts Occupations
The most common Management, Business, Science and Arts occupations in Manchester are Community & Social Service (297 | 10.8%), Education Instruction & Library (261 | 9.5%), Business & Financial (116 | 4.2%), Health Diagnosing & Treating (116 | 4.2%), and Management (95 | 3.5%).
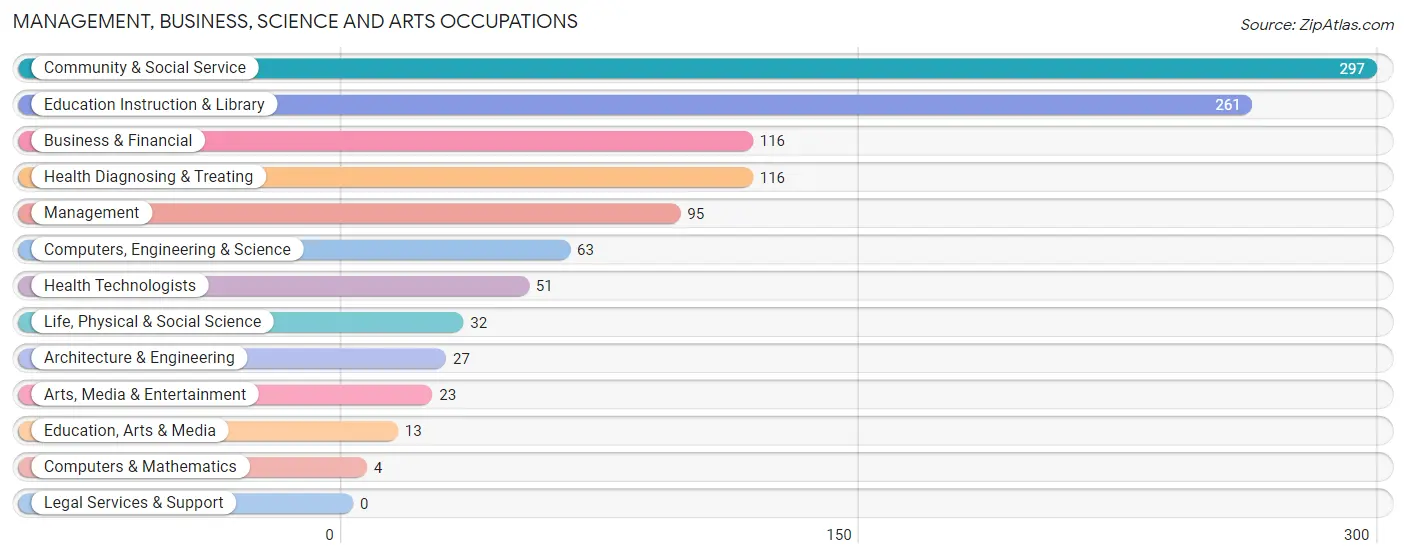
Management, Business, Science and Arts Occupations by Sex
Within the Management, Business, Science and Arts occupations in Manchester, the most male-oriented occupations are Computers, Engineering & Science (100.0%), Computers & Mathematics (100.0%), and Architecture & Engineering (100.0%), while the most female-oriented occupations are Arts, Media & Entertainment (100.0%), Health Diagnosing & Treating (94.0%), and Health Technologists (86.3%).
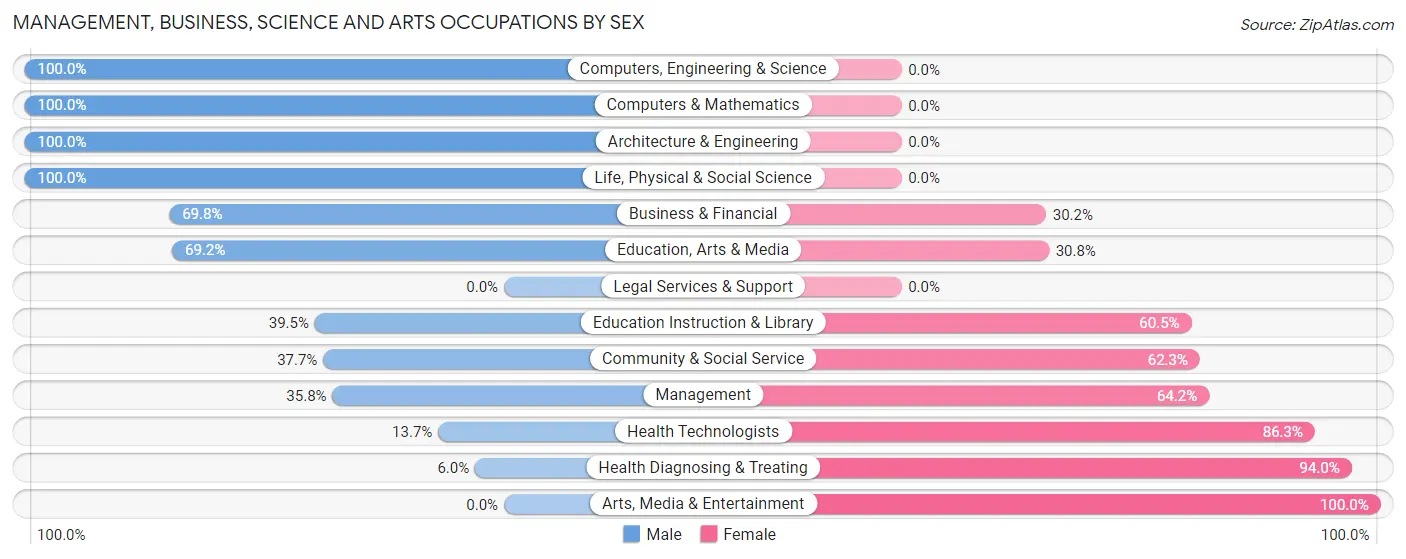
| Occupation | Male | Female |
| Management | 34 (35.8%) | 61 (64.2%) |
| Business & Financial | 81 (69.8%) | 35 (30.2%) |
| Computers, Engineering & Science | 63 (100.0%) | 0 (0.0%) |
| Computers & Mathematics | 4 (100.0%) | 0 (0.0%) |
| Architecture & Engineering | 27 (100.0%) | 0 (0.0%) |
| Life, Physical & Social Science | 32 (100.0%) | 0 (0.0%) |
| Community & Social Service | 112 (37.7%) | 185 (62.3%) |
| Education, Arts & Media | 9 (69.2%) | 4 (30.8%) |
| Legal Services & Support | 0 (0.0%) | 0 (0.0%) |
| Education Instruction & Library | 103 (39.5%) | 158 (60.5%) |
| Arts, Media & Entertainment | 0 (0.0%) | 23 (100.0%) |
| Health Diagnosing & Treating | 7 (6.0%) | 109 (94.0%) |
| Health Technologists | 7 (13.7%) | 44 (86.3%) |
| Total (Category) | 297 (43.2%) | 390 (56.8%) |
| Total (Overall) | 1,532 (55.9%) | 1,209 (44.1%) |
Services Occupations
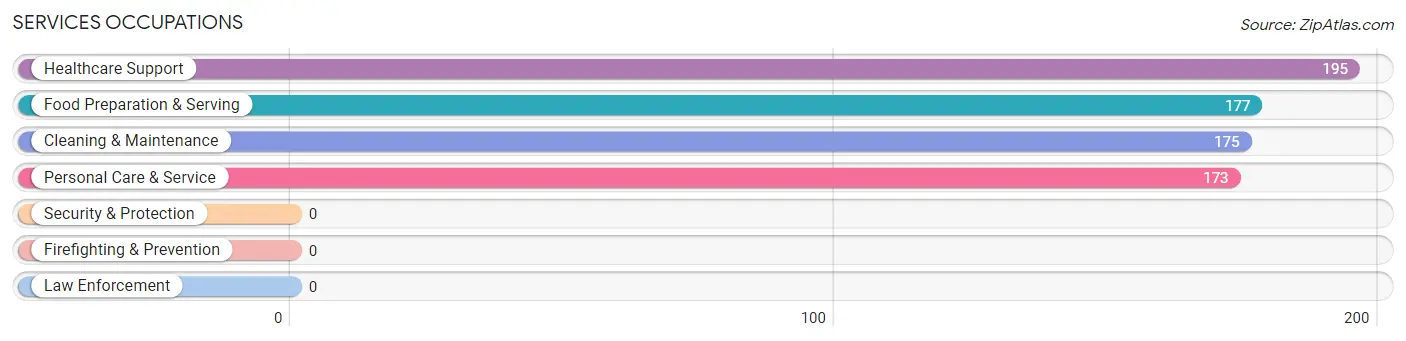
The most common Services occupations in Manchester are Healthcare Support (195 | 7.1%), Food Preparation & Serving (177 | 6.5%), Cleaning & Maintenance (175 | 6.4%), and Personal Care & Service (173 | 6.3%).
Services Occupations by Sex
Within the Services occupations in Manchester, the most male-oriented occupations are Cleaning & Maintenance (66.3%), Food Preparation & Serving (22.6%), and Healthcare Support (6.7%), while the most female-oriented occupations are Personal Care & Service (100.0%), Healthcare Support (93.3%), and Food Preparation & Serving (77.4%).
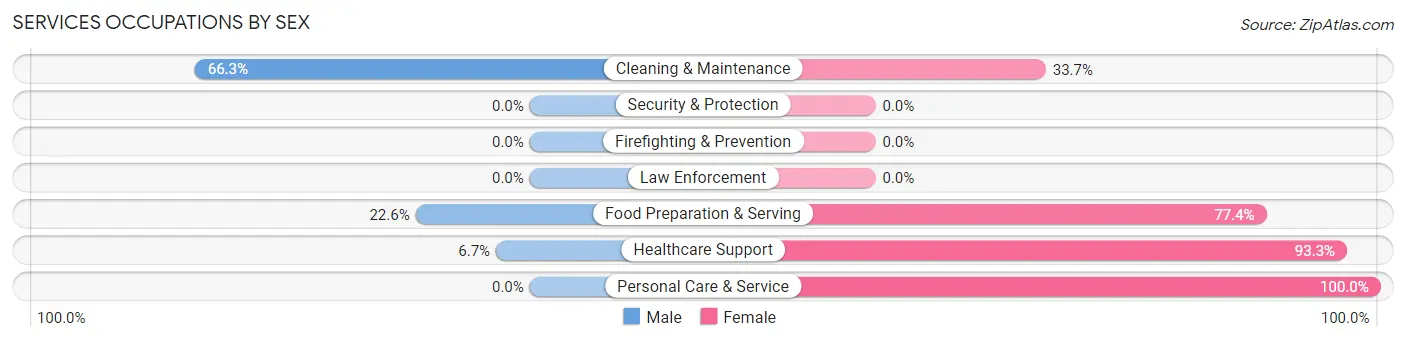
| Occupation | Male | Female |
| Healthcare Support | 13 (6.7%) | 182 (93.3%) |
| Security & Protection | 0 (0.0%) | 0 (0.0%) |
| Firefighting & Prevention | 0 (0.0%) | 0 (0.0%) |
| Law Enforcement | 0 (0.0%) | 0 (0.0%) |
| Food Preparation & Serving | 40 (22.6%) | 137 (77.4%) |
| Cleaning & Maintenance | 116 (66.3%) | 59 (33.7%) |
| Personal Care & Service | 0 (0.0%) | 173 (100.0%) |
| Total (Category) | 169 (23.5%) | 551 (76.5%) |
| Total (Overall) | 1,532 (55.9%) | 1,209 (44.1%) |
Sales and Office Occupations
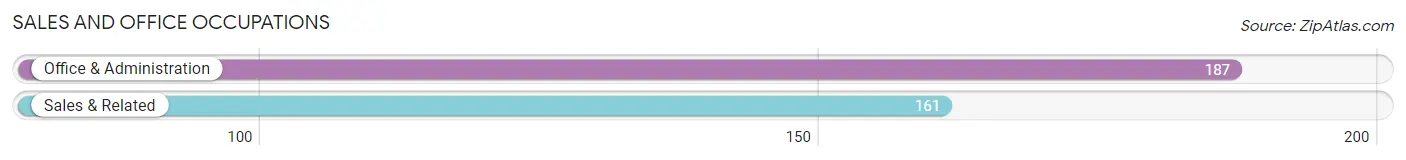
The most common Sales and Office occupations in Manchester are Office & Administration (187 | 6.8%), and Sales & Related (161 | 5.9%).
Sales and Office Occupations by Sex
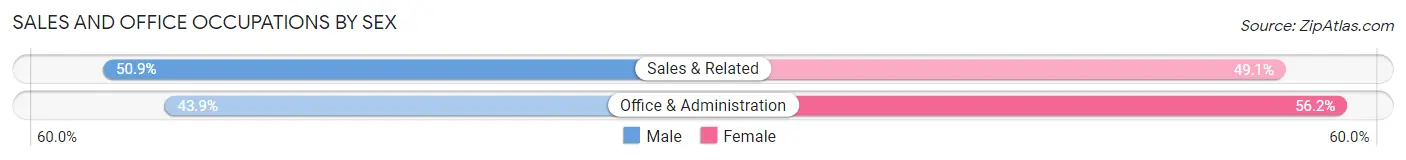
| Occupation | Male | Female |
| Sales & Related | 82 (50.9%) | 79 (49.1%) |
| Office & Administration | 82 (43.9%) | 105 (56.1%) |
| Total (Category) | 164 (47.1%) | 184 (52.9%) |
| Total (Overall) | 1,532 (55.9%) | 1,209 (44.1%) |
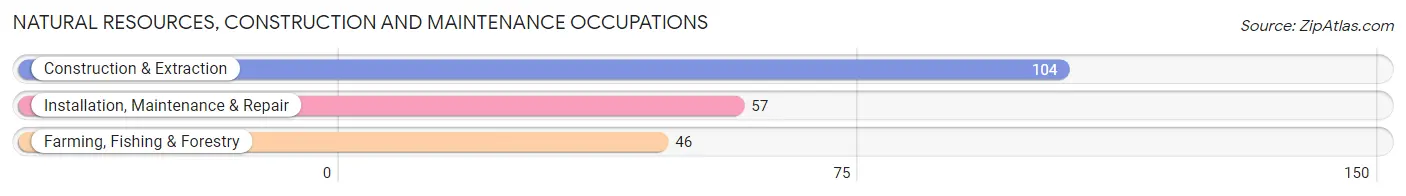
Natural Resources, Construction and Maintenance Occupations
The most common Natural Resources, Construction and Maintenance occupations in Manchester are Construction & Extraction (104 | 3.8%), Installation, Maintenance & Repair (57 | 2.1%), and Farming, Fishing & Forestry (46 | 1.7%).
Natural Resources, Construction and Maintenance Occupations by Sex
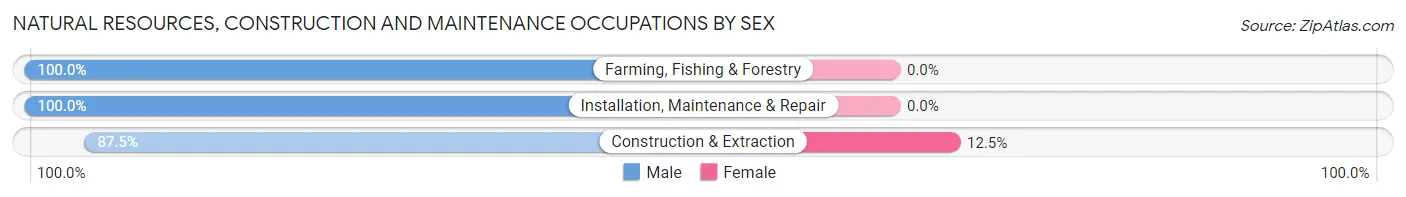
| Occupation | Male | Female |
| Farming, Fishing & Forestry | 46 (100.0%) | 0 (0.0%) |
| Construction & Extraction | 91 (87.5%) | 13 (12.5%) |
| Installation, Maintenance & Repair | 57 (100.0%) | 0 (0.0%) |
| Total (Category) | 194 (93.7%) | 13 (6.3%) |
| Total (Overall) | 1,532 (55.9%) | 1,209 (44.1%) |
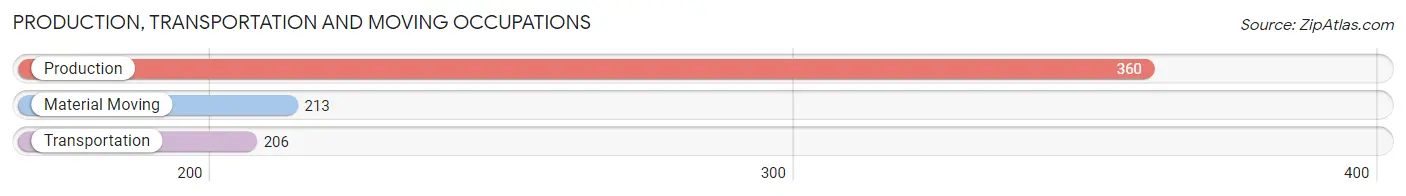
Production, Transportation and Moving Occupations
The most common Production, Transportation and Moving occupations in Manchester are Production (360 | 13.1%), Material Moving (213 | 7.8%), and Transportation (206 | 7.5%).
Production, Transportation and Moving Occupations by Sex
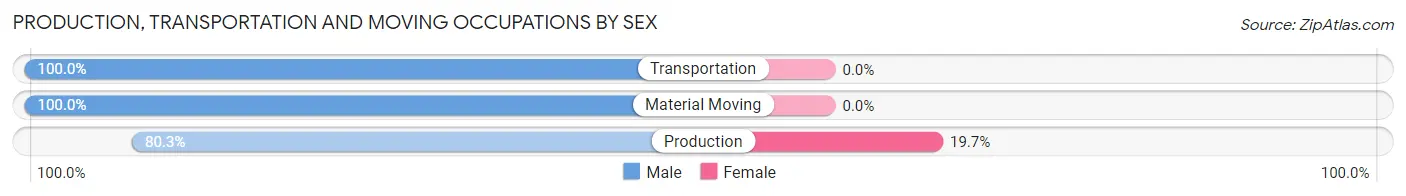
| Occupation | Male | Female |
| Production | 289 (80.3%) | 71 (19.7%) |
| Transportation | 206 (100.0%) | 0 (0.0%) |
| Material Moving | 213 (100.0%) | 0 (0.0%) |
| Total (Category) | 708 (90.9%) | 71 (9.1%) |
| Total (Overall) | 1,532 (55.9%) | 1,209 (44.1%) |
Employment Industries by Sex in Manchester
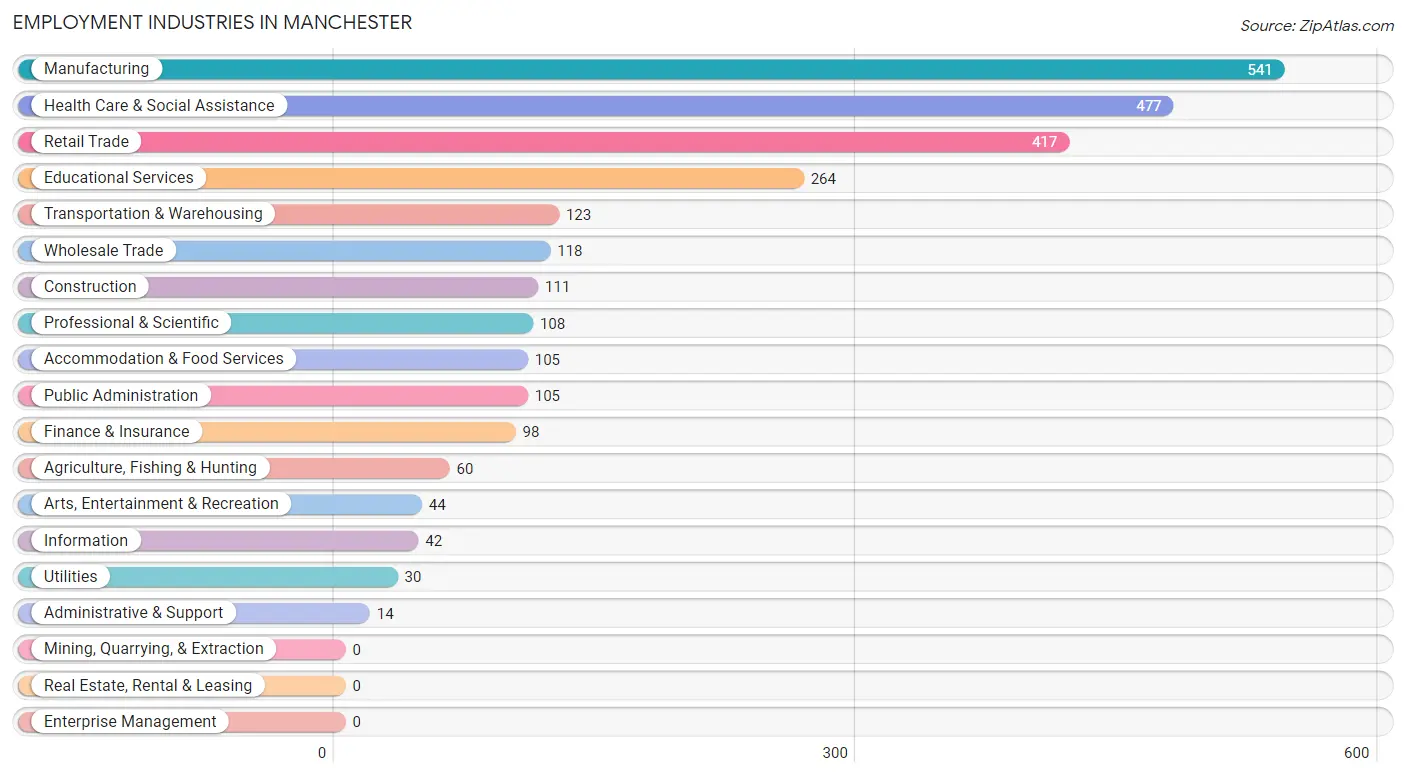
Employment Industries in Manchester
The major employment industries in Manchester include Manufacturing (541 | 19.7%), Health Care & Social Assistance (477 | 17.4%), Retail Trade (417 | 15.2%), Educational Services (264 | 9.6%), and Transportation & Warehousing (123 | 4.5%).
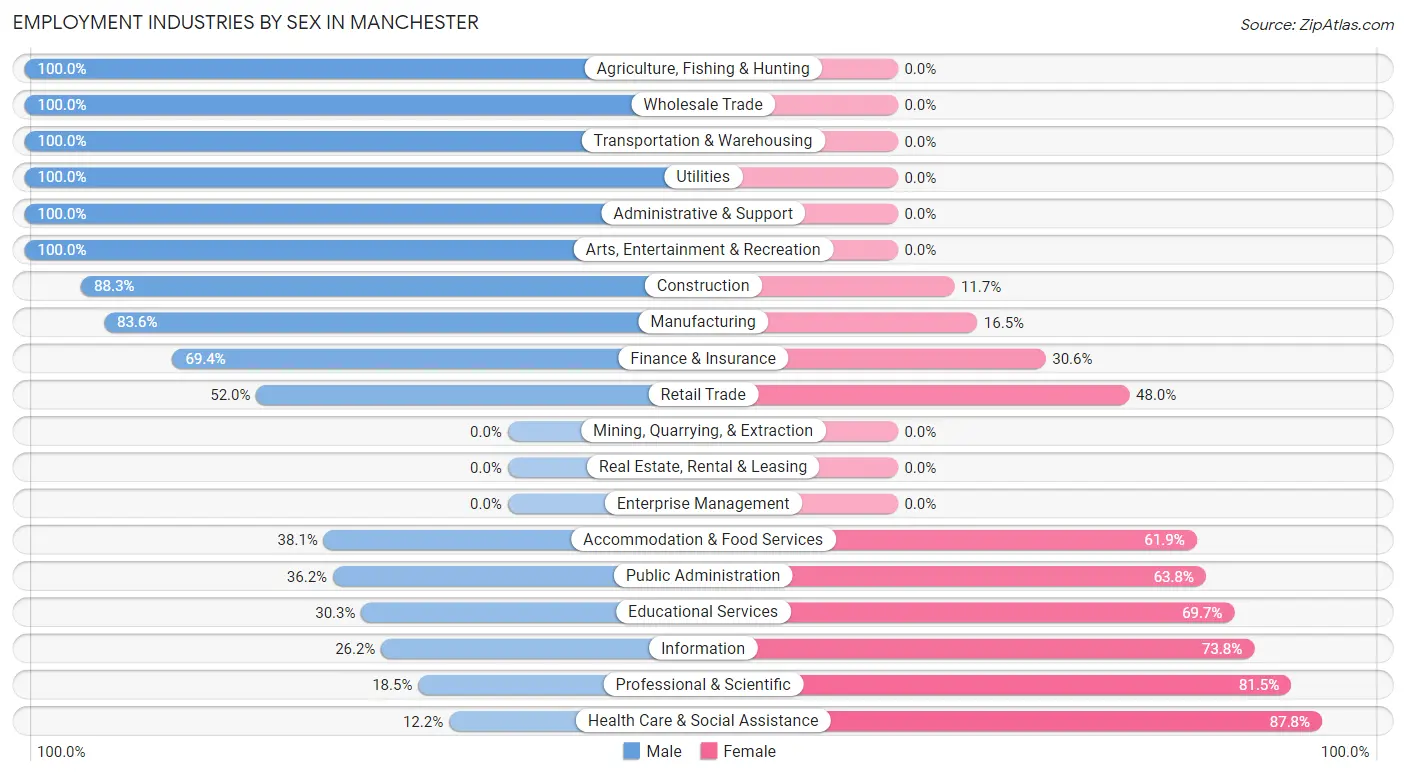
Employment Industries by Sex in Manchester
The Manchester industries that see more men than women are Agriculture, Fishing & Hunting (100.0%), Wholesale Trade (100.0%), and Transportation & Warehousing (100.0%), whereas the industries that tend to have a higher number of women are Health Care & Social Assistance (87.8%), Professional & Scientific (81.5%), and Information (73.8%).
| Industry | Male | Female |
| Agriculture, Fishing & Hunting | 60 (100.0%) | 0 (0.0%) |
| Mining, Quarrying, & Extraction | 0 (0.0%) | 0 (0.0%) |
| Construction | 98 (88.3%) | 13 (11.7%) |
| Manufacturing | 452 (83.6%) | 89 (16.5%) |
| Wholesale Trade | 118 (100.0%) | 0 (0.0%) |
| Retail Trade | 217 (52.0%) | 200 (48.0%) |
| Transportation & Warehousing | 123 (100.0%) | 0 (0.0%) |
| Utilities | 30 (100.0%) | 0 (0.0%) |
| Information | 11 (26.2%) | 31 (73.8%) |
| Finance & Insurance | 68 (69.4%) | 30 (30.6%) |
| Real Estate, Rental & Leasing | 0 (0.0%) | 0 (0.0%) |
| Professional & Scientific | 20 (18.5%) | 88 (81.5%) |
| Enterprise Management | 0 (0.0%) | 0 (0.0%) |
| Administrative & Support | 14 (100.0%) | 0 (0.0%) |
| Educational Services | 80 (30.3%) | 184 (69.7%) |
| Health Care & Social Assistance | 58 (12.2%) | 419 (87.8%) |
| Arts, Entertainment & Recreation | 44 (100.0%) | 0 (0.0%) |
| Accommodation & Food Services | 40 (38.1%) | 65 (61.9%) |
| Public Administration | 38 (36.2%) | 67 (63.8%) |
| Total | 1,532 (55.9%) | 1,209 (44.1%) |
Education in Manchester
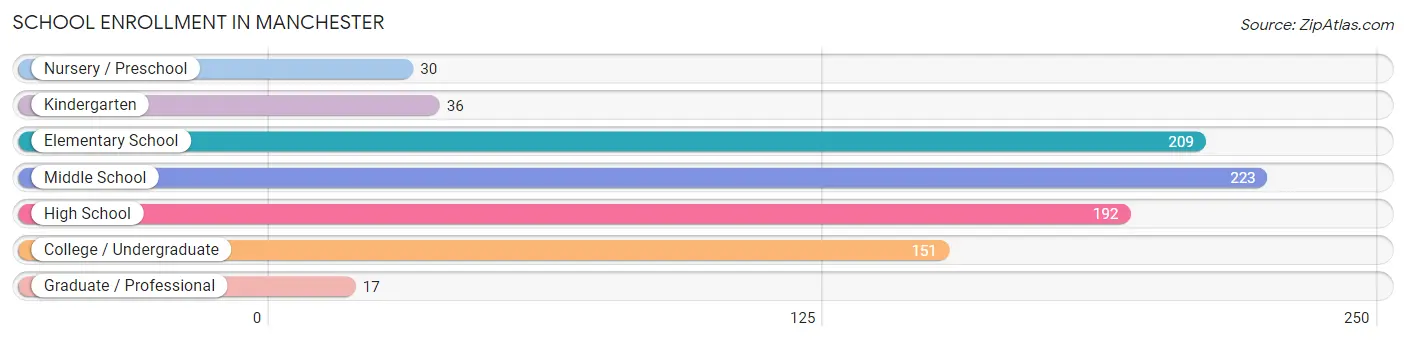
School Enrollment in Manchester
The most common levels of schooling among the 858 students in Manchester are middle school (223 | 26.0%), elementary school (209 | 24.4%), and high school (192 | 22.4%).
| School Level | # Students | % Students |
| Nursery / Preschool | 30 | 3.5% |
| Kindergarten | 36 | 4.2% |
| Elementary School | 209 | 24.4% |
| Middle School | 223 | 26.0% |
| High School | 192 | 22.4% |
| College / Undergraduate | 151 | 17.6% |
| Graduate / Professional | 17 | 2.0% |
| Total | 858 | 100.0% |
School Enrollment by Age by Funding Source in Manchester
Out of a total of 858 students who are enrolled in schools in Manchester, 194 (22.6%) attend a private institution, while the remaining 664 (77.4%) are enrolled in public schools. The age group of 35 years and over has the highest likelihood of being enrolled in private schools, with 41 (80.4% in the age bracket) enrolled. Conversely, the age group of 15 to 17 year olds has the lowest likelihood of being enrolled in a private school, with 121 (100.0% in the age bracket) attending a public institution.
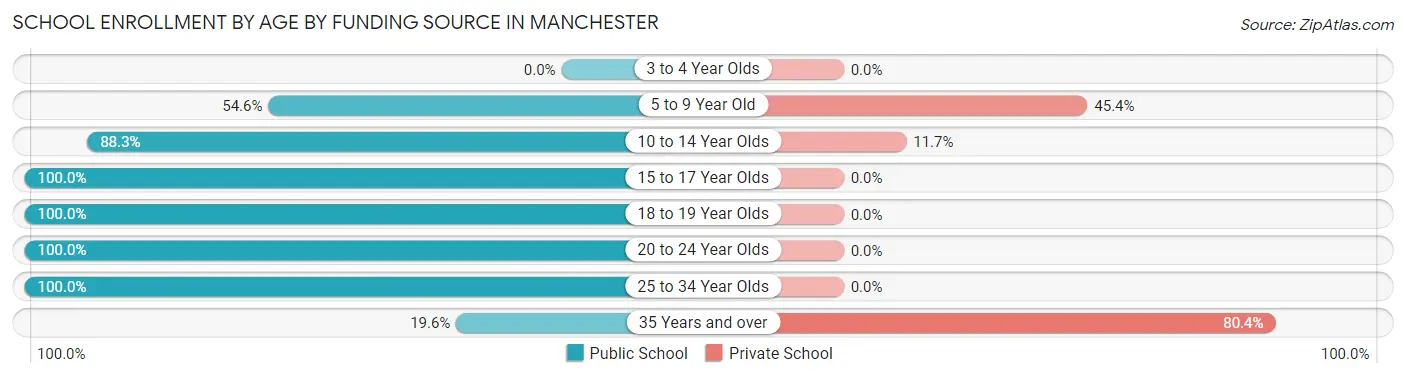
| Age Bracket | Public School | Private School |
| 3 to 4 Year Olds | 0 (0.0%) | 0 (0.0%) |
| 5 to 9 Year Old | 148 (54.6%) | 123 (45.4%) |
| 10 to 14 Year Olds | 227 (88.3%) | 30 (11.7%) |
| 15 to 17 Year Olds | 121 (100.0%) | 0 (0.0%) |
| 18 to 19 Year Olds | 60 (100.0%) | 0 (0.0%) |
| 20 to 24 Year Olds | 79 (100.0%) | 0 (0.0%) |
| 25 to 34 Year Olds | 19 (100.0%) | 0 (0.0%) |
| 35 Years and over | 10 (19.6%) | 41 (80.4%) |
| Total | 664 (77.4%) | 194 (22.6%) |
Educational Attainment by Field of Study in Manchester
Education (186 | 20.5%), business (172 | 19.0%), bio, nature & agricultural (114 | 12.6%), science & technology (102 | 11.3%), and psychology (92 | 10.2%) are the most common fields of study among 905 individuals in Manchester who have obtained a bachelor's degree or higher.
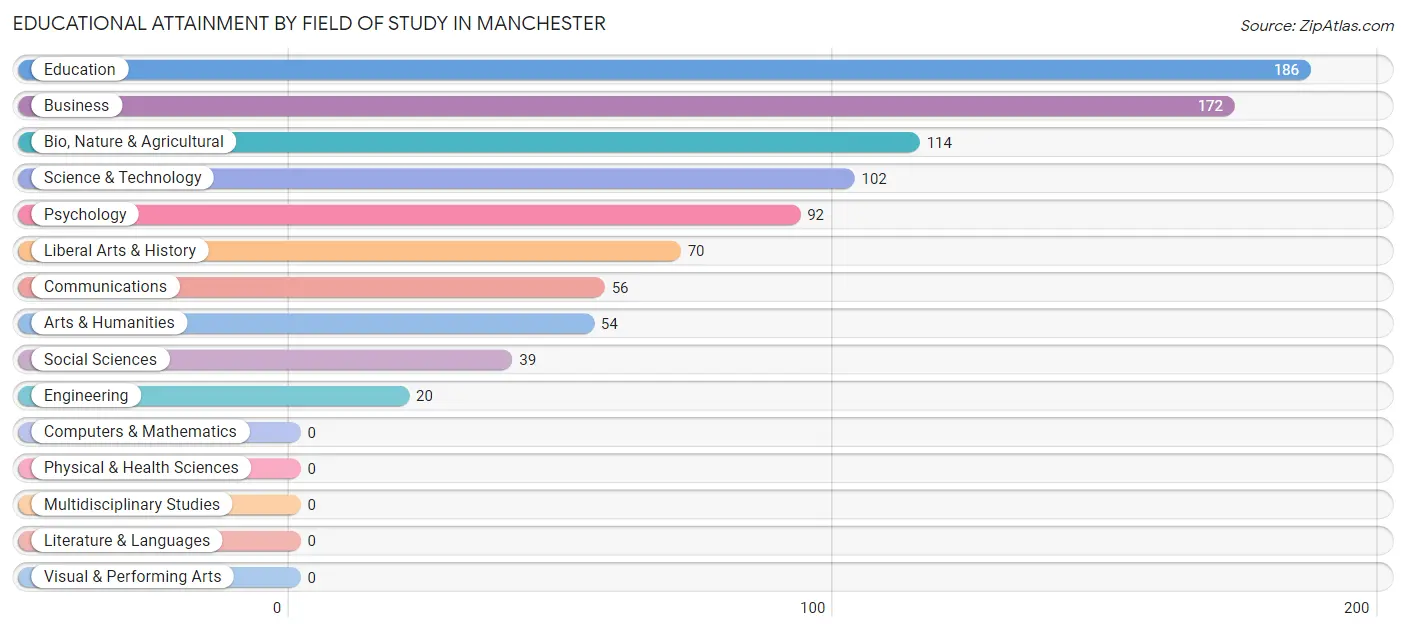
| Field of Study | # Graduates | % Graduates |
| Computers & Mathematics | 0 | 0.0% |
| Bio, Nature & Agricultural | 114 | 12.6% |
| Physical & Health Sciences | 0 | 0.0% |
| Psychology | 92 | 10.2% |
| Social Sciences | 39 | 4.3% |
| Engineering | 20 | 2.2% |
| Multidisciplinary Studies | 0 | 0.0% |
| Science & Technology | 102 | 11.3% |
| Business | 172 | 19.0% |
| Education | 186 | 20.5% |
| Literature & Languages | 0 | 0.0% |
| Liberal Arts & History | 70 | 7.7% |
| Visual & Performing Arts | 0 | 0.0% |
| Communications | 56 | 6.2% |
| Arts & Humanities | 54 | 6.0% |
| Total | 905 | 100.0% |
Transportation & Commute in Manchester
Vehicle Availability by Sex in Manchester
The most prevalent vehicle ownership categories in Manchester are males with 2 vehicles (728, accounting for 47.9%) and females with 2 vehicles (547, making up 60.2%).
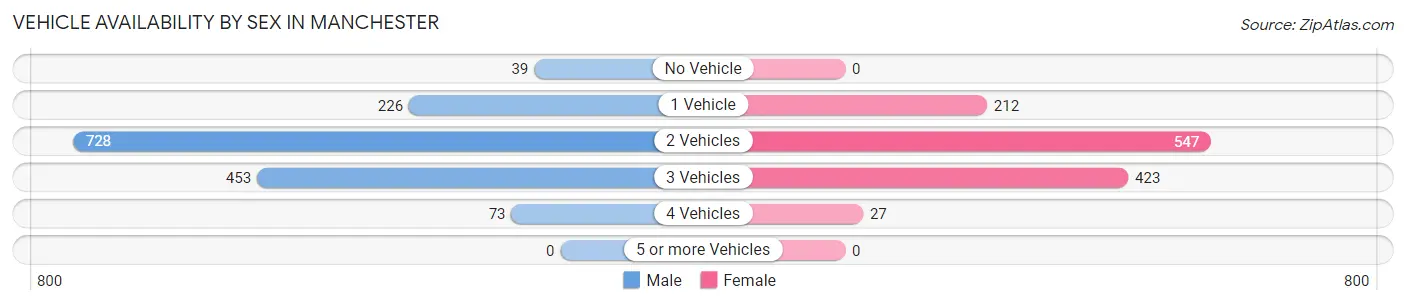
| Vehicles Available | Male | Female |
| No Vehicle | 39 (2.6%) | 0 (0.0%) |
| 1 Vehicle | 226 (14.9%) | 212 (17.5%) |
| 2 Vehicles | 728 (47.9%) | 547 (45.2%) |
| 3 Vehicles | 453 (29.8%) | 423 (35.0%) |
| 4 Vehicles | 73 (4.8%) | 27 (2.2%) |
| 5 or more Vehicles | 0 (0.0%) | 0 (0.0%) |
| Total | 1,519 (100.0%) | 1,209 (100.0%) |
Commute Time in Manchester
The most frequently occuring commute durations in Manchester are 5 to 9 minutes (884 commuters, 34.7%), less than 5 minutes (652 commuters, 25.6%), and 10 to 14 minutes (396 commuters, 15.5%).
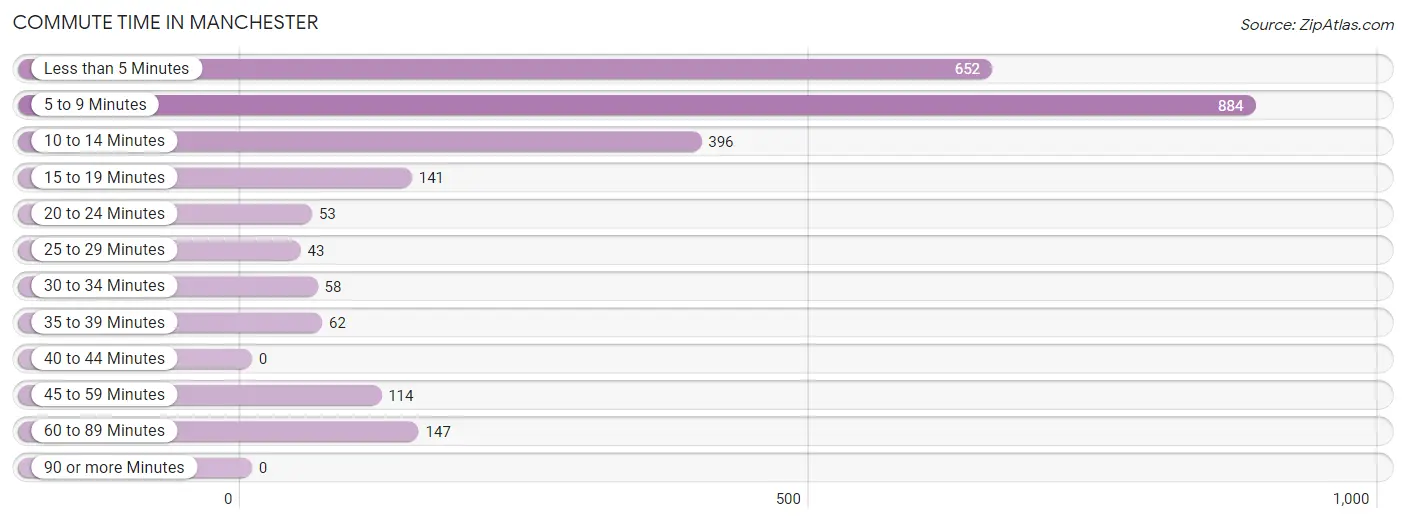
| Commute Time | # Commuters | % Commuters |
| Less than 5 Minutes | 652 | 25.6% |
| 5 to 9 Minutes | 884 | 34.7% |
| 10 to 14 Minutes | 396 | 15.5% |
| 15 to 19 Minutes | 141 | 5.5% |
| 20 to 24 Minutes | 53 | 2.1% |
| 25 to 29 Minutes | 43 | 1.7% |
| 30 to 34 Minutes | 58 | 2.3% |
| 35 to 39 Minutes | 62 | 2.4% |
| 40 to 44 Minutes | 0 | 0.0% |
| 45 to 59 Minutes | 114 | 4.5% |
| 60 to 89 Minutes | 147 | 5.8% |
| 90 or more Minutes | 0 | 0.0% |
Commute Time by Sex in Manchester
The most common commute times in Manchester are 5 to 9 minutes (540 commuters, 36.5%) for males and 5 to 9 minutes (344 commuters, 32.1%) for females.
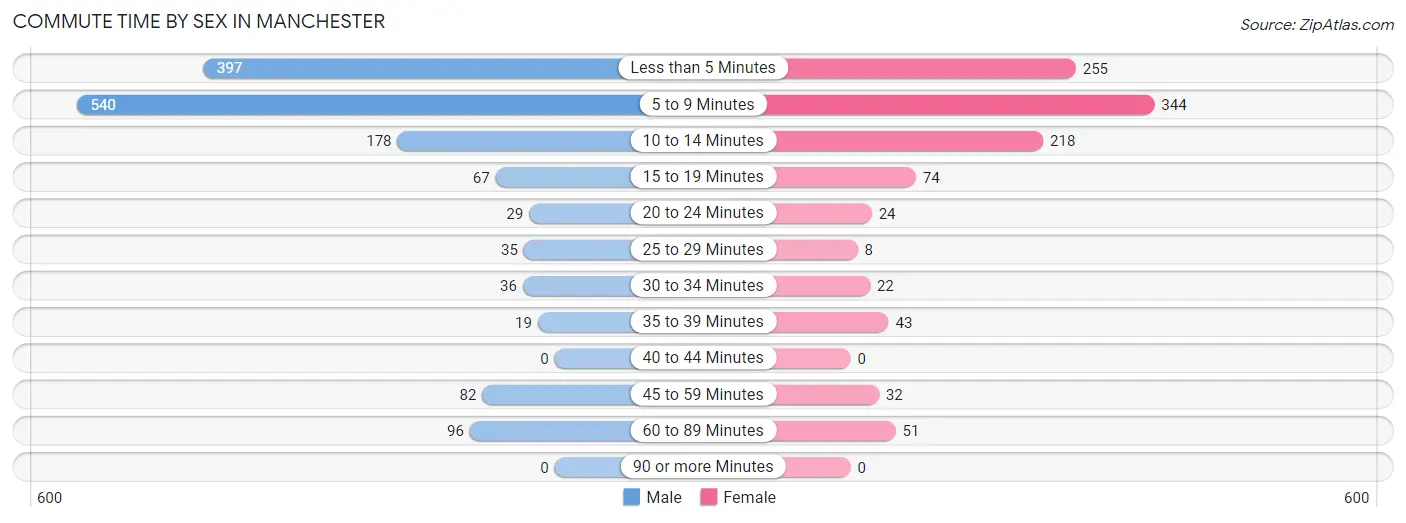
| Commute Time | Male | Female |
| Less than 5 Minutes | 397 (26.8%) | 255 (23.8%) |
| 5 to 9 Minutes | 540 (36.5%) | 344 (32.1%) |
| 10 to 14 Minutes | 178 (12.0%) | 218 (20.3%) |
| 15 to 19 Minutes | 67 (4.5%) | 74 (6.9%) |
| 20 to 24 Minutes | 29 (2.0%) | 24 (2.2%) |
| 25 to 29 Minutes | 35 (2.4%) | 8 (0.7%) |
| 30 to 34 Minutes | 36 (2.4%) | 22 (2.1%) |
| 35 to 39 Minutes | 19 (1.3%) | 43 (4.0%) |
| 40 to 44 Minutes | 0 (0.0%) | 0 (0.0%) |
| 45 to 59 Minutes | 82 (5.5%) | 32 (3.0%) |
| 60 to 89 Minutes | 96 (6.5%) | 51 (4.8%) |
| 90 or more Minutes | 0 (0.0%) | 0 (0.0%) |
Time of Departure to Work by Sex in Manchester
The most frequent times of departure to work in Manchester are 7:30 AM to 7:59 AM (410, 27.7%) for males and 7:30 AM to 7:59 AM (281, 26.2%) for females.
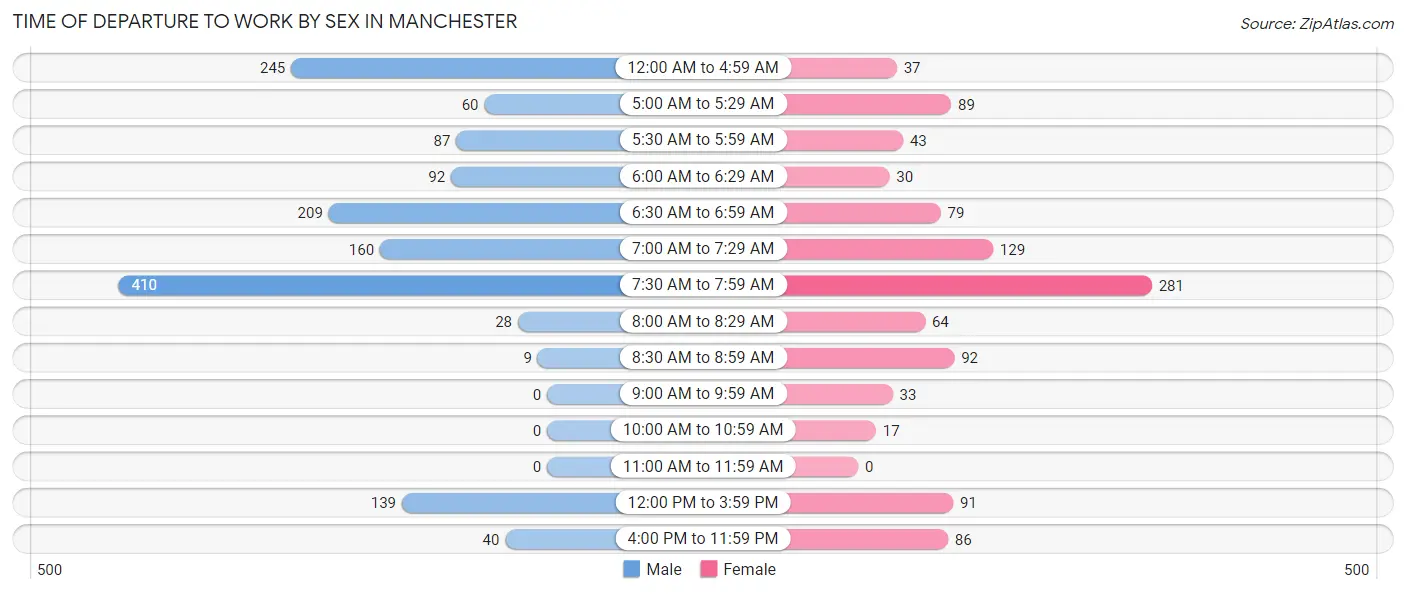
| Time of Departure | Male | Female |
| 12:00 AM to 4:59 AM | 245 (16.6%) | 37 (3.5%) |
| 5:00 AM to 5:29 AM | 60 (4.1%) | 89 (8.3%) |
| 5:30 AM to 5:59 AM | 87 (5.9%) | 43 (4.0%) |
| 6:00 AM to 6:29 AM | 92 (6.2%) | 30 (2.8%) |
| 6:30 AM to 6:59 AM | 209 (14.1%) | 79 (7.4%) |
| 7:00 AM to 7:29 AM | 160 (10.8%) | 129 (12.0%) |
| 7:30 AM to 7:59 AM | 410 (27.7%) | 281 (26.2%) |
| 8:00 AM to 8:29 AM | 28 (1.9%) | 64 (6.0%) |
| 8:30 AM to 8:59 AM | 9 (0.6%) | 92 (8.6%) |
| 9:00 AM to 9:59 AM | 0 (0.0%) | 33 (3.1%) |
| 10:00 AM to 10:59 AM | 0 (0.0%) | 17 (1.6%) |
| 11:00 AM to 11:59 AM | 0 (0.0%) | 0 (0.0%) |
| 12:00 PM to 3:59 PM | 139 (9.4%) | 91 (8.5%) |
| 4:00 PM to 11:59 PM | 40 (2.7%) | 86 (8.0%) |
| Total | 1,479 (100.0%) | 1,071 (100.0%) |
Housing Occupancy in Manchester
Occupancy by Ownership in Manchester
Of the total 2,281 dwellings in Manchester, owner-occupied units account for 1,718 (75.3%), while renter-occupied units make up 563 (24.7%).
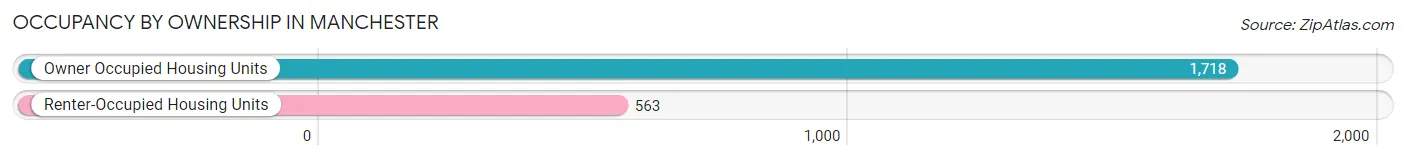
| Occupancy | # Housing Units | % Housing Units |
| Owner Occupied Housing Units | 1,718 | 75.3% |
| Renter-Occupied Housing Units | 563 | 24.7% |
| Total Occupied Housing Units | 2,281 | 100.0% |
Occupancy by Household Size in Manchester
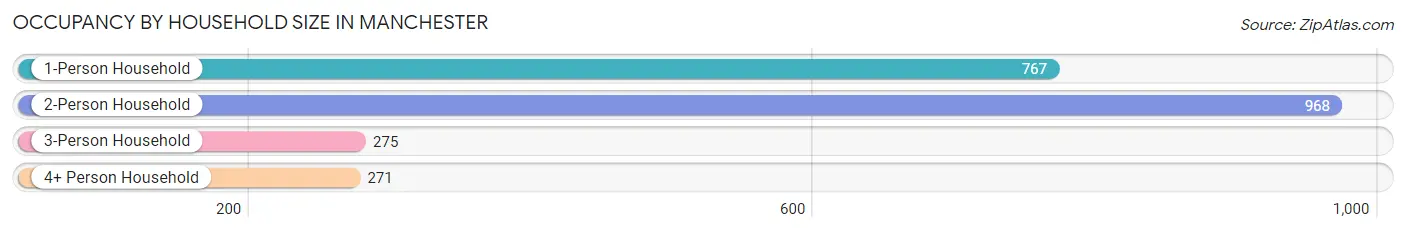
| Household Size | # Housing Units | % Housing Units |
| 1-Person Household | 767 | 33.6% |
| 2-Person Household | 968 | 42.4% |
| 3-Person Household | 275 | 12.1% |
| 4+ Person Household | 271 | 11.9% |
| Total Housing Units | 2,281 | 100.0% |
Occupancy by Ownership by Household Size in Manchester
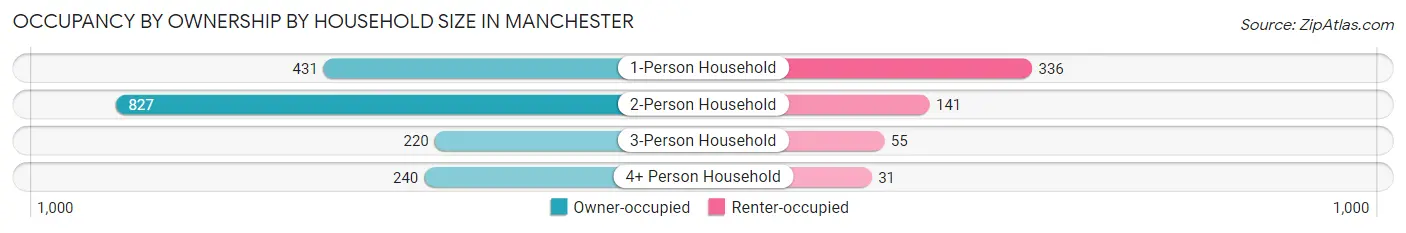
| Household Size | Owner-occupied | Renter-occupied |
| 1-Person Household | 431 (56.2%) | 336 (43.8%) |
| 2-Person Household | 827 (85.4%) | 141 (14.6%) |
| 3-Person Household | 220 (80.0%) | 55 (20.0%) |
| 4+ Person Household | 240 (88.6%) | 31 (11.4%) |
| Total Housing Units | 1,718 (75.3%) | 563 (24.7%) |
Occupancy by Educational Attainment in Manchester
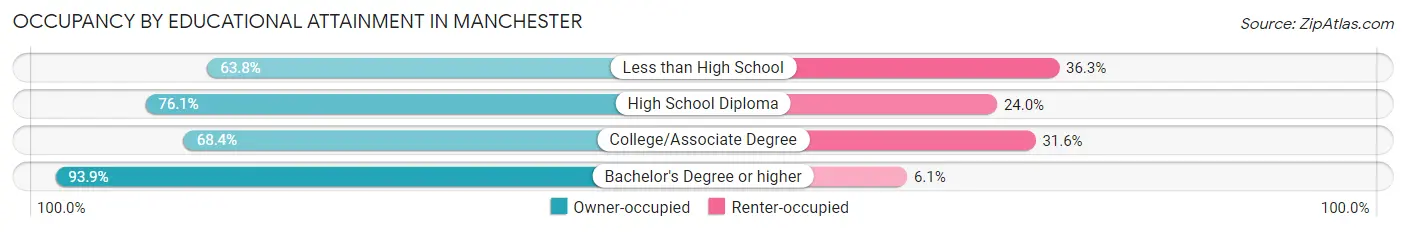
| Household Size | Owner-occupied | Renter-occupied |
| Less than High School | 248 (63.7%) | 141 (36.2%) |
| High School Diploma | 667 (76.0%) | 210 (23.9%) |
| College/Associate Degree | 403 (68.4%) | 186 (31.6%) |
| Bachelor's Degree or higher | 400 (93.9%) | 26 (6.1%) |
Occupancy by Age of Householder in Manchester
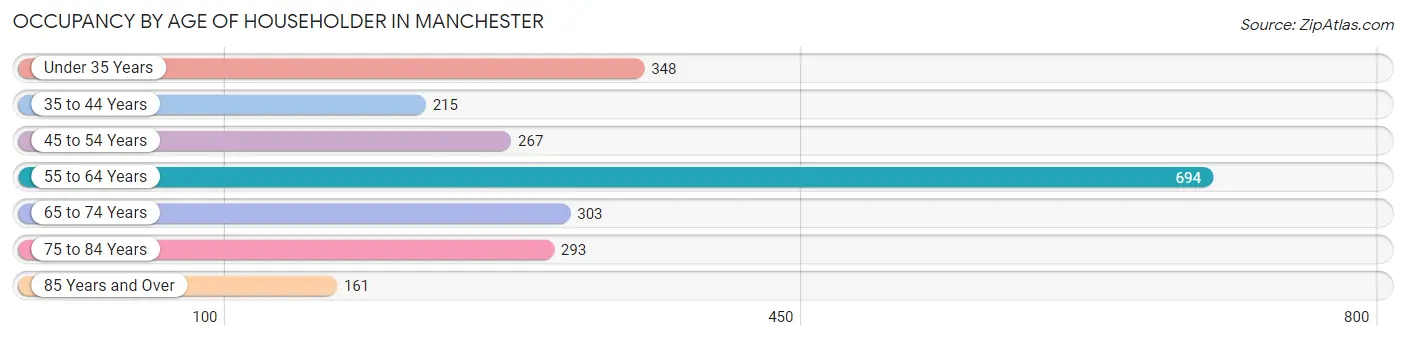
| Age Bracket | # Households | % Households |
| Under 35 Years | 348 | 15.3% |
| 35 to 44 Years | 215 | 9.4% |
| 45 to 54 Years | 267 | 11.7% |
| 55 to 64 Years | 694 | 30.4% |
| 65 to 74 Years | 303 | 13.3% |
| 75 to 84 Years | 293 | 12.9% |
| 85 Years and Over | 161 | 7.1% |
| Total | 2,281 | 100.0% |
Housing Finances in Manchester
Median Income by Occupancy in Manchester
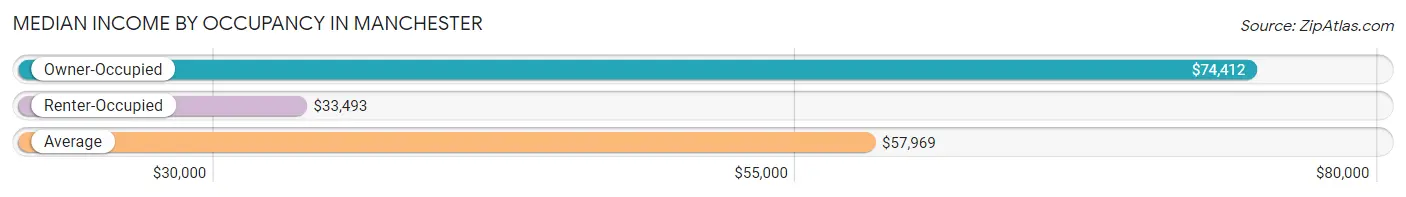
| Occupancy Type | # Households | Median Income |
| Owner-Occupied | 1,718 (75.3%) | $74,412 |
| Renter-Occupied | 563 (24.7%) | $33,493 |
| Average | 2,281 (100.0%) | $57,969 |
Occupancy by Householder Income Bracket in Manchester
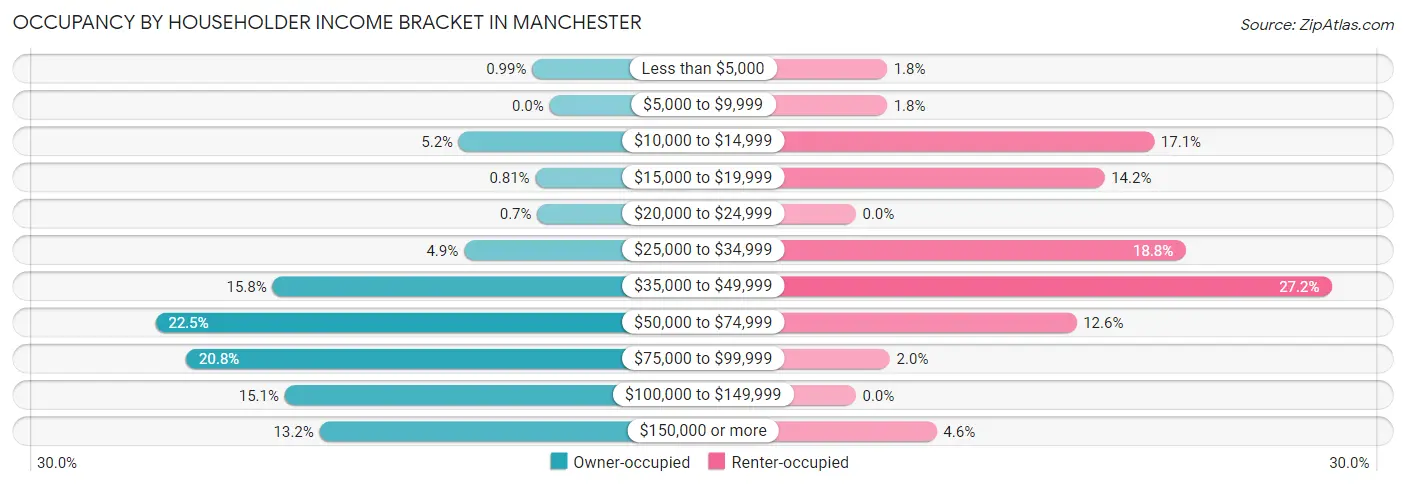
| Income Bracket | Owner-occupied | Renter-occupied |
| Less than $5,000 | 17 (1.0%) | 10 (1.8%) |
| $5,000 to $9,999 | 0 (0.0%) | 10 (1.8%) |
| $10,000 to $14,999 | 89 (5.2%) | 96 (17.1%) |
| $15,000 to $19,999 | 14 (0.8%) | 80 (14.2%) |
| $20,000 to $24,999 | 12 (0.7%) | 0 (0.0%) |
| $25,000 to $34,999 | 84 (4.9%) | 106 (18.8%) |
| $35,000 to $49,999 | 272 (15.8%) | 153 (27.2%) |
| $50,000 to $74,999 | 387 (22.5%) | 71 (12.6%) |
| $75,000 to $99,999 | 357 (20.8%) | 11 (1.9%) |
| $100,000 to $149,999 | 260 (15.1%) | 0 (0.0%) |
| $150,000 or more | 226 (13.2%) | 26 (4.6%) |
| Total | 1,718 (100.0%) | 563 (100.0%) |
Monthly Housing Cost Tiers in Manchester
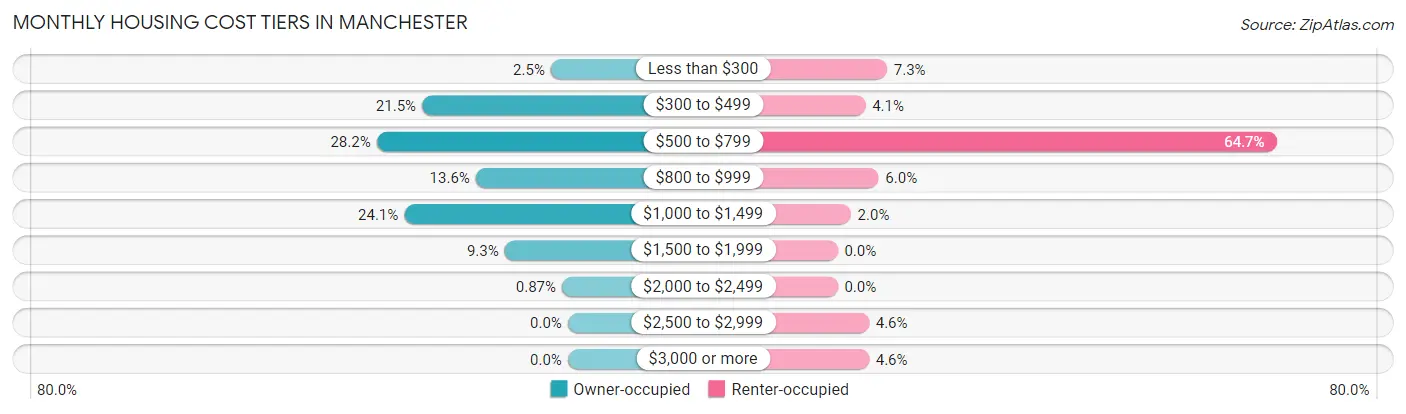
| Monthly Cost | Owner-occupied | Renter-occupied |
| Less than $300 | 43 (2.5%) | 41 (7.3%) |
| $300 to $499 | 369 (21.5%) | 23 (4.1%) |
| $500 to $799 | 484 (28.2%) | 364 (64.6%) |
| $800 to $999 | 233 (13.6%) | 34 (6.0%) |
| $1,000 to $1,499 | 414 (24.1%) | 11 (1.9%) |
| $1,500 to $1,999 | 160 (9.3%) | 0 (0.0%) |
| $2,000 to $2,499 | 15 (0.9%) | 0 (0.0%) |
| $2,500 to $2,999 | 0 (0.0%) | 26 (4.6%) |
| $3,000 or more | 0 (0.0%) | 26 (4.6%) |
| Total | 1,718 (100.0%) | 563 (100.0%) |
Physical Housing Characteristics in Manchester
Housing Structures in Manchester
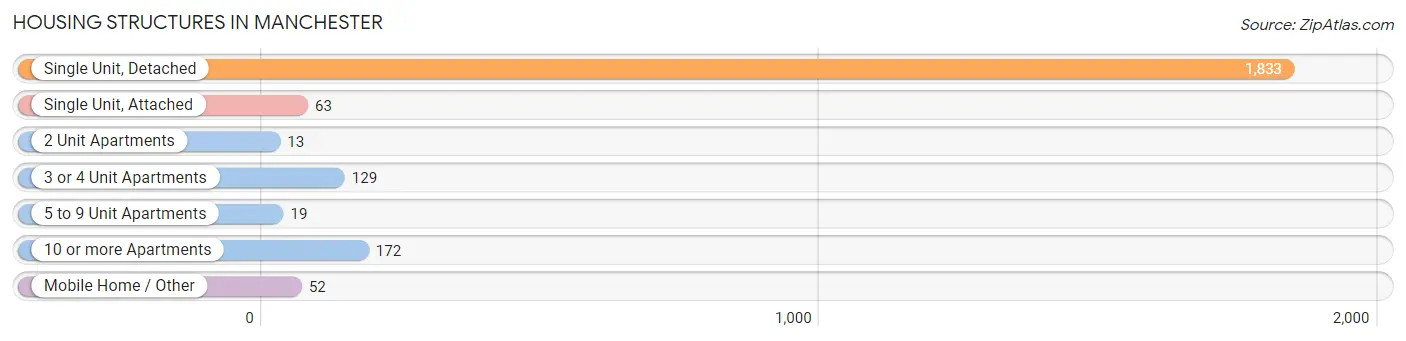
| Structure Type | # Housing Units | % Housing Units |
| Single Unit, Detached | 1,833 | 80.4% |
| Single Unit, Attached | 63 | 2.8% |
| 2 Unit Apartments | 13 | 0.6% |
| 3 or 4 Unit Apartments | 129 | 5.7% |
| 5 to 9 Unit Apartments | 19 | 0.8% |
| 10 or more Apartments | 172 | 7.5% |
| Mobile Home / Other | 52 | 2.3% |
| Total | 2,281 | 100.0% |
Housing Structures by Occupancy in Manchester
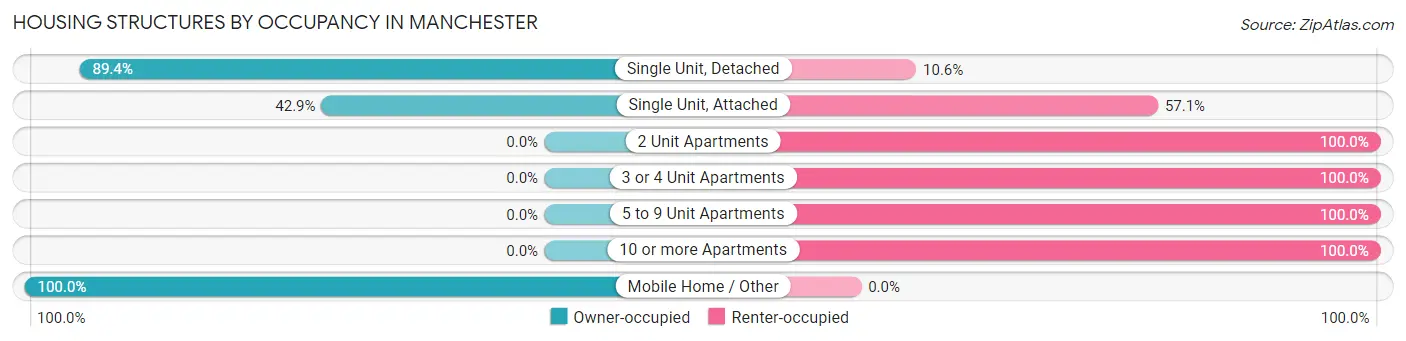
| Structure Type | Owner-occupied | Renter-occupied |
| Single Unit, Detached | 1,639 (89.4%) | 194 (10.6%) |
| Single Unit, Attached | 27 (42.9%) | 36 (57.1%) |
| 2 Unit Apartments | 0 (0.0%) | 13 (100.0%) |
| 3 or 4 Unit Apartments | 0 (0.0%) | 129 (100.0%) |
| 5 to 9 Unit Apartments | 0 (0.0%) | 19 (100.0%) |
| 10 or more Apartments | 0 (0.0%) | 172 (100.0%) |
| Mobile Home / Other | 52 (100.0%) | 0 (0.0%) |
| Total | 1,718 (75.3%) | 563 (24.7%) |
Housing Structures by Number of Rooms in Manchester
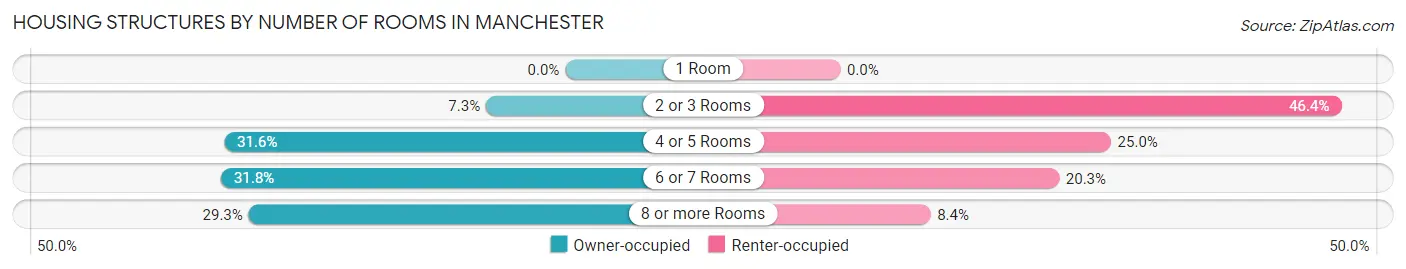
| Number of Rooms | Owner-occupied | Renter-occupied |
| 1 Room | 0 (0.0%) | 0 (0.0%) |
| 2 or 3 Rooms | 126 (7.3%) | 261 (46.4%) |
| 4 or 5 Rooms | 542 (31.6%) | 141 (25.0%) |
| 6 or 7 Rooms | 547 (31.8%) | 114 (20.3%) |
| 8 or more Rooms | 503 (29.3%) | 47 (8.4%) |
| Total | 1,718 (100.0%) | 563 (100.0%) |
Housing Structure by Heating Type in Manchester
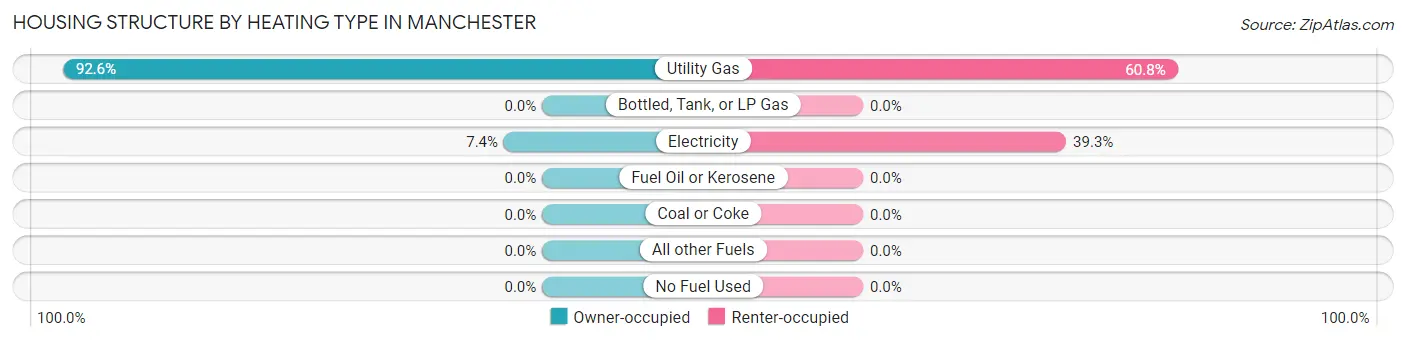
| Heating Type | Owner-occupied | Renter-occupied |
| Utility Gas | 1,591 (92.6%) | 342 (60.8%) |
| Bottled, Tank, or LP Gas | 0 (0.0%) | 0 (0.0%) |
| Electricity | 127 (7.4%) | 221 (39.3%) |
| Fuel Oil or Kerosene | 0 (0.0%) | 0 (0.0%) |
| Coal or Coke | 0 (0.0%) | 0 (0.0%) |
| All other Fuels | 0 (0.0%) | 0 (0.0%) |
| No Fuel Used | 0 (0.0%) | 0 (0.0%) |
| Total | 1,718 (100.0%) | 563 (100.0%) |
Household Vehicle Usage in Manchester
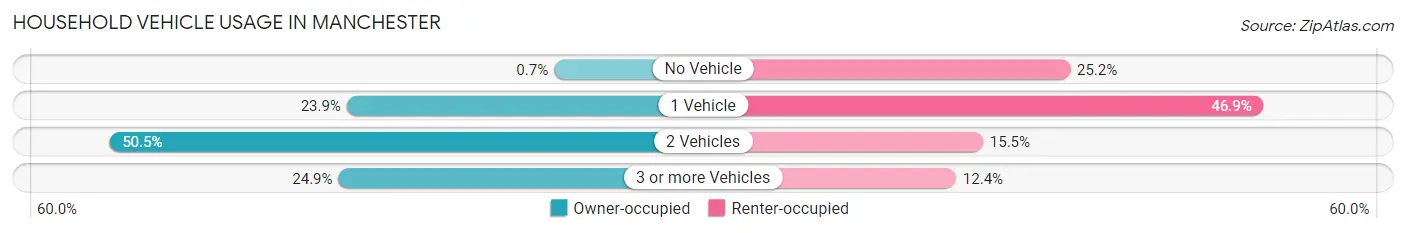
| Vehicles per Household | Owner-occupied | Renter-occupied |
| No Vehicle | 12 (0.7%) | 142 (25.2%) |
| 1 Vehicle | 411 (23.9%) | 264 (46.9%) |
| 2 Vehicles | 868 (50.5%) | 87 (15.4%) |
| 3 or more Vehicles | 427 (24.8%) | 70 (12.4%) |
| Total | 1,718 (100.0%) | 563 (100.0%) |
Real Estate & Mortgages in Manchester
Real Estate and Mortgage Overview in Manchester
| Characteristic | Without Mortgage | With Mortgage |
| Housing Units | 712 | 1,006 |
| Median Property Value | $114,400 | $105,700 |
| Median Household Income | $58,571 | $145 |
| Monthly Housing Costs | $476 | $0 |
| Real Estate Taxes | $1,770 | $85 |
Property Value by Mortgage Status in Manchester
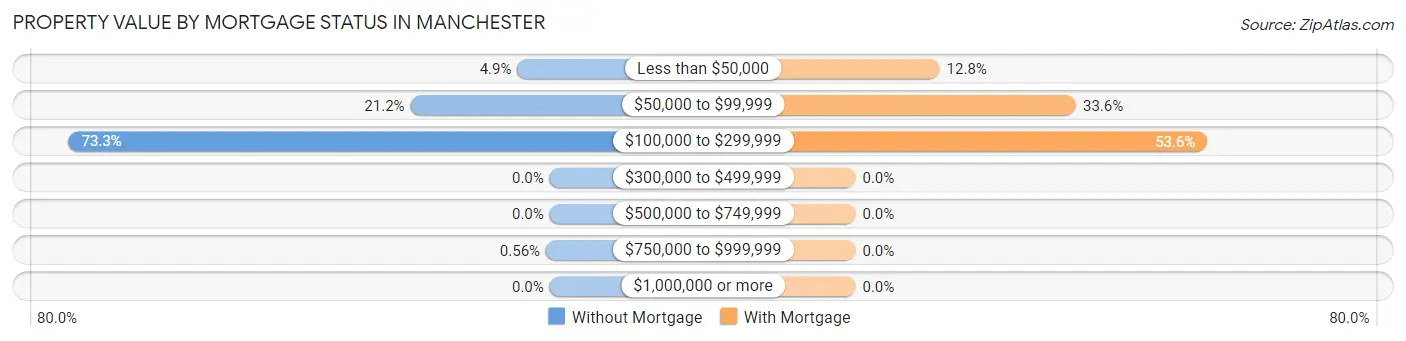
| Property Value | Without Mortgage | With Mortgage |
| Less than $50,000 | 35 (4.9%) | 129 (12.8%) |
| $50,000 to $99,999 | 151 (21.2%) | 338 (33.6%) |
| $100,000 to $299,999 | 522 (73.3%) | 539 (53.6%) |
| $300,000 to $499,999 | 0 (0.0%) | 0 (0.0%) |
| $500,000 to $749,999 | 0 (0.0%) | 0 (0.0%) |
| $750,000 to $999,999 | 4 (0.6%) | 0 (0.0%) |
| $1,000,000 or more | 0 (0.0%) | 0 (0.0%) |
| Total | 712 (100.0%) | 1,006 (100.0%) |
Household Income by Mortgage Status in Manchester
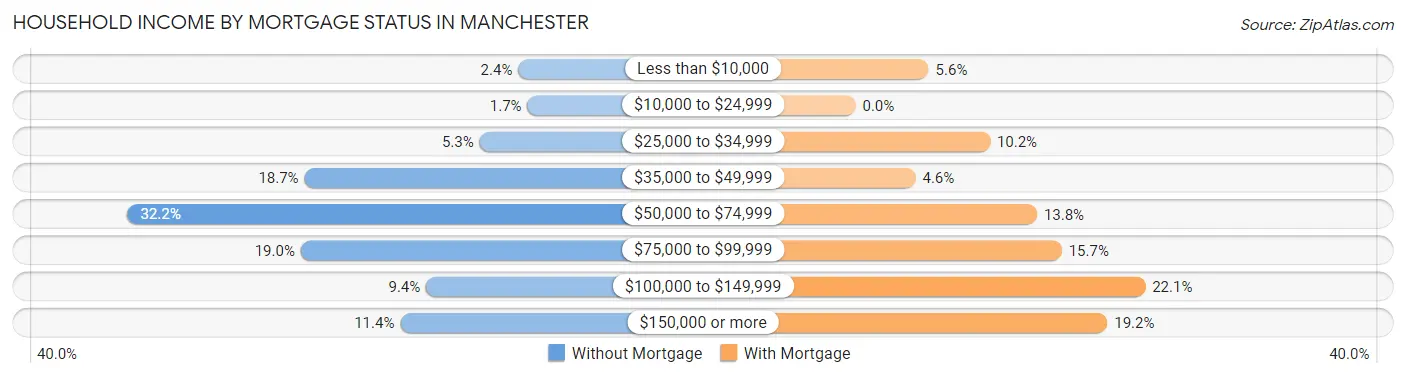
| Household Income | Without Mortgage | With Mortgage |
| Less than $10,000 | 17 (2.4%) | 56 (5.6%) |
| $10,000 to $24,999 | 12 (1.7%) | 0 (0.0%) |
| $25,000 to $34,999 | 38 (5.3%) | 103 (10.2%) |
| $35,000 to $49,999 | 133 (18.7%) | 46 (4.6%) |
| $50,000 to $74,999 | 229 (32.2%) | 139 (13.8%) |
| $75,000 to $99,999 | 135 (19.0%) | 158 (15.7%) |
| $100,000 to $149,999 | 67 (9.4%) | 222 (22.1%) |
| $150,000 or more | 81 (11.4%) | 193 (19.2%) |
| Total | 712 (100.0%) | 1,006 (100.0%) |
Property Value to Household Income Ratio in Manchester
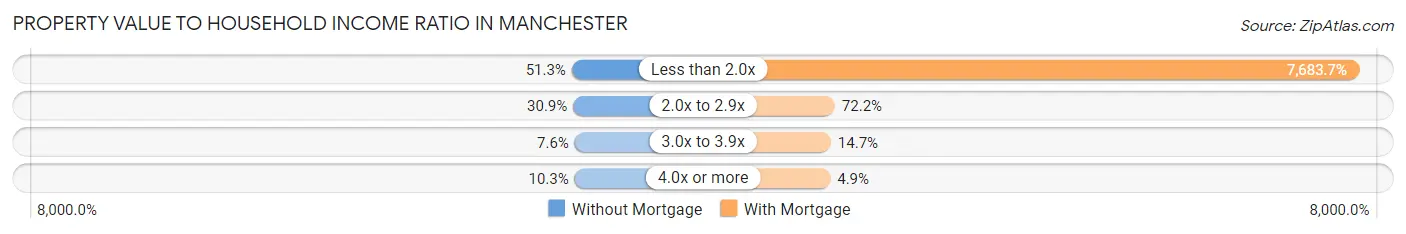
| Value-to-Income Ratio | Without Mortgage | With Mortgage |
| Less than 2.0x | 365 (51.3%) | 77,298 (7,683.7%) |
| 2.0x to 2.9x | 220 (30.9%) | 726 (72.2%) |
| 3.0x to 3.9x | 54 (7.6%) | 148 (14.7%) |
| 4.0x or more | 73 (10.2%) | 49 (4.9%) |
| Total | 712 (100.0%) | 1,006 (100.0%) |
Real Estate Taxes by Mortgage Status in Manchester
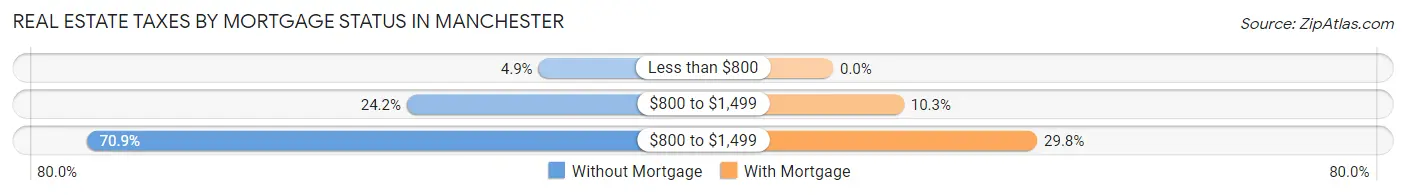
| Property Taxes | Without Mortgage | With Mortgage |
| Less than $800 | 35 (4.9%) | 0 (0.0%) |
| $800 to $1,499 | 172 (24.2%) | 104 (10.3%) |
| $800 to $1,499 | 505 (70.9%) | 300 (29.8%) |
| Total | 712 (100.0%) | 1,006 (100.0%) |
Health & Disability in Manchester
Health Insurance Coverage by Age in Manchester
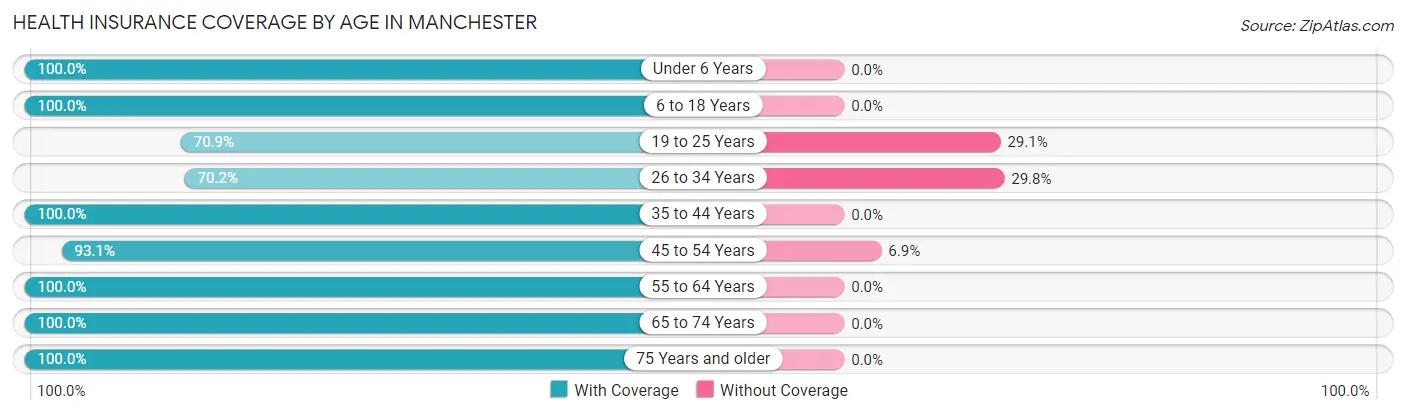
| Age Bracket | With Coverage | Without Coverage |
| Under 6 Years | 384 (100.0%) | 0 (0.0%) |
| 6 to 18 Years | 624 (100.0%) | 0 (0.0%) |
| 19 to 25 Years | 309 (70.9%) | 127 (29.1%) |
| 26 to 34 Years | 315 (70.2%) | 134 (29.8%) |
| 35 to 44 Years | 400 (100.0%) | 0 (0.0%) |
| 45 to 54 Years | 444 (93.1%) | 33 (6.9%) |
| 55 to 64 Years | 944 (100.0%) | 0 (0.0%) |
| 65 to 74 Years | 620 (100.0%) | 0 (0.0%) |
| 75 Years and older | 660 (100.0%) | 0 (0.0%) |
| Total | 4,700 (94.1%) | 294 (5.9%) |
Health Insurance Coverage by Citizenship Status in Manchester
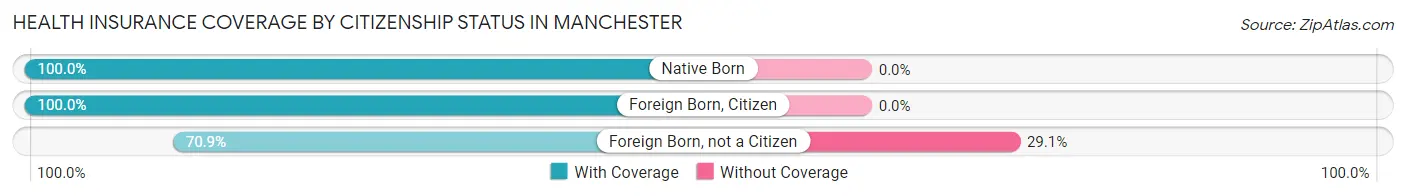
| Citizenship Status | With Coverage | Without Coverage |
| Native Born | 384 (100.0%) | 0 (0.0%) |
| Foreign Born, Citizen | 624 (100.0%) | 0 (0.0%) |
| Foreign Born, not a Citizen | 309 (70.9%) | 127 (29.1%) |
Health Insurance Coverage by Household Income in Manchester
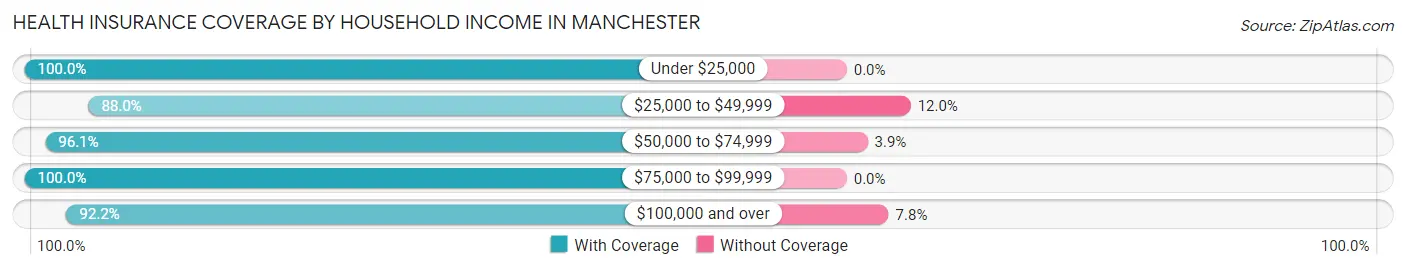
| Household Income | With Coverage | Without Coverage |
| Under $25,000 | 436 (100.0%) | 0 (0.0%) |
| $25,000 to $49,999 | 949 (88.0%) | 129 (12.0%) |
| $50,000 to $74,999 | 840 (96.1%) | 34 (3.9%) |
| $75,000 to $99,999 | 932 (100.0%) | 0 (0.0%) |
| $100,000 and over | 1,539 (92.2%) | 131 (7.8%) |
Public vs Private Health Insurance Coverage by Age in Manchester
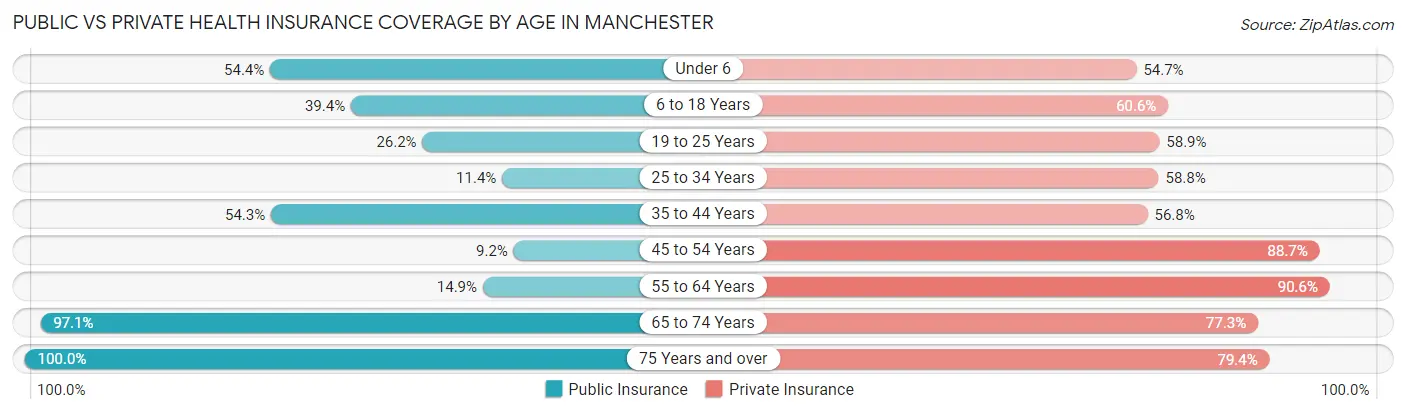
| Age Bracket | Public Insurance | Private Insurance |
| Under 6 | 209 (54.4%) | 210 (54.7%) |
| 6 to 18 Years | 246 (39.4%) | 378 (60.6%) |
| 19 to 25 Years | 114 (26.2%) | 257 (58.9%) |
| 25 to 34 Years | 51 (11.4%) | 264 (58.8%) |
| 35 to 44 Years | 217 (54.2%) | 227 (56.8%) |
| 45 to 54 Years | 44 (9.2%) | 423 (88.7%) |
| 55 to 64 Years | 141 (14.9%) | 855 (90.6%) |
| 65 to 74 Years | 602 (97.1%) | 479 (77.3%) |
| 75 Years and over | 660 (100.0%) | 524 (79.4%) |
| Total | 2,284 (45.7%) | 3,617 (72.4%) |
Disability Status by Sex by Age in Manchester
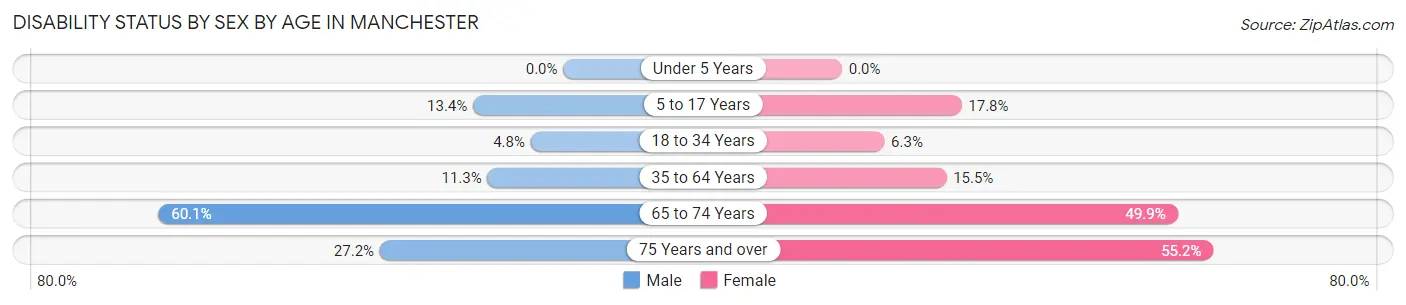
| Age Bracket | Male | Female |
| Under 5 Years | 0 (0.0%) | 0 (0.0%) |
| 5 to 17 Years | 56 (13.4%) | 41 (17.7%) |
| 18 to 34 Years | 24 (4.8%) | 27 (6.3%) |
| 35 to 64 Years | 104 (11.3%) | 139 (15.5%) |
| 65 to 74 Years | 175 (60.1%) | 164 (49.8%) |
| 75 Years and over | 82 (27.2%) | 198 (55.1%) |
Disability Class by Sex by Age in Manchester
Disability Class: Hearing Difficulty
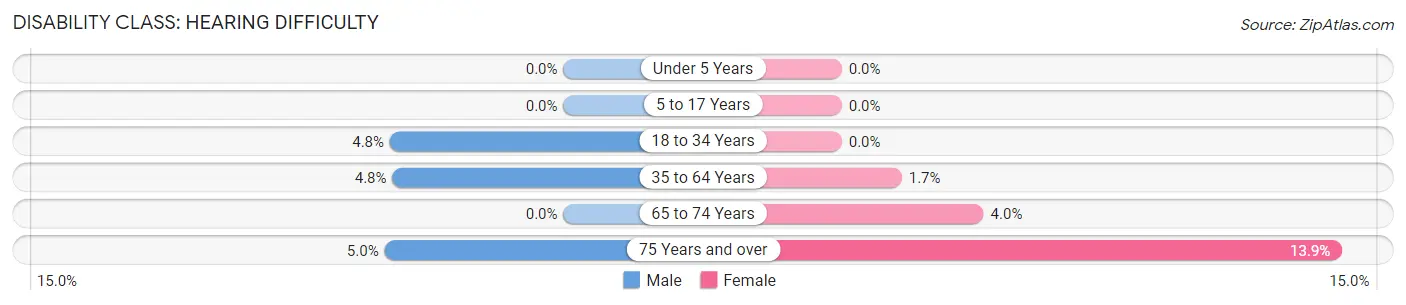
| Age Bracket | Male | Female |
| Under 5 Years | 0 (0.0%) | 0 (0.0%) |
| 5 to 17 Years | 0 (0.0%) | 0 (0.0%) |
| 18 to 34 Years | 24 (4.8%) | 0 (0.0%) |
| 35 to 64 Years | 44 (4.8%) | 15 (1.7%) |
| 65 to 74 Years | 0 (0.0%) | 13 (4.0%) |
| 75 Years and over | 15 (5.0%) | 50 (13.9%) |
Disability Class: Vision Difficulty
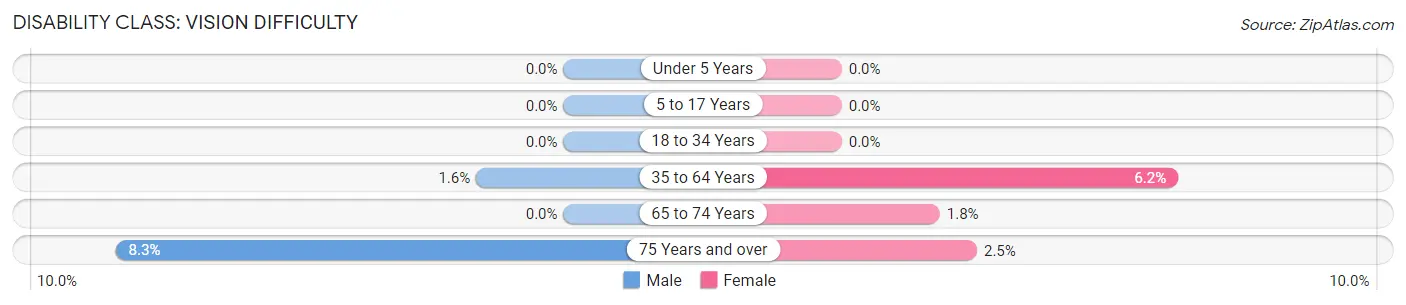
| Age Bracket | Male | Female |
| Under 5 Years | 0 (0.0%) | 0 (0.0%) |
| 5 to 17 Years | 0 (0.0%) | 0 (0.0%) |
| 18 to 34 Years | 0 (0.0%) | 0 (0.0%) |
| 35 to 64 Years | 15 (1.6%) | 56 (6.2%) |
| 65 to 74 Years | 0 (0.0%) | 6 (1.8%) |
| 75 Years and over | 25 (8.3%) | 9 (2.5%) |
Disability Class: Cognitive Difficulty
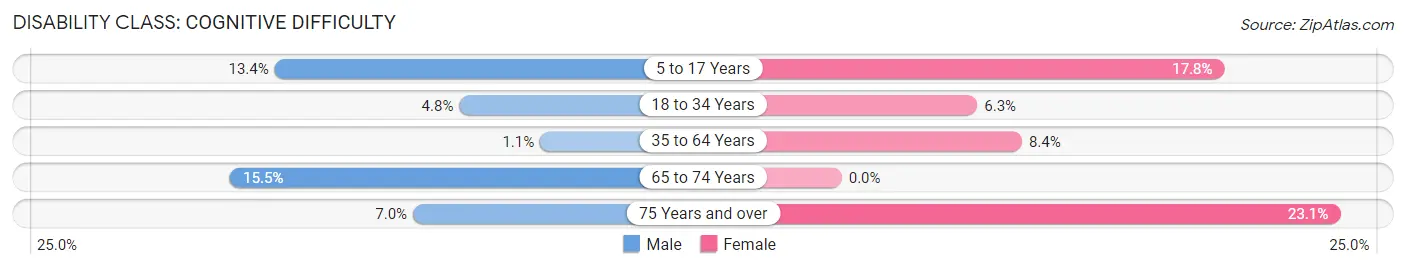
| Age Bracket | Male | Female |
| 5 to 17 Years | 56 (13.4%) | 41 (17.7%) |
| 18 to 34 Years | 24 (4.8%) | 27 (6.3%) |
| 35 to 64 Years | 10 (1.1%) | 75 (8.4%) |
| 65 to 74 Years | 45 (15.5%) | 0 (0.0%) |
| 75 Years and over | 21 (7.0%) | 83 (23.1%) |
Disability Class: Ambulatory Difficulty
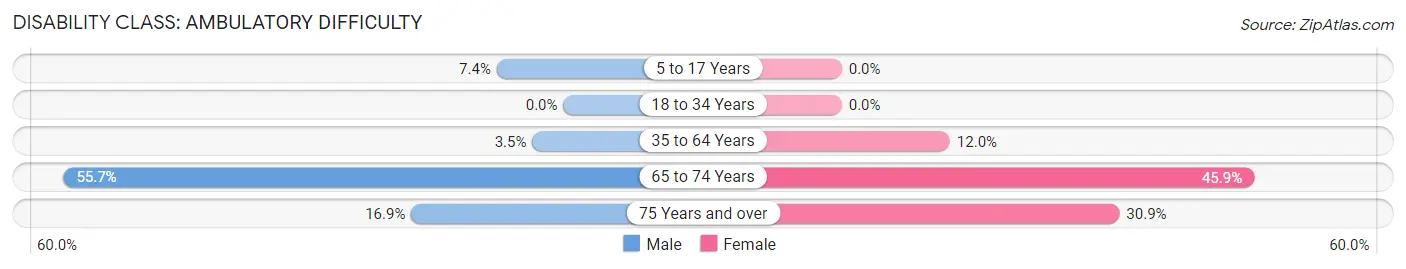
| Age Bracket | Male | Female |
| 5 to 17 Years | 31 (7.4%) | 0 (0.0%) |
| 18 to 34 Years | 0 (0.0%) | 0 (0.0%) |
| 35 to 64 Years | 32 (3.5%) | 108 (12.0%) |
| 65 to 74 Years | 162 (55.7%) | 151 (45.9%) |
| 75 Years and over | 51 (16.9%) | 111 (30.9%) |
Disability Class: Self-Care Difficulty
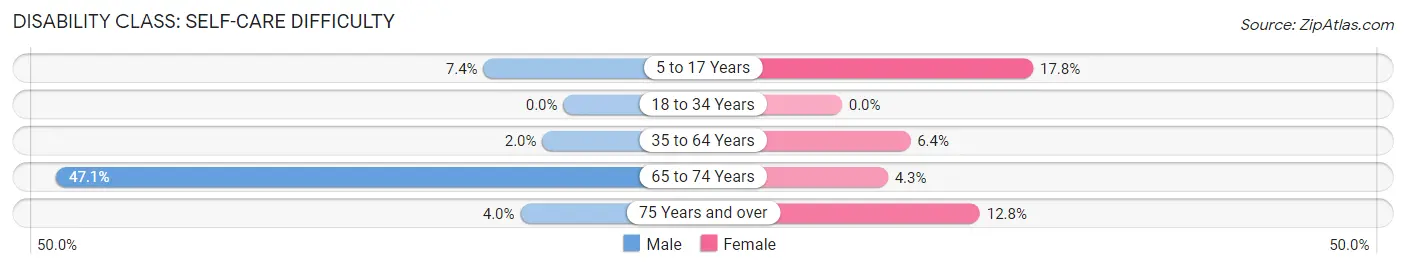
| Age Bracket | Male | Female |
| 5 to 17 Years | 31 (7.4%) | 41 (17.7%) |
| 18 to 34 Years | 0 (0.0%) | 0 (0.0%) |
| 35 to 64 Years | 18 (1.9%) | 57 (6.4%) |
| 65 to 74 Years | 137 (47.1%) | 14 (4.3%) |
| 75 Years and over | 12 (4.0%) | 46 (12.8%) |
Technology Access in Manchester
Computing Device Access in Manchester
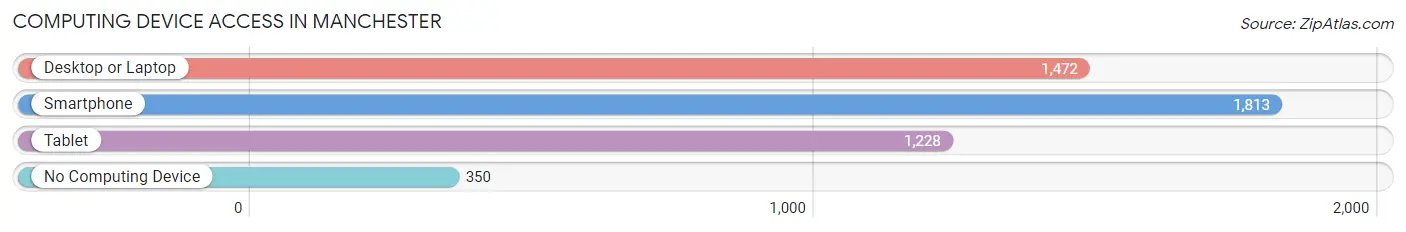
| Device Type | # Households | % Households |
| Desktop or Laptop | 1,472 | 64.5% |
| Smartphone | 1,813 | 79.5% |
| Tablet | 1,228 | 53.8% |
| No Computing Device | 350 | 15.3% |
| Total | 2,281 | 100.0% |
Internet Access in Manchester
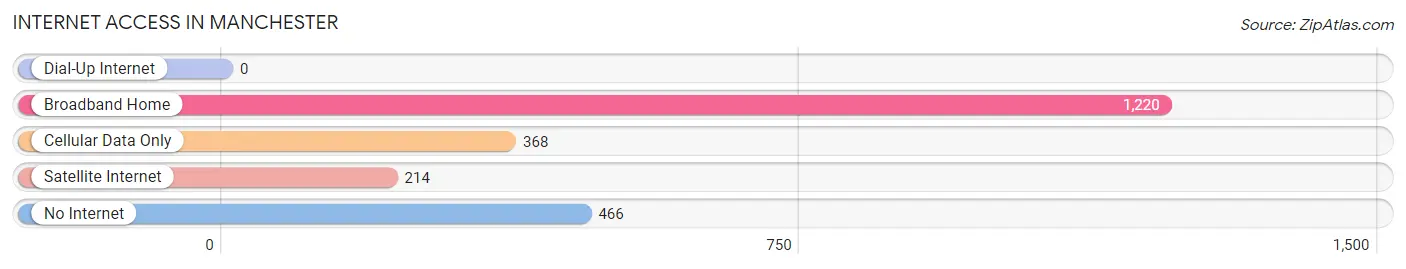
| Internet Type | # Households | % Households |
| Dial-Up Internet | 0 | 0.0% |
| Broadband Home | 1,220 | 53.5% |
| Cellular Data Only | 368 | 16.1% |
| Satellite Internet | 214 | 9.4% |
| No Internet | 466 | 20.4% |
| Total | 2,281 | 100.0% |
Manchester Summary
Manchester, Iowa is a city located in Delaware County, Iowa, United States. It is the county seat of Delaware County and is located along the Maquoketa River. The population was 5,179 at the 2010 census, making it the largest city in Delaware County.
Geography
Manchester is located at 42°10'17" North, 91°7'45" West (42.1714, -91.1293). According to the United States Census Bureau, the city has a total area of 4.2 square miles (10.8 km2), all of it land.
Manchester is located in the rolling hills of the Driftless Area of Iowa. The Maquoketa River runs through the city, and is a popular spot for fishing and canoeing. The city is also home to several parks, including the Manchester City Park, which features a swimming pool, tennis courts, and a disc golf course.
Economy
Manchester is a small city with a diverse economy. The city is home to several manufacturing companies, including a large paper mill, a plastics manufacturer, and a metal fabrication plant. The city also has a strong agricultural presence, with several farms located in the area.
The city is also home to several retail stores, including a grocery store, a hardware store, and several restaurants. The city also has a small downtown area, which features several antique stores and other small businesses.
Demographics
As of the 2010 census, there were 5,179 people, 2,093 households, and 1,323 families residing in the city. The population density was 1,233.2 people per square mile (476.2/km2). There were 2,309 housing units at an average density of 551.3 per square mile (212.9/km2). The racial makeup of the city was 97.2% White, 0.3% African American, 0.2% Native American, 0.4% Asian, 0.2% from other races, and 1.7% from two or more races. Hispanic or Latino of any race were 1.2% of the population.
There were 2,093 households, out of which 30.2% had children under the age of 18 living with them, 48.2% were married couples living together, 11.2% had a female householder with no husband present, and 36.3% were non-families. 32.2% of all households were made up of individuals, and 16.2% had someone living alone who was 65 years of age or older. The average household size was 2.37 and the average family size was 2.97.
In the city, the population was spread out, with 24.7% under the age of 18, 7.7% from 18 to 24, 25.3% from 25 to 44, 22.3% from 45 to 64, and 20.0% who were 65 years of age or older. The median age was 40 years. For every 100 females, there were 87.3 males. For every 100 females age 18 and over, there were 83.2 males.
The median income for a household in the city was $37,917, and the median income for a family was $45,938. Males had a median income of $31,917 versus $22,917 for females. The per capita income for the city was $18,945. About 6.2% of families and 8.7% of the population were below the poverty line, including 11.2% of those under age 18 and 8.2% of those age 65 or over.
Common Questions
What is Per Capita Income in Manchester?
Per Capita income in Manchester is $33,783.
What is the Median Family Income in Manchester?
Median Family Income in Manchester is $76,074.
What is the Median Household income in Manchester?
Median Household Income in Manchester is $57,969.
What is Income or Wage Gap in Manchester?
Income or Wage Gap in Manchester is 37.1%.
Women in Manchester earn 62.9 cents for every dollar earned by a man.
What is Inequality or Gini Index in Manchester?
Inequality or Gini Index in Manchester is 0.39.
What is the Total Population of Manchester?
Total Population of Manchester is 5,112.
What is the Total Male Population of Manchester?
Total Male Population of Manchester is 2,616.
What is the Total Female Population of Manchester?
Total Female Population of Manchester is 2,496.
What is the Ratio of Males per 100 Females in Manchester?
There are 104.81 Males per 100 Females in Manchester.
What is the Ratio of Females per 100 Males in Manchester?
There are 95.41 Females per 100 Males in Manchester.
What is the Median Population Age in Manchester?
Median Population Age in Manchester is 49.9 Years.
What is the Average Family Size in Manchester
Average Family Size in Manchester is 2.8 People.
What is the Average Household Size in Manchester
Average Household Size in Manchester is 2.2 People.
How Large is the Labor Force in Manchester?
There are 2,819 People in the Labor Forcein in Manchester.
What is the Percentage of People in the Labor Force in Manchester?
66.6% of People are in the Labor Force in Manchester.
What is the Unemployment Rate in Manchester?
Unemployment Rate in Manchester is 2.8%.