Leon, IA Map & Demographics
Leon Map
Leon Overview
$27,082
PER CAPITA INCOME
$66,071
AVG FAMILY INCOME
$56,818
AVG HOUSEHOLD INCOME
62.9%
WAGE / INCOME GAP [ % ]
37.1¢/ $1
WAGE / INCOME GAP [ $ ]
0.33
INEQUALITY / GINI INDEX
1,707
TOTAL POPULATION
826
MALE POPULATION
881
FEMALE POPULATION
93.76
MALES / 100 FEMALES
106.66
FEMALES / 100 MALES
40.1
MEDIAN AGE
2.6
AVG FAMILY SIZE
2.1
AVG HOUSEHOLD SIZE
798
LABOR FORCE [ PEOPLE ]
58.0%
PERCENT IN LABOR FORCE
1.4%
UNEMPLOYMENT RATE
Leon Zip Codes
Leon Area Codes
Income in Leon
Income Overview in Leon
Per Capita Income in Leon is $27,082, while median incomes of families and households are $66,071 and $56,818 respectively.
| Characteristic | Number | Measure |
| Per Capita Income | 1,707 | $27,082 |
| Median Family Income | 402 | $66,071 |
| Mean Family Income | 402 | $73,620 |
| Median Household Income | 788 | $56,818 |
| Mean Household Income | 788 | $59,497 |
| Income Deficit | 402 | $0 |
| Wage / Income Gap (%) | 1,707 | 62.94% |
| Wage / Income Gap ($) | 1,707 | 37.06¢ per $1 |
| Gini / Inequality Index | 1,707 | 0.33 |
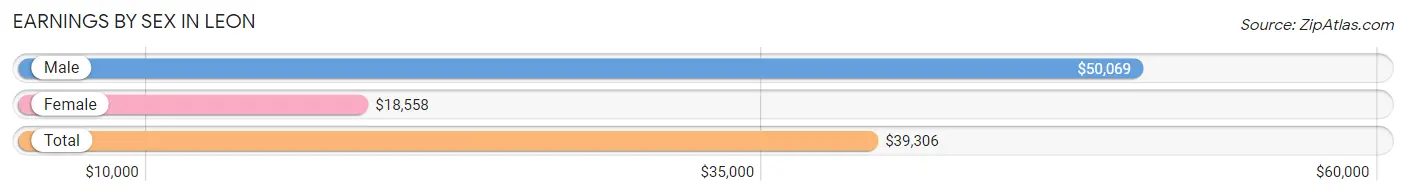
Earnings by Sex in Leon
Average Earnings in Leon are $39,306, $50,069 for men and $18,558 for women, a difference of 62.9%.
| Sex | Number | Average Earnings |
| Male | 492 (56.9%) | $50,069 |
| Female | 373 (43.1%) | $18,558 |
| Total | 865 (100.0%) | $39,306 |
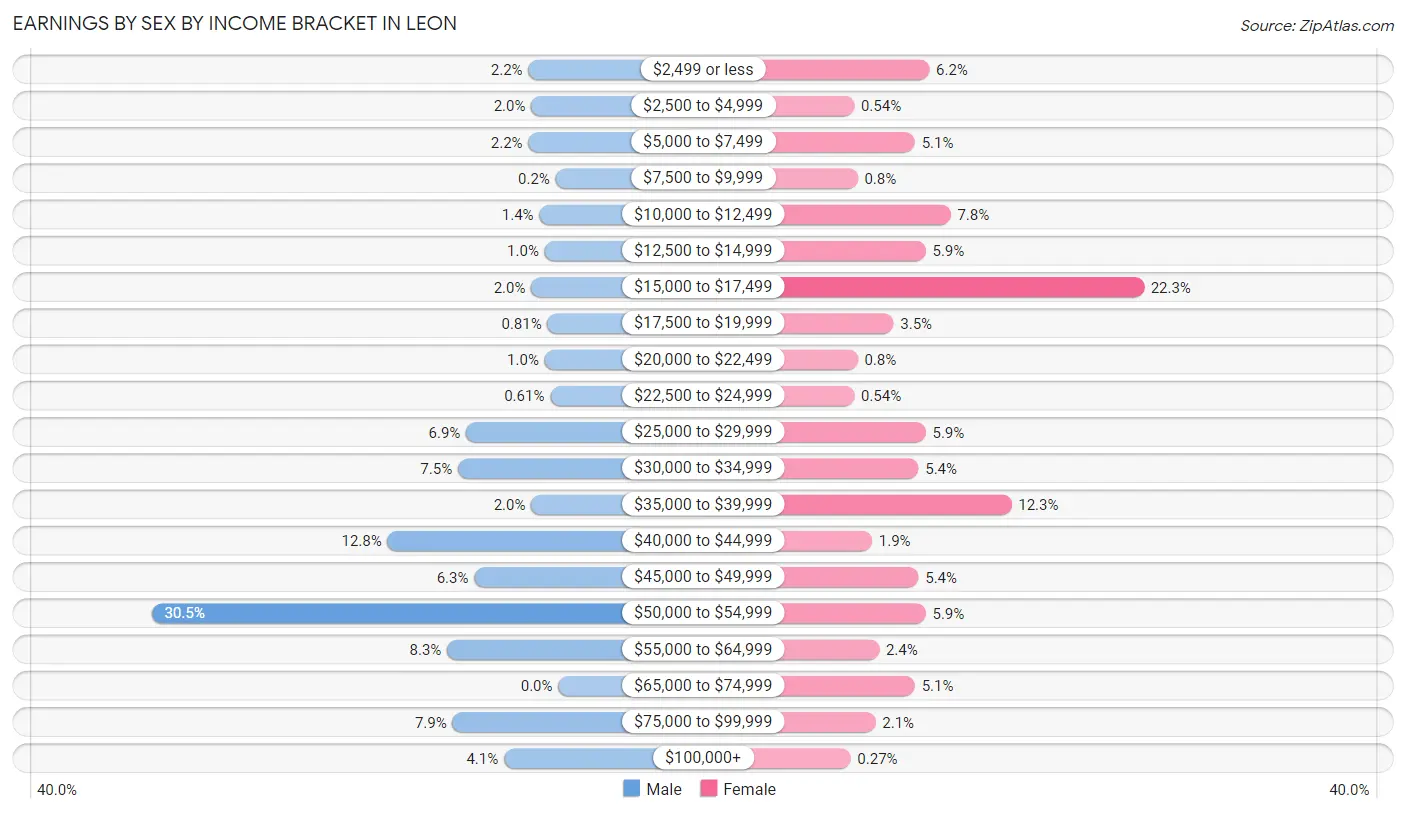
Earnings by Sex by Income Bracket in Leon
The most common earnings brackets in Leon are $50,000 to $54,999 for men (150 | 30.5%) and $15,000 to $17,499 for women (83 | 22.3%).
| Income | Male | Female |
| $2,499 or less | 11 (2.2%) | 23 (6.2%) |
| $2,500 to $4,999 | 10 (2.0%) | 2 (0.5%) |
| $5,000 to $7,499 | 11 (2.2%) | 19 (5.1%) |
| $7,500 to $9,999 | 1 (0.2%) | 3 (0.8%) |
| $10,000 to $12,499 | 7 (1.4%) | 29 (7.8%) |
| $12,500 to $14,999 | 5 (1.0%) | 22 (5.9%) |
| $15,000 to $17,499 | 10 (2.0%) | 83 (22.3%) |
| $17,500 to $19,999 | 4 (0.8%) | 13 (3.5%) |
| $20,000 to $22,499 | 5 (1.0%) | 3 (0.8%) |
| $22,500 to $24,999 | 3 (0.6%) | 2 (0.5%) |
| $25,000 to $29,999 | 34 (6.9%) | 22 (5.9%) |
| $30,000 to $34,999 | 37 (7.5%) | 20 (5.4%) |
| $35,000 to $39,999 | 10 (2.0%) | 46 (12.3%) |
| $40,000 to $44,999 | 63 (12.8%) | 7 (1.9%) |
| $45,000 to $49,999 | 31 (6.3%) | 20 (5.4%) |
| $50,000 to $54,999 | 150 (30.5%) | 22 (5.9%) |
| $55,000 to $64,999 | 41 (8.3%) | 9 (2.4%) |
| $65,000 to $74,999 | 0 (0.0%) | 19 (5.1%) |
| $75,000 to $99,999 | 39 (7.9%) | 8 (2.1%) |
| $100,000+ | 20 (4.1%) | 1 (0.3%) |
| Total | 492 (100.0%) | 373 (100.0%) |
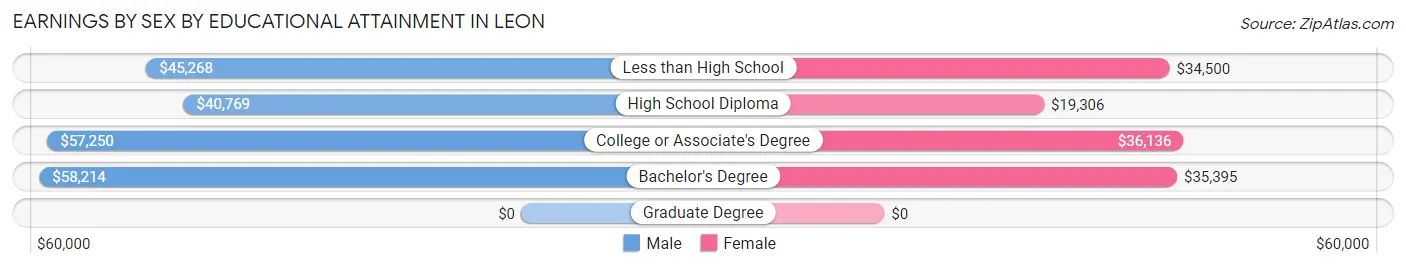
Earnings by Sex by Educational Attainment in Leon
Average earnings in Leon are $43,400 for men and $31,406 for women, a difference of 27.6%. Men with an educational attainment of bachelor's degree enjoy the highest average annual earnings of $58,214, while those with high school diploma education earn the least with $40,769. Women with an educational attainment of college or associate's degree earn the most with the average annual earnings of $36,136, while those with high school diploma education have the smallest earnings of $19,306.
| Educational Attainment | Male Income | Female Income |
| Less than High School | $45,268 | $34,500 |
| High School Diploma | $40,769 | $19,306 |
| College or Associate's Degree | $57,250 | $36,136 |
| Bachelor's Degree | $58,214 | $35,395 |
| Graduate Degree | - | - |
| Total | $43,400 | $31,406 |
Family Income in Leon
Family Income Brackets in Leon
According to the Leon family income data, there are 113 families falling into the $35,000 to $49,999 income range, which is the most common income bracket and makes up 28.1% of all families.
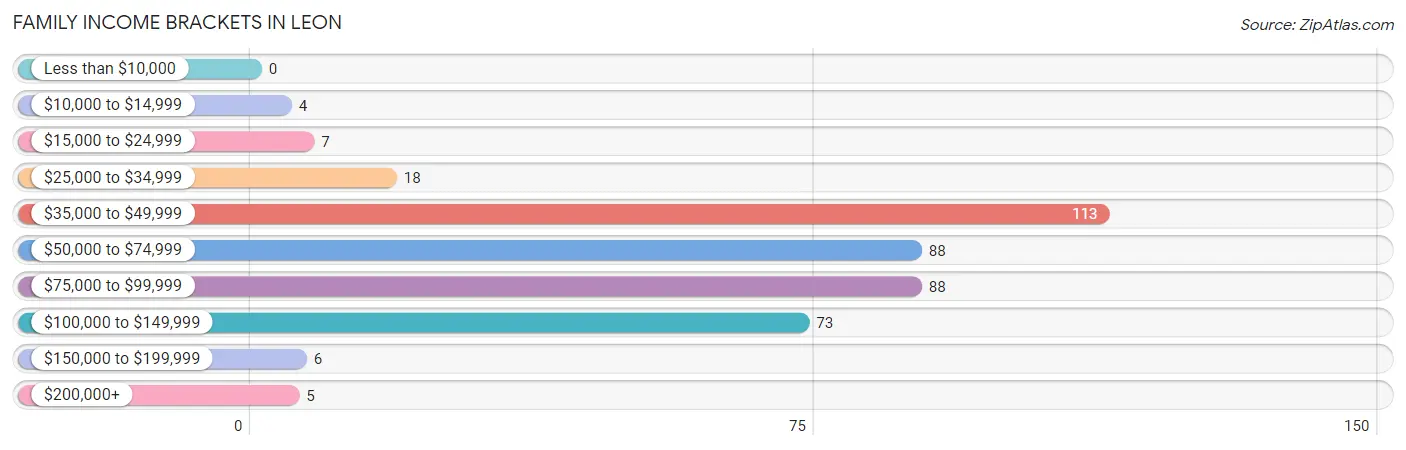
| Income Bracket | # Families | % Families |
| Less than $10,000 | 0 | 0.0% |
| $10,000 to $14,999 | 4 | 1.0% |
| $15,000 to $24,999 | 7 | 1.7% |
| $25,000 to $34,999 | 18 | 4.5% |
| $35,000 to $49,999 | 113 | 28.1% |
| $50,000 to $74,999 | 88 | 21.9% |
| $75,000 to $99,999 | 88 | 21.9% |
| $100,000 to $149,999 | 73 | 18.2% |
| $150,000 to $199,999 | 6 | 1.5% |
| $200,000+ | 5 | 1.2% |
Family Income by Famaliy Size in Leon
3-person families (87 | 21.6%) account for the highest median family income in Leon with $69,250 per family, while 2-person families (219 | 54.5%) have the highest median income of $33,660 per family member.
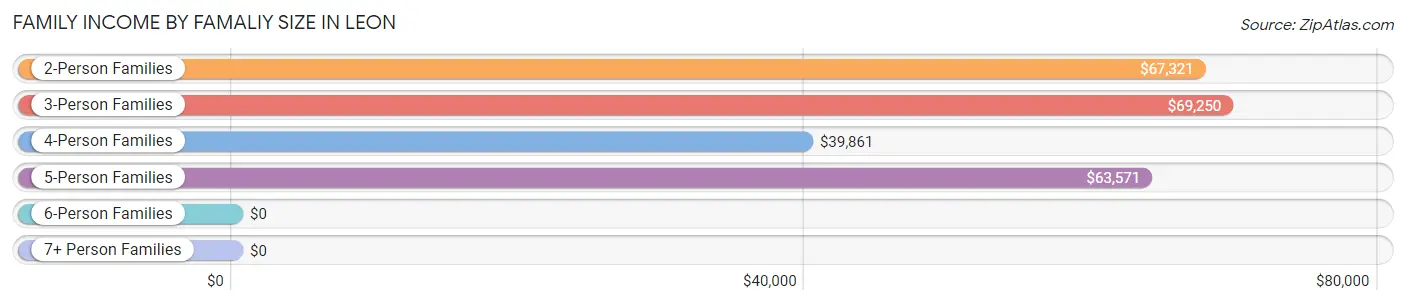
| Income Bracket | # Families | Median Income |
| 2-Person Families | 219 (54.5%) | $67,321 |
| 3-Person Families | 87 (21.6%) | $69,250 |
| 4-Person Families | 51 (12.7%) | $39,861 |
| 5-Person Families | 30 (7.5%) | $63,571 |
| 6-Person Families | 15 (3.7%) | $0 |
| 7+ Person Families | 0 (0.0%) | $0 |
| Total | 402 (100.0%) | $66,071 |
Family Income by Number of Earners in Leon
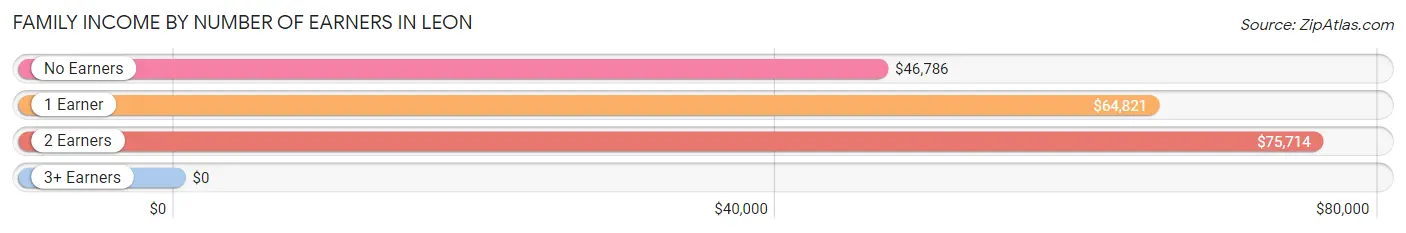
| Number of Earners | # Families | Median Income |
| No Earners | 44 (11.0%) | $46,786 |
| 1 Earner | 163 (40.6%) | $64,821 |
| 2 Earners | 192 (47.8%) | $75,714 |
| 3+ Earners | 3 (0.7%) | $0 |
| Total | 402 (100.0%) | $66,071 |
Household Income in Leon
Household Income Brackets in Leon
With 251 households falling in the category, the $50,000 to $74,999 income range is the most frequent in Leon, accounting for 31.9% of all households. In contrast, only 5 households (0.6%) fall into the $200,000+ income bracket, making it the least populous group.
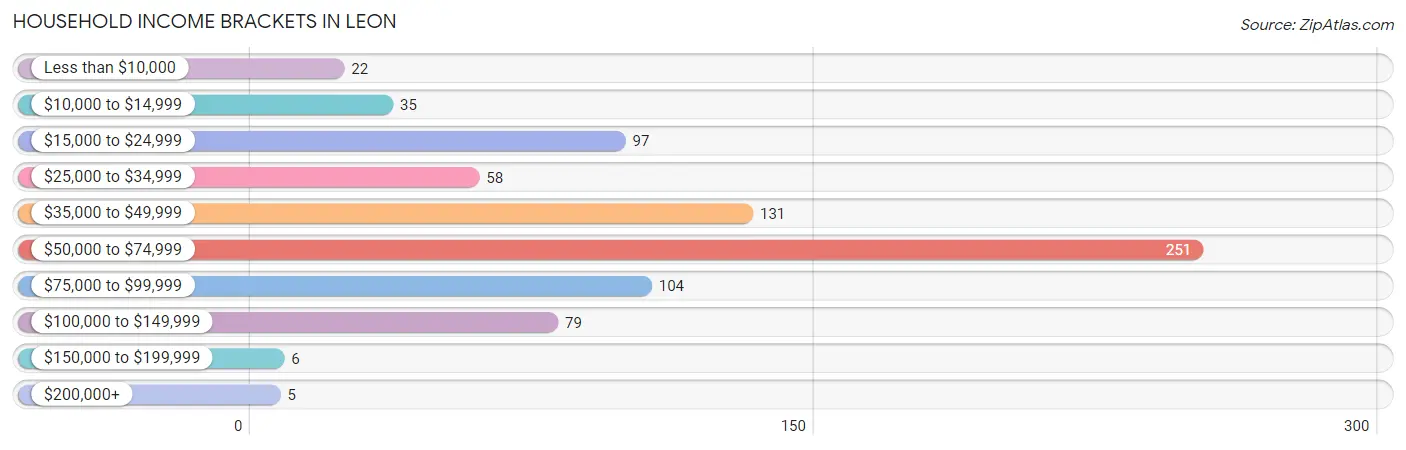
| Income Bracket | # Households | % Households |
| Less than $10,000 | 22 | 2.8% |
| $10,000 to $14,999 | 35 | 4.4% |
| $15,000 to $24,999 | 97 | 12.3% |
| $25,000 to $34,999 | 58 | 7.4% |
| $35,000 to $49,999 | 131 | 16.6% |
| $50,000 to $74,999 | 251 | 31.9% |
| $75,000 to $99,999 | 104 | 13.2% |
| $100,000 to $149,999 | 79 | 10.0% |
| $150,000 to $199,999 | 6 | 0.8% |
| $200,000+ | 5 | 0.6% |
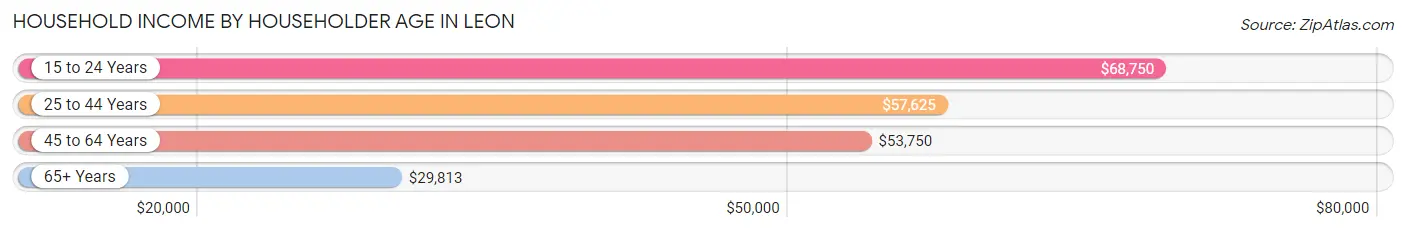
Household Income by Householder Age in Leon
The median household income in Leon is $56,818, with the highest median household income of $68,750 found in the 15 to 24 years age bracket for the primary householder. A total of 153 households (19.4%) fall into this category. Meanwhile, the 65+ years age bracket for the primary householder has the lowest median household income of $29,813, with 279 households (35.4%) in this group.
| Income Bracket | # Households | Median Income |
| 15 to 24 Years | 153 (19.4%) | $68,750 |
| 25 to 44 Years | 175 (22.2%) | $57,625 |
| 45 to 64 Years | 181 (23.0%) | $53,750 |
| 65+ Years | 279 (35.4%) | $29,813 |
| Total | 788 (100.0%) | $56,818 |
Poverty in Leon
Income Below Poverty by Sex and Age in Leon
With 2.5% poverty level for males and 8.9% for females among the residents of Leon, 25 to 34 year old males and 16 and 17 year old females are the most vulnerable to poverty, with 9 males (22.5%) and 3 females (33.3%) in their respective age groups living below the poverty level.
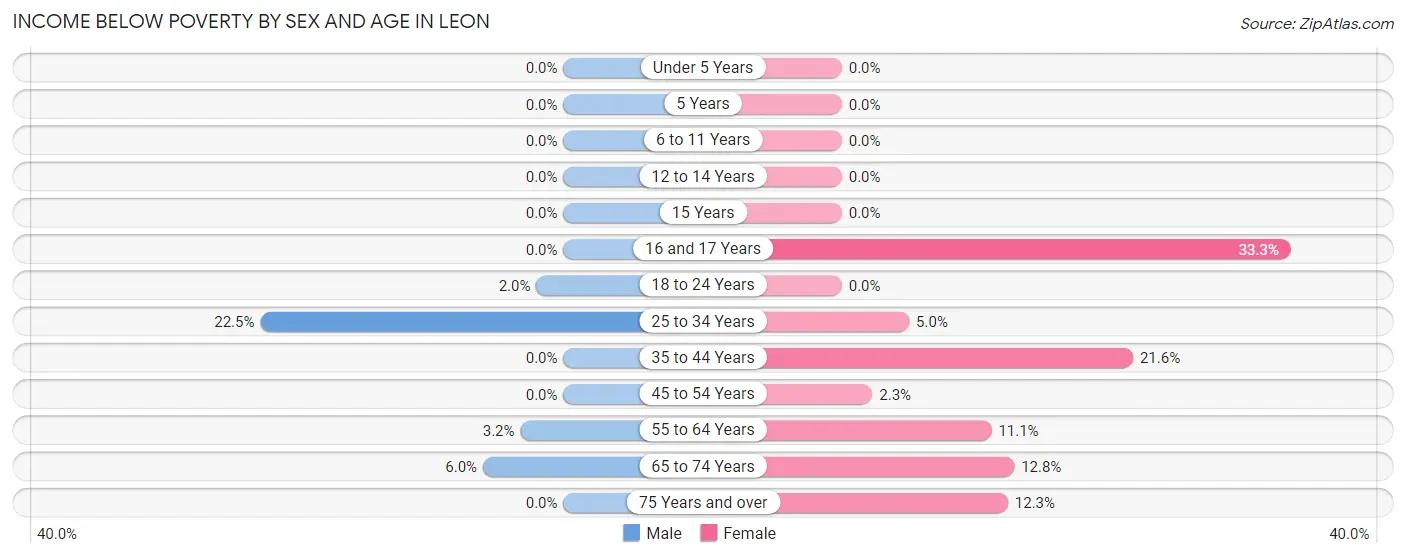
| Age Bracket | Male | Female |
| Under 5 Years | 0 (0.0%) | 0 (0.0%) |
| 5 Years | 0 (0.0%) | 0 (0.0%) |
| 6 to 11 Years | 0 (0.0%) | 0 (0.0%) |
| 12 to 14 Years | 0 (0.0%) | 0 (0.0%) |
| 15 Years | 0 (0.0%) | 0 (0.0%) |
| 16 and 17 Years | 0 (0.0%) | 3 (33.3%) |
| 18 to 24 Years | 3 (2.0%) | 0 (0.0%) |
| 25 to 34 Years | 9 (22.5%) | 3 (5.0%) |
| 35 to 44 Years | 0 (0.0%) | 16 (21.6%) |
| 45 to 54 Years | 0 (0.0%) | 1 (2.3%) |
| 55 to 64 Years | 3 (3.2%) | 15 (11.1%) |
| 65 to 74 Years | 4 (6.0%) | 16 (12.8%) |
| 75 Years and over | 0 (0.0%) | 18 (12.3%) |
| Total | 19 (2.5%) | 72 (8.9%) |
Income Above Poverty by Sex and Age in Leon
According to the poverty statistics in Leon, males aged under 5 years and females aged under 5 years are the age groups that are most secure financially, with 100.0% of males and 100.0% of females in these age groups living above the poverty line.
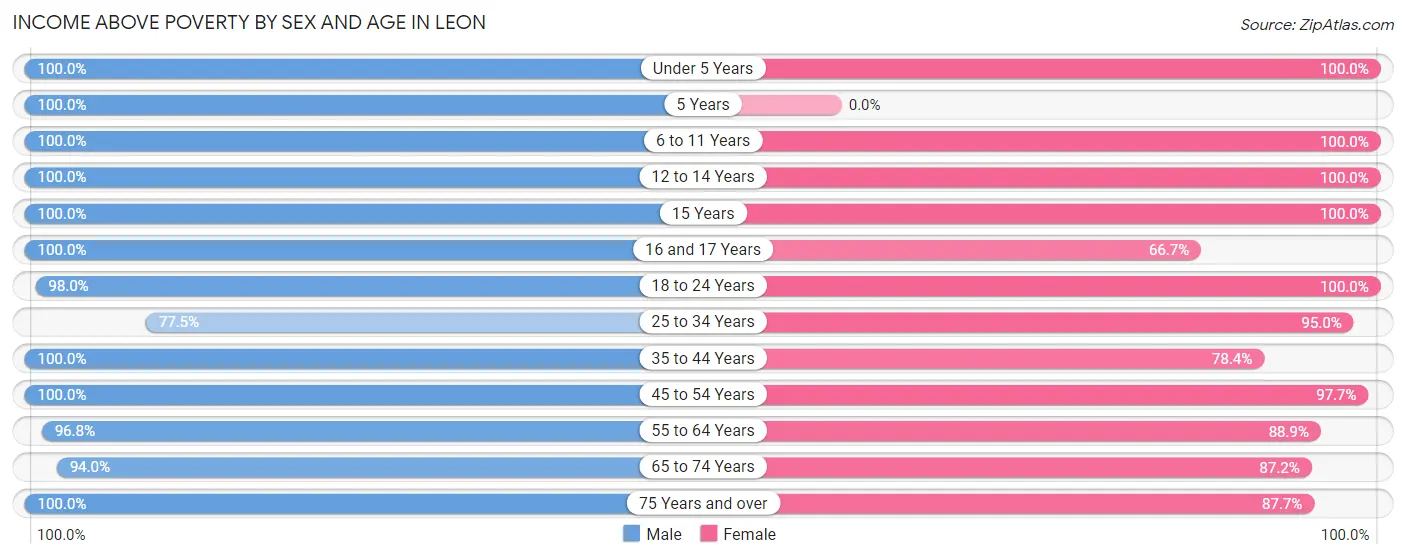
| Age Bracket | Male | Female |
| Under 5 Years | 40 (100.0%) | 33 (100.0%) |
| 5 Years | 6 (100.0%) | 0 (0.0%) |
| 6 to 11 Years | 58 (100.0%) | 42 (100.0%) |
| 12 to 14 Years | 19 (100.0%) | 32 (100.0%) |
| 15 Years | 27 (100.0%) | 10 (100.0%) |
| 16 and 17 Years | 11 (100.0%) | 6 (66.7%) |
| 18 to 24 Years | 146 (98.0%) | 99 (100.0%) |
| 25 to 34 Years | 31 (77.5%) | 57 (95.0%) |
| 35 to 44 Years | 126 (100.0%) | 58 (78.4%) |
| 45 to 54 Years | 70 (100.0%) | 43 (97.7%) |
| 55 to 64 Years | 91 (96.8%) | 120 (88.9%) |
| 65 to 74 Years | 63 (94.0%) | 109 (87.2%) |
| 75 Years and over | 43 (100.0%) | 128 (87.7%) |
| Total | 731 (97.5%) | 737 (91.1%) |
Income Below Poverty Among Married-Couple Families in Leon
The poverty statistics for married-couple families in Leon show that 1.2% or 4 of the total 336 families live below the poverty line. Families with no children have the highest poverty rate of 1.8%, comprising of 4 families. On the other hand, families with 1 or 2 children have the lowest poverty rate of 0.0%, which includes 0 families.
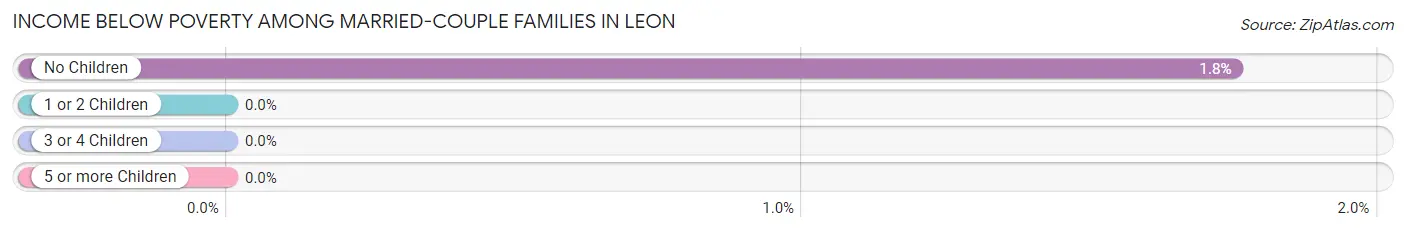
| Children | Above Poverty | Below Poverty |
| No Children | 224 (98.3%) | 4 (1.8%) |
| 1 or 2 Children | 63 (100.0%) | 0 (0.0%) |
| 3 or 4 Children | 45 (100.0%) | 0 (0.0%) |
| 5 or more Children | 0 (0.0%) | 0 (0.0%) |
| Total | 332 (98.8%) | 4 (1.2%) |
Income Below Poverty Among Single-Parent Households in Leon
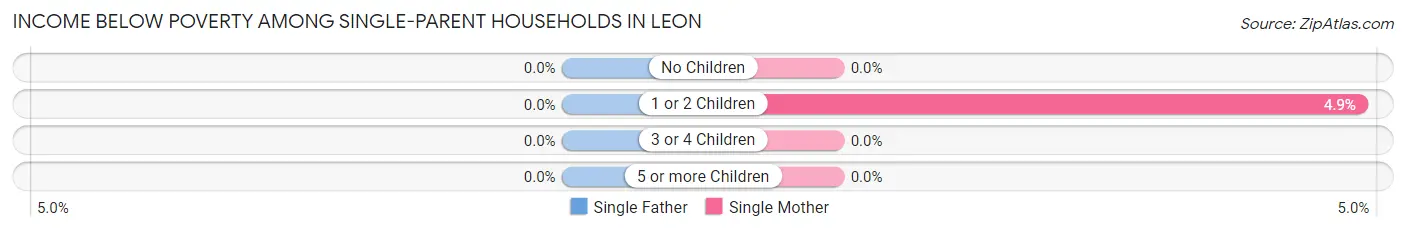
| Children | Single Father | Single Mother |
| No Children | 0 (0.0%) | 0 (0.0%) |
| 1 or 2 Children | 0 (0.0%) | 2 (4.9%) |
| 3 or 4 Children | 0 (0.0%) | 0 (0.0%) |
| 5 or more Children | 0 (0.0%) | 0 (0.0%) |
| Total | 0 (0.0%) | 2 (3.5%) |
Income Below Poverty Among Married-Couple vs Single-Parent Households in Leon
The poverty data for Leon shows that 4 of the married-couple family households (1.2%) and 2 of the single-parent households (3.0%) are living below the poverty level. Within the married-couple family households, those with no children have the highest poverty rate, with 4 households (1.8%) falling below the poverty line. Among the single-parent households, those with 1 or 2 children have the highest poverty rate, with 2 household (4.0%) living below poverty.
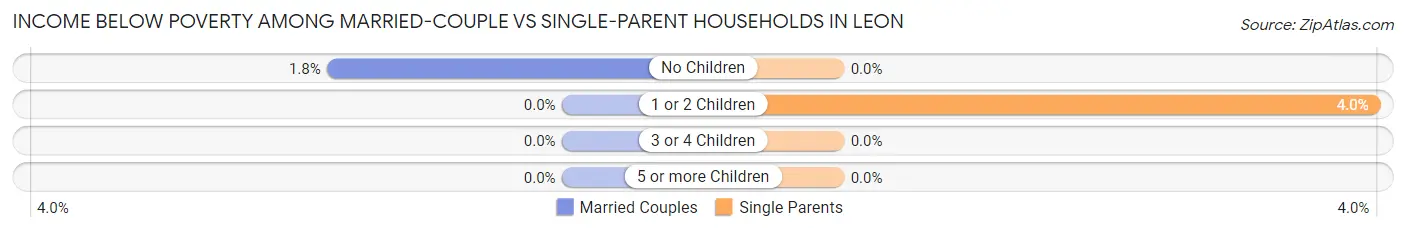
| Children | Married-Couple Families | Single-Parent Households |
| No Children | 4 (1.8%) | 0 (0.0%) |
| 1 or 2 Children | 0 (0.0%) | 2 (4.0%) |
| 3 or 4 Children | 0 (0.0%) | 0 (0.0%) |
| 5 or more Children | 0 (0.0%) | 0 (0.0%) |
| Total | 4 (1.2%) | 2 (3.0%) |
Race in Leon
The most populous races in Leon are White / Caucasian (1,654 | 96.9%), Two or more Races (47 | 2.8%), and Hispanic or Latino (30 | 1.8%).
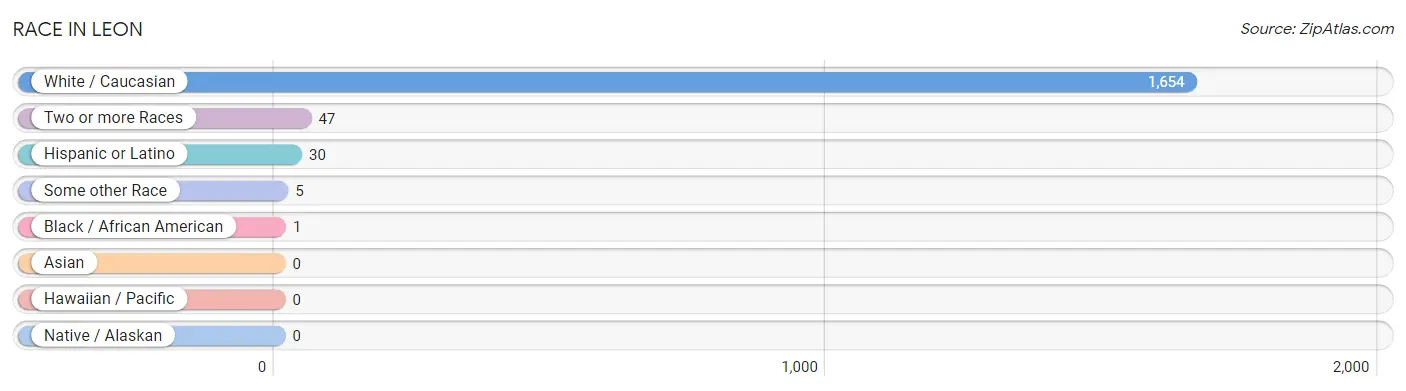
| Race | # Population | % Population |
| Asian | 0 | 0.0% |
| Black / African American | 1 | 0.1% |
| Hawaiian / Pacific | 0 | 0.0% |
| Hispanic or Latino | 30 | 1.8% |
| Native / Alaskan | 0 | 0.0% |
| White / Caucasian | 1,654 | 96.9% |
| Two or more Races | 47 | 2.8% |
| Some other Race | 5 | 0.3% |
| Total | 1,707 | 100.0% |
Ancestry in Leon
The most populous ancestries reported in Leon are German (430 | 25.2%), English (312 | 18.3%), Irish (235 | 13.8%), American (123 | 7.2%), and Dutch (85 | 5.0%), together accounting for 69.4% of all Leon residents.
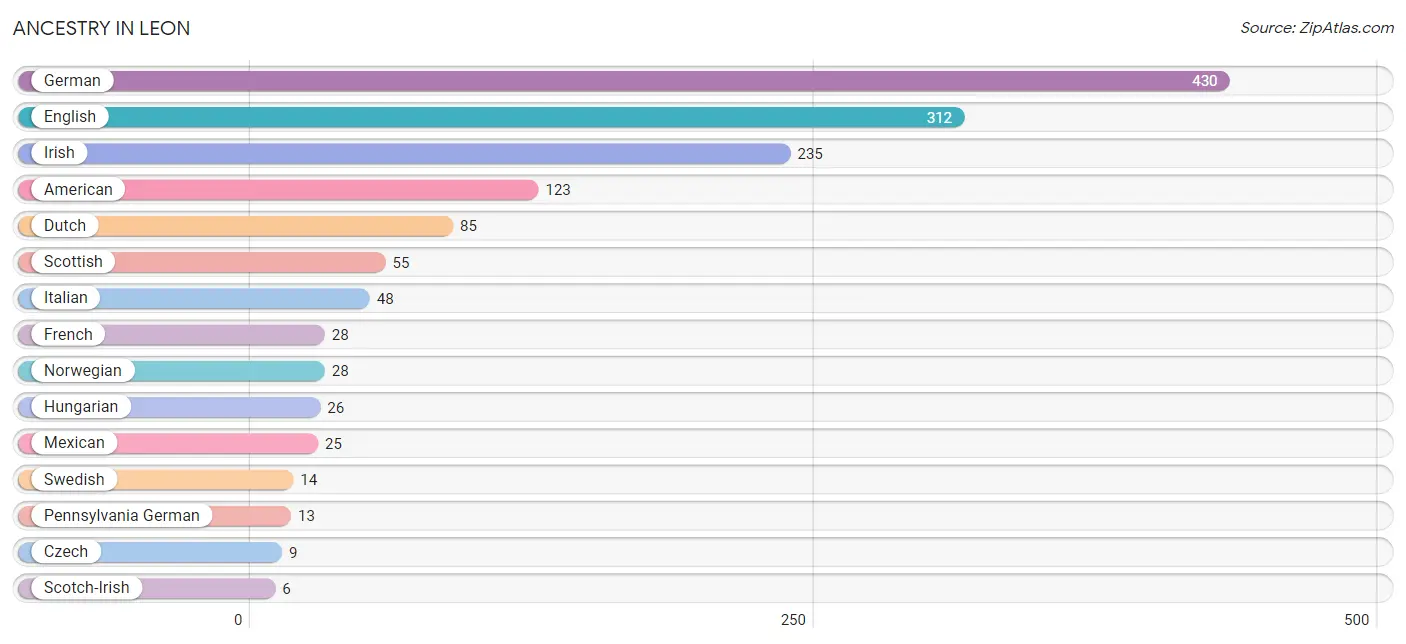
| Ancestry | # Population | % Population |
| American | 123 | 7.2% |
| Belgian | 5 | 0.3% |
| Czech | 9 | 0.5% |
| Danish | 4 | 0.2% |
| Dutch | 85 | 5.0% |
| English | 312 | 18.3% |
| European | 4 | 0.2% |
| Finnish | 3 | 0.2% |
| French | 28 | 1.6% |
| German | 430 | 25.2% |
| Greek | 3 | 0.2% |
| Hungarian | 26 | 1.5% |
| Irish | 235 | 13.8% |
| Italian | 48 | 2.8% |
| Mexican | 25 | 1.5% |
| Norwegian | 28 | 1.6% |
| Pennsylvania German | 13 | 0.8% |
| Polish | 3 | 0.2% |
| Scandinavian | 1 | 0.1% |
| Scotch-Irish | 6 | 0.4% |
| Scottish | 55 | 3.2% |
| Spaniard | 1 | 0.1% |
| Swedish | 14 | 0.8% |
| Swiss | 1 | 0.1% |
| Welsh | 6 | 0.4% | View All 25 Rows |
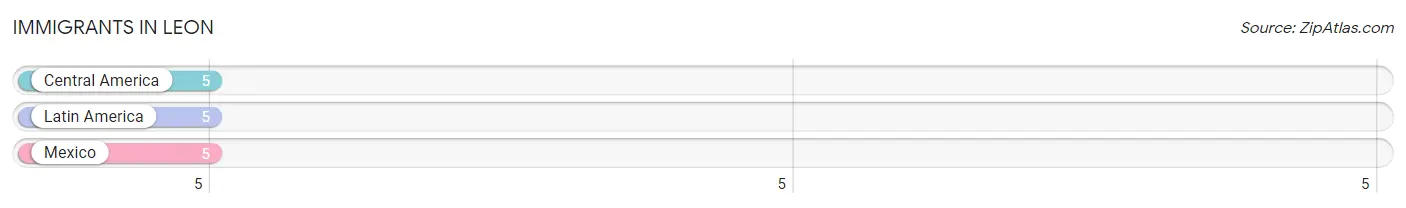
Immigrants in Leon
The most numerous immigrant groups reported in Leon came from Central America (5 | 0.3%), Latin America (5 | 0.3%), and Mexico (5 | 0.3%), together accounting for 0.9% of all Leon residents.
| Immigration Origin | # Population | % Population |
| Central America | 5 | 0.3% |
| Latin America | 5 | 0.3% |
| Mexico | 5 | 0.3% | View All 3 Rows |
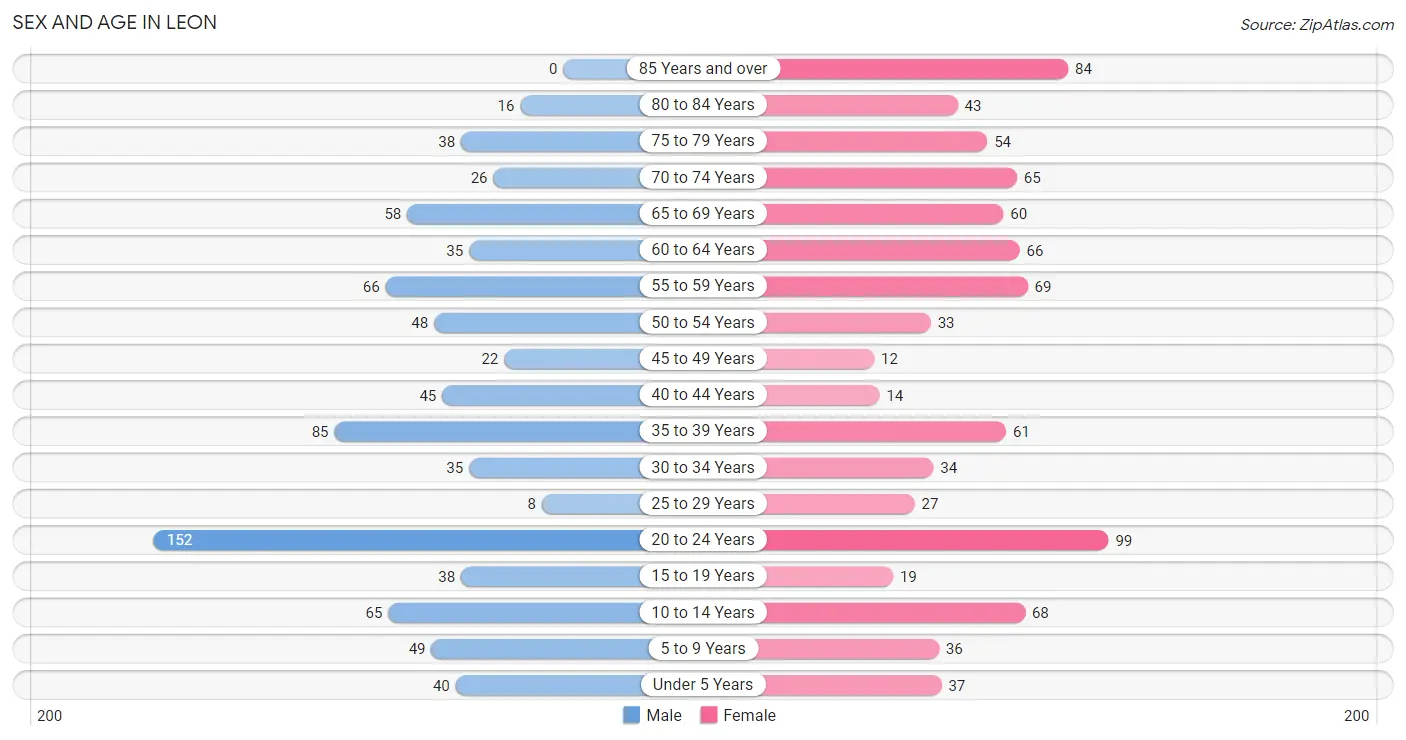
Sex and Age in Leon
Sex and Age in Leon
The most populous age groups in Leon are 20 to 24 Years (152 | 18.4%) for men and 20 to 24 Years (99 | 11.2%) for women.
| Age Bracket | Male | Female |
| Under 5 Years | 40 (4.8%) | 37 (4.2%) |
| 5 to 9 Years | 49 (5.9%) | 36 (4.1%) |
| 10 to 14 Years | 65 (7.9%) | 68 (7.7%) |
| 15 to 19 Years | 38 (4.6%) | 19 (2.2%) |
| 20 to 24 Years | 152 (18.4%) | 99 (11.2%) |
| 25 to 29 Years | 8 (1.0%) | 27 (3.1%) |
| 30 to 34 Years | 35 (4.2%) | 34 (3.9%) |
| 35 to 39 Years | 85 (10.3%) | 61 (6.9%) |
| 40 to 44 Years | 45 (5.4%) | 14 (1.6%) |
| 45 to 49 Years | 22 (2.7%) | 12 (1.4%) |
| 50 to 54 Years | 48 (5.8%) | 33 (3.7%) |
| 55 to 59 Years | 66 (8.0%) | 69 (7.8%) |
| 60 to 64 Years | 35 (4.2%) | 66 (7.5%) |
| 65 to 69 Years | 58 (7.0%) | 60 (6.8%) |
| 70 to 74 Years | 26 (3.2%) | 65 (7.4%) |
| 75 to 79 Years | 38 (4.6%) | 54 (6.1%) |
| 80 to 84 Years | 16 (1.9%) | 43 (4.9%) |
| 85 Years and over | 0 (0.0%) | 84 (9.5%) |
| Total | 826 (100.0%) | 881 (100.0%) |
Families and Households in Leon
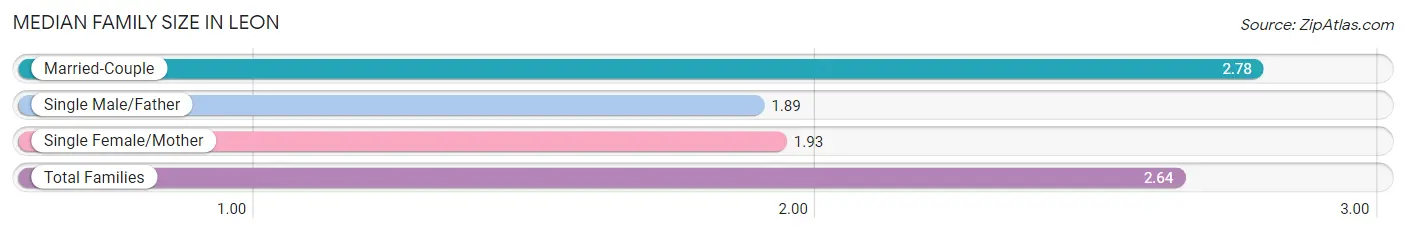
Median Family Size in Leon
The median family size in Leon is 2.64 persons per family, with married-couple families (336 | 83.6%) accounting for the largest median family size of 2.78 persons per family. On the other hand, single male/father families (9 | 2.2%) represent the smallest median family size with 1.89 persons per family.
| Family Type | # Families | Family Size |
| Married-Couple | 336 (83.6%) | 2.78 |
| Single Male/Father | 9 (2.2%) | 1.89 |
| Single Female/Mother | 57 (14.2%) | 1.93 |
| Total Families | 402 (100.0%) | 2.64 |
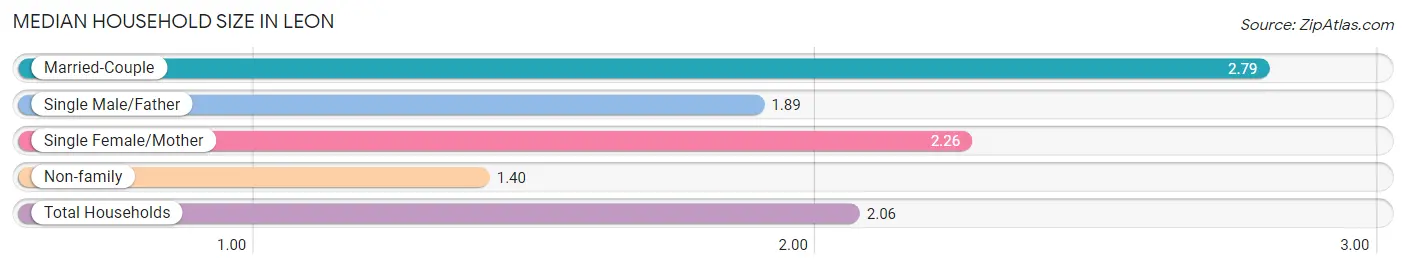
Median Household Size in Leon
The median household size in Leon is 2.06 persons per household, with married-couple households (336 | 42.6%) accounting for the largest median household size of 2.79 persons per household. non-family households (386 | 49.0%) represent the smallest median household size with 1.40 persons per household.
| Household Type | # Households | Household Size |
| Married-Couple | 336 (42.6%) | 2.79 |
| Single Male/Father | 9 (1.1%) | 1.89 |
| Single Female/Mother | 57 (7.2%) | 2.26 |
| Non-family | 386 (49.0%) | 1.40 |
| Total Households | 788 (100.0%) | 2.06 |
Household Size by Marriage Status in Leon
Out of a total of 788 households in Leon, 402 (51.0%) are family households, while 386 (49.0%) are nonfamily households. The most numerous type of family households are 2-person households, comprising 200, and the most common type of nonfamily households are 1-person households, comprising 223.
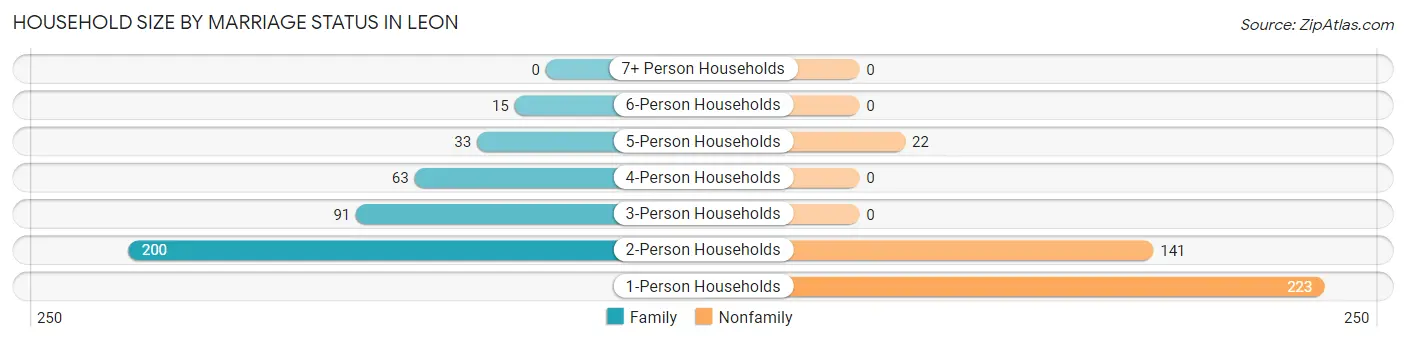
| Household Size | Family Households | Nonfamily Households |
| 1-Person Households | - | 223 (28.3%) |
| 2-Person Households | 200 (25.4%) | 141 (17.9%) |
| 3-Person Households | 91 (11.6%) | 0 (0.0%) |
| 4-Person Households | 63 (8.0%) | 0 (0.0%) |
| 5-Person Households | 33 (4.2%) | 22 (2.8%) |
| 6-Person Households | 15 (1.9%) | 0 (0.0%) |
| 7+ Person Households | 0 (0.0%) | 0 (0.0%) |
| Total | 402 (51.0%) | 386 (49.0%) |
Female Fertility in Leon
Fertility by Age in Leon
Average fertility rate in Leon is 29.0 births per 1,000 women. Women in the age bracket of 35 to 50 years have the highest fertility rate with 86.0 births per 1,000 women. Women in the age bracket of 35 to 50 years acount for 100.0% of all women with births.
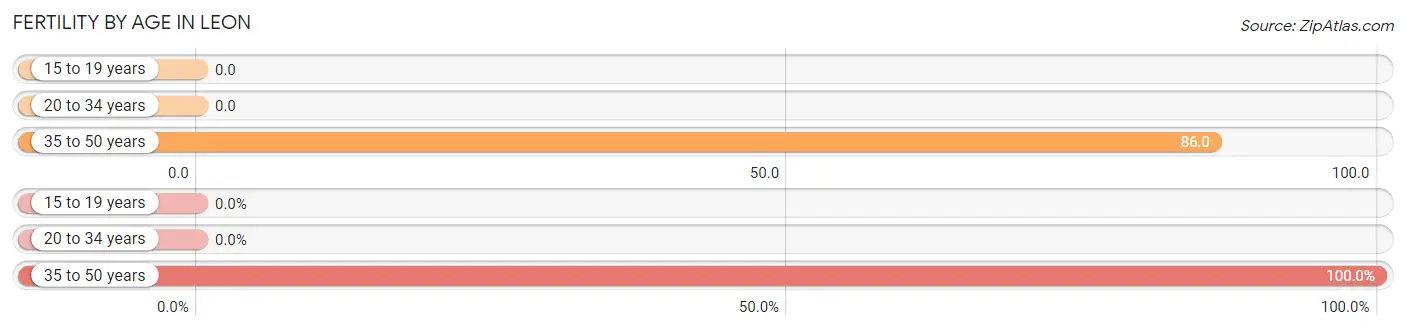
| Age Bracket | Women with Births | Births / 1,000 Women |
| 15 to 19 years | 0 (0.0%) | 0.0 |
| 20 to 34 years | 0 (0.0%) | 0.0 |
| 35 to 50 years | 8 (100.0%) | 86.0 |
| Total | 8 (100.0%) | 29.0 |
Fertility by Age by Marriage Status in Leon
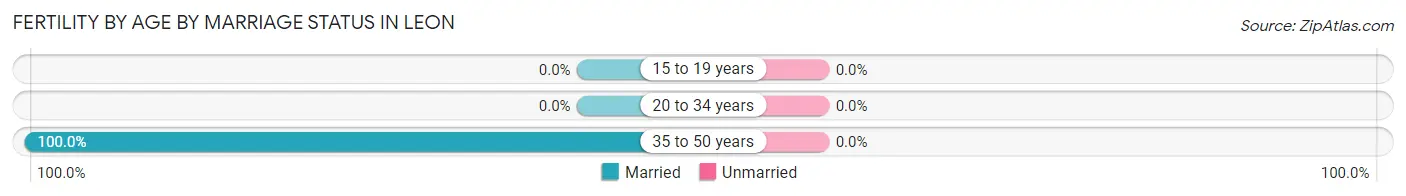
| Age Bracket | Married | Unmarried |
| 15 to 19 years | 0 (0.0%) | 0 (0.0%) |
| 20 to 34 years | 0 (0.0%) | 0 (0.0%) |
| 35 to 50 years | 8 (100.0%) | 0 (0.0%) |
| Total | 8 (100.0%) | 0 (0.0%) |
Fertility by Education in Leon
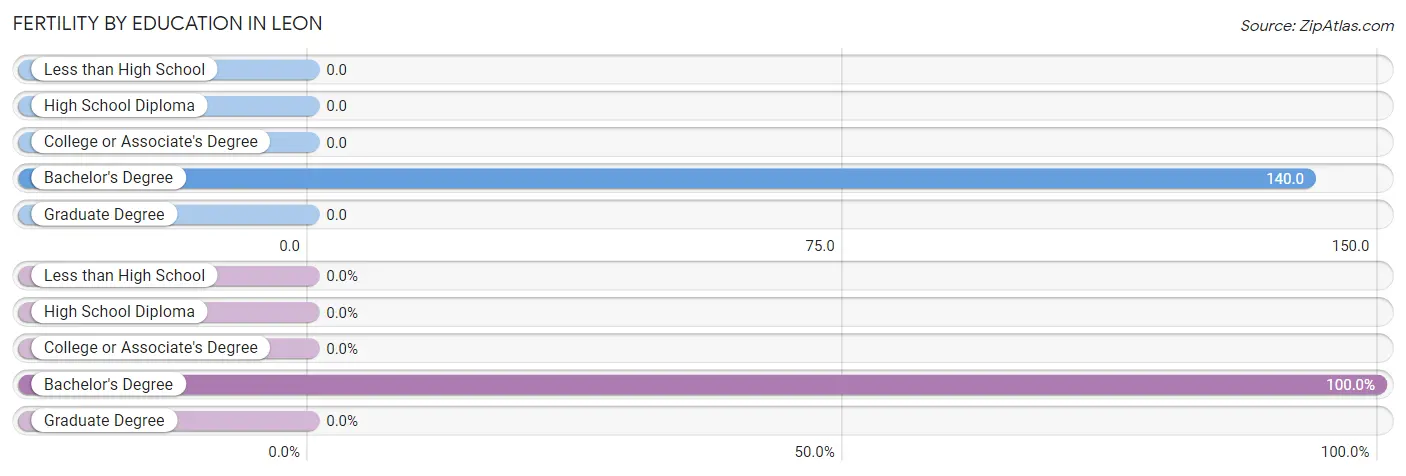
| Educational Attainment | Women with Births | Births / 1,000 Women |
| Less than High School | 0 (0.0%) | 0.0 |
| High School Diploma | 0 (0.0%) | 0.0 |
| College or Associate's Degree | 0 (0.0%) | 0.0 |
| Bachelor's Degree | 8 (100.0%) | 140.0 |
| Graduate Degree | 0 (0.0%) | 0.0 |
| Total | 8 (100.0%) | 29.0 |
Fertility by Education by Marriage Status in Leon
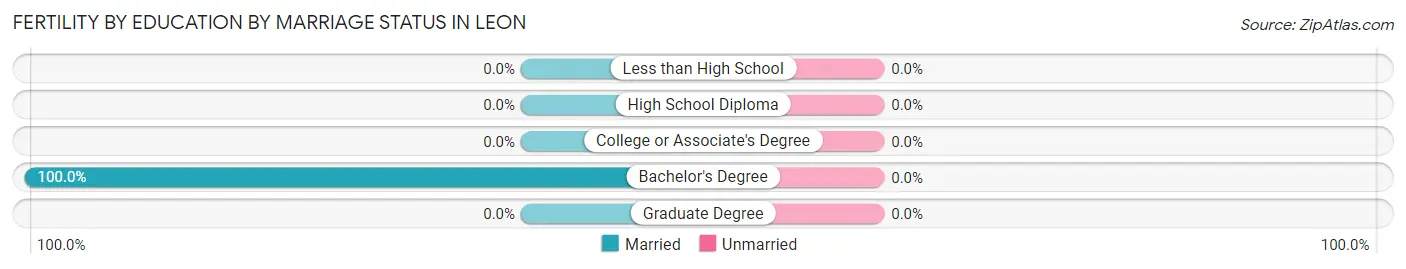
| Educational Attainment | Married | Unmarried |
| Less than High School | 0 (0.0%) | 0 (0.0%) |
| High School Diploma | 0 (0.0%) | 0 (0.0%) |
| College or Associate's Degree | 0 (0.0%) | 0 (0.0%) |
| Bachelor's Degree | 8 (100.0%) | 0 (0.0%) |
| Graduate Degree | 0 (0.0%) | 0 (0.0%) |
| Total | 8 (100.0%) | 0 (0.0%) |
Employment Characteristics in Leon
Employment by Class of Employer in Leon
Among the 785 employed individuals in Leon, private company employees (501 | 63.8%), local government employees (171 | 21.8%), and not-for-profit organizations (53 | 6.8%) make up the most common classes of employment.
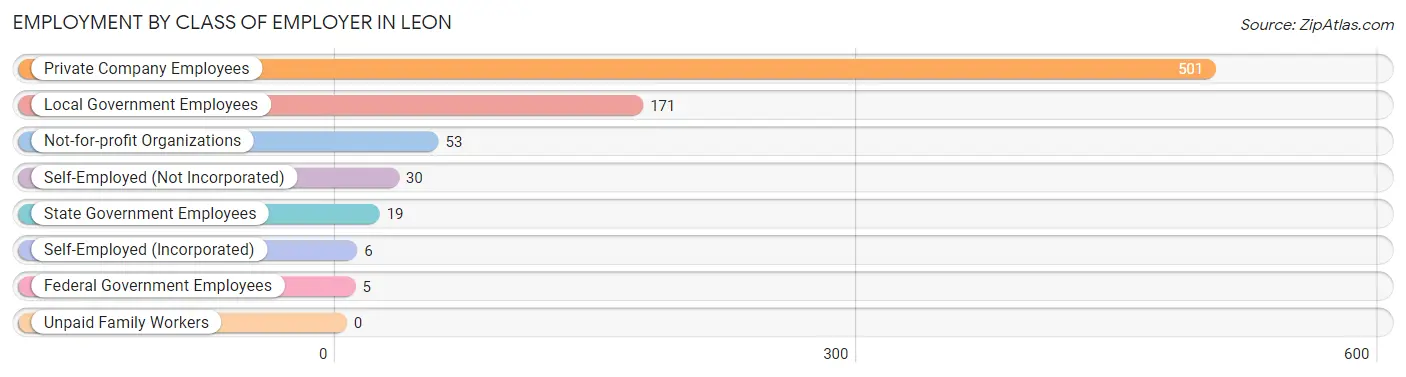
| Employer Class | # Employees | % Employees |
| Private Company Employees | 501 | 63.8% |
| Self-Employed (Incorporated) | 6 | 0.8% |
| Self-Employed (Not Incorporated) | 30 | 3.8% |
| Not-for-profit Organizations | 53 | 6.8% |
| Local Government Employees | 171 | 21.8% |
| State Government Employees | 19 | 2.4% |
| Federal Government Employees | 5 | 0.6% |
| Unpaid Family Workers | 0 | 0.0% |
| Total | 785 | 100.0% |
Employment Status by Age in Leon
According to the labor force statistics for Leon, out of the total population over 16 years of age (1,375), 58.0% or 798 individuals are in the labor force, with 1.4% or 11 of them unemployed. The age group with the highest labor force participation rate is 25 to 29 years, with 97.1% or 34 individuals in the labor force. Within the labor force, the 30 to 34 years age range has the highest percentage of unemployed individuals, with 20.4% or 10 of them being unemployed.
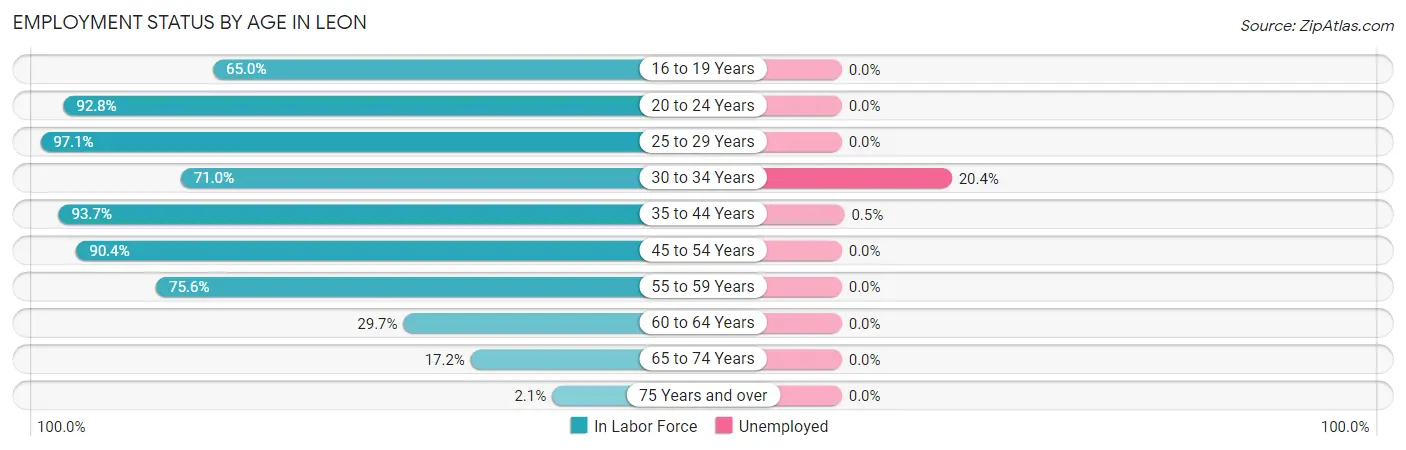
| Age Bracket | In Labor Force | Unemployed |
| 16 to 19 Years | 13 (65.0%) | 0 (0.0%) |
| 20 to 24 Years | 233 (92.8%) | 0 (0.0%) |
| 25 to 29 Years | 34 (97.1%) | 0 (0.0%) |
| 30 to 34 Years | 49 (71.0%) | 10 (20.4%) |
| 35 to 44 Years | 192 (93.7%) | 1 (0.5%) |
| 45 to 54 Years | 104 (90.4%) | 0 (0.0%) |
| 55 to 59 Years | 102 (75.6%) | 0 (0.0%) |
| 60 to 64 Years | 30 (29.7%) | 0 (0.0%) |
| 65 to 74 Years | 36 (17.2%) | 0 (0.0%) |
| 75 Years and over | 5 (2.1%) | 0 (0.0%) |
| Total | 798 (58.0%) | 11 (1.4%) |
Employment Status by Educational Attainment in Leon
According to labor force statistics for Leon, 77.4% of individuals (511) out of the total population between 25 and 64 years of age (660) are in the labor force, with 2.2% or 11 of them being unemployed. The group with the highest labor force participation rate are those with the educational attainment of college / associate degree, with 89.5% or 162 individuals in the labor force. Within the labor force, individuals with high school diploma education have the highest percentage of unemployment, with 4.5% or 11 of them being unemployed.
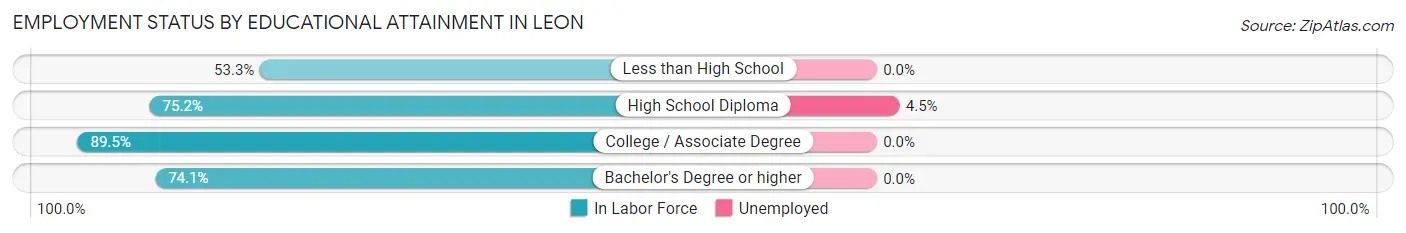
| Educational Attainment | In Labor Force | Unemployed |
| Less than High School | 24 (53.3%) | 0 (0.0%) |
| High School Diploma | 245 (75.2%) | 15 (4.5%) |
| College / Associate Degree | 162 (89.5%) | 0 (0.0%) |
| Bachelor's Degree or higher | 80 (74.1%) | 0 (0.0%) |
| Total | 511 (77.4%) | 15 (2.2%) |
Employment Occupations by Sex in Leon
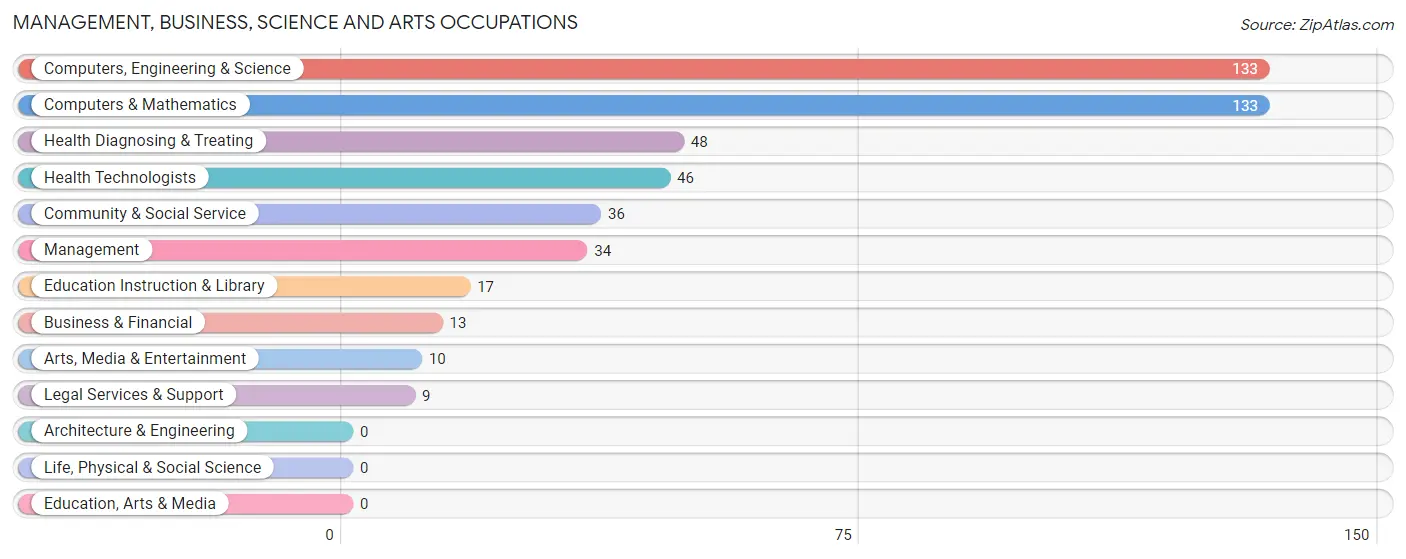
Management, Business, Science and Arts Occupations
The most common Management, Business, Science and Arts occupations in Leon are Computers, Engineering & Science (133 | 16.9%), Computers & Mathematics (133 | 16.9%), Health Diagnosing & Treating (48 | 6.1%), Health Technologists (46 | 5.8%), and Community & Social Service (36 | 4.6%).
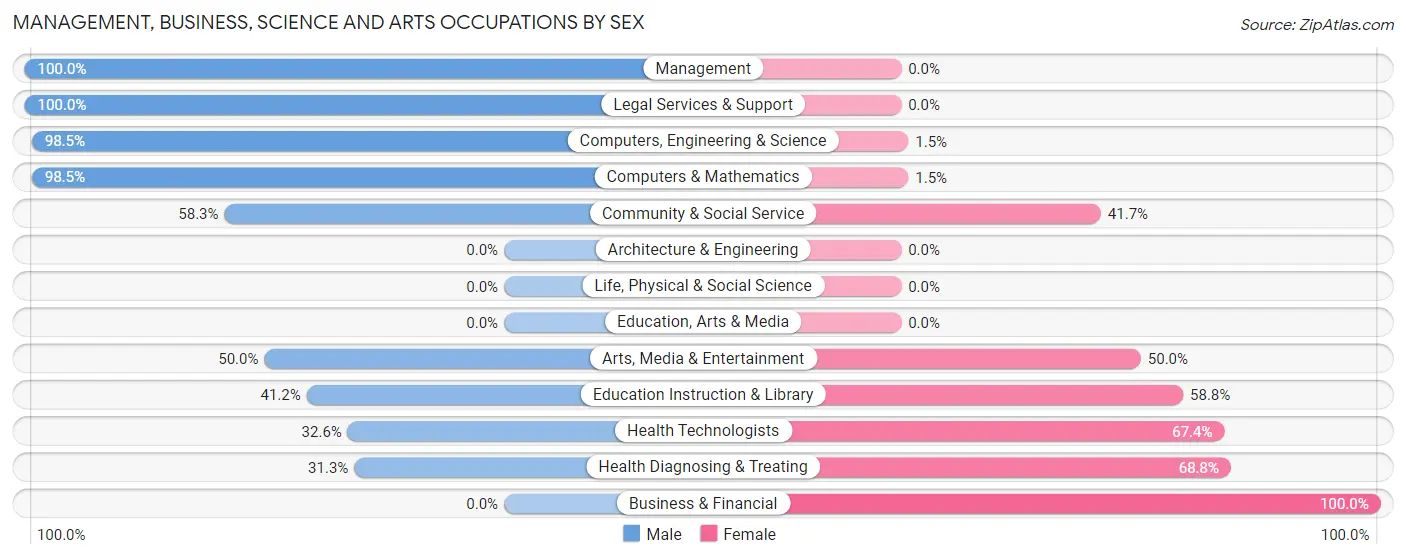
Management, Business, Science and Arts Occupations by Sex
Within the Management, Business, Science and Arts occupations in Leon, the most male-oriented occupations are Management (100.0%), Legal Services & Support (100.0%), and Computers, Engineering & Science (98.5%), while the most female-oriented occupations are Business & Financial (100.0%), Health Diagnosing & Treating (68.8%), and Health Technologists (67.4%).
| Occupation | Male | Female |
| Management | 34 (100.0%) | 0 (0.0%) |
| Business & Financial | 0 (0.0%) | 13 (100.0%) |
| Computers, Engineering & Science | 131 (98.5%) | 2 (1.5%) |
| Computers & Mathematics | 131 (98.5%) | 2 (1.5%) |
| Architecture & Engineering | 0 (0.0%) | 0 (0.0%) |
| Life, Physical & Social Science | 0 (0.0%) | 0 (0.0%) |
| Community & Social Service | 21 (58.3%) | 15 (41.7%) |
| Education, Arts & Media | 0 (0.0%) | 0 (0.0%) |
| Legal Services & Support | 9 (100.0%) | 0 (0.0%) |
| Education Instruction & Library | 7 (41.2%) | 10 (58.8%) |
| Arts, Media & Entertainment | 5 (50.0%) | 5 (50.0%) |
| Health Diagnosing & Treating | 15 (31.2%) | 33 (68.8%) |
| Health Technologists | 15 (32.6%) | 31 (67.4%) |
| Total (Category) | 201 (76.1%) | 63 (23.9%) |
| Total (Overall) | 449 (57.1%) | 338 (42.9%) |
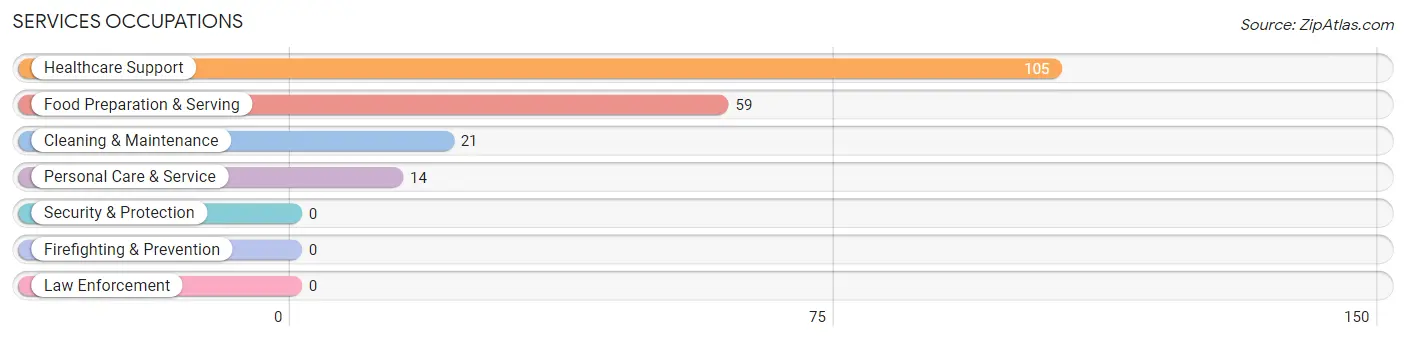
Services Occupations
The most common Services occupations in Leon are Healthcare Support (105 | 13.3%), Food Preparation & Serving (59 | 7.5%), Cleaning & Maintenance (21 | 2.7%), and Personal Care & Service (14 | 1.8%).
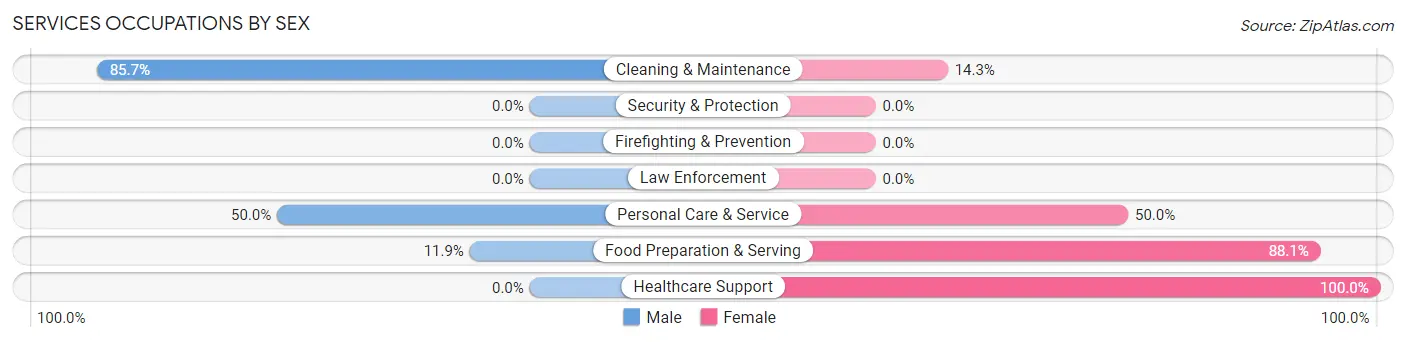
Services Occupations by Sex
Within the Services occupations in Leon, the most male-oriented occupations are Cleaning & Maintenance (85.7%), Personal Care & Service (50.0%), and Food Preparation & Serving (11.9%), while the most female-oriented occupations are Healthcare Support (100.0%), Food Preparation & Serving (88.1%), and Personal Care & Service (50.0%).
| Occupation | Male | Female |
| Healthcare Support | 0 (0.0%) | 105 (100.0%) |
| Security & Protection | 0 (0.0%) | 0 (0.0%) |
| Firefighting & Prevention | 0 (0.0%) | 0 (0.0%) |
| Law Enforcement | 0 (0.0%) | 0 (0.0%) |
| Food Preparation & Serving | 7 (11.9%) | 52 (88.1%) |
| Cleaning & Maintenance | 18 (85.7%) | 3 (14.3%) |
| Personal Care & Service | 7 (50.0%) | 7 (50.0%) |
| Total (Category) | 32 (16.1%) | 167 (83.9%) |
| Total (Overall) | 449 (57.1%) | 338 (42.9%) |
Sales and Office Occupations
The most common Sales and Office occupations in Leon are Sales & Related (44 | 5.6%), and Office & Administration (41 | 5.2%).
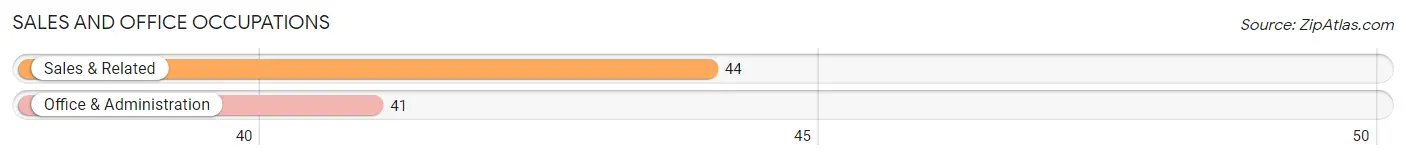
Sales and Office Occupations by Sex
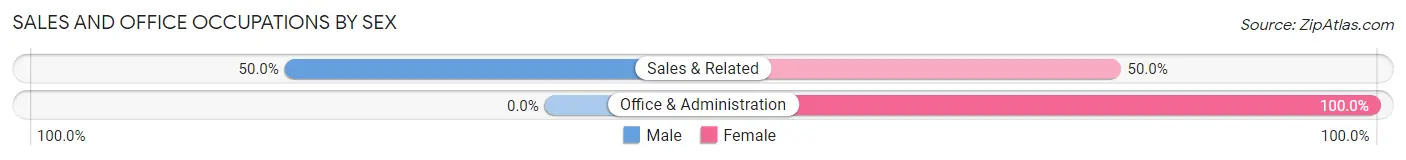
| Occupation | Male | Female |
| Sales & Related | 22 (50.0%) | 22 (50.0%) |
| Office & Administration | 0 (0.0%) | 41 (100.0%) |
| Total (Category) | 22 (25.9%) | 63 (74.1%) |
| Total (Overall) | 449 (57.1%) | 338 (42.9%) |
Natural Resources, Construction and Maintenance Occupations
The most common Natural Resources, Construction and Maintenance occupations in Leon are Construction & Extraction (48 | 6.1%), Installation, Maintenance & Repair (30 | 3.8%), and Farming, Fishing & Forestry (28 | 3.6%).
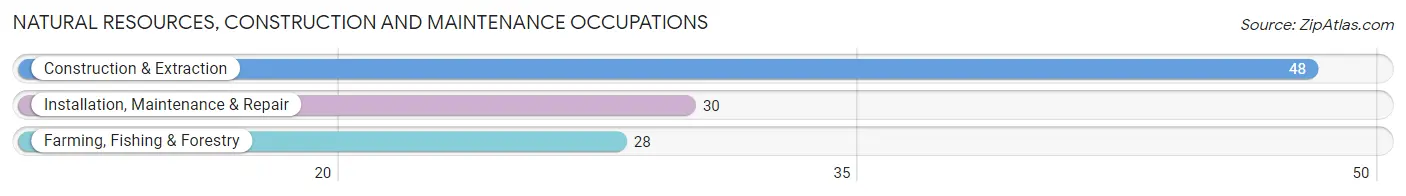
Natural Resources, Construction and Maintenance Occupations by Sex
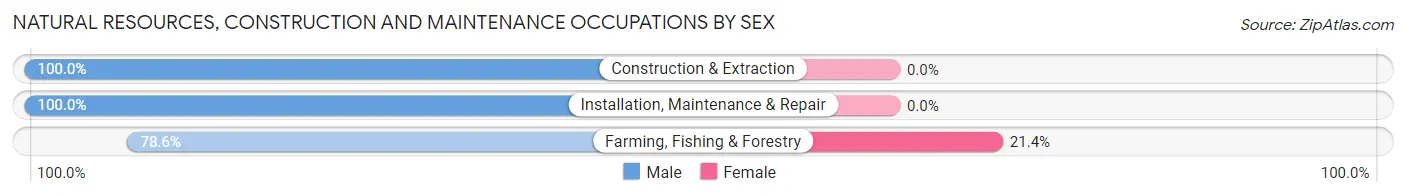
| Occupation | Male | Female |
| Farming, Fishing & Forestry | 22 (78.6%) | 6 (21.4%) |
| Construction & Extraction | 48 (100.0%) | 0 (0.0%) |
| Installation, Maintenance & Repair | 30 (100.0%) | 0 (0.0%) |
| Total (Category) | 100 (94.3%) | 6 (5.7%) |
| Total (Overall) | 449 (57.1%) | 338 (42.9%) |
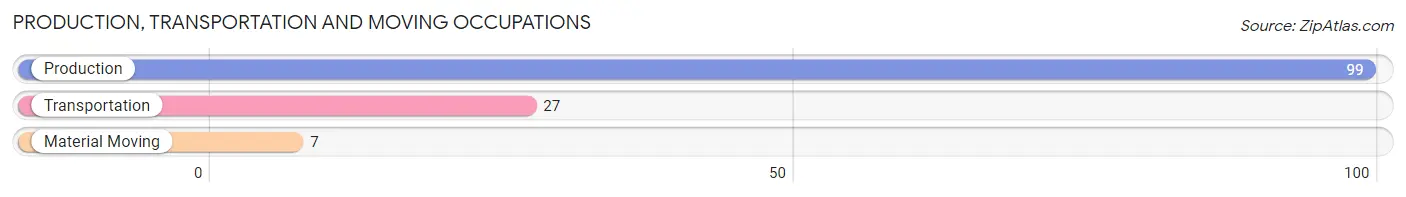
Production, Transportation and Moving Occupations
The most common Production, Transportation and Moving occupations in Leon are Production (99 | 12.6%), Transportation (27 | 3.4%), and Material Moving (7 | 0.9%).
Production, Transportation and Moving Occupations by Sex
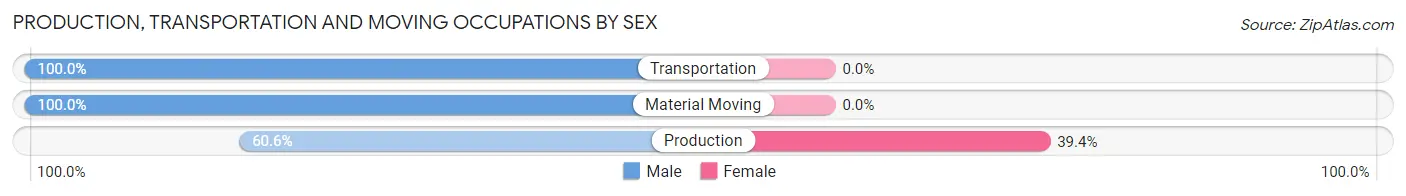
| Occupation | Male | Female |
| Production | 60 (60.6%) | 39 (39.4%) |
| Transportation | 27 (100.0%) | 0 (0.0%) |
| Material Moving | 7 (100.0%) | 0 (0.0%) |
| Total (Category) | 94 (70.7%) | 39 (29.3%) |
| Total (Overall) | 449 (57.1%) | 338 (42.9%) |
Employment Industries by Sex in Leon
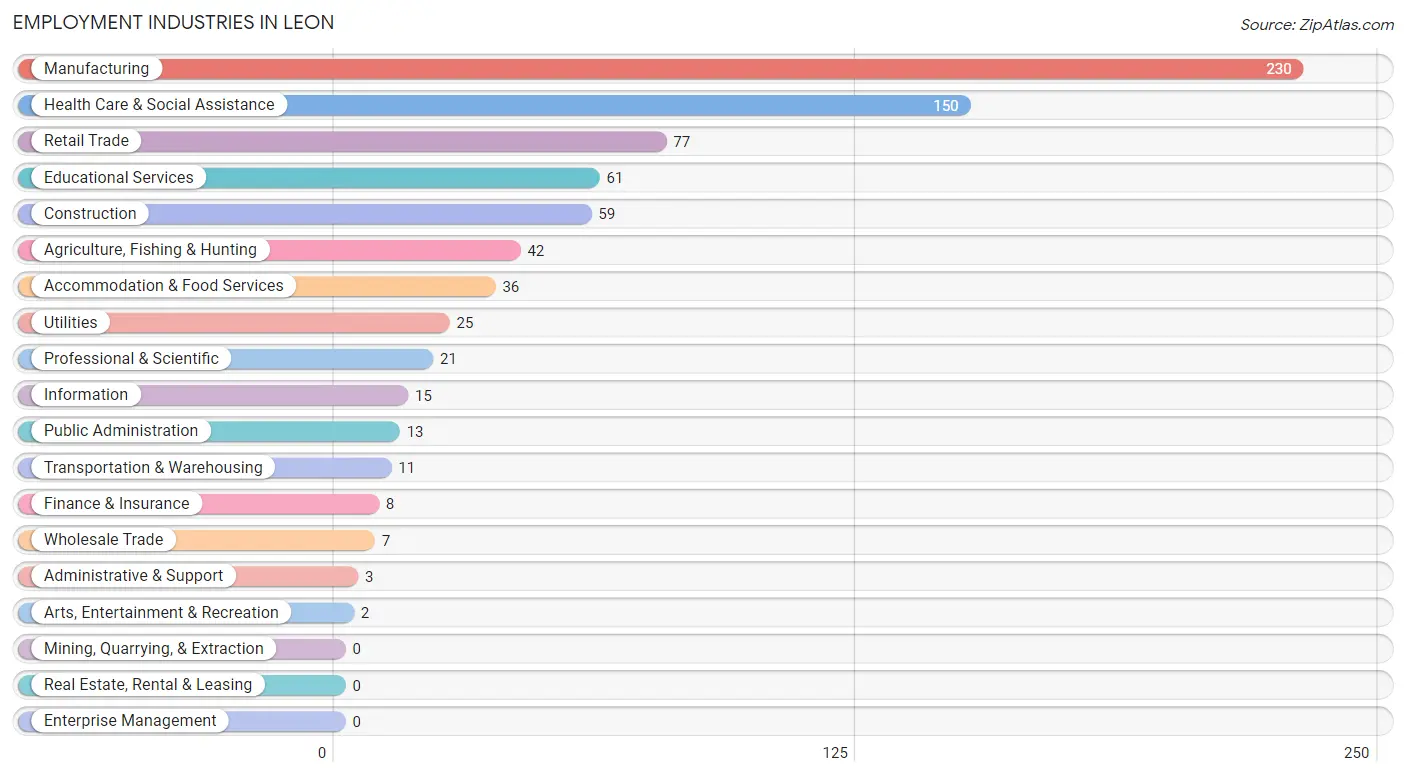
Employment Industries in Leon
The major employment industries in Leon include Manufacturing (230 | 29.2%), Health Care & Social Assistance (150 | 19.1%), Retail Trade (77 | 9.8%), Educational Services (61 | 7.7%), and Construction (59 | 7.5%).
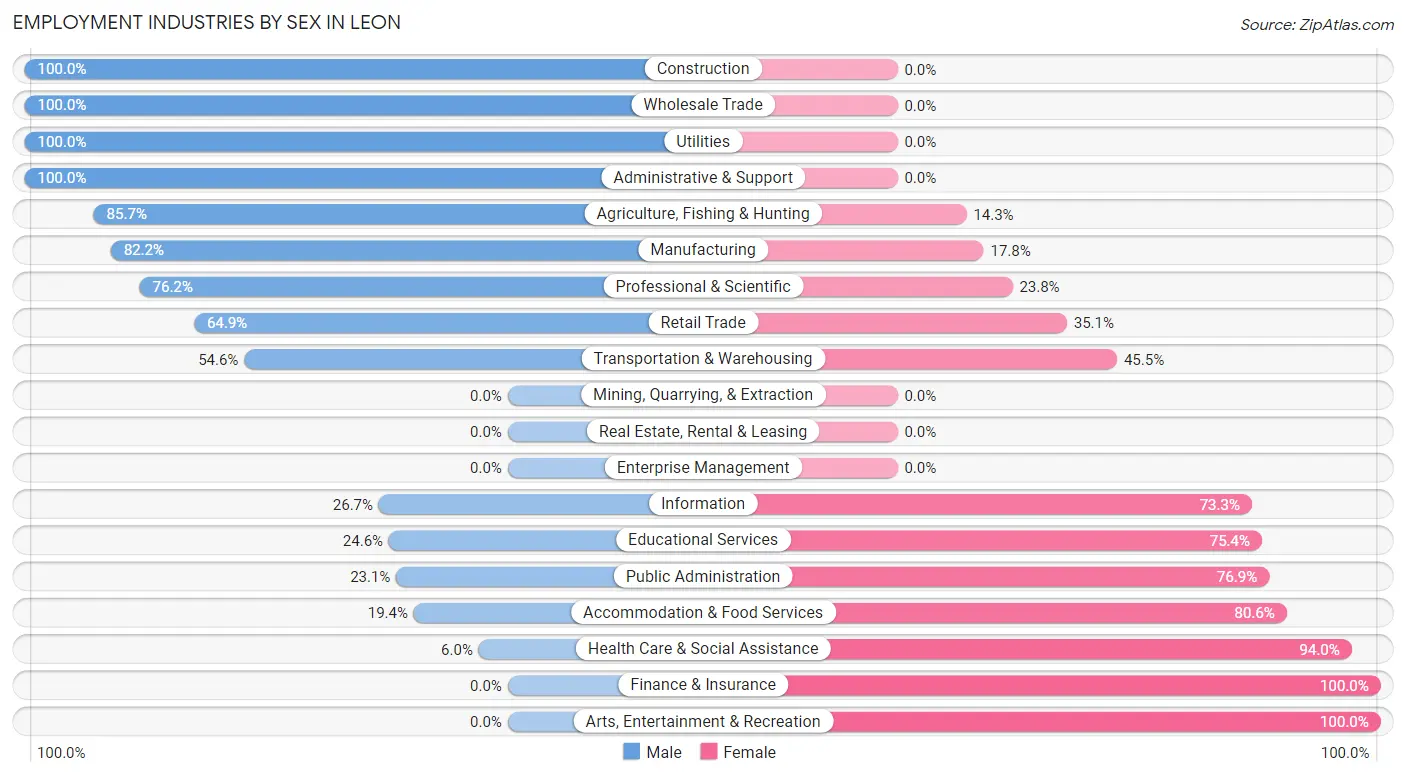
Employment Industries by Sex in Leon
The Leon industries that see more men than women are Construction (100.0%), Wholesale Trade (100.0%), and Utilities (100.0%), whereas the industries that tend to have a higher number of women are Finance & Insurance (100.0%), Arts, Entertainment & Recreation (100.0%), and Health Care & Social Assistance (94.0%).
| Industry | Male | Female |
| Agriculture, Fishing & Hunting | 36 (85.7%) | 6 (14.3%) |
| Mining, Quarrying, & Extraction | 0 (0.0%) | 0 (0.0%) |
| Construction | 59 (100.0%) | 0 (0.0%) |
| Manufacturing | 189 (82.2%) | 41 (17.8%) |
| Wholesale Trade | 7 (100.0%) | 0 (0.0%) |
| Retail Trade | 50 (64.9%) | 27 (35.1%) |
| Transportation & Warehousing | 6 (54.5%) | 5 (45.5%) |
| Utilities | 25 (100.0%) | 0 (0.0%) |
| Information | 4 (26.7%) | 11 (73.3%) |
| Finance & Insurance | 0 (0.0%) | 8 (100.0%) |
| Real Estate, Rental & Leasing | 0 (0.0%) | 0 (0.0%) |
| Professional & Scientific | 16 (76.2%) | 5 (23.8%) |
| Enterprise Management | 0 (0.0%) | 0 (0.0%) |
| Administrative & Support | 3 (100.0%) | 0 (0.0%) |
| Educational Services | 15 (24.6%) | 46 (75.4%) |
| Health Care & Social Assistance | 9 (6.0%) | 141 (94.0%) |
| Arts, Entertainment & Recreation | 0 (0.0%) | 2 (100.0%) |
| Accommodation & Food Services | 7 (19.4%) | 29 (80.6%) |
| Public Administration | 3 (23.1%) | 10 (76.9%) |
| Total | 449 (57.1%) | 338 (42.9%) |
Education in Leon
School Enrollment in Leon
The most common levels of schooling among the 380 students in Leon are middle school (95 | 25.0%), college / undergraduate (84 | 22.1%), and high school (83 | 21.8%).
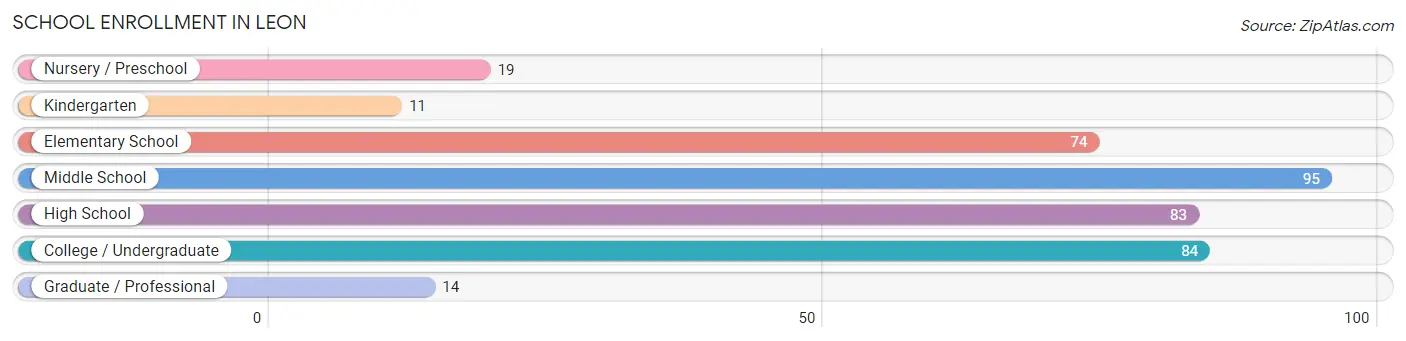
| School Level | # Students | % Students |
| Nursery / Preschool | 19 | 5.0% |
| Kindergarten | 11 | 2.9% |
| Elementary School | 74 | 19.5% |
| Middle School | 95 | 25.0% |
| High School | 83 | 21.8% |
| College / Undergraduate | 84 | 22.1% |
| Graduate / Professional | 14 | 3.7% |
| Total | 380 | 100.0% |
School Enrollment by Age by Funding Source in Leon
Out of a total of 380 students who are enrolled in schools in Leon, 31 (8.2%) attend a private institution, while the remaining 349 (91.8%) are enrolled in public schools. The age group of 25 to 34 year olds has the highest likelihood of being enrolled in private schools, with 14 (100.0% in the age bracket) enrolled. Conversely, the age group of 3 to 4 year olds has the lowest likelihood of being enrolled in a private school, with 19 (100.0% in the age bracket) attending a public institution.
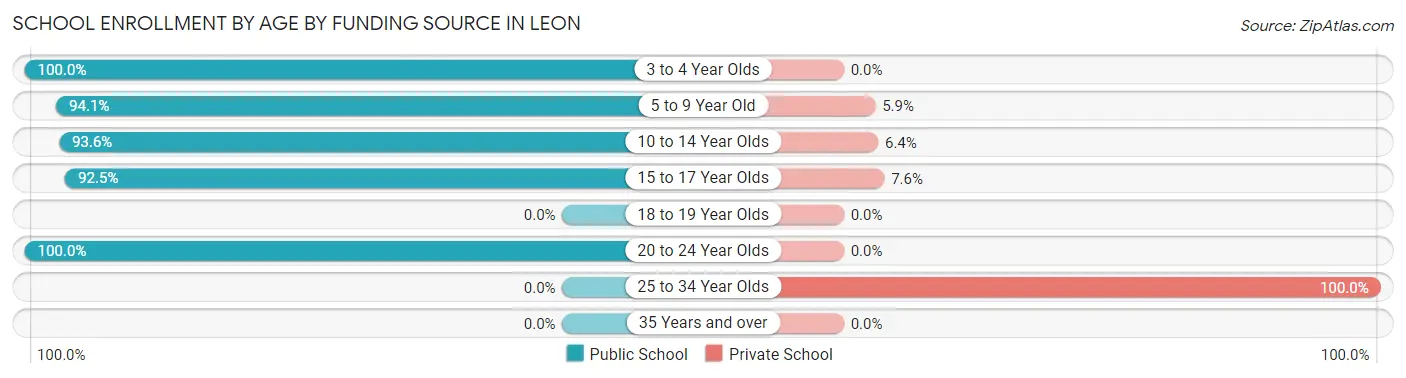
| Age Bracket | Public School | Private School |
| 3 to 4 Year Olds | 19 (100.0%) | 0 (0.0%) |
| 5 to 9 Year Old | 80 (94.1%) | 5 (5.9%) |
| 10 to 14 Year Olds | 117 (93.6%) | 8 (6.4%) |
| 15 to 17 Year Olds | 49 (92.4%) | 4 (7.5%) |
| 18 to 19 Year Olds | 0 (0.0%) | 0 (0.0%) |
| 20 to 24 Year Olds | 84 (100.0%) | 0 (0.0%) |
| 25 to 34 Year Olds | 0 (0.0%) | 14 (100.0%) |
| 35 Years and over | 0 (0.0%) | 0 (0.0%) |
| Total | 349 (91.8%) | 31 (8.2%) |
Educational Attainment by Field of Study in Leon
Education (63 | 29.3%), psychology (22 | 10.2%), business (21 | 9.8%), liberal arts & history (21 | 9.8%), and arts & humanities (20 | 9.3%) are the most common fields of study among 215 individuals in Leon who have obtained a bachelor's degree or higher.
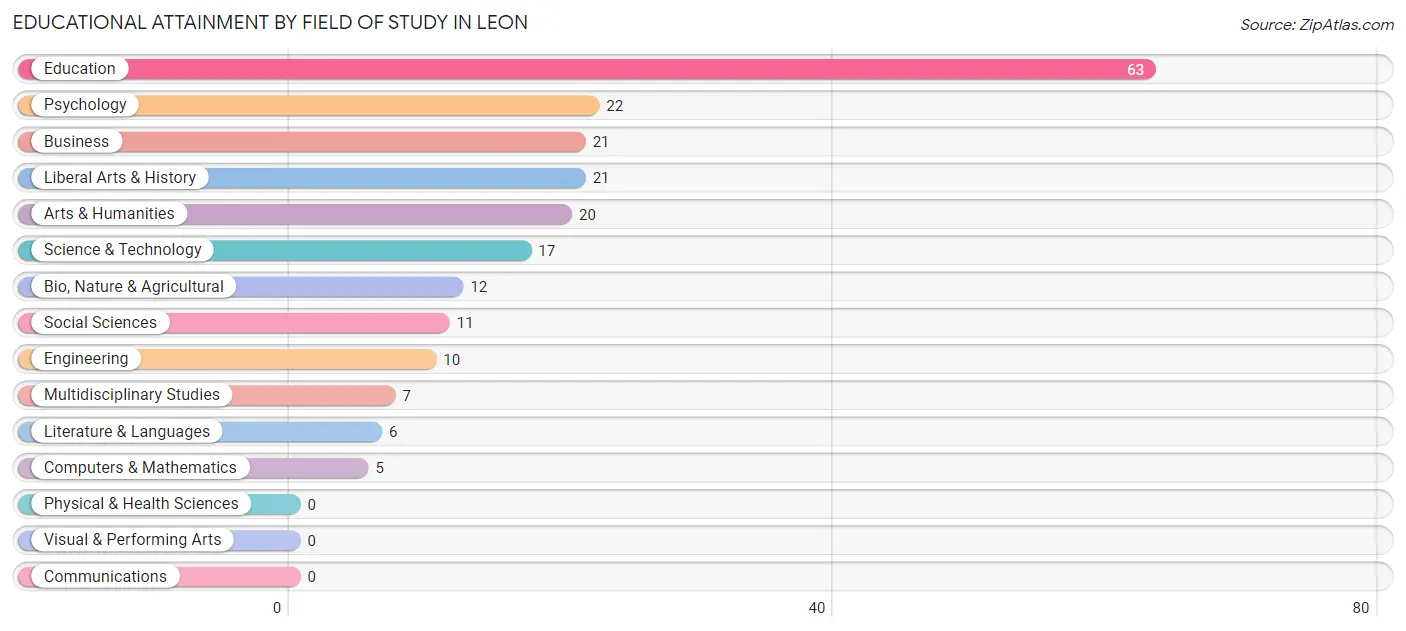
| Field of Study | # Graduates | % Graduates |
| Computers & Mathematics | 5 | 2.3% |
| Bio, Nature & Agricultural | 12 | 5.6% |
| Physical & Health Sciences | 0 | 0.0% |
| Psychology | 22 | 10.2% |
| Social Sciences | 11 | 5.1% |
| Engineering | 10 | 4.6% |
| Multidisciplinary Studies | 7 | 3.3% |
| Science & Technology | 17 | 7.9% |
| Business | 21 | 9.8% |
| Education | 63 | 29.3% |
| Literature & Languages | 6 | 2.8% |
| Liberal Arts & History | 21 | 9.8% |
| Visual & Performing Arts | 0 | 0.0% |
| Communications | 0 | 0.0% |
| Arts & Humanities | 20 | 9.3% |
| Total | 215 | 100.0% |
Transportation & Commute in Leon
Vehicle Availability by Sex in Leon
The most prevalent vehicle ownership categories in Leon are males with 2 vehicles (293, accounting for 65.5%) and females with 2 vehicles (166, making up 86.7%).
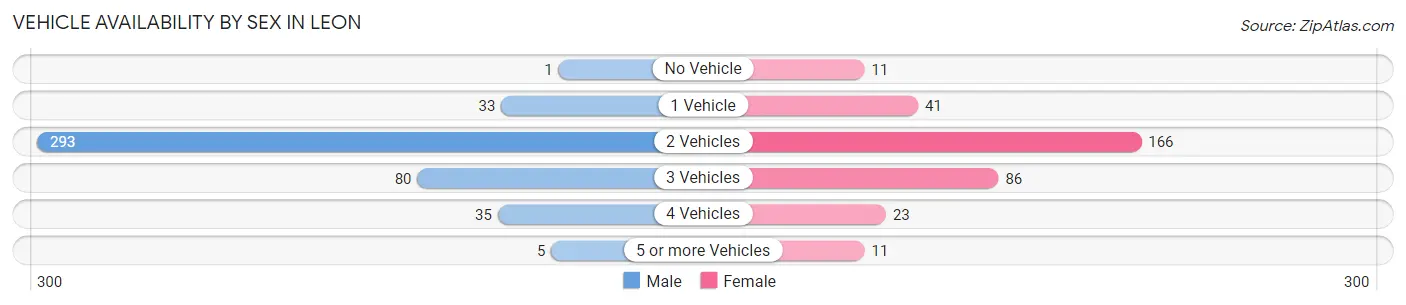
| Vehicles Available | Male | Female |
| No Vehicle | 1 (0.2%) | 11 (3.3%) |
| 1 Vehicle | 33 (7.4%) | 41 (12.1%) |
| 2 Vehicles | 293 (65.5%) | 166 (49.1%) |
| 3 Vehicles | 80 (17.9%) | 86 (25.4%) |
| 4 Vehicles | 35 (7.8%) | 23 (6.8%) |
| 5 or more Vehicles | 5 (1.1%) | 11 (3.3%) |
| Total | 447 (100.0%) | 338 (100.0%) |
Commute Time in Leon
The most frequently occuring commute durations in Leon are 30 to 34 minutes (202 commuters, 26.1%), 5 to 9 minutes (177 commuters, 22.9%), and less than 5 minutes (119 commuters, 15.4%).
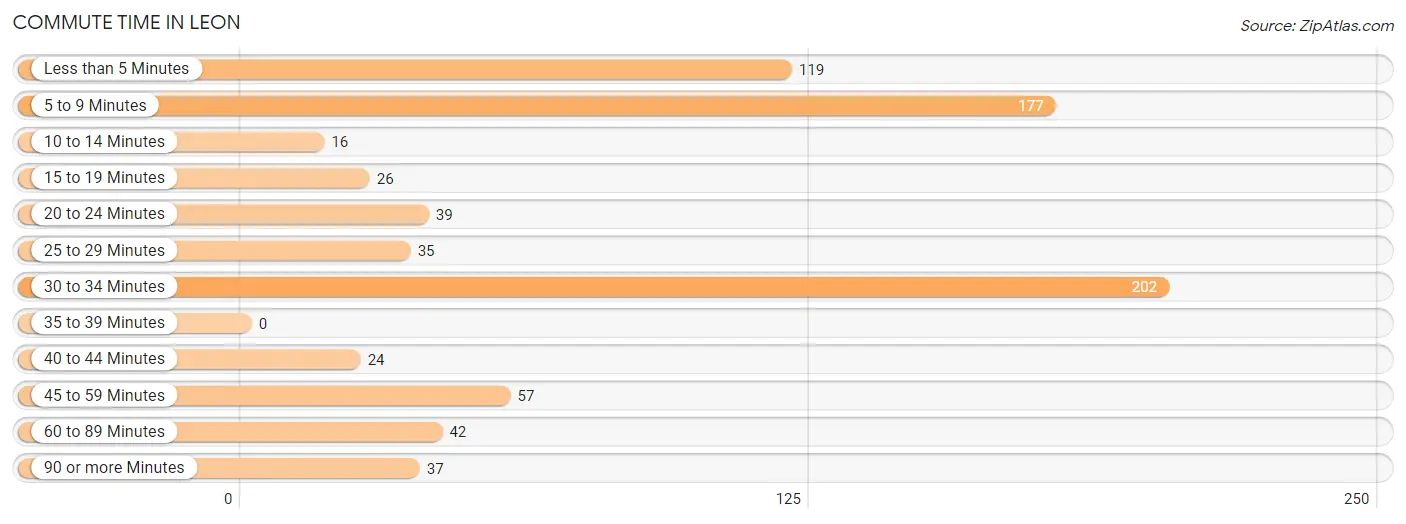
| Commute Time | # Commuters | % Commuters |
| Less than 5 Minutes | 119 | 15.4% |
| 5 to 9 Minutes | 177 | 22.9% |
| 10 to 14 Minutes | 16 | 2.1% |
| 15 to 19 Minutes | 26 | 3.4% |
| 20 to 24 Minutes | 39 | 5.0% |
| 25 to 29 Minutes | 35 | 4.5% |
| 30 to 34 Minutes | 202 | 26.1% |
| 35 to 39 Minutes | 0 | 0.0% |
| 40 to 44 Minutes | 24 | 3.1% |
| 45 to 59 Minutes | 57 | 7.4% |
| 60 to 89 Minutes | 42 | 5.4% |
| 90 or more Minutes | 37 | 4.8% |
Commute Time by Sex in Leon
The most common commute times in Leon are 30 to 34 minutes (190 commuters, 42.5%) for males and 5 to 9 minutes (105 commuters, 32.1%) for females.
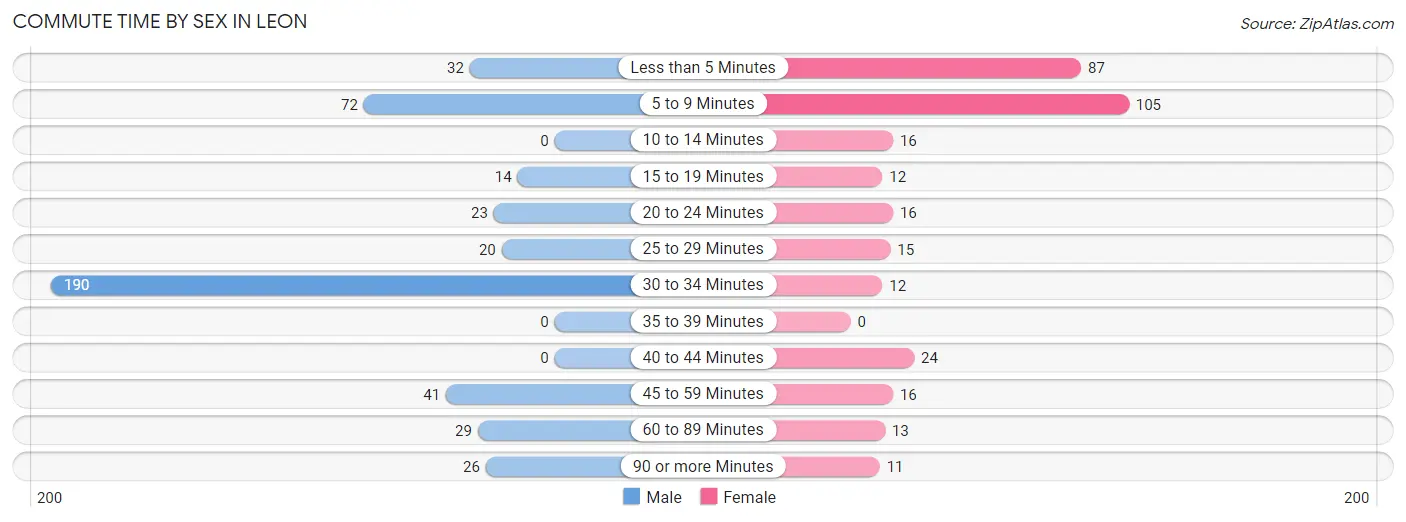
| Commute Time | Male | Female |
| Less than 5 Minutes | 32 (7.2%) | 87 (26.6%) |
| 5 to 9 Minutes | 72 (16.1%) | 105 (32.1%) |
| 10 to 14 Minutes | 0 (0.0%) | 16 (4.9%) |
| 15 to 19 Minutes | 14 (3.1%) | 12 (3.7%) |
| 20 to 24 Minutes | 23 (5.1%) | 16 (4.9%) |
| 25 to 29 Minutes | 20 (4.5%) | 15 (4.6%) |
| 30 to 34 Minutes | 190 (42.5%) | 12 (3.7%) |
| 35 to 39 Minutes | 0 (0.0%) | 0 (0.0%) |
| 40 to 44 Minutes | 0 (0.0%) | 24 (7.3%) |
| 45 to 59 Minutes | 41 (9.2%) | 16 (4.9%) |
| 60 to 89 Minutes | 29 (6.5%) | 13 (4.0%) |
| 90 or more Minutes | 26 (5.8%) | 11 (3.4%) |
Time of Departure to Work by Sex in Leon
The most frequent times of departure to work in Leon are 7:30 AM to 7:59 AM (144, 32.2%) for males and 6:30 AM to 6:59 AM (98, 30.0%) for females.
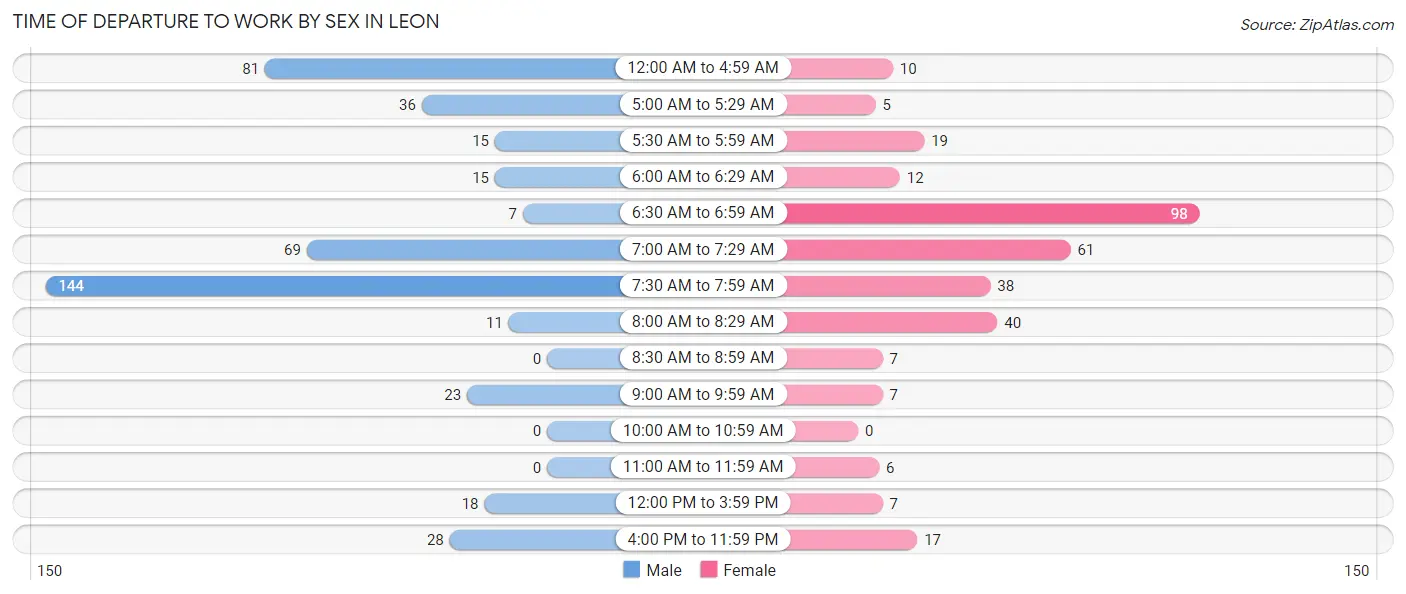
| Time of Departure | Male | Female |
| 12:00 AM to 4:59 AM | 81 (18.1%) | 10 (3.1%) |
| 5:00 AM to 5:29 AM | 36 (8.1%) | 5 (1.5%) |
| 5:30 AM to 5:59 AM | 15 (3.4%) | 19 (5.8%) |
| 6:00 AM to 6:29 AM | 15 (3.4%) | 12 (3.7%) |
| 6:30 AM to 6:59 AM | 7 (1.6%) | 98 (30.0%) |
| 7:00 AM to 7:29 AM | 69 (15.4%) | 61 (18.6%) |
| 7:30 AM to 7:59 AM | 144 (32.2%) | 38 (11.6%) |
| 8:00 AM to 8:29 AM | 11 (2.5%) | 40 (12.2%) |
| 8:30 AM to 8:59 AM | 0 (0.0%) | 7 (2.1%) |
| 9:00 AM to 9:59 AM | 23 (5.1%) | 7 (2.1%) |
| 10:00 AM to 10:59 AM | 0 (0.0%) | 0 (0.0%) |
| 11:00 AM to 11:59 AM | 0 (0.0%) | 6 (1.8%) |
| 12:00 PM to 3:59 PM | 18 (4.0%) | 7 (2.1%) |
| 4:00 PM to 11:59 PM | 28 (6.3%) | 17 (5.2%) |
| Total | 447 (100.0%) | 327 (100.0%) |
Housing Occupancy in Leon
Occupancy by Ownership in Leon
Of the total 788 dwellings in Leon, owner-occupied units account for 394 (50.0%), while renter-occupied units make up 394 (50.0%).
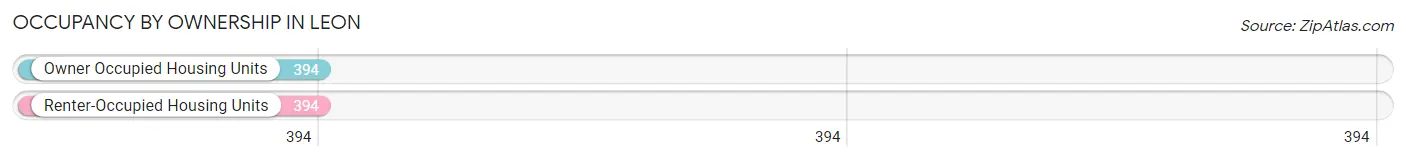
| Occupancy | # Housing Units | % Housing Units |
| Owner Occupied Housing Units | 394 | 50.0% |
| Renter-Occupied Housing Units | 394 | 50.0% |
| Total Occupied Housing Units | 788 | 100.0% |
Occupancy by Household Size in Leon
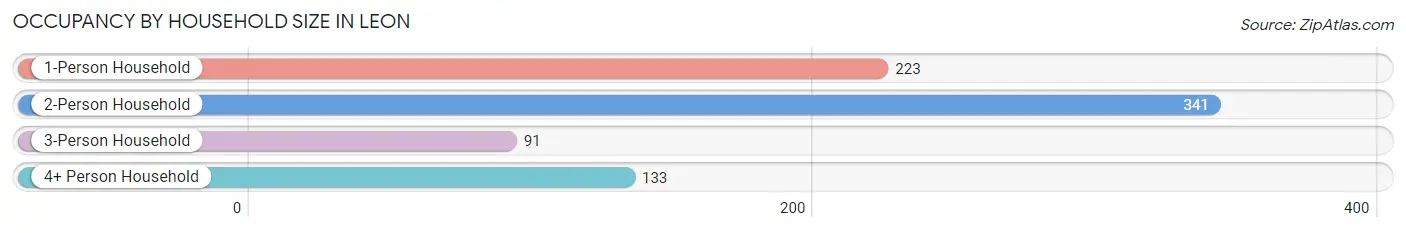
| Household Size | # Housing Units | % Housing Units |
| 1-Person Household | 223 | 28.3% |
| 2-Person Household | 341 | 43.3% |
| 3-Person Household | 91 | 11.6% |
| 4+ Person Household | 133 | 16.9% |
| Total Housing Units | 788 | 100.0% |
Occupancy by Ownership by Household Size in Leon
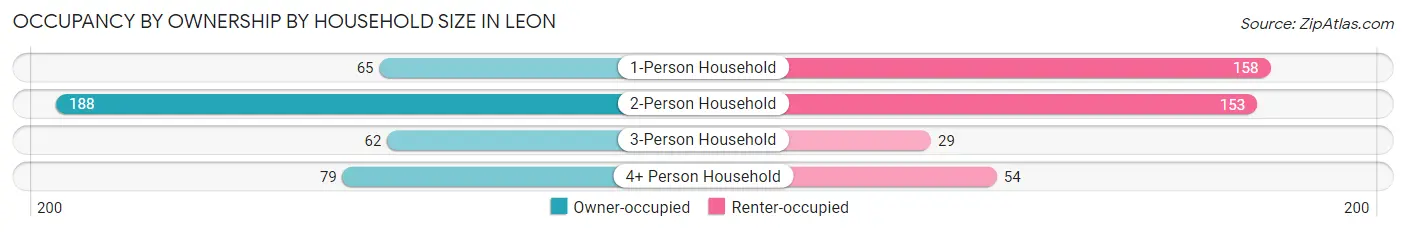
| Household Size | Owner-occupied | Renter-occupied |
| 1-Person Household | 65 (29.1%) | 158 (70.9%) |
| 2-Person Household | 188 (55.1%) | 153 (44.9%) |
| 3-Person Household | 62 (68.1%) | 29 (31.9%) |
| 4+ Person Household | 79 (59.4%) | 54 (40.6%) |
| Total Housing Units | 394 (50.0%) | 394 (50.0%) |
Occupancy by Educational Attainment in Leon
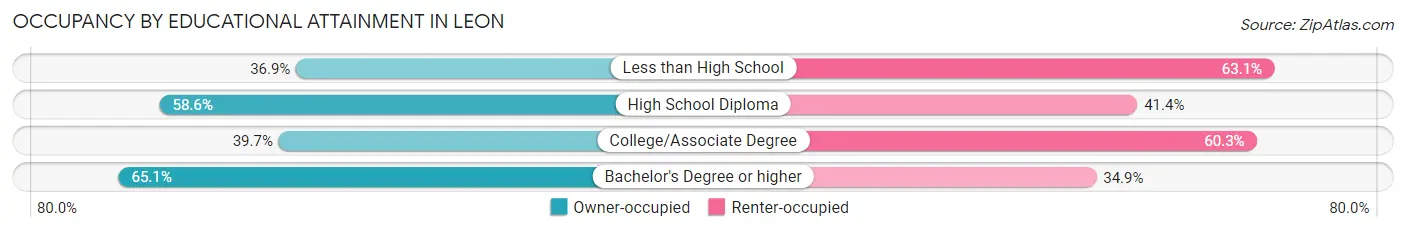
| Household Size | Owner-occupied | Renter-occupied |
| Less than High School | 24 (36.9%) | 41 (63.1%) |
| High School Diploma | 174 (58.6%) | 123 (41.4%) |
| College/Associate Degree | 127 (39.7%) | 193 (60.3%) |
| Bachelor's Degree or higher | 69 (65.1%) | 37 (34.9%) |
Occupancy by Age of Householder in Leon
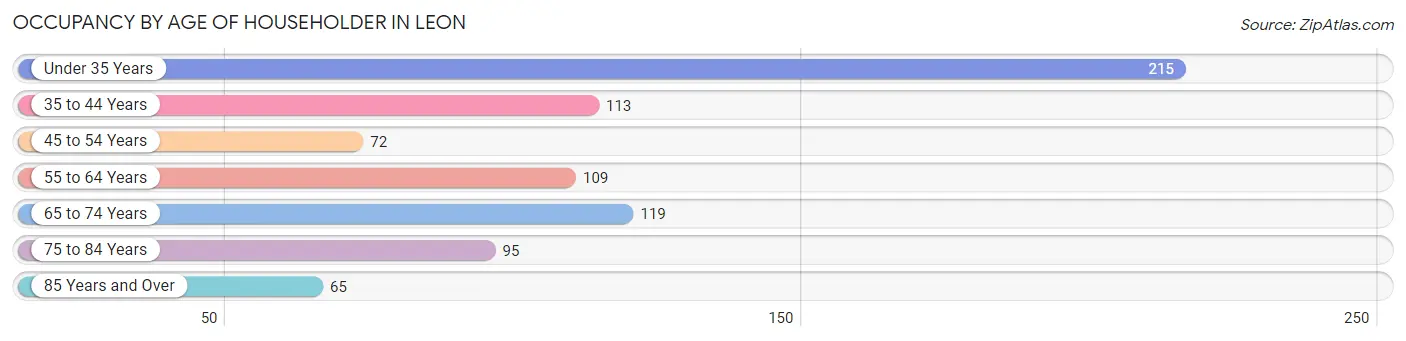
| Age Bracket | # Households | % Households |
| Under 35 Years | 215 | 27.3% |
| 35 to 44 Years | 113 | 14.3% |
| 45 to 54 Years | 72 | 9.1% |
| 55 to 64 Years | 109 | 13.8% |
| 65 to 74 Years | 119 | 15.1% |
| 75 to 84 Years | 95 | 12.1% |
| 85 Years and Over | 65 | 8.3% |
| Total | 788 | 100.0% |
Housing Finances in Leon
Median Income by Occupancy in Leon
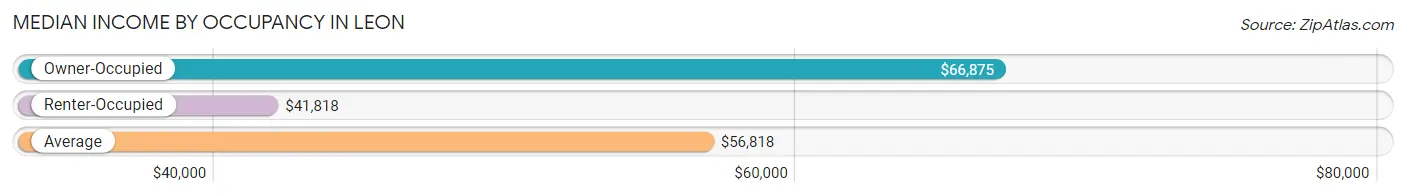
| Occupancy Type | # Households | Median Income |
| Owner-Occupied | 394 (50.0%) | $66,875 |
| Renter-Occupied | 394 (50.0%) | $41,818 |
| Average | 788 (100.0%) | $56,818 |
Occupancy by Householder Income Bracket in Leon
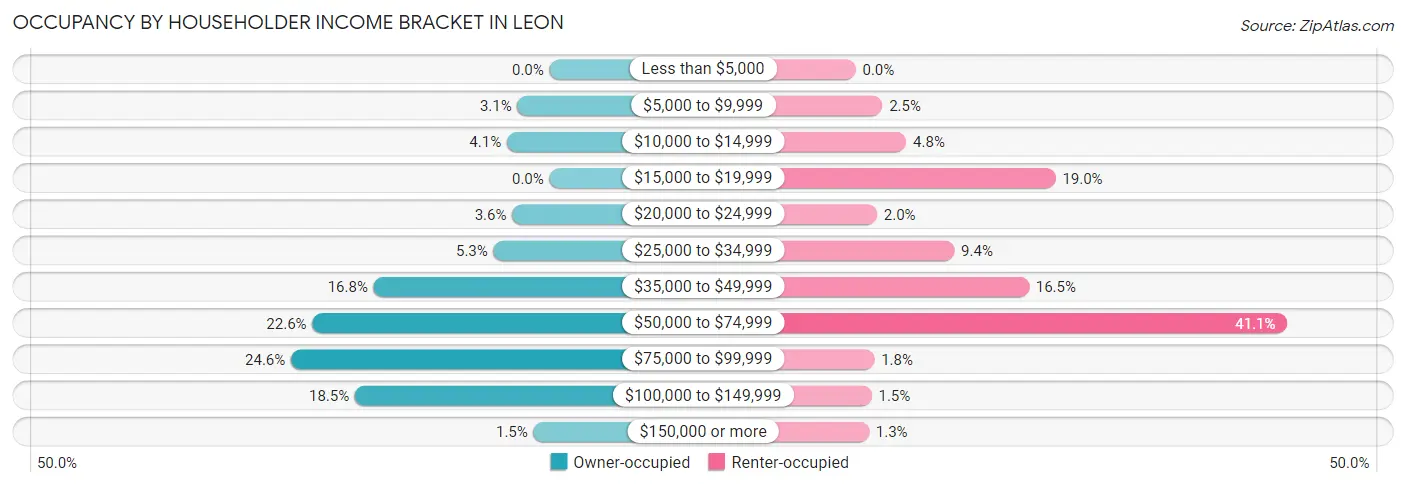
| Income Bracket | Owner-occupied | Renter-occupied |
| Less than $5,000 | 0 (0.0%) | 0 (0.0%) |
| $5,000 to $9,999 | 12 (3.0%) | 10 (2.5%) |
| $10,000 to $14,999 | 16 (4.1%) | 19 (4.8%) |
| $15,000 to $19,999 | 0 (0.0%) | 75 (19.0%) |
| $20,000 to $24,999 | 14 (3.5%) | 8 (2.0%) |
| $25,000 to $34,999 | 21 (5.3%) | 37 (9.4%) |
| $35,000 to $49,999 | 66 (16.8%) | 65 (16.5%) |
| $50,000 to $74,999 | 89 (22.6%) | 162 (41.1%) |
| $75,000 to $99,999 | 97 (24.6%) | 7 (1.8%) |
| $100,000 to $149,999 | 73 (18.5%) | 6 (1.5%) |
| $150,000 or more | 6 (1.5%) | 5 (1.3%) |
| Total | 394 (100.0%) | 394 (100.0%) |
Monthly Housing Cost Tiers in Leon
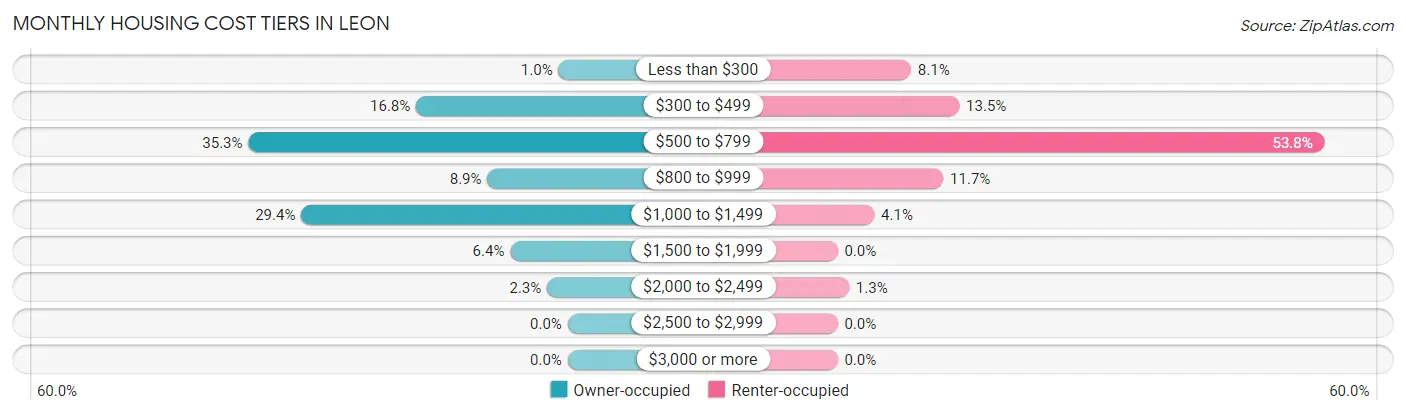
| Monthly Cost | Owner-occupied | Renter-occupied |
| Less than $300 | 4 (1.0%) | 32 (8.1%) |
| $300 to $499 | 66 (16.8%) | 53 (13.5%) |
| $500 to $799 | 139 (35.3%) | 212 (53.8%) |
| $800 to $999 | 35 (8.9%) | 46 (11.7%) |
| $1,000 to $1,499 | 116 (29.4%) | 16 (4.1%) |
| $1,500 to $1,999 | 25 (6.4%) | 0 (0.0%) |
| $2,000 to $2,499 | 9 (2.3%) | 5 (1.3%) |
| $2,500 to $2,999 | 0 (0.0%) | 0 (0.0%) |
| $3,000 or more | 0 (0.0%) | 0 (0.0%) |
| Total | 394 (100.0%) | 394 (100.0%) |
Physical Housing Characteristics in Leon
Housing Structures in Leon
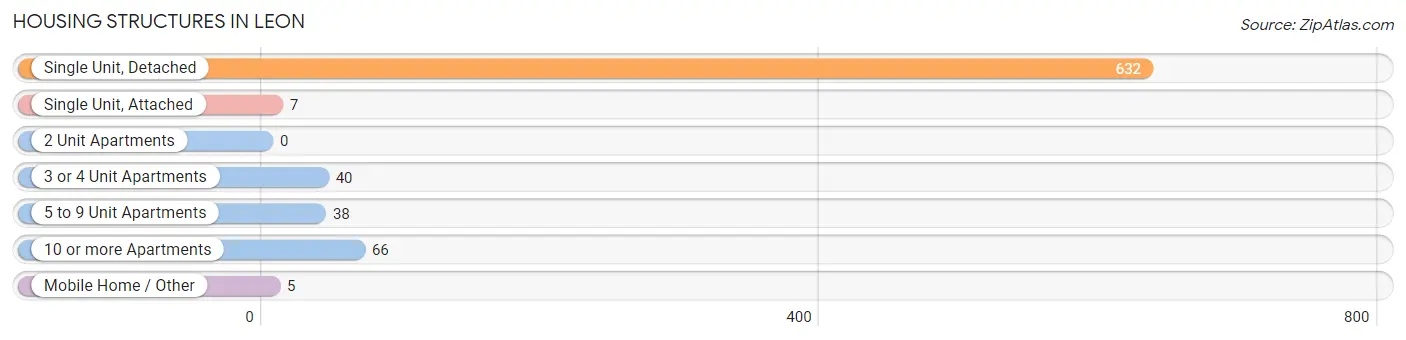
| Structure Type | # Housing Units | % Housing Units |
| Single Unit, Detached | 632 | 80.2% |
| Single Unit, Attached | 7 | 0.9% |
| 2 Unit Apartments | 0 | 0.0% |
| 3 or 4 Unit Apartments | 40 | 5.1% |
| 5 to 9 Unit Apartments | 38 | 4.8% |
| 10 or more Apartments | 66 | 8.4% |
| Mobile Home / Other | 5 | 0.6% |
| Total | 788 | 100.0% |
Housing Structures by Occupancy in Leon
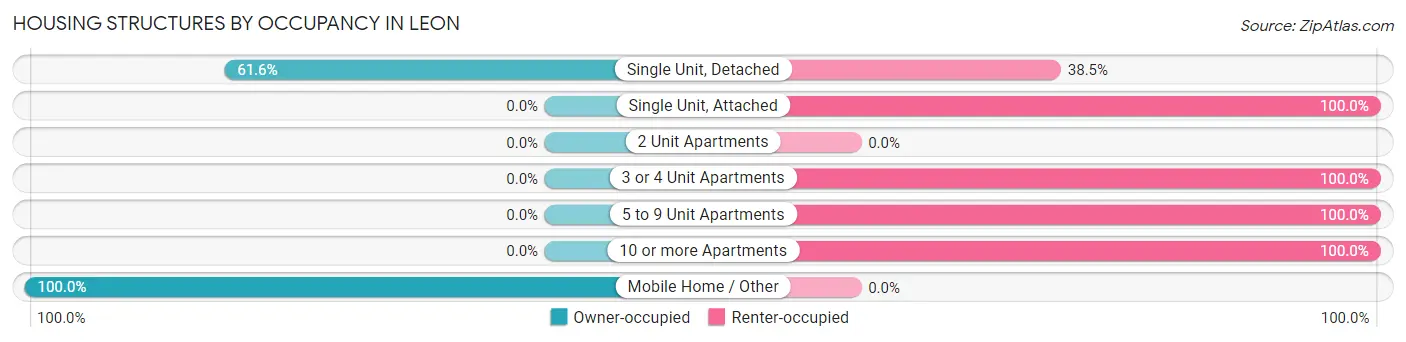
| Structure Type | Owner-occupied | Renter-occupied |
| Single Unit, Detached | 389 (61.6%) | 243 (38.5%) |
| Single Unit, Attached | 0 (0.0%) | 7 (100.0%) |
| 2 Unit Apartments | 0 (0.0%) | 0 (0.0%) |
| 3 or 4 Unit Apartments | 0 (0.0%) | 40 (100.0%) |
| 5 to 9 Unit Apartments | 0 (0.0%) | 38 (100.0%) |
| 10 or more Apartments | 0 (0.0%) | 66 (100.0%) |
| Mobile Home / Other | 5 (100.0%) | 0 (0.0%) |
| Total | 394 (50.0%) | 394 (50.0%) |
Housing Structures by Number of Rooms in Leon
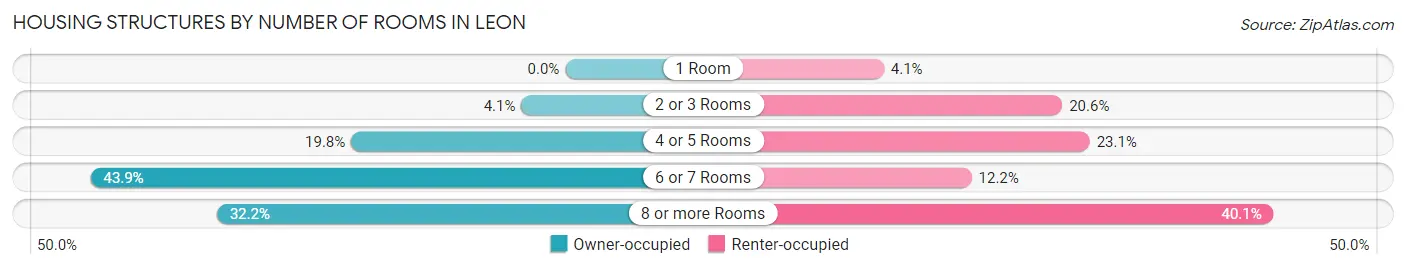
| Number of Rooms | Owner-occupied | Renter-occupied |
| 1 Room | 0 (0.0%) | 16 (4.1%) |
| 2 or 3 Rooms | 16 (4.1%) | 81 (20.6%) |
| 4 or 5 Rooms | 78 (19.8%) | 91 (23.1%) |
| 6 or 7 Rooms | 173 (43.9%) | 48 (12.2%) |
| 8 or more Rooms | 127 (32.2%) | 158 (40.1%) |
| Total | 394 (100.0%) | 394 (100.0%) |
Housing Structure by Heating Type in Leon
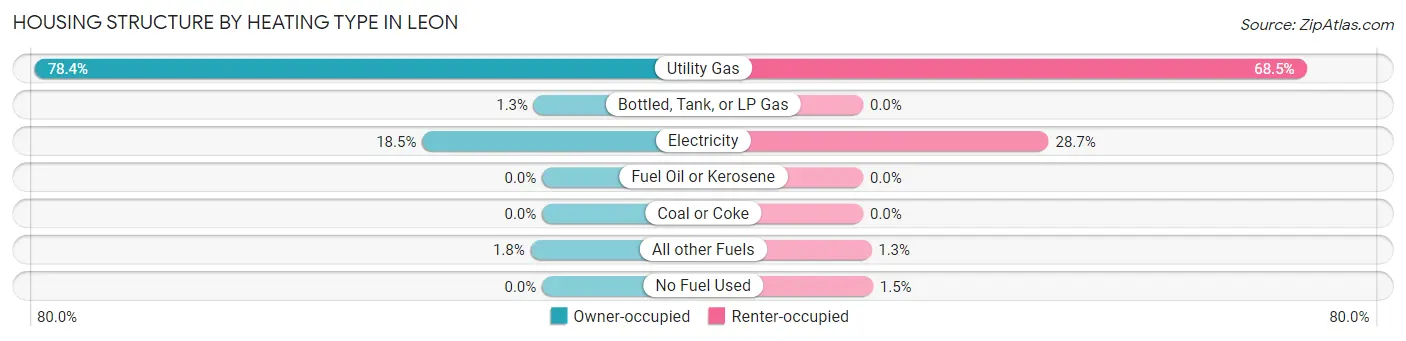
| Heating Type | Owner-occupied | Renter-occupied |
| Utility Gas | 309 (78.4%) | 270 (68.5%) |
| Bottled, Tank, or LP Gas | 5 (1.3%) | 0 (0.0%) |
| Electricity | 73 (18.5%) | 113 (28.7%) |
| Fuel Oil or Kerosene | 0 (0.0%) | 0 (0.0%) |
| Coal or Coke | 0 (0.0%) | 0 (0.0%) |
| All other Fuels | 7 (1.8%) | 5 (1.3%) |
| No Fuel Used | 0 (0.0%) | 6 (1.5%) |
| Total | 394 (100.0%) | 394 (100.0%) |
Household Vehicle Usage in Leon
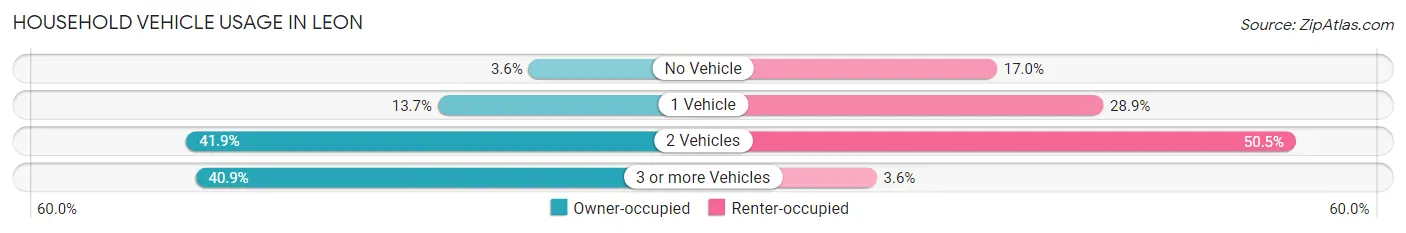
| Vehicles per Household | Owner-occupied | Renter-occupied |
| No Vehicle | 14 (3.5%) | 67 (17.0%) |
| 1 Vehicle | 54 (13.7%) | 114 (28.9%) |
| 2 Vehicles | 165 (41.9%) | 199 (50.5%) |
| 3 or more Vehicles | 161 (40.9%) | 14 (3.5%) |
| Total | 394 (100.0%) | 394 (100.0%) |
Real Estate & Mortgages in Leon
Real Estate and Mortgage Overview in Leon
| Characteristic | Without Mortgage | With Mortgage |
| Housing Units | 203 | 191 |
| Median Property Value | $70,300 | $86,900 |
| Median Household Income | $49,750 | $0 |
| Monthly Housing Costs | $542 | $0 |
| Real Estate Taxes | $1,618 | $0 |
Property Value by Mortgage Status in Leon
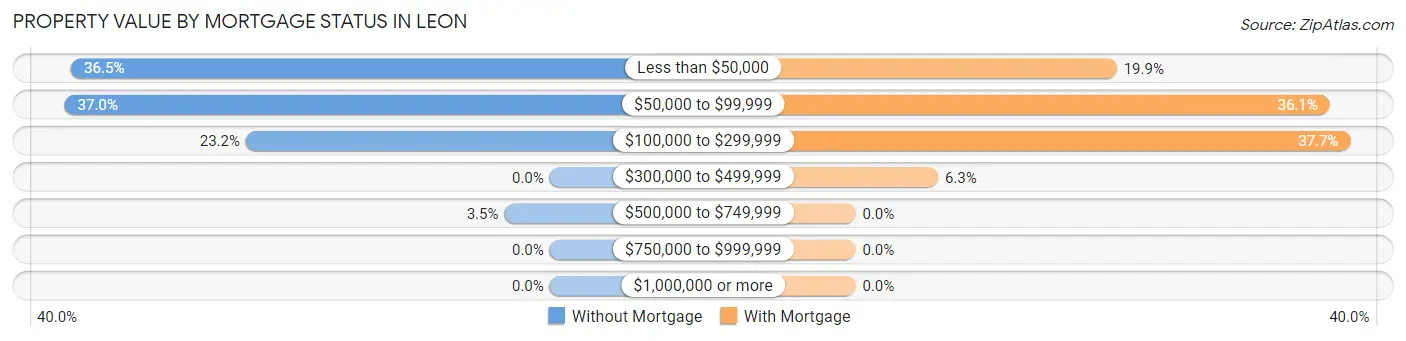
| Property Value | Without Mortgage | With Mortgage |
| Less than $50,000 | 74 (36.4%) | 38 (19.9%) |
| $50,000 to $99,999 | 75 (36.9%) | 69 (36.1%) |
| $100,000 to $299,999 | 47 (23.2%) | 72 (37.7%) |
| $300,000 to $499,999 | 0 (0.0%) | 12 (6.3%) |
| $500,000 to $749,999 | 7 (3.5%) | 0 (0.0%) |
| $750,000 to $999,999 | 0 (0.0%) | 0 (0.0%) |
| $1,000,000 or more | 0 (0.0%) | 0 (0.0%) |
| Total | 203 (100.0%) | 191 (100.0%) |
Household Income by Mortgage Status in Leon
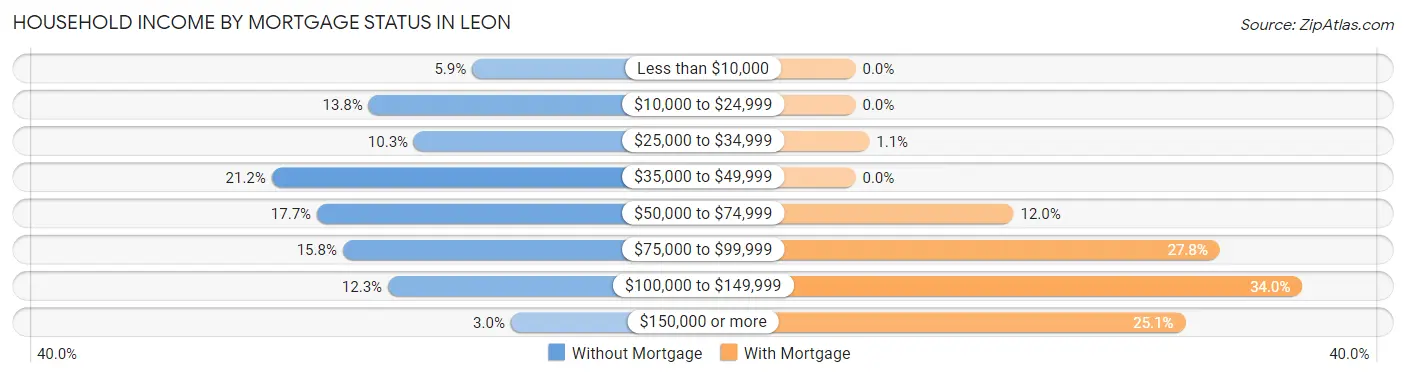
| Household Income | Without Mortgage | With Mortgage |
| Less than $10,000 | 12 (5.9%) | 0 (0.0%) |
| $10,000 to $24,999 | 28 (13.8%) | 0 (0.0%) |
| $25,000 to $34,999 | 21 (10.3%) | 2 (1.1%) |
| $35,000 to $49,999 | 43 (21.2%) | 0 (0.0%) |
| $50,000 to $74,999 | 36 (17.7%) | 23 (12.0%) |
| $75,000 to $99,999 | 32 (15.8%) | 53 (27.8%) |
| $100,000 to $149,999 | 25 (12.3%) | 65 (34.0%) |
| $150,000 or more | 6 (3.0%) | 48 (25.1%) |
| Total | 203 (100.0%) | 191 (100.0%) |
Property Value to Household Income Ratio in Leon
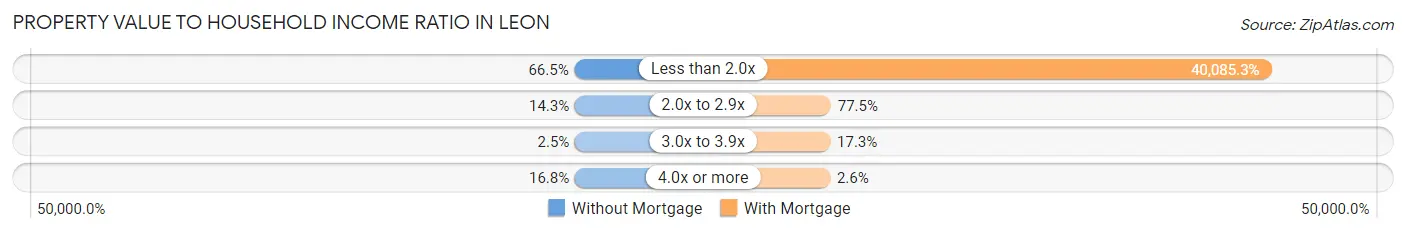
| Value-to-Income Ratio | Without Mortgage | With Mortgage |
| Less than 2.0x | 135 (66.5%) | 76,563 (40,085.3%) |
| 2.0x to 2.9x | 29 (14.3%) | 148 (77.5%) |
| 3.0x to 3.9x | 5 (2.5%) | 33 (17.3%) |
| 4.0x or more | 34 (16.8%) | 5 (2.6%) |
| Total | 203 (100.0%) | 191 (100.0%) |
Real Estate Taxes by Mortgage Status in Leon
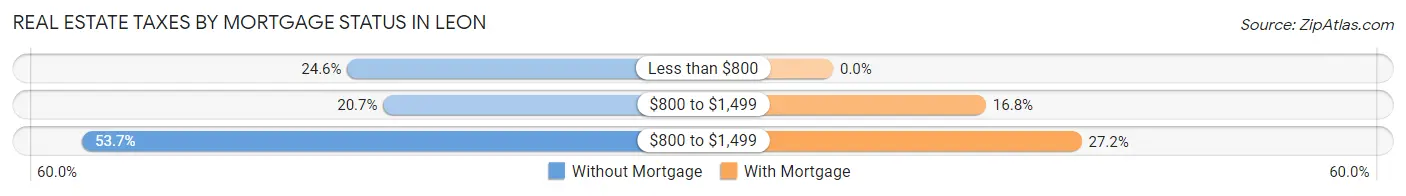
| Property Taxes | Without Mortgage | With Mortgage |
| Less than $800 | 50 (24.6%) | 0 (0.0%) |
| $800 to $1,499 | 42 (20.7%) | 32 (16.8%) |
| $800 to $1,499 | 109 (53.7%) | 52 (27.2%) |
| Total | 203 (100.0%) | 191 (100.0%) |
Health & Disability in Leon
Health Insurance Coverage by Age in Leon
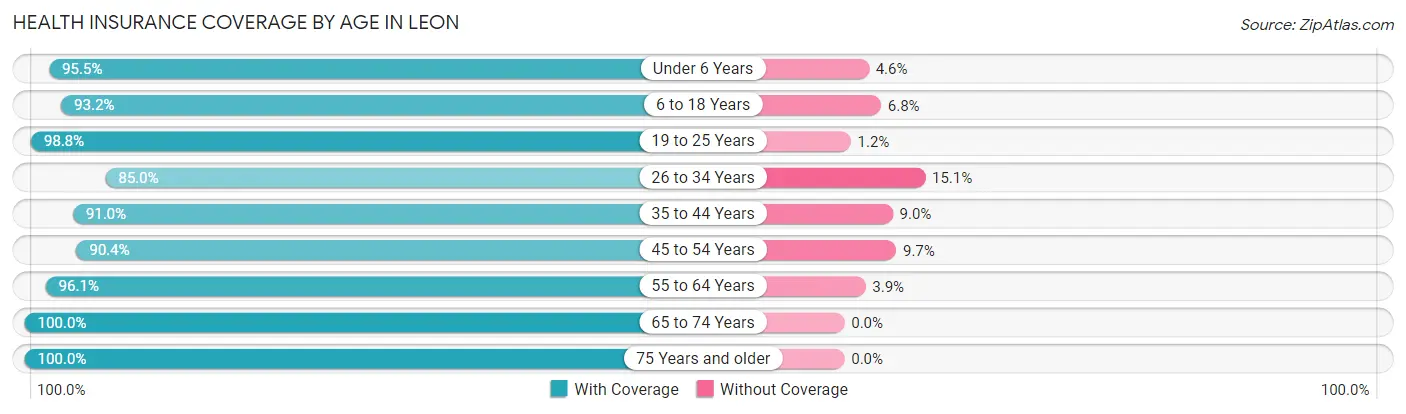
| Age Bracket | With Coverage | Without Coverage |
| Under 6 Years | 84 (95.5%) | 4 (4.5%) |
| 6 to 18 Years | 246 (93.2%) | 18 (6.8%) |
| 19 to 25 Years | 252 (98.8%) | 3 (1.2%) |
| 26 to 34 Years | 79 (85.0%) | 14 (15.0%) |
| 35 to 44 Years | 182 (91.0%) | 18 (9.0%) |
| 45 to 54 Years | 103 (90.3%) | 11 (9.7%) |
| 55 to 64 Years | 220 (96.1%) | 9 (3.9%) |
| 65 to 74 Years | 192 (100.0%) | 0 (0.0%) |
| 75 Years and older | 189 (100.0%) | 0 (0.0%) |
| Total | 1,547 (95.3%) | 77 (4.7%) |
Health Insurance Coverage by Citizenship Status in Leon
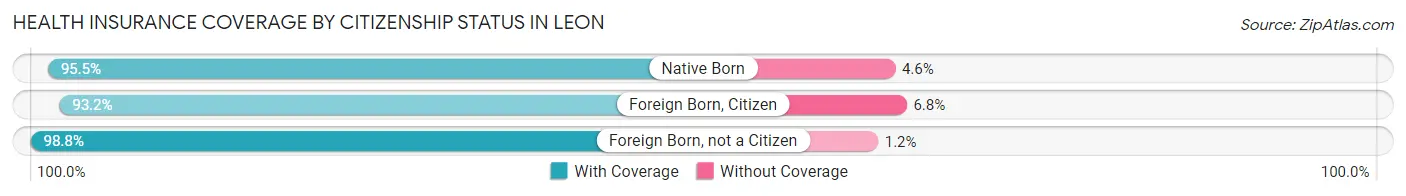
| Citizenship Status | With Coverage | Without Coverage |
| Native Born | 84 (95.5%) | 4 (4.5%) |
| Foreign Born, Citizen | 246 (93.2%) | 18 (6.8%) |
| Foreign Born, not a Citizen | 252 (98.8%) | 3 (1.2%) |
Health Insurance Coverage by Household Income in Leon
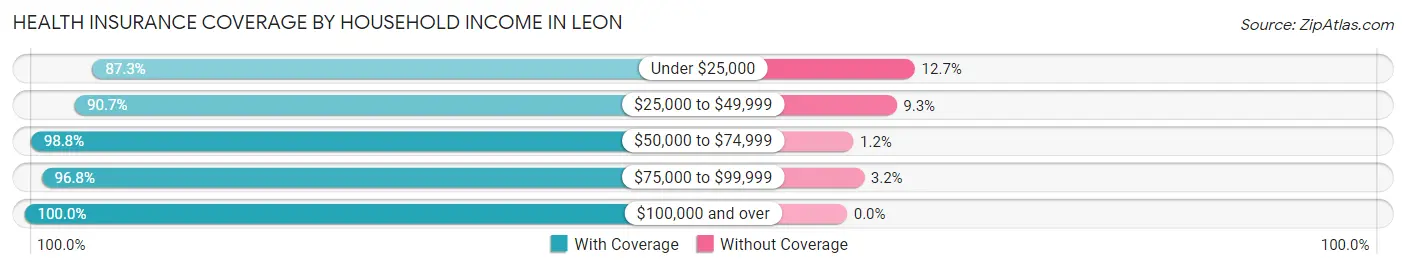
| Household Income | With Coverage | Without Coverage |
| Under $25,000 | 158 (87.3%) | 23 (12.7%) |
| $25,000 to $49,999 | 371 (90.7%) | 38 (9.3%) |
| $50,000 to $74,999 | 503 (98.8%) | 6 (1.2%) |
| $75,000 to $99,999 | 303 (96.8%) | 10 (3.2%) |
| $100,000 and over | 212 (100.0%) | 0 (0.0%) |
Public vs Private Health Insurance Coverage by Age in Leon
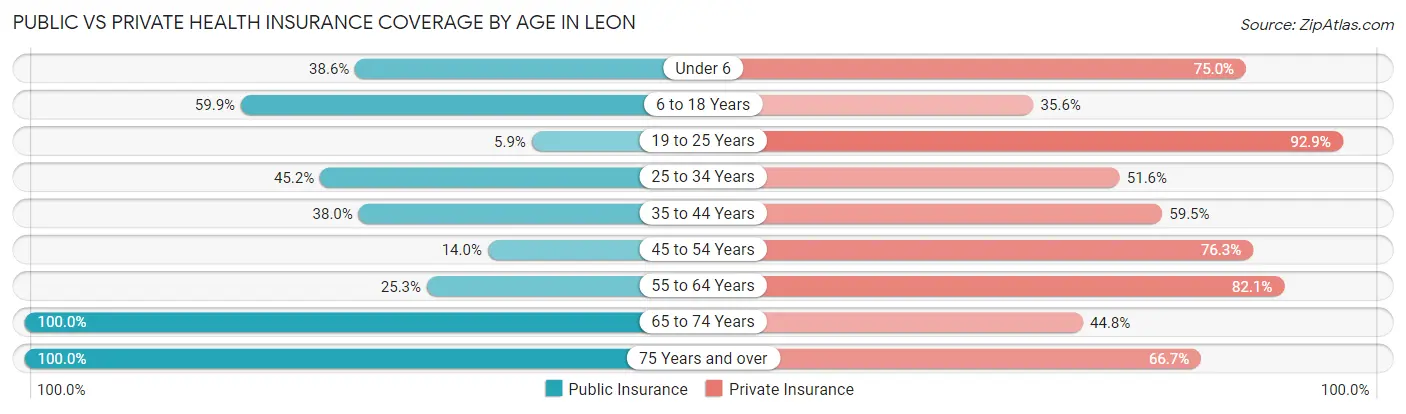
| Age Bracket | Public Insurance | Private Insurance |
| Under 6 | 34 (38.6%) | 66 (75.0%) |
| 6 to 18 Years | 158 (59.9%) | 94 (35.6%) |
| 19 to 25 Years | 15 (5.9%) | 237 (92.9%) |
| 25 to 34 Years | 42 (45.2%) | 48 (51.6%) |
| 35 to 44 Years | 76 (38.0%) | 119 (59.5%) |
| 45 to 54 Years | 16 (14.0%) | 87 (76.3%) |
| 55 to 64 Years | 58 (25.3%) | 188 (82.1%) |
| 65 to 74 Years | 192 (100.0%) | 86 (44.8%) |
| 75 Years and over | 189 (100.0%) | 126 (66.7%) |
| Total | 780 (48.0%) | 1,051 (64.7%) |
Disability Status by Sex by Age in Leon
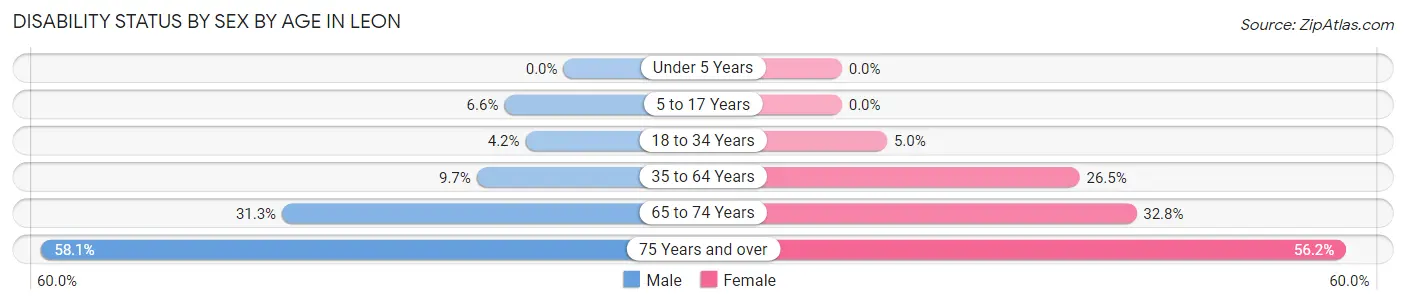
| Age Bracket | Male | Female |
| Under 5 Years | 0 (0.0%) | 0 (0.0%) |
| 5 to 17 Years | 10 (6.6%) | 0 (0.0%) |
| 18 to 34 Years | 8 (4.2%) | 8 (5.0%) |
| 35 to 64 Years | 28 (9.7%) | 67 (26.5%) |
| 65 to 74 Years | 21 (31.3%) | 41 (32.8%) |
| 75 Years and over | 25 (58.1%) | 82 (56.2%) |
Disability Class by Sex by Age in Leon
Disability Class: Hearing Difficulty
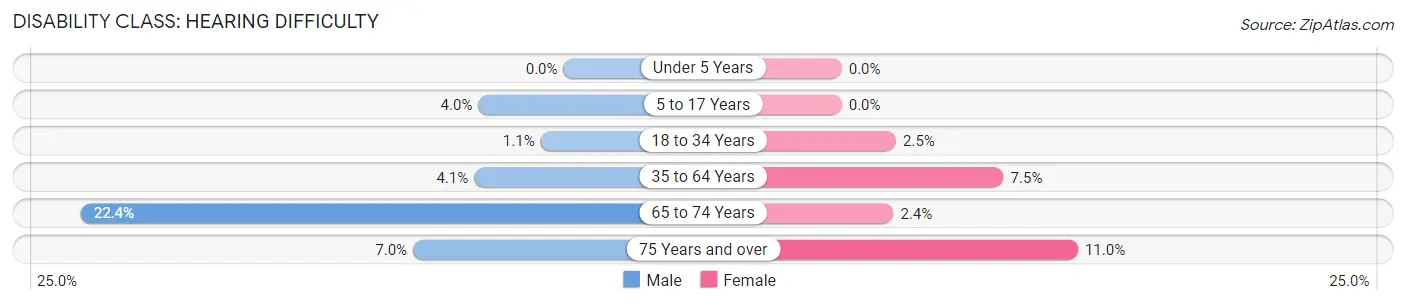
| Age Bracket | Male | Female |
| Under 5 Years | 0 (0.0%) | 0 (0.0%) |
| 5 to 17 Years | 6 (4.0%) | 0 (0.0%) |
| 18 to 34 Years | 2 (1.1%) | 4 (2.5%) |
| 35 to 64 Years | 12 (4.1%) | 19 (7.5%) |
| 65 to 74 Years | 15 (22.4%) | 3 (2.4%) |
| 75 Years and over | 3 (7.0%) | 16 (11.0%) |
Disability Class: Vision Difficulty
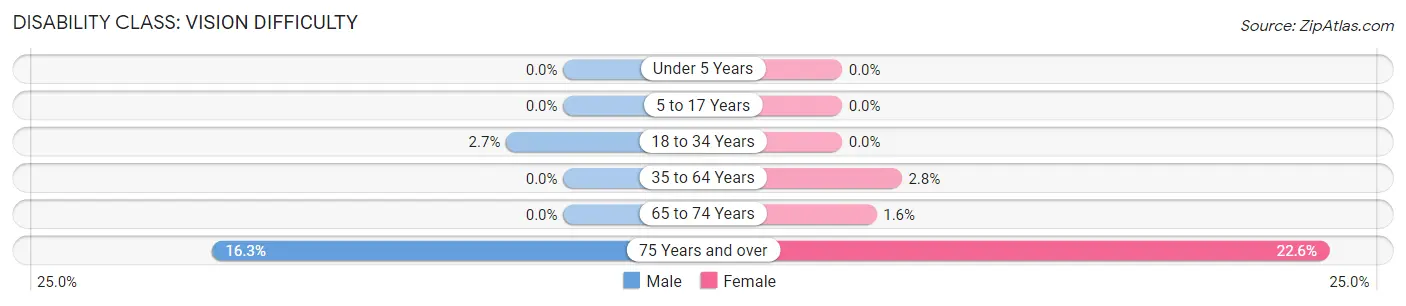
| Age Bracket | Male | Female |
| Under 5 Years | 0 (0.0%) | 0 (0.0%) |
| 5 to 17 Years | 0 (0.0%) | 0 (0.0%) |
| 18 to 34 Years | 5 (2.6%) | 0 (0.0%) |
| 35 to 64 Years | 0 (0.0%) | 7 (2.8%) |
| 65 to 74 Years | 0 (0.0%) | 2 (1.6%) |
| 75 Years and over | 7 (16.3%) | 33 (22.6%) |
Disability Class: Cognitive Difficulty
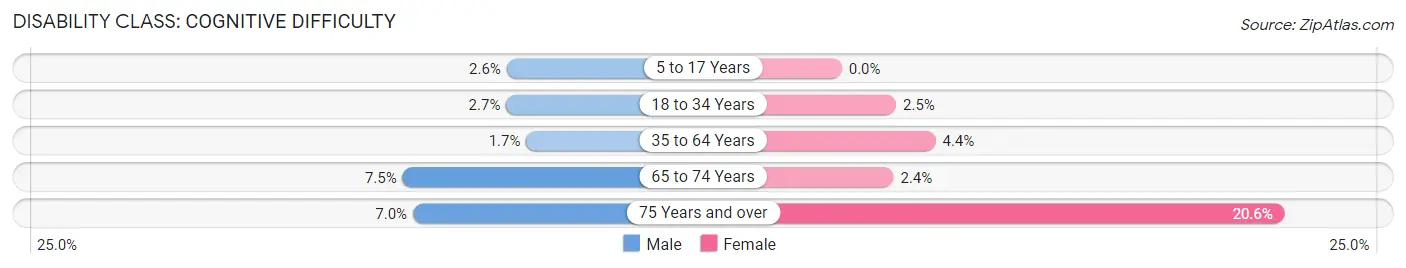
| Age Bracket | Male | Female |
| 5 to 17 Years | 4 (2.6%) | 0 (0.0%) |
| 18 to 34 Years | 5 (2.6%) | 4 (2.5%) |
| 35 to 64 Years | 5 (1.7%) | 11 (4.3%) |
| 65 to 74 Years | 5 (7.5%) | 3 (2.4%) |
| 75 Years and over | 3 (7.0%) | 30 (20.5%) |
Disability Class: Ambulatory Difficulty
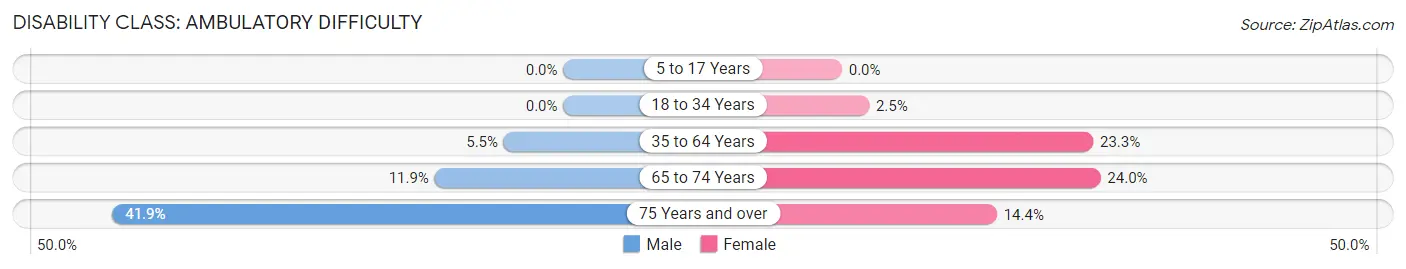
| Age Bracket | Male | Female |
| 5 to 17 Years | 0 (0.0%) | 0 (0.0%) |
| 18 to 34 Years | 0 (0.0%) | 4 (2.5%) |
| 35 to 64 Years | 16 (5.5%) | 59 (23.3%) |
| 65 to 74 Years | 8 (11.9%) | 30 (24.0%) |
| 75 Years and over | 18 (41.9%) | 21 (14.4%) |
Disability Class: Self-Care Difficulty
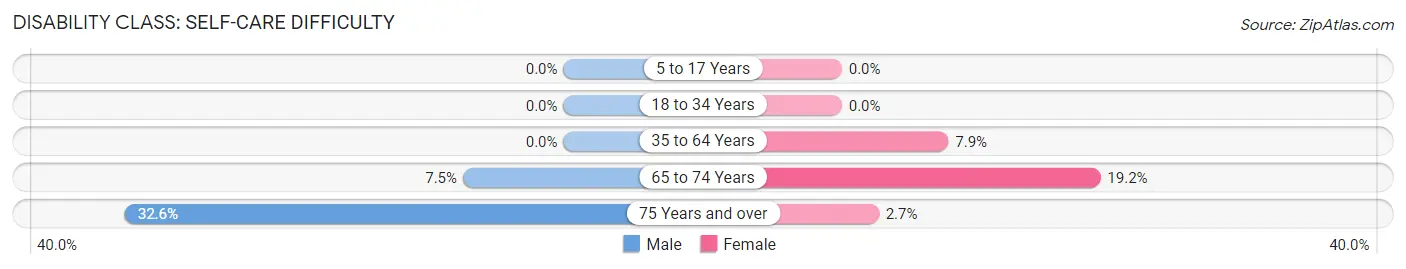
| Age Bracket | Male | Female |
| 5 to 17 Years | 0 (0.0%) | 0 (0.0%) |
| 18 to 34 Years | 0 (0.0%) | 0 (0.0%) |
| 35 to 64 Years | 0 (0.0%) | 20 (7.9%) |
| 65 to 74 Years | 5 (7.5%) | 24 (19.2%) |
| 75 Years and over | 14 (32.6%) | 4 (2.7%) |
Technology Access in Leon
Computing Device Access in Leon
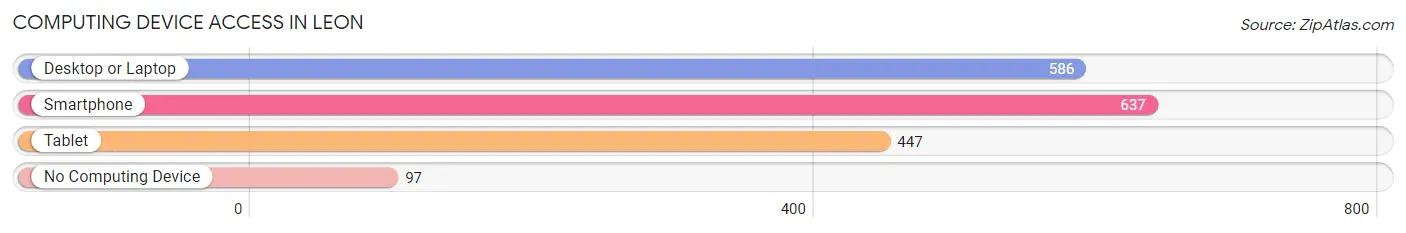
| Device Type | # Households | % Households |
| Desktop or Laptop | 586 | 74.4% |
| Smartphone | 637 | 80.8% |
| Tablet | 447 | 56.7% |
| No Computing Device | 97 | 12.3% |
| Total | 788 | 100.0% |
Internet Access in Leon
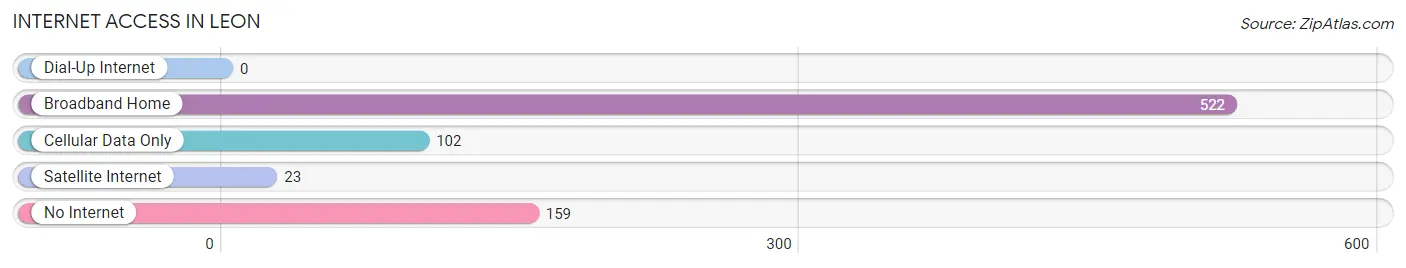
| Internet Type | # Households | % Households |
| Dial-Up Internet | 0 | 0.0% |
| Broadband Home | 522 | 66.2% |
| Cellular Data Only | 102 | 12.9% |
| Satellite Internet | 23 | 2.9% |
| No Internet | 159 | 20.2% |
| Total | 788 | 100.0% |
Leon Summary
Leon, Iowa is a small city located in Decatur County in the south-central part of the state. It is the county seat and has a population of 1,845 as of the 2010 census. The city was founded in 1856 and was named after the Spanish explorer, Leon de Soto.
Geography
Leon is located at the intersection of U.S. Route 69 and Iowa Highway 2. It is situated in the rolling hills of the Loess Hills region of Iowa. The city is located on the banks of the Grand River, which flows through the city and is a tributary of the Des Moines River. The city is located in a rural area and is surrounded by farmland. The nearest major city is Des Moines, which is located about 70 miles to the north.
Climate
Leon has a humid continental climate, with hot summers and cold winters. The average high temperature in July is 86°F and the average low temperature in January is 17°F. The city receives an average of 36 inches of precipitation per year, with the majority of it falling in the spring and summer months.
Economy
Leon’s economy is largely based on agriculture. The city is home to several large farms, as well as a number of smaller family-owned farms. The city is also home to several manufacturing companies, including a furniture factory and a plastics factory. The city also has a number of retail stores, restaurants, and other businesses.
Demographics
As of the 2010 census, Leon had a population of 1,845. The racial makeup of the city was 97.2% White, 0.7% African American, 0.3% Native American, 0.2% Asian, 0.1% Pacific Islander, 0.4% from other races, and 1.1% from two or more races. Hispanic or Latino of any race were 1.3% of the population.
The median household income in Leon was $41,250, and the median family income was $50,000. The per capita income for the city was $20,845. About 11.2% of families and 14.2% of the population were below the poverty line, including 18.2% of those under age 18 and 8.3% of those age 65 or over.
Education
Leon is served by the Leon Community School District, which consists of one elementary school, one middle school, and one high school. The district also operates a preschool and an alternative school. The city is also home to a branch of Southwestern Community College.
Conclusion
Leon, Iowa is a small city located in Decatur County in the south-central part of the state. It is the county seat and has a population of 1,845 as of the 2010 census. The city was founded in 1856 and was named after the Spanish explorer, Leon de Soto. The city’s economy is largely based on agriculture, and it is also home to several manufacturing companies, retail stores, restaurants, and other businesses. The city is served by the Leon Community School District, which consists of one elementary school, one middle school, and one high school. The city is also home to a branch of Southwestern Community College.
Common Questions
What is Per Capita Income in Leon?
Per Capita income in Leon is $27,082.
What is the Median Family Income in Leon?
Median Family Income in Leon is $66,071.
What is the Median Household income in Leon?
Median Household Income in Leon is $56,818.
What is Income or Wage Gap in Leon?
Income or Wage Gap in Leon is 62.9%.
Women in Leon earn 37.1 cents for every dollar earned by a man.
What is Inequality or Gini Index in Leon?
Inequality or Gini Index in Leon is 0.33.
What is the Total Population of Leon?
Total Population of Leon is 1,707.
What is the Total Male Population of Leon?
Total Male Population of Leon is 826.
What is the Total Female Population of Leon?
Total Female Population of Leon is 881.
What is the Ratio of Males per 100 Females in Leon?
There are 93.76 Males per 100 Females in Leon.
What is the Ratio of Females per 100 Males in Leon?
There are 106.66 Females per 100 Males in Leon.
What is the Median Population Age in Leon?
Median Population Age in Leon is 40.1 Years.
What is the Average Family Size in Leon
Average Family Size in Leon is 2.6 People.
What is the Average Household Size in Leon
Average Household Size in Leon is 2.1 People.
How Large is the Labor Force in Leon?
There are 798 People in the Labor Forcein in Leon.
What is the Percentage of People in the Labor Force in Leon?
58.0% of People are in the Labor Force in Leon.
What is the Unemployment Rate in Leon?
Unemployment Rate in Leon is 1.4%.