Leland, IA Map & Demographics
Leland Map
Leland Overview
$34,274
PER CAPITA INCOME
$75,000
AVG FAMILY INCOME
$52,500
AVG HOUSEHOLD INCOME
28.3%
WAGE / INCOME GAP [ % ]
71.7¢/ $1
WAGE / INCOME GAP [ $ ]
0.48
INEQUALITY / GINI INDEX
238
TOTAL POPULATION
103
MALE POPULATION
135
FEMALE POPULATION
76.30
MALES / 100 FEMALES
131.07
FEMALES / 100 MALES
38.0
MEDIAN AGE
3.1
AVG FAMILY SIZE
2.3
AVG HOUSEHOLD SIZE
116
LABOR FORCE [ PEOPLE ]
61.7%
PERCENT IN LABOR FORCE
6.9%
UNEMPLOYMENT RATE
Leland Zip Codes
Leland Area Codes
Income in Leland
Income Overview in Leland
Per Capita Income in Leland is $34,274, while median incomes of families and households are $75,000 and $52,500 respectively.
| Characteristic | Number | Measure |
| Per Capita Income | 238 | $34,274 |
| Median Family Income | 54 | $75,000 |
| Mean Family Income | 54 | $85,978 |
| Median Household Income | 104 | $52,500 |
| Mean Household Income | 104 | $81,488 |
| Income Deficit | 54 | $0 |
| Wage / Income Gap (%) | 238 | 28.30% |
| Wage / Income Gap ($) | 238 | 71.70¢ per $1 |
| Gini / Inequality Index | 238 | 0.48 |
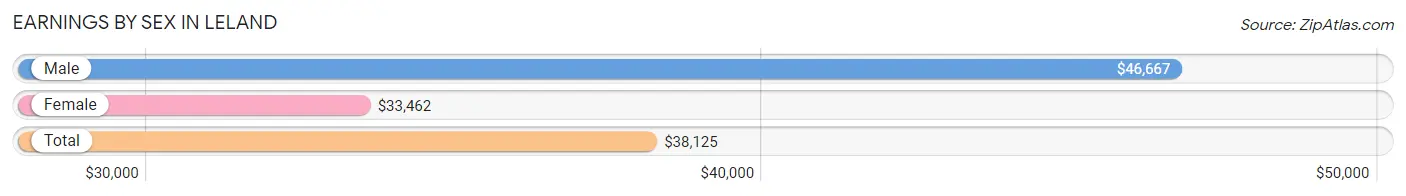
Earnings by Sex in Leland
Average Earnings in Leland are $38,125, $46,667 for men and $33,462 for women, a difference of 28.3%.
| Sex | Number | Average Earnings |
| Male | 60 (50.8%) | $46,667 |
| Female | 58 (49.1%) | $33,462 |
| Total | 118 (100.0%) | $38,125 |
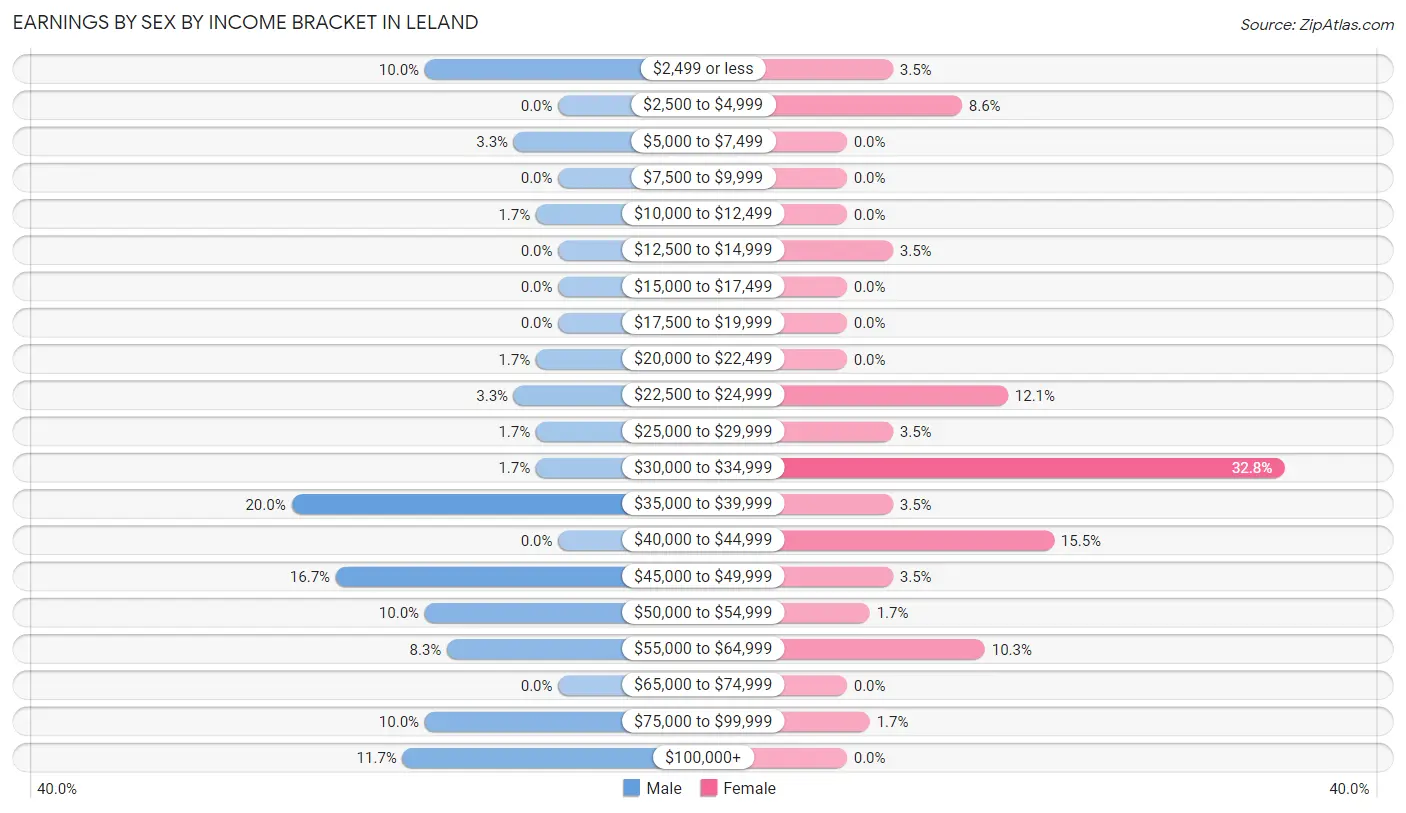
Earnings by Sex by Income Bracket in Leland
The most common earnings brackets in Leland are $35,000 to $39,999 for men (12 | 20.0%) and $30,000 to $34,999 for women (19 | 32.8%).
| Income | Male | Female |
| $2,499 or less | 6 (10.0%) | 2 (3.5%) |
| $2,500 to $4,999 | 0 (0.0%) | 5 (8.6%) |
| $5,000 to $7,499 | 2 (3.3%) | 0 (0.0%) |
| $7,500 to $9,999 | 0 (0.0%) | 0 (0.0%) |
| $10,000 to $12,499 | 1 (1.7%) | 0 (0.0%) |
| $12,500 to $14,999 | 0 (0.0%) | 2 (3.5%) |
| $15,000 to $17,499 | 0 (0.0%) | 0 (0.0%) |
| $17,500 to $19,999 | 0 (0.0%) | 0 (0.0%) |
| $20,000 to $22,499 | 1 (1.7%) | 0 (0.0%) |
| $22,500 to $24,999 | 2 (3.3%) | 7 (12.1%) |
| $25,000 to $29,999 | 1 (1.7%) | 2 (3.5%) |
| $30,000 to $34,999 | 1 (1.7%) | 19 (32.8%) |
| $35,000 to $39,999 | 12 (20.0%) | 2 (3.5%) |
| $40,000 to $44,999 | 0 (0.0%) | 9 (15.5%) |
| $45,000 to $49,999 | 10 (16.7%) | 2 (3.5%) |
| $50,000 to $54,999 | 6 (10.0%) | 1 (1.7%) |
| $55,000 to $64,999 | 5 (8.3%) | 6 (10.3%) |
| $65,000 to $74,999 | 0 (0.0%) | 0 (0.0%) |
| $75,000 to $99,999 | 6 (10.0%) | 1 (1.7%) |
| $100,000+ | 7 (11.7%) | 0 (0.0%) |
| Total | 60 (100.0%) | 58 (100.0%) |
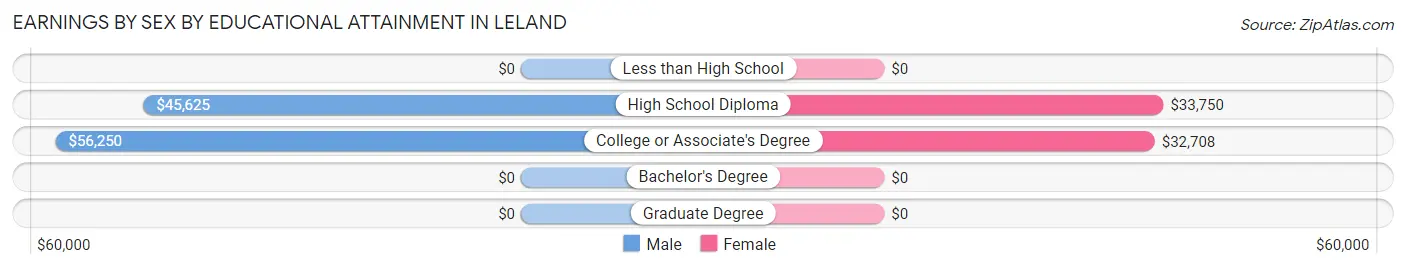
Earnings by Sex by Educational Attainment in Leland
Average earnings in Leland are $48,125 for men and $33,750 for women, a difference of 29.9%. Men with an educational attainment of college or associate's degree enjoy the highest average annual earnings of $56,250, while those with high school diploma education earn the least with $45,625. Women with an educational attainment of high school diploma earn the most with the average annual earnings of $33,750, while those with college or associate's degree education have the smallest earnings of $32,708.
| Educational Attainment | Male Income | Female Income |
| Less than High School | - | - |
| High School Diploma | $45,625 | $33,750 |
| College or Associate's Degree | $56,250 | $32,708 |
| Bachelor's Degree | - | - |
| Graduate Degree | - | - |
| Total | $48,125 | $33,750 |
Family Income in Leland
Family Income Brackets in Leland
According to the Leland family income data, there are 16 families falling into the $35,000 to $49,999 income range, which is the most common income bracket and makes up 29.6% of all families.
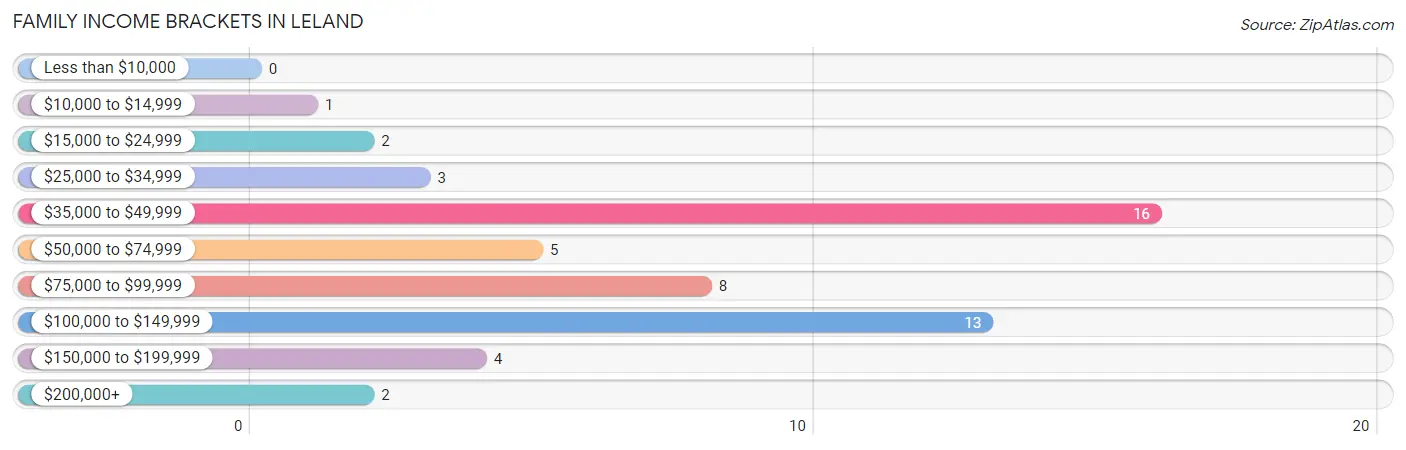
| Income Bracket | # Families | % Families |
| Less than $10,000 | 0 | 0.0% |
| $10,000 to $14,999 | 1 | 1.9% |
| $15,000 to $24,999 | 2 | 3.7% |
| $25,000 to $34,999 | 3 | 5.6% |
| $35,000 to $49,999 | 16 | 29.6% |
| $50,000 to $74,999 | 5 | 9.3% |
| $75,000 to $99,999 | 8 | 14.8% |
| $100,000 to $149,999 | 13 | 24.1% |
| $150,000 to $199,999 | 4 | 7.4% |
| $200,000+ | 2 | 3.7% |
Family Income by Famaliy Size in Leland
4-person families (6 | 11.1%) account for the highest median family income in Leland with $111,667 per family, while 2-person families (28 | 51.8%) have the highest median income of $34,375 per family member.
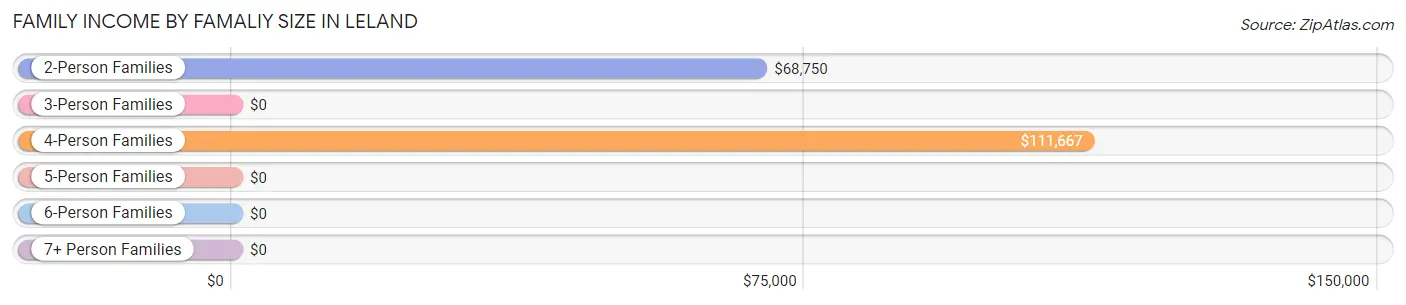
| Income Bracket | # Families | Median Income |
| 2-Person Families | 28 (51.8%) | $68,750 |
| 3-Person Families | 9 (16.7%) | $0 |
| 4-Person Families | 6 (11.1%) | $111,667 |
| 5-Person Families | 11 (20.4%) | $0 |
| 6-Person Families | 0 (0.0%) | $0 |
| 7+ Person Families | 0 (0.0%) | $0 |
| Total | 54 (100.0%) | $75,000 |
Family Income by Number of Earners in Leland
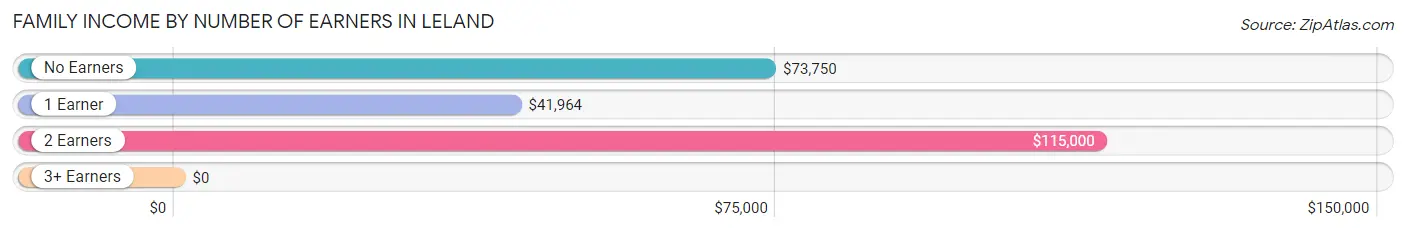
| Number of Earners | # Families | Median Income |
| No Earners | 5 (9.3%) | $73,750 |
| 1 Earner | 27 (50.0%) | $41,964 |
| 2 Earners | 18 (33.3%) | $115,000 |
| 3+ Earners | 4 (7.4%) | $0 |
| Total | 54 (100.0%) | $75,000 |
Household Income in Leland
Household Income Brackets in Leland
With 23 households falling in the category, the $35,000 to $49,999 income range is the most frequent in Leland, accounting for 22.1% of all households. In contrast, only 4 households (3.8%) fall into the $10,000 to $14,999 income bracket, making it the least populous group.
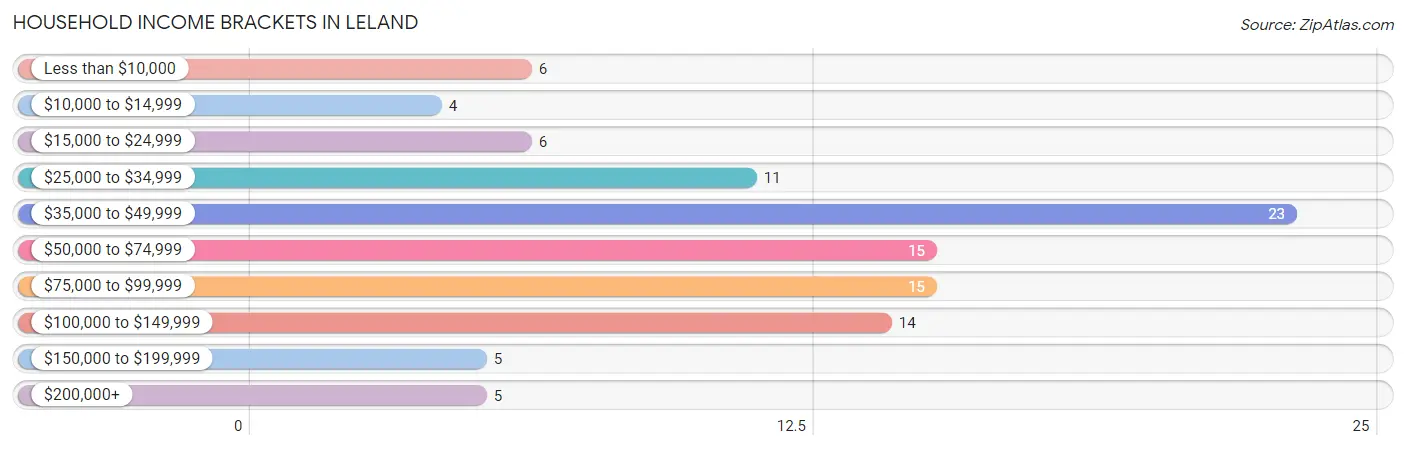
| Income Bracket | # Households | % Households |
| Less than $10,000 | 6 | 5.8% |
| $10,000 to $14,999 | 4 | 3.8% |
| $15,000 to $24,999 | 6 | 5.8% |
| $25,000 to $34,999 | 11 | 10.6% |
| $35,000 to $49,999 | 23 | 22.1% |
| $50,000 to $74,999 | 15 | 14.4% |
| $75,000 to $99,999 | 15 | 14.4% |
| $100,000 to $149,999 | 14 | 13.5% |
| $150,000 to $199,999 | 5 | 4.8% |
| $200,000+ | 5 | 4.8% |
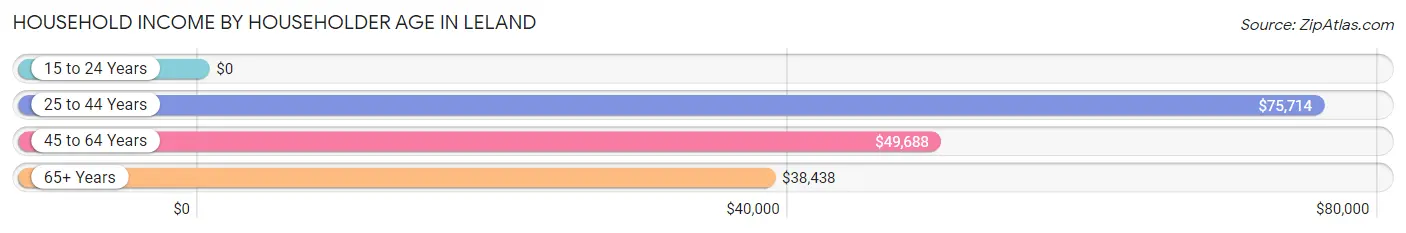
Household Income by Householder Age in Leland
The median household income in Leland is $52,500, with the highest median household income of $75,714 found in the 25 to 44 years age bracket for the primary householder. A total of 30 households (28.8%) fall into this category. Meanwhile, the 15 to 24 years age bracket for the primary householder has the lowest median household income of $0, with 4 households (3.8%) in this group.
| Income Bracket | # Households | Median Income |
| 15 to 24 Years | 4 (3.8%) | $0 |
| 25 to 44 Years | 30 (28.8%) | $75,714 |
| 45 to 64 Years | 41 (39.4%) | $49,688 |
| 65+ Years | 29 (27.9%) | $38,438 |
| Total | 104 (100.0%) | $52,500 |
Poverty in Leland
Income Below Poverty by Sex and Age in Leland
With 6.1% poverty level for males and 9.6% for females among the residents of Leland, 75 year old and over males and 75 year old and over females are the most vulnerable to poverty, with 3 males (50.0%) and 4 females (33.3%) in their respective age groups living below the poverty level.
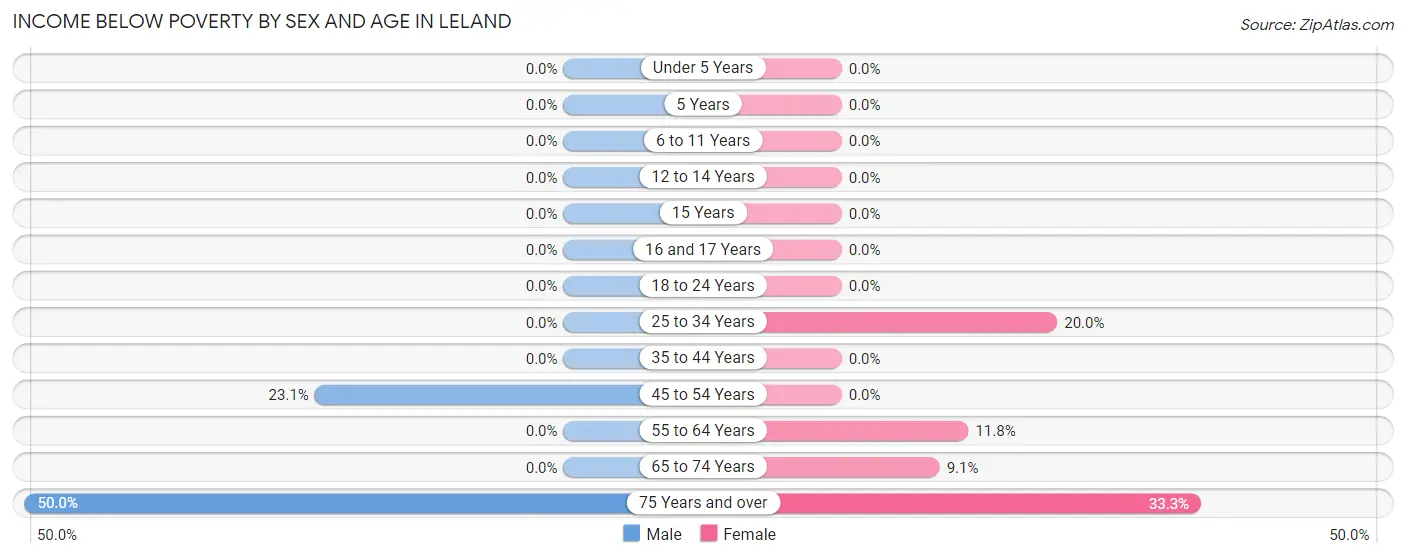
| Age Bracket | Male | Female |
| Under 5 Years | 0 (0.0%) | 0 (0.0%) |
| 5 Years | 0 (0.0%) | 0 (0.0%) |
| 6 to 11 Years | 0 (0.0%) | 0 (0.0%) |
| 12 to 14 Years | 0 (0.0%) | 0 (0.0%) |
| 15 Years | 0 (0.0%) | 0 (0.0%) |
| 16 and 17 Years | 0 (0.0%) | 0 (0.0%) |
| 18 to 24 Years | 0 (0.0%) | 0 (0.0%) |
| 25 to 34 Years | 0 (0.0%) | 6 (20.0%) |
| 35 to 44 Years | 0 (0.0%) | 0 (0.0%) |
| 45 to 54 Years | 3 (23.1%) | 0 (0.0%) |
| 55 to 64 Years | 0 (0.0%) | 2 (11.8%) |
| 65 to 74 Years | 0 (0.0%) | 1 (9.1%) |
| 75 Years and over | 3 (50.0%) | 4 (33.3%) |
| Total | 6 (6.1%) | 13 (9.6%) |
Income Above Poverty by Sex and Age in Leland
According to the poverty statistics in Leland, males aged under 5 years and females aged under 5 years are the age groups that are most secure financially, with 100.0% of males and 100.0% of females in these age groups living above the poverty line.
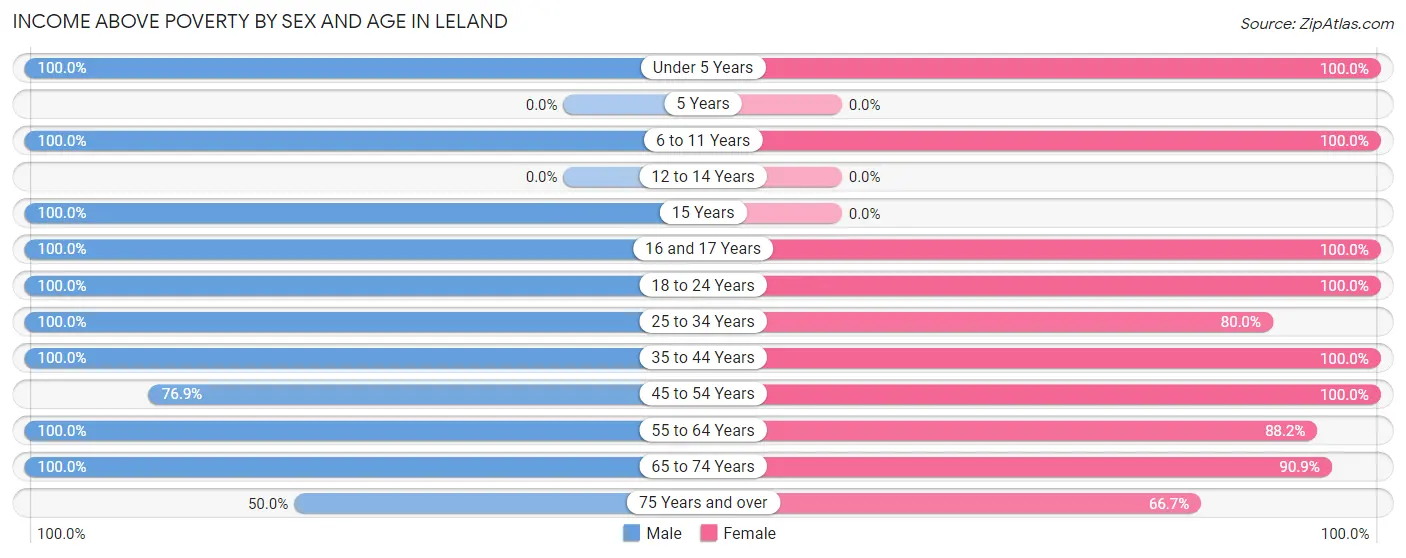
| Age Bracket | Male | Female |
| Under 5 Years | 10 (100.0%) | 6 (100.0%) |
| 5 Years | 0 (0.0%) | 0 (0.0%) |
| 6 to 11 Years | 5 (100.0%) | 22 (100.0%) |
| 12 to 14 Years | 0 (0.0%) | 0 (0.0%) |
| 15 Years | 2 (100.0%) | 0 (0.0%) |
| 16 and 17 Years | 1 (100.0%) | 9 (100.0%) |
| 18 to 24 Years | 6 (100.0%) | 9 (100.0%) |
| 25 to 34 Years | 7 (100.0%) | 24 (80.0%) |
| 35 to 44 Years | 17 (100.0%) | 4 (100.0%) |
| 45 to 54 Years | 10 (76.9%) | 15 (100.0%) |
| 55 to 64 Years | 19 (100.0%) | 15 (88.2%) |
| 65 to 74 Years | 12 (100.0%) | 10 (90.9%) |
| 75 Years and over | 3 (50.0%) | 8 (66.7%) |
| Total | 92 (93.9%) | 122 (90.4%) |
Income Below Poverty Among Married-Couple Families in Leland
The poverty statistics for married-couple families in Leland show that 7.3% or 3 of the total 41 families live below the poverty line. Families with no children have the highest poverty rate of 12.0%, comprising of 3 families. On the other hand, families with 1 or 2 children have the lowest poverty rate of 0.0%, which includes 0 families.
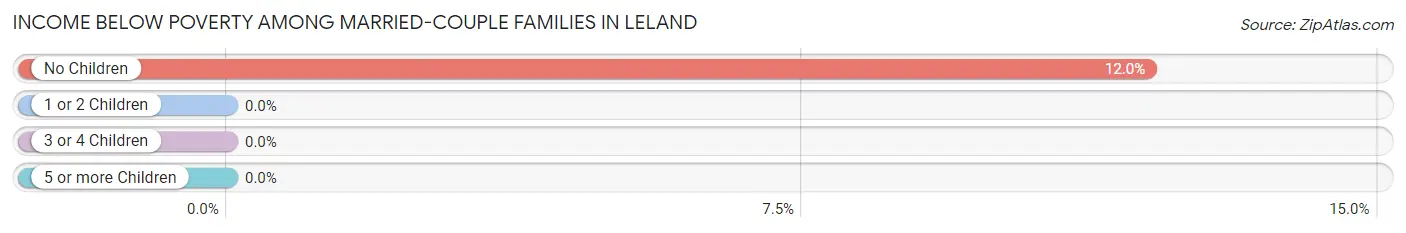
| Children | Above Poverty | Below Poverty |
| No Children | 22 (88.0%) | 3 (12.0%) |
| 1 or 2 Children | 7 (100.0%) | 0 (0.0%) |
| 3 or 4 Children | 9 (100.0%) | 0 (0.0%) |
| 5 or more Children | 0 (0.0%) | 0 (0.0%) |
| Total | 38 (92.7%) | 3 (7.3%) |
Income Below Poverty Among Single-Parent Households in Leland
| Children | Single Father | Single Mother |
| No Children | 0 (0.0%) | 0 (0.0%) |
| 1 or 2 Children | 0 (0.0%) | 0 (0.0%) |
| 3 or 4 Children | 0 (0.0%) | 0 (0.0%) |
| 5 or more Children | 0 (0.0%) | 0 (0.0%) |
| Total | 0 (0.0%) | 0 (0.0%) |
Income Below Poverty Among Married-Couple vs Single-Parent Households in Leland
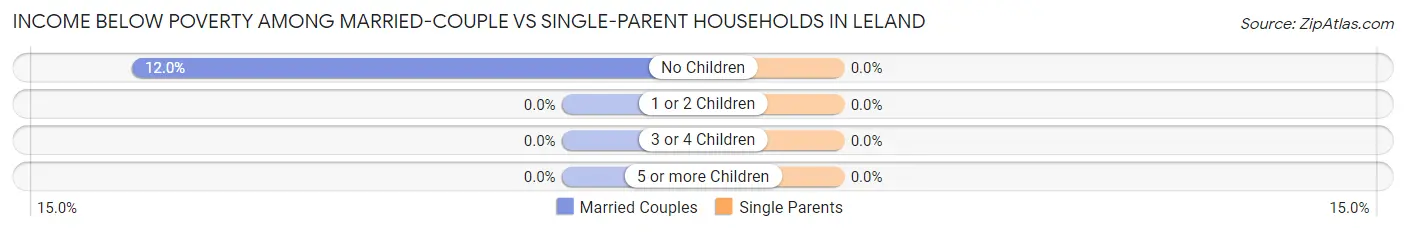
| Children | Married-Couple Families | Single-Parent Households |
| No Children | 3 (12.0%) | 0 (0.0%) |
| 1 or 2 Children | 0 (0.0%) | 0 (0.0%) |
| 3 or 4 Children | 0 (0.0%) | 0 (0.0%) |
| 5 or more Children | 0 (0.0%) | 0 (0.0%) |
| Total | 3 (7.3%) | 0 (0.0%) |
Race in Leland
The most populous races in Leland are White / Caucasian (207 | 87.0%), Two or more Races (25 | 10.5%), and Hispanic or Latino (12 | 5.0%).
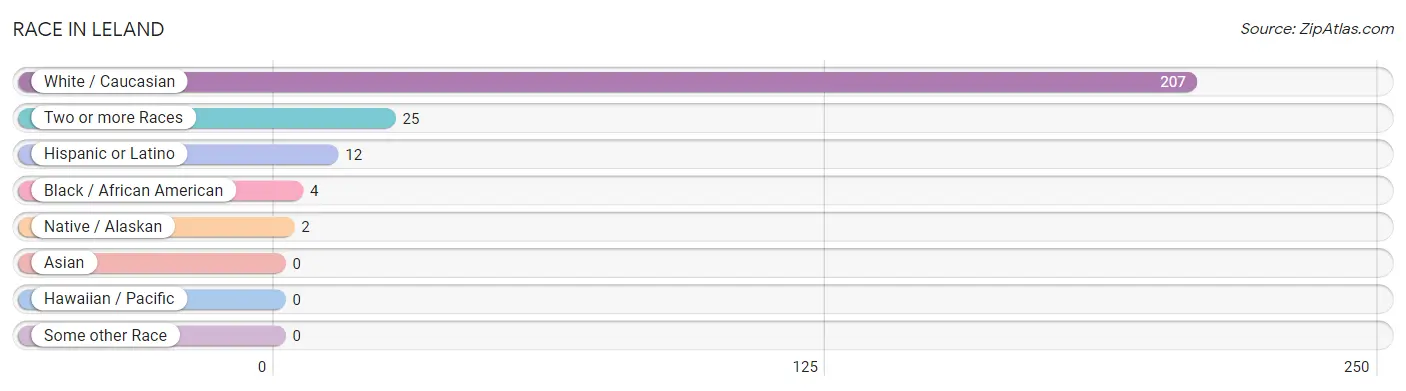
| Race | # Population | % Population |
| Asian | 0 | 0.0% |
| Black / African American | 4 | 1.7% |
| Hawaiian / Pacific | 0 | 0.0% |
| Hispanic or Latino | 12 | 5.0% |
| Native / Alaskan | 2 | 0.8% |
| White / Caucasian | 207 | 87.0% |
| Two or more Races | 25 | 10.5% |
| Some other Race | 0 | 0.0% |
| Total | 238 | 100.0% |
Ancestry in Leland
The most populous ancestries reported in Leland are German (75 | 31.5%), Norwegian (43 | 18.1%), Irish (19 | 8.0%), Mexican (12 | 5.0%), and Dutch (7 | 2.9%), together accounting for 65.5% of all Leland residents.
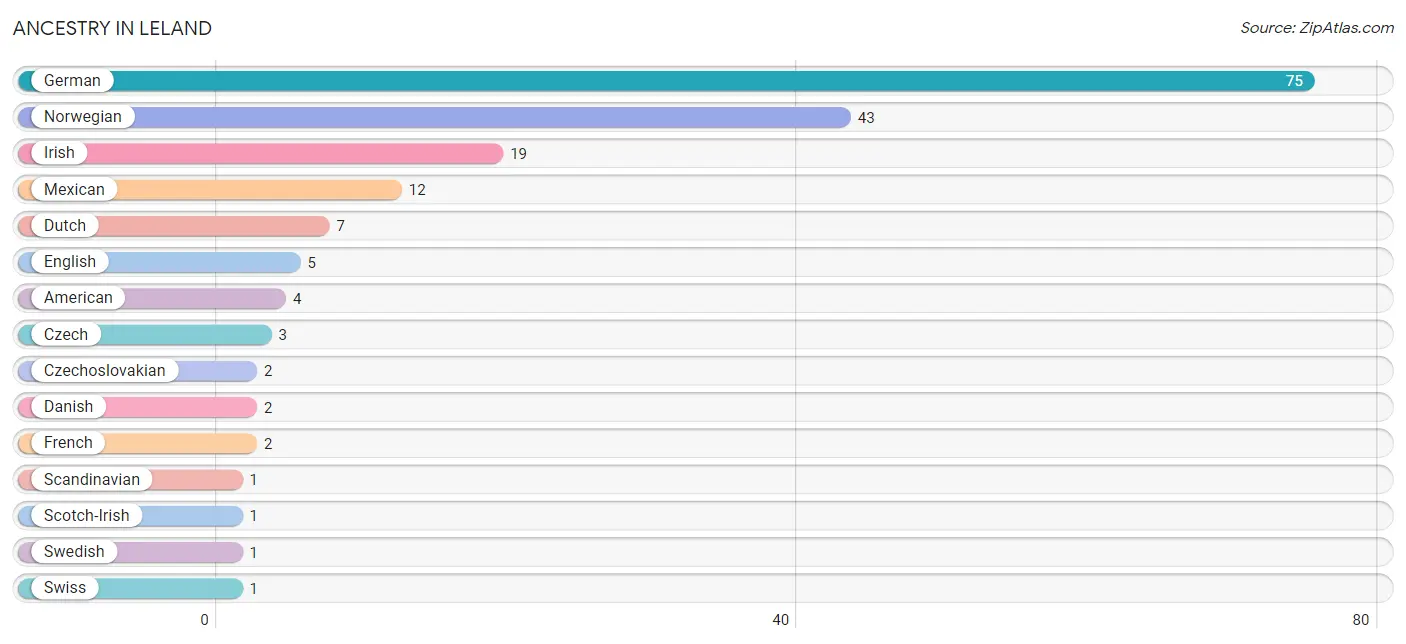
| Ancestry | # Population | % Population |
| American | 4 | 1.7% |
| Czech | 3 | 1.3% |
| Czechoslovakian | 2 | 0.8% |
| Danish | 2 | 0.8% |
| Dutch | 7 | 2.9% |
| English | 5 | 2.1% |
| French | 2 | 0.8% |
| German | 75 | 31.5% |
| Irish | 19 | 8.0% |
| Mexican | 12 | 5.0% |
| Norwegian | 43 | 18.1% |
| Scandinavian | 1 | 0.4% |
| Scotch-Irish | 1 | 0.4% |
| Swedish | 1 | 0.4% |
| Swiss | 1 | 0.4% | View All 15 Rows |
Immigrants in Leland

| Immigration Origin | # Population | % Population | View All 0 Rows |
Sex and Age in Leland
Sex and Age in Leland
The most populous age groups in Leland are 35 to 39 Years (15 | 14.6%) for men and 5 to 9 Years (22 | 16.3%) for women.
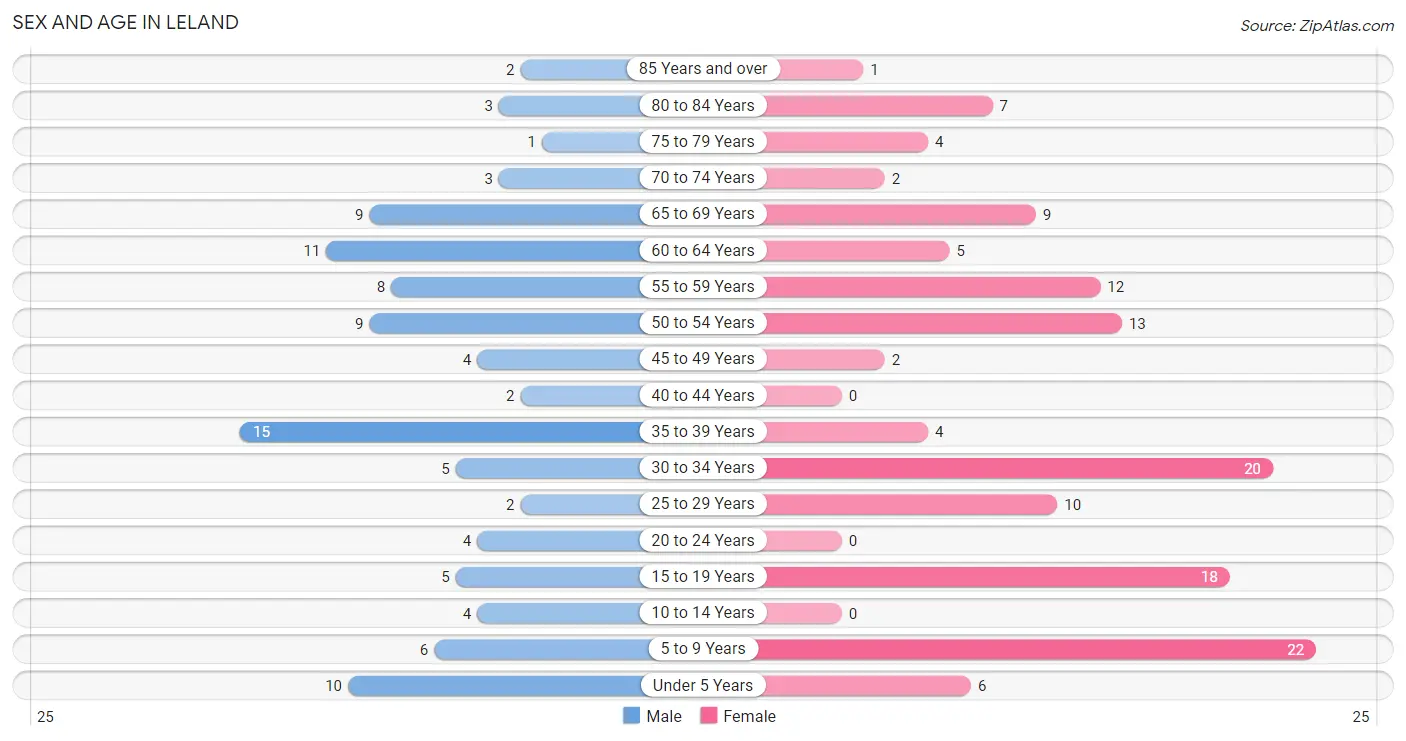
| Age Bracket | Male | Female |
| Under 5 Years | 10 (9.7%) | 6 (4.4%) |
| 5 to 9 Years | 6 (5.8%) | 22 (16.3%) |
| 10 to 14 Years | 4 (3.9%) | 0 (0.0%) |
| 15 to 19 Years | 5 (4.9%) | 18 (13.3%) |
| 20 to 24 Years | 4 (3.9%) | 0 (0.0%) |
| 25 to 29 Years | 2 (1.9%) | 10 (7.4%) |
| 30 to 34 Years | 5 (4.9%) | 20 (14.8%) |
| 35 to 39 Years | 15 (14.6%) | 4 (3.0%) |
| 40 to 44 Years | 2 (1.9%) | 0 (0.0%) |
| 45 to 49 Years | 4 (3.9%) | 2 (1.5%) |
| 50 to 54 Years | 9 (8.7%) | 13 (9.6%) |
| 55 to 59 Years | 8 (7.8%) | 12 (8.9%) |
| 60 to 64 Years | 11 (10.7%) | 5 (3.7%) |
| 65 to 69 Years | 9 (8.7%) | 9 (6.7%) |
| 70 to 74 Years | 3 (2.9%) | 2 (1.5%) |
| 75 to 79 Years | 1 (1.0%) | 4 (3.0%) |
| 80 to 84 Years | 3 (2.9%) | 7 (5.2%) |
| 85 Years and over | 2 (1.9%) | 1 (0.7%) |
| Total | 103 (100.0%) | 135 (100.0%) |
Families and Households in Leland
Median Family Size in Leland
The median family size in Leland is 3.06 persons per family, with single male/father families (3 | 5.6%) accounting for the largest median family size of 4.33 persons per family. On the other hand, single female/mother families (10 | 18.5%) represent the smallest median family size with 2.90 persons per family.
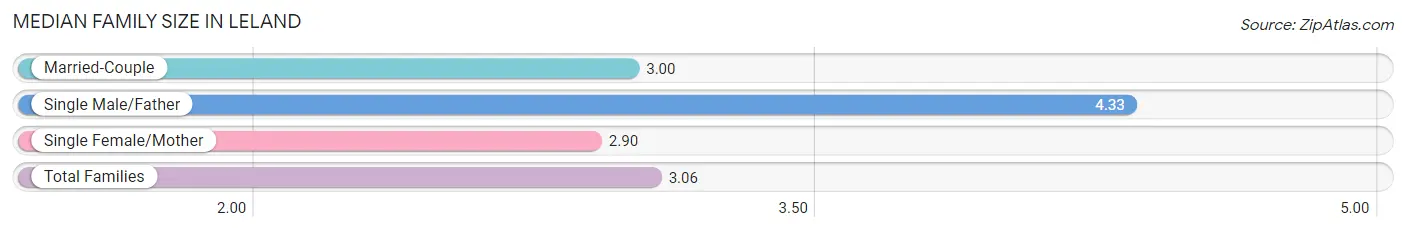
| Family Type | # Families | Family Size |
| Married-Couple | 41 (75.9%) | 3.00 |
| Single Male/Father | 3 (5.6%) | 4.33 |
| Single Female/Mother | 10 (18.5%) | 2.90 |
| Total Families | 54 (100.0%) | 3.06 |
Median Household Size in Leland
The median household size in Leland is 2.29 persons per household, with single male/father households (3 | 2.9%) accounting for the largest median household size of 8 persons per household. non-family households (50 | 48.1%) represent the smallest median household size with 1.12 persons per household.
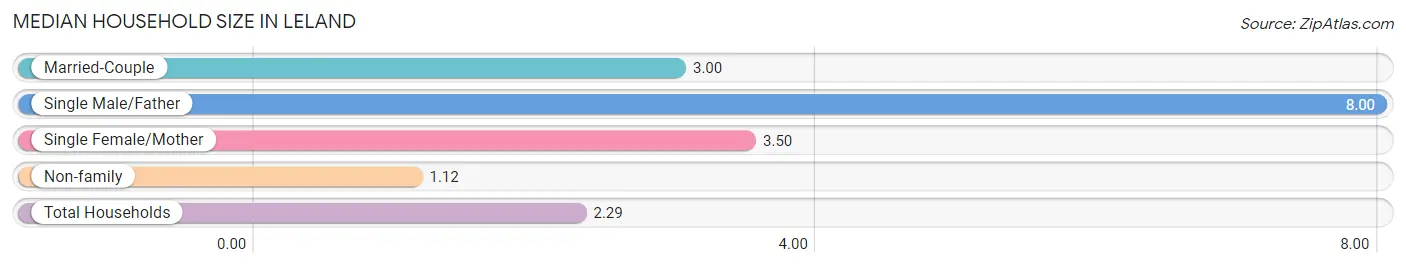
| Household Type | # Households | Household Size |
| Married-Couple | 41 (39.4%) | 3.00 |
| Single Male/Father | 3 (2.9%) | 8.00 |
| Single Female/Mother | 10 (9.6%) | 3.50 |
| Non-family | 50 (48.1%) | 1.12 |
| Total Households | 104 (100.0%) | 2.29 |
Household Size by Marriage Status in Leland
Out of a total of 104 households in Leland, 54 (51.9%) are family households, while 50 (48.1%) are nonfamily households. The most numerous type of family households are 2-person households, comprising 24, and the most common type of nonfamily households are 1-person households, comprising 46.
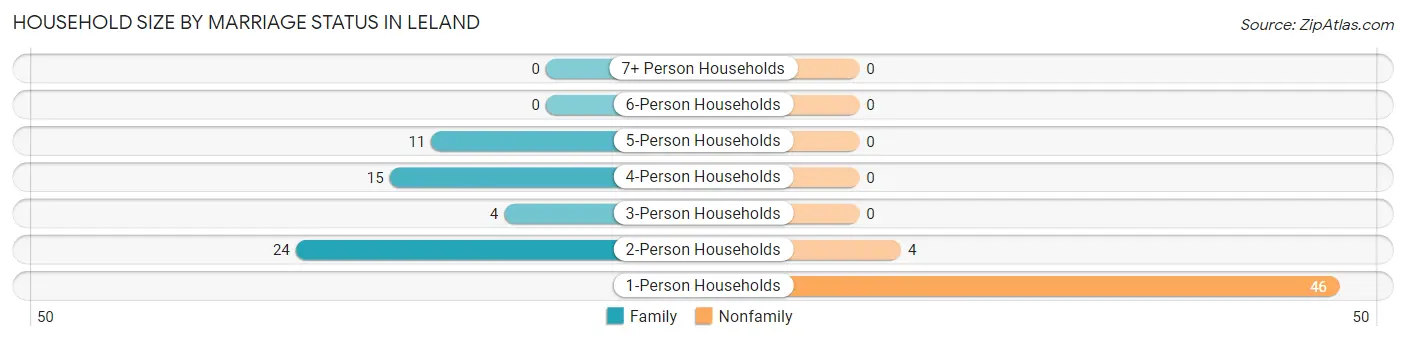
| Household Size | Family Households | Nonfamily Households |
| 1-Person Households | - | 46 (44.2%) |
| 2-Person Households | 24 (23.1%) | 4 (3.8%) |
| 3-Person Households | 4 (3.8%) | 0 (0.0%) |
| 4-Person Households | 15 (14.4%) | 0 (0.0%) |
| 5-Person Households | 11 (10.6%) | 0 (0.0%) |
| 6-Person Households | 0 (0.0%) | 0 (0.0%) |
| 7+ Person Households | 0 (0.0%) | 0 (0.0%) |
| Total | 54 (51.9%) | 50 (48.1%) |
Female Fertility in Leland
Fertility by Age in Leland
Average fertility rate in Leland is 63.0 births per 1,000 women. Women in the age bracket of 20 to 34 years have the highest fertility rate with 133.0 births per 1,000 women. Women in the age bracket of 20 to 34 years acount for 100.0% of all women with births.
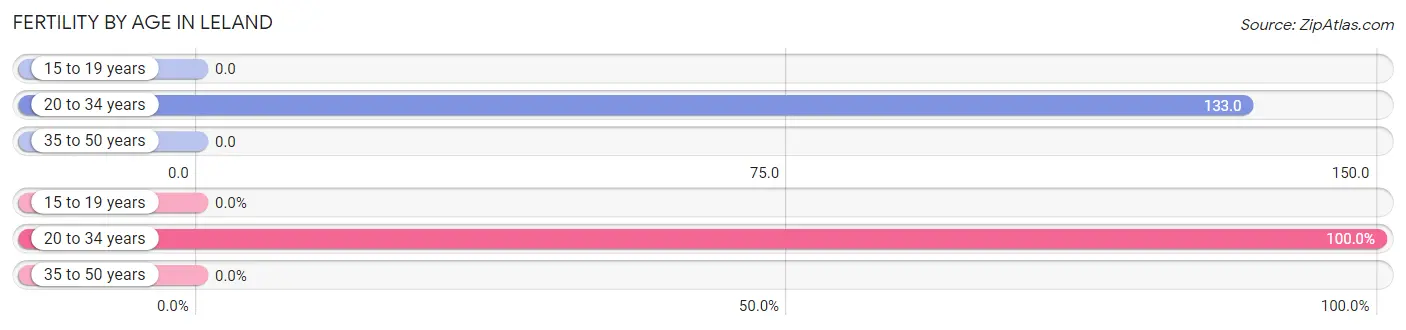
| Age Bracket | Women with Births | Births / 1,000 Women |
| 15 to 19 years | 0 (0.0%) | 0.0 |
| 20 to 34 years | 4 (100.0%) | 133.0 |
| 35 to 50 years | 0 (0.0%) | 0.0 |
| Total | 4 (100.0%) | 63.0 |
Fertility by Age by Marriage Status in Leland
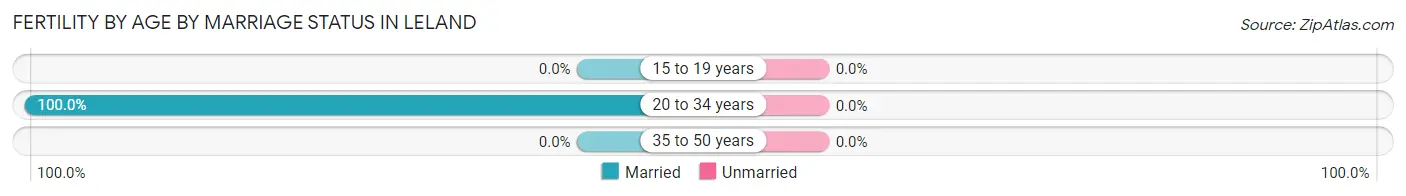
| Age Bracket | Married | Unmarried |
| 15 to 19 years | 0 (0.0%) | 0 (0.0%) |
| 20 to 34 years | 4 (100.0%) | 0 (0.0%) |
| 35 to 50 years | 0 (0.0%) | 0 (0.0%) |
| Total | 4 (100.0%) | 0 (0.0%) |
Fertility by Education in Leland
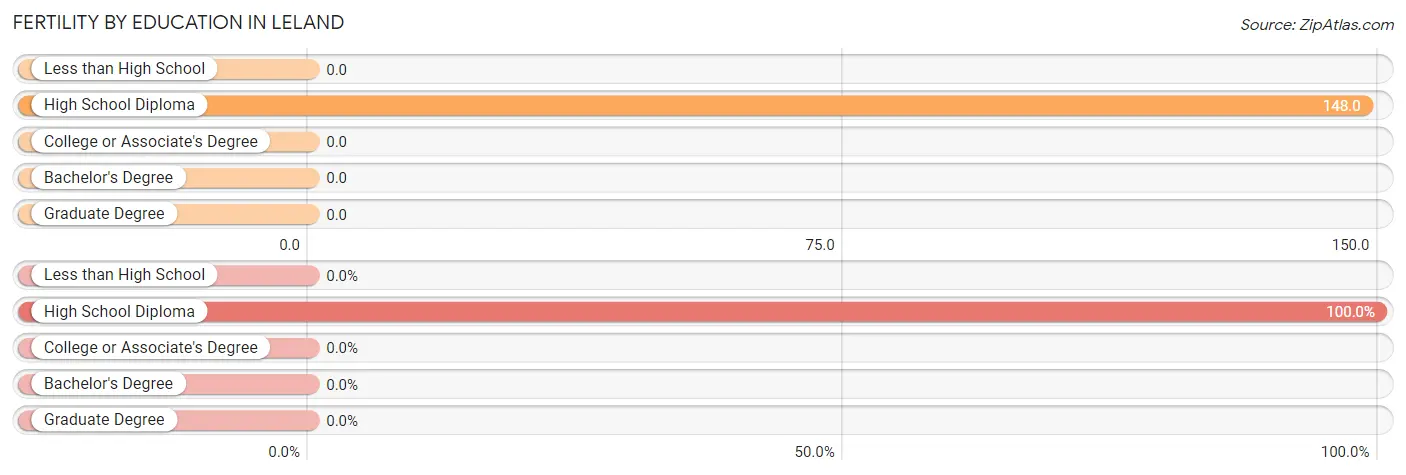
| Educational Attainment | Women with Births | Births / 1,000 Women |
| Less than High School | 0 (0.0%) | 0.0 |
| High School Diploma | 4 (100.0%) | 148.0 |
| College or Associate's Degree | 0 (0.0%) | 0.0 |
| Bachelor's Degree | 0 (0.0%) | 0.0 |
| Graduate Degree | 0 (0.0%) | 0.0 |
| Total | 4 (100.0%) | 63.0 |
Fertility by Education by Marriage Status in Leland
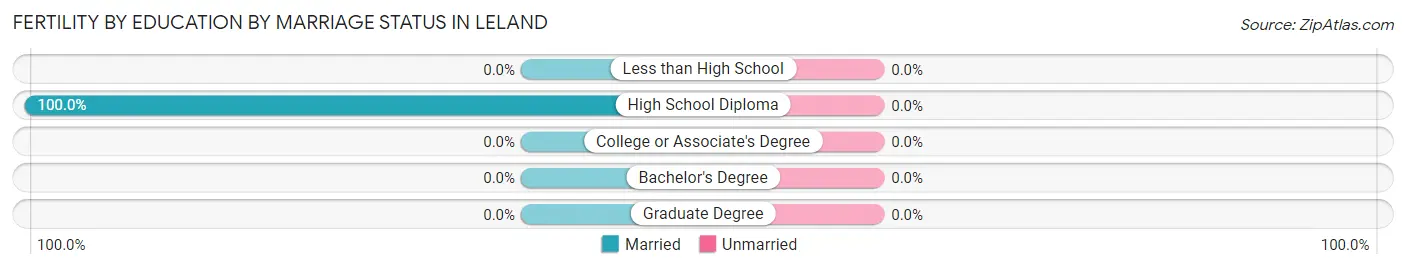
| Educational Attainment | Married | Unmarried |
| Less than High School | 0 (0.0%) | 0 (0.0%) |
| High School Diploma | 4 (100.0%) | 0 (0.0%) |
| College or Associate's Degree | 0 (0.0%) | 0 (0.0%) |
| Bachelor's Degree | 0 (0.0%) | 0 (0.0%) |
| Graduate Degree | 0 (0.0%) | 0 (0.0%) |
| Total | 4 (100.0%) | 0 (0.0%) |
Employment Characteristics in Leland
Employment by Class of Employer in Leland
Among the 108 employed individuals in Leland, private company employees (91 | 84.3%), local government employees (7 | 6.5%), and self-employed (not incorporated) (4 | 3.7%) make up the most common classes of employment.
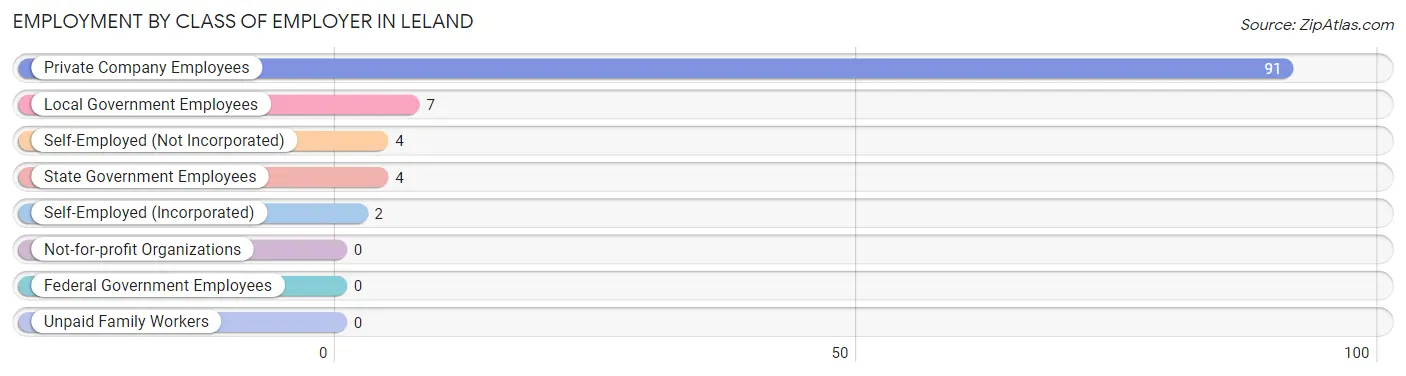
| Employer Class | # Employees | % Employees |
| Private Company Employees | 91 | 84.3% |
| Self-Employed (Incorporated) | 2 | 1.8% |
| Self-Employed (Not Incorporated) | 4 | 3.7% |
| Not-for-profit Organizations | 0 | 0.0% |
| Local Government Employees | 7 | 6.5% |
| State Government Employees | 4 | 3.7% |
| Federal Government Employees | 0 | 0.0% |
| Unpaid Family Workers | 0 | 0.0% |
| Total | 108 | 100.0% |
Employment Status by Age in Leland
According to the labor force statistics for Leland, out of the total population over 16 years of age (188), 61.7% or 116 individuals are in the labor force, with 6.9% or 8 of them unemployed. The age group with the highest labor force participation rate is 20 to 24 years, with 100.0% or 4 individuals in the labor force. Within the labor force, the 65 to 74 years age range has the highest percentage of unemployed individuals, with 66.7% or 4 of them being unemployed.
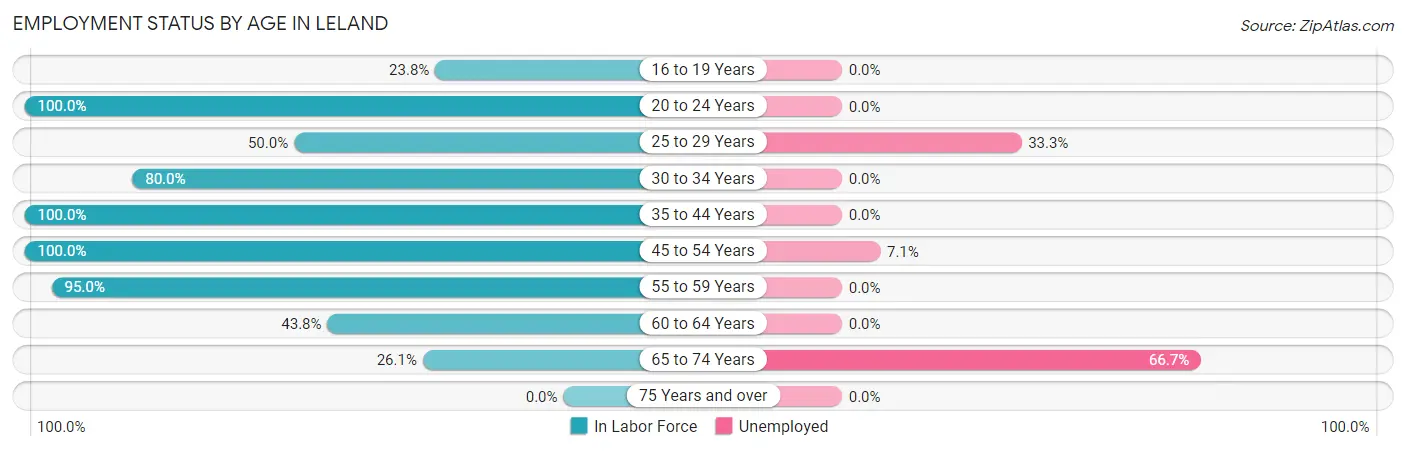
| Age Bracket | In Labor Force | Unemployed |
| 16 to 19 Years | 5 (23.8%) | 0 (0.0%) |
| 20 to 24 Years | 4 (100.0%) | 0 (0.0%) |
| 25 to 29 Years | 6 (50.0%) | 2 (33.3%) |
| 30 to 34 Years | 20 (80.0%) | 0 (0.0%) |
| 35 to 44 Years | 21 (100.0%) | 0 (0.0%) |
| 45 to 54 Years | 28 (100.0%) | 2 (7.1%) |
| 55 to 59 Years | 19 (95.0%) | 0 (0.0%) |
| 60 to 64 Years | 7 (43.8%) | 0 (0.0%) |
| 65 to 74 Years | 6 (26.1%) | 4 (66.7%) |
| 75 Years and over | 0 (0.0%) | 0 (0.0%) |
| Total | 116 (61.7%) | 8 (6.9%) |
Employment Status by Educational Attainment in Leland
According to labor force statistics for Leland, 82.8% of individuals (101) out of the total population between 25 and 64 years of age (122) are in the labor force, with 4.0% or 4 of them being unemployed. The group with the highest labor force participation rate are those with the educational attainment of less than high school, with 84.6% or 11 individuals in the labor force. Within the labor force, individuals with high school diploma education have the highest percentage of unemployment, with 7.8% or 4 of them being unemployed.
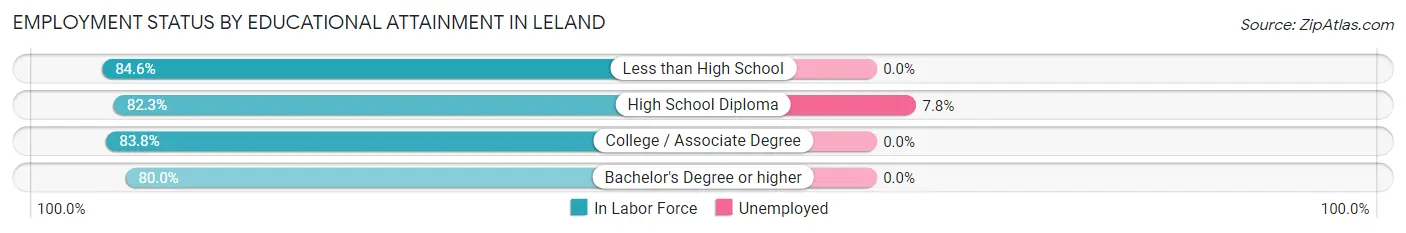
| Educational Attainment | In Labor Force | Unemployed |
| Less than High School | 11 (84.6%) | 0 (0.0%) |
| High School Diploma | 51 (82.3%) | 5 (7.8%) |
| College / Associate Degree | 31 (83.8%) | 0 (0.0%) |
| Bachelor's Degree or higher | 8 (80.0%) | 0 (0.0%) |
| Total | 101 (82.8%) | 5 (4.0%) |
Employment Occupations by Sex in Leland
Management, Business, Science and Arts Occupations
The most common Management, Business, Science and Arts occupations in Leland are Management (7 | 6.5%), Community & Social Service (4 | 3.7%), Arts, Media & Entertainment (4 | 3.7%), Computers, Engineering & Science (1 | 0.9%), and Architecture & Engineering (1 | 0.9%).
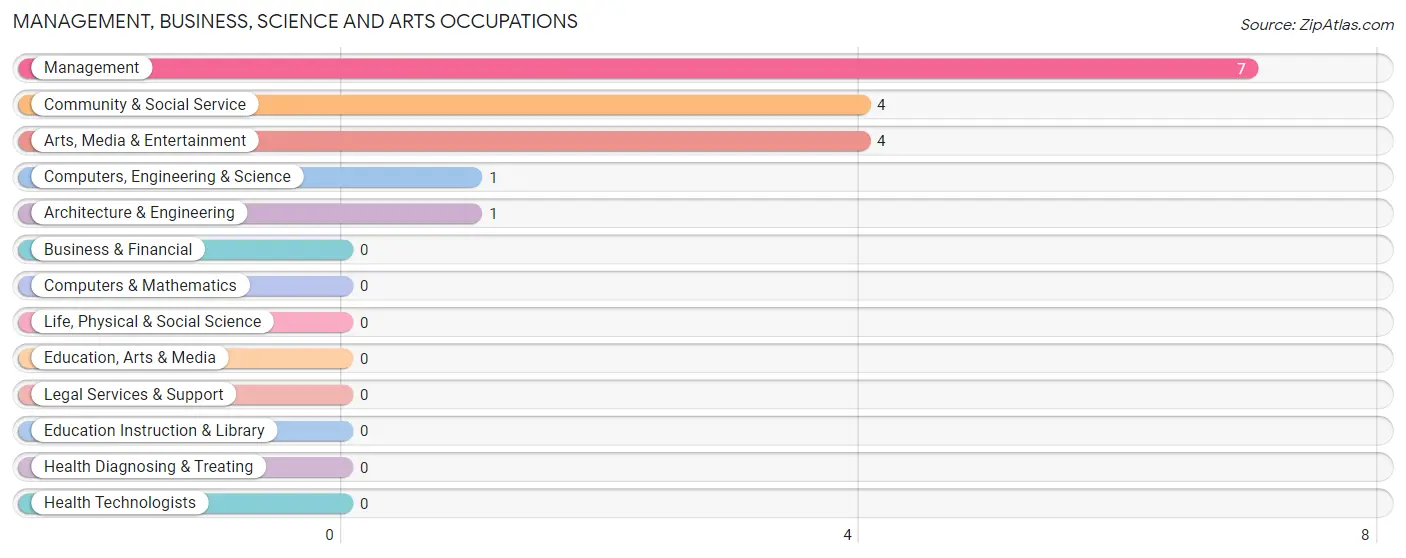
Management, Business, Science and Arts Occupations by Sex
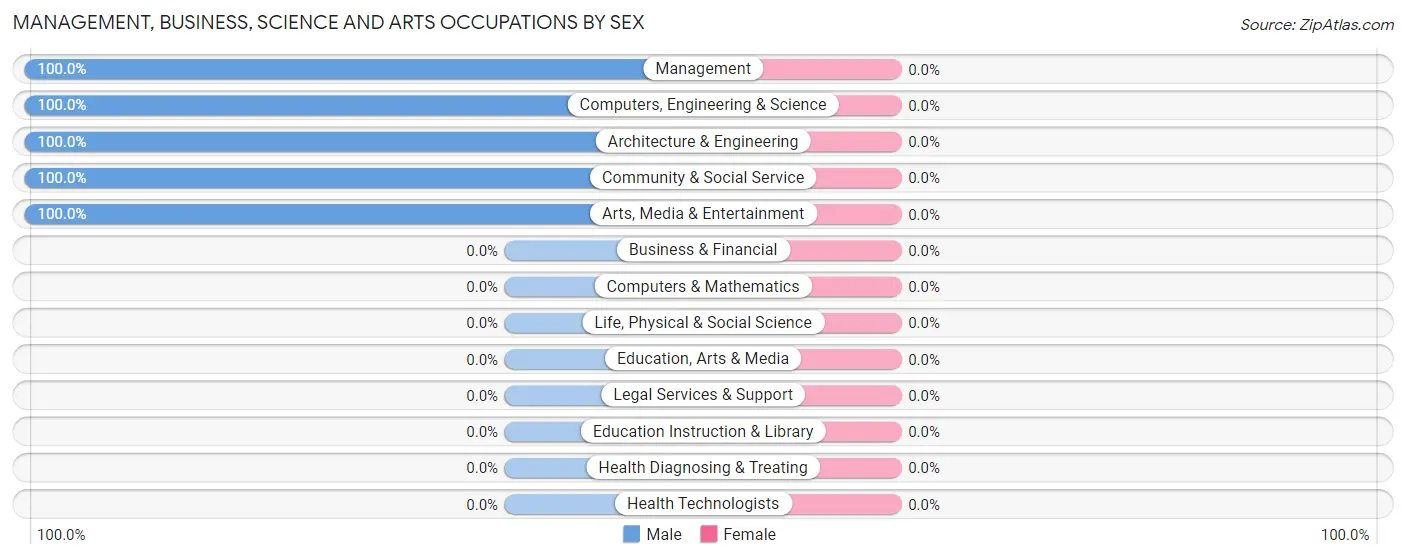
| Occupation | Male | Female |
| Management | 7 (100.0%) | 0 (0.0%) |
| Business & Financial | 0 (0.0%) | 0 (0.0%) |
| Computers, Engineering & Science | 1 (100.0%) | 0 (0.0%) |
| Computers & Mathematics | 0 (0.0%) | 0 (0.0%) |
| Architecture & Engineering | 1 (100.0%) | 0 (0.0%) |
| Life, Physical & Social Science | 0 (0.0%) | 0 (0.0%) |
| Community & Social Service | 4 (100.0%) | 0 (0.0%) |
| Education, Arts & Media | 0 (0.0%) | 0 (0.0%) |
| Legal Services & Support | 0 (0.0%) | 0 (0.0%) |
| Education Instruction & Library | 0 (0.0%) | 0 (0.0%) |
| Arts, Media & Entertainment | 4 (100.0%) | 0 (0.0%) |
| Health Diagnosing & Treating | 0 (0.0%) | 0 (0.0%) |
| Health Technologists | 0 (0.0%) | 0 (0.0%) |
| Total (Category) | 12 (100.0%) | 0 (0.0%) |
| Total (Overall) | 52 (48.1%) | 56 (51.8%) |
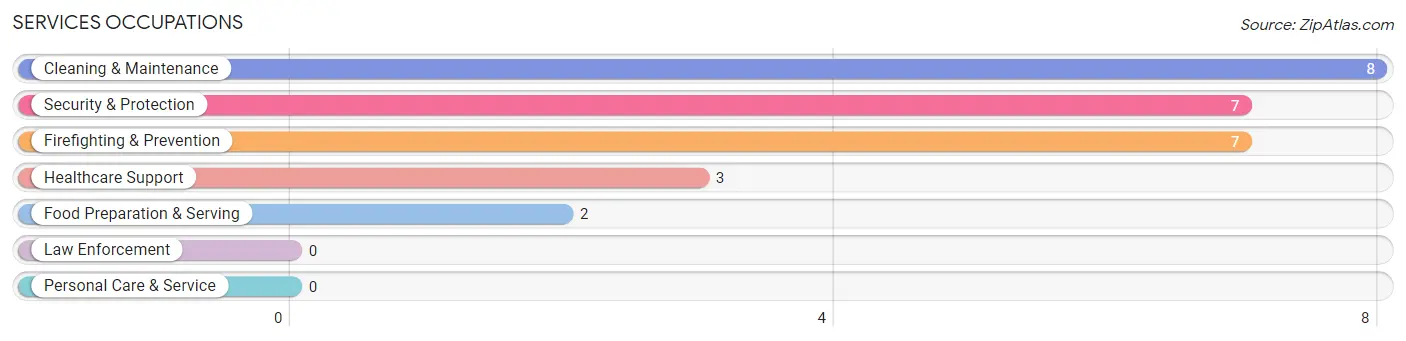
Services Occupations
The most common Services occupations in Leland are Cleaning & Maintenance (8 | 7.4%), Security & Protection (7 | 6.5%), Firefighting & Prevention (7 | 6.5%), Healthcare Support (3 | 2.8%), and Food Preparation & Serving (2 | 1.8%).
Services Occupations by Sex
Within the Services occupations in Leland, the most male-oriented occupations are Security & Protection (57.1%), Firefighting & Prevention (57.1%), and Cleaning & Maintenance (37.5%), while the most female-oriented occupations are Food Preparation & Serving (100.0%), Healthcare Support (66.7%), and Cleaning & Maintenance (62.5%).
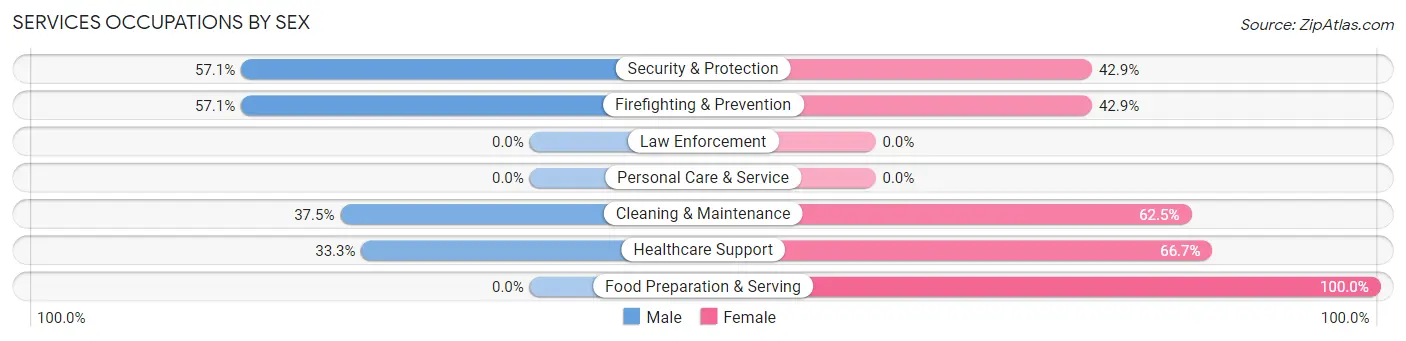
| Occupation | Male | Female |
| Healthcare Support | 1 (33.3%) | 2 (66.7%) |
| Security & Protection | 4 (57.1%) | 3 (42.9%) |
| Firefighting & Prevention | 4 (57.1%) | 3 (42.9%) |
| Law Enforcement | 0 (0.0%) | 0 (0.0%) |
| Food Preparation & Serving | 0 (0.0%) | 2 (100.0%) |
| Cleaning & Maintenance | 3 (37.5%) | 5 (62.5%) |
| Personal Care & Service | 0 (0.0%) | 0 (0.0%) |
| Total (Category) | 8 (40.0%) | 12 (60.0%) |
| Total (Overall) | 52 (48.1%) | 56 (51.8%) |
Sales and Office Occupations
The most common Sales and Office occupations in Leland are Office & Administration (18 | 16.7%), and Sales & Related (4 | 3.7%).
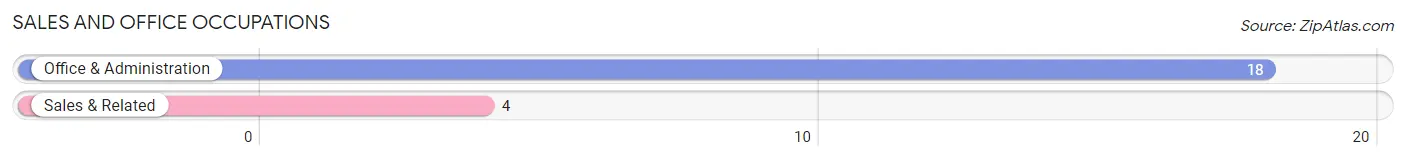
Sales and Office Occupations by Sex
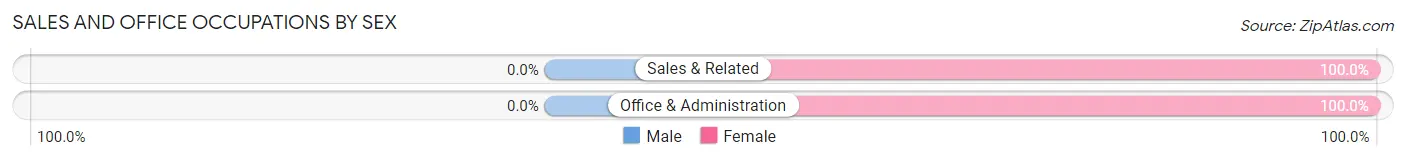
| Occupation | Male | Female |
| Sales & Related | 0 (0.0%) | 4 (100.0%) |
| Office & Administration | 0 (0.0%) | 18 (100.0%) |
| Total (Category) | 0 (0.0%) | 22 (100.0%) |
| Total (Overall) | 52 (48.1%) | 56 (51.8%) |
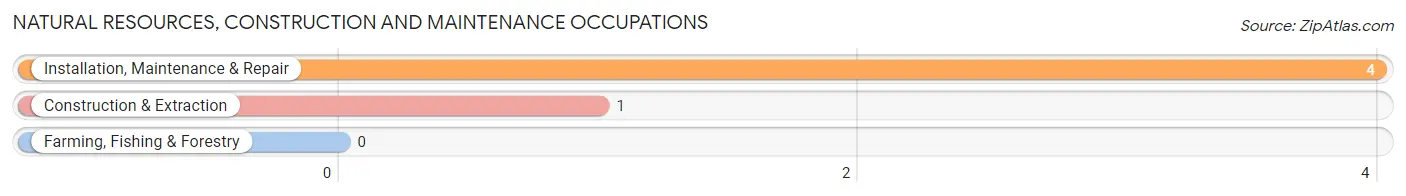
Natural Resources, Construction and Maintenance Occupations
The most common Natural Resources, Construction and Maintenance occupations in Leland are Installation, Maintenance & Repair (4 | 3.7%), and Construction & Extraction (1 | 0.9%).
Natural Resources, Construction and Maintenance Occupations by Sex
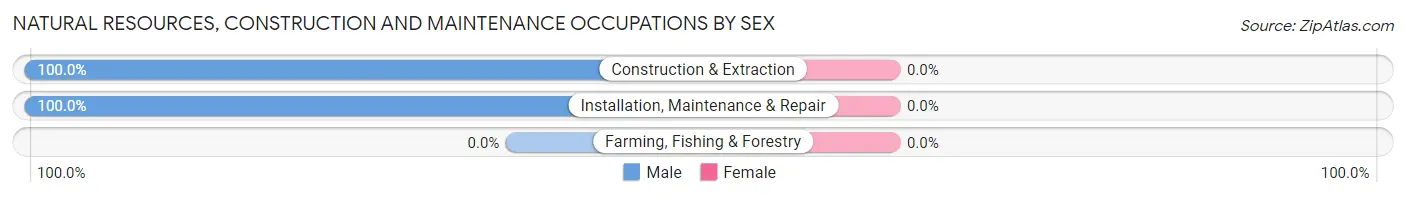
| Occupation | Male | Female |
| Farming, Fishing & Forestry | 0 (0.0%) | 0 (0.0%) |
| Construction & Extraction | 1 (100.0%) | 0 (0.0%) |
| Installation, Maintenance & Repair | 4 (100.0%) | 0 (0.0%) |
| Total (Category) | 5 (100.0%) | 0 (0.0%) |
| Total (Overall) | 52 (48.1%) | 56 (51.8%) |
Production, Transportation and Moving Occupations
The most common Production, Transportation and Moving occupations in Leland are Production (34 | 31.5%), Material Moving (12 | 11.1%), and Transportation (3 | 2.8%).
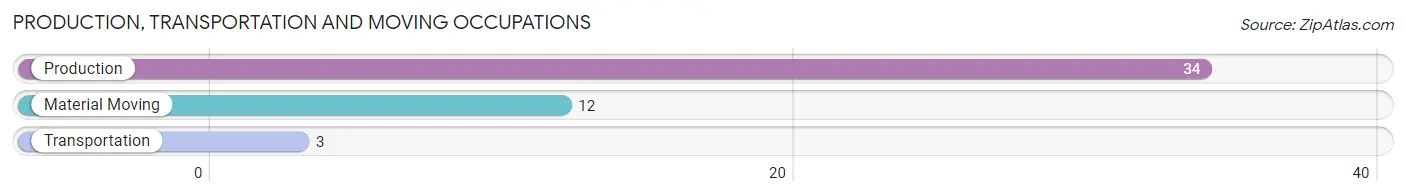
Production, Transportation and Moving Occupations by Sex
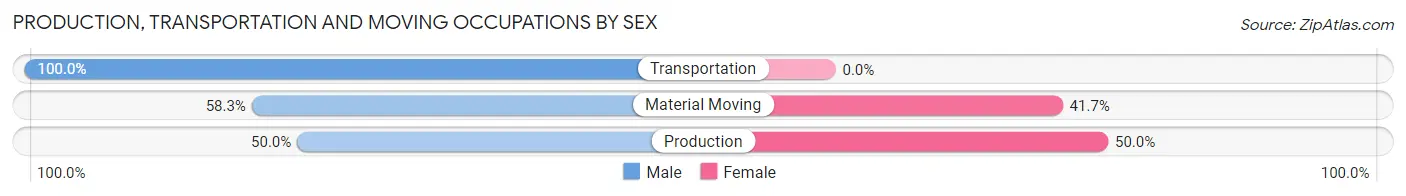
| Occupation | Male | Female |
| Production | 17 (50.0%) | 17 (50.0%) |
| Transportation | 3 (100.0%) | 0 (0.0%) |
| Material Moving | 7 (58.3%) | 5 (41.7%) |
| Total (Category) | 27 (55.1%) | 22 (44.9%) |
| Total (Overall) | 52 (48.1%) | 56 (51.8%) |
Employment Industries by Sex in Leland
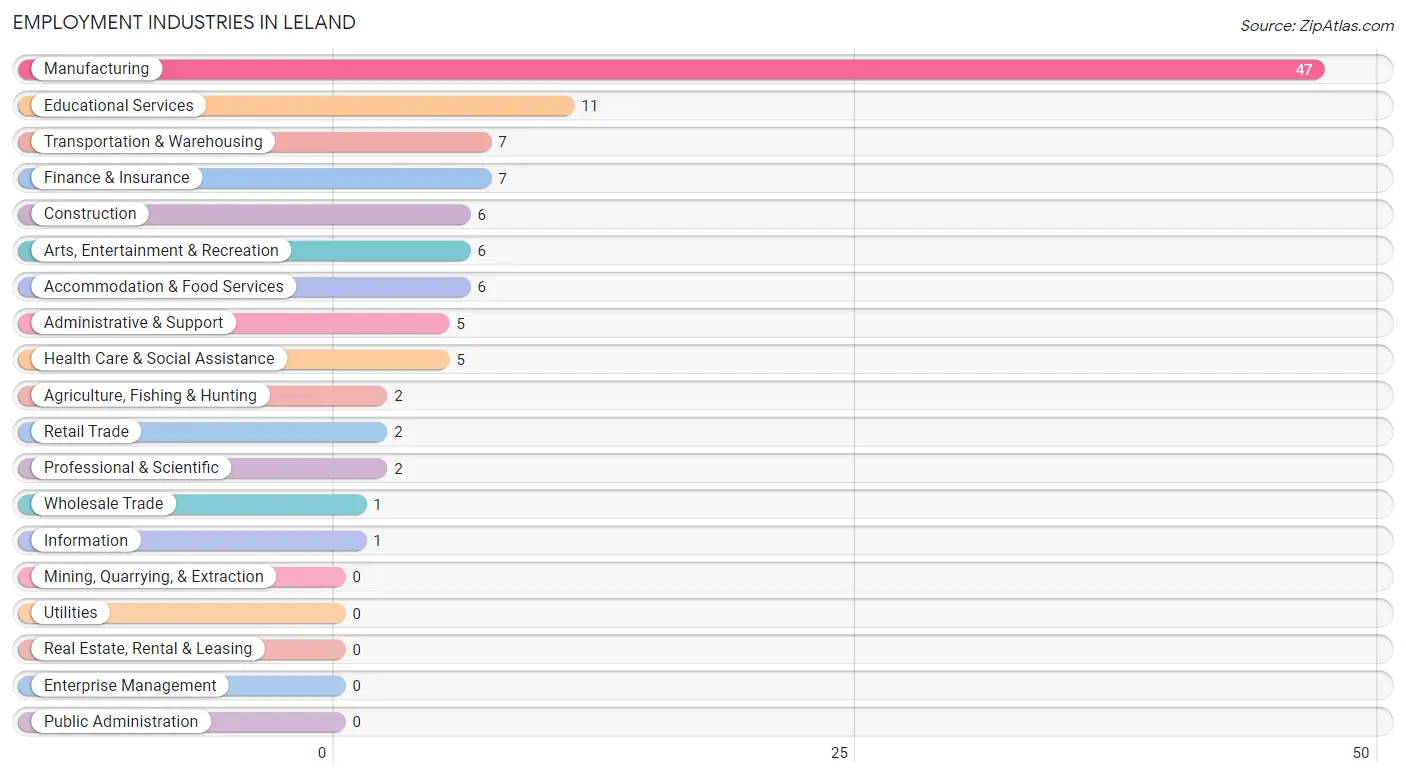
Employment Industries in Leland
The major employment industries in Leland include Manufacturing (47 | 43.5%), Educational Services (11 | 10.2%), Transportation & Warehousing (7 | 6.5%), Finance & Insurance (7 | 6.5%), and Construction (6 | 5.6%).
Employment Industries by Sex in Leland
The Leland industries that see more men than women are Construction (100.0%), Wholesale Trade (100.0%), and Information (100.0%), whereas the industries that tend to have a higher number of women are Agriculture, Fishing & Hunting (100.0%), Retail Trade (100.0%), and Finance & Insurance (100.0%).
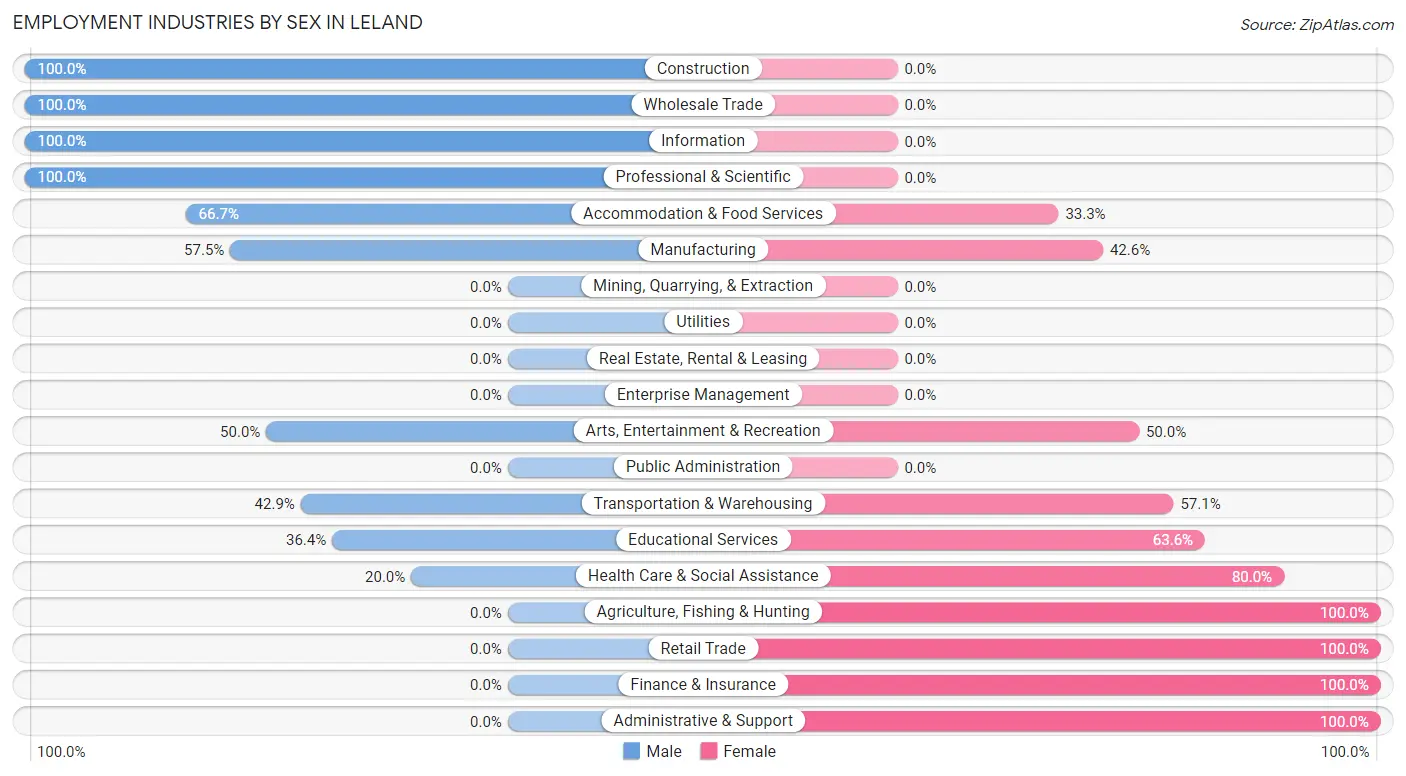
| Industry | Male | Female |
| Agriculture, Fishing & Hunting | 0 (0.0%) | 2 (100.0%) |
| Mining, Quarrying, & Extraction | 0 (0.0%) | 0 (0.0%) |
| Construction | 6 (100.0%) | 0 (0.0%) |
| Manufacturing | 27 (57.5%) | 20 (42.5%) |
| Wholesale Trade | 1 (100.0%) | 0 (0.0%) |
| Retail Trade | 0 (0.0%) | 2 (100.0%) |
| Transportation & Warehousing | 3 (42.9%) | 4 (57.1%) |
| Utilities | 0 (0.0%) | 0 (0.0%) |
| Information | 1 (100.0%) | 0 (0.0%) |
| Finance & Insurance | 0 (0.0%) | 7 (100.0%) |
| Real Estate, Rental & Leasing | 0 (0.0%) | 0 (0.0%) |
| Professional & Scientific | 2 (100.0%) | 0 (0.0%) |
| Enterprise Management | 0 (0.0%) | 0 (0.0%) |
| Administrative & Support | 0 (0.0%) | 5 (100.0%) |
| Educational Services | 4 (36.4%) | 7 (63.6%) |
| Health Care & Social Assistance | 1 (20.0%) | 4 (80.0%) |
| Arts, Entertainment & Recreation | 3 (50.0%) | 3 (50.0%) |
| Accommodation & Food Services | 4 (66.7%) | 2 (33.3%) |
| Public Administration | 0 (0.0%) | 0 (0.0%) |
| Total | 52 (48.1%) | 56 (51.8%) |
Education in Leland
School Enrollment in Leland
The most common levels of schooling among the 56 students in Leland are elementary school (23 | 41.1%), high school (16 | 28.6%), and kindergarten (5 | 8.9%).
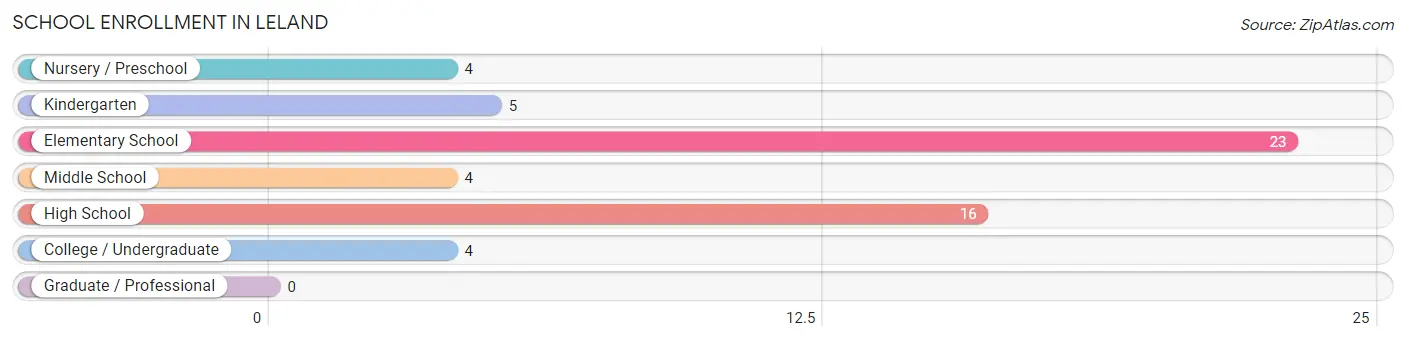
| School Level | # Students | % Students |
| Nursery / Preschool | 4 | 7.1% |
| Kindergarten | 5 | 8.9% |
| Elementary School | 23 | 41.1% |
| Middle School | 4 | 7.1% |
| High School | 16 | 28.6% |
| College / Undergraduate | 4 | 7.1% |
| Graduate / Professional | 0 | 0.0% |
| Total | 56 | 100.0% |
School Enrollment by Age by Funding Source in Leland
Out of a total of 56 students who are enrolled in schools in Leland, 4 (7.1%) attend a private institution, while the remaining 52 (92.9%) are enrolled in public schools. The age group of 10 to 14 year olds has the highest likelihood of being enrolled in private schools, with 4 (100.0% in the age bracket) enrolled. Conversely, the age group of 3 to 4 year olds has the lowest likelihood of being enrolled in a private school, with 4 (100.0% in the age bracket) attending a public institution.
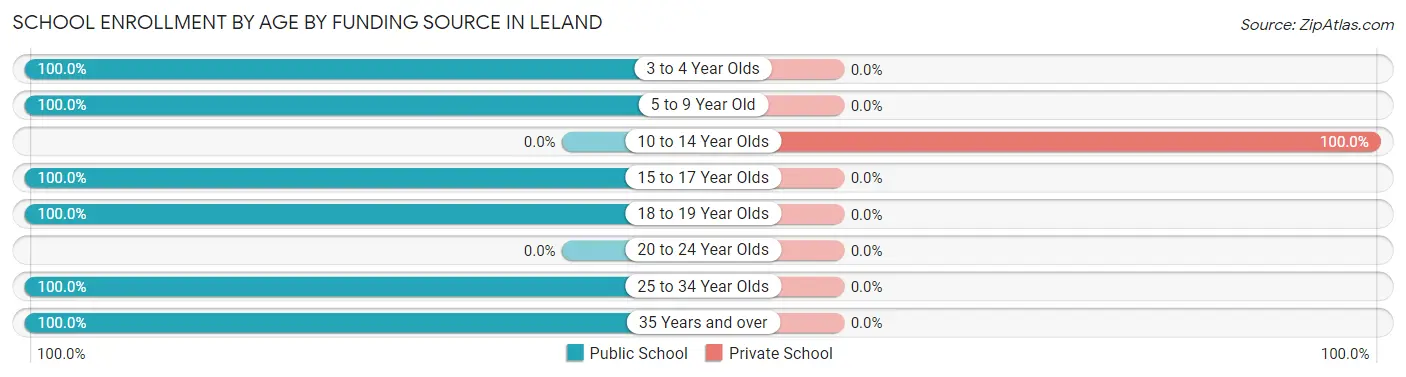
| Age Bracket | Public School | Private School |
| 3 to 4 Year Olds | 4 (100.0%) | 0 (0.0%) |
| 5 to 9 Year Old | 28 (100.0%) | 0 (0.0%) |
| 10 to 14 Year Olds | 0 (0.0%) | 4 (100.0%) |
| 15 to 17 Year Olds | 12 (100.0%) | 0 (0.0%) |
| 18 to 19 Year Olds | 2 (100.0%) | 0 (0.0%) |
| 20 to 24 Year Olds | 0 (0.0%) | 0 (0.0%) |
| 25 to 34 Year Olds | 2 (100.0%) | 0 (0.0%) |
| 35 Years and over | 4 (100.0%) | 0 (0.0%) |
| Total | 52 (92.9%) | 4 (7.1%) |
Educational Attainment by Field of Study in Leland
Engineering (4 | 28.6%), education (4 | 28.6%), business (3 | 21.4%), bio, nature & agricultural (1 | 7.1%), and liberal arts & history (1 | 7.1%) are the most common fields of study among 14 individuals in Leland who have obtained a bachelor's degree or higher.
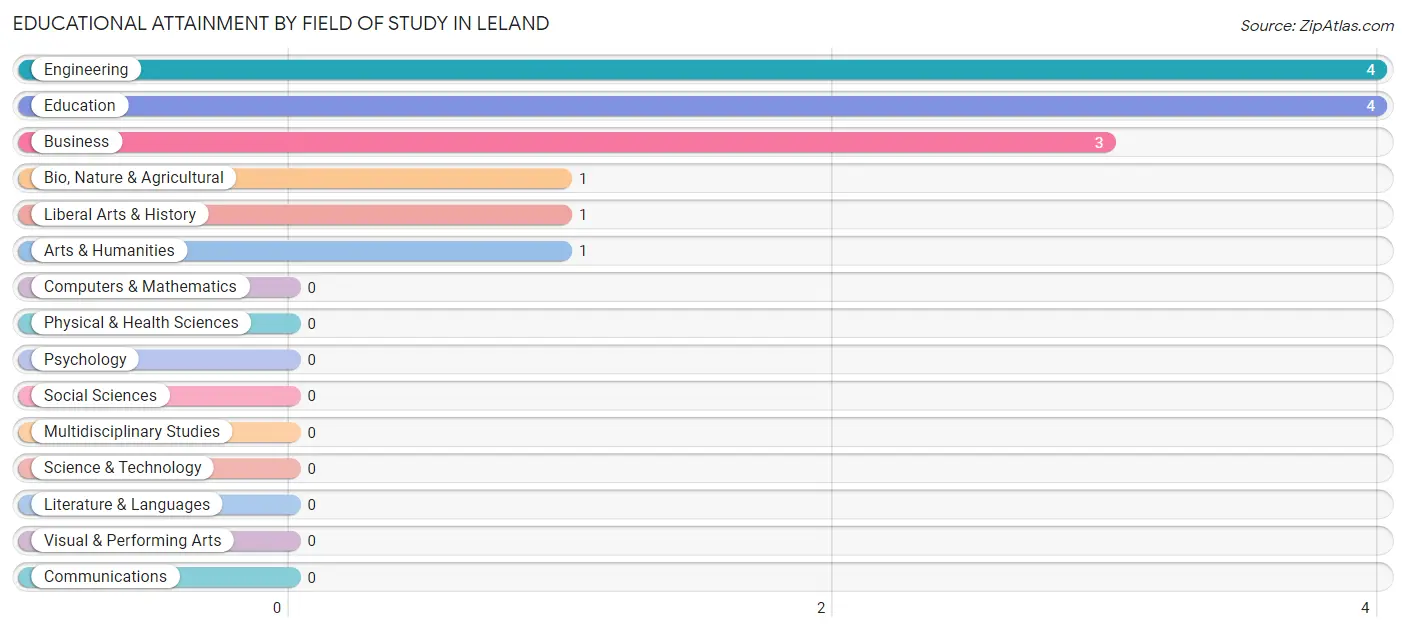
| Field of Study | # Graduates | % Graduates |
| Computers & Mathematics | 0 | 0.0% |
| Bio, Nature & Agricultural | 1 | 7.1% |
| Physical & Health Sciences | 0 | 0.0% |
| Psychology | 0 | 0.0% |
| Social Sciences | 0 | 0.0% |
| Engineering | 4 | 28.6% |
| Multidisciplinary Studies | 0 | 0.0% |
| Science & Technology | 0 | 0.0% |
| Business | 3 | 21.4% |
| Education | 4 | 28.6% |
| Literature & Languages | 0 | 0.0% |
| Liberal Arts & History | 1 | 7.1% |
| Visual & Performing Arts | 0 | 0.0% |
| Communications | 0 | 0.0% |
| Arts & Humanities | 1 | 7.1% |
| Total | 14 | 100.0% |
Transportation & Commute in Leland
Vehicle Availability by Sex in Leland
The most prevalent vehicle ownership categories in Leland are males with 2 vehicles (33, accounting for 63.5%) and females with 2 vehicles (40, making up 58.9%).
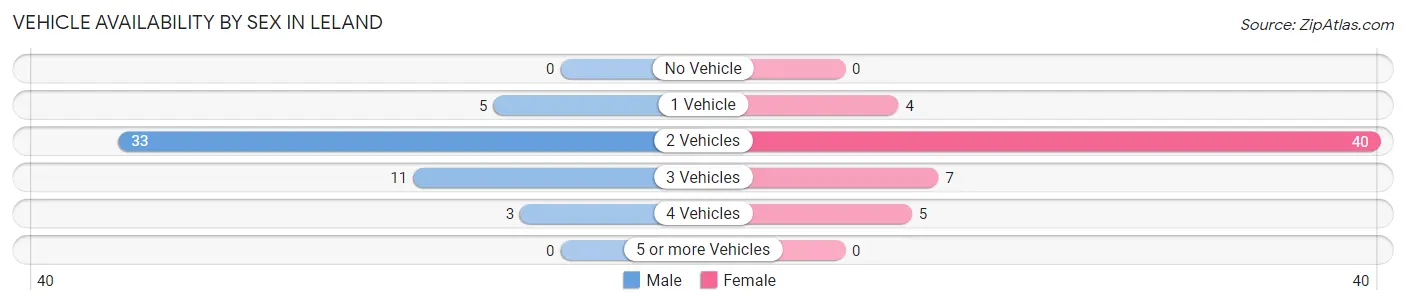
| Vehicles Available | Male | Female |
| No Vehicle | 0 (0.0%) | 0 (0.0%) |
| 1 Vehicle | 5 (9.6%) | 4 (7.1%) |
| 2 Vehicles | 33 (63.5%) | 40 (71.4%) |
| 3 Vehicles | 11 (21.1%) | 7 (12.5%) |
| 4 Vehicles | 3 (5.8%) | 5 (8.9%) |
| 5 or more Vehicles | 0 (0.0%) | 0 (0.0%) |
| Total | 52 (100.0%) | 56 (100.0%) |
Commute Time in Leland
The most frequently occuring commute durations in Leland are 10 to 14 minutes (40 commuters, 38.1%), 15 to 19 minutes (21 commuters, 20.0%), and 20 to 24 minutes (13 commuters, 12.4%).
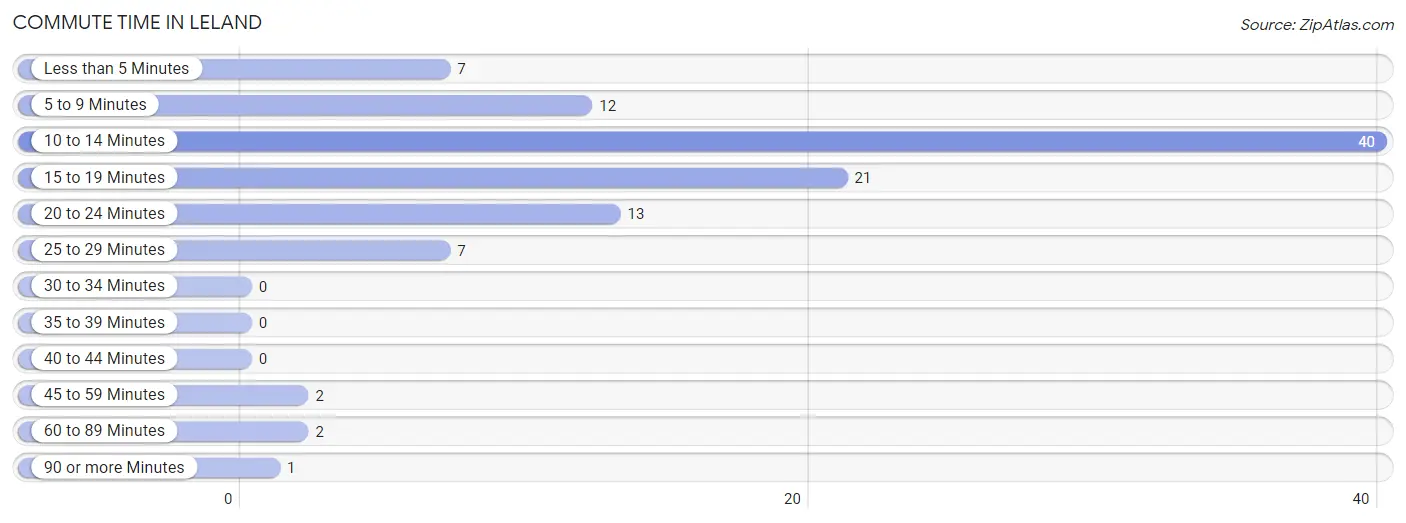
| Commute Time | # Commuters | % Commuters |
| Less than 5 Minutes | 7 | 6.7% |
| 5 to 9 Minutes | 12 | 11.4% |
| 10 to 14 Minutes | 40 | 38.1% |
| 15 to 19 Minutes | 21 | 20.0% |
| 20 to 24 Minutes | 13 | 12.4% |
| 25 to 29 Minutes | 7 | 6.7% |
| 30 to 34 Minutes | 0 | 0.0% |
| 35 to 39 Minutes | 0 | 0.0% |
| 40 to 44 Minutes | 0 | 0.0% |
| 45 to 59 Minutes | 2 | 1.9% |
| 60 to 89 Minutes | 2 | 1.9% |
| 90 or more Minutes | 1 | 0.9% |
Commute Time by Sex in Leland
The most common commute times in Leland are 10 to 14 minutes (17 commuters, 33.3%) for males and 10 to 14 minutes (23 commuters, 42.6%) for females.
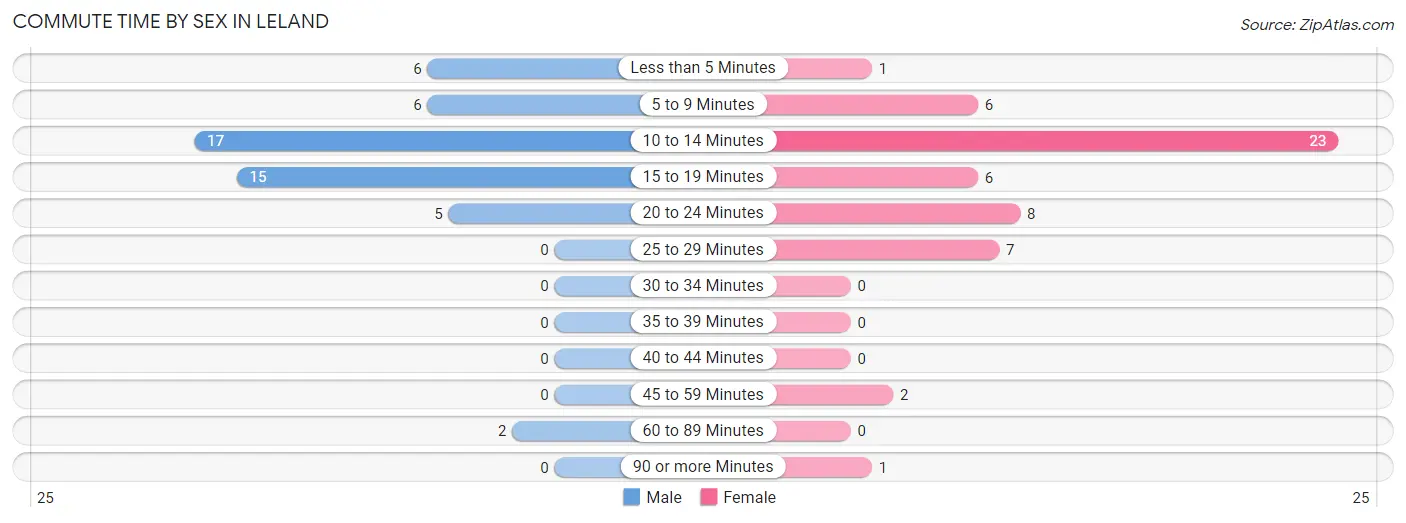
| Commute Time | Male | Female |
| Less than 5 Minutes | 6 (11.8%) | 1 (1.8%) |
| 5 to 9 Minutes | 6 (11.8%) | 6 (11.1%) |
| 10 to 14 Minutes | 17 (33.3%) | 23 (42.6%) |
| 15 to 19 Minutes | 15 (29.4%) | 6 (11.1%) |
| 20 to 24 Minutes | 5 (9.8%) | 8 (14.8%) |
| 25 to 29 Minutes | 0 (0.0%) | 7 (13.0%) |
| 30 to 34 Minutes | 0 (0.0%) | 0 (0.0%) |
| 35 to 39 Minutes | 0 (0.0%) | 0 (0.0%) |
| 40 to 44 Minutes | 0 (0.0%) | 0 (0.0%) |
| 45 to 59 Minutes | 0 (0.0%) | 2 (3.7%) |
| 60 to 89 Minutes | 2 (3.9%) | 0 (0.0%) |
| 90 or more Minutes | 0 (0.0%) | 1 (1.8%) |
Time of Departure to Work by Sex in Leland
The most frequent times of departure to work in Leland are 5:00 AM to 5:29 AM (11, 21.6%) for males and 7:30 AM to 7:59 AM (15, 27.8%) for females.
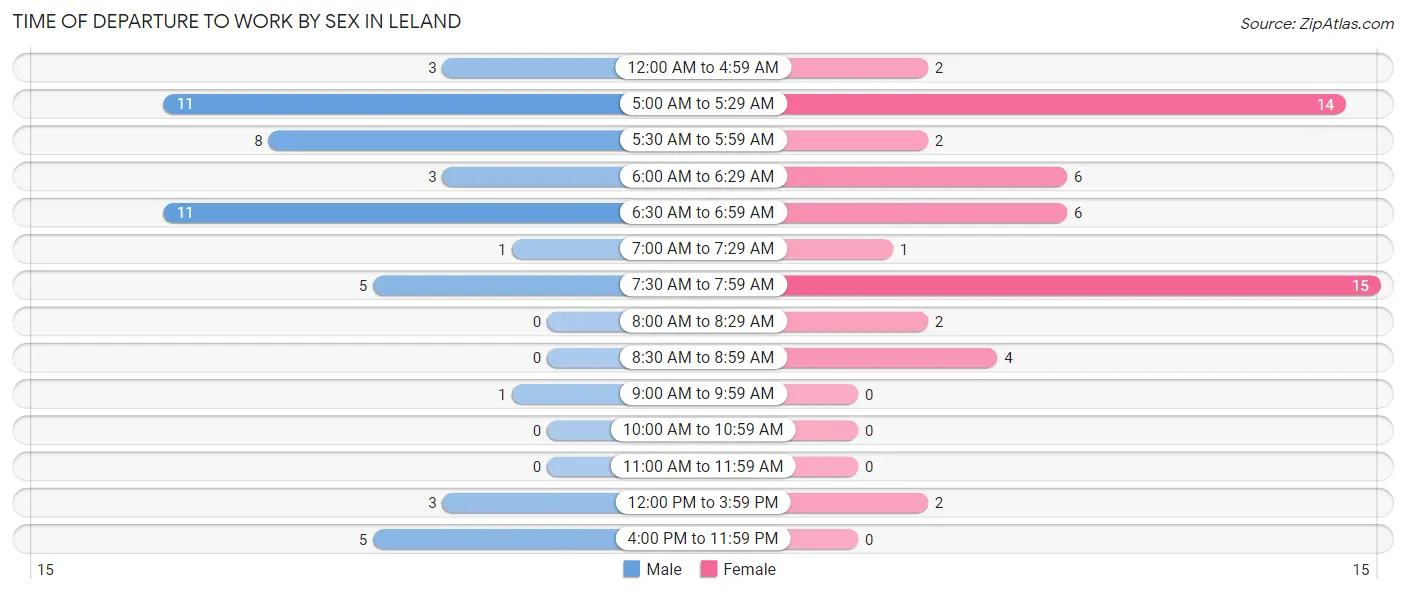
| Time of Departure | Male | Female |
| 12:00 AM to 4:59 AM | 3 (5.9%) | 2 (3.7%) |
| 5:00 AM to 5:29 AM | 11 (21.6%) | 14 (25.9%) |
| 5:30 AM to 5:59 AM | 8 (15.7%) | 2 (3.7%) |
| 6:00 AM to 6:29 AM | 3 (5.9%) | 6 (11.1%) |
| 6:30 AM to 6:59 AM | 11 (21.6%) | 6 (11.1%) |
| 7:00 AM to 7:29 AM | 1 (2.0%) | 1 (1.8%) |
| 7:30 AM to 7:59 AM | 5 (9.8%) | 15 (27.8%) |
| 8:00 AM to 8:29 AM | 0 (0.0%) | 2 (3.7%) |
| 8:30 AM to 8:59 AM | 0 (0.0%) | 4 (7.4%) |
| 9:00 AM to 9:59 AM | 1 (2.0%) | 0 (0.0%) |
| 10:00 AM to 10:59 AM | 0 (0.0%) | 0 (0.0%) |
| 11:00 AM to 11:59 AM | 0 (0.0%) | 0 (0.0%) |
| 12:00 PM to 3:59 PM | 3 (5.9%) | 2 (3.7%) |
| 4:00 PM to 11:59 PM | 5 (9.8%) | 0 (0.0%) |
| Total | 51 (100.0%) | 54 (100.0%) |
Housing Occupancy in Leland
Occupancy by Ownership in Leland
Of the total 104 dwellings in Leland, owner-occupied units account for 91 (87.5%), while renter-occupied units make up 13 (12.5%).
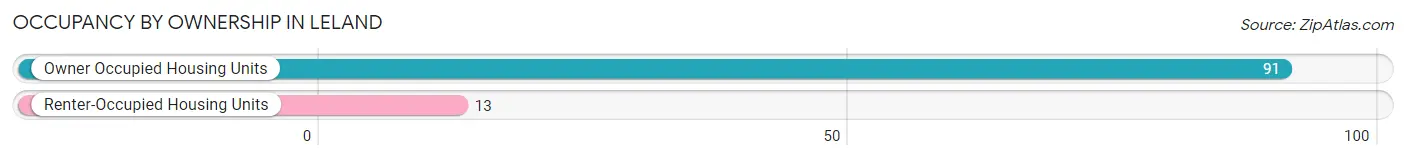
| Occupancy | # Housing Units | % Housing Units |
| Owner Occupied Housing Units | 91 | 87.5% |
| Renter-Occupied Housing Units | 13 | 12.5% |
| Total Occupied Housing Units | 104 | 100.0% |
Occupancy by Household Size in Leland
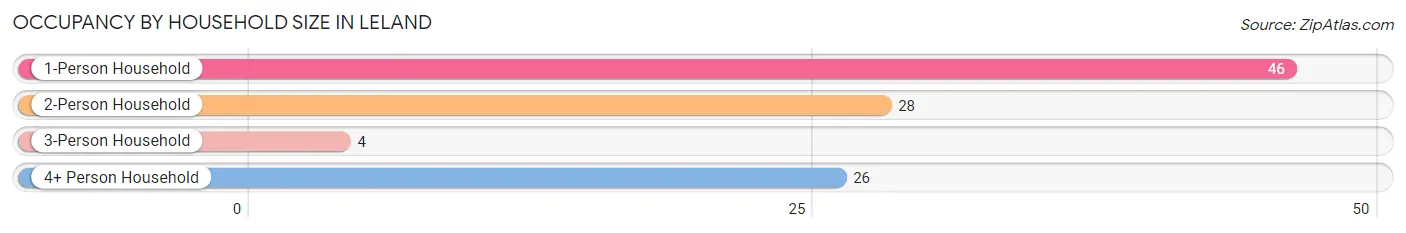
| Household Size | # Housing Units | % Housing Units |
| 1-Person Household | 46 | 44.2% |
| 2-Person Household | 28 | 26.9% |
| 3-Person Household | 4 | 3.8% |
| 4+ Person Household | 26 | 25.0% |
| Total Housing Units | 104 | 100.0% |
Occupancy by Ownership by Household Size in Leland
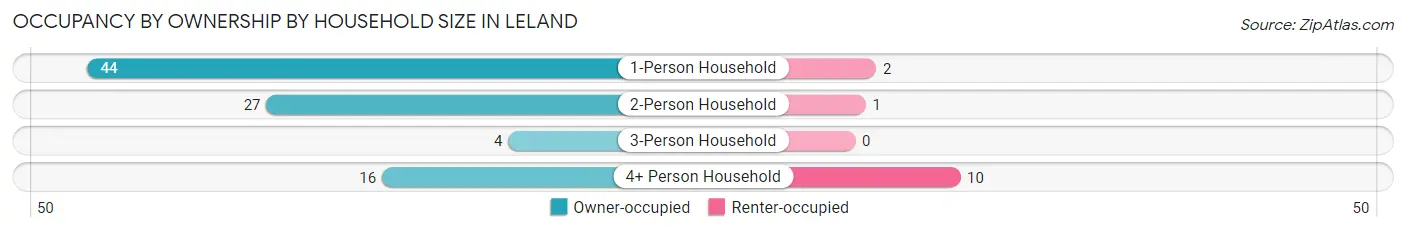
| Household Size | Owner-occupied | Renter-occupied |
| 1-Person Household | 44 (95.7%) | 2 (4.3%) |
| 2-Person Household | 27 (96.4%) | 1 (3.6%) |
| 3-Person Household | 4 (100.0%) | 0 (0.0%) |
| 4+ Person Household | 16 (61.5%) | 10 (38.5%) |
| Total Housing Units | 91 (87.5%) | 13 (12.5%) |
Occupancy by Educational Attainment in Leland
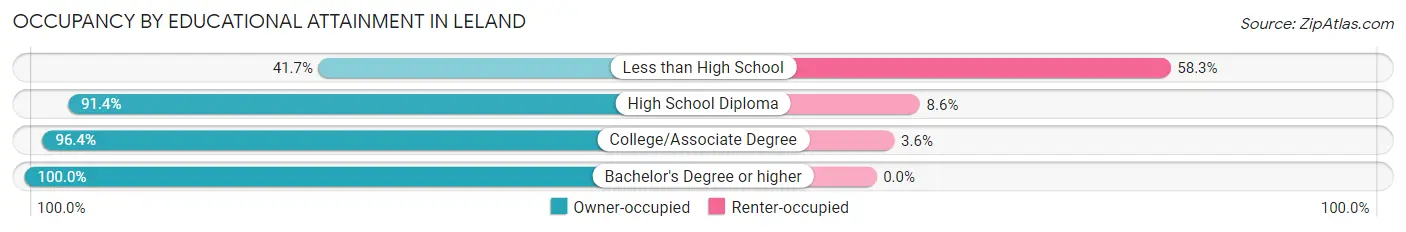
| Household Size | Owner-occupied | Renter-occupied |
| Less than High School | 5 (41.7%) | 7 (58.3%) |
| High School Diploma | 53 (91.4%) | 5 (8.6%) |
| College/Associate Degree | 27 (96.4%) | 1 (3.6%) |
| Bachelor's Degree or higher | 6 (100.0%) | 0 (0.0%) |
Occupancy by Age of Householder in Leland
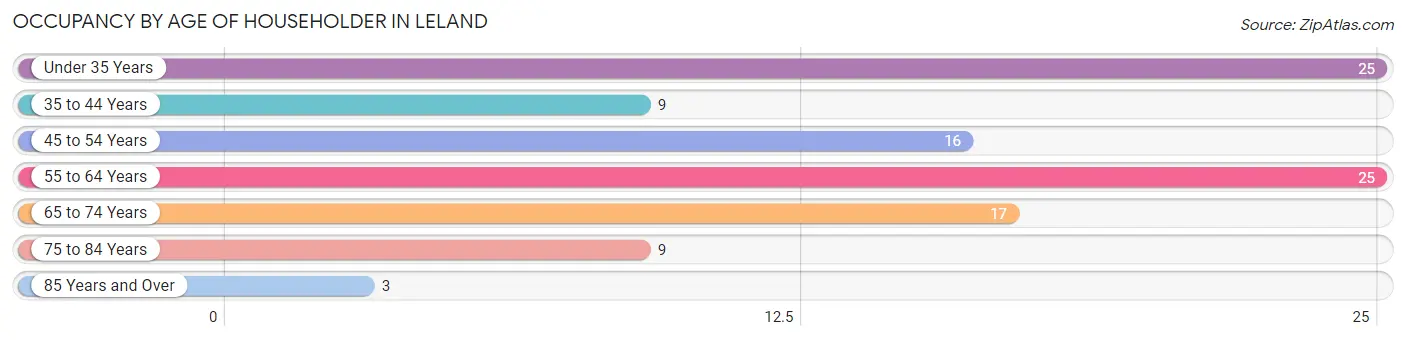
| Age Bracket | # Households | % Households |
| Under 35 Years | 25 | 24.0% |
| 35 to 44 Years | 9 | 8.6% |
| 45 to 54 Years | 16 | 15.4% |
| 55 to 64 Years | 25 | 24.0% |
| 65 to 74 Years | 17 | 16.4% |
| 75 to 84 Years | 9 | 8.6% |
| 85 Years and Over | 3 | 2.9% |
| Total | 104 | 100.0% |
Housing Finances in Leland
Median Income by Occupancy in Leland
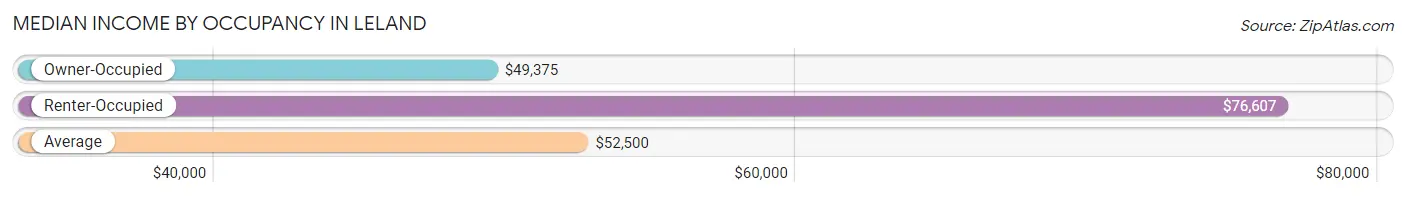
| Occupancy Type | # Households | Median Income |
| Owner-Occupied | 91 (87.5%) | $49,375 |
| Renter-Occupied | 13 (12.5%) | $76,607 |
| Average | 104 (100.0%) | $52,500 |
Occupancy by Householder Income Bracket in Leland
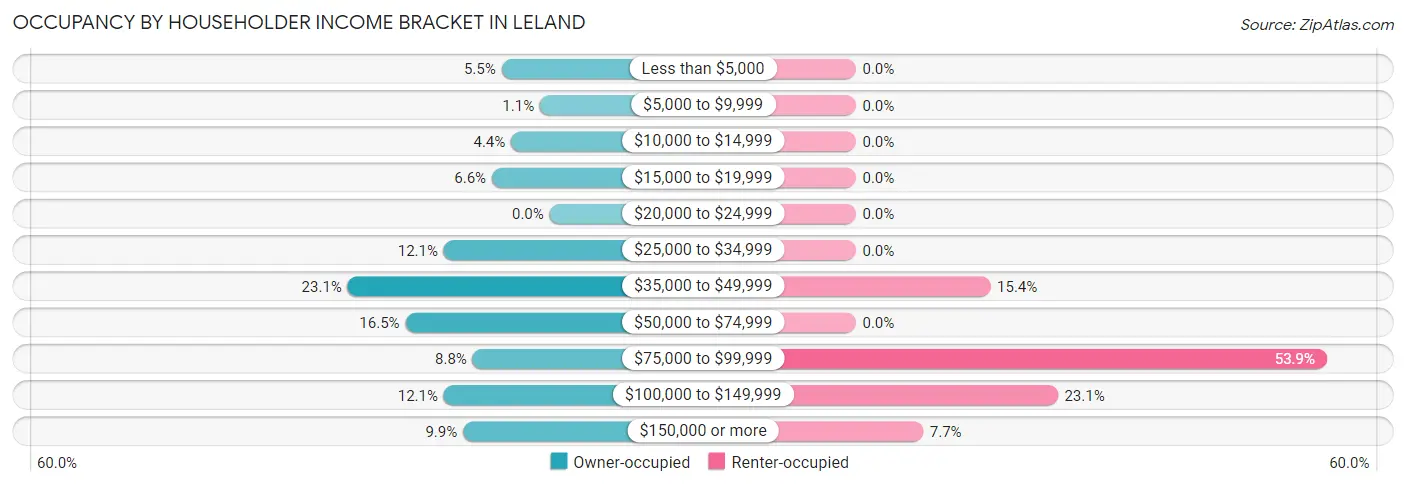
| Income Bracket | Owner-occupied | Renter-occupied |
| Less than $5,000 | 5 (5.5%) | 0 (0.0%) |
| $5,000 to $9,999 | 1 (1.1%) | 0 (0.0%) |
| $10,000 to $14,999 | 4 (4.4%) | 0 (0.0%) |
| $15,000 to $19,999 | 6 (6.6%) | 0 (0.0%) |
| $20,000 to $24,999 | 0 (0.0%) | 0 (0.0%) |
| $25,000 to $34,999 | 11 (12.1%) | 0 (0.0%) |
| $35,000 to $49,999 | 21 (23.1%) | 2 (15.4%) |
| $50,000 to $74,999 | 15 (16.5%) | 0 (0.0%) |
| $75,000 to $99,999 | 8 (8.8%) | 7 (53.8%) |
| $100,000 to $149,999 | 11 (12.1%) | 3 (23.1%) |
| $150,000 or more | 9 (9.9%) | 1 (7.7%) |
| Total | 91 (100.0%) | 13 (100.0%) |
Monthly Housing Cost Tiers in Leland
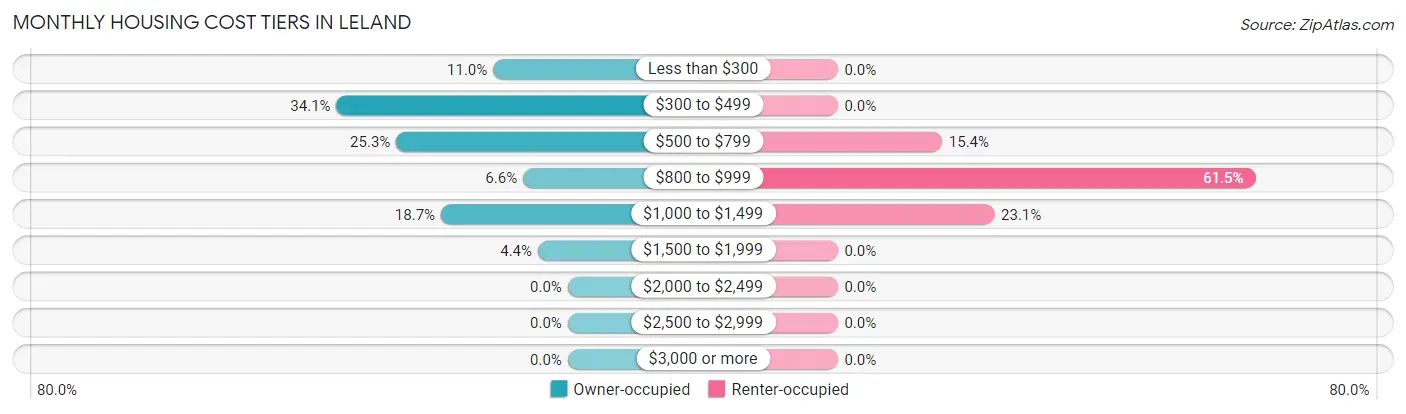
| Monthly Cost | Owner-occupied | Renter-occupied |
| Less than $300 | 10 (11.0%) | 0 (0.0%) |
| $300 to $499 | 31 (34.1%) | 0 (0.0%) |
| $500 to $799 | 23 (25.3%) | 2 (15.4%) |
| $800 to $999 | 6 (6.6%) | 8 (61.5%) |
| $1,000 to $1,499 | 17 (18.7%) | 3 (23.1%) |
| $1,500 to $1,999 | 4 (4.4%) | 0 (0.0%) |
| $2,000 to $2,499 | 0 (0.0%) | 0 (0.0%) |
| $2,500 to $2,999 | 0 (0.0%) | 0 (0.0%) |
| $3,000 or more | 0 (0.0%) | 0 (0.0%) |
| Total | 91 (100.0%) | 13 (100.0%) |
Physical Housing Characteristics in Leland
Housing Structures in Leland
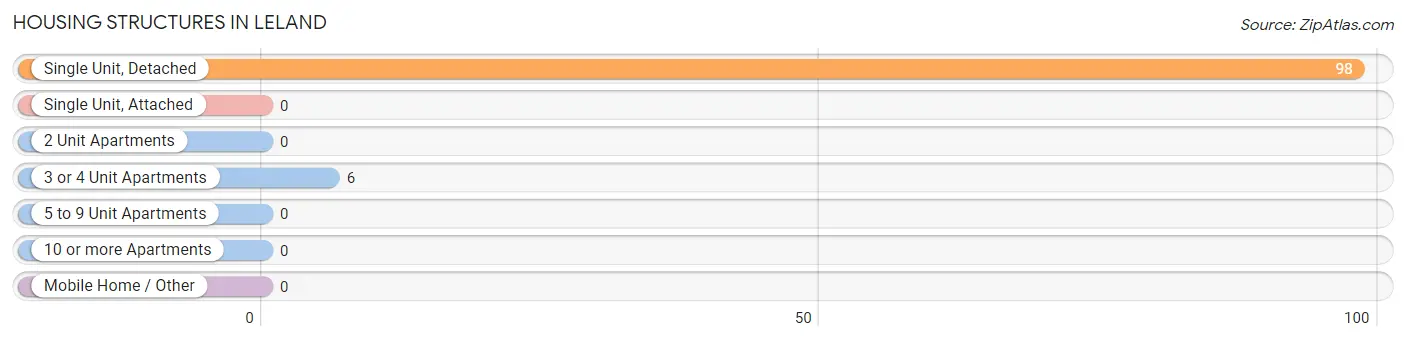
| Structure Type | # Housing Units | % Housing Units |
| Single Unit, Detached | 98 | 94.2% |
| Single Unit, Attached | 0 | 0.0% |
| 2 Unit Apartments | 0 | 0.0% |
| 3 or 4 Unit Apartments | 6 | 5.8% |
| 5 to 9 Unit Apartments | 0 | 0.0% |
| 10 or more Apartments | 0 | 0.0% |
| Mobile Home / Other | 0 | 0.0% |
| Total | 104 | 100.0% |
Housing Structures by Occupancy in Leland
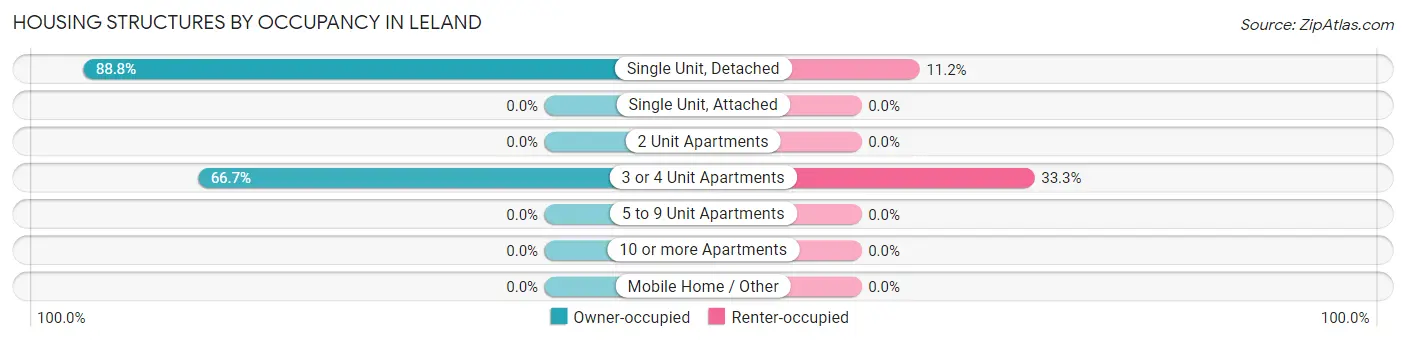
| Structure Type | Owner-occupied | Renter-occupied |
| Single Unit, Detached | 87 (88.8%) | 11 (11.2%) |
| Single Unit, Attached | 0 (0.0%) | 0 (0.0%) |
| 2 Unit Apartments | 0 (0.0%) | 0 (0.0%) |
| 3 or 4 Unit Apartments | 4 (66.7%) | 2 (33.3%) |
| 5 to 9 Unit Apartments | 0 (0.0%) | 0 (0.0%) |
| 10 or more Apartments | 0 (0.0%) | 0 (0.0%) |
| Mobile Home / Other | 0 (0.0%) | 0 (0.0%) |
| Total | 91 (87.5%) | 13 (12.5%) |
Housing Structures by Number of Rooms in Leland
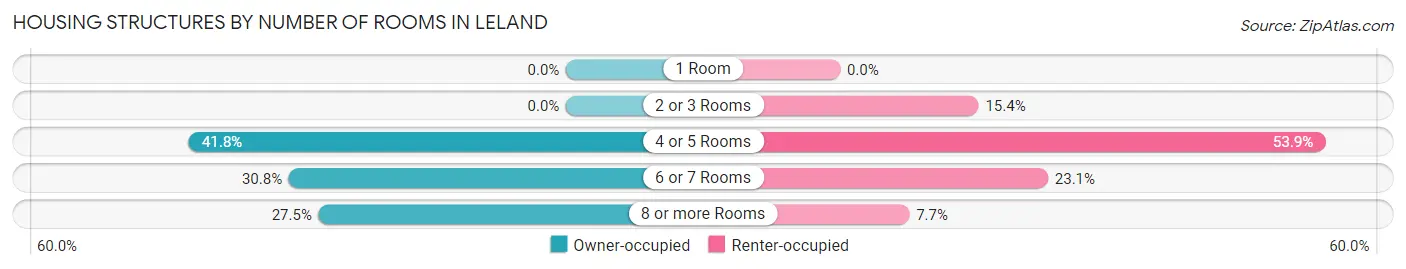
| Number of Rooms | Owner-occupied | Renter-occupied |
| 1 Room | 0 (0.0%) | 0 (0.0%) |
| 2 or 3 Rooms | 0 (0.0%) | 2 (15.4%) |
| 4 or 5 Rooms | 38 (41.8%) | 7 (53.8%) |
| 6 or 7 Rooms | 28 (30.8%) | 3 (23.1%) |
| 8 or more Rooms | 25 (27.5%) | 1 (7.7%) |
| Total | 91 (100.0%) | 13 (100.0%) |
Housing Structure by Heating Type in Leland
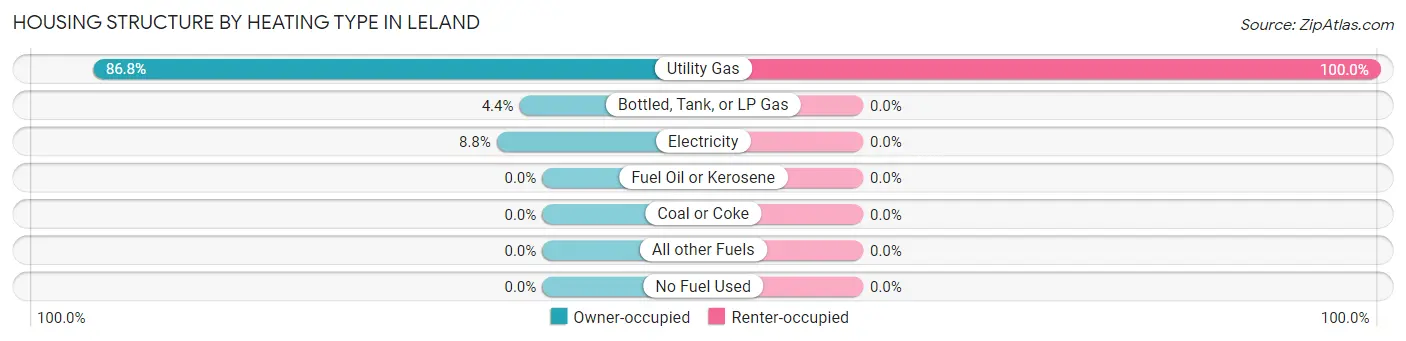
| Heating Type | Owner-occupied | Renter-occupied |
| Utility Gas | 79 (86.8%) | 13 (100.0%) |
| Bottled, Tank, or LP Gas | 4 (4.4%) | 0 (0.0%) |
| Electricity | 8 (8.8%) | 0 (0.0%) |
| Fuel Oil or Kerosene | 0 (0.0%) | 0 (0.0%) |
| Coal or Coke | 0 (0.0%) | 0 (0.0%) |
| All other Fuels | 0 (0.0%) | 0 (0.0%) |
| No Fuel Used | 0 (0.0%) | 0 (0.0%) |
| Total | 91 (100.0%) | 13 (100.0%) |
Household Vehicle Usage in Leland
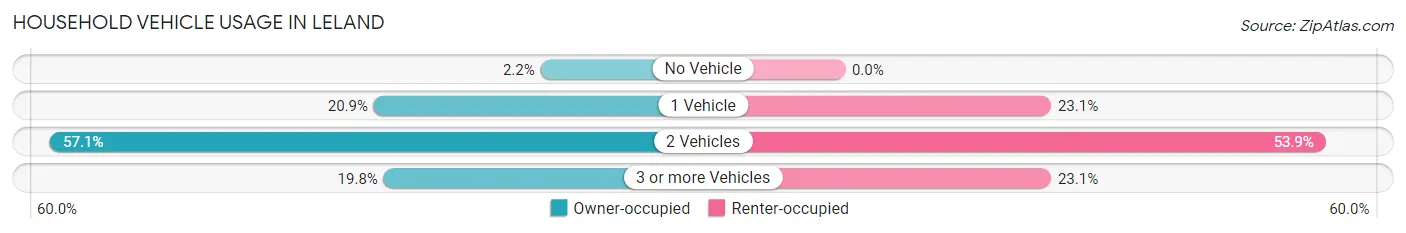
| Vehicles per Household | Owner-occupied | Renter-occupied |
| No Vehicle | 2 (2.2%) | 0 (0.0%) |
| 1 Vehicle | 19 (20.9%) | 3 (23.1%) |
| 2 Vehicles | 52 (57.1%) | 7 (53.8%) |
| 3 or more Vehicles | 18 (19.8%) | 3 (23.1%) |
| Total | 91 (100.0%) | 13 (100.0%) |
Real Estate & Mortgages in Leland
Real Estate and Mortgage Overview in Leland
| Characteristic | Without Mortgage | With Mortgage |
| Housing Units | 58 | 33 |
| Median Property Value | $72,000 | $102,500 |
| Median Household Income | $42,500 | $4 |
| Monthly Housing Costs | $408 | $0 |
| Real Estate Taxes | $1,271 | $0 |
Property Value by Mortgage Status in Leland
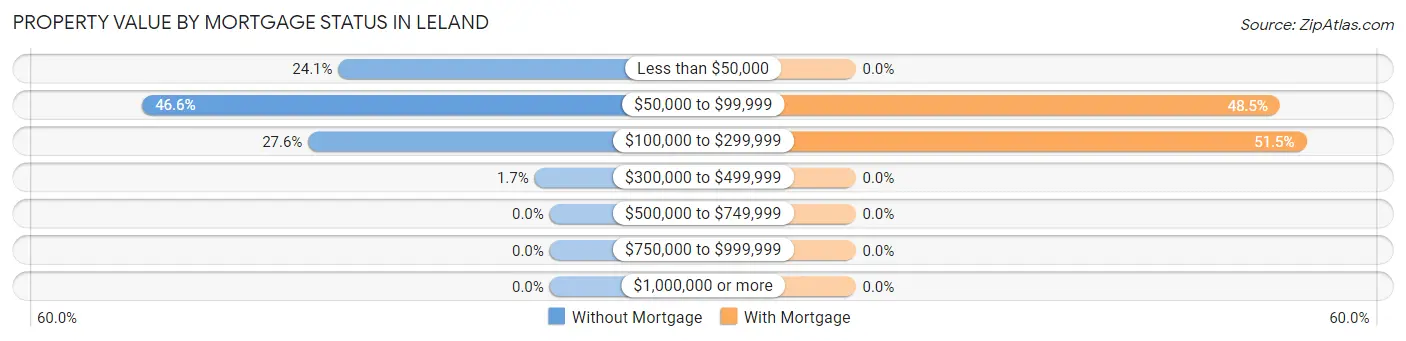
| Property Value | Without Mortgage | With Mortgage |
| Less than $50,000 | 14 (24.1%) | 0 (0.0%) |
| $50,000 to $99,999 | 27 (46.6%) | 16 (48.5%) |
| $100,000 to $299,999 | 16 (27.6%) | 17 (51.5%) |
| $300,000 to $499,999 | 1 (1.7%) | 0 (0.0%) |
| $500,000 to $749,999 | 0 (0.0%) | 0 (0.0%) |
| $750,000 to $999,999 | 0 (0.0%) | 0 (0.0%) |
| $1,000,000 or more | 0 (0.0%) | 0 (0.0%) |
| Total | 58 (100.0%) | 33 (100.0%) |
Household Income by Mortgage Status in Leland
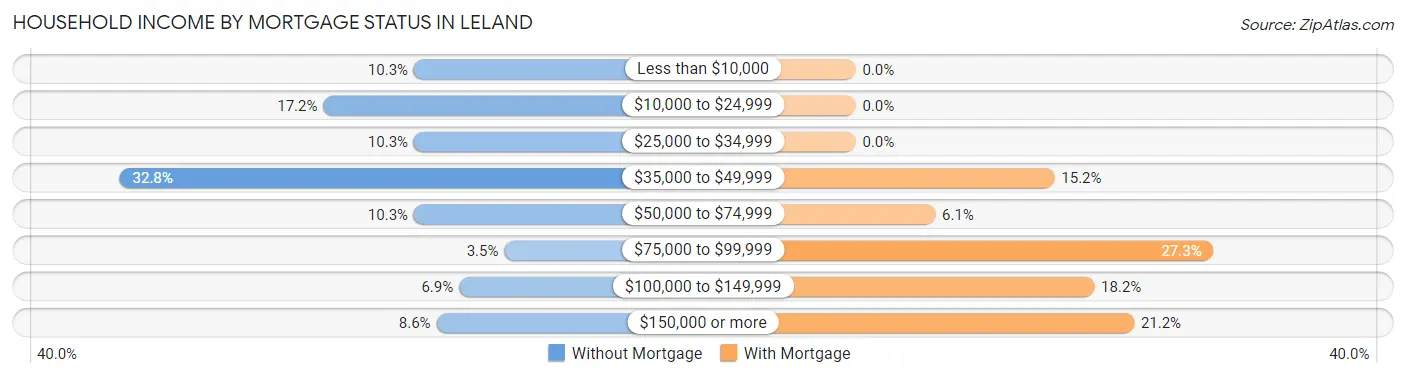
| Household Income | Without Mortgage | With Mortgage |
| Less than $10,000 | 6 (10.3%) | 0 (0.0%) |
| $10,000 to $24,999 | 10 (17.2%) | 0 (0.0%) |
| $25,000 to $34,999 | 6 (10.3%) | 0 (0.0%) |
| $35,000 to $49,999 | 19 (32.8%) | 5 (15.1%) |
| $50,000 to $74,999 | 6 (10.3%) | 2 (6.1%) |
| $75,000 to $99,999 | 2 (3.5%) | 9 (27.3%) |
| $100,000 to $149,999 | 4 (6.9%) | 6 (18.2%) |
| $150,000 or more | 5 (8.6%) | 7 (21.2%) |
| Total | 58 (100.0%) | 33 (100.0%) |
Property Value to Household Income Ratio in Leland
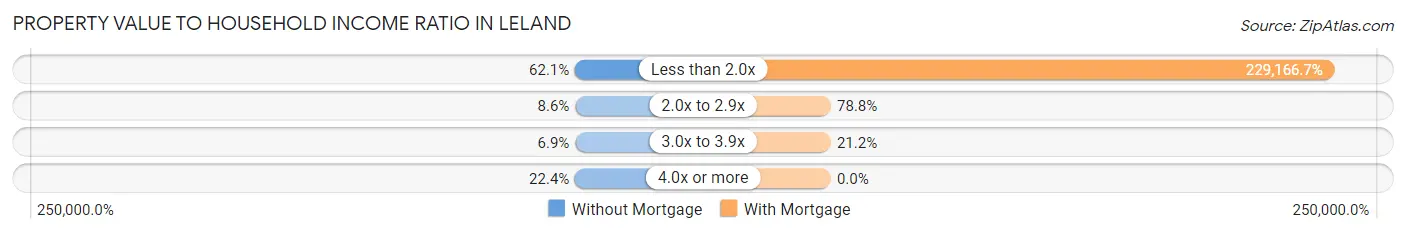
| Value-to-Income Ratio | Without Mortgage | With Mortgage |
| Less than 2.0x | 36 (62.1%) | 75,625 (229,166.7%) |
| 2.0x to 2.9x | 5 (8.6%) | 26 (78.8%) |
| 3.0x to 3.9x | 4 (6.9%) | 7 (21.2%) |
| 4.0x or more | 13 (22.4%) | 0 (0.0%) |
| Total | 58 (100.0%) | 33 (100.0%) |
Real Estate Taxes by Mortgage Status in Leland
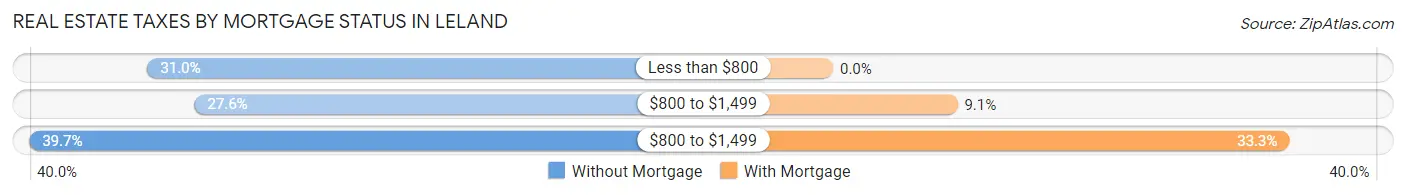
| Property Taxes | Without Mortgage | With Mortgage |
| Less than $800 | 18 (31.0%) | 0 (0.0%) |
| $800 to $1,499 | 16 (27.6%) | 3 (9.1%) |
| $800 to $1,499 | 23 (39.7%) | 11 (33.3%) |
| Total | 58 (100.0%) | 33 (100.0%) |
Health & Disability in Leland
Health Insurance Coverage by Age in Leland
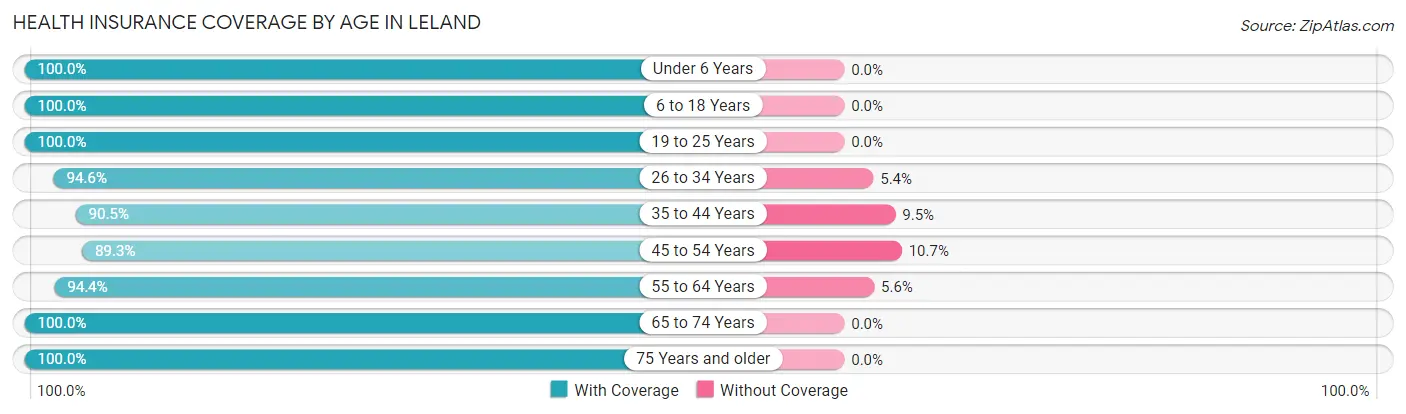
| Age Bracket | With Coverage | Without Coverage |
| Under 6 Years | 16 (100.0%) | 0 (0.0%) |
| 6 to 18 Years | 45 (100.0%) | 0 (0.0%) |
| 19 to 25 Years | 14 (100.0%) | 0 (0.0%) |
| 26 to 34 Years | 35 (94.6%) | 2 (5.4%) |
| 35 to 44 Years | 19 (90.5%) | 2 (9.5%) |
| 45 to 54 Years | 25 (89.3%) | 3 (10.7%) |
| 55 to 64 Years | 34 (94.4%) | 2 (5.6%) |
| 65 to 74 Years | 23 (100.0%) | 0 (0.0%) |
| 75 Years and older | 18 (100.0%) | 0 (0.0%) |
| Total | 229 (96.2%) | 9 (3.8%) |
Health Insurance Coverage by Citizenship Status in Leland
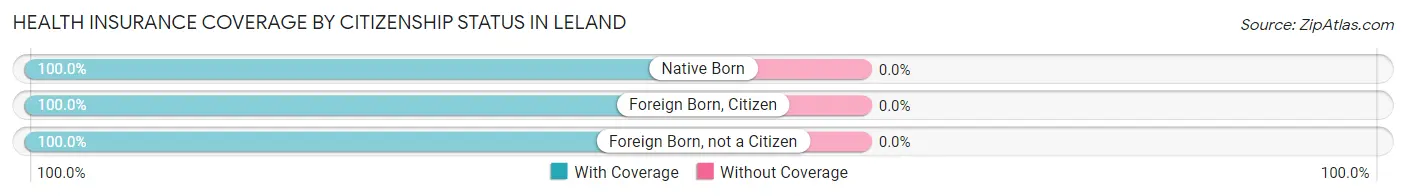
| Citizenship Status | With Coverage | Without Coverage |
| Native Born | 16 (100.0%) | 0 (0.0%) |
| Foreign Born, Citizen | 45 (100.0%) | 0 (0.0%) |
| Foreign Born, not a Citizen | 14 (100.0%) | 0 (0.0%) |
Health Insurance Coverage by Household Income in Leland
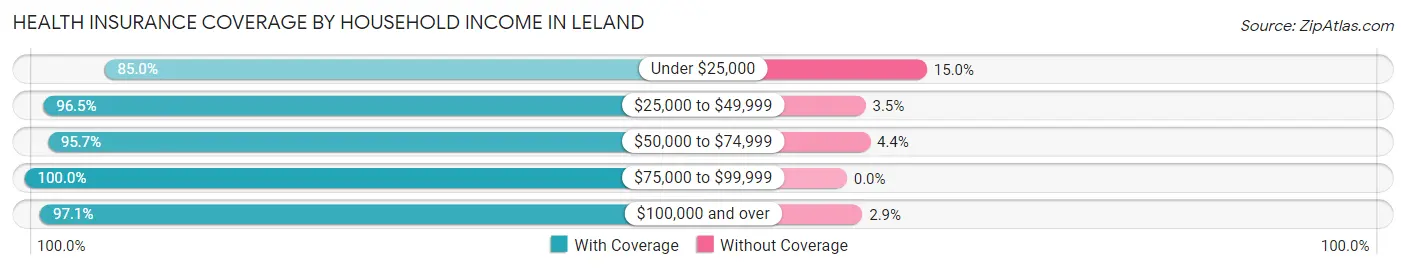
| Household Income | With Coverage | Without Coverage |
| Under $25,000 | 17 (85.0%) | 3 (15.0%) |
| $25,000 to $49,999 | 55 (96.5%) | 2 (3.5%) |
| $50,000 to $74,999 | 44 (95.7%) | 2 (4.3%) |
| $75,000 to $99,999 | 46 (100.0%) | 0 (0.0%) |
| $100,000 and over | 67 (97.1%) | 2 (2.9%) |
Public vs Private Health Insurance Coverage by Age in Leland
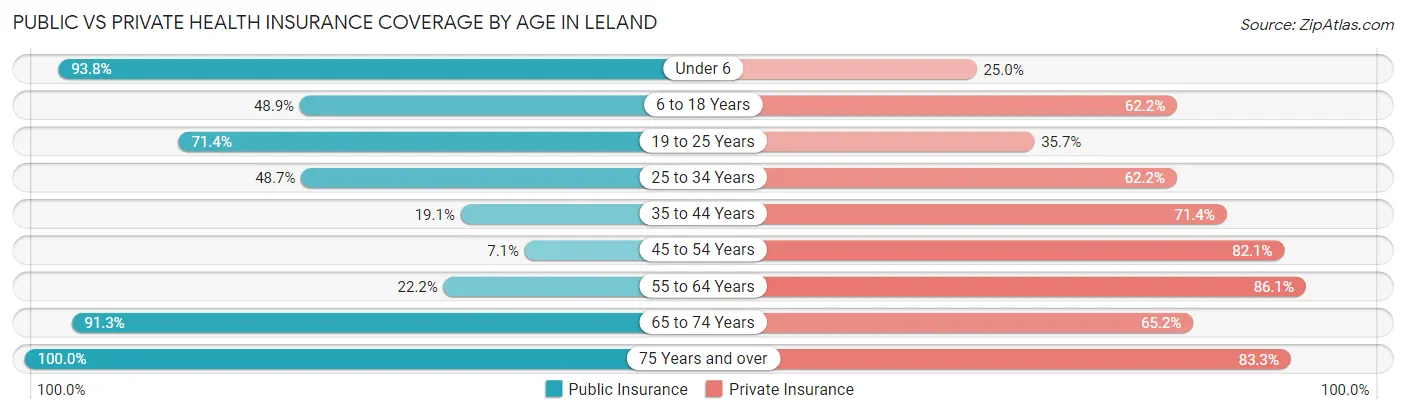
| Age Bracket | Public Insurance | Private Insurance |
| Under 6 | 15 (93.8%) | 4 (25.0%) |
| 6 to 18 Years | 22 (48.9%) | 28 (62.2%) |
| 19 to 25 Years | 10 (71.4%) | 5 (35.7%) |
| 25 to 34 Years | 18 (48.6%) | 23 (62.2%) |
| 35 to 44 Years | 4 (19.1%) | 15 (71.4%) |
| 45 to 54 Years | 2 (7.1%) | 23 (82.1%) |
| 55 to 64 Years | 8 (22.2%) | 31 (86.1%) |
| 65 to 74 Years | 21 (91.3%) | 15 (65.2%) |
| 75 Years and over | 18 (100.0%) | 15 (83.3%) |
| Total | 118 (49.6%) | 159 (66.8%) |
Disability Status by Sex by Age in Leland
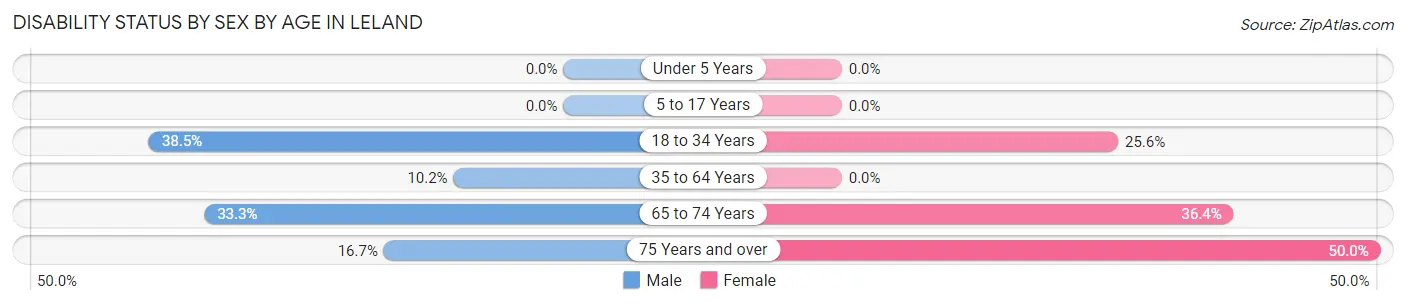
| Age Bracket | Male | Female |
| Under 5 Years | 0 (0.0%) | 0 (0.0%) |
| 5 to 17 Years | 0 (0.0%) | 0 (0.0%) |
| 18 to 34 Years | 5 (38.5%) | 10 (25.6%) |
| 35 to 64 Years | 5 (10.2%) | 0 (0.0%) |
| 65 to 74 Years | 4 (33.3%) | 4 (36.4%) |
| 75 Years and over | 1 (16.7%) | 6 (50.0%) |
Disability Class by Sex by Age in Leland
Disability Class: Hearing Difficulty
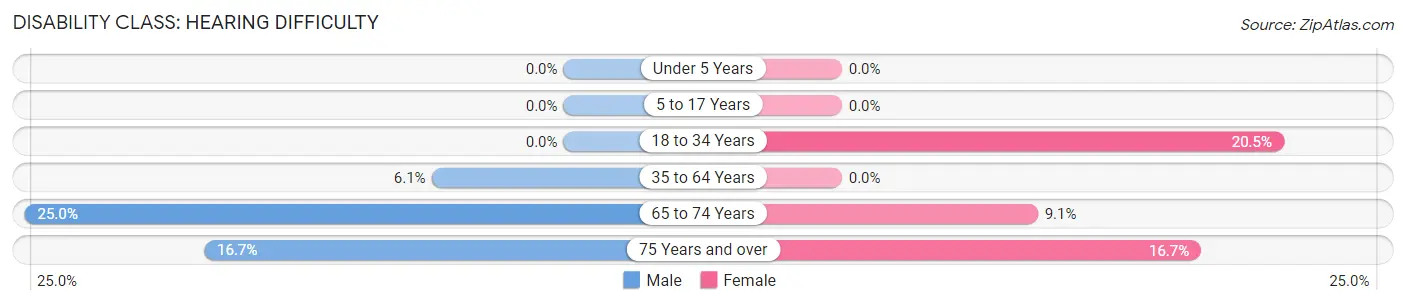
| Age Bracket | Male | Female |
| Under 5 Years | 0 (0.0%) | 0 (0.0%) |
| 5 to 17 Years | 0 (0.0%) | 0 (0.0%) |
| 18 to 34 Years | 0 (0.0%) | 8 (20.5%) |
| 35 to 64 Years | 3 (6.1%) | 0 (0.0%) |
| 65 to 74 Years | 3 (25.0%) | 1 (9.1%) |
| 75 Years and over | 1 (16.7%) | 2 (16.7%) |
Disability Class: Vision Difficulty
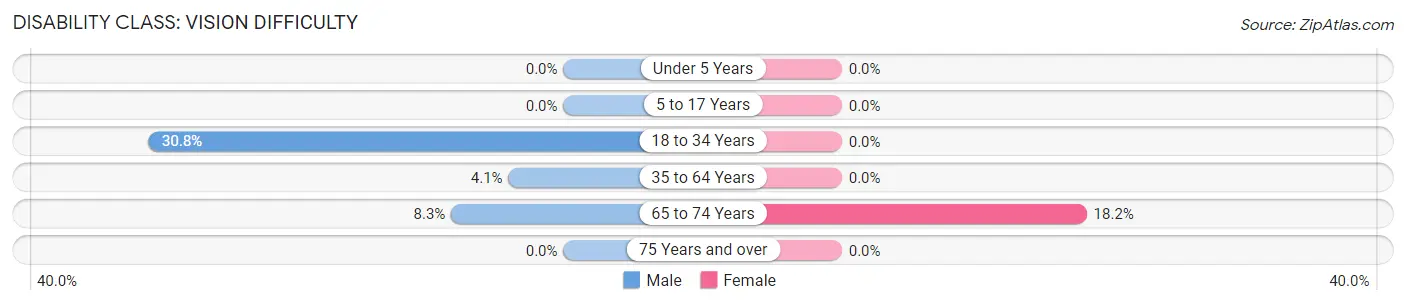
| Age Bracket | Male | Female |
| Under 5 Years | 0 (0.0%) | 0 (0.0%) |
| 5 to 17 Years | 0 (0.0%) | 0 (0.0%) |
| 18 to 34 Years | 4 (30.8%) | 0 (0.0%) |
| 35 to 64 Years | 2 (4.1%) | 0 (0.0%) |
| 65 to 74 Years | 1 (8.3%) | 2 (18.2%) |
| 75 Years and over | 0 (0.0%) | 0 (0.0%) |
Disability Class: Cognitive Difficulty
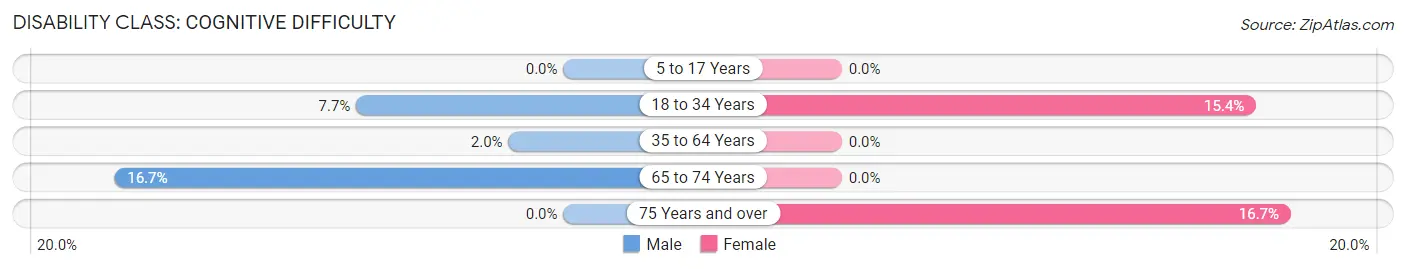
| Age Bracket | Male | Female |
| 5 to 17 Years | 0 (0.0%) | 0 (0.0%) |
| 18 to 34 Years | 1 (7.7%) | 6 (15.4%) |
| 35 to 64 Years | 1 (2.0%) | 0 (0.0%) |
| 65 to 74 Years | 2 (16.7%) | 0 (0.0%) |
| 75 Years and over | 0 (0.0%) | 2 (16.7%) |
Disability Class: Ambulatory Difficulty
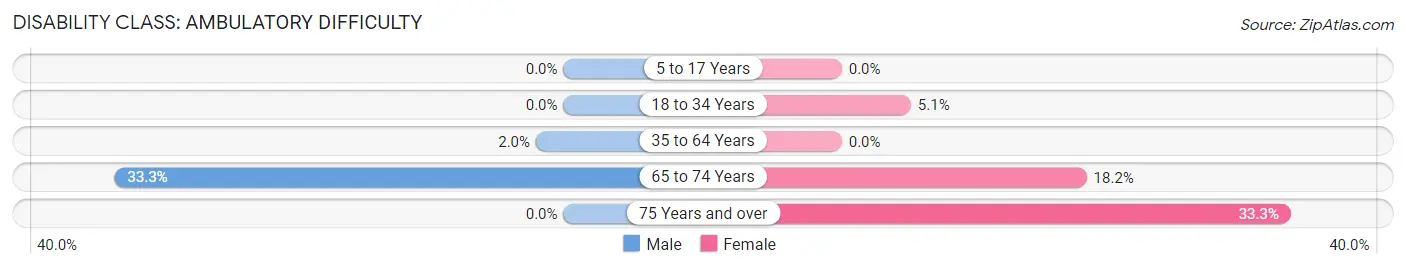
| Age Bracket | Male | Female |
| 5 to 17 Years | 0 (0.0%) | 0 (0.0%) |
| 18 to 34 Years | 0 (0.0%) | 2 (5.1%) |
| 35 to 64 Years | 1 (2.0%) | 0 (0.0%) |
| 65 to 74 Years | 4 (33.3%) | 2 (18.2%) |
| 75 Years and over | 0 (0.0%) | 4 (33.3%) |
Disability Class: Self-Care Difficulty
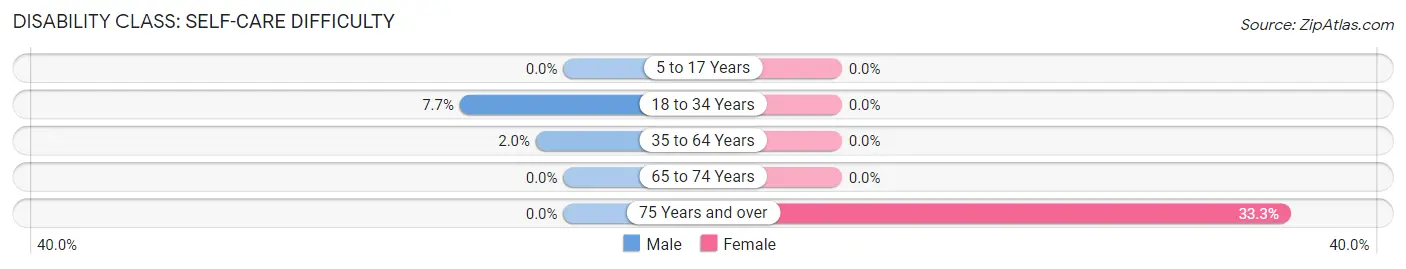
| Age Bracket | Male | Female |
| 5 to 17 Years | 0 (0.0%) | 0 (0.0%) |
| 18 to 34 Years | 1 (7.7%) | 0 (0.0%) |
| 35 to 64 Years | 1 (2.0%) | 0 (0.0%) |
| 65 to 74 Years | 0 (0.0%) | 0 (0.0%) |
| 75 Years and over | 0 (0.0%) | 4 (33.3%) |
Technology Access in Leland
Computing Device Access in Leland
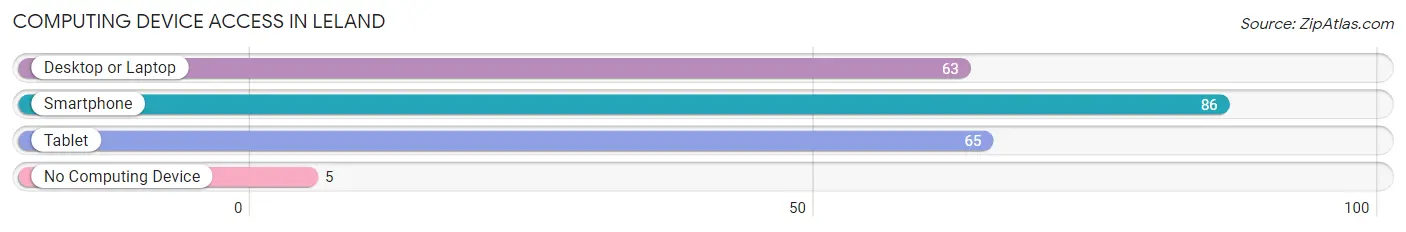
| Device Type | # Households | % Households |
| Desktop or Laptop | 63 | 60.6% |
| Smartphone | 86 | 82.7% |
| Tablet | 65 | 62.5% |
| No Computing Device | 5 | 4.8% |
| Total | 104 | 100.0% |
Internet Access in Leland
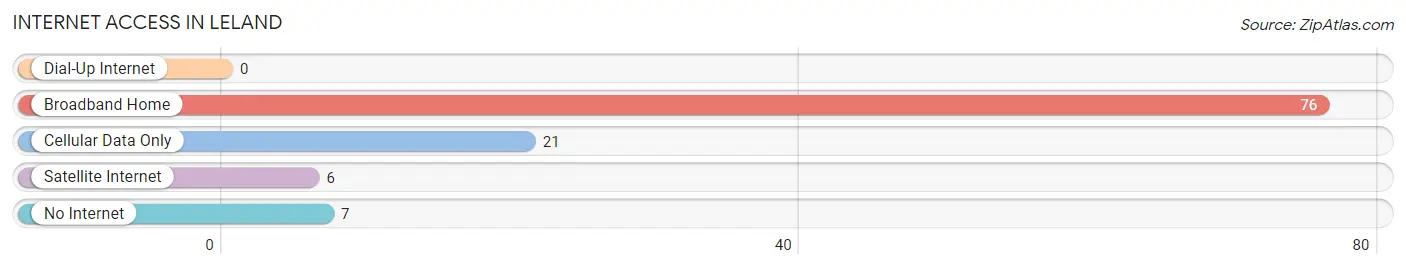
| Internet Type | # Households | % Households |
| Dial-Up Internet | 0 | 0.0% |
| Broadband Home | 76 | 73.1% |
| Cellular Data Only | 21 | 20.2% |
| Satellite Internet | 6 | 5.8% |
| No Internet | 7 | 6.7% |
| Total | 104 | 100.0% |
Leland Summary
Leland, Iowa is a small town located in the northwest corner of the state, in the county of Winnebago. It is situated on the banks of the Upper Iowa River, and is surrounded by rolling hills and farmland. The town has a population of just over 500 people, and is known for its small-town charm and friendly atmosphere.
History
Leland was founded in 1856 by a group of settlers from New York. The town was named after the Leland family, who were among the first settlers. The town was originally a farming community, and the main crops grown were corn, oats, and hay. In the late 1800s, the town began to grow and develop, and a number of businesses were established. These included a general store, a blacksmith shop, a hotel, and a sawmill.
In the early 1900s, the town began to experience a period of growth and prosperity. The railroad was extended to Leland in 1906, and this allowed for the transportation of goods and people to and from the town. This period of growth was short-lived, however, as the Great Depression hit the town hard. Many businesses closed, and the population began to decline.
Geography
Leland is located in the northwest corner of Iowa, in the county of Winnebago. It is situated on the banks of the Upper Iowa River, and is surrounded by rolling hills and farmland. The town is located approximately 30 miles from the state capital of Des Moines.
The climate in Leland is typical of the Midwest, with hot summers and cold winters. The average temperature in the summer is around 75 degrees Fahrenheit, and the average temperature in the winter is around 25 degrees Fahrenheit. The town receives an average of 30 inches of precipitation per year.
Economy
The economy of Leland is largely based on agriculture. The town is surrounded by farmland, and the main crops grown are corn, oats, and hay. The town also has a number of small businesses, including a general store, a hardware store, and a few restaurants.
The town is also home to a number of manufacturing companies, including a furniture factory and a plastics factory. These companies provide employment for many of the town’s residents.
Demographics
As of the 2010 census, the population of Leland was 514. The town is predominantly white, with a small minority population. The median household income is $41,250, and the median home value is $117,000. The town has a low unemployment rate, and the majority of the population is employed in either agriculture or manufacturing.
Leland is a small town with a rich history and a friendly atmosphere. It is a great place to live and work, and offers a unique blend of rural charm and modern amenities. The town is a great place to raise a family, and offers a safe and secure environment for its residents.
Common Questions
What is Per Capita Income in Leland?
Per Capita income in Leland is $34,274.
What is the Median Family Income in Leland?
Median Family Income in Leland is $75,000.
What is the Median Household income in Leland?
Median Household Income in Leland is $52,500.
What is Income or Wage Gap in Leland?
Income or Wage Gap in Leland is 28.3%.
Women in Leland earn 71.7 cents for every dollar earned by a man.
What is Inequality or Gini Index in Leland?
Inequality or Gini Index in Leland is 0.48.
What is the Total Population of Leland?
Total Population of Leland is 238.
What is the Total Male Population of Leland?
Total Male Population of Leland is 103.
What is the Total Female Population of Leland?
Total Female Population of Leland is 135.
What is the Ratio of Males per 100 Females in Leland?
There are 76.30 Males per 100 Females in Leland.
What is the Ratio of Females per 100 Males in Leland?
There are 131.07 Females per 100 Males in Leland.
What is the Median Population Age in Leland?
Median Population Age in Leland is 38.0 Years.
What is the Average Family Size in Leland
Average Family Size in Leland is 3.1 People.
What is the Average Household Size in Leland
Average Household Size in Leland is 2.3 People.
How Large is the Labor Force in Leland?
There are 116 People in the Labor Forcein in Leland.
What is the Percentage of People in the Labor Force in Leland?
61.7% of People are in the Labor Force in Leland.
What is the Unemployment Rate in Leland?
Unemployment Rate in Leland is 6.9%.