Le Claire, IA Map & Demographics
Le Claire Map
Le Claire Overview
$44,081
PER CAPITA INCOME
$106,667
AVG FAMILY INCOME
$95,206
AVG HOUSEHOLD INCOME
50.0%
WAGE / INCOME GAP [ % ]
50.0¢/ $1
WAGE / INCOME GAP [ $ ]
0.47
INEQUALITY / GINI INDEX
4,679
TOTAL POPULATION
2,272
MALE POPULATION
2,407
FEMALE POPULATION
94.39
MALES / 100 FEMALES
105.94
FEMALES / 100 MALES
35.4
MEDIAN AGE
3.0
AVG FAMILY SIZE
2.8
AVG HOUSEHOLD SIZE
1,949
LABOR FORCE [ PEOPLE ]
63.1%
PERCENT IN LABOR FORCE
0.7%
UNEMPLOYMENT RATE
Le Claire Zip Codes
Le Claire Area Codes
Income in Le Claire
Income Overview in Le Claire
Per Capita Income in Le Claire is $44,081, while median incomes of families and households are $106,667 and $95,206 respectively.
| Characteristic | Number | Measure |
| Per Capita Income | 4,679 | $44,081 |
| Median Family Income | 1,202 | $106,667 |
| Mean Family Income | 1,202 | $140,819 |
| Median Household Income | 1,703 | $95,206 |
| Mean Household Income | 1,703 | $120,711 |
| Income Deficit | 1,202 | $0 |
| Wage / Income Gap (%) | 4,679 | 50.04% |
| Wage / Income Gap ($) | 4,679 | 49.96¢ per $1 |
| Gini / Inequality Index | 4,679 | 0.47 |
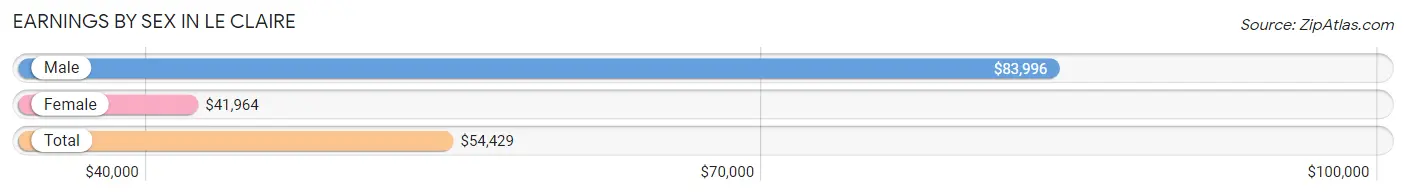
Earnings by Sex in Le Claire
Average Earnings in Le Claire are $54,429, $83,996 for men and $41,964 for women, a difference of 50.0%.
| Sex | Number | Average Earnings |
| Male | 1,073 (51.0%) | $83,996 |
| Female | 1,032 (49.0%) | $41,964 |
| Total | 2,105 (100.0%) | $54,429 |
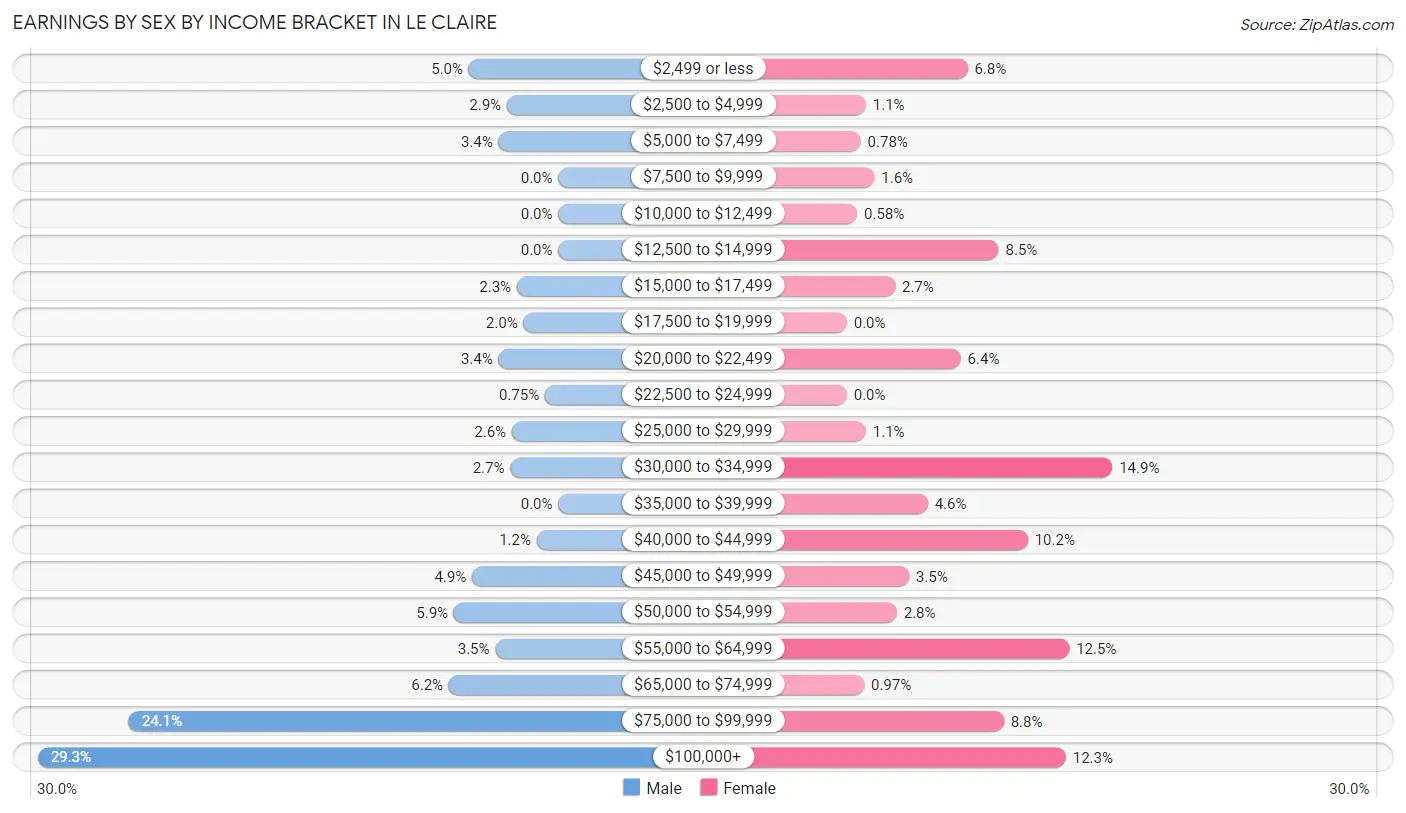
Earnings by Sex by Income Bracket in Le Claire
The most common earnings brackets in Le Claire are $100,000+ for men (314 | 29.3%) and $30,000 to $34,999 for women (154 | 14.9%).
| Income | Male | Female |
| $2,499 or less | 54 (5.0%) | 70 (6.8%) |
| $2,500 to $4,999 | 31 (2.9%) | 11 (1.1%) |
| $5,000 to $7,499 | 36 (3.4%) | 8 (0.8%) |
| $7,500 to $9,999 | 0 (0.0%) | 16 (1.5%) |
| $10,000 to $12,499 | 0 (0.0%) | 6 (0.6%) |
| $12,500 to $14,999 | 0 (0.0%) | 88 (8.5%) |
| $15,000 to $17,499 | 25 (2.3%) | 28 (2.7%) |
| $17,500 to $19,999 | 21 (2.0%) | 0 (0.0%) |
| $20,000 to $22,499 | 36 (3.4%) | 66 (6.4%) |
| $22,500 to $24,999 | 8 (0.7%) | 0 (0.0%) |
| $25,000 to $29,999 | 28 (2.6%) | 11 (1.1%) |
| $30,000 to $34,999 | 29 (2.7%) | 154 (14.9%) |
| $35,000 to $39,999 | 0 (0.0%) | 47 (4.5%) |
| $40,000 to $44,999 | 13 (1.2%) | 105 (10.2%) |
| $45,000 to $49,999 | 52 (4.9%) | 36 (3.5%) |
| $50,000 to $54,999 | 63 (5.9%) | 29 (2.8%) |
| $55,000 to $64,999 | 38 (3.5%) | 129 (12.5%) |
| $65,000 to $74,999 | 66 (6.1%) | 10 (1.0%) |
| $75,000 to $99,999 | 259 (24.1%) | 91 (8.8%) |
| $100,000+ | 314 (29.3%) | 127 (12.3%) |
| Total | 1,073 (100.0%) | 1,032 (100.0%) |
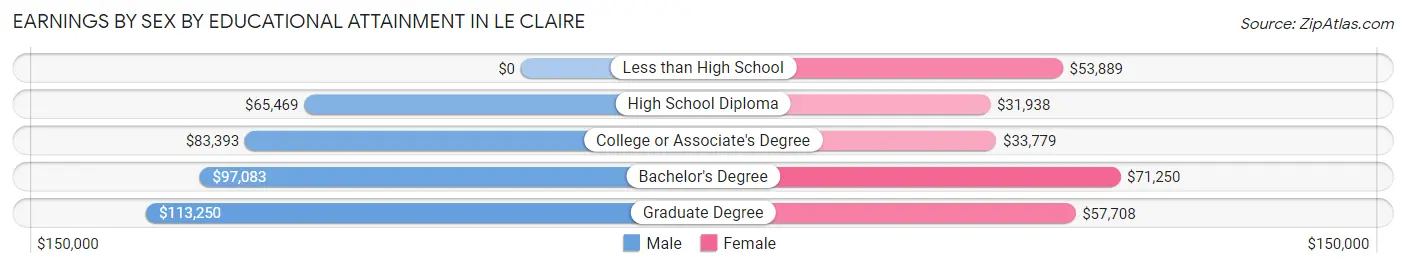
Earnings by Sex by Educational Attainment in Le Claire
Average earnings in Le Claire are $89,679 for men and $43,393 for women, a difference of 51.6%. Men with an educational attainment of graduate degree enjoy the highest average annual earnings of $113,250, while those with high school diploma education earn the least with $65,469. Women with an educational attainment of bachelor's degree earn the most with the average annual earnings of $71,250, while those with high school diploma education have the smallest earnings of $31,938.
| Educational Attainment | Male Income | Female Income |
| Less than High School | - | - |
| High School Diploma | $65,469 | $31,938 |
| College or Associate's Degree | $83,393 | $33,779 |
| Bachelor's Degree | $97,083 | $71,250 |
| Graduate Degree | $113,250 | $57,708 |
| Total | $89,679 | $43,393 |
Family Income in Le Claire
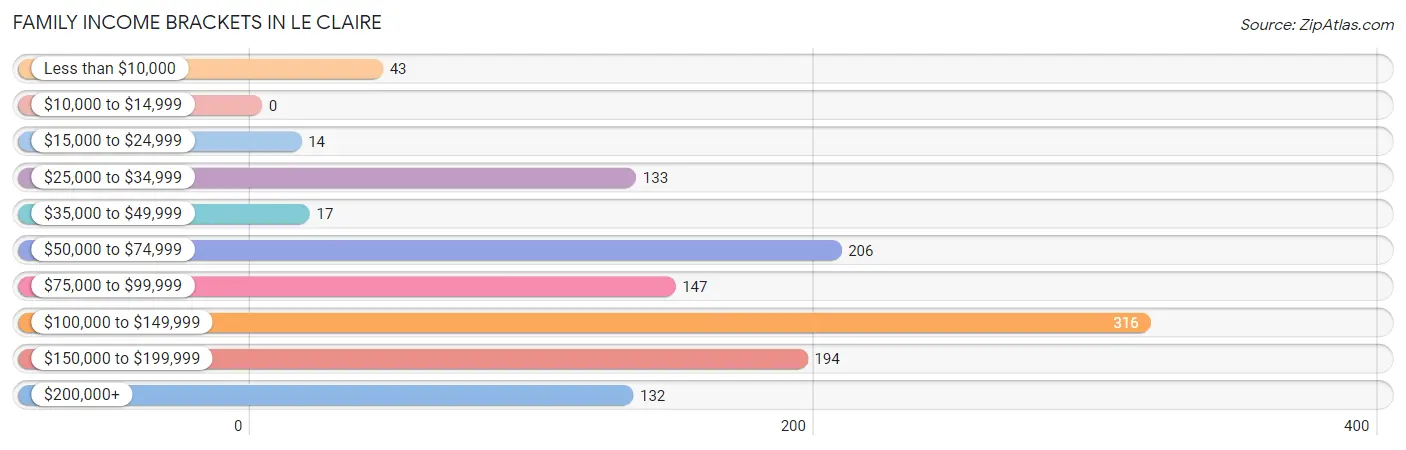
Family Income Brackets in Le Claire
According to the Le Claire family income data, there are 316 families falling into the $100,000 to $149,999 income range, which is the most common income bracket and makes up 26.3% of all families.
| Income Bracket | # Families | % Families |
| Less than $10,000 | 43 | 3.6% |
| $10,000 to $14,999 | 0 | 0.0% |
| $15,000 to $24,999 | 14 | 1.2% |
| $25,000 to $34,999 | 133 | 11.1% |
| $35,000 to $49,999 | 17 | 1.4% |
| $50,000 to $74,999 | 206 | 17.1% |
| $75,000 to $99,999 | 147 | 12.2% |
| $100,000 to $149,999 | 316 | 26.3% |
| $150,000 to $199,999 | 194 | 16.1% |
| $200,000+ | 132 | 11.0% |
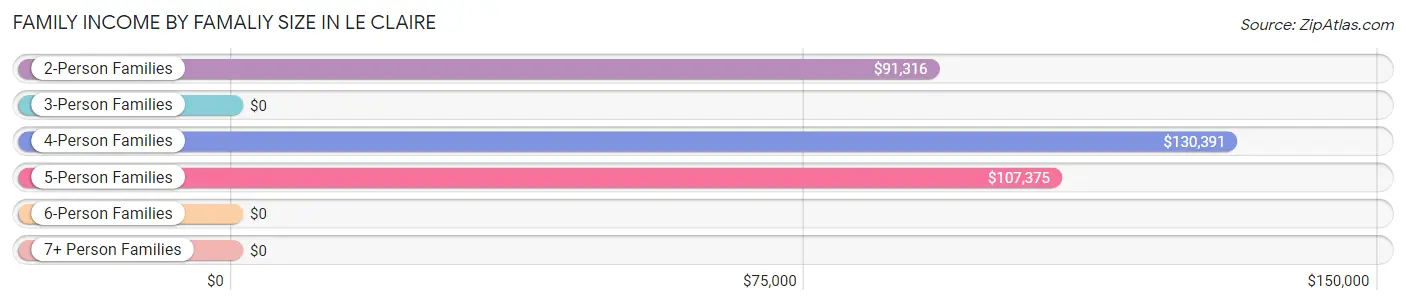
Family Income by Famaliy Size in Le Claire
4-person families (201 | 16.7%) account for the highest median family income in Le Claire with $130,391 per family, while 2-person families (584 | 48.6%) have the highest median income of $45,658 per family member.
| Income Bracket | # Families | Median Income |
| 2-Person Families | 584 (48.6%) | $91,316 |
| 3-Person Families | 281 (23.4%) | $0 |
| 4-Person Families | 201 (16.7%) | $130,391 |
| 5-Person Families | 136 (11.3%) | $107,375 |
| 6-Person Families | 0 (0.0%) | $0 |
| 7+ Person Families | 0 (0.0%) | $0 |
| Total | 1,202 (100.0%) | $106,667 |
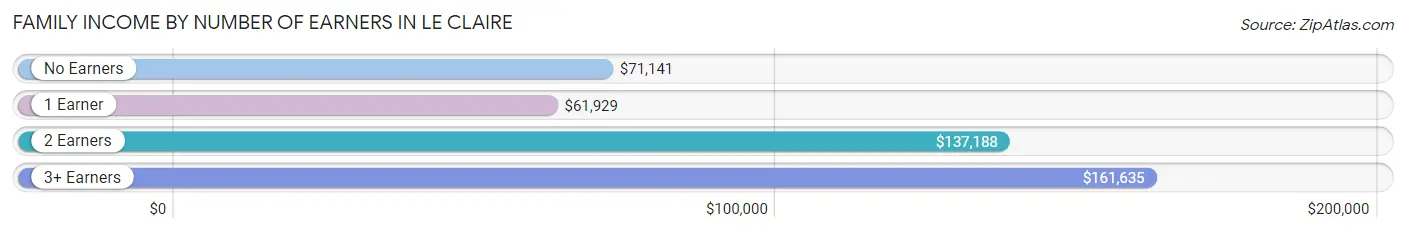
Family Income by Number of Earners in Le Claire
The median family income in Le Claire is $106,667, with families comprising 3+ earners (103) having the highest median family income of $161,635, while families with 1 earner (453) have the lowest median family income of $61,929, accounting for 8.6% and 37.7% of families, respectively.
| Number of Earners | # Families | Median Income |
| No Earners | 137 (11.4%) | $71,141 |
| 1 Earner | 453 (37.7%) | $61,929 |
| 2 Earners | 509 (42.3%) | $137,188 |
| 3+ Earners | 103 (8.6%) | $161,635 |
| Total | 1,202 (100.0%) | $106,667 |
Household Income in Le Claire
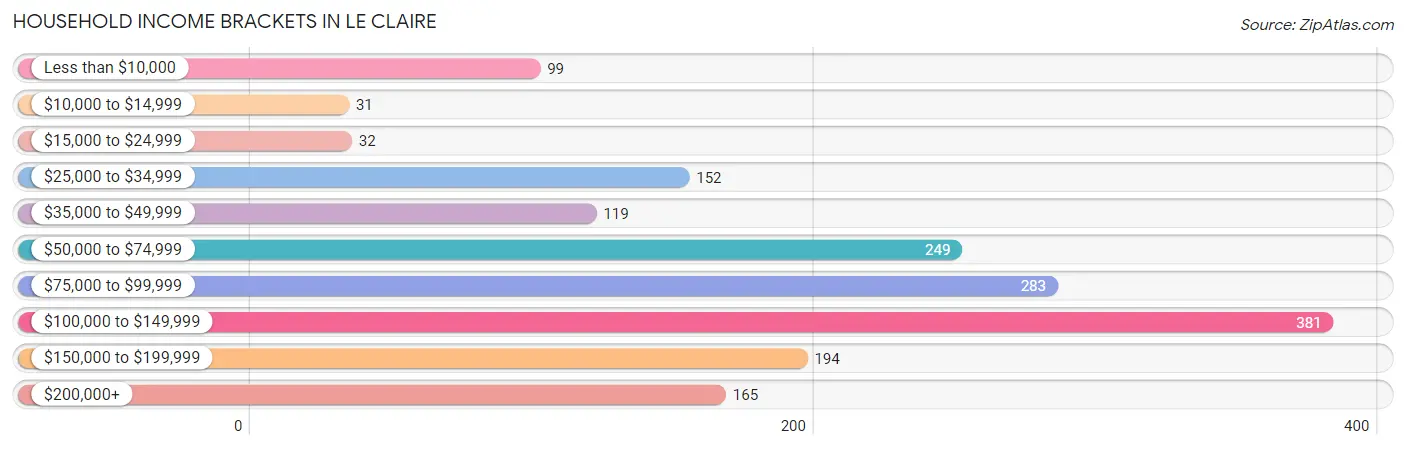
Household Income Brackets in Le Claire
With 381 households falling in the category, the $100,000 to $149,999 income range is the most frequent in Le Claire, accounting for 22.4% of all households. In contrast, only 31 households (1.8%) fall into the $10,000 to $14,999 income bracket, making it the least populous group.
| Income Bracket | # Households | % Households |
| Less than $10,000 | 99 | 5.8% |
| $10,000 to $14,999 | 31 | 1.8% |
| $15,000 to $24,999 | 32 | 1.9% |
| $25,000 to $34,999 | 152 | 8.9% |
| $35,000 to $49,999 | 119 | 7.0% |
| $50,000 to $74,999 | 249 | 14.6% |
| $75,000 to $99,999 | 283 | 16.6% |
| $100,000 to $149,999 | 381 | 22.4% |
| $150,000 to $199,999 | 194 | 11.4% |
| $200,000+ | 165 | 9.7% |
Household Income by Householder Age in Le Claire
The median household income in Le Claire is $95,206, with the highest median household income of $109,115 found in the 45 to 64 years age bracket for the primary householder. A total of 718 households (42.2%) fall into this category.
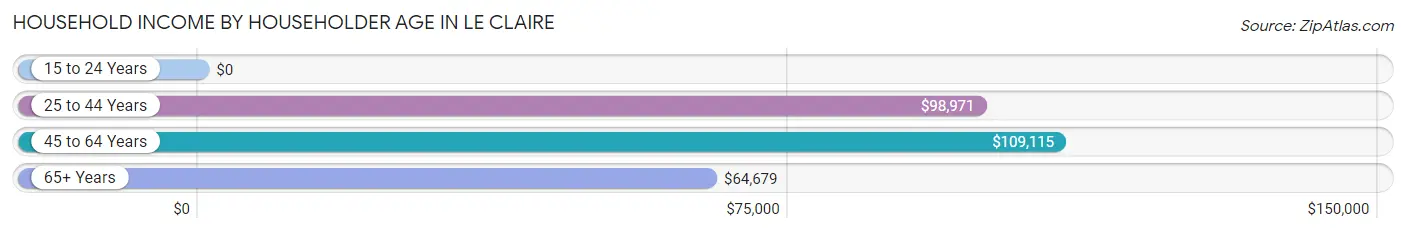
| Income Bracket | # Households | Median Income |
| 15 to 24 Years | 0 (0.0%) | $0 |
| 25 to 44 Years | 582 (34.2%) | $98,971 |
| 45 to 64 Years | 718 (42.2%) | $109,115 |
| 65+ Years | 403 (23.7%) | $64,679 |
| Total | 1,703 (100.0%) | $95,206 |
Poverty in Le Claire
Income Below Poverty by Sex and Age in Le Claire
With 4.7% poverty level for males and 11.2% for females among the residents of Le Claire, 65 to 74 year old males and 35 to 44 year old females are the most vulnerable to poverty, with 49 males (17.4%) and 137 females (33.6%) in their respective age groups living below the poverty level.
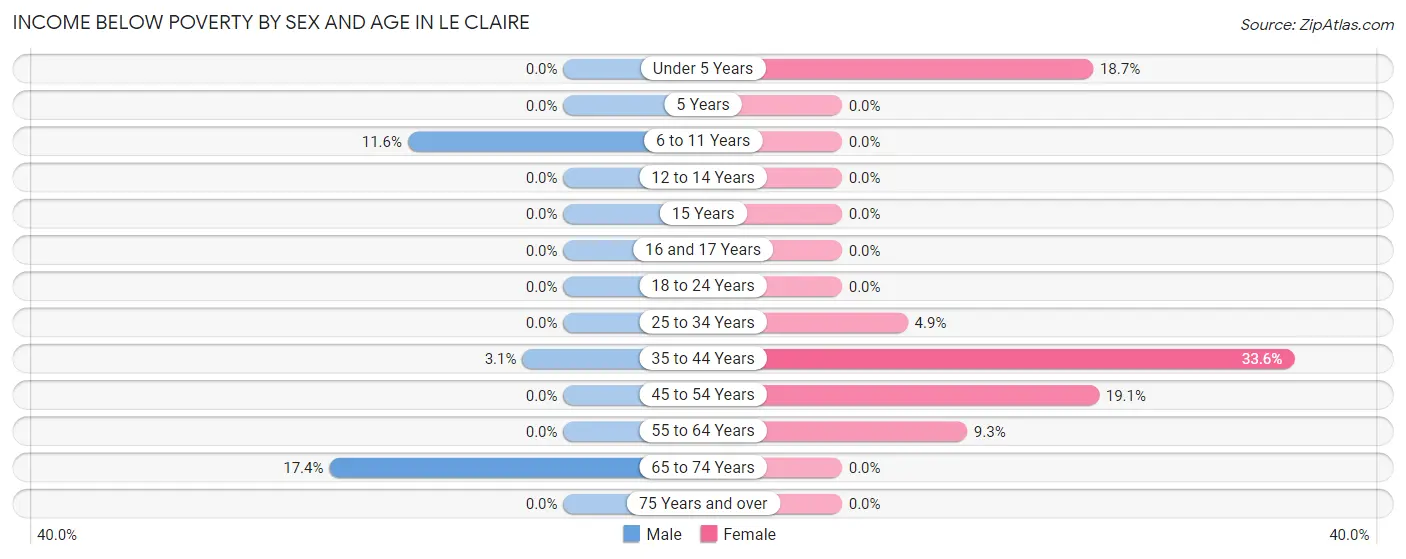
| Age Bracket | Male | Female |
| Under 5 Years | 0 (0.0%) | 36 (18.6%) |
| 5 Years | 0 (0.0%) | 0 (0.0%) |
| 6 to 11 Years | 38 (11.6%) | 0 (0.0%) |
| 12 to 14 Years | 0 (0.0%) | 0 (0.0%) |
| 15 Years | 0 (0.0%) | 0 (0.0%) |
| 16 and 17 Years | 0 (0.0%) | 0 (0.0%) |
| 18 to 24 Years | 0 (0.0%) | 0 (0.0%) |
| 25 to 34 Years | 0 (0.0%) | 17 (4.9%) |
| 35 to 44 Years | 8 (3.0%) | 137 (33.6%) |
| 45 to 54 Years | 0 (0.0%) | 33 (19.1%) |
| 55 to 64 Years | 0 (0.0%) | 30 (9.3%) |
| 65 to 74 Years | 49 (17.4%) | 0 (0.0%) |
| 75 Years and over | 0 (0.0%) | 0 (0.0%) |
| Total | 95 (4.7%) | 253 (11.2%) |
Income Above Poverty by Sex and Age in Le Claire
According to the poverty statistics in Le Claire, males aged under 5 years and females aged 5 years are the age groups that are most secure financially, with 100.0% of males and 100.0% of females in these age groups living above the poverty line.
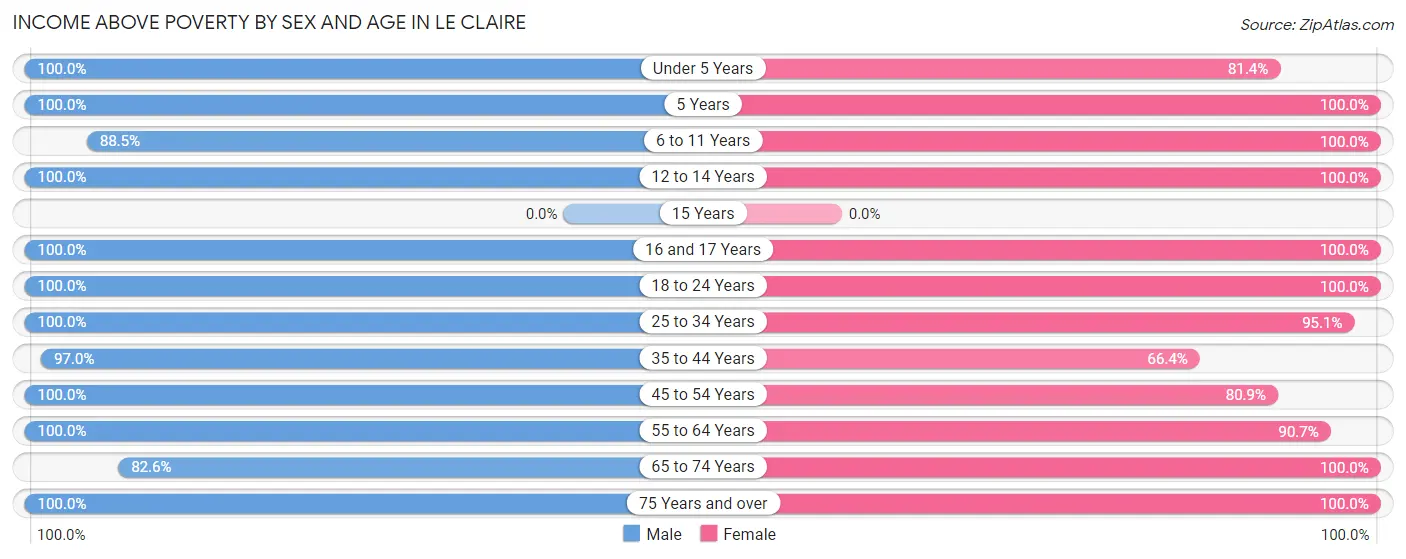
| Age Bracket | Male | Female |
| Under 5 Years | 153 (100.0%) | 157 (81.4%) |
| 5 Years | 26 (100.0%) | 78 (100.0%) |
| 6 to 11 Years | 291 (88.4%) | 355 (100.0%) |
| 12 to 14 Years | 26 (100.0%) | 50 (100.0%) |
| 15 Years | 0 (0.0%) | 0 (0.0%) |
| 16 and 17 Years | 75 (100.0%) | 43 (100.0%) |
| 18 to 24 Years | 88 (100.0%) | 55 (100.0%) |
| 25 to 34 Years | 122 (100.0%) | 331 (95.1%) |
| 35 to 44 Years | 254 (97.0%) | 271 (66.4%) |
| 45 to 54 Years | 207 (100.0%) | 140 (80.9%) |
| 55 to 64 Years | 324 (100.0%) | 293 (90.7%) |
| 65 to 74 Years | 233 (82.6%) | 118 (100.0%) |
| 75 Years and over | 135 (100.0%) | 126 (100.0%) |
| Total | 1,934 (95.3%) | 2,017 (88.8%) |
Income Below Poverty Among Married-Couple Families in Le Claire
The poverty statistics for married-couple families in Le Claire show that 0.9% or 8 of the total 897 families live below the poverty line. Families with 1 or 2 children have the highest poverty rate of 2.7%, comprising of 8 families. On the other hand, families with no children have the lowest poverty rate of 0.0%, which includes 0 families.
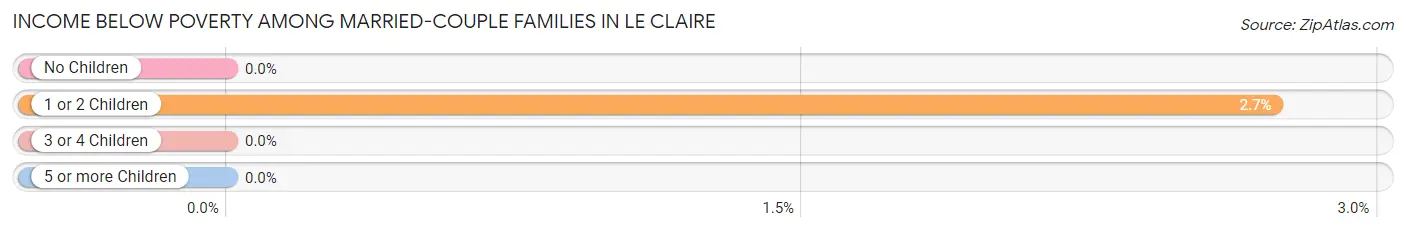
| Children | Above Poverty | Below Poverty |
| No Children | 489 (100.0%) | 0 (0.0%) |
| 1 or 2 Children | 285 (97.3%) | 8 (2.7%) |
| 3 or 4 Children | 115 (100.0%) | 0 (0.0%) |
| 5 or more Children | 0 (0.0%) | 0 (0.0%) |
| Total | 889 (99.1%) | 8 (0.9%) |
Income Below Poverty Among Single-Parent Households in Le Claire
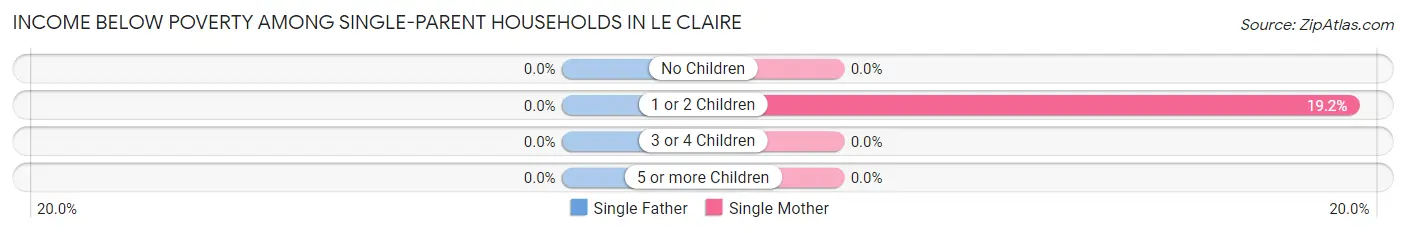
| Children | Single Father | Single Mother |
| No Children | 0 (0.0%) | 0 (0.0%) |
| 1 or 2 Children | 0 (0.0%) | 43 (19.2%) |
| 3 or 4 Children | 0 (0.0%) | 0 (0.0%) |
| 5 or more Children | 0 (0.0%) | 0 (0.0%) |
| Total | 0 (0.0%) | 43 (17.5%) |
Income Below Poverty Among Married-Couple vs Single-Parent Households in Le Claire
The poverty data for Le Claire shows that 8 of the married-couple family households (0.9%) and 43 of the single-parent households (14.1%) are living below the poverty level. Within the married-couple family households, those with 1 or 2 children have the highest poverty rate, with 8 households (2.7%) falling below the poverty line. Among the single-parent households, those with 1 or 2 children have the highest poverty rate, with 43 household (18.1%) living below poverty.
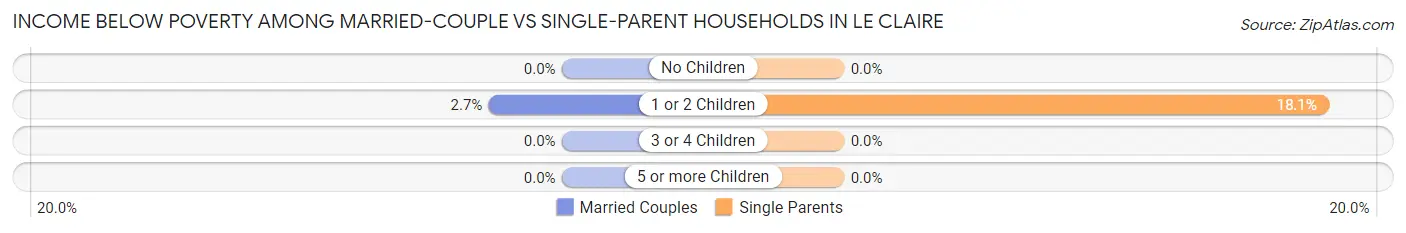
| Children | Married-Couple Families | Single-Parent Households |
| No Children | 0 (0.0%) | 0 (0.0%) |
| 1 or 2 Children | 8 (2.7%) | 43 (18.1%) |
| 3 or 4 Children | 0 (0.0%) | 0 (0.0%) |
| 5 or more Children | 0 (0.0%) | 0 (0.0%) |
| Total | 8 (0.9%) | 43 (14.1%) |
Race in Le Claire
The most populous races in Le Claire are White / Caucasian (4,308 | 92.1%), Two or more Races (281 | 6.0%), and Hispanic or Latino (62 | 1.3%).
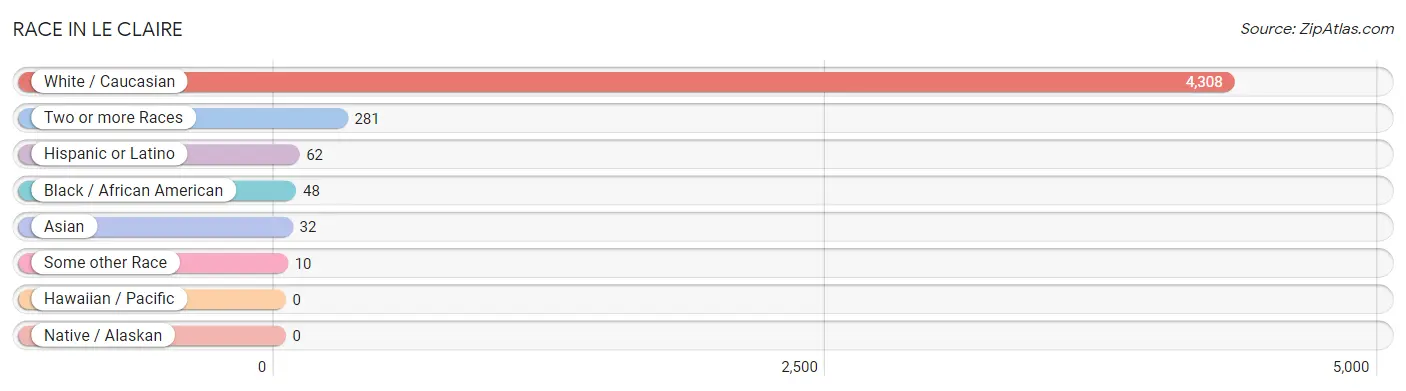
| Race | # Population | % Population |
| Asian | 32 | 0.7% |
| Black / African American | 48 | 1.0% |
| Hawaiian / Pacific | 0 | 0.0% |
| Hispanic or Latino | 62 | 1.3% |
| Native / Alaskan | 0 | 0.0% |
| White / Caucasian | 4,308 | 92.1% |
| Two or more Races | 281 | 6.0% |
| Some other Race | 10 | 0.2% |
| Total | 4,679 | 100.0% |
Ancestry in Le Claire
The most populous ancestries reported in Le Claire are German (968 | 20.7%), English (779 | 16.7%), Irish (574 | 12.3%), American (203 | 4.3%), and Swedish (160 | 3.4%), together accounting for 57.4% of all Le Claire residents.
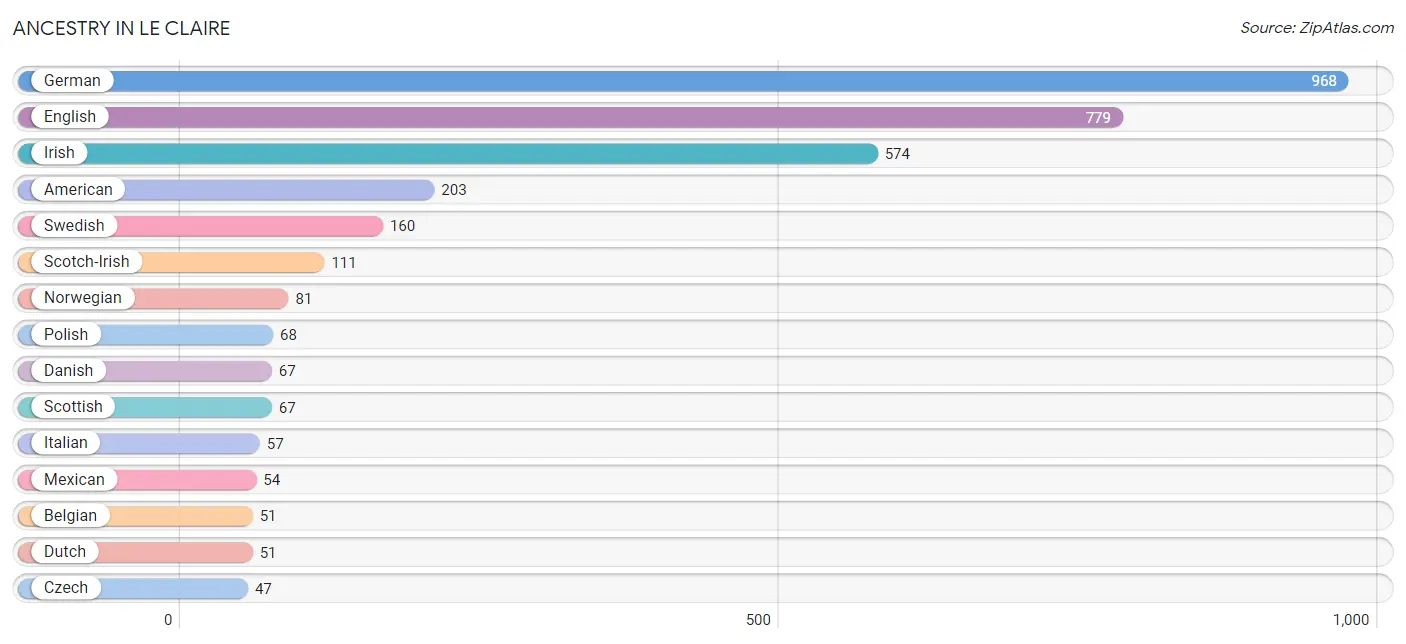
| Ancestry | # Population | % Population |
| American | 203 | 4.3% |
| Arab | 15 | 0.3% |
| Austrian | 22 | 0.5% |
| Belgian | 51 | 1.1% |
| Bhutanese | 21 | 0.4% |
| Central American | 8 | 0.2% |
| Czech | 47 | 1.0% |
| Danish | 67 | 1.4% |
| Dutch | 51 | 1.1% |
| English | 779 | 16.7% |
| European | 47 | 1.0% |
| Finnish | 11 | 0.2% |
| French | 44 | 0.9% |
| German | 968 | 20.7% |
| Greek | 23 | 0.5% |
| Guamanian / Chamorro | 30 | 0.6% |
| Guatemalan | 8 | 0.2% |
| Irish | 574 | 12.3% |
| Italian | 57 | 1.2% |
| Korean | 37 | 0.8% |
| Lebanese | 15 | 0.3% |
| Luxembourger | 36 | 0.8% |
| Mexican | 54 | 1.1% |
| Norwegian | 81 | 1.7% |
| Polish | 68 | 1.5% |
| Scotch-Irish | 111 | 2.4% |
| Scottish | 67 | 1.4% |
| Slovene | 12 | 0.3% |
| Swedish | 160 | 3.4% |
| Swiss | 12 | 0.3% |
| Thai | 25 | 0.5% | View All 31 Rows |
Immigrants in Le Claire
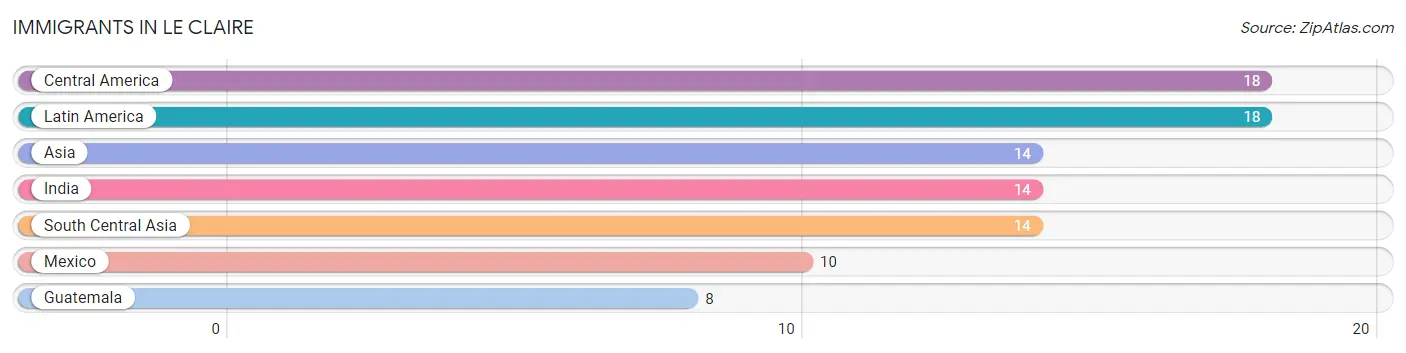
The most numerous immigrant groups reported in Le Claire came from Central America (18 | 0.4%), Latin America (18 | 0.4%), Asia (14 | 0.3%), India (14 | 0.3%), and South Central Asia (14 | 0.3%), together accounting for 1.7% of all Le Claire residents.
| Immigration Origin | # Population | % Population |
| Asia | 14 | 0.3% |
| Central America | 18 | 0.4% |
| Guatemala | 8 | 0.2% |
| India | 14 | 0.3% |
| Latin America | 18 | 0.4% |
| Mexico | 10 | 0.2% |
| South Central Asia | 14 | 0.3% | View All 7 Rows |
Sex and Age in Le Claire
Sex and Age in Le Claire
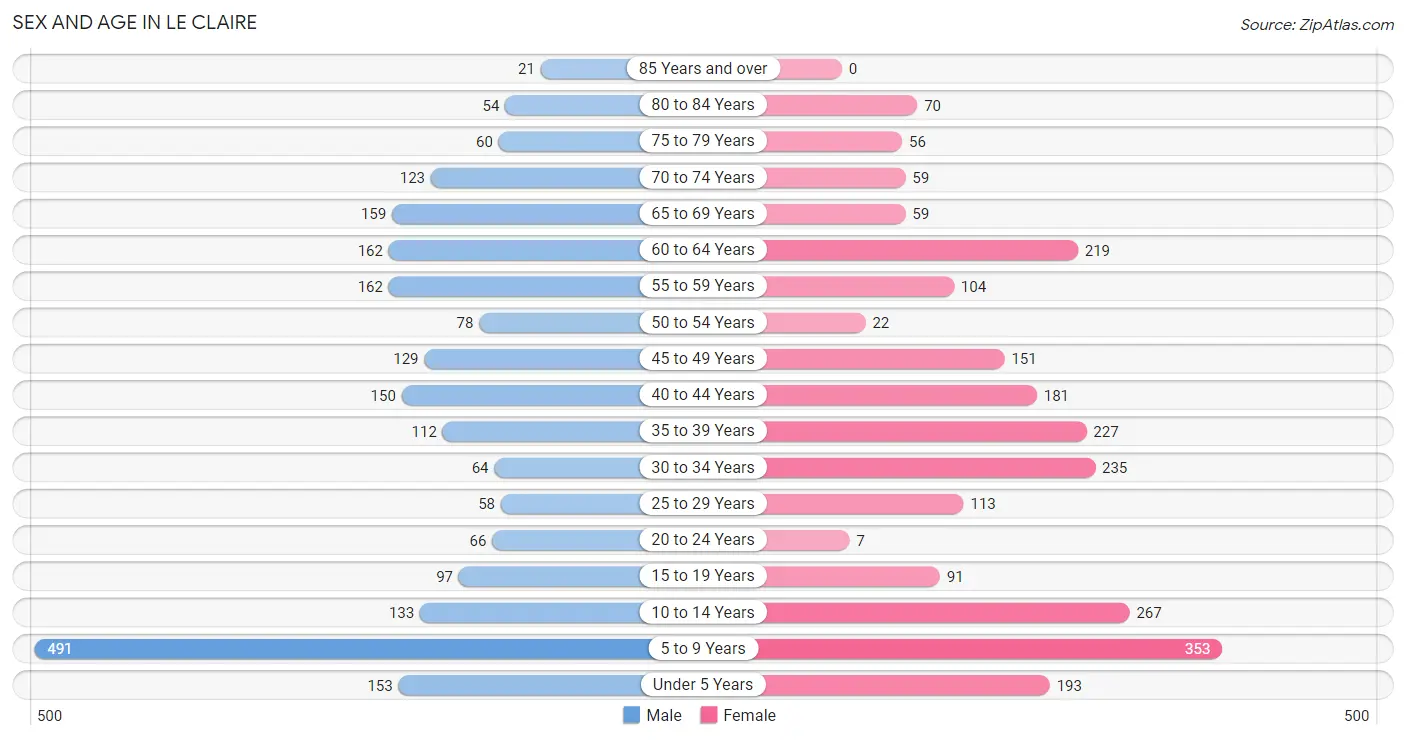
The most populous age groups in Le Claire are 5 to 9 Years (491 | 21.6%) for men and 5 to 9 Years (353 | 14.7%) for women.
| Age Bracket | Male | Female |
| Under 5 Years | 153 (6.7%) | 193 (8.0%) |
| 5 to 9 Years | 491 (21.6%) | 353 (14.7%) |
| 10 to 14 Years | 133 (5.9%) | 267 (11.1%) |
| 15 to 19 Years | 97 (4.3%) | 91 (3.8%) |
| 20 to 24 Years | 66 (2.9%) | 7 (0.3%) |
| 25 to 29 Years | 58 (2.5%) | 113 (4.7%) |
| 30 to 34 Years | 64 (2.8%) | 235 (9.8%) |
| 35 to 39 Years | 112 (4.9%) | 227 (9.4%) |
| 40 to 44 Years | 150 (6.6%) | 181 (7.5%) |
| 45 to 49 Years | 129 (5.7%) | 151 (6.3%) |
| 50 to 54 Years | 78 (3.4%) | 22 (0.9%) |
| 55 to 59 Years | 162 (7.1%) | 104 (4.3%) |
| 60 to 64 Years | 162 (7.1%) | 219 (9.1%) |
| 65 to 69 Years | 159 (7.0%) | 59 (2.5%) |
| 70 to 74 Years | 123 (5.4%) | 59 (2.5%) |
| 75 to 79 Years | 60 (2.6%) | 56 (2.3%) |
| 80 to 84 Years | 54 (2.4%) | 70 (2.9%) |
| 85 Years and over | 21 (0.9%) | 0 (0.0%) |
| Total | 2,272 (100.0%) | 2,407 (100.0%) |
Families and Households in Le Claire
Median Family Size in Le Claire
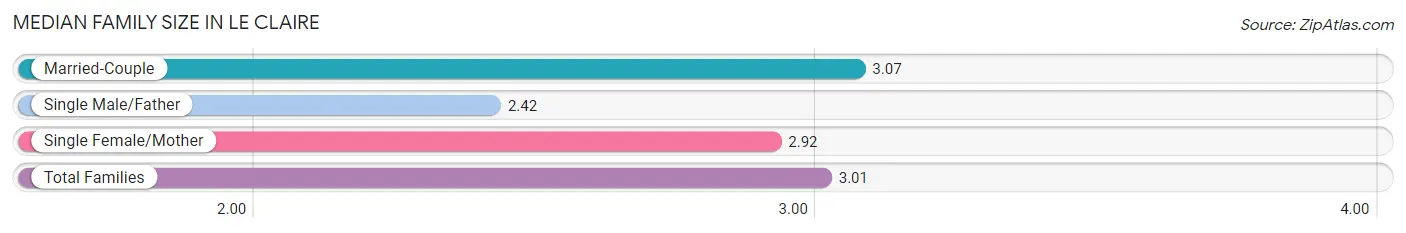
The median family size in Le Claire is 3.01 persons per family, with married-couple families (897 | 74.6%) accounting for the largest median family size of 3.07 persons per family. On the other hand, single male/father families (59 | 4.9%) represent the smallest median family size with 2.42 persons per family.
| Family Type | # Families | Family Size |
| Married-Couple | 897 (74.6%) | 3.07 |
| Single Male/Father | 59 (4.9%) | 2.42 |
| Single Female/Mother | 246 (20.5%) | 2.92 |
| Total Families | 1,202 (100.0%) | 3.01 |
Median Household Size in Le Claire
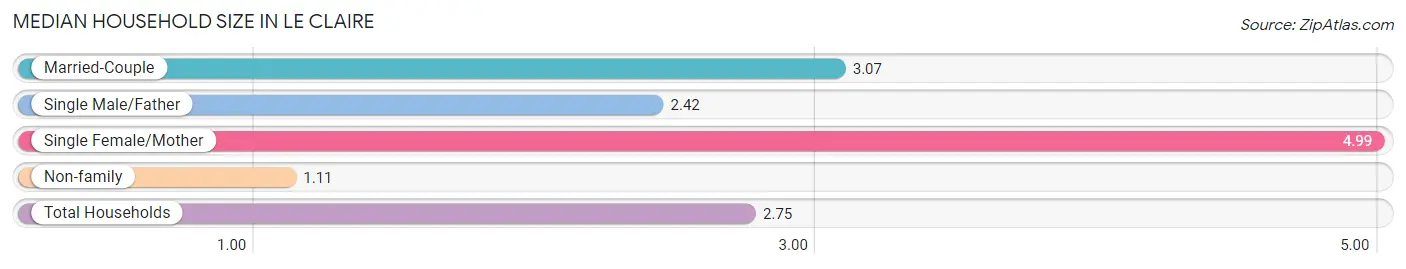
The median household size in Le Claire is 2.75 persons per household, with single female/mother households (246 | 14.4%) accounting for the largest median household size of 4.99 persons per household. non-family households (501 | 29.4%) represent the smallest median household size with 1.11 persons per household.
| Household Type | # Households | Household Size |
| Married-Couple | 897 (52.7%) | 3.07 |
| Single Male/Father | 59 (3.5%) | 2.42 |
| Single Female/Mother | 246 (14.4%) | 4.99 |
| Non-family | 501 (29.4%) | 1.11 |
| Total Households | 1,703 (100.0%) | 2.75 |
Household Size by Marriage Status in Le Claire
Out of a total of 1,703 households in Le Claire, 1,202 (70.6%) are family households, while 501 (29.4%) are nonfamily households. The most numerous type of family households are 2-person households, comprising 584, and the most common type of nonfamily households are 1-person households, comprising 449.
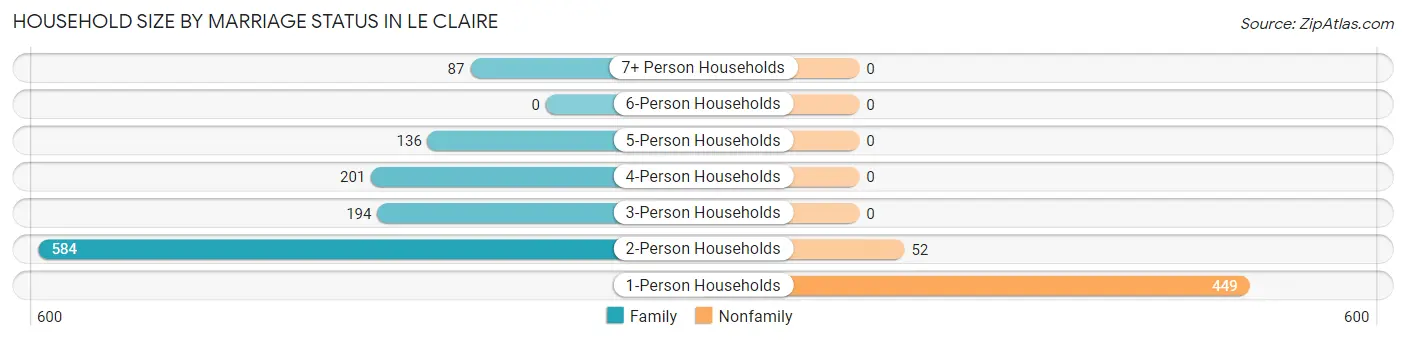
| Household Size | Family Households | Nonfamily Households |
| 1-Person Households | - | 449 (26.4%) |
| 2-Person Households | 584 (34.3%) | 52 (3.0%) |
| 3-Person Households | 194 (11.4%) | 0 (0.0%) |
| 4-Person Households | 201 (11.8%) | 0 (0.0%) |
| 5-Person Households | 136 (8.0%) | 0 (0.0%) |
| 6-Person Households | 0 (0.0%) | 0 (0.0%) |
| 7+ Person Households | 87 (5.1%) | 0 (0.0%) |
| Total | 1,202 (70.6%) | 501 (29.4%) |
Female Fertility in Le Claire
Fertility by Age in Le Claire
Average fertility rate in Le Claire is 42.0 births per 1,000 women. Women in the age bracket of 20 to 34 years have the highest fertility rate with 90.0 births per 1,000 women. Women in the age bracket of 20 to 34 years acount for 76.2% of all women with births.
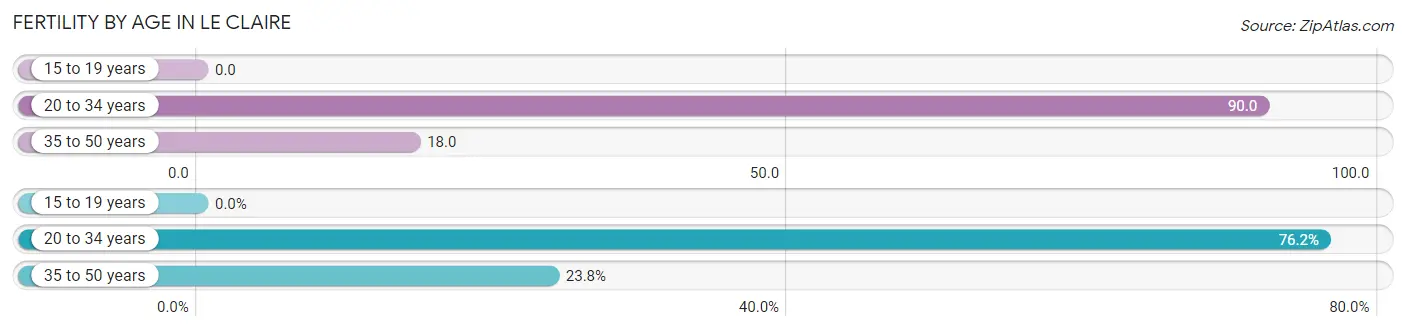
| Age Bracket | Women with Births | Births / 1,000 Women |
| 15 to 19 years | 0 (0.0%) | 0.0 |
| 20 to 34 years | 32 (76.2%) | 90.0 |
| 35 to 50 years | 10 (23.8%) | 18.0 |
| Total | 42 (100.0%) | 42.0 |
Fertility by Age by Marriage Status in Le Claire
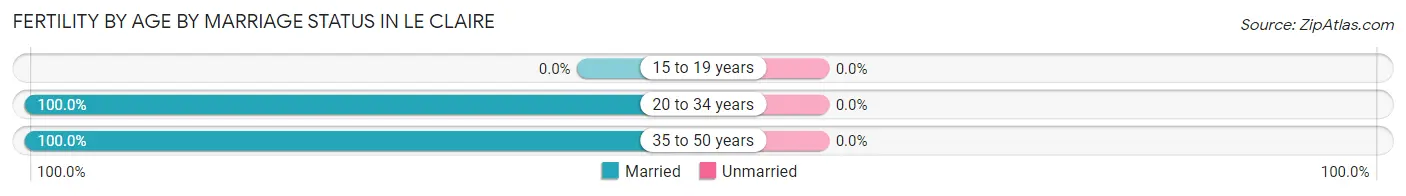
| Age Bracket | Married | Unmarried |
| 15 to 19 years | 0 (0.0%) | 0 (0.0%) |
| 20 to 34 years | 32 (100.0%) | 0 (0.0%) |
| 35 to 50 years | 10 (100.0%) | 0 (0.0%) |
| Total | 42 (100.0%) | 0 (0.0%) |
Fertility by Education in Le Claire
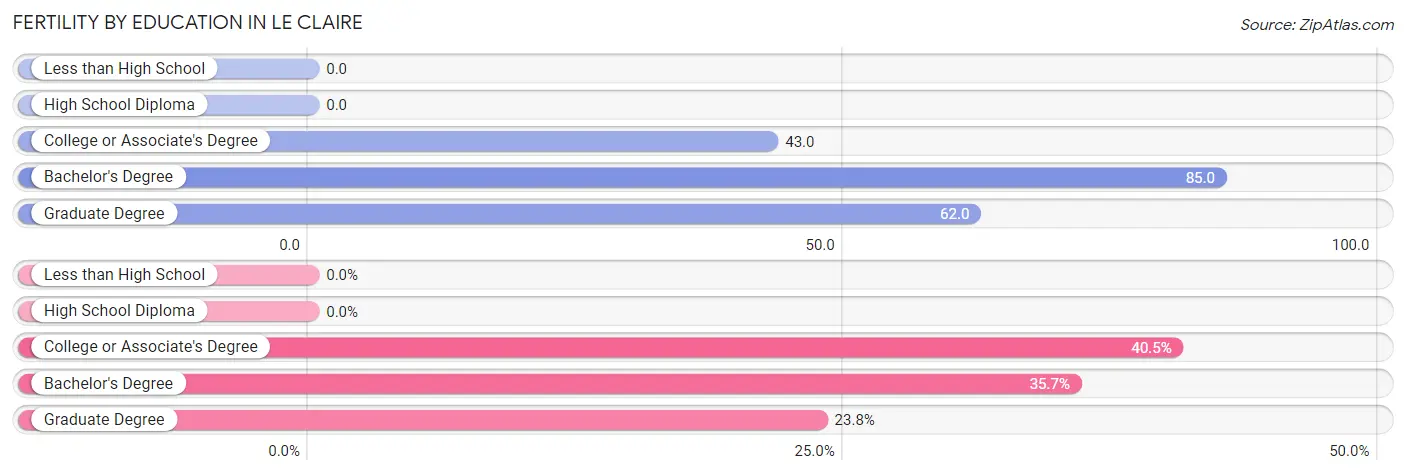
| Educational Attainment | Women with Births | Births / 1,000 Women |
| Less than High School | 0 (0.0%) | 0.0 |
| High School Diploma | 0 (0.0%) | 0.0 |
| College or Associate's Degree | 17 (40.5%) | 43.0 |
| Bachelor's Degree | 15 (35.7%) | 85.0 |
| Graduate Degree | 10 (23.8%) | 62.0 |
| Total | 42 (100.0%) | 42.0 |
Fertility by Education by Marriage Status in Le Claire
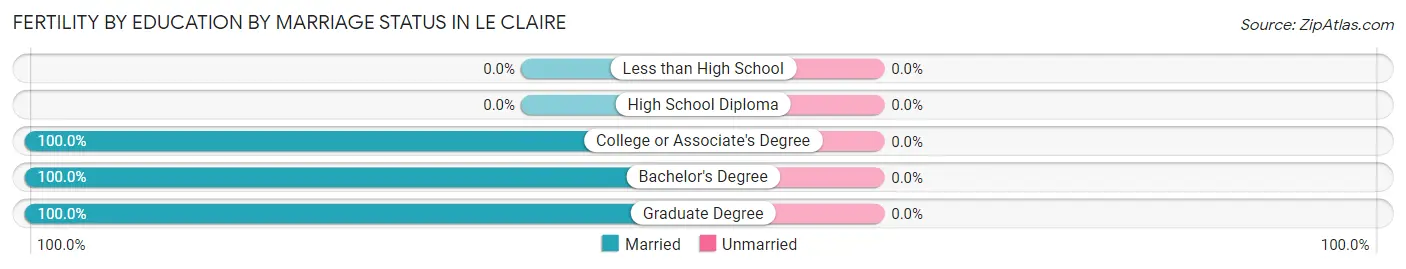
| Educational Attainment | Married | Unmarried |
| Less than High School | 0 (0.0%) | 0 (0.0%) |
| High School Diploma | 0 (0.0%) | 0 (0.0%) |
| College or Associate's Degree | 17 (100.0%) | 0 (0.0%) |
| Bachelor's Degree | 15 (100.0%) | 0 (0.0%) |
| Graduate Degree | 10 (100.0%) | 0 (0.0%) |
| Total | 42 (100.0%) | 0 (0.0%) |
Employment Characteristics in Le Claire
Employment by Class of Employer in Le Claire
Among the 1,878 employed individuals in Le Claire, private company employees (1,368 | 72.8%), local government employees (196 | 10.4%), and self-employed (not incorporated) (130 | 6.9%) make up the most common classes of employment.
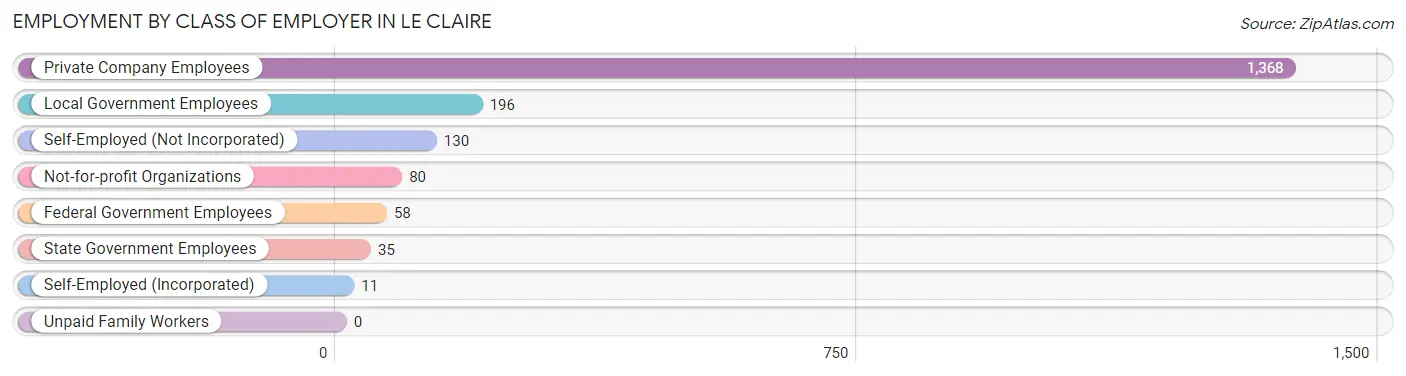
| Employer Class | # Employees | % Employees |
| Private Company Employees | 1,368 | 72.8% |
| Self-Employed (Incorporated) | 11 | 0.6% |
| Self-Employed (Not Incorporated) | 130 | 6.9% |
| Not-for-profit Organizations | 80 | 4.3% |
| Local Government Employees | 196 | 10.4% |
| State Government Employees | 35 | 1.9% |
| Federal Government Employees | 58 | 3.1% |
| Unpaid Family Workers | 0 | 0.0% |
| Total | 1,878 | 100.0% |
Employment Status by Age in Le Claire
According to the labor force statistics for Le Claire, out of the total population over 16 years of age (3,089), 63.1% or 1,949 individuals are in the labor force, with 0.7% or 14 of them unemployed. The age group with the highest labor force participation rate is 55 to 59 years, with 88.0% or 234 individuals in the labor force. Within the labor force, the 75 years and over age range has the highest percentage of unemployed individuals, with 25.0% or 14 of them being unemployed.
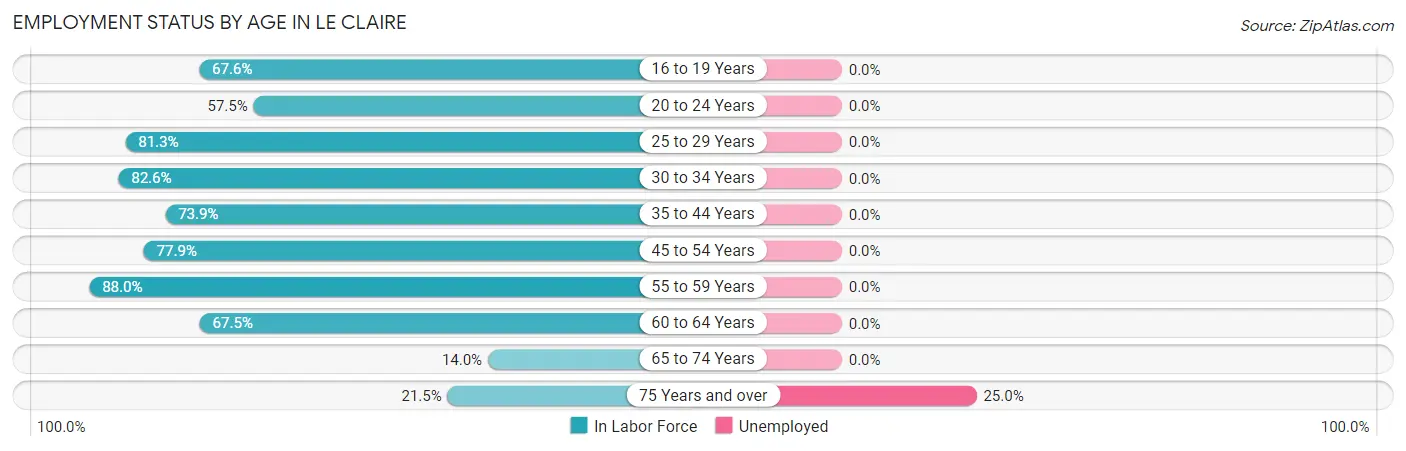
| Age Bracket | In Labor Force | Unemployed |
| 16 to 19 Years | 127 (67.6%) | 0 (0.0%) |
| 20 to 24 Years | 42 (57.5%) | 0 (0.0%) |
| 25 to 29 Years | 139 (81.3%) | 0 (0.0%) |
| 30 to 34 Years | 247 (82.6%) | 0 (0.0%) |
| 35 to 44 Years | 495 (73.9%) | 0 (0.0%) |
| 45 to 54 Years | 296 (77.9%) | 0 (0.0%) |
| 55 to 59 Years | 234 (88.0%) | 0 (0.0%) |
| 60 to 64 Years | 257 (67.5%) | 0 (0.0%) |
| 65 to 74 Years | 56 (14.0%) | 0 (0.0%) |
| 75 Years and over | 56 (21.5%) | 14 (25.0%) |
| Total | 1,949 (63.1%) | 14 (0.7%) |
Employment Status by Educational Attainment in Le Claire
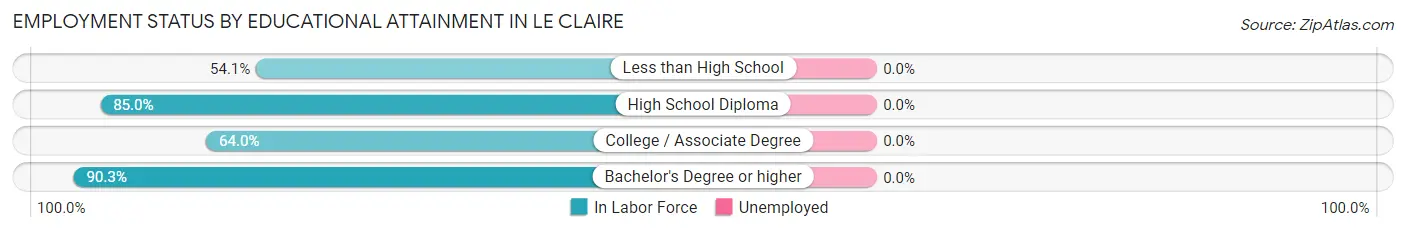
| Educational Attainment | In Labor Force | Unemployed |
| Less than High School | 86 (54.1%) | 0 (0.0%) |
| High School Diploma | 345 (85.0%) | 0 (0.0%) |
| College / Associate Degree | 511 (64.0%) | 0 (0.0%) |
| Bachelor's Degree or higher | 726 (90.3%) | 0 (0.0%) |
| Total | 1,669 (77.0%) | 0 (0.0%) |
Employment Occupations by Sex in Le Claire
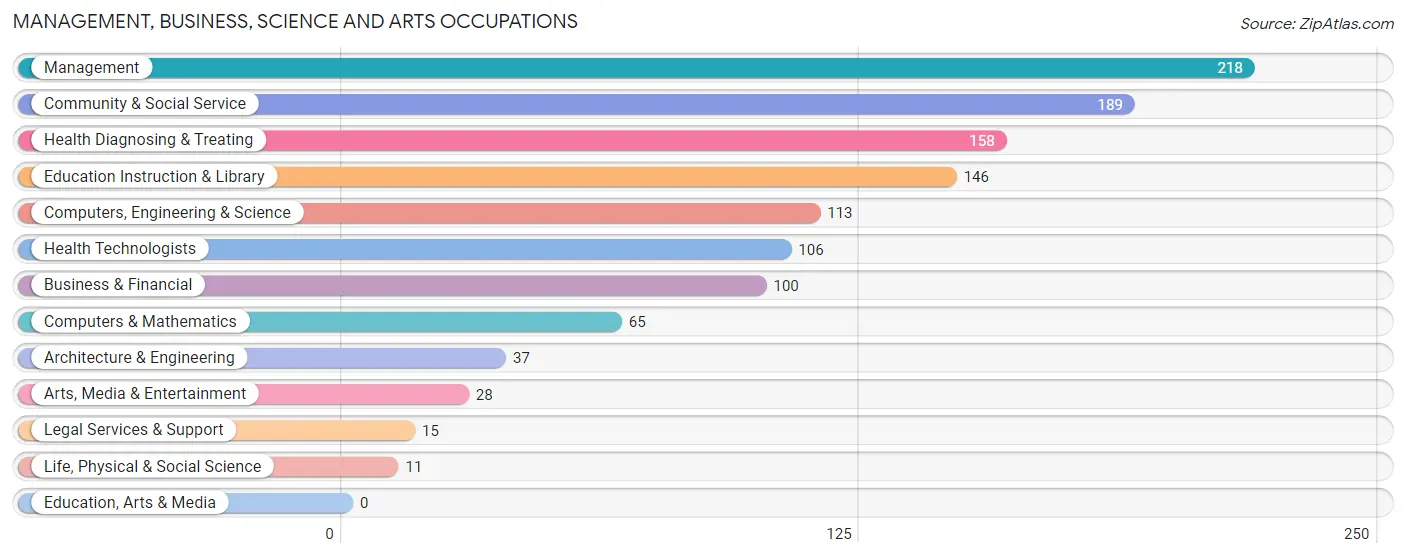
Management, Business, Science and Arts Occupations
The most common Management, Business, Science and Arts occupations in Le Claire are Management (218 | 11.4%), Community & Social Service (189 | 9.9%), Health Diagnosing & Treating (158 | 8.2%), Education Instruction & Library (146 | 7.6%), and Computers, Engineering & Science (113 | 5.9%).
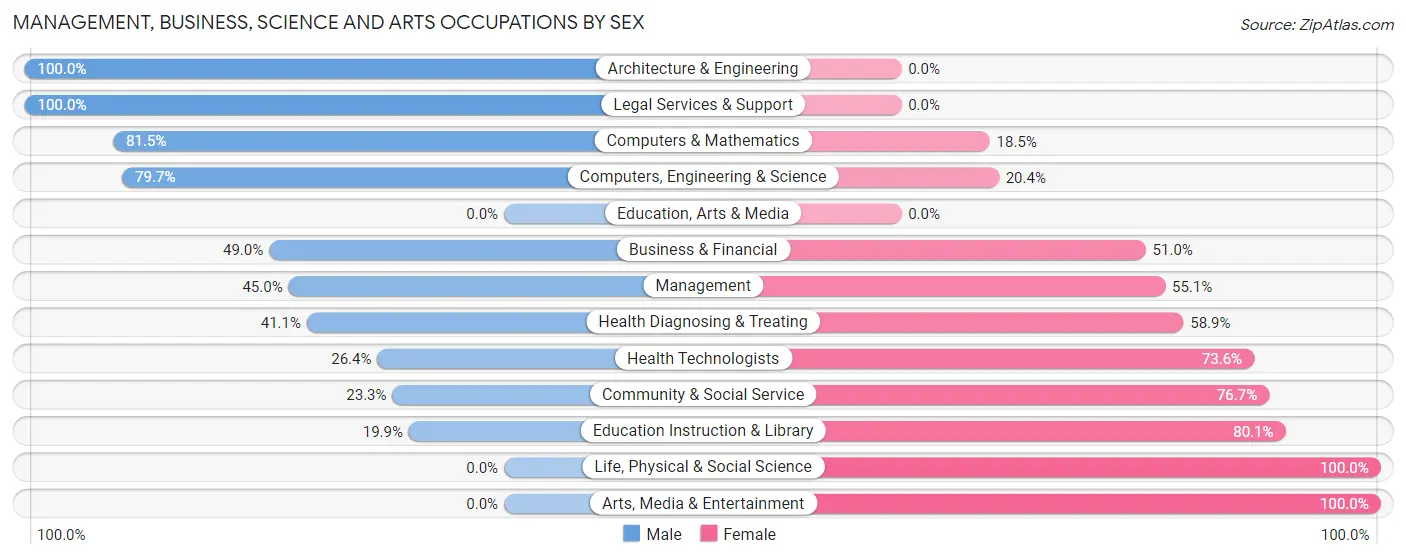
Management, Business, Science and Arts Occupations by Sex
Within the Management, Business, Science and Arts occupations in Le Claire, the most male-oriented occupations are Architecture & Engineering (100.0%), Legal Services & Support (100.0%), and Computers & Mathematics (81.5%), while the most female-oriented occupations are Life, Physical & Social Science (100.0%), Arts, Media & Entertainment (100.0%), and Education Instruction & Library (80.1%).
| Occupation | Male | Female |
| Management | 98 (45.0%) | 120 (55.0%) |
| Business & Financial | 49 (49.0%) | 51 (51.0%) |
| Computers, Engineering & Science | 90 (79.6%) | 23 (20.3%) |
| Computers & Mathematics | 53 (81.5%) | 12 (18.5%) |
| Architecture & Engineering | 37 (100.0%) | 0 (0.0%) |
| Life, Physical & Social Science | 0 (0.0%) | 11 (100.0%) |
| Community & Social Service | 44 (23.3%) | 145 (76.7%) |
| Education, Arts & Media | 0 (0.0%) | 0 (0.0%) |
| Legal Services & Support | 15 (100.0%) | 0 (0.0%) |
| Education Instruction & Library | 29 (19.9%) | 117 (80.1%) |
| Arts, Media & Entertainment | 0 (0.0%) | 28 (100.0%) |
| Health Diagnosing & Treating | 65 (41.1%) | 93 (58.9%) |
| Health Technologists | 28 (26.4%) | 78 (73.6%) |
| Total (Category) | 346 (44.5%) | 432 (55.5%) |
| Total (Overall) | 965 (50.3%) | 953 (49.7%) |
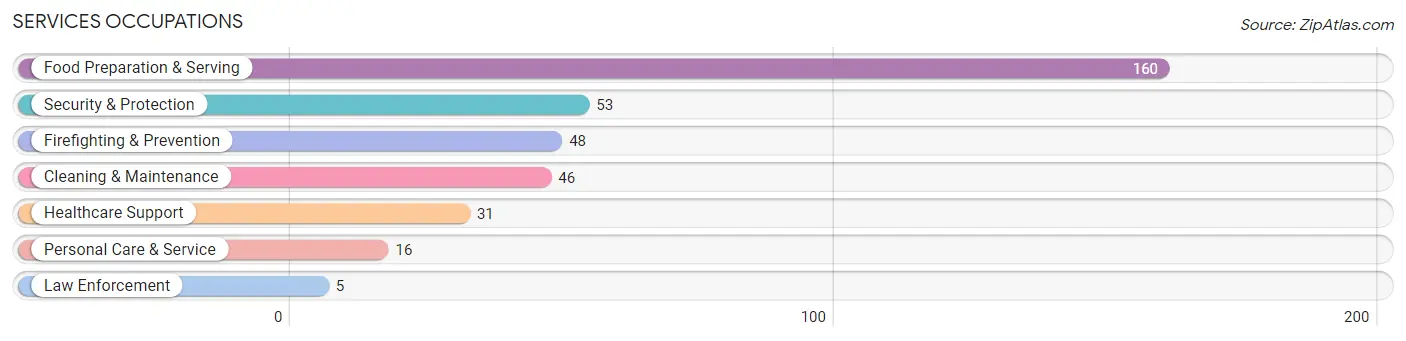
Services Occupations
The most common Services occupations in Le Claire are Food Preparation & Serving (160 | 8.3%), Security & Protection (53 | 2.8%), Firefighting & Prevention (48 | 2.5%), Cleaning & Maintenance (46 | 2.4%), and Healthcare Support (31 | 1.6%).
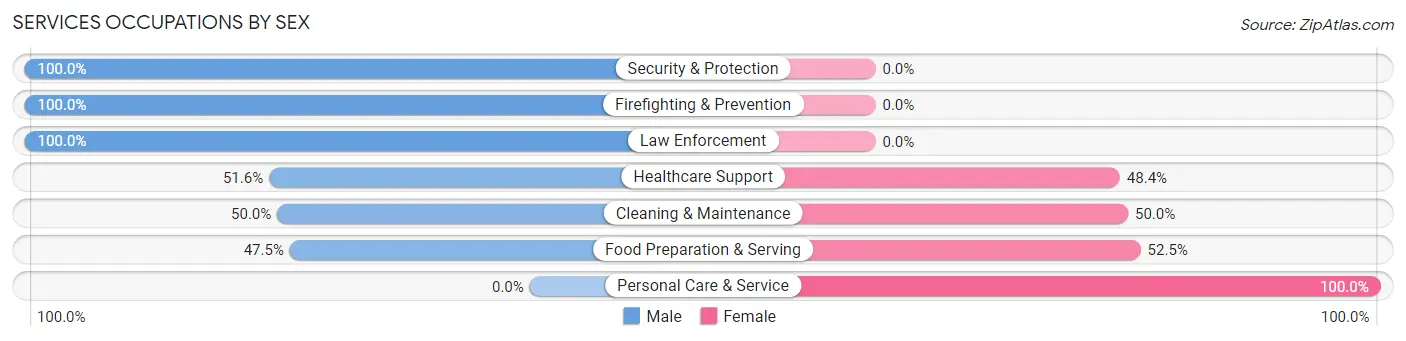
Services Occupations by Sex
Within the Services occupations in Le Claire, the most male-oriented occupations are Security & Protection (100.0%), Firefighting & Prevention (100.0%), and Law Enforcement (100.0%), while the most female-oriented occupations are Personal Care & Service (100.0%), Food Preparation & Serving (52.5%), and Cleaning & Maintenance (50.0%).
| Occupation | Male | Female |
| Healthcare Support | 16 (51.6%) | 15 (48.4%) |
| Security & Protection | 53 (100.0%) | 0 (0.0%) |
| Firefighting & Prevention | 48 (100.0%) | 0 (0.0%) |
| Law Enforcement | 5 (100.0%) | 0 (0.0%) |
| Food Preparation & Serving | 76 (47.5%) | 84 (52.5%) |
| Cleaning & Maintenance | 23 (50.0%) | 23 (50.0%) |
| Personal Care & Service | 0 (0.0%) | 16 (100.0%) |
| Total (Category) | 168 (54.9%) | 138 (45.1%) |
| Total (Overall) | 965 (50.3%) | 953 (49.7%) |
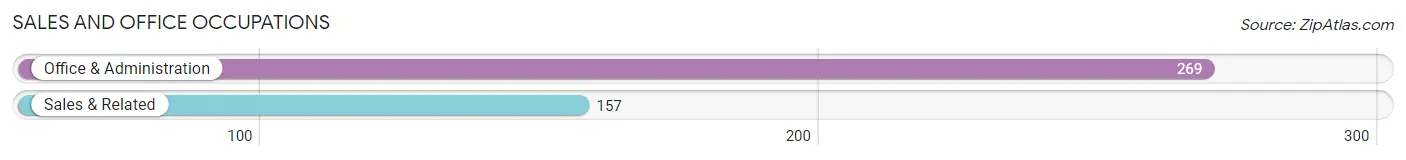
Sales and Office Occupations
The most common Sales and Office occupations in Le Claire are Office & Administration (269 | 14.0%), and Sales & Related (157 | 8.2%).
Sales and Office Occupations by Sex
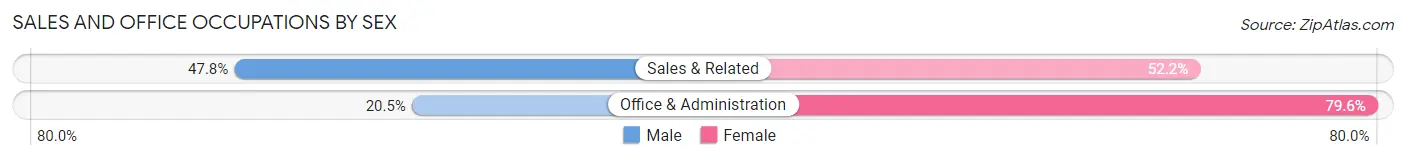
| Occupation | Male | Female |
| Sales & Related | 75 (47.8%) | 82 (52.2%) |
| Office & Administration | 55 (20.4%) | 214 (79.5%) |
| Total (Category) | 130 (30.5%) | 296 (69.5%) |
| Total (Overall) | 965 (50.3%) | 953 (49.7%) |
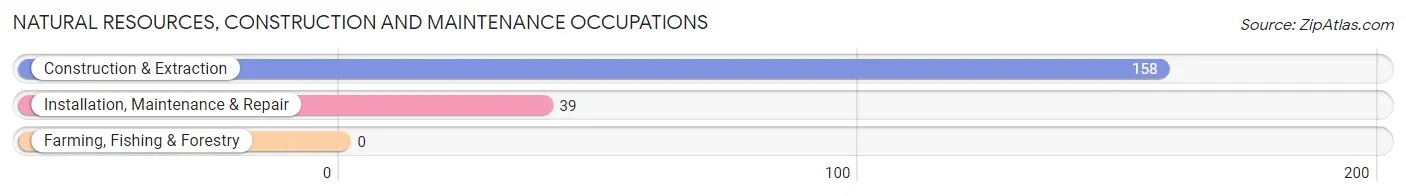
Natural Resources, Construction and Maintenance Occupations
The most common Natural Resources, Construction and Maintenance occupations in Le Claire are Construction & Extraction (158 | 8.2%), and Installation, Maintenance & Repair (39 | 2.0%).
Natural Resources, Construction and Maintenance Occupations by Sex
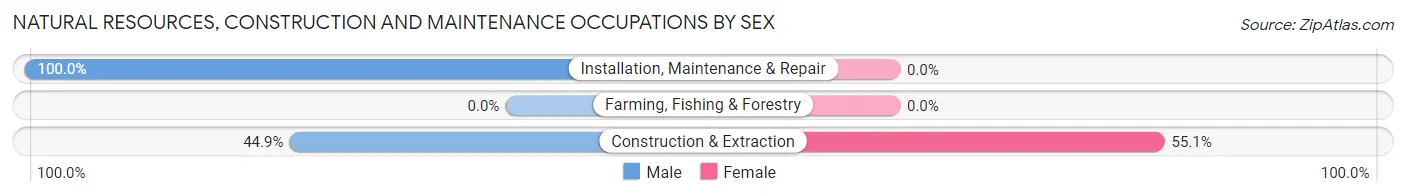
| Occupation | Male | Female |
| Farming, Fishing & Forestry | 0 (0.0%) | 0 (0.0%) |
| Construction & Extraction | 71 (44.9%) | 87 (55.1%) |
| Installation, Maintenance & Repair | 39 (100.0%) | 0 (0.0%) |
| Total (Category) | 110 (55.8%) | 87 (44.2%) |
| Total (Overall) | 965 (50.3%) | 953 (49.7%) |
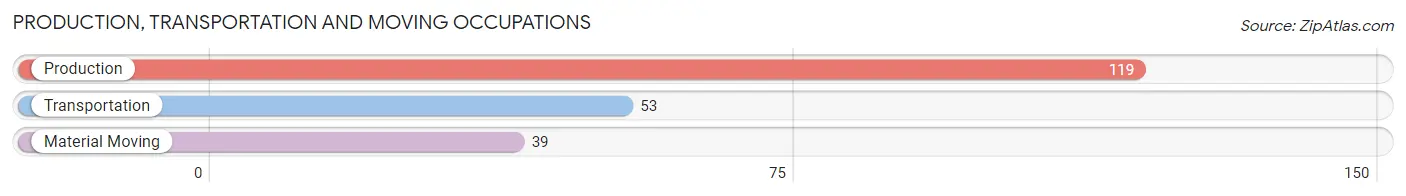
Production, Transportation and Moving Occupations
The most common Production, Transportation and Moving occupations in Le Claire are Production (119 | 6.2%), Transportation (53 | 2.8%), and Material Moving (39 | 2.0%).
Production, Transportation and Moving Occupations by Sex
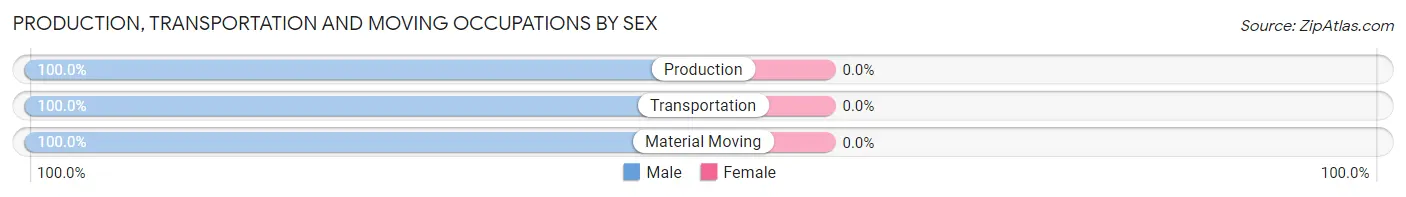
| Occupation | Male | Female |
| Production | 119 (100.0%) | 0 (0.0%) |
| Transportation | 53 (100.0%) | 0 (0.0%) |
| Material Moving | 39 (100.0%) | 0 (0.0%) |
| Total (Category) | 211 (100.0%) | 0 (0.0%) |
| Total (Overall) | 965 (50.3%) | 953 (49.7%) |
Employment Industries by Sex in Le Claire
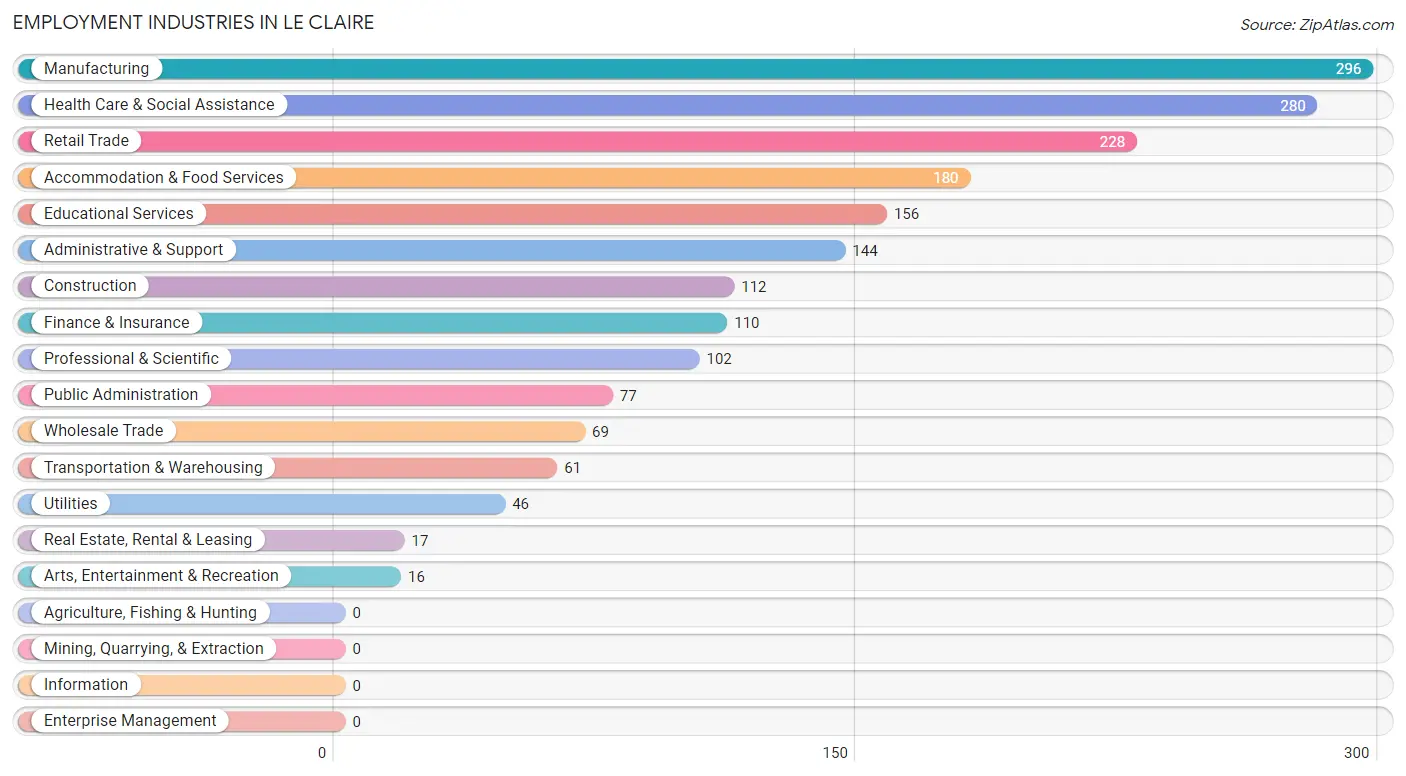
Employment Industries in Le Claire
The major employment industries in Le Claire include Manufacturing (296 | 15.4%), Health Care & Social Assistance (280 | 14.6%), Retail Trade (228 | 11.9%), Accommodation & Food Services (180 | 9.4%), and Educational Services (156 | 8.1%).
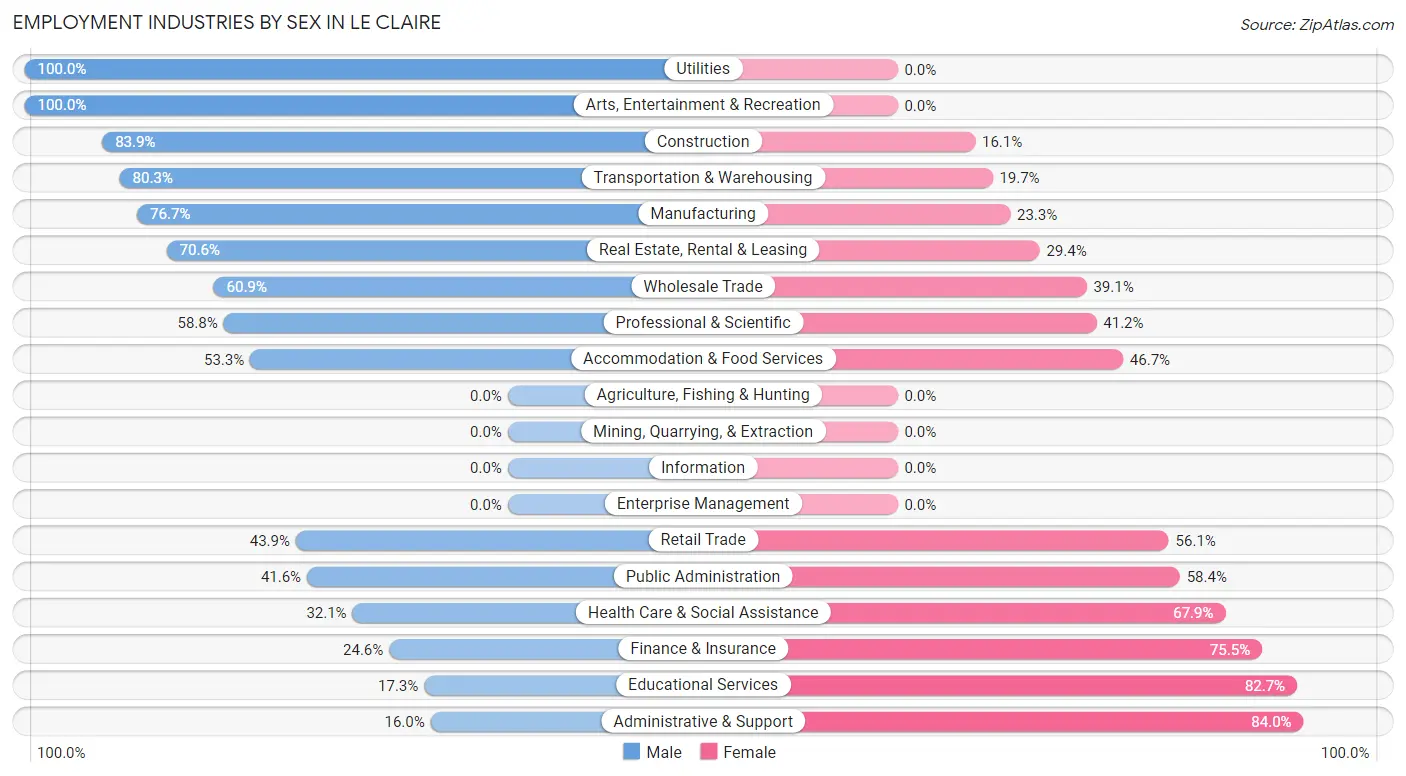
Employment Industries by Sex in Le Claire
The Le Claire industries that see more men than women are Utilities (100.0%), Arts, Entertainment & Recreation (100.0%), and Construction (83.9%), whereas the industries that tend to have a higher number of women are Administrative & Support (84.0%), Educational Services (82.7%), and Finance & Insurance (75.4%).
| Industry | Male | Female |
| Agriculture, Fishing & Hunting | 0 (0.0%) | 0 (0.0%) |
| Mining, Quarrying, & Extraction | 0 (0.0%) | 0 (0.0%) |
| Construction | 94 (83.9%) | 18 (16.1%) |
| Manufacturing | 227 (76.7%) | 69 (23.3%) |
| Wholesale Trade | 42 (60.9%) | 27 (39.1%) |
| Retail Trade | 100 (43.9%) | 128 (56.1%) |
| Transportation & Warehousing | 49 (80.3%) | 12 (19.7%) |
| Utilities | 46 (100.0%) | 0 (0.0%) |
| Information | 0 (0.0%) | 0 (0.0%) |
| Finance & Insurance | 27 (24.5%) | 83 (75.4%) |
| Real Estate, Rental & Leasing | 12 (70.6%) | 5 (29.4%) |
| Professional & Scientific | 60 (58.8%) | 42 (41.2%) |
| Enterprise Management | 0 (0.0%) | 0 (0.0%) |
| Administrative & Support | 23 (16.0%) | 121 (84.0%) |
| Educational Services | 27 (17.3%) | 129 (82.7%) |
| Health Care & Social Assistance | 90 (32.1%) | 190 (67.9%) |
| Arts, Entertainment & Recreation | 16 (100.0%) | 0 (0.0%) |
| Accommodation & Food Services | 96 (53.3%) | 84 (46.7%) |
| Public Administration | 32 (41.6%) | 45 (58.4%) |
| Total | 965 (50.3%) | 953 (49.7%) |
Education in Le Claire
School Enrollment in Le Claire
The most common levels of schooling among the 1,603 students in Le Claire are kindergarten (467 | 29.1%), middle school (373 | 23.3%), and elementary school (341 | 21.3%).
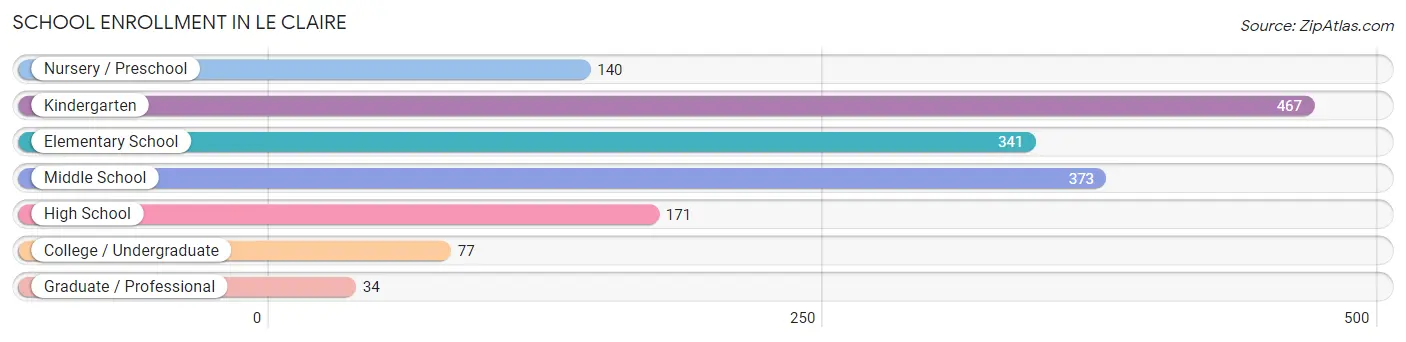
| School Level | # Students | % Students |
| Nursery / Preschool | 140 | 8.7% |
| Kindergarten | 467 | 29.1% |
| Elementary School | 341 | 21.3% |
| Middle School | 373 | 23.3% |
| High School | 171 | 10.7% |
| College / Undergraduate | 77 | 4.8% |
| Graduate / Professional | 34 | 2.1% |
| Total | 1,603 | 100.0% |
School Enrollment by Age by Funding Source in Le Claire
Out of a total of 1,603 students who are enrolled in schools in Le Claire, 96 (6.0%) attend a private institution, while the remaining 1,507 (94.0%) are enrolled in public schools. The age group of 25 to 34 year olds has the highest likelihood of being enrolled in private schools, with 24 (68.6% in the age bracket) enrolled. Conversely, the age group of 18 to 19 year olds has the lowest likelihood of being enrolled in a private school, with 37 (100.0% in the age bracket) attending a public institution.
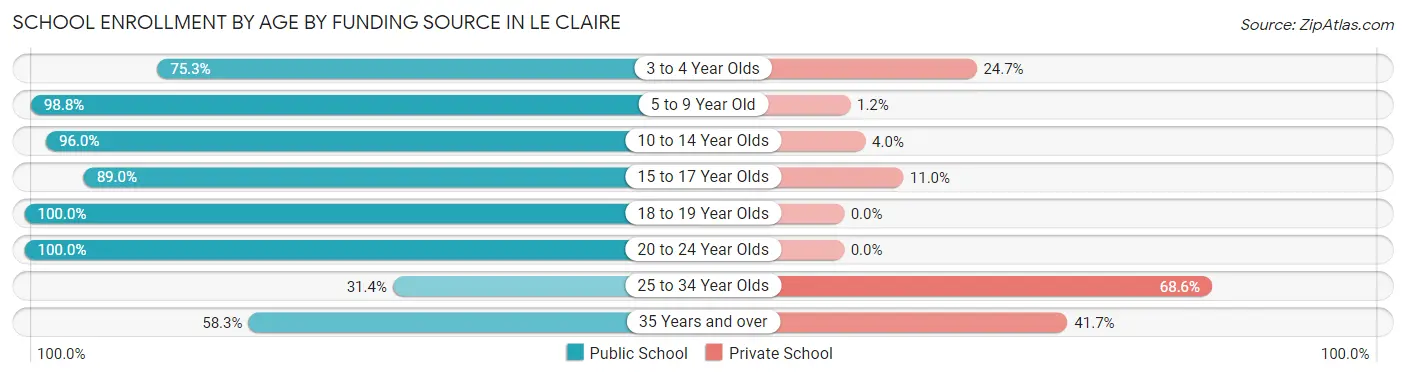
| Age Bracket | Public School | Private School |
| 3 to 4 Year Olds | 70 (75.3%) | 23 (24.7%) |
| 5 to 9 Year Old | 834 (98.8%) | 10 (1.2%) |
| 10 to 14 Year Olds | 384 (96.0%) | 16 (4.0%) |
| 15 to 17 Year Olds | 105 (89.0%) | 13 (11.0%) |
| 18 to 19 Year Olds | 37 (100.0%) | 0 (0.0%) |
| 20 to 24 Year Olds | 52 (100.0%) | 0 (0.0%) |
| 25 to 34 Year Olds | 11 (31.4%) | 24 (68.6%) |
| 35 Years and over | 14 (58.3%) | 10 (41.7%) |
| Total | 1,507 (94.0%) | 96 (6.0%) |
Educational Attainment by Field of Study in Le Claire
Business (212 | 19.7%), engineering (180 | 16.7%), arts & humanities (119 | 11.0%), education (109 | 10.1%), and bio, nature & agricultural (94 | 8.7%) are the most common fields of study among 1,078 individuals in Le Claire who have obtained a bachelor's degree or higher.
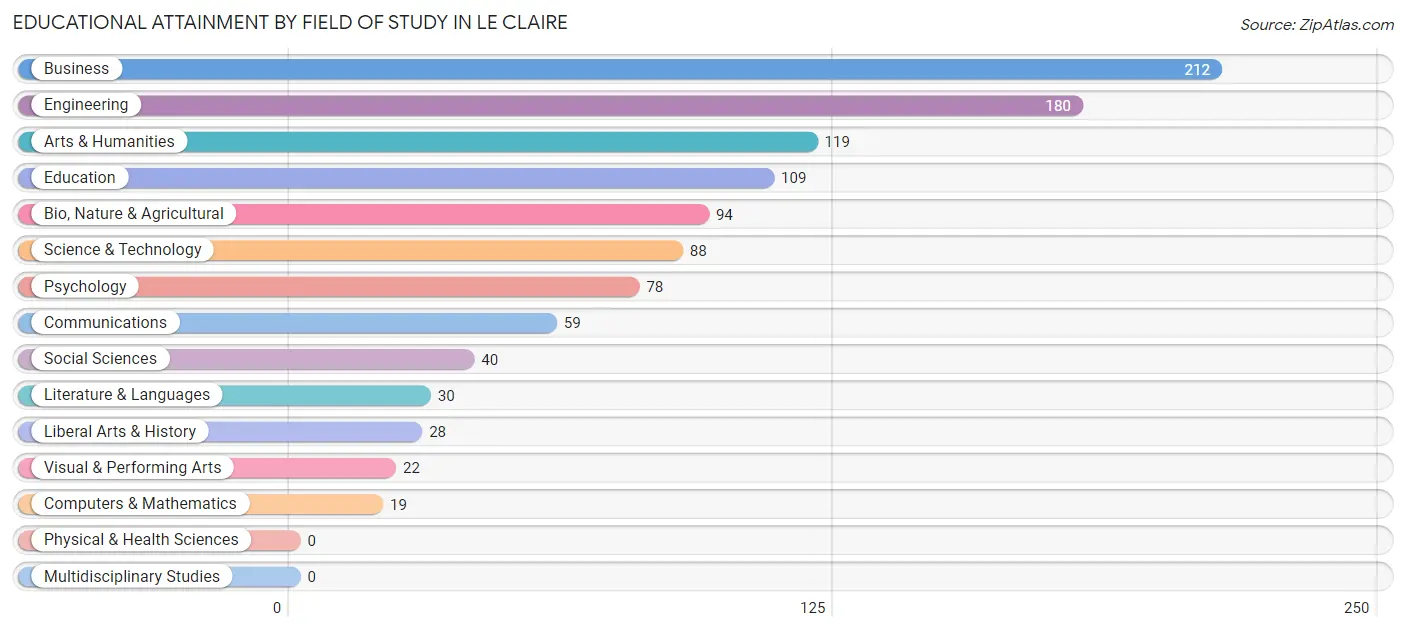
| Field of Study | # Graduates | % Graduates |
| Computers & Mathematics | 19 | 1.8% |
| Bio, Nature & Agricultural | 94 | 8.7% |
| Physical & Health Sciences | 0 | 0.0% |
| Psychology | 78 | 7.2% |
| Social Sciences | 40 | 3.7% |
| Engineering | 180 | 16.7% |
| Multidisciplinary Studies | 0 | 0.0% |
| Science & Technology | 88 | 8.2% |
| Business | 212 | 19.7% |
| Education | 109 | 10.1% |
| Literature & Languages | 30 | 2.8% |
| Liberal Arts & History | 28 | 2.6% |
| Visual & Performing Arts | 22 | 2.0% |
| Communications | 59 | 5.5% |
| Arts & Humanities | 119 | 11.0% |
| Total | 1,078 | 100.0% |
Transportation & Commute in Le Claire
Vehicle Availability by Sex in Le Claire
The most prevalent vehicle ownership categories in Le Claire are males with 2 vehicles (460, accounting for 48.3%) and females with 2 vehicles (455, making up 49.7%).
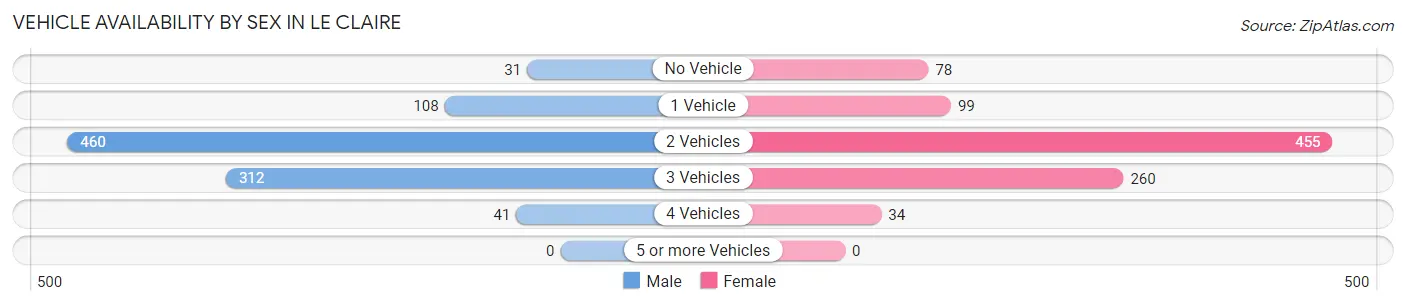
| Vehicles Available | Male | Female |
| No Vehicle | 31 (3.3%) | 78 (8.4%) |
| 1 Vehicle | 108 (11.3%) | 99 (10.7%) |
| 2 Vehicles | 460 (48.3%) | 455 (49.1%) |
| 3 Vehicles | 312 (32.8%) | 260 (28.1%) |
| 4 Vehicles | 41 (4.3%) | 34 (3.7%) |
| 5 or more Vehicles | 0 (0.0%) | 0 (0.0%) |
| Total | 952 (100.0%) | 926 (100.0%) |
Commute Time in Le Claire
The most frequently occuring commute durations in Le Claire are 20 to 24 minutes (334 commuters, 20.3%), 30 to 34 minutes (318 commuters, 19.4%), and 25 to 29 minutes (248 commuters, 15.1%).
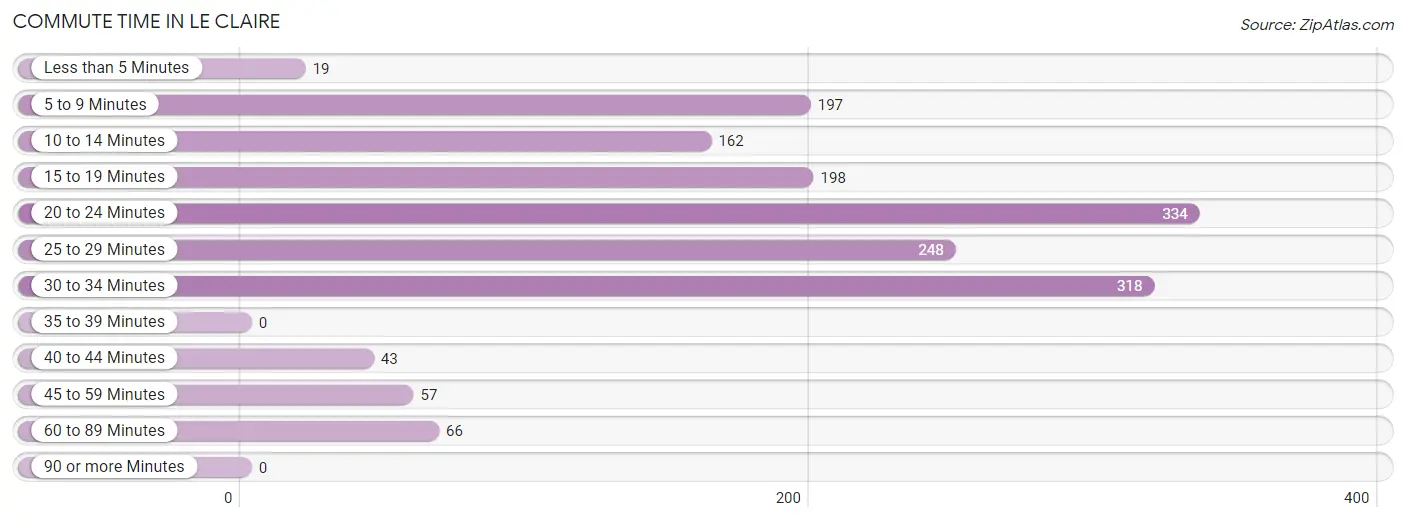
| Commute Time | # Commuters | % Commuters |
| Less than 5 Minutes | 19 | 1.2% |
| 5 to 9 Minutes | 197 | 12.0% |
| 10 to 14 Minutes | 162 | 9.9% |
| 15 to 19 Minutes | 198 | 12.1% |
| 20 to 24 Minutes | 334 | 20.3% |
| 25 to 29 Minutes | 248 | 15.1% |
| 30 to 34 Minutes | 318 | 19.4% |
| 35 to 39 Minutes | 0 | 0.0% |
| 40 to 44 Minutes | 43 | 2.6% |
| 45 to 59 Minutes | 57 | 3.5% |
| 60 to 89 Minutes | 66 | 4.0% |
| 90 or more Minutes | 0 | 0.0% |
Commute Time by Sex in Le Claire
The most common commute times in Le Claire are 25 to 29 minutes (248 commuters, 29.0%) for males and 30 to 34 minutes (163 commuters, 20.7%) for females.
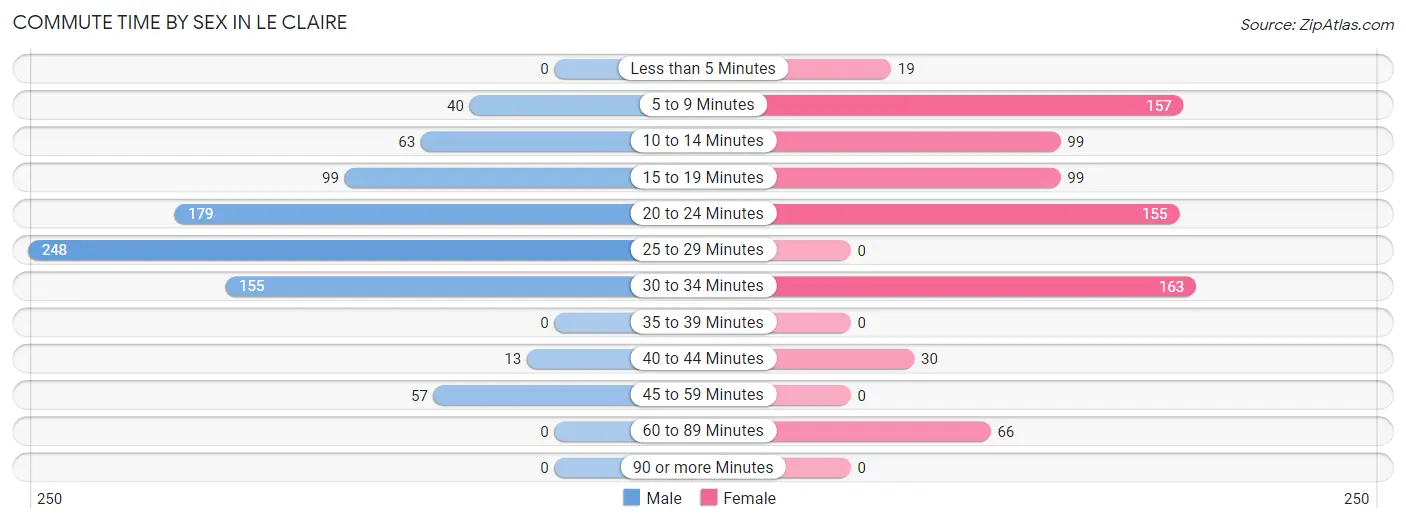
| Commute Time | Male | Female |
| Less than 5 Minutes | 0 (0.0%) | 19 (2.4%) |
| 5 to 9 Minutes | 40 (4.7%) | 157 (19.9%) |
| 10 to 14 Minutes | 63 (7.4%) | 99 (12.6%) |
| 15 to 19 Minutes | 99 (11.6%) | 99 (12.6%) |
| 20 to 24 Minutes | 179 (21.0%) | 155 (19.7%) |
| 25 to 29 Minutes | 248 (29.0%) | 0 (0.0%) |
| 30 to 34 Minutes | 155 (18.1%) | 163 (20.7%) |
| 35 to 39 Minutes | 0 (0.0%) | 0 (0.0%) |
| 40 to 44 Minutes | 13 (1.5%) | 30 (3.8%) |
| 45 to 59 Minutes | 57 (6.7%) | 0 (0.0%) |
| 60 to 89 Minutes | 0 (0.0%) | 66 (8.4%) |
| 90 or more Minutes | 0 (0.0%) | 0 (0.0%) |
Time of Departure to Work by Sex in Le Claire
The most frequent times of departure to work in Le Claire are 6:00 AM to 6:29 AM (135, 15.8%) for males and 8:00 AM to 8:29 AM (173, 22.0%) for females.
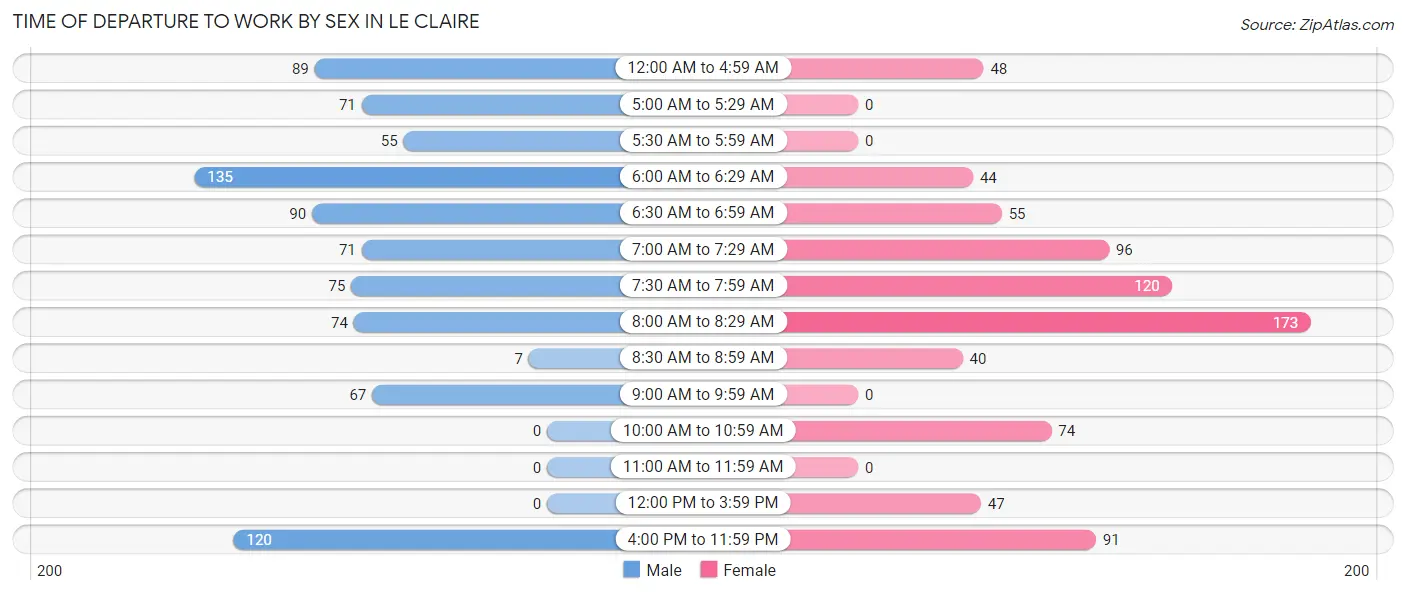
| Time of Departure | Male | Female |
| 12:00 AM to 4:59 AM | 89 (10.4%) | 48 (6.1%) |
| 5:00 AM to 5:29 AM | 71 (8.3%) | 0 (0.0%) |
| 5:30 AM to 5:59 AM | 55 (6.4%) | 0 (0.0%) |
| 6:00 AM to 6:29 AM | 135 (15.8%) | 44 (5.6%) |
| 6:30 AM to 6:59 AM | 90 (10.5%) | 55 (7.0%) |
| 7:00 AM to 7:29 AM | 71 (8.3%) | 96 (12.2%) |
| 7:30 AM to 7:59 AM | 75 (8.8%) | 120 (15.2%) |
| 8:00 AM to 8:29 AM | 74 (8.7%) | 173 (22.0%) |
| 8:30 AM to 8:59 AM | 7 (0.8%) | 40 (5.1%) |
| 9:00 AM to 9:59 AM | 67 (7.9%) | 0 (0.0%) |
| 10:00 AM to 10:59 AM | 0 (0.0%) | 74 (9.4%) |
| 11:00 AM to 11:59 AM | 0 (0.0%) | 0 (0.0%) |
| 12:00 PM to 3:59 PM | 0 (0.0%) | 47 (6.0%) |
| 4:00 PM to 11:59 PM | 120 (14.1%) | 91 (11.6%) |
| Total | 854 (100.0%) | 788 (100.0%) |
Housing Occupancy in Le Claire
Occupancy by Ownership in Le Claire
Of the total 1,703 dwellings in Le Claire, owner-occupied units account for 1,191 (69.9%), while renter-occupied units make up 512 (30.1%).
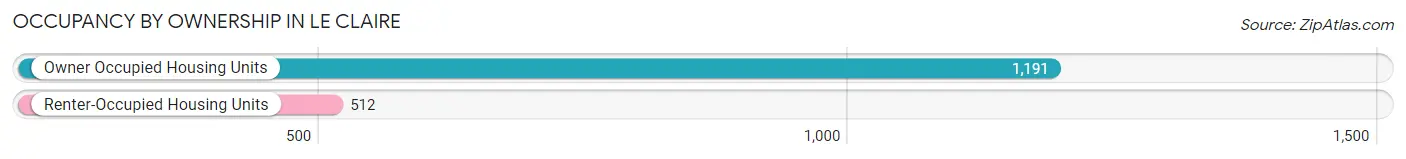
| Occupancy | # Housing Units | % Housing Units |
| Owner Occupied Housing Units | 1,191 | 69.9% |
| Renter-Occupied Housing Units | 512 | 30.1% |
| Total Occupied Housing Units | 1,703 | 100.0% |
Occupancy by Household Size in Le Claire
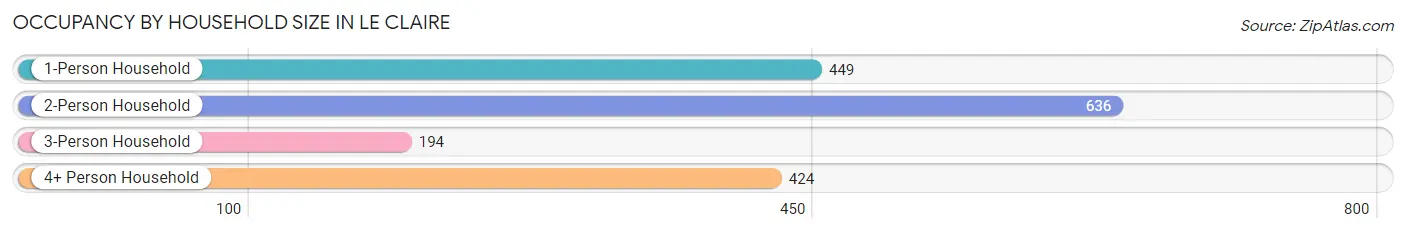
| Household Size | # Housing Units | % Housing Units |
| 1-Person Household | 449 | 26.4% |
| 2-Person Household | 636 | 37.3% |
| 3-Person Household | 194 | 11.4% |
| 4+ Person Household | 424 | 24.9% |
| Total Housing Units | 1,703 | 100.0% |
Occupancy by Ownership by Household Size in Le Claire
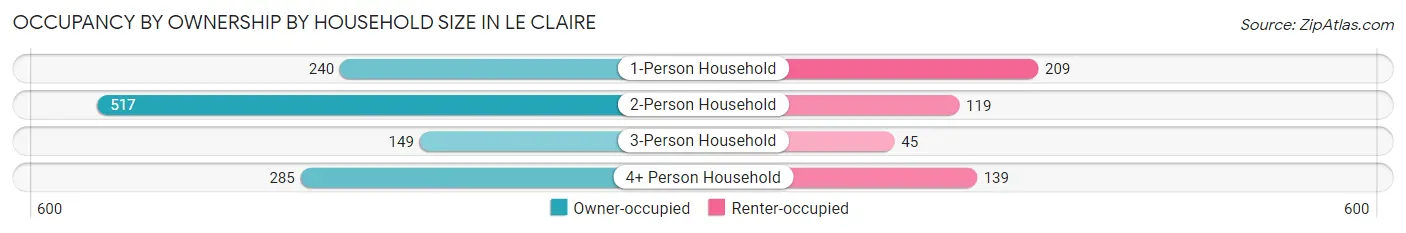
| Household Size | Owner-occupied | Renter-occupied |
| 1-Person Household | 240 (53.4%) | 209 (46.6%) |
| 2-Person Household | 517 (81.3%) | 119 (18.7%) |
| 3-Person Household | 149 (76.8%) | 45 (23.2%) |
| 4+ Person Household | 285 (67.2%) | 139 (32.8%) |
| Total Housing Units | 1,191 (69.9%) | 512 (30.1%) |
Occupancy by Educational Attainment in Le Claire
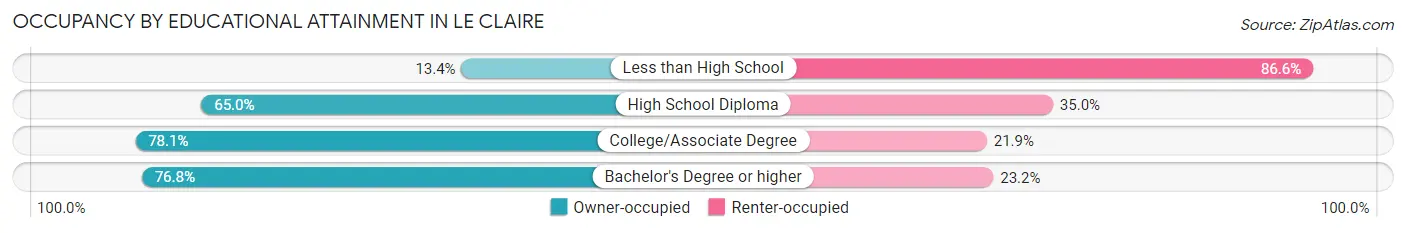
| Household Size | Owner-occupied | Renter-occupied |
| Less than High School | 17 (13.4%) | 110 (86.6%) |
| High School Diploma | 241 (65.0%) | 130 (35.0%) |
| College/Associate Degree | 477 (78.1%) | 134 (21.9%) |
| Bachelor's Degree or higher | 456 (76.8%) | 138 (23.2%) |
Occupancy by Age of Householder in Le Claire
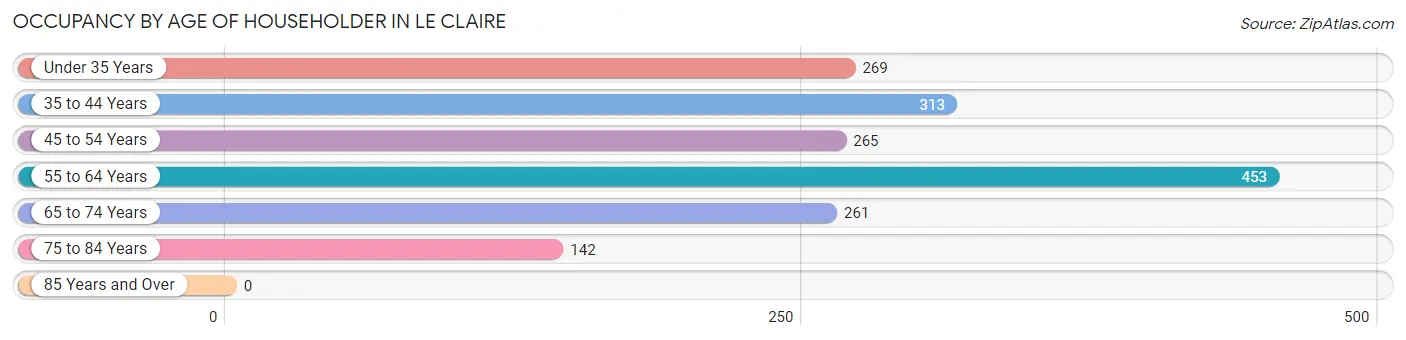
| Age Bracket | # Households | % Households |
| Under 35 Years | 269 | 15.8% |
| 35 to 44 Years | 313 | 18.4% |
| 45 to 54 Years | 265 | 15.6% |
| 55 to 64 Years | 453 | 26.6% |
| 65 to 74 Years | 261 | 15.3% |
| 75 to 84 Years | 142 | 8.3% |
| 85 Years and Over | 0 | 0.0% |
| Total | 1,703 | 100.0% |
Housing Finances in Le Claire
Median Income by Occupancy in Le Claire
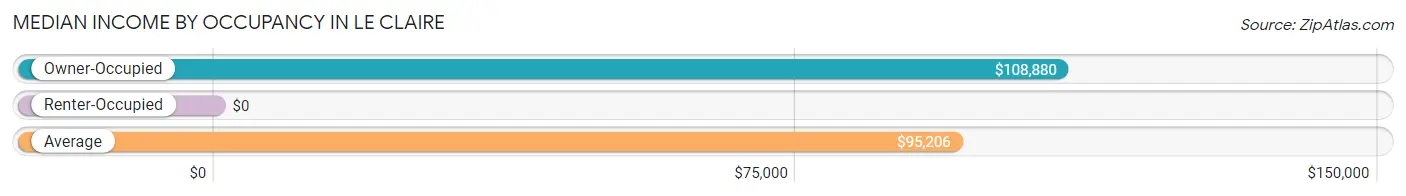
| Occupancy Type | # Households | Median Income |
| Owner-Occupied | 1,191 (69.9%) | $108,880 |
| Renter-Occupied | 512 (30.1%) | $0 |
| Average | 1,703 (100.0%) | $95,206 |
Occupancy by Householder Income Bracket in Le Claire
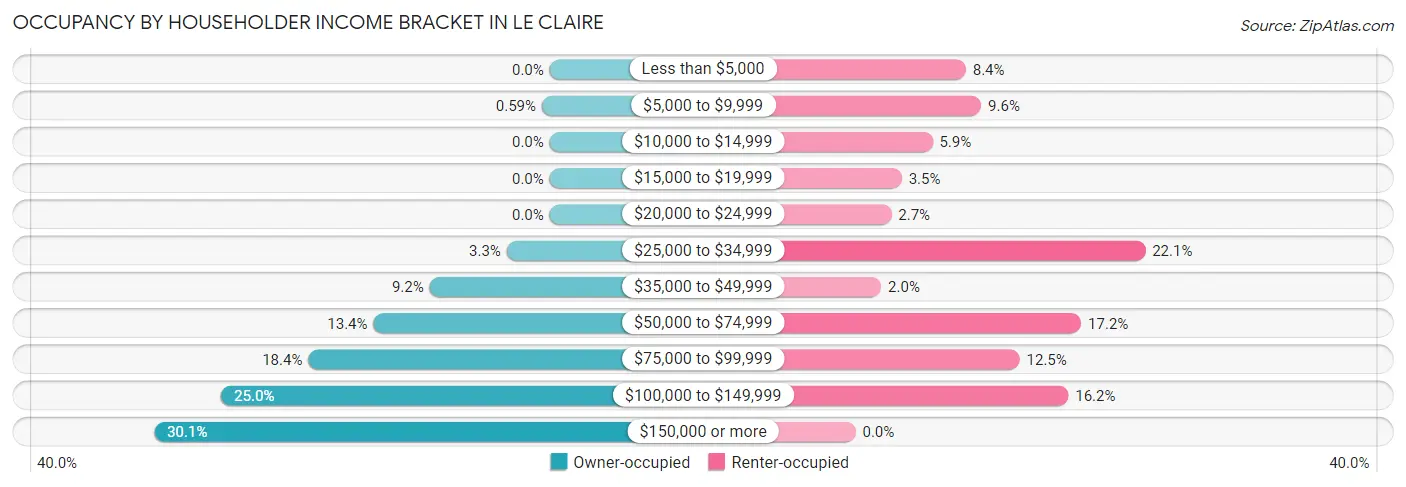
| Income Bracket | Owner-occupied | Renter-occupied |
| Less than $5,000 | 0 (0.0%) | 43 (8.4%) |
| $5,000 to $9,999 | 7 (0.6%) | 49 (9.6%) |
| $10,000 to $14,999 | 0 (0.0%) | 30 (5.9%) |
| $15,000 to $19,999 | 0 (0.0%) | 18 (3.5%) |
| $20,000 to $24,999 | 0 (0.0%) | 14 (2.7%) |
| $25,000 to $34,999 | 39 (3.3%) | 113 (22.1%) |
| $35,000 to $49,999 | 109 (9.1%) | 10 (1.9%) |
| $50,000 to $74,999 | 160 (13.4%) | 88 (17.2%) |
| $75,000 to $99,999 | 219 (18.4%) | 64 (12.5%) |
| $100,000 to $149,999 | 298 (25.0%) | 83 (16.2%) |
| $150,000 or more | 359 (30.1%) | 0 (0.0%) |
| Total | 1,191 (100.0%) | 512 (100.0%) |
Monthly Housing Cost Tiers in Le Claire
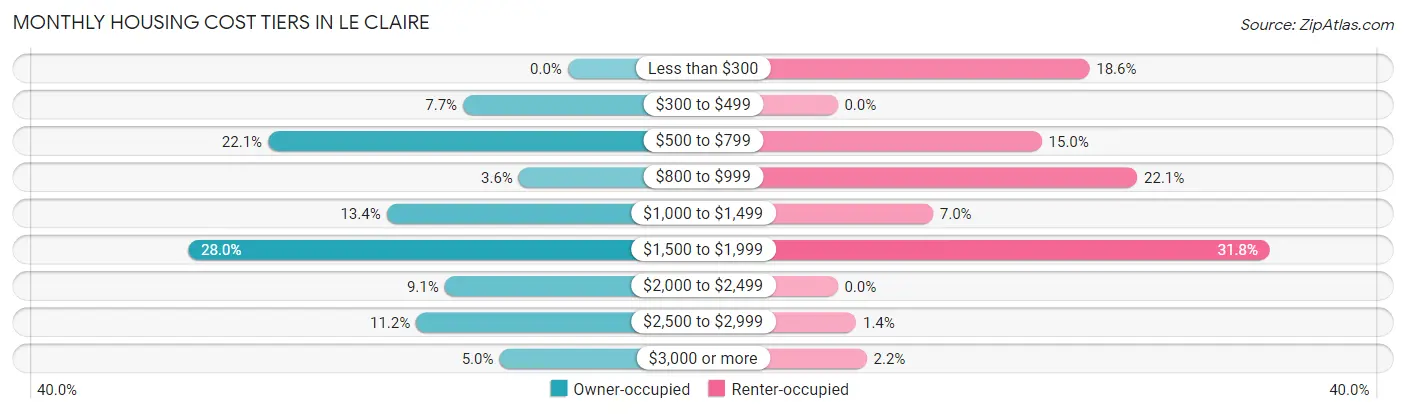
| Monthly Cost | Owner-occupied | Renter-occupied |
| Less than $300 | 0 (0.0%) | 95 (18.5%) |
| $300 to $499 | 92 (7.7%) | 0 (0.0%) |
| $500 to $799 | 263 (22.1%) | 77 (15.0%) |
| $800 to $999 | 43 (3.6%) | 113 (22.1%) |
| $1,000 to $1,499 | 159 (13.4%) | 36 (7.0%) |
| $1,500 to $1,999 | 333 (28.0%) | 163 (31.8%) |
| $2,000 to $2,499 | 108 (9.1%) | 0 (0.0%) |
| $2,500 to $2,999 | 133 (11.2%) | 7 (1.4%) |
| $3,000 or more | 60 (5.0%) | 11 (2.1%) |
| Total | 1,191 (100.0%) | 512 (100.0%) |
Physical Housing Characteristics in Le Claire
Housing Structures in Le Claire
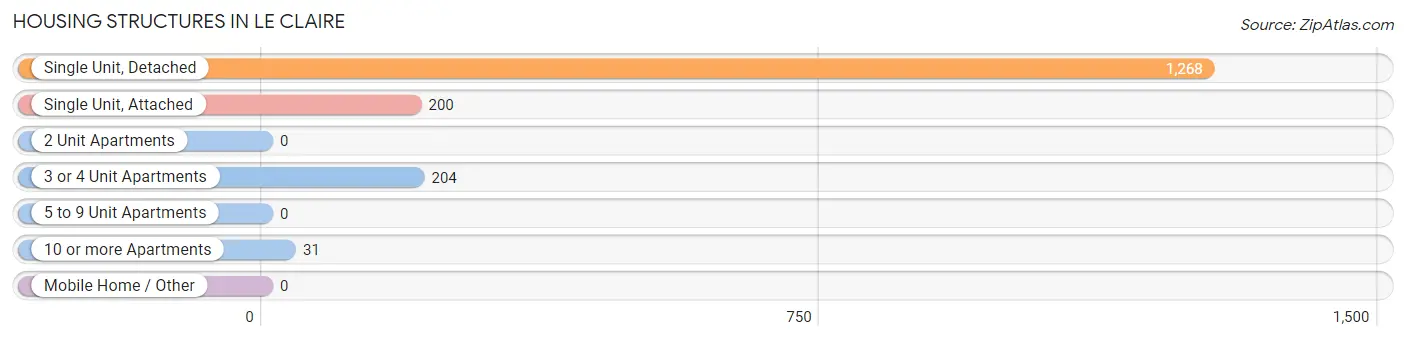
| Structure Type | # Housing Units | % Housing Units |
| Single Unit, Detached | 1,268 | 74.5% |
| Single Unit, Attached | 200 | 11.7% |
| 2 Unit Apartments | 0 | 0.0% |
| 3 or 4 Unit Apartments | 204 | 12.0% |
| 5 to 9 Unit Apartments | 0 | 0.0% |
| 10 or more Apartments | 31 | 1.8% |
| Mobile Home / Other | 0 | 0.0% |
| Total | 1,703 | 100.0% |
Housing Structures by Occupancy in Le Claire
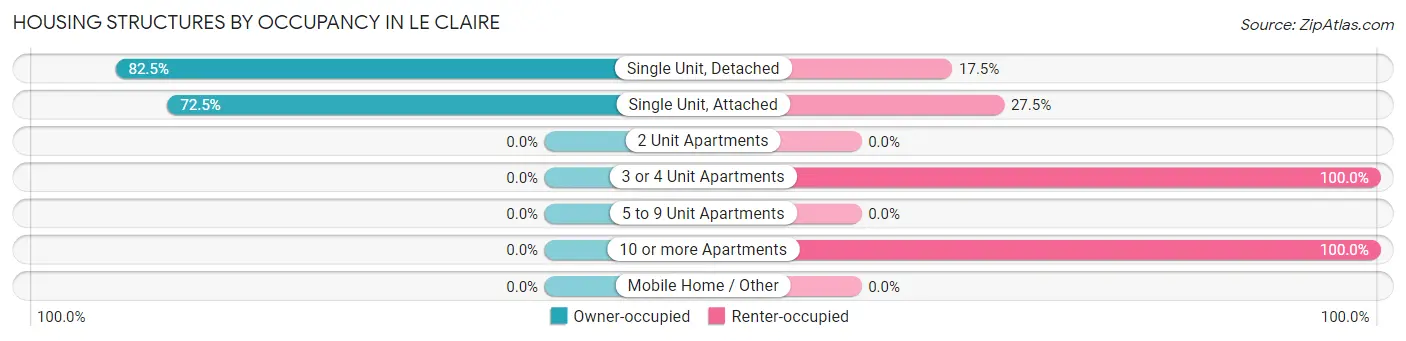
| Structure Type | Owner-occupied | Renter-occupied |
| Single Unit, Detached | 1,046 (82.5%) | 222 (17.5%) |
| Single Unit, Attached | 145 (72.5%) | 55 (27.5%) |
| 2 Unit Apartments | 0 (0.0%) | 0 (0.0%) |
| 3 or 4 Unit Apartments | 0 (0.0%) | 204 (100.0%) |
| 5 to 9 Unit Apartments | 0 (0.0%) | 0 (0.0%) |
| 10 or more Apartments | 0 (0.0%) | 31 (100.0%) |
| Mobile Home / Other | 0 (0.0%) | 0 (0.0%) |
| Total | 1,191 (69.9%) | 512 (30.1%) |
Housing Structures by Number of Rooms in Le Claire
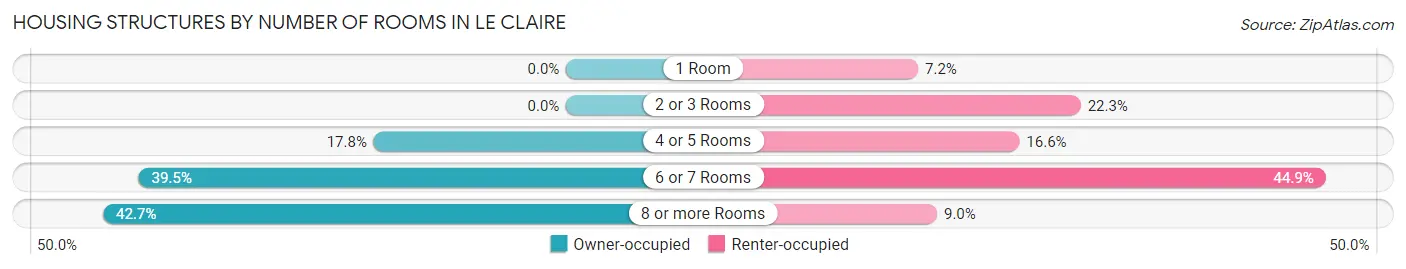
| Number of Rooms | Owner-occupied | Renter-occupied |
| 1 Room | 0 (0.0%) | 37 (7.2%) |
| 2 or 3 Rooms | 0 (0.0%) | 114 (22.3%) |
| 4 or 5 Rooms | 212 (17.8%) | 85 (16.6%) |
| 6 or 7 Rooms | 470 (39.5%) | 230 (44.9%) |
| 8 or more Rooms | 509 (42.7%) | 46 (9.0%) |
| Total | 1,191 (100.0%) | 512 (100.0%) |
Housing Structure by Heating Type in Le Claire
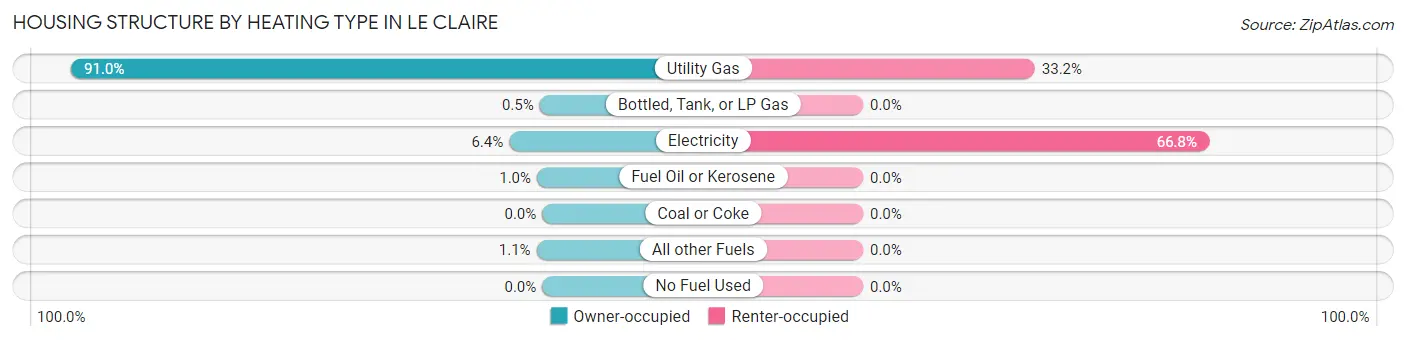
| Heating Type | Owner-occupied | Renter-occupied |
| Utility Gas | 1,084 (91.0%) | 170 (33.2%) |
| Bottled, Tank, or LP Gas | 6 (0.5%) | 0 (0.0%) |
| Electricity | 76 (6.4%) | 342 (66.8%) |
| Fuel Oil or Kerosene | 12 (1.0%) | 0 (0.0%) |
| Coal or Coke | 0 (0.0%) | 0 (0.0%) |
| All other Fuels | 13 (1.1%) | 0 (0.0%) |
| No Fuel Used | 0 (0.0%) | 0 (0.0%) |
| Total | 1,191 (100.0%) | 512 (100.0%) |
Household Vehicle Usage in Le Claire
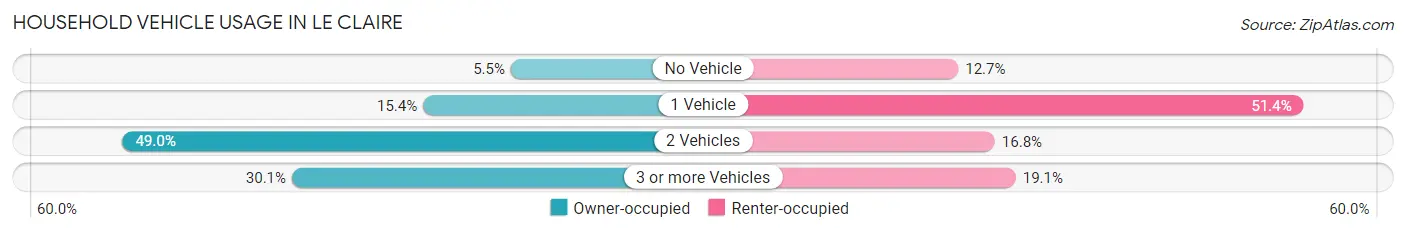
| Vehicles per Household | Owner-occupied | Renter-occupied |
| No Vehicle | 66 (5.5%) | 65 (12.7%) |
| 1 Vehicle | 183 (15.4%) | 263 (51.4%) |
| 2 Vehicles | 584 (49.0%) | 86 (16.8%) |
| 3 or more Vehicles | 358 (30.1%) | 98 (19.1%) |
| Total | 1,191 (100.0%) | 512 (100.0%) |
Real Estate & Mortgages in Le Claire
Real Estate and Mortgage Overview in Le Claire
| Characteristic | Without Mortgage | With Mortgage |
| Housing Units | 440 | 751 |
| Median Property Value | $198,500 | $306,900 |
| Median Household Income | $78,447 | $306 |
| Monthly Housing Costs | $670 | $60 |
| Real Estate Taxes | $2,899 | $0 |
Property Value by Mortgage Status in Le Claire
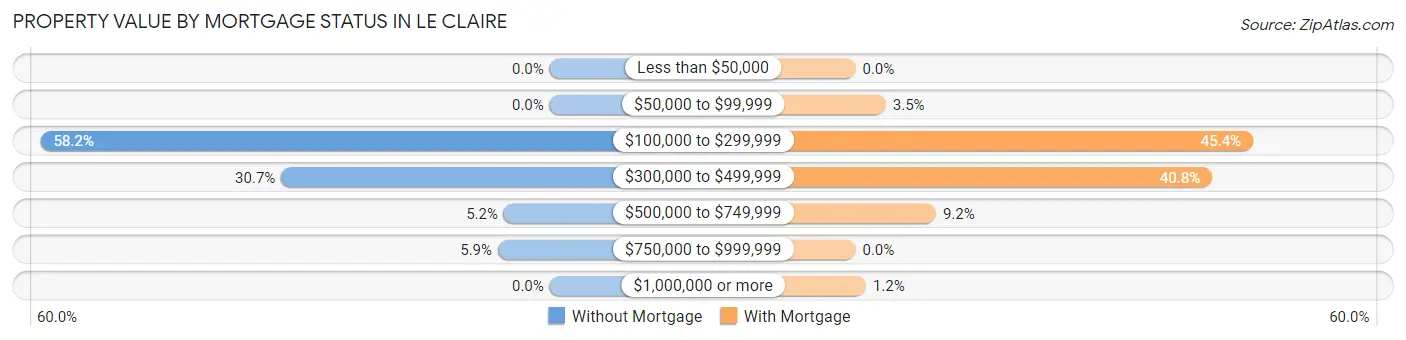
| Property Value | Without Mortgage | With Mortgage |
| Less than $50,000 | 0 (0.0%) | 0 (0.0%) |
| $50,000 to $99,999 | 0 (0.0%) | 26 (3.5%) |
| $100,000 to $299,999 | 256 (58.2%) | 341 (45.4%) |
| $300,000 to $499,999 | 135 (30.7%) | 306 (40.7%) |
| $500,000 to $749,999 | 23 (5.2%) | 69 (9.2%) |
| $750,000 to $999,999 | 26 (5.9%) | 0 (0.0%) |
| $1,000,000 or more | 0 (0.0%) | 9 (1.2%) |
| Total | 440 (100.0%) | 751 (100.0%) |
Household Income by Mortgage Status in Le Claire
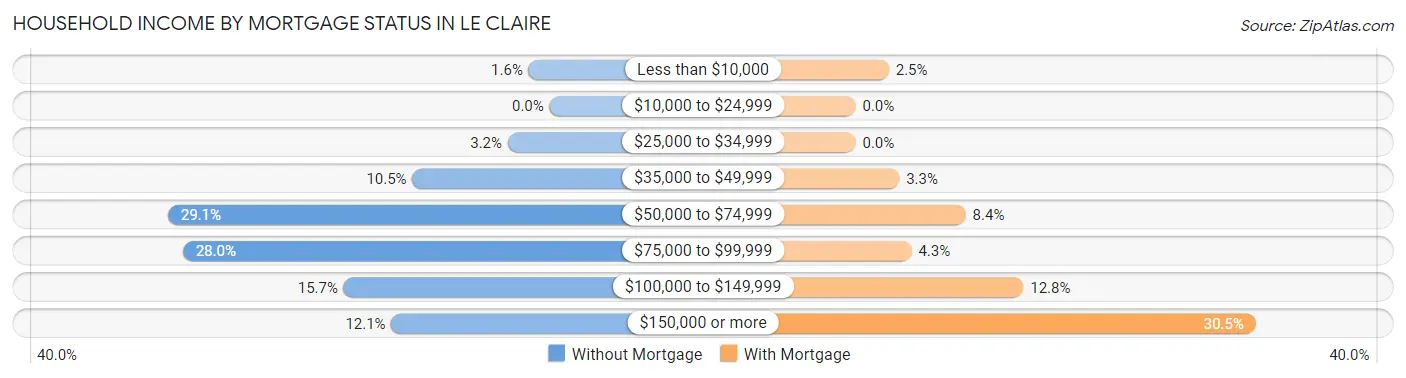
| Household Income | Without Mortgage | With Mortgage |
| Less than $10,000 | 7 (1.6%) | 19 (2.5%) |
| $10,000 to $24,999 | 0 (0.0%) | 0 (0.0%) |
| $25,000 to $34,999 | 14 (3.2%) | 0 (0.0%) |
| $35,000 to $49,999 | 46 (10.4%) | 25 (3.3%) |
| $50,000 to $74,999 | 128 (29.1%) | 63 (8.4%) |
| $75,000 to $99,999 | 123 (28.0%) | 32 (4.3%) |
| $100,000 to $149,999 | 69 (15.7%) | 96 (12.8%) |
| $150,000 or more | 53 (12.0%) | 229 (30.5%) |
| Total | 440 (100.0%) | 751 (100.0%) |
Property Value to Household Income Ratio in Le Claire
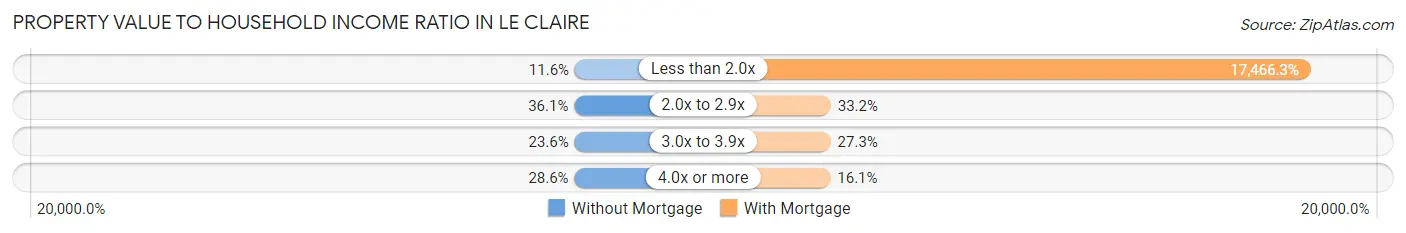
| Value-to-Income Ratio | Without Mortgage | With Mortgage |
| Less than 2.0x | 51 (11.6%) | 131,172 (17,466.3%) |
| 2.0x to 2.9x | 159 (36.1%) | 249 (33.2%) |
| 3.0x to 3.9x | 104 (23.6%) | 205 (27.3%) |
| 4.0x or more | 126 (28.6%) | 121 (16.1%) |
| Total | 440 (100.0%) | 751 (100.0%) |
Real Estate Taxes by Mortgage Status in Le Claire
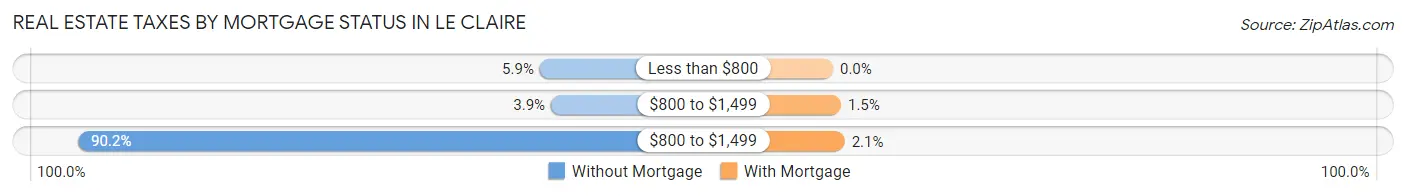
| Property Taxes | Without Mortgage | With Mortgage |
| Less than $800 | 26 (5.9%) | 0 (0.0%) |
| $800 to $1,499 | 17 (3.9%) | 11 (1.5%) |
| $800 to $1,499 | 397 (90.2%) | 16 (2.1%) |
| Total | 440 (100.0%) | 751 (100.0%) |
Health & Disability in Le Claire
Health Insurance Coverage by Age in Le Claire
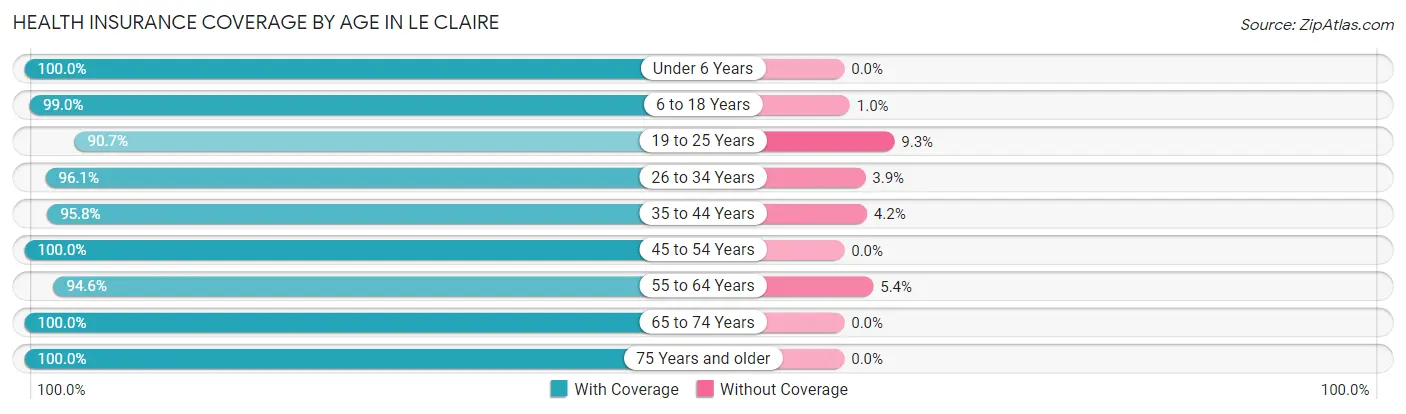
| Age Bracket | With Coverage | Without Coverage |
| Under 6 Years | 580 (100.0%) | 0 (0.0%) |
| 6 to 18 Years | 1,153 (99.0%) | 12 (1.0%) |
| 19 to 25 Years | 175 (90.7%) | 18 (9.3%) |
| 26 to 34 Years | 368 (96.1%) | 15 (3.9%) |
| 35 to 44 Years | 635 (95.8%) | 28 (4.2%) |
| 45 to 54 Years | 370 (100.0%) | 0 (0.0%) |
| 55 to 64 Years | 612 (94.6%) | 35 (5.4%) |
| 65 to 74 Years | 400 (100.0%) | 0 (0.0%) |
| 75 Years and older | 261 (100.0%) | 0 (0.0%) |
| Total | 4,554 (97.7%) | 108 (2.3%) |
Health Insurance Coverage by Citizenship Status in Le Claire
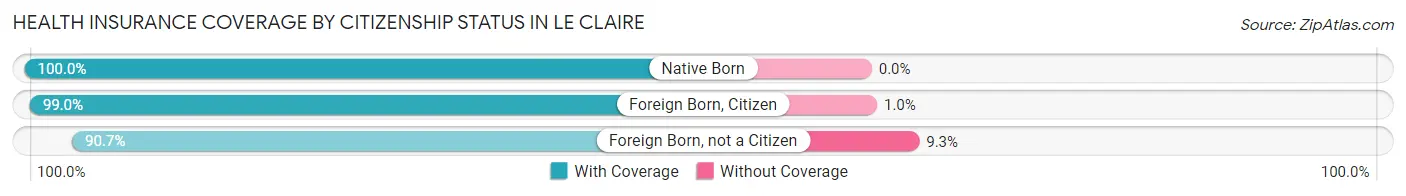
| Citizenship Status | With Coverage | Without Coverage |
| Native Born | 580 (100.0%) | 0 (0.0%) |
| Foreign Born, Citizen | 1,153 (99.0%) | 12 (1.0%) |
| Foreign Born, not a Citizen | 175 (90.7%) | 18 (9.3%) |
Health Insurance Coverage by Household Income in Le Claire
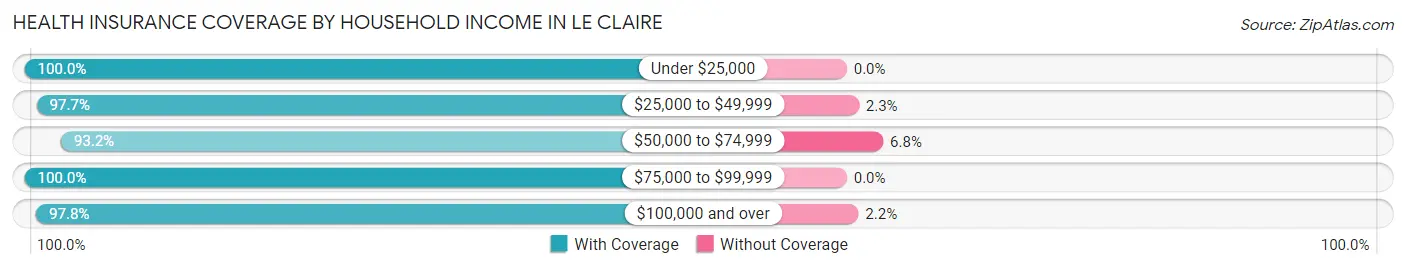
| Household Income | With Coverage | Without Coverage |
| Under $25,000 | 234 (100.0%) | 0 (0.0%) |
| $25,000 to $49,999 | 1,080 (97.7%) | 25 (2.3%) |
| $50,000 to $74,999 | 479 (93.2%) | 35 (6.8%) |
| $75,000 to $99,999 | 596 (100.0%) | 0 (0.0%) |
| $100,000 and over | 2,165 (97.8%) | 48 (2.2%) |
Public vs Private Health Insurance Coverage by Age in Le Claire
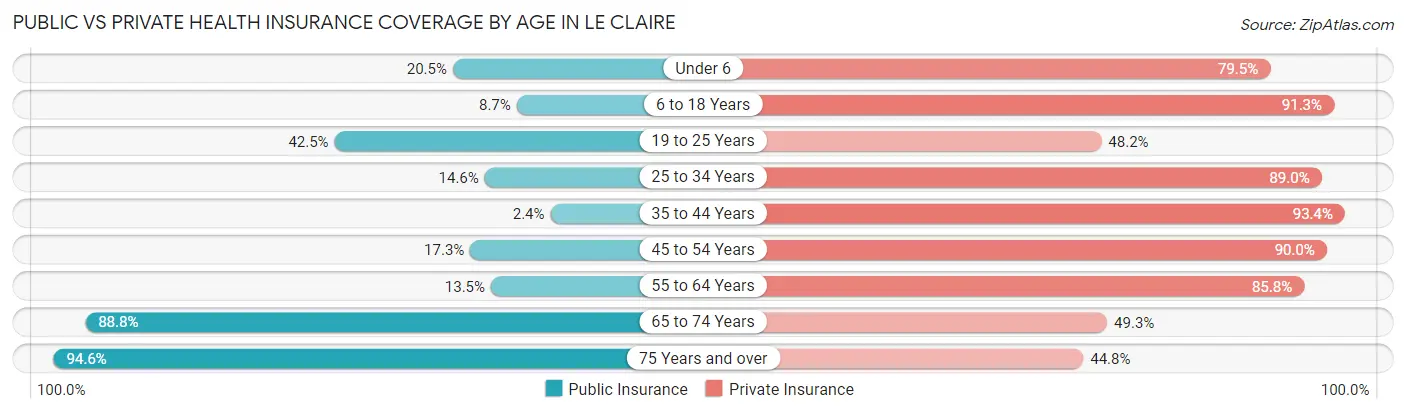
| Age Bracket | Public Insurance | Private Insurance |
| Under 6 | 119 (20.5%) | 461 (79.5%) |
| 6 to 18 Years | 101 (8.7%) | 1,064 (91.3%) |
| 19 to 25 Years | 82 (42.5%) | 93 (48.2%) |
| 25 to 34 Years | 56 (14.6%) | 341 (89.0%) |
| 35 to 44 Years | 16 (2.4%) | 619 (93.4%) |
| 45 to 54 Years | 64 (17.3%) | 333 (90.0%) |
| 55 to 64 Years | 87 (13.5%) | 555 (85.8%) |
| 65 to 74 Years | 355 (88.7%) | 197 (49.2%) |
| 75 Years and over | 247 (94.6%) | 117 (44.8%) |
| Total | 1,127 (24.2%) | 3,780 (81.1%) |
Disability Status by Sex by Age in Le Claire
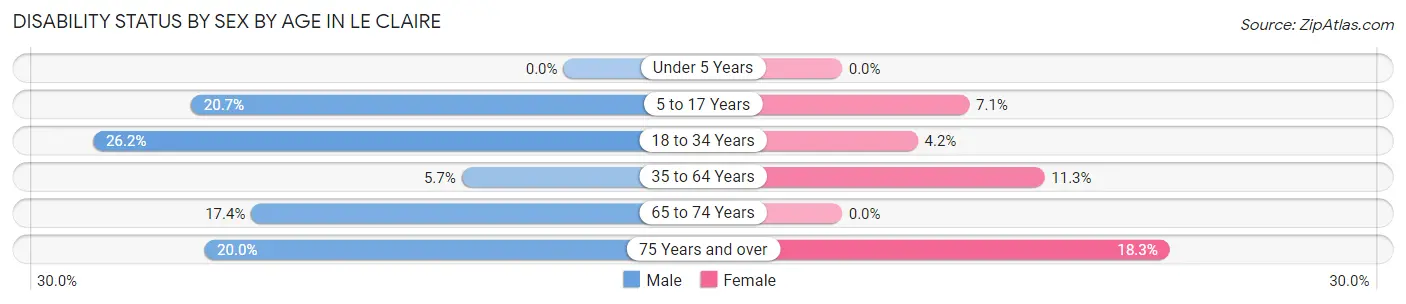
| Age Bracket | Male | Female |
| Under 5 Years | 0 (0.0%) | 0 (0.0%) |
| 5 to 17 Years | 145 (20.7%) | 47 (7.1%) |
| 18 to 34 Years | 55 (26.2%) | 17 (4.2%) |
| 35 to 64 Years | 44 (5.7%) | 102 (11.3%) |
| 65 to 74 Years | 49 (17.4%) | 0 (0.0%) |
| 75 Years and over | 27 (20.0%) | 23 (18.2%) |
Disability Class by Sex by Age in Le Claire
Disability Class: Hearing Difficulty
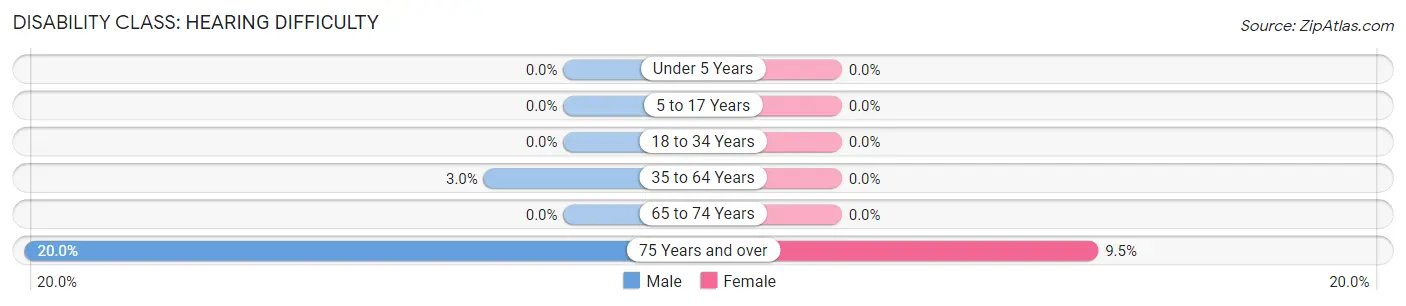
| Age Bracket | Male | Female |
| Under 5 Years | 0 (0.0%) | 0 (0.0%) |
| 5 to 17 Years | 0 (0.0%) | 0 (0.0%) |
| 18 to 34 Years | 0 (0.0%) | 0 (0.0%) |
| 35 to 64 Years | 23 (3.0%) | 0 (0.0%) |
| 65 to 74 Years | 0 (0.0%) | 0 (0.0%) |
| 75 Years and over | 27 (20.0%) | 12 (9.5%) |
Disability Class: Vision Difficulty
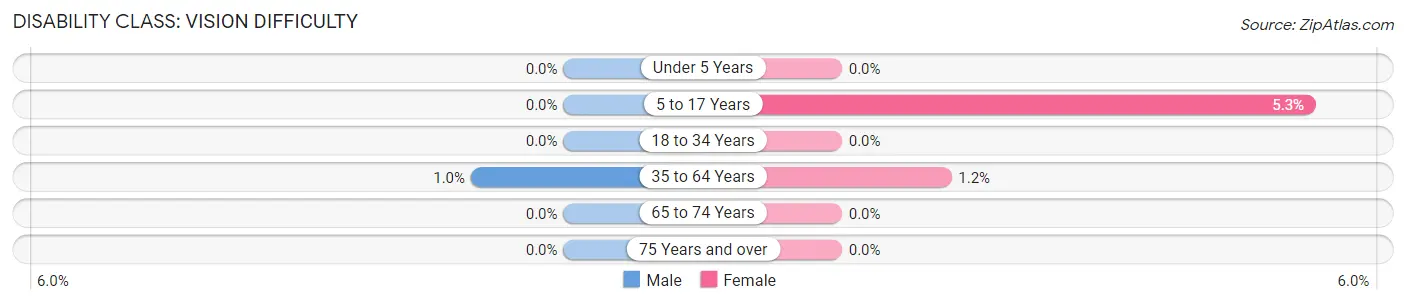
| Age Bracket | Male | Female |
| Under 5 Years | 0 (0.0%) | 0 (0.0%) |
| 5 to 17 Years | 0 (0.0%) | 35 (5.3%) |
| 18 to 34 Years | 0 (0.0%) | 0 (0.0%) |
| 35 to 64 Years | 8 (1.0%) | 11 (1.2%) |
| 65 to 74 Years | 0 (0.0%) | 0 (0.0%) |
| 75 Years and over | 0 (0.0%) | 0 (0.0%) |
Disability Class: Cognitive Difficulty
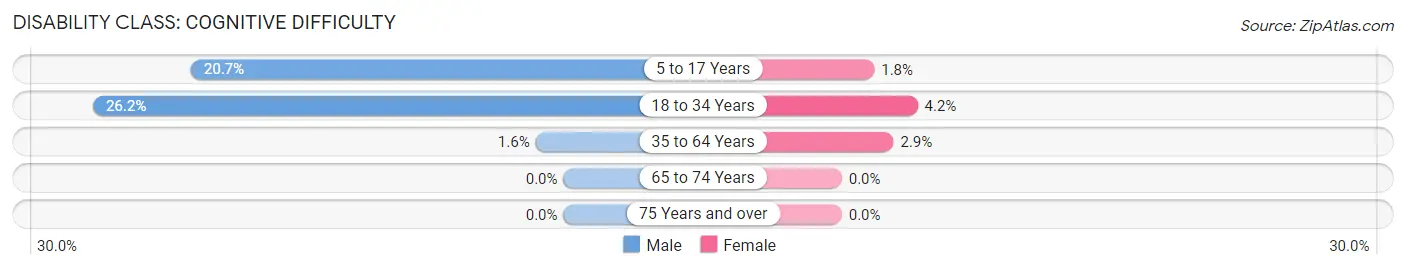
| Age Bracket | Male | Female |
| 5 to 17 Years | 145 (20.7%) | 12 (1.8%) |
| 18 to 34 Years | 55 (26.2%) | 17 (4.2%) |
| 35 to 64 Years | 12 (1.5%) | 26 (2.9%) |
| 65 to 74 Years | 0 (0.0%) | 0 (0.0%) |
| 75 Years and over | 0 (0.0%) | 0 (0.0%) |
Disability Class: Ambulatory Difficulty
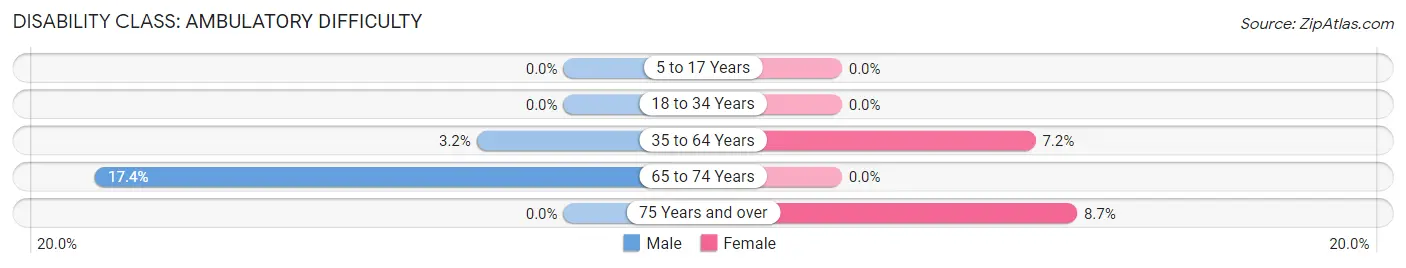
| Age Bracket | Male | Female |
| 5 to 17 Years | 0 (0.0%) | 0 (0.0%) |
| 18 to 34 Years | 0 (0.0%) | 0 (0.0%) |
| 35 to 64 Years | 25 (3.2%) | 65 (7.2%) |
| 65 to 74 Years | 49 (17.4%) | 0 (0.0%) |
| 75 Years and over | 0 (0.0%) | 11 (8.7%) |
Disability Class: Self-Care Difficulty
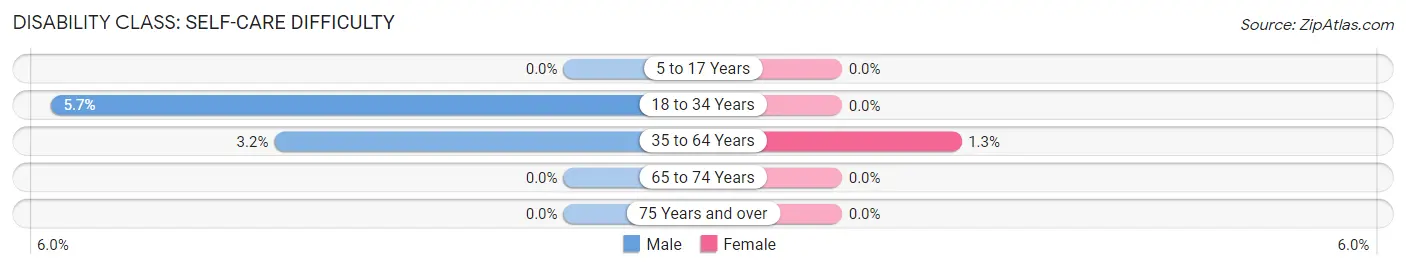
| Age Bracket | Male | Female |
| 5 to 17 Years | 0 (0.0%) | 0 (0.0%) |
| 18 to 34 Years | 12 (5.7%) | 0 (0.0%) |
| 35 to 64 Years | 25 (3.2%) | 12 (1.3%) |
| 65 to 74 Years | 0 (0.0%) | 0 (0.0%) |
| 75 Years and over | 0 (0.0%) | 0 (0.0%) |
Technology Access in Le Claire
Computing Device Access in Le Claire
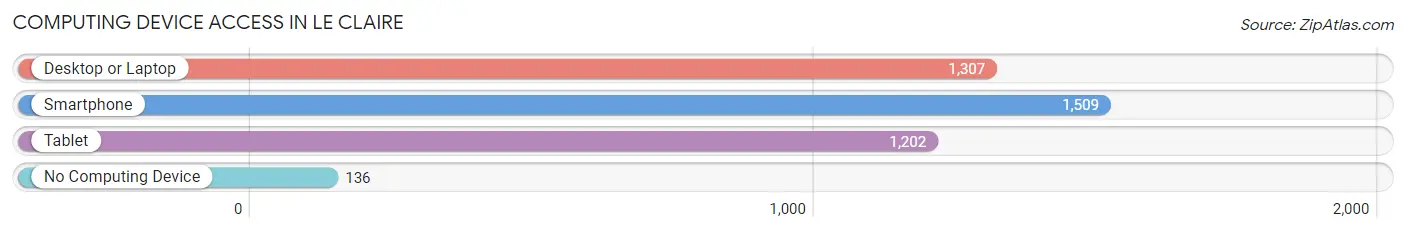
| Device Type | # Households | % Households |
| Desktop or Laptop | 1,307 | 76.7% |
| Smartphone | 1,509 | 88.6% |
| Tablet | 1,202 | 70.6% |
| No Computing Device | 136 | 8.0% |
| Total | 1,703 | 100.0% |
Internet Access in Le Claire
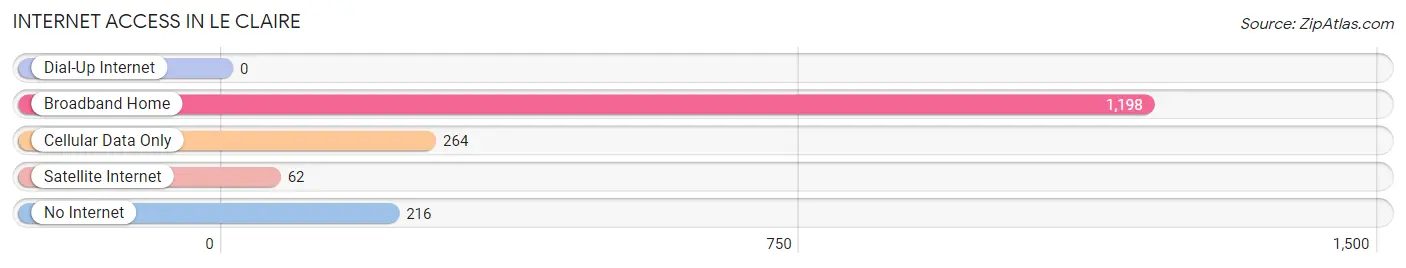
| Internet Type | # Households | % Households |
| Dial-Up Internet | 0 | 0.0% |
| Broadband Home | 1,198 | 70.4% |
| Cellular Data Only | 264 | 15.5% |
| Satellite Internet | 62 | 3.6% |
| No Internet | 216 | 12.7% |
| Total | 1,703 | 100.0% |
Le Claire Summary
Claire, Iowa is a small city located in Scott County, Iowa, United States. It is situated on the banks of the Mississippi River, just south of the Quad Cities. The city has a population of 4,321 as of the 2010 census.
History
Claire was founded in 1836 by a group of settlers from the nearby town of Davenport. The settlers named the town after their leader, John Claire. The town was originally a trading post and ferry landing, and it quickly grew into a bustling river port. In 1845, the first steamboat arrived in Claire, and the town soon became a major hub for river traffic.
In 1853, the first railroad line was built through Claire, connecting it to the rest of the Midwest. This allowed the town to become a major shipping center for the region. The railroad also brought new industry to the area, including a flour mill, a sawmill, and a brickyard.
In the late 19th century, Claire became a popular tourist destination. The town was home to several resorts, including the Hotel Claire, which was built in 1891. The hotel was a popular destination for wealthy visitors from the Midwest and beyond.
Geography
Claire is located in the northwest corner of Scott County, Iowa, on the banks of the Mississippi River. The city is situated at an elevation of 645 feet (197 m) above sea level. The city has a total area of 4.2 square miles (10.8 km2), all of which is land.
The climate in Claire is humid continental, with hot summers and cold winters. The average annual temperature is 48.2 °F (9.0 °C), and the average annual precipitation is 36.2 inches (919 mm).
Economy
Claire’s economy is largely based on tourism and manufacturing. The city is home to several tourist attractions, including the Hotel Claire, the Mississippi River Museum, and the National Mississippi River Museum and Aquarium.
The city is also home to several manufacturing companies, including a paper mill, a printing company, and a plastics manufacturer. The city is also home to several retail stores, restaurants, and other businesses.
Demographics
As of the 2010 census, the population of Claire was 4,321. The racial makeup of the city was 95.2% White, 1.2% African American, 0.3% Native American, 0.7% Asian, 0.1% Pacific Islander, 0.7% from other races, and 1.8% from two or more races. Hispanic or Latino of any race were 2.2% of the population.
The median income for a household in Claire was $41,944, and the median income for a family was $50,917. The per capita income for the city was $20,945. About 8.2% of families and 10.3% of the population were below the poverty line, including 14.2% of those under age 18 and 6.2% of those age 65 or over.
Common Questions
What is Per Capita Income in Le Claire?
Per Capita income in Le Claire is $44,081.
What is the Median Family Income in Le Claire?
Median Family Income in Le Claire is $106,667.
What is the Median Household income in Le Claire?
Median Household Income in Le Claire is $95,206.
What is Income or Wage Gap in Le Claire?
Income or Wage Gap in Le Claire is 50.0%.
Women in Le Claire earn 50.0 cents for every dollar earned by a man.
What is Inequality or Gini Index in Le Claire?
Inequality or Gini Index in Le Claire is 0.47.
What is the Total Population of Le Claire?
Total Population of Le Claire is 4,679.
What is the Total Male Population of Le Claire?
Total Male Population of Le Claire is 2,272.
What is the Total Female Population of Le Claire?
Total Female Population of Le Claire is 2,407.
What is the Ratio of Males per 100 Females in Le Claire?
There are 94.39 Males per 100 Females in Le Claire.
What is the Ratio of Females per 100 Males in Le Claire?
There are 105.94 Females per 100 Males in Le Claire.
What is the Median Population Age in Le Claire?
Median Population Age in Le Claire is 35.4 Years.
What is the Average Family Size in Le Claire
Average Family Size in Le Claire is 3.0 People.
What is the Average Household Size in Le Claire
Average Household Size in Le Claire is 2.8 People.
How Large is the Labor Force in Le Claire?
There are 1,949 People in the Labor Forcein in Le Claire.
What is the Percentage of People in the Labor Force in Le Claire?
63.1% of People are in the Labor Force in Le Claire.
What is the Unemployment Rate in Le Claire?
Unemployment Rate in Le Claire is 0.7%.