La Porte City, IA Map & Demographics
La Porte City Map
La Porte City Overview
$30,627
PER CAPITA INCOME
$90,833
AVG FAMILY INCOME
$65,451
AVG HOUSEHOLD INCOME
23.4%
WAGE / INCOME GAP [ % ]
76.6¢/ $1
WAGE / INCOME GAP [ $ ]
0.41
INEQUALITY / GINI INDEX
2,347
TOTAL POPULATION
1,195
MALE POPULATION
1,152
FEMALE POPULATION
103.73
MALES / 100 FEMALES
96.40
FEMALES / 100 MALES
32.6
MEDIAN AGE
3.3
AVG FAMILY SIZE
2.6
AVG HOUSEHOLD SIZE
1,159
LABOR FORCE [ PEOPLE ]
69.3%
PERCENT IN LABOR FORCE
1.8%
UNEMPLOYMENT RATE
La Porte City Zip Codes
La Porte City Area Codes
Income in La Porte City
Income Overview in La Porte City
Per Capita Income in La Porte City is $30,627, while median incomes of families and households are $90,833 and $65,451 respectively.
| Characteristic | Number | Measure |
| Per Capita Income | 2,347 | $30,627 |
| Median Family Income | 562 | $90,833 |
| Mean Family Income | 562 | $92,348 |
| Median Household Income | 899 | $65,451 |
| Mean Household Income | 899 | $78,775 |
| Income Deficit | 562 | $0 |
| Wage / Income Gap (%) | 2,347 | 23.44% |
| Wage / Income Gap ($) | 2,347 | 76.56¢ per $1 |
| Gini / Inequality Index | 2,347 | 0.41 |
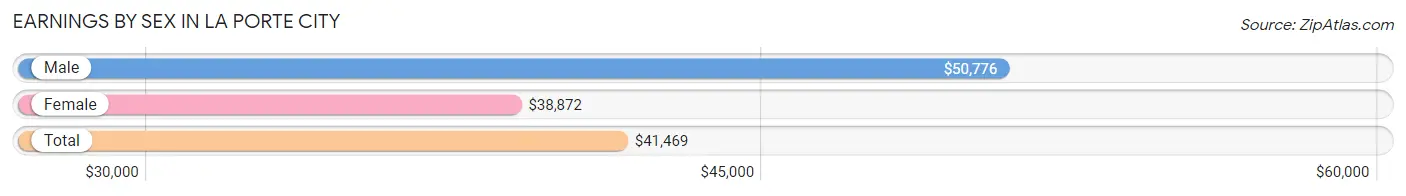
Earnings by Sex in La Porte City
Average Earnings in La Porte City are $41,469, $50,776 for men and $38,872 for women, a difference of 23.4%.
| Sex | Number | Average Earnings |
| Male | 618 (52.9%) | $50,776 |
| Female | 551 (47.1%) | $38,872 |
| Total | 1,169 (100.0%) | $41,469 |
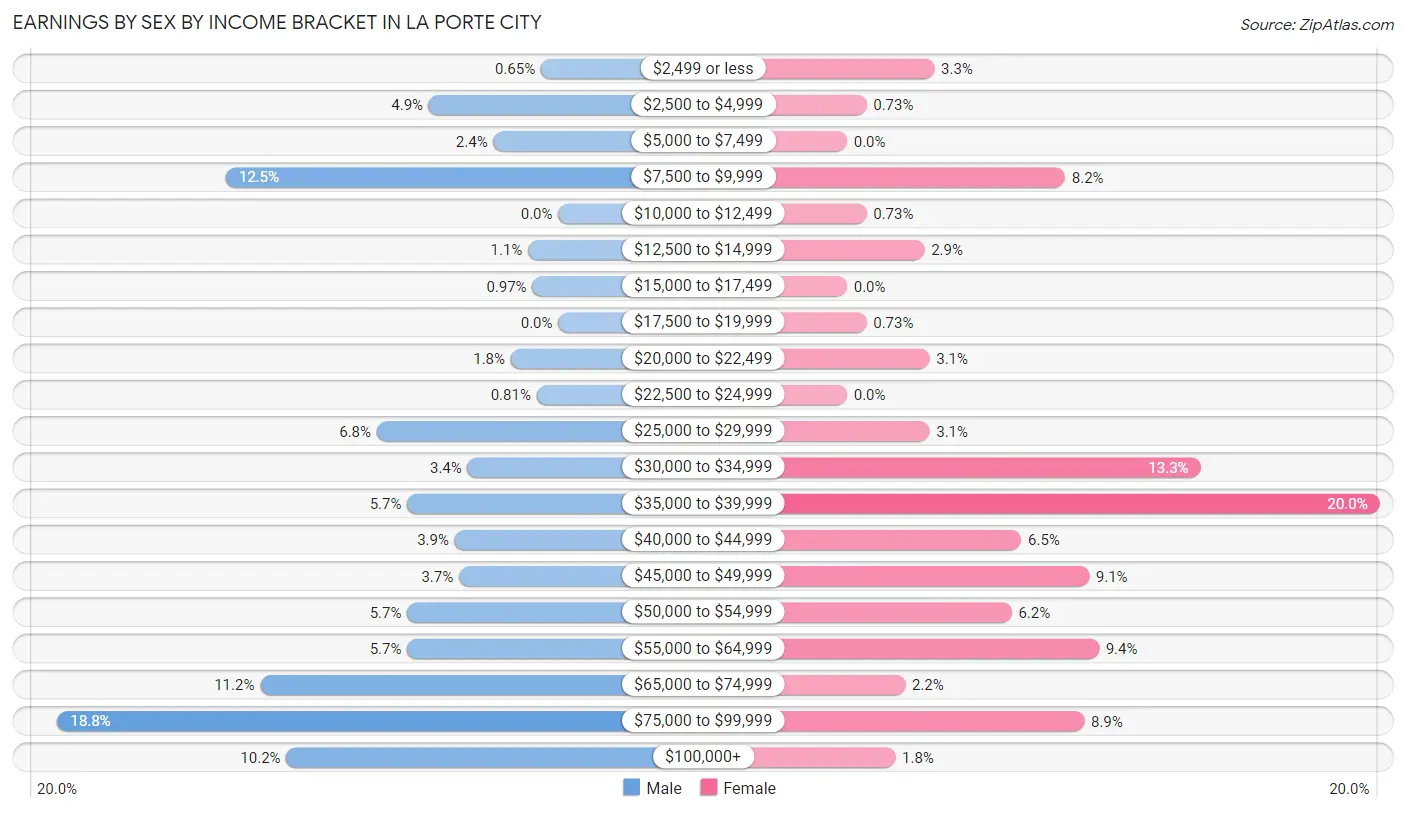
Earnings by Sex by Income Bracket in La Porte City
The most common earnings brackets in La Porte City are $75,000 to $99,999 for men (116 | 18.8%) and $35,000 to $39,999 for women (110 | 20.0%).
| Income | Male | Female |
| $2,499 or less | 4 (0.6%) | 18 (3.3%) |
| $2,500 to $4,999 | 30 (4.9%) | 4 (0.7%) |
| $5,000 to $7,499 | 15 (2.4%) | 0 (0.0%) |
| $7,500 to $9,999 | 77 (12.5%) | 45 (8.2%) |
| $10,000 to $12,499 | 0 (0.0%) | 4 (0.7%) |
| $12,500 to $14,999 | 7 (1.1%) | 16 (2.9%) |
| $15,000 to $17,499 | 6 (1.0%) | 0 (0.0%) |
| $17,500 to $19,999 | 0 (0.0%) | 4 (0.7%) |
| $20,000 to $22,499 | 11 (1.8%) | 17 (3.1%) |
| $22,500 to $24,999 | 5 (0.8%) | 0 (0.0%) |
| $25,000 to $29,999 | 42 (6.8%) | 17 (3.1%) |
| $30,000 to $34,999 | 21 (3.4%) | 73 (13.3%) |
| $35,000 to $39,999 | 35 (5.7%) | 110 (20.0%) |
| $40,000 to $44,999 | 24 (3.9%) | 36 (6.5%) |
| $45,000 to $49,999 | 23 (3.7%) | 50 (9.1%) |
| $50,000 to $54,999 | 35 (5.7%) | 34 (6.2%) |
| $55,000 to $64,999 | 35 (5.7%) | 52 (9.4%) |
| $65,000 to $74,999 | 69 (11.2%) | 12 (2.2%) |
| $75,000 to $99,999 | 116 (18.8%) | 49 (8.9%) |
| $100,000+ | 63 (10.2%) | 10 (1.8%) |
| Total | 618 (100.0%) | 551 (100.0%) |
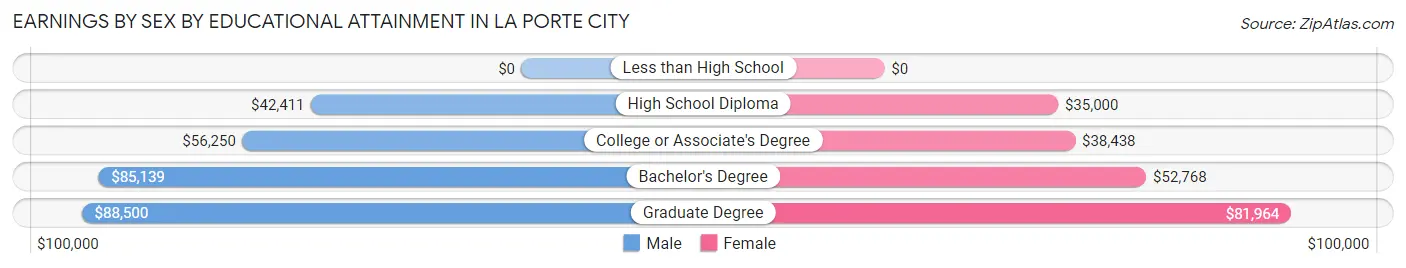
Earnings by Sex by Educational Attainment in La Porte City
Average earnings in La Porte City are $56,607 for men and $39,167 for women, a difference of 30.8%. Men with an educational attainment of graduate degree enjoy the highest average annual earnings of $88,500, while those with high school diploma education earn the least with $42,411. Women with an educational attainment of graduate degree earn the most with the average annual earnings of $81,964, while those with high school diploma education have the smallest earnings of $35,000.
| Educational Attainment | Male Income | Female Income |
| Less than High School | - | - |
| High School Diploma | $42,411 | $35,000 |
| College or Associate's Degree | $56,250 | $38,438 |
| Bachelor's Degree | $85,139 | $52,768 |
| Graduate Degree | $88,500 | $81,964 |
| Total | $56,607 | $39,167 |
Family Income in La Porte City
Family Income Brackets in La Porte City
According to the La Porte City family income data, there are 137 families falling into the $100,000 to $149,999 income range, which is the most common income bracket and makes up 24.4% of all families.

| Income Bracket | # Families | % Families |
| Less than $10,000 | 28 | 5.0% |
| $10,000 to $14,999 | 0 | 0.0% |
| $15,000 to $24,999 | 24 | 4.3% |
| $25,000 to $34,999 | 85 | 15.1% |
| $35,000 to $49,999 | 50 | 8.9% |
| $50,000 to $74,999 | 65 | 11.6% |
| $75,000 to $99,999 | 67 | 11.9% |
| $100,000 to $149,999 | 137 | 24.4% |
| $150,000 to $199,999 | 87 | 15.5% |
| $200,000+ | 19 | 3.4% |
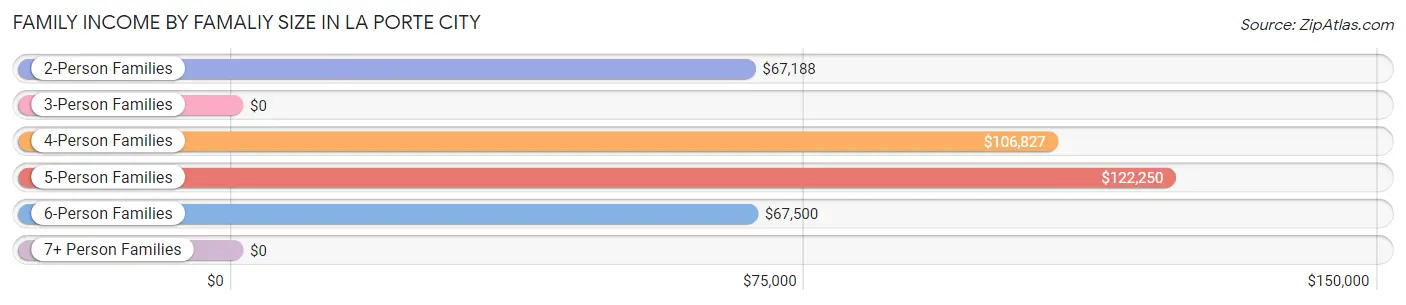
Family Income by Famaliy Size in La Porte City
5-person families (71 | 12.6%) account for the highest median family income in La Porte City with $122,250 per family, while 2-person families (257 | 45.7%) have the highest median income of $33,594 per family member.
| Income Bracket | # Families | Median Income |
| 2-Person Families | 257 (45.7%) | $67,188 |
| 3-Person Families | 112 (19.9%) | $0 |
| 4-Person Families | 81 (14.4%) | $106,827 |
| 5-Person Families | 71 (12.6%) | $122,250 |
| 6-Person Families | 24 (4.3%) | $67,500 |
| 7+ Person Families | 17 (3.0%) | $0 |
| Total | 562 (100.0%) | $90,833 |
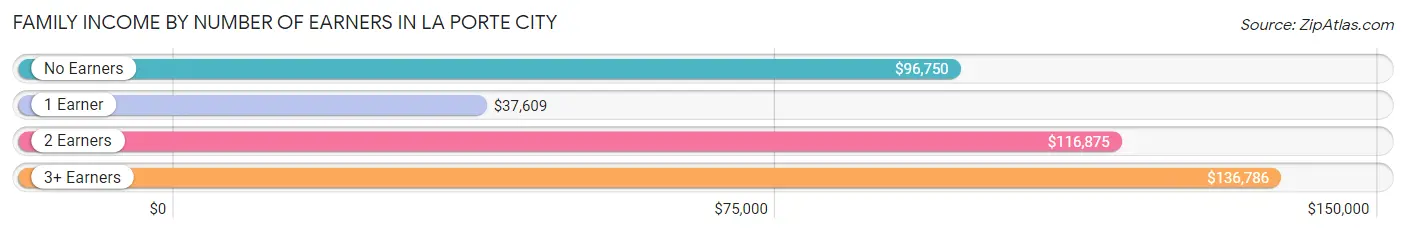
Family Income by Number of Earners in La Porte City
The median family income in La Porte City is $90,833, with families comprising 3+ earners (32) having the highest median family income of $136,786, while families with 1 earner (266) have the lowest median family income of $37,609, accounting for 5.7% and 47.3% of families, respectively.
| Number of Earners | # Families | Median Income |
| No Earners | 39 (6.9%) | $96,750 |
| 1 Earner | 266 (47.3%) | $37,609 |
| 2 Earners | 225 (40.0%) | $116,875 |
| 3+ Earners | 32 (5.7%) | $136,786 |
| Total | 562 (100.0%) | $90,833 |
Household Income in La Porte City
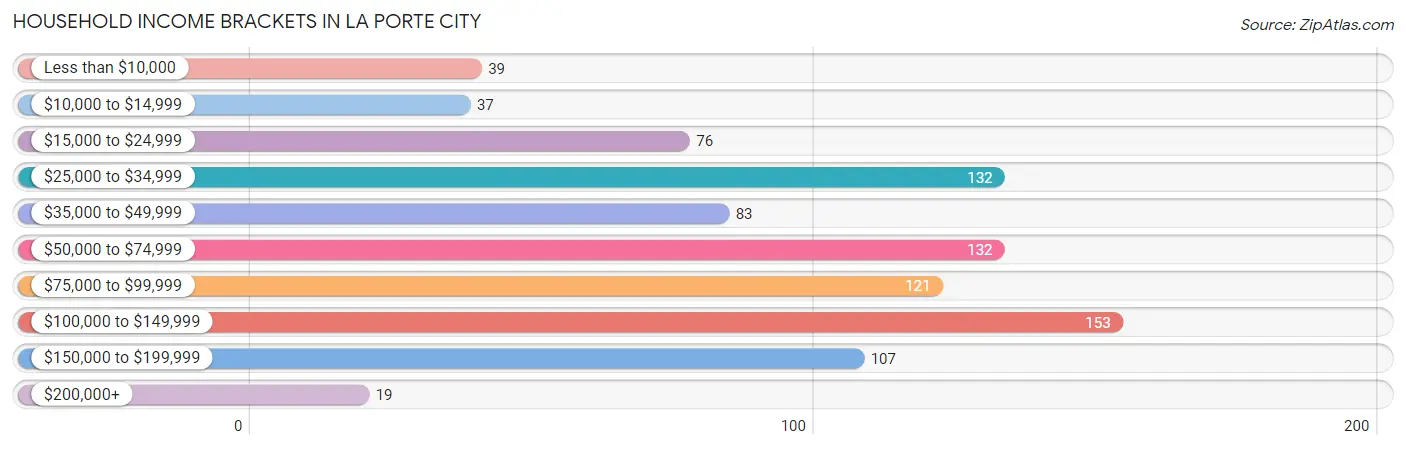
Household Income Brackets in La Porte City
With 153 households falling in the category, the $100,000 to $149,999 income range is the most frequent in La Porte City, accounting for 17.0% of all households. In contrast, only 19 households (2.1%) fall into the $200,000+ income bracket, making it the least populous group.
| Income Bracket | # Households | % Households |
| Less than $10,000 | 39 | 4.3% |
| $10,000 to $14,999 | 37 | 4.1% |
| $15,000 to $24,999 | 76 | 8.5% |
| $25,000 to $34,999 | 132 | 14.7% |
| $35,000 to $49,999 | 83 | 9.2% |
| $50,000 to $74,999 | 132 | 14.7% |
| $75,000 to $99,999 | 121 | 13.5% |
| $100,000 to $149,999 | 153 | 17.0% |
| $150,000 to $199,999 | 107 | 11.9% |
| $200,000+ | 19 | 2.1% |
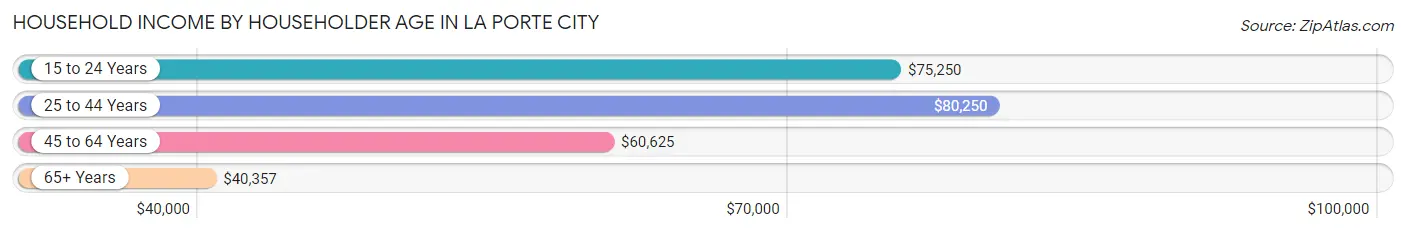
Household Income by Householder Age in La Porte City
The median household income in La Porte City is $65,451, with the highest median household income of $80,250 found in the 25 to 44 years age bracket for the primary householder. A total of 355 households (39.5%) fall into this category. Meanwhile, the 65+ years age bracket for the primary householder has the lowest median household income of $40,357, with 202 households (22.5%) in this group.
| Income Bracket | # Households | Median Income |
| 15 to 24 Years | 48 (5.3%) | $75,250 |
| 25 to 44 Years | 355 (39.5%) | $80,250 |
| 45 to 64 Years | 294 (32.7%) | $60,625 |
| 65+ Years | 202 (22.5%) | $40,357 |
| Total | 899 (100.0%) | $65,451 |
Poverty in La Porte City
Income Below Poverty by Sex and Age in La Porte City
With 12.8% poverty level for males and 8.8% for females among the residents of La Porte City, 18 to 24 year old males and 16 and 17 year old females are the most vulnerable to poverty, with 83 males (63.4%) and 14 females (42.4%) in their respective age groups living below the poverty level.
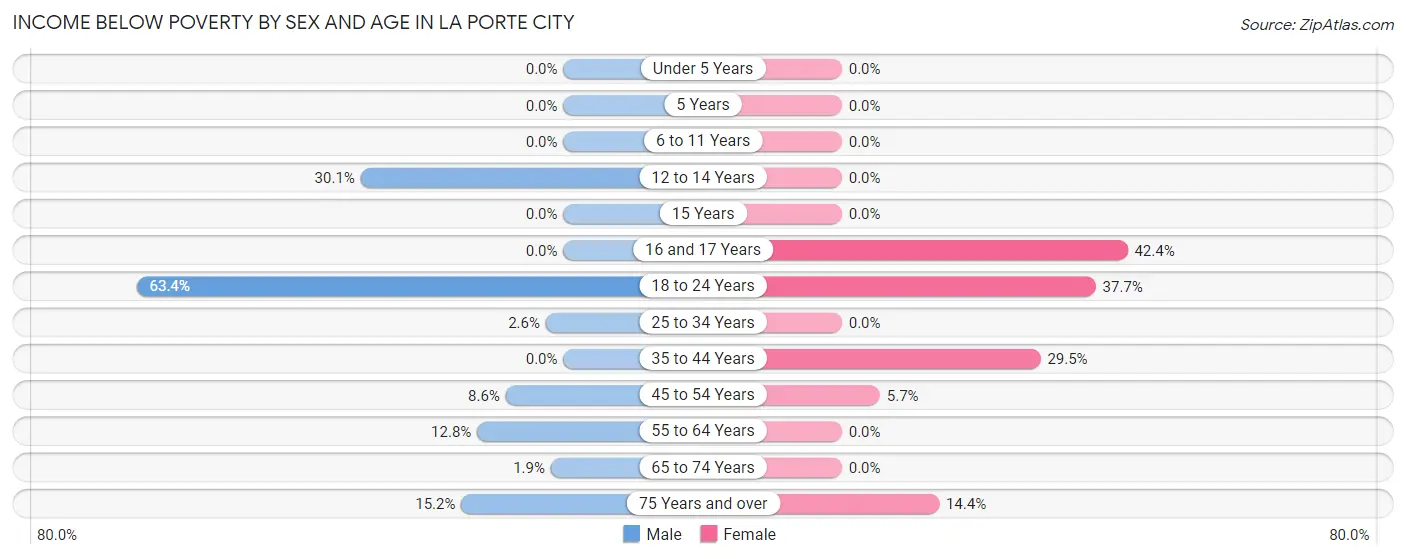
| Age Bracket | Male | Female |
| Under 5 Years | 0 (0.0%) | 0 (0.0%) |
| 5 Years | 0 (0.0%) | 0 (0.0%) |
| 6 to 11 Years | 0 (0.0%) | 0 (0.0%) |
| 12 to 14 Years | 31 (30.1%) | 0 (0.0%) |
| 15 Years | 0 (0.0%) | 0 (0.0%) |
| 16 and 17 Years | 0 (0.0%) | 14 (42.4%) |
| 18 to 24 Years | 83 (63.4%) | 23 (37.7%) |
| 25 to 34 Years | 4 (2.6%) | 0 (0.0%) |
| 35 to 44 Years | 0 (0.0%) | 41 (29.5%) |
| 45 to 54 Years | 9 (8.6%) | 7 (5.7%) |
| 55 to 64 Years | 16 (12.8%) | 0 (0.0%) |
| 65 to 74 Years | 2 (1.9%) | 0 (0.0%) |
| 75 Years and over | 5 (15.1%) | 14 (14.4%) |
| Total | 150 (12.8%) | 99 (8.8%) |
Income Above Poverty by Sex and Age in La Porte City
According to the poverty statistics in La Porte City, males aged under 5 years and females aged under 5 years are the age groups that are most secure financially, with 100.0% of males and 100.0% of females in these age groups living above the poverty line.
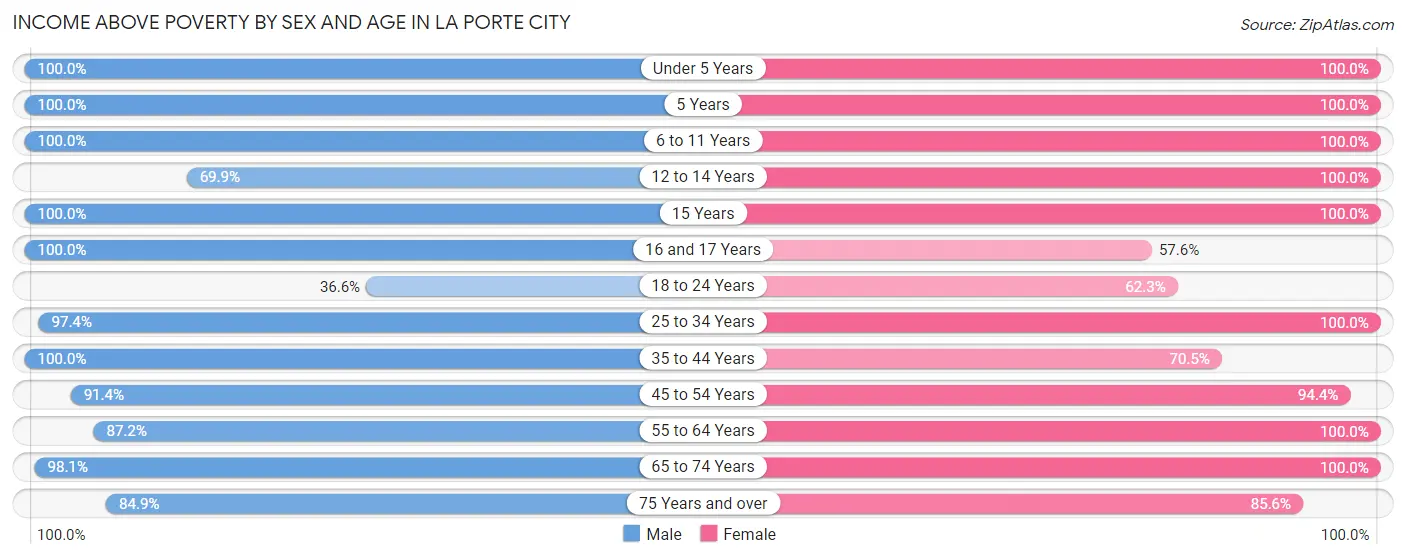
| Age Bracket | Male | Female |
| Under 5 Years | 70 (100.0%) | 59 (100.0%) |
| 5 Years | 33 (100.0%) | 22 (100.0%) |
| 6 to 11 Years | 167 (100.0%) | 70 (100.0%) |
| 12 to 14 Years | 72 (69.9%) | 96 (100.0%) |
| 15 Years | 6 (100.0%) | 45 (100.0%) |
| 16 and 17 Years | 15 (100.0%) | 19 (57.6%) |
| 18 to 24 Years | 48 (36.6%) | 38 (62.3%) |
| 25 to 34 Years | 149 (97.4%) | 195 (100.0%) |
| 35 to 44 Years | 125 (100.0%) | 98 (70.5%) |
| 45 to 54 Years | 96 (91.4%) | 117 (94.4%) |
| 55 to 64 Years | 109 (87.2%) | 102 (100.0%) |
| 65 to 74 Years | 105 (98.1%) | 83 (100.0%) |
| 75 Years and over | 28 (84.9%) | 83 (85.6%) |
| Total | 1,023 (87.2%) | 1,027 (91.2%) |
Income Below Poverty Among Married-Couple Families in La Porte City
The poverty statistics for married-couple families in La Porte City show that 3.3% or 13 of the total 395 families live below the poverty line. Families with 1 or 2 children have the highest poverty rate of 14.3%, comprising of 13 families. On the other hand, families with no children have the lowest poverty rate of 0.0%, which includes 0 families.
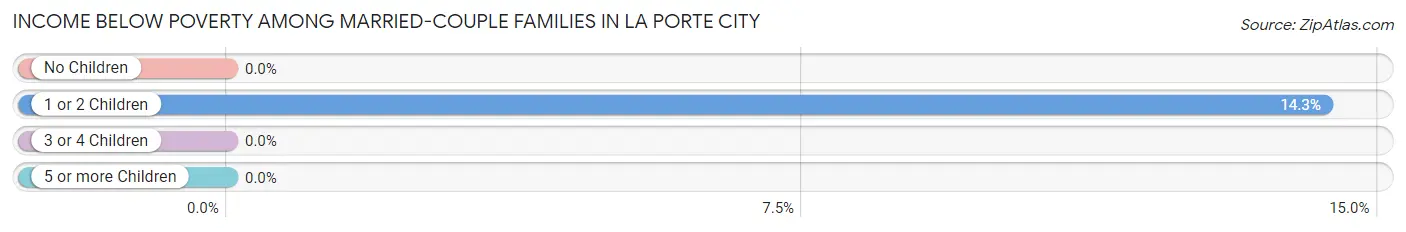
| Children | Above Poverty | Below Poverty |
| No Children | 224 (100.0%) | 0 (0.0%) |
| 1 or 2 Children | 78 (85.7%) | 13 (14.3%) |
| 3 or 4 Children | 63 (100.0%) | 0 (0.0%) |
| 5 or more Children | 17 (100.0%) | 0 (0.0%) |
| Total | 382 (96.7%) | 13 (3.3%) |
Income Below Poverty Among Single-Parent Households in La Porte City
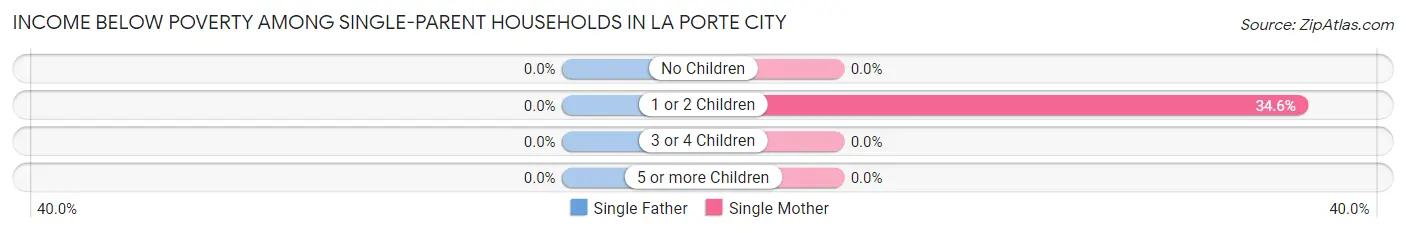
| Children | Single Father | Single Mother |
| No Children | 0 (0.0%) | 0 (0.0%) |
| 1 or 2 Children | 0 (0.0%) | 28 (34.6%) |
| 3 or 4 Children | 0 (0.0%) | 0 (0.0%) |
| 5 or more Children | 0 (0.0%) | 0 (0.0%) |
| Total | 0 (0.0%) | 28 (19.9%) |
Income Below Poverty Among Married-Couple vs Single-Parent Households in La Porte City
The poverty data for La Porte City shows that 13 of the married-couple family households (3.3%) and 28 of the single-parent households (16.8%) are living below the poverty level. Within the married-couple family households, those with 1 or 2 children have the highest poverty rate, with 13 households (14.3%) falling below the poverty line. Among the single-parent households, those with 1 or 2 children have the highest poverty rate, with 28 household (27.5%) living below poverty.
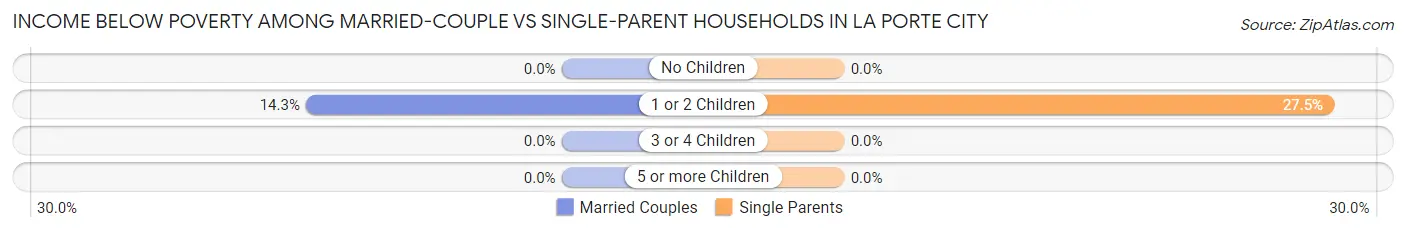
| Children | Married-Couple Families | Single-Parent Households |
| No Children | 0 (0.0%) | 0 (0.0%) |
| 1 or 2 Children | 13 (14.3%) | 28 (27.5%) |
| 3 or 4 Children | 0 (0.0%) | 0 (0.0%) |
| 5 or more Children | 0 (0.0%) | 0 (0.0%) |
| Total | 13 (3.3%) | 28 (16.8%) |
Race in La Porte City
The most populous races in La Porte City are White / Caucasian (2,180 | 92.9%), Some other Race (79 | 3.4%), and Two or more Races (66 | 2.8%).
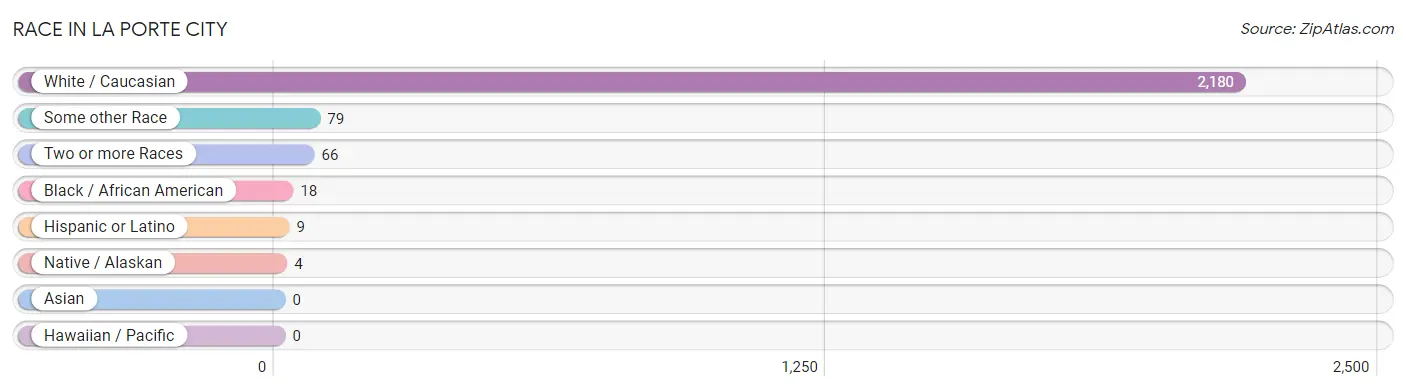
| Race | # Population | % Population |
| Asian | 0 | 0.0% |
| Black / African American | 18 | 0.8% |
| Hawaiian / Pacific | 0 | 0.0% |
| Hispanic or Latino | 9 | 0.4% |
| Native / Alaskan | 4 | 0.2% |
| White / Caucasian | 2,180 | 92.9% |
| Two or more Races | 66 | 2.8% |
| Some other Race | 79 | 3.4% |
| Total | 2,347 | 100.0% |
Ancestry in La Porte City
The most populous ancestries reported in La Porte City are German (1,006 | 42.9%), Irish (450 | 19.2%), English (126 | 5.4%), Norwegian (103 | 4.4%), and American (102 | 4.3%), together accounting for 76.1% of all La Porte City residents.
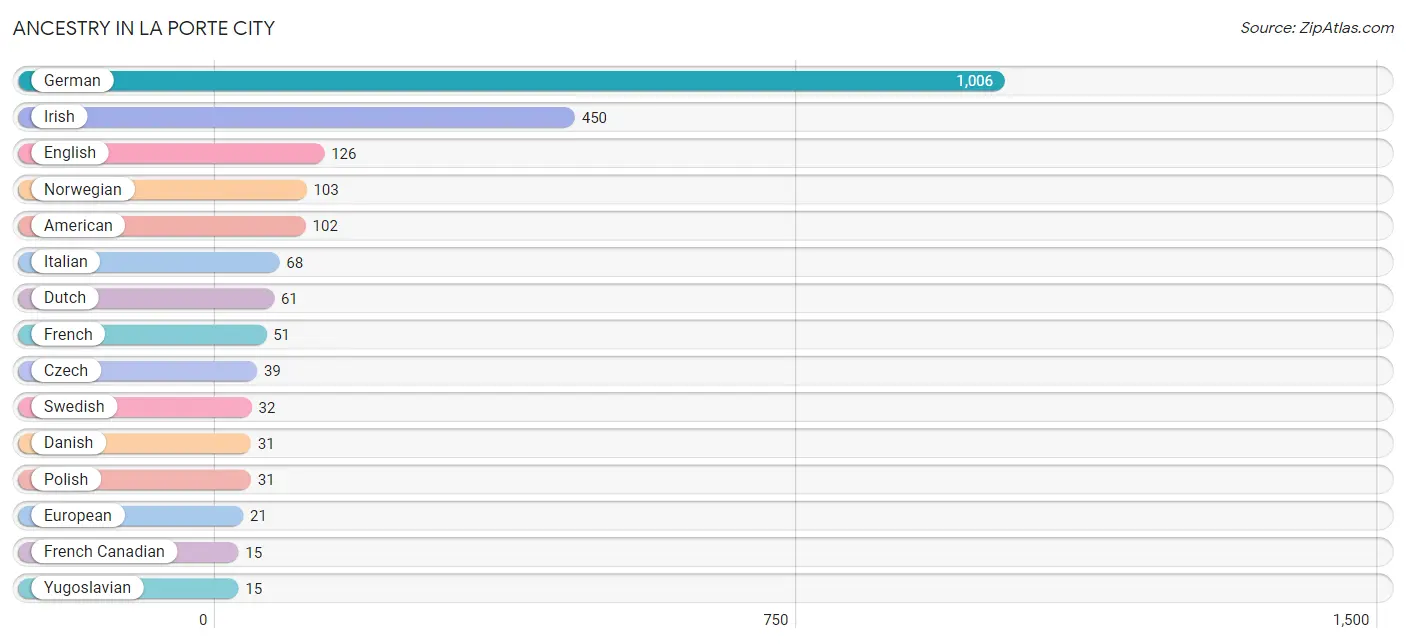
| Ancestry | # Population | % Population |
| American | 102 | 4.3% |
| Austrian | 3 | 0.1% |
| Bulgarian | 5 | 0.2% |
| Czech | 39 | 1.7% |
| Danish | 31 | 1.3% |
| Dutch | 61 | 2.6% |
| English | 126 | 5.4% |
| European | 21 | 0.9% |
| French | 51 | 2.2% |
| French Canadian | 15 | 0.6% |
| German | 1,006 | 42.9% |
| Irish | 450 | 19.2% |
| Italian | 68 | 2.9% |
| Mexican | 9 | 0.4% |
| Northern European | 6 | 0.3% |
| Norwegian | 103 | 4.4% |
| Polish | 31 | 1.3% |
| Scotch-Irish | 5 | 0.2% |
| Scottish | 13 | 0.5% |
| Slavic | 5 | 0.2% |
| Swedish | 32 | 1.4% |
| Welsh | 12 | 0.5% |
| Yugoslavian | 15 | 0.6% | View All 23 Rows |
Immigrants in La Porte City
The most numerous immigrant groups reported in La Porte City came from Bosnia and Herzegovina (15 | 0.6%), Eastern Europe (15 | 0.6%), Europe (15 | 0.6%), Canada (5 | 0.2%), and Central America (5 | 0.2%), together accounting for 2.3% of all La Porte City residents.
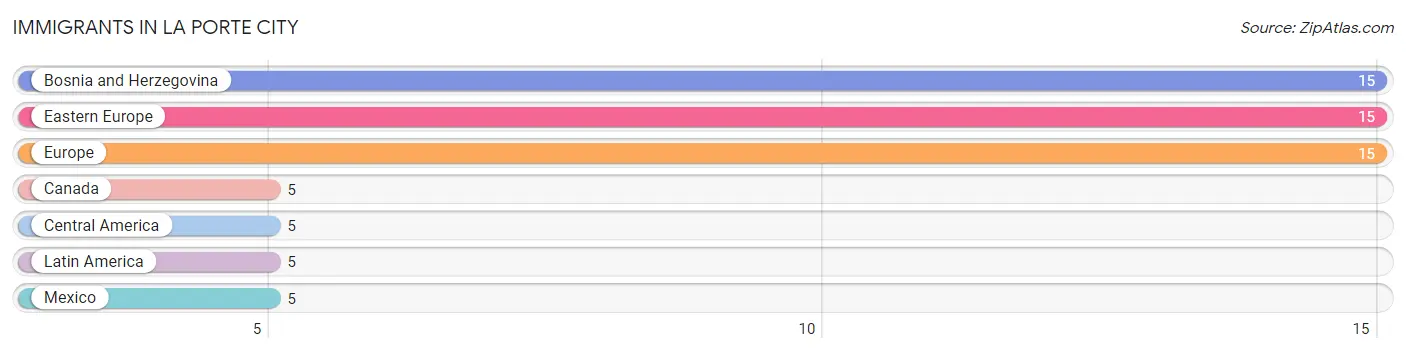
| Immigration Origin | # Population | % Population |
| Bosnia and Herzegovina | 15 | 0.6% |
| Canada | 5 | 0.2% |
| Central America | 5 | 0.2% |
| Eastern Europe | 15 | 0.6% |
| Europe | 15 | 0.6% |
| Latin America | 5 | 0.2% |
| Mexico | 5 | 0.2% | View All 7 Rows |
Sex and Age in La Porte City
Sex and Age in La Porte City
The most populous age groups in La Porte City are 10 to 14 Years (168 | 14.1%) for men and 10 to 14 Years (129 | 11.2%) for women.
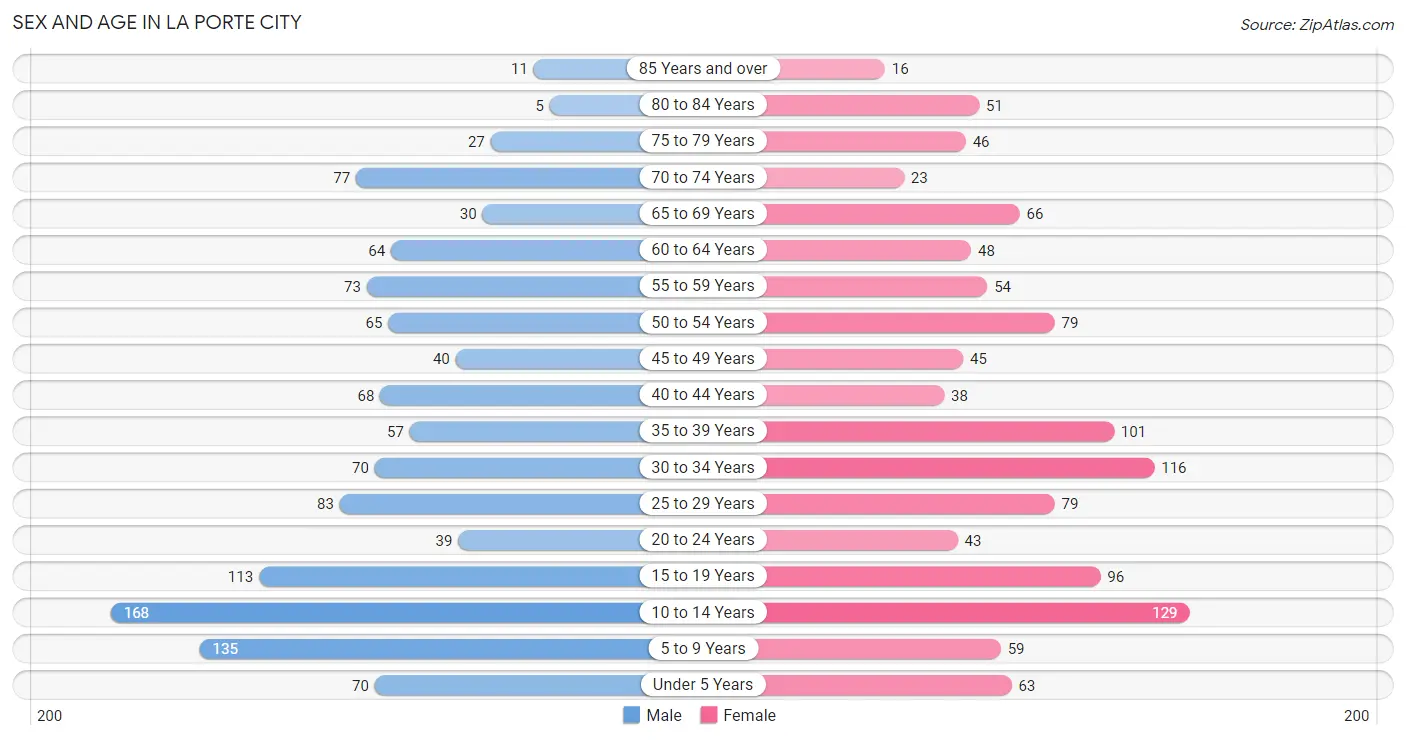
| Age Bracket | Male | Female |
| Under 5 Years | 70 (5.9%) | 63 (5.5%) |
| 5 to 9 Years | 135 (11.3%) | 59 (5.1%) |
| 10 to 14 Years | 168 (14.1%) | 129 (11.2%) |
| 15 to 19 Years | 113 (9.5%) | 96 (8.3%) |
| 20 to 24 Years | 39 (3.3%) | 43 (3.7%) |
| 25 to 29 Years | 83 (7.0%) | 79 (6.9%) |
| 30 to 34 Years | 70 (5.9%) | 116 (10.1%) |
| 35 to 39 Years | 57 (4.8%) | 101 (8.8%) |
| 40 to 44 Years | 68 (5.7%) | 38 (3.3%) |
| 45 to 49 Years | 40 (3.4%) | 45 (3.9%) |
| 50 to 54 Years | 65 (5.4%) | 79 (6.9%) |
| 55 to 59 Years | 73 (6.1%) | 54 (4.7%) |
| 60 to 64 Years | 64 (5.4%) | 48 (4.2%) |
| 65 to 69 Years | 30 (2.5%) | 66 (5.7%) |
| 70 to 74 Years | 77 (6.4%) | 23 (2.0%) |
| 75 to 79 Years | 27 (2.3%) | 46 (4.0%) |
| 80 to 84 Years | 5 (0.4%) | 51 (4.4%) |
| 85 Years and over | 11 (0.9%) | 16 (1.4%) |
| Total | 1,195 (100.0%) | 1,152 (100.0%) |
Families and Households in La Porte City
Median Family Size in La Porte City
The median family size in La Porte City is 3.29 persons per family, with single female/mother families (141 | 25.1%) accounting for the largest median family size of 3.57 persons per family. On the other hand, single male/father families (26 | 4.6%) represent the smallest median family size with 2.12 persons per family.
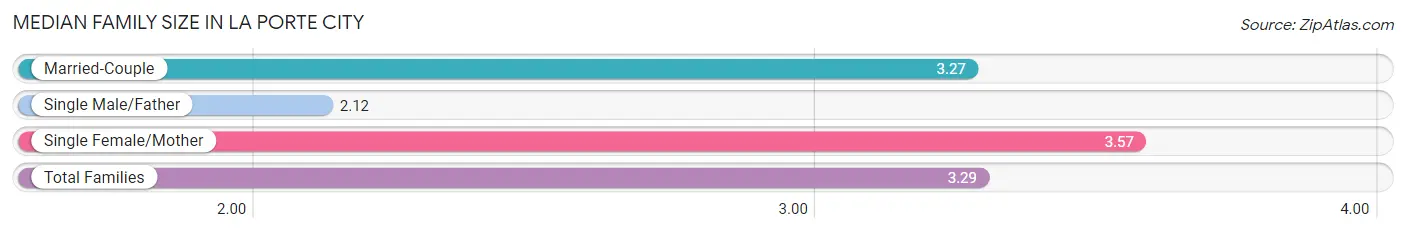
| Family Type | # Families | Family Size |
| Married-Couple | 395 (70.3%) | 3.27 |
| Single Male/Father | 26 (4.6%) | 2.12 |
| Single Female/Mother | 141 (25.1%) | 3.57 |
| Total Families | 562 (100.0%) | 3.29 |
Median Household Size in La Porte City
The median household size in La Porte City is 2.56 persons per household, with single female/mother households (141 | 15.7%) accounting for the largest median household size of 3.69 persons per household. non-family households (337 | 37.5%) represent the smallest median household size with 1.26 persons per household.
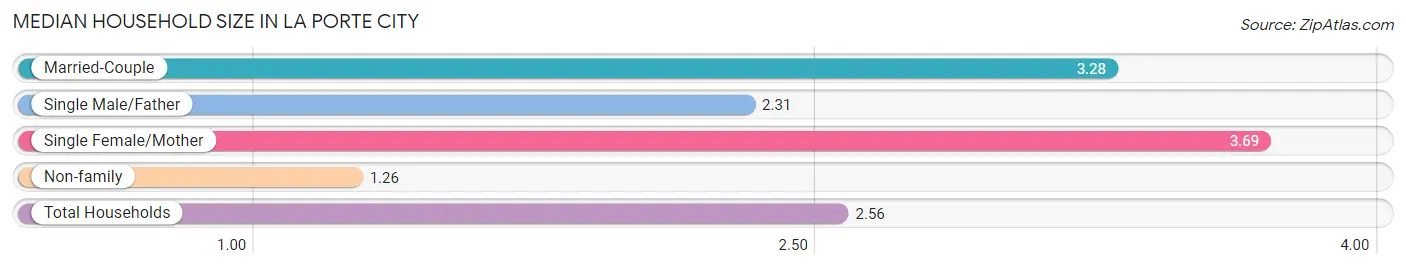
| Household Type | # Households | Household Size |
| Married-Couple | 395 (43.9%) | 3.28 |
| Single Male/Father | 26 (2.9%) | 2.31 |
| Single Female/Mother | 141 (15.7%) | 3.69 |
| Non-family | 337 (37.5%) | 1.26 |
| Total Households | 899 (100.0%) | 2.56 |
Household Size by Marriage Status in La Porte City
Out of a total of 899 households in La Porte City, 562 (62.5%) are family households, while 337 (37.5%) are nonfamily households. The most numerous type of family households are 2-person households, comprising 235, and the most common type of nonfamily households are 1-person households, comprising 254.
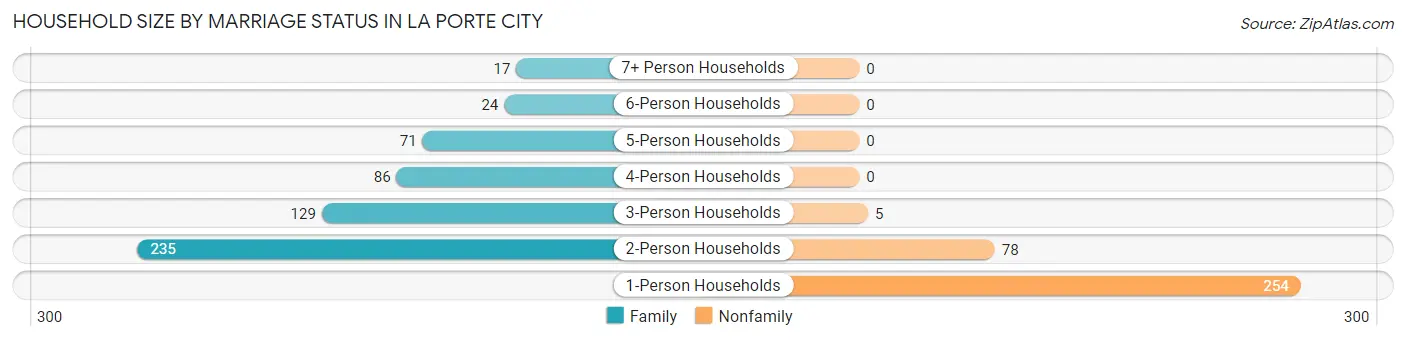
| Household Size | Family Households | Nonfamily Households |
| 1-Person Households | - | 254 (28.2%) |
| 2-Person Households | 235 (26.1%) | 78 (8.7%) |
| 3-Person Households | 129 (14.3%) | 5 (0.6%) |
| 4-Person Households | 86 (9.6%) | 0 (0.0%) |
| 5-Person Households | 71 (7.9%) | 0 (0.0%) |
| 6-Person Households | 24 (2.7%) | 0 (0.0%) |
| 7+ Person Households | 17 (1.9%) | 0 (0.0%) |
| Total | 562 (62.5%) | 337 (37.5%) |
Female Fertility in La Porte City
Fertility by Age in La Porte City
Average fertility rate in La Porte City is 75.0 births per 1,000 women. Women in the age bracket of 20 to 34 years have the highest fertility rate with 126.0 births per 1,000 women. Women in the age bracket of 20 to 34 years acount for 76.9% of all women with births.
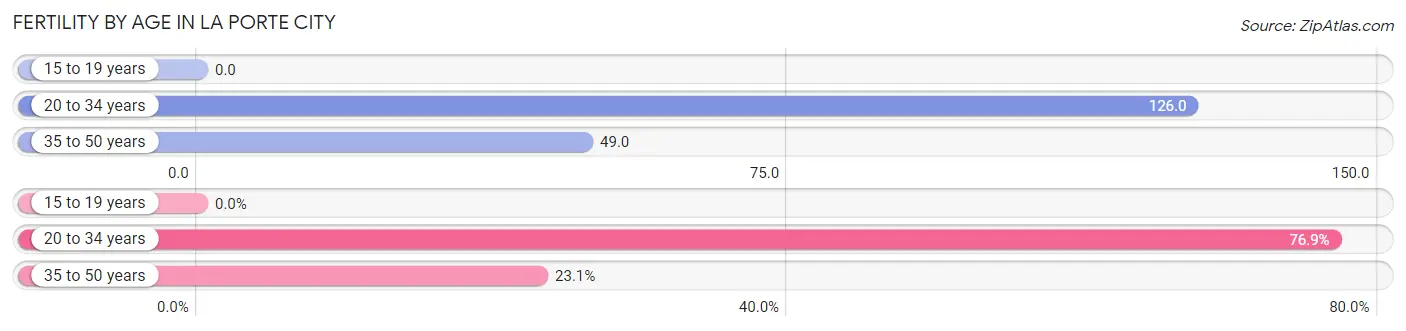
| Age Bracket | Women with Births | Births / 1,000 Women |
| 15 to 19 years | 0 (0.0%) | 0.0 |
| 20 to 34 years | 30 (76.9%) | 126.0 |
| 35 to 50 years | 9 (23.1%) | 49.0 |
| Total | 39 (100.0%) | 75.0 |
Fertility by Age by Marriage Status in La Porte City
64.1% of women with births (39) in La Porte City are married. The highest percentage of unmarried women with births falls into 20 to 34 years age bracket with 36.7% of them unmarried at the time of birth, while the lowest percentage of unmarried women with births belong to 35 to 50 years age bracket with 33.3% of them unmarried.
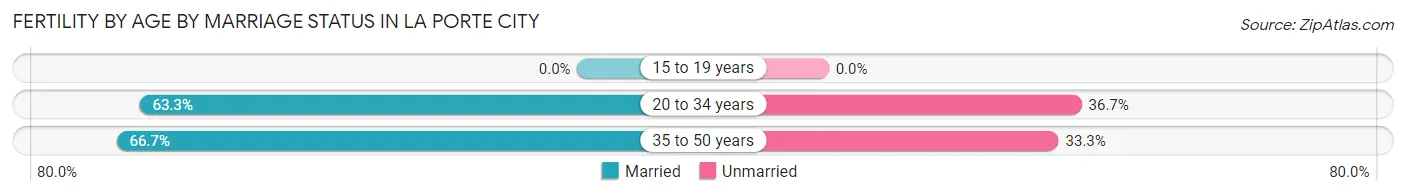
| Age Bracket | Married | Unmarried |
| 15 to 19 years | 0 (0.0%) | 0 (0.0%) |
| 20 to 34 years | 19 (63.3%) | 11 (36.7%) |
| 35 to 50 years | 6 (66.7%) | 3 (33.3%) |
| Total | 25 (64.1%) | 14 (35.9%) |
Fertility by Education in La Porte City
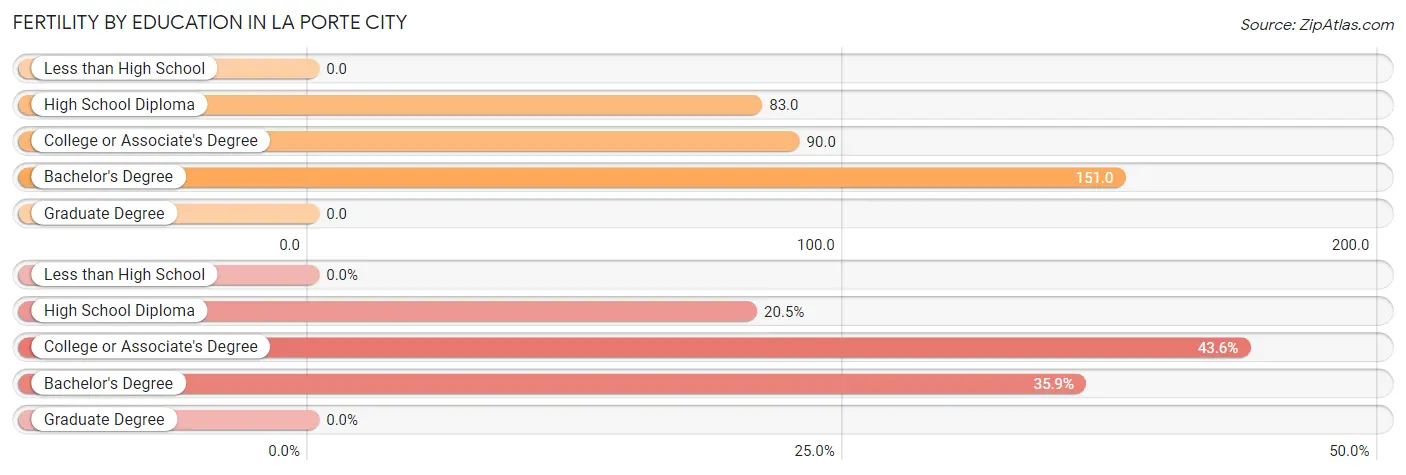
| Educational Attainment | Women with Births | Births / 1,000 Women |
| Less than High School | 0 (0.0%) | 0.0 |
| High School Diploma | 8 (20.5%) | 83.0 |
| College or Associate's Degree | 17 (43.6%) | 90.0 |
| Bachelor's Degree | 14 (35.9%) | 151.0 |
| Graduate Degree | 0 (0.0%) | 0.0 |
| Total | 39 (100.0%) | 75.0 |
Fertility by Education by Marriage Status in La Porte City
35.9% of women with births in La Porte City are unmarried. Women with the educational attainment of bachelor's degree are most likely to be married with 100.0% of them married at childbirth, while women with the educational attainment of high school diploma are least likely to be married with 100.0% of them unmarried at childbirth.
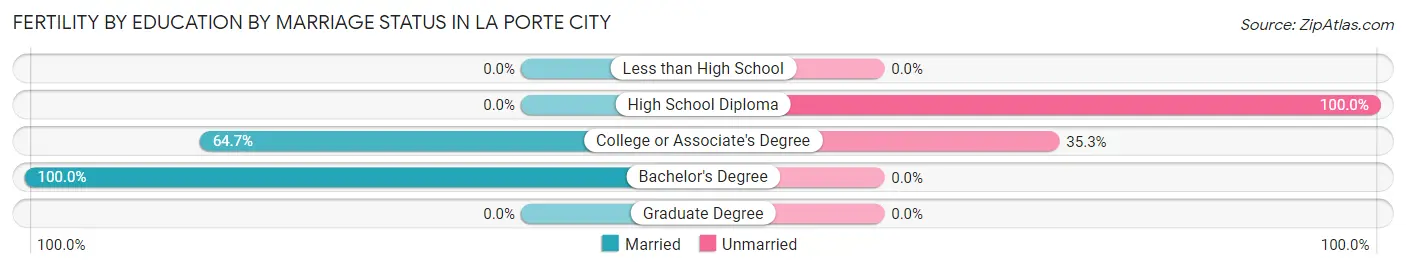
| Educational Attainment | Married | Unmarried |
| Less than High School | 0 (0.0%) | 0 (0.0%) |
| High School Diploma | 0 (0.0%) | 8 (100.0%) |
| College or Associate's Degree | 11 (64.7%) | 6 (35.3%) |
| Bachelor's Degree | 14 (100.0%) | 0 (0.0%) |
| Graduate Degree | 0 (0.0%) | 0 (0.0%) |
| Total | 25 (64.1%) | 14 (35.9%) |
Employment Characteristics in La Porte City
Employment by Class of Employer in La Porte City
Among the 1,095 employed individuals in La Porte City, private company employees (776 | 70.9%), local government employees (95 | 8.7%), and not-for-profit organizations (68 | 6.2%) make up the most common classes of employment.

| Employer Class | # Employees | % Employees |
| Private Company Employees | 776 | 70.9% |
| Self-Employed (Incorporated) | 14 | 1.3% |
| Self-Employed (Not Incorporated) | 66 | 6.0% |
| Not-for-profit Organizations | 68 | 6.2% |
| Local Government Employees | 95 | 8.7% |
| State Government Employees | 51 | 4.7% |
| Federal Government Employees | 19 | 1.7% |
| Unpaid Family Workers | 6 | 0.5% |
| Total | 1,095 | 100.0% |
Employment Status by Age in La Porte City
According to the labor force statistics for La Porte City, out of the total population over 16 years of age (1,672), 69.3% or 1,159 individuals are in the labor force, with 1.8% or 21 of them unemployed. The age group with the highest labor force participation rate is 20 to 24 years, with 100.0% or 82 individuals in the labor force. Within the labor force, the 16 to 19 years age range has the highest percentage of unemployed individuals, with 9.6% or 11 of them being unemployed.
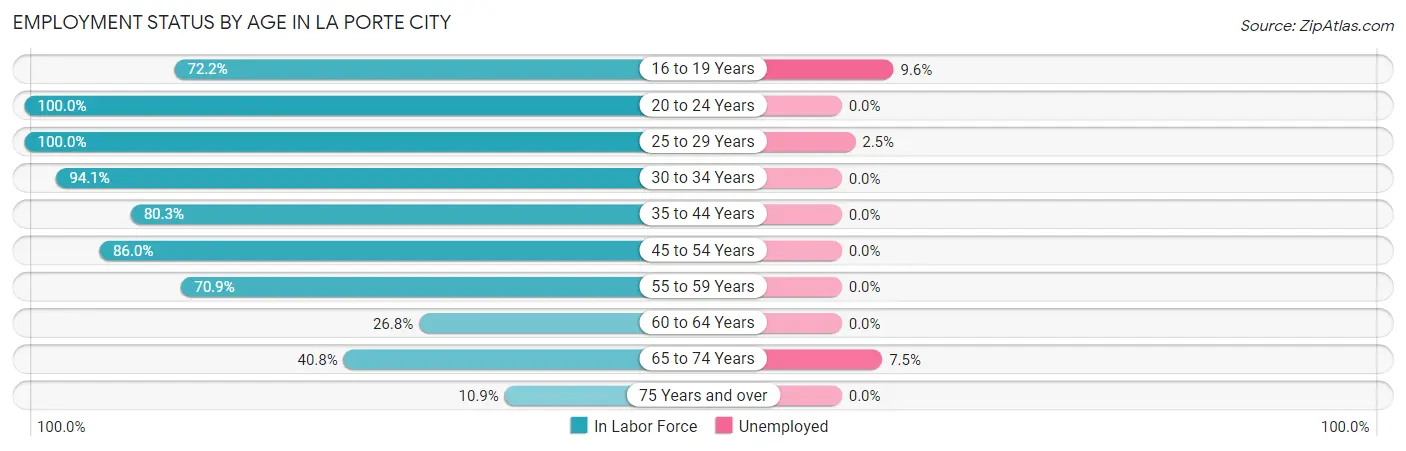
| Age Bracket | In Labor Force | Unemployed |
| 16 to 19 Years | 114 (72.2%) | 11 (9.6%) |
| 20 to 24 Years | 82 (100.0%) | 0 (0.0%) |
| 25 to 29 Years | 162 (100.0%) | 4 (2.5%) |
| 30 to 34 Years | 175 (94.1%) | 0 (0.0%) |
| 35 to 44 Years | 212 (80.3%) | 0 (0.0%) |
| 45 to 54 Years | 197 (86.0%) | 0 (0.0%) |
| 55 to 59 Years | 90 (70.9%) | 0 (0.0%) |
| 60 to 64 Years | 30 (26.8%) | 0 (0.0%) |
| 65 to 74 Years | 80 (40.8%) | 6 (7.5%) |
| 75 Years and over | 17 (10.9%) | 0 (0.0%) |
| Total | 1,159 (69.3%) | 21 (1.8%) |
Employment Status by Educational Attainment in La Porte City
According to labor force statistics for La Porte City, 80.2% of individuals (866) out of the total population between 25 and 64 years of age (1,080) are in the labor force, with 0.5% or 4 of them being unemployed. The group with the highest labor force participation rate are those with the educational attainment of bachelor's degree or higher, with 95.6% or 217 individuals in the labor force. Within the labor force, individuals with college / associate degree education have the highest percentage of unemployment, with 0.9% or 4 of them being unemployed.

| Educational Attainment | In Labor Force | Unemployed |
| Less than High School | 4 (12.1%) | 0 (0.0%) |
| High School Diploma | 178 (64.0%) | 0 (0.0%) |
| College / Associate Degree | 467 (86.2%) | 5 (0.9%) |
| Bachelor's Degree or higher | 217 (95.6%) | 0 (0.0%) |
| Total | 866 (80.2%) | 5 (0.5%) |
Employment Occupations by Sex in La Porte City
Management, Business, Science and Arts Occupations
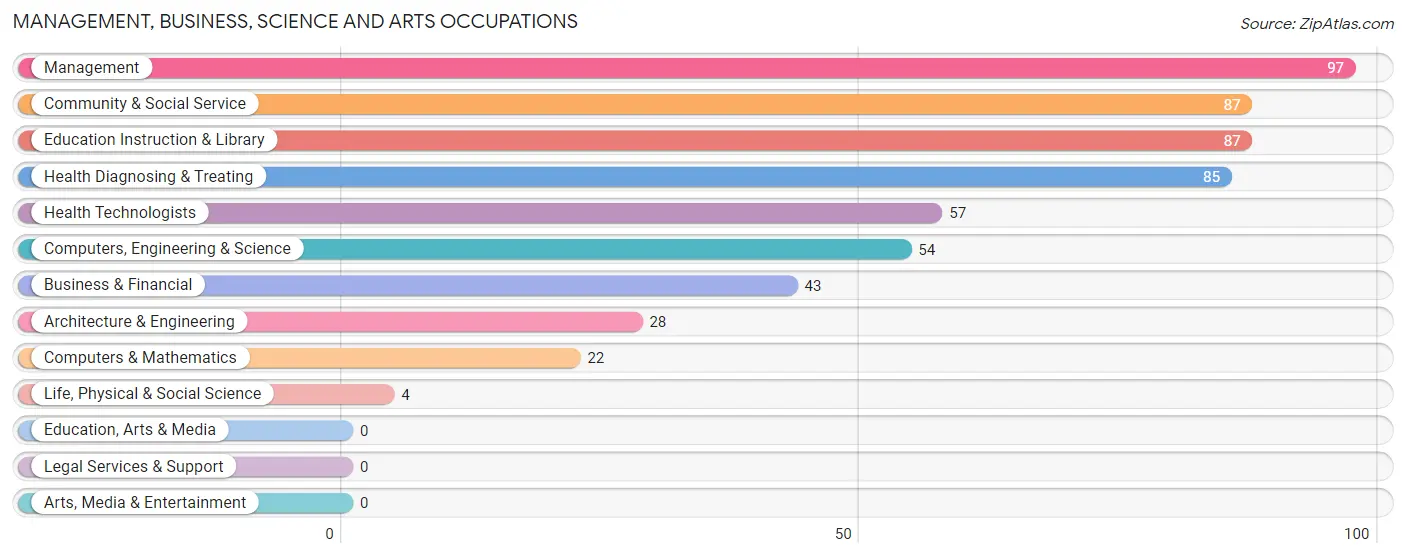
The most common Management, Business, Science and Arts occupations in La Porte City are Management (97 | 8.5%), Community & Social Service (87 | 7.6%), Education Instruction & Library (87 | 7.6%), Health Diagnosing & Treating (85 | 7.5%), and Health Technologists (57 | 5.0%).
Management, Business, Science and Arts Occupations by Sex
Within the Management, Business, Science and Arts occupations in La Porte City, the most male-oriented occupations are Architecture & Engineering (100.0%), Life, Physical & Social Science (100.0%), and Computers, Engineering & Science (90.7%), while the most female-oriented occupations are Health Diagnosing & Treating (94.1%), Health Technologists (91.2%), and Community & Social Service (88.5%).
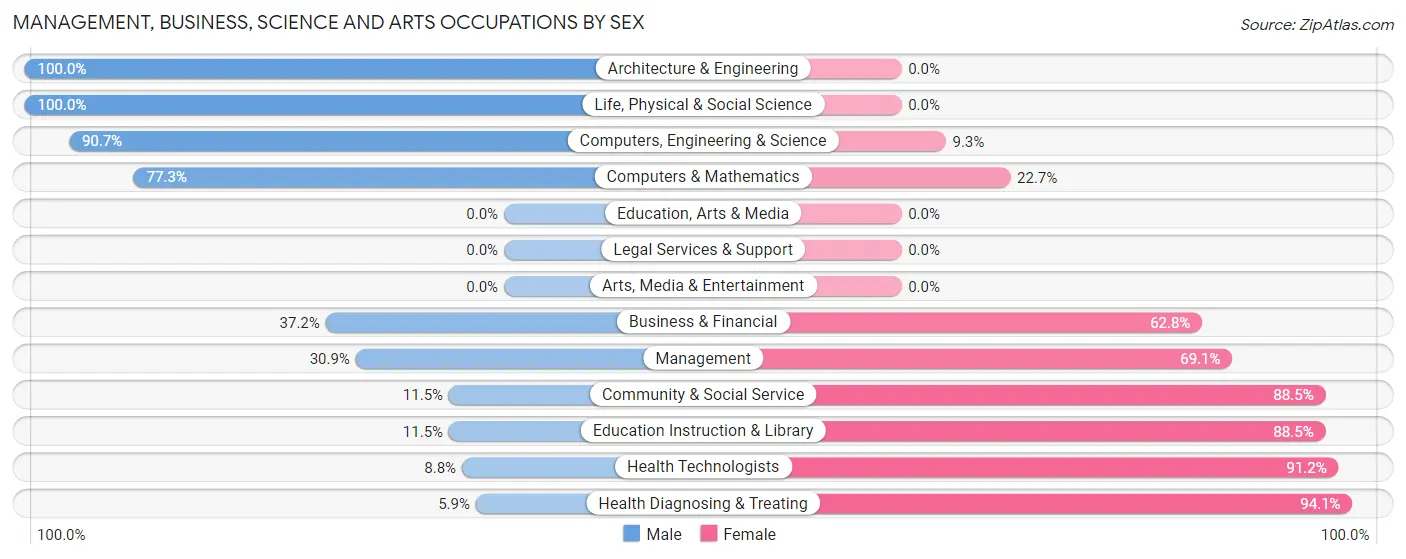
| Occupation | Male | Female |
| Management | 30 (30.9%) | 67 (69.1%) |
| Business & Financial | 16 (37.2%) | 27 (62.8%) |
| Computers, Engineering & Science | 49 (90.7%) | 5 (9.3%) |
| Computers & Mathematics | 17 (77.3%) | 5 (22.7%) |
| Architecture & Engineering | 28 (100.0%) | 0 (0.0%) |
| Life, Physical & Social Science | 4 (100.0%) | 0 (0.0%) |
| Community & Social Service | 10 (11.5%) | 77 (88.5%) |
| Education, Arts & Media | 0 (0.0%) | 0 (0.0%) |
| Legal Services & Support | 0 (0.0%) | 0 (0.0%) |
| Education Instruction & Library | 10 (11.5%) | 77 (88.5%) |
| Arts, Media & Entertainment | 0 (0.0%) | 0 (0.0%) |
| Health Diagnosing & Treating | 5 (5.9%) | 80 (94.1%) |
| Health Technologists | 5 (8.8%) | 52 (91.2%) |
| Total (Category) | 110 (30.0%) | 256 (70.0%) |
| Total (Overall) | 598 (52.5%) | 540 (47.4%) |
Services Occupations
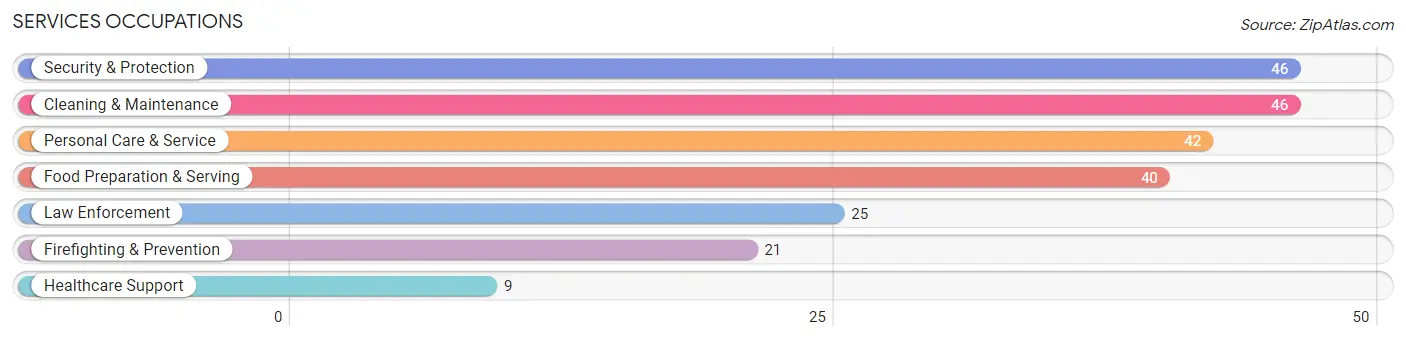
The most common Services occupations in La Porte City are Security & Protection (46 | 4.0%), Cleaning & Maintenance (46 | 4.0%), Personal Care & Service (42 | 3.7%), Food Preparation & Serving (40 | 3.5%), and Law Enforcement (25 | 2.2%).
Services Occupations by Sex
Within the Services occupations in La Porte City, the most male-oriented occupations are Security & Protection (100.0%), Firefighting & Prevention (100.0%), and Law Enforcement (100.0%), while the most female-oriented occupations are Healthcare Support (100.0%), Personal Care & Service (54.8%), and Food Preparation & Serving (50.0%).
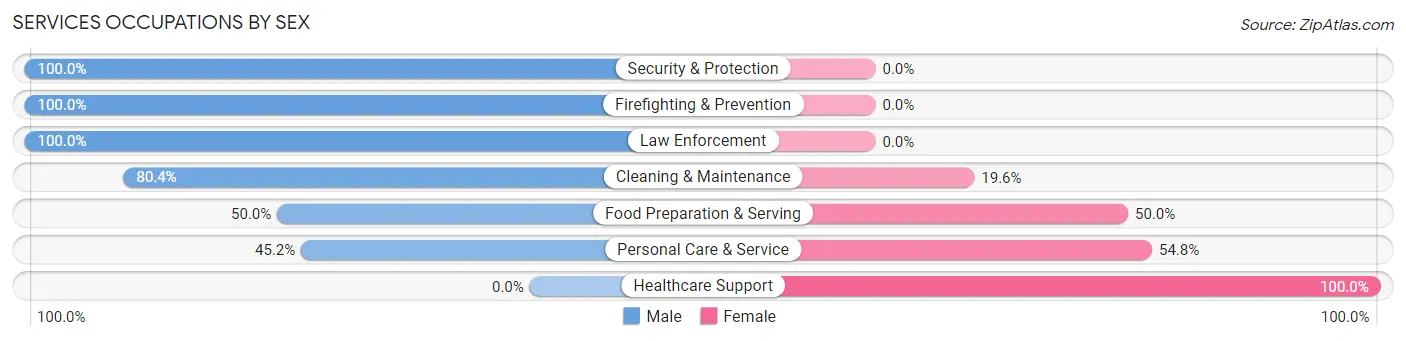
| Occupation | Male | Female |
| Healthcare Support | 0 (0.0%) | 9 (100.0%) |
| Security & Protection | 46 (100.0%) | 0 (0.0%) |
| Firefighting & Prevention | 21 (100.0%) | 0 (0.0%) |
| Law Enforcement | 25 (100.0%) | 0 (0.0%) |
| Food Preparation & Serving | 20 (50.0%) | 20 (50.0%) |
| Cleaning & Maintenance | 37 (80.4%) | 9 (19.6%) |
| Personal Care & Service | 19 (45.2%) | 23 (54.8%) |
| Total (Category) | 122 (66.7%) | 61 (33.3%) |
| Total (Overall) | 598 (52.5%) | 540 (47.4%) |
Sales and Office Occupations
The most common Sales and Office occupations in La Porte City are Office & Administration (174 | 15.3%), and Sales & Related (135 | 11.9%).

Sales and Office Occupations by Sex

| Occupation | Male | Female |
| Sales & Related | 122 (90.4%) | 13 (9.6%) |
| Office & Administration | 35 (20.1%) | 139 (79.9%) |
| Total (Category) | 157 (50.8%) | 152 (49.2%) |
| Total (Overall) | 598 (52.5%) | 540 (47.4%) |
Natural Resources, Construction and Maintenance Occupations
The most common Natural Resources, Construction and Maintenance occupations in La Porte City are Construction & Extraction (39 | 3.4%), and Installation, Maintenance & Repair (34 | 3.0%).
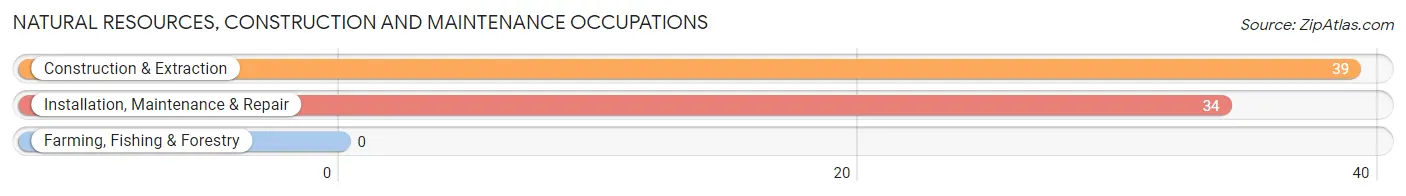
Natural Resources, Construction and Maintenance Occupations by Sex

| Occupation | Male | Female |
| Farming, Fishing & Forestry | 0 (0.0%) | 0 (0.0%) |
| Construction & Extraction | 39 (100.0%) | 0 (0.0%) |
| Installation, Maintenance & Repair | 34 (100.0%) | 0 (0.0%) |
| Total (Category) | 73 (100.0%) | 0 (0.0%) |
| Total (Overall) | 598 (52.5%) | 540 (47.4%) |
Production, Transportation and Moving Occupations
The most common Production, Transportation and Moving occupations in La Porte City are Production (85 | 7.5%), Material Moving (69 | 6.1%), and Transportation (53 | 4.7%).
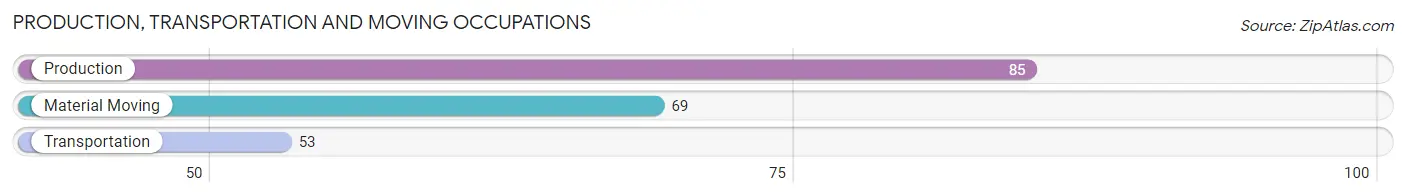
Production, Transportation and Moving Occupations by Sex

| Occupation | Male | Female |
| Production | 54 (63.5%) | 31 (36.5%) |
| Transportation | 53 (100.0%) | 0 (0.0%) |
| Material Moving | 29 (42.0%) | 40 (58.0%) |
| Total (Category) | 136 (65.7%) | 71 (34.3%) |
| Total (Overall) | 598 (52.5%) | 540 (47.4%) |
Employment Industries by Sex in La Porte City
Employment Industries in La Porte City
The major employment industries in La Porte City include Retail Trade (198 | 17.4%), Manufacturing (176 | 15.5%), Health Care & Social Assistance (157 | 13.8%), Educational Services (125 | 11.0%), and Finance & Insurance (77 | 6.8%).
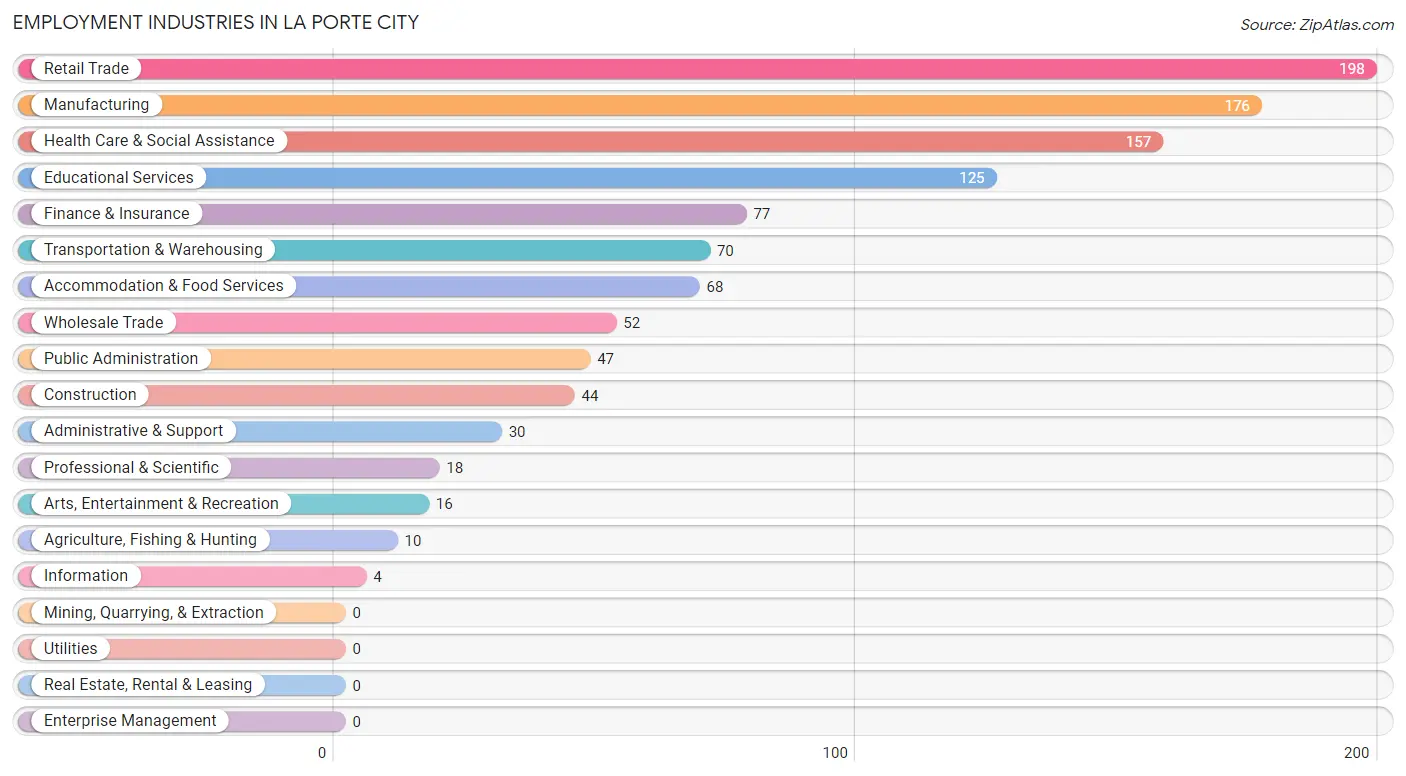
Employment Industries by Sex in La Porte City
The La Porte City industries that see more men than women are Agriculture, Fishing & Hunting (100.0%), Construction (100.0%), and Arts, Entertainment & Recreation (100.0%), whereas the industries that tend to have a higher number of women are Information (100.0%), Health Care & Social Assistance (93.0%), and Finance & Insurance (92.2%).
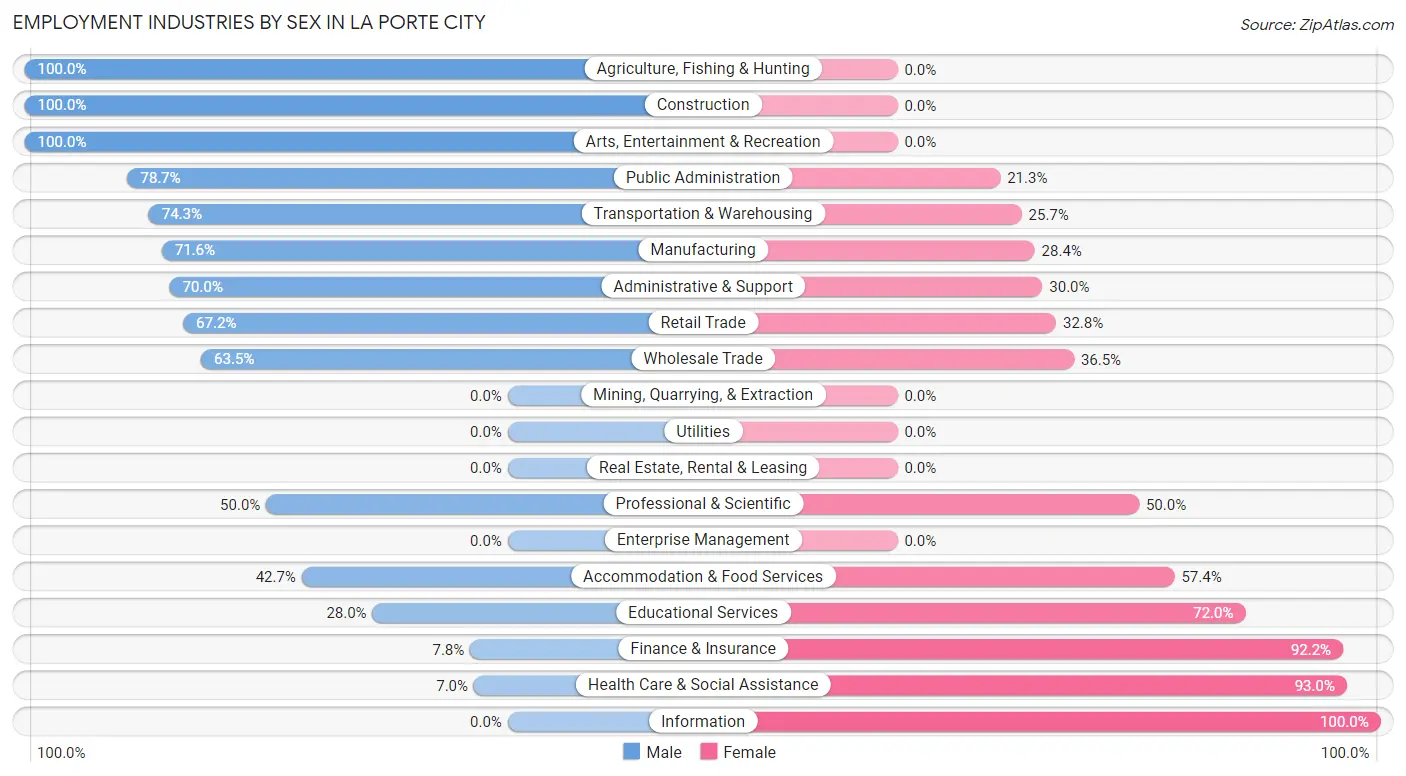
| Industry | Male | Female |
| Agriculture, Fishing & Hunting | 10 (100.0%) | 0 (0.0%) |
| Mining, Quarrying, & Extraction | 0 (0.0%) | 0 (0.0%) |
| Construction | 44 (100.0%) | 0 (0.0%) |
| Manufacturing | 126 (71.6%) | 50 (28.4%) |
| Wholesale Trade | 33 (63.5%) | 19 (36.5%) |
| Retail Trade | 133 (67.2%) | 65 (32.8%) |
| Transportation & Warehousing | 52 (74.3%) | 18 (25.7%) |
| Utilities | 0 (0.0%) | 0 (0.0%) |
| Information | 0 (0.0%) | 4 (100.0%) |
| Finance & Insurance | 6 (7.8%) | 71 (92.2%) |
| Real Estate, Rental & Leasing | 0 (0.0%) | 0 (0.0%) |
| Professional & Scientific | 9 (50.0%) | 9 (50.0%) |
| Enterprise Management | 0 (0.0%) | 0 (0.0%) |
| Administrative & Support | 21 (70.0%) | 9 (30.0%) |
| Educational Services | 35 (28.0%) | 90 (72.0%) |
| Health Care & Social Assistance | 11 (7.0%) | 146 (93.0%) |
| Arts, Entertainment & Recreation | 16 (100.0%) | 0 (0.0%) |
| Accommodation & Food Services | 29 (42.6%) | 39 (57.4%) |
| Public Administration | 37 (78.7%) | 10 (21.3%) |
| Total | 598 (52.5%) | 540 (47.4%) |
Education in La Porte City
School Enrollment in La Porte City
The most common levels of schooling among the 730 students in La Porte City are middle school (236 | 32.3%), elementary school (167 | 22.9%), and high school (142 | 19.5%).
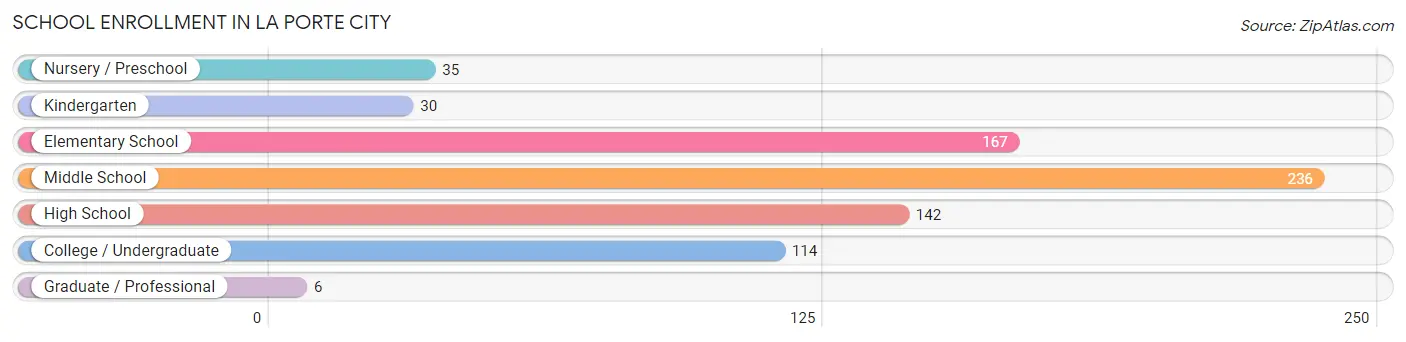
| School Level | # Students | % Students |
| Nursery / Preschool | 35 | 4.8% |
| Kindergarten | 30 | 4.1% |
| Elementary School | 167 | 22.9% |
| Middle School | 236 | 32.3% |
| High School | 142 | 19.5% |
| College / Undergraduate | 114 | 15.6% |
| Graduate / Professional | 6 | 0.8% |
| Total | 730 | 100.0% |
School Enrollment by Age by Funding Source in La Porte City
Out of a total of 730 students who are enrolled in schools in La Porte City, 30 (4.1%) attend a private institution, while the remaining 700 (95.9%) are enrolled in public schools. The age group of 35 years and over has the highest likelihood of being enrolled in private schools, with 6 (50.0% in the age bracket) enrolled. Conversely, the age group of 5 to 9 year old has the lowest likelihood of being enrolled in a private school, with 184 (100.0% in the age bracket) attending a public institution.
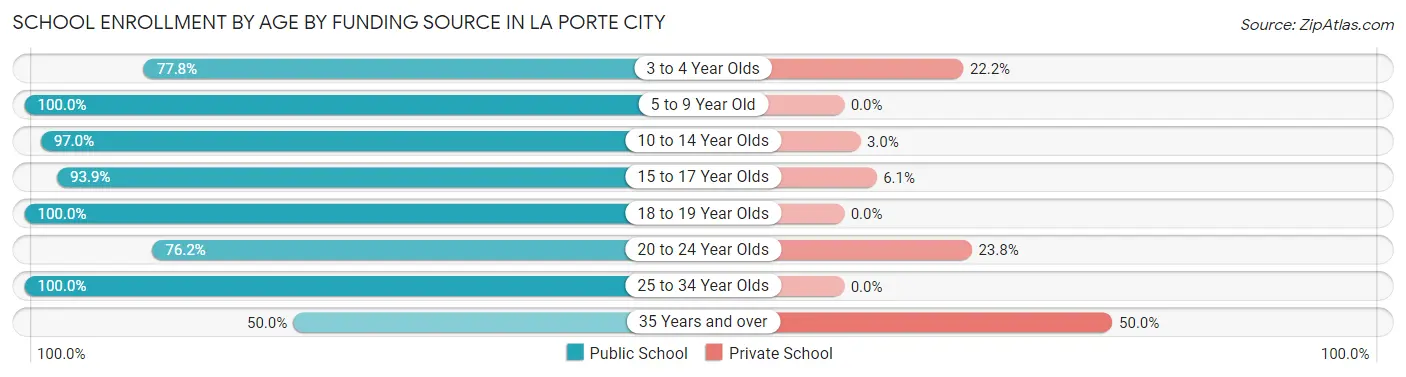
| Age Bracket | Public School | Private School |
| 3 to 4 Year Olds | 14 (77.8%) | 4 (22.2%) |
| 5 to 9 Year Old | 184 (100.0%) | 0 (0.0%) |
| 10 to 14 Year Olds | 288 (97.0%) | 9 (3.0%) |
| 15 to 17 Year Olds | 93 (93.9%) | 6 (6.1%) |
| 18 to 19 Year Olds | 88 (100.0%) | 0 (0.0%) |
| 20 to 24 Year Olds | 16 (76.2%) | 5 (23.8%) |
| 25 to 34 Year Olds | 11 (100.0%) | 0 (0.0%) |
| 35 Years and over | 6 (50.0%) | 6 (50.0%) |
| Total | 700 (95.9%) | 30 (4.1%) |
Educational Attainment by Field of Study in La Porte City
Education (111 | 37.4%), business (40 | 13.5%), bio, nature & agricultural (25 | 8.4%), science & technology (24 | 8.1%), and liberal arts & history (19 | 6.4%) are the most common fields of study among 297 individuals in La Porte City who have obtained a bachelor's degree or higher.
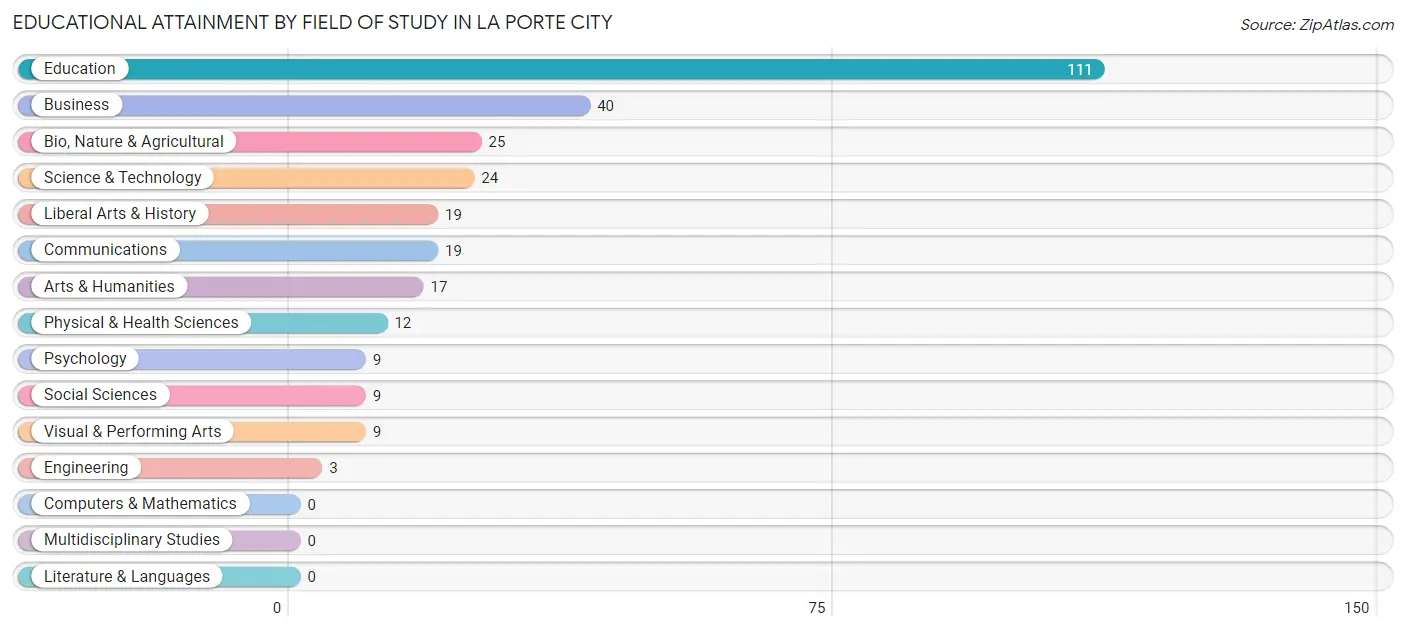
| Field of Study | # Graduates | % Graduates |
| Computers & Mathematics | 0 | 0.0% |
| Bio, Nature & Agricultural | 25 | 8.4% |
| Physical & Health Sciences | 12 | 4.0% |
| Psychology | 9 | 3.0% |
| Social Sciences | 9 | 3.0% |
| Engineering | 3 | 1.0% |
| Multidisciplinary Studies | 0 | 0.0% |
| Science & Technology | 24 | 8.1% |
| Business | 40 | 13.5% |
| Education | 111 | 37.4% |
| Literature & Languages | 0 | 0.0% |
| Liberal Arts & History | 19 | 6.4% |
| Visual & Performing Arts | 9 | 3.0% |
| Communications | 19 | 6.4% |
| Arts & Humanities | 17 | 5.7% |
| Total | 297 | 100.0% |
Transportation & Commute in La Porte City
Vehicle Availability by Sex in La Porte City
The most prevalent vehicle ownership categories in La Porte City are males with 2 vehicles (269, accounting for 47.8%) and females with 2 vehicles (231, making up 50.6%).
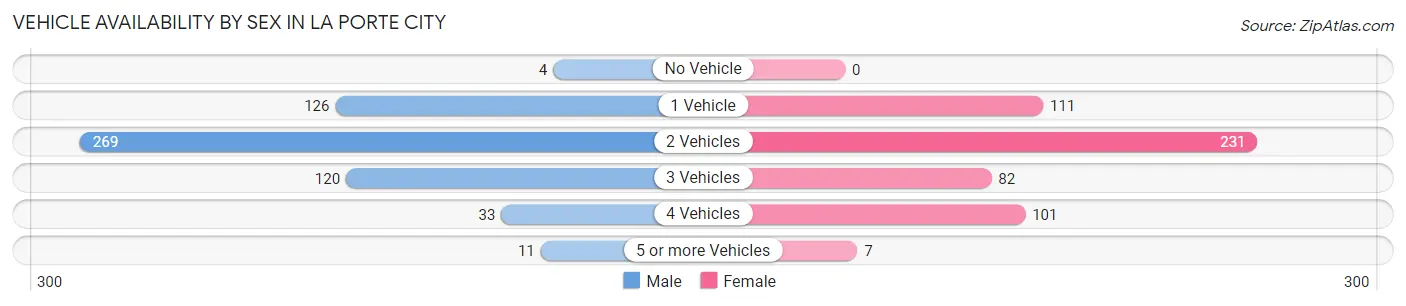
| Vehicles Available | Male | Female |
| No Vehicle | 4 (0.7%) | 0 (0.0%) |
| 1 Vehicle | 126 (22.4%) | 111 (20.9%) |
| 2 Vehicles | 269 (47.8%) | 231 (43.4%) |
| 3 Vehicles | 120 (21.3%) | 82 (15.4%) |
| 4 Vehicles | 33 (5.9%) | 101 (19.0%) |
| 5 or more Vehicles | 11 (1.9%) | 7 (1.3%) |
| Total | 563 (100.0%) | 532 (100.0%) |
Commute Time in La Porte City
The most frequently occuring commute durations in La Porte City are 25 to 29 minutes (230 commuters, 21.9%), 20 to 24 minutes (221 commuters, 21.0%), and 30 to 34 minutes (203 commuters, 19.3%).
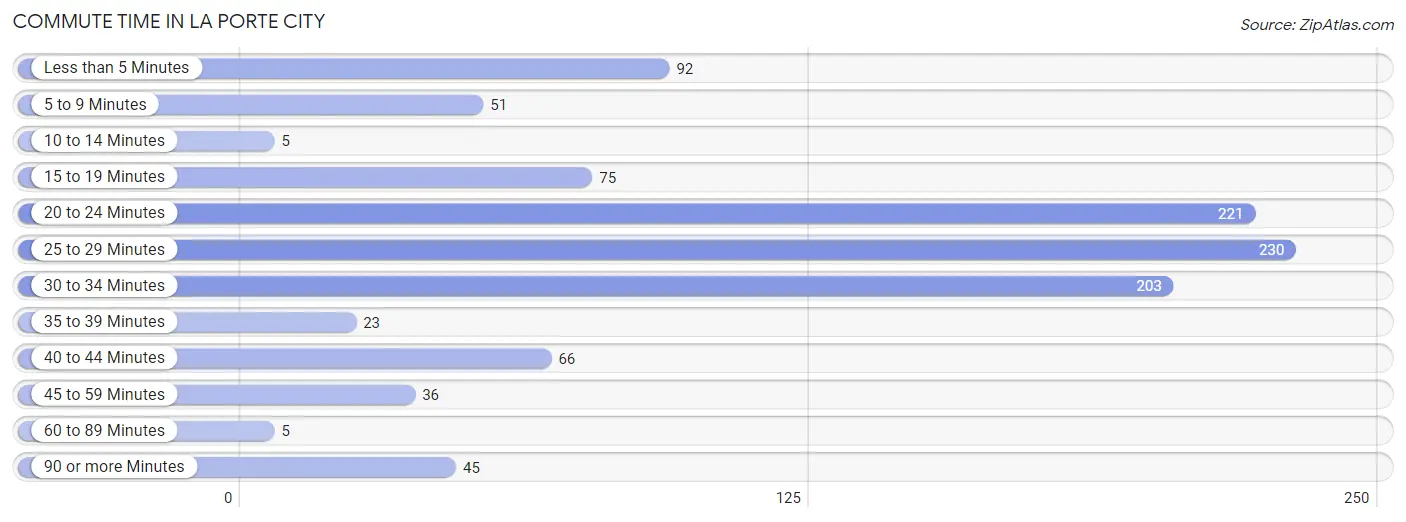
| Commute Time | # Commuters | % Commuters |
| Less than 5 Minutes | 92 | 8.7% |
| 5 to 9 Minutes | 51 | 4.9% |
| 10 to 14 Minutes | 5 | 0.5% |
| 15 to 19 Minutes | 75 | 7.1% |
| 20 to 24 Minutes | 221 | 21.0% |
| 25 to 29 Minutes | 230 | 21.9% |
| 30 to 34 Minutes | 203 | 19.3% |
| 35 to 39 Minutes | 23 | 2.2% |
| 40 to 44 Minutes | 66 | 6.3% |
| 45 to 59 Minutes | 36 | 3.4% |
| 60 to 89 Minutes | 5 | 0.5% |
| 90 or more Minutes | 45 | 4.3% |
Commute Time by Sex in La Porte City
The most common commute times in La Porte City are 25 to 29 minutes (148 commuters, 26.9%) for males and 20 to 24 minutes (131 commuters, 26.2%) for females.
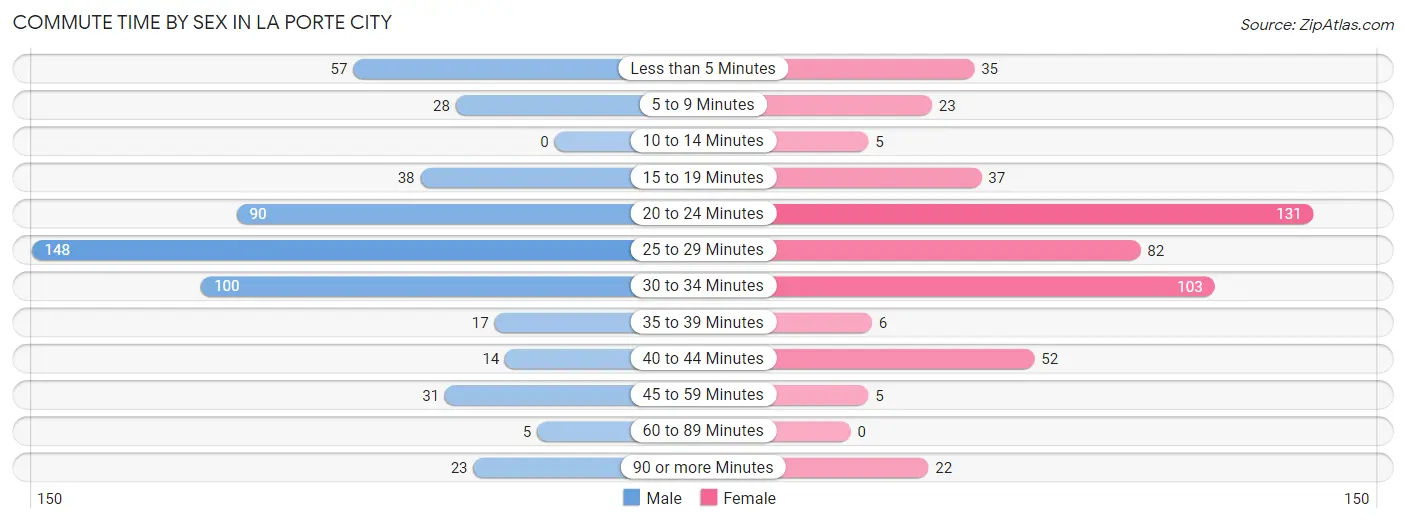
| Commute Time | Male | Female |
| Less than 5 Minutes | 57 (10.3%) | 35 (7.0%) |
| 5 to 9 Minutes | 28 (5.1%) | 23 (4.6%) |
| 10 to 14 Minutes | 0 (0.0%) | 5 (1.0%) |
| 15 to 19 Minutes | 38 (6.9%) | 37 (7.4%) |
| 20 to 24 Minutes | 90 (16.3%) | 131 (26.2%) |
| 25 to 29 Minutes | 148 (26.9%) | 82 (16.4%) |
| 30 to 34 Minutes | 100 (18.1%) | 103 (20.6%) |
| 35 to 39 Minutes | 17 (3.1%) | 6 (1.2%) |
| 40 to 44 Minutes | 14 (2.5%) | 52 (10.4%) |
| 45 to 59 Minutes | 31 (5.6%) | 5 (1.0%) |
| 60 to 89 Minutes | 5 (0.9%) | 0 (0.0%) |
| 90 or more Minutes | 23 (4.2%) | 22 (4.4%) |
Time of Departure to Work by Sex in La Porte City
The most frequent times of departure to work in La Porte City are 4:00 PM to 11:59 PM (99, 18.0%) for males and 7:00 AM to 7:29 AM (135, 27.0%) for females.
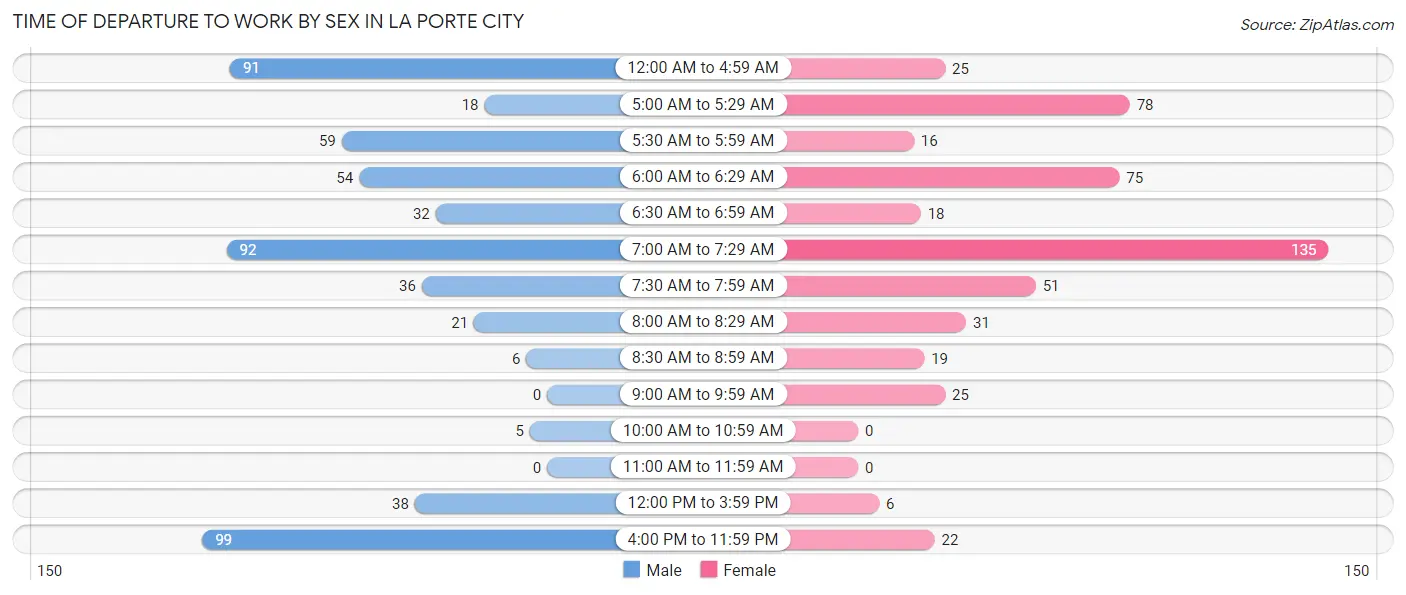
| Time of Departure | Male | Female |
| 12:00 AM to 4:59 AM | 91 (16.5%) | 25 (5.0%) |
| 5:00 AM to 5:29 AM | 18 (3.3%) | 78 (15.6%) |
| 5:30 AM to 5:59 AM | 59 (10.7%) | 16 (3.2%) |
| 6:00 AM to 6:29 AM | 54 (9.8%) | 75 (15.0%) |
| 6:30 AM to 6:59 AM | 32 (5.8%) | 18 (3.6%) |
| 7:00 AM to 7:29 AM | 92 (16.7%) | 135 (27.0%) |
| 7:30 AM to 7:59 AM | 36 (6.5%) | 51 (10.2%) |
| 8:00 AM to 8:29 AM | 21 (3.8%) | 31 (6.2%) |
| 8:30 AM to 8:59 AM | 6 (1.1%) | 19 (3.8%) |
| 9:00 AM to 9:59 AM | 0 (0.0%) | 25 (5.0%) |
| 10:00 AM to 10:59 AM | 5 (0.9%) | 0 (0.0%) |
| 11:00 AM to 11:59 AM | 0 (0.0%) | 0 (0.0%) |
| 12:00 PM to 3:59 PM | 38 (6.9%) | 6 (1.2%) |
| 4:00 PM to 11:59 PM | 99 (18.0%) | 22 (4.4%) |
| Total | 551 (100.0%) | 501 (100.0%) |
Housing Occupancy in La Porte City
Occupancy by Ownership in La Porte City
Of the total 899 dwellings in La Porte City, owner-occupied units account for 712 (79.2%), while renter-occupied units make up 187 (20.8%).
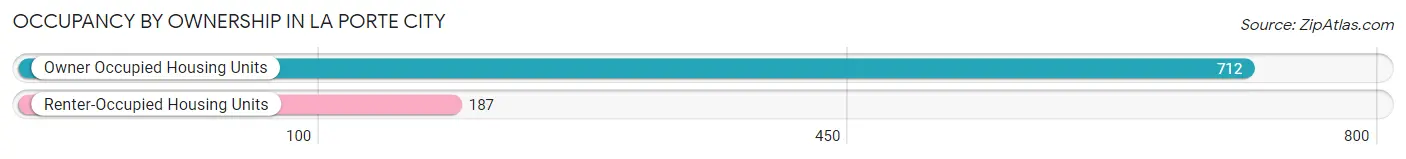
| Occupancy | # Housing Units | % Housing Units |
| Owner Occupied Housing Units | 712 | 79.2% |
| Renter-Occupied Housing Units | 187 | 20.8% |
| Total Occupied Housing Units | 899 | 100.0% |
Occupancy by Household Size in La Porte City
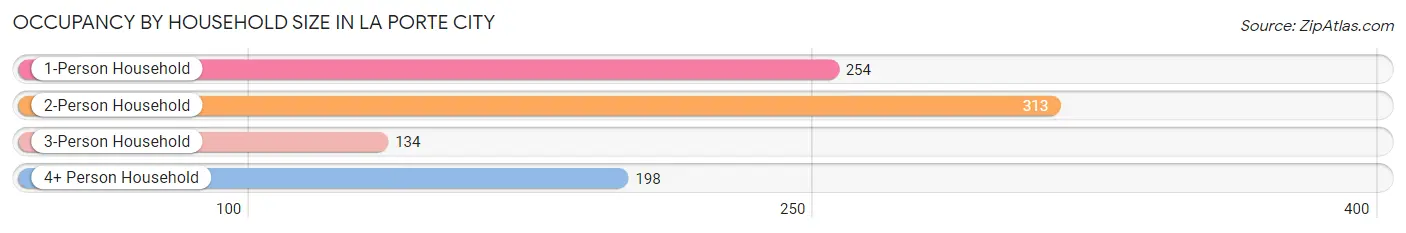
| Household Size | # Housing Units | % Housing Units |
| 1-Person Household | 254 | 28.2% |
| 2-Person Household | 313 | 34.8% |
| 3-Person Household | 134 | 14.9% |
| 4+ Person Household | 198 | 22.0% |
| Total Housing Units | 899 | 100.0% |
Occupancy by Ownership by Household Size in La Porte City
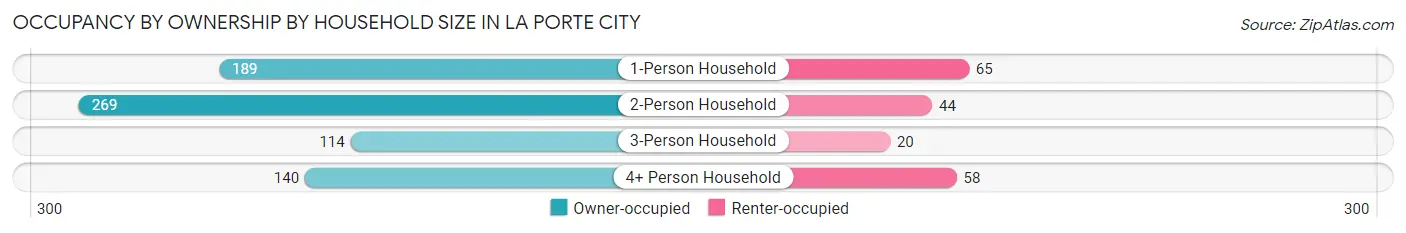
| Household Size | Owner-occupied | Renter-occupied |
| 1-Person Household | 189 (74.4%) | 65 (25.6%) |
| 2-Person Household | 269 (85.9%) | 44 (14.1%) |
| 3-Person Household | 114 (85.1%) | 20 (14.9%) |
| 4+ Person Household | 140 (70.7%) | 58 (29.3%) |
| Total Housing Units | 712 (79.2%) | 187 (20.8%) |
Occupancy by Educational Attainment in La Porte City
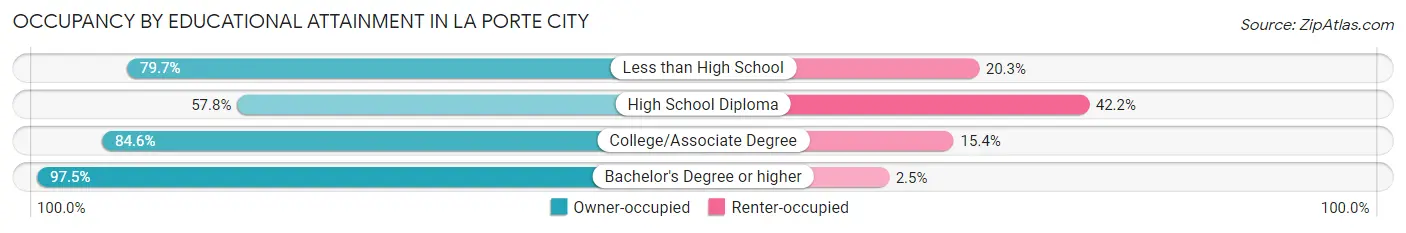
| Household Size | Owner-occupied | Renter-occupied |
| Less than High School | 47 (79.7%) | 12 (20.3%) |
| High School Diploma | 155 (57.8%) | 113 (42.2%) |
| College/Associate Degree | 314 (84.6%) | 57 (15.4%) |
| Bachelor's Degree or higher | 196 (97.5%) | 5 (2.5%) |
Occupancy by Age of Householder in La Porte City
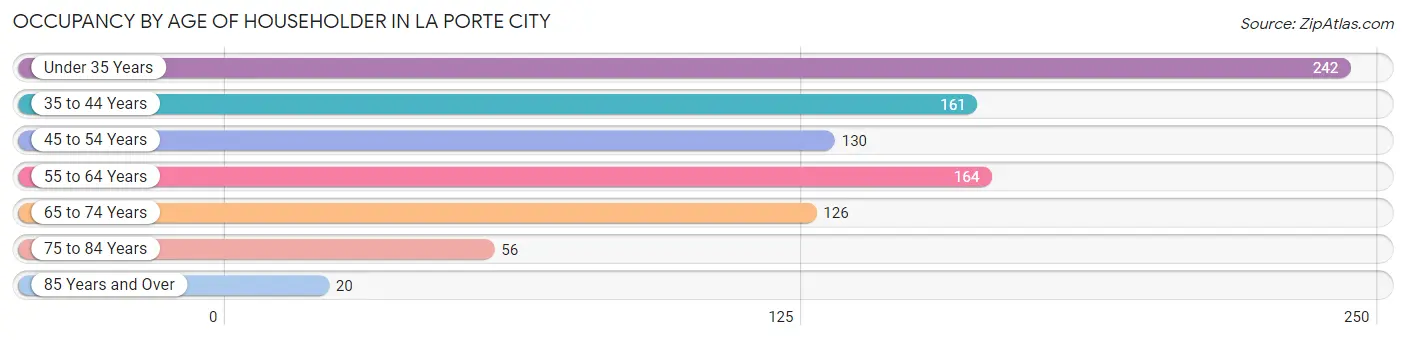
| Age Bracket | # Households | % Households |
| Under 35 Years | 242 | 26.9% |
| 35 to 44 Years | 161 | 17.9% |
| 45 to 54 Years | 130 | 14.5% |
| 55 to 64 Years | 164 | 18.2% |
| 65 to 74 Years | 126 | 14.0% |
| 75 to 84 Years | 56 | 6.2% |
| 85 Years and Over | 20 | 2.2% |
| Total | 899 | 100.0% |
Housing Finances in La Porte City
Median Income by Occupancy in La Porte City
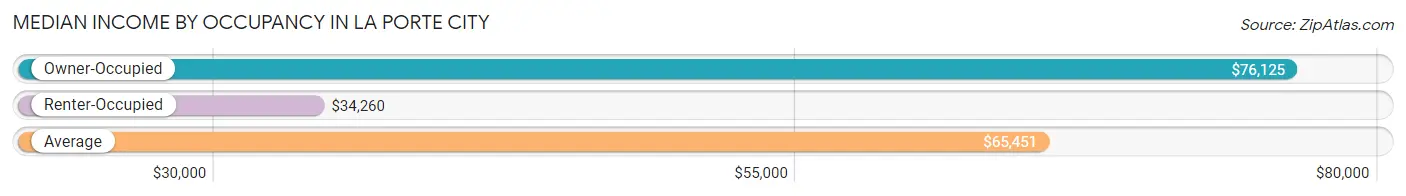
| Occupancy Type | # Households | Median Income |
| Owner-Occupied | 712 (79.2%) | $76,125 |
| Renter-Occupied | 187 (20.8%) | $34,260 |
| Average | 899 (100.0%) | $65,451 |
Occupancy by Householder Income Bracket in La Porte City
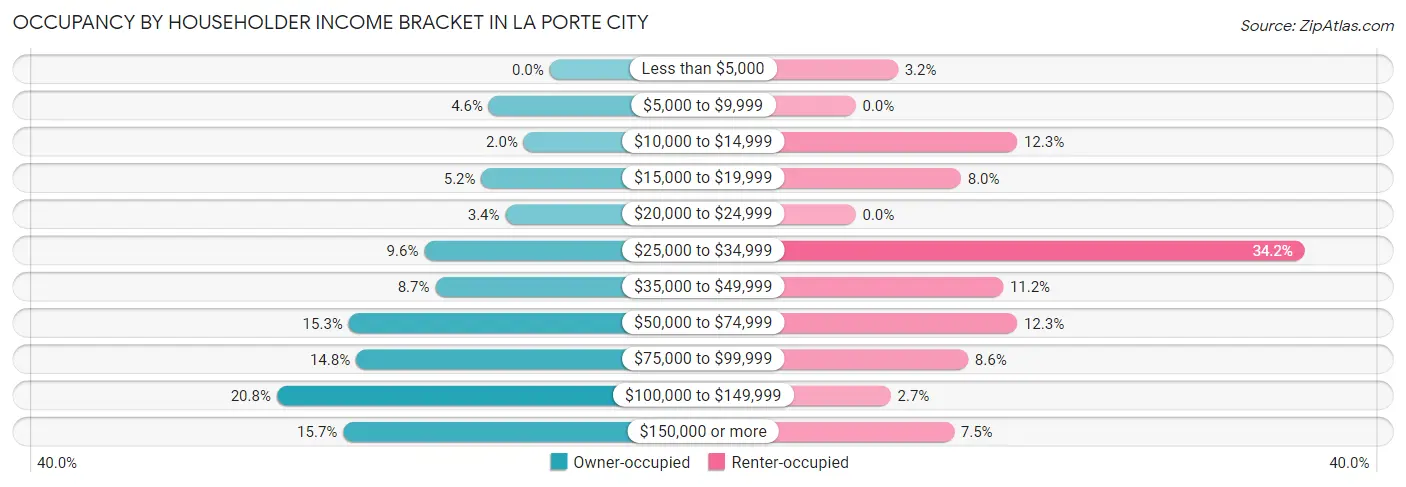
| Income Bracket | Owner-occupied | Renter-occupied |
| Less than $5,000 | 0 (0.0%) | 6 (3.2%) |
| $5,000 to $9,999 | 33 (4.6%) | 0 (0.0%) |
| $10,000 to $14,999 | 14 (2.0%) | 23 (12.3%) |
| $15,000 to $19,999 | 37 (5.2%) | 15 (8.0%) |
| $20,000 to $24,999 | 24 (3.4%) | 0 (0.0%) |
| $25,000 to $34,999 | 68 (9.6%) | 64 (34.2%) |
| $35,000 to $49,999 | 62 (8.7%) | 21 (11.2%) |
| $50,000 to $74,999 | 109 (15.3%) | 23 (12.3%) |
| $75,000 to $99,999 | 105 (14.7%) | 16 (8.6%) |
| $100,000 to $149,999 | 148 (20.8%) | 5 (2.7%) |
| $150,000 or more | 112 (15.7%) | 14 (7.5%) |
| Total | 712 (100.0%) | 187 (100.0%) |
Monthly Housing Cost Tiers in La Porte City
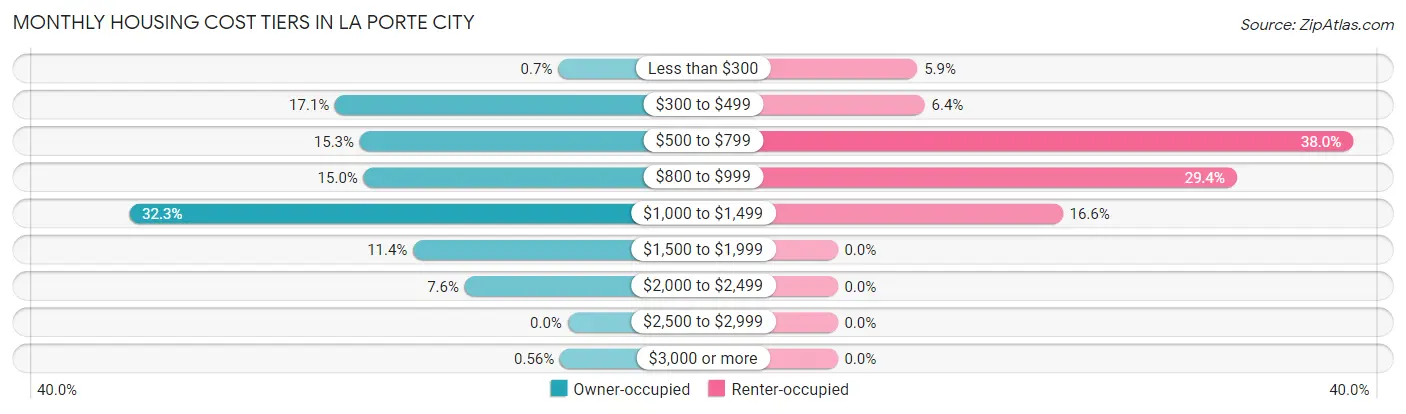
| Monthly Cost | Owner-occupied | Renter-occupied |
| Less than $300 | 5 (0.7%) | 11 (5.9%) |
| $300 to $499 | 122 (17.1%) | 12 (6.4%) |
| $500 to $799 | 109 (15.3%) | 71 (38.0%) |
| $800 to $999 | 107 (15.0%) | 55 (29.4%) |
| $1,000 to $1,499 | 230 (32.3%) | 31 (16.6%) |
| $1,500 to $1,999 | 81 (11.4%) | 0 (0.0%) |
| $2,000 to $2,499 | 54 (7.6%) | 0 (0.0%) |
| $2,500 to $2,999 | 0 (0.0%) | 0 (0.0%) |
| $3,000 or more | 4 (0.6%) | 0 (0.0%) |
| Total | 712 (100.0%) | 187 (100.0%) |
Physical Housing Characteristics in La Porte City
Housing Structures in La Porte City
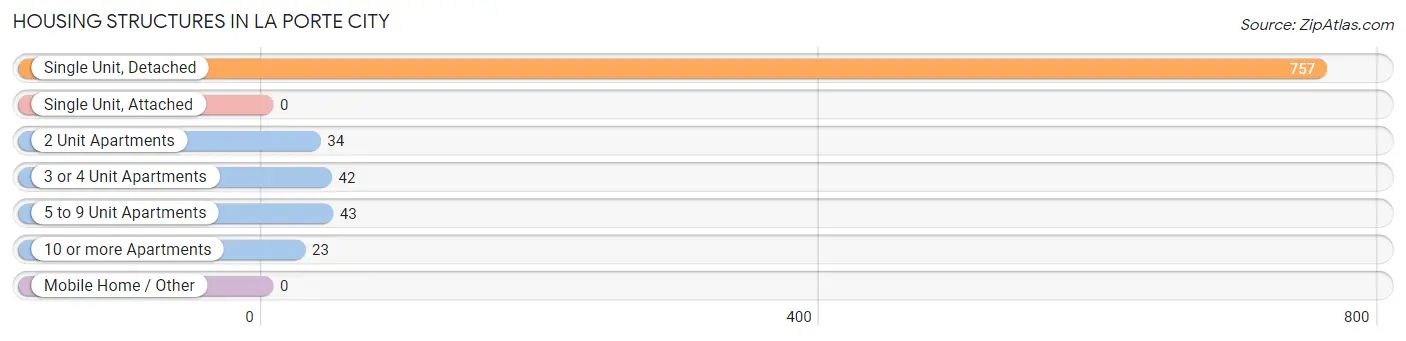
| Structure Type | # Housing Units | % Housing Units |
| Single Unit, Detached | 757 | 84.2% |
| Single Unit, Attached | 0 | 0.0% |
| 2 Unit Apartments | 34 | 3.8% |
| 3 or 4 Unit Apartments | 42 | 4.7% |
| 5 to 9 Unit Apartments | 43 | 4.8% |
| 10 or more Apartments | 23 | 2.6% |
| Mobile Home / Other | 0 | 0.0% |
| Total | 899 | 100.0% |
Housing Structures by Occupancy in La Porte City
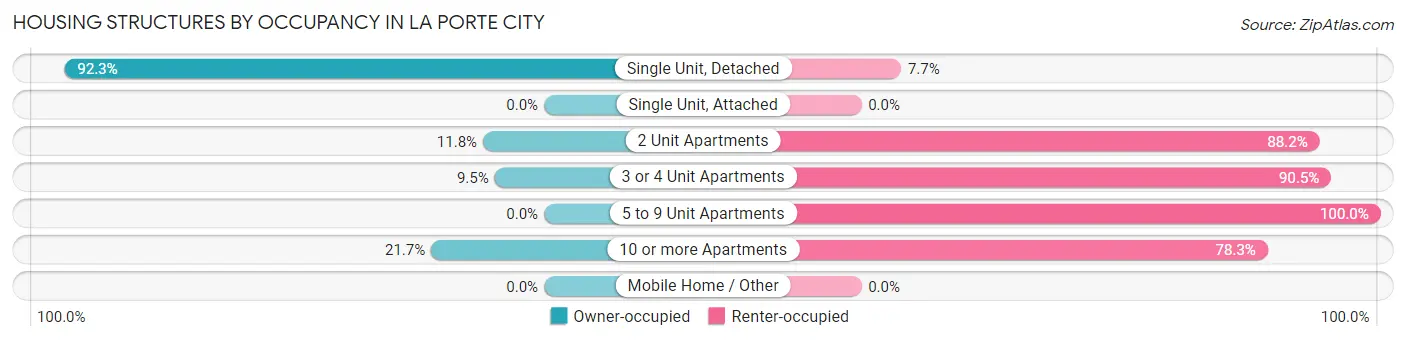
| Structure Type | Owner-occupied | Renter-occupied |
| Single Unit, Detached | 699 (92.3%) | 58 (7.7%) |
| Single Unit, Attached | 0 (0.0%) | 0 (0.0%) |
| 2 Unit Apartments | 4 (11.8%) | 30 (88.2%) |
| 3 or 4 Unit Apartments | 4 (9.5%) | 38 (90.5%) |
| 5 to 9 Unit Apartments | 0 (0.0%) | 43 (100.0%) |
| 10 or more Apartments | 5 (21.7%) | 18 (78.3%) |
| Mobile Home / Other | 0 (0.0%) | 0 (0.0%) |
| Total | 712 (79.2%) | 187 (20.8%) |
Housing Structures by Number of Rooms in La Porte City
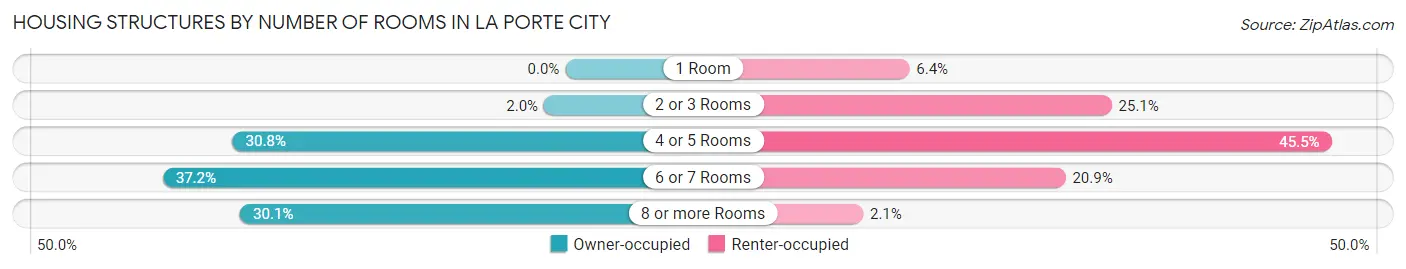
| Number of Rooms | Owner-occupied | Renter-occupied |
| 1 Room | 0 (0.0%) | 12 (6.4%) |
| 2 or 3 Rooms | 14 (2.0%) | 47 (25.1%) |
| 4 or 5 Rooms | 219 (30.8%) | 85 (45.5%) |
| 6 or 7 Rooms | 265 (37.2%) | 39 (20.9%) |
| 8 or more Rooms | 214 (30.1%) | 4 (2.1%) |
| Total | 712 (100.0%) | 187 (100.0%) |
Housing Structure by Heating Type in La Porte City
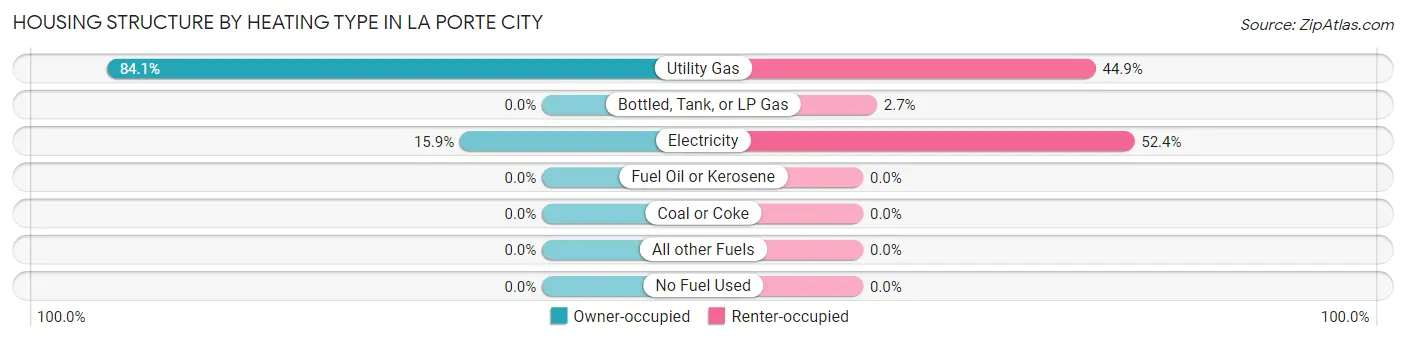
| Heating Type | Owner-occupied | Renter-occupied |
| Utility Gas | 599 (84.1%) | 84 (44.9%) |
| Bottled, Tank, or LP Gas | 0 (0.0%) | 5 (2.7%) |
| Electricity | 113 (15.9%) | 98 (52.4%) |
| Fuel Oil or Kerosene | 0 (0.0%) | 0 (0.0%) |
| Coal or Coke | 0 (0.0%) | 0 (0.0%) |
| All other Fuels | 0 (0.0%) | 0 (0.0%) |
| No Fuel Used | 0 (0.0%) | 0 (0.0%) |
| Total | 712 (100.0%) | 187 (100.0%) |
Household Vehicle Usage in La Porte City
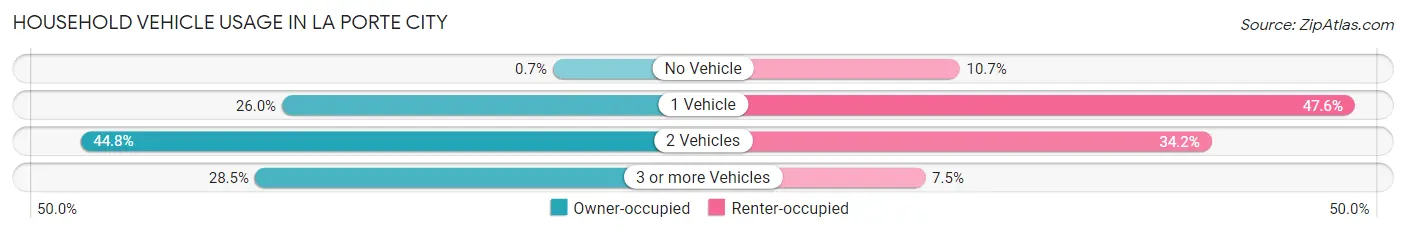
| Vehicles per Household | Owner-occupied | Renter-occupied |
| No Vehicle | 5 (0.7%) | 20 (10.7%) |
| 1 Vehicle | 185 (26.0%) | 89 (47.6%) |
| 2 Vehicles | 319 (44.8%) | 64 (34.2%) |
| 3 or more Vehicles | 203 (28.5%) | 14 (7.5%) |
| Total | 712 (100.0%) | 187 (100.0%) |
Real Estate & Mortgages in La Porte City
Real Estate and Mortgage Overview in La Porte City
| Characteristic | Without Mortgage | With Mortgage |
| Housing Units | 229 | 483 |
| Median Property Value | $142,300 | $138,200 |
| Median Household Income | $62,679 | $83 |
| Monthly Housing Costs | $508 | $4 |
| Real Estate Taxes | $2,414 | $0 |
Property Value by Mortgage Status in La Porte City
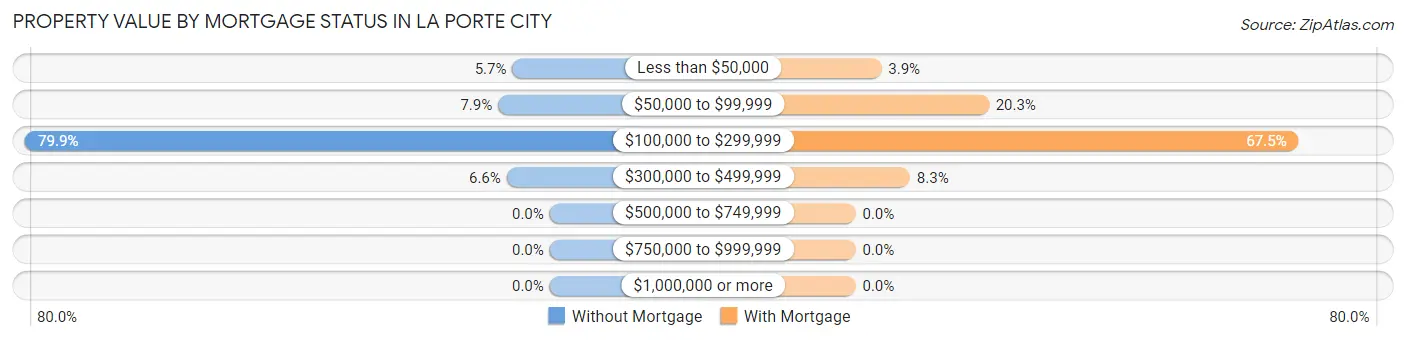
| Property Value | Without Mortgage | With Mortgage |
| Less than $50,000 | 13 (5.7%) | 19 (3.9%) |
| $50,000 to $99,999 | 18 (7.9%) | 98 (20.3%) |
| $100,000 to $299,999 | 183 (79.9%) | 326 (67.5%) |
| $300,000 to $499,999 | 15 (6.6%) | 40 (8.3%) |
| $500,000 to $749,999 | 0 (0.0%) | 0 (0.0%) |
| $750,000 to $999,999 | 0 (0.0%) | 0 (0.0%) |
| $1,000,000 or more | 0 (0.0%) | 0 (0.0%) |
| Total | 229 (100.0%) | 483 (100.0%) |
Household Income by Mortgage Status in La Porte City
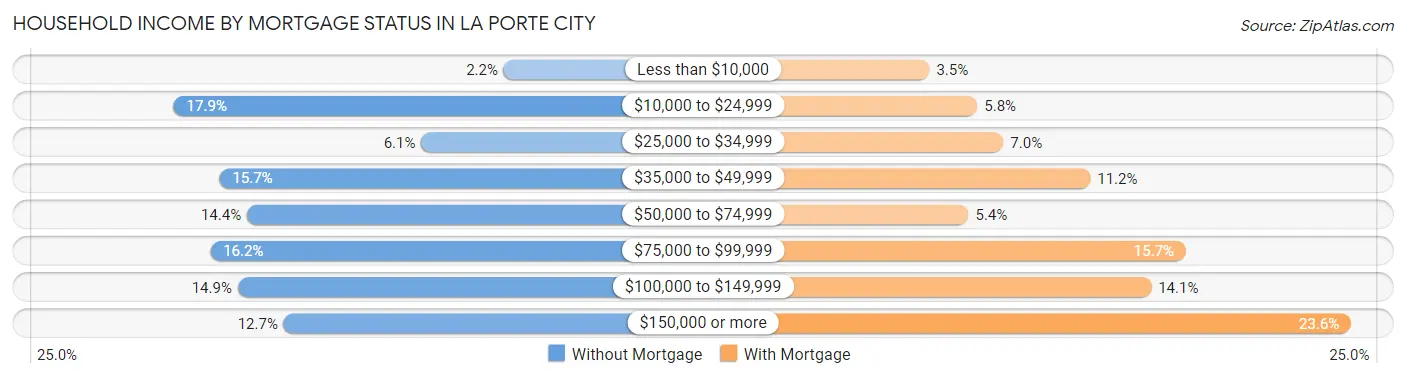
| Household Income | Without Mortgage | With Mortgage |
| Less than $10,000 | 5 (2.2%) | 17 (3.5%) |
| $10,000 to $24,999 | 41 (17.9%) | 28 (5.8%) |
| $25,000 to $34,999 | 14 (6.1%) | 34 (7.0%) |
| $35,000 to $49,999 | 36 (15.7%) | 54 (11.2%) |
| $50,000 to $74,999 | 33 (14.4%) | 26 (5.4%) |
| $75,000 to $99,999 | 37 (16.2%) | 76 (15.7%) |
| $100,000 to $149,999 | 34 (14.8%) | 68 (14.1%) |
| $150,000 or more | 29 (12.7%) | 114 (23.6%) |
| Total | 229 (100.0%) | 483 (100.0%) |
Property Value to Household Income Ratio in La Porte City
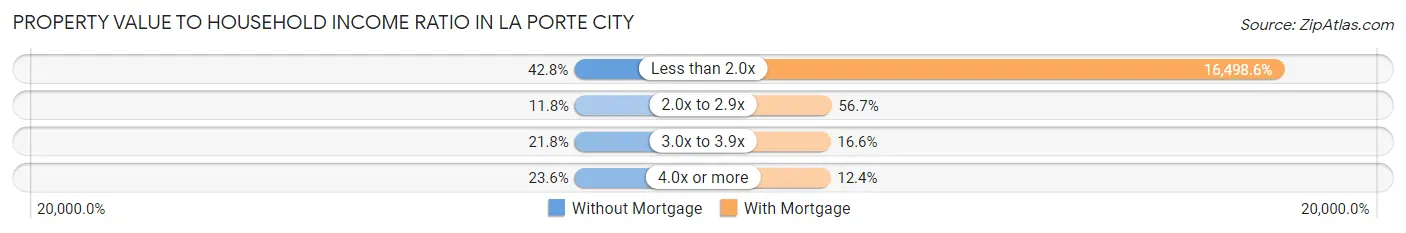
| Value-to-Income Ratio | Without Mortgage | With Mortgage |
| Less than 2.0x | 98 (42.8%) | 79,688 (16,498.6%) |
| 2.0x to 2.9x | 27 (11.8%) | 274 (56.7%) |
| 3.0x to 3.9x | 50 (21.8%) | 80 (16.6%) |
| 4.0x or more | 54 (23.6%) | 60 (12.4%) |
| Total | 229 (100.0%) | 483 (100.0%) |
Real Estate Taxes by Mortgage Status in La Porte City

| Property Taxes | Without Mortgage | With Mortgage |
| Less than $800 | 23 (10.0%) | 0 (0.0%) |
| $800 to $1,499 | 39 (17.0%) | 3 (0.6%) |
| $800 to $1,499 | 148 (64.6%) | 116 (24.0%) |
| Total | 229 (100.0%) | 483 (100.0%) |
Health & Disability in La Porte City
Health Insurance Coverage by Age in La Porte City
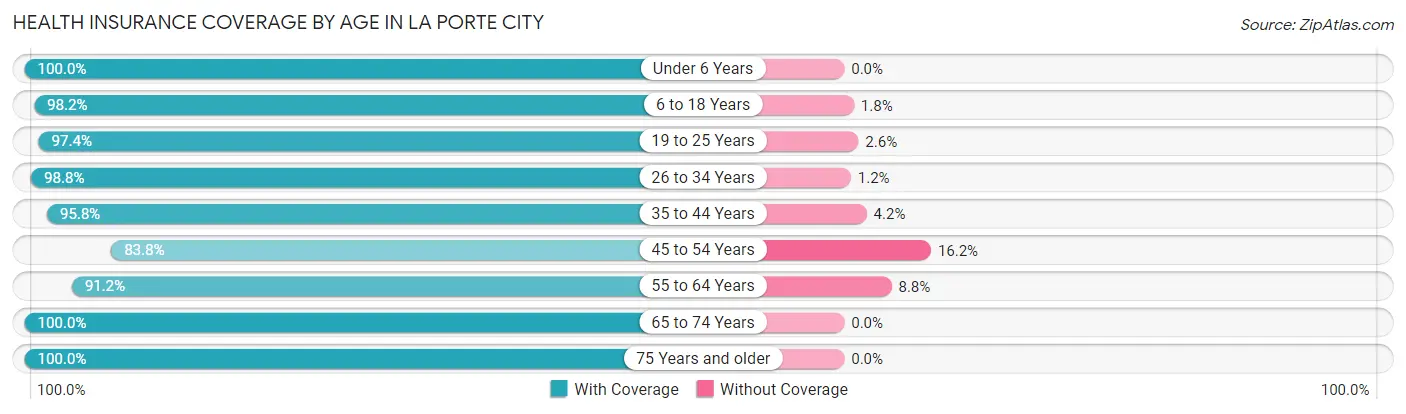
| Age Bracket | With Coverage | Without Coverage |
| Under 6 Years | 188 (100.0%) | 0 (0.0%) |
| 6 to 18 Years | 548 (98.2%) | 10 (1.8%) |
| 19 to 25 Years | 185 (97.4%) | 5 (2.6%) |
| 26 to 34 Years | 323 (98.8%) | 4 (1.2%) |
| 35 to 44 Years | 253 (95.8%) | 11 (4.2%) |
| 45 to 54 Years | 192 (83.8%) | 37 (16.2%) |
| 55 to 64 Years | 207 (91.2%) | 20 (8.8%) |
| 65 to 74 Years | 190 (100.0%) | 0 (0.0%) |
| 75 Years and older | 130 (100.0%) | 0 (0.0%) |
| Total | 2,216 (96.2%) | 87 (3.8%) |
Health Insurance Coverage by Citizenship Status in La Porte City

| Citizenship Status | With Coverage | Without Coverage |
| Native Born | 188 (100.0%) | 0 (0.0%) |
| Foreign Born, Citizen | 548 (98.2%) | 10 (1.8%) |
| Foreign Born, not a Citizen | 185 (97.4%) | 5 (2.6%) |
Health Insurance Coverage by Household Income in La Porte City

| Household Income | With Coverage | Without Coverage |
| Under $25,000 | 268 (100.0%) | 0 (0.0%) |
| $25,000 to $49,999 | 426 (89.7%) | 49 (10.3%) |
| $50,000 to $74,999 | 284 (94.0%) | 18 (6.0%) |
| $75,000 to $99,999 | 280 (93.3%) | 20 (6.7%) |
| $100,000 and over | 958 (100.0%) | 0 (0.0%) |
Public vs Private Health Insurance Coverage by Age in La Porte City
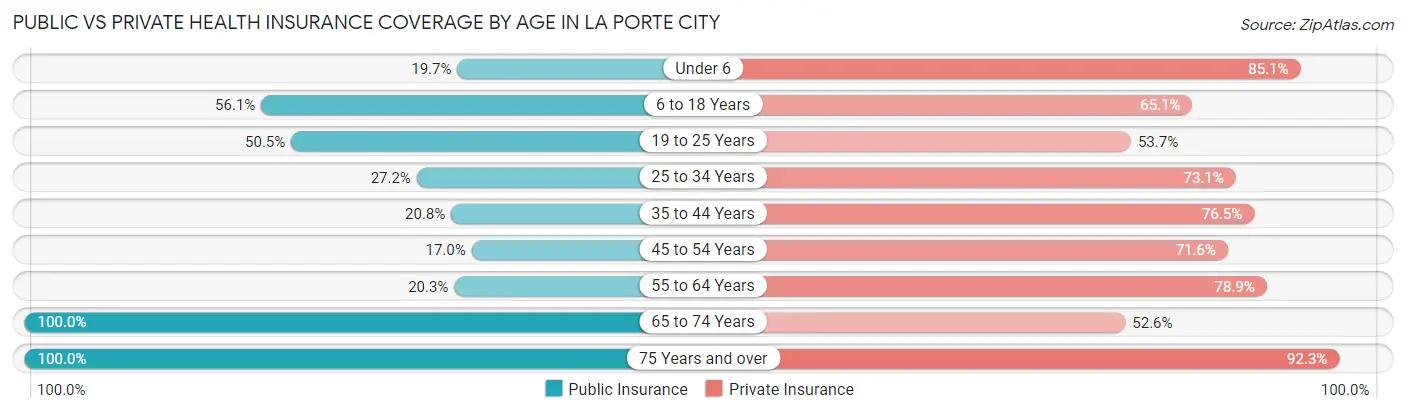
| Age Bracket | Public Insurance | Private Insurance |
| Under 6 | 37 (19.7%) | 160 (85.1%) |
| 6 to 18 Years | 313 (56.1%) | 363 (65.0%) |
| 19 to 25 Years | 96 (50.5%) | 102 (53.7%) |
| 25 to 34 Years | 89 (27.2%) | 239 (73.1%) |
| 35 to 44 Years | 55 (20.8%) | 202 (76.5%) |
| 45 to 54 Years | 39 (17.0%) | 164 (71.6%) |
| 55 to 64 Years | 46 (20.3%) | 179 (78.8%) |
| 65 to 74 Years | 190 (100.0%) | 100 (52.6%) |
| 75 Years and over | 130 (100.0%) | 120 (92.3%) |
| Total | 995 (43.2%) | 1,629 (70.7%) |
Disability Status by Sex by Age in La Porte City
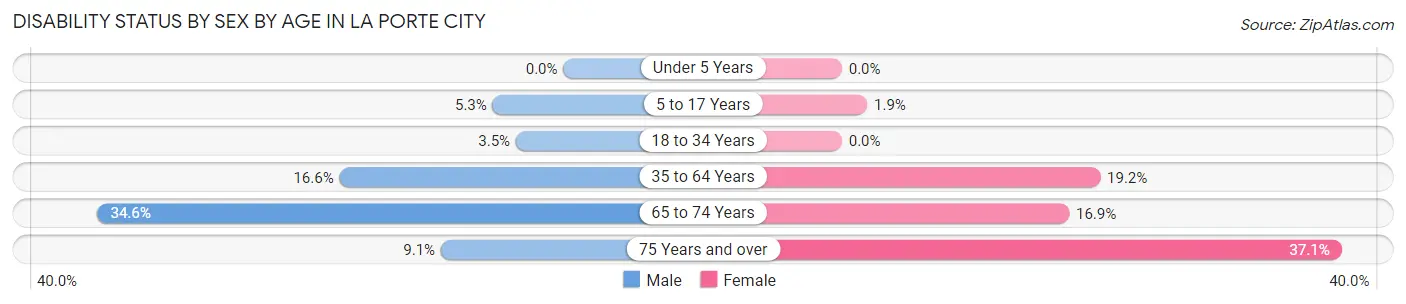
| Age Bracket | Male | Female |
| Under 5 Years | 0 (0.0%) | 0 (0.0%) |
| 5 to 17 Years | 17 (5.2%) | 5 (1.9%) |
| 18 to 34 Years | 10 (3.5%) | 0 (0.0%) |
| 35 to 64 Years | 59 (16.6%) | 70 (19.2%) |
| 65 to 74 Years | 37 (34.6%) | 14 (16.9%) |
| 75 Years and over | 3 (9.1%) | 36 (37.1%) |
Disability Class by Sex by Age in La Porte City
Disability Class: Hearing Difficulty
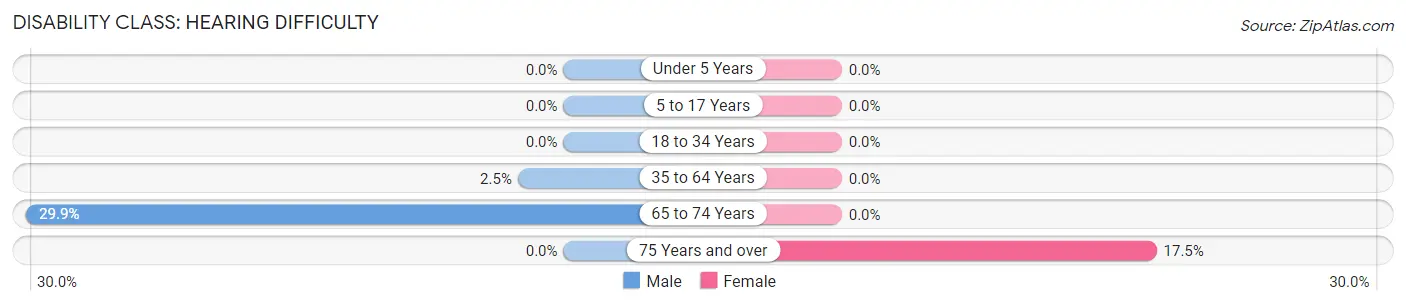
| Age Bracket | Male | Female |
| Under 5 Years | 0 (0.0%) | 0 (0.0%) |
| 5 to 17 Years | 0 (0.0%) | 0 (0.0%) |
| 18 to 34 Years | 0 (0.0%) | 0 (0.0%) |
| 35 to 64 Years | 9 (2.5%) | 0 (0.0%) |
| 65 to 74 Years | 32 (29.9%) | 0 (0.0%) |
| 75 Years and over | 0 (0.0%) | 17 (17.5%) |
Disability Class: Vision Difficulty
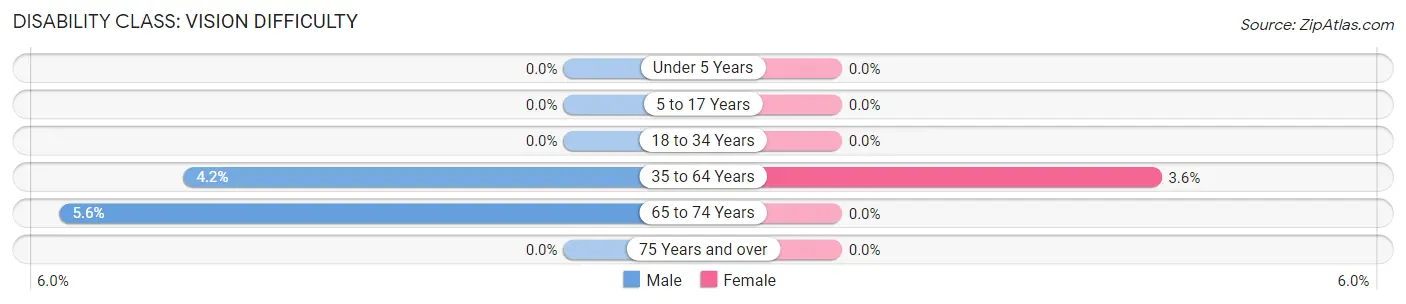
| Age Bracket | Male | Female |
| Under 5 Years | 0 (0.0%) | 0 (0.0%) |
| 5 to 17 Years | 0 (0.0%) | 0 (0.0%) |
| 18 to 34 Years | 0 (0.0%) | 0 (0.0%) |
| 35 to 64 Years | 15 (4.2%) | 13 (3.6%) |
| 65 to 74 Years | 6 (5.6%) | 0 (0.0%) |
| 75 Years and over | 0 (0.0%) | 0 (0.0%) |
Disability Class: Cognitive Difficulty
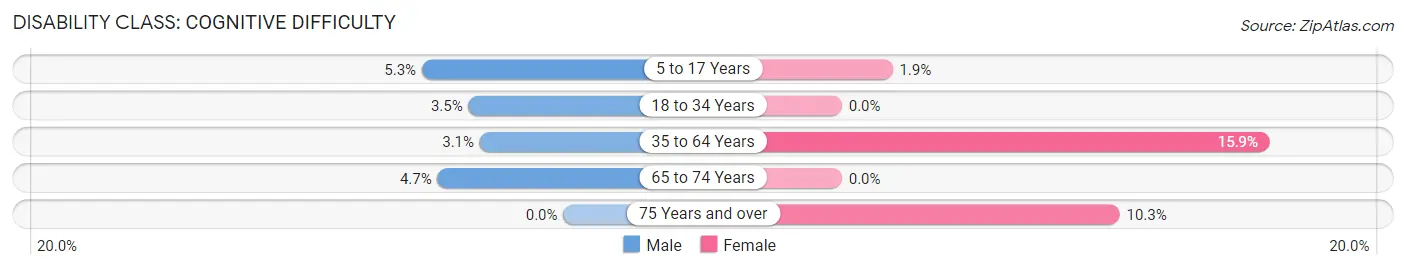
| Age Bracket | Male | Female |
| 5 to 17 Years | 17 (5.2%) | 5 (1.9%) |
| 18 to 34 Years | 10 (3.5%) | 0 (0.0%) |
| 35 to 64 Years | 11 (3.1%) | 58 (15.9%) |
| 65 to 74 Years | 5 (4.7%) | 0 (0.0%) |
| 75 Years and over | 0 (0.0%) | 10 (10.3%) |
Disability Class: Ambulatory Difficulty
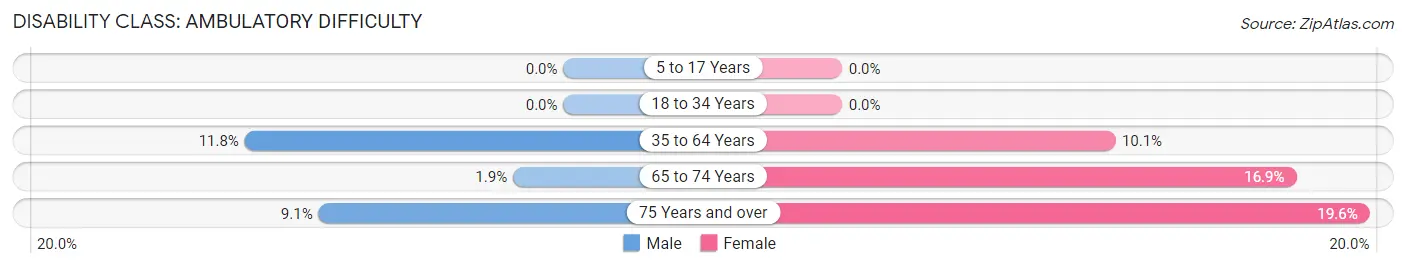
| Age Bracket | Male | Female |
| 5 to 17 Years | 0 (0.0%) | 0 (0.0%) |
| 18 to 34 Years | 0 (0.0%) | 0 (0.0%) |
| 35 to 64 Years | 42 (11.8%) | 37 (10.1%) |
| 65 to 74 Years | 2 (1.9%) | 14 (16.9%) |
| 75 Years and over | 3 (9.1%) | 19 (19.6%) |
Disability Class: Self-Care Difficulty

| Age Bracket | Male | Female |
| 5 to 17 Years | 0 (0.0%) | 0 (0.0%) |
| 18 to 34 Years | 0 (0.0%) | 0 (0.0%) |
| 35 to 64 Years | 11 (3.1%) | 5 (1.4%) |
| 65 to 74 Years | 0 (0.0%) | 5 (6.0%) |
| 75 Years and over | 0 (0.0%) | 19 (19.6%) |
Technology Access in La Porte City
Computing Device Access in La Porte City
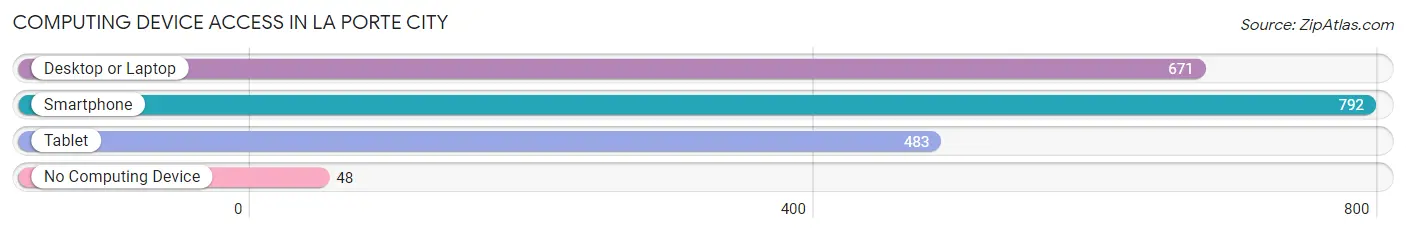
| Device Type | # Households | % Households |
| Desktop or Laptop | 671 | 74.6% |
| Smartphone | 792 | 88.1% |
| Tablet | 483 | 53.7% |
| No Computing Device | 48 | 5.3% |
| Total | 899 | 100.0% |
Internet Access in La Porte City
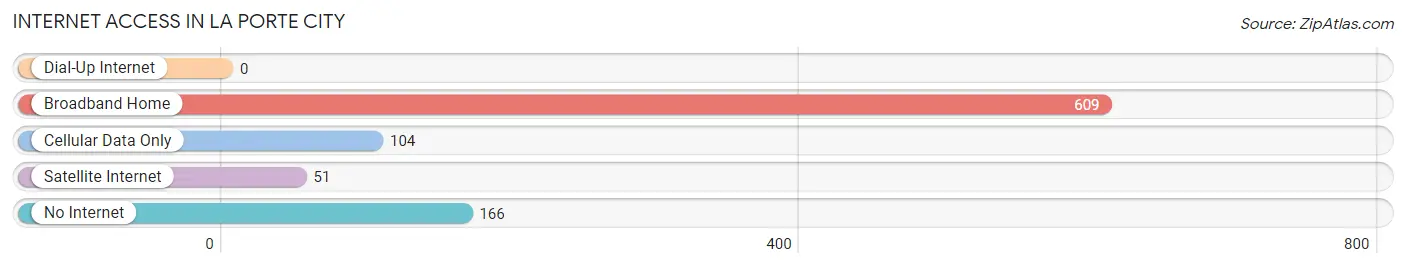
| Internet Type | # Households | % Households |
| Dial-Up Internet | 0 | 0.0% |
| Broadband Home | 609 | 67.7% |
| Cellular Data Only | 104 | 11.6% |
| Satellite Internet | 51 | 5.7% |
| No Internet | 166 | 18.5% |
| Total | 899 | 100.0% |
La Porte City Summary
Porte City, Iowa is a small city located in Black Hawk County, Iowa. It is situated on the banks of the Cedar River, approximately 10 miles north of Waterloo. The city has a population of 2,231 as of the 2010 census, making it the smallest city in Black Hawk County.
History
Porte City was founded in 1855 by a group of settlers from Pennsylvania. The city was named after the nearby Cedar River, which was known as the “Porte” or “Gate” River by the Native Americans who lived in the area. The settlers built a sawmill and a grist mill, which were the first industries in the area. The city was incorporated in 1876.
In the late 19th century, Porte City was a thriving industrial center. The city was home to several factories, including a woolen mill, a flour mill, a brickyard, and a furniture factory. The city also had a large lumber industry, which supplied lumber to the surrounding area.
In the early 20th century, Porte City experienced a period of decline. The factories closed and the population decreased. However, the city was able to rebound in the 1950s and 1960s, thanks to the construction of a new dam on the Cedar River. The dam provided the city with a reliable source of electricity and allowed for the development of new industries.
Geography
Porte City is located in Black Hawk County, Iowa. It is situated on the banks of the Cedar River, approximately 10 miles north of Waterloo. The city has a total area of 1.3 square miles, all of which is land. The city is located in a flat, open area, with no major hills or mountains.
The climate in Porte City is humid continental, with hot summers and cold winters. The average temperature in the summer is around 75 degrees Fahrenheit, while the average temperature in the winter is around 25 degrees Fahrenheit. The city receives an average of 33 inches of precipitation per year.
Economy
The economy of Porte City is largely based on agriculture and manufacturing. The city is home to several factories, including a furniture factory, a plastics factory, and a food processing plant. The city also has a large lumber industry, which supplies lumber to the surrounding area.
The city also has a growing tourism industry. The city is home to several parks and recreational areas, including the Cedar River State Park and the Porte City Nature Center. The city also hosts several festivals and events throughout the year, including the Porte City Summer Festival and the Porte City Fall Festival.
Demographics
As of the 2010 census, the population of Porte City was 2,231. The racial makeup of the city was 97.3% White, 0.7% African American, 0.3% Native American, 0.3% Asian, 0.2% from other races, and 1.3% from two or more races. Hispanic or Latino of any race were 1.2% of the population.
The median household income in Porte City was $41,944, and the median family income was $50,938. The per capita income for the city was $20,845. About 8.3% of families and 10.2% of the population were below the poverty line, including 14.2% of those under age 18 and 6.2% of those age 65 or over.
Common Questions
What is Per Capita Income in La Porte City?
Per Capita income in La Porte City is $30,627.
What is the Median Family Income in La Porte City?
Median Family Income in La Porte City is $90,833.
What is the Median Household income in La Porte City?
Median Household Income in La Porte City is $65,451.
What is Income or Wage Gap in La Porte City?
Income or Wage Gap in La Porte City is 23.4%.
Women in La Porte City earn 76.6 cents for every dollar earned by a man.
What is Inequality or Gini Index in La Porte City?
Inequality or Gini Index in La Porte City is 0.41.
What is the Total Population of La Porte City?
Total Population of La Porte City is 2,347.
What is the Total Male Population of La Porte City?
Total Male Population of La Porte City is 1,195.
What is the Total Female Population of La Porte City?
Total Female Population of La Porte City is 1,152.
What is the Ratio of Males per 100 Females in La Porte City?
There are 103.73 Males per 100 Females in La Porte City.
What is the Ratio of Females per 100 Males in La Porte City?
There are 96.40 Females per 100 Males in La Porte City.
What is the Median Population Age in La Porte City?
Median Population Age in La Porte City is 32.6 Years.
What is the Average Family Size in La Porte City
Average Family Size in La Porte City is 3.3 People.
What is the Average Household Size in La Porte City
Average Household Size in La Porte City is 2.6 People.
How Large is the Labor Force in La Porte City?
There are 1,159 People in the Labor Forcein in La Porte City.
What is the Percentage of People in the Labor Force in La Porte City?
69.3% of People are in the Labor Force in La Porte City.
What is the Unemployment Rate in La Porte City?
Unemployment Rate in La Porte City is 1.8%.