Kinross, IA Map & Demographics
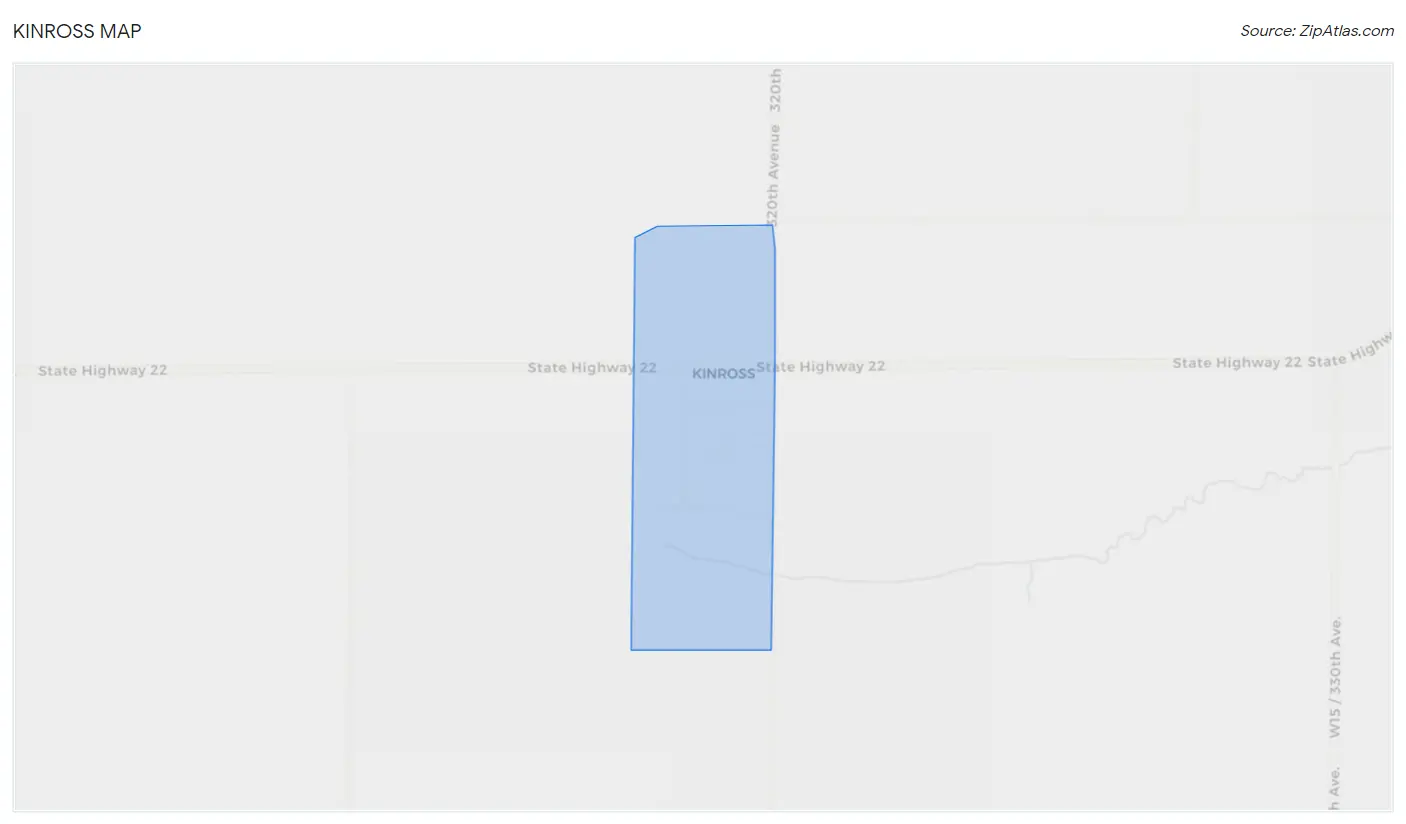
Kinross Map
Kinross Overview
$18,480
PER CAPITA INCOME
$77,813
AVG FAMILY INCOME
0.44
INEQUALITY / GINI INDEX
104
TOTAL POPULATION
58
MALE POPULATION
46
FEMALE POPULATION
126.09
MALES / 100 FEMALES
79.31
FEMALES / 100 MALES
31.8
MEDIAN AGE
4.0
AVG FAMILY SIZE
3.1
AVG HOUSEHOLD SIZE
34
LABOR FORCE [ PEOPLE ]
52.3%
PERCENT IN LABOR FORCE
8.8%
UNEMPLOYMENT RATE
Kinross Area Codes
Income in Kinross
Income Overview in Kinross
| Characteristic | Number | Measure |
| Per Capita Income | 104 | $18,480 |
| Median Family Income | 21 | $77,813 |
| Mean Family Income | 21 | $80,205 |
| Median Household Income | 34 | $0 |
| Mean Household Income | 34 | $58,112 |
| Income Deficit | 21 | $0 |
| Wage / Income Gap (%) | 104 | 0.00% |
| Wage / Income Gap ($) | 104 | 100.00¢ per $1 |
| Gini / Inequality Index | 104 | 0.44 |
Earnings by Sex in Kinross
| Sex | Number | Average Earnings |
| Male | 25 (56.8%) | $0 |
| Female | 19 (43.2%) | $0 |
| Total | 44 (100.0%) | $0 |
Earnings by Sex by Income Bracket in Kinross
The most common earnings brackets in Kinross are $2,499 or less for men (10 | 40.0%) and $50,000 to $54,999 for women (4 | 21.0%).
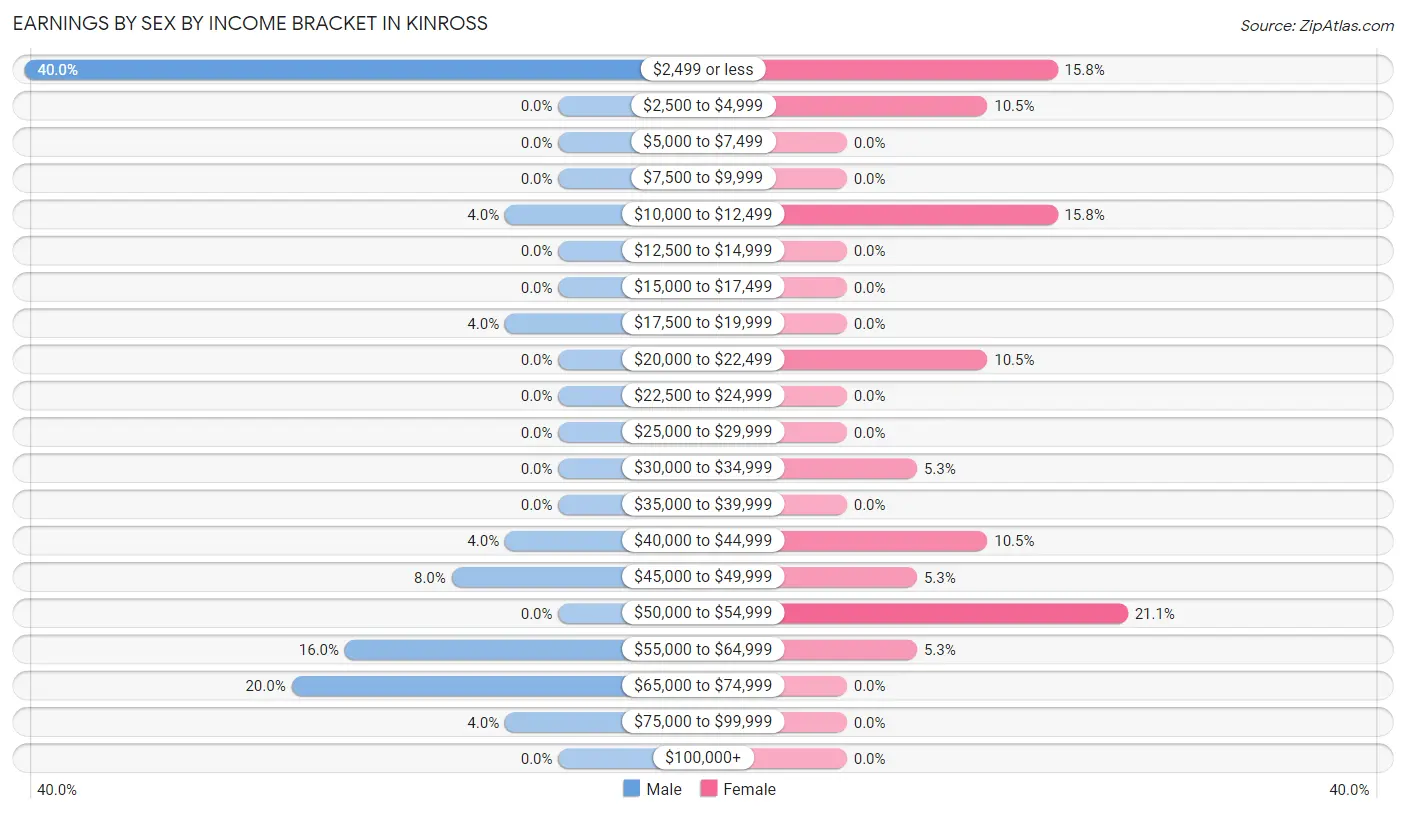
| Income | Male | Female |
| $2,499 or less | 10 (40.0%) | 3 (15.8%) |
| $2,500 to $4,999 | 0 (0.0%) | 2 (10.5%) |
| $5,000 to $7,499 | 0 (0.0%) | 0 (0.0%) |
| $7,500 to $9,999 | 0 (0.0%) | 0 (0.0%) |
| $10,000 to $12,499 | 1 (4.0%) | 3 (15.8%) |
| $12,500 to $14,999 | 0 (0.0%) | 0 (0.0%) |
| $15,000 to $17,499 | 0 (0.0%) | 0 (0.0%) |
| $17,500 to $19,999 | 1 (4.0%) | 0 (0.0%) |
| $20,000 to $22,499 | 0 (0.0%) | 2 (10.5%) |
| $22,500 to $24,999 | 0 (0.0%) | 0 (0.0%) |
| $25,000 to $29,999 | 0 (0.0%) | 0 (0.0%) |
| $30,000 to $34,999 | 0 (0.0%) | 1 (5.3%) |
| $35,000 to $39,999 | 0 (0.0%) | 0 (0.0%) |
| $40,000 to $44,999 | 1 (4.0%) | 2 (10.5%) |
| $45,000 to $49,999 | 2 (8.0%) | 1 (5.3%) |
| $50,000 to $54,999 | 0 (0.0%) | 4 (21.0%) |
| $55,000 to $64,999 | 4 (16.0%) | 1 (5.3%) |
| $65,000 to $74,999 | 5 (20.0%) | 0 (0.0%) |
| $75,000 to $99,999 | 1 (4.0%) | 0 (0.0%) |
| $100,000+ | 0 (0.0%) | 0 (0.0%) |
| Total | 25 (100.0%) | 19 (100.0%) |
Earnings by Sex by Educational Attainment in Kinross
| Educational Attainment | Male Income | Female Income |
| Less than High School | - | - |
| High School Diploma | - | - |
| College or Associate's Degree | - | - |
| Bachelor's Degree | - | - |
| Graduate Degree | - | - |
| Total | - | - |
Family Income in Kinross
Family Income Brackets in Kinross
According to the Kinross family income data, there are 6 families falling into the $100,000 to $149,999 income range, which is the most common income bracket and makes up 28.6% of all families.
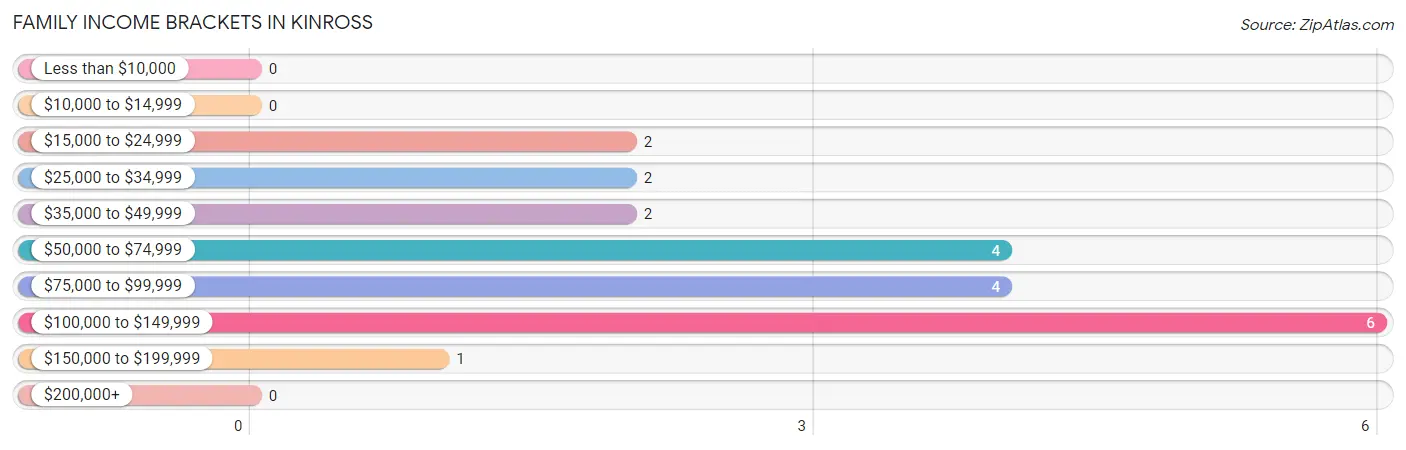
| Income Bracket | # Families | % Families |
| Less than $10,000 | 0 | 0.0% |
| $10,000 to $14,999 | 0 | 0.0% |
| $15,000 to $24,999 | 2 | 9.5% |
| $25,000 to $34,999 | 2 | 9.5% |
| $35,000 to $49,999 | 2 | 9.5% |
| $50,000 to $74,999 | 4 | 19.0% |
| $75,000 to $99,999 | 4 | 19.0% |
| $100,000 to $149,999 | 6 | 28.6% |
| $150,000 to $199,999 | 1 | 4.8% |
| $200,000+ | 0 | 0.0% |
Family Income by Famaliy Size in Kinross
2-person families (11 | 52.4%) account for the highest median family income in Kinross with $46,875 per family, while 2-person families (11 | 52.4%) have the highest median income of $23,438 per family member.
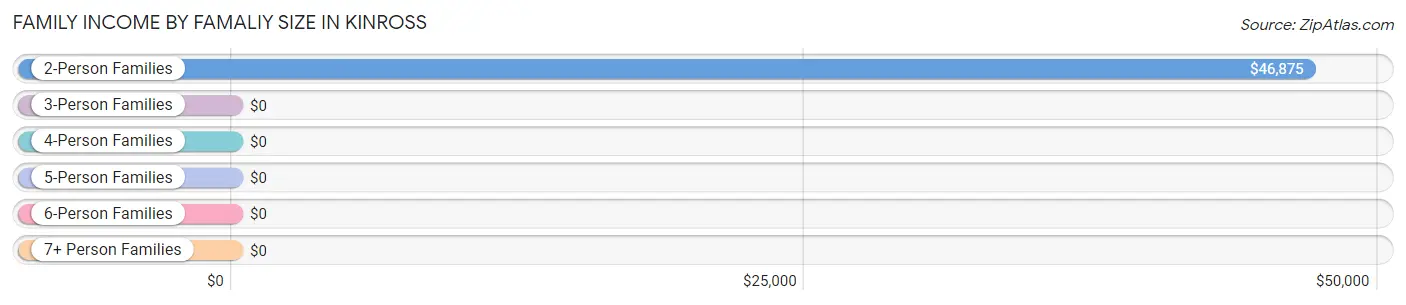
| Income Bracket | # Families | Median Income |
| 2-Person Families | 11 (52.4%) | $46,875 |
| 3-Person Families | 5 (23.8%) | $0 |
| 4-Person Families | 0 (0.0%) | $0 |
| 5-Person Families | 0 (0.0%) | $0 |
| 6-Person Families | 4 (19.1%) | $0 |
| 7+ Person Families | 1 (4.8%) | $0 |
| Total | 21 (100.0%) | $77,813 |
Family Income by Number of Earners in Kinross
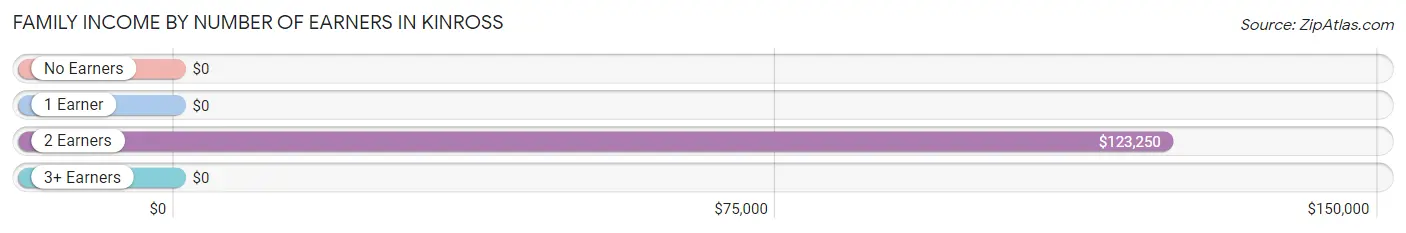
| Number of Earners | # Families | Median Income |
| No Earners | 3 (14.3%) | $0 |
| 1 Earner | 10 (47.6%) | $0 |
| 2 Earners | 7 (33.3%) | $123,250 |
| 3+ Earners | 1 (4.8%) | $0 |
| Total | 21 (100.0%) | $77,813 |
Household Income in Kinross
Household Income Brackets in Kinross
With 13 households falling in the category, the $10,000 to $14,999 income range is the most frequent in Kinross, accounting for 38.2% of all households.
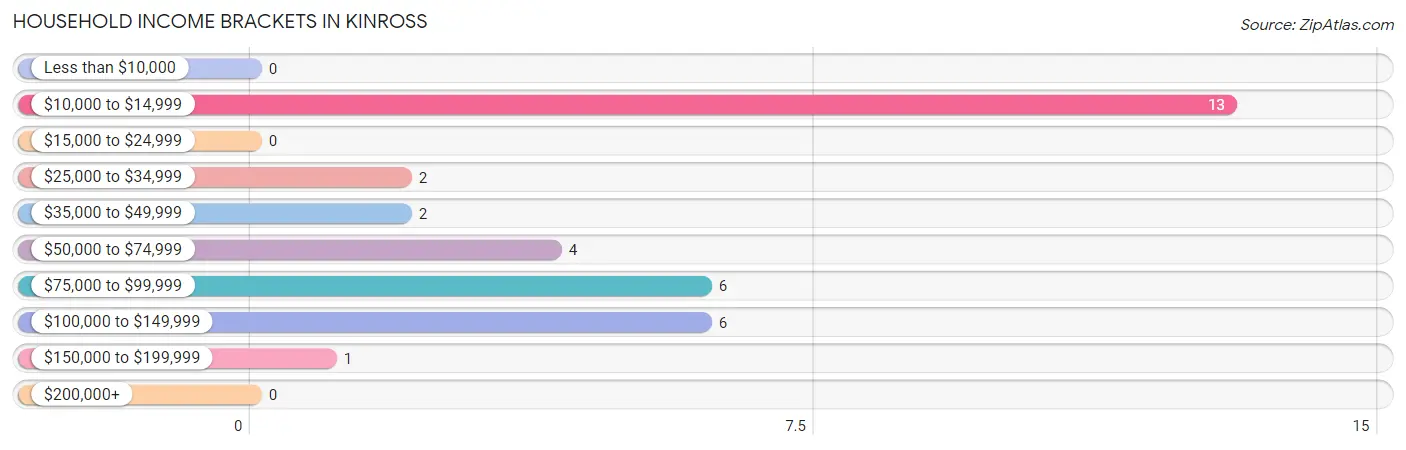
| Income Bracket | # Households | % Households |
| Less than $10,000 | 0 | 0.0% |
| $10,000 to $14,999 | 13 | 38.2% |
| $15,000 to $24,999 | 0 | 0.0% |
| $25,000 to $34,999 | 2 | 5.9% |
| $35,000 to $49,999 | 2 | 5.9% |
| $50,000 to $74,999 | 4 | 11.8% |
| $75,000 to $99,999 | 6 | 17.6% |
| $100,000 to $149,999 | 6 | 17.6% |
| $150,000 to $199,999 | 1 | 2.9% |
| $200,000+ | 0 | 0.0% |
Household Income by Householder Age in Kinross
The median household income in Kinross is $0, with the highest median household income of $96,250 found in the 25 to 44 years age bracket for the primary householder. A total of 12 households (35.3%) fall into this category.
| Income Bracket | # Households | Median Income |
| 15 to 24 Years | 0 (0.0%) | $0 |
| 25 to 44 Years | 12 (35.3%) | $96,250 |
| 45 to 64 Years | 5 (14.7%) | $38,125 |
| 65+ Years | 17 (50.0%) | $0 |
| Total | 34 (100.0%) | $0 |
Poverty in Kinross
Income Below Poverty by Sex and Age in Kinross
| Age Bracket | Male | Female |
| Under 5 Years | 0 (0.0%) | 0 (0.0%) |
| 5 Years | 0 (0.0%) | 0 (0.0%) |
| 6 to 11 Years | 0 (0.0%) | 0 (0.0%) |
| 12 to 14 Years | 0 (0.0%) | 0 (0.0%) |
| 15 Years | 0 (0.0%) | 0 (0.0%) |
| 16 and 17 Years | 0 (0.0%) | 0 (0.0%) |
| 18 to 24 Years | 0 (0.0%) | 0 (0.0%) |
| 25 to 34 Years | 0 (0.0%) | 0 (0.0%) |
| 35 to 44 Years | 0 (0.0%) | 0 (0.0%) |
| 45 to 54 Years | 0 (0.0%) | 0 (0.0%) |
| 55 to 64 Years | 0 (0.0%) | 0 (0.0%) |
| 65 to 74 Years | 13 (92.9%) | 0 (0.0%) |
| 75 Years and over | 0 (0.0%) | 0 (0.0%) |
| Total | 13 (24.1%) | 0 (0.0%) |
Income Above Poverty by Sex and Age in Kinross
According to the poverty statistics in Kinross, males aged under 5 years and females aged under 5 years are the age groups that are most secure financially, with 100.0% of males and 100.0% of females in these age groups living above the poverty line.
| Age Bracket | Male | Female |
| Under 5 Years | 5 (100.0%) | 2 (100.0%) |
| 5 Years | 0 (0.0%) | 0 (0.0%) |
| 6 to 11 Years | 11 (100.0%) | 14 (100.0%) |
| 12 to 14 Years | 3 (100.0%) | 0 (0.0%) |
| 15 Years | 0 (0.0%) | 0 (0.0%) |
| 16 and 17 Years | 2 (100.0%) | 0 (0.0%) |
| 18 to 24 Years | 0 (0.0%) | 2 (100.0%) |
| 25 to 34 Years | 5 (100.0%) | 9 (100.0%) |
| 35 to 44 Years | 8 (100.0%) | 6 (100.0%) |
| 45 to 54 Years | 1 (100.0%) | 6 (100.0%) |
| 55 to 64 Years | 2 (100.0%) | 2 (100.0%) |
| 65 to 74 Years | 1 (7.1%) | 2 (100.0%) |
| 75 Years and over | 3 (100.0%) | 3 (100.0%) |
| Total | 41 (75.9%) | 46 (100.0%) |
Income Below Poverty Among Married-Couple Families in Kinross
| Children | Above Poverty | Below Poverty |
| No Children | 7 (100.0%) | 0 (0.0%) |
| 1 or 2 Children | 6 (100.0%) | 0 (0.0%) |
| 3 or 4 Children | 4 (100.0%) | 0 (0.0%) |
| 5 or more Children | 0 (0.0%) | 0 (0.0%) |
| Total | 17 (100.0%) | 0 (0.0%) |
Income Below Poverty Among Single-Parent Households in Kinross
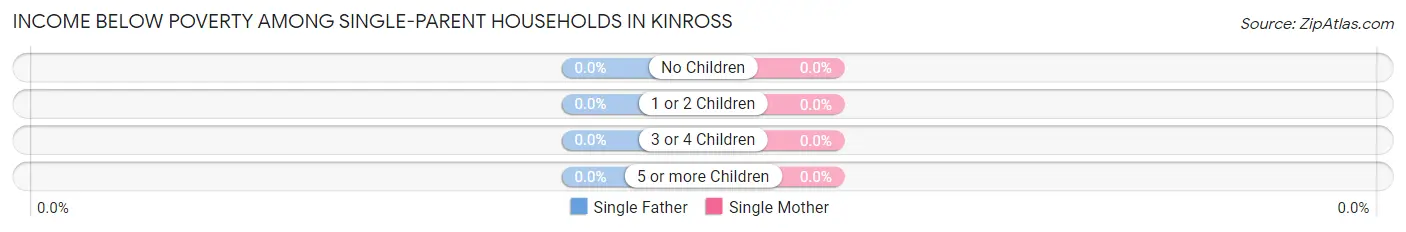
| Children | Single Father | Single Mother |
| No Children | 0 (0.0%) | 0 (0.0%) |
| 1 or 2 Children | 0 (0.0%) | 0 (0.0%) |
| 3 or 4 Children | 0 (0.0%) | 0 (0.0%) |
| 5 or more Children | 0 (0.0%) | 0 (0.0%) |
| Total | 0 (0.0%) | 0 (0.0%) |
Income Below Poverty Among Married-Couple vs Single-Parent Households in Kinross
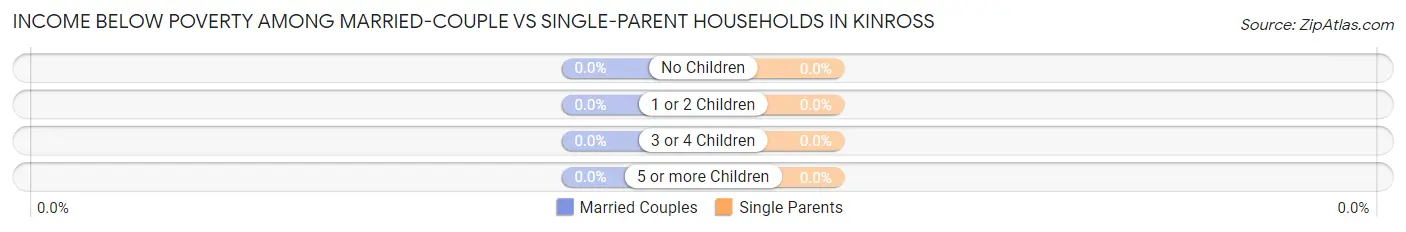
| Children | Married-Couple Families | Single-Parent Households |
| No Children | 0 (0.0%) | 0 (0.0%) |
| 1 or 2 Children | 0 (0.0%) | 0 (0.0%) |
| 3 or 4 Children | 0 (0.0%) | 0 (0.0%) |
| 5 or more Children | 0 (0.0%) | 0 (0.0%) |
| Total | 0 (0.0%) | 0 (0.0%) |
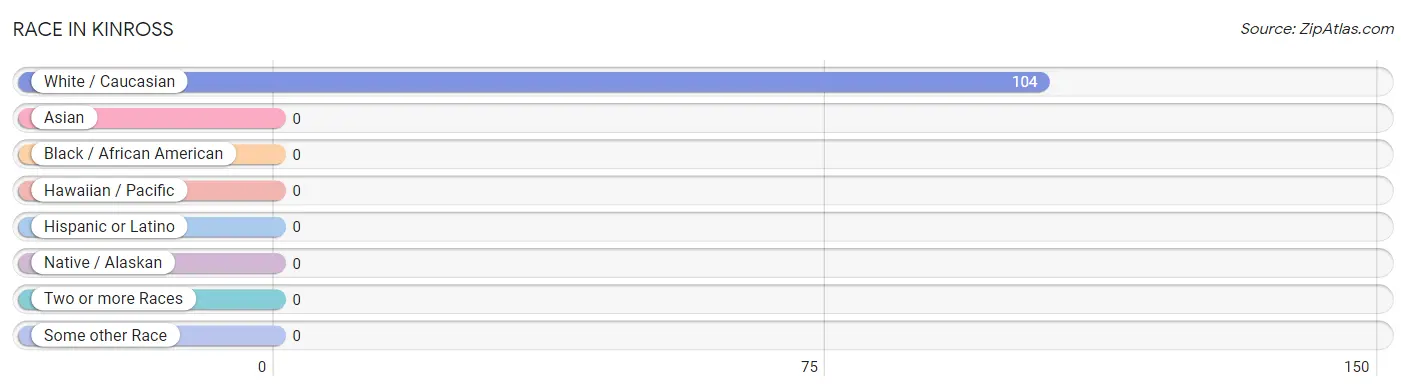
Race in Kinross
The most populous races in Kinross are , and White / Caucasian (104 | 100.0%).
| Race | # Population | % Population |
| Asian | 0 | 0.0% |
| Black / African American | 0 | 0.0% |
| Hawaiian / Pacific | 0 | 0.0% |
| Hispanic or Latino | 0 | 0.0% |
| Native / Alaskan | 0 | 0.0% |
| White / Caucasian | 104 | 100.0% |
| Two or more Races | 0 | 0.0% |
| Some other Race | 0 | 0.0% |
| Total | 104 | 100.0% |
Ancestry in Kinross
The most populous ancestries reported in Kinross are Danish (30 | 28.8%), Irish (30 | 28.8%), American (15 | 14.4%), Dutch (15 | 14.4%), and German (5 | 4.8%), together accounting for 91.3% of all Kinross residents.
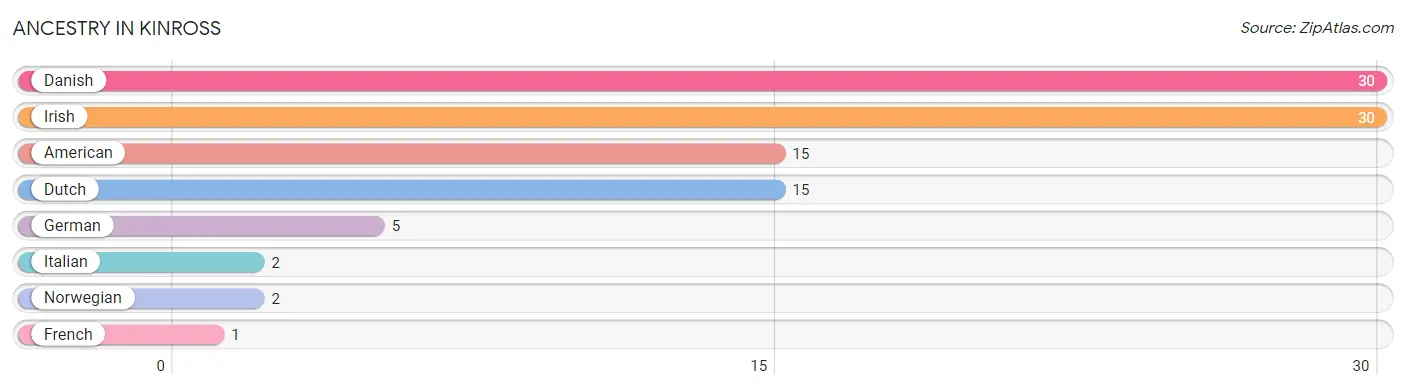
| Ancestry | # Population | % Population |
| American | 15 | 14.4% |
| Danish | 30 | 28.8% |
| Dutch | 15 | 14.4% |
| French | 1 | 1.0% |
| German | 5 | 4.8% |
| Irish | 30 | 28.8% |
| Italian | 2 | 1.9% |
| Norwegian | 2 | 1.9% | View All 8 Rows |
Immigrants in Kinross
The most numerous immigrant groups reported in Kinross came from Europe (3 | 2.9%), and Northern Europe (3 | 2.9%), together accounting for 5.8% of all Kinross residents.
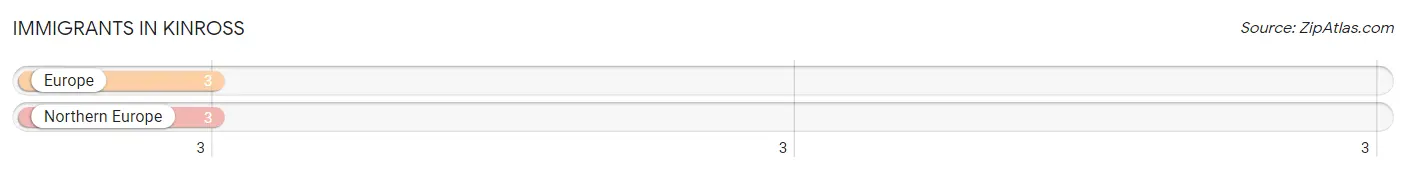
| Immigration Origin | # Population | % Population |
| Europe | 3 | 2.9% |
| Northern Europe | 3 | 2.9% | View All 2 Rows |
Sex and Age in Kinross
Sex and Age in Kinross
The most populous age groups in Kinross are 10 to 14 Years (11 | 19.0%) for men and 5 to 9 Years (14 | 30.4%) for women.
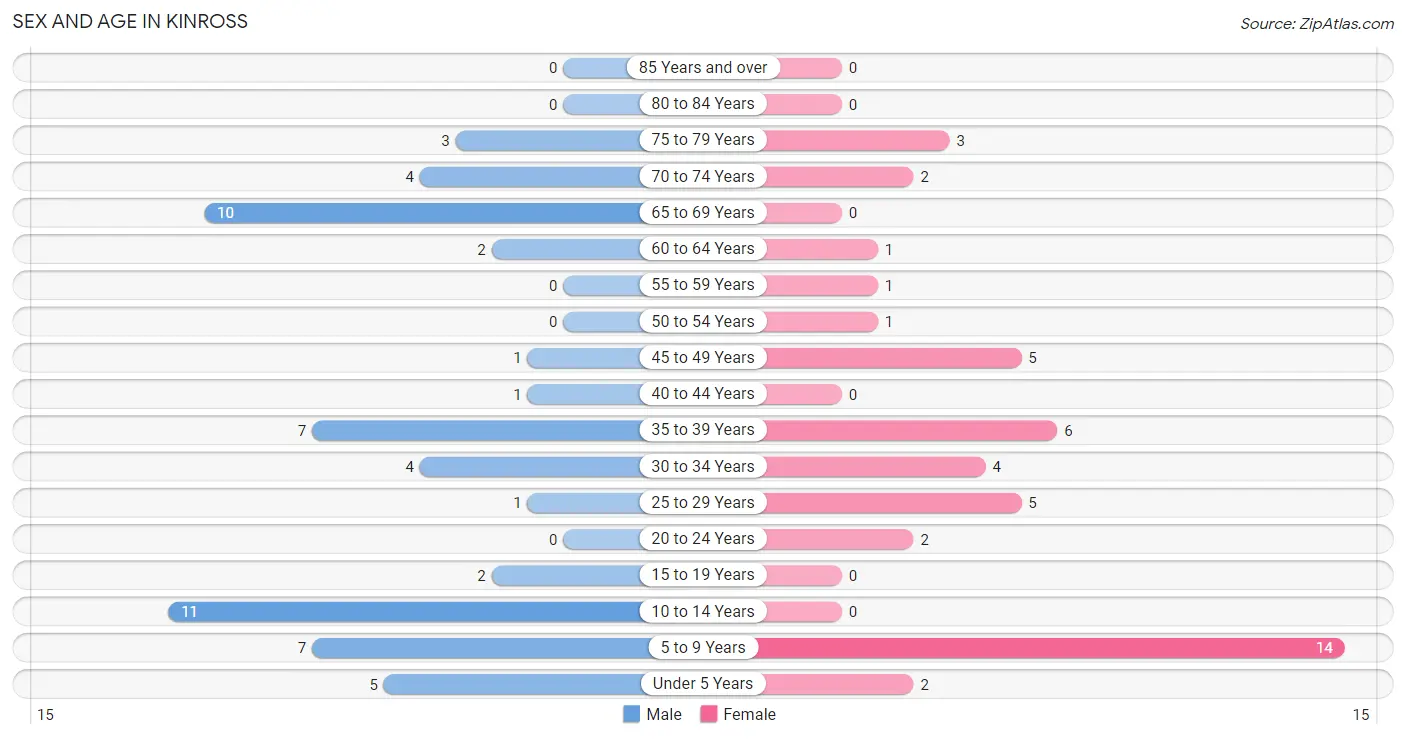
| Age Bracket | Male | Female |
| Under 5 Years | 5 (8.6%) | 2 (4.3%) |
| 5 to 9 Years | 7 (12.1%) | 14 (30.4%) |
| 10 to 14 Years | 11 (19.0%) | 0 (0.0%) |
| 15 to 19 Years | 2 (3.5%) | 0 (0.0%) |
| 20 to 24 Years | 0 (0.0%) | 2 (4.3%) |
| 25 to 29 Years | 1 (1.7%) | 5 (10.9%) |
| 30 to 34 Years | 4 (6.9%) | 4 (8.7%) |
| 35 to 39 Years | 7 (12.1%) | 6 (13.0%) |
| 40 to 44 Years | 1 (1.7%) | 0 (0.0%) |
| 45 to 49 Years | 1 (1.7%) | 5 (10.9%) |
| 50 to 54 Years | 0 (0.0%) | 1 (2.2%) |
| 55 to 59 Years | 0 (0.0%) | 1 (2.2%) |
| 60 to 64 Years | 2 (3.5%) | 1 (2.2%) |
| 65 to 69 Years | 10 (17.2%) | 0 (0.0%) |
| 70 to 74 Years | 4 (6.9%) | 2 (4.3%) |
| 75 to 79 Years | 3 (5.2%) | 3 (6.5%) |
| 80 to 84 Years | 0 (0.0%) | 0 (0.0%) |
| 85 Years and over | 0 (0.0%) | 0 (0.0%) |
| Total | 58 (100.0%) | 46 (100.0%) |
Families and Households in Kinross
Median Family Size in Kinross
The median family size in Kinross is 4.00 persons per family, with married-couple families (17 | 80.9%) accounting for the largest median family size of 4.47 persons per family. On the other hand, single male/father families (2 | 9.5%) represent the smallest median family size with 2.00 persons per family.
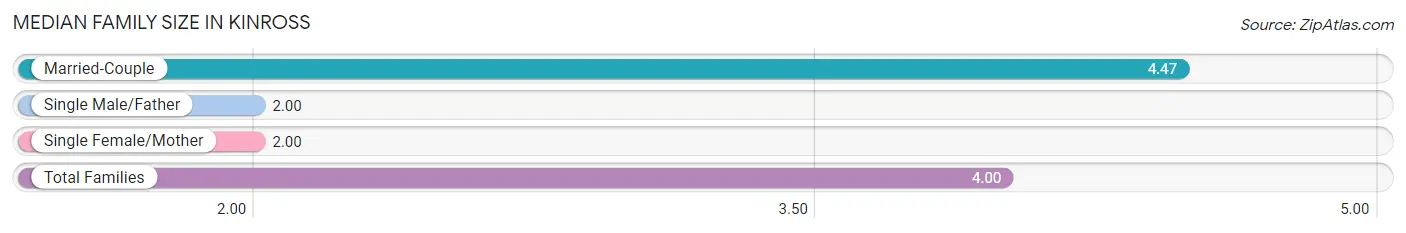
| Family Type | # Families | Family Size |
| Married-Couple | 17 (80.9%) | 4.47 |
| Single Male/Father | 2 (9.5%) | 2.00 |
| Single Female/Mother | 2 (9.5%) | 2.00 |
| Total Families | 21 (100.0%) | 4.00 |
Median Household Size in Kinross
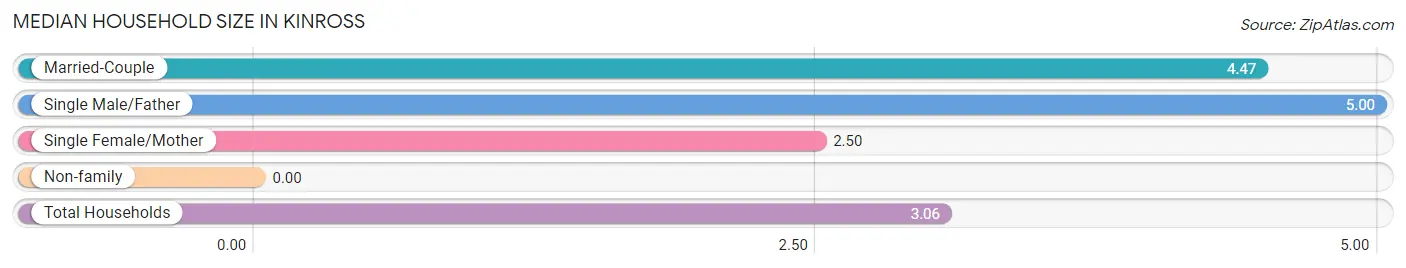
| Household Type | # Households | Household Size |
| Married-Couple | 17 (50.0%) | 4.47 |
| Single Male/Father | 2 (5.9%) | 5.00 |
| Single Female/Mother | 2 (5.9%) | 2.50 |
| Non-family | 13 (38.2%) | - |
| Total Households | 34 (100.0%) | 3.06 |
Household Size by Marriage Status in Kinross
Out of a total of 34 households in Kinross, 21 (61.8%) are family households, while 13 (38.2%) are nonfamily households. The most numerous type of family households are 2-person households, comprising 7, and the most common type of nonfamily households are 1-person households, comprising 13.
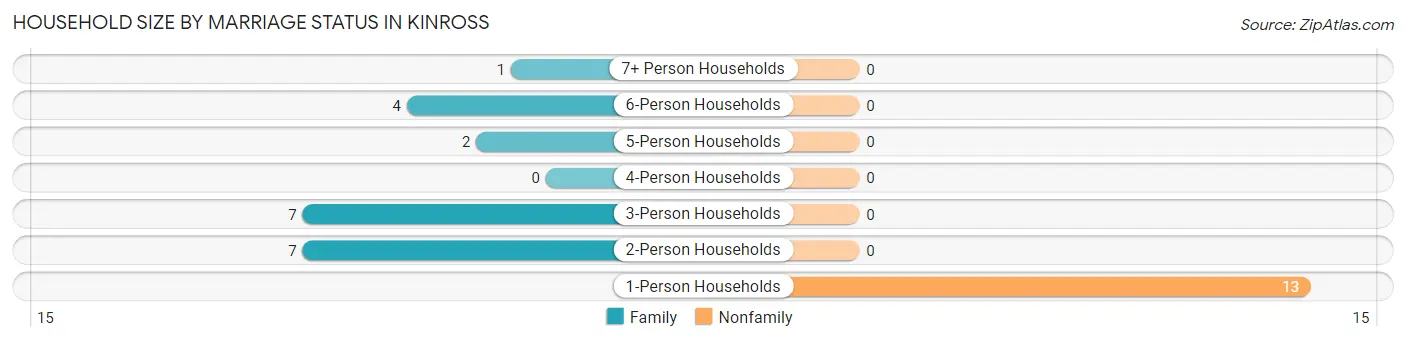
| Household Size | Family Households | Nonfamily Households |
| 1-Person Households | - | 13 (38.2%) |
| 2-Person Households | 7 (20.6%) | 0 (0.0%) |
| 3-Person Households | 7 (20.6%) | 0 (0.0%) |
| 4-Person Households | 0 (0.0%) | 0 (0.0%) |
| 5-Person Households | 2 (5.9%) | 0 (0.0%) |
| 6-Person Households | 4 (11.8%) | 0 (0.0%) |
| 7+ Person Households | 1 (2.9%) | 0 (0.0%) |
| Total | 21 (61.8%) | 13 (38.2%) |
Female Fertility in Kinross
Fertility by Age in Kinross
| Age Bracket | Women with Births | Births / 1,000 Women |
| 15 to 19 years | 0 (0.0%) | 0.0 |
| 20 to 34 years | 0 (0.0%) | 0.0 |
| 35 to 50 years | 0 (0.0%) | 0.0 |
| Total | 0 (0.0%) | 0.0 |
Fertility by Age by Marriage Status in Kinross
| Age Bracket | Married | Unmarried |
| 15 to 19 years | 0 (0.0%) | 0 (0.0%) |
| 20 to 34 years | 0 (0.0%) | 0 (0.0%) |
| 35 to 50 years | 0 (0.0%) | 0 (0.0%) |
| Total | 0 (0.0%) | 0 (0.0%) |
Fertility by Education in Kinross
| Educational Attainment | Women with Births | Births / 1,000 Women |
| Less than High School | 0 (0.0%) | 0.0 |
| High School Diploma | 0 (0.0%) | 0.0 |
| College or Associate's Degree | 0 (0.0%) | 0.0 |
| Bachelor's Degree | 0 (0.0%) | 0.0 |
| Graduate Degree | 0 (0.0%) | 0.0 |
| Total | 0 (0.0%) | 0.0 |
Fertility by Education by Marriage Status in Kinross
| Educational Attainment | Married | Unmarried |
| Less than High School | 0 (0.0%) | 0 (0.0%) |
| High School Diploma | 0 (0.0%) | 0 (0.0%) |
| College or Associate's Degree | 0 (0.0%) | 0 (0.0%) |
| Bachelor's Degree | 0 (0.0%) | 0 (0.0%) |
| Graduate Degree | 0 (0.0%) | 0 (0.0%) |
| Total | 0 (0.0%) | 0 (0.0%) |
Employment Characteristics in Kinross
Employment by Class of Employer in Kinross
Among the 28 employed individuals in Kinross, private company employees (19 | 67.9%), local government employees (5 | 17.9%), and not-for-profit organizations (3 | 10.7%) make up the most common classes of employment.
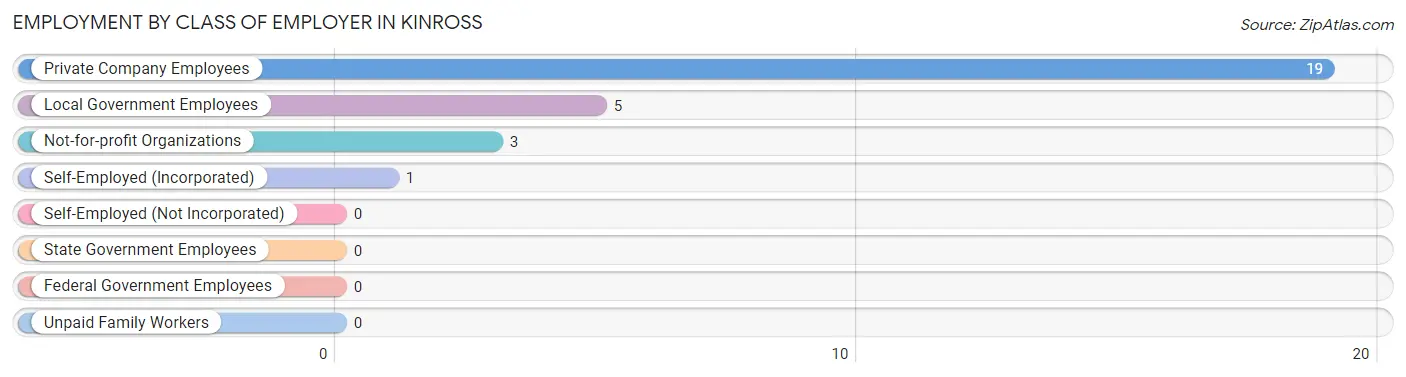
| Employer Class | # Employees | % Employees |
| Private Company Employees | 19 | 67.9% |
| Self-Employed (Incorporated) | 1 | 3.6% |
| Self-Employed (Not Incorporated) | 0 | 0.0% |
| Not-for-profit Organizations | 3 | 10.7% |
| Local Government Employees | 5 | 17.9% |
| State Government Employees | 0 | 0.0% |
| Federal Government Employees | 0 | 0.0% |
| Unpaid Family Workers | 0 | 0.0% |
| Total | 28 | 100.0% |
Employment Status by Age in Kinross
According to the labor force statistics for Kinross, out of the total population over 16 years of age (65), 52.3% or 34 individuals are in the labor force, with 8.8% or 3 of them unemployed. The age group with the highest labor force participation rate is 25 to 29 years, with 100.0% or 6 individuals in the labor force. Within the labor force, the 65 to 74 years age range has the highest percentage of unemployed individuals, with 100.0% or 1 of them being unemployed.
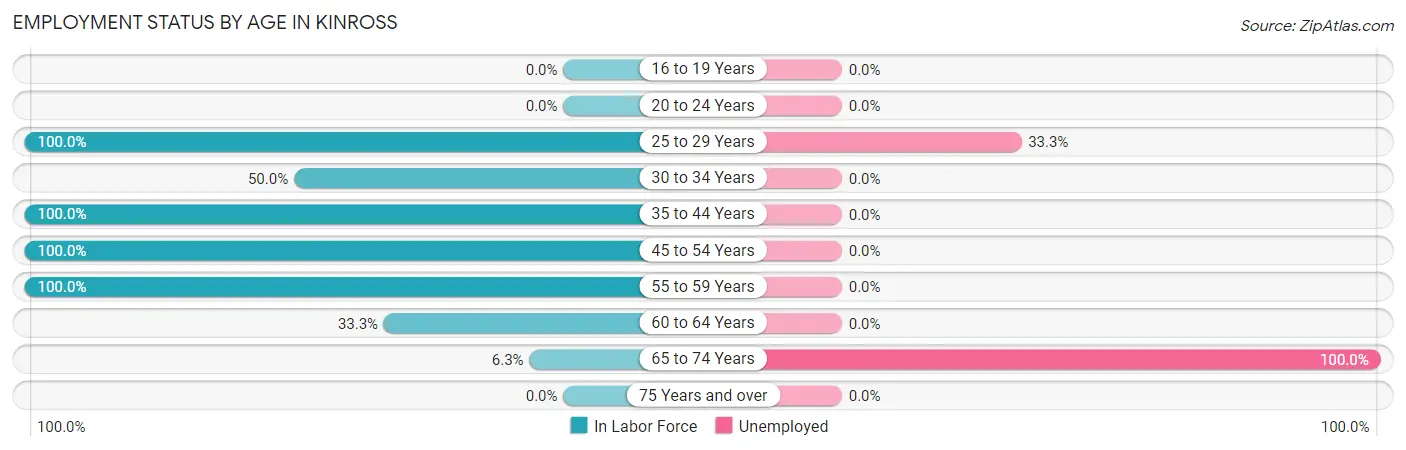
| Age Bracket | In Labor Force | Unemployed |
| 16 to 19 Years | 0 (0.0%) | 0 (0.0%) |
| 20 to 24 Years | 0 (0.0%) | 0 (0.0%) |
| 25 to 29 Years | 6 (100.0%) | 2 (33.3%) |
| 30 to 34 Years | 4 (50.0%) | 0 (0.0%) |
| 35 to 44 Years | 14 (100.0%) | 0 (0.0%) |
| 45 to 54 Years | 7 (100.0%) | 0 (0.0%) |
| 55 to 59 Years | 1 (100.0%) | 0 (0.0%) |
| 60 to 64 Years | 1 (33.3%) | 0 (0.0%) |
| 65 to 74 Years | 1 (6.3%) | 1 (100.0%) |
| 75 Years and over | 0 (0.0%) | 0 (0.0%) |
| Total | 34 (52.3%) | 3 (8.8%) |
Employment Status by Educational Attainment in Kinross
According to labor force statistics for Kinross, 84.6% of individuals (33) out of the total population between 25 and 64 years of age (39) are in the labor force, with 6.1% or 2 of them being unemployed. The group with the highest labor force participation rate are those with the educational attainment of less than high school, with 100.0% or 1 individuals in the labor force. Within the labor force, individuals with college / associate degree education have the highest percentage of unemployment, with 8.0% or 2 of them being unemployed.
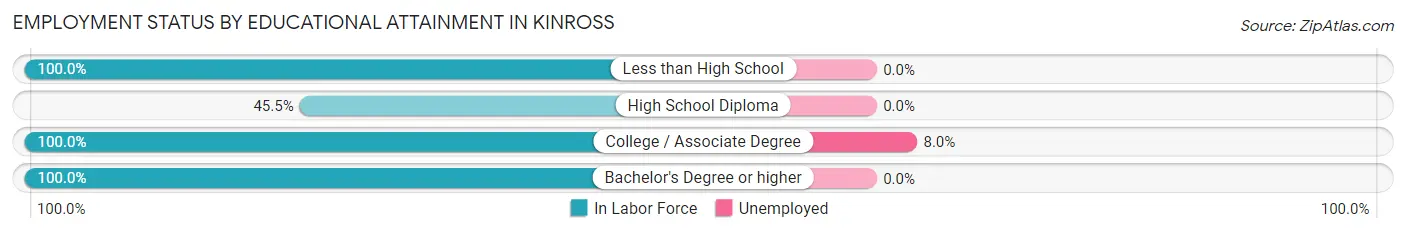
| Educational Attainment | In Labor Force | Unemployed |
| Less than High School | 1 (100.0%) | 0 (0.0%) |
| High School Diploma | 5 (45.5%) | 0 (0.0%) |
| College / Associate Degree | 25 (100.0%) | 2 (8.0%) |
| Bachelor's Degree or higher | 2 (100.0%) | 0 (0.0%) |
| Total | 33 (84.6%) | 2 (6.1%) |
Employment Occupations by Sex in Kinross
Management, Business, Science and Arts Occupations
The most common Management, Business, Science and Arts occupations in Kinross are Management (5 | 16.1%), Health Diagnosing & Treating (5 | 16.1%), Health Technologists (2 | 6.5%), Computers, Engineering & Science (1 | 3.2%), and Computers & Mathematics (1 | 3.2%).
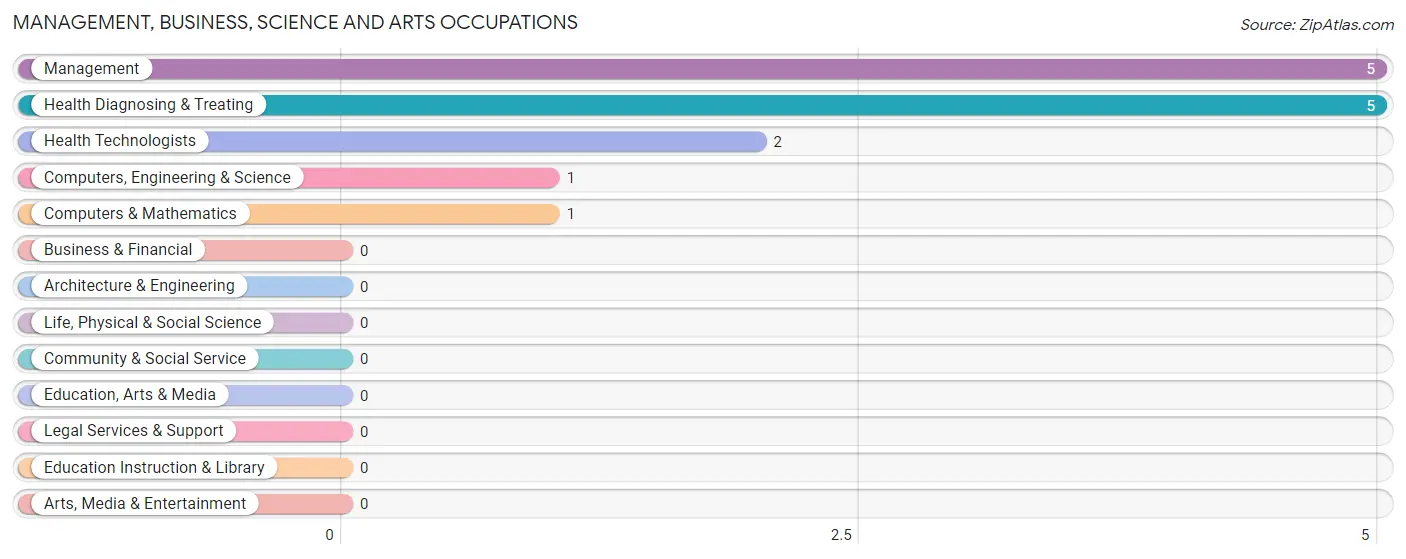
Management, Business, Science and Arts Occupations by Sex
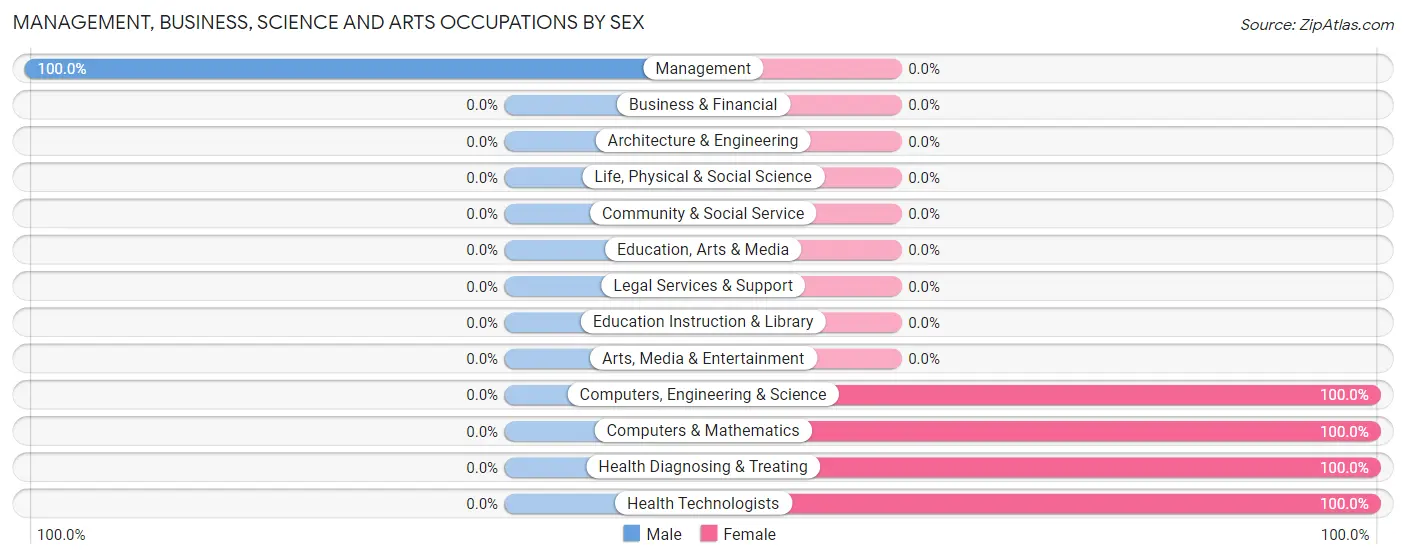
| Occupation | Male | Female |
| Management | 5 (100.0%) | 0 (0.0%) |
| Business & Financial | 0 (0.0%) | 0 (0.0%) |
| Computers, Engineering & Science | 0 (0.0%) | 1 (100.0%) |
| Computers & Mathematics | 0 (0.0%) | 1 (100.0%) |
| Architecture & Engineering | 0 (0.0%) | 0 (0.0%) |
| Life, Physical & Social Science | 0 (0.0%) | 0 (0.0%) |
| Community & Social Service | 0 (0.0%) | 0 (0.0%) |
| Education, Arts & Media | 0 (0.0%) | 0 (0.0%) |
| Legal Services & Support | 0 (0.0%) | 0 (0.0%) |
| Education Instruction & Library | 0 (0.0%) | 0 (0.0%) |
| Arts, Media & Entertainment | 0 (0.0%) | 0 (0.0%) |
| Health Diagnosing & Treating | 0 (0.0%) | 5 (100.0%) |
| Health Technologists | 0 (0.0%) | 2 (100.0%) |
| Total (Category) | 5 (45.5%) | 6 (54.5%) |
| Total (Overall) | 14 (45.2%) | 17 (54.8%) |
Services Occupations
The most common Services occupations in Kinross are Security & Protection (6 | 19.4%), Law Enforcement (5 | 16.1%), Healthcare Support (1 | 3.2%), Firefighting & Prevention (1 | 3.2%), and Cleaning & Maintenance (1 | 3.2%).
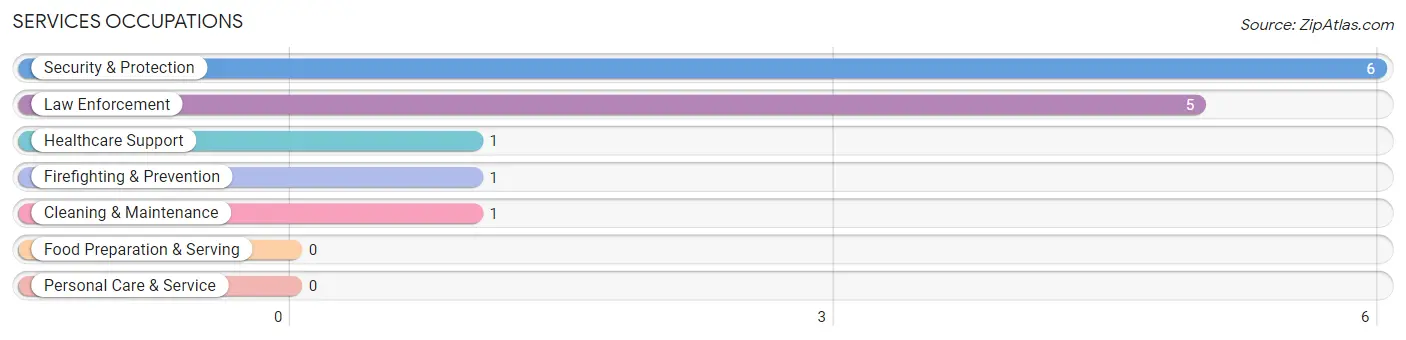
Services Occupations by Sex
Within the Services occupations in Kinross, the most male-oriented occupations are Law Enforcement (100.0%), Cleaning & Maintenance (100.0%), and Security & Protection (83.3%), while the most female-oriented occupations are Healthcare Support (100.0%), Firefighting & Prevention (100.0%), and Security & Protection (16.7%).
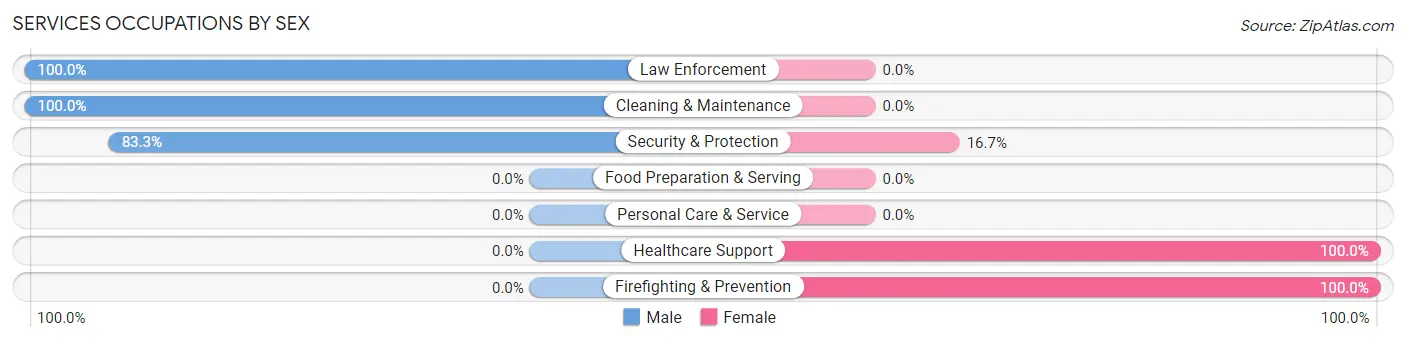
| Occupation | Male | Female |
| Healthcare Support | 0 (0.0%) | 1 (100.0%) |
| Security & Protection | 5 (83.3%) | 1 (16.7%) |
| Firefighting & Prevention | 0 (0.0%) | 1 (100.0%) |
| Law Enforcement | 5 (100.0%) | 0 (0.0%) |
| Food Preparation & Serving | 0 (0.0%) | 0 (0.0%) |
| Cleaning & Maintenance | 1 (100.0%) | 0 (0.0%) |
| Personal Care & Service | 0 (0.0%) | 0 (0.0%) |
| Total (Category) | 6 (75.0%) | 2 (25.0%) |
| Total (Overall) | 14 (45.2%) | 17 (54.8%) |
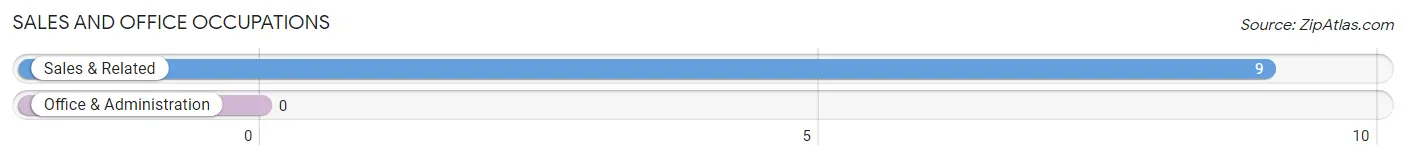
Sales and Office Occupations
The most common Sales and Office occupations in Kinross are , and Sales & Related (9 | 29.0%).
Sales and Office Occupations by Sex
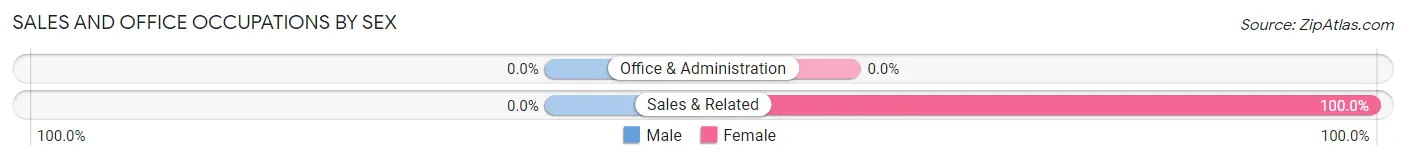
| Occupation | Male | Female |
| Sales & Related | 0 (0.0%) | 9 (100.0%) |
| Office & Administration | 0 (0.0%) | 0 (0.0%) |
| Total (Category) | 0 (0.0%) | 9 (100.0%) |
| Total (Overall) | 14 (45.2%) | 17 (54.8%) |
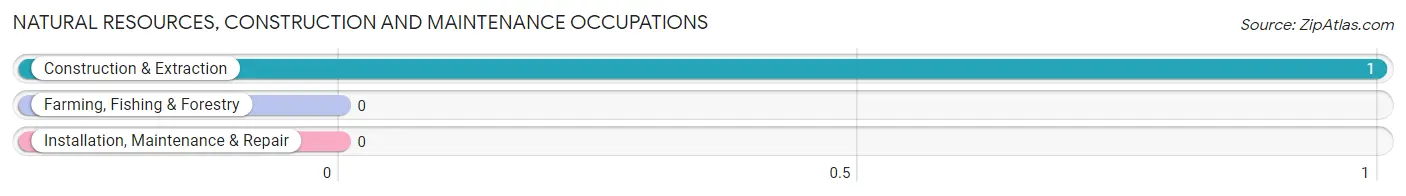
Natural Resources, Construction and Maintenance Occupations
The most common Natural Resources, Construction and Maintenance occupations in Kinross are , and Construction & Extraction (1 | 3.2%).
Natural Resources, Construction and Maintenance Occupations by Sex
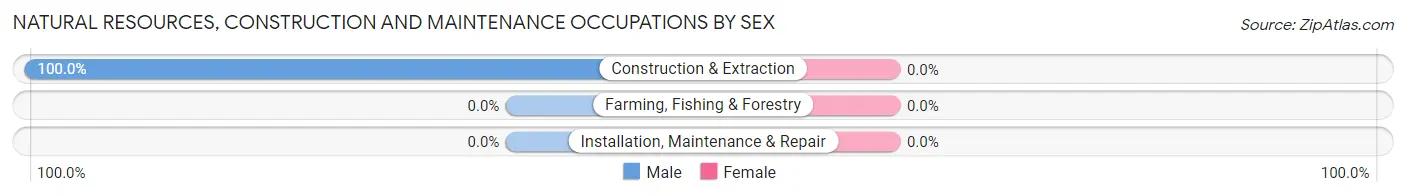
| Occupation | Male | Female |
| Farming, Fishing & Forestry | 0 (0.0%) | 0 (0.0%) |
| Construction & Extraction | 1 (100.0%) | 0 (0.0%) |
| Installation, Maintenance & Repair | 0 (0.0%) | 0 (0.0%) |
| Total (Category) | 1 (100.0%) | 0 (0.0%) |
| Total (Overall) | 14 (45.2%) | 17 (54.8%) |
Production, Transportation and Moving Occupations
The most common Production, Transportation and Moving occupations in Kinross are , and Transportation (2 | 6.5%).
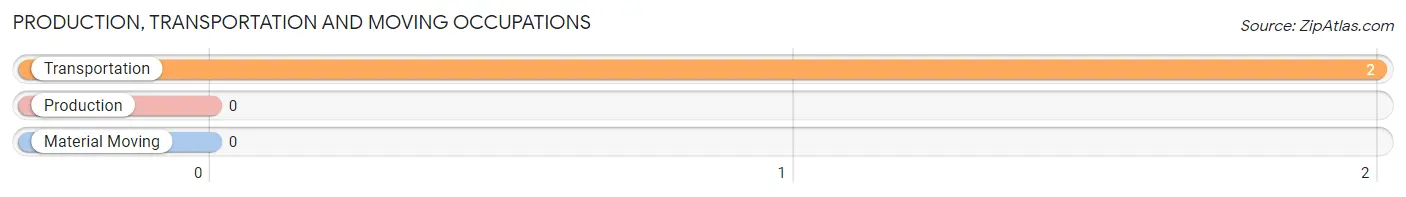
Production, Transportation and Moving Occupations by Sex
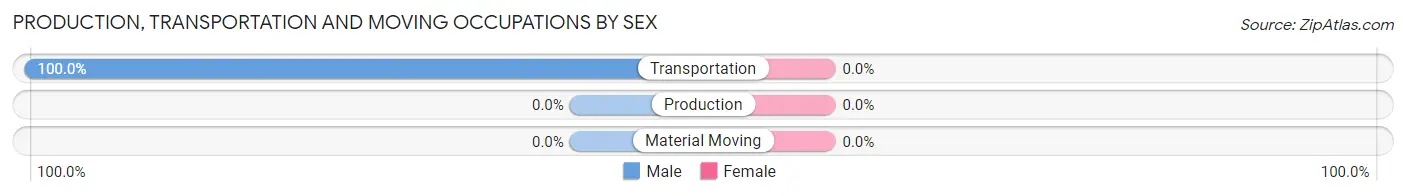
| Occupation | Male | Female |
| Production | 0 (0.0%) | 0 (0.0%) |
| Transportation | 2 (100.0%) | 0 (0.0%) |
| Material Moving | 0 (0.0%) | 0 (0.0%) |
| Total (Category) | 2 (100.0%) | 0 (0.0%) |
| Total (Overall) | 14 (45.2%) | 17 (54.8%) |
Employment Industries by Sex in Kinross
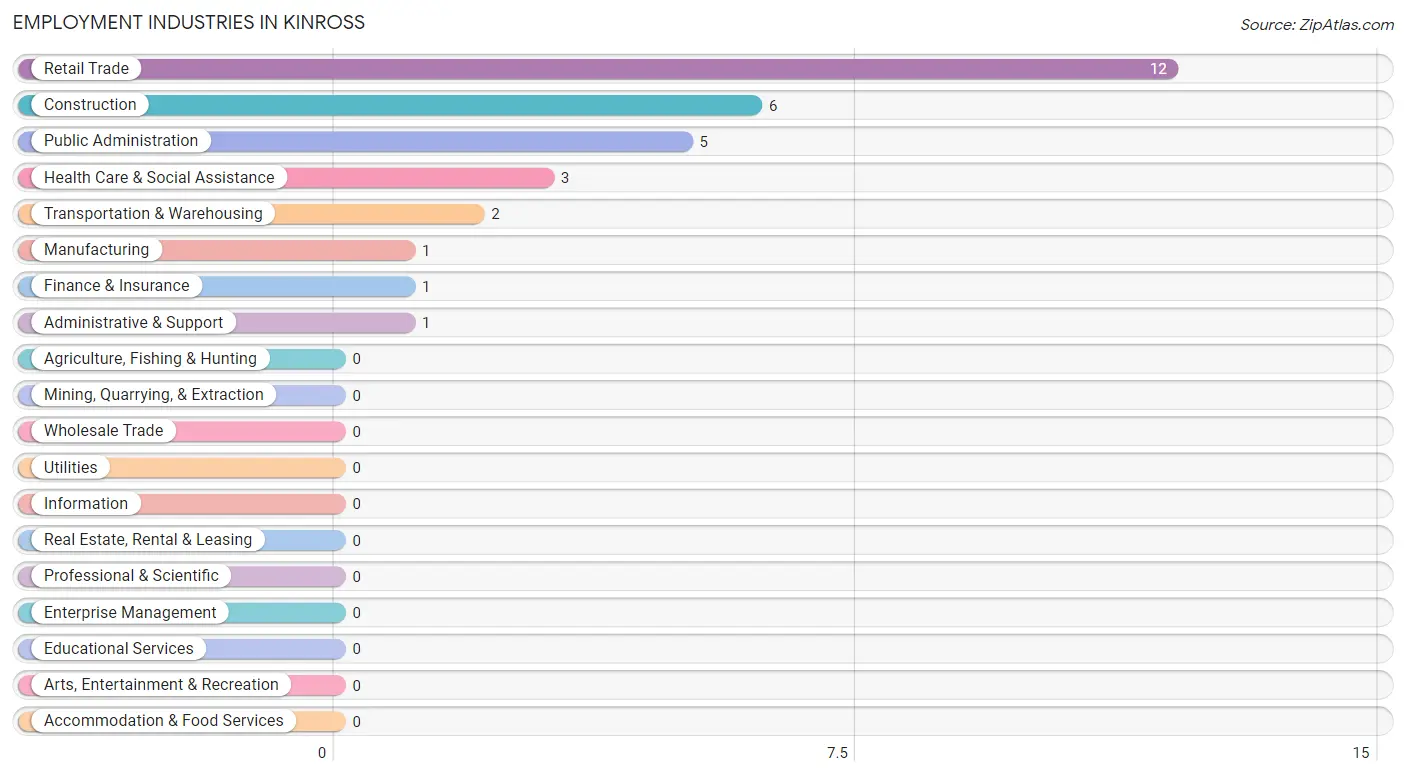
Employment Industries in Kinross
The major employment industries in Kinross include Retail Trade (12 | 38.7%), Construction (6 | 19.4%), Public Administration (5 | 16.1%), Health Care & Social Assistance (3 | 9.7%), and Transportation & Warehousing (2 | 6.5%).
Employment Industries by Sex in Kinross
The Kinross industries that see more men than women are Construction (100.0%), Manufacturing (100.0%), and Transportation & Warehousing (100.0%), whereas the industries that tend to have a higher number of women are Retail Trade (100.0%), Finance & Insurance (100.0%), and Administrative & Support (100.0%).
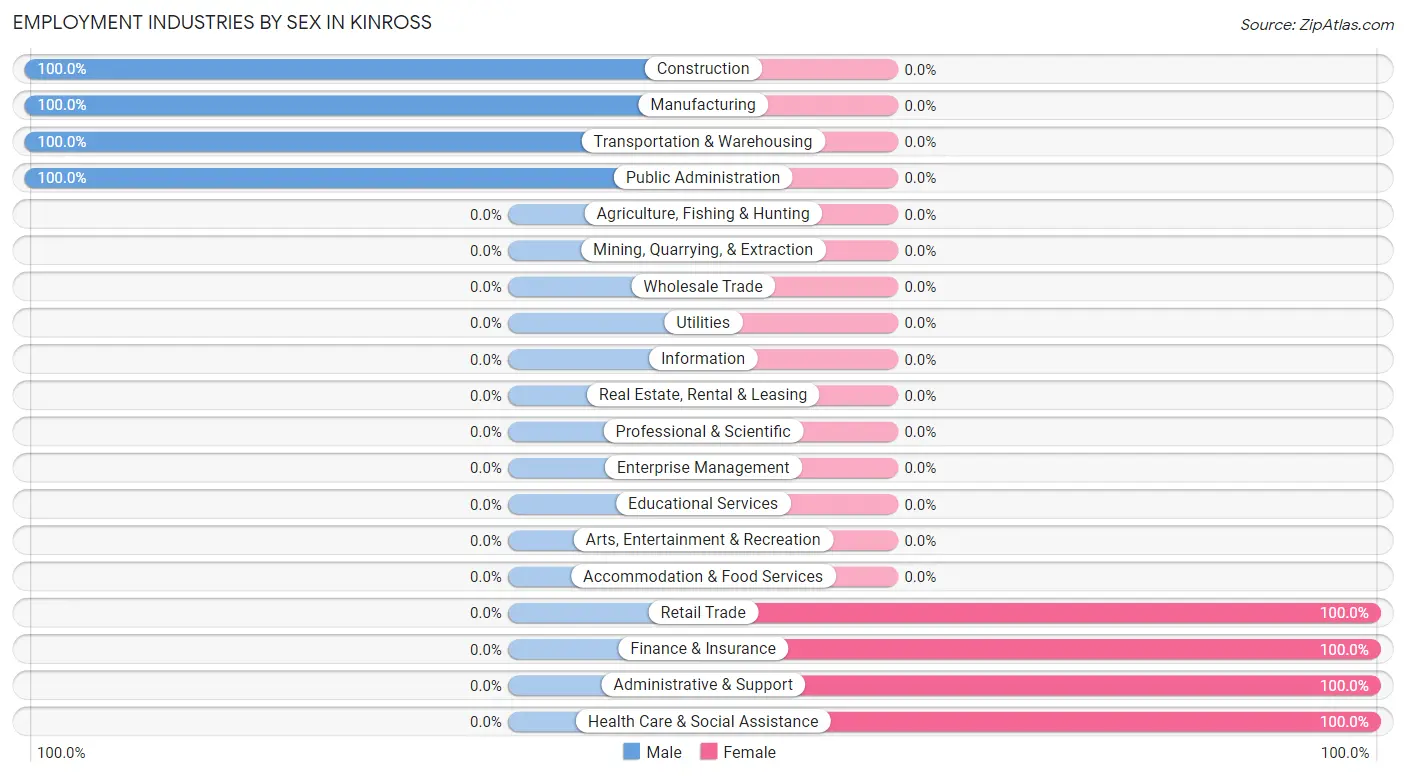
| Industry | Male | Female |
| Agriculture, Fishing & Hunting | 0 (0.0%) | 0 (0.0%) |
| Mining, Quarrying, & Extraction | 0 (0.0%) | 0 (0.0%) |
| Construction | 6 (100.0%) | 0 (0.0%) |
| Manufacturing | 1 (100.0%) | 0 (0.0%) |
| Wholesale Trade | 0 (0.0%) | 0 (0.0%) |
| Retail Trade | 0 (0.0%) | 12 (100.0%) |
| Transportation & Warehousing | 2 (100.0%) | 0 (0.0%) |
| Utilities | 0 (0.0%) | 0 (0.0%) |
| Information | 0 (0.0%) | 0 (0.0%) |
| Finance & Insurance | 0 (0.0%) | 1 (100.0%) |
| Real Estate, Rental & Leasing | 0 (0.0%) | 0 (0.0%) |
| Professional & Scientific | 0 (0.0%) | 0 (0.0%) |
| Enterprise Management | 0 (0.0%) | 0 (0.0%) |
| Administrative & Support | 0 (0.0%) | 1 (100.0%) |
| Educational Services | 0 (0.0%) | 0 (0.0%) |
| Health Care & Social Assistance | 0 (0.0%) | 3 (100.0%) |
| Arts, Entertainment & Recreation | 0 (0.0%) | 0 (0.0%) |
| Accommodation & Food Services | 0 (0.0%) | 0 (0.0%) |
| Public Administration | 5 (100.0%) | 0 (0.0%) |
| Total | 14 (45.2%) | 17 (54.8%) |
Education in Kinross
School Enrollment in Kinross
The most common levels of schooling among the 40 students in Kinross are elementary school (14 | 35.0%), middle school (10 | 25.0%), and kindergarten (7 | 17.5%).
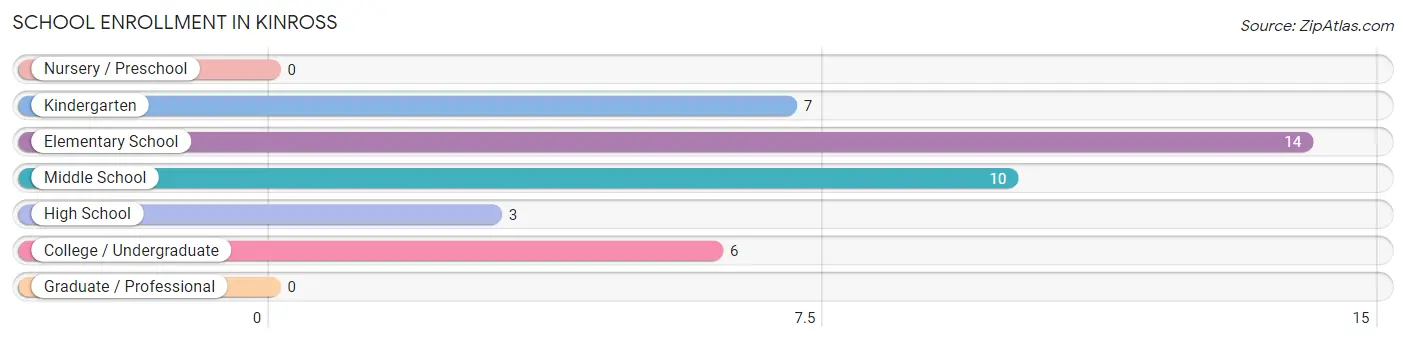
| School Level | # Students | % Students |
| Nursery / Preschool | 0 | 0.0% |
| Kindergarten | 7 | 17.5% |
| Elementary School | 14 | 35.0% |
| Middle School | 10 | 25.0% |
| High School | 3 | 7.5% |
| College / Undergraduate | 6 | 15.0% |
| Graduate / Professional | 0 | 0.0% |
| Total | 40 | 100.0% |
School Enrollment by Age by Funding Source in Kinross
Out of a total of 40 students who are enrolled in schools in Kinross, 4 (10.0%) attend a private institution, while the remaining 36 (90.0%) are enrolled in public schools. The age group of 25 to 34 year olds has the highest likelihood of being enrolled in private schools, with 4 (100.0% in the age bracket) enrolled. Conversely, the age group of 5 to 9 year old has the lowest likelihood of being enrolled in a private school, with 21 (100.0% in the age bracket) attending a public institution.
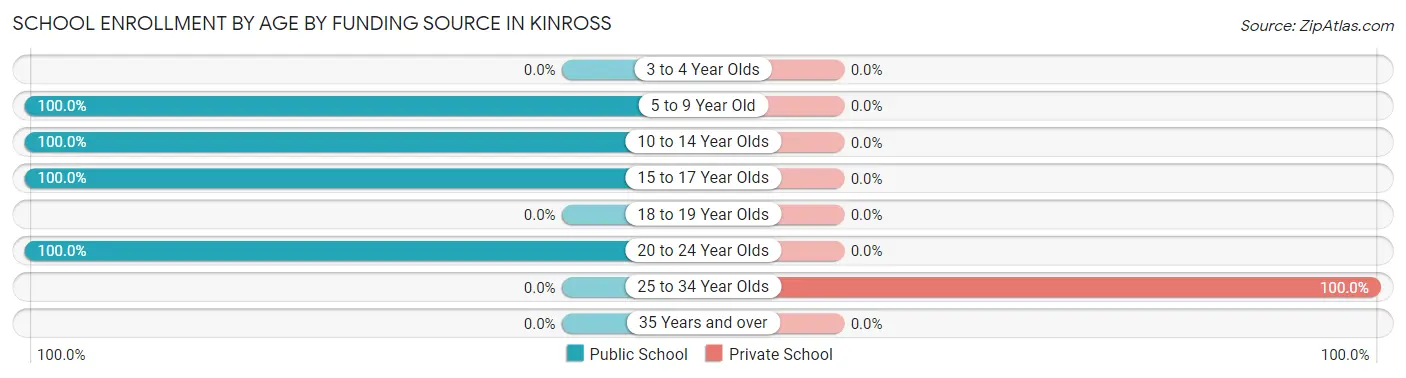
| Age Bracket | Public School | Private School |
| 3 to 4 Year Olds | 0 (0.0%) | 0 (0.0%) |
| 5 to 9 Year Old | 21 (100.0%) | 0 (0.0%) |
| 10 to 14 Year Olds | 11 (100.0%) | 0 (0.0%) |
| 15 to 17 Year Olds | 2 (100.0%) | 0 (0.0%) |
| 18 to 19 Year Olds | 0 (0.0%) | 0 (0.0%) |
| 20 to 24 Year Olds | 2 (100.0%) | 0 (0.0%) |
| 25 to 34 Year Olds | 0 (0.0%) | 4 (100.0%) |
| 35 Years and over | 0 (0.0%) | 0 (0.0%) |
| Total | 36 (90.0%) | 4 (10.0%) |
Educational Attainment by Field of Study in Kinross
, and science & technology (2 | 100.0%) are the most common fields of study among 2 individuals in Kinross who have obtained a bachelor's degree or higher.
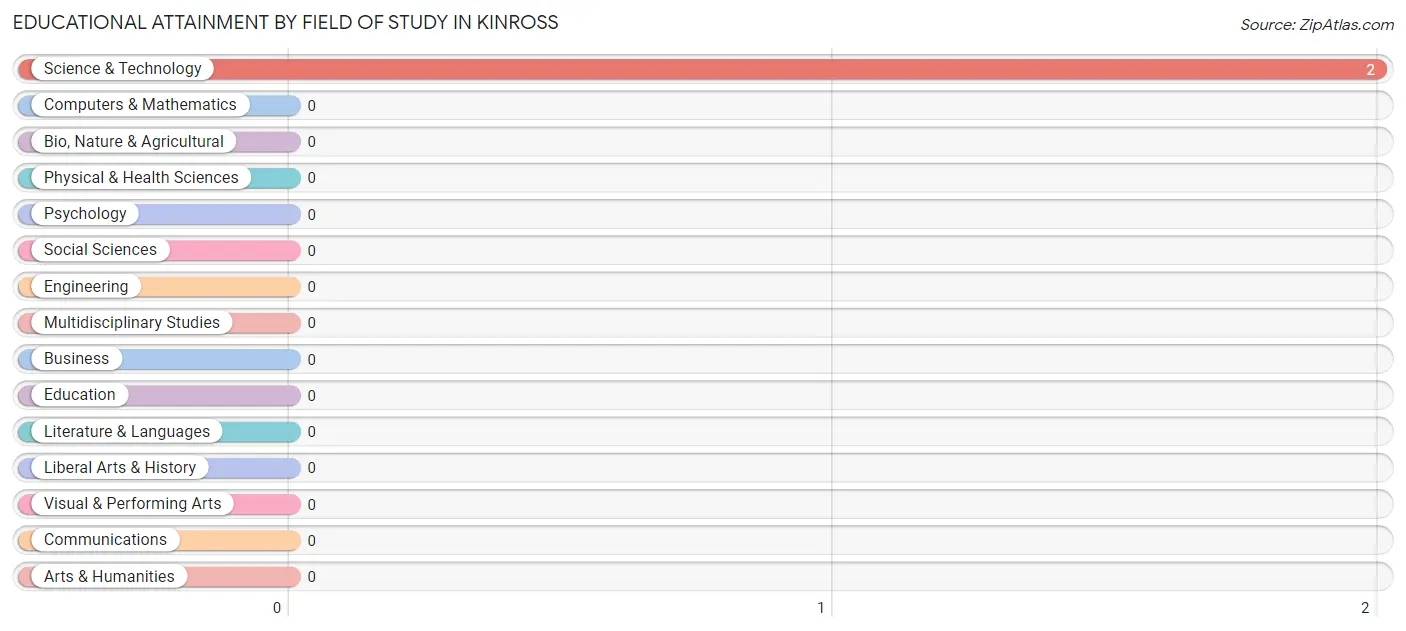
| Field of Study | # Graduates | % Graduates |
| Computers & Mathematics | 0 | 0.0% |
| Bio, Nature & Agricultural | 0 | 0.0% |
| Physical & Health Sciences | 0 | 0.0% |
| Psychology | 0 | 0.0% |
| Social Sciences | 0 | 0.0% |
| Engineering | 0 | 0.0% |
| Multidisciplinary Studies | 0 | 0.0% |
| Science & Technology | 2 | 100.0% |
| Business | 0 | 0.0% |
| Education | 0 | 0.0% |
| Literature & Languages | 0 | 0.0% |
| Liberal Arts & History | 0 | 0.0% |
| Visual & Performing Arts | 0 | 0.0% |
| Communications | 0 | 0.0% |
| Arts & Humanities | 0 | 0.0% |
| Total | 2 | 100.0% |
Transportation & Commute in Kinross
Vehicle Availability by Sex in Kinross
The most prevalent vehicle ownership categories in Kinross are males with 2 vehicles (10, accounting for 71.4%) and females with 2 vehicles (10, making up 71.4%).
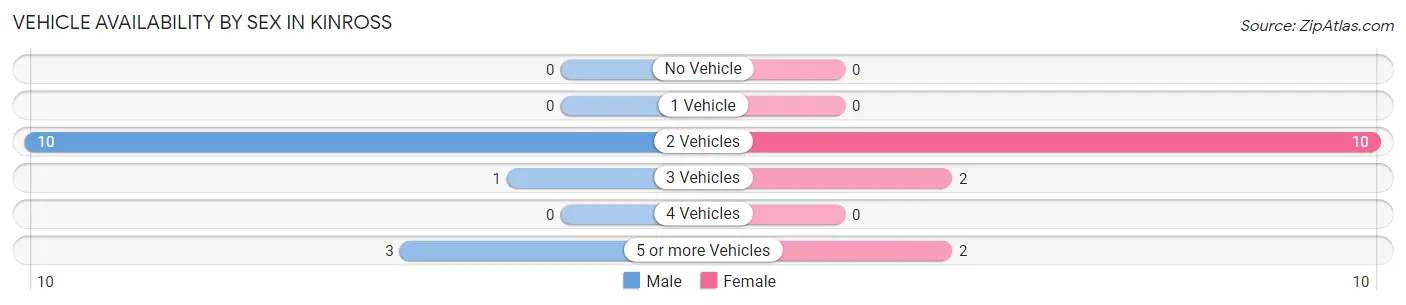
| Vehicles Available | Male | Female |
| No Vehicle | 0 (0.0%) | 0 (0.0%) |
| 1 Vehicle | 0 (0.0%) | 0 (0.0%) |
| 2 Vehicles | 10 (71.4%) | 10 (71.4%) |
| 3 Vehicles | 1 (7.1%) | 2 (14.3%) |
| 4 Vehicles | 0 (0.0%) | 0 (0.0%) |
| 5 or more Vehicles | 3 (21.4%) | 2 (14.3%) |
| Total | 14 (100.0%) | 14 (100.0%) |
Commute Time in Kinross
The most frequently occuring commute durations in Kinross are 45 to 59 minutes (12 commuters, 44.4%), 10 to 14 minutes (6 commuters, 22.2%), and 25 to 29 minutes (4 commuters, 14.8%).
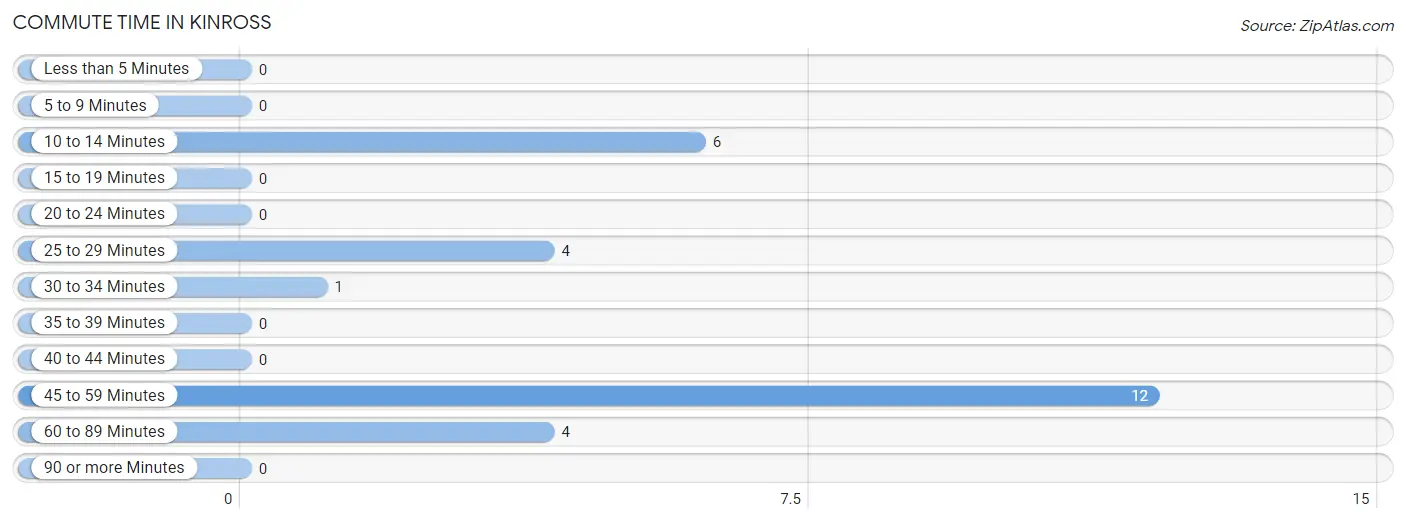
| Commute Time | # Commuters | % Commuters |
| Less than 5 Minutes | 0 | 0.0% |
| 5 to 9 Minutes | 0 | 0.0% |
| 10 to 14 Minutes | 6 | 22.2% |
| 15 to 19 Minutes | 0 | 0.0% |
| 20 to 24 Minutes | 0 | 0.0% |
| 25 to 29 Minutes | 4 | 14.8% |
| 30 to 34 Minutes | 1 | 3.7% |
| 35 to 39 Minutes | 0 | 0.0% |
| 40 to 44 Minutes | 0 | 0.0% |
| 45 to 59 Minutes | 12 | 44.4% |
| 60 to 89 Minutes | 4 | 14.8% |
| 90 or more Minutes | 0 | 0.0% |
Commute Time by Sex in Kinross
The most common commute times in Kinross are 45 to 59 minutes (6 commuters, 42.9%) for males and 45 to 59 minutes (6 commuters, 46.2%) for females.
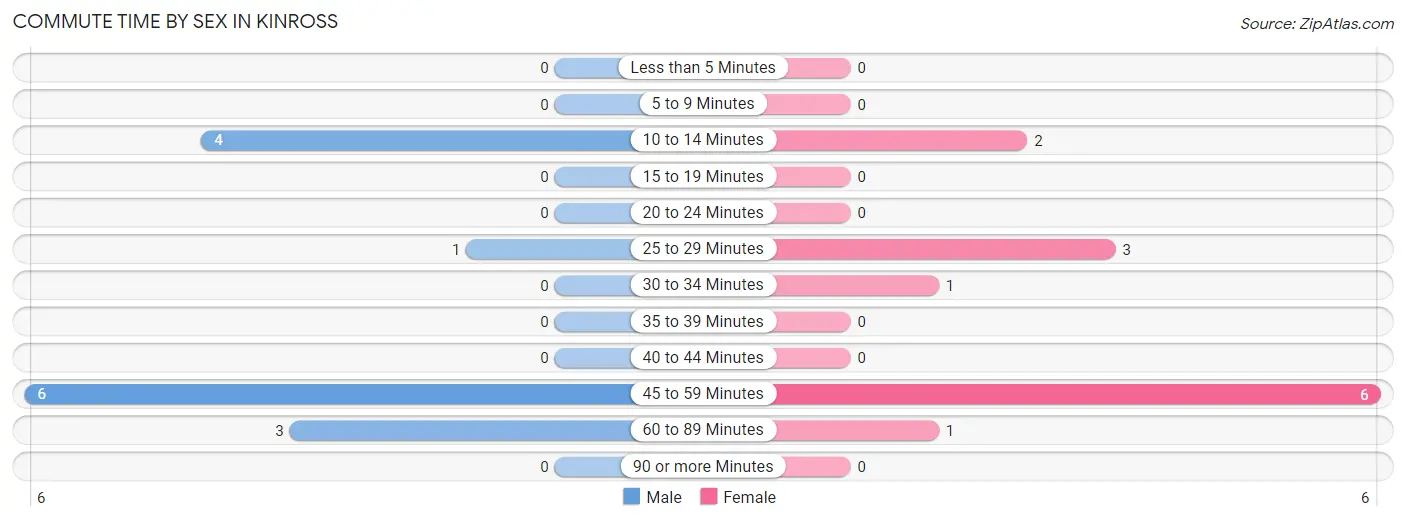
| Commute Time | Male | Female |
| Less than 5 Minutes | 0 (0.0%) | 0 (0.0%) |
| 5 to 9 Minutes | 0 (0.0%) | 0 (0.0%) |
| 10 to 14 Minutes | 4 (28.6%) | 2 (15.4%) |
| 15 to 19 Minutes | 0 (0.0%) | 0 (0.0%) |
| 20 to 24 Minutes | 0 (0.0%) | 0 (0.0%) |
| 25 to 29 Minutes | 1 (7.1%) | 3 (23.1%) |
| 30 to 34 Minutes | 0 (0.0%) | 1 (7.7%) |
| 35 to 39 Minutes | 0 (0.0%) | 0 (0.0%) |
| 40 to 44 Minutes | 0 (0.0%) | 0 (0.0%) |
| 45 to 59 Minutes | 6 (42.9%) | 6 (46.2%) |
| 60 to 89 Minutes | 3 (21.4%) | 1 (7.7%) |
| 90 or more Minutes | 0 (0.0%) | 0 (0.0%) |
Time of Departure to Work by Sex in Kinross
The most frequent times of departure to work in Kinross are 5:30 AM to 5:59 AM (6, 42.9%) for males and 6:30 AM to 6:59 AM (5, 38.5%) for females.
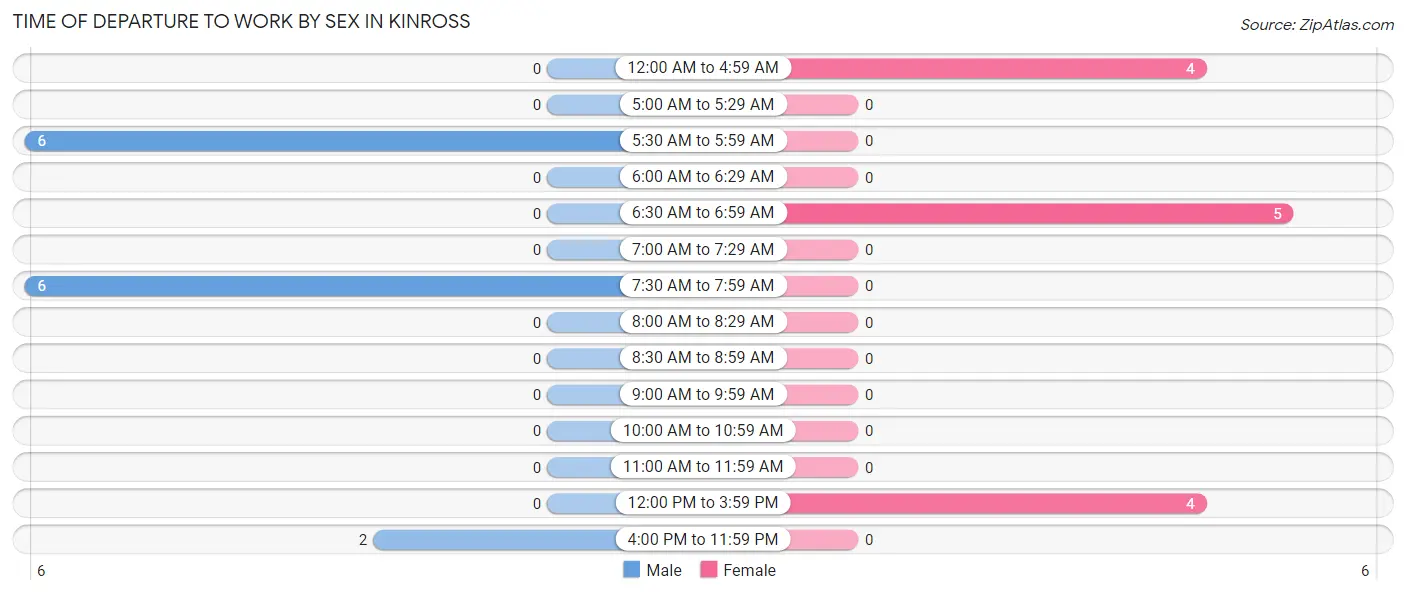
| Time of Departure | Male | Female |
| 12:00 AM to 4:59 AM | 0 (0.0%) | 4 (30.8%) |
| 5:00 AM to 5:29 AM | 0 (0.0%) | 0 (0.0%) |
| 5:30 AM to 5:59 AM | 6 (42.9%) | 0 (0.0%) |
| 6:00 AM to 6:29 AM | 0 (0.0%) | 0 (0.0%) |
| 6:30 AM to 6:59 AM | 0 (0.0%) | 5 (38.5%) |
| 7:00 AM to 7:29 AM | 0 (0.0%) | 0 (0.0%) |
| 7:30 AM to 7:59 AM | 6 (42.9%) | 0 (0.0%) |
| 8:00 AM to 8:29 AM | 0 (0.0%) | 0 (0.0%) |
| 8:30 AM to 8:59 AM | 0 (0.0%) | 0 (0.0%) |
| 9:00 AM to 9:59 AM | 0 (0.0%) | 0 (0.0%) |
| 10:00 AM to 10:59 AM | 0 (0.0%) | 0 (0.0%) |
| 11:00 AM to 11:59 AM | 0 (0.0%) | 0 (0.0%) |
| 12:00 PM to 3:59 PM | 0 (0.0%) | 4 (30.8%) |
| 4:00 PM to 11:59 PM | 2 (14.3%) | 0 (0.0%) |
| Total | 14 (100.0%) | 13 (100.0%) |
Housing Occupancy in Kinross
Occupancy by Ownership in Kinross
Of the total 34 dwellings in Kinross, owner-occupied units account for 34 (100.0%), while renter-occupied units make up 0 (0.0%).
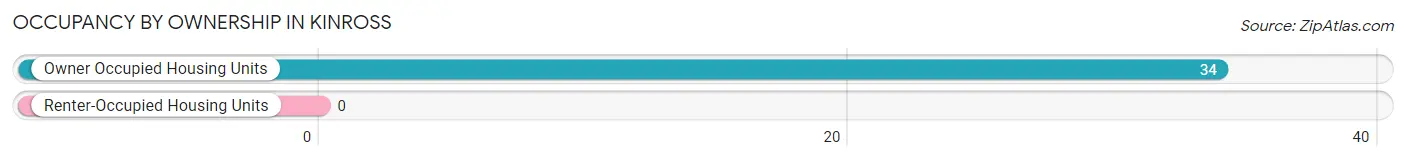
| Occupancy | # Housing Units | % Housing Units |
| Owner Occupied Housing Units | 34 | 100.0% |
| Renter-Occupied Housing Units | 0 | 0.0% |
| Total Occupied Housing Units | 34 | 100.0% |
Occupancy by Household Size in Kinross
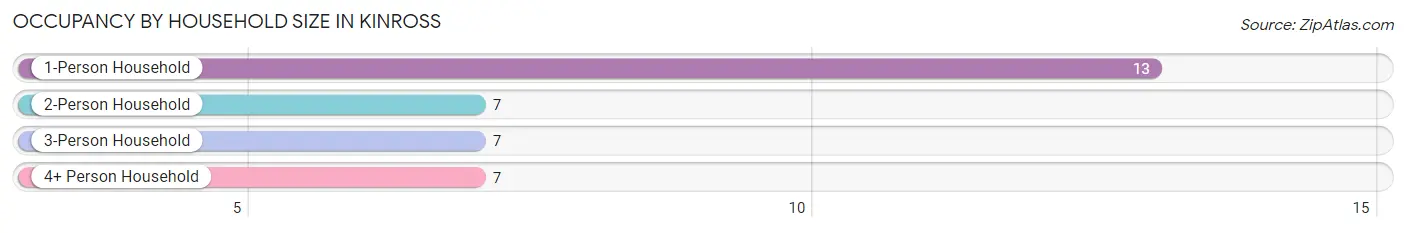
| Household Size | # Housing Units | % Housing Units |
| 1-Person Household | 13 | 38.2% |
| 2-Person Household | 7 | 20.6% |
| 3-Person Household | 7 | 20.6% |
| 4+ Person Household | 7 | 20.6% |
| Total Housing Units | 34 | 100.0% |
Occupancy by Ownership by Household Size in Kinross
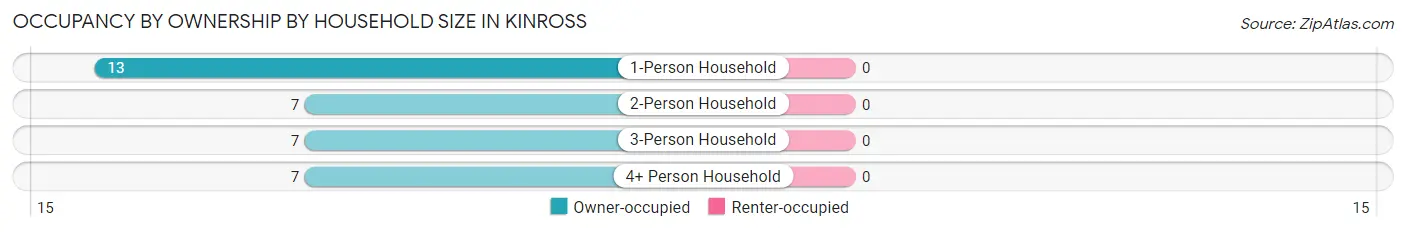
| Household Size | Owner-occupied | Renter-occupied |
| 1-Person Household | 13 (100.0%) | 0 (0.0%) |
| 2-Person Household | 7 (100.0%) | 0 (0.0%) |
| 3-Person Household | 7 (100.0%) | 0 (0.0%) |
| 4+ Person Household | 7 (100.0%) | 0 (0.0%) |
| Total Housing Units | 34 (100.0%) | 0 (0.0%) |
Occupancy by Educational Attainment in Kinross
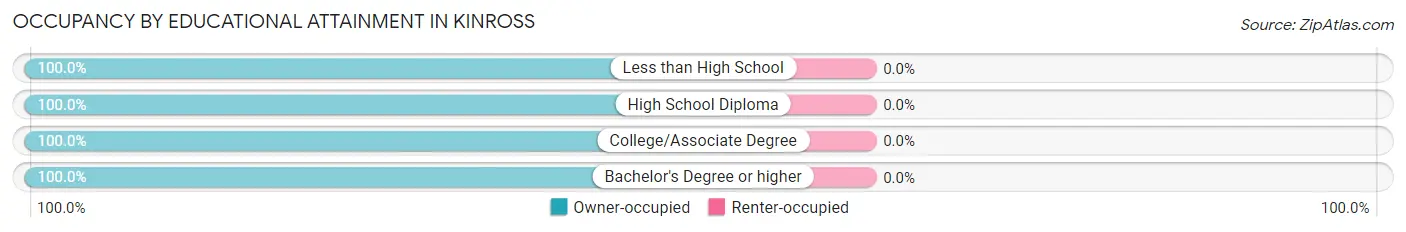
| Household Size | Owner-occupied | Renter-occupied |
| Less than High School | 1 (100.0%) | 0 (0.0%) |
| High School Diploma | 8 (100.0%) | 0 (0.0%) |
| College/Associate Degree | 23 (100.0%) | 0 (0.0%) |
| Bachelor's Degree or higher | 2 (100.0%) | 0 (0.0%) |
Occupancy by Age of Householder in Kinross
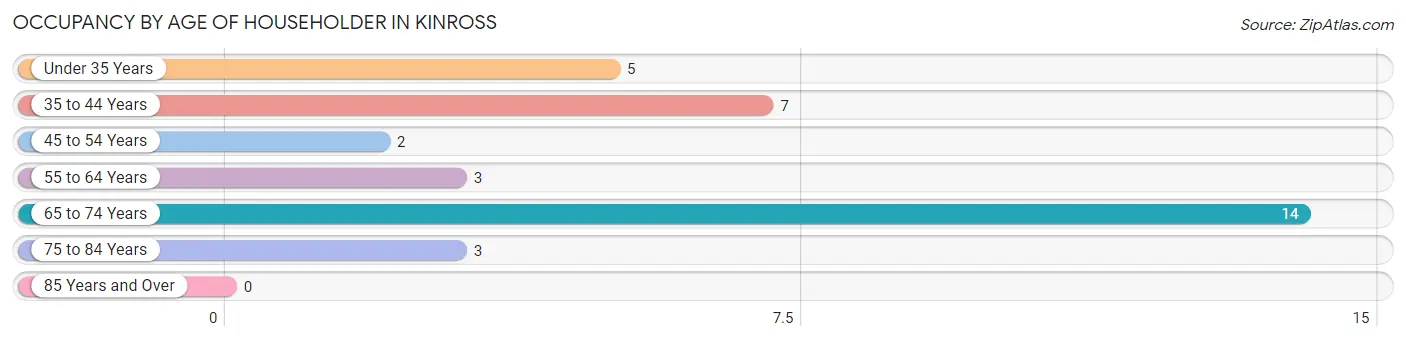
| Age Bracket | # Households | % Households |
| Under 35 Years | 5 | 14.7% |
| 35 to 44 Years | 7 | 20.6% |
| 45 to 54 Years | 2 | 5.9% |
| 55 to 64 Years | 3 | 8.8% |
| 65 to 74 Years | 14 | 41.2% |
| 75 to 84 Years | 3 | 8.8% |
| 85 Years and Over | 0 | 0.0% |
| Total | 34 | 100.0% |
Housing Finances in Kinross
Median Income by Occupancy in Kinross
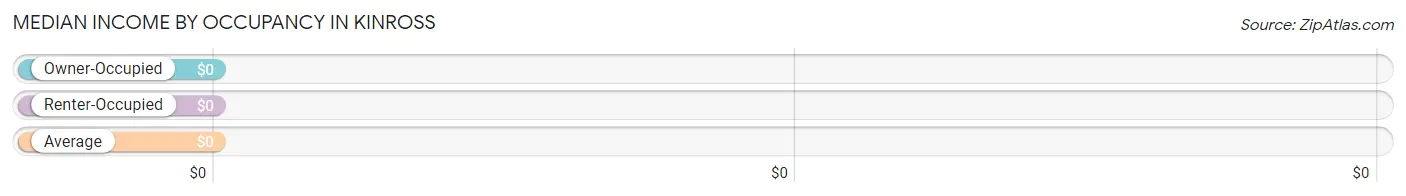
| Occupancy Type | # Households | Median Income |
| Owner-Occupied | 34 (100.0%) | $0 |
| Renter-Occupied | 0 (0.0%) | $0 |
| Average | 34 (100.0%) | $0 |
Occupancy by Householder Income Bracket in Kinross
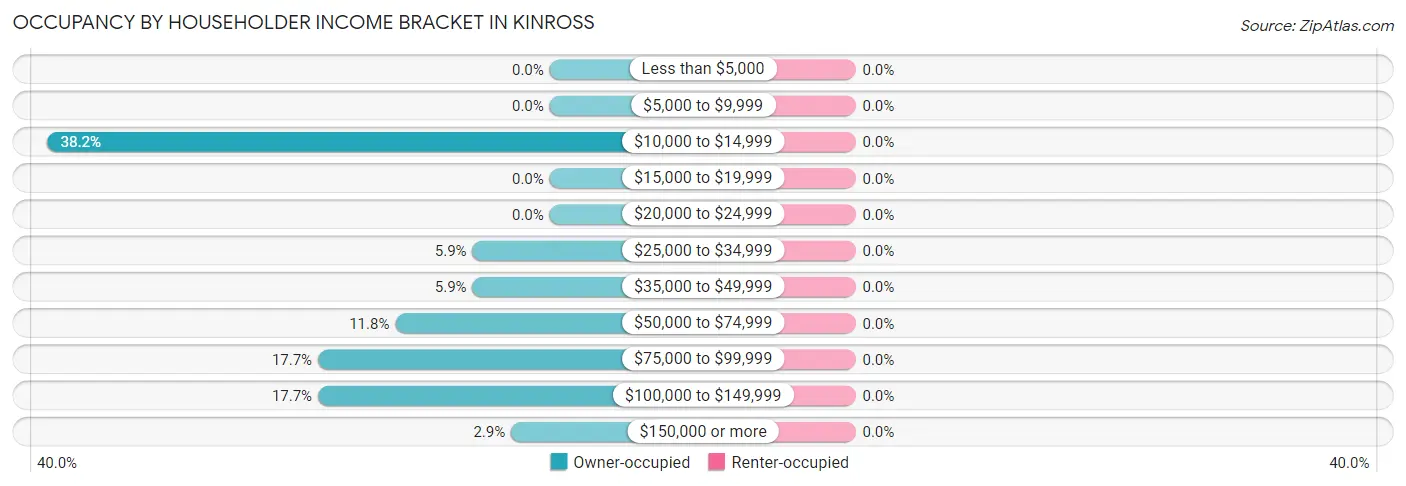
| Income Bracket | Owner-occupied | Renter-occupied |
| Less than $5,000 | 0 (0.0%) | 0 (0.0%) |
| $5,000 to $9,999 | 0 (0.0%) | 0 (0.0%) |
| $10,000 to $14,999 | 13 (38.2%) | 0 (0.0%) |
| $15,000 to $19,999 | 0 (0.0%) | 0 (0.0%) |
| $20,000 to $24,999 | 0 (0.0%) | 0 (0.0%) |
| $25,000 to $34,999 | 2 (5.9%) | 0 (0.0%) |
| $35,000 to $49,999 | 2 (5.9%) | 0 (0.0%) |
| $50,000 to $74,999 | 4 (11.8%) | 0 (0.0%) |
| $75,000 to $99,999 | 6 (17.6%) | 0 (0.0%) |
| $100,000 to $149,999 | 6 (17.6%) | 0 (0.0%) |
| $150,000 or more | 1 (2.9%) | 0 (0.0%) |
| Total | 34 (100.0%) | 0 (0.0%) |
Monthly Housing Cost Tiers in Kinross
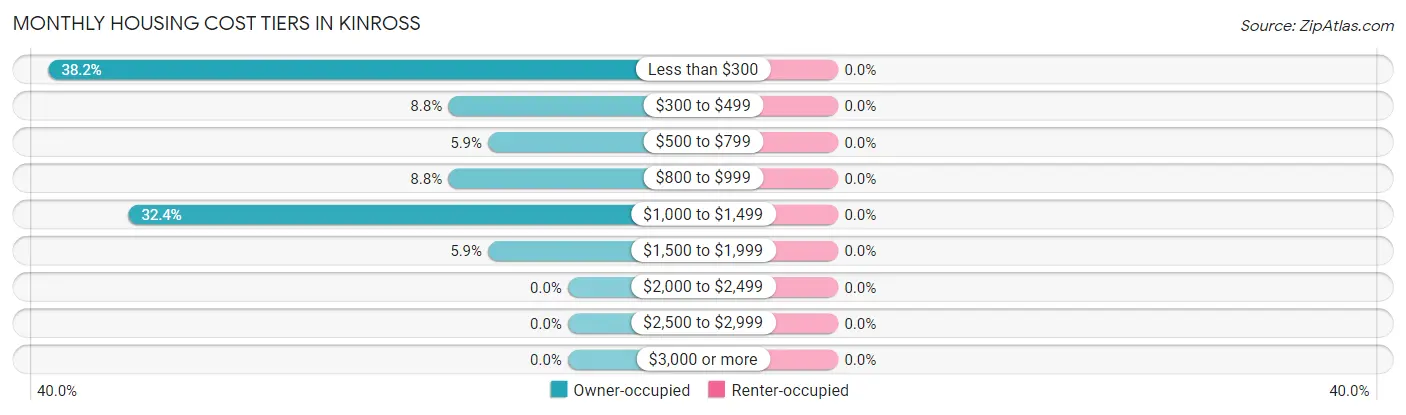
| Monthly Cost | Owner-occupied | Renter-occupied |
| Less than $300 | 13 (38.2%) | 0 (0.0%) |
| $300 to $499 | 3 (8.8%) | 0 (0.0%) |
| $500 to $799 | 2 (5.9%) | 0 (0.0%) |
| $800 to $999 | 3 (8.8%) | 0 (0.0%) |
| $1,000 to $1,499 | 11 (32.4%) | 0 (0.0%) |
| $1,500 to $1,999 | 2 (5.9%) | 0 (0.0%) |
| $2,000 to $2,499 | 0 (0.0%) | 0 (0.0%) |
| $2,500 to $2,999 | 0 (0.0%) | 0 (0.0%) |
| $3,000 or more | 0 (0.0%) | 0 (0.0%) |
| Total | 34 (100.0%) | 0 (0.0%) |
Physical Housing Characteristics in Kinross
Housing Structures in Kinross
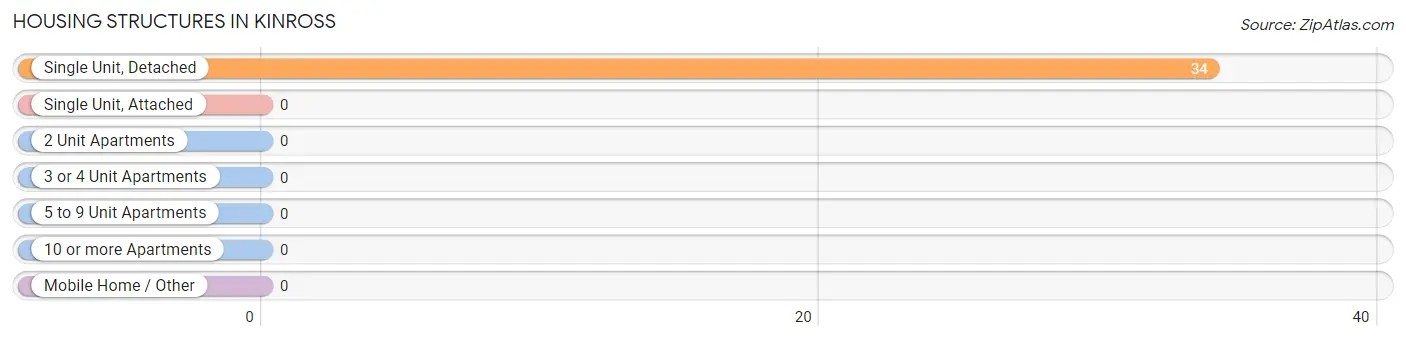
| Structure Type | # Housing Units | % Housing Units |
| Single Unit, Detached | 34 | 100.0% |
| Single Unit, Attached | 0 | 0.0% |
| 2 Unit Apartments | 0 | 0.0% |
| 3 or 4 Unit Apartments | 0 | 0.0% |
| 5 to 9 Unit Apartments | 0 | 0.0% |
| 10 or more Apartments | 0 | 0.0% |
| Mobile Home / Other | 0 | 0.0% |
| Total | 34 | 100.0% |
Housing Structures by Occupancy in Kinross
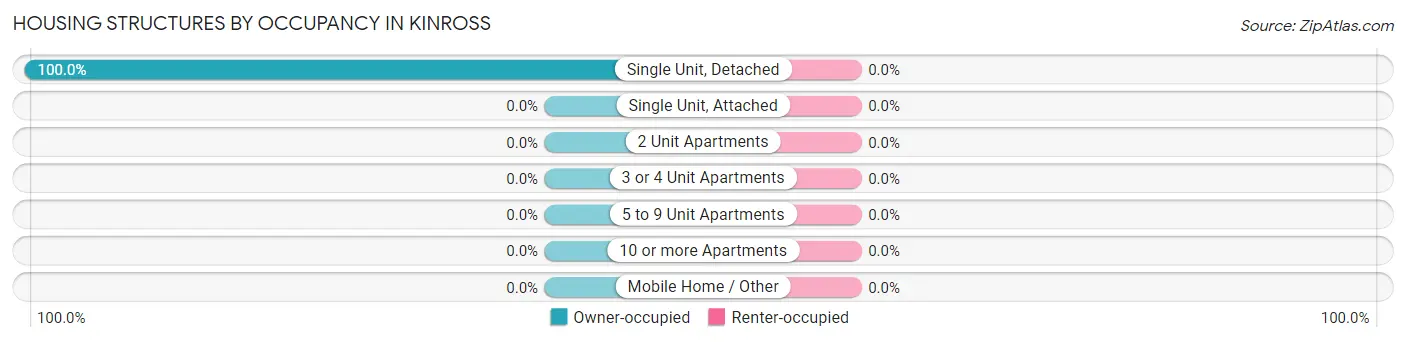
| Structure Type | Owner-occupied | Renter-occupied |
| Single Unit, Detached | 34 (100.0%) | 0 (0.0%) |
| Single Unit, Attached | 0 (0.0%) | 0 (0.0%) |
| 2 Unit Apartments | 0 (0.0%) | 0 (0.0%) |
| 3 or 4 Unit Apartments | 0 (0.0%) | 0 (0.0%) |
| 5 to 9 Unit Apartments | 0 (0.0%) | 0 (0.0%) |
| 10 or more Apartments | 0 (0.0%) | 0 (0.0%) |
| Mobile Home / Other | 0 (0.0%) | 0 (0.0%) |
| Total | 34 (100.0%) | 0 (0.0%) |
Housing Structures by Number of Rooms in Kinross
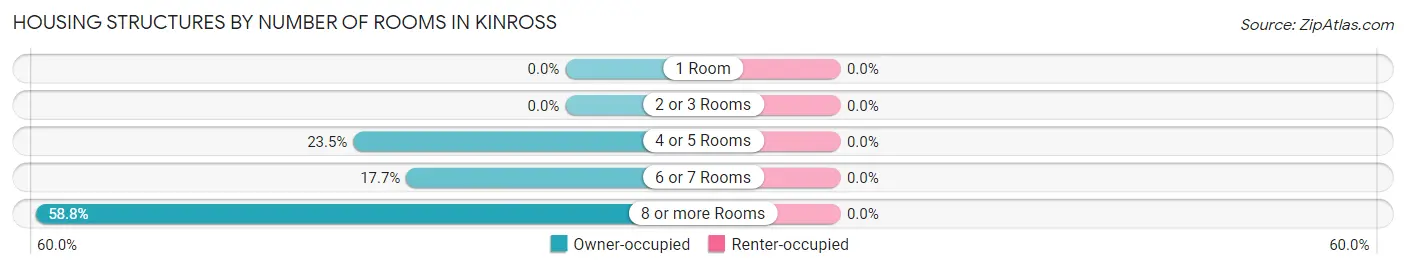
| Number of Rooms | Owner-occupied | Renter-occupied |
| 1 Room | 0 (0.0%) | 0 (0.0%) |
| 2 or 3 Rooms | 0 (0.0%) | 0 (0.0%) |
| 4 or 5 Rooms | 8 (23.5%) | 0 (0.0%) |
| 6 or 7 Rooms | 6 (17.6%) | 0 (0.0%) |
| 8 or more Rooms | 20 (58.8%) | 0 (0.0%) |
| Total | 34 (100.0%) | 0 (0.0%) |
Housing Structure by Heating Type in Kinross
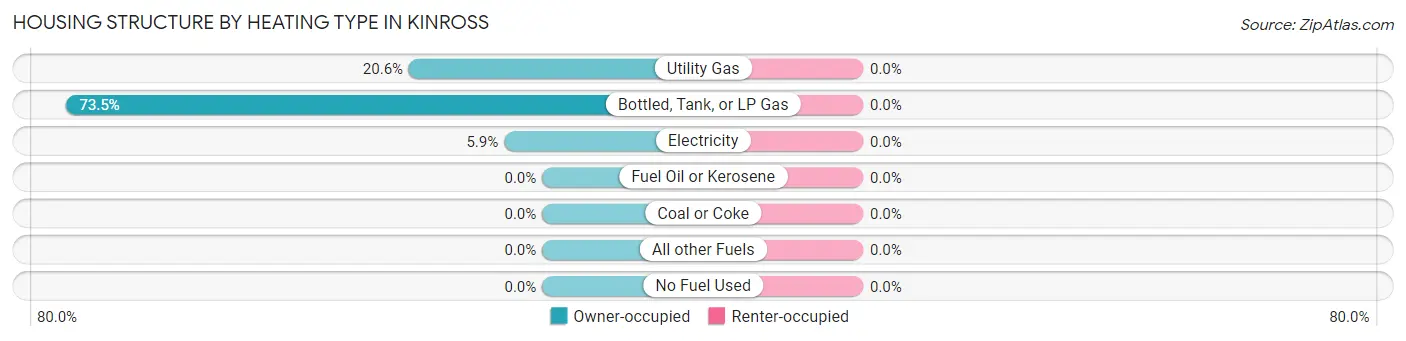
| Heating Type | Owner-occupied | Renter-occupied |
| Utility Gas | 7 (20.6%) | 0 (0.0%) |
| Bottled, Tank, or LP Gas | 25 (73.5%) | 0 (0.0%) |
| Electricity | 2 (5.9%) | 0 (0.0%) |
| Fuel Oil or Kerosene | 0 (0.0%) | 0 (0.0%) |
| Coal or Coke | 0 (0.0%) | 0 (0.0%) |
| All other Fuels | 0 (0.0%) | 0 (0.0%) |
| No Fuel Used | 0 (0.0%) | 0 (0.0%) |
| Total | 34 (100.0%) | 0 (0.0%) |
Household Vehicle Usage in Kinross
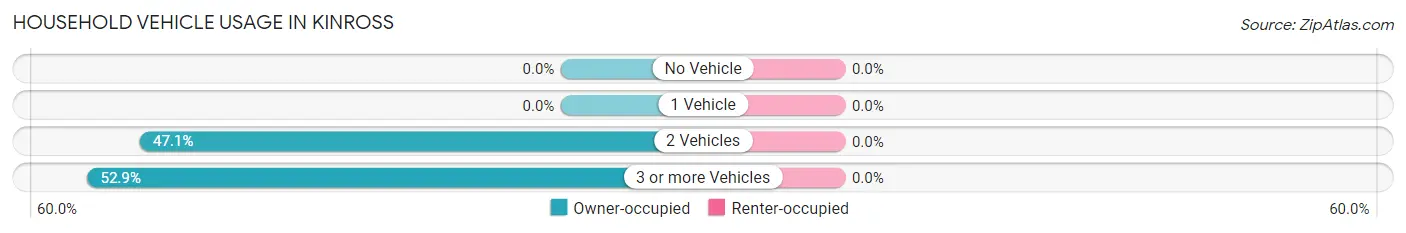
| Vehicles per Household | Owner-occupied | Renter-occupied |
| No Vehicle | 0 (0.0%) | 0 (0.0%) |
| 1 Vehicle | 0 (0.0%) | 0 (0.0%) |
| 2 Vehicles | 16 (47.1%) | 0 (0.0%) |
| 3 or more Vehicles | 18 (52.9%) | 0 (0.0%) |
| Total | 34 (100.0%) | 0 (0.0%) |
Real Estate & Mortgages in Kinross
Real Estate and Mortgage Overview in Kinross
| Characteristic | Without Mortgage | With Mortgage |
| Housing Units | 19 | 15 |
| Median Property Value | $38,700 | $81,700 |
| Median Household Income | - | - |
| Monthly Housing Costs | - | - |
| Real Estate Taxes | - | - |
Property Value by Mortgage Status in Kinross
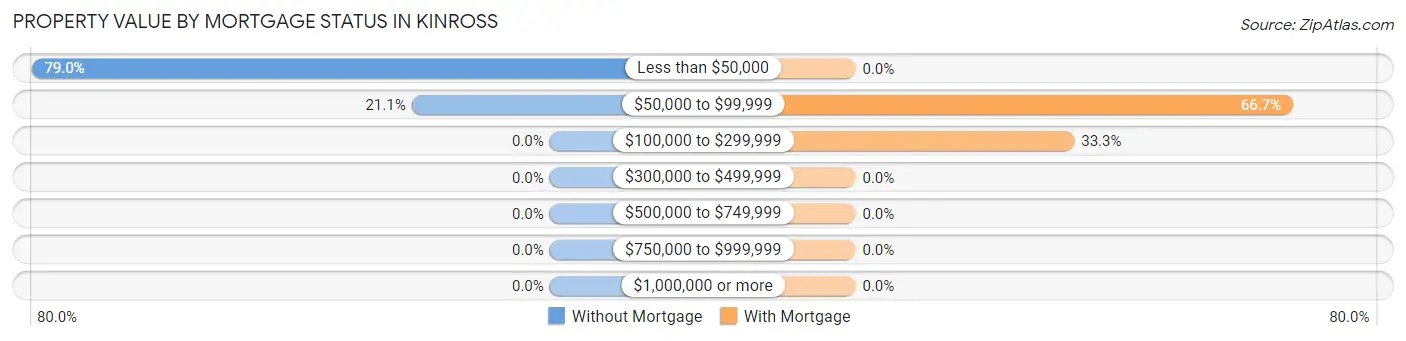
| Property Value | Without Mortgage | With Mortgage |
| Less than $50,000 | 15 (78.9%) | 0 (0.0%) |
| $50,000 to $99,999 | 4 (21.0%) | 10 (66.7%) |
| $100,000 to $299,999 | 0 (0.0%) | 5 (33.3%) |
| $300,000 to $499,999 | 0 (0.0%) | 0 (0.0%) |
| $500,000 to $749,999 | 0 (0.0%) | 0 (0.0%) |
| $750,000 to $999,999 | 0 (0.0%) | 0 (0.0%) |
| $1,000,000 or more | 0 (0.0%) | 0 (0.0%) |
| Total | 19 (100.0%) | 15 (100.0%) |
Household Income by Mortgage Status in Kinross
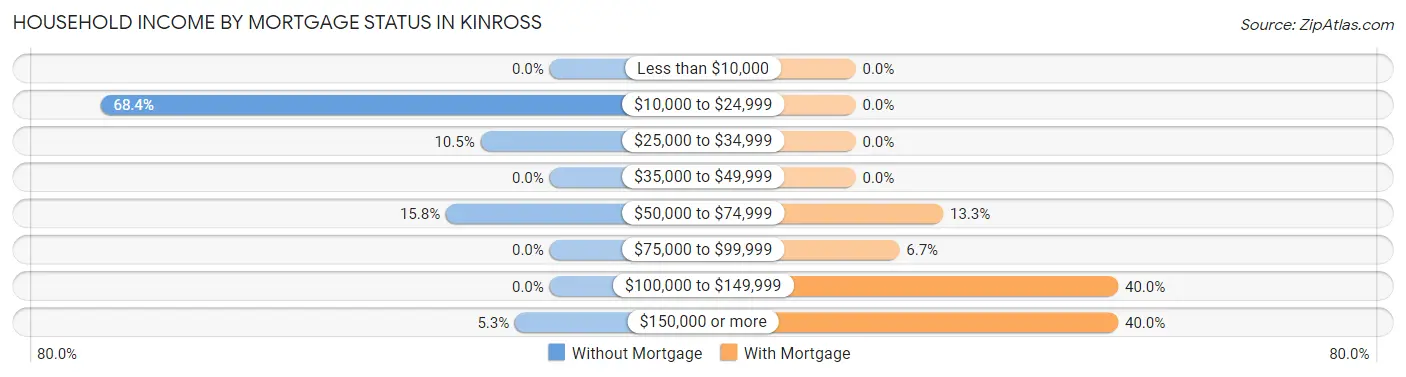
| Household Income | Without Mortgage | With Mortgage |
| Less than $10,000 | 0 (0.0%) | 0 (0.0%) |
| $10,000 to $24,999 | 13 (68.4%) | 0 (0.0%) |
| $25,000 to $34,999 | 2 (10.5%) | 0 (0.0%) |
| $35,000 to $49,999 | 0 (0.0%) | 0 (0.0%) |
| $50,000 to $74,999 | 3 (15.8%) | 2 (13.3%) |
| $75,000 to $99,999 | 0 (0.0%) | 1 (6.7%) |
| $100,000 to $149,999 | 0 (0.0%) | 6 (40.0%) |
| $150,000 or more | 1 (5.3%) | 6 (40.0%) |
| Total | 19 (100.0%) | 15 (100.0%) |
Property Value to Household Income Ratio in Kinross
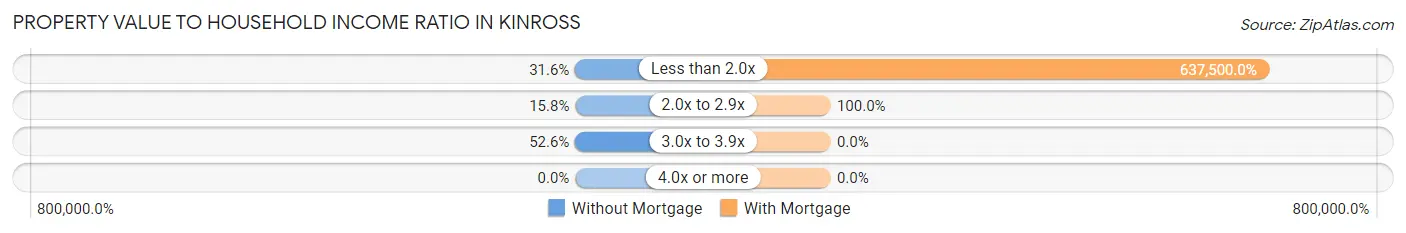
| Value-to-Income Ratio | Without Mortgage | With Mortgage |
| Less than 2.0x | 6 (31.6%) | 95,625 (637,500.0%) |
| 2.0x to 2.9x | 3 (15.8%) | 15 (100.0%) |
| 3.0x to 3.9x | 10 (52.6%) | 0 (0.0%) |
| 4.0x or more | 0 (0.0%) | 0 (0.0%) |
| Total | 19 (100.0%) | 15 (100.0%) |
Real Estate Taxes by Mortgage Status in Kinross
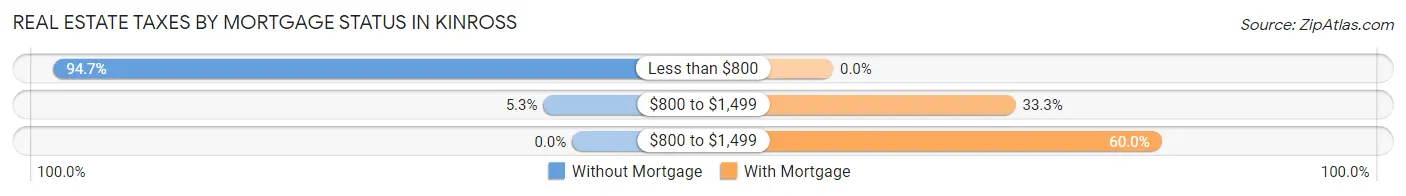
| Property Taxes | Without Mortgage | With Mortgage |
| Less than $800 | 18 (94.7%) | 0 (0.0%) |
| $800 to $1,499 | 1 (5.3%) | 5 (33.3%) |
| $800 to $1,499 | 0 (0.0%) | 9 (60.0%) |
| Total | 19 (100.0%) | 15 (100.0%) |
Health & Disability in Kinross
Health Insurance Coverage by Age in Kinross
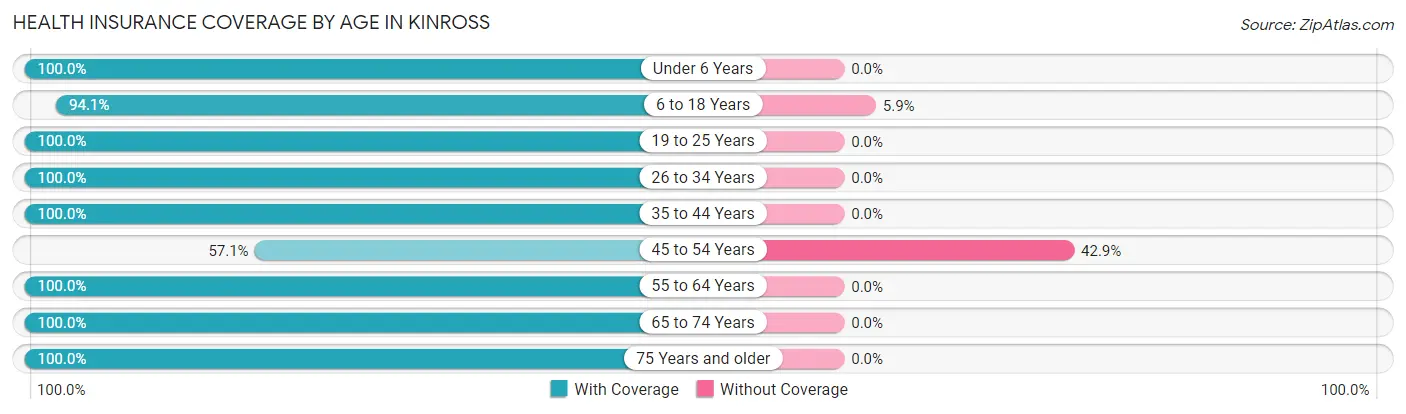
| Age Bracket | With Coverage | Without Coverage |
| Under 6 Years | 7 (100.0%) | 0 (0.0%) |
| 6 to 18 Years | 32 (94.1%) | 2 (5.9%) |
| 19 to 25 Years | 4 (100.0%) | 0 (0.0%) |
| 26 to 34 Years | 12 (100.0%) | 0 (0.0%) |
| 35 to 44 Years | 14 (100.0%) | 0 (0.0%) |
| 45 to 54 Years | 4 (57.1%) | 3 (42.9%) |
| 55 to 64 Years | 4 (100.0%) | 0 (0.0%) |
| 65 to 74 Years | 16 (100.0%) | 0 (0.0%) |
| 75 Years and older | 6 (100.0%) | 0 (0.0%) |
| Total | 99 (95.2%) | 5 (4.8%) |
Health Insurance Coverage by Citizenship Status in Kinross
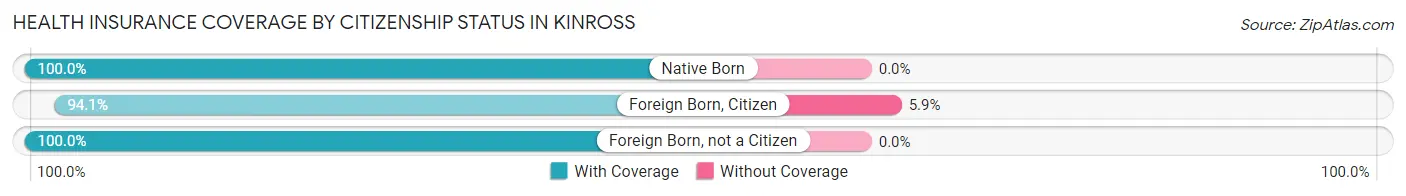
| Citizenship Status | With Coverage | Without Coverage |
| Native Born | 7 (100.0%) | 0 (0.0%) |
| Foreign Born, Citizen | 32 (94.1%) | 2 (5.9%) |
| Foreign Born, not a Citizen | 4 (100.0%) | 0 (0.0%) |
Health Insurance Coverage by Household Income in Kinross
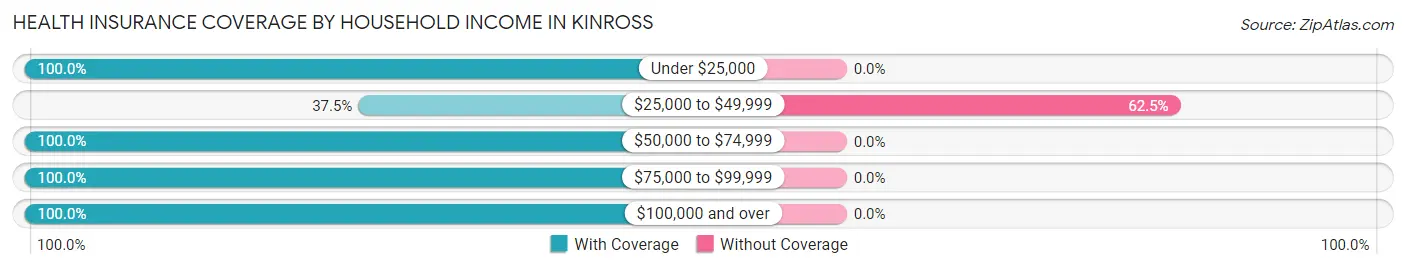
| Household Income | With Coverage | Without Coverage |
| Under $25,000 | 13 (100.0%) | 0 (0.0%) |
| $25,000 to $49,999 | 3 (37.5%) | 5 (62.5%) |
| $50,000 to $74,999 | 10 (100.0%) | 0 (0.0%) |
| $75,000 to $99,999 | 44 (100.0%) | 0 (0.0%) |
| $100,000 and over | 29 (100.0%) | 0 (0.0%) |
Public vs Private Health Insurance Coverage by Age in Kinross
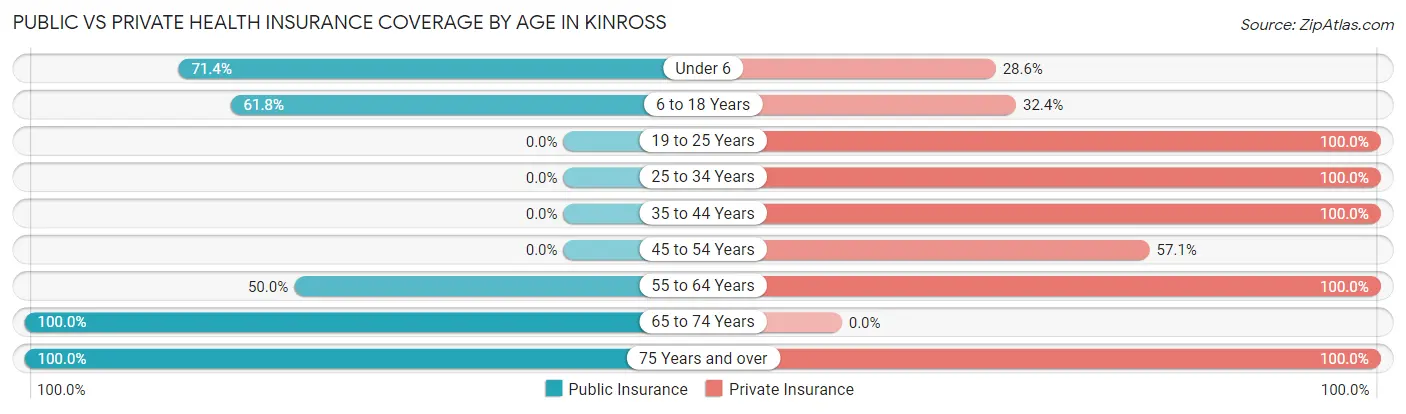
| Age Bracket | Public Insurance | Private Insurance |
| Under 6 | 5 (71.4%) | 2 (28.6%) |
| 6 to 18 Years | 21 (61.8%) | 11 (32.4%) |
| 19 to 25 Years | 0 (0.0%) | 4 (100.0%) |
| 25 to 34 Years | 0 (0.0%) | 12 (100.0%) |
| 35 to 44 Years | 0 (0.0%) | 14 (100.0%) |
| 45 to 54 Years | 0 (0.0%) | 4 (57.1%) |
| 55 to 64 Years | 2 (50.0%) | 4 (100.0%) |
| 65 to 74 Years | 16 (100.0%) | 0 (0.0%) |
| 75 Years and over | 6 (100.0%) | 6 (100.0%) |
| Total | 50 (48.1%) | 57 (54.8%) |
Disability Status by Sex by Age in Kinross
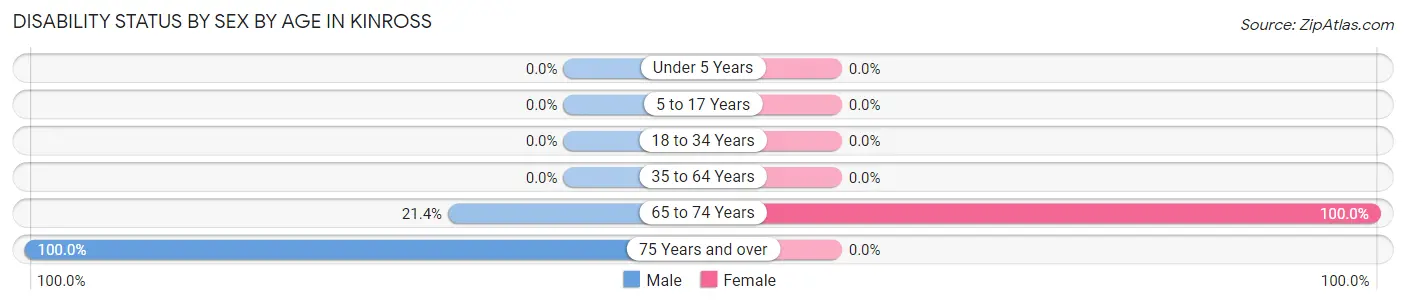
| Age Bracket | Male | Female |
| Under 5 Years | 0 (0.0%) | 0 (0.0%) |
| 5 to 17 Years | 0 (0.0%) | 0 (0.0%) |
| 18 to 34 Years | 0 (0.0%) | 0 (0.0%) |
| 35 to 64 Years | 0 (0.0%) | 0 (0.0%) |
| 65 to 74 Years | 3 (21.4%) | 2 (100.0%) |
| 75 Years and over | 3 (100.0%) | 0 (0.0%) |
Disability Class by Sex by Age in Kinross
Disability Class: Hearing Difficulty
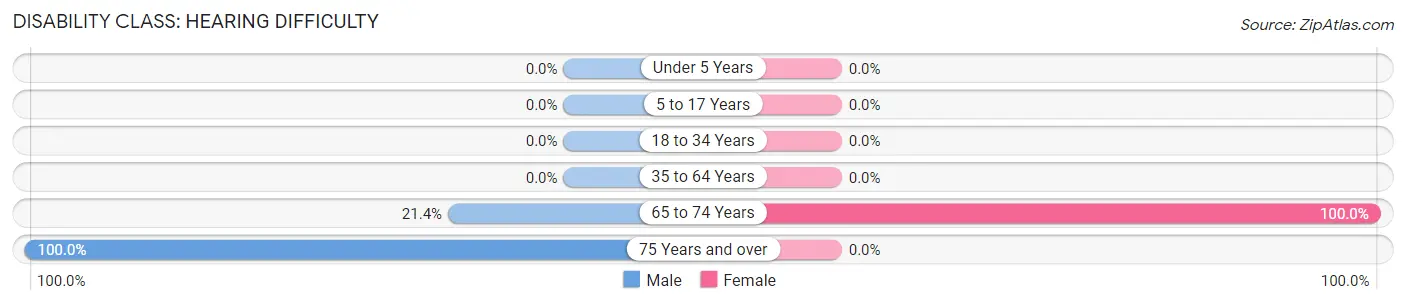
| Age Bracket | Male | Female |
| Under 5 Years | 0 (0.0%) | 0 (0.0%) |
| 5 to 17 Years | 0 (0.0%) | 0 (0.0%) |
| 18 to 34 Years | 0 (0.0%) | 0 (0.0%) |
| 35 to 64 Years | 0 (0.0%) | 0 (0.0%) |
| 65 to 74 Years | 3 (21.4%) | 2 (100.0%) |
| 75 Years and over | 3 (100.0%) | 0 (0.0%) |
Disability Class: Vision Difficulty
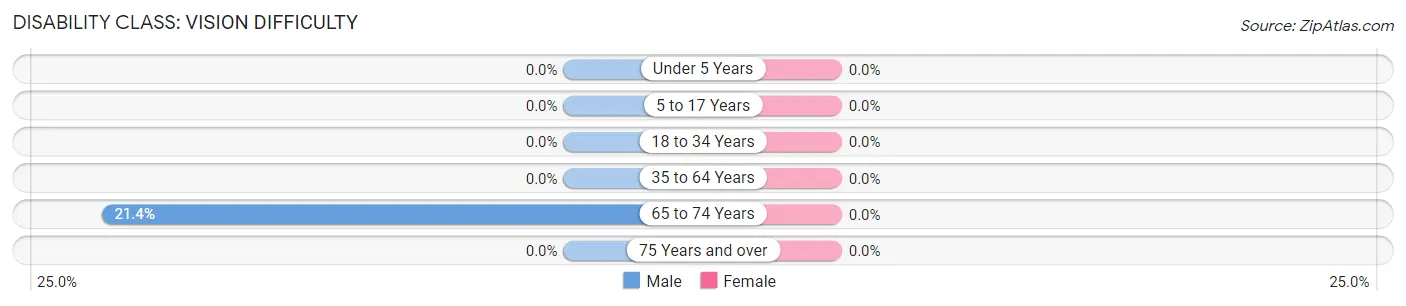
| Age Bracket | Male | Female |
| Under 5 Years | 0 (0.0%) | 0 (0.0%) |
| 5 to 17 Years | 0 (0.0%) | 0 (0.0%) |
| 18 to 34 Years | 0 (0.0%) | 0 (0.0%) |
| 35 to 64 Years | 0 (0.0%) | 0 (0.0%) |
| 65 to 74 Years | 3 (21.4%) | 0 (0.0%) |
| 75 Years and over | 0 (0.0%) | 0 (0.0%) |
Disability Class: Cognitive Difficulty
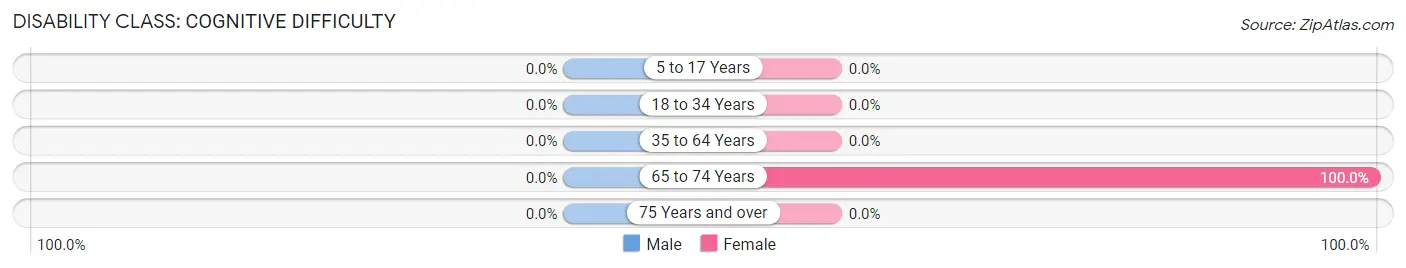
| Age Bracket | Male | Female |
| 5 to 17 Years | 0 (0.0%) | 0 (0.0%) |
| 18 to 34 Years | 0 (0.0%) | 0 (0.0%) |
| 35 to 64 Years | 0 (0.0%) | 0 (0.0%) |
| 65 to 74 Years | 0 (0.0%) | 2 (100.0%) |
| 75 Years and over | 0 (0.0%) | 0 (0.0%) |
Disability Class: Ambulatory Difficulty
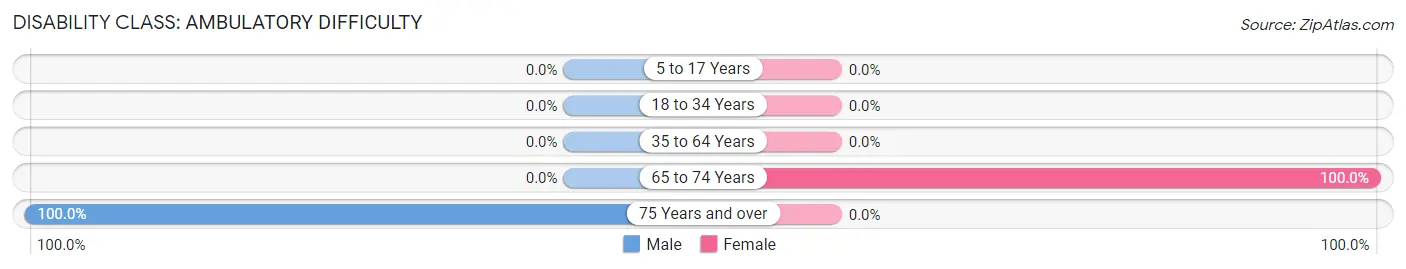
| Age Bracket | Male | Female |
| 5 to 17 Years | 0 (0.0%) | 0 (0.0%) |
| 18 to 34 Years | 0 (0.0%) | 0 (0.0%) |
| 35 to 64 Years | 0 (0.0%) | 0 (0.0%) |
| 65 to 74 Years | 0 (0.0%) | 2 (100.0%) |
| 75 Years and over | 3 (100.0%) | 0 (0.0%) |
Disability Class: Self-Care Difficulty
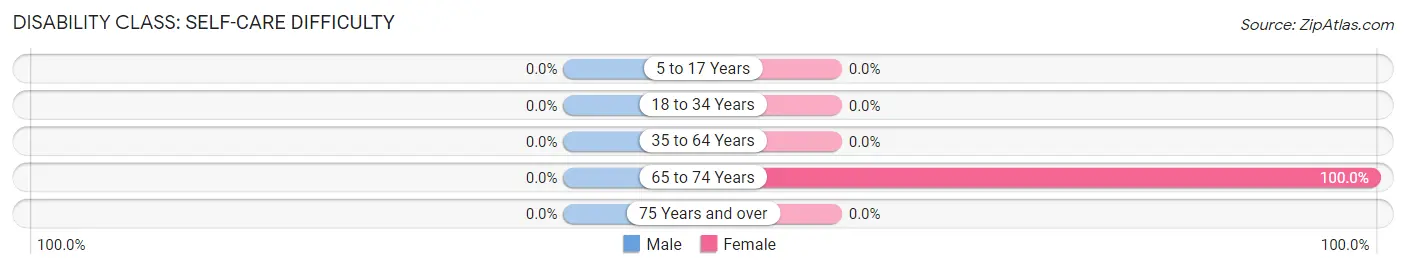
| Age Bracket | Male | Female |
| 5 to 17 Years | 0 (0.0%) | 0 (0.0%) |
| 18 to 34 Years | 0 (0.0%) | 0 (0.0%) |
| 35 to 64 Years | 0 (0.0%) | 0 (0.0%) |
| 65 to 74 Years | 0 (0.0%) | 2 (100.0%) |
| 75 Years and over | 0 (0.0%) | 0 (0.0%) |
Technology Access in Kinross
Computing Device Access in Kinross
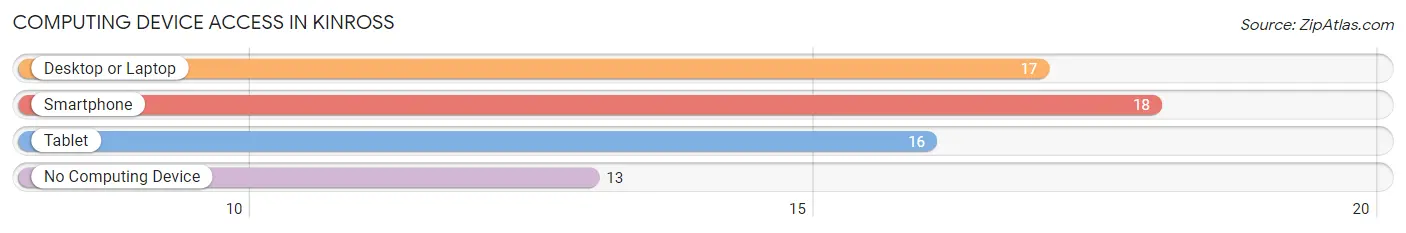
| Device Type | # Households | % Households |
| Desktop or Laptop | 17 | 50.0% |
| Smartphone | 18 | 52.9% |
| Tablet | 16 | 47.1% |
| No Computing Device | 13 | 38.2% |
| Total | 34 | 100.0% |
Internet Access in Kinross
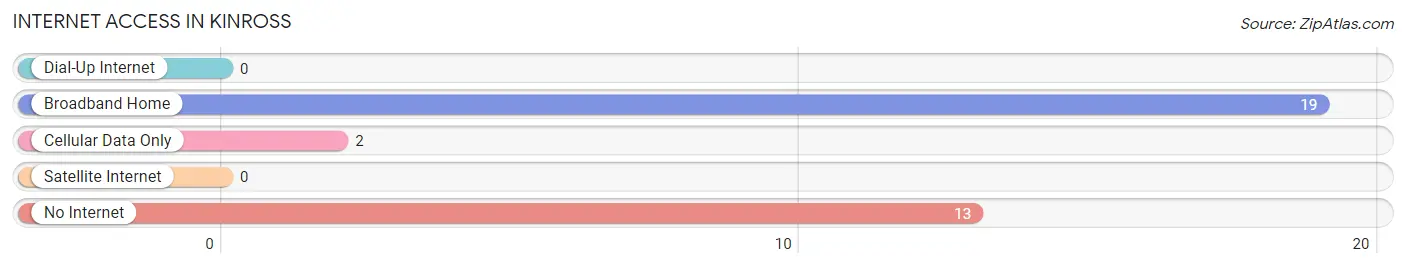
| Internet Type | # Households | % Households |
| Dial-Up Internet | 0 | 0.0% |
| Broadband Home | 19 | 55.9% |
| Cellular Data Only | 2 | 5.9% |
| Satellite Internet | 0 | 0.0% |
| No Internet | 13 | 38.2% |
| Total | 34 | 100.0% |
Kinross Summary
History
The small town of Kinross, Iowa is located in the southeastern corner of the state, in Appanoose County. It was founded in 1854 by a group of settlers from Scotland, who named the town after their hometown of Kinross, Scotland. The town was originally a farming community, and the settlers grew corn, wheat, and oats. The town was also known for its brickyards, which produced bricks for many of the buildings in the area.
In the late 1800s, the town began to grow and develop. The railroad came to town in 1881, and the town was incorporated in 1883. The railroad brought new businesses and industries to the area, and the town began to thrive. The population grew to over 500 by the early 1900s.
In the early 1900s, the town was home to several businesses, including a bank, a hotel, a general store, a blacksmith shop, and a lumberyard. The town also had a school, a post office, and a newspaper.
In the 1920s, the town began to decline. The railroad stopped running, and many of the businesses closed. The population dropped to just over 200 by the 1940s.
In the 1950s, the town began to experience a resurgence. The railroad was restored, and new businesses opened. The population grew to over 500 by the 1960s.
Today, Kinross is a small, rural town with a population of just over 500. The town is still primarily agricultural, and the main crops are corn, soybeans, and hay. The town also has a few small businesses, including a grocery store, a hardware store, and a restaurant.
Geography
Kinross is located in the southeastern corner of Iowa, in Appanoose County. The town is situated on the banks of the Chariton River, and is surrounded by rolling hills and farmland. The town is located about 30 miles from the state capital of Des Moines.
The climate in Kinross is typical of the Midwest, with hot summers and cold winters. The average temperature in the summer is around 80 degrees Fahrenheit, and the average temperature in the winter is around 20 degrees Fahrenheit. The town receives an average of 40 inches of precipitation each year.
Economy
The economy of Kinross is primarily agricultural. The main crops are corn, soybeans, and hay. The town also has a few small businesses, including a grocery store, a hardware store, and a restaurant.
The town is also home to a few manufacturing companies, including a furniture factory and a plastics factory. The town also has a few small service businesses, such as a gas station and a car repair shop.
Demographics
As of the 2010 census, the population of Kinross was 514. The population is primarily white (97.3%), with a small percentage of African Americans (1.2%) and Hispanics (1.2%). The median household income is $41,250, and the median age is 43.
The town is served by the Appanoose County School District, which includes two elementary schools, one middle school, and one high school. The town also has a public library and a few churches.
Common Questions
What is Per Capita Income in Kinross?
Per Capita income in Kinross is $18,480.
What is the Median Family Income in Kinross?
Median Family Income in Kinross is $77,813.
What is Inequality or Gini Index in Kinross?
Inequality or Gini Index in Kinross is 0.44.
What is the Total Population of Kinross?
Total Population of Kinross is 104.
What is the Total Male Population of Kinross?
Total Male Population of Kinross is 58.
What is the Total Female Population of Kinross?
Total Female Population of Kinross is 46.
What is the Ratio of Males per 100 Females in Kinross?
There are 126.09 Males per 100 Females in Kinross.
What is the Ratio of Females per 100 Males in Kinross?
There are 79.31 Females per 100 Males in Kinross.
What is the Median Population Age in Kinross?
Median Population Age in Kinross is 31.8 Years.
What is the Average Family Size in Kinross
Average Family Size in Kinross is 4.0 People.
What is the Average Household Size in Kinross
Average Household Size in Kinross is 3.1 People.
How Large is the Labor Force in Kinross?
There are 34 People in the Labor Forcein in Kinross.
What is the Percentage of People in the Labor Force in Kinross?
52.3% of People are in the Labor Force in Kinross.
What is the Unemployment Rate in Kinross?
Unemployment Rate in Kinross is 8.8%.