Jewell Junction, IA Map & Demographics
Jewell Junction Map
Jewell Junction Overview
$45,059
PER CAPITA INCOME
$88,750
AVG FAMILY INCOME
$75,179
AVG HOUSEHOLD INCOME
44.2%
WAGE / INCOME GAP [ % ]
55.8¢/ $1
WAGE / INCOME GAP [ $ ]
0.47
INEQUALITY / GINI INDEX
1,284
TOTAL POPULATION
598
MALE POPULATION
686
FEMALE POPULATION
87.17
MALES / 100 FEMALES
114.72
FEMALES / 100 MALES
36.2
MEDIAN AGE
3.3
AVG FAMILY SIZE
2.5
AVG HOUSEHOLD SIZE
724
LABOR FORCE [ PEOPLE ]
71.6%
PERCENT IN LABOR FORCE
0.7%
UNEMPLOYMENT RATE
Income in Jewell Junction
Income Overview in Jewell Junction
Per Capita Income in Jewell Junction is $45,059, while median incomes of families and households are $88,750 and $75,179 respectively.
| Characteristic | Number | Measure |
| Per Capita Income | 1,284 | $45,059 |
| Median Family Income | 318 | $88,750 |
| Mean Family Income | 318 | $128,926 |
| Median Household Income | 507 | $75,179 |
| Mean Household Income | 507 | $103,267 |
| Income Deficit | 318 | $0 |
| Wage / Income Gap (%) | 1,284 | 44.15% |
| Wage / Income Gap ($) | 1,284 | 55.85¢ per $1 |
| Gini / Inequality Index | 1,284 | 0.47 |
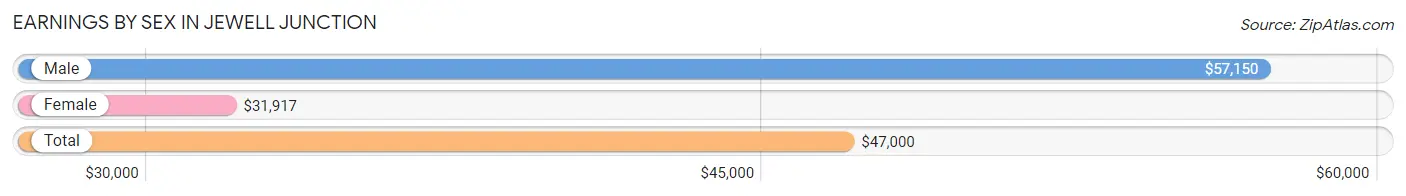
Earnings by Sex in Jewell Junction
Average Earnings in Jewell Junction are $47,000, $57,150 for men and $31,917 for women, a difference of 44.2%.
| Sex | Number | Average Earnings |
| Male | 391 (51.7%) | $57,150 |
| Female | 365 (48.3%) | $31,917 |
| Total | 756 (100.0%) | $47,000 |
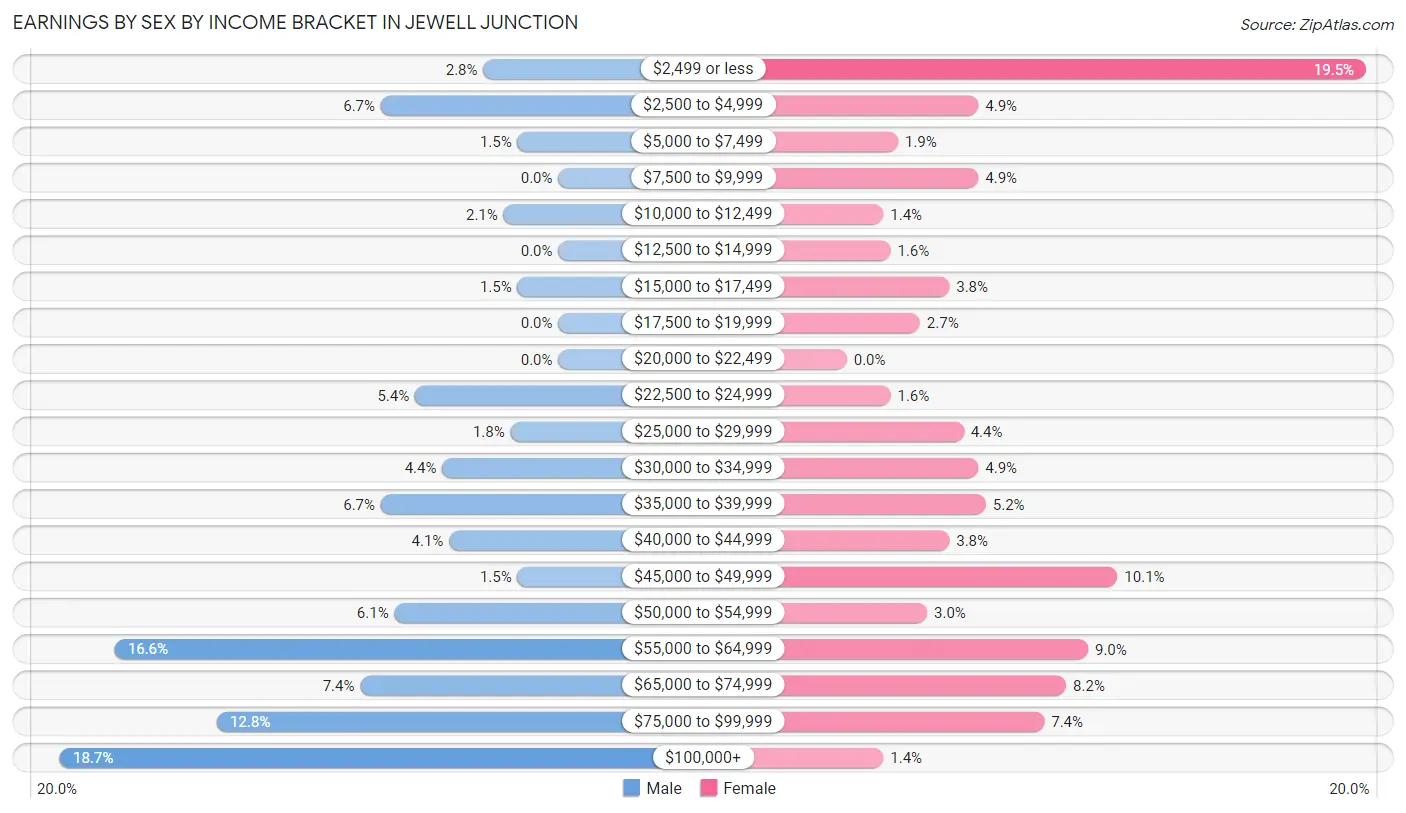
Earnings by Sex by Income Bracket in Jewell Junction
The most common earnings brackets in Jewell Junction are $100,000+ for men (73 | 18.7%) and $2,499 or less for women (71 | 19.5%).
| Income | Male | Female |
| $2,499 or less | 11 (2.8%) | 71 (19.5%) |
| $2,500 to $4,999 | 26 (6.7%) | 18 (4.9%) |
| $5,000 to $7,499 | 6 (1.5%) | 7 (1.9%) |
| $7,500 to $9,999 | 0 (0.0%) | 18 (4.9%) |
| $10,000 to $12,499 | 8 (2.1%) | 5 (1.4%) |
| $12,500 to $14,999 | 0 (0.0%) | 6 (1.6%) |
| $15,000 to $17,499 | 6 (1.5%) | 14 (3.8%) |
| $17,500 to $19,999 | 0 (0.0%) | 10 (2.7%) |
| $20,000 to $22,499 | 0 (0.0%) | 0 (0.0%) |
| $22,500 to $24,999 | 21 (5.4%) | 6 (1.6%) |
| $25,000 to $29,999 | 7 (1.8%) | 16 (4.4%) |
| $30,000 to $34,999 | 17 (4.3%) | 18 (4.9%) |
| $35,000 to $39,999 | 26 (6.7%) | 19 (5.2%) |
| $40,000 to $44,999 | 16 (4.1%) | 14 (3.8%) |
| $45,000 to $49,999 | 6 (1.5%) | 37 (10.1%) |
| $50,000 to $54,999 | 24 (6.1%) | 11 (3.0%) |
| $55,000 to $64,999 | 65 (16.6%) | 33 (9.0%) |
| $65,000 to $74,999 | 29 (7.4%) | 30 (8.2%) |
| $75,000 to $99,999 | 50 (12.8%) | 27 (7.4%) |
| $100,000+ | 73 (18.7%) | 5 (1.4%) |
| Total | 391 (100.0%) | 365 (100.0%) |
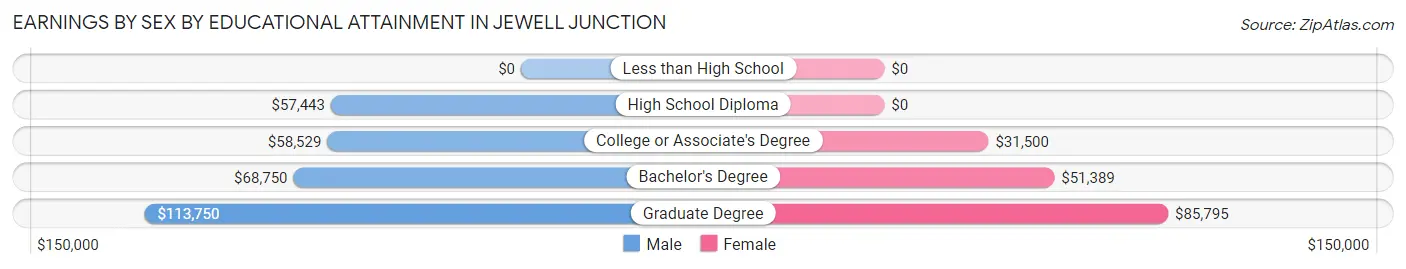
Earnings by Sex by Educational Attainment in Jewell Junction
Average earnings in Jewell Junction are $61,042 for men and $45,313 for women, a difference of 25.8%. Men with an educational attainment of graduate degree enjoy the highest average annual earnings of $113,750, while those with high school diploma education earn the least with $57,443. Women with an educational attainment of graduate degree earn the most with the average annual earnings of $85,795, while those with college or associate's degree education have the smallest earnings of $31,500.
| Educational Attainment | Male Income | Female Income |
| Less than High School | - | - |
| High School Diploma | $57,443 | $0 |
| College or Associate's Degree | $58,529 | $31,500 |
| Bachelor's Degree | $68,750 | $51,389 |
| Graduate Degree | $113,750 | $85,795 |
| Total | $61,042 | $45,313 |
Family Income in Jewell Junction
Family Income Brackets in Jewell Junction
According to the Jewell Junction family income data, there are 65 families falling into the $100,000 to $149,999 income range, which is the most common income bracket and makes up 20.4% of all families. Conversely, the $10,000 to $14,999 income bracket is the least frequent group with only 1 families (0.3%) belonging to this category.
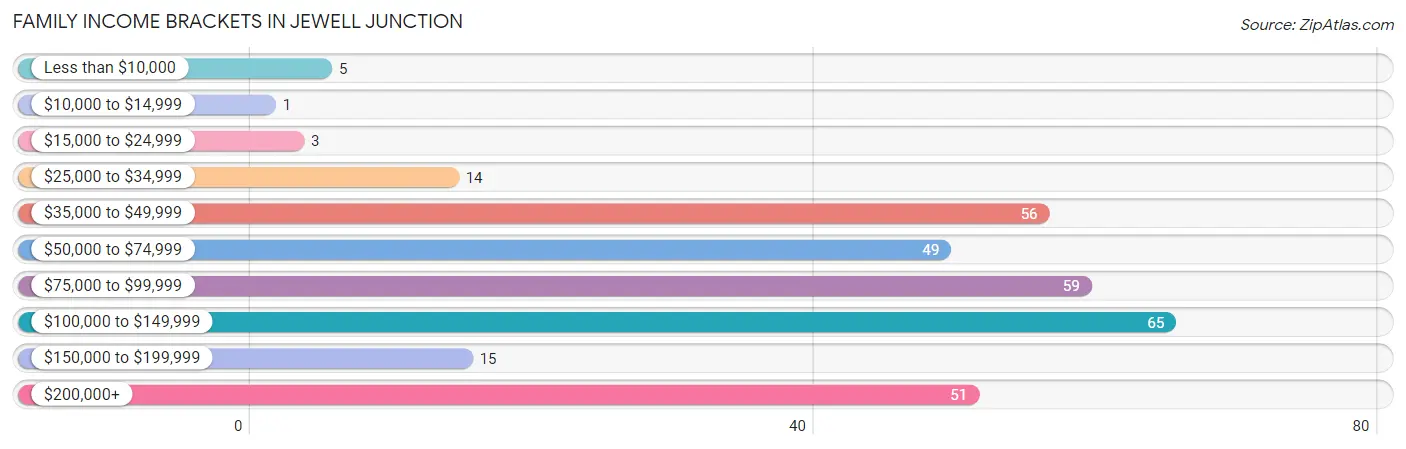
| Income Bracket | # Families | % Families |
| Less than $10,000 | 5 | 1.6% |
| $10,000 to $14,999 | 1 | 0.3% |
| $15,000 to $24,999 | 3 | 0.9% |
| $25,000 to $34,999 | 14 | 4.4% |
| $35,000 to $49,999 | 56 | 17.6% |
| $50,000 to $74,999 | 49 | 15.4% |
| $75,000 to $99,999 | 59 | 18.6% |
| $100,000 to $149,999 | 65 | 20.4% |
| $150,000 to $199,999 | 15 | 4.7% |
| $200,000+ | 51 | 16.0% |
Family Income by Famaliy Size in Jewell Junction
3-person families (101 | 31.8%) account for the highest median family income in Jewell Junction with $113,203 per family, while 3-person families (101 | 31.8%) have the highest median income of $37,734 per family member.
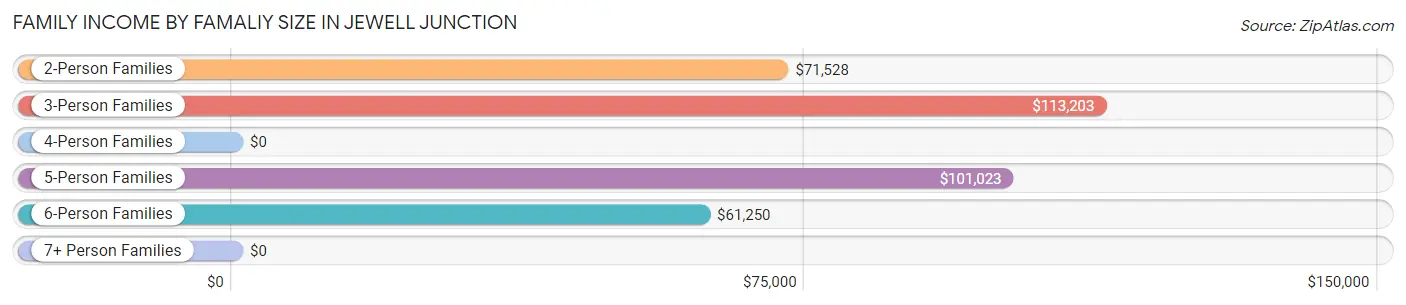
| Income Bracket | # Families | Median Income |
| 2-Person Families | 127 (39.9%) | $71,528 |
| 3-Person Families | 101 (31.8%) | $113,203 |
| 4-Person Families | 45 (14.1%) | $0 |
| 5-Person Families | 33 (10.4%) | $101,023 |
| 6-Person Families | 12 (3.8%) | $61,250 |
| 7+ Person Families | 0 (0.0%) | $0 |
| Total | 318 (100.0%) | $88,750 |
Family Income by Number of Earners in Jewell Junction
The median family income in Jewell Junction is $88,750, with families comprising 3+ earners (33) having the highest median family income of $102,386, while families with no earners (21) have the lowest median family income of $56,250, accounting for 10.4% and 6.6% of families, respectively.

| Number of Earners | # Families | Median Income |
| No Earners | 21 (6.6%) | $56,250 |
| 1 Earner | 122 (38.4%) | $64,250 |
| 2 Earners | 142 (44.7%) | $94,833 |
| 3+ Earners | 33 (10.4%) | $102,386 |
| Total | 318 (100.0%) | $88,750 |
Household Income in Jewell Junction
Household Income Brackets in Jewell Junction
With 116 households falling in the category, the $100,000 to $149,999 income range is the most frequent in Jewell Junction, accounting for 22.9% of all households. In contrast, only 7 households (1.4%) fall into the $10,000 to $14,999 income bracket, making it the least populous group.
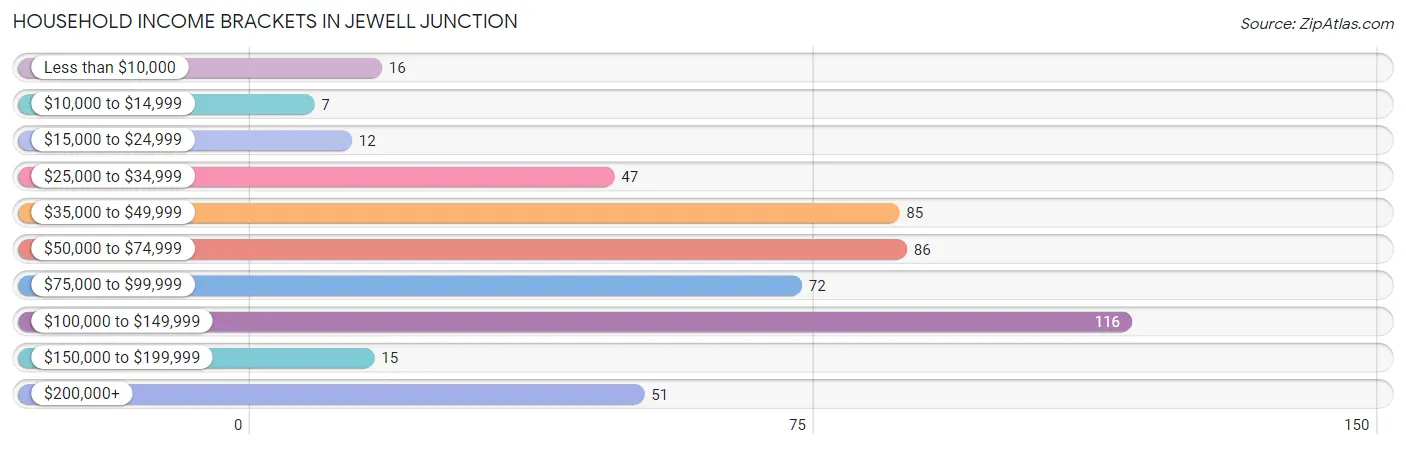
| Income Bracket | # Households | % Households |
| Less than $10,000 | 16 | 3.2% |
| $10,000 to $14,999 | 7 | 1.4% |
| $15,000 to $24,999 | 12 | 2.4% |
| $25,000 to $34,999 | 47 | 9.3% |
| $35,000 to $49,999 | 85 | 16.8% |
| $50,000 to $74,999 | 86 | 17.0% |
| $75,000 to $99,999 | 72 | 14.2% |
| $100,000 to $149,999 | 116 | 22.9% |
| $150,000 to $199,999 | 15 | 3.0% |
| $200,000+ | 51 | 10.1% |
Household Income by Householder Age in Jewell Junction
The median household income in Jewell Junction is $75,179, with the highest median household income of $103,500 found in the 45 to 64 years age bracket for the primary householder. A total of 214 households (42.2%) fall into this category. Meanwhile, the 15 to 24 years age bracket for the primary householder has the lowest median household income of $0, with 32 households (6.3%) in this group.
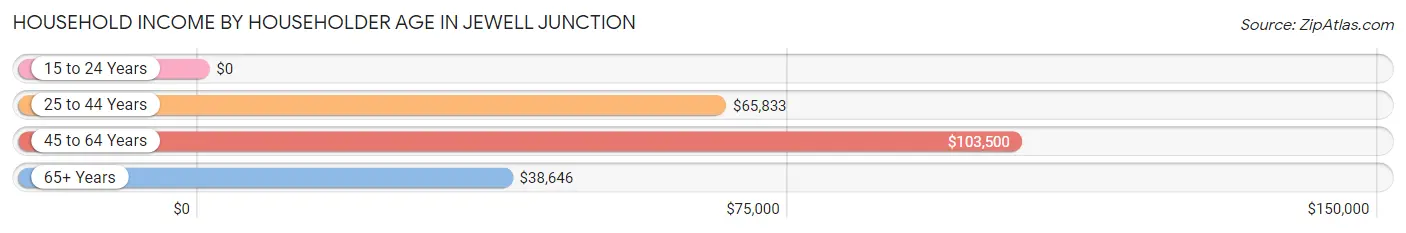
| Income Bracket | # Households | Median Income |
| 15 to 24 Years | 32 (6.3%) | $0 |
| 25 to 44 Years | 160 (31.6%) | $65,833 |
| 45 to 64 Years | 214 (42.2%) | $103,500 |
| 65+ Years | 101 (19.9%) | $38,646 |
| Total | 507 (100.0%) | $75,179 |
Poverty in Jewell Junction
Income Below Poverty by Sex and Age in Jewell Junction
With 7.4% poverty level for males and 10.8% for females among the residents of Jewell Junction, 15 year old males and 15 year old females are the most vulnerable to poverty, with 3 males (30.0%) and 6 females (37.5%) in their respective age groups living below the poverty level.
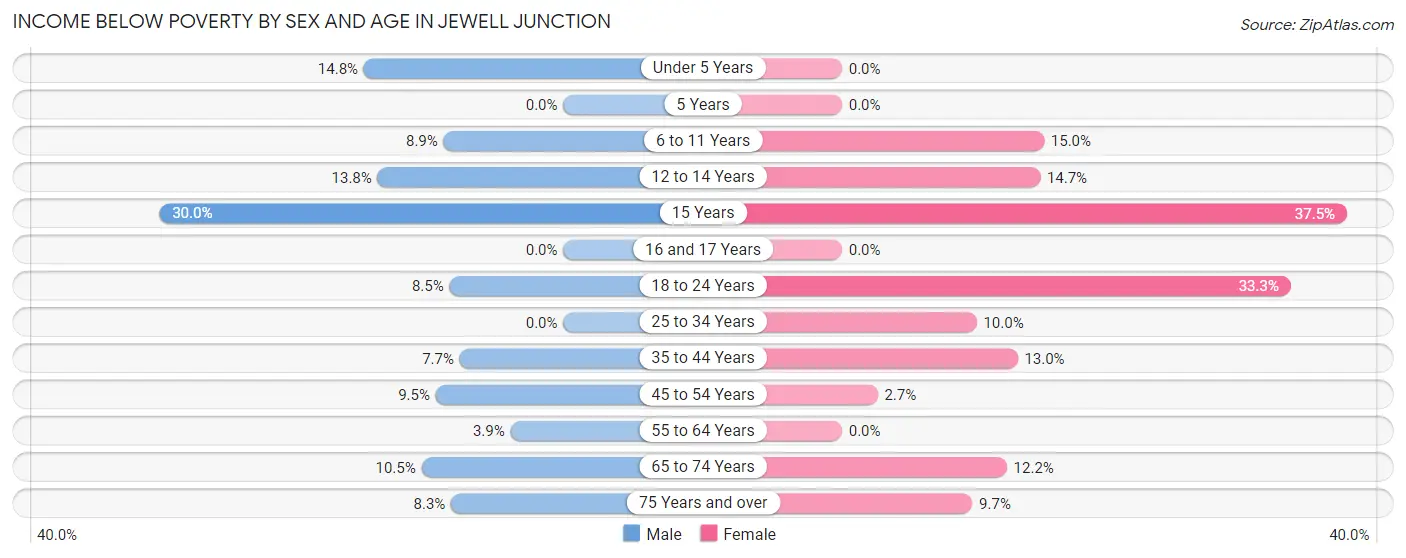
| Age Bracket | Male | Female |
| Under 5 Years | 4 (14.8%) | 0 (0.0%) |
| 5 Years | 0 (0.0%) | 0 (0.0%) |
| 6 to 11 Years | 4 (8.9%) | 12 (15.0%) |
| 12 to 14 Years | 4 (13.8%) | 5 (14.7%) |
| 15 Years | 3 (30.0%) | 6 (37.5%) |
| 16 and 17 Years | 0 (0.0%) | 0 (0.0%) |
| 18 to 24 Years | 6 (8.5%) | 20 (33.3%) |
| 25 to 34 Years | 0 (0.0%) | 7 (10.0%) |
| 35 to 44 Years | 5 (7.7%) | 9 (13.0%) |
| 45 to 54 Years | 9 (9.5%) | 3 (2.6%) |
| 55 to 64 Years | 4 (3.9%) | 0 (0.0%) |
| 65 to 74 Years | 4 (10.5%) | 6 (12.2%) |
| 75 Years and over | 1 (8.3%) | 6 (9.7%) |
| Total | 44 (7.4%) | 74 (10.8%) |
Income Above Poverty by Sex and Age in Jewell Junction
According to the poverty statistics in Jewell Junction, males aged 5 years and females aged under 5 years are the age groups that are most secure financially, with 100.0% of males and 100.0% of females in these age groups living above the poverty line.
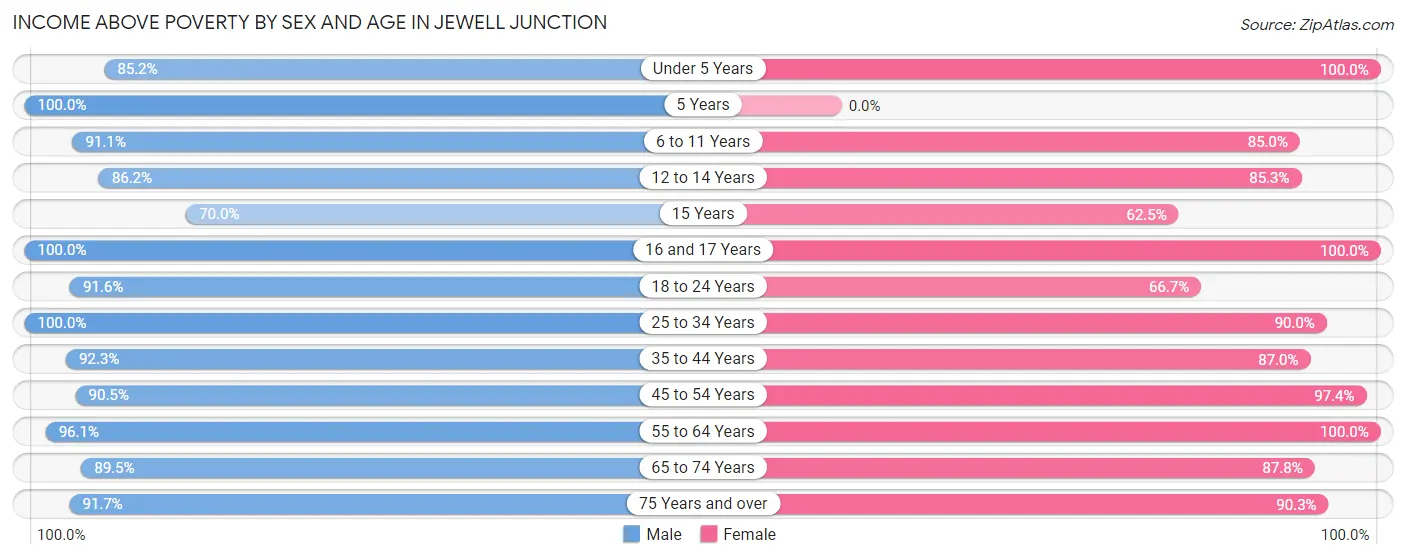
| Age Bracket | Male | Female |
| Under 5 Years | 23 (85.2%) | 18 (100.0%) |
| 5 Years | 14 (100.0%) | 0 (0.0%) |
| 6 to 11 Years | 41 (91.1%) | 68 (85.0%) |
| 12 to 14 Years | 25 (86.2%) | 29 (85.3%) |
| 15 Years | 7 (70.0%) | 10 (62.5%) |
| 16 and 17 Years | 15 (100.0%) | 64 (100.0%) |
| 18 to 24 Years | 65 (91.5%) | 40 (66.7%) |
| 25 to 34 Years | 75 (100.0%) | 63 (90.0%) |
| 35 to 44 Years | 60 (92.3%) | 60 (87.0%) |
| 45 to 54 Years | 86 (90.5%) | 110 (97.4%) |
| 55 to 64 Years | 98 (96.1%) | 51 (100.0%) |
| 65 to 74 Years | 34 (89.5%) | 43 (87.8%) |
| 75 Years and over | 11 (91.7%) | 56 (90.3%) |
| Total | 554 (92.6%) | 612 (89.2%) |
Income Below Poverty Among Married-Couple Families in Jewell Junction
The poverty statistics for married-couple families in Jewell Junction show that 1.3% or 3 of the total 237 families live below the poverty line. Families with 3 or 4 children have the highest poverty rate of 10.7%, comprising of 3 families. On the other hand, families with no children have the lowest poverty rate of 0.0%, which includes 0 families.
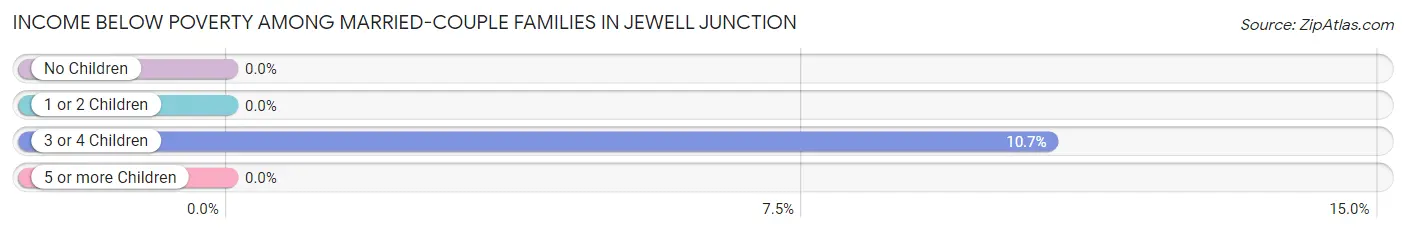
| Children | Above Poverty | Below Poverty |
| No Children | 130 (100.0%) | 0 (0.0%) |
| 1 or 2 Children | 79 (100.0%) | 0 (0.0%) |
| 3 or 4 Children | 25 (89.3%) | 3 (10.7%) |
| 5 or more Children | 0 (0.0%) | 0 (0.0%) |
| Total | 234 (98.7%) | 3 (1.3%) |
Income Below Poverty Among Single-Parent Households in Jewell Junction
According to the poverty data in Jewell Junction, 16.7% or 1 single-father households and 16.0% or 12 single-mother households are living below the poverty line. Among single-father households, those with no children have the highest poverty rate, with 1 households (25.0%) experiencing poverty. Likewise, among single-mother households, those with 3 or 4 children have the highest poverty rate, with 9 households (69.2%) falling below the poverty line.
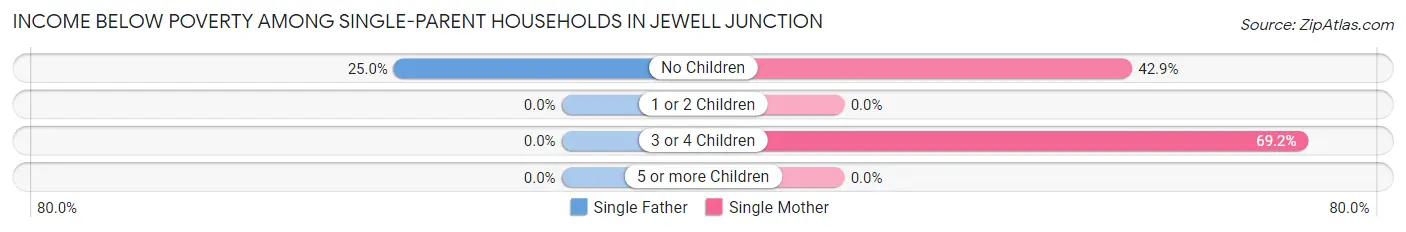
| Children | Single Father | Single Mother |
| No Children | 1 (25.0%) | 3 (42.9%) |
| 1 or 2 Children | 0 (0.0%) | 0 (0.0%) |
| 3 or 4 Children | 0 (0.0%) | 9 (69.2%) |
| 5 or more Children | 0 (0.0%) | 0 (0.0%) |
| Total | 1 (16.7%) | 12 (16.0%) |
Income Below Poverty Among Married-Couple vs Single-Parent Households in Jewell Junction
The poverty data for Jewell Junction shows that 3 of the married-couple family households (1.3%) and 13 of the single-parent households (16.1%) are living below the poverty level. Within the married-couple family households, those with 3 or 4 children have the highest poverty rate, with 3 households (10.7%) falling below the poverty line. Among the single-parent households, those with 3 or 4 children have the highest poverty rate, with 9 household (69.2%) living below poverty.
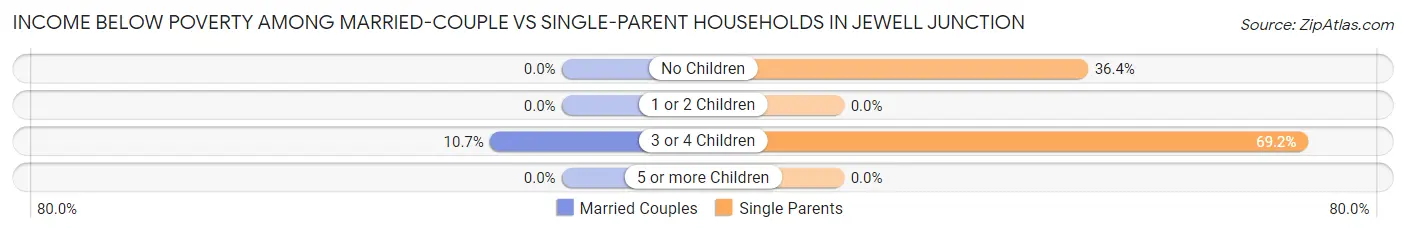
| Children | Married-Couple Families | Single-Parent Households |
| No Children | 0 (0.0%) | 4 (36.4%) |
| 1 or 2 Children | 0 (0.0%) | 0 (0.0%) |
| 3 or 4 Children | 3 (10.7%) | 9 (69.2%) |
| 5 or more Children | 0 (0.0%) | 0 (0.0%) |
| Total | 3 (1.3%) | 13 (16.1%) |
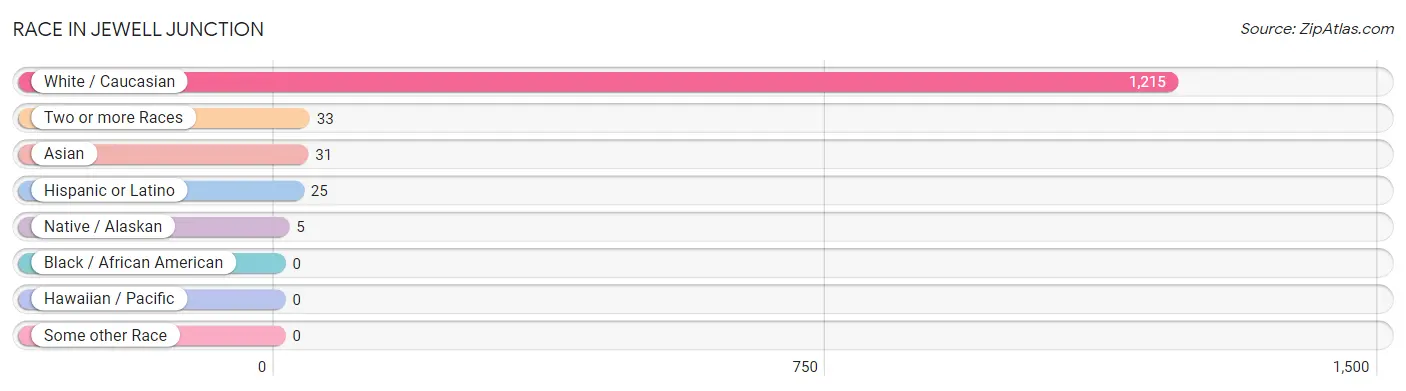
Race in Jewell Junction
The most populous races in Jewell Junction are White / Caucasian (1,215 | 94.6%), Two or more Races (33 | 2.6%), and Asian (31 | 2.4%).
| Race | # Population | % Population |
| Asian | 31 | 2.4% |
| Black / African American | 0 | 0.0% |
| Hawaiian / Pacific | 0 | 0.0% |
| Hispanic or Latino | 25 | 1.9% |
| Native / Alaskan | 5 | 0.4% |
| White / Caucasian | 1,215 | 94.6% |
| Two or more Races | 33 | 2.6% |
| Some other Race | 0 | 0.0% |
| Total | 1,284 | 100.0% |
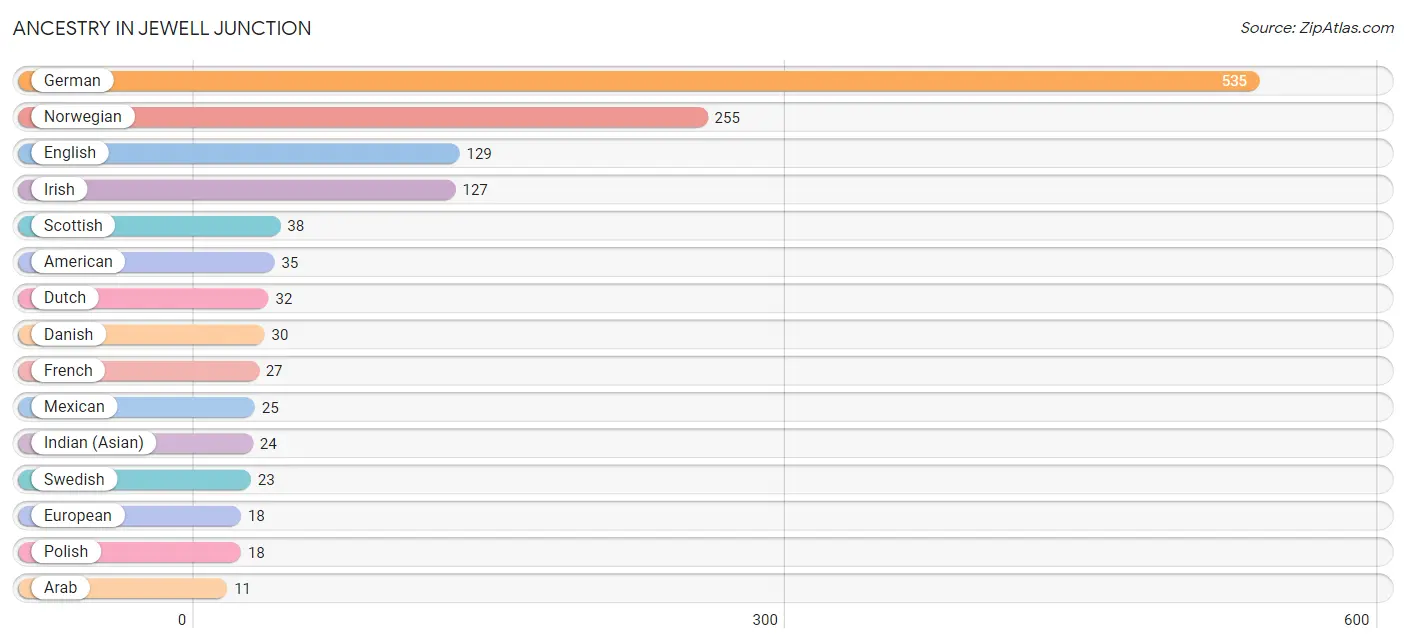
Ancestry in Jewell Junction
The most populous ancestries reported in Jewell Junction are German (535 | 41.7%), Norwegian (255 | 19.9%), English (129 | 10.1%), Irish (127 | 9.9%), and Scottish (38 | 3.0%), together accounting for 84.4% of all Jewell Junction residents.
| Ancestry | # Population | % Population |
| American | 35 | 2.7% |
| Apache | 3 | 0.2% |
| Arab | 11 | 0.9% |
| British | 2 | 0.2% |
| Czech | 5 | 0.4% |
| Danish | 30 | 2.3% |
| Dutch | 32 | 2.5% |
| English | 129 | 10.1% |
| European | 18 | 1.4% |
| French | 27 | 2.1% |
| French Canadian | 9 | 0.7% |
| German | 535 | 41.7% |
| Indian (Asian) | 24 | 1.9% |
| Irish | 127 | 9.9% |
| Malaysian | 7 | 0.5% |
| Mexican | 25 | 1.9% |
| Mexican American Indian | 2 | 0.2% |
| Norwegian | 255 | 19.9% |
| Polish | 18 | 1.4% |
| Scandinavian | 4 | 0.3% |
| Scotch-Irish | 11 | 0.9% |
| Scottish | 38 | 3.0% |
| Subsaharan African | 2 | 0.2% |
| Swedish | 23 | 1.8% |
| Swiss | 2 | 0.2% |
| Welsh | 6 | 0.5% | View All 26 Rows |
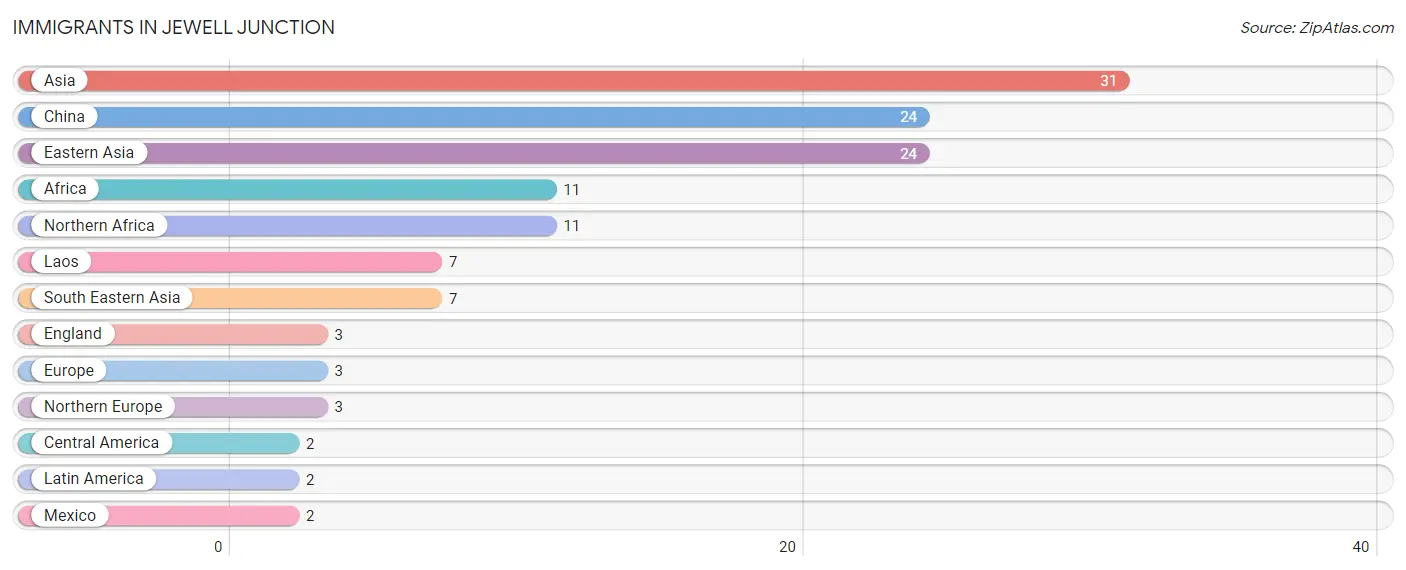
Immigrants in Jewell Junction
The most numerous immigrant groups reported in Jewell Junction came from Asia (31 | 2.4%), China (24 | 1.9%), Eastern Asia (24 | 1.9%), Africa (11 | 0.9%), and Northern Africa (11 | 0.9%), together accounting for 7.9% of all Jewell Junction residents.
| Immigration Origin | # Population | % Population |
| Africa | 11 | 0.9% |
| Asia | 31 | 2.4% |
| Central America | 2 | 0.2% |
| China | 24 | 1.9% |
| Eastern Asia | 24 | 1.9% |
| England | 3 | 0.2% |
| Europe | 3 | 0.2% |
| Laos | 7 | 0.5% |
| Latin America | 2 | 0.2% |
| Mexico | 2 | 0.2% |
| Northern Africa | 11 | 0.9% |
| Northern Europe | 3 | 0.2% |
| South Eastern Asia | 7 | 0.5% | View All 13 Rows |
Sex and Age in Jewell Junction
Sex and Age in Jewell Junction
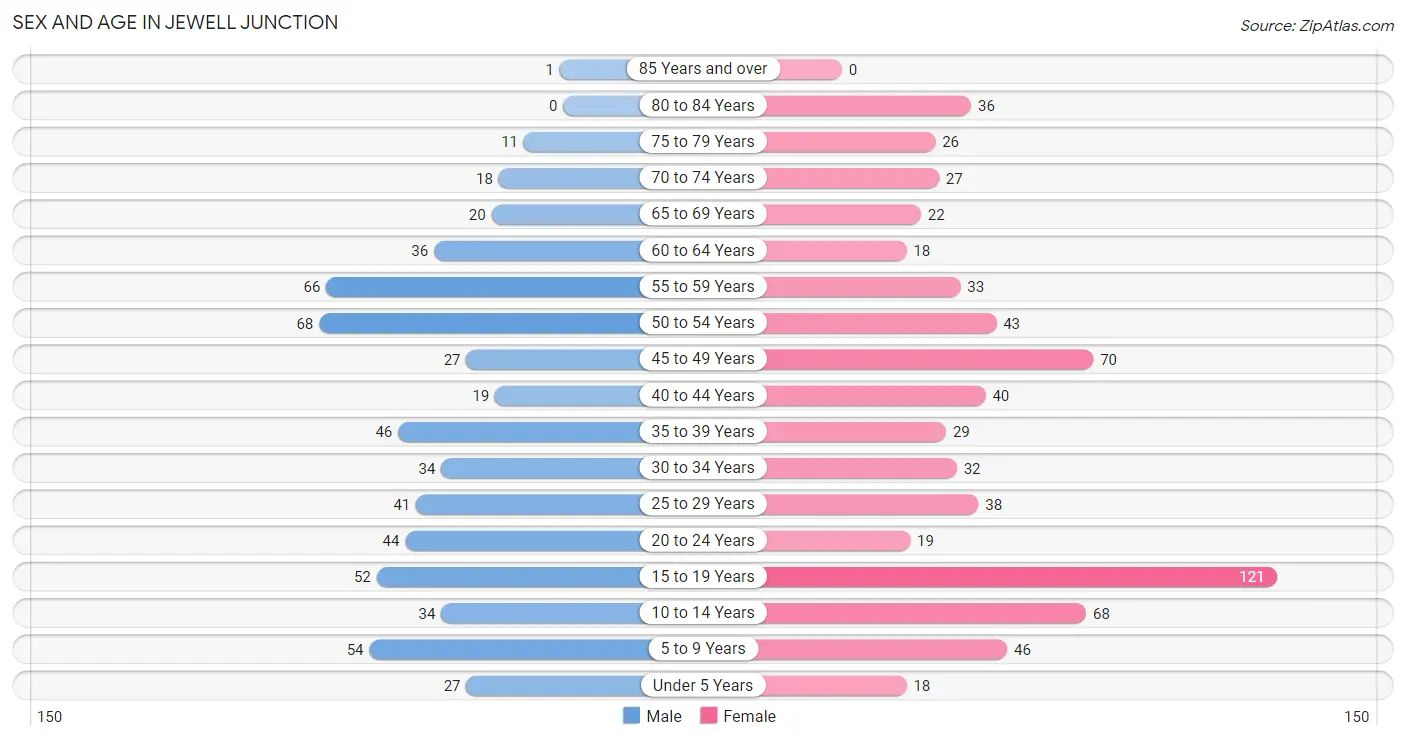
The most populous age groups in Jewell Junction are 50 to 54 Years (68 | 11.4%) for men and 15 to 19 Years (121 | 17.6%) for women.
| Age Bracket | Male | Female |
| Under 5 Years | 27 (4.5%) | 18 (2.6%) |
| 5 to 9 Years | 54 (9.0%) | 46 (6.7%) |
| 10 to 14 Years | 34 (5.7%) | 68 (9.9%) |
| 15 to 19 Years | 52 (8.7%) | 121 (17.6%) |
| 20 to 24 Years | 44 (7.4%) | 19 (2.8%) |
| 25 to 29 Years | 41 (6.9%) | 38 (5.5%) |
| 30 to 34 Years | 34 (5.7%) | 32 (4.7%) |
| 35 to 39 Years | 46 (7.7%) | 29 (4.2%) |
| 40 to 44 Years | 19 (3.2%) | 40 (5.8%) |
| 45 to 49 Years | 27 (4.5%) | 70 (10.2%) |
| 50 to 54 Years | 68 (11.4%) | 43 (6.3%) |
| 55 to 59 Years | 66 (11.0%) | 33 (4.8%) |
| 60 to 64 Years | 36 (6.0%) | 18 (2.6%) |
| 65 to 69 Years | 20 (3.3%) | 22 (3.2%) |
| 70 to 74 Years | 18 (3.0%) | 27 (3.9%) |
| 75 to 79 Years | 11 (1.8%) | 26 (3.8%) |
| 80 to 84 Years | 0 (0.0%) | 36 (5.2%) |
| 85 Years and over | 1 (0.2%) | 0 (0.0%) |
| Total | 598 (100.0%) | 686 (100.0%) |
Families and Households in Jewell Junction
Median Family Size in Jewell Junction
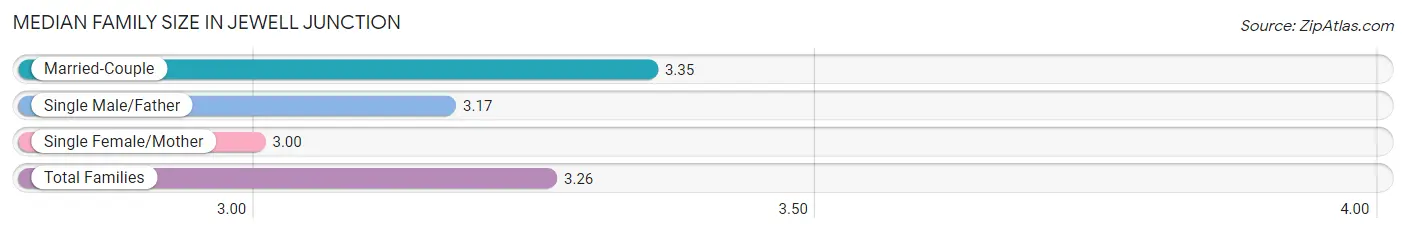
The median family size in Jewell Junction is 3.26 persons per family, with married-couple families (237 | 74.5%) accounting for the largest median family size of 3.35 persons per family. On the other hand, single female/mother families (75 | 23.6%) represent the smallest median family size with 3.00 persons per family.
| Family Type | # Families | Family Size |
| Married-Couple | 237 (74.5%) | 3.35 |
| Single Male/Father | 6 (1.9%) | 3.17 |
| Single Female/Mother | 75 (23.6%) | 3.00 |
| Total Families | 318 (100.0%) | 3.26 |
Median Household Size in Jewell Junction
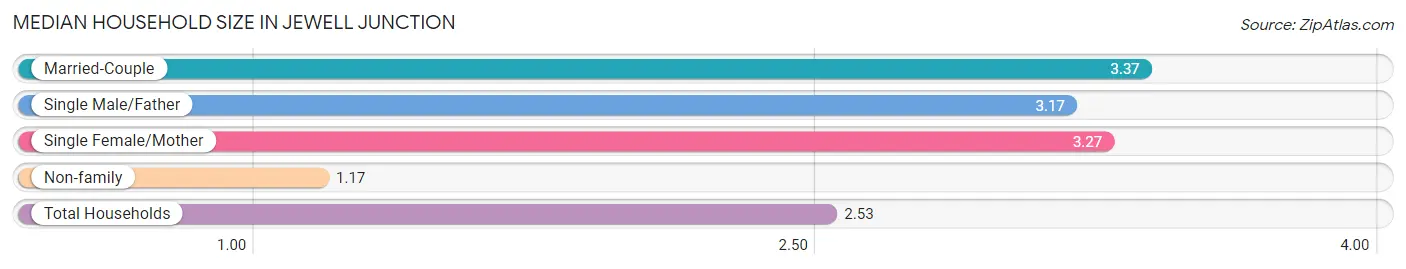
The median household size in Jewell Junction is 2.53 persons per household, with married-couple households (237 | 46.8%) accounting for the largest median household size of 3.37 persons per household. non-family households (189 | 37.3%) represent the smallest median household size with 1.17 persons per household.
| Household Type | # Households | Household Size |
| Married-Couple | 237 (46.8%) | 3.37 |
| Single Male/Father | 6 (1.2%) | 3.17 |
| Single Female/Mother | 75 (14.8%) | 3.27 |
| Non-family | 189 (37.3%) | 1.17 |
| Total Households | 507 (100.0%) | 2.53 |
Household Size by Marriage Status in Jewell Junction
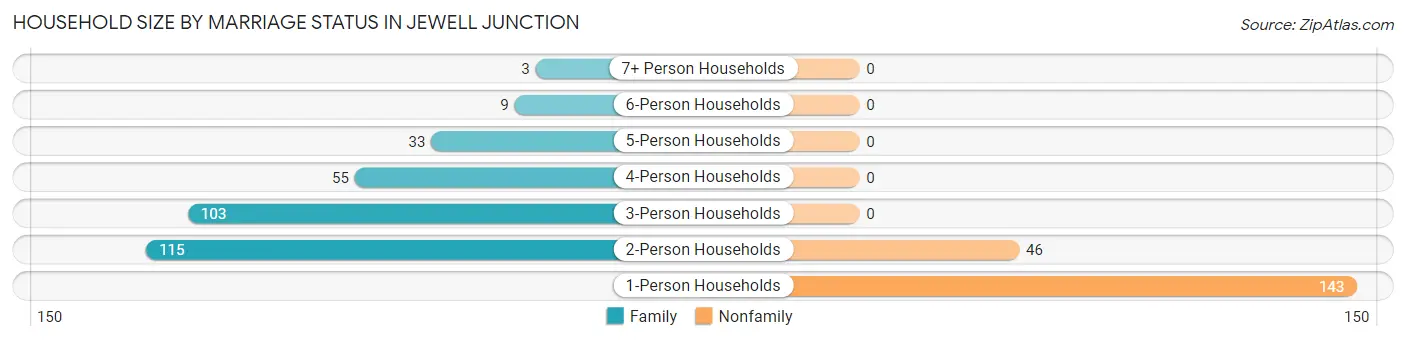
Out of a total of 507 households in Jewell Junction, 318 (62.7%) are family households, while 189 (37.3%) are nonfamily households. The most numerous type of family households are 2-person households, comprising 115, and the most common type of nonfamily households are 1-person households, comprising 143.
| Household Size | Family Households | Nonfamily Households |
| 1-Person Households | - | 143 (28.2%) |
| 2-Person Households | 115 (22.7%) | 46 (9.1%) |
| 3-Person Households | 103 (20.3%) | 0 (0.0%) |
| 4-Person Households | 55 (10.8%) | 0 (0.0%) |
| 5-Person Households | 33 (6.5%) | 0 (0.0%) |
| 6-Person Households | 9 (1.8%) | 0 (0.0%) |
| 7+ Person Households | 3 (0.6%) | 0 (0.0%) |
| Total | 318 (62.7%) | 189 (37.3%) |
Female Fertility in Jewell Junction
Fertility by Age in Jewell Junction
Average fertility rate in Jewell Junction is 22.0 births per 1,000 women. Women in the age bracket of 20 to 34 years have the highest fertility rate with 90.0 births per 1,000 women. Women in the age bracket of 20 to 34 years acount for 100.0% of all women with births.
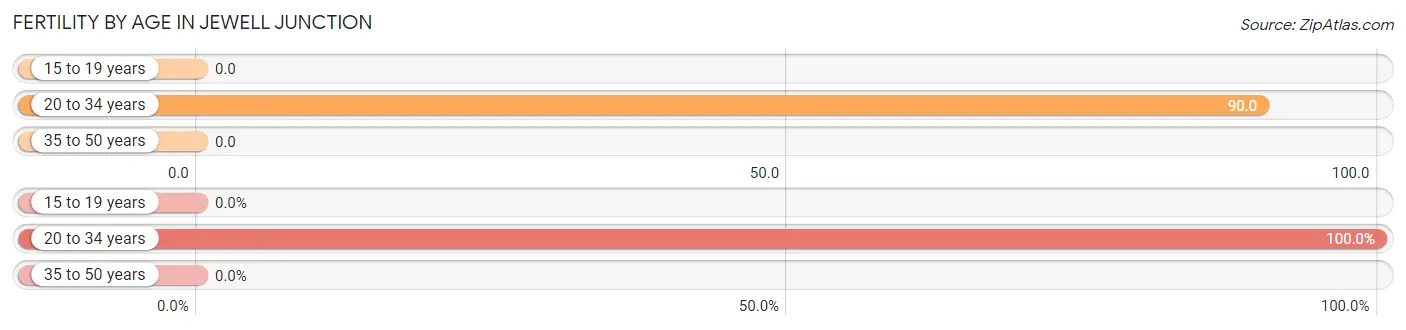
| Age Bracket | Women with Births | Births / 1,000 Women |
| 15 to 19 years | 0 (0.0%) | 0.0 |
| 20 to 34 years | 8 (100.0%) | 90.0 |
| 35 to 50 years | 0 (0.0%) | 0.0 |
| Total | 8 (100.0%) | 22.0 |
Fertility by Age by Marriage Status in Jewell Junction
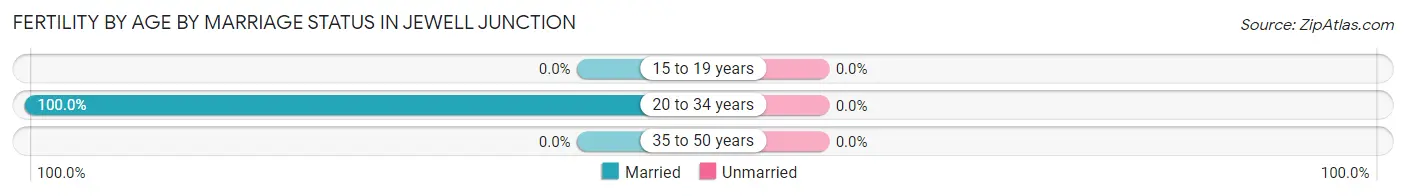
| Age Bracket | Married | Unmarried |
| 15 to 19 years | 0 (0.0%) | 0 (0.0%) |
| 20 to 34 years | 8 (100.0%) | 0 (0.0%) |
| 35 to 50 years | 0 (0.0%) | 0 (0.0%) |
| Total | 8 (100.0%) | 0 (0.0%) |
Fertility by Education in Jewell Junction
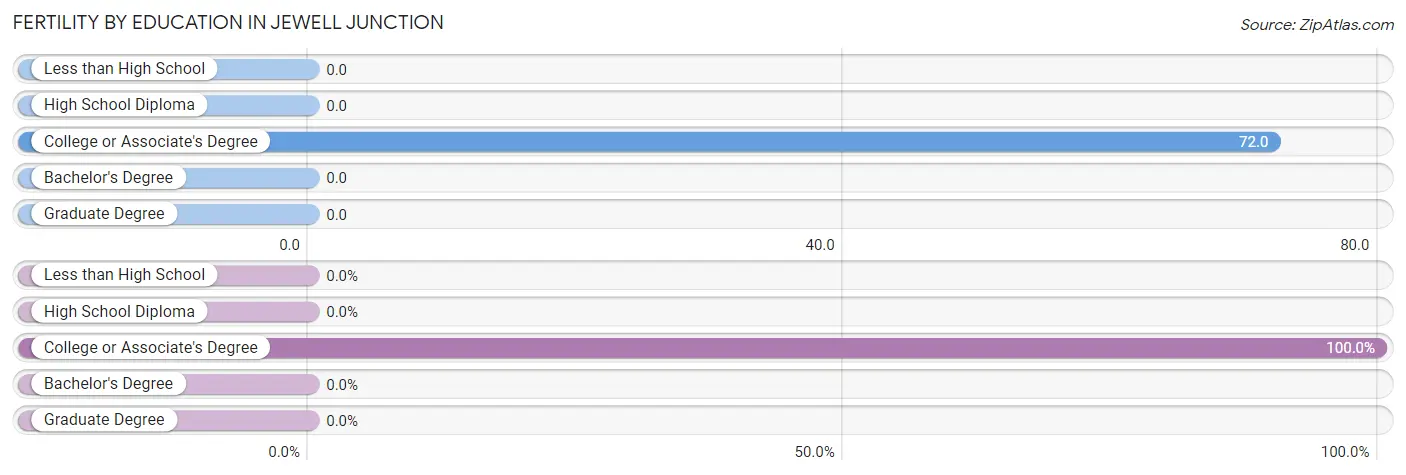
| Educational Attainment | Women with Births | Births / 1,000 Women |
| Less than High School | 0 (0.0%) | 0.0 |
| High School Diploma | 0 (0.0%) | 0.0 |
| College or Associate's Degree | 8 (100.0%) | 72.0 |
| Bachelor's Degree | 0 (0.0%) | 0.0 |
| Graduate Degree | 0 (0.0%) | 0.0 |
| Total | 8 (100.0%) | 22.0 |
Fertility by Education by Marriage Status in Jewell Junction
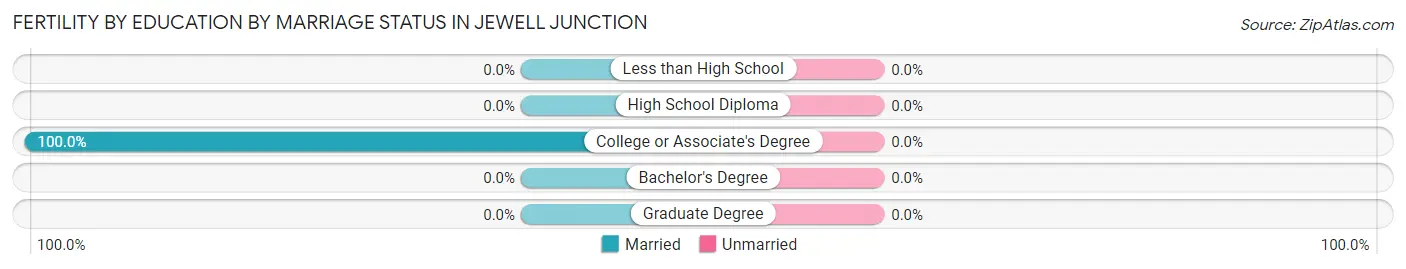
| Educational Attainment | Married | Unmarried |
| Less than High School | 0 (0.0%) | 0 (0.0%) |
| High School Diploma | 0 (0.0%) | 0 (0.0%) |
| College or Associate's Degree | 8 (100.0%) | 0 (0.0%) |
| Bachelor's Degree | 0 (0.0%) | 0 (0.0%) |
| Graduate Degree | 0 (0.0%) | 0 (0.0%) |
| Total | 8 (100.0%) | 0 (0.0%) |
Employment Characteristics in Jewell Junction
Employment by Class of Employer in Jewell Junction
Among the 706 employed individuals in Jewell Junction, private company employees (430 | 60.9%), local government employees (103 | 14.6%), and state government employees (79 | 11.2%) make up the most common classes of employment.
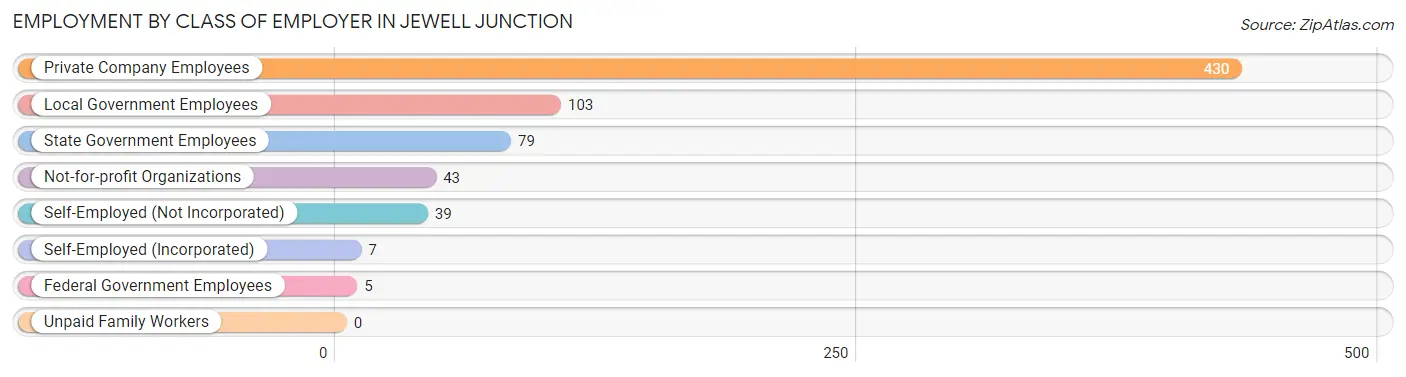
| Employer Class | # Employees | % Employees |
| Private Company Employees | 430 | 60.9% |
| Self-Employed (Incorporated) | 7 | 1.0% |
| Self-Employed (Not Incorporated) | 39 | 5.5% |
| Not-for-profit Organizations | 43 | 6.1% |
| Local Government Employees | 103 | 14.6% |
| State Government Employees | 79 | 11.2% |
| Federal Government Employees | 5 | 0.7% |
| Unpaid Family Workers | 0 | 0.0% |
| Total | 706 | 100.0% |
Employment Status by Age in Jewell Junction
According to the labor force statistics for Jewell Junction, out of the total population over 16 years of age (1,011), 71.6% or 724 individuals are in the labor force, with 0.7% or 5 of them unemployed. The age group with the highest labor force participation rate is 35 to 44 years, with 94.8% or 127 individuals in the labor force. Within the labor force, the 55 to 59 years age range has the highest percentage of unemployed individuals, with 3.3% or 3 of them being unemployed.
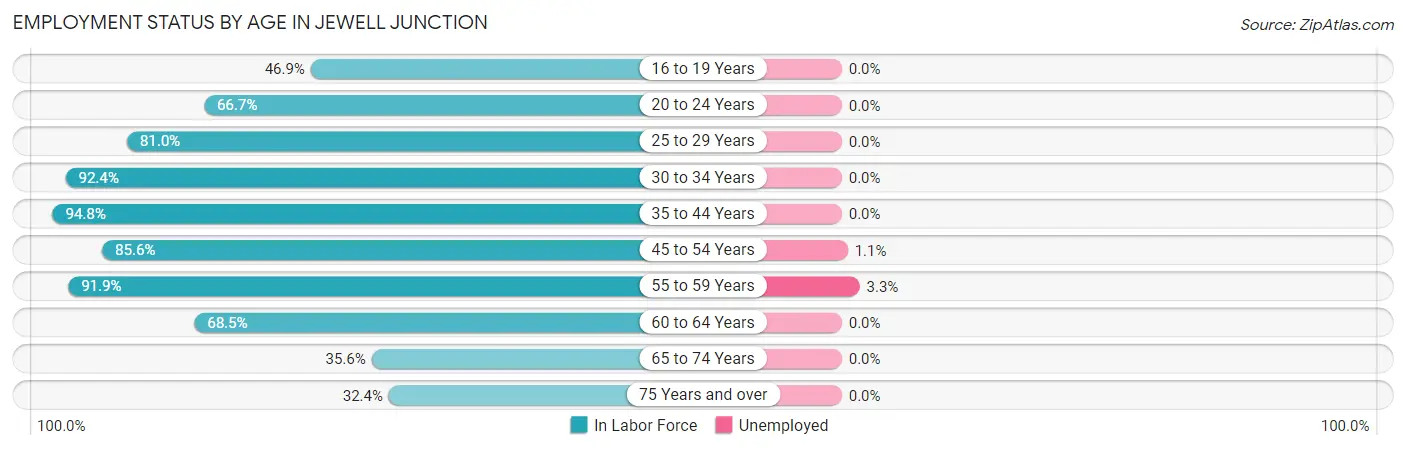
| Age Bracket | In Labor Force | Unemployed |
| 16 to 19 Years | 69 (46.9%) | 0 (0.0%) |
| 20 to 24 Years | 42 (66.7%) | 0 (0.0%) |
| 25 to 29 Years | 64 (81.0%) | 0 (0.0%) |
| 30 to 34 Years | 61 (92.4%) | 0 (0.0%) |
| 35 to 44 Years | 127 (94.8%) | 0 (0.0%) |
| 45 to 54 Years | 178 (85.6%) | 2 (1.1%) |
| 55 to 59 Years | 91 (91.9%) | 3 (3.3%) |
| 60 to 64 Years | 37 (68.5%) | 0 (0.0%) |
| 65 to 74 Years | 31 (35.6%) | 0 (0.0%) |
| 75 Years and over | 24 (32.4%) | 0 (0.0%) |
| Total | 724 (71.6%) | 5 (0.7%) |
Employment Status by Educational Attainment in Jewell Junction
According to labor force statistics for Jewell Junction, 87.2% of individuals (558) out of the total population between 25 and 64 years of age (640) are in the labor force, with 0.9% or 5 of them being unemployed. The group with the highest labor force participation rate are those with the educational attainment of bachelor's degree or higher, with 96.6% or 168 individuals in the labor force. Within the labor force, individuals with high school diploma education have the highest percentage of unemployment, with 3.3% or 5 of them being unemployed.
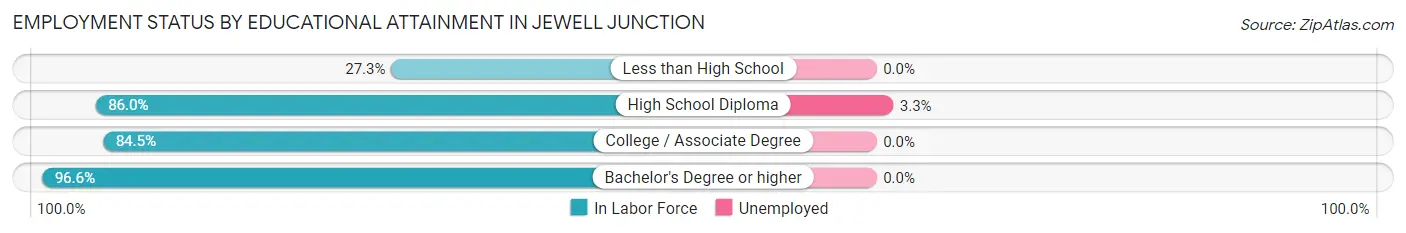
| Educational Attainment | In Labor Force | Unemployed |
| Less than High School | 3 (27.3%) | 0 (0.0%) |
| High School Diploma | 153 (86.0%) | 6 (3.3%) |
| College / Associate Degree | 234 (84.5%) | 0 (0.0%) |
| Bachelor's Degree or higher | 168 (96.6%) | 0 (0.0%) |
| Total | 558 (87.2%) | 6 (0.9%) |
Employment Occupations by Sex in Jewell Junction
Management, Business, Science and Arts Occupations
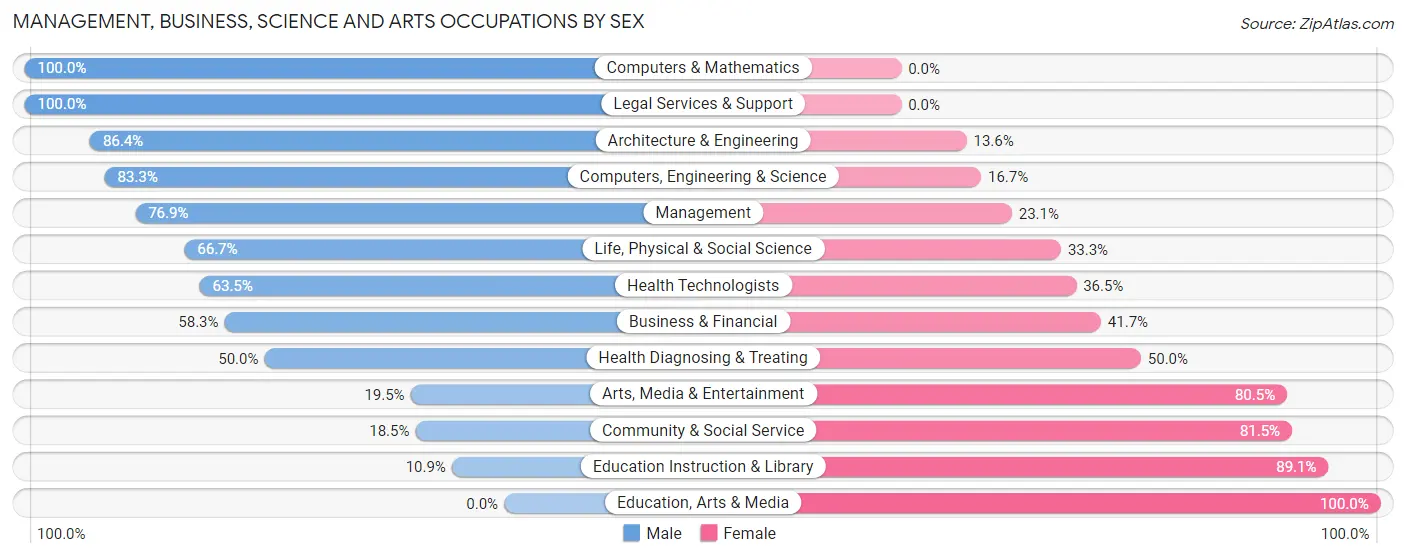
The most common Management, Business, Science and Arts occupations in Jewell Junction are Community & Social Service (119 | 16.6%), Health Diagnosing & Treating (80 | 11.1%), Management (65 | 9.0%), Health Technologists (63 | 8.8%), and Education Instruction & Library (55 | 7.6%).
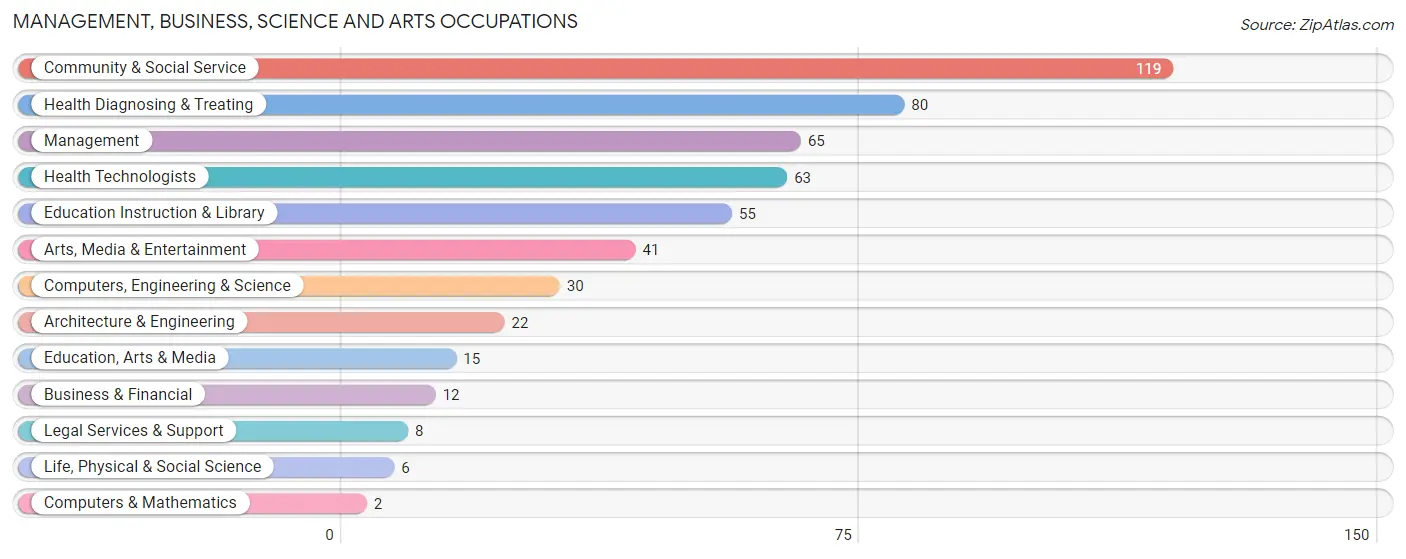
Management, Business, Science and Arts Occupations by Sex
Within the Management, Business, Science and Arts occupations in Jewell Junction, the most male-oriented occupations are Computers & Mathematics (100.0%), Legal Services & Support (100.0%), and Architecture & Engineering (86.4%), while the most female-oriented occupations are Education, Arts & Media (100.0%), Education Instruction & Library (89.1%), and Community & Social Service (81.5%).
| Occupation | Male | Female |
| Management | 50 (76.9%) | 15 (23.1%) |
| Business & Financial | 7 (58.3%) | 5 (41.7%) |
| Computers, Engineering & Science | 25 (83.3%) | 5 (16.7%) |
| Computers & Mathematics | 2 (100.0%) | 0 (0.0%) |
| Architecture & Engineering | 19 (86.4%) | 3 (13.6%) |
| Life, Physical & Social Science | 4 (66.7%) | 2 (33.3%) |
| Community & Social Service | 22 (18.5%) | 97 (81.5%) |
| Education, Arts & Media | 0 (0.0%) | 15 (100.0%) |
| Legal Services & Support | 8 (100.0%) | 0 (0.0%) |
| Education Instruction & Library | 6 (10.9%) | 49 (89.1%) |
| Arts, Media & Entertainment | 8 (19.5%) | 33 (80.5%) |
| Health Diagnosing & Treating | 40 (50.0%) | 40 (50.0%) |
| Health Technologists | 40 (63.5%) | 23 (36.5%) |
| Total (Category) | 144 (47.1%) | 162 (52.9%) |
| Total (Overall) | 382 (53.1%) | 337 (46.9%) |
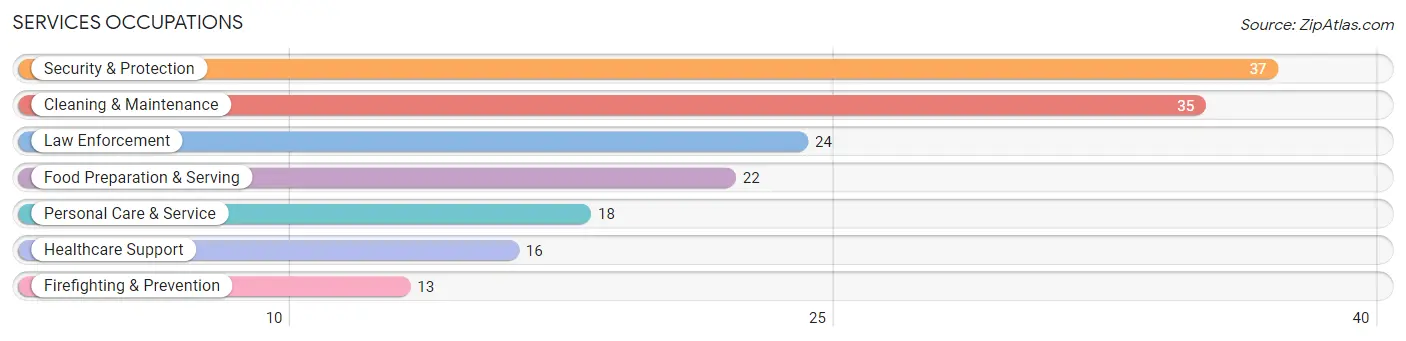
Services Occupations
The most common Services occupations in Jewell Junction are Security & Protection (37 | 5.1%), Cleaning & Maintenance (35 | 4.9%), Law Enforcement (24 | 3.3%), Food Preparation & Serving (22 | 3.1%), and Personal Care & Service (18 | 2.5%).
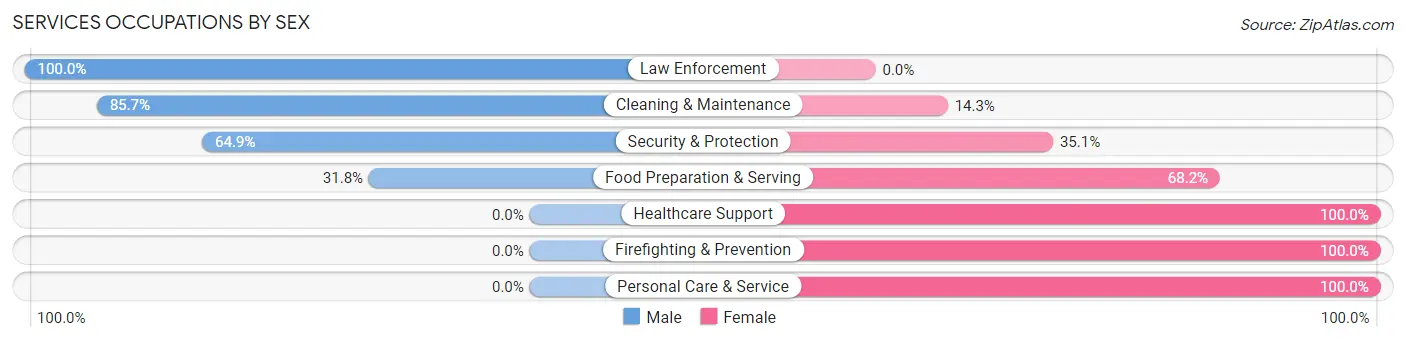
Services Occupations by Sex
Within the Services occupations in Jewell Junction, the most male-oriented occupations are Law Enforcement (100.0%), Cleaning & Maintenance (85.7%), and Security & Protection (64.9%), while the most female-oriented occupations are Healthcare Support (100.0%), Firefighting & Prevention (100.0%), and Personal Care & Service (100.0%).
| Occupation | Male | Female |
| Healthcare Support | 0 (0.0%) | 16 (100.0%) |
| Security & Protection | 24 (64.9%) | 13 (35.1%) |
| Firefighting & Prevention | 0 (0.0%) | 13 (100.0%) |
| Law Enforcement | 24 (100.0%) | 0 (0.0%) |
| Food Preparation & Serving | 7 (31.8%) | 15 (68.2%) |
| Cleaning & Maintenance | 30 (85.7%) | 5 (14.3%) |
| Personal Care & Service | 0 (0.0%) | 18 (100.0%) |
| Total (Category) | 61 (47.7%) | 67 (52.3%) |
| Total (Overall) | 382 (53.1%) | 337 (46.9%) |
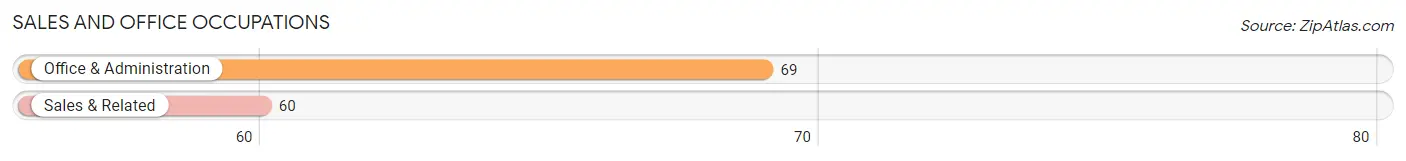
Sales and Office Occupations
The most common Sales and Office occupations in Jewell Junction are Office & Administration (69 | 9.6%), and Sales & Related (60 | 8.3%).
Sales and Office Occupations by Sex
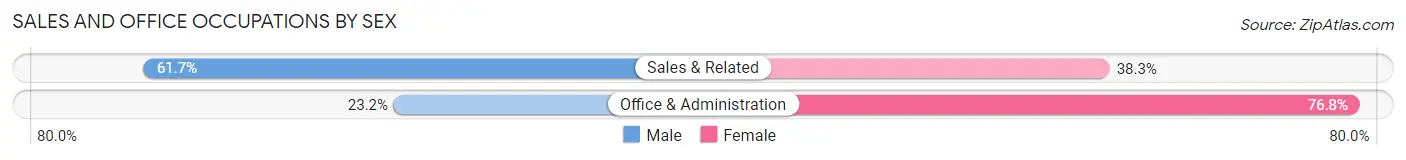
| Occupation | Male | Female |
| Sales & Related | 37 (61.7%) | 23 (38.3%) |
| Office & Administration | 16 (23.2%) | 53 (76.8%) |
| Total (Category) | 53 (41.1%) | 76 (58.9%) |
| Total (Overall) | 382 (53.1%) | 337 (46.9%) |
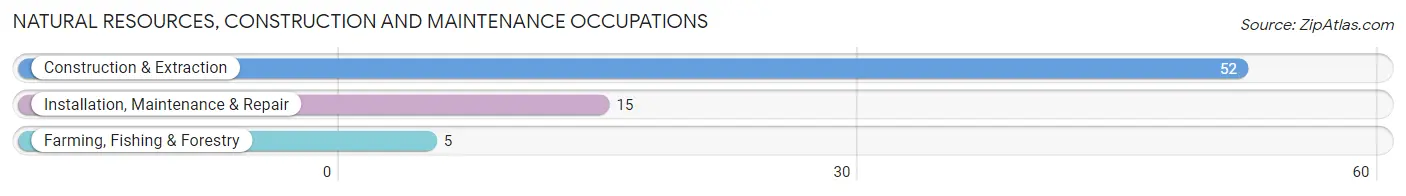
Natural Resources, Construction and Maintenance Occupations
The most common Natural Resources, Construction and Maintenance occupations in Jewell Junction are Construction & Extraction (52 | 7.2%), Installation, Maintenance & Repair (15 | 2.1%), and Farming, Fishing & Forestry (5 | 0.7%).
Natural Resources, Construction and Maintenance Occupations by Sex
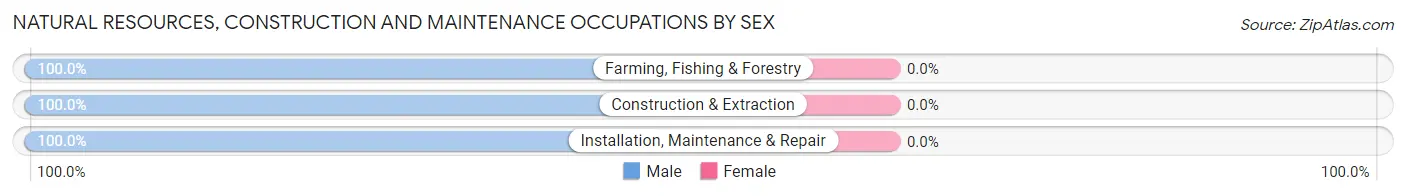
| Occupation | Male | Female |
| Farming, Fishing & Forestry | 5 (100.0%) | 0 (0.0%) |
| Construction & Extraction | 52 (100.0%) | 0 (0.0%) |
| Installation, Maintenance & Repair | 15 (100.0%) | 0 (0.0%) |
| Total (Category) | 72 (100.0%) | 0 (0.0%) |
| Total (Overall) | 382 (53.1%) | 337 (46.9%) |
Production, Transportation and Moving Occupations
The most common Production, Transportation and Moving occupations in Jewell Junction are Production (42 | 5.8%), Transportation (22 | 3.1%), and Material Moving (20 | 2.8%).
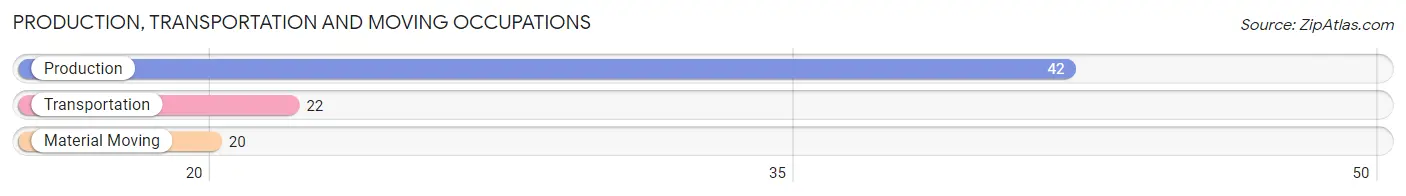
Production, Transportation and Moving Occupations by Sex
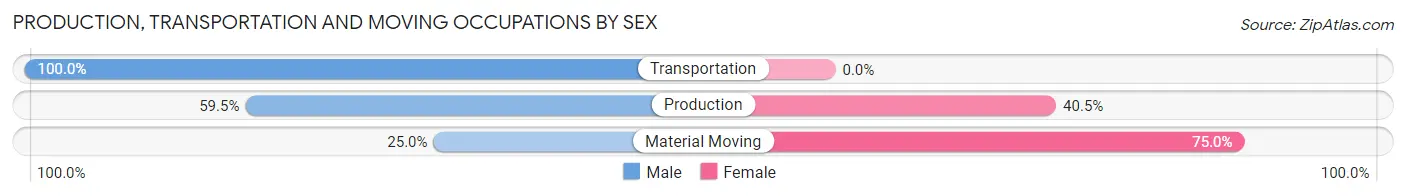
| Occupation | Male | Female |
| Production | 25 (59.5%) | 17 (40.5%) |
| Transportation | 22 (100.0%) | 0 (0.0%) |
| Material Moving | 5 (25.0%) | 15 (75.0%) |
| Total (Category) | 52 (61.9%) | 32 (38.1%) |
| Total (Overall) | 382 (53.1%) | 337 (46.9%) |
Employment Industries by Sex in Jewell Junction
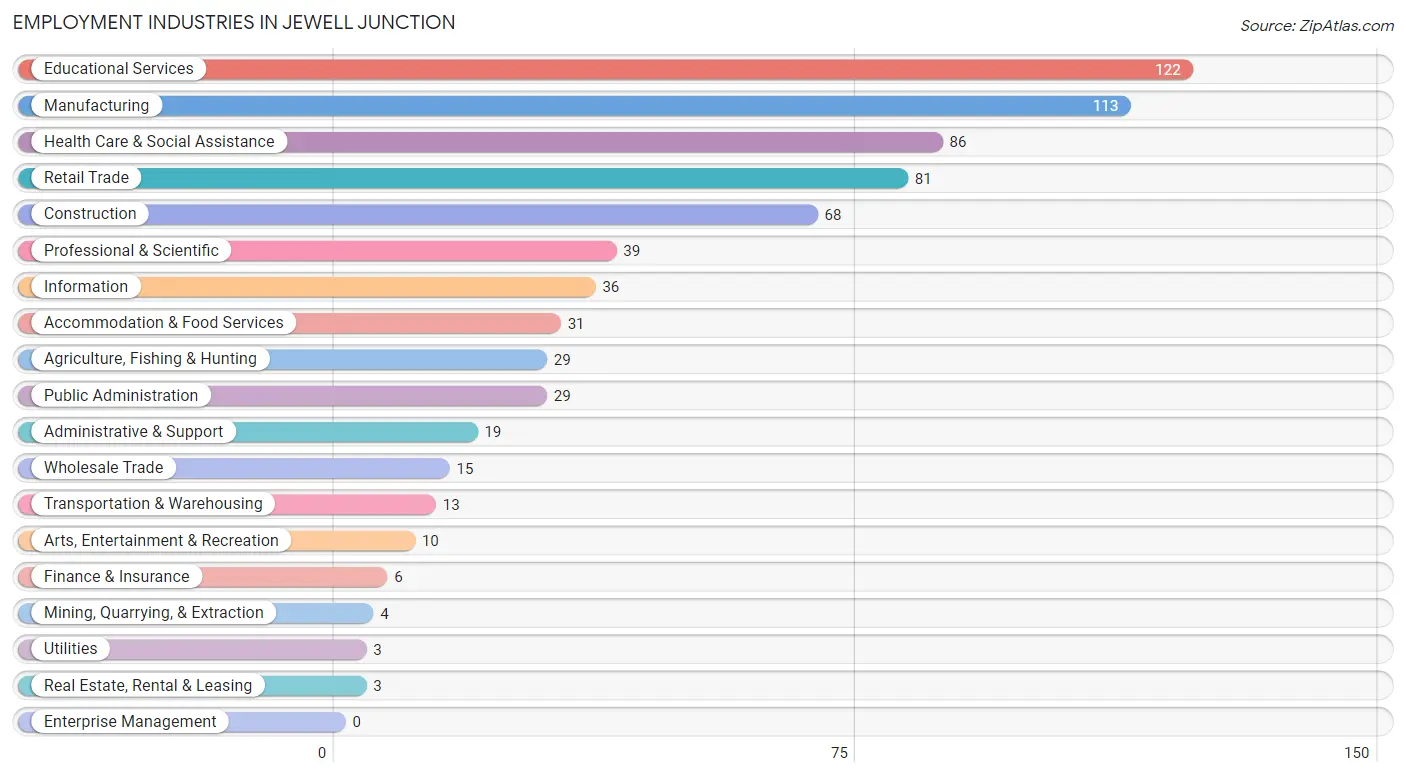
Employment Industries in Jewell Junction
The major employment industries in Jewell Junction include Educational Services (122 | 17.0%), Manufacturing (113 | 15.7%), Health Care & Social Assistance (86 | 12.0%), Retail Trade (81 | 11.3%), and Construction (68 | 9.5%).
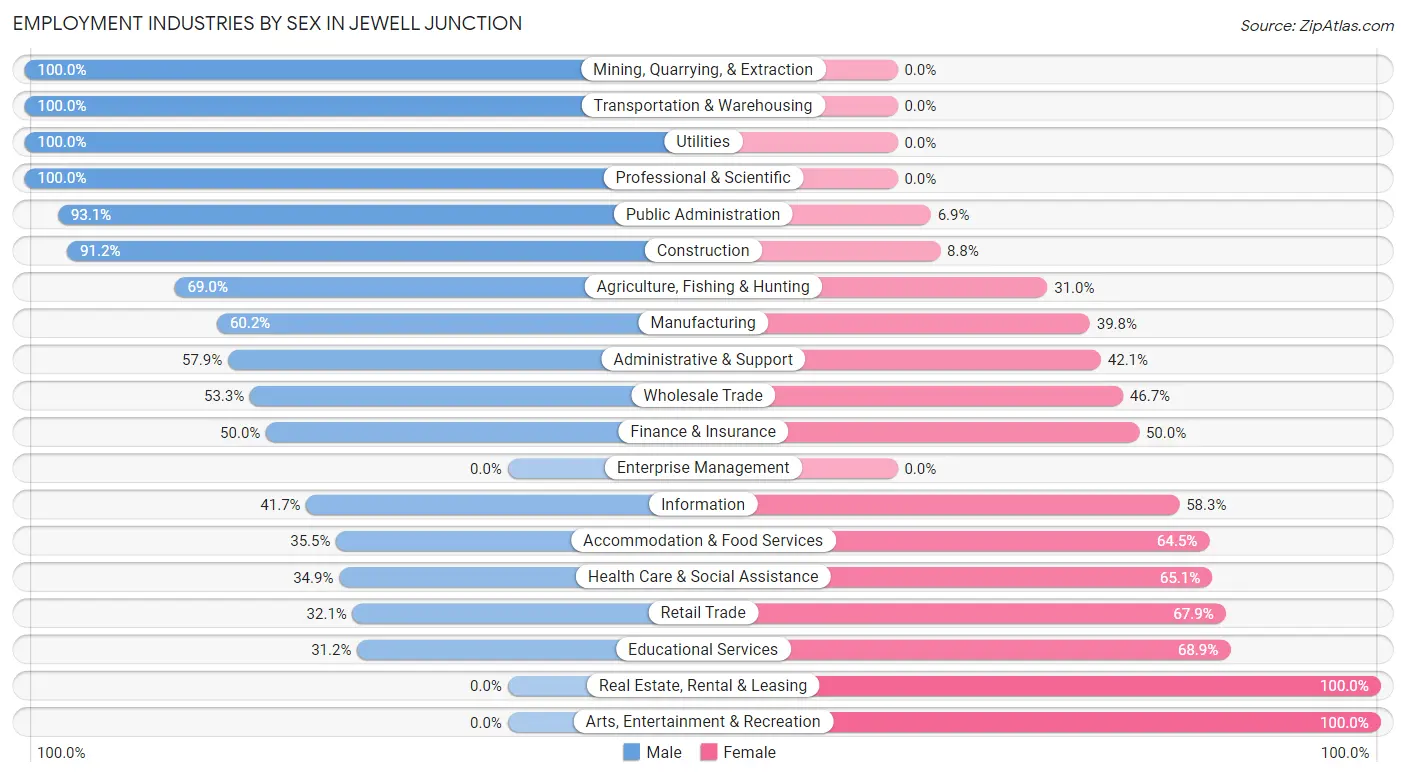
Employment Industries by Sex in Jewell Junction
The Jewell Junction industries that see more men than women are Mining, Quarrying, & Extraction (100.0%), Transportation & Warehousing (100.0%), and Utilities (100.0%), whereas the industries that tend to have a higher number of women are Real Estate, Rental & Leasing (100.0%), Arts, Entertainment & Recreation (100.0%), and Educational Services (68.9%).
| Industry | Male | Female |
| Agriculture, Fishing & Hunting | 20 (69.0%) | 9 (31.0%) |
| Mining, Quarrying, & Extraction | 4 (100.0%) | 0 (0.0%) |
| Construction | 62 (91.2%) | 6 (8.8%) |
| Manufacturing | 68 (60.2%) | 45 (39.8%) |
| Wholesale Trade | 8 (53.3%) | 7 (46.7%) |
| Retail Trade | 26 (32.1%) | 55 (67.9%) |
| Transportation & Warehousing | 13 (100.0%) | 0 (0.0%) |
| Utilities | 3 (100.0%) | 0 (0.0%) |
| Information | 15 (41.7%) | 21 (58.3%) |
| Finance & Insurance | 3 (50.0%) | 3 (50.0%) |
| Real Estate, Rental & Leasing | 0 (0.0%) | 3 (100.0%) |
| Professional & Scientific | 39 (100.0%) | 0 (0.0%) |
| Enterprise Management | 0 (0.0%) | 0 (0.0%) |
| Administrative & Support | 11 (57.9%) | 8 (42.1%) |
| Educational Services | 38 (31.1%) | 84 (68.9%) |
| Health Care & Social Assistance | 30 (34.9%) | 56 (65.1%) |
| Arts, Entertainment & Recreation | 0 (0.0%) | 10 (100.0%) |
| Accommodation & Food Services | 11 (35.5%) | 20 (64.5%) |
| Public Administration | 27 (93.1%) | 2 (6.9%) |
| Total | 382 (53.1%) | 337 (46.9%) |
Education in Jewell Junction
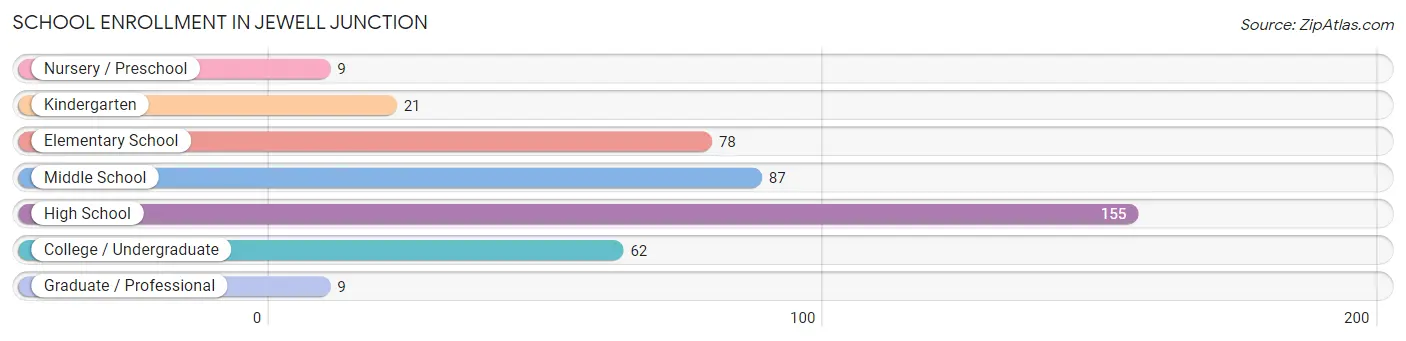
School Enrollment in Jewell Junction
The most common levels of schooling among the 421 students in Jewell Junction are high school (155 | 36.8%), middle school (87 | 20.7%), and elementary school (78 | 18.5%).
| School Level | # Students | % Students |
| Nursery / Preschool | 9 | 2.1% |
| Kindergarten | 21 | 5.0% |
| Elementary School | 78 | 18.5% |
| Middle School | 87 | 20.7% |
| High School | 155 | 36.8% |
| College / Undergraduate | 62 | 14.7% |
| Graduate / Professional | 9 | 2.1% |
| Total | 421 | 100.0% |
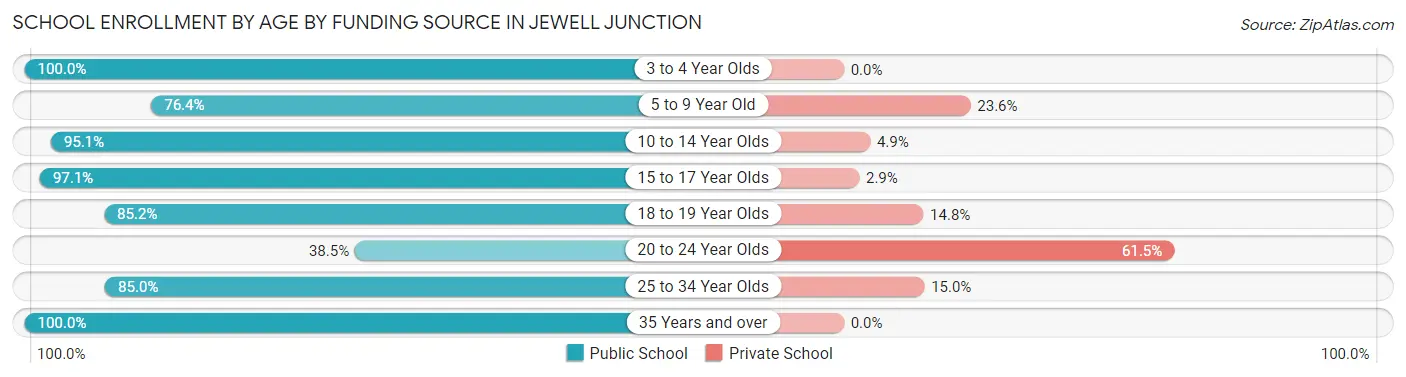
School Enrollment by Age by Funding Source in Jewell Junction
Out of a total of 421 students who are enrolled in schools in Jewell Junction, 64 (15.2%) attend a private institution, while the remaining 357 (84.8%) are enrolled in public schools. The age group of 20 to 24 year olds has the highest likelihood of being enrolled in private schools, with 24 (61.5% in the age bracket) enrolled. Conversely, the age group of 3 to 4 year olds has the lowest likelihood of being enrolled in a private school, with 6 (100.0% in the age bracket) attending a public institution.
| Age Bracket | Public School | Private School |
| 3 to 4 Year Olds | 6 (100.0%) | 0 (0.0%) |
| 5 to 9 Year Old | 68 (76.4%) | 21 (23.6%) |
| 10 to 14 Year Olds | 97 (95.1%) | 5 (4.9%) |
| 15 to 17 Year Olds | 102 (97.1%) | 3 (2.9%) |
| 18 to 19 Year Olds | 46 (85.2%) | 8 (14.8%) |
| 20 to 24 Year Olds | 15 (38.5%) | 24 (61.5%) |
| 25 to 34 Year Olds | 17 (85.0%) | 3 (15.0%) |
| 35 Years and over | 6 (100.0%) | 0 (0.0%) |
| Total | 357 (84.8%) | 64 (15.2%) |
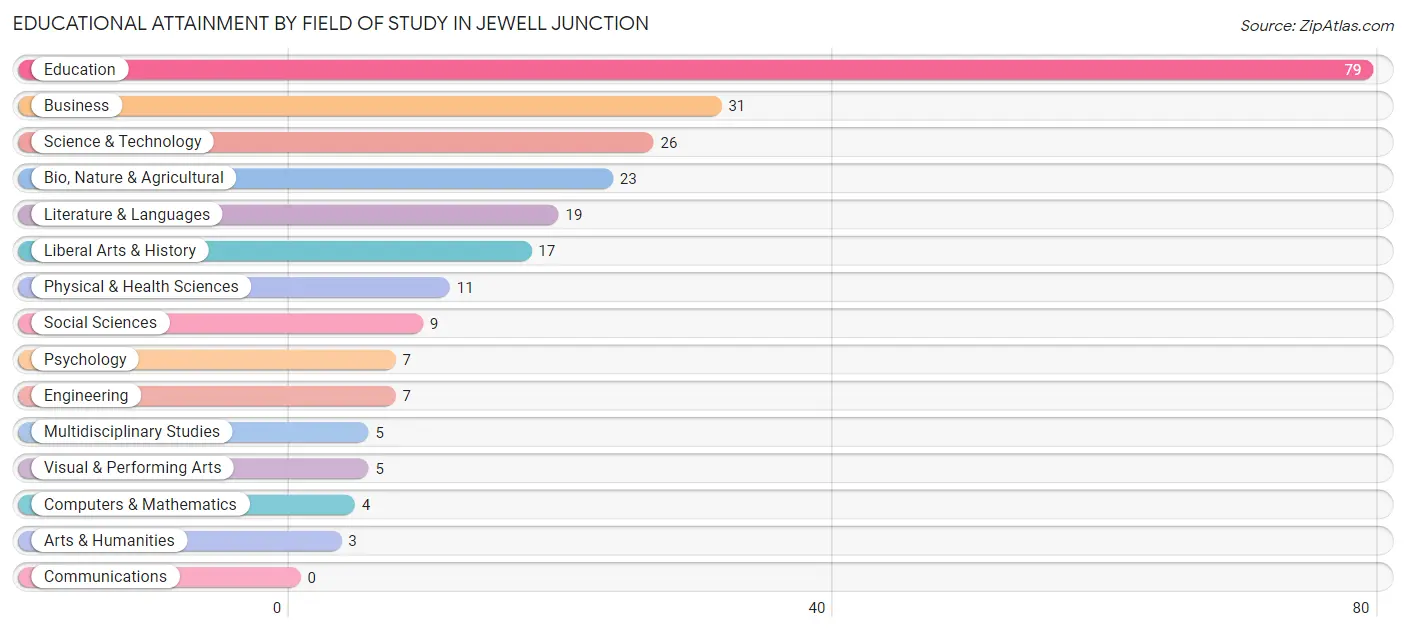
Educational Attainment by Field of Study in Jewell Junction
Education (79 | 32.1%), business (31 | 12.6%), science & technology (26 | 10.6%), bio, nature & agricultural (23 | 9.3%), and literature & languages (19 | 7.7%) are the most common fields of study among 246 individuals in Jewell Junction who have obtained a bachelor's degree or higher.
| Field of Study | # Graduates | % Graduates |
| Computers & Mathematics | 4 | 1.6% |
| Bio, Nature & Agricultural | 23 | 9.3% |
| Physical & Health Sciences | 11 | 4.5% |
| Psychology | 7 | 2.9% |
| Social Sciences | 9 | 3.7% |
| Engineering | 7 | 2.9% |
| Multidisciplinary Studies | 5 | 2.0% |
| Science & Technology | 26 | 10.6% |
| Business | 31 | 12.6% |
| Education | 79 | 32.1% |
| Literature & Languages | 19 | 7.7% |
| Liberal Arts & History | 17 | 6.9% |
| Visual & Performing Arts | 5 | 2.0% |
| Communications | 0 | 0.0% |
| Arts & Humanities | 3 | 1.2% |
| Total | 246 | 100.0% |
Transportation & Commute in Jewell Junction
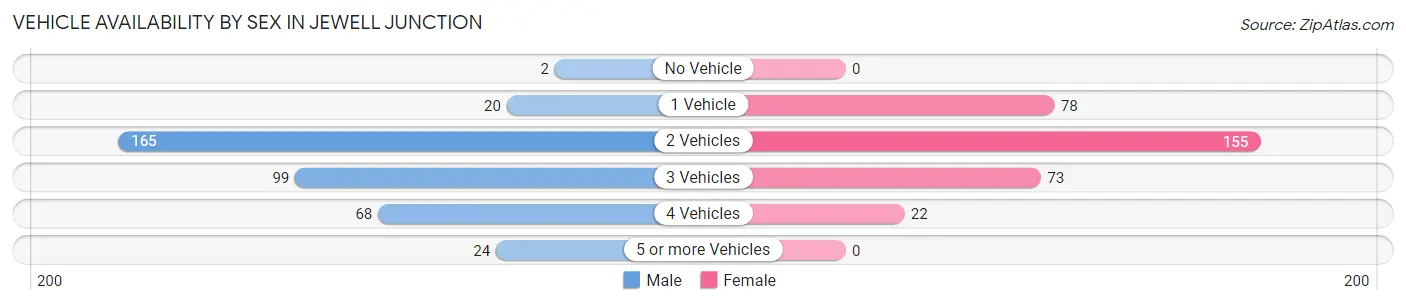
Vehicle Availability by Sex in Jewell Junction
The most prevalent vehicle ownership categories in Jewell Junction are males with 2 vehicles (165, accounting for 43.6%) and females with 2 vehicles (155, making up 50.3%).
| Vehicles Available | Male | Female |
| No Vehicle | 2 (0.5%) | 0 (0.0%) |
| 1 Vehicle | 20 (5.3%) | 78 (23.8%) |
| 2 Vehicles | 165 (43.6%) | 155 (47.3%) |
| 3 Vehicles | 99 (26.2%) | 73 (22.3%) |
| 4 Vehicles | 68 (18.0%) | 22 (6.7%) |
| 5 or more Vehicles | 24 (6.4%) | 0 (0.0%) |
| Total | 378 (100.0%) | 328 (100.0%) |
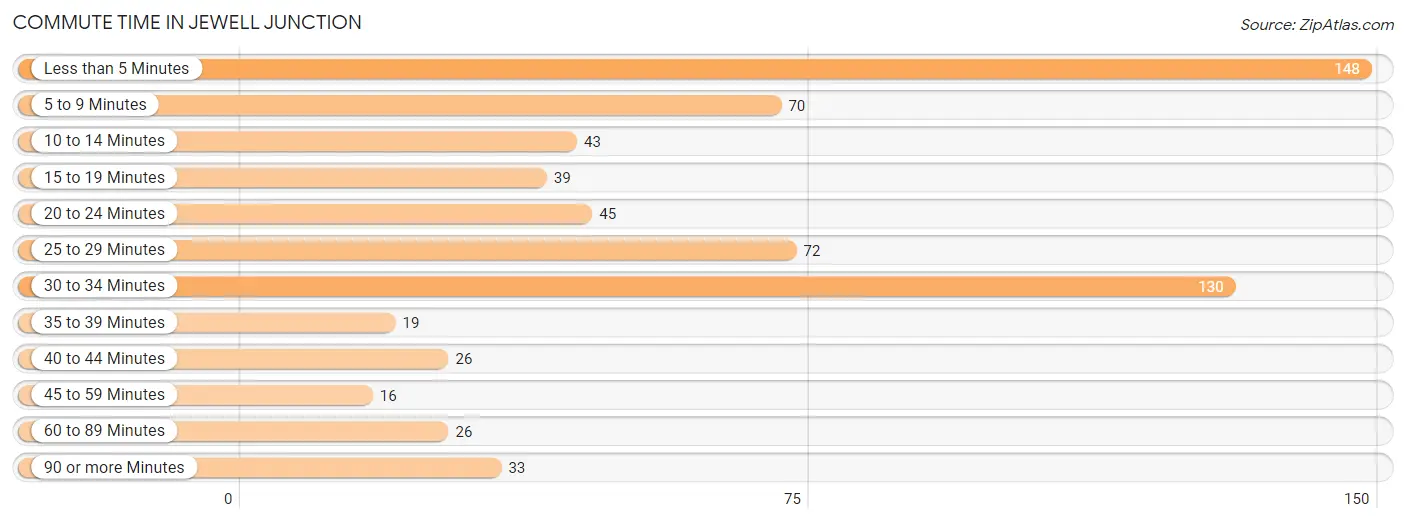
Commute Time in Jewell Junction
The most frequently occuring commute durations in Jewell Junction are less than 5 minutes (148 commuters, 22.2%), 30 to 34 minutes (130 commuters, 19.5%), and 25 to 29 minutes (72 commuters, 10.8%).
| Commute Time | # Commuters | % Commuters |
| Less than 5 Minutes | 148 | 22.2% |
| 5 to 9 Minutes | 70 | 10.5% |
| 10 to 14 Minutes | 43 | 6.5% |
| 15 to 19 Minutes | 39 | 5.9% |
| 20 to 24 Minutes | 45 | 6.8% |
| 25 to 29 Minutes | 72 | 10.8% |
| 30 to 34 Minutes | 130 | 19.5% |
| 35 to 39 Minutes | 19 | 2.9% |
| 40 to 44 Minutes | 26 | 3.9% |
| 45 to 59 Minutes | 16 | 2.4% |
| 60 to 89 Minutes | 26 | 3.9% |
| 90 or more Minutes | 33 | 5.0% |
Commute Time by Sex in Jewell Junction
The most common commute times in Jewell Junction are less than 5 minutes (94 commuters, 25.1%) for males and 30 to 34 minutes (70 commuters, 23.9%) for females.
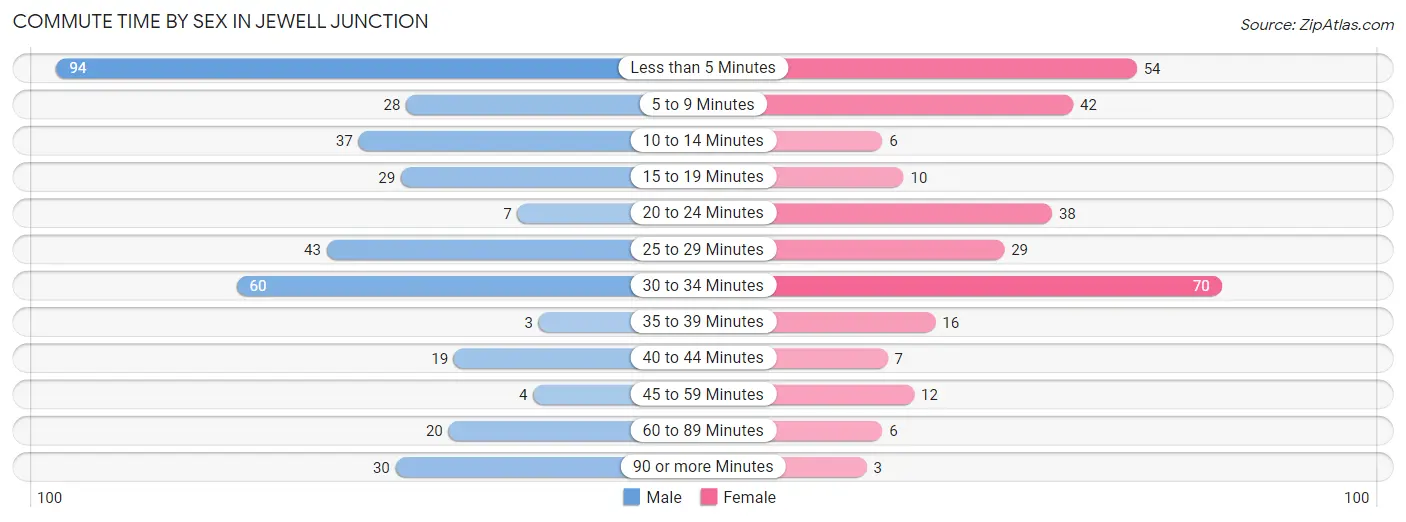
| Commute Time | Male | Female |
| Less than 5 Minutes | 94 (25.1%) | 54 (18.4%) |
| 5 to 9 Minutes | 28 (7.5%) | 42 (14.3%) |
| 10 to 14 Minutes | 37 (9.9%) | 6 (2.1%) |
| 15 to 19 Minutes | 29 (7.7%) | 10 (3.4%) |
| 20 to 24 Minutes | 7 (1.9%) | 38 (13.0%) |
| 25 to 29 Minutes | 43 (11.5%) | 29 (9.9%) |
| 30 to 34 Minutes | 60 (16.0%) | 70 (23.9%) |
| 35 to 39 Minutes | 3 (0.8%) | 16 (5.5%) |
| 40 to 44 Minutes | 19 (5.1%) | 7 (2.4%) |
| 45 to 59 Minutes | 4 (1.1%) | 12 (4.1%) |
| 60 to 89 Minutes | 20 (5.3%) | 6 (2.1%) |
| 90 or more Minutes | 30 (8.0%) | 3 (1.0%) |
Time of Departure to Work by Sex in Jewell Junction
The most frequent times of departure to work in Jewell Junction are 6:30 AM to 6:59 AM (65, 17.4%) for males and 7:30 AM to 7:59 AM (75, 25.6%) for females.
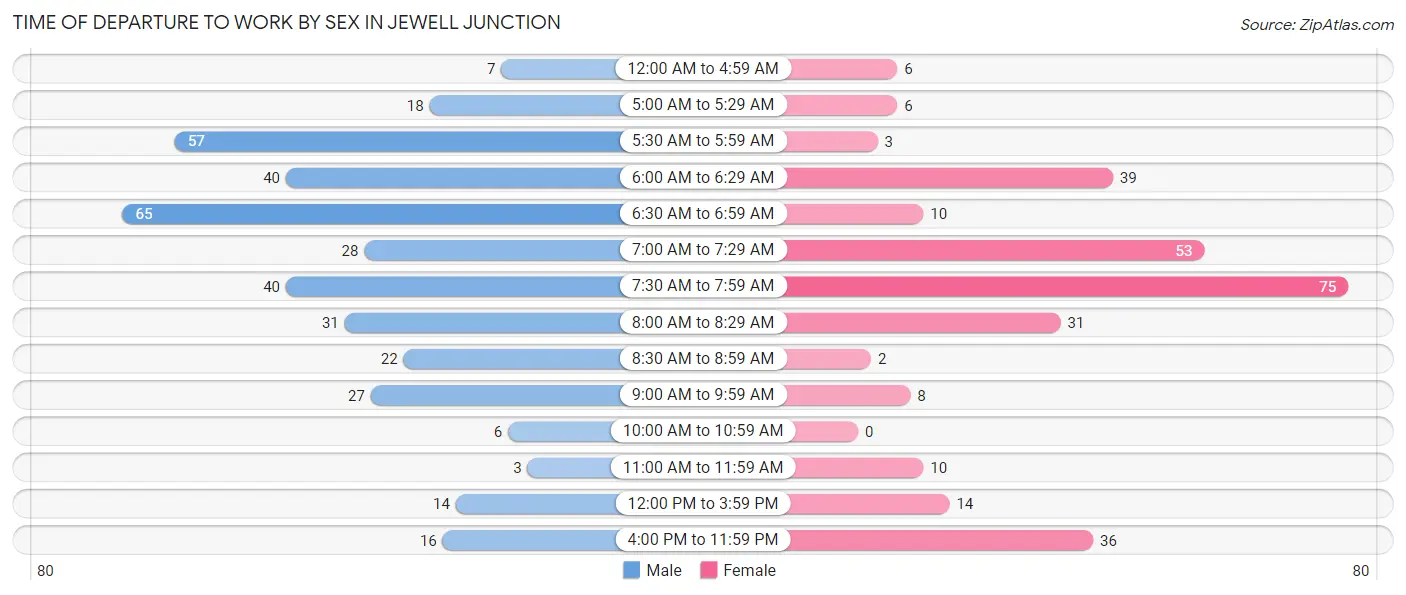
| Time of Departure | Male | Female |
| 12:00 AM to 4:59 AM | 7 (1.9%) | 6 (2.1%) |
| 5:00 AM to 5:29 AM | 18 (4.8%) | 6 (2.1%) |
| 5:30 AM to 5:59 AM | 57 (15.2%) | 3 (1.0%) |
| 6:00 AM to 6:29 AM | 40 (10.7%) | 39 (13.3%) |
| 6:30 AM to 6:59 AM | 65 (17.4%) | 10 (3.4%) |
| 7:00 AM to 7:29 AM | 28 (7.5%) | 53 (18.1%) |
| 7:30 AM to 7:59 AM | 40 (10.7%) | 75 (25.6%) |
| 8:00 AM to 8:29 AM | 31 (8.3%) | 31 (10.6%) |
| 8:30 AM to 8:59 AM | 22 (5.9%) | 2 (0.7%) |
| 9:00 AM to 9:59 AM | 27 (7.2%) | 8 (2.7%) |
| 10:00 AM to 10:59 AM | 6 (1.6%) | 0 (0.0%) |
| 11:00 AM to 11:59 AM | 3 (0.8%) | 10 (3.4%) |
| 12:00 PM to 3:59 PM | 14 (3.7%) | 14 (4.8%) |
| 4:00 PM to 11:59 PM | 16 (4.3%) | 36 (12.3%) |
| Total | 374 (100.0%) | 293 (100.0%) |
Housing Occupancy in Jewell Junction
Occupancy by Ownership in Jewell Junction
Of the total 507 dwellings in Jewell Junction, owner-occupied units account for 413 (81.5%), while renter-occupied units make up 94 (18.5%).
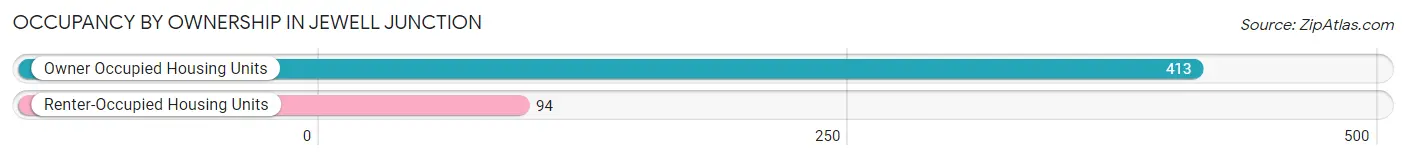
| Occupancy | # Housing Units | % Housing Units |
| Owner Occupied Housing Units | 413 | 81.5% |
| Renter-Occupied Housing Units | 94 | 18.5% |
| Total Occupied Housing Units | 507 | 100.0% |
Occupancy by Household Size in Jewell Junction
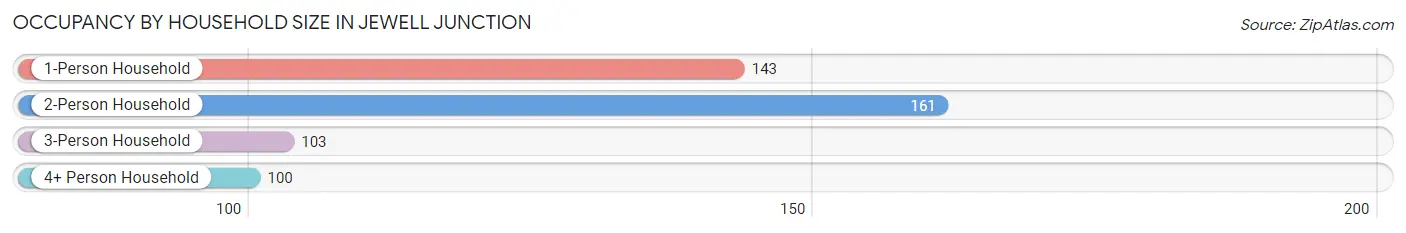
| Household Size | # Housing Units | % Housing Units |
| 1-Person Household | 143 | 28.2% |
| 2-Person Household | 161 | 31.8% |
| 3-Person Household | 103 | 20.3% |
| 4+ Person Household | 100 | 19.7% |
| Total Housing Units | 507 | 100.0% |
Occupancy by Ownership by Household Size in Jewell Junction
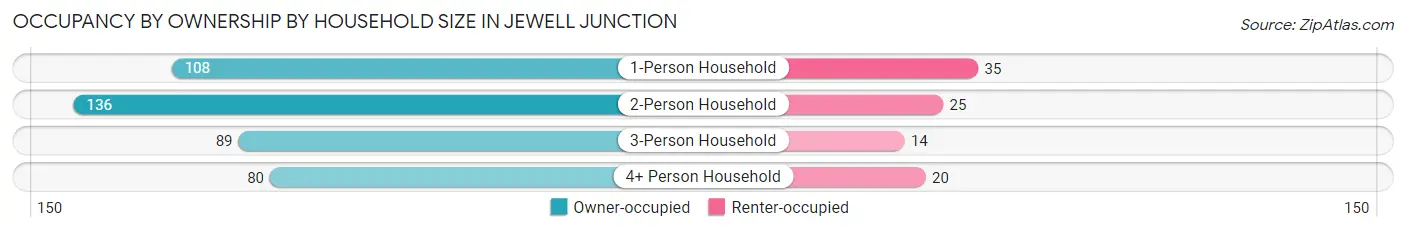
| Household Size | Owner-occupied | Renter-occupied |
| 1-Person Household | 108 (75.5%) | 35 (24.5%) |
| 2-Person Household | 136 (84.5%) | 25 (15.5%) |
| 3-Person Household | 89 (86.4%) | 14 (13.6%) |
| 4+ Person Household | 80 (80.0%) | 20 (20.0%) |
| Total Housing Units | 413 (81.5%) | 94 (18.5%) |
Occupancy by Educational Attainment in Jewell Junction
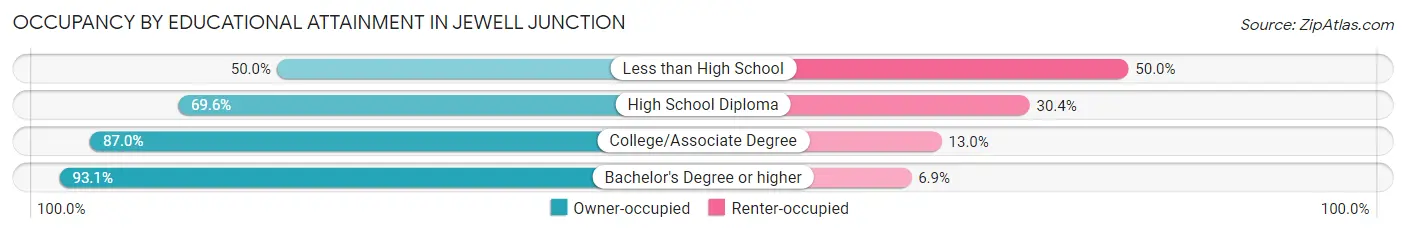
| Household Size | Owner-occupied | Renter-occupied |
| Less than High School | 15 (50.0%) | 15 (50.0%) |
| High School Diploma | 103 (69.6%) | 45 (30.4%) |
| College/Associate Degree | 161 (87.0%) | 24 (13.0%) |
| Bachelor's Degree or higher | 134 (93.1%) | 10 (6.9%) |
Occupancy by Age of Householder in Jewell Junction
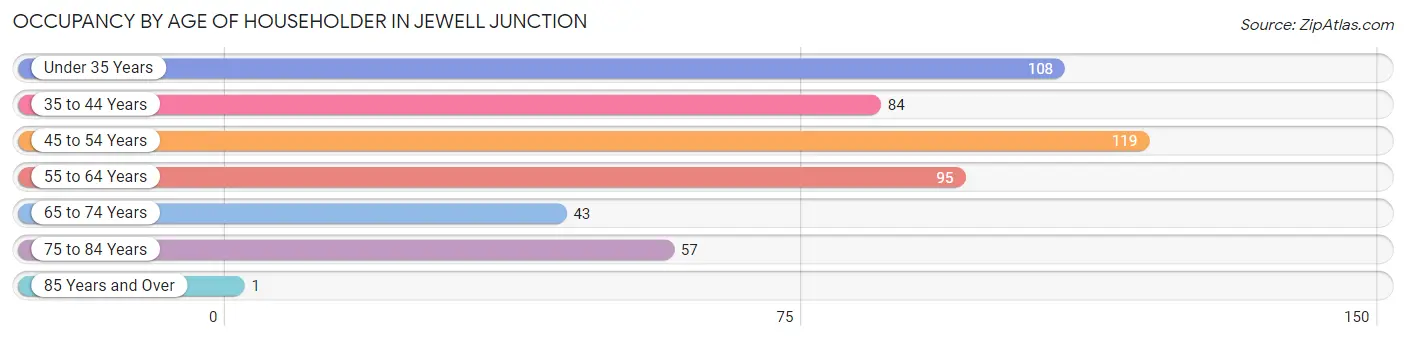
| Age Bracket | # Households | % Households |
| Under 35 Years | 108 | 21.3% |
| 35 to 44 Years | 84 | 16.6% |
| 45 to 54 Years | 119 | 23.5% |
| 55 to 64 Years | 95 | 18.7% |
| 65 to 74 Years | 43 | 8.5% |
| 75 to 84 Years | 57 | 11.2% |
| 85 Years and Over | 1 | 0.2% |
| Total | 507 | 100.0% |
Housing Finances in Jewell Junction
Median Income by Occupancy in Jewell Junction
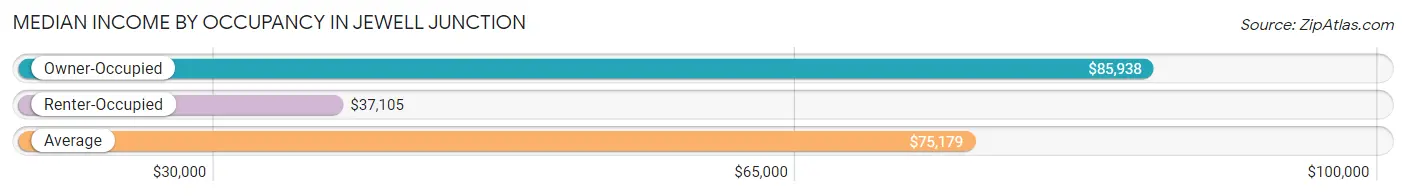
| Occupancy Type | # Households | Median Income |
| Owner-Occupied | 413 (81.5%) | $85,938 |
| Renter-Occupied | 94 (18.5%) | $37,105 |
| Average | 507 (100.0%) | $75,179 |
Occupancy by Householder Income Bracket in Jewell Junction
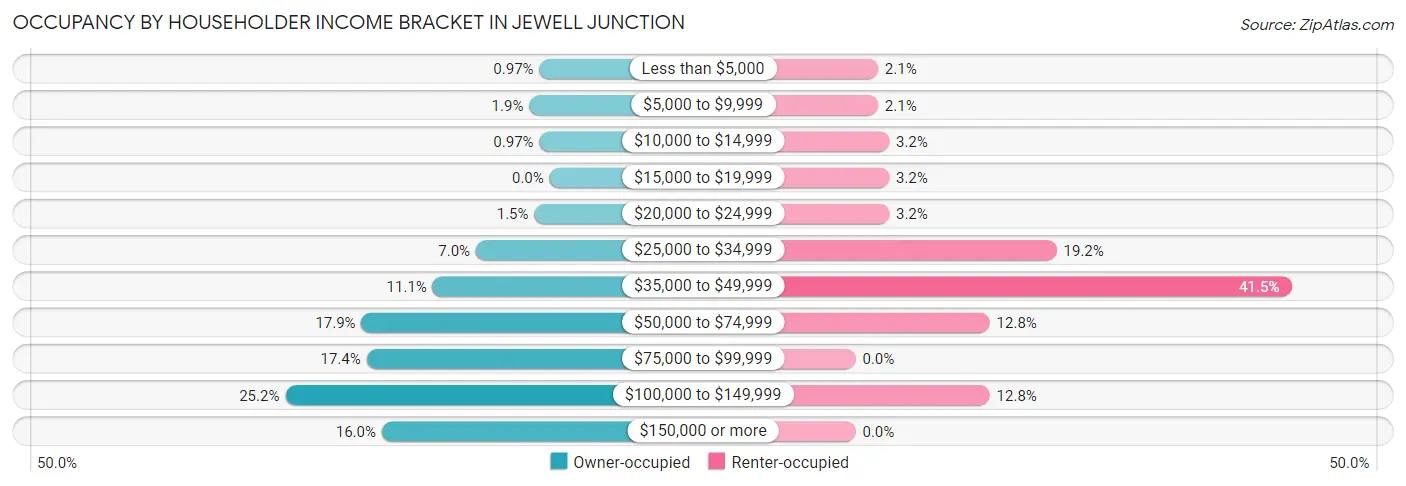
| Income Bracket | Owner-occupied | Renter-occupied |
| Less than $5,000 | 4 (1.0%) | 2 (2.1%) |
| $5,000 to $9,999 | 8 (1.9%) | 2 (2.1%) |
| $10,000 to $14,999 | 4 (1.0%) | 3 (3.2%) |
| $15,000 to $19,999 | 0 (0.0%) | 3 (3.2%) |
| $20,000 to $24,999 | 6 (1.5%) | 3 (3.2%) |
| $25,000 to $34,999 | 29 (7.0%) | 18 (19.2%) |
| $35,000 to $49,999 | 46 (11.1%) | 39 (41.5%) |
| $50,000 to $74,999 | 74 (17.9%) | 12 (12.8%) |
| $75,000 to $99,999 | 72 (17.4%) | 0 (0.0%) |
| $100,000 to $149,999 | 104 (25.2%) | 12 (12.8%) |
| $150,000 or more | 66 (16.0%) | 0 (0.0%) |
| Total | 413 (100.0%) | 94 (100.0%) |
Monthly Housing Cost Tiers in Jewell Junction
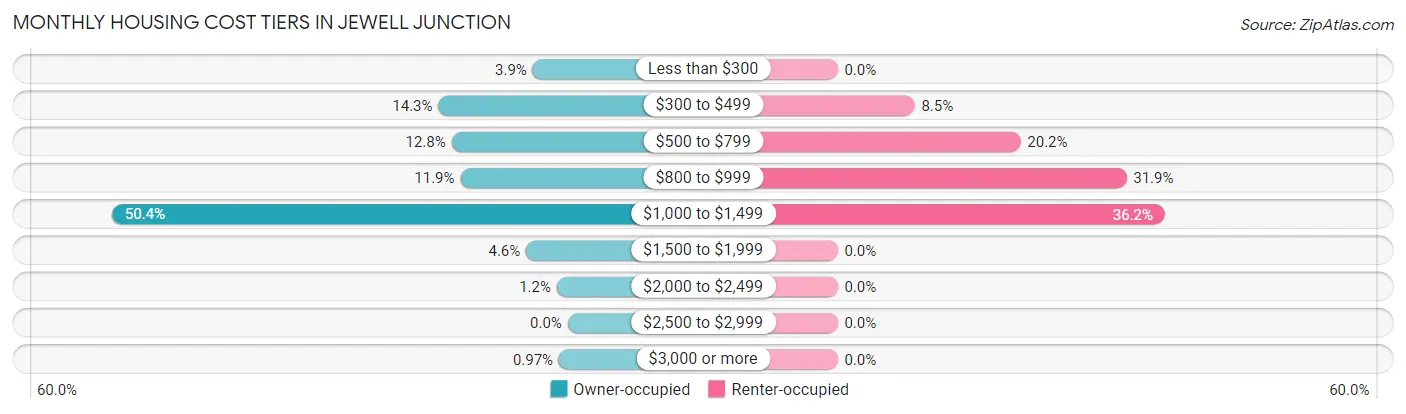
| Monthly Cost | Owner-occupied | Renter-occupied |
| Less than $300 | 16 (3.9%) | 0 (0.0%) |
| $300 to $499 | 59 (14.3%) | 8 (8.5%) |
| $500 to $799 | 53 (12.8%) | 19 (20.2%) |
| $800 to $999 | 49 (11.9%) | 30 (31.9%) |
| $1,000 to $1,499 | 208 (50.4%) | 34 (36.2%) |
| $1,500 to $1,999 | 19 (4.6%) | 0 (0.0%) |
| $2,000 to $2,499 | 5 (1.2%) | 0 (0.0%) |
| $2,500 to $2,999 | 0 (0.0%) | 0 (0.0%) |
| $3,000 or more | 4 (1.0%) | 0 (0.0%) |
| Total | 413 (100.0%) | 94 (100.0%) |
Physical Housing Characteristics in Jewell Junction
Housing Structures in Jewell Junction
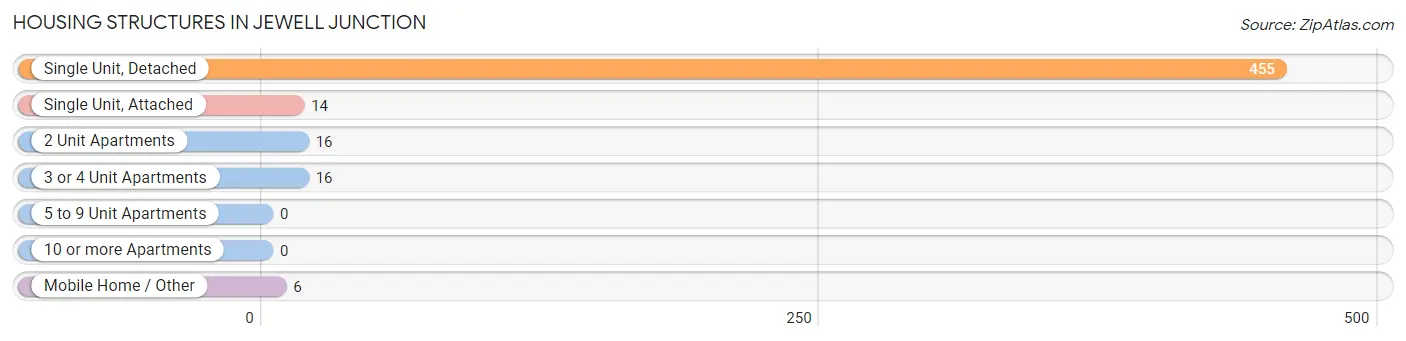
| Structure Type | # Housing Units | % Housing Units |
| Single Unit, Detached | 455 | 89.7% |
| Single Unit, Attached | 14 | 2.8% |
| 2 Unit Apartments | 16 | 3.2% |
| 3 or 4 Unit Apartments | 16 | 3.2% |
| 5 to 9 Unit Apartments | 0 | 0.0% |
| 10 or more Apartments | 0 | 0.0% |
| Mobile Home / Other | 6 | 1.2% |
| Total | 507 | 100.0% |
Housing Structures by Occupancy in Jewell Junction
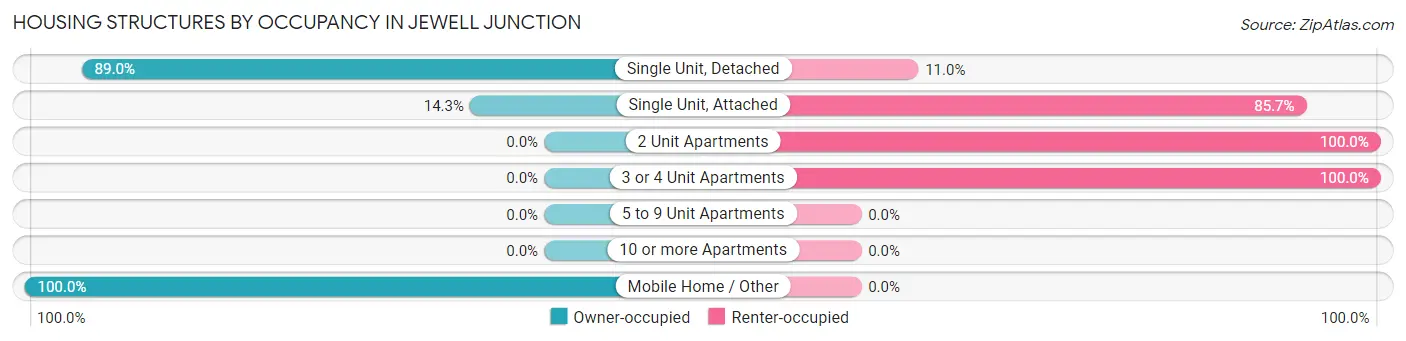
| Structure Type | Owner-occupied | Renter-occupied |
| Single Unit, Detached | 405 (89.0%) | 50 (11.0%) |
| Single Unit, Attached | 2 (14.3%) | 12 (85.7%) |
| 2 Unit Apartments | 0 (0.0%) | 16 (100.0%) |
| 3 or 4 Unit Apartments | 0 (0.0%) | 16 (100.0%) |
| 5 to 9 Unit Apartments | 0 (0.0%) | 0 (0.0%) |
| 10 or more Apartments | 0 (0.0%) | 0 (0.0%) |
| Mobile Home / Other | 6 (100.0%) | 0 (0.0%) |
| Total | 413 (81.5%) | 94 (18.5%) |
Housing Structures by Number of Rooms in Jewell Junction
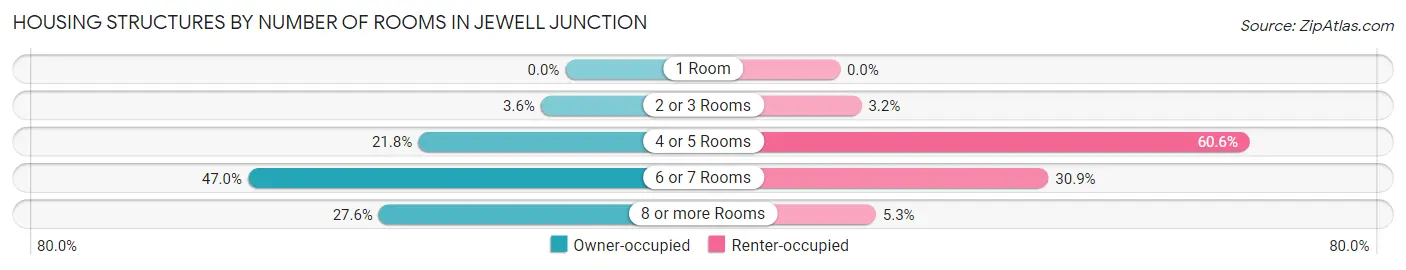
| Number of Rooms | Owner-occupied | Renter-occupied |
| 1 Room | 0 (0.0%) | 0 (0.0%) |
| 2 or 3 Rooms | 15 (3.6%) | 3 (3.2%) |
| 4 or 5 Rooms | 90 (21.8%) | 57 (60.6%) |
| 6 or 7 Rooms | 194 (47.0%) | 29 (30.8%) |
| 8 or more Rooms | 114 (27.6%) | 5 (5.3%) |
| Total | 413 (100.0%) | 94 (100.0%) |
Housing Structure by Heating Type in Jewell Junction
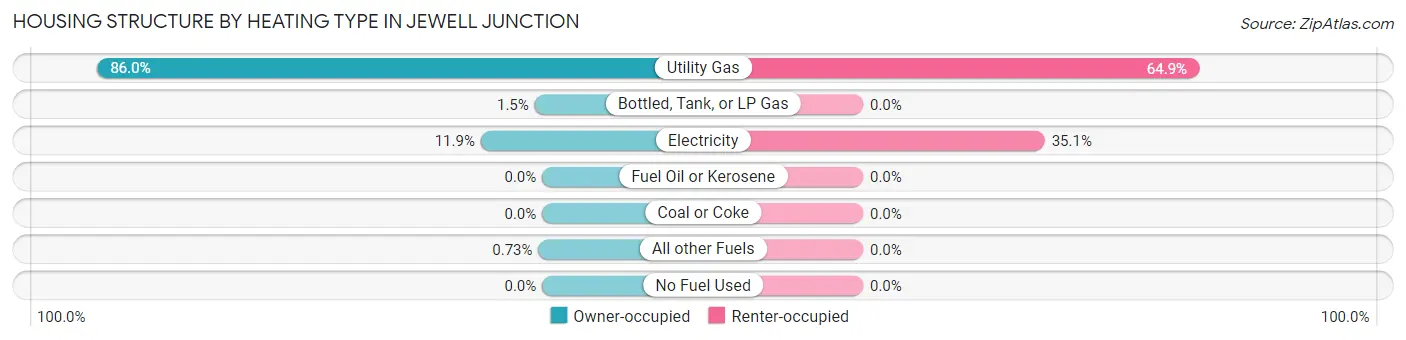
| Heating Type | Owner-occupied | Renter-occupied |
| Utility Gas | 355 (86.0%) | 61 (64.9%) |
| Bottled, Tank, or LP Gas | 6 (1.5%) | 0 (0.0%) |
| Electricity | 49 (11.9%) | 33 (35.1%) |
| Fuel Oil or Kerosene | 0 (0.0%) | 0 (0.0%) |
| Coal or Coke | 0 (0.0%) | 0 (0.0%) |
| All other Fuels | 3 (0.7%) | 0 (0.0%) |
| No Fuel Used | 0 (0.0%) | 0 (0.0%) |
| Total | 413 (100.0%) | 94 (100.0%) |
Household Vehicle Usage in Jewell Junction
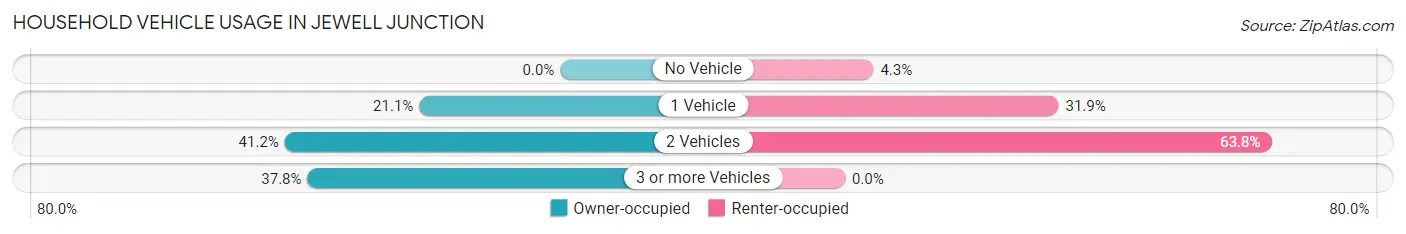
| Vehicles per Household | Owner-occupied | Renter-occupied |
| No Vehicle | 0 (0.0%) | 4 (4.3%) |
| 1 Vehicle | 87 (21.1%) | 30 (31.9%) |
| 2 Vehicles | 170 (41.2%) | 60 (63.8%) |
| 3 or more Vehicles | 156 (37.8%) | 0 (0.0%) |
| Total | 413 (100.0%) | 94 (100.0%) |
Real Estate & Mortgages in Jewell Junction
Real Estate and Mortgage Overview in Jewell Junction
| Characteristic | Without Mortgage | With Mortgage |
| Housing Units | 134 | 279 |
| Median Property Value | $133,000 | $120,800 |
| Median Household Income | $69,500 | $46 |
| Monthly Housing Costs | $483 | $4 |
| Real Estate Taxes | $1,900 | $8 |
Property Value by Mortgage Status in Jewell Junction
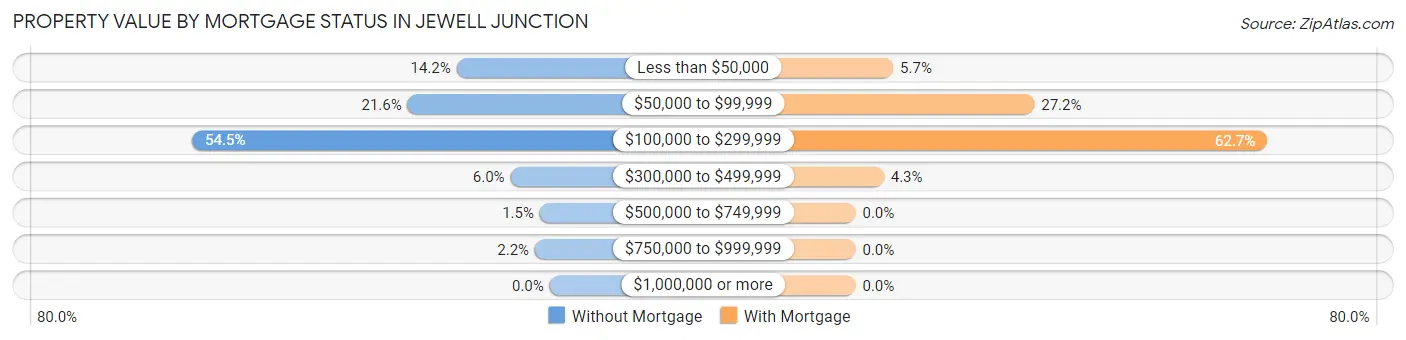
| Property Value | Without Mortgage | With Mortgage |
| Less than $50,000 | 19 (14.2%) | 16 (5.7%) |
| $50,000 to $99,999 | 29 (21.6%) | 76 (27.2%) |
| $100,000 to $299,999 | 73 (54.5%) | 175 (62.7%) |
| $300,000 to $499,999 | 8 (6.0%) | 12 (4.3%) |
| $500,000 to $749,999 | 2 (1.5%) | 0 (0.0%) |
| $750,000 to $999,999 | 3 (2.2%) | 0 (0.0%) |
| $1,000,000 or more | 0 (0.0%) | 0 (0.0%) |
| Total | 134 (100.0%) | 279 (100.0%) |
Household Income by Mortgage Status in Jewell Junction
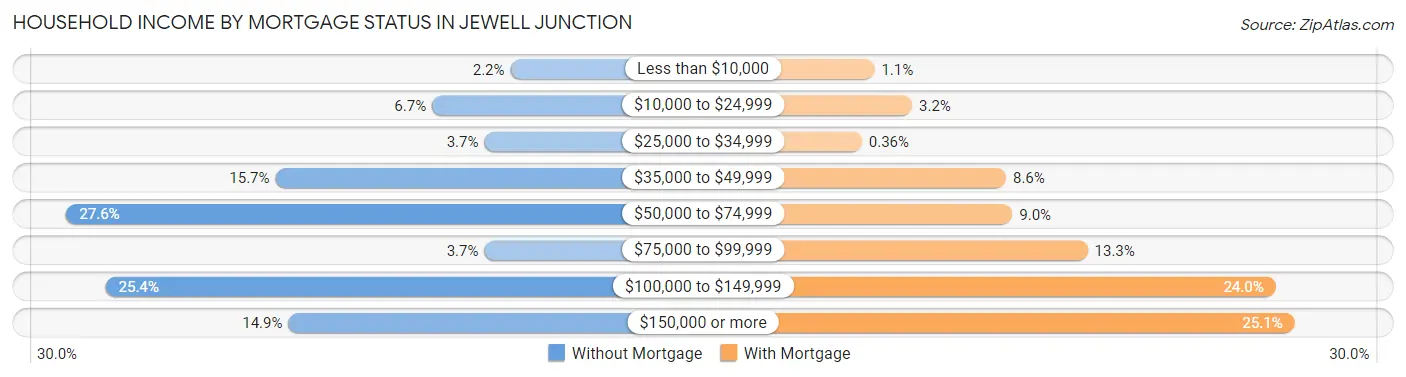
| Household Income | Without Mortgage | With Mortgage |
| Less than $10,000 | 3 (2.2%) | 3 (1.1%) |
| $10,000 to $24,999 | 9 (6.7%) | 9 (3.2%) |
| $25,000 to $34,999 | 5 (3.7%) | 1 (0.4%) |
| $35,000 to $49,999 | 21 (15.7%) | 24 (8.6%) |
| $50,000 to $74,999 | 37 (27.6%) | 25 (9.0%) |
| $75,000 to $99,999 | 5 (3.7%) | 37 (13.3%) |
| $100,000 to $149,999 | 34 (25.4%) | 67 (24.0%) |
| $150,000 or more | 20 (14.9%) | 70 (25.1%) |
| Total | 134 (100.0%) | 279 (100.0%) |
Property Value to Household Income Ratio in Jewell Junction
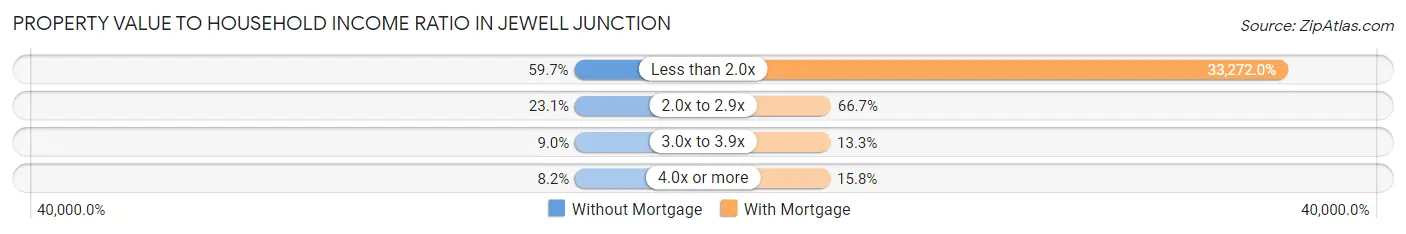
| Value-to-Income Ratio | Without Mortgage | With Mortgage |
| Less than 2.0x | 80 (59.7%) | 92,829 (33,272.0%) |
| 2.0x to 2.9x | 31 (23.1%) | 186 (66.7%) |
| 3.0x to 3.9x | 12 (9.0%) | 37 (13.3%) |
| 4.0x or more | 11 (8.2%) | 44 (15.8%) |
| Total | 134 (100.0%) | 279 (100.0%) |
Real Estate Taxes by Mortgage Status in Jewell Junction
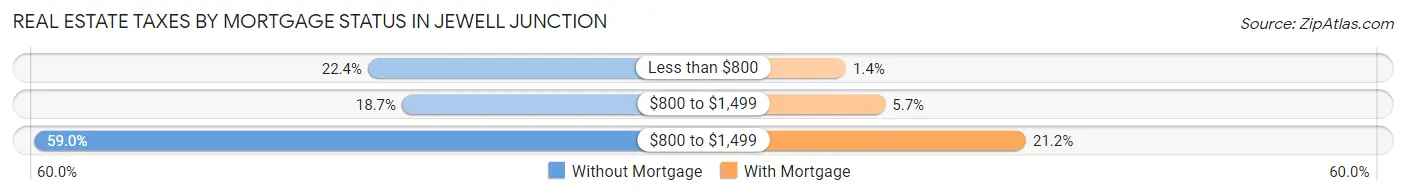
| Property Taxes | Without Mortgage | With Mortgage |
| Less than $800 | 30 (22.4%) | 4 (1.4%) |
| $800 to $1,499 | 25 (18.7%) | 16 (5.7%) |
| $800 to $1,499 | 79 (59.0%) | 59 (21.1%) |
| Total | 134 (100.0%) | 279 (100.0%) |
Health & Disability in Jewell Junction
Health Insurance Coverage by Age in Jewell Junction
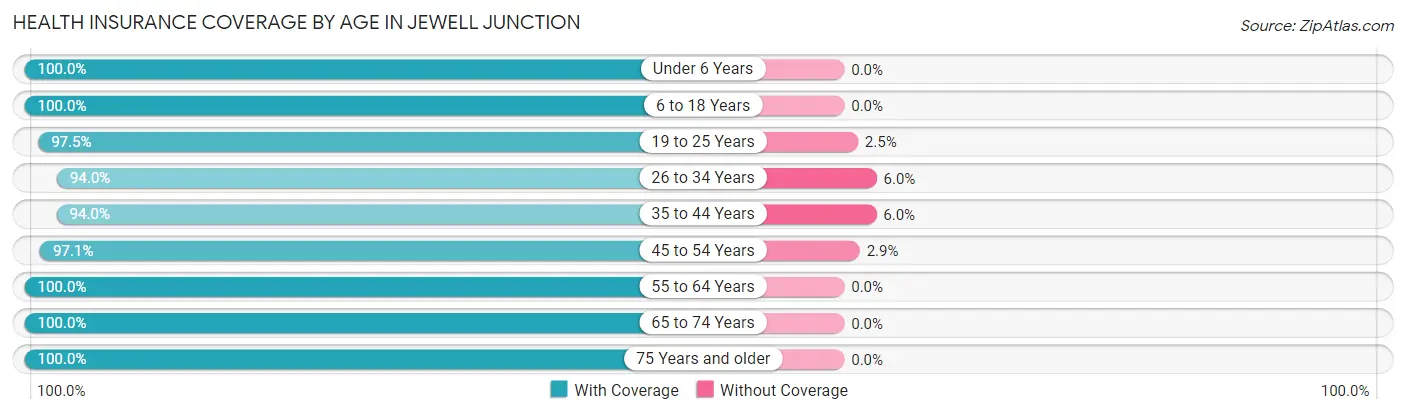
| Age Bracket | With Coverage | Without Coverage |
| Under 6 Years | 59 (100.0%) | 0 (0.0%) |
| 6 to 18 Years | 335 (100.0%) | 0 (0.0%) |
| 19 to 25 Years | 115 (97.5%) | 3 (2.5%) |
| 26 to 34 Years | 109 (94.0%) | 7 (6.0%) |
| 35 to 44 Years | 126 (94.0%) | 8 (6.0%) |
| 45 to 54 Years | 202 (97.1%) | 6 (2.9%) |
| 55 to 64 Years | 153 (100.0%) | 0 (0.0%) |
| 65 to 74 Years | 87 (100.0%) | 0 (0.0%) |
| 75 Years and older | 74 (100.0%) | 0 (0.0%) |
| Total | 1,260 (98.1%) | 24 (1.9%) |
Health Insurance Coverage by Citizenship Status in Jewell Junction
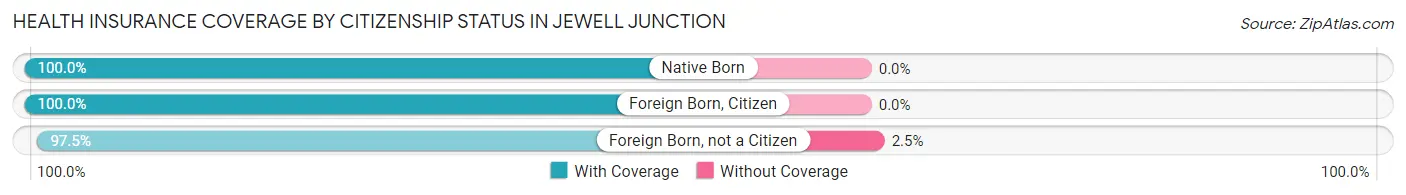
| Citizenship Status | With Coverage | Without Coverage |
| Native Born | 59 (100.0%) | 0 (0.0%) |
| Foreign Born, Citizen | 335 (100.0%) | 0 (0.0%) |
| Foreign Born, not a Citizen | 115 (97.5%) | 3 (2.5%) |
Health Insurance Coverage by Household Income in Jewell Junction
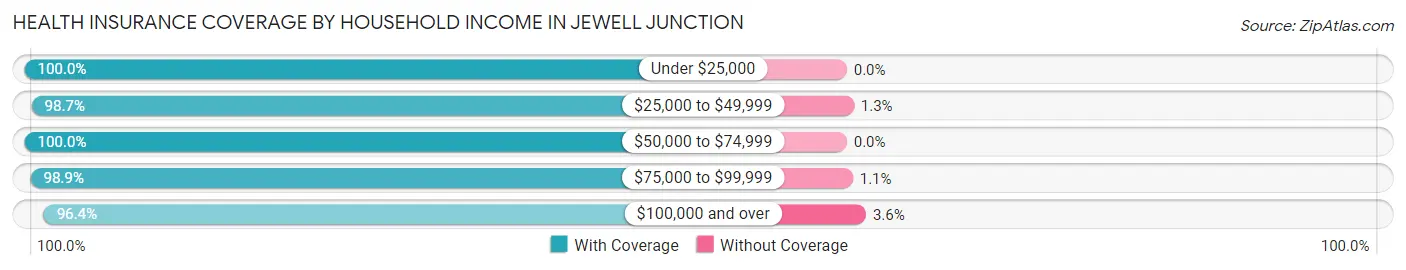
| Household Income | With Coverage | Without Coverage |
| Under $25,000 | 60 (100.0%) | 0 (0.0%) |
| $25,000 to $49,999 | 299 (98.7%) | 4 (1.3%) |
| $50,000 to $74,999 | 179 (100.0%) | 0 (0.0%) |
| $75,000 to $99,999 | 265 (98.9%) | 3 (1.1%) |
| $100,000 and over | 457 (96.4%) | 17 (3.6%) |
Public vs Private Health Insurance Coverage by Age in Jewell Junction
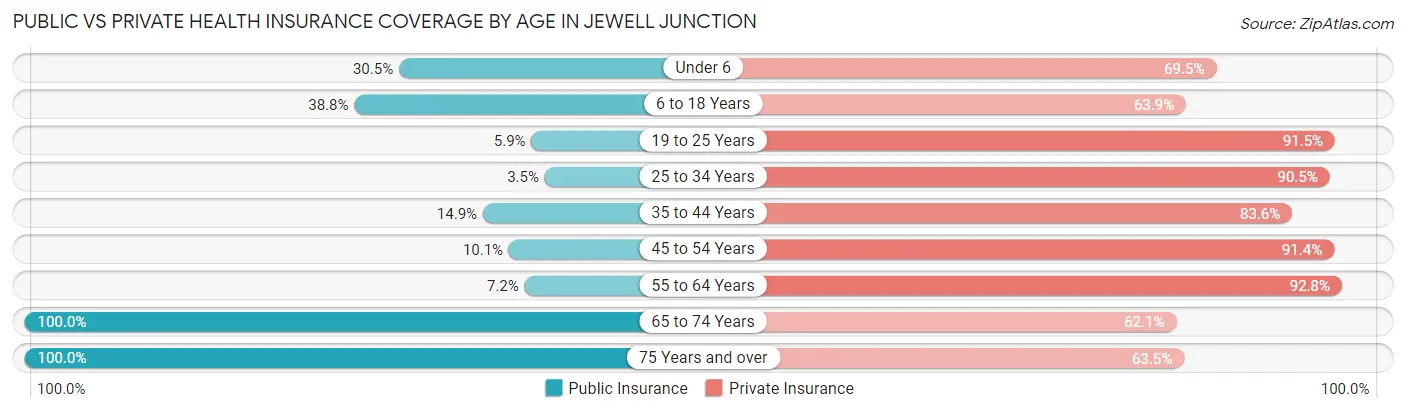
| Age Bracket | Public Insurance | Private Insurance |
| Under 6 | 18 (30.5%) | 41 (69.5%) |
| 6 to 18 Years | 130 (38.8%) | 214 (63.9%) |
| 19 to 25 Years | 7 (5.9%) | 108 (91.5%) |
| 25 to 34 Years | 4 (3.5%) | 105 (90.5%) |
| 35 to 44 Years | 20 (14.9%) | 112 (83.6%) |
| 45 to 54 Years | 21 (10.1%) | 190 (91.3%) |
| 55 to 64 Years | 11 (7.2%) | 142 (92.8%) |
| 65 to 74 Years | 87 (100.0%) | 54 (62.1%) |
| 75 Years and over | 74 (100.0%) | 47 (63.5%) |
| Total | 372 (29.0%) | 1,013 (78.9%) |
Disability Status by Sex by Age in Jewell Junction
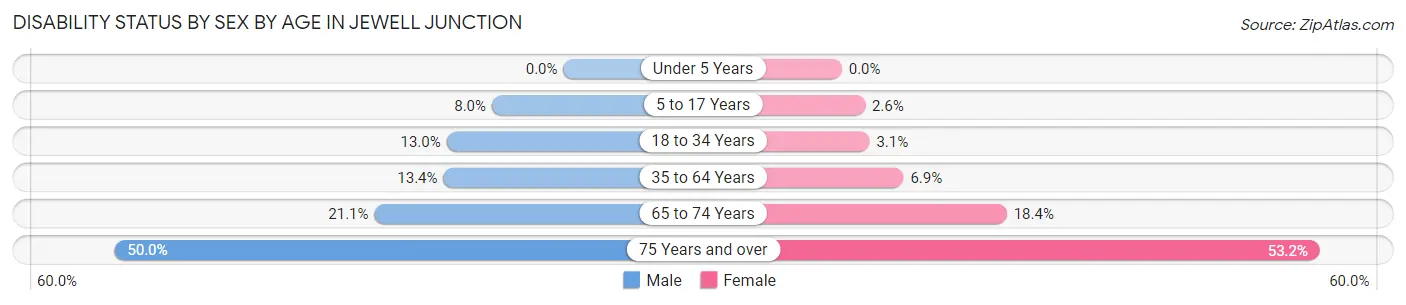
| Age Bracket | Male | Female |
| Under 5 Years | 0 (0.0%) | 0 (0.0%) |
| 5 to 17 Years | 9 (8.0%) | 5 (2.6%) |
| 18 to 34 Years | 19 (13.0%) | 4 (3.1%) |
| 35 to 64 Years | 35 (13.4%) | 16 (6.9%) |
| 65 to 74 Years | 8 (21.0%) | 9 (18.4%) |
| 75 Years and over | 6 (50.0%) | 33 (53.2%) |
Disability Class by Sex by Age in Jewell Junction
Disability Class: Hearing Difficulty
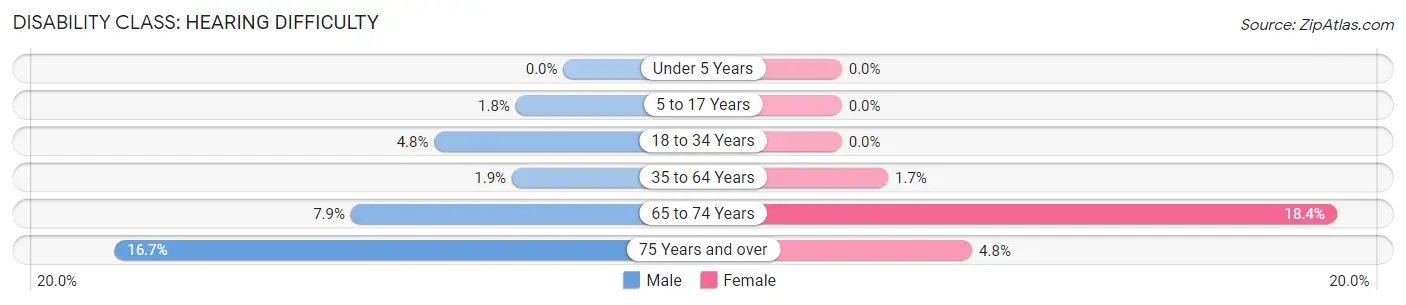
| Age Bracket | Male | Female |
| Under 5 Years | 0 (0.0%) | 0 (0.0%) |
| 5 to 17 Years | 2 (1.8%) | 0 (0.0%) |
| 18 to 34 Years | 7 (4.8%) | 0 (0.0%) |
| 35 to 64 Years | 5 (1.9%) | 4 (1.7%) |
| 65 to 74 Years | 3 (7.9%) | 9 (18.4%) |
| 75 Years and over | 2 (16.7%) | 3 (4.8%) |
Disability Class: Vision Difficulty
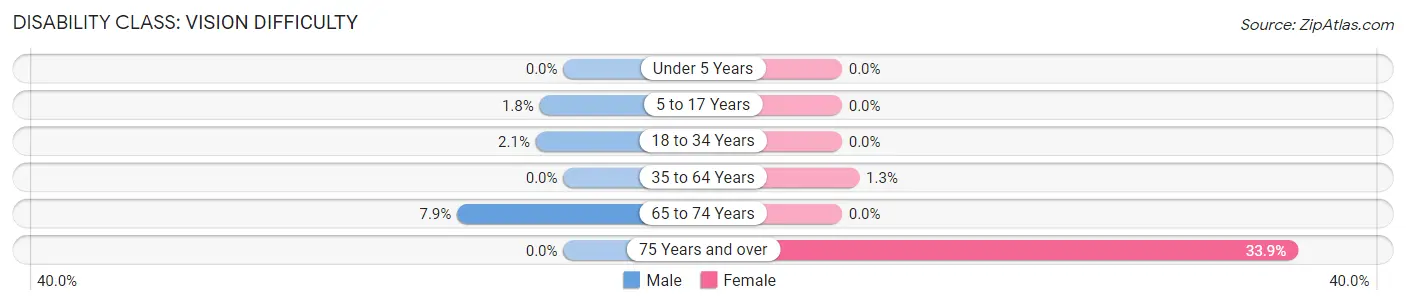
| Age Bracket | Male | Female |
| Under 5 Years | 0 (0.0%) | 0 (0.0%) |
| 5 to 17 Years | 2 (1.8%) | 0 (0.0%) |
| 18 to 34 Years | 3 (2.1%) | 0 (0.0%) |
| 35 to 64 Years | 0 (0.0%) | 3 (1.3%) |
| 65 to 74 Years | 3 (7.9%) | 0 (0.0%) |
| 75 Years and over | 0 (0.0%) | 21 (33.9%) |
Disability Class: Cognitive Difficulty
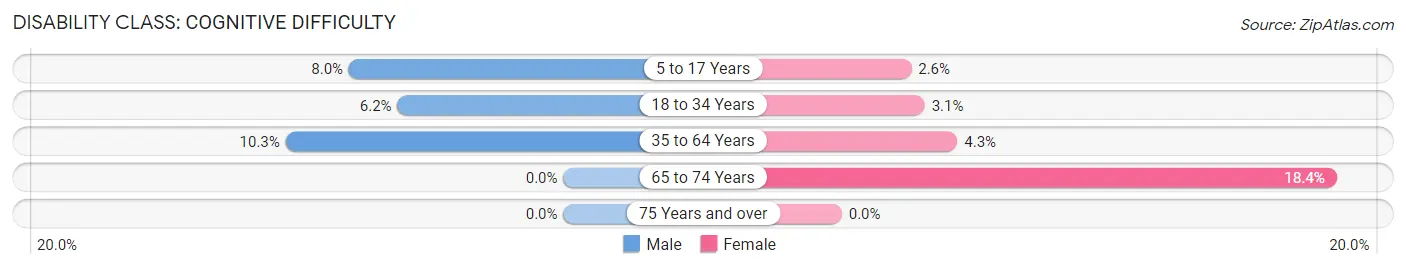
| Age Bracket | Male | Female |
| 5 to 17 Years | 9 (8.0%) | 5 (2.6%) |
| 18 to 34 Years | 9 (6.2%) | 4 (3.1%) |
| 35 to 64 Years | 27 (10.3%) | 10 (4.3%) |
| 65 to 74 Years | 0 (0.0%) | 9 (18.4%) |
| 75 Years and over | 0 (0.0%) | 0 (0.0%) |
Disability Class: Ambulatory Difficulty
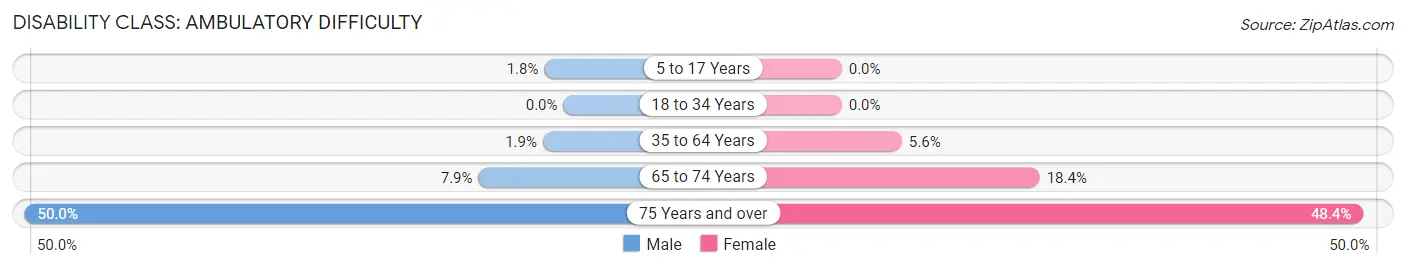
| Age Bracket | Male | Female |
| 5 to 17 Years | 2 (1.8%) | 0 (0.0%) |
| 18 to 34 Years | 0 (0.0%) | 0 (0.0%) |
| 35 to 64 Years | 5 (1.9%) | 13 (5.6%) |
| 65 to 74 Years | 3 (7.9%) | 9 (18.4%) |
| 75 Years and over | 6 (50.0%) | 30 (48.4%) |
Disability Class: Self-Care Difficulty
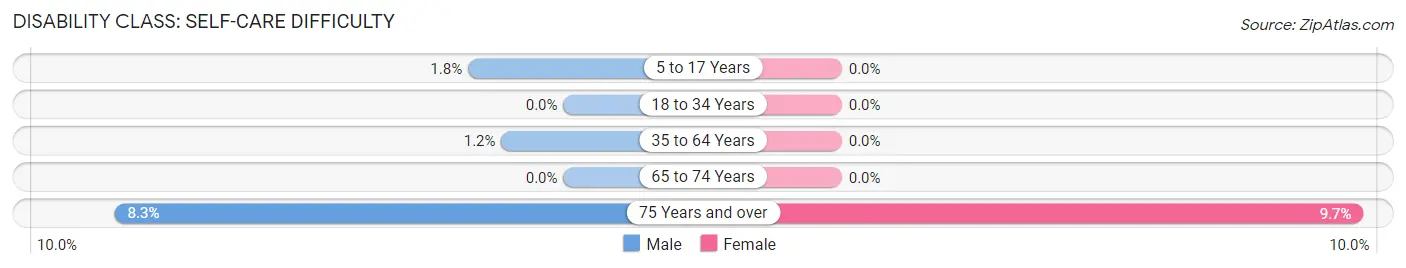
| Age Bracket | Male | Female |
| 5 to 17 Years | 2 (1.8%) | 0 (0.0%) |
| 18 to 34 Years | 0 (0.0%) | 0 (0.0%) |
| 35 to 64 Years | 3 (1.1%) | 0 (0.0%) |
| 65 to 74 Years | 0 (0.0%) | 0 (0.0%) |
| 75 Years and over | 1 (8.3%) | 6 (9.7%) |
Technology Access in Jewell Junction
Computing Device Access in Jewell Junction
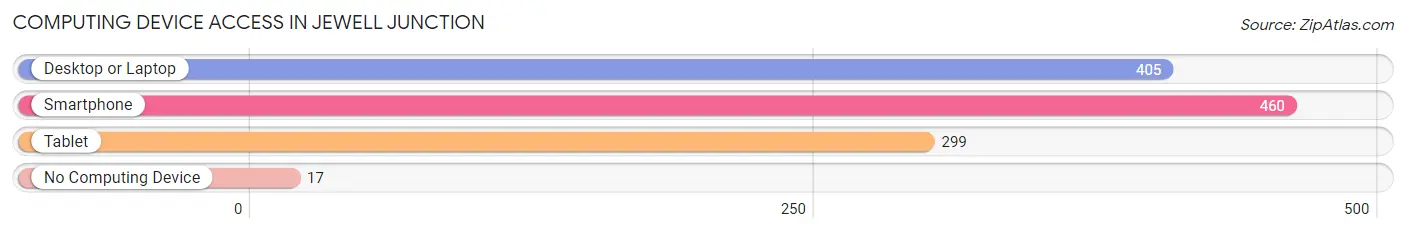
| Device Type | # Households | % Households |
| Desktop or Laptop | 405 | 79.9% |
| Smartphone | 460 | 90.7% |
| Tablet | 299 | 59.0% |
| No Computing Device | 17 | 3.4% |
| Total | 507 | 100.0% |
Internet Access in Jewell Junction
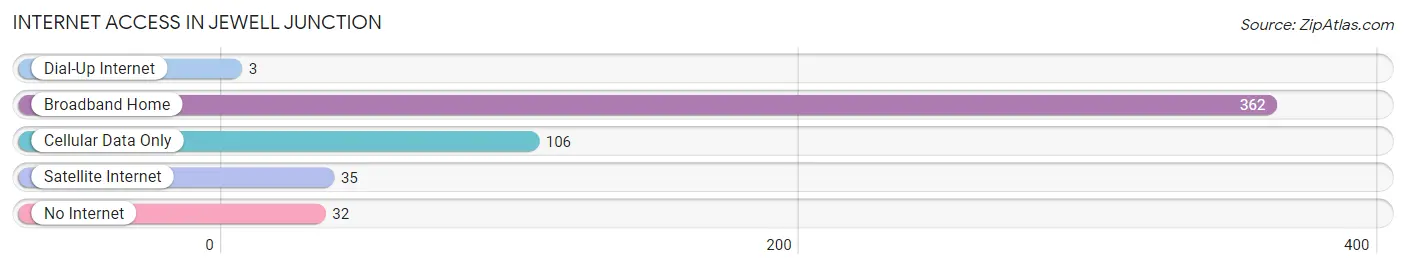
| Internet Type | # Households | % Households |
| Dial-Up Internet | 3 | 0.6% |
| Broadband Home | 362 | 71.4% |
| Cellular Data Only | 106 | 20.9% |
| Satellite Internet | 35 | 6.9% |
| No Internet | 32 | 6.3% |
| Total | 507 | 100.0% |
Jewell Junction Summary
Jewell Junction, Iowa is a small town located in the northwest corner of the state, in Hamilton County. It is situated on the banks of the Boone River, and is surrounded by rolling hills and farmland. The town was founded in 1856, and has a population of just over 500 people.
History
Jewell Junction was founded in 1856 by a group of settlers from the nearby town of Jewell. The settlers were looking for a place to settle and start a new life, and they chose the area around the Boone River. The town was named after the nearby Jewell family, who had settled in the area in the early 1800s.
The town grew slowly over the years, and by the early 1900s it had become a thriving community. The town was home to a variety of businesses, including a general store, a blacksmith, a hotel, and a post office. The town also had a school, which was attended by the children of the town.
In the early 1900s, the town was also home to a number of churches, including the Methodist Episcopal Church, the Baptist Church, and the Presbyterian Church. The town also had a number of social clubs, including the Jewell Junction Social Club, which was founded in 1906.
Geography
Jewell Junction is located in the northwest corner of Iowa, in Hamilton County. The town is situated on the banks of the Boone River, and is surrounded by rolling hills and farmland. The town is located about 25 miles from the state capital of Des Moines.
The town has a total area of 0.6 square miles, all of which is land. The town is located at an elevation of 890 feet above sea level. The climate in the area is generally mild, with temperatures ranging from the low 30s in the winter to the mid-80s in the summer.
Economy
The economy of Jewell Junction is largely based on agriculture. The town is home to a number of farms, which produce a variety of crops, including corn, soybeans, and hay. The town also has a number of small businesses, including a general store, a hardware store, and a restaurant.
The town is also home to a number of manufacturing companies, including a furniture factory and a plastics factory. The town is also home to a number of small businesses, including a bakery, a florist, and a barber shop.
Demographics
As of the 2010 census, the population of Jewell Junction was 514. The racial makeup of the town was 97.3% White, 0.6% African American, 0.2% Native American, 0.2% Asian, 0.2% from other races, and 1.7% from two or more races. Hispanic or Latino of any race were 0.8% of the population.
The median income for a household in the town was $41,250, and the median income for a family was $50,000. The per capita income for the town was $19,945. About 8.3% of families and 10.2% of the population were below the poverty line, including 14.3% of those under age 18 and 6.3% of those age 65 or over.
Jewell Junction is a small town with a rich history and a strong sense of community. The town is home to a variety of businesses, and the economy is largely based on agriculture. The town has a population of just over 500 people, and the racial makeup is predominantly white. The town has a median income of $41,250, and the per capita income is $19,945.
Common Questions
What is Per Capita Income in Jewell Junction?
Per Capita income in Jewell Junction is $45,059.
What is the Median Family Income in Jewell Junction?
Median Family Income in Jewell Junction is $88,750.
What is the Median Household income in Jewell Junction?
Median Household Income in Jewell Junction is $75,179.
What is Income or Wage Gap in Jewell Junction?
Income or Wage Gap in Jewell Junction is 44.2%.
Women in Jewell Junction earn 55.8 cents for every dollar earned by a man.
What is Inequality or Gini Index in Jewell Junction?
Inequality or Gini Index in Jewell Junction is 0.47.
What is the Total Population of Jewell Junction?
Total Population of Jewell Junction is 1,284.
What is the Total Male Population of Jewell Junction?
Total Male Population of Jewell Junction is 598.
What is the Total Female Population of Jewell Junction?
Total Female Population of Jewell Junction is 686.
What is the Ratio of Males per 100 Females in Jewell Junction?
There are 87.17 Males per 100 Females in Jewell Junction.
What is the Ratio of Females per 100 Males in Jewell Junction?
There are 114.72 Females per 100 Males in Jewell Junction.
What is the Median Population Age in Jewell Junction?
Median Population Age in Jewell Junction is 36.2 Years.
What is the Average Family Size in Jewell Junction
Average Family Size in Jewell Junction is 3.3 People.
What is the Average Household Size in Jewell Junction
Average Household Size in Jewell Junction is 2.5 People.
How Large is the Labor Force in Jewell Junction?
There are 724 People in the Labor Forcein in Jewell Junction.
What is the Percentage of People in the Labor Force in Jewell Junction?
71.6% of People are in the Labor Force in Jewell Junction.
What is the Unemployment Rate in Jewell Junction?
Unemployment Rate in Jewell Junction is 0.7%.