Humeston, IA Map & Demographics
Humeston Map
Humeston Overview
$34,965
PER CAPITA INCOME
$55,714
AVG FAMILY INCOME
$48,600
AVG HOUSEHOLD INCOME
29.4%
WAGE / INCOME GAP [ % ]
70.6¢/ $1
WAGE / INCOME GAP [ $ ]
0.51
INEQUALITY / GINI INDEX
510
TOTAL POPULATION
255
MALE POPULATION
255
FEMALE POPULATION
100.00
MALES / 100 FEMALES
100.00
FEMALES / 100 MALES
54.6
MEDIAN AGE
2.8
AVG FAMILY SIZE
2.2
AVG HOUSEHOLD SIZE
223
LABOR FORCE [ PEOPLE ]
56.2%
PERCENT IN LABOR FORCE
2.2%
UNEMPLOYMENT RATE
Humeston Zip Codes
Humeston Area Codes
Income in Humeston
Income Overview in Humeston
Per Capita Income in Humeston is $34,965, while median incomes of families and households are $55,714 and $48,600 respectively.
| Characteristic | Number | Measure |
| Per Capita Income | 510 | $34,965 |
| Median Family Income | 142 | $55,714 |
| Mean Family Income | 142 | $98,769 |
| Median Household Income | 230 | $48,600 |
| Mean Household Income | 230 | $76,439 |
| Income Deficit | 142 | $0 |
| Wage / Income Gap (%) | 510 | 29.38% |
| Wage / Income Gap ($) | 510 | 70.62¢ per $1 |
| Gini / Inequality Index | 510 | 0.51 |
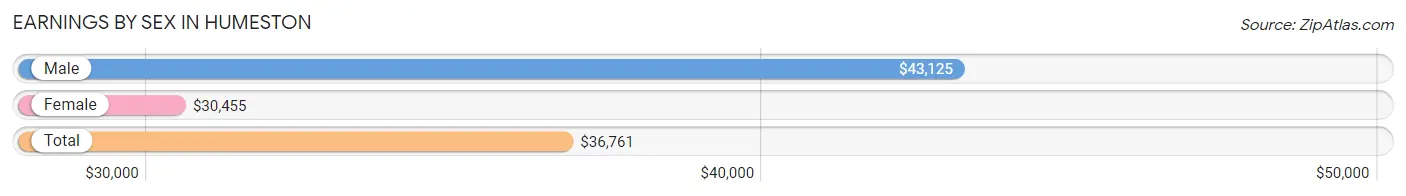
Earnings by Sex in Humeston
Average Earnings in Humeston are $36,761, $43,125 for men and $30,455 for women, a difference of 29.4%.
| Sex | Number | Average Earnings |
| Male | 125 (54.6%) | $43,125 |
| Female | 104 (45.4%) | $30,455 |
| Total | 229 (100.0%) | $36,761 |
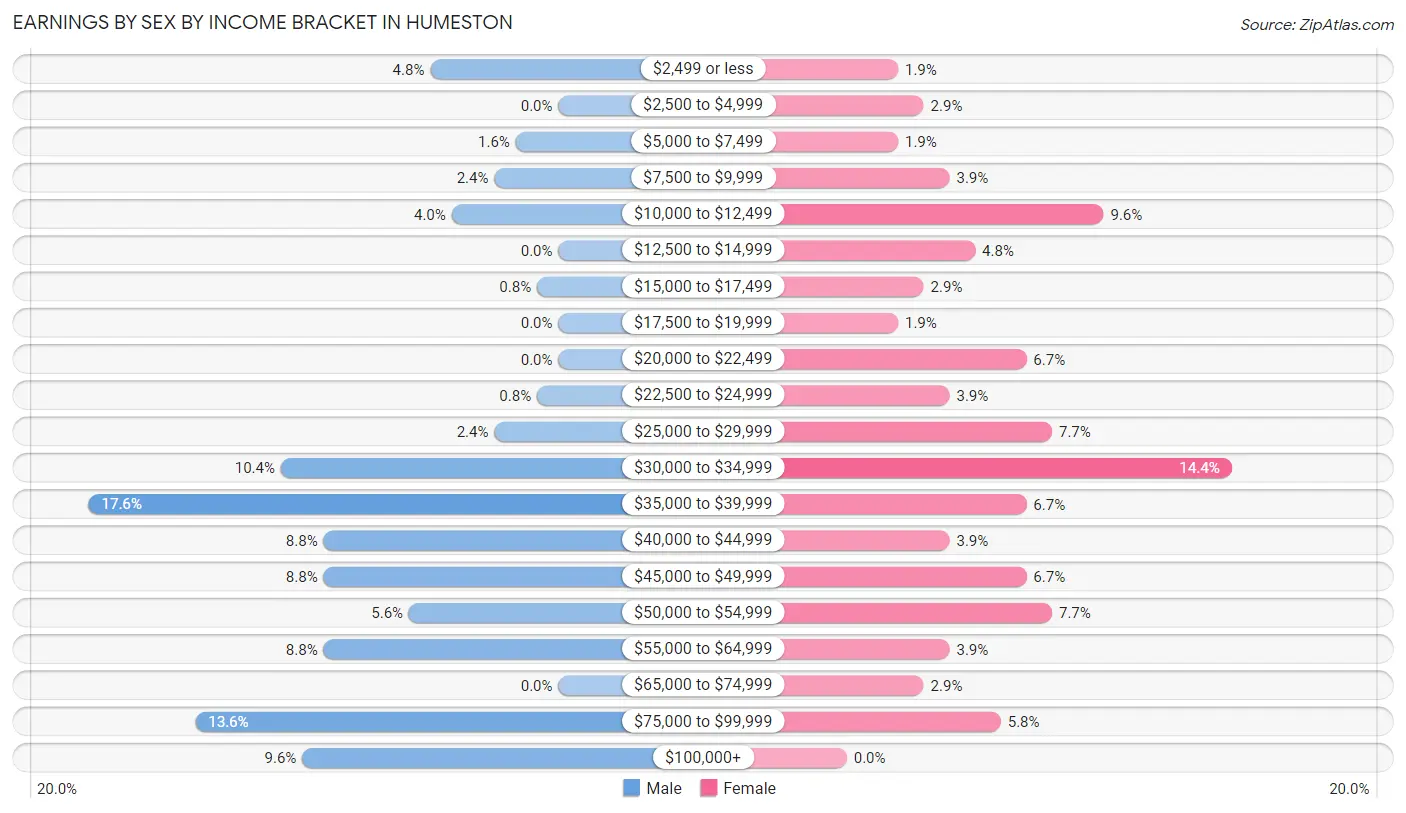
Earnings by Sex by Income Bracket in Humeston
The most common earnings brackets in Humeston are $35,000 to $39,999 for men (22 | 17.6%) and $30,000 to $34,999 for women (15 | 14.4%).
| Income | Male | Female |
| $2,499 or less | 6 (4.8%) | 2 (1.9%) |
| $2,500 to $4,999 | 0 (0.0%) | 3 (2.9%) |
| $5,000 to $7,499 | 2 (1.6%) | 2 (1.9%) |
| $7,500 to $9,999 | 3 (2.4%) | 4 (3.8%) |
| $10,000 to $12,499 | 5 (4.0%) | 10 (9.6%) |
| $12,500 to $14,999 | 0 (0.0%) | 5 (4.8%) |
| $15,000 to $17,499 | 1 (0.8%) | 3 (2.9%) |
| $17,500 to $19,999 | 0 (0.0%) | 2 (1.9%) |
| $20,000 to $22,499 | 0 (0.0%) | 7 (6.7%) |
| $22,500 to $24,999 | 1 (0.8%) | 4 (3.8%) |
| $25,000 to $29,999 | 3 (2.4%) | 8 (7.7%) |
| $30,000 to $34,999 | 13 (10.4%) | 15 (14.4%) |
| $35,000 to $39,999 | 22 (17.6%) | 7 (6.7%) |
| $40,000 to $44,999 | 11 (8.8%) | 4 (3.8%) |
| $45,000 to $49,999 | 11 (8.8%) | 7 (6.7%) |
| $50,000 to $54,999 | 7 (5.6%) | 8 (7.7%) |
| $55,000 to $64,999 | 11 (8.8%) | 4 (3.8%) |
| $65,000 to $74,999 | 0 (0.0%) | 3 (2.9%) |
| $75,000 to $99,999 | 17 (13.6%) | 6 (5.8%) |
| $100,000+ | 12 (9.6%) | 0 (0.0%) |
| Total | 125 (100.0%) | 104 (100.0%) |
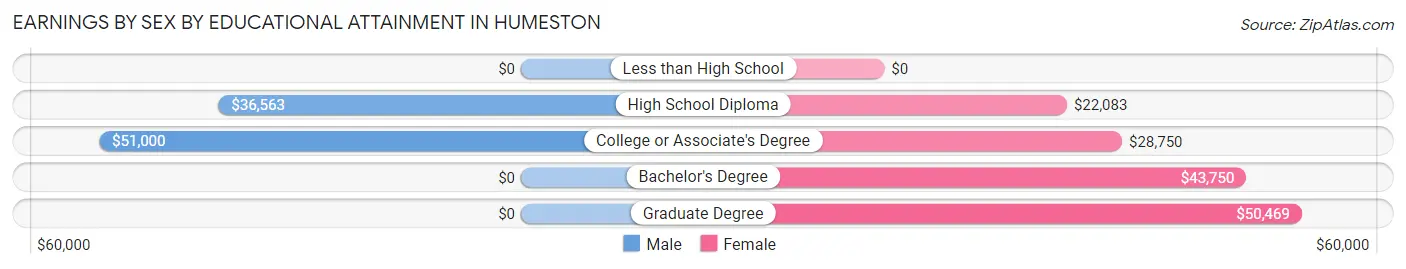
Earnings by Sex by Educational Attainment in Humeston
Average earnings in Humeston are $47,000 for men and $32,000 for women, a difference of 31.9%. Men with an educational attainment of college or associate's degree enjoy the highest average annual earnings of $51,000, while those with high school diploma education earn the least with $36,563. Women with an educational attainment of graduate degree earn the most with the average annual earnings of $50,469, while those with high school diploma education have the smallest earnings of $22,083.
| Educational Attainment | Male Income | Female Income |
| Less than High School | - | - |
| High School Diploma | $36,563 | $22,083 |
| College or Associate's Degree | $51,000 | $28,750 |
| Bachelor's Degree | - | - |
| Graduate Degree | - | - |
| Total | $47,000 | $32,000 |
Family Income in Humeston
Family Income Brackets in Humeston
According to the Humeston family income data, there are 37 families falling into the $35,000 to $49,999 income range, which is the most common income bracket and makes up 26.1% of all families. Conversely, the $150,000 to $199,999 income bracket is the least frequent group with only 2 families (1.4%) belonging to this category.
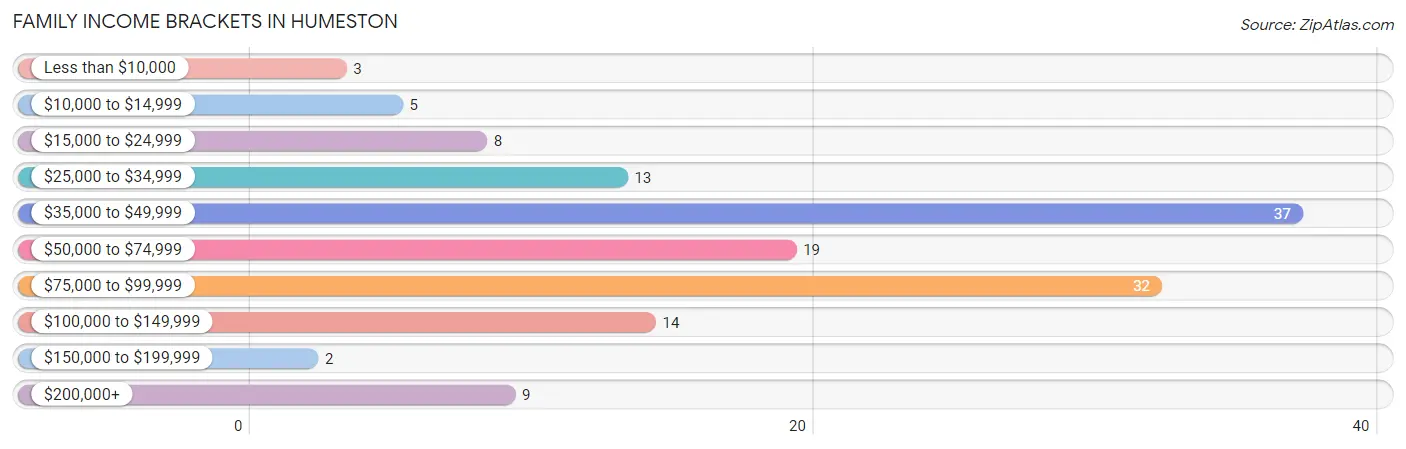
| Income Bracket | # Families | % Families |
| Less than $10,000 | 3 | 2.1% |
| $10,000 to $14,999 | 5 | 3.5% |
| $15,000 to $24,999 | 8 | 5.6% |
| $25,000 to $34,999 | 13 | 9.2% |
| $35,000 to $49,999 | 37 | 26.1% |
| $50,000 to $74,999 | 19 | 13.4% |
| $75,000 to $99,999 | 32 | 22.5% |
| $100,000 to $149,999 | 14 | 9.9% |
| $150,000 to $199,999 | 2 | 1.4% |
| $200,000+ | 9 | 6.3% |
Family Income by Famaliy Size in Humeston
4-person families (6 | 4.2%) account for the highest median family income in Humeston with $103,750 per family, while 2-person families (96 | 67.6%) have the highest median income of $27,678 per family member.
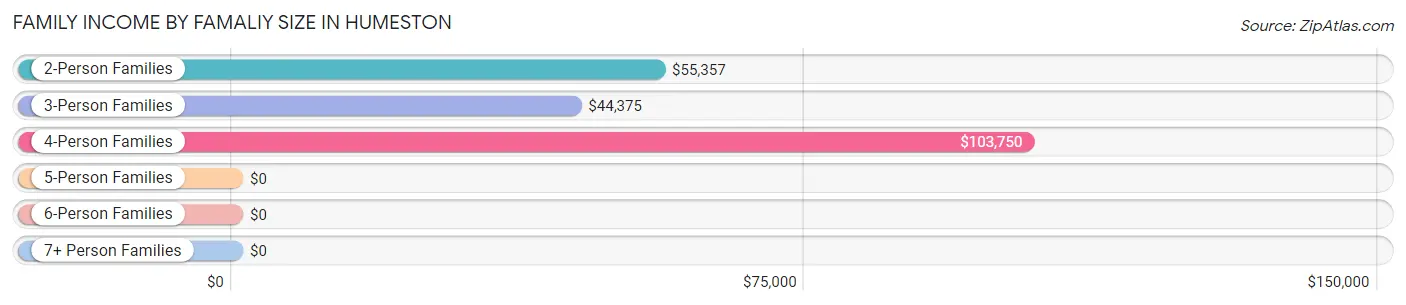
| Income Bracket | # Families | Median Income |
| 2-Person Families | 96 (67.6%) | $55,357 |
| 3-Person Families | 31 (21.8%) | $44,375 |
| 4-Person Families | 6 (4.2%) | $103,750 |
| 5-Person Families | 6 (4.2%) | $0 |
| 6-Person Families | 3 (2.1%) | $0 |
| 7+ Person Families | 0 (0.0%) | $0 |
| Total | 142 (100.0%) | $55,714 |
Family Income by Number of Earners in Humeston
The median family income in Humeston is $55,714, with families comprising 3+ earners (6) having the highest median family income of $110,833, while families with no earners (42) have the lowest median family income of $47,941, accounting for 4.2% and 29.6% of families, respectively.
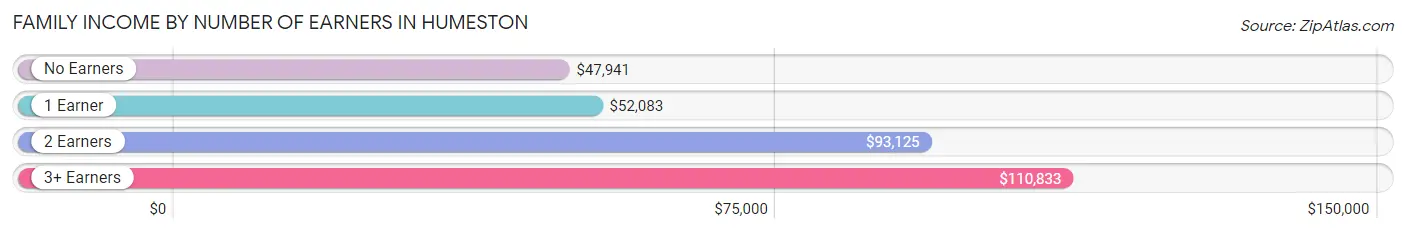
| Number of Earners | # Families | Median Income |
| No Earners | 42 (29.6%) | $47,941 |
| 1 Earner | 49 (34.5%) | $52,083 |
| 2 Earners | 45 (31.7%) | $93,125 |
| 3+ Earners | 6 (4.2%) | $110,833 |
| Total | 142 (100.0%) | $55,714 |
Household Income in Humeston
Household Income Brackets in Humeston
With 53 households falling in the category, the $35,000 to $49,999 income range is the most frequent in Humeston, accounting for 23.0% of all households. In contrast, only 2 households (0.9%) fall into the $150,000 to $199,999 income bracket, making it the least populous group.
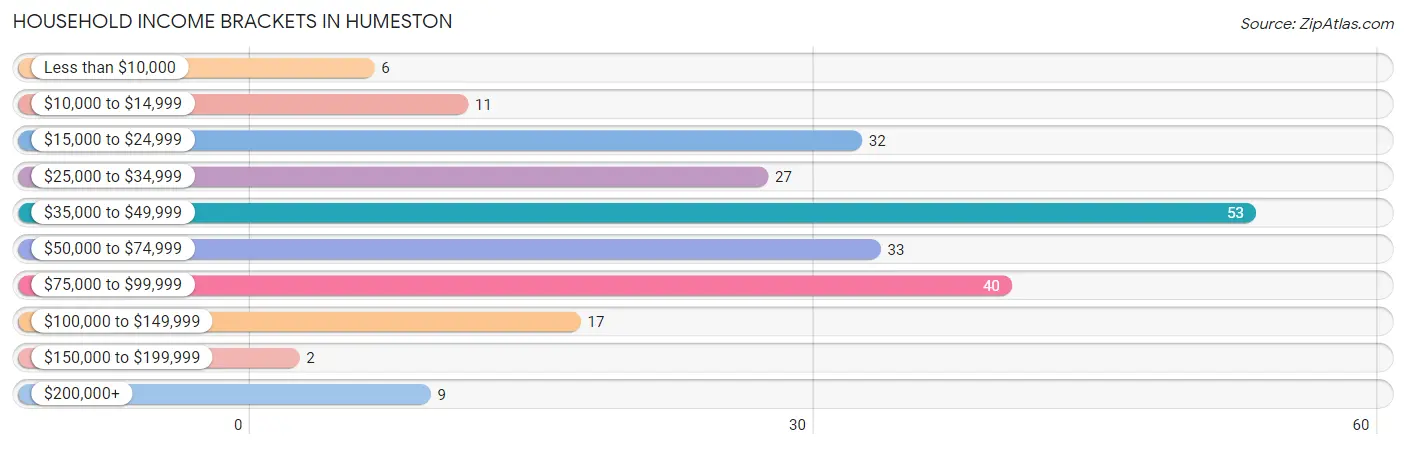
| Income Bracket | # Households | % Households |
| Less than $10,000 | 6 | 2.6% |
| $10,000 to $14,999 | 11 | 4.8% |
| $15,000 to $24,999 | 32 | 13.9% |
| $25,000 to $34,999 | 27 | 11.7% |
| $35,000 to $49,999 | 53 | 23.0% |
| $50,000 to $74,999 | 33 | 14.3% |
| $75,000 to $99,999 | 40 | 17.4% |
| $100,000 to $149,999 | 17 | 7.4% |
| $150,000 to $199,999 | 2 | 0.9% |
| $200,000+ | 9 | 3.9% |
Household Income by Householder Age in Humeston
The median household income in Humeston is $48,600, with the highest median household income of $62,917 found in the 25 to 44 years age bracket for the primary householder. A total of 41 households (17.8%) fall into this category. Meanwhile, the 15 to 24 years age bracket for the primary householder has the lowest median household income of $35,000, with 16 households (7.0%) in this group.
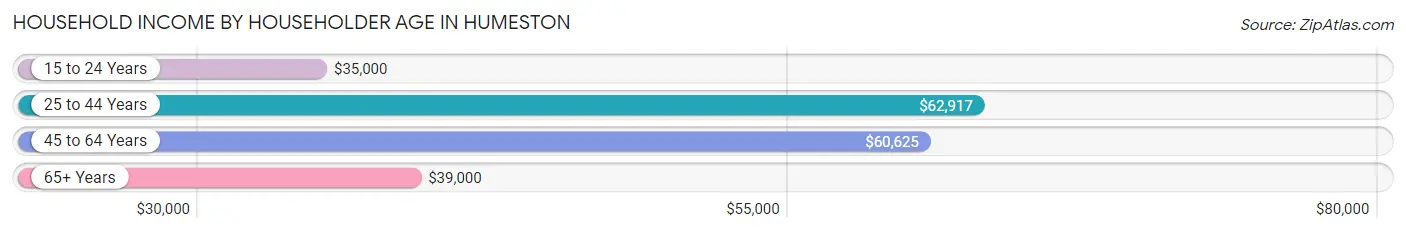
| Income Bracket | # Households | Median Income |
| 15 to 24 Years | 16 (7.0%) | $35,000 |
| 25 to 44 Years | 41 (17.8%) | $62,917 |
| 45 to 64 Years | 71 (30.9%) | $60,625 |
| 65+ Years | 102 (44.4%) | $39,000 |
| Total | 230 (100.0%) | $48,600 |
Poverty in Humeston
Income Below Poverty by Sex and Age in Humeston
With 20.8% poverty level for males and 10.6% for females among the residents of Humeston, under 5 year old males and under 5 year old females are the most vulnerable to poverty, with 10 males (100.0%) and 6 females (50.0%) in their respective age groups living below the poverty level.
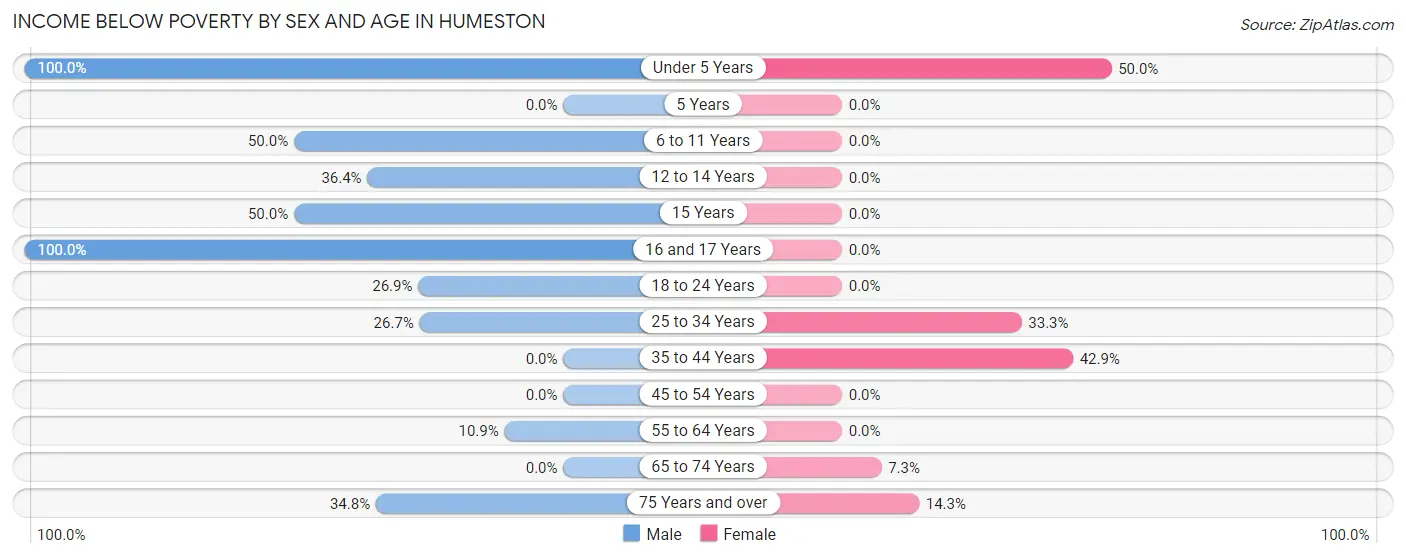
| Age Bracket | Male | Female |
| Under 5 Years | 10 (100.0%) | 6 (50.0%) |
| 5 Years | 0 (0.0%) | 0 (0.0%) |
| 6 to 11 Years | 4 (50.0%) | 0 (0.0%) |
| 12 to 14 Years | 4 (36.4%) | 0 (0.0%) |
| 15 Years | 5 (50.0%) | 0 (0.0%) |
| 16 and 17 Years | 5 (100.0%) | 0 (0.0%) |
| 18 to 24 Years | 7 (26.9%) | 0 (0.0%) |
| 25 to 34 Years | 4 (26.7%) | 7 (33.3%) |
| 35 to 44 Years | 0 (0.0%) | 6 (42.9%) |
| 45 to 54 Years | 0 (0.0%) | 0 (0.0%) |
| 55 to 64 Years | 6 (10.9%) | 0 (0.0%) |
| 65 to 74 Years | 0 (0.0%) | 3 (7.3%) |
| 75 Years and over | 8 (34.8%) | 5 (14.3%) |
| Total | 53 (20.8%) | 27 (10.6%) |
Income Above Poverty by Sex and Age in Humeston
According to the poverty statistics in Humeston, males aged 35 to 44 years and females aged 5 years are the age groups that are most secure financially, with 100.0% of males and 100.0% of females in these age groups living above the poverty line.
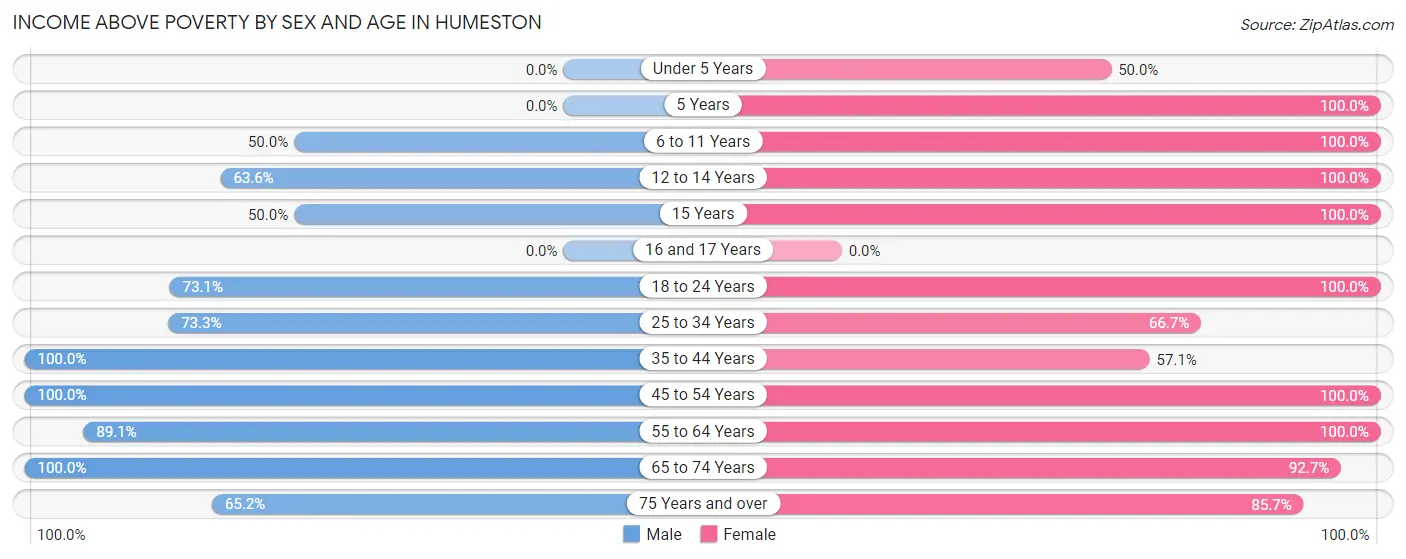
| Age Bracket | Male | Female |
| Under 5 Years | 0 (0.0%) | 6 (50.0%) |
| 5 Years | 0 (0.0%) | 6 (100.0%) |
| 6 to 11 Years | 4 (50.0%) | 20 (100.0%) |
| 12 to 14 Years | 7 (63.6%) | 20 (100.0%) |
| 15 Years | 5 (50.0%) | 16 (100.0%) |
| 16 and 17 Years | 0 (0.0%) | 0 (0.0%) |
| 18 to 24 Years | 19 (73.1%) | 20 (100.0%) |
| 25 to 34 Years | 11 (73.3%) | 14 (66.7%) |
| 35 to 44 Years | 11 (100.0%) | 8 (57.1%) |
| 45 to 54 Years | 23 (100.0%) | 9 (100.0%) |
| 55 to 64 Years | 49 (89.1%) | 41 (100.0%) |
| 65 to 74 Years | 58 (100.0%) | 38 (92.7%) |
| 75 Years and over | 15 (65.2%) | 30 (85.7%) |
| Total | 202 (79.2%) | 228 (89.4%) |
Income Below Poverty Among Married-Couple Families in Humeston
The poverty statistics for married-couple families in Humeston show that 2.6% or 3 of the total 114 families live below the poverty line. Families with no children have the highest poverty rate of 3.1%, comprising of 3 families. On the other hand, families with 1 or 2 children have the lowest poverty rate of 0.0%, which includes 0 families.
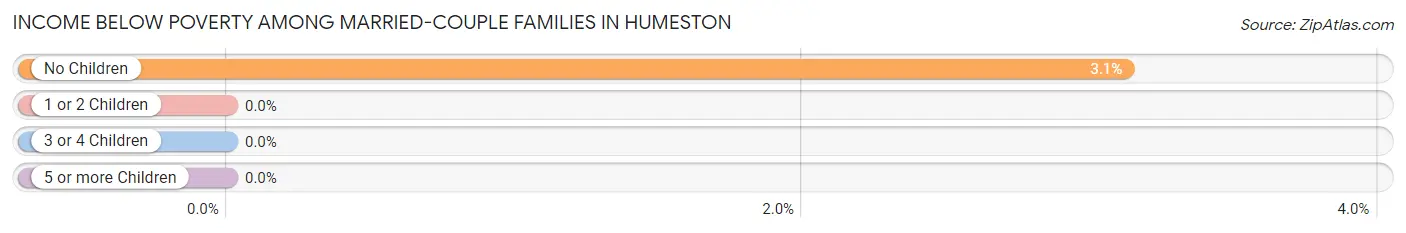
| Children | Above Poverty | Below Poverty |
| No Children | 93 (96.9%) | 3 (3.1%) |
| 1 or 2 Children | 12 (100.0%) | 0 (0.0%) |
| 3 or 4 Children | 6 (100.0%) | 0 (0.0%) |
| 5 or more Children | 0 (0.0%) | 0 (0.0%) |
| Total | 111 (97.4%) | 3 (2.6%) |
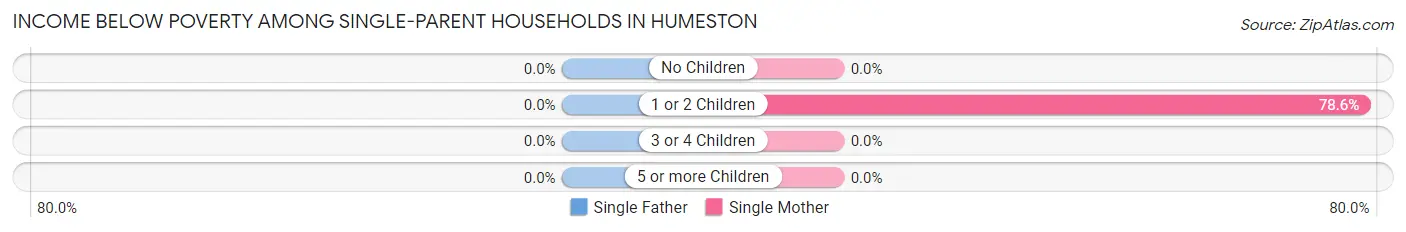
Income Below Poverty Among Single-Parent Households in Humeston
| Children | Single Father | Single Mother |
| No Children | 0 (0.0%) | 0 (0.0%) |
| 1 or 2 Children | 0 (0.0%) | 11 (78.6%) |
| 3 or 4 Children | 0 (0.0%) | 0 (0.0%) |
| 5 or more Children | 0 (0.0%) | 0 (0.0%) |
| Total | 0 (0.0%) | 11 (64.7%) |
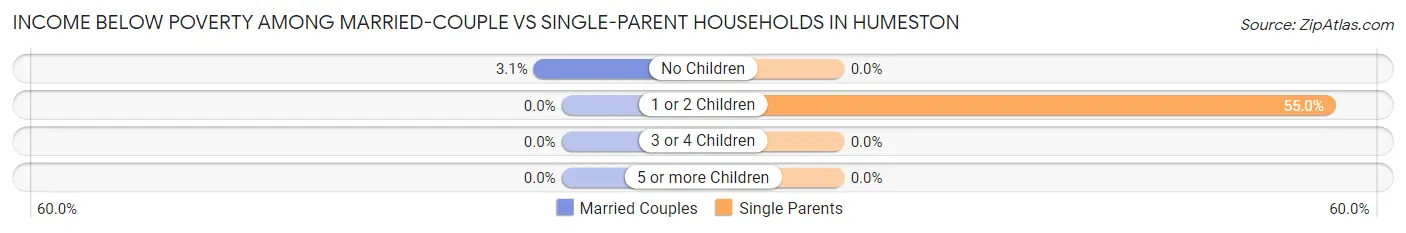
Income Below Poverty Among Married-Couple vs Single-Parent Households in Humeston
The poverty data for Humeston shows that 3 of the married-couple family households (2.6%) and 11 of the single-parent households (39.3%) are living below the poverty level. Within the married-couple family households, those with no children have the highest poverty rate, with 3 households (3.1%) falling below the poverty line. Among the single-parent households, those with 1 or 2 children have the highest poverty rate, with 11 household (55.0%) living below poverty.
| Children | Married-Couple Families | Single-Parent Households |
| No Children | 3 (3.1%) | 0 (0.0%) |
| 1 or 2 Children | 0 (0.0%) | 11 (55.0%) |
| 3 or 4 Children | 0 (0.0%) | 0 (0.0%) |
| 5 or more Children | 0 (0.0%) | 0 (0.0%) |
| Total | 3 (2.6%) | 11 (39.3%) |
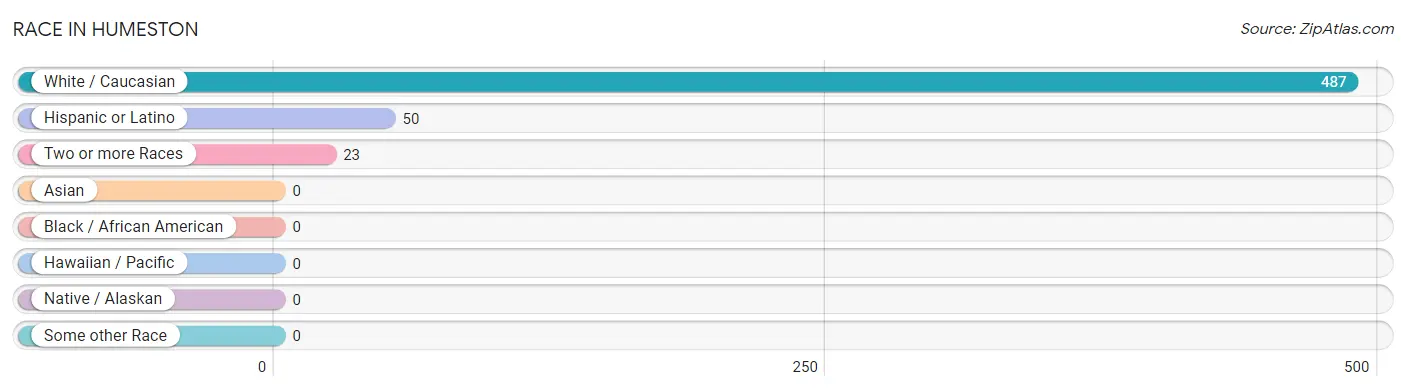
Race in Humeston
The most populous races in Humeston are White / Caucasian (487 | 95.5%), Hispanic or Latino (50 | 9.8%), and Two or more Races (23 | 4.5%).
| Race | # Population | % Population |
| Asian | 0 | 0.0% |
| Black / African American | 0 | 0.0% |
| Hawaiian / Pacific | 0 | 0.0% |
| Hispanic or Latino | 50 | 9.8% |
| Native / Alaskan | 0 | 0.0% |
| White / Caucasian | 487 | 95.5% |
| Two or more Races | 23 | 4.5% |
| Some other Race | 0 | 0.0% |
| Total | 510 | 100.0% |
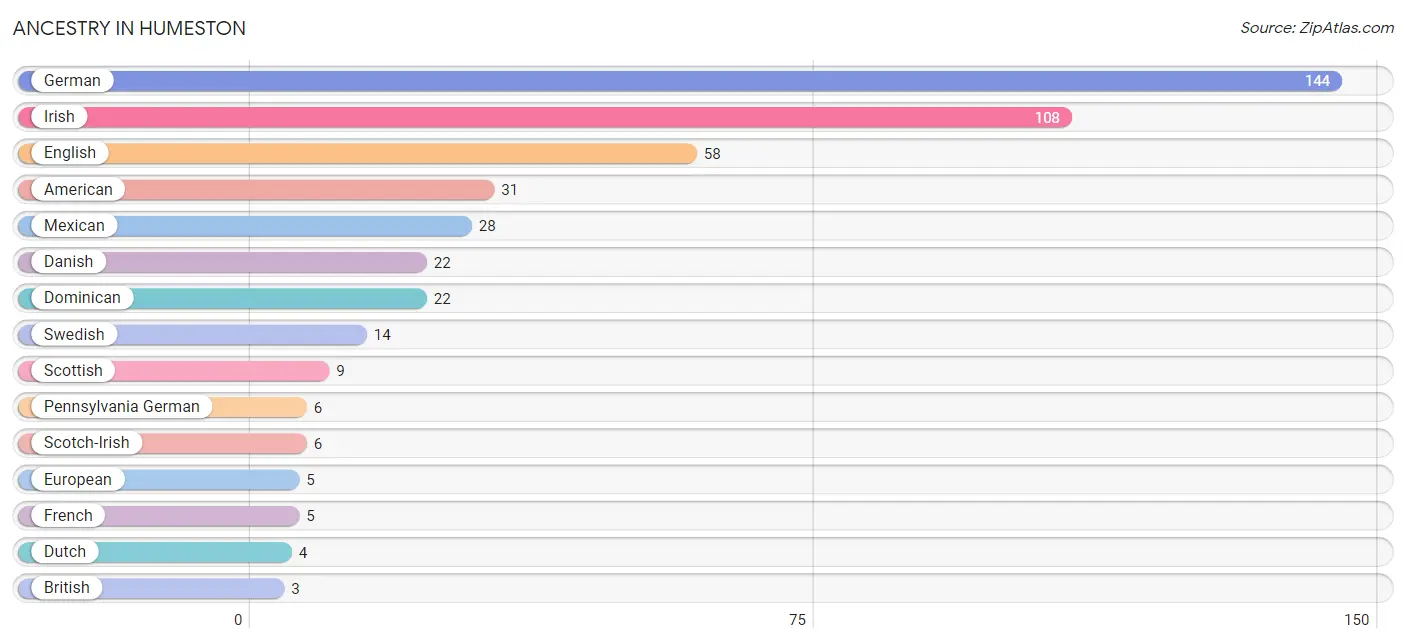
Ancestry in Humeston
The most populous ancestries reported in Humeston are German (144 | 28.2%), Irish (108 | 21.2%), English (58 | 11.4%), American (31 | 6.1%), and Mexican (28 | 5.5%), together accounting for 72.4% of all Humeston residents.
| Ancestry | # Population | % Population |
| American | 31 | 6.1% |
| British | 3 | 0.6% |
| Danish | 22 | 4.3% |
| Dominican | 22 | 4.3% |
| Dutch | 4 | 0.8% |
| English | 58 | 11.4% |
| European | 5 | 1.0% |
| French | 5 | 1.0% |
| German | 144 | 28.2% |
| Irish | 108 | 21.2% |
| Italian | 3 | 0.6% |
| Mexican | 28 | 5.5% |
| Pennsylvania German | 6 | 1.2% |
| Scotch-Irish | 6 | 1.2% |
| Scottish | 9 | 1.8% |
| Slavic | 2 | 0.4% |
| Swedish | 14 | 2.8% |
| Swiss | 1 | 0.2% |
| Welsh | 3 | 0.6% | View All 19 Rows |
Immigrants in Humeston
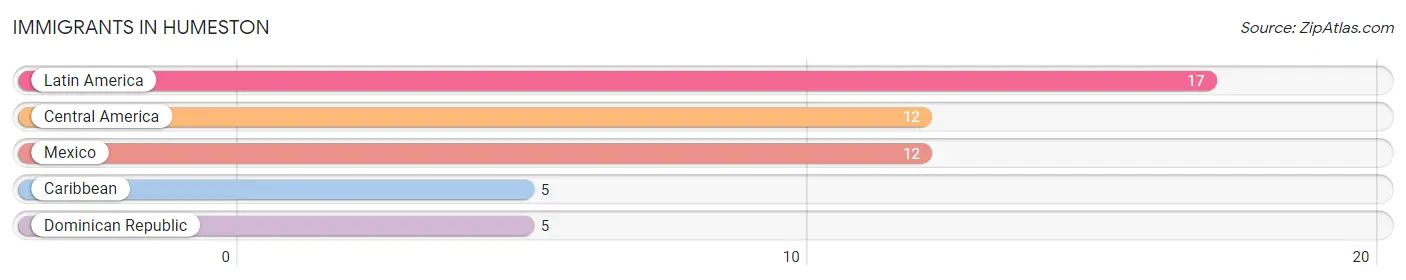
The most numerous immigrant groups reported in Humeston came from Latin America (17 | 3.3%), Central America (12 | 2.4%), Mexico (12 | 2.4%), Caribbean (5 | 1.0%), and Dominican Republic (5 | 1.0%), together accounting for 10.0% of all Humeston residents.
| Immigration Origin | # Population | % Population |
| Caribbean | 5 | 1.0% |
| Central America | 12 | 2.4% |
| Dominican Republic | 5 | 1.0% |
| Latin America | 17 | 3.3% |
| Mexico | 12 | 2.4% | View All 5 Rows |
Sex and Age in Humeston
Sex and Age in Humeston
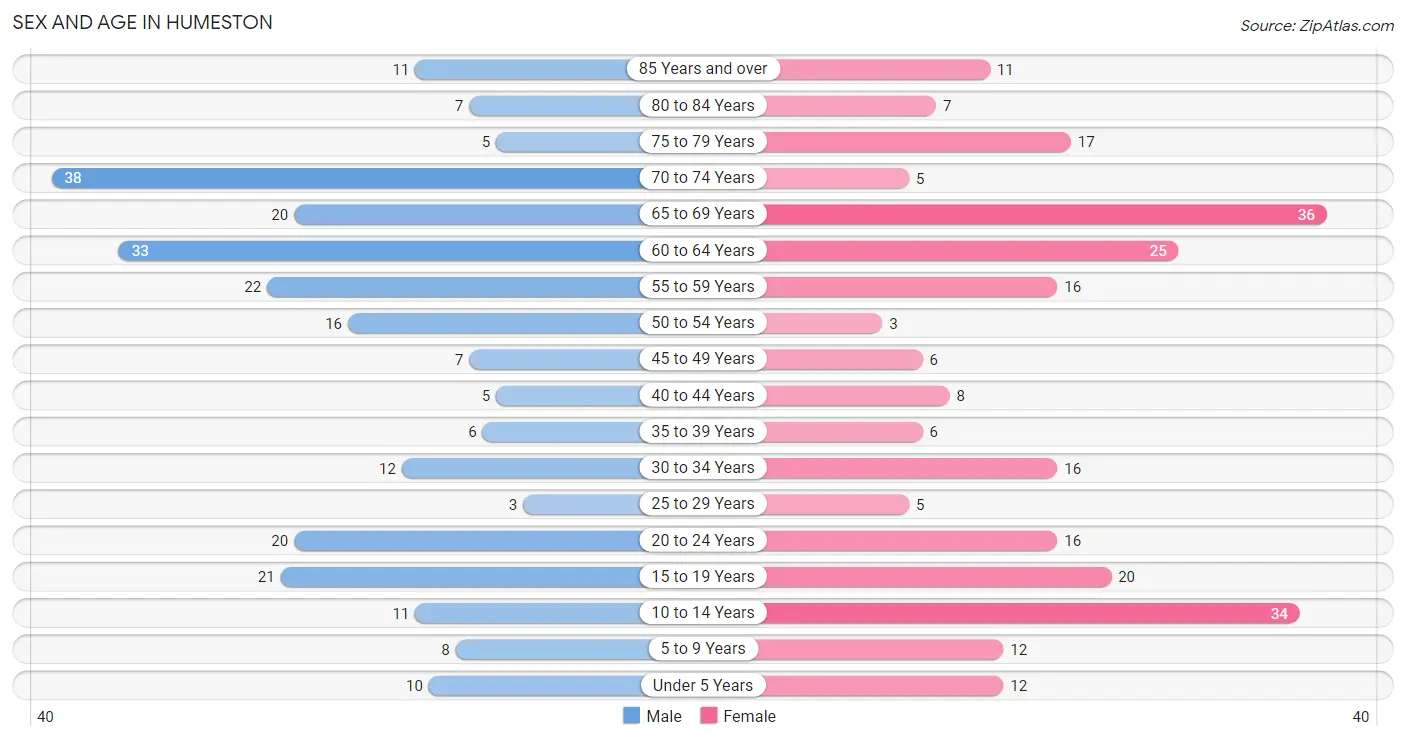
The most populous age groups in Humeston are 70 to 74 Years (38 | 14.9%) for men and 65 to 69 Years (36 | 14.1%) for women.
| Age Bracket | Male | Female |
| Under 5 Years | 10 (3.9%) | 12 (4.7%) |
| 5 to 9 Years | 8 (3.1%) | 12 (4.7%) |
| 10 to 14 Years | 11 (4.3%) | 34 (13.3%) |
| 15 to 19 Years | 21 (8.2%) | 20 (7.8%) |
| 20 to 24 Years | 20 (7.8%) | 16 (6.3%) |
| 25 to 29 Years | 3 (1.2%) | 5 (2.0%) |
| 30 to 34 Years | 12 (4.7%) | 16 (6.3%) |
| 35 to 39 Years | 6 (2.4%) | 6 (2.4%) |
| 40 to 44 Years | 5 (2.0%) | 8 (3.1%) |
| 45 to 49 Years | 7 (2.8%) | 6 (2.4%) |
| 50 to 54 Years | 16 (6.3%) | 3 (1.2%) |
| 55 to 59 Years | 22 (8.6%) | 16 (6.3%) |
| 60 to 64 Years | 33 (12.9%) | 25 (9.8%) |
| 65 to 69 Years | 20 (7.8%) | 36 (14.1%) |
| 70 to 74 Years | 38 (14.9%) | 5 (2.0%) |
| 75 to 79 Years | 5 (2.0%) | 17 (6.7%) |
| 80 to 84 Years | 7 (2.8%) | 7 (2.8%) |
| 85 Years and over | 11 (4.3%) | 11 (4.3%) |
| Total | 255 (100.0%) | 255 (100.0%) |
Families and Households in Humeston
Median Family Size in Humeston
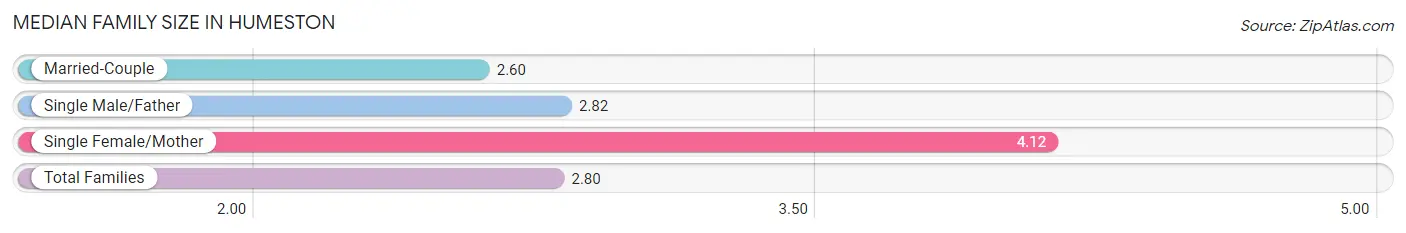
The median family size in Humeston is 2.80 persons per family, with single female/mother families (17 | 12.0%) accounting for the largest median family size of 4.12 persons per family. On the other hand, married-couple families (114 | 80.3%) represent the smallest median family size with 2.60 persons per family.
| Family Type | # Families | Family Size |
| Married-Couple | 114 (80.3%) | 2.60 |
| Single Male/Father | 11 (7.7%) | 2.82 |
| Single Female/Mother | 17 (12.0%) | 4.12 |
| Total Families | 142 (100.0%) | 2.80 |
Median Household Size in Humeston
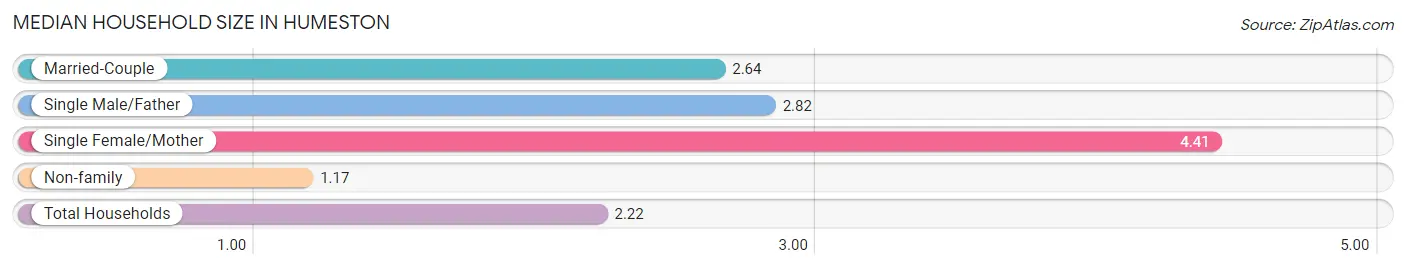
The median household size in Humeston is 2.22 persons per household, with single female/mother households (17 | 7.4%) accounting for the largest median household size of 4.41 persons per household. non-family households (88 | 38.3%) represent the smallest median household size with 1.17 persons per household.
| Household Type | # Households | Household Size |
| Married-Couple | 114 (49.6%) | 2.64 |
| Single Male/Father | 11 (4.8%) | 2.82 |
| Single Female/Mother | 17 (7.4%) | 4.41 |
| Non-family | 88 (38.3%) | 1.17 |
| Total Households | 230 (100.0%) | 2.22 |
Household Size by Marriage Status in Humeston
Out of a total of 230 households in Humeston, 142 (61.7%) are family households, while 88 (38.3%) are nonfamily households. The most numerous type of family households are 2-person households, comprising 93, and the most common type of nonfamily households are 1-person households, comprising 71.
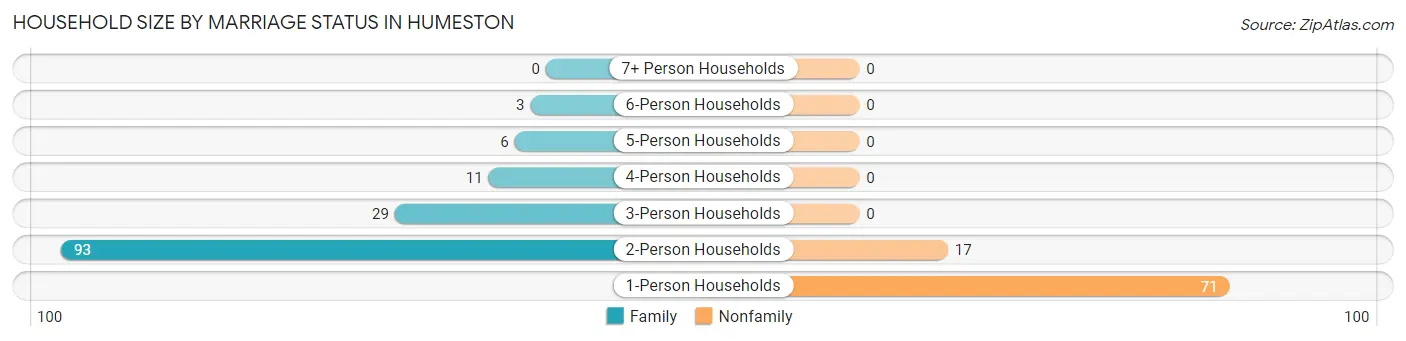
| Household Size | Family Households | Nonfamily Households |
| 1-Person Households | - | 71 (30.9%) |
| 2-Person Households | 93 (40.4%) | 17 (7.4%) |
| 3-Person Households | 29 (12.6%) | 0 (0.0%) |
| 4-Person Households | 11 (4.8%) | 0 (0.0%) |
| 5-Person Households | 6 (2.6%) | 0 (0.0%) |
| 6-Person Households | 3 (1.3%) | 0 (0.0%) |
| 7+ Person Households | 0 (0.0%) | 0 (0.0%) |
| Total | 142 (61.7%) | 88 (38.3%) |
Female Fertility in Humeston
Fertility by Age in Humeston
Average fertility rate in Humeston is 130.0 births per 1,000 women. Women in the age bracket of 20 to 34 years have the highest fertility rate with 216.0 births per 1,000 women. Women in the age bracket of 20 to 34 years acount for 80.0% of all women with births.
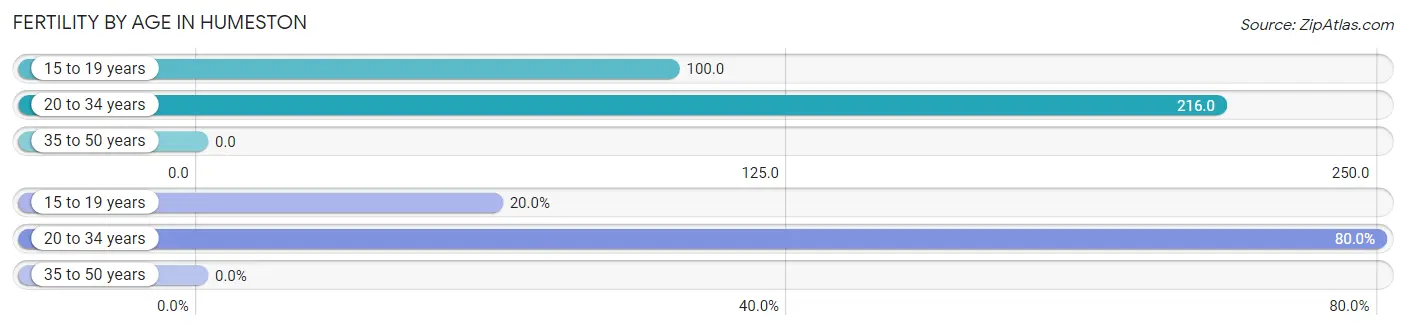
| Age Bracket | Women with Births | Births / 1,000 Women |
| 15 to 19 years | 2 (20.0%) | 100.0 |
| 20 to 34 years | 8 (80.0%) | 216.0 |
| 35 to 50 years | 0 (0.0%) | 0.0 |
| Total | 10 (100.0%) | 130.0 |
Fertility by Age by Marriage Status in Humeston
30.0% of women with births (10) in Humeston are married. The highest percentage of unmarried women with births falls into 15 to 19 years age bracket with 100.0% of them unmarried at the time of birth, while the lowest percentage of unmarried women with births belong to 20 to 34 years age bracket with 62.5% of them unmarried.
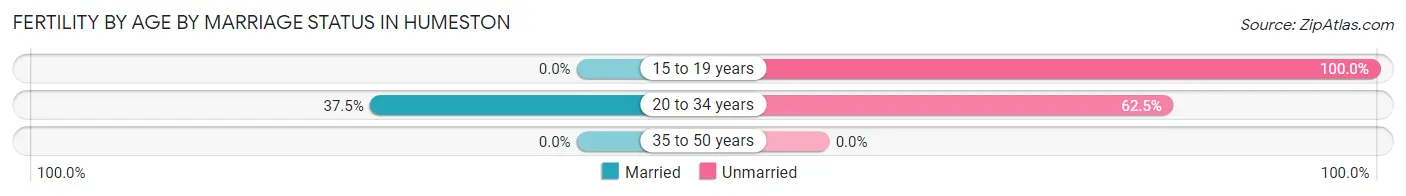
| Age Bracket | Married | Unmarried |
| 15 to 19 years | 0 (0.0%) | 2 (100.0%) |
| 20 to 34 years | 3 (37.5%) | 5 (62.5%) |
| 35 to 50 years | 0 (0.0%) | 0 (0.0%) |
| Total | 3 (30.0%) | 7 (70.0%) |
Fertility by Education in Humeston
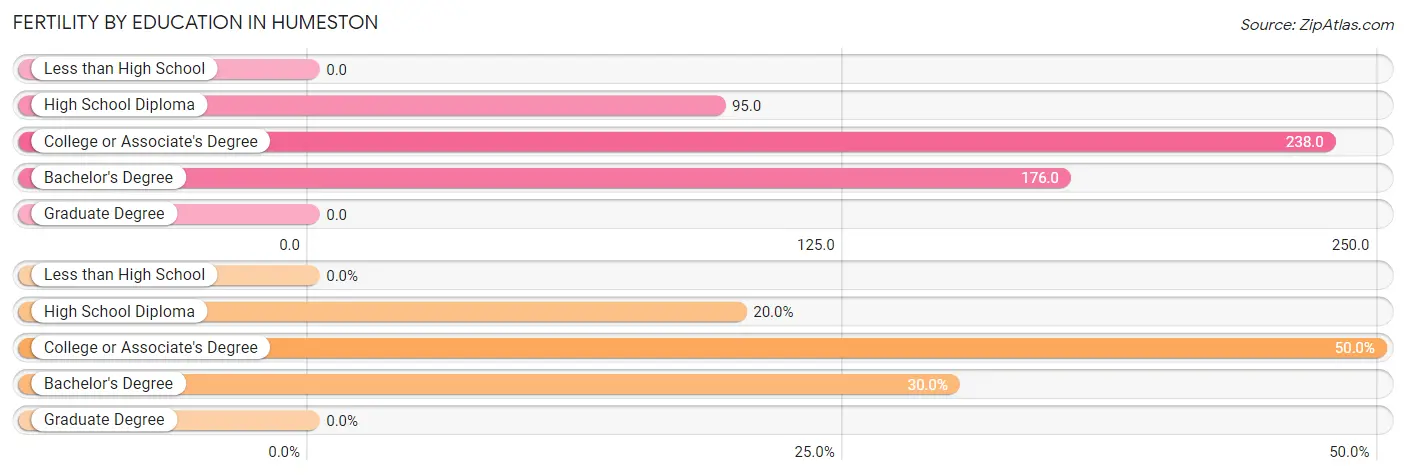
| Educational Attainment | Women with Births | Births / 1,000 Women |
| Less than High School | 0 (0.0%) | 0.0 |
| High School Diploma | 2 (20.0%) | 95.0 |
| College or Associate's Degree | 5 (50.0%) | 238.0 |
| Bachelor's Degree | 3 (30.0%) | 176.0 |
| Graduate Degree | 0 (0.0%) | 0.0 |
| Total | 10 (100.0%) | 130.0 |
Fertility by Education by Marriage Status in Humeston
70.0% of women with births in Humeston are unmarried. Women with the educational attainment of bachelor's degree are most likely to be married with 100.0% of them married at childbirth, while women with the educational attainment of high school diploma are least likely to be married with 100.0% of them unmarried at childbirth.
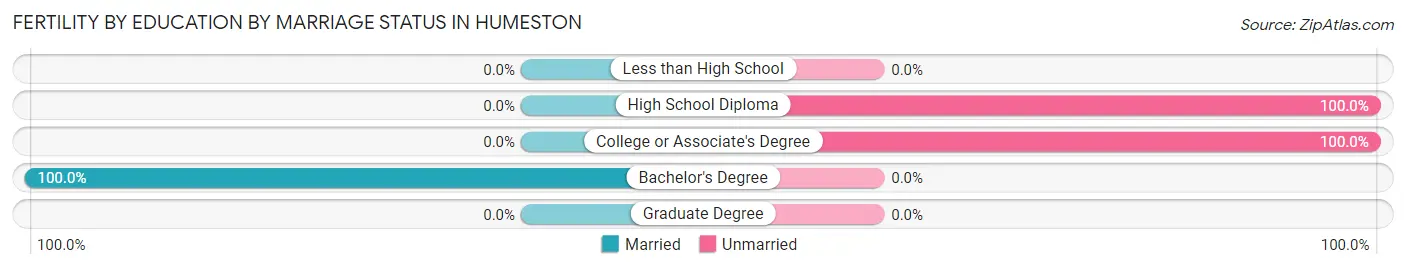
| Educational Attainment | Married | Unmarried |
| Less than High School | 0 (0.0%) | 0 (0.0%) |
| High School Diploma | 0 (0.0%) | 2 (100.0%) |
| College or Associate's Degree | 0 (0.0%) | 5 (100.0%) |
| Bachelor's Degree | 3 (100.0%) | 0 (0.0%) |
| Graduate Degree | 0 (0.0%) | 0 (0.0%) |
| Total | 3 (30.0%) | 7 (70.0%) |
Employment Characteristics in Humeston
Employment by Class of Employer in Humeston
Among the 215 employed individuals in Humeston, private company employees (119 | 55.3%), not-for-profit organizations (30 | 14.0%), and local government employees (28 | 13.0%) make up the most common classes of employment.
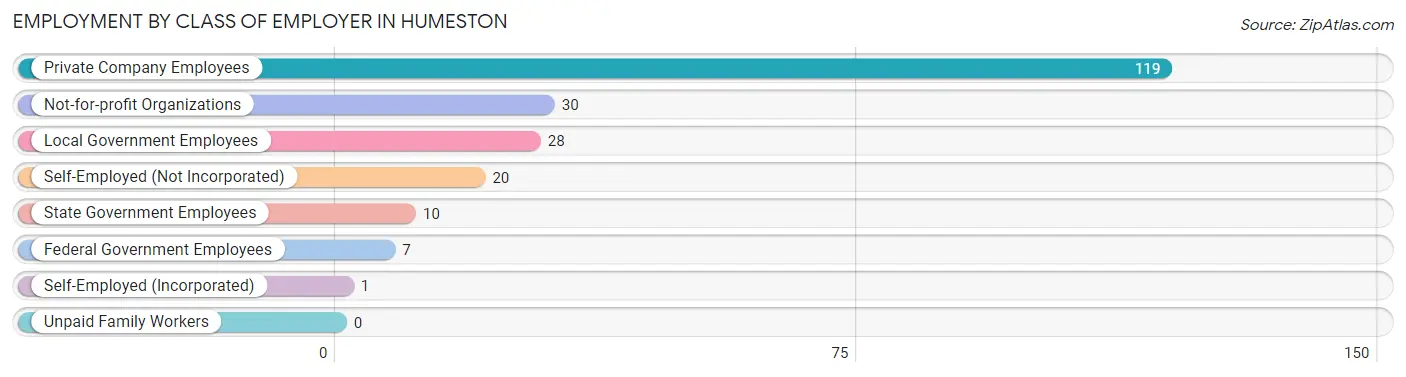
| Employer Class | # Employees | % Employees |
| Private Company Employees | 119 | 55.3% |
| Self-Employed (Incorporated) | 1 | 0.5% |
| Self-Employed (Not Incorporated) | 20 | 9.3% |
| Not-for-profit Organizations | 30 | 14.0% |
| Local Government Employees | 28 | 13.0% |
| State Government Employees | 10 | 4.6% |
| Federal Government Employees | 7 | 3.3% |
| Unpaid Family Workers | 0 | 0.0% |
| Total | 215 | 100.0% |
Employment Status by Age in Humeston
According to the labor force statistics for Humeston, out of the total population over 16 years of age (397), 56.2% or 223 individuals are in the labor force, with 2.2% or 5 of them unemployed. The age group with the highest labor force participation rate is 35 to 44 years, with 100.0% or 25 individuals in the labor force. Within the labor force, the 55 to 59 years age range has the highest percentage of unemployed individuals, with 10.0% or 2 of them being unemployed.
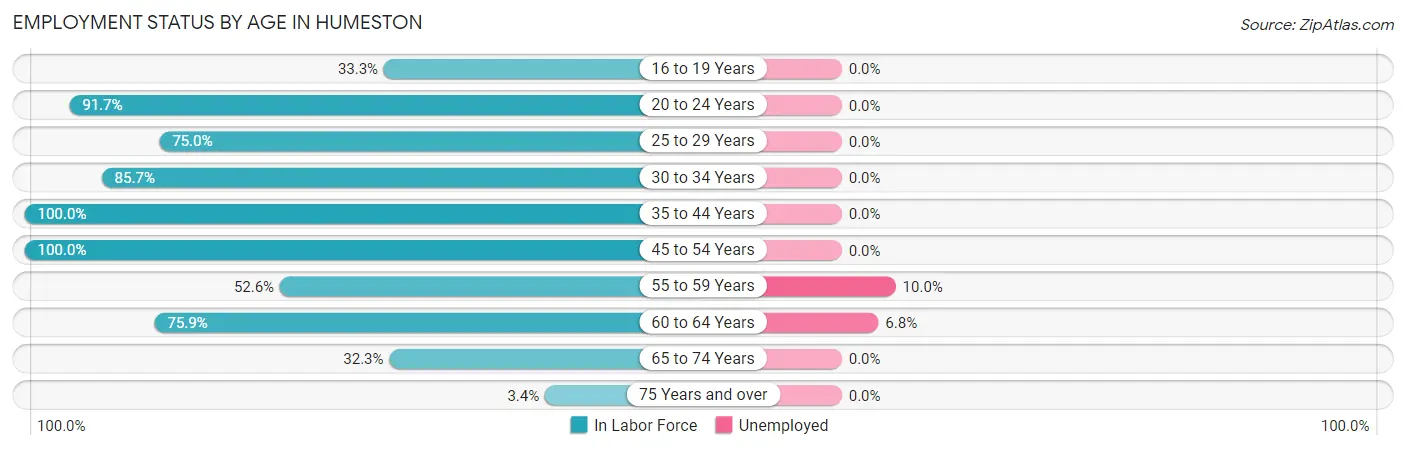
| Age Bracket | In Labor Force | Unemployed |
| 16 to 19 Years | 5 (33.3%) | 0 (0.0%) |
| 20 to 24 Years | 33 (91.7%) | 0 (0.0%) |
| 25 to 29 Years | 6 (75.0%) | 0 (0.0%) |
| 30 to 34 Years | 24 (85.7%) | 0 (0.0%) |
| 35 to 44 Years | 25 (100.0%) | 0 (0.0%) |
| 45 to 54 Years | 32 (100.0%) | 0 (0.0%) |
| 55 to 59 Years | 20 (52.6%) | 2 (10.0%) |
| 60 to 64 Years | 44 (75.9%) | 3 (6.8%) |
| 65 to 74 Years | 32 (32.3%) | 0 (0.0%) |
| 75 Years and over | 2 (3.4%) | 0 (0.0%) |
| Total | 223 (56.2%) | 5 (2.2%) |
Employment Status by Educational Attainment in Humeston
According to labor force statistics for Humeston, 79.9% of individuals (151) out of the total population between 25 and 64 years of age (189) are in the labor force, with 3.3% or 5 of them being unemployed. The group with the highest labor force participation rate are those with the educational attainment of bachelor's degree or higher, with 100.0% or 48 individuals in the labor force. Within the labor force, individuals with less than high school education have the highest percentage of unemployment, with 16.7% or 2 of them being unemployed.
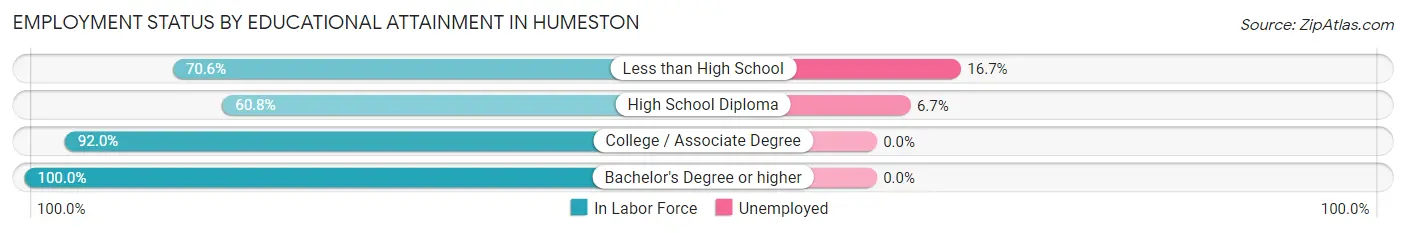
| Educational Attainment | In Labor Force | Unemployed |
| Less than High School | 12 (70.6%) | 3 (16.7%) |
| High School Diploma | 45 (60.8%) | 5 (6.7%) |
| College / Associate Degree | 46 (92.0%) | 0 (0.0%) |
| Bachelor's Degree or higher | 48 (100.0%) | 0 (0.0%) |
| Total | 151 (79.9%) | 6 (3.3%) |
Employment Occupations by Sex in Humeston
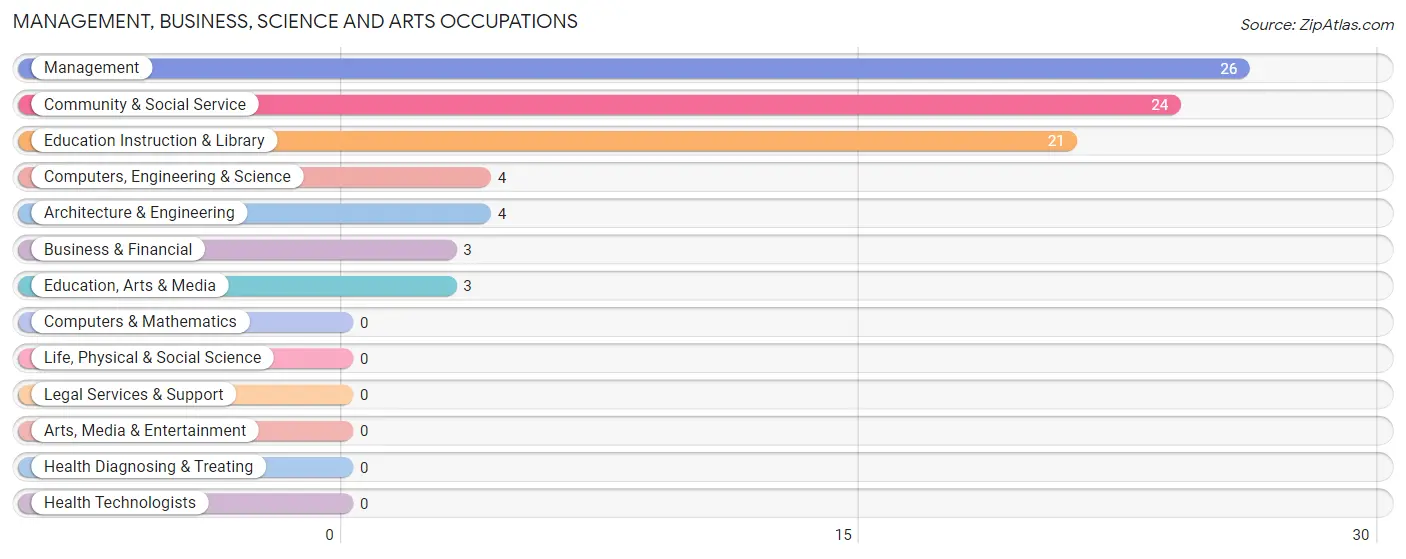
Management, Business, Science and Arts Occupations
The most common Management, Business, Science and Arts occupations in Humeston are Management (26 | 11.9%), Community & Social Service (24 | 11.0%), Education Instruction & Library (21 | 9.6%), Computers, Engineering & Science (4 | 1.8%), and Architecture & Engineering (4 | 1.8%).
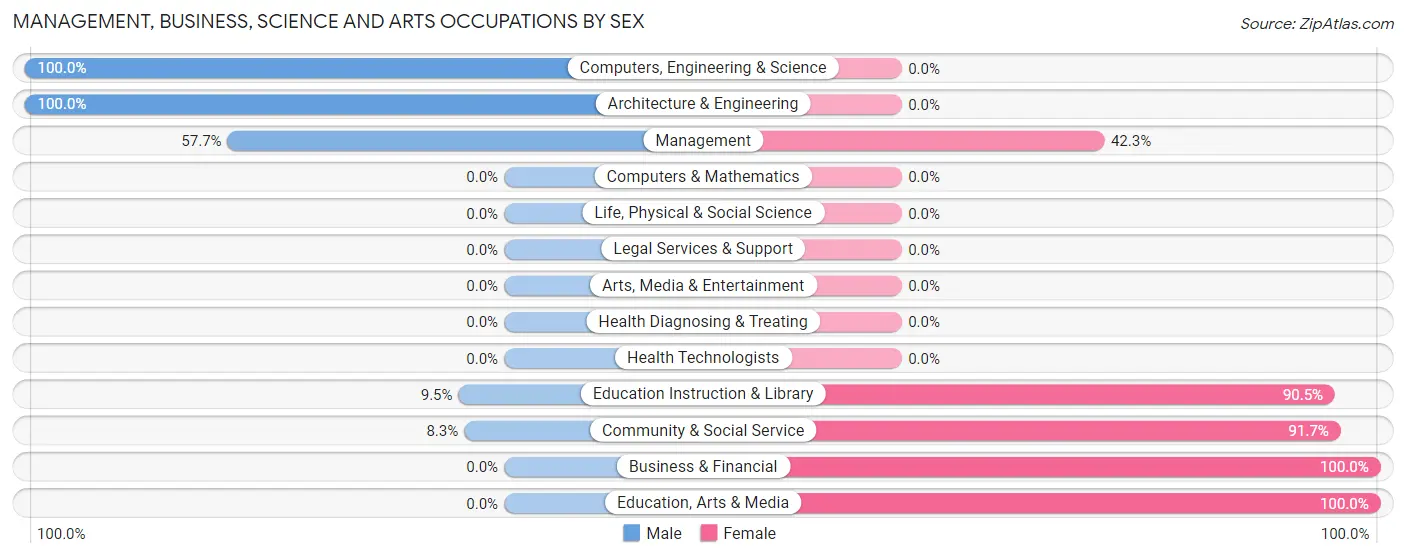
Management, Business, Science and Arts Occupations by Sex
Within the Management, Business, Science and Arts occupations in Humeston, the most male-oriented occupations are Computers, Engineering & Science (100.0%), Architecture & Engineering (100.0%), and Management (57.7%), while the most female-oriented occupations are Business & Financial (100.0%), Education, Arts & Media (100.0%), and Community & Social Service (91.7%).
| Occupation | Male | Female |
| Management | 15 (57.7%) | 11 (42.3%) |
| Business & Financial | 0 (0.0%) | 3 (100.0%) |
| Computers, Engineering & Science | 4 (100.0%) | 0 (0.0%) |
| Computers & Mathematics | 0 (0.0%) | 0 (0.0%) |
| Architecture & Engineering | 4 (100.0%) | 0 (0.0%) |
| Life, Physical & Social Science | 0 (0.0%) | 0 (0.0%) |
| Community & Social Service | 2 (8.3%) | 22 (91.7%) |
| Education, Arts & Media | 0 (0.0%) | 3 (100.0%) |
| Legal Services & Support | 0 (0.0%) | 0 (0.0%) |
| Education Instruction & Library | 2 (9.5%) | 19 (90.5%) |
| Arts, Media & Entertainment | 0 (0.0%) | 0 (0.0%) |
| Health Diagnosing & Treating | 0 (0.0%) | 0 (0.0%) |
| Health Technologists | 0 (0.0%) | 0 (0.0%) |
| Total (Category) | 21 (36.8%) | 36 (63.2%) |
| Total (Overall) | 114 (52.3%) | 104 (47.7%) |
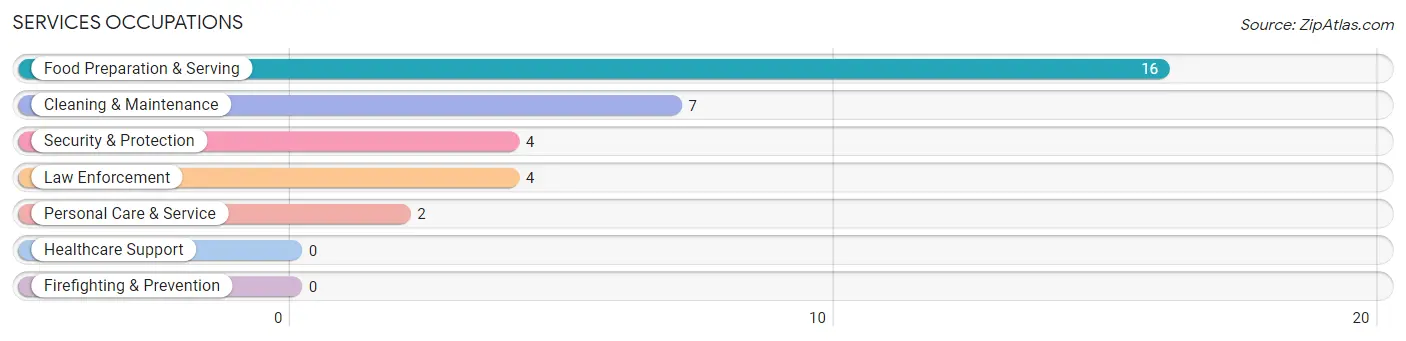
Services Occupations
The most common Services occupations in Humeston are Food Preparation & Serving (16 | 7.3%), Cleaning & Maintenance (7 | 3.2%), Security & Protection (4 | 1.8%), Law Enforcement (4 | 1.8%), and Personal Care & Service (2 | 0.9%).
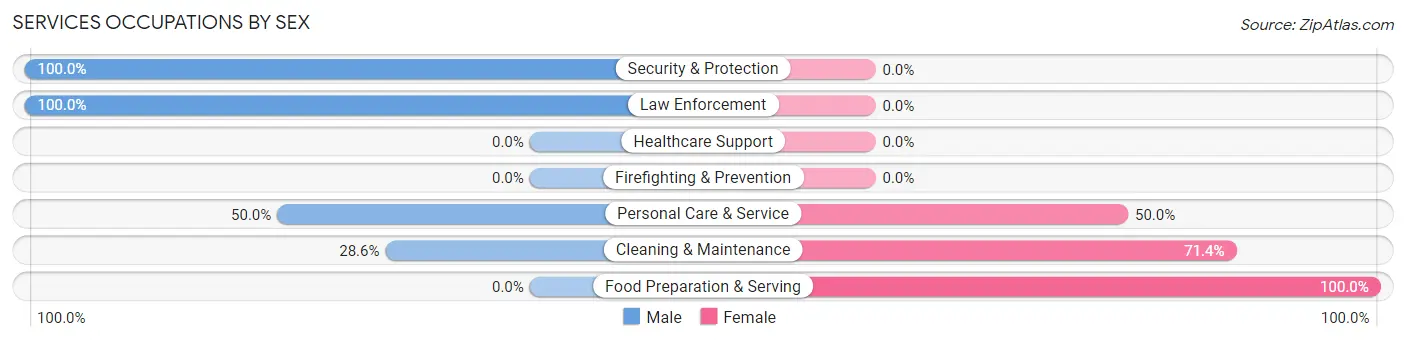
Services Occupations by Sex
Within the Services occupations in Humeston, the most male-oriented occupations are Security & Protection (100.0%), Law Enforcement (100.0%), and Personal Care & Service (50.0%), while the most female-oriented occupations are Food Preparation & Serving (100.0%), Cleaning & Maintenance (71.4%), and Personal Care & Service (50.0%).
| Occupation | Male | Female |
| Healthcare Support | 0 (0.0%) | 0 (0.0%) |
| Security & Protection | 4 (100.0%) | 0 (0.0%) |
| Firefighting & Prevention | 0 (0.0%) | 0 (0.0%) |
| Law Enforcement | 4 (100.0%) | 0 (0.0%) |
| Food Preparation & Serving | 0 (0.0%) | 16 (100.0%) |
| Cleaning & Maintenance | 2 (28.6%) | 5 (71.4%) |
| Personal Care & Service | 1 (50.0%) | 1 (50.0%) |
| Total (Category) | 7 (24.1%) | 22 (75.9%) |
| Total (Overall) | 114 (52.3%) | 104 (47.7%) |
Sales and Office Occupations
The most common Sales and Office occupations in Humeston are Office & Administration (29 | 13.3%), and Sales & Related (8 | 3.7%).
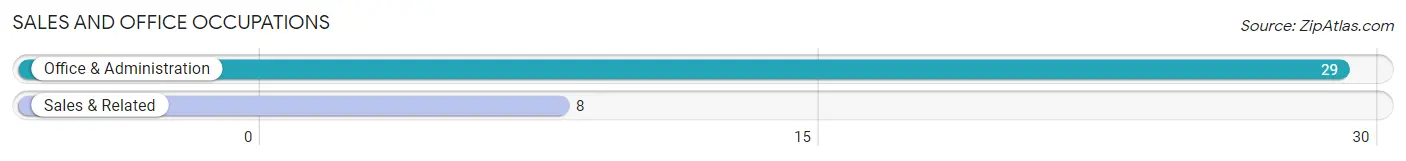
Sales and Office Occupations by Sex
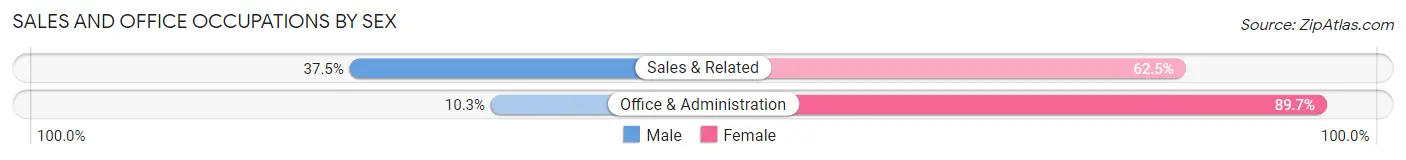
| Occupation | Male | Female |
| Sales & Related | 3 (37.5%) | 5 (62.5%) |
| Office & Administration | 3 (10.3%) | 26 (89.7%) |
| Total (Category) | 6 (16.2%) | 31 (83.8%) |
| Total (Overall) | 114 (52.3%) | 104 (47.7%) |
Natural Resources, Construction and Maintenance Occupations
The most common Natural Resources, Construction and Maintenance occupations in Humeston are Construction & Extraction (15 | 6.9%), Installation, Maintenance & Repair (10 | 4.6%), and Farming, Fishing & Forestry (4 | 1.8%).
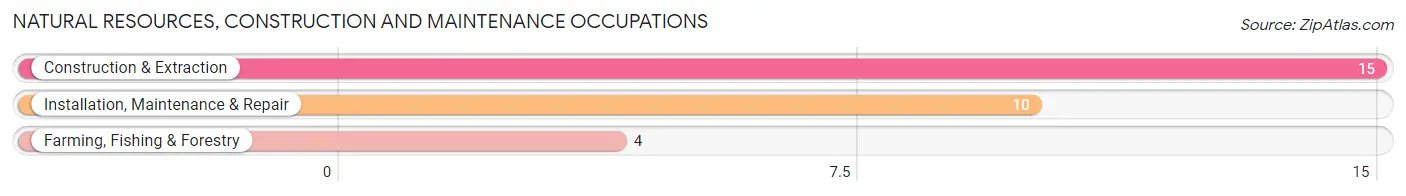
Natural Resources, Construction and Maintenance Occupations by Sex
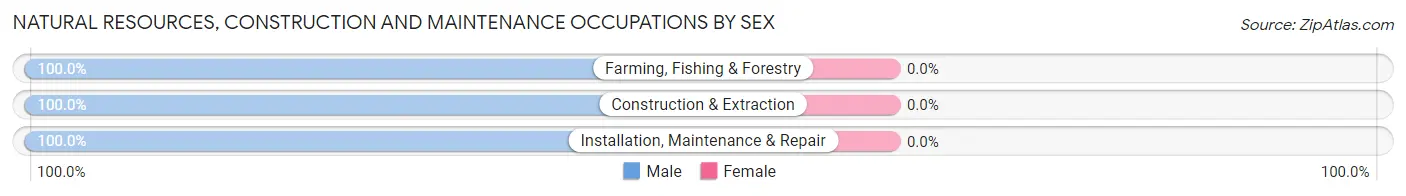
| Occupation | Male | Female |
| Farming, Fishing & Forestry | 4 (100.0%) | 0 (0.0%) |
| Construction & Extraction | 15 (100.0%) | 0 (0.0%) |
| Installation, Maintenance & Repair | 10 (100.0%) | 0 (0.0%) |
| Total (Category) | 29 (100.0%) | 0 (0.0%) |
| Total (Overall) | 114 (52.3%) | 104 (47.7%) |
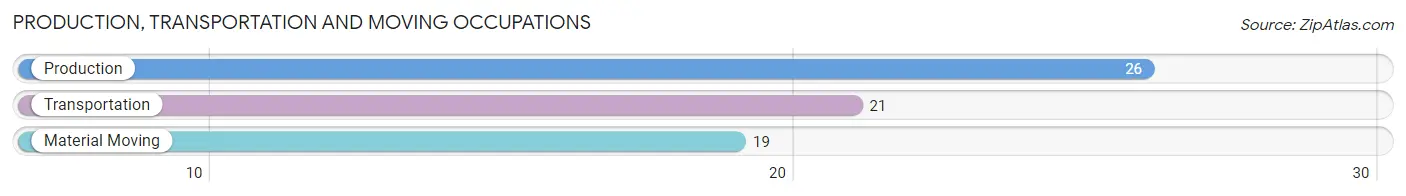
Production, Transportation and Moving Occupations
The most common Production, Transportation and Moving occupations in Humeston are Production (26 | 11.9%), Transportation (21 | 9.6%), and Material Moving (19 | 8.7%).
Production, Transportation and Moving Occupations by Sex
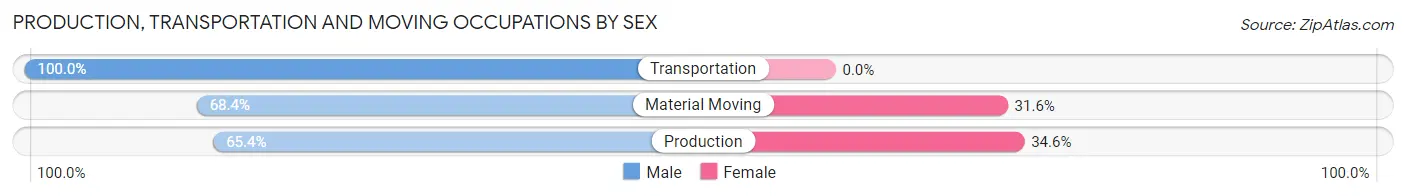
| Occupation | Male | Female |
| Production | 17 (65.4%) | 9 (34.6%) |
| Transportation | 21 (100.0%) | 0 (0.0%) |
| Material Moving | 13 (68.4%) | 6 (31.6%) |
| Total (Category) | 51 (77.3%) | 15 (22.7%) |
| Total (Overall) | 114 (52.3%) | 104 (47.7%) |
Employment Industries by Sex in Humeston
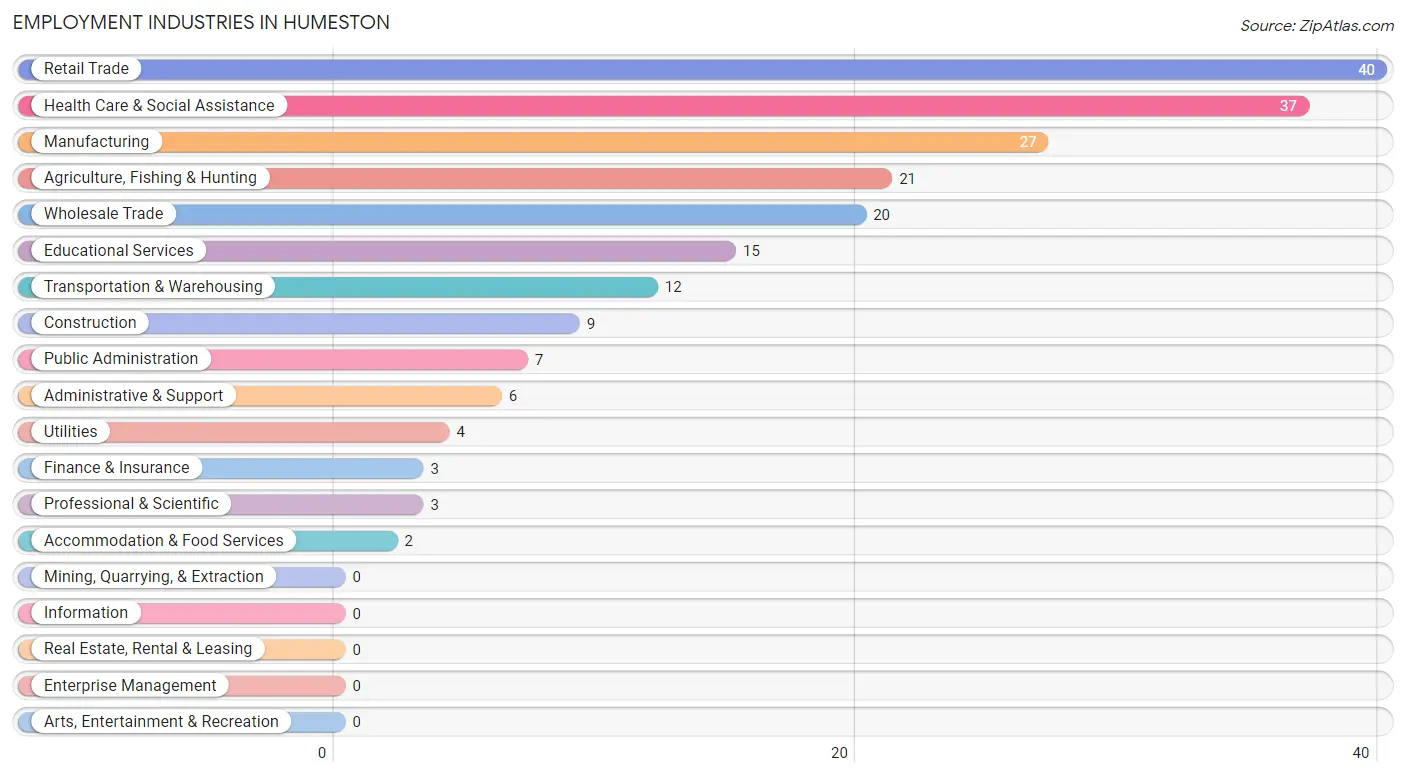
Employment Industries in Humeston
The major employment industries in Humeston include Retail Trade (40 | 18.3%), Health Care & Social Assistance (37 | 17.0%), Manufacturing (27 | 12.4%), Agriculture, Fishing & Hunting (21 | 9.6%), and Wholesale Trade (20 | 9.2%).
Employment Industries by Sex in Humeston
The Humeston industries that see more men than women are Agriculture, Fishing & Hunting (100.0%), Construction (100.0%), and Transportation & Warehousing (100.0%), whereas the industries that tend to have a higher number of women are Finance & Insurance (100.0%), Professional & Scientific (100.0%), and Accommodation & Food Services (100.0%).
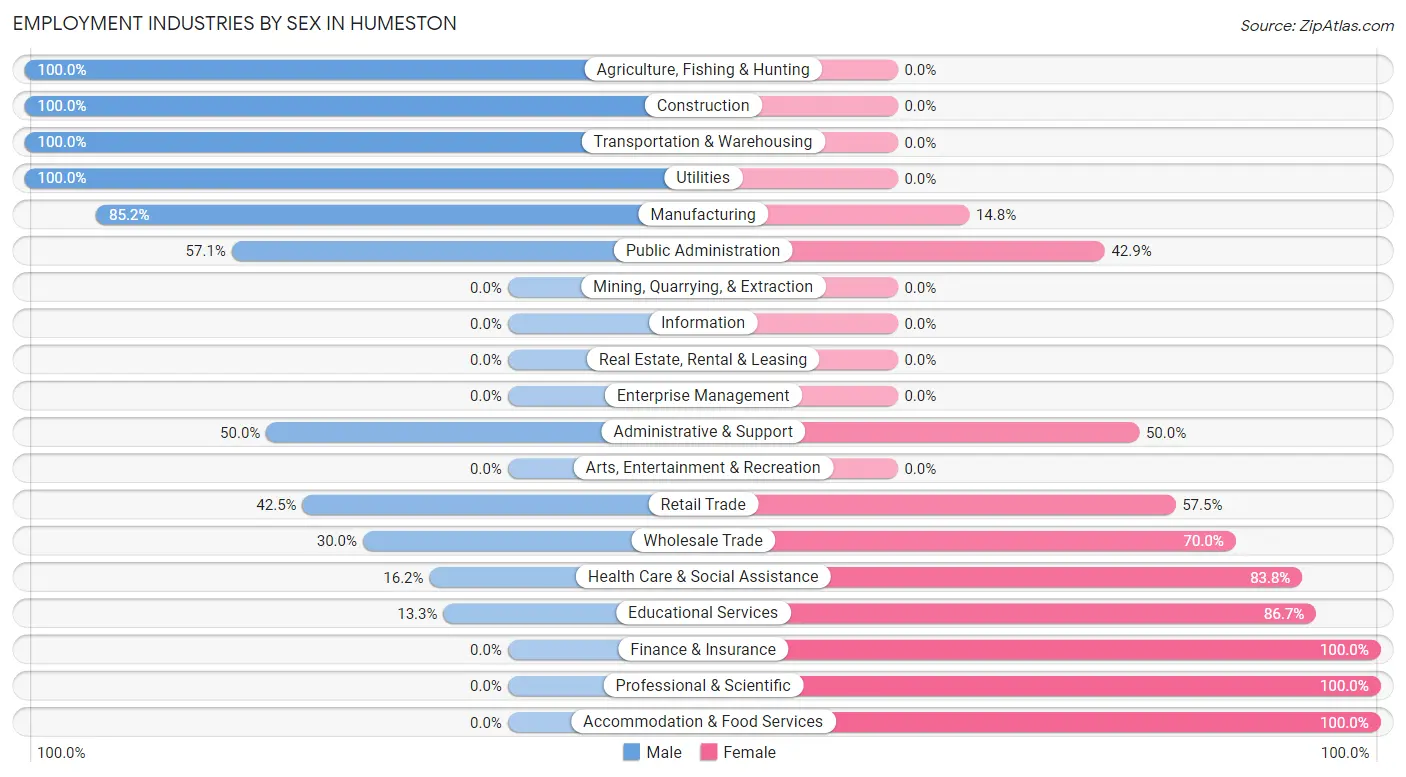
| Industry | Male | Female |
| Agriculture, Fishing & Hunting | 21 (100.0%) | 0 (0.0%) |
| Mining, Quarrying, & Extraction | 0 (0.0%) | 0 (0.0%) |
| Construction | 9 (100.0%) | 0 (0.0%) |
| Manufacturing | 23 (85.2%) | 4 (14.8%) |
| Wholesale Trade | 6 (30.0%) | 14 (70.0%) |
| Retail Trade | 17 (42.5%) | 23 (57.5%) |
| Transportation & Warehousing | 12 (100.0%) | 0 (0.0%) |
| Utilities | 4 (100.0%) | 0 (0.0%) |
| Information | 0 (0.0%) | 0 (0.0%) |
| Finance & Insurance | 0 (0.0%) | 3 (100.0%) |
| Real Estate, Rental & Leasing | 0 (0.0%) | 0 (0.0%) |
| Professional & Scientific | 0 (0.0%) | 3 (100.0%) |
| Enterprise Management | 0 (0.0%) | 0 (0.0%) |
| Administrative & Support | 3 (50.0%) | 3 (50.0%) |
| Educational Services | 2 (13.3%) | 13 (86.7%) |
| Health Care & Social Assistance | 6 (16.2%) | 31 (83.8%) |
| Arts, Entertainment & Recreation | 0 (0.0%) | 0 (0.0%) |
| Accommodation & Food Services | 0 (0.0%) | 2 (100.0%) |
| Public Administration | 4 (57.1%) | 3 (42.9%) |
| Total | 114 (52.3%) | 104 (47.7%) |
Education in Humeston
School Enrollment in Humeston
The most common levels of schooling among the 115 students in Humeston are middle school (45 | 39.1%), high school (33 | 28.7%), and elementary school (12 | 10.4%).
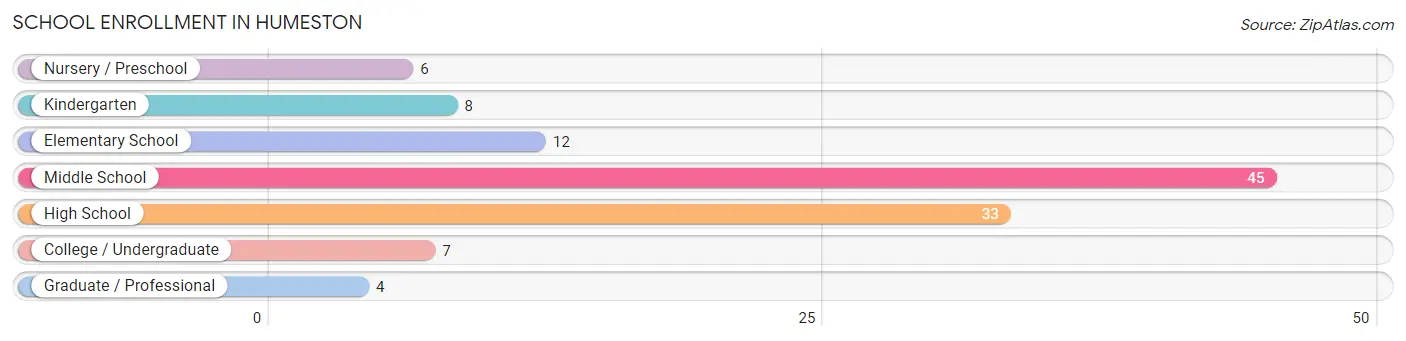
| School Level | # Students | % Students |
| Nursery / Preschool | 6 | 5.2% |
| Kindergarten | 8 | 7.0% |
| Elementary School | 12 | 10.4% |
| Middle School | 45 | 39.1% |
| High School | 33 | 28.7% |
| College / Undergraduate | 7 | 6.1% |
| Graduate / Professional | 4 | 3.5% |
| Total | 115 | 100.0% |
School Enrollment by Age by Funding Source in Humeston
Out of a total of 115 students who are enrolled in schools in Humeston, 4 (3.5%) attend a private institution, while the remaining 111 (96.5%) are enrolled in public schools. The age group of 5 to 9 year old has the highest likelihood of being enrolled in private schools, with 4 (20.0% in the age bracket) enrolled. Conversely, the age group of 3 to 4 year olds has the lowest likelihood of being enrolled in a private school, with 6 (100.0% in the age bracket) attending a public institution.
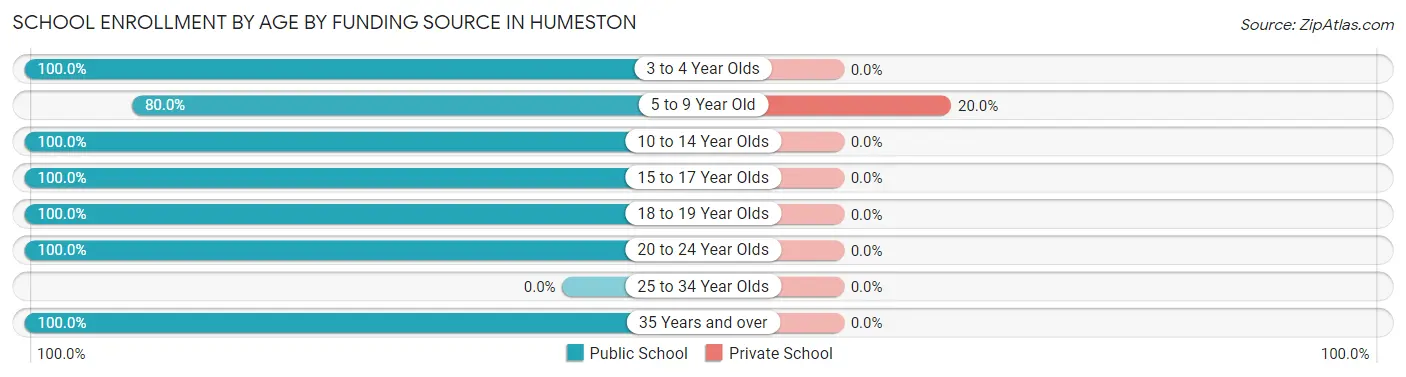
| Age Bracket | Public School | Private School |
| 3 to 4 Year Olds | 6 (100.0%) | 0 (0.0%) |
| 5 to 9 Year Old | 16 (80.0%) | 4 (20.0%) |
| 10 to 14 Year Olds | 45 (100.0%) | 0 (0.0%) |
| 15 to 17 Year Olds | 31 (100.0%) | 0 (0.0%) |
| 18 to 19 Year Olds | 4 (100.0%) | 0 (0.0%) |
| 20 to 24 Year Olds | 3 (100.0%) | 0 (0.0%) |
| 25 to 34 Year Olds | 0 (0.0%) | 0 (0.0%) |
| 35 Years and over | 6 (100.0%) | 0 (0.0%) |
| Total | 111 (96.5%) | 4 (3.5%) |
Educational Attainment by Field of Study in Humeston
Education (19 | 28.8%), bio, nature & agricultural (16 | 24.2%), physical & health sciences (9 | 13.6%), business (9 | 13.6%), and psychology (7 | 10.6%) are the most common fields of study among 66 individuals in Humeston who have obtained a bachelor's degree or higher.
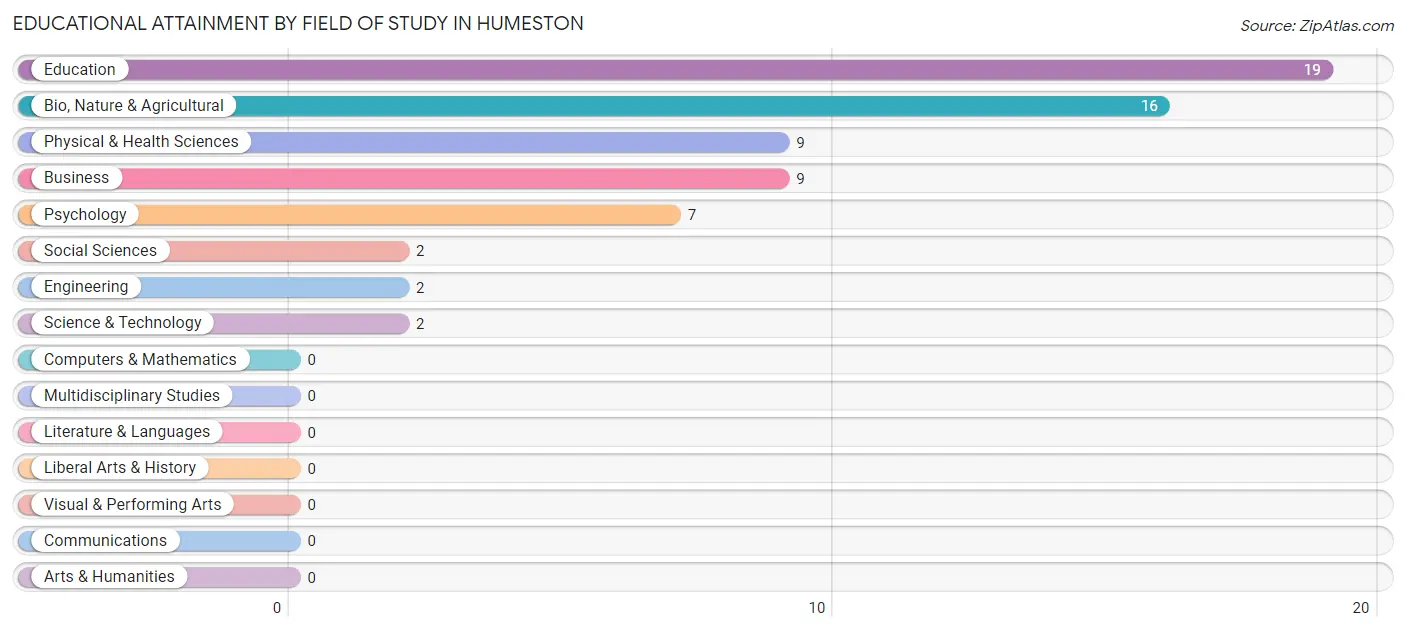
| Field of Study | # Graduates | % Graduates |
| Computers & Mathematics | 0 | 0.0% |
| Bio, Nature & Agricultural | 16 | 24.2% |
| Physical & Health Sciences | 9 | 13.6% |
| Psychology | 7 | 10.6% |
| Social Sciences | 2 | 3.0% |
| Engineering | 2 | 3.0% |
| Multidisciplinary Studies | 0 | 0.0% |
| Science & Technology | 2 | 3.0% |
| Business | 9 | 13.6% |
| Education | 19 | 28.8% |
| Literature & Languages | 0 | 0.0% |
| Liberal Arts & History | 0 | 0.0% |
| Visual & Performing Arts | 0 | 0.0% |
| Communications | 0 | 0.0% |
| Arts & Humanities | 0 | 0.0% |
| Total | 66 | 100.0% |
Transportation & Commute in Humeston
Vehicle Availability by Sex in Humeston
The most prevalent vehicle ownership categories in Humeston are males with 3 vehicles (39, accounting for 35.1%) and females with 3 vehicles (35, making up 37.5%).
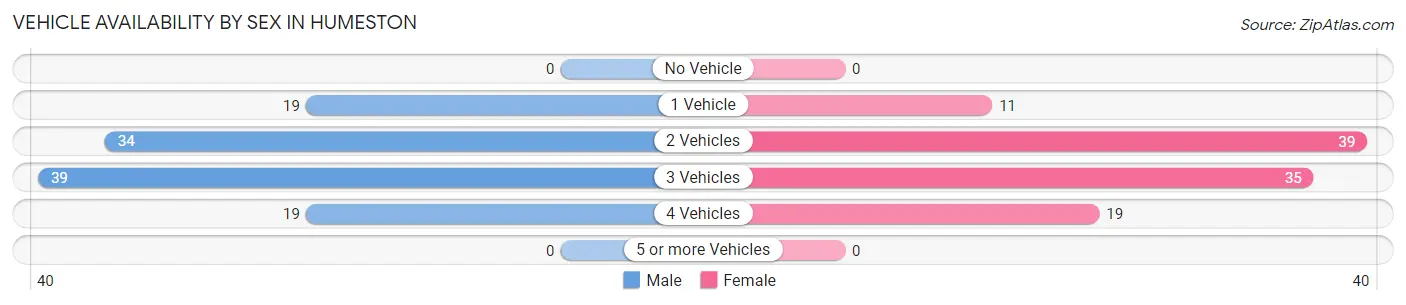
| Vehicles Available | Male | Female |
| No Vehicle | 0 (0.0%) | 0 (0.0%) |
| 1 Vehicle | 19 (17.1%) | 11 (10.6%) |
| 2 Vehicles | 34 (30.6%) | 39 (37.5%) |
| 3 Vehicles | 39 (35.1%) | 35 (33.7%) |
| 4 Vehicles | 19 (17.1%) | 19 (18.3%) |
| 5 or more Vehicles | 0 (0.0%) | 0 (0.0%) |
| Total | 111 (100.0%) | 104 (100.0%) |
Commute Time in Humeston
The most frequently occuring commute durations in Humeston are 20 to 24 minutes (53 commuters, 24.6%), less than 5 minutes (36 commuters, 16.7%), and 30 to 34 minutes (32 commuters, 14.9%).
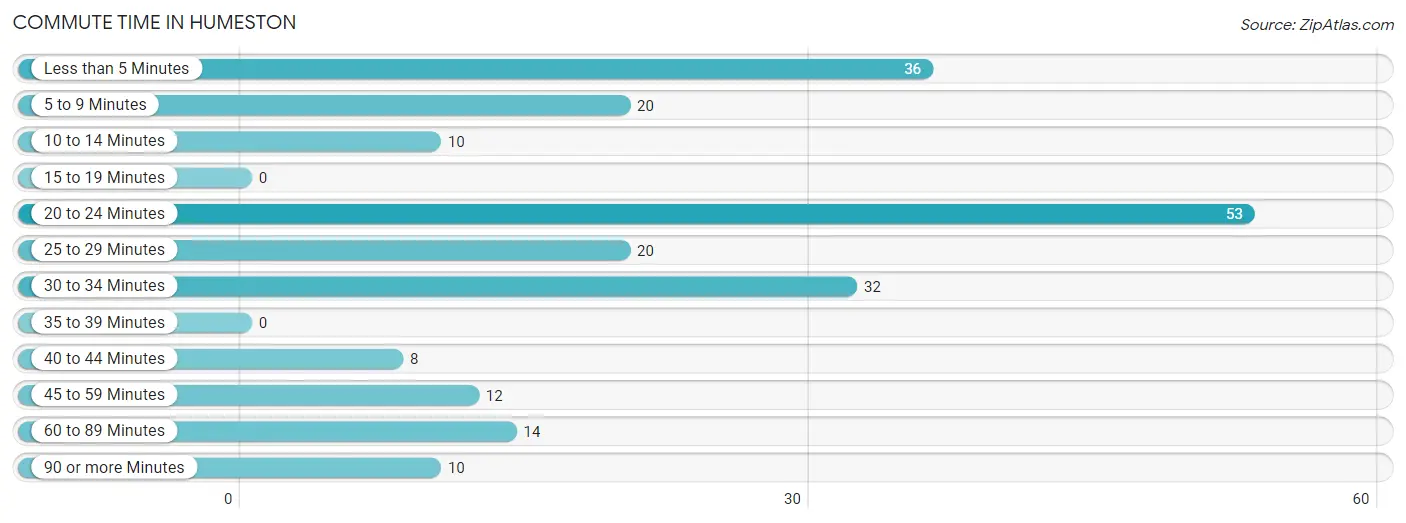
| Commute Time | # Commuters | % Commuters |
| Less than 5 Minutes | 36 | 16.7% |
| 5 to 9 Minutes | 20 | 9.3% |
| 10 to 14 Minutes | 10 | 4.6% |
| 15 to 19 Minutes | 0 | 0.0% |
| 20 to 24 Minutes | 53 | 24.6% |
| 25 to 29 Minutes | 20 | 9.3% |
| 30 to 34 Minutes | 32 | 14.9% |
| 35 to 39 Minutes | 0 | 0.0% |
| 40 to 44 Minutes | 8 | 3.7% |
| 45 to 59 Minutes | 12 | 5.6% |
| 60 to 89 Minutes | 14 | 6.5% |
| 90 or more Minutes | 10 | 4.6% |
Commute Time by Sex in Humeston
The most common commute times in Humeston are 20 to 24 minutes (38 commuters, 34.2%) for males and less than 5 minutes (24 commuters, 23.1%) for females.
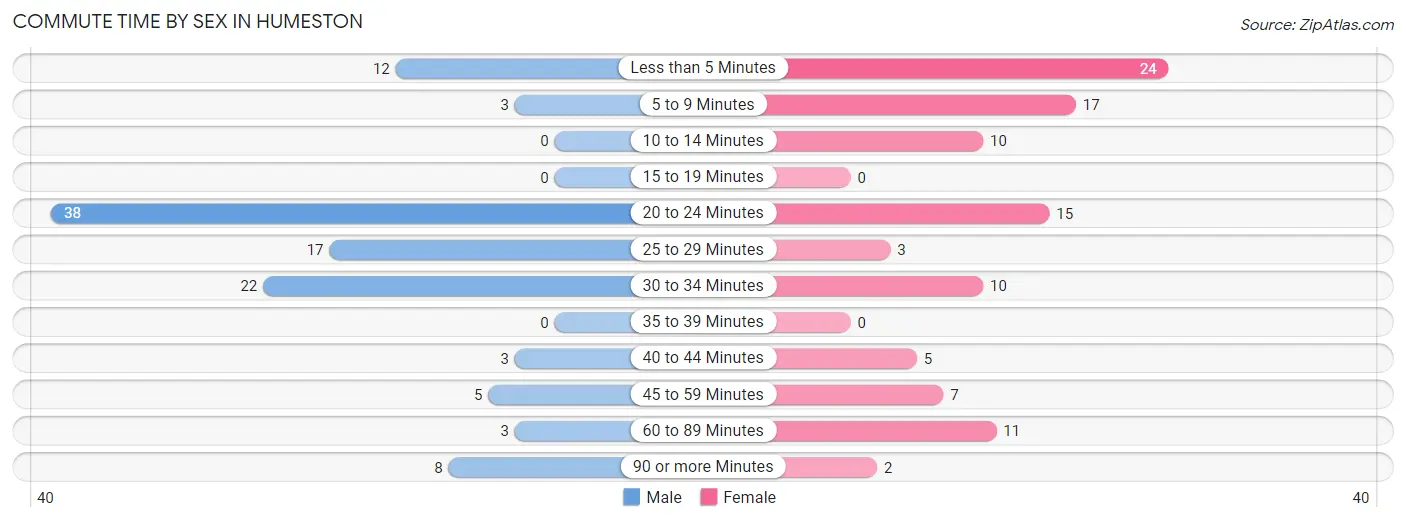
| Commute Time | Male | Female |
| Less than 5 Minutes | 12 (10.8%) | 24 (23.1%) |
| 5 to 9 Minutes | 3 (2.7%) | 17 (16.4%) |
| 10 to 14 Minutes | 0 (0.0%) | 10 (9.6%) |
| 15 to 19 Minutes | 0 (0.0%) | 0 (0.0%) |
| 20 to 24 Minutes | 38 (34.2%) | 15 (14.4%) |
| 25 to 29 Minutes | 17 (15.3%) | 3 (2.9%) |
| 30 to 34 Minutes | 22 (19.8%) | 10 (9.6%) |
| 35 to 39 Minutes | 0 (0.0%) | 0 (0.0%) |
| 40 to 44 Minutes | 3 (2.7%) | 5 (4.8%) |
| 45 to 59 Minutes | 5 (4.5%) | 7 (6.7%) |
| 60 to 89 Minutes | 3 (2.7%) | 11 (10.6%) |
| 90 or more Minutes | 8 (7.2%) | 2 (1.9%) |
Time of Departure to Work by Sex in Humeston
The most frequent times of departure to work in Humeston are 6:30 AM to 6:59 AM (26, 23.4%) for males and 7:30 AM to 7:59 AM (22, 21.1%) for females.
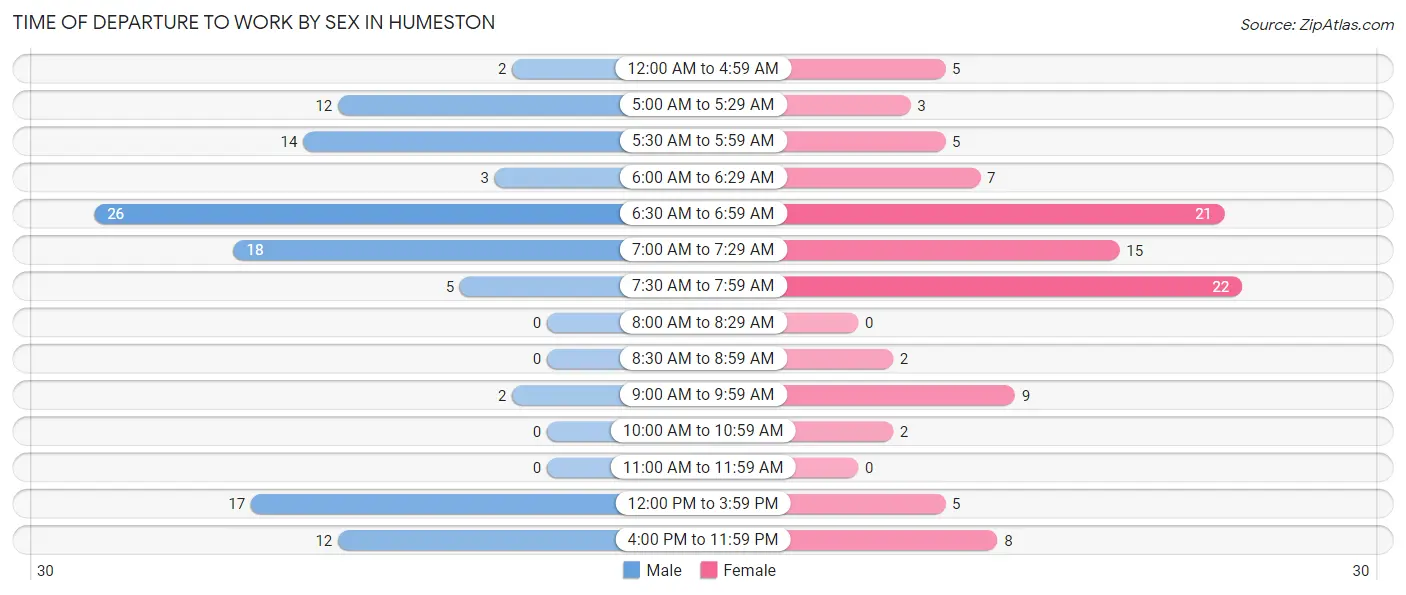
| Time of Departure | Male | Female |
| 12:00 AM to 4:59 AM | 2 (1.8%) | 5 (4.8%) |
| 5:00 AM to 5:29 AM | 12 (10.8%) | 3 (2.9%) |
| 5:30 AM to 5:59 AM | 14 (12.6%) | 5 (4.8%) |
| 6:00 AM to 6:29 AM | 3 (2.7%) | 7 (6.7%) |
| 6:30 AM to 6:59 AM | 26 (23.4%) | 21 (20.2%) |
| 7:00 AM to 7:29 AM | 18 (16.2%) | 15 (14.4%) |
| 7:30 AM to 7:59 AM | 5 (4.5%) | 22 (21.1%) |
| 8:00 AM to 8:29 AM | 0 (0.0%) | 0 (0.0%) |
| 8:30 AM to 8:59 AM | 0 (0.0%) | 2 (1.9%) |
| 9:00 AM to 9:59 AM | 2 (1.8%) | 9 (8.6%) |
| 10:00 AM to 10:59 AM | 0 (0.0%) | 2 (1.9%) |
| 11:00 AM to 11:59 AM | 0 (0.0%) | 0 (0.0%) |
| 12:00 PM to 3:59 PM | 17 (15.3%) | 5 (4.8%) |
| 4:00 PM to 11:59 PM | 12 (10.8%) | 8 (7.7%) |
| Total | 111 (100.0%) | 104 (100.0%) |
Housing Occupancy in Humeston
Occupancy by Ownership in Humeston
Of the total 230 dwellings in Humeston, owner-occupied units account for 182 (79.1%), while renter-occupied units make up 48 (20.9%).
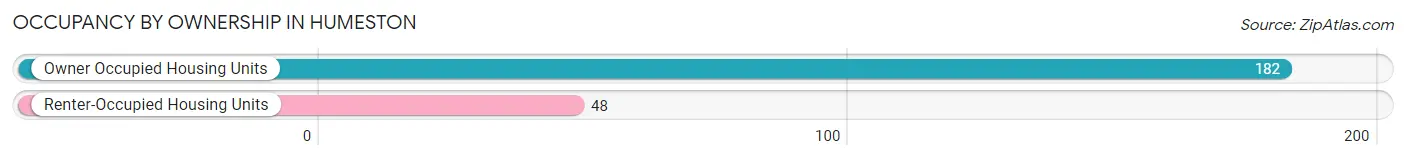
| Occupancy | # Housing Units | % Housing Units |
| Owner Occupied Housing Units | 182 | 79.1% |
| Renter-Occupied Housing Units | 48 | 20.9% |
| Total Occupied Housing Units | 230 | 100.0% |
Occupancy by Household Size in Humeston
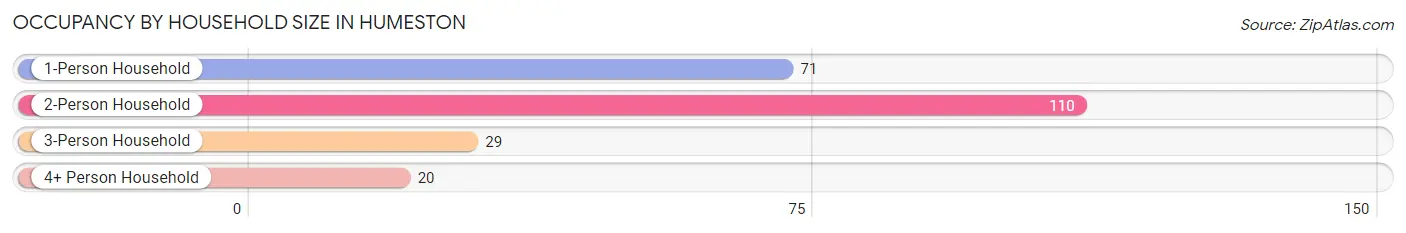
| Household Size | # Housing Units | % Housing Units |
| 1-Person Household | 71 | 30.9% |
| 2-Person Household | 110 | 47.8% |
| 3-Person Household | 29 | 12.6% |
| 4+ Person Household | 20 | 8.7% |
| Total Housing Units | 230 | 100.0% |
Occupancy by Ownership by Household Size in Humeston
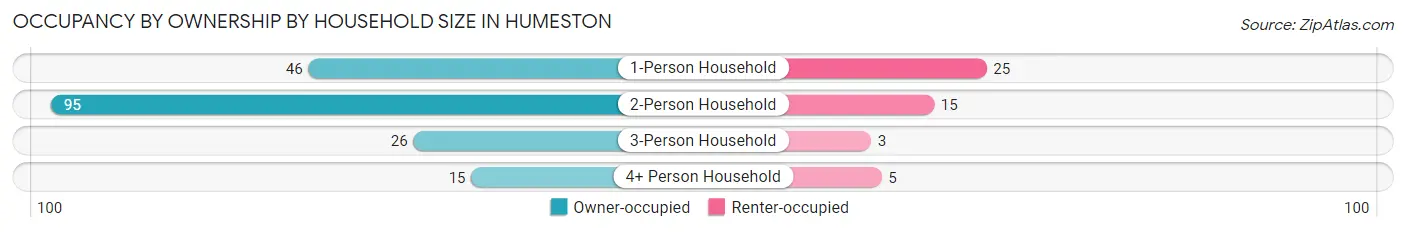
| Household Size | Owner-occupied | Renter-occupied |
| 1-Person Household | 46 (64.8%) | 25 (35.2%) |
| 2-Person Household | 95 (86.4%) | 15 (13.6%) |
| 3-Person Household | 26 (89.7%) | 3 (10.3%) |
| 4+ Person Household | 15 (75.0%) | 5 (25.0%) |
| Total Housing Units | 182 (79.1%) | 48 (20.9%) |
Occupancy by Educational Attainment in Humeston
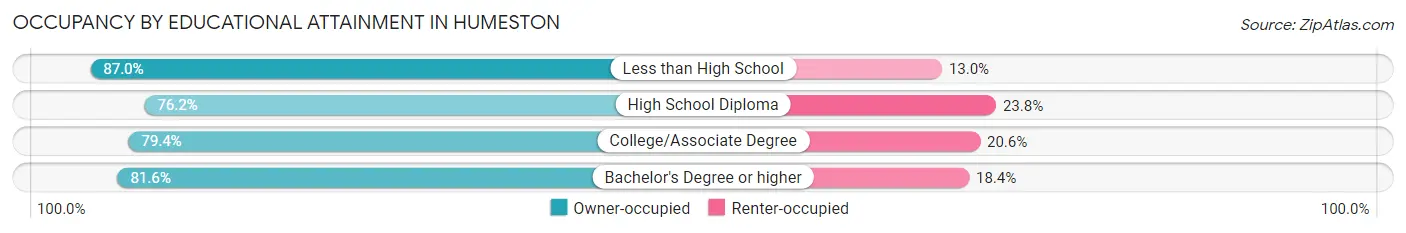
| Household Size | Owner-occupied | Renter-occupied |
| Less than High School | 20 (87.0%) | 3 (13.0%) |
| High School Diploma | 77 (76.2%) | 24 (23.8%) |
| College/Associate Degree | 54 (79.4%) | 14 (20.6%) |
| Bachelor's Degree or higher | 31 (81.6%) | 7 (18.4%) |
Occupancy by Age of Householder in Humeston
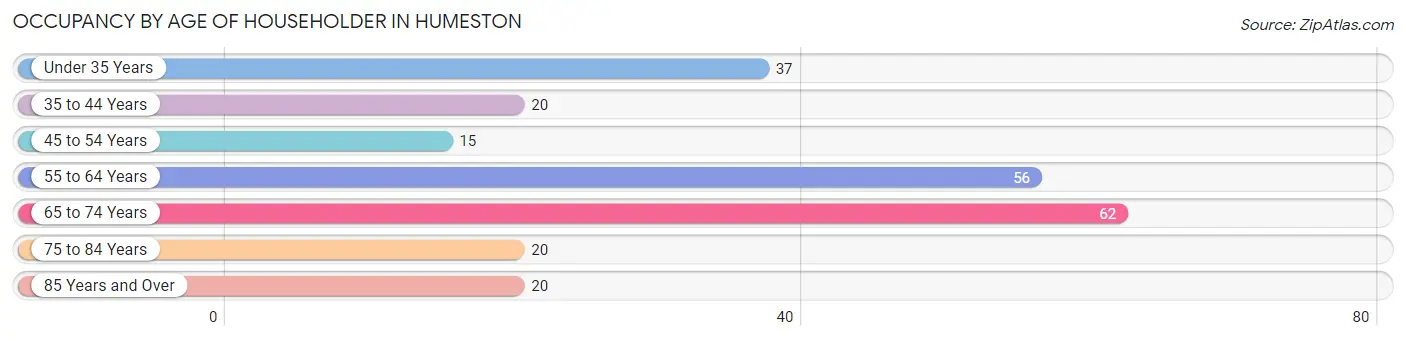
| Age Bracket | # Households | % Households |
| Under 35 Years | 37 | 16.1% |
| 35 to 44 Years | 20 | 8.7% |
| 45 to 54 Years | 15 | 6.5% |
| 55 to 64 Years | 56 | 24.3% |
| 65 to 74 Years | 62 | 27.0% |
| 75 to 84 Years | 20 | 8.7% |
| 85 Years and Over | 20 | 8.7% |
| Total | 230 | 100.0% |
Housing Finances in Humeston
Median Income by Occupancy in Humeston
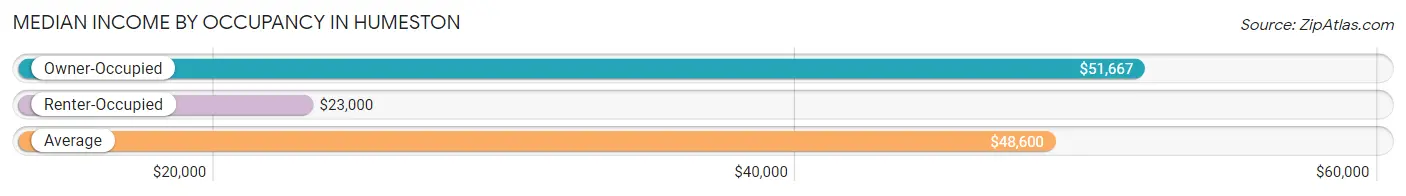
| Occupancy Type | # Households | Median Income |
| Owner-Occupied | 182 (79.1%) | $51,667 |
| Renter-Occupied | 48 (20.9%) | $23,000 |
| Average | 230 (100.0%) | $48,600 |
Occupancy by Householder Income Bracket in Humeston
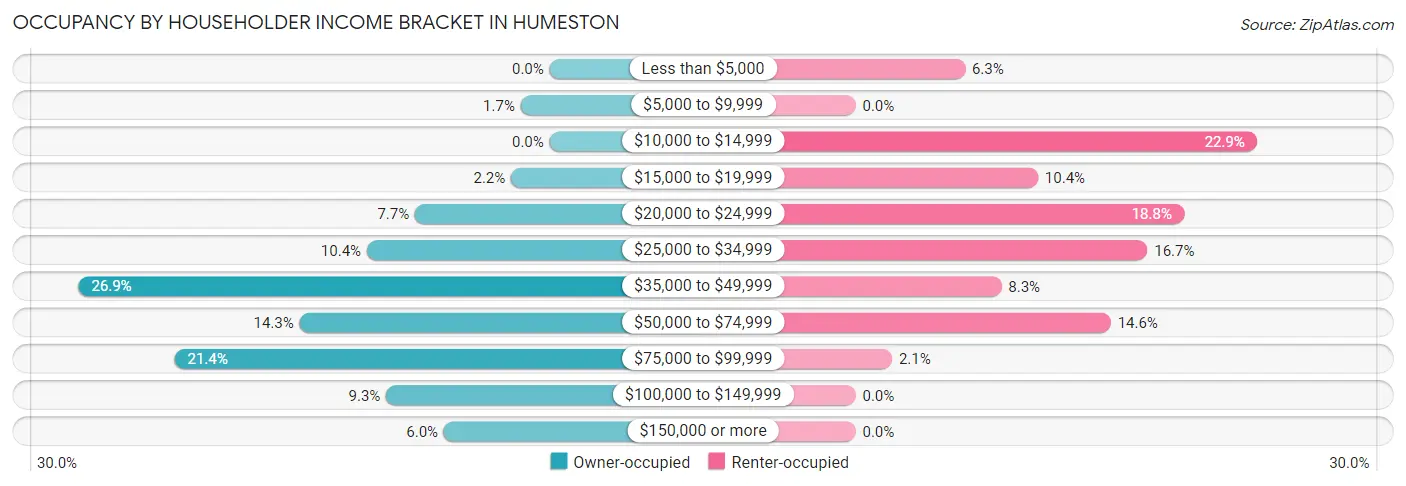
| Income Bracket | Owner-occupied | Renter-occupied |
| Less than $5,000 | 0 (0.0%) | 3 (6.2%) |
| $5,000 to $9,999 | 3 (1.7%) | 0 (0.0%) |
| $10,000 to $14,999 | 0 (0.0%) | 11 (22.9%) |
| $15,000 to $19,999 | 4 (2.2%) | 5 (10.4%) |
| $20,000 to $24,999 | 14 (7.7%) | 9 (18.8%) |
| $25,000 to $34,999 | 19 (10.4%) | 8 (16.7%) |
| $35,000 to $49,999 | 49 (26.9%) | 4 (8.3%) |
| $50,000 to $74,999 | 26 (14.3%) | 7 (14.6%) |
| $75,000 to $99,999 | 39 (21.4%) | 1 (2.1%) |
| $100,000 to $149,999 | 17 (9.3%) | 0 (0.0%) |
| $150,000 or more | 11 (6.0%) | 0 (0.0%) |
| Total | 182 (100.0%) | 48 (100.0%) |
Monthly Housing Cost Tiers in Humeston
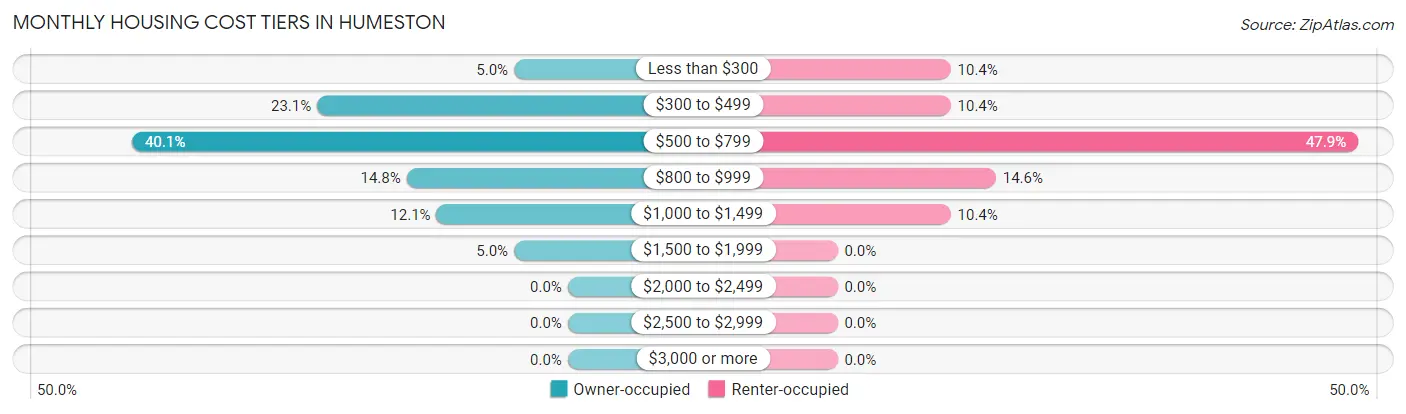
| Monthly Cost | Owner-occupied | Renter-occupied |
| Less than $300 | 9 (5.0%) | 5 (10.4%) |
| $300 to $499 | 42 (23.1%) | 5 (10.4%) |
| $500 to $799 | 73 (40.1%) | 23 (47.9%) |
| $800 to $999 | 27 (14.8%) | 7 (14.6%) |
| $1,000 to $1,499 | 22 (12.1%) | 5 (10.4%) |
| $1,500 to $1,999 | 9 (5.0%) | 0 (0.0%) |
| $2,000 to $2,499 | 0 (0.0%) | 0 (0.0%) |
| $2,500 to $2,999 | 0 (0.0%) | 0 (0.0%) |
| $3,000 or more | 0 (0.0%) | 0 (0.0%) |
| Total | 182 (100.0%) | 48 (100.0%) |
Physical Housing Characteristics in Humeston
Housing Structures in Humeston
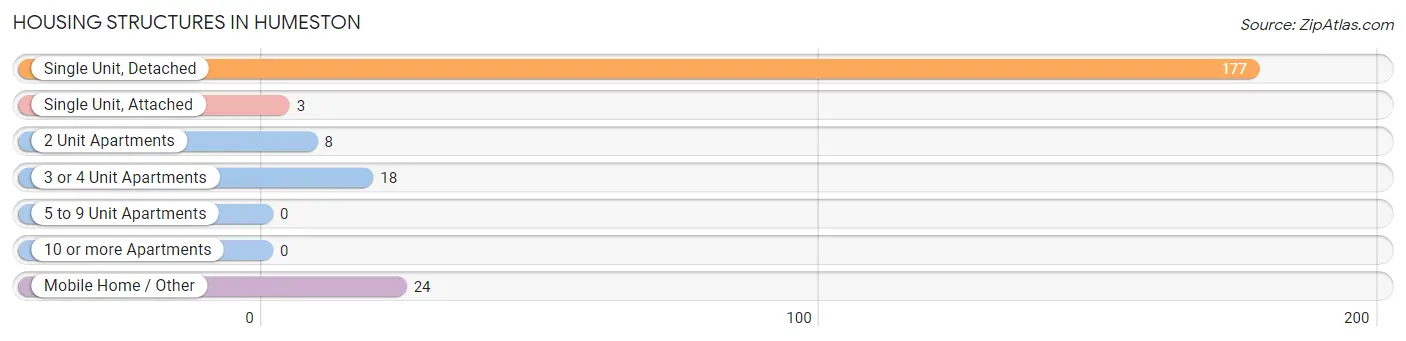
| Structure Type | # Housing Units | % Housing Units |
| Single Unit, Detached | 177 | 77.0% |
| Single Unit, Attached | 3 | 1.3% |
| 2 Unit Apartments | 8 | 3.5% |
| 3 or 4 Unit Apartments | 18 | 7.8% |
| 5 to 9 Unit Apartments | 0 | 0.0% |
| 10 or more Apartments | 0 | 0.0% |
| Mobile Home / Other | 24 | 10.4% |
| Total | 230 | 100.0% |
Housing Structures by Occupancy in Humeston
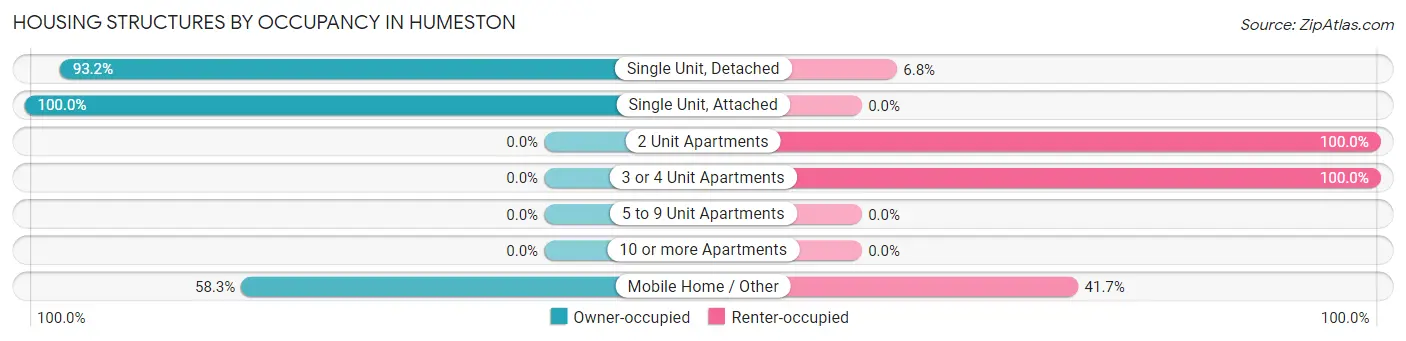
| Structure Type | Owner-occupied | Renter-occupied |
| Single Unit, Detached | 165 (93.2%) | 12 (6.8%) |
| Single Unit, Attached | 3 (100.0%) | 0 (0.0%) |
| 2 Unit Apartments | 0 (0.0%) | 8 (100.0%) |
| 3 or 4 Unit Apartments | 0 (0.0%) | 18 (100.0%) |
| 5 to 9 Unit Apartments | 0 (0.0%) | 0 (0.0%) |
| 10 or more Apartments | 0 (0.0%) | 0 (0.0%) |
| Mobile Home / Other | 14 (58.3%) | 10 (41.7%) |
| Total | 182 (79.1%) | 48 (20.9%) |
Housing Structures by Number of Rooms in Humeston
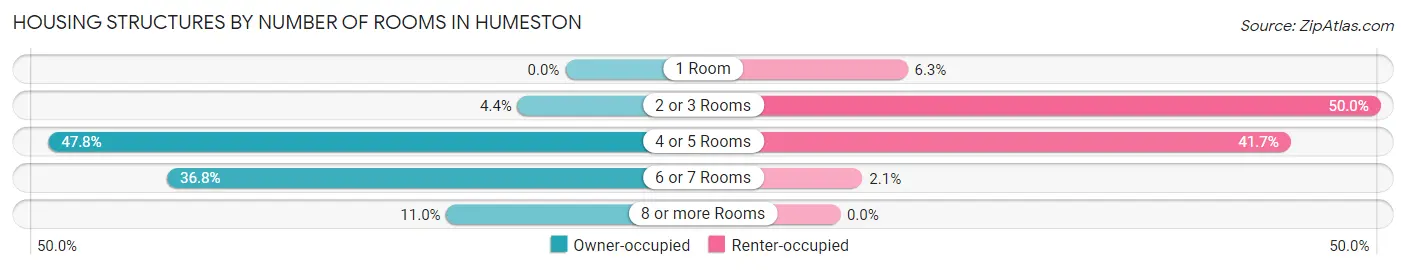
| Number of Rooms | Owner-occupied | Renter-occupied |
| 1 Room | 0 (0.0%) | 3 (6.2%) |
| 2 or 3 Rooms | 8 (4.4%) | 24 (50.0%) |
| 4 or 5 Rooms | 87 (47.8%) | 20 (41.7%) |
| 6 or 7 Rooms | 67 (36.8%) | 1 (2.1%) |
| 8 or more Rooms | 20 (11.0%) | 0 (0.0%) |
| Total | 182 (100.0%) | 48 (100.0%) |
Housing Structure by Heating Type in Humeston
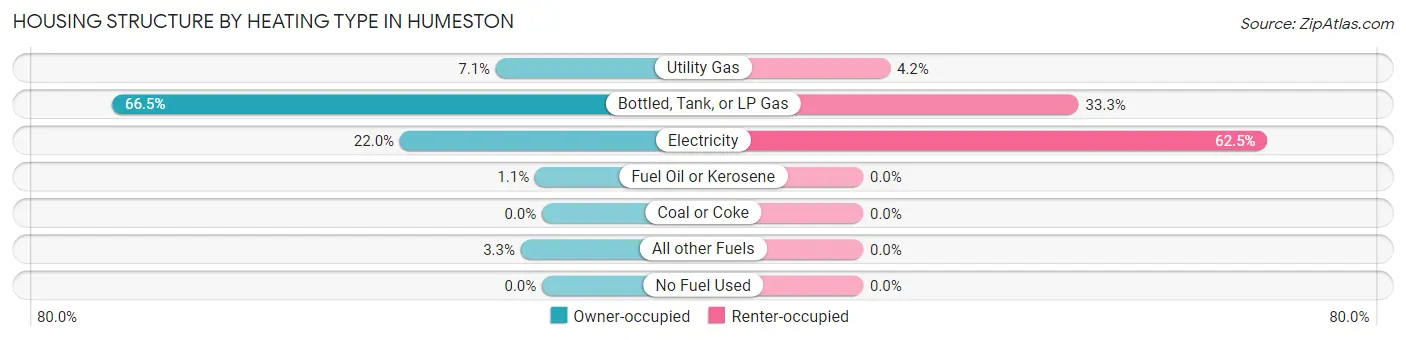
| Heating Type | Owner-occupied | Renter-occupied |
| Utility Gas | 13 (7.1%) | 2 (4.2%) |
| Bottled, Tank, or LP Gas | 121 (66.5%) | 16 (33.3%) |
| Electricity | 40 (22.0%) | 30 (62.5%) |
| Fuel Oil or Kerosene | 2 (1.1%) | 0 (0.0%) |
| Coal or Coke | 0 (0.0%) | 0 (0.0%) |
| All other Fuels | 6 (3.3%) | 0 (0.0%) |
| No Fuel Used | 0 (0.0%) | 0 (0.0%) |
| Total | 182 (100.0%) | 48 (100.0%) |
Household Vehicle Usage in Humeston
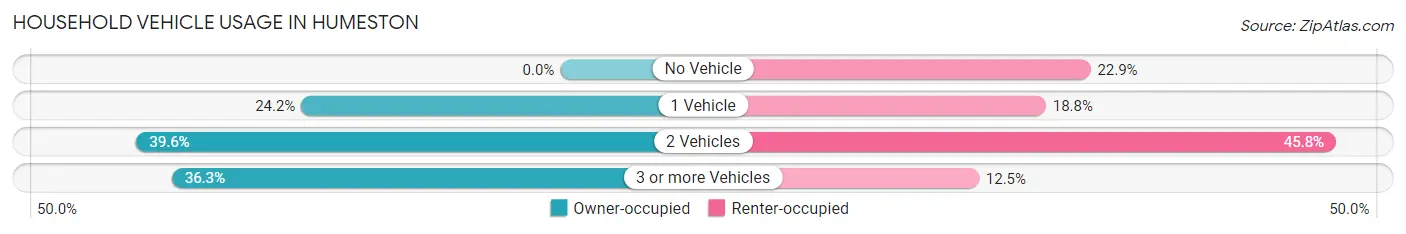
| Vehicles per Household | Owner-occupied | Renter-occupied |
| No Vehicle | 0 (0.0%) | 11 (22.9%) |
| 1 Vehicle | 44 (24.2%) | 9 (18.8%) |
| 2 Vehicles | 72 (39.6%) | 22 (45.8%) |
| 3 or more Vehicles | 66 (36.3%) | 6 (12.5%) |
| Total | 182 (100.0%) | 48 (100.0%) |
Real Estate & Mortgages in Humeston
Real Estate and Mortgage Overview in Humeston
| Characteristic | Without Mortgage | With Mortgage |
| Housing Units | 111 | 71 |
| Median Property Value | $72,500 | $67,000 |
| Median Household Income | $48,098 | $9 |
| Monthly Housing Costs | $514 | $0 |
| Real Estate Taxes | $1,363 | $0 |
Property Value by Mortgage Status in Humeston
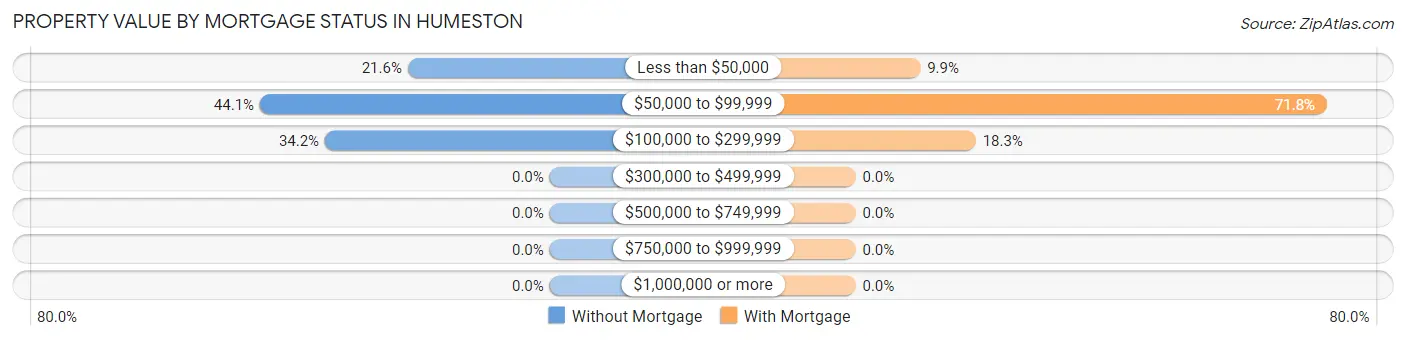
| Property Value | Without Mortgage | With Mortgage |
| Less than $50,000 | 24 (21.6%) | 7 (9.9%) |
| $50,000 to $99,999 | 49 (44.1%) | 51 (71.8%) |
| $100,000 to $299,999 | 38 (34.2%) | 13 (18.3%) |
| $300,000 to $499,999 | 0 (0.0%) | 0 (0.0%) |
| $500,000 to $749,999 | 0 (0.0%) | 0 (0.0%) |
| $750,000 to $999,999 | 0 (0.0%) | 0 (0.0%) |
| $1,000,000 or more | 0 (0.0%) | 0 (0.0%) |
| Total | 111 (100.0%) | 71 (100.0%) |
Household Income by Mortgage Status in Humeston
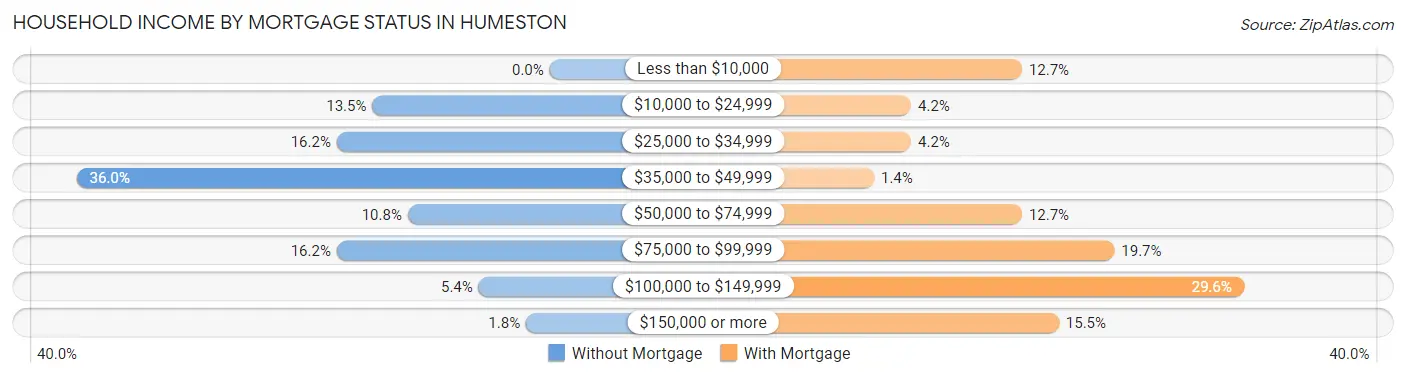
| Household Income | Without Mortgage | With Mortgage |
| Less than $10,000 | 0 (0.0%) | 9 (12.7%) |
| $10,000 to $24,999 | 15 (13.5%) | 3 (4.2%) |
| $25,000 to $34,999 | 18 (16.2%) | 3 (4.2%) |
| $35,000 to $49,999 | 40 (36.0%) | 1 (1.4%) |
| $50,000 to $74,999 | 12 (10.8%) | 9 (12.7%) |
| $75,000 to $99,999 | 18 (16.2%) | 14 (19.7%) |
| $100,000 to $149,999 | 6 (5.4%) | 21 (29.6%) |
| $150,000 or more | 2 (1.8%) | 11 (15.5%) |
| Total | 111 (100.0%) | 71 (100.0%) |
Property Value to Household Income Ratio in Humeston
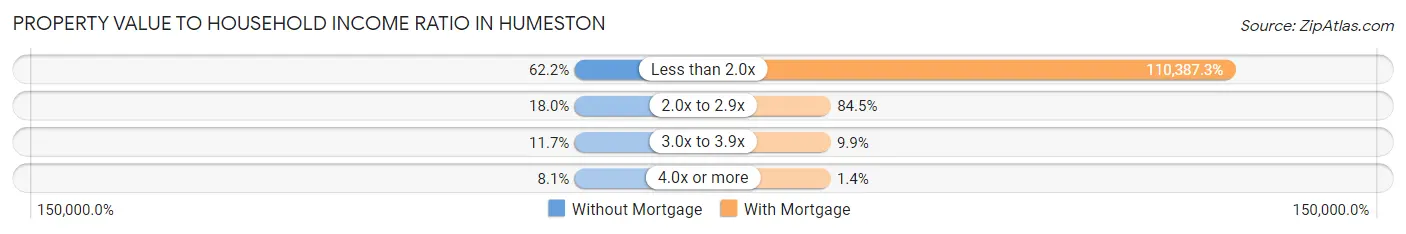
| Value-to-Income Ratio | Without Mortgage | With Mortgage |
| Less than 2.0x | 69 (62.2%) | 78,375 (110,387.3%) |
| 2.0x to 2.9x | 20 (18.0%) | 60 (84.5%) |
| 3.0x to 3.9x | 13 (11.7%) | 7 (9.9%) |
| 4.0x or more | 9 (8.1%) | 1 (1.4%) |
| Total | 111 (100.0%) | 71 (100.0%) |
Real Estate Taxes by Mortgage Status in Humeston
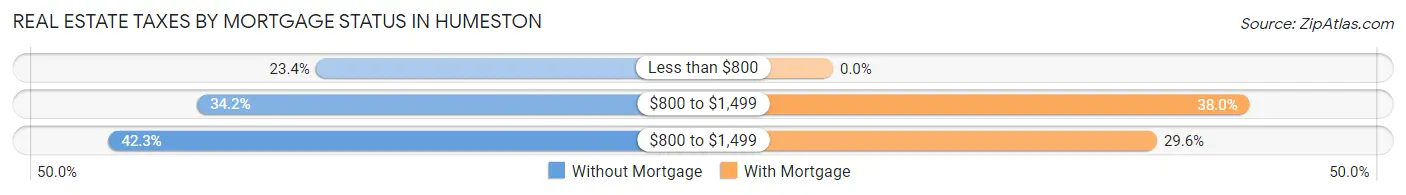
| Property Taxes | Without Mortgage | With Mortgage |
| Less than $800 | 26 (23.4%) | 0 (0.0%) |
| $800 to $1,499 | 38 (34.2%) | 27 (38.0%) |
| $800 to $1,499 | 47 (42.3%) | 21 (29.6%) |
| Total | 111 (100.0%) | 71 (100.0%) |
Health & Disability in Humeston
Health Insurance Coverage by Age in Humeston
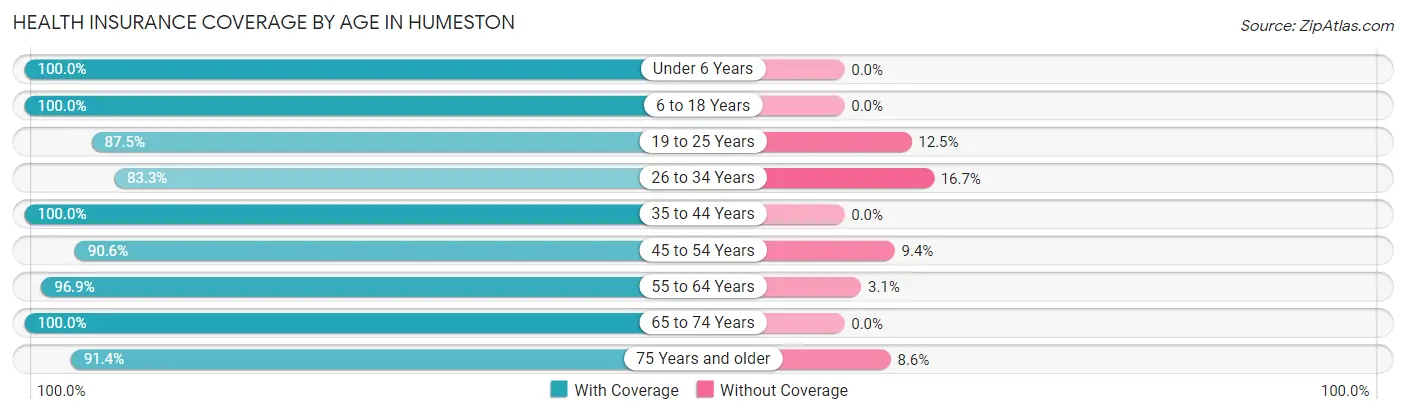
| Age Bracket | With Coverage | Without Coverage |
| Under 6 Years | 28 (100.0%) | 0 (0.0%) |
| 6 to 18 Years | 96 (100.0%) | 0 (0.0%) |
| 19 to 25 Years | 35 (87.5%) | 5 (12.5%) |
| 26 to 34 Years | 30 (83.3%) | 6 (16.7%) |
| 35 to 44 Years | 25 (100.0%) | 0 (0.0%) |
| 45 to 54 Years | 29 (90.6%) | 3 (9.4%) |
| 55 to 64 Years | 93 (96.9%) | 3 (3.1%) |
| 65 to 74 Years | 99 (100.0%) | 0 (0.0%) |
| 75 Years and older | 53 (91.4%) | 5 (8.6%) |
| Total | 488 (95.7%) | 22 (4.3%) |
Health Insurance Coverage by Citizenship Status in Humeston
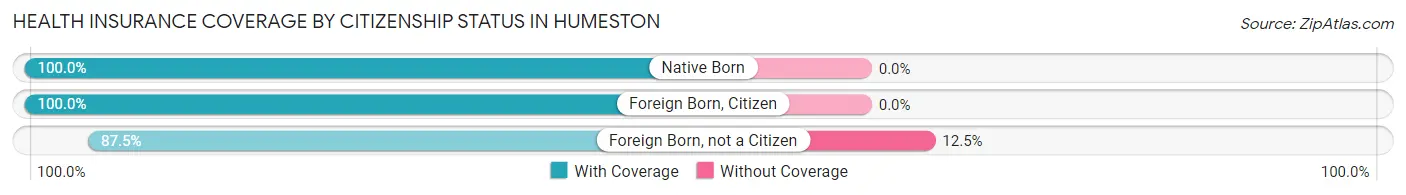
| Citizenship Status | With Coverage | Without Coverage |
| Native Born | 28 (100.0%) | 0 (0.0%) |
| Foreign Born, Citizen | 96 (100.0%) | 0 (0.0%) |
| Foreign Born, not a Citizen | 35 (87.5%) | 5 (12.5%) |
Health Insurance Coverage by Household Income in Humeston
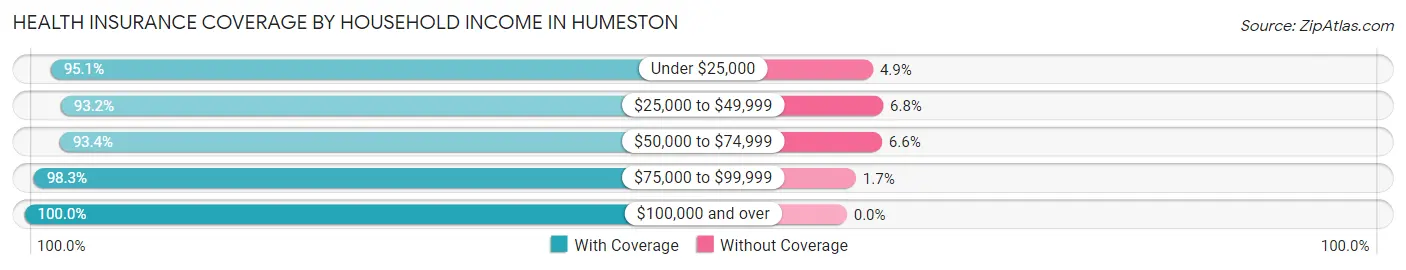
| Household Income | With Coverage | Without Coverage |
| Under $25,000 | 97 (95.1%) | 5 (4.9%) |
| $25,000 to $49,999 | 137 (93.2%) | 10 (6.8%) |
| $50,000 to $74,999 | 71 (93.4%) | 5 (6.6%) |
| $75,000 to $99,999 | 115 (98.3%) | 2 (1.7%) |
| $100,000 and over | 68 (100.0%) | 0 (0.0%) |
Public vs Private Health Insurance Coverage by Age in Humeston
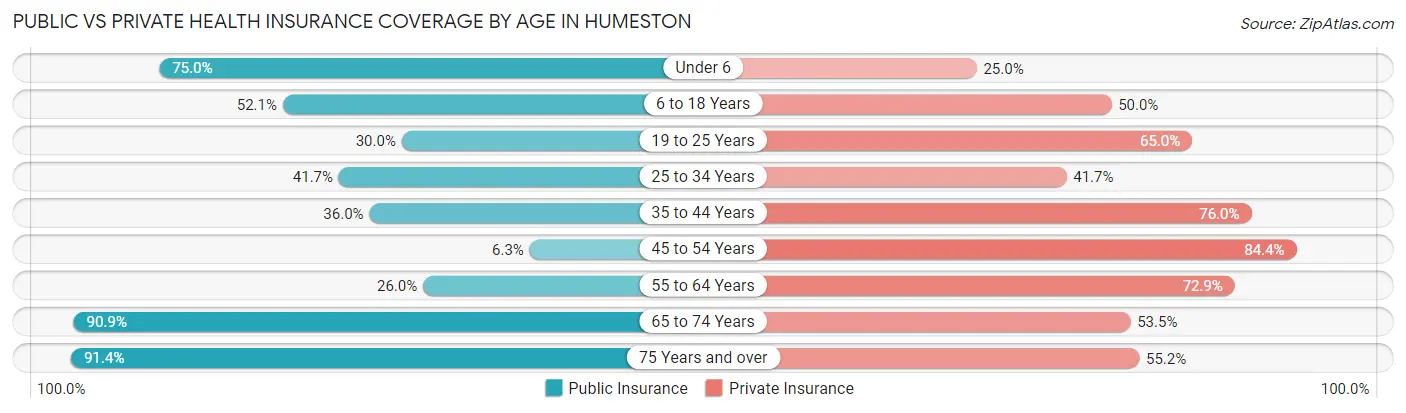
| Age Bracket | Public Insurance | Private Insurance |
| Under 6 | 21 (75.0%) | 7 (25.0%) |
| 6 to 18 Years | 50 (52.1%) | 48 (50.0%) |
| 19 to 25 Years | 12 (30.0%) | 26 (65.0%) |
| 25 to 34 Years | 15 (41.7%) | 15 (41.7%) |
| 35 to 44 Years | 9 (36.0%) | 19 (76.0%) |
| 45 to 54 Years | 2 (6.2%) | 27 (84.4%) |
| 55 to 64 Years | 25 (26.0%) | 70 (72.9%) |
| 65 to 74 Years | 90 (90.9%) | 53 (53.5%) |
| 75 Years and over | 53 (91.4%) | 32 (55.2%) |
| Total | 277 (54.3%) | 297 (58.2%) |
Disability Status by Sex by Age in Humeston
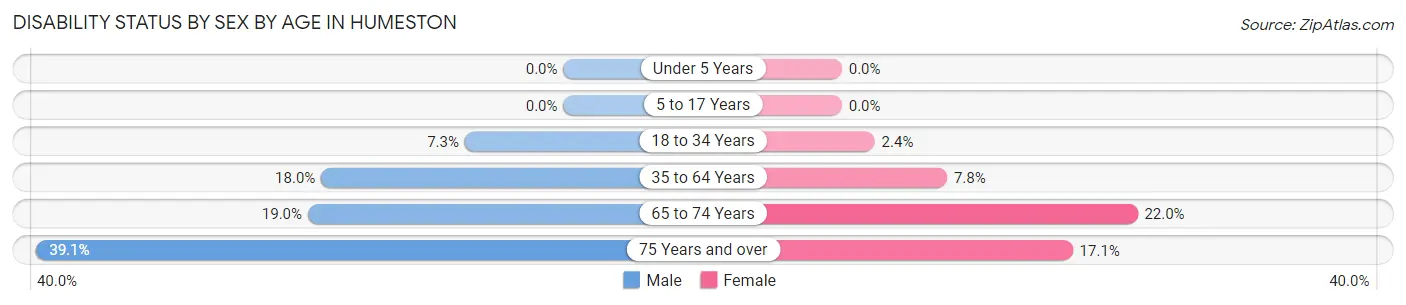
| Age Bracket | Male | Female |
| Under 5 Years | 0 (0.0%) | 0 (0.0%) |
| 5 to 17 Years | 0 (0.0%) | 0 (0.0%) |
| 18 to 34 Years | 3 (7.3%) | 1 (2.4%) |
| 35 to 64 Years | 16 (18.0%) | 5 (7.8%) |
| 65 to 74 Years | 11 (19.0%) | 9 (22.0%) |
| 75 Years and over | 9 (39.1%) | 6 (17.1%) |
Disability Class by Sex by Age in Humeston
Disability Class: Hearing Difficulty
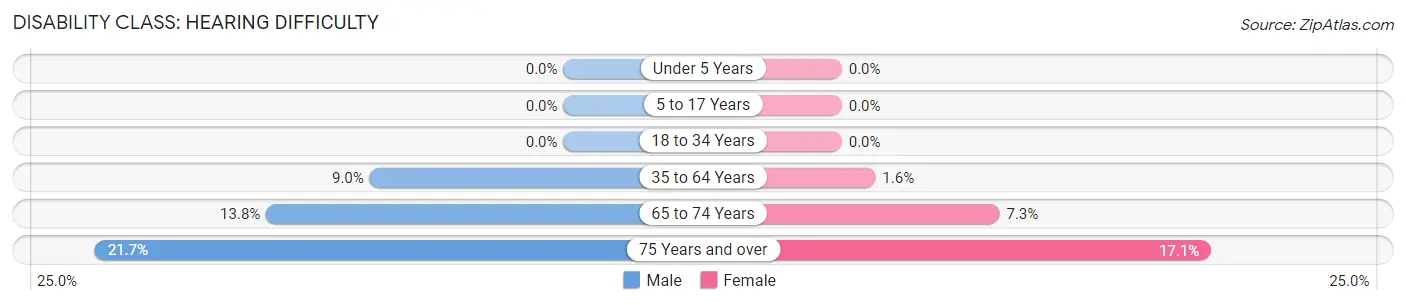
| Age Bracket | Male | Female |
| Under 5 Years | 0 (0.0%) | 0 (0.0%) |
| 5 to 17 Years | 0 (0.0%) | 0 (0.0%) |
| 18 to 34 Years | 0 (0.0%) | 0 (0.0%) |
| 35 to 64 Years | 8 (9.0%) | 1 (1.6%) |
| 65 to 74 Years | 8 (13.8%) | 3 (7.3%) |
| 75 Years and over | 5 (21.7%) | 6 (17.1%) |
Disability Class: Vision Difficulty
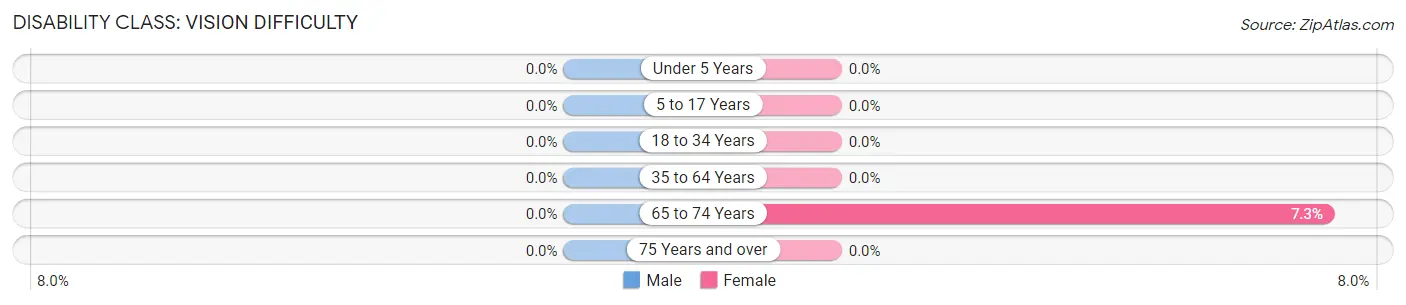
| Age Bracket | Male | Female |
| Under 5 Years | 0 (0.0%) | 0 (0.0%) |
| 5 to 17 Years | 0 (0.0%) | 0 (0.0%) |
| 18 to 34 Years | 0 (0.0%) | 0 (0.0%) |
| 35 to 64 Years | 0 (0.0%) | 0 (0.0%) |
| 65 to 74 Years | 0 (0.0%) | 3 (7.3%) |
| 75 Years and over | 0 (0.0%) | 0 (0.0%) |
Disability Class: Cognitive Difficulty
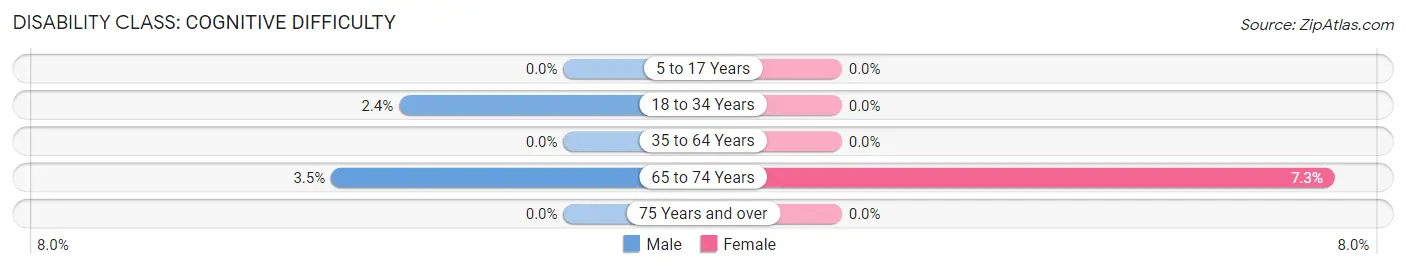
| Age Bracket | Male | Female |
| 5 to 17 Years | 0 (0.0%) | 0 (0.0%) |
| 18 to 34 Years | 1 (2.4%) | 0 (0.0%) |
| 35 to 64 Years | 0 (0.0%) | 0 (0.0%) |
| 65 to 74 Years | 2 (3.5%) | 3 (7.3%) |
| 75 Years and over | 0 (0.0%) | 0 (0.0%) |
Disability Class: Ambulatory Difficulty
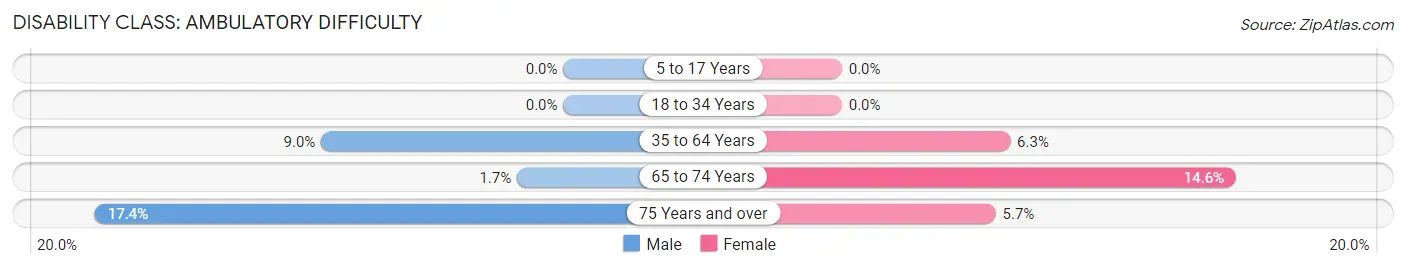
| Age Bracket | Male | Female |
| 5 to 17 Years | 0 (0.0%) | 0 (0.0%) |
| 18 to 34 Years | 0 (0.0%) | 0 (0.0%) |
| 35 to 64 Years | 8 (9.0%) | 4 (6.2%) |
| 65 to 74 Years | 1 (1.7%) | 6 (14.6%) |
| 75 Years and over | 4 (17.4%) | 2 (5.7%) |
Disability Class: Self-Care Difficulty
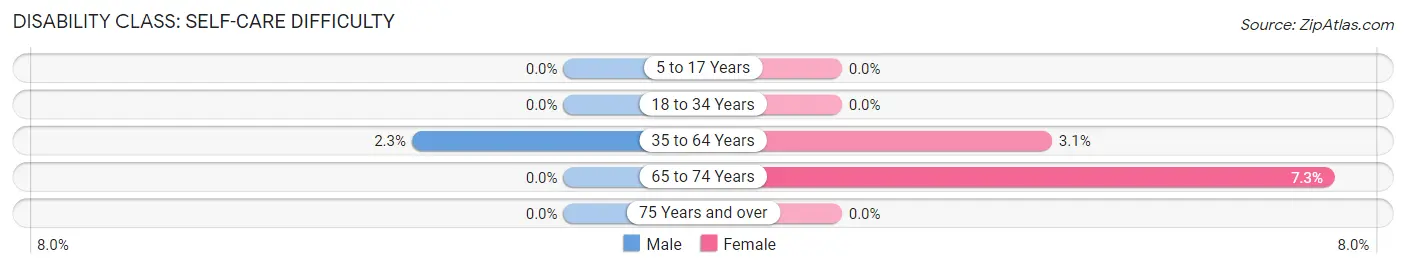
| Age Bracket | Male | Female |
| 5 to 17 Years | 0 (0.0%) | 0 (0.0%) |
| 18 to 34 Years | 0 (0.0%) | 0 (0.0%) |
| 35 to 64 Years | 2 (2.2%) | 2 (3.1%) |
| 65 to 74 Years | 0 (0.0%) | 3 (7.3%) |
| 75 Years and over | 0 (0.0%) | 0 (0.0%) |
Technology Access in Humeston
Computing Device Access in Humeston
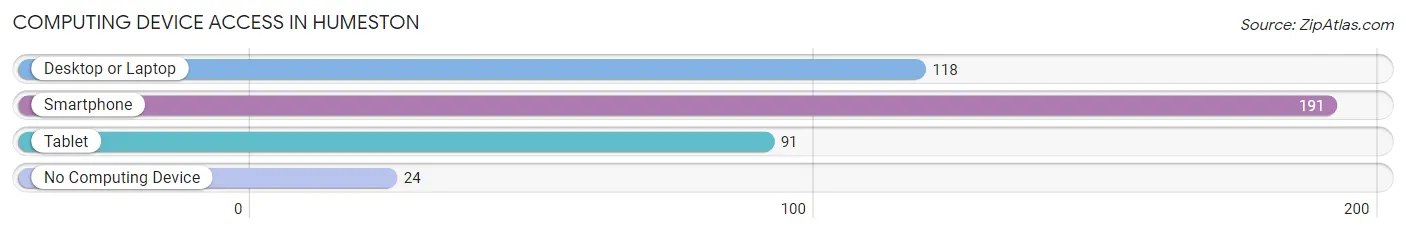
| Device Type | # Households | % Households |
| Desktop or Laptop | 118 | 51.3% |
| Smartphone | 191 | 83.0% |
| Tablet | 91 | 39.6% |
| No Computing Device | 24 | 10.4% |
| Total | 230 | 100.0% |
Internet Access in Humeston
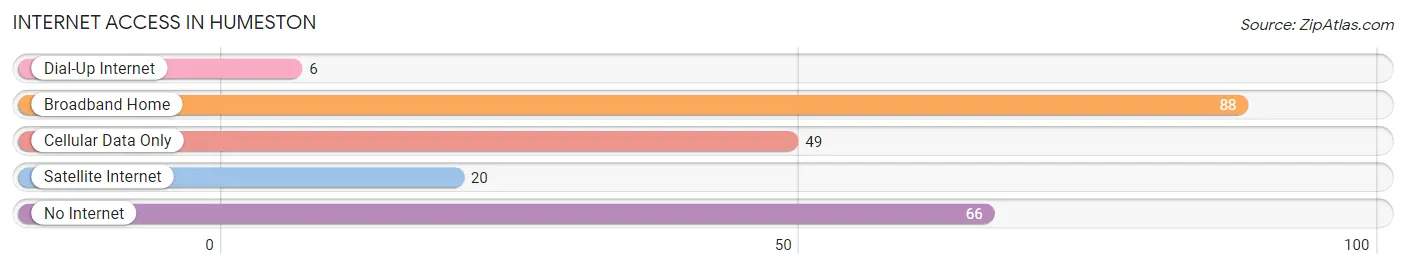
| Internet Type | # Households | % Households |
| Dial-Up Internet | 6 | 2.6% |
| Broadband Home | 88 | 38.3% |
| Cellular Data Only | 49 | 21.3% |
| Satellite Internet | 20 | 8.7% |
| No Internet | 66 | 28.7% |
| Total | 230 | 100.0% |
Humeston Summary
Humeston, Iowa is a small town located in Wayne County, Iowa. It is situated in the south-central part of the state, approximately 50 miles east of Des Moines. The town was founded in 1854 and has a population of approximately 1,000 people.
Humeston is located in the rolling hills of the Des Moines River Valley. The town is surrounded by farmland and is home to a variety of wildlife, including deer, wild turkeys, and pheasants. The town is also home to a variety of birds, including bald eagles, hawks, and owls.
Humeston has a rich history. The town was founded in 1854 by a group of settlers from Ohio. The settlers were attracted to the area due to its fertile soil and abundant wildlife. The town was named after the Humeston family, who were among the first settlers.
Humeston has a strong agricultural economy. The town is home to several large farms, including the Humeston Family Farm, which has been in operation since 1854. The town is also home to several small businesses, including a grocery store, a hardware store, and a restaurant.
The town is served by the Humeston-Wayne Community School District, which includes two elementary schools, a middle school, and a high school. The district also operates a public library and a community center.
Humeston has a diverse population. The town is home to a variety of ethnicities, including African American, Hispanic, and Native American. The town also has a large Amish population.
The town has a variety of recreational activities, including fishing, hunting, and camping. The town also has several parks, including Humeston Park, which features a playground, picnic areas, and a walking trail.
Humeston is a small town with a big heart. The town is home to a variety of friendly people who are proud of their community and its history. The town is a great place to live, work, and raise a family.
Common Questions
What is Per Capita Income in Humeston?
Per Capita income in Humeston is $34,965.
What is the Median Family Income in Humeston?
Median Family Income in Humeston is $55,714.
What is the Median Household income in Humeston?
Median Household Income in Humeston is $48,600.
What is Income or Wage Gap in Humeston?
Income or Wage Gap in Humeston is 29.4%.
Women in Humeston earn 70.6 cents for every dollar earned by a man.
What is Inequality or Gini Index in Humeston?
Inequality or Gini Index in Humeston is 0.51.
What is the Total Population of Humeston?
Total Population of Humeston is 510.
What is the Total Male Population of Humeston?
Total Male Population of Humeston is 255.
What is the Total Female Population of Humeston?
Total Female Population of Humeston is 255.
What is the Ratio of Males per 100 Females in Humeston?
There are 100.00 Males per 100 Females in Humeston.
What is the Ratio of Females per 100 Males in Humeston?
There are 100.00 Females per 100 Males in Humeston.
What is the Median Population Age in Humeston?
Median Population Age in Humeston is 54.6 Years.
What is the Average Family Size in Humeston
Average Family Size in Humeston is 2.8 People.
What is the Average Household Size in Humeston
Average Household Size in Humeston is 2.2 People.
How Large is the Labor Force in Humeston?
There are 223 People in the Labor Forcein in Humeston.
What is the Percentage of People in the Labor Force in Humeston?
56.2% of People are in the Labor Force in Humeston.
What is the Unemployment Rate in Humeston?
Unemployment Rate in Humeston is 2.2%.