Holy Cross, IA Map & Demographics
Holy Cross Map
Holy Cross Overview
$35,099
PER CAPITA INCOME
$96,875
AVG FAMILY INCOME
$72,857
AVG HOUSEHOLD INCOME
41.8%
WAGE / INCOME GAP [ % ]
58.2¢/ $1
WAGE / INCOME GAP [ $ ]
0.38
INEQUALITY / GINI INDEX
288
TOTAL POPULATION
148
MALE POPULATION
140
FEMALE POPULATION
105.71
MALES / 100 FEMALES
94.59
FEMALES / 100 MALES
38.6
MEDIAN AGE
3.1
AVG FAMILY SIZE
2.2
AVG HOUSEHOLD SIZE
167
LABOR FORCE [ PEOPLE ]
72.6%
PERCENT IN LABOR FORCE
1.2%
UNEMPLOYMENT RATE
Holy Cross Zip Codes
Holy Cross Area Codes
Income in Holy Cross
Income Overview in Holy Cross
Per Capita Income in Holy Cross is $35,099, while median incomes of families and households are $96,875 and $72,857 respectively.
| Characteristic | Number | Measure |
| Per Capita Income | 288 | $35,099 |
| Median Family Income | 73 | $96,875 |
| Mean Family Income | 73 | $102,366 |
| Median Household Income | 130 | $72,857 |
| Mean Household Income | 130 | $78,474 |
| Income Deficit | 73 | $0 |
| Wage / Income Gap (%) | 288 | 41.80% |
| Wage / Income Gap ($) | 288 | 58.20¢ per $1 |
| Gini / Inequality Index | 288 | 0.38 |
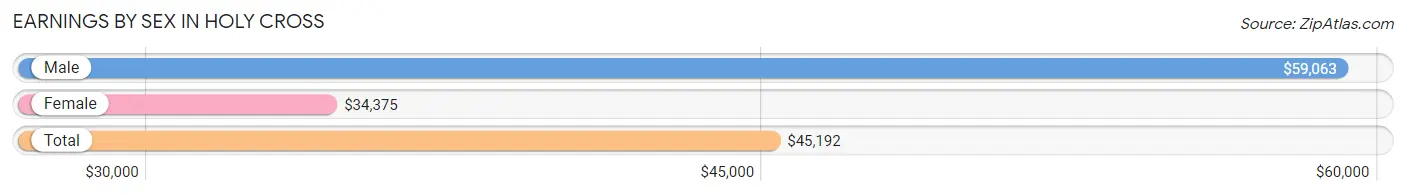
Earnings by Sex in Holy Cross
Average Earnings in Holy Cross are $45,192, $59,063 for men and $34,375 for women, a difference of 41.8%.
| Sex | Number | Average Earnings |
| Male | 99 (57.6%) | $59,063 |
| Female | 73 (42.4%) | $34,375 |
| Total | 172 (100.0%) | $45,192 |
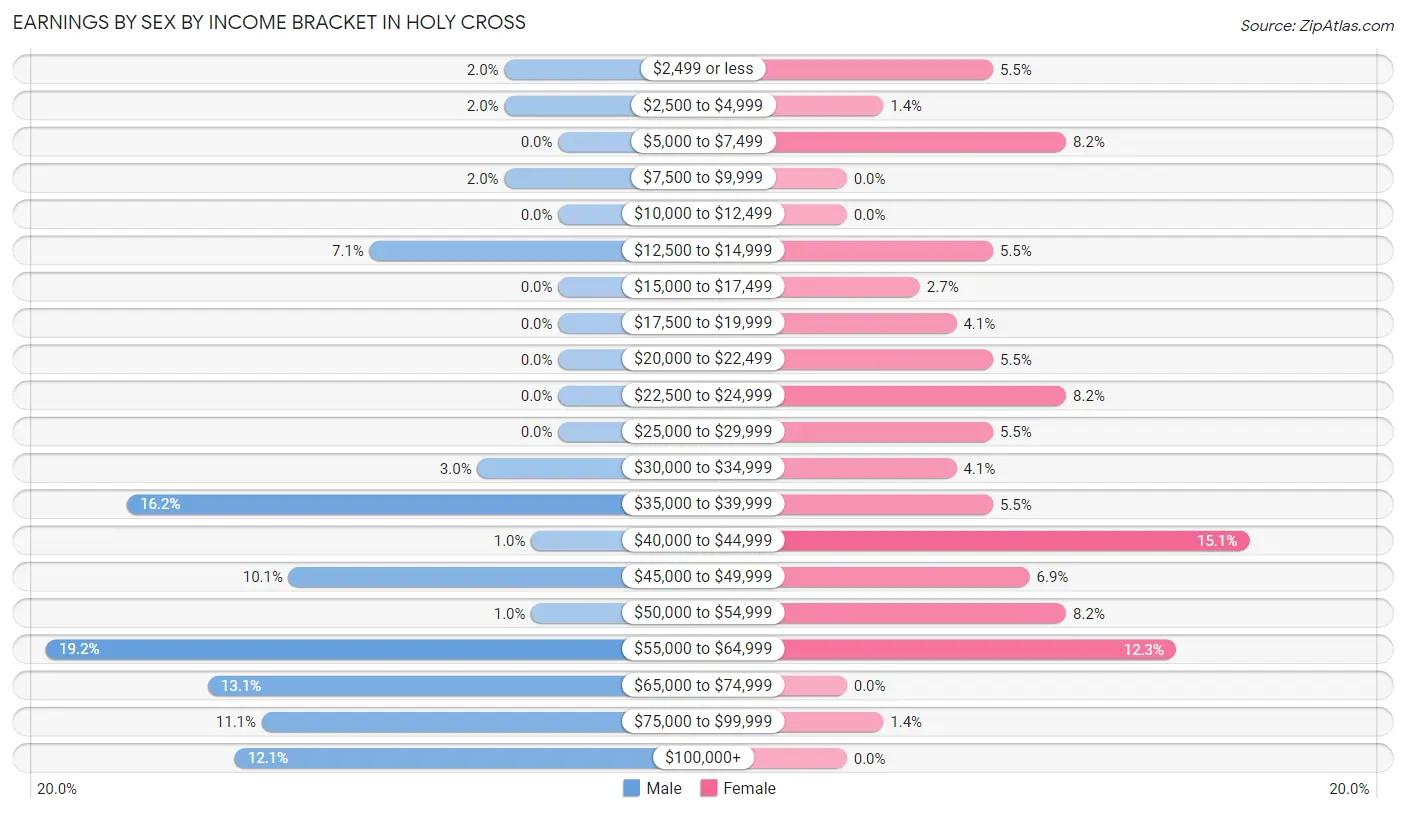
Earnings by Sex by Income Bracket in Holy Cross
The most common earnings brackets in Holy Cross are $55,000 to $64,999 for men (19 | 19.2%) and $40,000 to $44,999 for women (11 | 15.1%).
| Income | Male | Female |
| $2,499 or less | 2 (2.0%) | 4 (5.5%) |
| $2,500 to $4,999 | 2 (2.0%) | 1 (1.4%) |
| $5,000 to $7,499 | 0 (0.0%) | 6 (8.2%) |
| $7,500 to $9,999 | 2 (2.0%) | 0 (0.0%) |
| $10,000 to $12,499 | 0 (0.0%) | 0 (0.0%) |
| $12,500 to $14,999 | 7 (7.1%) | 4 (5.5%) |
| $15,000 to $17,499 | 0 (0.0%) | 2 (2.7%) |
| $17,500 to $19,999 | 0 (0.0%) | 3 (4.1%) |
| $20,000 to $22,499 | 0 (0.0%) | 4 (5.5%) |
| $22,500 to $24,999 | 0 (0.0%) | 6 (8.2%) |
| $25,000 to $29,999 | 0 (0.0%) | 4 (5.5%) |
| $30,000 to $34,999 | 3 (3.0%) | 3 (4.1%) |
| $35,000 to $39,999 | 16 (16.2%) | 4 (5.5%) |
| $40,000 to $44,999 | 1 (1.0%) | 11 (15.1%) |
| $45,000 to $49,999 | 10 (10.1%) | 5 (6.9%) |
| $50,000 to $54,999 | 1 (1.0%) | 6 (8.2%) |
| $55,000 to $64,999 | 19 (19.2%) | 9 (12.3%) |
| $65,000 to $74,999 | 13 (13.1%) | 0 (0.0%) |
| $75,000 to $99,999 | 11 (11.1%) | 1 (1.4%) |
| $100,000+ | 12 (12.1%) | 0 (0.0%) |
| Total | 99 (100.0%) | 73 (100.0%) |
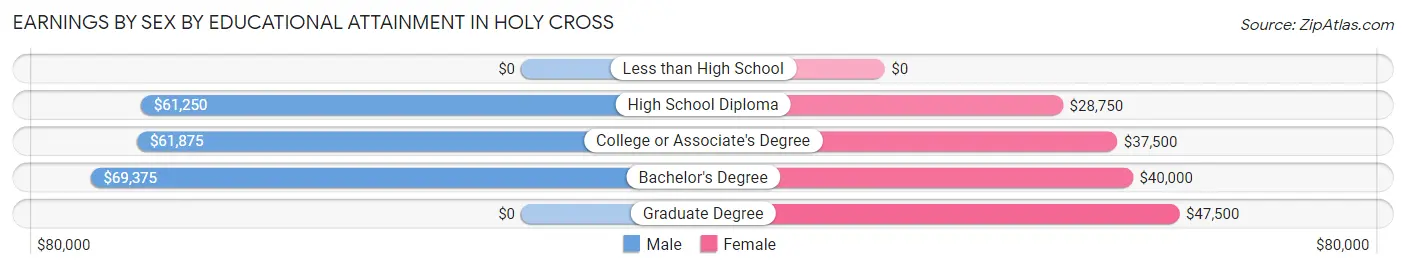
Earnings by Sex by Educational Attainment in Holy Cross
Average earnings in Holy Cross are $60,938 for men and $40,000 for women, a difference of 34.4%. Men with an educational attainment of bachelor's degree enjoy the highest average annual earnings of $69,375, while those with high school diploma education earn the least with $61,250. Women with an educational attainment of graduate degree earn the most with the average annual earnings of $47,500, while those with high school diploma education have the smallest earnings of $28,750.
| Educational Attainment | Male Income | Female Income |
| Less than High School | - | - |
| High School Diploma | $61,250 | $28,750 |
| College or Associate's Degree | $61,875 | $37,500 |
| Bachelor's Degree | $69,375 | $40,000 |
| Graduate Degree | - | - |
| Total | $60,938 | $40,000 |
Family Income in Holy Cross
Family Income Brackets in Holy Cross
According to the Holy Cross family income data, there are 25 families falling into the $100,000 to $149,999 income range, which is the most common income bracket and makes up 34.3% of all families.
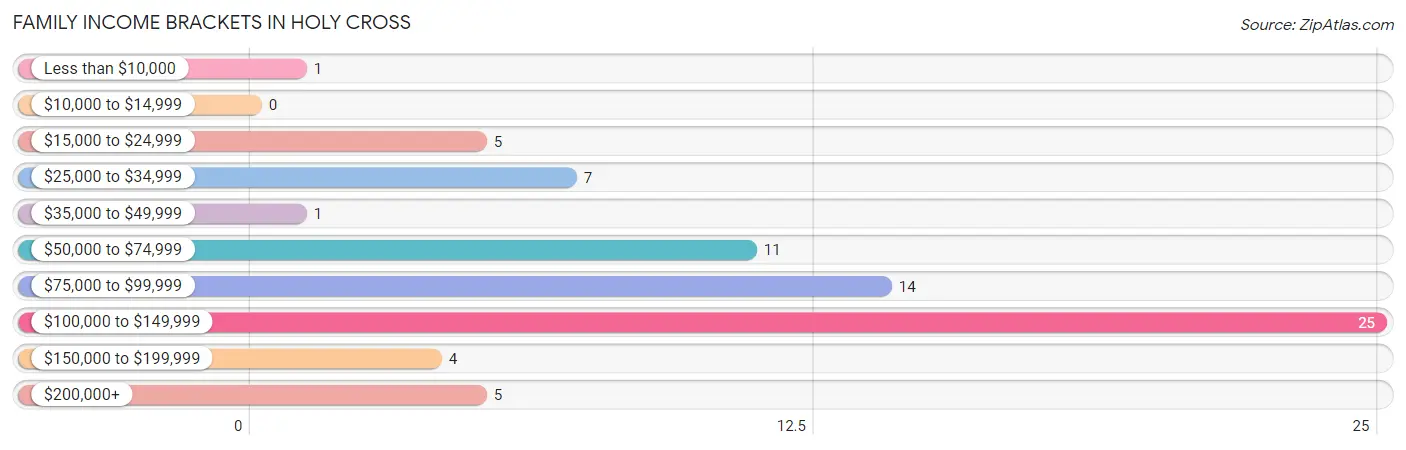
| Income Bracket | # Families | % Families |
| Less than $10,000 | 1 | 1.4% |
| $10,000 to $14,999 | 0 | 0.0% |
| $15,000 to $24,999 | 5 | 6.8% |
| $25,000 to $34,999 | 7 | 9.6% |
| $35,000 to $49,999 | 1 | 1.4% |
| $50,000 to $74,999 | 11 | 15.1% |
| $75,000 to $99,999 | 14 | 19.2% |
| $100,000 to $149,999 | 25 | 34.2% |
| $150,000 to $199,999 | 4 | 5.5% |
| $200,000+ | 5 | 6.8% |
Family Income by Famaliy Size in Holy Cross
3-person families (19 | 26.0%) account for the highest median family income in Holy Cross with $121,250 per family, while 3-person families (19 | 26.0%) have the highest median income of $40,417 per family member.
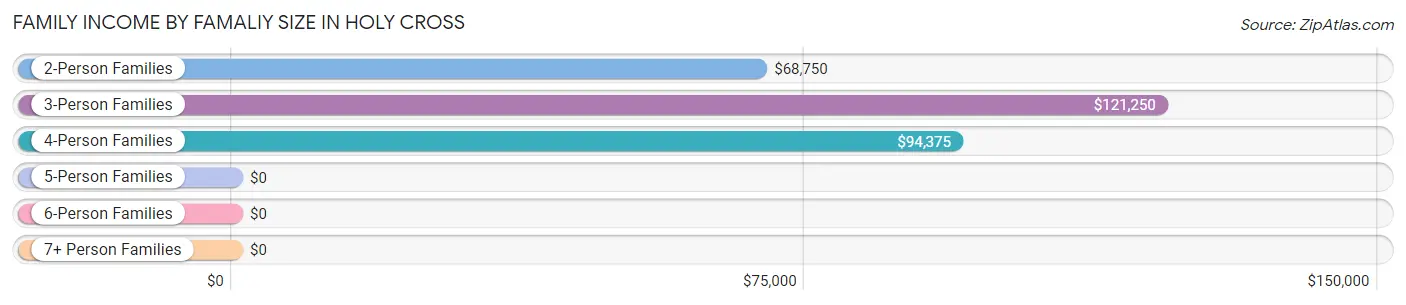
| Income Bracket | # Families | Median Income |
| 2-Person Families | 30 (41.1%) | $68,750 |
| 3-Person Families | 19 (26.0%) | $121,250 |
| 4-Person Families | 17 (23.3%) | $94,375 |
| 5-Person Families | 0 (0.0%) | $0 |
| 6-Person Families | 4 (5.5%) | $0 |
| 7+ Person Families | 3 (4.1%) | $0 |
| Total | 73 (100.0%) | $96,875 |
Family Income by Number of Earners in Holy Cross
The median family income in Holy Cross is $96,875, with families comprising 3+ earners (9) having the highest median family income of $143,750, while families with no earners (15) have the lowest median family income of $29,375, accounting for 12.3% and 20.5% of families, respectively.
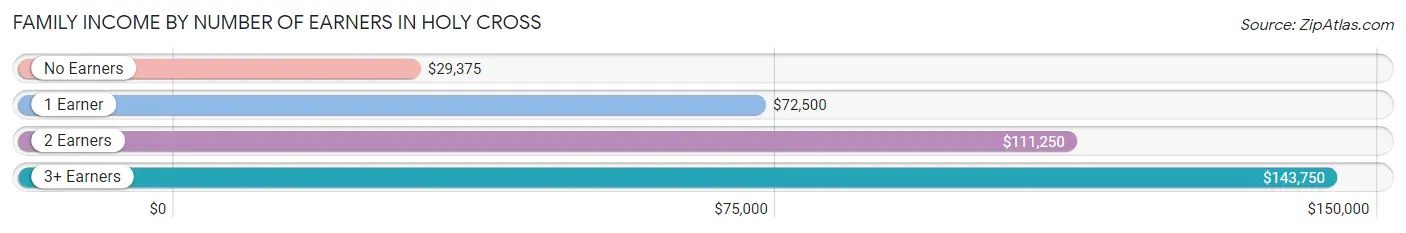
| Number of Earners | # Families | Median Income |
| No Earners | 15 (20.5%) | $29,375 |
| 1 Earner | 8 (11.0%) | $72,500 |
| 2 Earners | 41 (56.2%) | $111,250 |
| 3+ Earners | 9 (12.3%) | $143,750 |
| Total | 73 (100.0%) | $96,875 |
Household Income in Holy Cross
Household Income Brackets in Holy Cross
With 30 households falling in the category, the $35,000 to $49,999 income range is the most frequent in Holy Cross, accounting for 23.1% of all households. In contrast, only 1 households (0.8%) fall into the $10,000 to $14,999 income bracket, making it the least populous group.
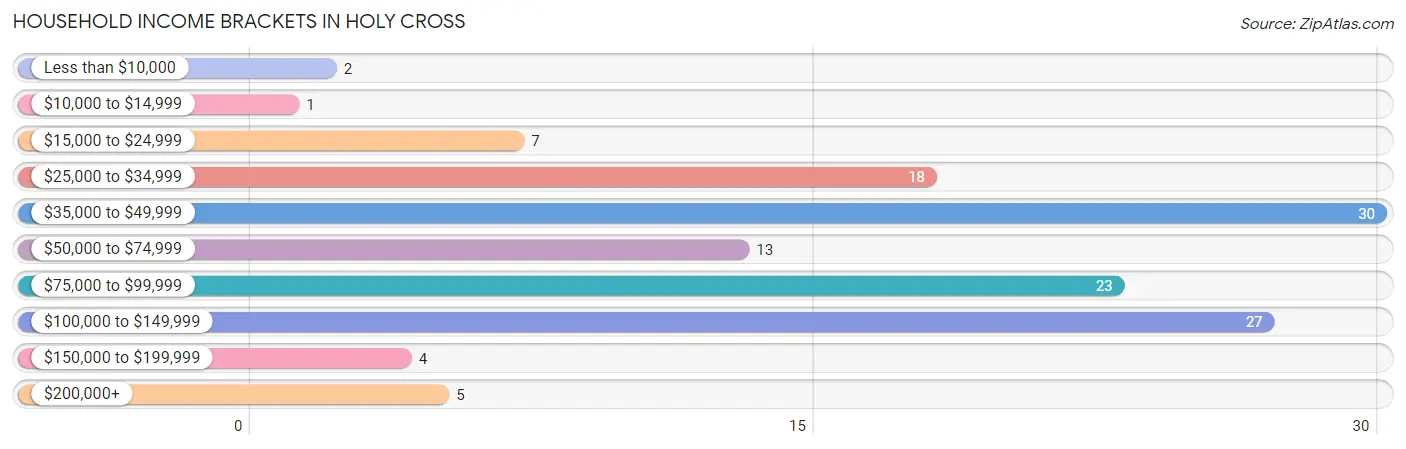
| Income Bracket | # Households | % Households |
| Less than $10,000 | 2 | 1.5% |
| $10,000 to $14,999 | 1 | 0.8% |
| $15,000 to $24,999 | 7 | 5.4% |
| $25,000 to $34,999 | 18 | 13.8% |
| $35,000 to $49,999 | 30 | 23.1% |
| $50,000 to $74,999 | 13 | 10.0% |
| $75,000 to $99,999 | 23 | 17.7% |
| $100,000 to $149,999 | 27 | 20.8% |
| $150,000 to $199,999 | 4 | 3.1% |
| $200,000+ | 5 | 3.8% |
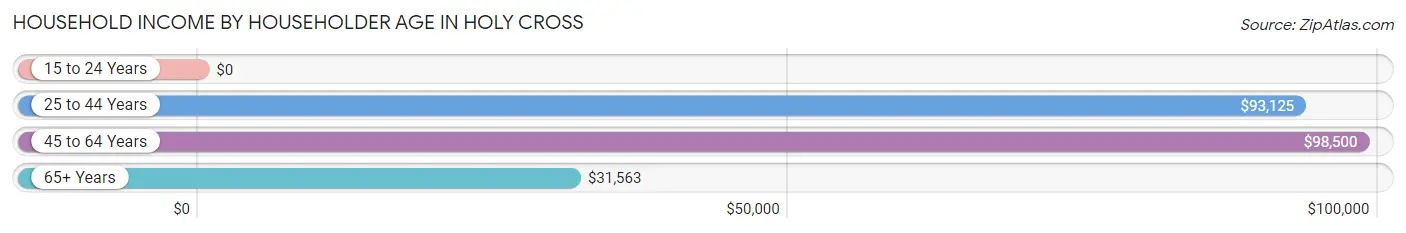
Household Income by Householder Age in Holy Cross
The median household income in Holy Cross is $72,857, with the highest median household income of $98,500 found in the 45 to 64 years age bracket for the primary householder. A total of 34 households (26.2%) fall into this category. Meanwhile, the 15 to 24 years age bracket for the primary householder has the lowest median household income of $0, with 2 households (1.5%) in this group.
| Income Bracket | # Households | Median Income |
| 15 to 24 Years | 2 (1.5%) | $0 |
| 25 to 44 Years | 47 (36.1%) | $93,125 |
| 45 to 64 Years | 34 (26.2%) | $98,500 |
| 65+ Years | 47 (36.1%) | $31,563 |
| Total | 130 (100.0%) | $72,857 |
Poverty in Holy Cross
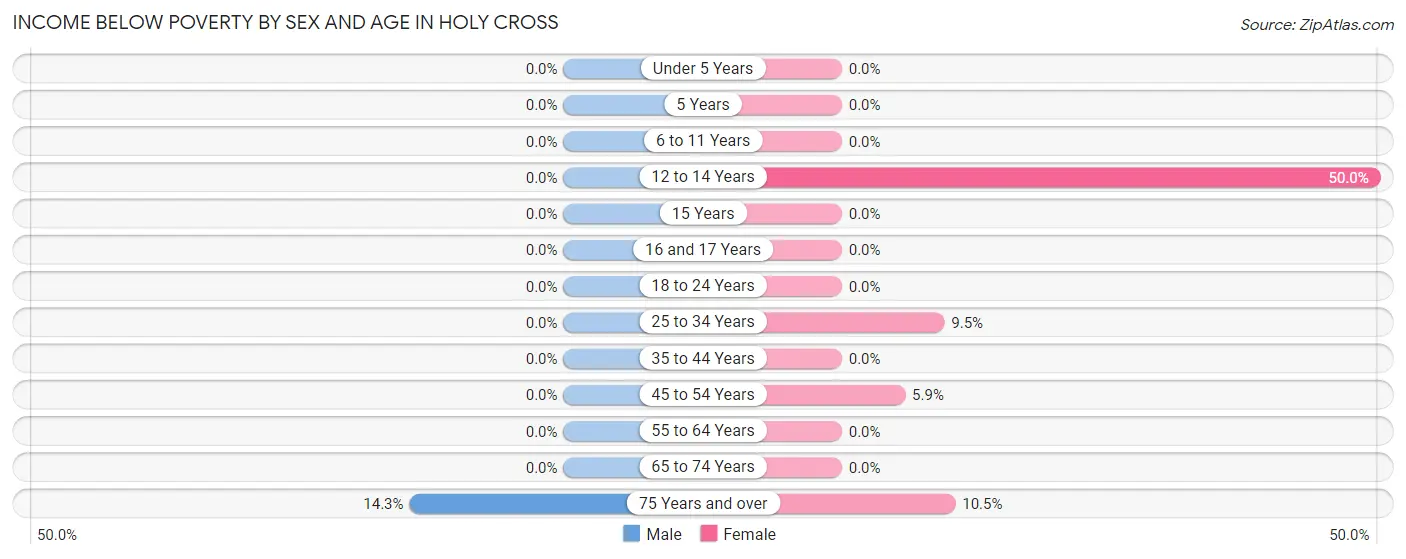
Income Below Poverty by Sex and Age in Holy Cross
With 1.3% poverty level for males and 4.3% for females among the residents of Holy Cross, 75 year old and over males and 12 to 14 year old females are the most vulnerable to poverty, with 2 males (14.3%) and 1 females (50.0%) in their respective age groups living below the poverty level.
| Age Bracket | Male | Female |
| Under 5 Years | 0 (0.0%) | 0 (0.0%) |
| 5 Years | 0 (0.0%) | 0 (0.0%) |
| 6 to 11 Years | 0 (0.0%) | 0 (0.0%) |
| 12 to 14 Years | 0 (0.0%) | 1 (50.0%) |
| 15 Years | 0 (0.0%) | 0 (0.0%) |
| 16 and 17 Years | 0 (0.0%) | 0 (0.0%) |
| 18 to 24 Years | 0 (0.0%) | 0 (0.0%) |
| 25 to 34 Years | 0 (0.0%) | 2 (9.5%) |
| 35 to 44 Years | 0 (0.0%) | 0 (0.0%) |
| 45 to 54 Years | 0 (0.0%) | 1 (5.9%) |
| 55 to 64 Years | 0 (0.0%) | 0 (0.0%) |
| 65 to 74 Years | 0 (0.0%) | 0 (0.0%) |
| 75 Years and over | 2 (14.3%) | 2 (10.5%) |
| Total | 2 (1.3%) | 6 (4.3%) |
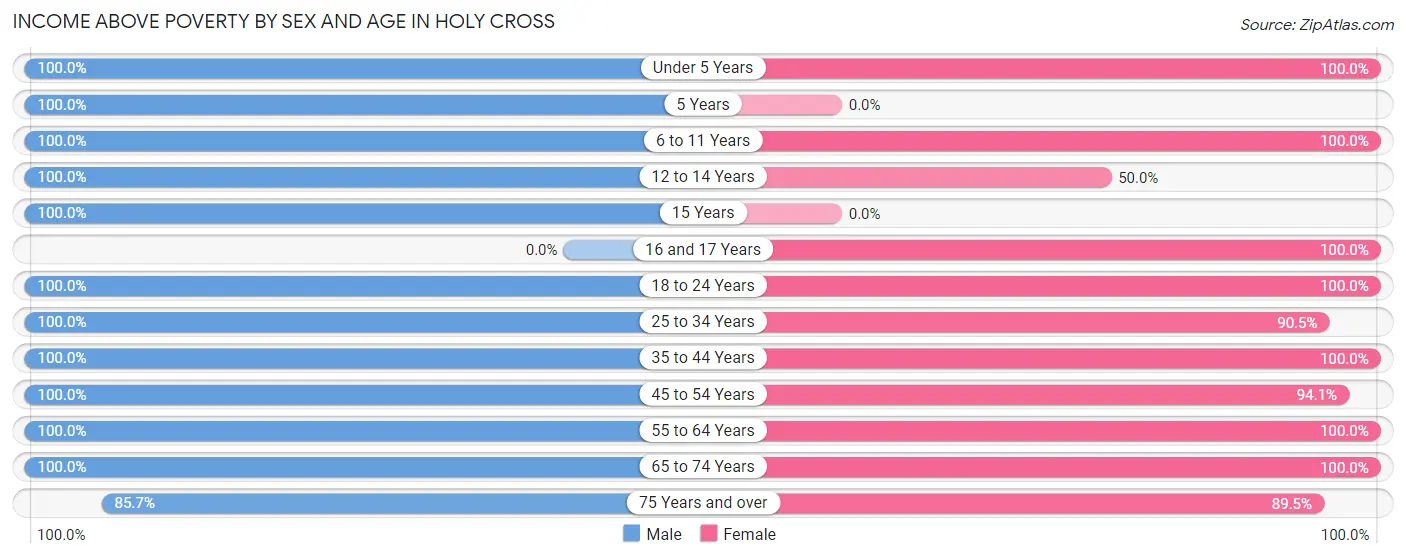
Income Above Poverty by Sex and Age in Holy Cross
According to the poverty statistics in Holy Cross, males aged under 5 years and females aged under 5 years are the age groups that are most secure financially, with 100.0% of males and 100.0% of females in these age groups living above the poverty line.
| Age Bracket | Male | Female |
| Under 5 Years | 11 (100.0%) | 13 (100.0%) |
| 5 Years | 3 (100.0%) | 0 (0.0%) |
| 6 to 11 Years | 9 (100.0%) | 15 (100.0%) |
| 12 to 14 Years | 3 (100.0%) | 1 (50.0%) |
| 15 Years | 2 (100.0%) | 0 (0.0%) |
| 16 and 17 Years | 0 (0.0%) | 1 (100.0%) |
| 18 to 24 Years | 8 (100.0%) | 10 (100.0%) |
| 25 to 34 Years | 30 (100.0%) | 19 (90.5%) |
| 35 to 44 Years | 19 (100.0%) | 15 (100.0%) |
| 45 to 54 Years | 18 (100.0%) | 16 (94.1%) |
| 55 to 64 Years | 13 (100.0%) | 9 (100.0%) |
| 65 to 74 Years | 18 (100.0%) | 18 (100.0%) |
| 75 Years and over | 12 (85.7%) | 17 (89.5%) |
| Total | 146 (98.7%) | 134 (95.7%) |
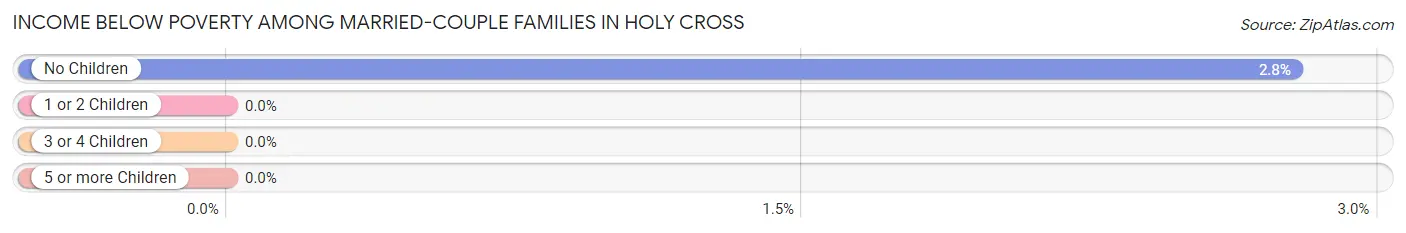
Income Below Poverty Among Married-Couple Families in Holy Cross
The poverty statistics for married-couple families in Holy Cross show that 1.4% or 1 of the total 70 families live below the poverty line. Families with no children have the highest poverty rate of 2.8%, comprising of 1 families. On the other hand, families with 1 or 2 children have the lowest poverty rate of 0.0%, which includes 0 families.
| Children | Above Poverty | Below Poverty |
| No Children | 35 (97.2%) | 1 (2.8%) |
| 1 or 2 Children | 29 (100.0%) | 0 (0.0%) |
| 3 or 4 Children | 5 (100.0%) | 0 (0.0%) |
| 5 or more Children | 0 (0.0%) | 0 (0.0%) |
| Total | 69 (98.6%) | 1 (1.4%) |
Income Below Poverty Among Single-Parent Households in Holy Cross
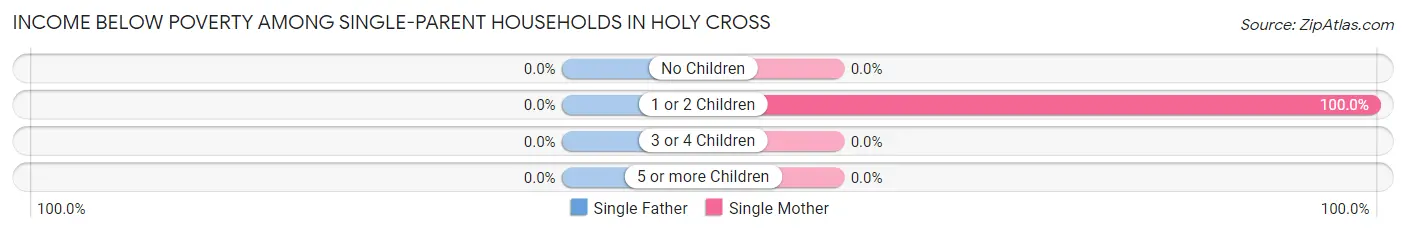
| Children | Single Father | Single Mother |
| No Children | 0 (0.0%) | 0 (0.0%) |
| 1 or 2 Children | 0 (0.0%) | 1 (100.0%) |
| 3 or 4 Children | 0 (0.0%) | 0 (0.0%) |
| 5 or more Children | 0 (0.0%) | 0 (0.0%) |
| Total | 0 (0.0%) | 1 (33.3%) |
Income Below Poverty Among Married-Couple vs Single-Parent Households in Holy Cross
The poverty data for Holy Cross shows that 1 of the married-couple family households (1.4%) and 1 of the single-parent households (33.3%) are living below the poverty level. Within the married-couple family households, those with no children have the highest poverty rate, with 1 households (2.8%) falling below the poverty line. Among the single-parent households, those with 1 or 2 children have the highest poverty rate, with 1 household (100.0%) living below poverty.
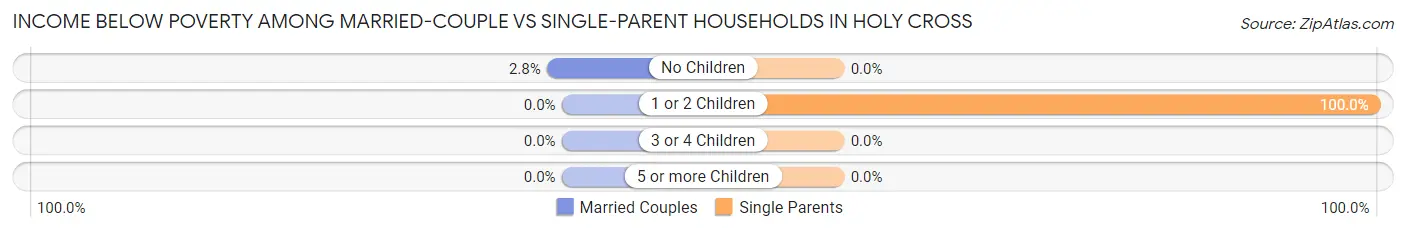
| Children | Married-Couple Families | Single-Parent Households |
| No Children | 1 (2.8%) | 0 (0.0%) |
| 1 or 2 Children | 0 (0.0%) | 1 (100.0%) |
| 3 or 4 Children | 0 (0.0%) | 0 (0.0%) |
| 5 or more Children | 0 (0.0%) | 0 (0.0%) |
| Total | 1 (1.4%) | 1 (33.3%) |
Race in Holy Cross
The most populous races in Holy Cross are White / Caucasian (270 | 93.8%), Hispanic or Latino (14 | 4.9%), and Some other Race (10 | 3.5%).
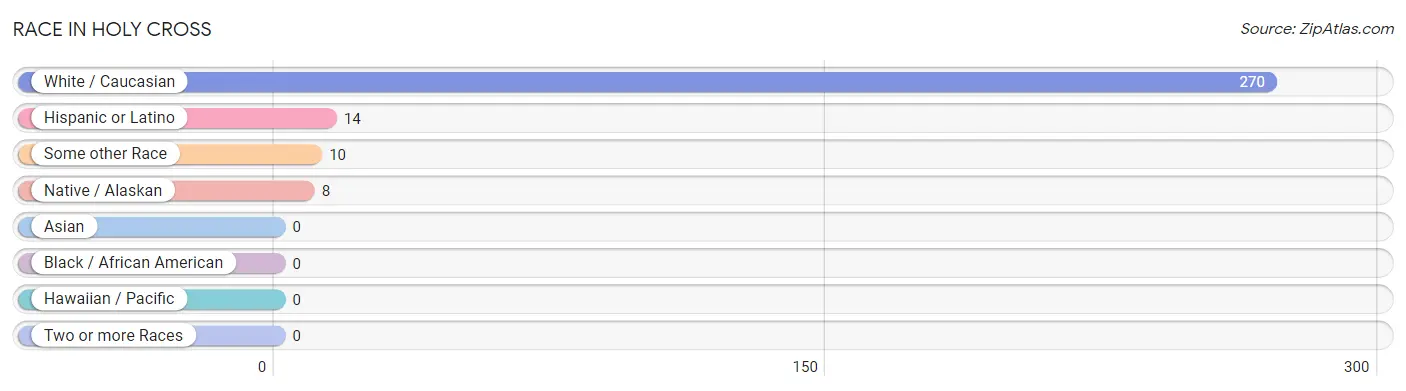
| Race | # Population | % Population |
| Asian | 0 | 0.0% |
| Black / African American | 0 | 0.0% |
| Hawaiian / Pacific | 0 | 0.0% |
| Hispanic or Latino | 14 | 4.9% |
| Native / Alaskan | 8 | 2.8% |
| White / Caucasian | 270 | 93.8% |
| Two or more Races | 0 | 0.0% |
| Some other Race | 10 | 3.5% |
| Total | 288 | 100.0% |
Ancestry in Holy Cross
The most populous ancestries reported in Holy Cross are German (151 | 52.4%), Irish (35 | 12.1%), American (24 | 8.3%), Norwegian (10 | 3.5%), and Central American Indian (8 | 2.8%), together accounting for 79.2% of all Holy Cross residents.
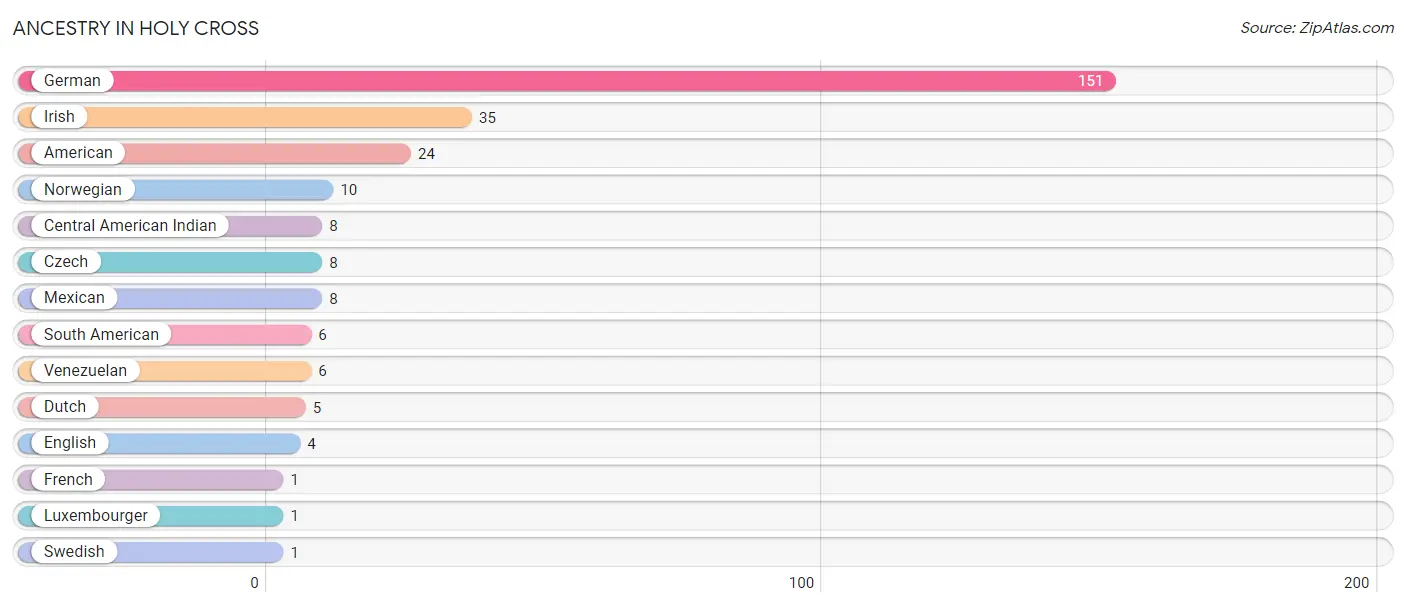
| Ancestry | # Population | % Population |
| American | 24 | 8.3% |
| Central American Indian | 8 | 2.8% |
| Czech | 8 | 2.8% |
| Dutch | 5 | 1.7% |
| English | 4 | 1.4% |
| French | 1 | 0.4% |
| German | 151 | 52.4% |
| Irish | 35 | 12.1% |
| Luxembourger | 1 | 0.4% |
| Mexican | 8 | 2.8% |
| Norwegian | 10 | 3.5% |
| South American | 6 | 2.1% |
| Swedish | 1 | 0.4% |
| Venezuelan | 6 | 2.1% | View All 14 Rows |
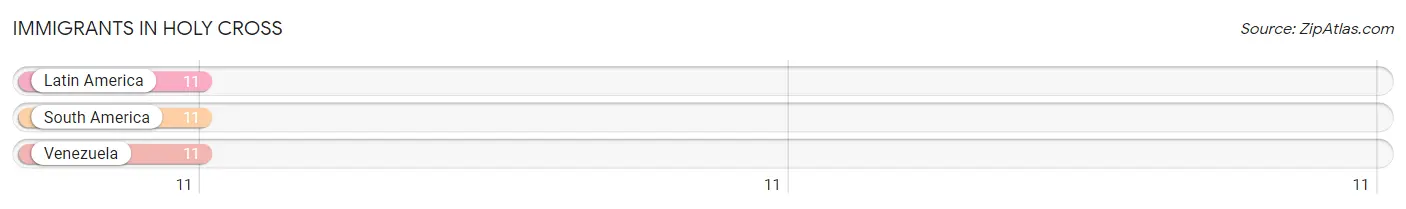
Immigrants in Holy Cross
The most numerous immigrant groups reported in Holy Cross came from Latin America (11 | 3.8%), South America (11 | 3.8%), and Venezuela (11 | 3.8%), together accounting for 11.5% of all Holy Cross residents.
| Immigration Origin | # Population | % Population |
| Latin America | 11 | 3.8% |
| South America | 11 | 3.8% |
| Venezuela | 11 | 3.8% | View All 3 Rows |
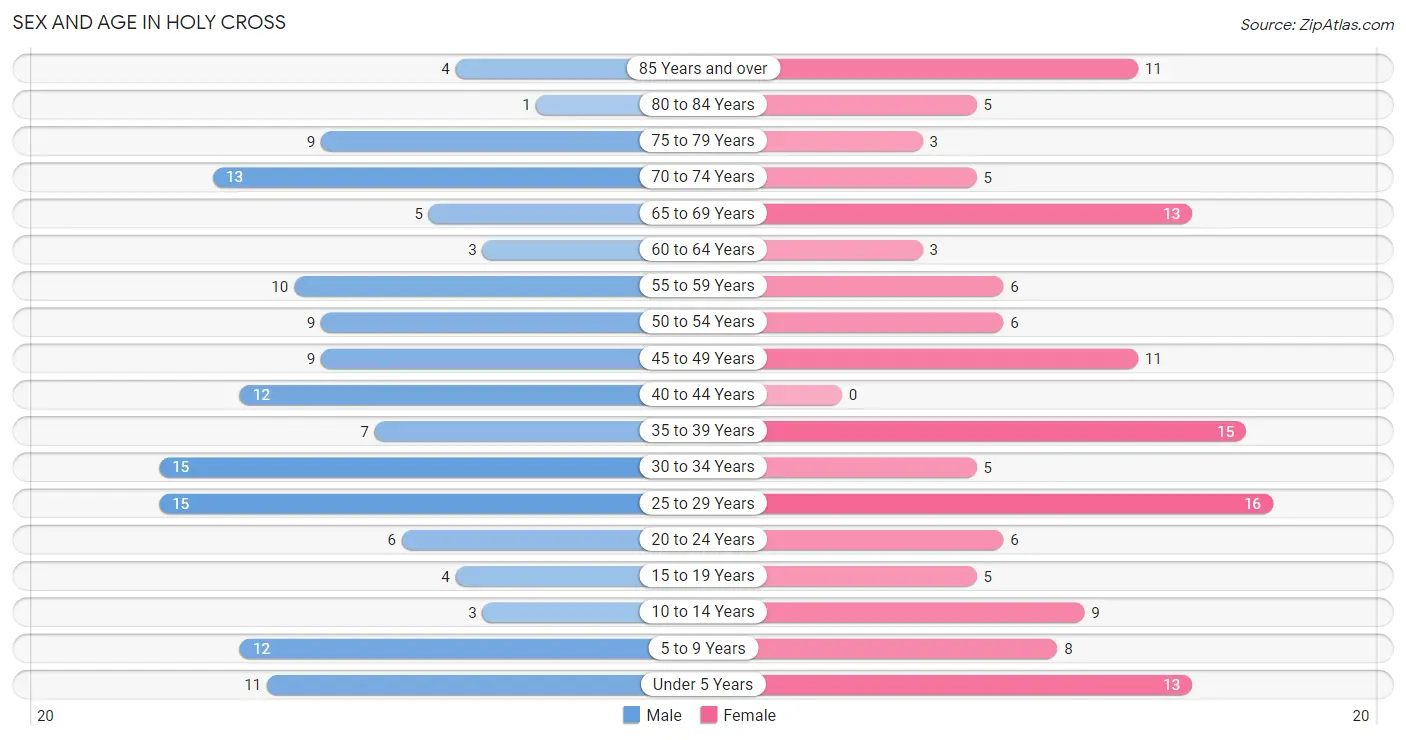
Sex and Age in Holy Cross
Sex and Age in Holy Cross
The most populous age groups in Holy Cross are 25 to 29 Years (15 | 10.1%) for men and 25 to 29 Years (16 | 11.4%) for women.
| Age Bracket | Male | Female |
| Under 5 Years | 11 (7.4%) | 13 (9.3%) |
| 5 to 9 Years | 12 (8.1%) | 8 (5.7%) |
| 10 to 14 Years | 3 (2.0%) | 9 (6.4%) |
| 15 to 19 Years | 4 (2.7%) | 5 (3.6%) |
| 20 to 24 Years | 6 (4.1%) | 6 (4.3%) |
| 25 to 29 Years | 15 (10.1%) | 16 (11.4%) |
| 30 to 34 Years | 15 (10.1%) | 5 (3.6%) |
| 35 to 39 Years | 7 (4.7%) | 15 (10.7%) |
| 40 to 44 Years | 12 (8.1%) | 0 (0.0%) |
| 45 to 49 Years | 9 (6.1%) | 11 (7.9%) |
| 50 to 54 Years | 9 (6.1%) | 6 (4.3%) |
| 55 to 59 Years | 10 (6.8%) | 6 (4.3%) |
| 60 to 64 Years | 3 (2.0%) | 3 (2.1%) |
| 65 to 69 Years | 5 (3.4%) | 13 (9.3%) |
| 70 to 74 Years | 13 (8.8%) | 5 (3.6%) |
| 75 to 79 Years | 9 (6.1%) | 3 (2.1%) |
| 80 to 84 Years | 1 (0.7%) | 5 (3.6%) |
| 85 Years and over | 4 (2.7%) | 11 (7.9%) |
| Total | 148 (100.0%) | 140 (100.0%) |
Families and Households in Holy Cross
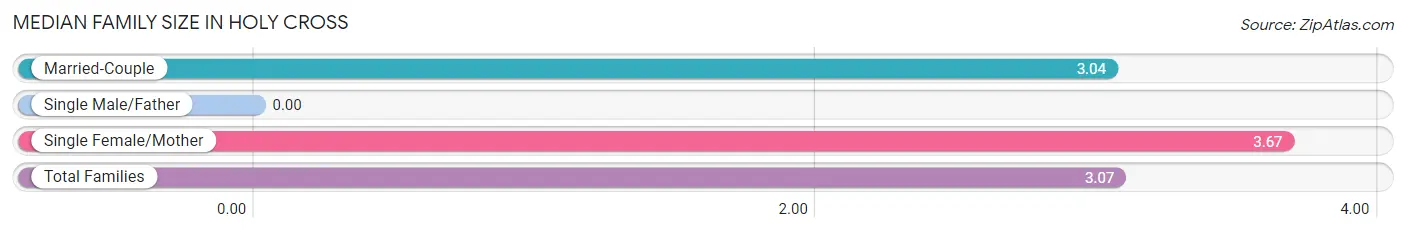
Median Family Size in Holy Cross
| Family Type | # Families | Family Size |
| Married-Couple | 70 (95.9%) | 3.04 |
| Single Male/Father | 0 (0.0%) | - |
| Single Female/Mother | 3 (4.1%) | 3.67 |
| Total Families | 73 (100.0%) | 3.07 |
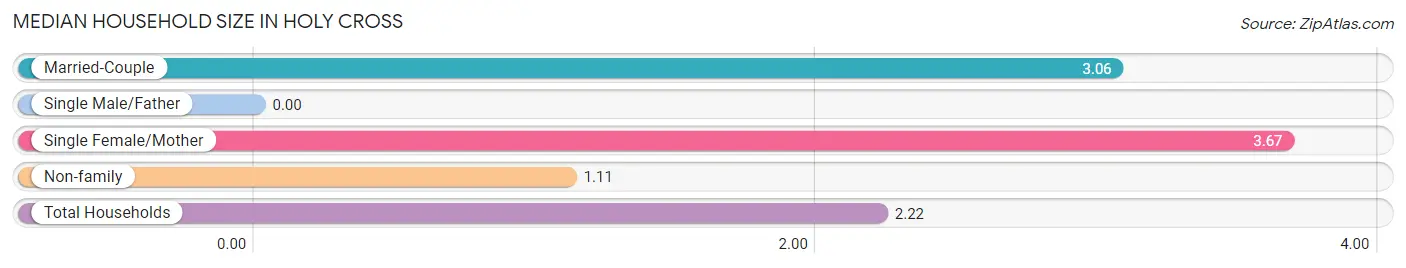
Median Household Size in Holy Cross
| Household Type | # Households | Household Size |
| Married-Couple | 70 (53.8%) | 3.06 |
| Single Male/Father | 0 (0.0%) | - |
| Single Female/Mother | 3 (2.3%) | 3.67 |
| Non-family | 57 (43.9%) | 1.11 |
| Total Households | 130 (100.0%) | 2.22 |
Household Size by Marriage Status in Holy Cross
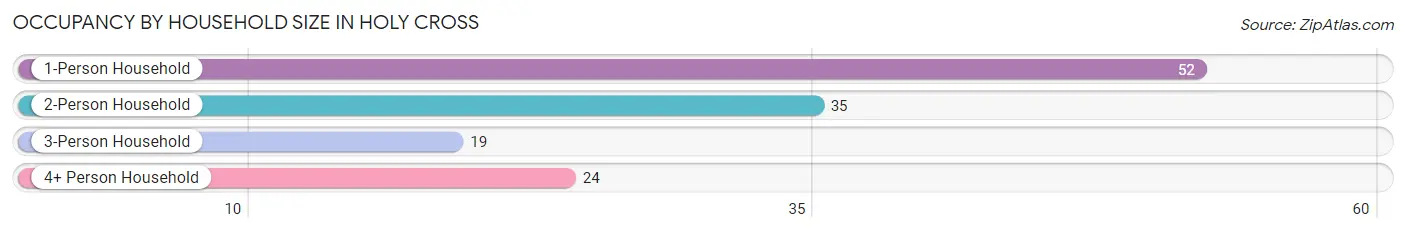
Out of a total of 130 households in Holy Cross, 73 (56.1%) are family households, while 57 (43.9%) are nonfamily households. The most numerous type of family households are 2-person households, comprising 30, and the most common type of nonfamily households are 1-person households, comprising 52.
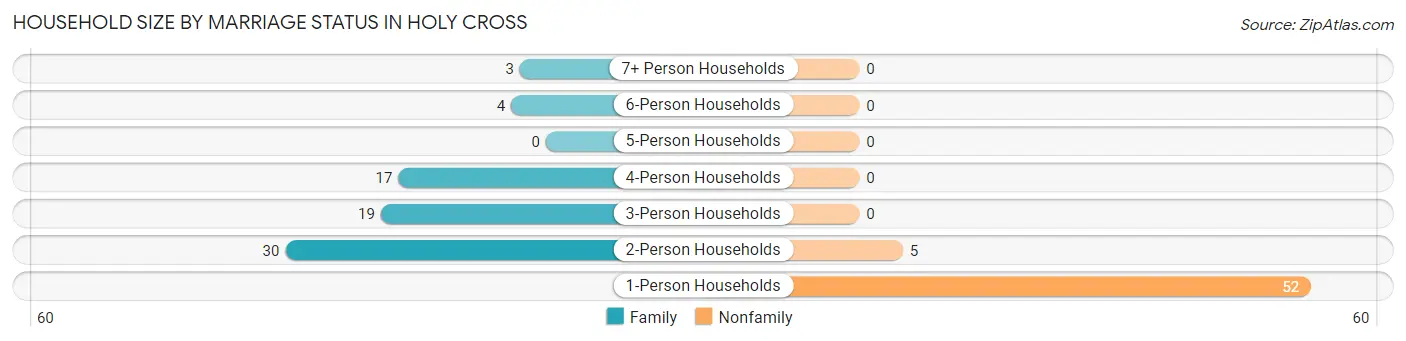
| Household Size | Family Households | Nonfamily Households |
| 1-Person Households | - | 52 (40.0%) |
| 2-Person Households | 30 (23.1%) | 5 (3.8%) |
| 3-Person Households | 19 (14.6%) | 0 (0.0%) |
| 4-Person Households | 17 (13.1%) | 0 (0.0%) |
| 5-Person Households | 0 (0.0%) | 0 (0.0%) |
| 6-Person Households | 4 (3.1%) | 0 (0.0%) |
| 7+ Person Households | 3 (2.3%) | 0 (0.0%) |
| Total | 73 (56.1%) | 57 (43.9%) |
Female Fertility in Holy Cross
Fertility by Age in Holy Cross
Average fertility rate in Holy Cross is 86.0 births per 1,000 women. Women in the age bracket of 20 to 34 years have the highest fertility rate with 185.0 births per 1,000 women. Women in the age bracket of 20 to 34 years acount for 100.0% of all women with births.
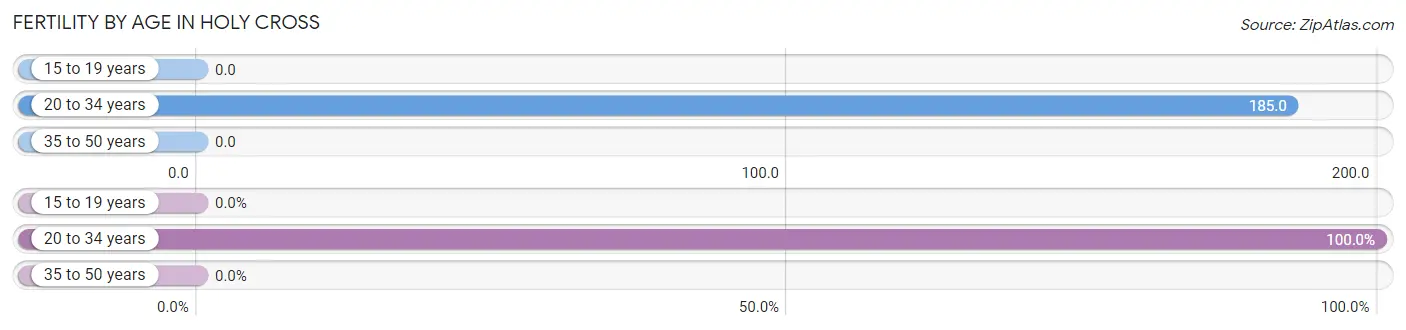
| Age Bracket | Women with Births | Births / 1,000 Women |
| 15 to 19 years | 0 (0.0%) | 0.0 |
| 20 to 34 years | 5 (100.0%) | 185.0 |
| 35 to 50 years | 0 (0.0%) | 0.0 |
| Total | 5 (100.0%) | 86.0 |
Fertility by Age by Marriage Status in Holy Cross
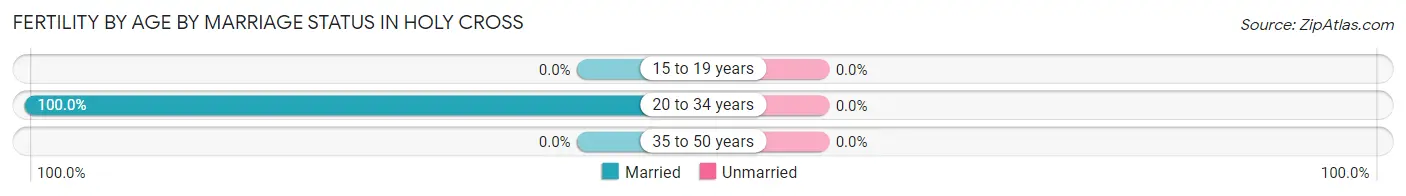
| Age Bracket | Married | Unmarried |
| 15 to 19 years | 0 (0.0%) | 0 (0.0%) |
| 20 to 34 years | 5 (100.0%) | 0 (0.0%) |
| 35 to 50 years | 0 (0.0%) | 0 (0.0%) |
| Total | 5 (100.0%) | 0 (0.0%) |
Fertility by Education in Holy Cross
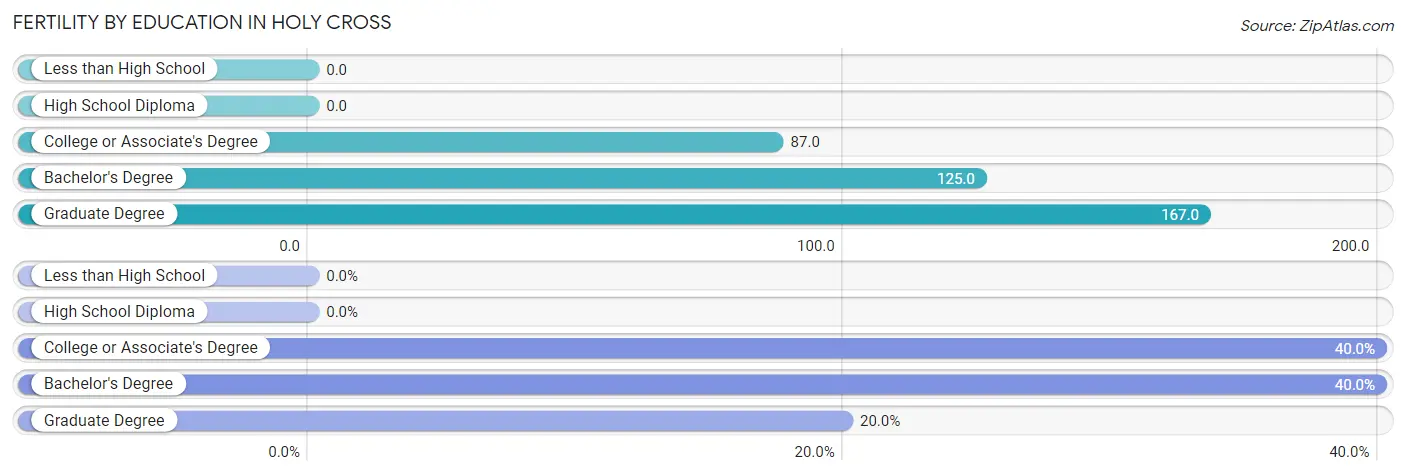
| Educational Attainment | Women with Births | Births / 1,000 Women |
| Less than High School | 0 (0.0%) | 0.0 |
| High School Diploma | 0 (0.0%) | 0.0 |
| College or Associate's Degree | 2 (40.0%) | 87.0 |
| Bachelor's Degree | 2 (40.0%) | 125.0 |
| Graduate Degree | 1 (20.0%) | 167.0 |
| Total | 5 (100.0%) | 86.0 |
Fertility by Education by Marriage Status in Holy Cross
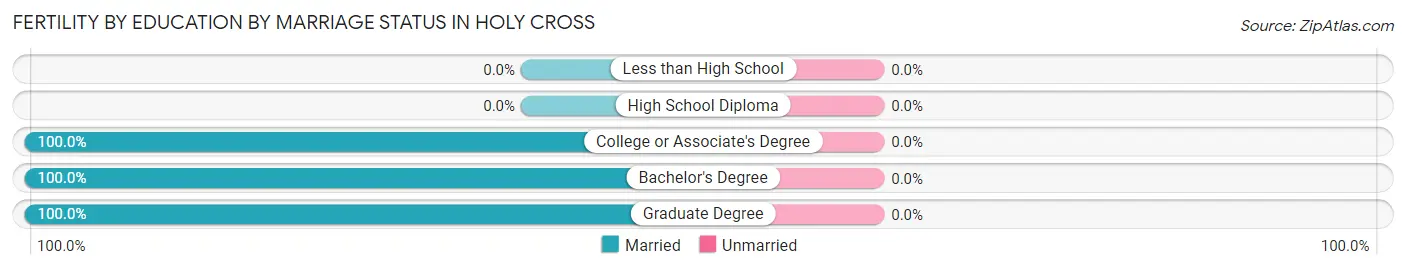
| Educational Attainment | Married | Unmarried |
| Less than High School | 0 (0.0%) | 0 (0.0%) |
| High School Diploma | 0 (0.0%) | 0 (0.0%) |
| College or Associate's Degree | 2 (100.0%) | 0 (0.0%) |
| Bachelor's Degree | 2 (100.0%) | 0 (0.0%) |
| Graduate Degree | 1 (100.0%) | 0 (0.0%) |
| Total | 5 (100.0%) | 0 (0.0%) |
Employment Characteristics in Holy Cross
Employment by Class of Employer in Holy Cross
Among the 164 employed individuals in Holy Cross, private company employees (102 | 62.2%), self-employed (not incorporated) (23 | 14.0%), and not-for-profit organizations (12 | 7.3%) make up the most common classes of employment.
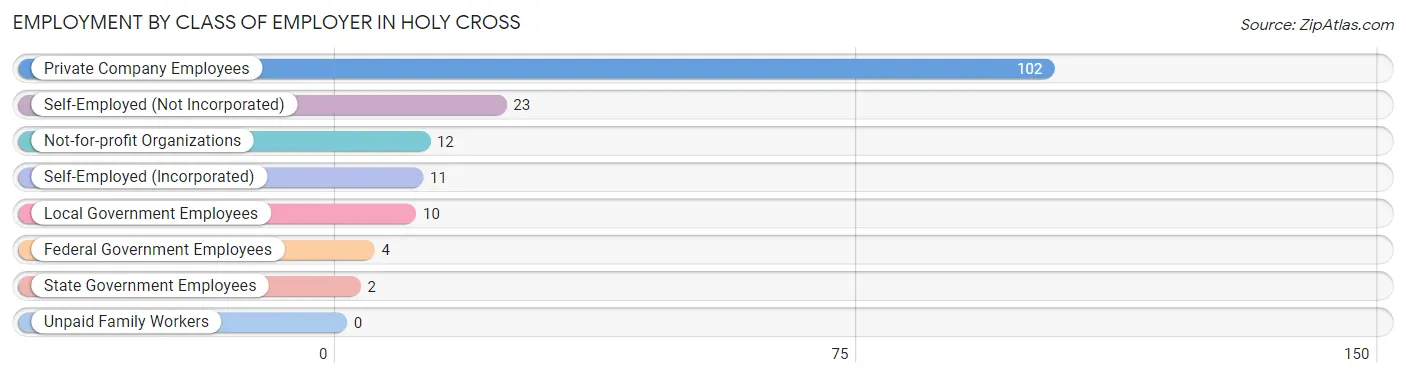
| Employer Class | # Employees | % Employees |
| Private Company Employees | 102 | 62.2% |
| Self-Employed (Incorporated) | 11 | 6.7% |
| Self-Employed (Not Incorporated) | 23 | 14.0% |
| Not-for-profit Organizations | 12 | 7.3% |
| Local Government Employees | 10 | 6.1% |
| State Government Employees | 2 | 1.2% |
| Federal Government Employees | 4 | 2.4% |
| Unpaid Family Workers | 0 | 0.0% |
| Total | 164 | 100.0% |
Employment Status by Age in Holy Cross
According to the labor force statistics for Holy Cross, out of the total population over 16 years of age (230), 72.6% or 167 individuals are in the labor force, with 1.2% or 2 of them unemployed. The age group with the highest labor force participation rate is 20 to 24 years, with 100.0% or 12 individuals in the labor force. Within the labor force, the 20 to 24 years age range has the highest percentage of unemployed individuals, with 8.3% or 1 of them being unemployed.
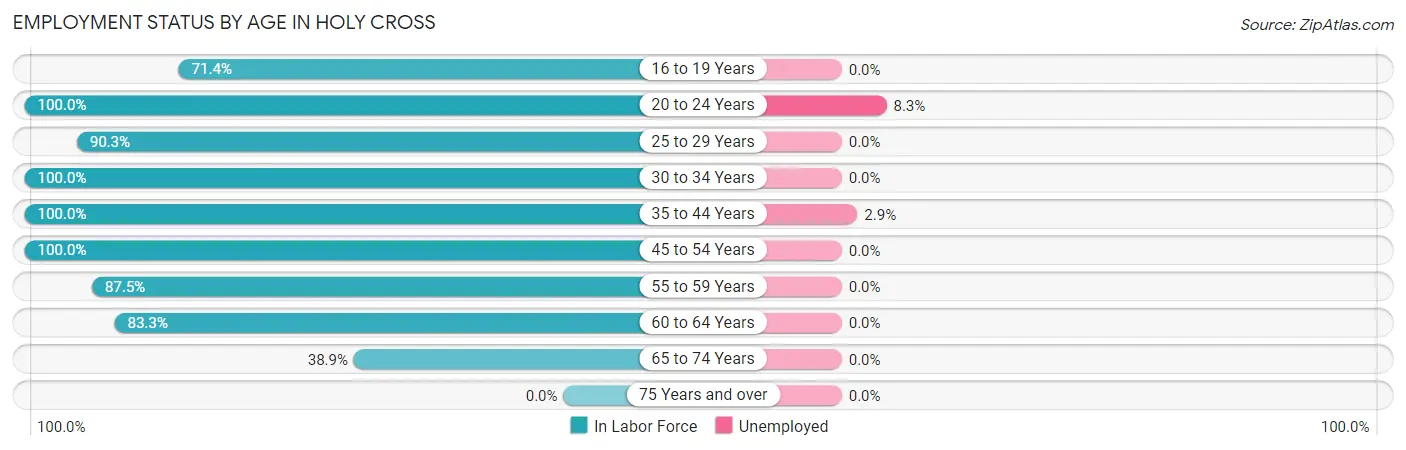
| Age Bracket | In Labor Force | Unemployed |
| 16 to 19 Years | 5 (71.4%) | 0 (0.0%) |
| 20 to 24 Years | 12 (100.0%) | 1 (8.3%) |
| 25 to 29 Years | 28 (90.3%) | 0 (0.0%) |
| 30 to 34 Years | 20 (100.0%) | 0 (0.0%) |
| 35 to 44 Years | 34 (100.0%) | 1 (2.9%) |
| 45 to 54 Years | 35 (100.0%) | 0 (0.0%) |
| 55 to 59 Years | 14 (87.5%) | 0 (0.0%) |
| 60 to 64 Years | 5 (83.3%) | 0 (0.0%) |
| 65 to 74 Years | 14 (38.9%) | 0 (0.0%) |
| 75 Years and over | 0 (0.0%) | 0 (0.0%) |
| Total | 167 (72.6%) | 2 (1.2%) |
Employment Status by Educational Attainment in Holy Cross
According to labor force statistics for Holy Cross, 95.8% of individuals (136) out of the total population between 25 and 64 years of age (142) are in the labor force, with 0.7% or 1 of them being unemployed. The group with the highest labor force participation rate are those with the educational attainment of less than high school, with 100.0% or 1 individuals in the labor force. Within the labor force, individuals with high school diploma education have the highest percentage of unemployment, with 2.7% or 1 of them being unemployed.
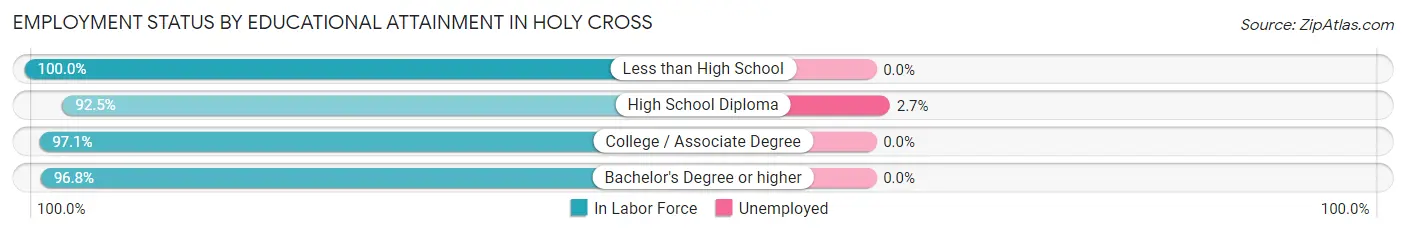
| Educational Attainment | In Labor Force | Unemployed |
| Less than High School | 1 (100.0%) | 0 (0.0%) |
| High School Diploma | 37 (92.5%) | 1 (2.7%) |
| College / Associate Degree | 68 (97.1%) | 0 (0.0%) |
| Bachelor's Degree or higher | 30 (96.8%) | 0 (0.0%) |
| Total | 136 (95.8%) | 1 (0.7%) |
Employment Occupations by Sex in Holy Cross
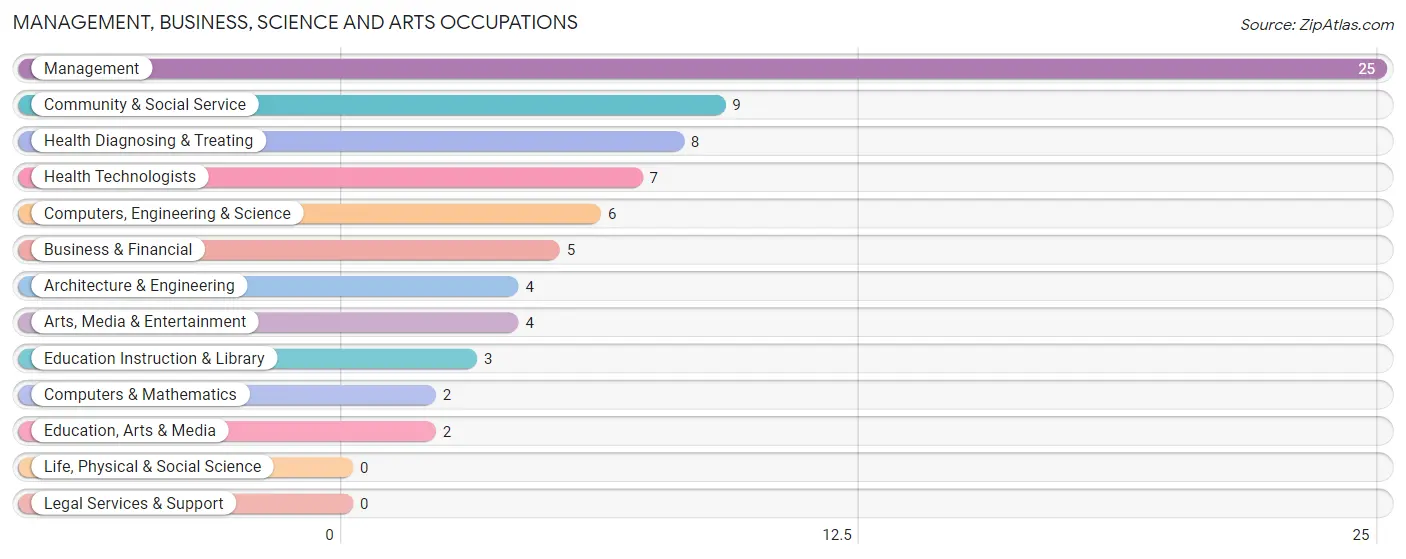
Management, Business, Science and Arts Occupations
The most common Management, Business, Science and Arts occupations in Holy Cross are Management (25 | 15.1%), Community & Social Service (9 | 5.4%), Health Diagnosing & Treating (8 | 4.9%), Health Technologists (7 | 4.2%), and Computers, Engineering & Science (6 | 3.6%).
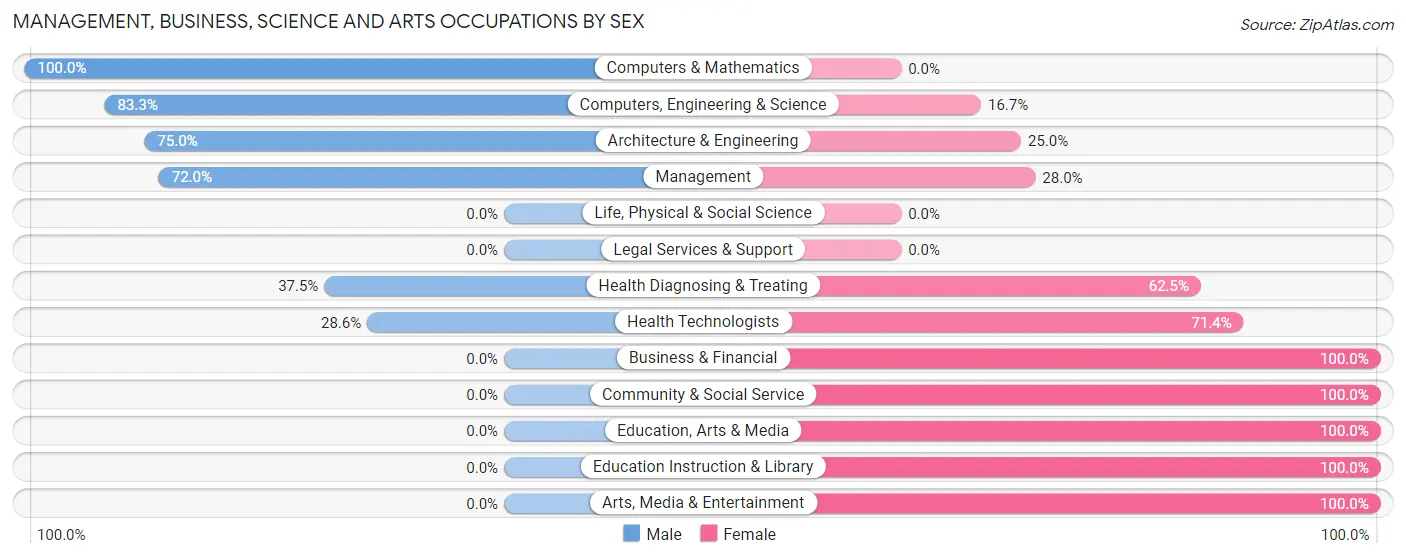
Management, Business, Science and Arts Occupations by Sex
Within the Management, Business, Science and Arts occupations in Holy Cross, the most male-oriented occupations are Computers & Mathematics (100.0%), Computers, Engineering & Science (83.3%), and Architecture & Engineering (75.0%), while the most female-oriented occupations are Business & Financial (100.0%), Community & Social Service (100.0%), and Education, Arts & Media (100.0%).
| Occupation | Male | Female |
| Management | 18 (72.0%) | 7 (28.0%) |
| Business & Financial | 0 (0.0%) | 5 (100.0%) |
| Computers, Engineering & Science | 5 (83.3%) | 1 (16.7%) |
| Computers & Mathematics | 2 (100.0%) | 0 (0.0%) |
| Architecture & Engineering | 3 (75.0%) | 1 (25.0%) |
| Life, Physical & Social Science | 0 (0.0%) | 0 (0.0%) |
| Community & Social Service | 0 (0.0%) | 9 (100.0%) |
| Education, Arts & Media | 0 (0.0%) | 2 (100.0%) |
| Legal Services & Support | 0 (0.0%) | 0 (0.0%) |
| Education Instruction & Library | 0 (0.0%) | 3 (100.0%) |
| Arts, Media & Entertainment | 0 (0.0%) | 4 (100.0%) |
| Health Diagnosing & Treating | 3 (37.5%) | 5 (62.5%) |
| Health Technologists | 2 (28.6%) | 5 (71.4%) |
| Total (Category) | 26 (49.1%) | 27 (50.9%) |
| Total (Overall) | 94 (57.0%) | 71 (43.0%) |
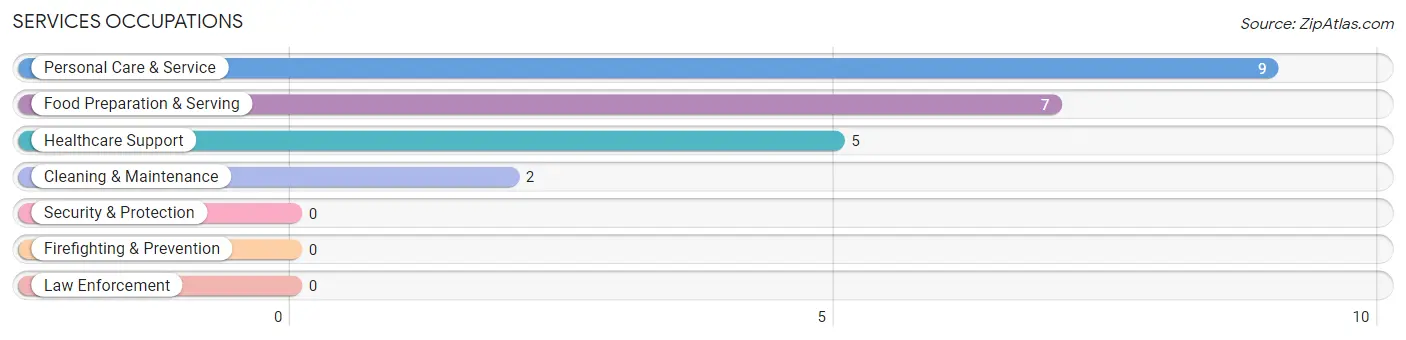
Services Occupations
The most common Services occupations in Holy Cross are Personal Care & Service (9 | 5.4%), Food Preparation & Serving (7 | 4.2%), Healthcare Support (5 | 3.0%), and Cleaning & Maintenance (2 | 1.2%).
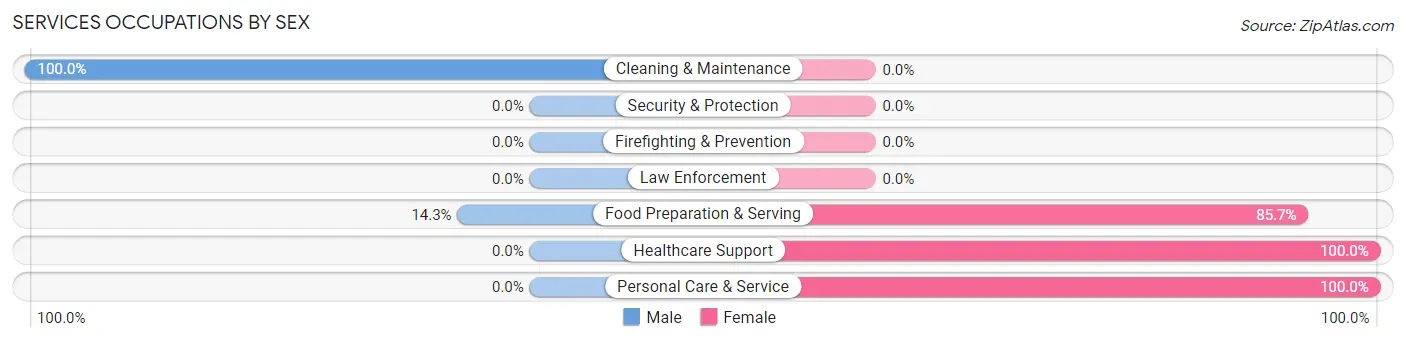
Services Occupations by Sex
Within the Services occupations in Holy Cross, the most male-oriented occupations are Cleaning & Maintenance (100.0%), and Food Preparation & Serving (14.3%), while the most female-oriented occupations are Healthcare Support (100.0%), Personal Care & Service (100.0%), and Food Preparation & Serving (85.7%).
| Occupation | Male | Female |
| Healthcare Support | 0 (0.0%) | 5 (100.0%) |
| Security & Protection | 0 (0.0%) | 0 (0.0%) |
| Firefighting & Prevention | 0 (0.0%) | 0 (0.0%) |
| Law Enforcement | 0 (0.0%) | 0 (0.0%) |
| Food Preparation & Serving | 1 (14.3%) | 6 (85.7%) |
| Cleaning & Maintenance | 2 (100.0%) | 0 (0.0%) |
| Personal Care & Service | 0 (0.0%) | 9 (100.0%) |
| Total (Category) | 3 (13.0%) | 20 (87.0%) |
| Total (Overall) | 94 (57.0%) | 71 (43.0%) |
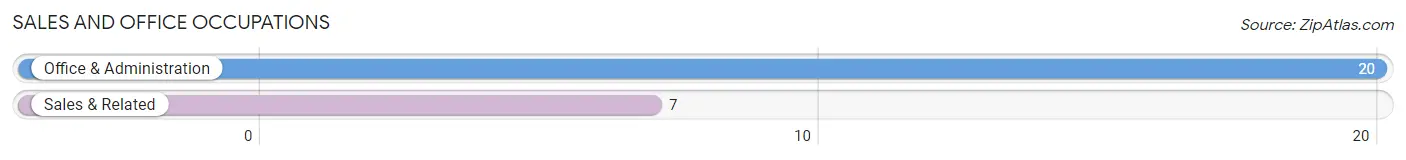
Sales and Office Occupations
The most common Sales and Office occupations in Holy Cross are Office & Administration (20 | 12.1%), and Sales & Related (7 | 4.2%).
Sales and Office Occupations by Sex
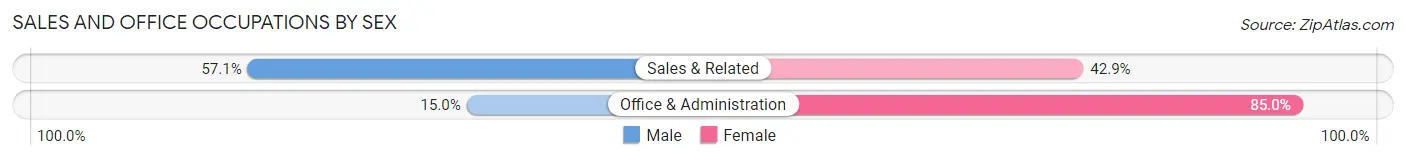
| Occupation | Male | Female |
| Sales & Related | 4 (57.1%) | 3 (42.9%) |
| Office & Administration | 3 (15.0%) | 17 (85.0%) |
| Total (Category) | 7 (25.9%) | 20 (74.1%) |
| Total (Overall) | 94 (57.0%) | 71 (43.0%) |
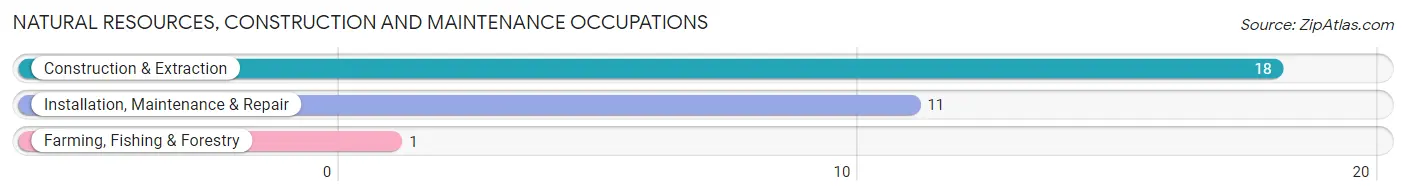
Natural Resources, Construction and Maintenance Occupations
The most common Natural Resources, Construction and Maintenance occupations in Holy Cross are Construction & Extraction (18 | 10.9%), Installation, Maintenance & Repair (11 | 6.7%), and Farming, Fishing & Forestry (1 | 0.6%).
Natural Resources, Construction and Maintenance Occupations by Sex
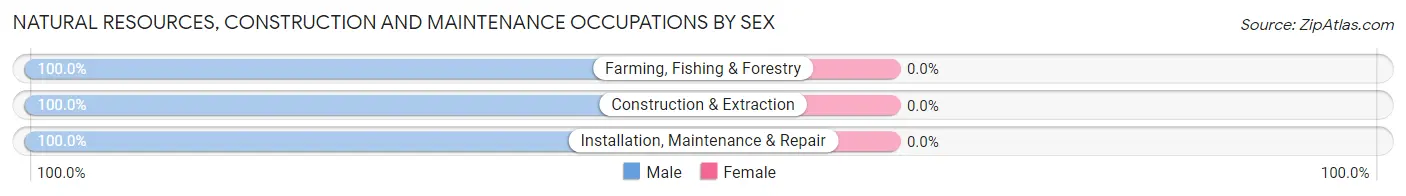
| Occupation | Male | Female |
| Farming, Fishing & Forestry | 1 (100.0%) | 0 (0.0%) |
| Construction & Extraction | 18 (100.0%) | 0 (0.0%) |
| Installation, Maintenance & Repair | 11 (100.0%) | 0 (0.0%) |
| Total (Category) | 30 (100.0%) | 0 (0.0%) |
| Total (Overall) | 94 (57.0%) | 71 (43.0%) |
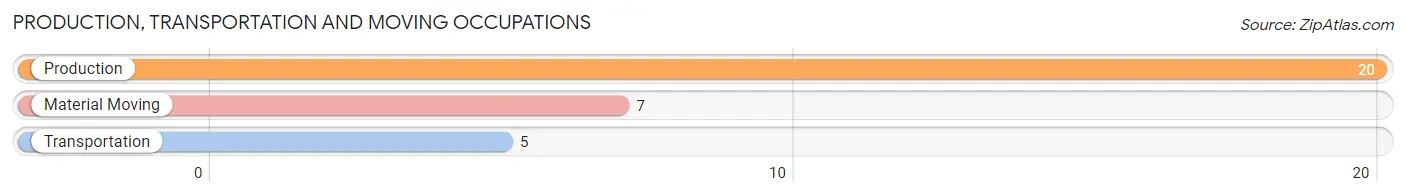
Production, Transportation and Moving Occupations
The most common Production, Transportation and Moving occupations in Holy Cross are Production (20 | 12.1%), Material Moving (7 | 4.2%), and Transportation (5 | 3.0%).
Production, Transportation and Moving Occupations by Sex
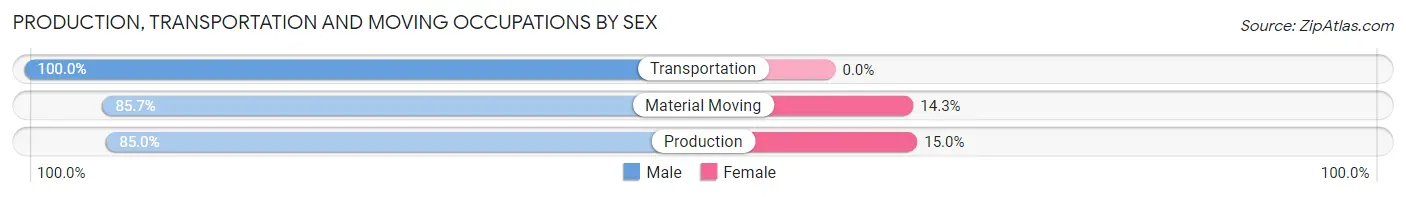
| Occupation | Male | Female |
| Production | 17 (85.0%) | 3 (15.0%) |
| Transportation | 5 (100.0%) | 0 (0.0%) |
| Material Moving | 6 (85.7%) | 1 (14.3%) |
| Total (Category) | 28 (87.5%) | 4 (12.5%) |
| Total (Overall) | 94 (57.0%) | 71 (43.0%) |
Employment Industries by Sex in Holy Cross
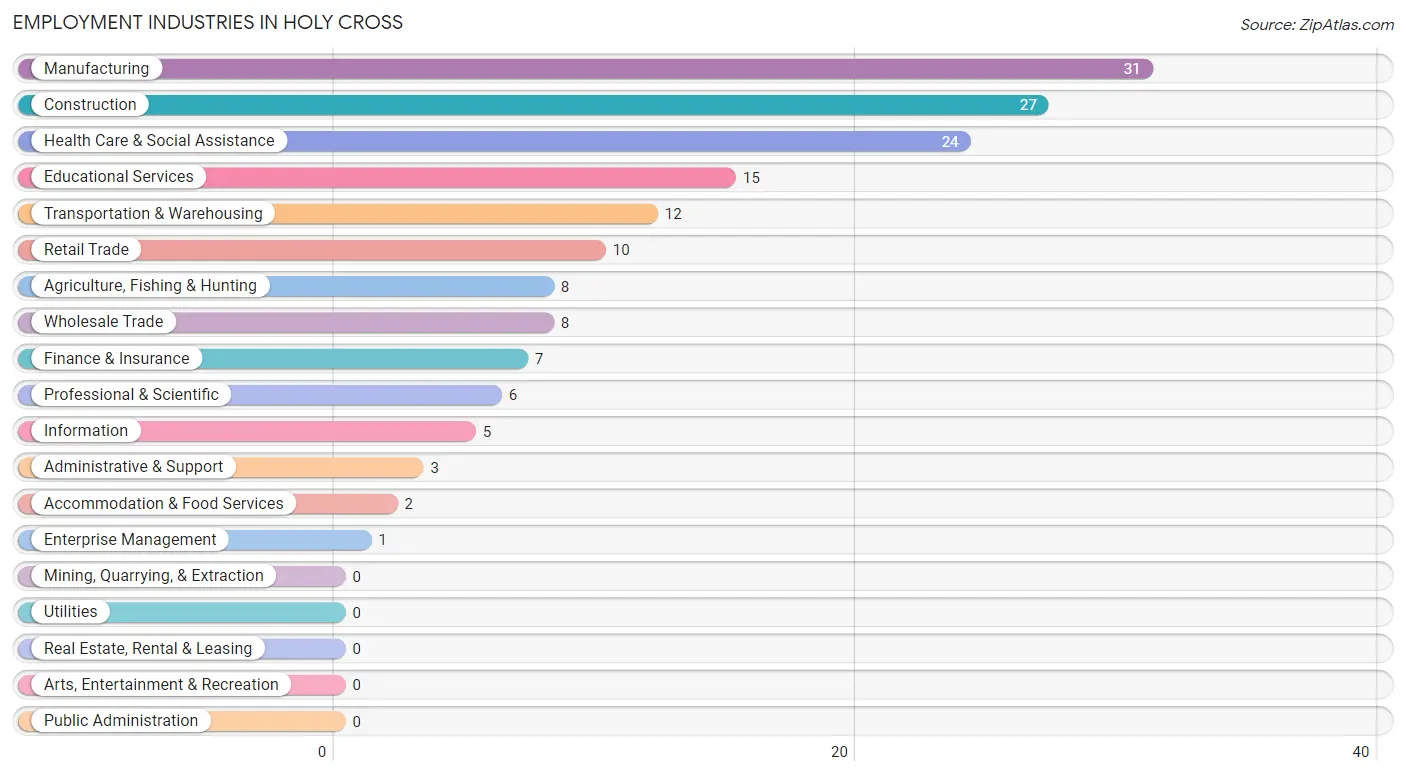
Employment Industries in Holy Cross
The major employment industries in Holy Cross include Manufacturing (31 | 18.8%), Construction (27 | 16.4%), Health Care & Social Assistance (24 | 14.5%), Educational Services (15 | 9.1%), and Transportation & Warehousing (12 | 7.3%).
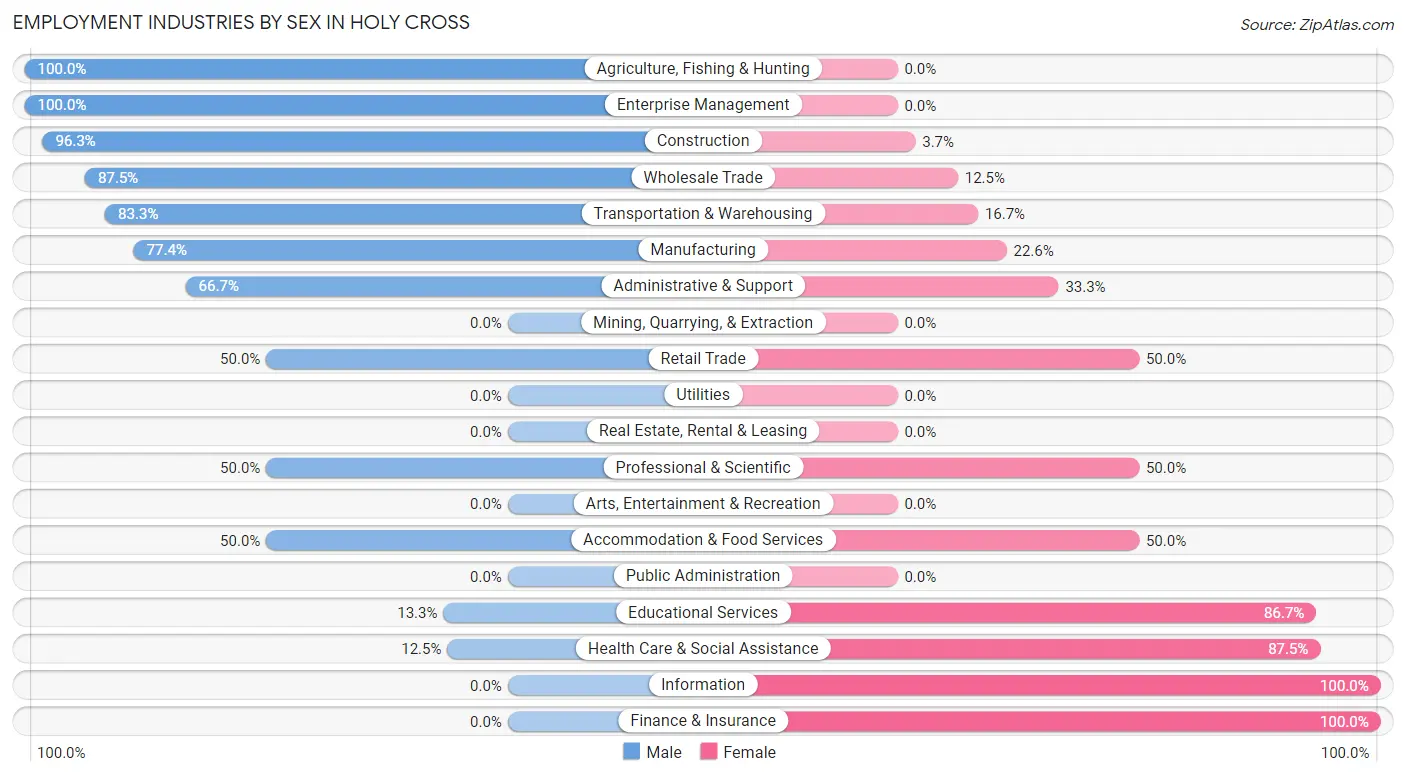
Employment Industries by Sex in Holy Cross
The Holy Cross industries that see more men than women are Agriculture, Fishing & Hunting (100.0%), Enterprise Management (100.0%), and Construction (96.3%), whereas the industries that tend to have a higher number of women are Information (100.0%), Finance & Insurance (100.0%), and Health Care & Social Assistance (87.5%).
| Industry | Male | Female |
| Agriculture, Fishing & Hunting | 8 (100.0%) | 0 (0.0%) |
| Mining, Quarrying, & Extraction | 0 (0.0%) | 0 (0.0%) |
| Construction | 26 (96.3%) | 1 (3.7%) |
| Manufacturing | 24 (77.4%) | 7 (22.6%) |
| Wholesale Trade | 7 (87.5%) | 1 (12.5%) |
| Retail Trade | 5 (50.0%) | 5 (50.0%) |
| Transportation & Warehousing | 10 (83.3%) | 2 (16.7%) |
| Utilities | 0 (0.0%) | 0 (0.0%) |
| Information | 0 (0.0%) | 5 (100.0%) |
| Finance & Insurance | 0 (0.0%) | 7 (100.0%) |
| Real Estate, Rental & Leasing | 0 (0.0%) | 0 (0.0%) |
| Professional & Scientific | 3 (50.0%) | 3 (50.0%) |
| Enterprise Management | 1 (100.0%) | 0 (0.0%) |
| Administrative & Support | 2 (66.7%) | 1 (33.3%) |
| Educational Services | 2 (13.3%) | 13 (86.7%) |
| Health Care & Social Assistance | 3 (12.5%) | 21 (87.5%) |
| Arts, Entertainment & Recreation | 0 (0.0%) | 0 (0.0%) |
| Accommodation & Food Services | 1 (50.0%) | 1 (50.0%) |
| Public Administration | 0 (0.0%) | 0 (0.0%) |
| Total | 94 (57.0%) | 71 (43.0%) |
Education in Holy Cross
School Enrollment in Holy Cross
The most common levels of schooling among the 58 students in Holy Cross are elementary school (18 | 31.0%), high school (12 | 20.7%), and nursery / preschool (9 | 15.5%).
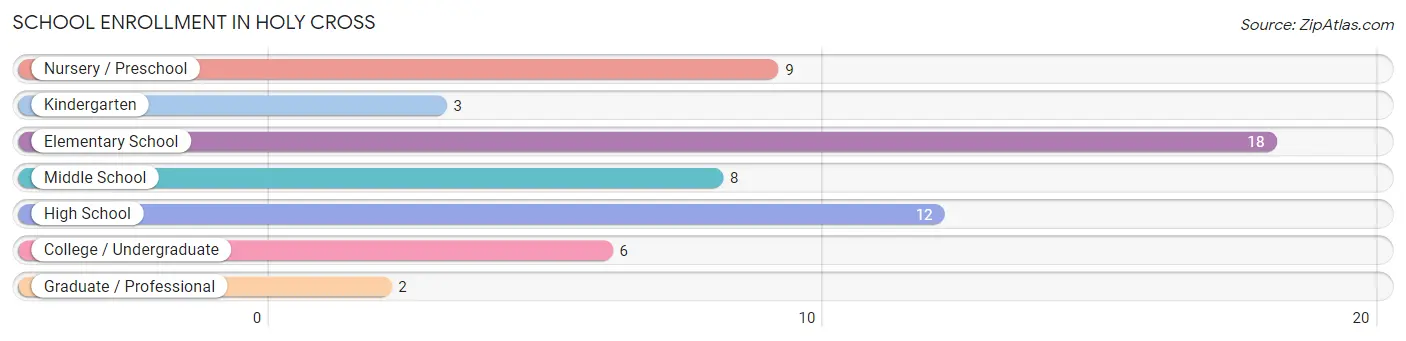
| School Level | # Students | % Students |
| Nursery / Preschool | 9 | 15.5% |
| Kindergarten | 3 | 5.2% |
| Elementary School | 18 | 31.0% |
| Middle School | 8 | 13.8% |
| High School | 12 | 20.7% |
| College / Undergraduate | 6 | 10.3% |
| Graduate / Professional | 2 | 3.5% |
| Total | 58 | 100.0% |
School Enrollment by Age by Funding Source in Holy Cross
Out of a total of 58 students who are enrolled in schools in Holy Cross, 24 (41.4%) attend a private institution, while the remaining 34 (58.6%) are enrolled in public schools. The age group of 15 to 17 year olds has the highest likelihood of being enrolled in private schools, with 3 (100.0% in the age bracket) enrolled. Conversely, the age group of 18 to 19 year olds has the lowest likelihood of being enrolled in a private school, with 6 (100.0% in the age bracket) attending a public institution.
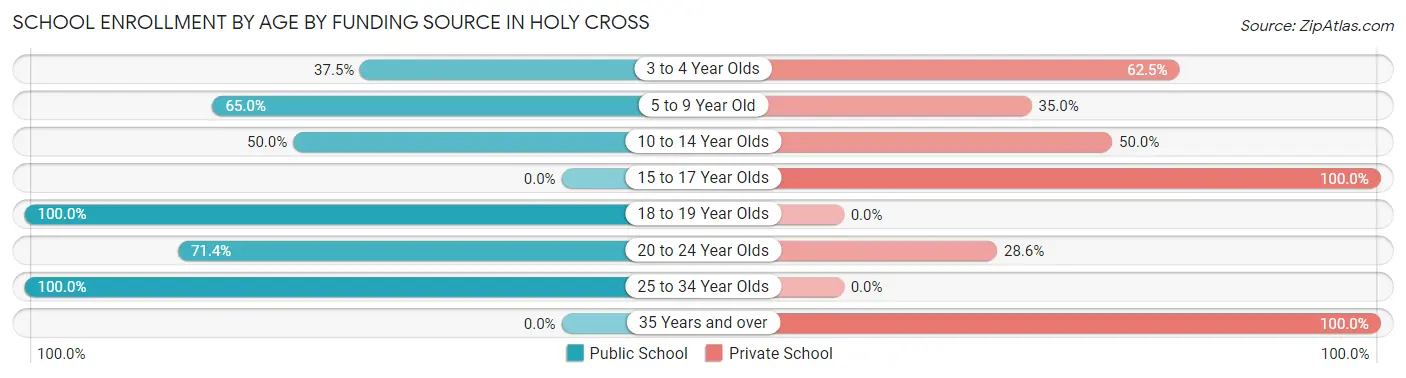
| Age Bracket | Public School | Private School |
| 3 to 4 Year Olds | 3 (37.5%) | 5 (62.5%) |
| 5 to 9 Year Old | 13 (65.0%) | 7 (35.0%) |
| 10 to 14 Year Olds | 6 (50.0%) | 6 (50.0%) |
| 15 to 17 Year Olds | 0 (0.0%) | 3 (100.0%) |
| 18 to 19 Year Olds | 6 (100.0%) | 0 (0.0%) |
| 20 to 24 Year Olds | 5 (71.4%) | 2 (28.6%) |
| 25 to 34 Year Olds | 1 (100.0%) | 0 (0.0%) |
| 35 Years and over | 0 (0.0%) | 1 (100.0%) |
| Total | 34 (58.6%) | 24 (41.4%) |
Educational Attainment by Field of Study in Holy Cross
Education (14 | 33.3%), business (9 | 21.4%), engineering (5 | 11.9%), communications (5 | 11.9%), and science & technology (3 | 7.1%) are the most common fields of study among 42 individuals in Holy Cross who have obtained a bachelor's degree or higher.
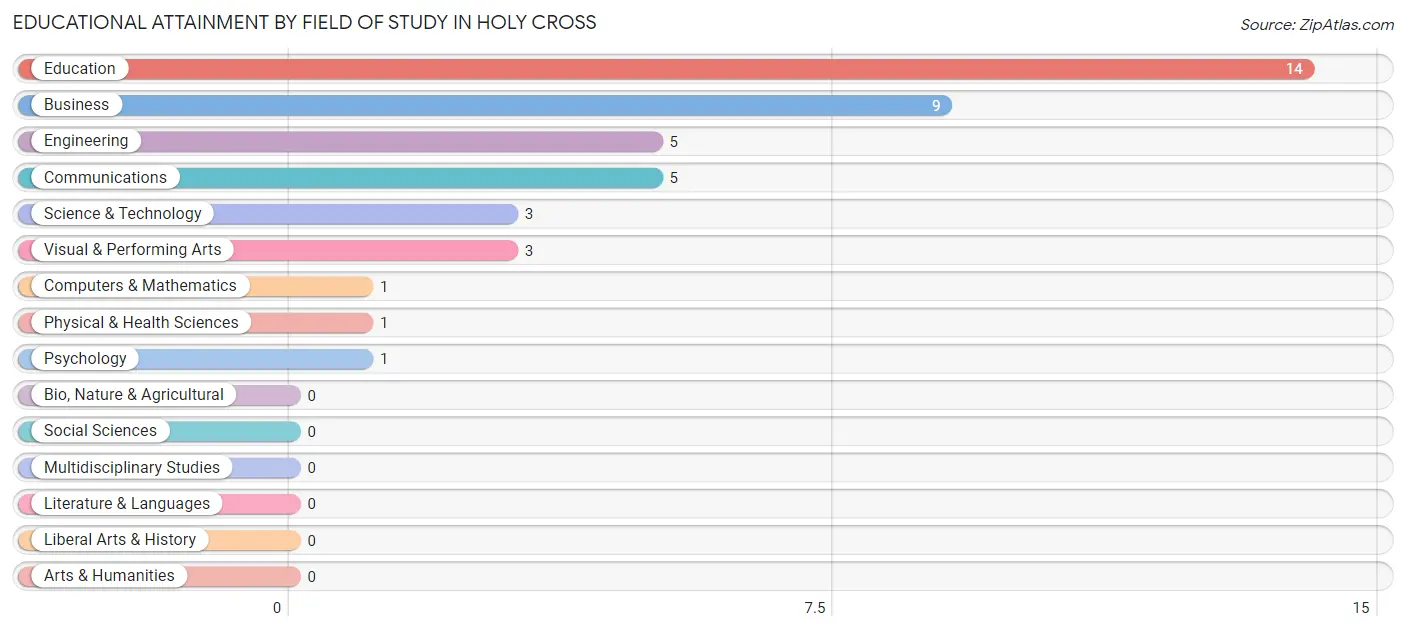
| Field of Study | # Graduates | % Graduates |
| Computers & Mathematics | 1 | 2.4% |
| Bio, Nature & Agricultural | 0 | 0.0% |
| Physical & Health Sciences | 1 | 2.4% |
| Psychology | 1 | 2.4% |
| Social Sciences | 0 | 0.0% |
| Engineering | 5 | 11.9% |
| Multidisciplinary Studies | 0 | 0.0% |
| Science & Technology | 3 | 7.1% |
| Business | 9 | 21.4% |
| Education | 14 | 33.3% |
| Literature & Languages | 0 | 0.0% |
| Liberal Arts & History | 0 | 0.0% |
| Visual & Performing Arts | 3 | 7.1% |
| Communications | 5 | 11.9% |
| Arts & Humanities | 0 | 0.0% |
| Total | 42 | 100.0% |
Transportation & Commute in Holy Cross
Vehicle Availability by Sex in Holy Cross
The most prevalent vehicle ownership categories in Holy Cross are males with 2 vehicles (36, accounting for 38.7%) and females with 2 vehicles (34, making up 50.7%).
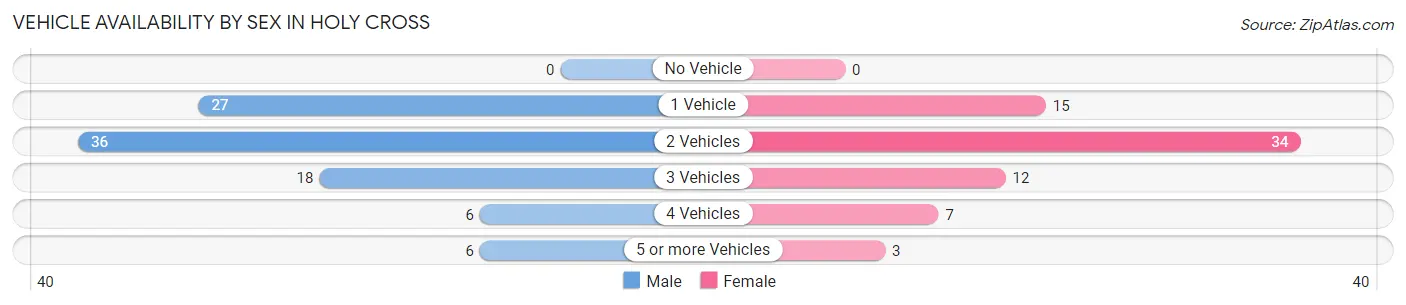
| Vehicles Available | Male | Female |
| No Vehicle | 0 (0.0%) | 0 (0.0%) |
| 1 Vehicle | 27 (29.0%) | 15 (21.1%) |
| 2 Vehicles | 36 (38.7%) | 34 (47.9%) |
| 3 Vehicles | 18 (19.4%) | 12 (16.9%) |
| 4 Vehicles | 6 (6.5%) | 7 (9.9%) |
| 5 or more Vehicles | 6 (6.5%) | 3 (4.2%) |
| Total | 93 (100.0%) | 71 (100.0%) |
Commute Time in Holy Cross
The most frequently occuring commute durations in Holy Cross are 30 to 34 minutes (38 commuters, 24.5%), 25 to 29 minutes (24 commuters, 15.5%), and 35 to 39 minutes (18 commuters, 11.6%).
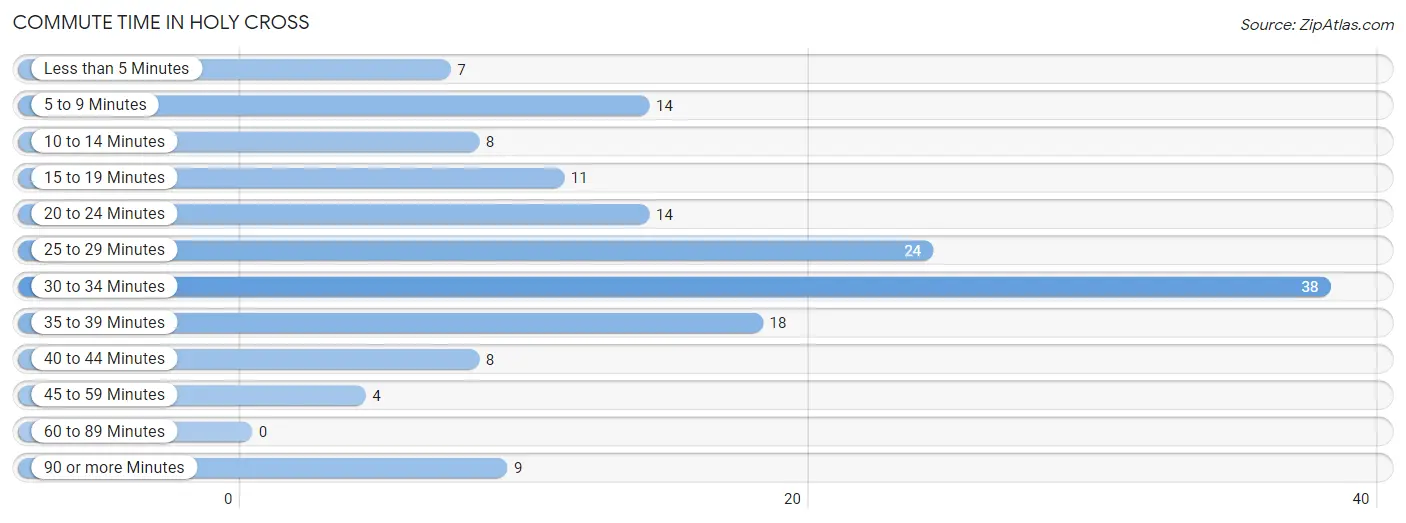
| Commute Time | # Commuters | % Commuters |
| Less than 5 Minutes | 7 | 4.5% |
| 5 to 9 Minutes | 14 | 9.0% |
| 10 to 14 Minutes | 8 | 5.2% |
| 15 to 19 Minutes | 11 | 7.1% |
| 20 to 24 Minutes | 14 | 9.0% |
| 25 to 29 Minutes | 24 | 15.5% |
| 30 to 34 Minutes | 38 | 24.5% |
| 35 to 39 Minutes | 18 | 11.6% |
| 40 to 44 Minutes | 8 | 5.2% |
| 45 to 59 Minutes | 4 | 2.6% |
| 60 to 89 Minutes | 0 | 0.0% |
| 90 or more Minutes | 9 | 5.8% |
Commute Time by Sex in Holy Cross
The most common commute times in Holy Cross are 30 to 34 minutes (17 commuters, 18.7%) for males and 30 to 34 minutes (21 commuters, 32.8%) for females.
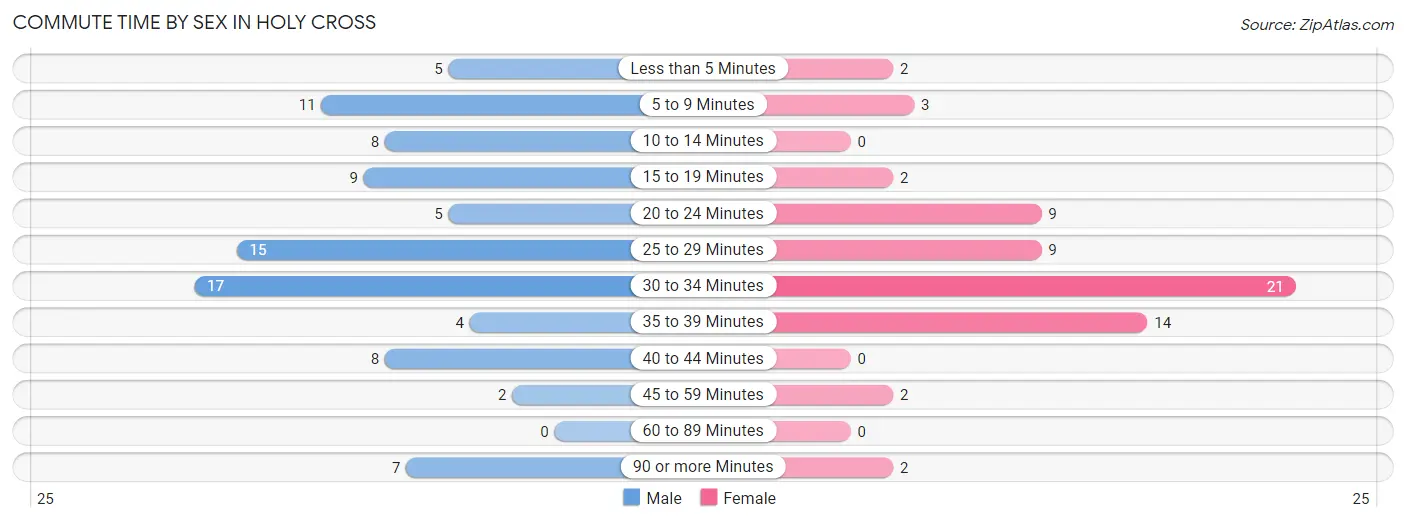
| Commute Time | Male | Female |
| Less than 5 Minutes | 5 (5.5%) | 2 (3.1%) |
| 5 to 9 Minutes | 11 (12.1%) | 3 (4.7%) |
| 10 to 14 Minutes | 8 (8.8%) | 0 (0.0%) |
| 15 to 19 Minutes | 9 (9.9%) | 2 (3.1%) |
| 20 to 24 Minutes | 5 (5.5%) | 9 (14.1%) |
| 25 to 29 Minutes | 15 (16.5%) | 9 (14.1%) |
| 30 to 34 Minutes | 17 (18.7%) | 21 (32.8%) |
| 35 to 39 Minutes | 4 (4.4%) | 14 (21.9%) |
| 40 to 44 Minutes | 8 (8.8%) | 0 (0.0%) |
| 45 to 59 Minutes | 2 (2.2%) | 2 (3.1%) |
| 60 to 89 Minutes | 0 (0.0%) | 0 (0.0%) |
| 90 or more Minutes | 7 (7.7%) | 2 (3.1%) |
Time of Departure to Work by Sex in Holy Cross
The most frequent times of departure to work in Holy Cross are 6:00 AM to 6:29 AM (28, 30.8%) for males and 7:00 AM to 7:29 AM (14, 21.9%) for females.
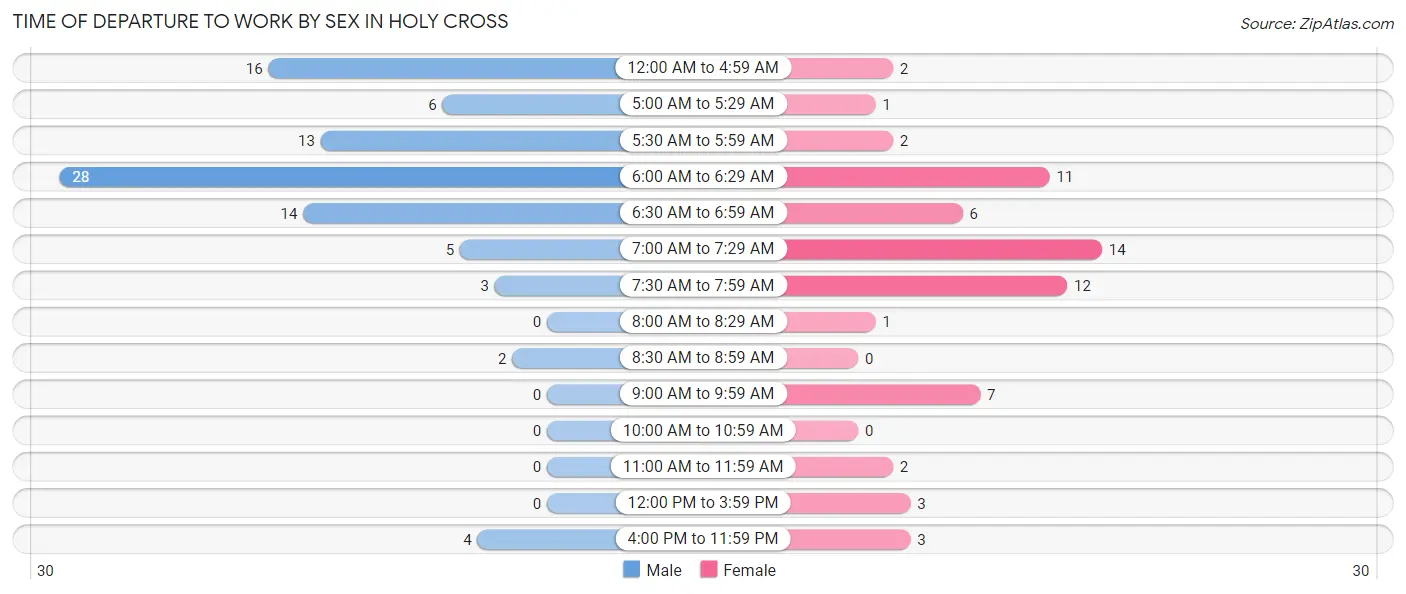
| Time of Departure | Male | Female |
| 12:00 AM to 4:59 AM | 16 (17.6%) | 2 (3.1%) |
| 5:00 AM to 5:29 AM | 6 (6.6%) | 1 (1.6%) |
| 5:30 AM to 5:59 AM | 13 (14.3%) | 2 (3.1%) |
| 6:00 AM to 6:29 AM | 28 (30.8%) | 11 (17.2%) |
| 6:30 AM to 6:59 AM | 14 (15.4%) | 6 (9.4%) |
| 7:00 AM to 7:29 AM | 5 (5.5%) | 14 (21.9%) |
| 7:30 AM to 7:59 AM | 3 (3.3%) | 12 (18.8%) |
| 8:00 AM to 8:29 AM | 0 (0.0%) | 1 (1.6%) |
| 8:30 AM to 8:59 AM | 2 (2.2%) | 0 (0.0%) |
| 9:00 AM to 9:59 AM | 0 (0.0%) | 7 (10.9%) |
| 10:00 AM to 10:59 AM | 0 (0.0%) | 0 (0.0%) |
| 11:00 AM to 11:59 AM | 0 (0.0%) | 2 (3.1%) |
| 12:00 PM to 3:59 PM | 0 (0.0%) | 3 (4.7%) |
| 4:00 PM to 11:59 PM | 4 (4.4%) | 3 (4.7%) |
| Total | 91 (100.0%) | 64 (100.0%) |
Housing Occupancy in Holy Cross
Occupancy by Ownership in Holy Cross
Of the total 130 dwellings in Holy Cross, owner-occupied units account for 96 (73.9%), while renter-occupied units make up 34 (26.2%).
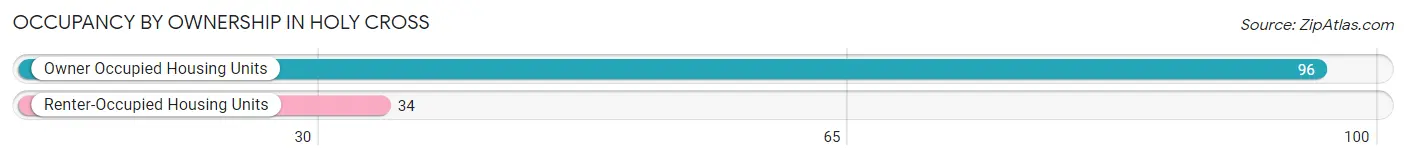
| Occupancy | # Housing Units | % Housing Units |
| Owner Occupied Housing Units | 96 | 73.9% |
| Renter-Occupied Housing Units | 34 | 26.2% |
| Total Occupied Housing Units | 130 | 100.0% |
Occupancy by Household Size in Holy Cross
| Household Size | # Housing Units | % Housing Units |
| 1-Person Household | 52 | 40.0% |
| 2-Person Household | 35 | 26.9% |
| 3-Person Household | 19 | 14.6% |
| 4+ Person Household | 24 | 18.5% |
| Total Housing Units | 130 | 100.0% |
Occupancy by Ownership by Household Size in Holy Cross
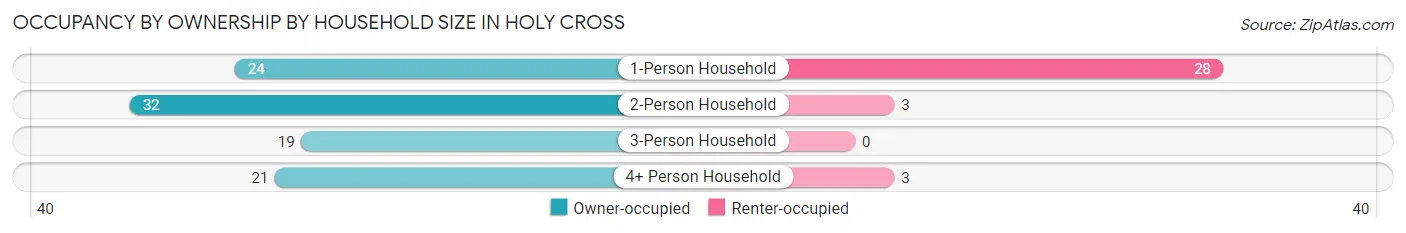
| Household Size | Owner-occupied | Renter-occupied |
| 1-Person Household | 24 (46.2%) | 28 (53.8%) |
| 2-Person Household | 32 (91.4%) | 3 (8.6%) |
| 3-Person Household | 19 (100.0%) | 0 (0.0%) |
| 4+ Person Household | 21 (87.5%) | 3 (12.5%) |
| Total Housing Units | 96 (73.9%) | 34 (26.2%) |
Occupancy by Educational Attainment in Holy Cross
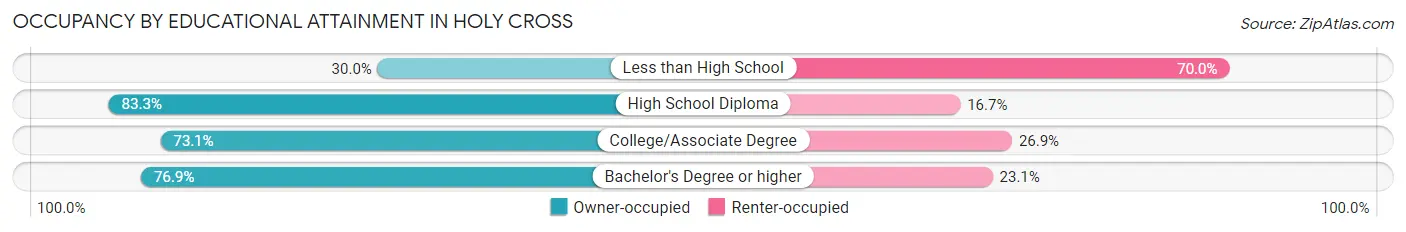
| Household Size | Owner-occupied | Renter-occupied |
| Less than High School | 3 (30.0%) | 7 (70.0%) |
| High School Diploma | 35 (83.3%) | 7 (16.7%) |
| College/Associate Degree | 38 (73.1%) | 14 (26.9%) |
| Bachelor's Degree or higher | 20 (76.9%) | 6 (23.1%) |
Occupancy by Age of Householder in Holy Cross
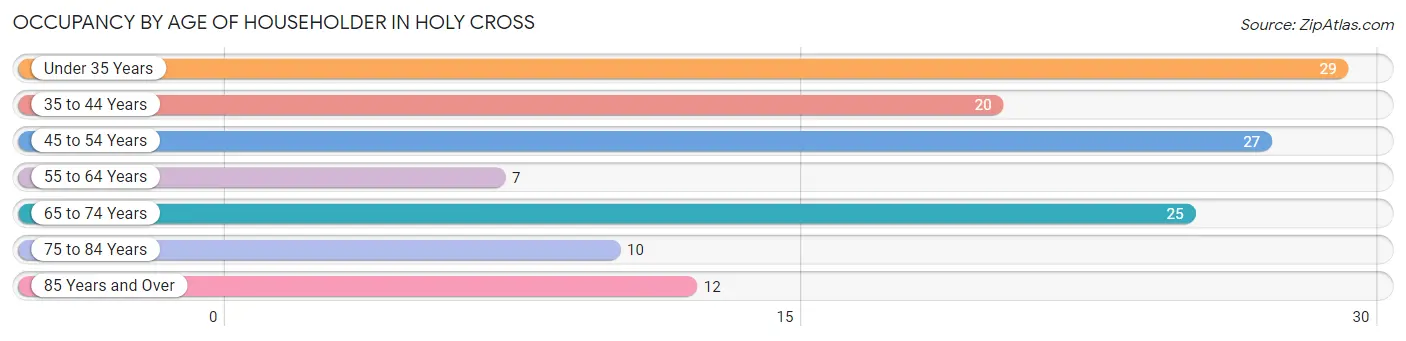
| Age Bracket | # Households | % Households |
| Under 35 Years | 29 | 22.3% |
| 35 to 44 Years | 20 | 15.4% |
| 45 to 54 Years | 27 | 20.8% |
| 55 to 64 Years | 7 | 5.4% |
| 65 to 74 Years | 25 | 19.2% |
| 75 to 84 Years | 10 | 7.7% |
| 85 Years and Over | 12 | 9.2% |
| Total | 130 | 100.0% |
Housing Finances in Holy Cross
Median Income by Occupancy in Holy Cross
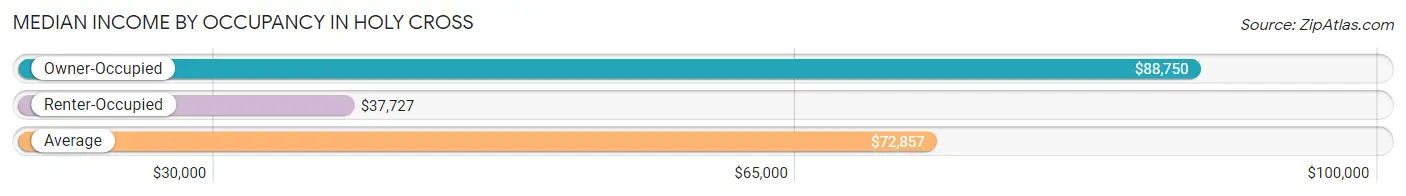
| Occupancy Type | # Households | Median Income |
| Owner-Occupied | 96 (73.9%) | $88,750 |
| Renter-Occupied | 34 (26.2%) | $37,727 |
| Average | 130 (100.0%) | $72,857 |
Occupancy by Householder Income Bracket in Holy Cross
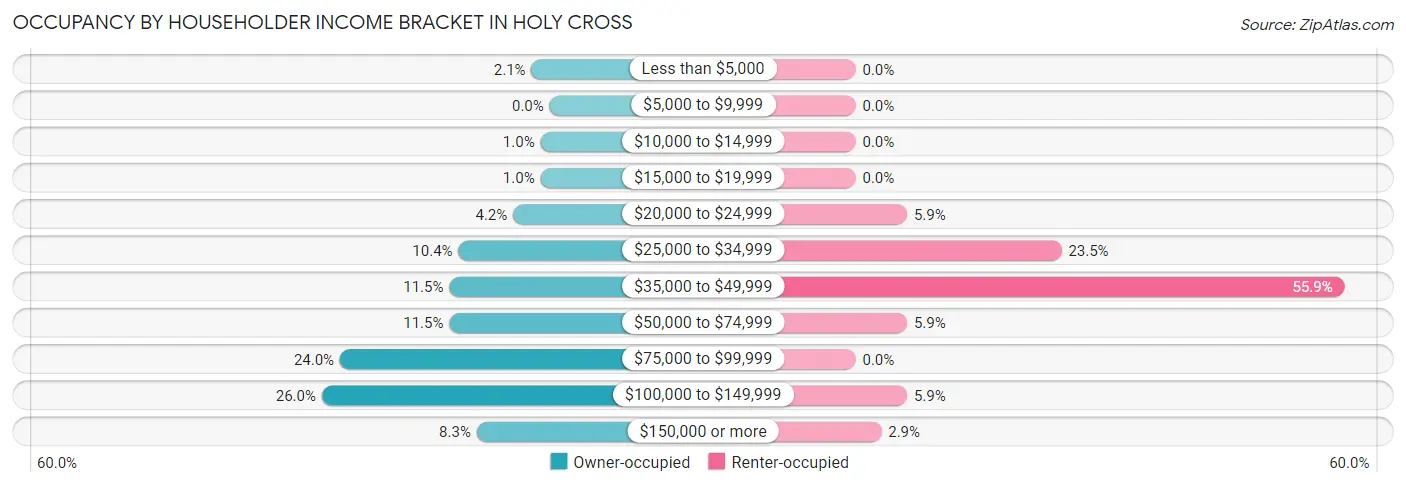
| Income Bracket | Owner-occupied | Renter-occupied |
| Less than $5,000 | 2 (2.1%) | 0 (0.0%) |
| $5,000 to $9,999 | 0 (0.0%) | 0 (0.0%) |
| $10,000 to $14,999 | 1 (1.0%) | 0 (0.0%) |
| $15,000 to $19,999 | 1 (1.0%) | 0 (0.0%) |
| $20,000 to $24,999 | 4 (4.2%) | 2 (5.9%) |
| $25,000 to $34,999 | 10 (10.4%) | 8 (23.5%) |
| $35,000 to $49,999 | 11 (11.5%) | 19 (55.9%) |
| $50,000 to $74,999 | 11 (11.5%) | 2 (5.9%) |
| $75,000 to $99,999 | 23 (24.0%) | 0 (0.0%) |
| $100,000 to $149,999 | 25 (26.0%) | 2 (5.9%) |
| $150,000 or more | 8 (8.3%) | 1 (2.9%) |
| Total | 96 (100.0%) | 34 (100.0%) |
Monthly Housing Cost Tiers in Holy Cross
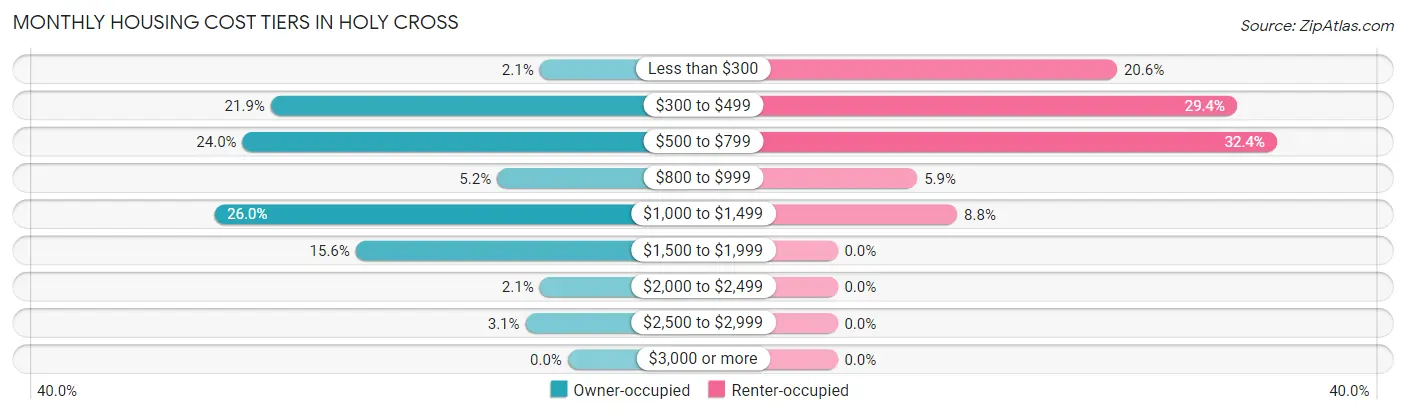
| Monthly Cost | Owner-occupied | Renter-occupied |
| Less than $300 | 2 (2.1%) | 7 (20.6%) |
| $300 to $499 | 21 (21.9%) | 10 (29.4%) |
| $500 to $799 | 23 (24.0%) | 11 (32.4%) |
| $800 to $999 | 5 (5.2%) | 2 (5.9%) |
| $1,000 to $1,499 | 25 (26.0%) | 3 (8.8%) |
| $1,500 to $1,999 | 15 (15.6%) | 0 (0.0%) |
| $2,000 to $2,499 | 2 (2.1%) | 0 (0.0%) |
| $2,500 to $2,999 | 3 (3.1%) | 0 (0.0%) |
| $3,000 or more | 0 (0.0%) | 0 (0.0%) |
| Total | 96 (100.0%) | 34 (100.0%) |
Physical Housing Characteristics in Holy Cross
Housing Structures in Holy Cross
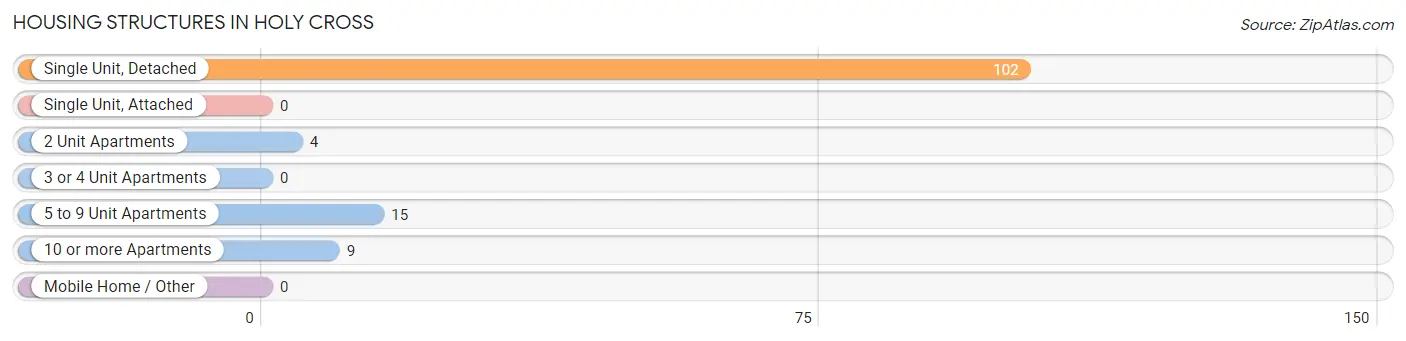
| Structure Type | # Housing Units | % Housing Units |
| Single Unit, Detached | 102 | 78.5% |
| Single Unit, Attached | 0 | 0.0% |
| 2 Unit Apartments | 4 | 3.1% |
| 3 or 4 Unit Apartments | 0 | 0.0% |
| 5 to 9 Unit Apartments | 15 | 11.5% |
| 10 or more Apartments | 9 | 6.9% |
| Mobile Home / Other | 0 | 0.0% |
| Total | 130 | 100.0% |
Housing Structures by Occupancy in Holy Cross
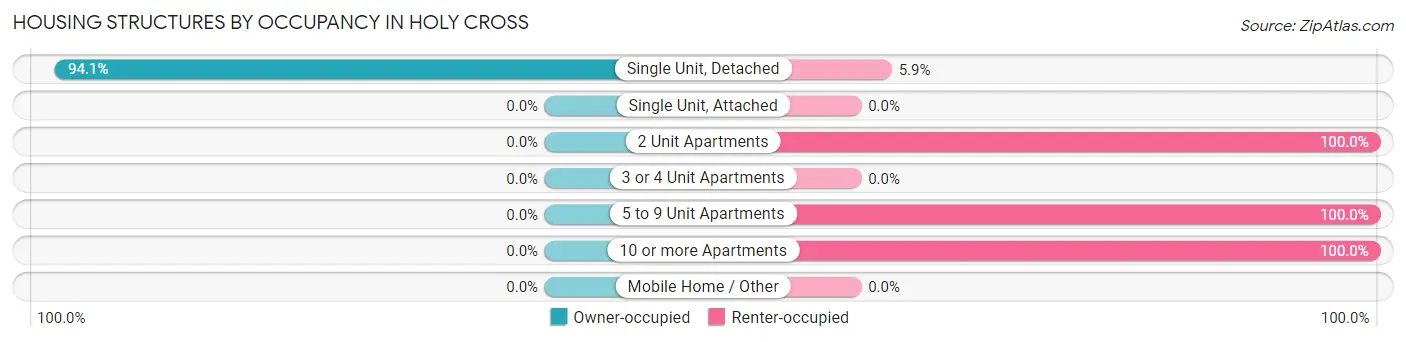
| Structure Type | Owner-occupied | Renter-occupied |
| Single Unit, Detached | 96 (94.1%) | 6 (5.9%) |
| Single Unit, Attached | 0 (0.0%) | 0 (0.0%) |
| 2 Unit Apartments | 0 (0.0%) | 4 (100.0%) |
| 3 or 4 Unit Apartments | 0 (0.0%) | 0 (0.0%) |
| 5 to 9 Unit Apartments | 0 (0.0%) | 15 (100.0%) |
| 10 or more Apartments | 0 (0.0%) | 9 (100.0%) |
| Mobile Home / Other | 0 (0.0%) | 0 (0.0%) |
| Total | 96 (73.9%) | 34 (26.2%) |
Housing Structures by Number of Rooms in Holy Cross
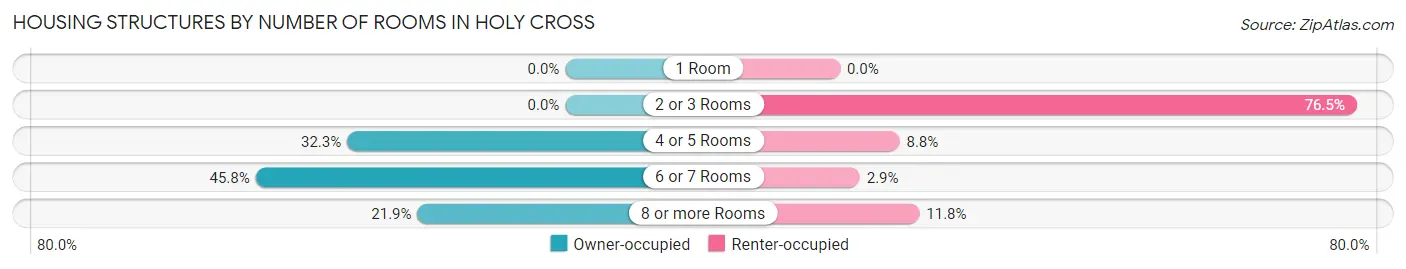
| Number of Rooms | Owner-occupied | Renter-occupied |
| 1 Room | 0 (0.0%) | 0 (0.0%) |
| 2 or 3 Rooms | 0 (0.0%) | 26 (76.5%) |
| 4 or 5 Rooms | 31 (32.3%) | 3 (8.8%) |
| 6 or 7 Rooms | 44 (45.8%) | 1 (2.9%) |
| 8 or more Rooms | 21 (21.9%) | 4 (11.8%) |
| Total | 96 (100.0%) | 34 (100.0%) |
Housing Structure by Heating Type in Holy Cross
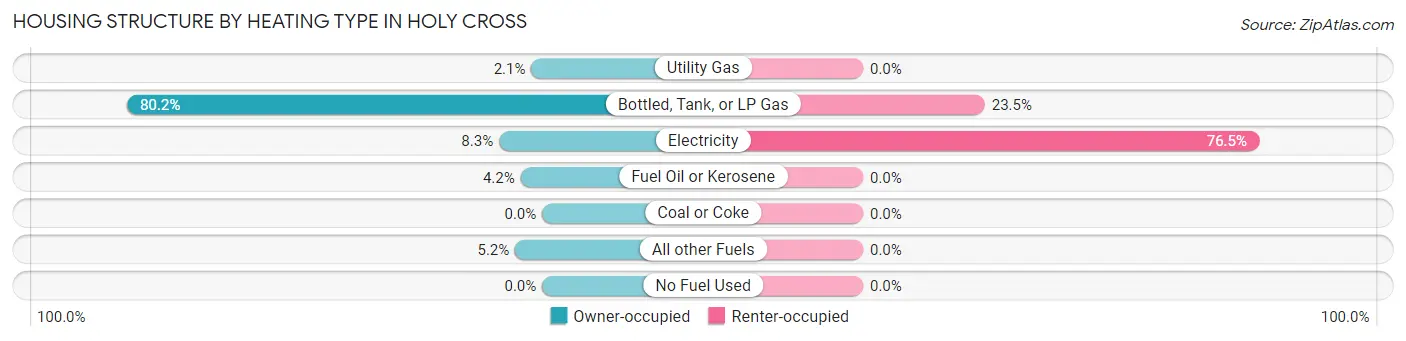
| Heating Type | Owner-occupied | Renter-occupied |
| Utility Gas | 2 (2.1%) | 0 (0.0%) |
| Bottled, Tank, or LP Gas | 77 (80.2%) | 8 (23.5%) |
| Electricity | 8 (8.3%) | 26 (76.5%) |
| Fuel Oil or Kerosene | 4 (4.2%) | 0 (0.0%) |
| Coal or Coke | 0 (0.0%) | 0 (0.0%) |
| All other Fuels | 5 (5.2%) | 0 (0.0%) |
| No Fuel Used | 0 (0.0%) | 0 (0.0%) |
| Total | 96 (100.0%) | 34 (100.0%) |
Household Vehicle Usage in Holy Cross
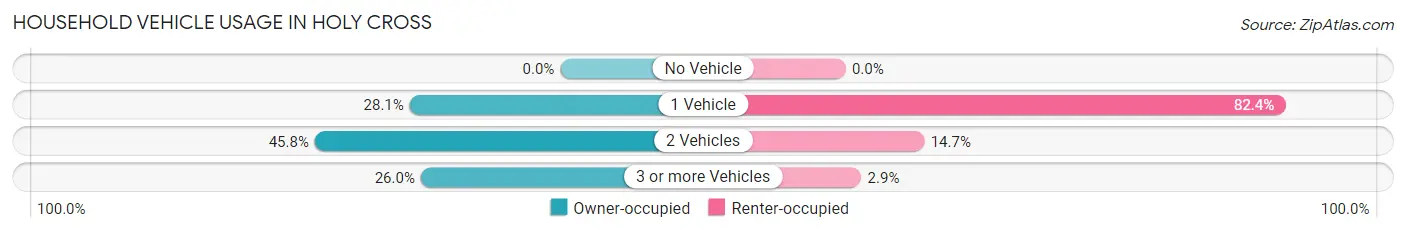
| Vehicles per Household | Owner-occupied | Renter-occupied |
| No Vehicle | 0 (0.0%) | 0 (0.0%) |
| 1 Vehicle | 27 (28.1%) | 28 (82.4%) |
| 2 Vehicles | 44 (45.8%) | 5 (14.7%) |
| 3 or more Vehicles | 25 (26.0%) | 1 (2.9%) |
| Total | 96 (100.0%) | 34 (100.0%) |
Real Estate & Mortgages in Holy Cross
Real Estate and Mortgage Overview in Holy Cross
| Characteristic | Without Mortgage | With Mortgage |
| Housing Units | 45 | 51 |
| Median Property Value | $159,000 | $144,100 |
| Median Household Income | $46,250 | $6 |
| Monthly Housing Costs | $497 | $0 |
| Real Estate Taxes | $2,167 | $2 |
Property Value by Mortgage Status in Holy Cross
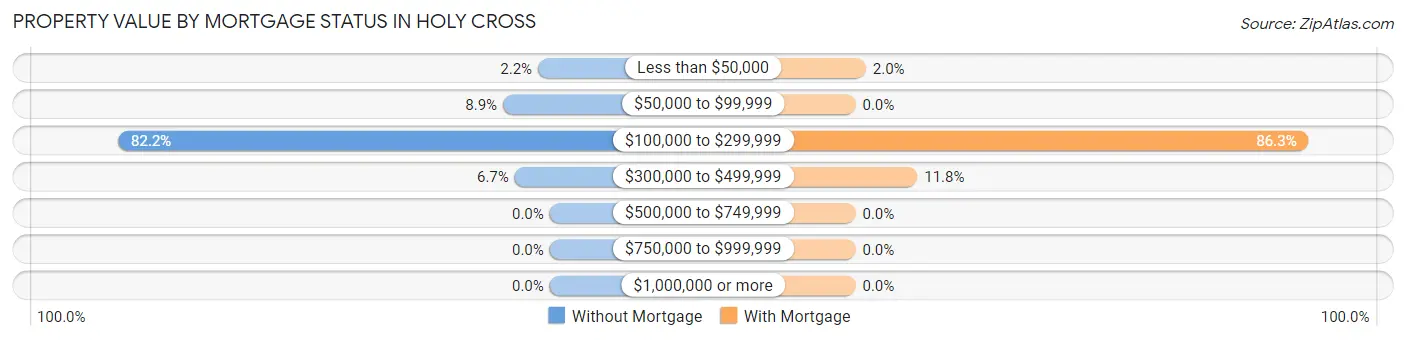
| Property Value | Without Mortgage | With Mortgage |
| Less than $50,000 | 1 (2.2%) | 1 (2.0%) |
| $50,000 to $99,999 | 4 (8.9%) | 0 (0.0%) |
| $100,000 to $299,999 | 37 (82.2%) | 44 (86.3%) |
| $300,000 to $499,999 | 3 (6.7%) | 6 (11.8%) |
| $500,000 to $749,999 | 0 (0.0%) | 0 (0.0%) |
| $750,000 to $999,999 | 0 (0.0%) | 0 (0.0%) |
| $1,000,000 or more | 0 (0.0%) | 0 (0.0%) |
| Total | 45 (100.0%) | 51 (100.0%) |
Household Income by Mortgage Status in Holy Cross
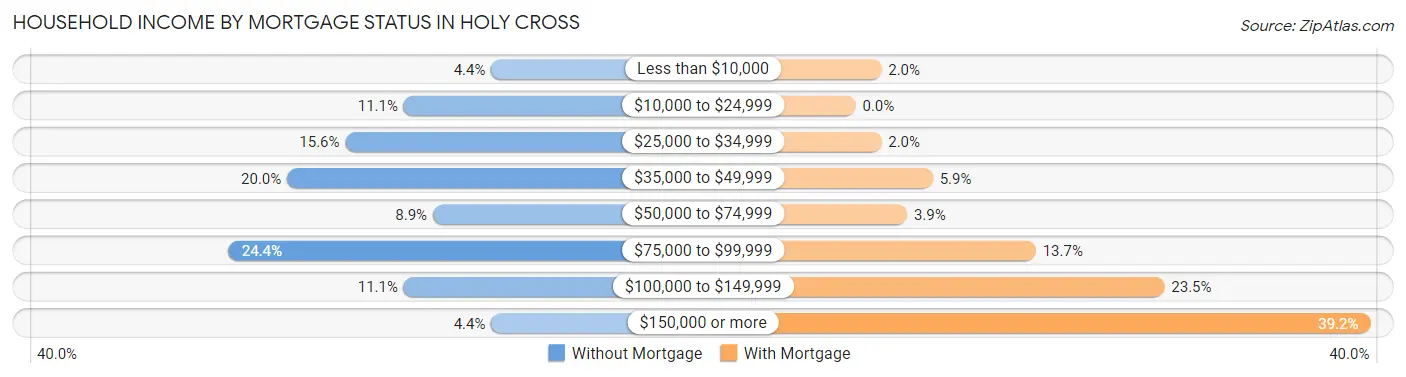
| Household Income | Without Mortgage | With Mortgage |
| Less than $10,000 | 2 (4.4%) | 1 (2.0%) |
| $10,000 to $24,999 | 5 (11.1%) | 0 (0.0%) |
| $25,000 to $34,999 | 7 (15.6%) | 1 (2.0%) |
| $35,000 to $49,999 | 9 (20.0%) | 3 (5.9%) |
| $50,000 to $74,999 | 4 (8.9%) | 2 (3.9%) |
| $75,000 to $99,999 | 11 (24.4%) | 7 (13.7%) |
| $100,000 to $149,999 | 5 (11.1%) | 12 (23.5%) |
| $150,000 or more | 2 (4.4%) | 20 (39.2%) |
| Total | 45 (100.0%) | 51 (100.0%) |
Property Value to Household Income Ratio in Holy Cross
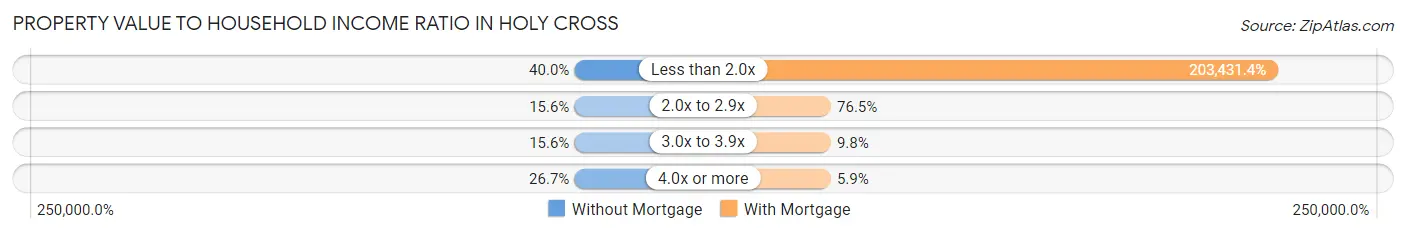
| Value-to-Income Ratio | Without Mortgage | With Mortgage |
| Less than 2.0x | 18 (40.0%) | 103,750 (203,431.4%) |
| 2.0x to 2.9x | 7 (15.6%) | 39 (76.5%) |
| 3.0x to 3.9x | 7 (15.6%) | 5 (9.8%) |
| 4.0x or more | 12 (26.7%) | 3 (5.9%) |
| Total | 45 (100.0%) | 51 (100.0%) |
Real Estate Taxes by Mortgage Status in Holy Cross
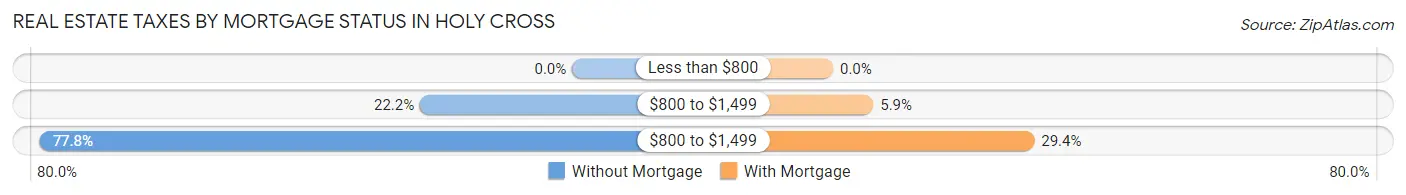
| Property Taxes | Without Mortgage | With Mortgage |
| Less than $800 | 0 (0.0%) | 0 (0.0%) |
| $800 to $1,499 | 10 (22.2%) | 3 (5.9%) |
| $800 to $1,499 | 35 (77.8%) | 15 (29.4%) |
| Total | 45 (100.0%) | 51 (100.0%) |
Health & Disability in Holy Cross
Health Insurance Coverage by Age in Holy Cross
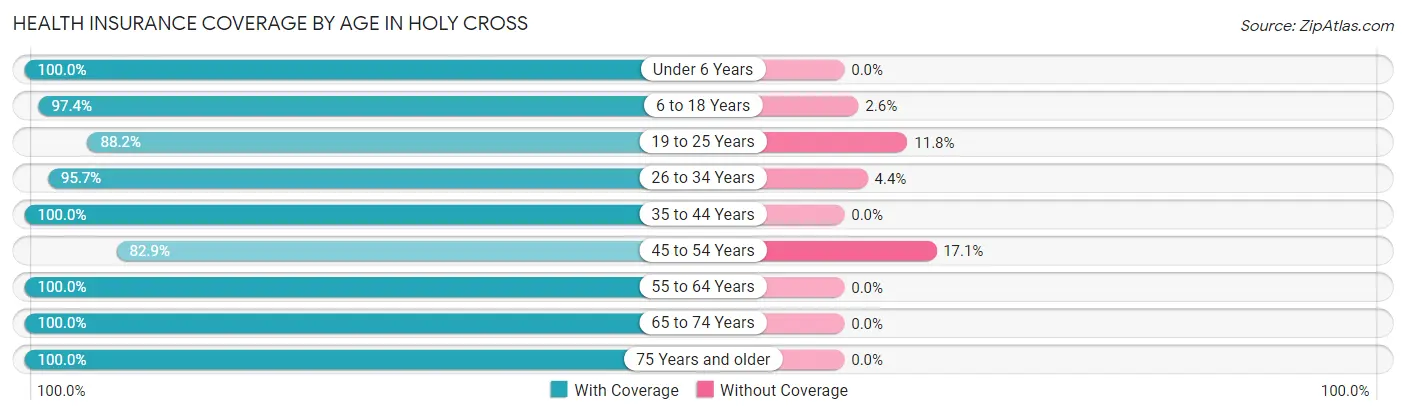
| Age Bracket | With Coverage | Without Coverage |
| Under 6 Years | 27 (100.0%) | 0 (0.0%) |
| 6 to 18 Years | 37 (97.4%) | 1 (2.6%) |
| 19 to 25 Years | 15 (88.2%) | 2 (11.8%) |
| 26 to 34 Years | 44 (95.7%) | 2 (4.3%) |
| 35 to 44 Years | 34 (100.0%) | 0 (0.0%) |
| 45 to 54 Years | 29 (82.9%) | 6 (17.1%) |
| 55 to 64 Years | 22 (100.0%) | 0 (0.0%) |
| 65 to 74 Years | 36 (100.0%) | 0 (0.0%) |
| 75 Years and older | 33 (100.0%) | 0 (0.0%) |
| Total | 277 (96.2%) | 11 (3.8%) |
Health Insurance Coverage by Citizenship Status in Holy Cross
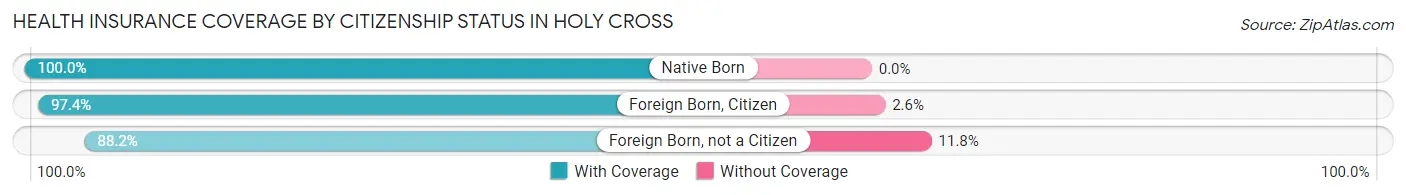
| Citizenship Status | With Coverage | Without Coverage |
| Native Born | 27 (100.0%) | 0 (0.0%) |
| Foreign Born, Citizen | 37 (97.4%) | 1 (2.6%) |
| Foreign Born, not a Citizen | 15 (88.2%) | 2 (11.8%) |
Health Insurance Coverage by Household Income in Holy Cross
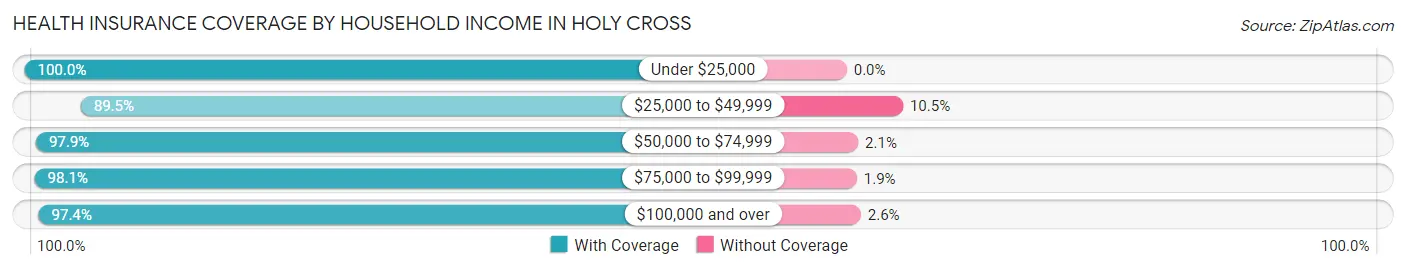
| Household Income | With Coverage | Without Coverage |
| Under $25,000 | 17 (100.0%) | 0 (0.0%) |
| $25,000 to $49,999 | 51 (89.5%) | 6 (10.5%) |
| $50,000 to $74,999 | 46 (97.9%) | 1 (2.1%) |
| $75,000 to $99,999 | 52 (98.1%) | 1 (1.9%) |
| $100,000 and over | 111 (97.4%) | 3 (2.6%) |
Public vs Private Health Insurance Coverage by Age in Holy Cross
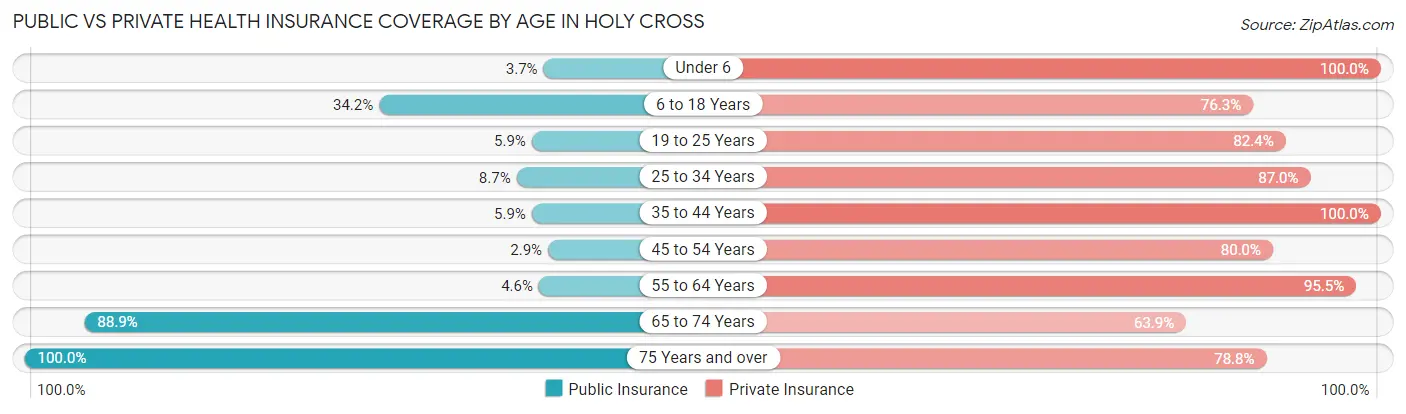
| Age Bracket | Public Insurance | Private Insurance |
| Under 6 | 1 (3.7%) | 27 (100.0%) |
| 6 to 18 Years | 13 (34.2%) | 29 (76.3%) |
| 19 to 25 Years | 1 (5.9%) | 14 (82.4%) |
| 25 to 34 Years | 4 (8.7%) | 40 (87.0%) |
| 35 to 44 Years | 2 (5.9%) | 34 (100.0%) |
| 45 to 54 Years | 1 (2.9%) | 28 (80.0%) |
| 55 to 64 Years | 1 (4.5%) | 21 (95.5%) |
| 65 to 74 Years | 32 (88.9%) | 23 (63.9%) |
| 75 Years and over | 33 (100.0%) | 26 (78.8%) |
| Total | 88 (30.6%) | 242 (84.0%) |
Disability Status by Sex by Age in Holy Cross
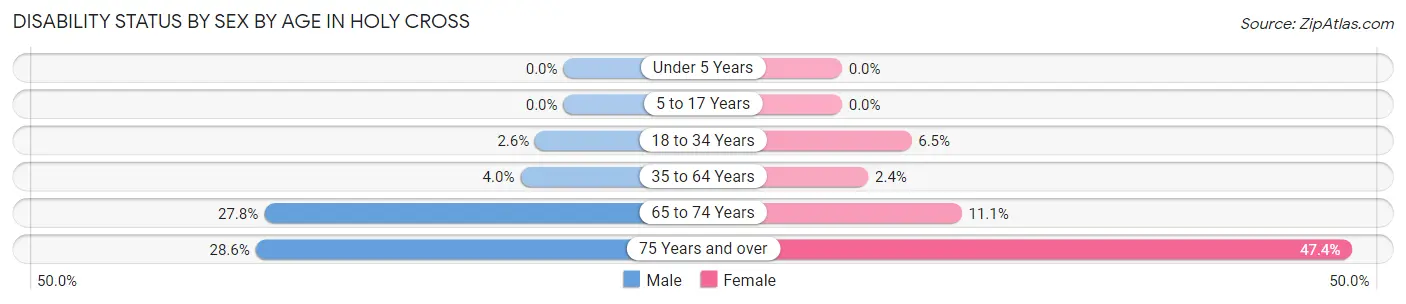
| Age Bracket | Male | Female |
| Under 5 Years | 0 (0.0%) | 0 (0.0%) |
| 5 to 17 Years | 0 (0.0%) | 0 (0.0%) |
| 18 to 34 Years | 1 (2.6%) | 2 (6.5%) |
| 35 to 64 Years | 2 (4.0%) | 1 (2.4%) |
| 65 to 74 Years | 5 (27.8%) | 2 (11.1%) |
| 75 Years and over | 4 (28.6%) | 9 (47.4%) |
Disability Class by Sex by Age in Holy Cross
Disability Class: Hearing Difficulty
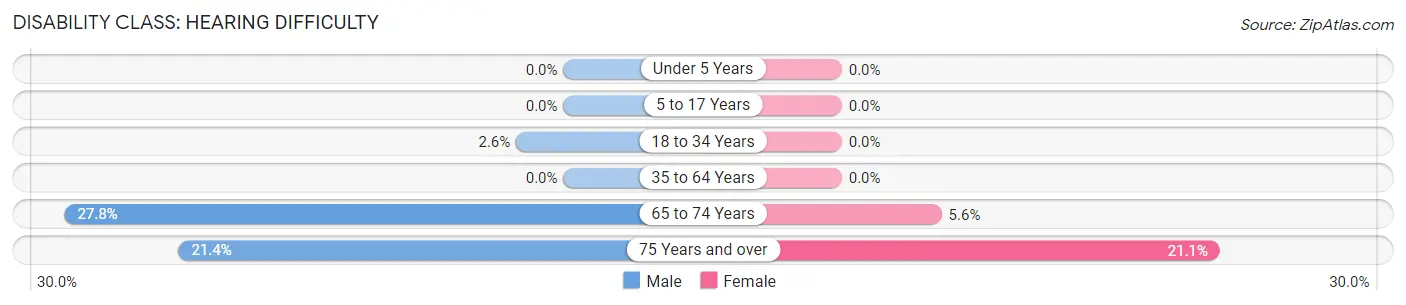
| Age Bracket | Male | Female |
| Under 5 Years | 0 (0.0%) | 0 (0.0%) |
| 5 to 17 Years | 0 (0.0%) | 0 (0.0%) |
| 18 to 34 Years | 1 (2.6%) | 0 (0.0%) |
| 35 to 64 Years | 0 (0.0%) | 0 (0.0%) |
| 65 to 74 Years | 5 (27.8%) | 1 (5.6%) |
| 75 Years and over | 3 (21.4%) | 4 (21.0%) |
Disability Class: Vision Difficulty
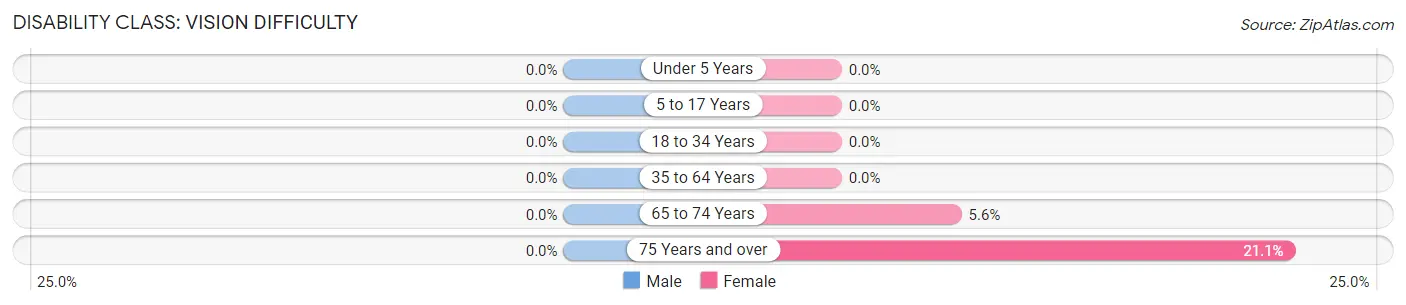
| Age Bracket | Male | Female |
| Under 5 Years | 0 (0.0%) | 0 (0.0%) |
| 5 to 17 Years | 0 (0.0%) | 0 (0.0%) |
| 18 to 34 Years | 0 (0.0%) | 0 (0.0%) |
| 35 to 64 Years | 0 (0.0%) | 0 (0.0%) |
| 65 to 74 Years | 0 (0.0%) | 1 (5.6%) |
| 75 Years and over | 0 (0.0%) | 4 (21.0%) |
Disability Class: Cognitive Difficulty
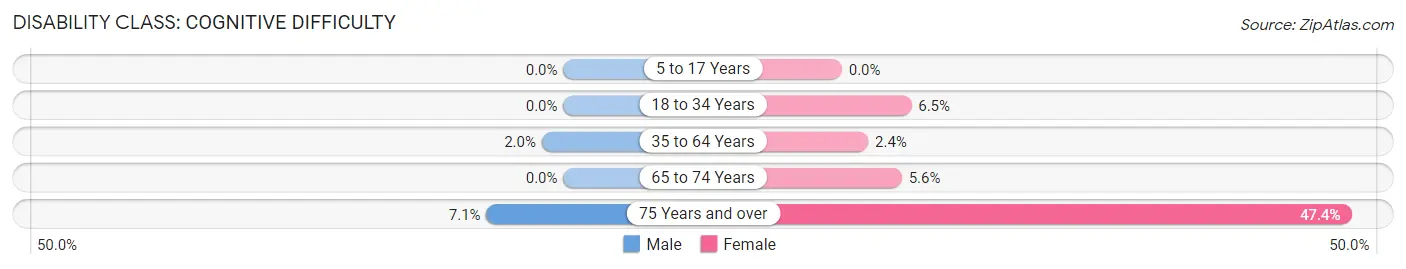
| Age Bracket | Male | Female |
| 5 to 17 Years | 0 (0.0%) | 0 (0.0%) |
| 18 to 34 Years | 0 (0.0%) | 2 (6.5%) |
| 35 to 64 Years | 1 (2.0%) | 1 (2.4%) |
| 65 to 74 Years | 0 (0.0%) | 1 (5.6%) |
| 75 Years and over | 1 (7.1%) | 9 (47.4%) |
Disability Class: Ambulatory Difficulty
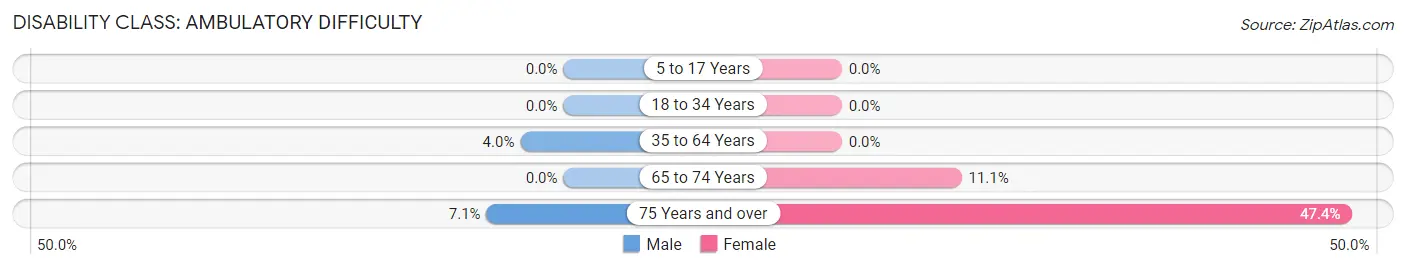
| Age Bracket | Male | Female |
| 5 to 17 Years | 0 (0.0%) | 0 (0.0%) |
| 18 to 34 Years | 0 (0.0%) | 0 (0.0%) |
| 35 to 64 Years | 2 (4.0%) | 0 (0.0%) |
| 65 to 74 Years | 0 (0.0%) | 2 (11.1%) |
| 75 Years and over | 1 (7.1%) | 9 (47.4%) |
Disability Class: Self-Care Difficulty
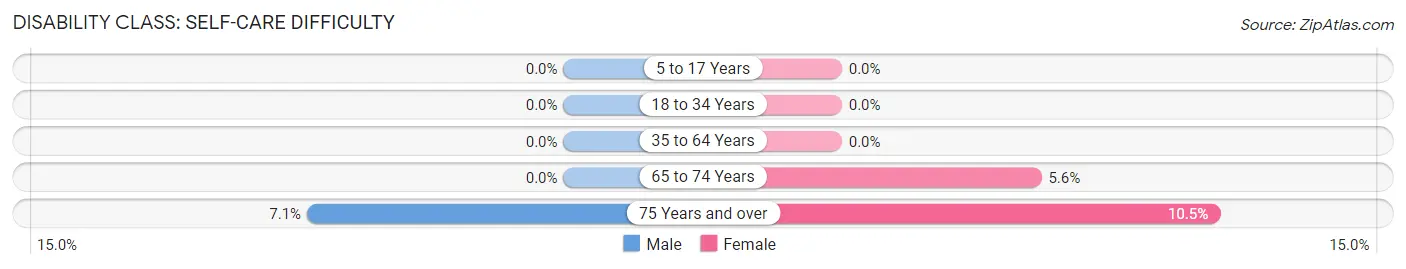
| Age Bracket | Male | Female |
| 5 to 17 Years | 0 (0.0%) | 0 (0.0%) |
| 18 to 34 Years | 0 (0.0%) | 0 (0.0%) |
| 35 to 64 Years | 0 (0.0%) | 0 (0.0%) |
| 65 to 74 Years | 0 (0.0%) | 1 (5.6%) |
| 75 Years and over | 1 (7.1%) | 2 (10.5%) |
Technology Access in Holy Cross
Computing Device Access in Holy Cross
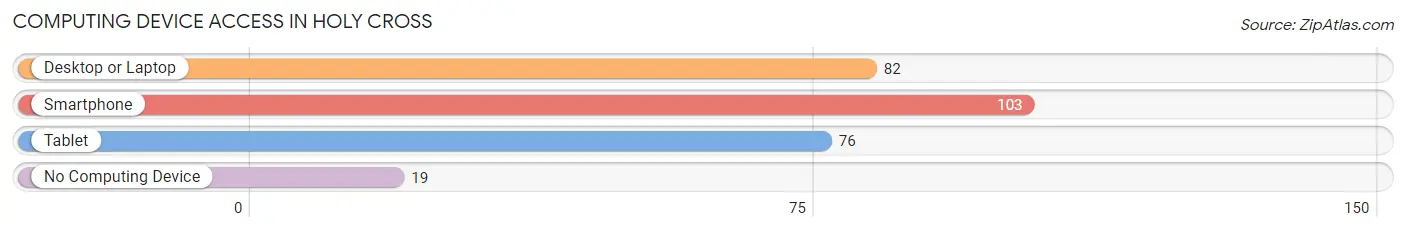
| Device Type | # Households | % Households |
| Desktop or Laptop | 82 | 63.1% |
| Smartphone | 103 | 79.2% |
| Tablet | 76 | 58.5% |
| No Computing Device | 19 | 14.6% |
| Total | 130 | 100.0% |
Internet Access in Holy Cross
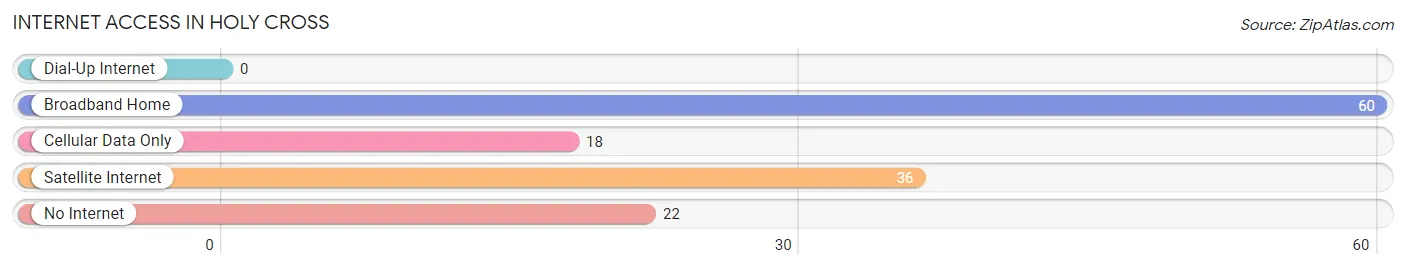
| Internet Type | # Households | % Households |
| Dial-Up Internet | 0 | 0.0% |
| Broadband Home | 60 | 46.2% |
| Cellular Data Only | 18 | 13.9% |
| Satellite Internet | 36 | 27.7% |
| No Internet | 22 | 16.9% |
| Total | 130 | 100.0% |
Holy Cross Summary
Cross, Iowa is a small town located in Dubuque County, Iowa. It is situated on the banks of the Mississippi River, just south of the city of Dubuque. The town was founded in 1845 by a group of German immigrants who were looking for a place to settle and start a new life. The town was named after the nearby Holy Cross Catholic Church, which was built in 1848.
Geographically, Cross is located in the Upper Mississippi Valley, which is characterized by rolling hills and valleys. The town is situated on the banks of the Mississippi River, and is surrounded by the cities of Dubuque, Dyersville, and Cascade. The town is also located near the Iowa-Wisconsin border.
The economy of Cross is largely based on agriculture and tourism. The town is home to several farms, which produce a variety of crops, including corn, soybeans, and hay. The town also has a number of small businesses, including restaurants, shops, and a few small manufacturing companies. In addition, the town is home to a number of tourist attractions, such as the National Mississippi River Museum and Aquarium, the Dubuque County Historical Society, and the Dubuque County Fairgrounds.
The population of Cross in 2000 was 1,845. The town is predominantly white, with a small percentage of African Americans, Hispanics, and Asians. The median household income in 2000 was $37,941, and the median home value was $90,000. The town has a low unemployment rate, and the majority of the population is employed in the agricultural and tourism industries.
Cross is served by the Dubuque Community School District, which includes two elementary schools, one middle school, and one high school. The town also has a number of churches, including the Holy Cross Catholic Church, which was built in 1848.
Cross is a small town with a rich history and a vibrant economy. The town is home to a number of farms, businesses, and tourist attractions, and is a great place to live and work. The town is also home to a number of churches, which provide a sense of community and spiritual guidance to its residents. Cross is a great place to call home, and is a great place to visit.
Common Questions
What is Per Capita Income in Holy Cross?
Per Capita income in Holy Cross is $35,099.
What is the Median Family Income in Holy Cross?
Median Family Income in Holy Cross is $96,875.
What is the Median Household income in Holy Cross?
Median Household Income in Holy Cross is $72,857.
What is Income or Wage Gap in Holy Cross?
Income or Wage Gap in Holy Cross is 41.8%.
Women in Holy Cross earn 58.2 cents for every dollar earned by a man.
What is Inequality or Gini Index in Holy Cross?
Inequality or Gini Index in Holy Cross is 0.38.
What is the Total Population of Holy Cross?
Total Population of Holy Cross is 288.
What is the Total Male Population of Holy Cross?
Total Male Population of Holy Cross is 148.
What is the Total Female Population of Holy Cross?
Total Female Population of Holy Cross is 140.
What is the Ratio of Males per 100 Females in Holy Cross?
There are 105.71 Males per 100 Females in Holy Cross.
What is the Ratio of Females per 100 Males in Holy Cross?
There are 94.59 Females per 100 Males in Holy Cross.
What is the Median Population Age in Holy Cross?
Median Population Age in Holy Cross is 38.6 Years.
What is the Average Family Size in Holy Cross
Average Family Size in Holy Cross is 3.1 People.
What is the Average Household Size in Holy Cross
Average Household Size in Holy Cross is 2.2 People.
How Large is the Labor Force in Holy Cross?
There are 167 People in the Labor Forcein in Holy Cross.
What is the Percentage of People in the Labor Force in Holy Cross?
72.6% of People are in the Labor Force in Holy Cross.
What is the Unemployment Rate in Holy Cross?
Unemployment Rate in Holy Cross is 1.2%.