Hawkeye, IA Map & Demographics
Hawkeye Map
Hawkeye Overview
$27,960
PER CAPITA INCOME
$65,909
AVG FAMILY INCOME
$55,938
AVG HOUSEHOLD INCOME
23.6%
WAGE / INCOME GAP [ % ]
76.4¢/ $1
WAGE / INCOME GAP [ $ ]
0.39
INEQUALITY / GINI INDEX
511
TOTAL POPULATION
253
MALE POPULATION
258
FEMALE POPULATION
98.06
MALES / 100 FEMALES
101.98
FEMALES / 100 MALES
40.8
MEDIAN AGE
3.0
AVG FAMILY SIZE
2.5
AVG HOUSEHOLD SIZE
279
LABOR FORCE [ PEOPLE ]
67.6%
PERCENT IN LABOR FORCE
1.8%
UNEMPLOYMENT RATE
Hawkeye Zip Codes
Hawkeye Area Codes
Income in Hawkeye
Income Overview in Hawkeye
Per Capita Income in Hawkeye is $27,960, while median incomes of families and households are $65,909 and $55,938 respectively.
| Characteristic | Number | Measure |
| Per Capita Income | 511 | $27,960 |
| Median Family Income | 124 | $65,909 |
| Mean Family Income | 124 | $76,492 |
| Median Household Income | 207 | $55,938 |
| Mean Household Income | 207 | $68,539 |
| Income Deficit | 124 | $0 |
| Wage / Income Gap (%) | 511 | 23.61% |
| Wage / Income Gap ($) | 511 | 76.39¢ per $1 |
| Gini / Inequality Index | 511 | 0.39 |
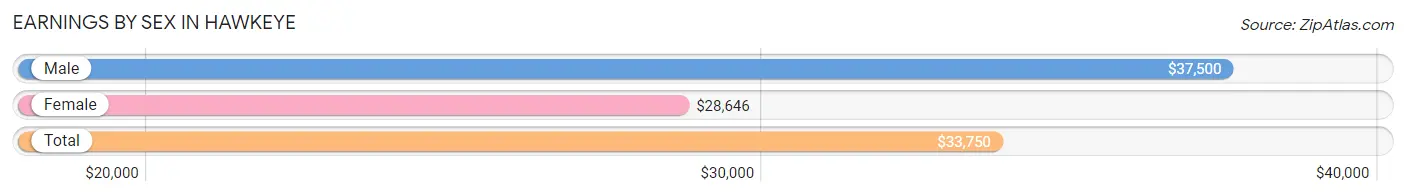
Earnings by Sex in Hawkeye
Average Earnings in Hawkeye are $33,750, $37,500 for men and $28,646 for women, a difference of 23.6%.
| Sex | Number | Average Earnings |
| Male | 168 (57.3%) | $37,500 |
| Female | 125 (42.7%) | $28,646 |
| Total | 293 (100.0%) | $33,750 |
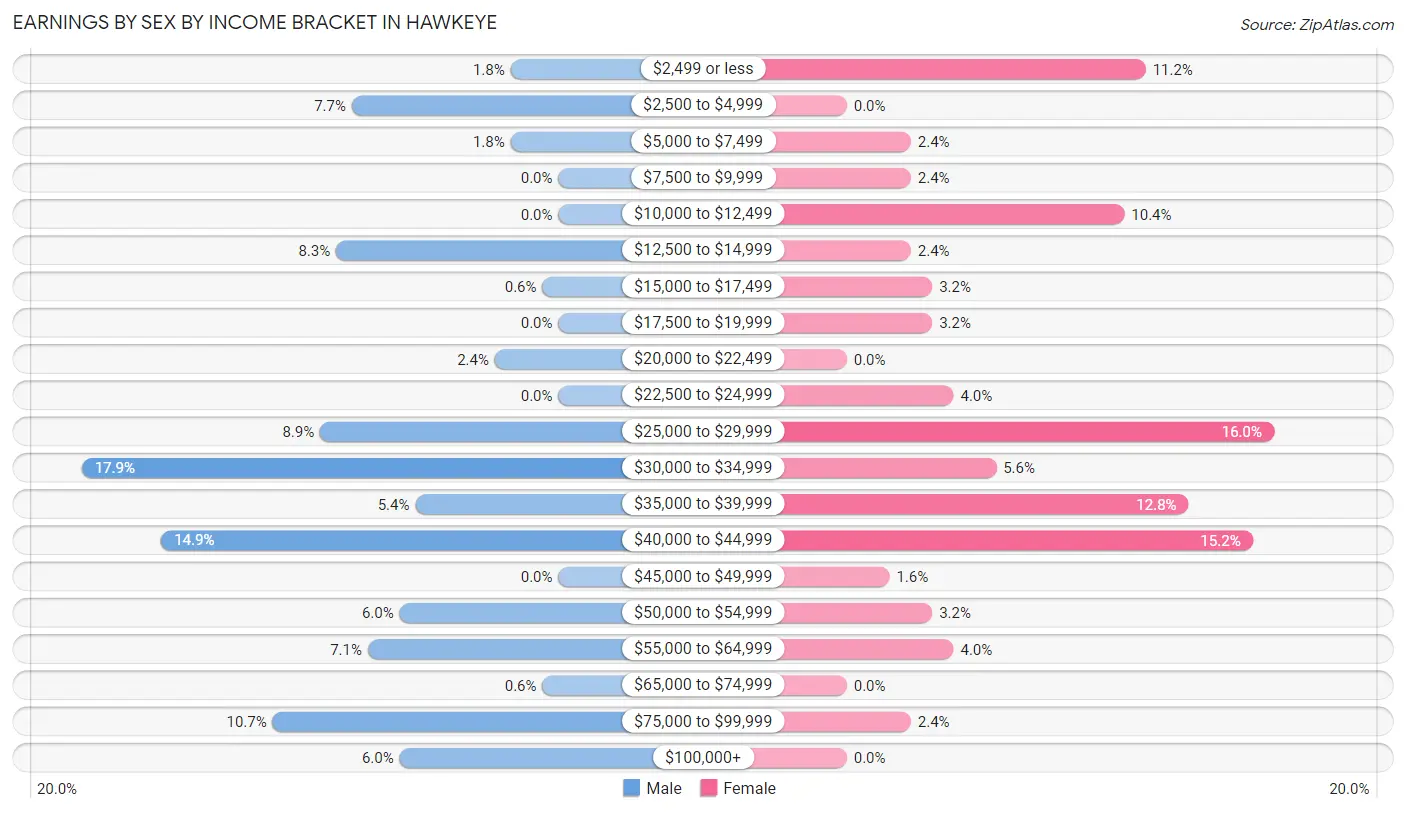
Earnings by Sex by Income Bracket in Hawkeye
The most common earnings brackets in Hawkeye are $30,000 to $34,999 for men (30 | 17.9%) and $25,000 to $29,999 for women (20 | 16.0%).
| Income | Male | Female |
| $2,499 or less | 3 (1.8%) | 14 (11.2%) |
| $2,500 to $4,999 | 13 (7.7%) | 0 (0.0%) |
| $5,000 to $7,499 | 3 (1.8%) | 3 (2.4%) |
| $7,500 to $9,999 | 0 (0.0%) | 3 (2.4%) |
| $10,000 to $12,499 | 0 (0.0%) | 13 (10.4%) |
| $12,500 to $14,999 | 14 (8.3%) | 3 (2.4%) |
| $15,000 to $17,499 | 1 (0.6%) | 4 (3.2%) |
| $17,500 to $19,999 | 0 (0.0%) | 4 (3.2%) |
| $20,000 to $22,499 | 4 (2.4%) | 0 (0.0%) |
| $22,500 to $24,999 | 0 (0.0%) | 5 (4.0%) |
| $25,000 to $29,999 | 15 (8.9%) | 20 (16.0%) |
| $30,000 to $34,999 | 30 (17.9%) | 7 (5.6%) |
| $35,000 to $39,999 | 9 (5.4%) | 16 (12.8%) |
| $40,000 to $44,999 | 25 (14.9%) | 19 (15.2%) |
| $45,000 to $49,999 | 0 (0.0%) | 2 (1.6%) |
| $50,000 to $54,999 | 10 (5.9%) | 4 (3.2%) |
| $55,000 to $64,999 | 12 (7.1%) | 5 (4.0%) |
| $65,000 to $74,999 | 1 (0.6%) | 0 (0.0%) |
| $75,000 to $99,999 | 18 (10.7%) | 3 (2.4%) |
| $100,000+ | 10 (5.9%) | 0 (0.0%) |
| Total | 168 (100.0%) | 125 (100.0%) |
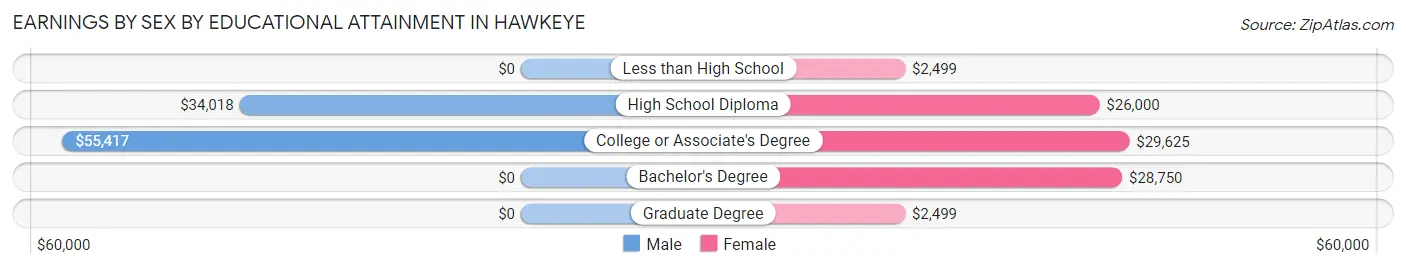
Earnings by Sex by Educational Attainment in Hawkeye
Average earnings in Hawkeye are $37,500 for men and $28,333 for women, a difference of 24.4%. Men with an educational attainment of college or associate's degree enjoy the highest average annual earnings of $55,417, while those with high school diploma education earn the least with $34,018. Women with an educational attainment of college or associate's degree earn the most with the average annual earnings of $29,625, while those with less than high school education have the smallest earnings of $2,499.
| Educational Attainment | Male Income | Female Income |
| Less than High School | - | - |
| High School Diploma | $34,018 | $26,000 |
| College or Associate's Degree | $55,417 | $29,625 |
| Bachelor's Degree | - | - |
| Graduate Degree | - | - |
| Total | $37,500 | $28,333 |
Family Income in Hawkeye
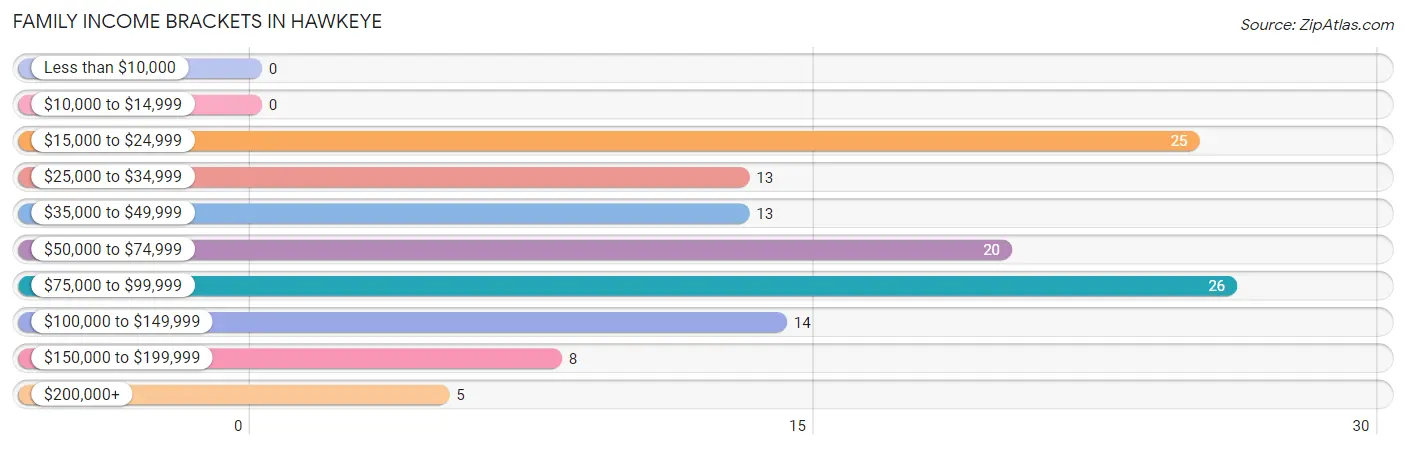
Family Income Brackets in Hawkeye
According to the Hawkeye family income data, there are 26 families falling into the $75,000 to $99,999 income range, which is the most common income bracket and makes up 21.0% of all families.
| Income Bracket | # Families | % Families |
| Less than $10,000 | 0 | 0.0% |
| $10,000 to $14,999 | 0 | 0.0% |
| $15,000 to $24,999 | 25 | 20.2% |
| $25,000 to $34,999 | 13 | 10.5% |
| $35,000 to $49,999 | 13 | 10.5% |
| $50,000 to $74,999 | 20 | 16.1% |
| $75,000 to $99,999 | 26 | 21.0% |
| $100,000 to $149,999 | 14 | 11.3% |
| $150,000 to $199,999 | 8 | 6.5% |
| $200,000+ | 5 | 4.0% |
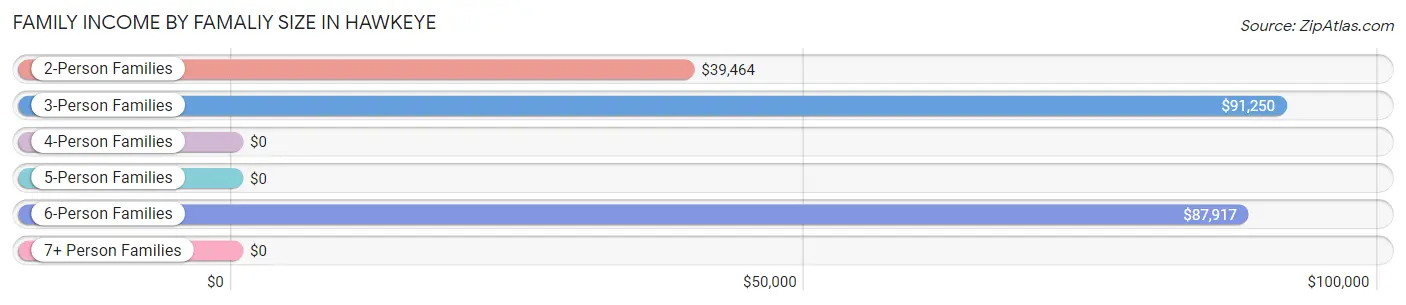
Family Income by Famaliy Size in Hawkeye
3-person families (7 | 5.7%) account for the highest median family income in Hawkeye with $91,250 per family, while 3-person families (7 | 5.7%) have the highest median income of $30,417 per family member.
| Income Bracket | # Families | Median Income |
| 2-Person Families | 83 (66.9%) | $39,464 |
| 3-Person Families | 7 (5.7%) | $91,250 |
| 4-Person Families | 22 (17.7%) | $0 |
| 5-Person Families | 3 (2.4%) | $0 |
| 6-Person Families | 9 (7.3%) | $87,917 |
| 7+ Person Families | 0 (0.0%) | $0 |
| Total | 124 (100.0%) | $65,909 |
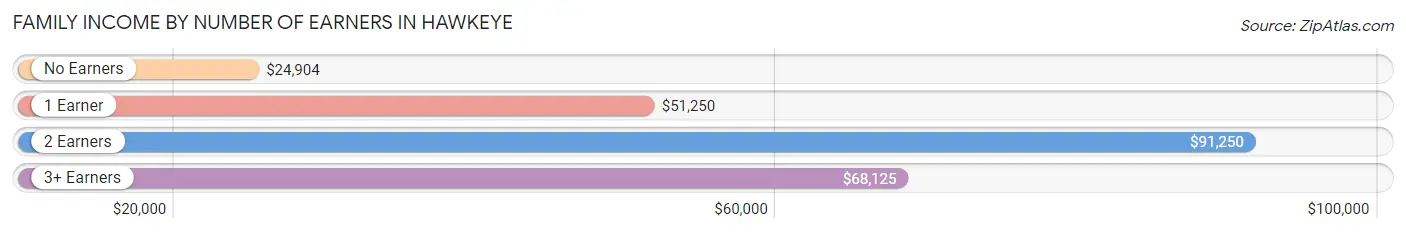
Family Income by Number of Earners in Hawkeye
The median family income in Hawkeye is $65,909, with families comprising 2 earners (55) having the highest median family income of $91,250, while families with no earners (25) have the lowest median family income of $24,904, accounting for 44.4% and 20.2% of families, respectively.
| Number of Earners | # Families | Median Income |
| No Earners | 25 (20.2%) | $24,904 |
| 1 Earner | 35 (28.2%) | $51,250 |
| 2 Earners | 55 (44.4%) | $91,250 |
| 3+ Earners | 9 (7.3%) | $68,125 |
| Total | 124 (100.0%) | $65,909 |
Household Income in Hawkeye
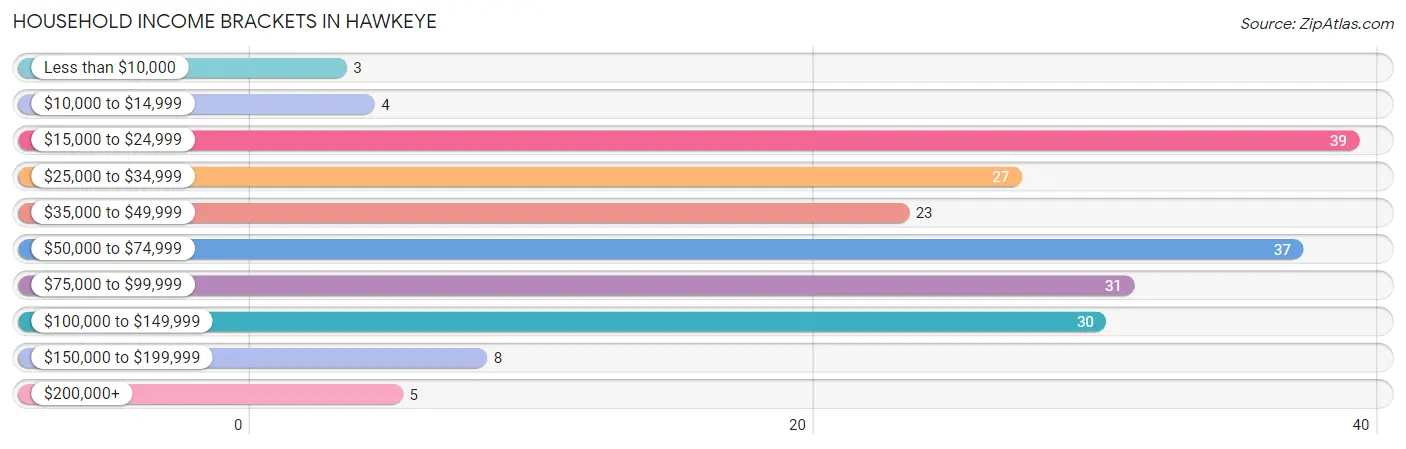
Household Income Brackets in Hawkeye
With 39 households falling in the category, the $15,000 to $24,999 income range is the most frequent in Hawkeye, accounting for 18.8% of all households. In contrast, only 3 households (1.5%) fall into the less than $10,000 income bracket, making it the least populous group.
| Income Bracket | # Households | % Households |
| Less than $10,000 | 3 | 1.4% |
| $10,000 to $14,999 | 4 | 1.9% |
| $15,000 to $24,999 | 39 | 18.8% |
| $25,000 to $34,999 | 27 | 13.0% |
| $35,000 to $49,999 | 23 | 11.1% |
| $50,000 to $74,999 | 37 | 17.9% |
| $75,000 to $99,999 | 31 | 15.0% |
| $100,000 to $149,999 | 30 | 14.5% |
| $150,000 to $199,999 | 8 | 3.9% |
| $200,000+ | 5 | 2.4% |
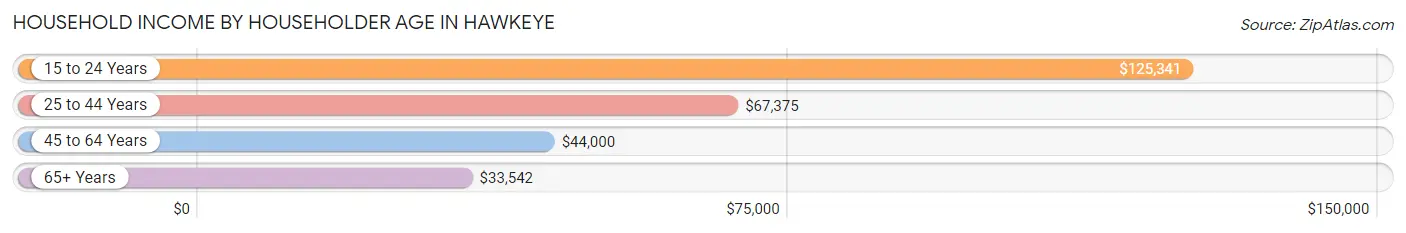
Household Income by Householder Age in Hawkeye
The median household income in Hawkeye is $55,938, with the highest median household income of $125,341 found in the 15 to 24 years age bracket for the primary householder. A total of 19 households (9.2%) fall into this category. Meanwhile, the 65+ years age bracket for the primary householder has the lowest median household income of $33,542, with 73 households (35.3%) in this group.
| Income Bracket | # Households | Median Income |
| 15 to 24 Years | 19 (9.2%) | $125,341 |
| 25 to 44 Years | 65 (31.4%) | $67,375 |
| 45 to 64 Years | 50 (24.1%) | $44,000 |
| 65+ Years | 73 (35.3%) | $33,542 |
| Total | 207 (100.0%) | $55,938 |
Poverty in Hawkeye
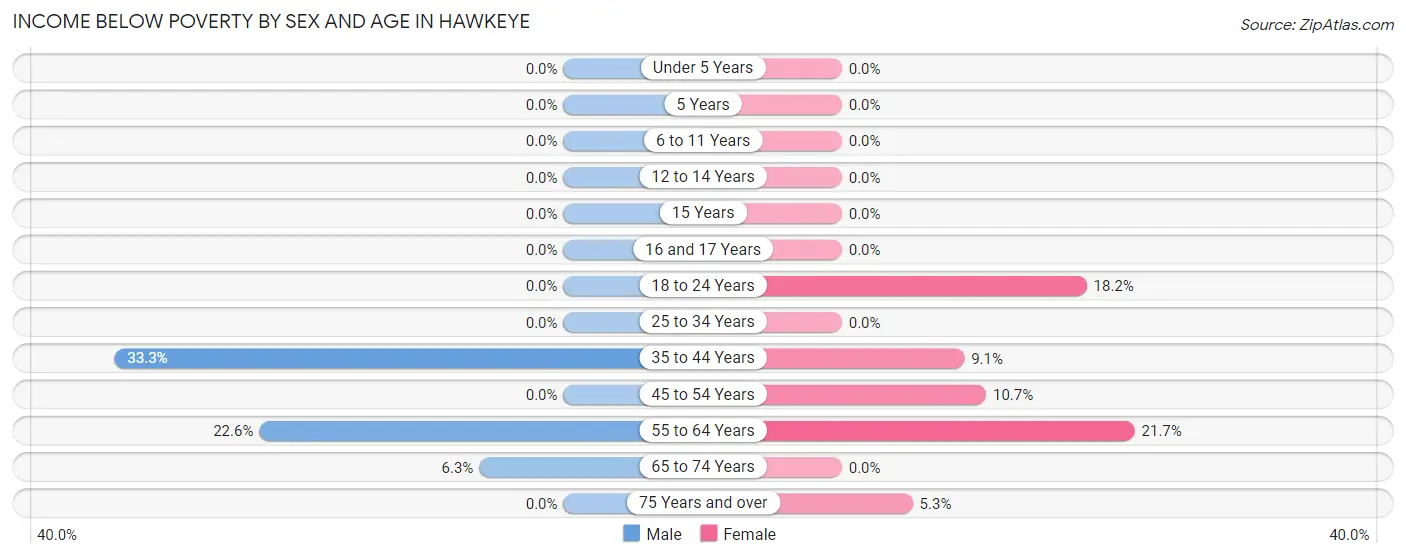
Income Below Poverty by Sex and Age in Hawkeye
With 8.7% poverty level for males and 6.2% for females among the residents of Hawkeye, 35 to 44 year old males and 55 to 64 year old females are the most vulnerable to poverty, with 13 males (33.3%) and 5 females (21.7%) in their respective age groups living below the poverty level.
| Age Bracket | Male | Female |
| Under 5 Years | 0 (0.0%) | 0 (0.0%) |
| 5 Years | 0 (0.0%) | 0 (0.0%) |
| 6 to 11 Years | 0 (0.0%) | 0 (0.0%) |
| 12 to 14 Years | 0 (0.0%) | 0 (0.0%) |
| 15 Years | 0 (0.0%) | 0 (0.0%) |
| 16 and 17 Years | 0 (0.0%) | 0 (0.0%) |
| 18 to 24 Years | 0 (0.0%) | 4 (18.2%) |
| 25 to 34 Years | 0 (0.0%) | 0 (0.0%) |
| 35 to 44 Years | 13 (33.3%) | 3 (9.1%) |
| 45 to 54 Years | 0 (0.0%) | 3 (10.7%) |
| 55 to 64 Years | 7 (22.6%) | 5 (21.7%) |
| 65 to 74 Years | 2 (6.2%) | 0 (0.0%) |
| 75 Years and over | 0 (0.0%) | 1 (5.3%) |
| Total | 22 (8.7%) | 16 (6.2%) |
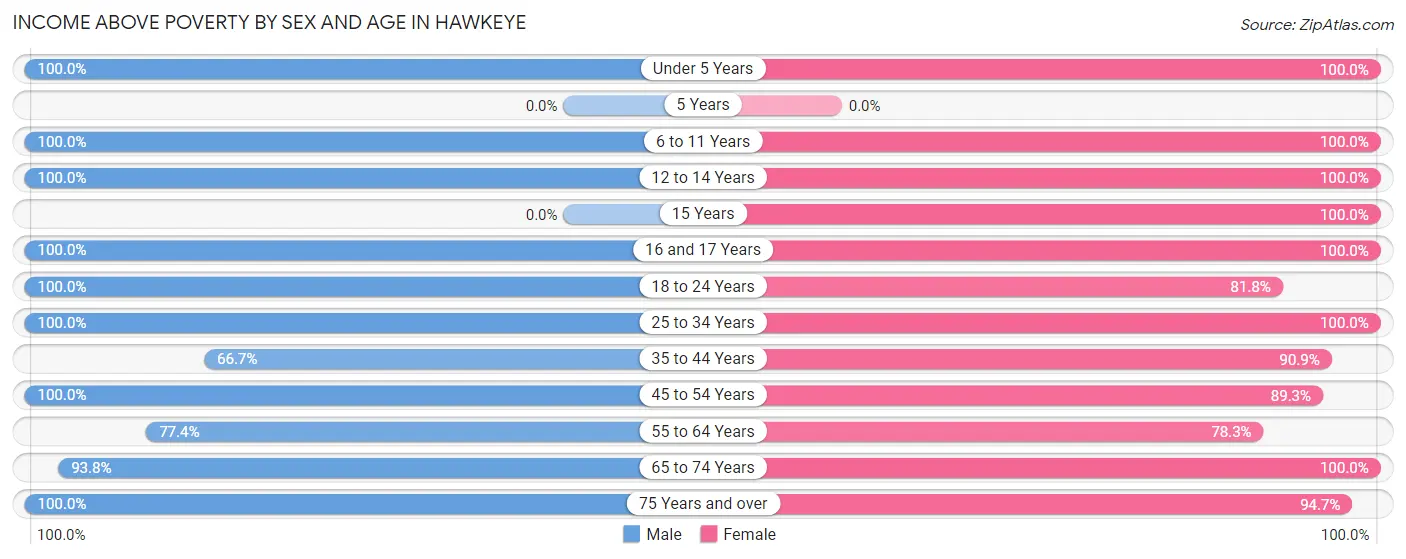
Income Above Poverty by Sex and Age in Hawkeye
According to the poverty statistics in Hawkeye, males aged under 5 years and females aged under 5 years are the age groups that are most secure financially, with 100.0% of males and 100.0% of females in these age groups living above the poverty line.
| Age Bracket | Male | Female |
| Under 5 Years | 9 (100.0%) | 16 (100.0%) |
| 5 Years | 0 (0.0%) | 0 (0.0%) |
| 6 to 11 Years | 13 (100.0%) | 19 (100.0%) |
| 12 to 14 Years | 10 (100.0%) | 28 (100.0%) |
| 15 Years | 0 (0.0%) | 3 (100.0%) |
| 16 and 17 Years | 3 (100.0%) | 11 (100.0%) |
| 18 to 24 Years | 23 (100.0%) | 18 (81.8%) |
| 25 to 34 Years | 38 (100.0%) | 15 (100.0%) |
| 35 to 44 Years | 26 (66.7%) | 30 (90.9%) |
| 45 to 54 Years | 24 (100.0%) | 25 (89.3%) |
| 55 to 64 Years | 24 (77.4%) | 18 (78.3%) |
| 65 to 74 Years | 30 (93.8%) | 41 (100.0%) |
| 75 Years and over | 31 (100.0%) | 18 (94.7%) |
| Total | 231 (91.3%) | 242 (93.8%) |
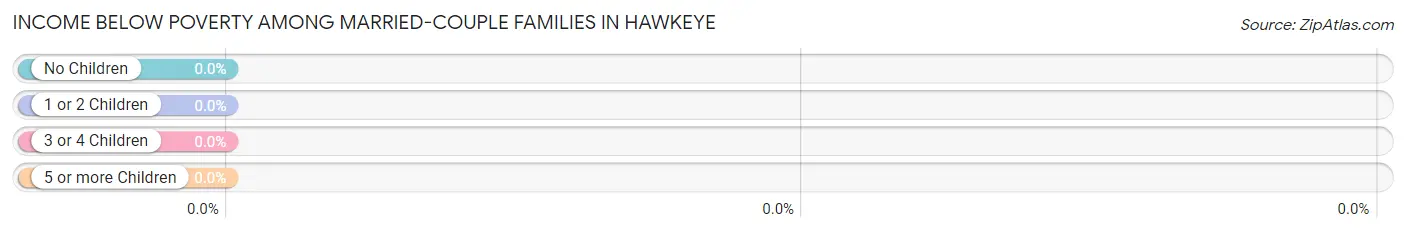
Income Below Poverty Among Married-Couple Families in Hawkeye
| Children | Above Poverty | Below Poverty |
| No Children | 67 (100.0%) | 0 (0.0%) |
| 1 or 2 Children | 24 (100.0%) | 0 (0.0%) |
| 3 or 4 Children | 12 (100.0%) | 0 (0.0%) |
| 5 or more Children | 0 (0.0%) | 0 (0.0%) |
| Total | 103 (100.0%) | 0 (0.0%) |
Income Below Poverty Among Single-Parent Households in Hawkeye
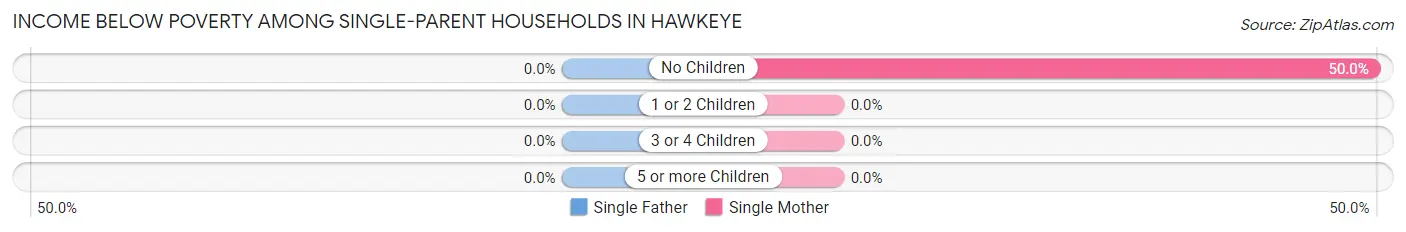
| Children | Single Father | Single Mother |
| No Children | 0 (0.0%) | 4 (50.0%) |
| 1 or 2 Children | 0 (0.0%) | 0 (0.0%) |
| 3 or 4 Children | 0 (0.0%) | 0 (0.0%) |
| 5 or more Children | 0 (0.0%) | 0 (0.0%) |
| Total | 0 (0.0%) | 4 (25.0%) |
Income Below Poverty Among Married-Couple vs Single-Parent Households in Hawkeye
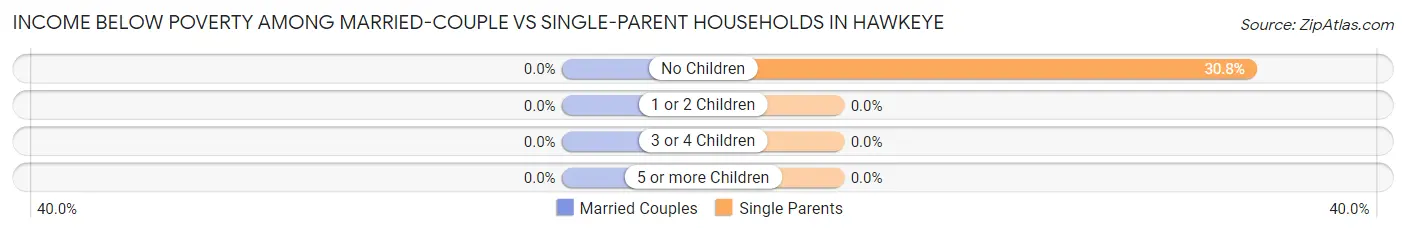
| Children | Married-Couple Families | Single-Parent Households |
| No Children | 0 (0.0%) | 4 (30.8%) |
| 1 or 2 Children | 0 (0.0%) | 0 (0.0%) |
| 3 or 4 Children | 0 (0.0%) | 0 (0.0%) |
| 5 or more Children | 0 (0.0%) | 0 (0.0%) |
| Total | 0 (0.0%) | 4 (19.1%) |
Race in Hawkeye
The most populous races in Hawkeye are White / Caucasian (456 | 89.2%), Two or more Races (42 | 8.2%), and Hispanic or Latino (21 | 4.1%).
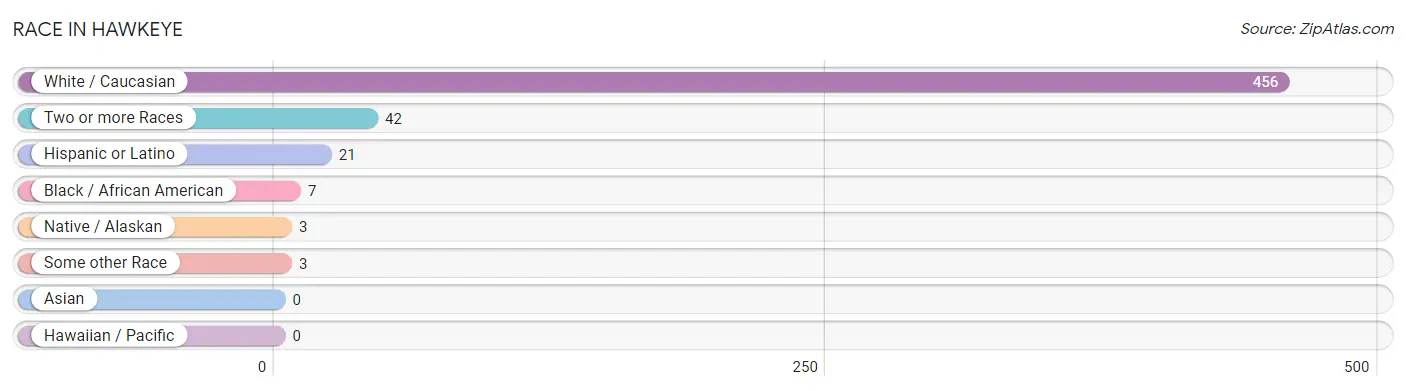
| Race | # Population | % Population |
| Asian | 0 | 0.0% |
| Black / African American | 7 | 1.4% |
| Hawaiian / Pacific | 0 | 0.0% |
| Hispanic or Latino | 21 | 4.1% |
| Native / Alaskan | 3 | 0.6% |
| White / Caucasian | 456 | 89.2% |
| Two or more Races | 42 | 8.2% |
| Some other Race | 3 | 0.6% |
| Total | 511 | 100.0% |
Ancestry in Hawkeye
The most populous ancestries reported in Hawkeye are German (260 | 50.9%), Irish (70 | 13.7%), American (62 | 12.1%), Norwegian (48 | 9.4%), and Mexican (21 | 4.1%), together accounting for 90.2% of all Hawkeye residents.
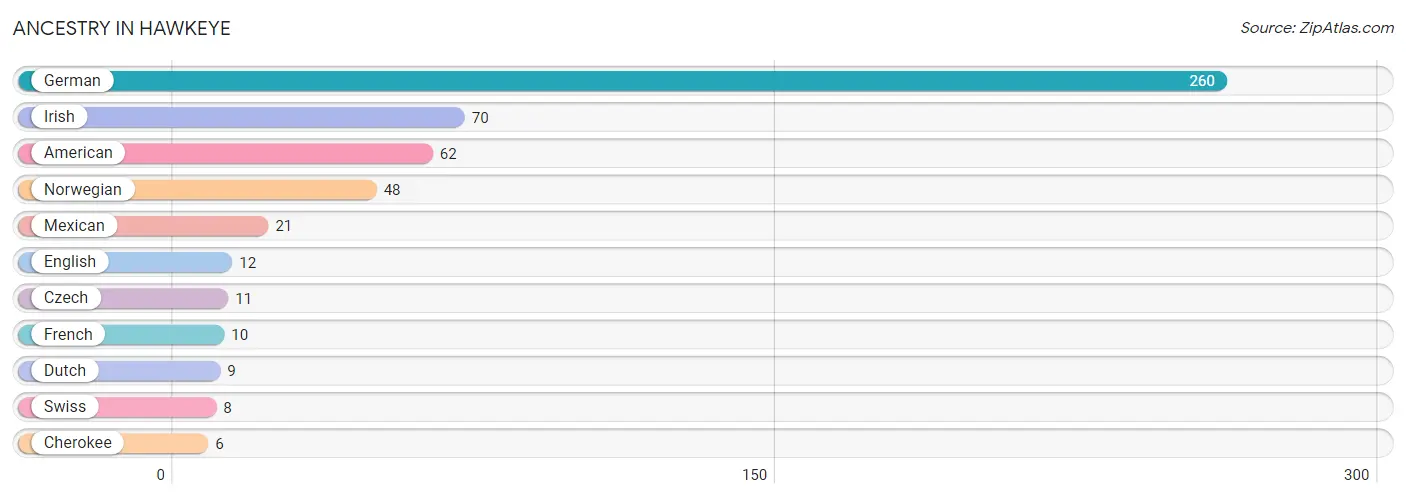
| Ancestry | # Population | % Population |
| American | 62 | 12.1% |
| Cherokee | 6 | 1.2% |
| Czech | 11 | 2.1% |
| Dutch | 9 | 1.8% |
| English | 12 | 2.4% |
| French | 10 | 2.0% |
| German | 260 | 50.9% |
| Irish | 70 | 13.7% |
| Mexican | 21 | 4.1% |
| Norwegian | 48 | 9.4% |
| Swiss | 8 | 1.6% | View All 11 Rows |
Immigrants in Hawkeye

| Immigration Origin | # Population | % Population | View All 0 Rows |
Sex and Age in Hawkeye
Sex and Age in Hawkeye
The most populous age groups in Hawkeye are 30 to 34 Years (26 | 10.3%) for men and 10 to 14 Years (40 | 15.5%) for women.
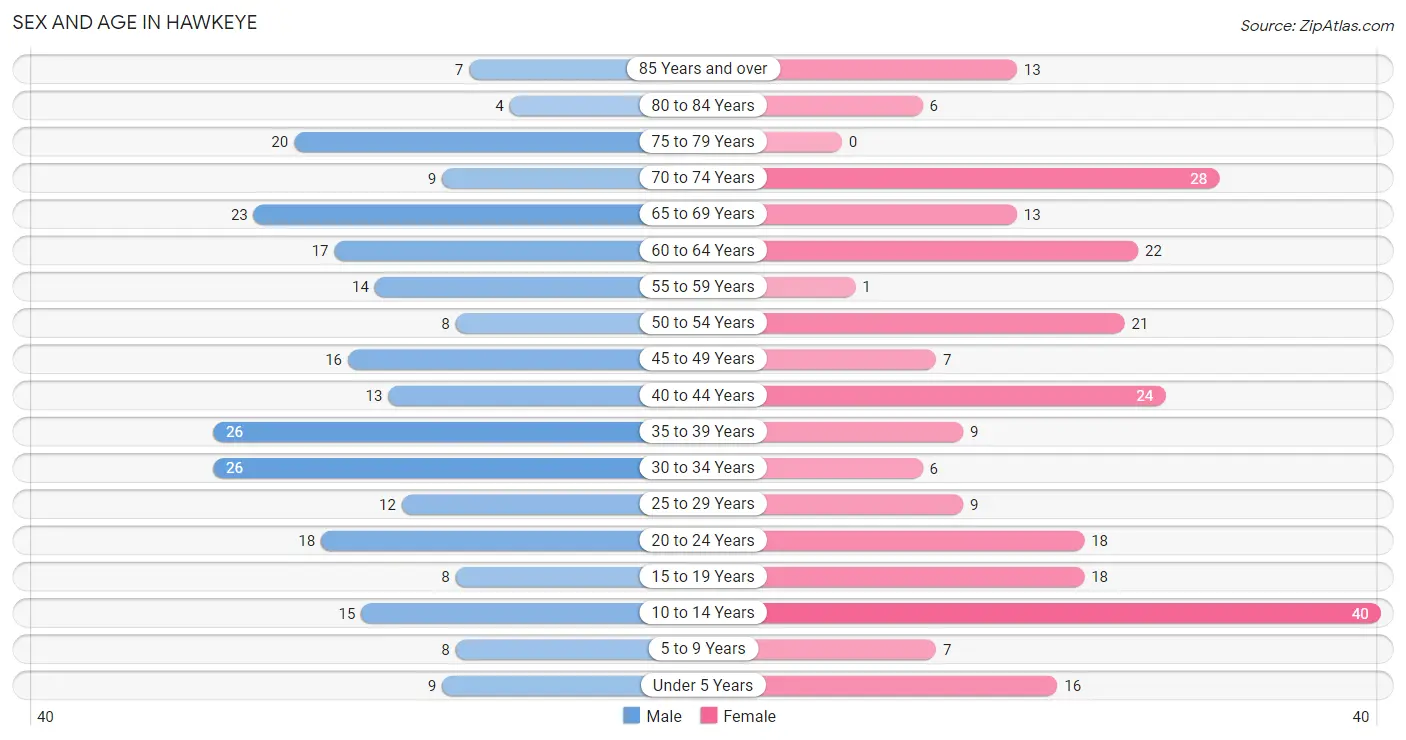
| Age Bracket | Male | Female |
| Under 5 Years | 9 (3.6%) | 16 (6.2%) |
| 5 to 9 Years | 8 (3.2%) | 7 (2.7%) |
| 10 to 14 Years | 15 (5.9%) | 40 (15.5%) |
| 15 to 19 Years | 8 (3.2%) | 18 (7.0%) |
| 20 to 24 Years | 18 (7.1%) | 18 (7.0%) |
| 25 to 29 Years | 12 (4.7%) | 9 (3.5%) |
| 30 to 34 Years | 26 (10.3%) | 6 (2.3%) |
| 35 to 39 Years | 26 (10.3%) | 9 (3.5%) |
| 40 to 44 Years | 13 (5.1%) | 24 (9.3%) |
| 45 to 49 Years | 16 (6.3%) | 7 (2.7%) |
| 50 to 54 Years | 8 (3.2%) | 21 (8.1%) |
| 55 to 59 Years | 14 (5.5%) | 1 (0.4%) |
| 60 to 64 Years | 17 (6.7%) | 22 (8.5%) |
| 65 to 69 Years | 23 (9.1%) | 13 (5.0%) |
| 70 to 74 Years | 9 (3.6%) | 28 (10.8%) |
| 75 to 79 Years | 20 (7.9%) | 0 (0.0%) |
| 80 to 84 Years | 4 (1.6%) | 6 (2.3%) |
| 85 Years and over | 7 (2.8%) | 13 (5.0%) |
| Total | 253 (100.0%) | 258 (100.0%) |
Families and Households in Hawkeye
Median Family Size in Hawkeye
The median family size in Hawkeye is 3.01 persons per family, with married-couple families (103 | 83.1%) accounting for the largest median family size of 3.09 persons per family. On the other hand, single male/father families (5 | 4.0%) represent the smallest median family size with 1.80 persons per family.
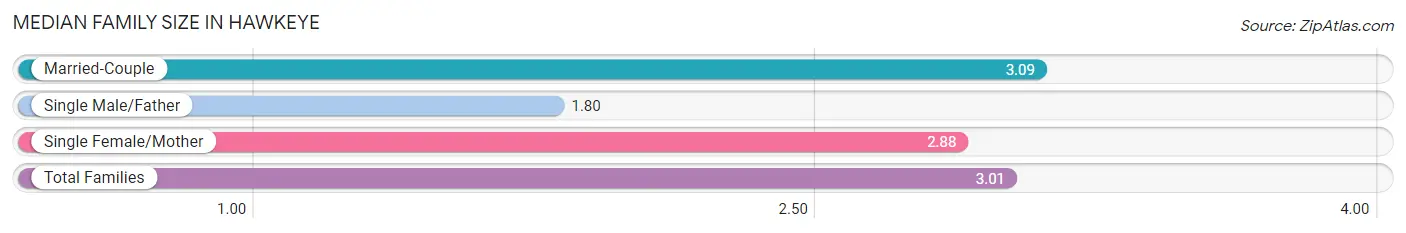
| Family Type | # Families | Family Size |
| Married-Couple | 103 (83.1%) | 3.09 |
| Single Male/Father | 5 (4.0%) | 1.80 |
| Single Female/Mother | 16 (12.9%) | 2.88 |
| Total Families | 124 (100.0%) | 3.01 |
Median Household Size in Hawkeye
The median household size in Hawkeye is 2.47 persons per household, with single female/mother households (16 | 7.7%) accounting for the largest median household size of 3.38 persons per household. non-family households (83 | 40.1%) represent the smallest median household size with 1.51 persons per household.
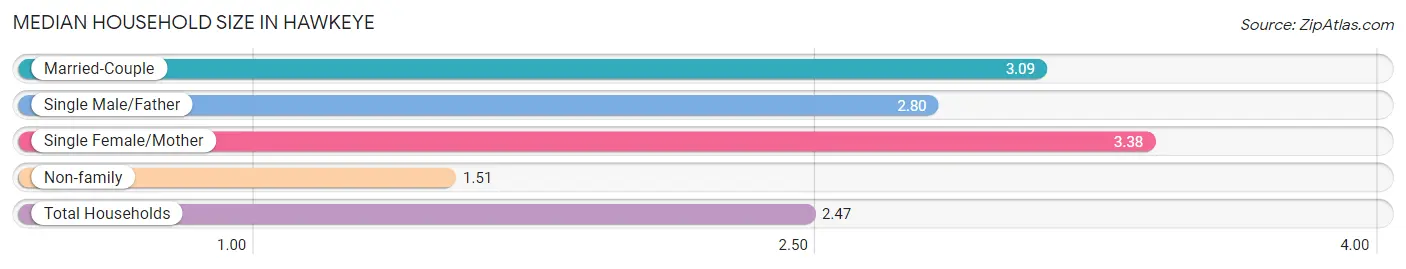
| Household Type | # Households | Household Size |
| Married-Couple | 103 (49.8%) | 3.09 |
| Single Male/Father | 5 (2.4%) | 2.80 |
| Single Female/Mother | 16 (7.7%) | 3.38 |
| Non-family | 83 (40.1%) | 1.51 |
| Total Households | 207 (100.0%) | 2.47 |
Household Size by Marriage Status in Hawkeye
Out of a total of 207 households in Hawkeye, 124 (59.9%) are family households, while 83 (40.1%) are nonfamily households. The most numerous type of family households are 2-person households, comprising 71, and the most common type of nonfamily households are 1-person households, comprising 50.
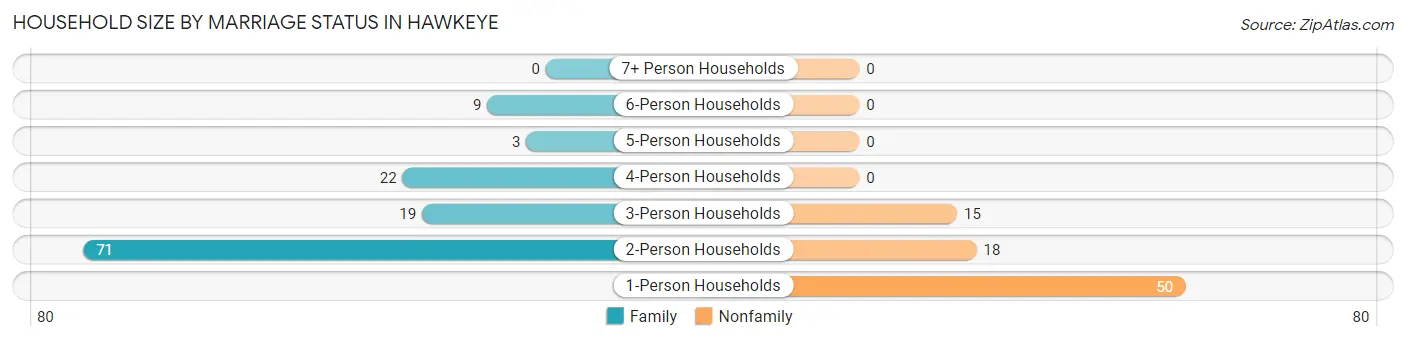
| Household Size | Family Households | Nonfamily Households |
| 1-Person Households | - | 50 (24.1%) |
| 2-Person Households | 71 (34.3%) | 18 (8.7%) |
| 3-Person Households | 19 (9.2%) | 15 (7.2%) |
| 4-Person Households | 22 (10.6%) | 0 (0.0%) |
| 5-Person Households | 3 (1.5%) | 0 (0.0%) |
| 6-Person Households | 9 (4.3%) | 0 (0.0%) |
| 7+ Person Households | 0 (0.0%) | 0 (0.0%) |
| Total | 124 (59.9%) | 83 (40.1%) |
Female Fertility in Hawkeye
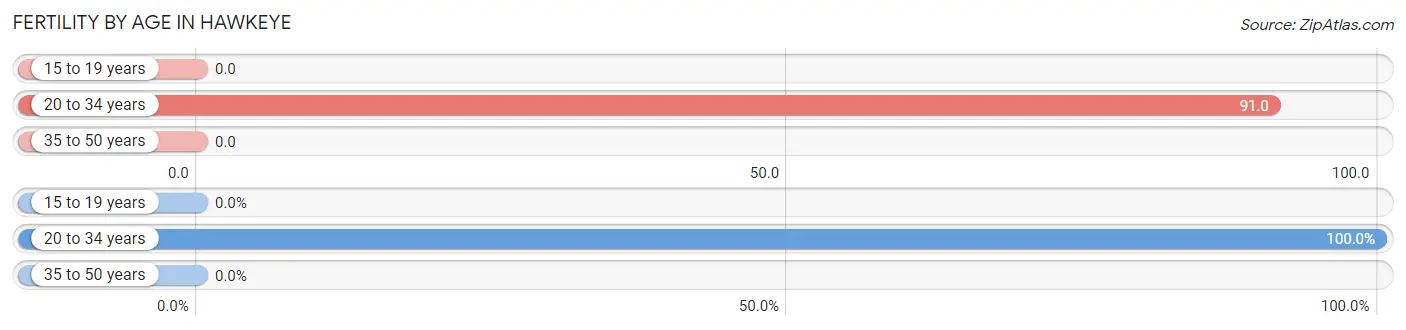
Fertility by Age in Hawkeye
Average fertility rate in Hawkeye is 33.0 births per 1,000 women. Women in the age bracket of 20 to 34 years have the highest fertility rate with 91.0 births per 1,000 women. Women in the age bracket of 20 to 34 years acount for 100.0% of all women with births.
| Age Bracket | Women with Births | Births / 1,000 Women |
| 15 to 19 years | 0 (0.0%) | 0.0 |
| 20 to 34 years | 3 (100.0%) | 91.0 |
| 35 to 50 years | 0 (0.0%) | 0.0 |
| Total | 3 (100.0%) | 33.0 |
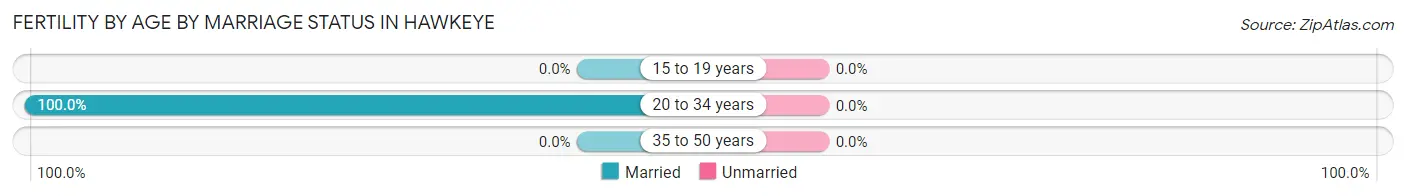
Fertility by Age by Marriage Status in Hawkeye
| Age Bracket | Married | Unmarried |
| 15 to 19 years | 0 (0.0%) | 0 (0.0%) |
| 20 to 34 years | 3 (100.0%) | 0 (0.0%) |
| 35 to 50 years | 0 (0.0%) | 0 (0.0%) |
| Total | 3 (100.0%) | 0 (0.0%) |
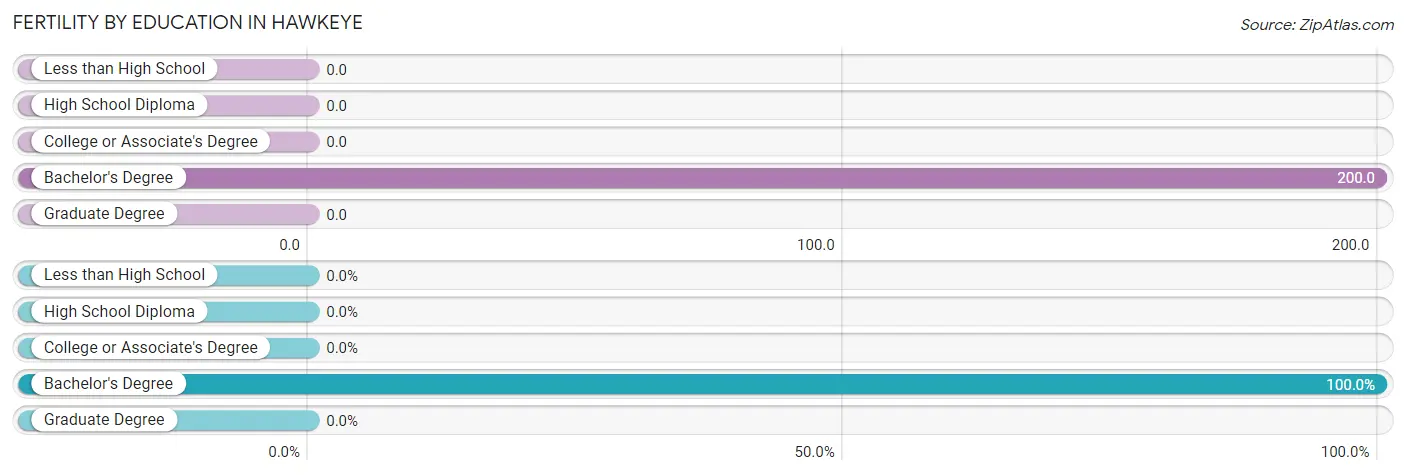
Fertility by Education in Hawkeye
| Educational Attainment | Women with Births | Births / 1,000 Women |
| Less than High School | 0 (0.0%) | 0.0 |
| High School Diploma | 0 (0.0%) | 0.0 |
| College or Associate's Degree | 0 (0.0%) | 0.0 |
| Bachelor's Degree | 3 (100.0%) | 200.0 |
| Graduate Degree | 0 (0.0%) | 0.0 |
| Total | 3 (100.0%) | 33.0 |
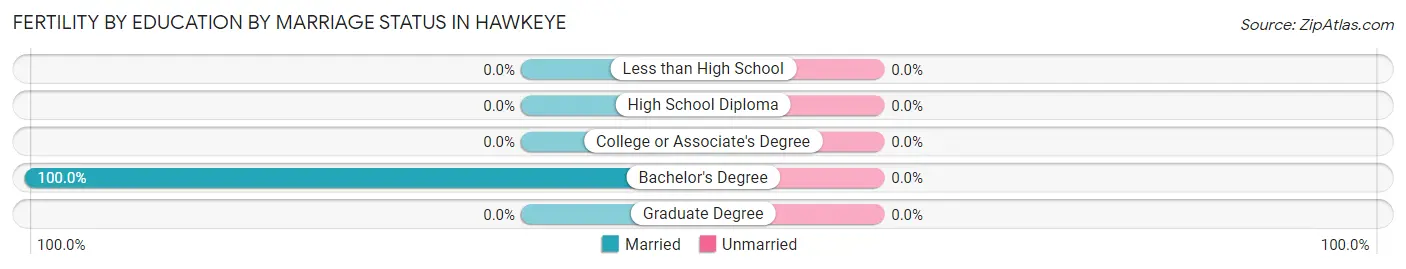
Fertility by Education by Marriage Status in Hawkeye
| Educational Attainment | Married | Unmarried |
| Less than High School | 0 (0.0%) | 0 (0.0%) |
| High School Diploma | 0 (0.0%) | 0 (0.0%) |
| College or Associate's Degree | 0 (0.0%) | 0 (0.0%) |
| Bachelor's Degree | 3 (100.0%) | 0 (0.0%) |
| Graduate Degree | 0 (0.0%) | 0 (0.0%) |
| Total | 3 (100.0%) | 0 (0.0%) |
Employment Characteristics in Hawkeye
Employment by Class of Employer in Hawkeye
Among the 264 employed individuals in Hawkeye, private company employees (196 | 74.2%), self-employed (not incorporated) (33 | 12.5%), and self-employed (incorporated) (11 | 4.2%) make up the most common classes of employment.
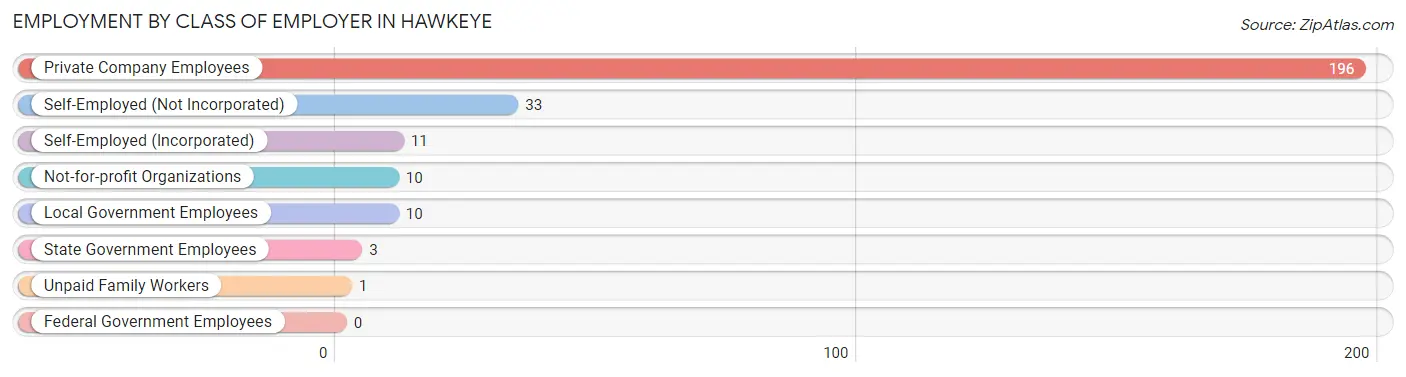
| Employer Class | # Employees | % Employees |
| Private Company Employees | 196 | 74.2% |
| Self-Employed (Incorporated) | 11 | 4.2% |
| Self-Employed (Not Incorporated) | 33 | 12.5% |
| Not-for-profit Organizations | 10 | 3.8% |
| Local Government Employees | 10 | 3.8% |
| State Government Employees | 3 | 1.1% |
| Federal Government Employees | 0 | 0.0% |
| Unpaid Family Workers | 1 | 0.4% |
| Total | 264 | 100.0% |
Employment Status by Age in Hawkeye
According to the labor force statistics for Hawkeye, out of the total population over 16 years of age (413), 67.6% or 279 individuals are in the labor force, with 1.8% or 5 of them unemployed. The age group with the highest labor force participation rate is 20 to 24 years, with 100.0% or 36 individuals in the labor force. Within the labor force, the 16 to 19 years age range has the highest percentage of unemployed individuals, with 11.8% or 2 of them being unemployed.
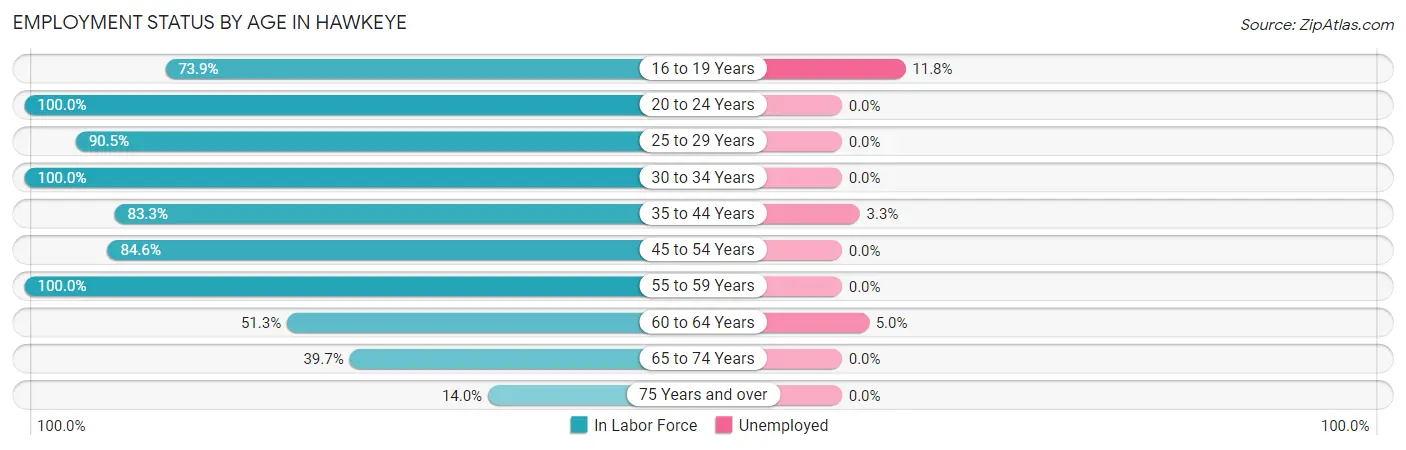
| Age Bracket | In Labor Force | Unemployed |
| 16 to 19 Years | 17 (73.9%) | 2 (11.8%) |
| 20 to 24 Years | 36 (100.0%) | 0 (0.0%) |
| 25 to 29 Years | 19 (90.5%) | 0 (0.0%) |
| 30 to 34 Years | 32 (100.0%) | 0 (0.0%) |
| 35 to 44 Years | 60 (83.3%) | 2 (3.3%) |
| 45 to 54 Years | 44 (84.6%) | 0 (0.0%) |
| 55 to 59 Years | 15 (100.0%) | 0 (0.0%) |
| 60 to 64 Years | 20 (51.3%) | 1 (5.0%) |
| 65 to 74 Years | 29 (39.7%) | 0 (0.0%) |
| 75 Years and over | 7 (14.0%) | 0 (0.0%) |
| Total | 279 (67.6%) | 5 (1.8%) |
Employment Status by Educational Attainment in Hawkeye
According to labor force statistics for Hawkeye, 82.3% of individuals (190) out of the total population between 25 and 64 years of age (231) are in the labor force, with 1.6% or 3 of them being unemployed. The group with the highest labor force participation rate are those with the educational attainment of high school diploma, with 90.5% or 86 individuals in the labor force. Within the labor force, individuals with less than high school education have the highest percentage of unemployment, with 11.1% or 2 of them being unemployed.
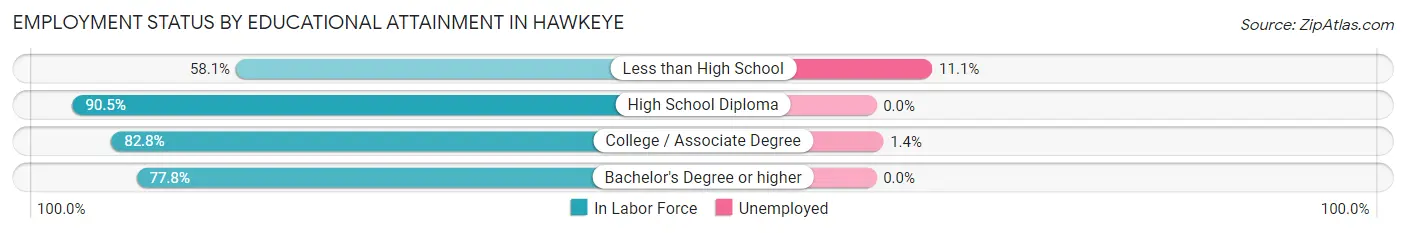
| Educational Attainment | In Labor Force | Unemployed |
| Less than High School | 18 (58.1%) | 3 (11.1%) |
| High School Diploma | 86 (90.5%) | 0 (0.0%) |
| College / Associate Degree | 72 (82.8%) | 1 (1.4%) |
| Bachelor's Degree or higher | 14 (77.8%) | 0 (0.0%) |
| Total | 190 (82.3%) | 4 (1.6%) |
Employment Occupations by Sex in Hawkeye
Management, Business, Science and Arts Occupations
The most common Management, Business, Science and Arts occupations in Hawkeye are Community & Social Service (16 | 5.8%), Management (13 | 4.7%), Health Diagnosing & Treating (13 | 4.7%), Education Instruction & Library (11 | 4.0%), and Health Technologists (8 | 2.9%).
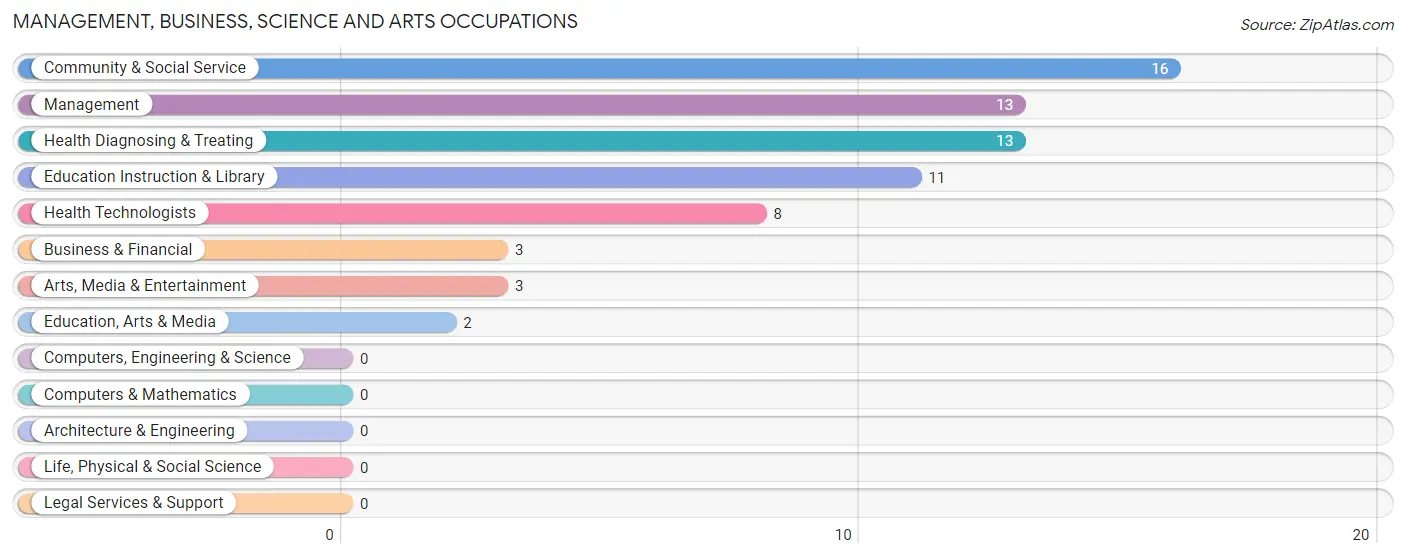
Management, Business, Science and Arts Occupations by Sex
Within the Management, Business, Science and Arts occupations in Hawkeye, the most male-oriented occupations are Arts, Media & Entertainment (100.0%), Management (76.9%), and Education, Arts & Media (50.0%), while the most female-oriented occupations are Education Instruction & Library (100.0%), Health Diagnosing & Treating (100.0%), and Health Technologists (100.0%).
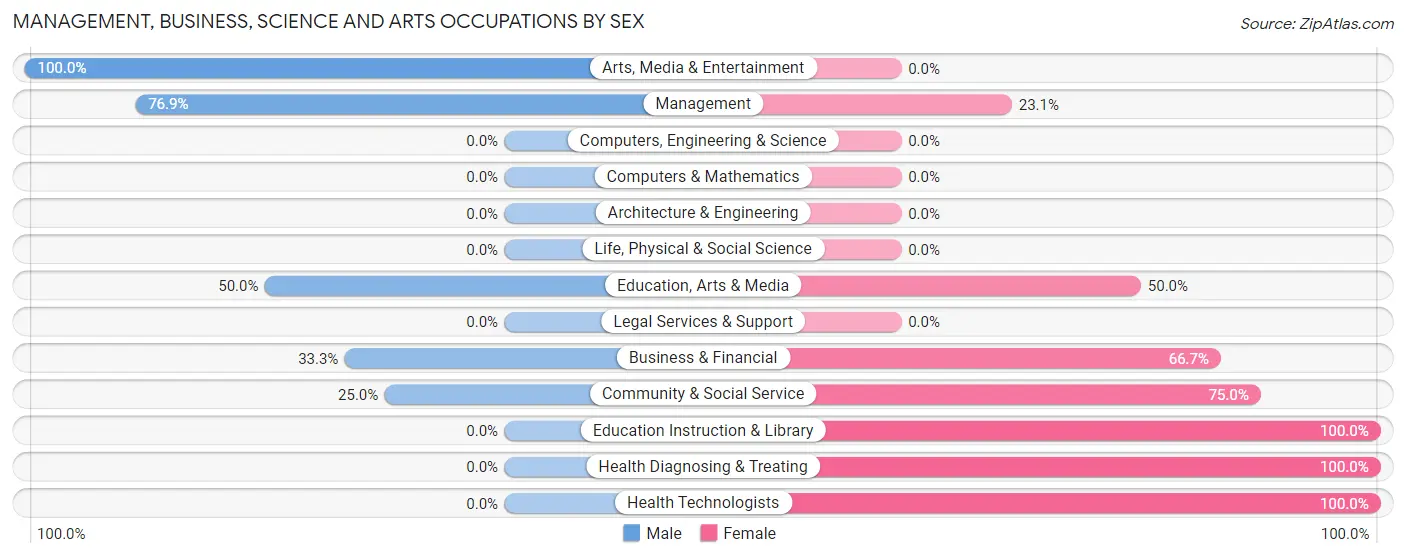
| Occupation | Male | Female |
| Management | 10 (76.9%) | 3 (23.1%) |
| Business & Financial | 1 (33.3%) | 2 (66.7%) |
| Computers, Engineering & Science | 0 (0.0%) | 0 (0.0%) |
| Computers & Mathematics | 0 (0.0%) | 0 (0.0%) |
| Architecture & Engineering | 0 (0.0%) | 0 (0.0%) |
| Life, Physical & Social Science | 0 (0.0%) | 0 (0.0%) |
| Community & Social Service | 4 (25.0%) | 12 (75.0%) |
| Education, Arts & Media | 1 (50.0%) | 1 (50.0%) |
| Legal Services & Support | 0 (0.0%) | 0 (0.0%) |
| Education Instruction & Library | 0 (0.0%) | 11 (100.0%) |
| Arts, Media & Entertainment | 3 (100.0%) | 0 (0.0%) |
| Health Diagnosing & Treating | 0 (0.0%) | 13 (100.0%) |
| Health Technologists | 0 (0.0%) | 8 (100.0%) |
| Total (Category) | 15 (33.3%) | 30 (66.7%) |
| Total (Overall) | 160 (58.4%) | 114 (41.6%) |
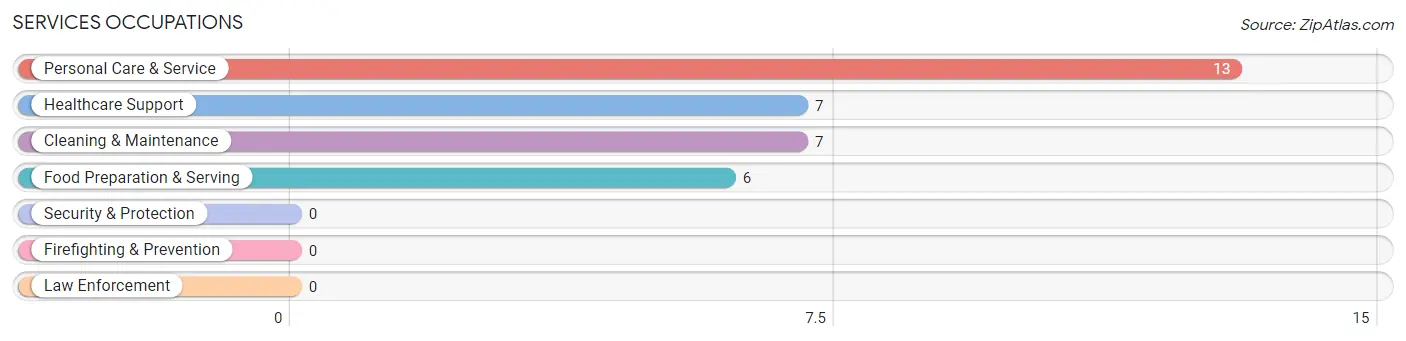
Services Occupations
The most common Services occupations in Hawkeye are Personal Care & Service (13 | 4.7%), Healthcare Support (7 | 2.5%), Cleaning & Maintenance (7 | 2.5%), and Food Preparation & Serving (6 | 2.2%).
Services Occupations by Sex
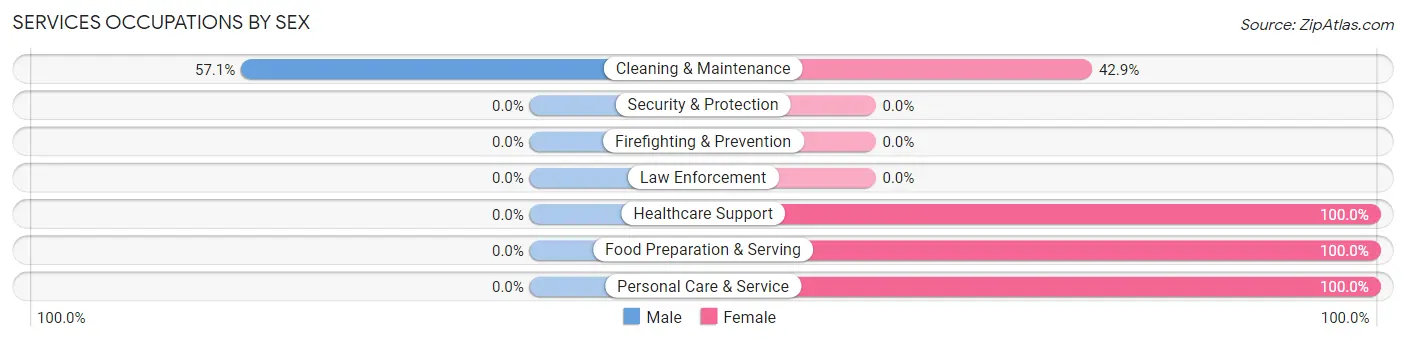
| Occupation | Male | Female |
| Healthcare Support | 0 (0.0%) | 7 (100.0%) |
| Security & Protection | 0 (0.0%) | 0 (0.0%) |
| Firefighting & Prevention | 0 (0.0%) | 0 (0.0%) |
| Law Enforcement | 0 (0.0%) | 0 (0.0%) |
| Food Preparation & Serving | 0 (0.0%) | 6 (100.0%) |
| Cleaning & Maintenance | 4 (57.1%) | 3 (42.9%) |
| Personal Care & Service | 0 (0.0%) | 13 (100.0%) |
| Total (Category) | 4 (12.1%) | 29 (87.9%) |
| Total (Overall) | 160 (58.4%) | 114 (41.6%) |
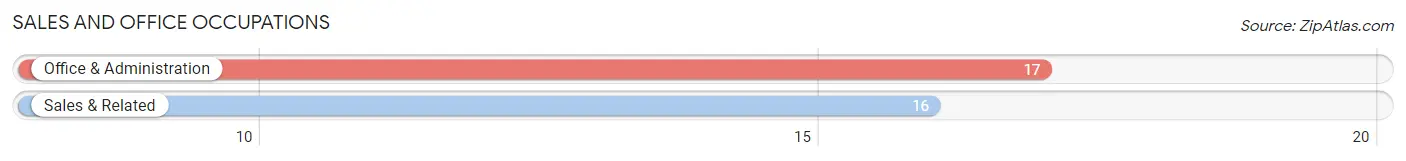
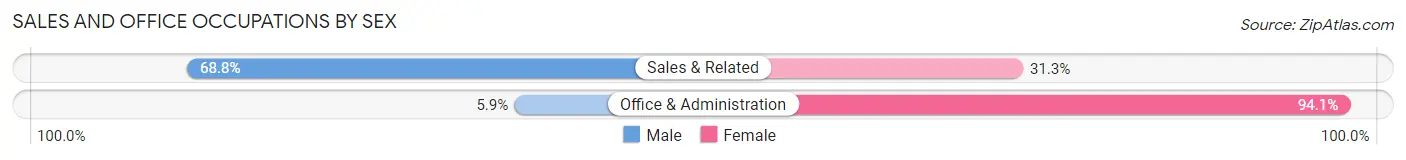
Sales and Office Occupations
The most common Sales and Office occupations in Hawkeye are Office & Administration (17 | 6.2%), and Sales & Related (16 | 5.8%).
Sales and Office Occupations by Sex
| Occupation | Male | Female |
| Sales & Related | 11 (68.8%) | 5 (31.2%) |
| Office & Administration | 1 (5.9%) | 16 (94.1%) |
| Total (Category) | 12 (36.4%) | 21 (63.6%) |
| Total (Overall) | 160 (58.4%) | 114 (41.6%) |
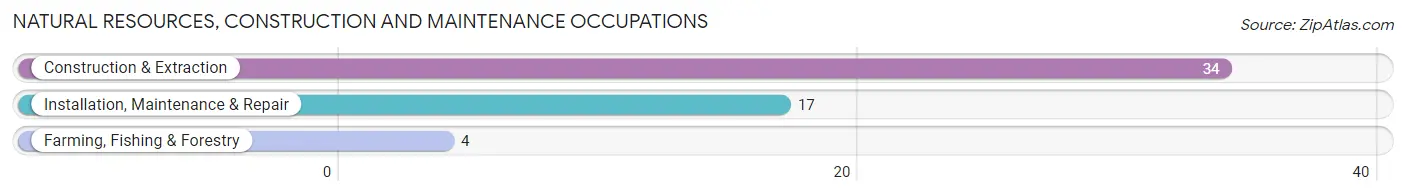
Natural Resources, Construction and Maintenance Occupations
The most common Natural Resources, Construction and Maintenance occupations in Hawkeye are Construction & Extraction (34 | 12.4%), Installation, Maintenance & Repair (17 | 6.2%), and Farming, Fishing & Forestry (4 | 1.5%).
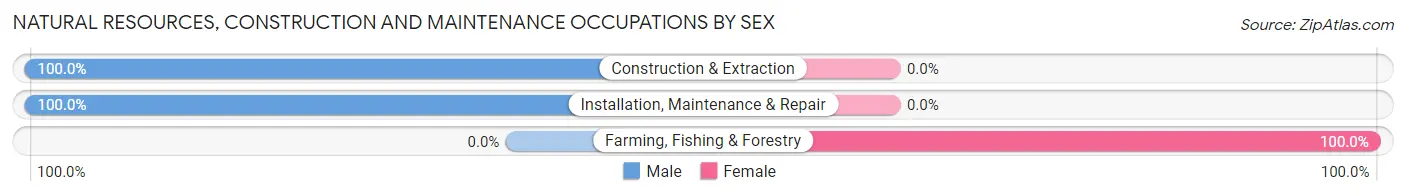
Natural Resources, Construction and Maintenance Occupations by Sex
| Occupation | Male | Female |
| Farming, Fishing & Forestry | 0 (0.0%) | 4 (100.0%) |
| Construction & Extraction | 34 (100.0%) | 0 (0.0%) |
| Installation, Maintenance & Repair | 17 (100.0%) | 0 (0.0%) |
| Total (Category) | 51 (92.7%) | 4 (7.3%) |
| Total (Overall) | 160 (58.4%) | 114 (41.6%) |
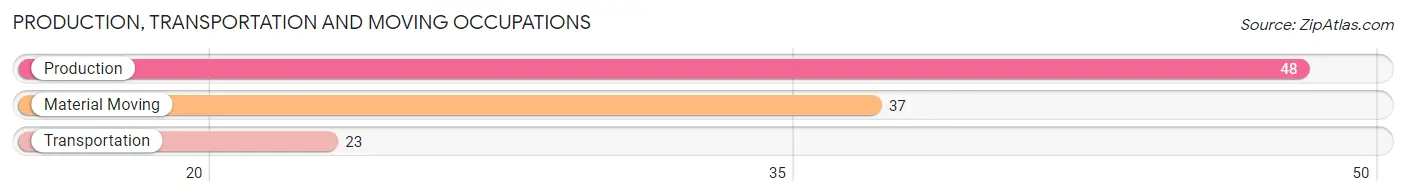
Production, Transportation and Moving Occupations
The most common Production, Transportation and Moving occupations in Hawkeye are Production (48 | 17.5%), Material Moving (37 | 13.5%), and Transportation (23 | 8.4%).
Production, Transportation and Moving Occupations by Sex
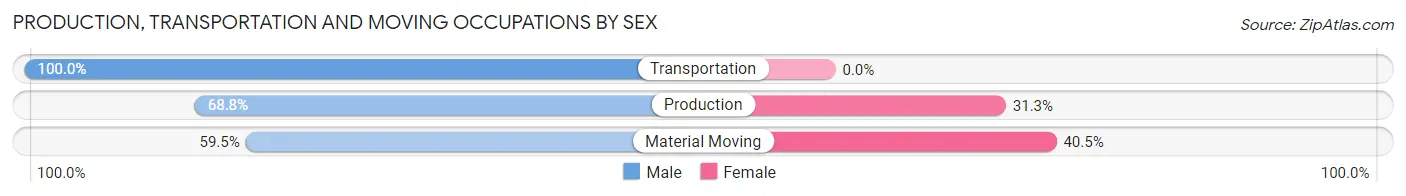
| Occupation | Male | Female |
| Production | 33 (68.8%) | 15 (31.2%) |
| Transportation | 23 (100.0%) | 0 (0.0%) |
| Material Moving | 22 (59.5%) | 15 (40.5%) |
| Total (Category) | 78 (72.2%) | 30 (27.8%) |
| Total (Overall) | 160 (58.4%) | 114 (41.6%) |
Employment Industries by Sex in Hawkeye
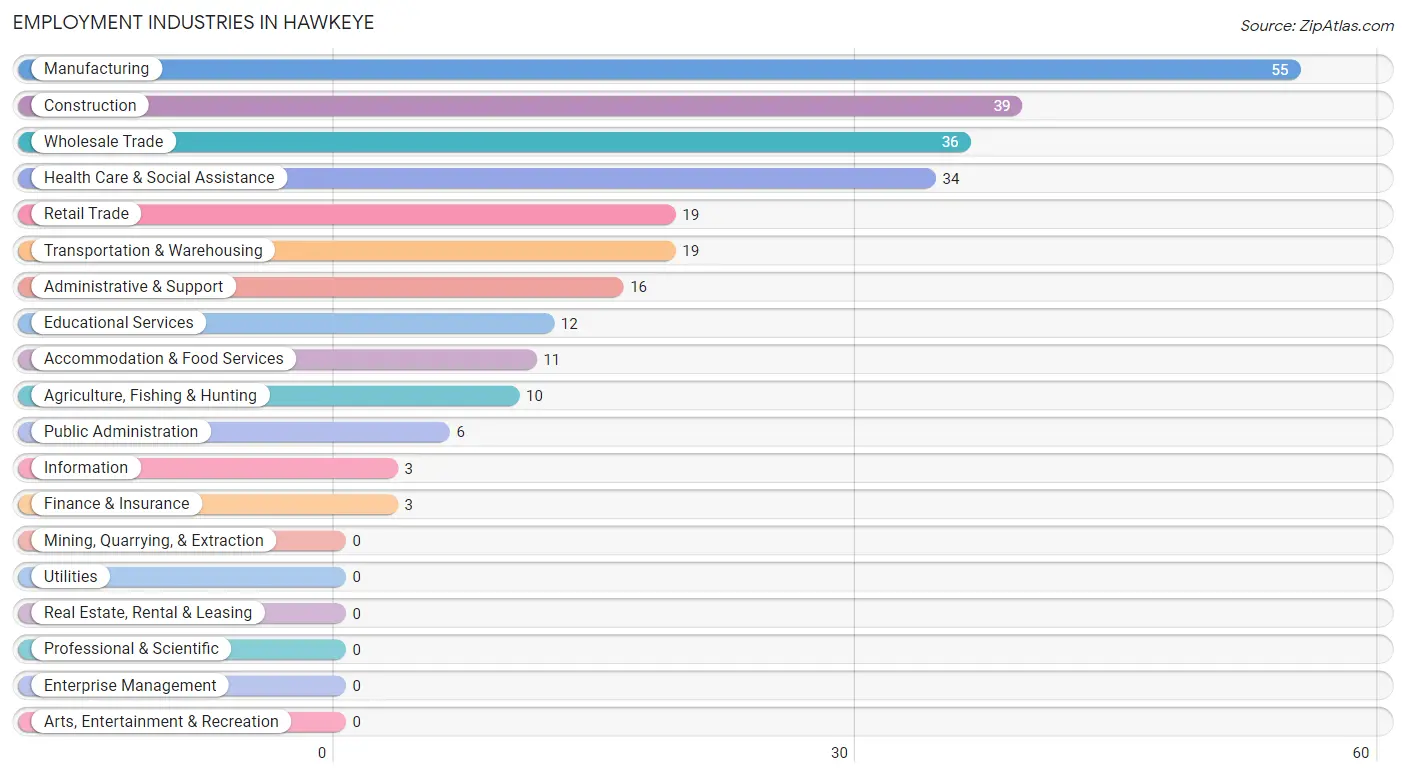
Employment Industries in Hawkeye
The major employment industries in Hawkeye include Manufacturing (55 | 20.1%), Construction (39 | 14.2%), Wholesale Trade (36 | 13.1%), Health Care & Social Assistance (34 | 12.4%), and Retail Trade (19 | 6.9%).
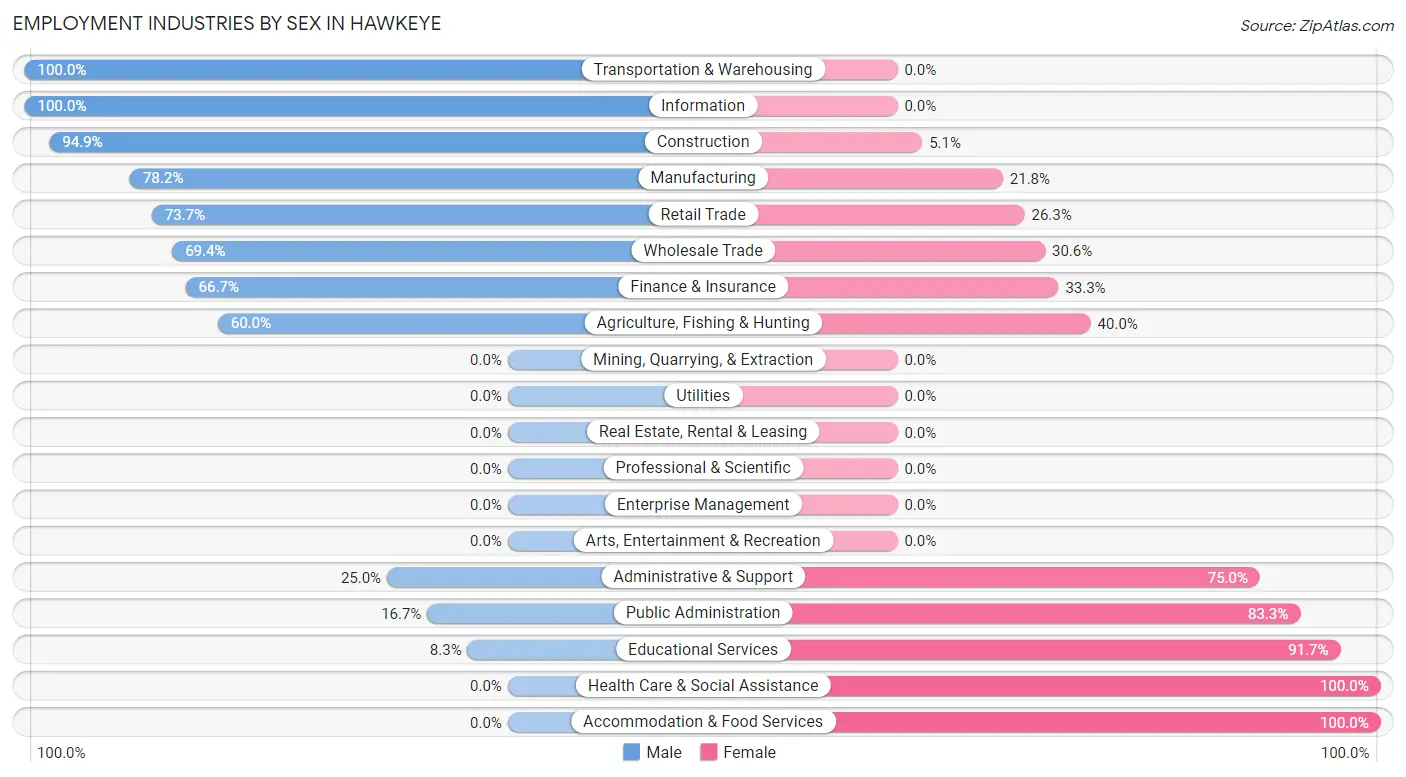
Employment Industries by Sex in Hawkeye
The Hawkeye industries that see more men than women are Transportation & Warehousing (100.0%), Information (100.0%), and Construction (94.9%), whereas the industries that tend to have a higher number of women are Health Care & Social Assistance (100.0%), Accommodation & Food Services (100.0%), and Educational Services (91.7%).
| Industry | Male | Female |
| Agriculture, Fishing & Hunting | 6 (60.0%) | 4 (40.0%) |
| Mining, Quarrying, & Extraction | 0 (0.0%) | 0 (0.0%) |
| Construction | 37 (94.9%) | 2 (5.1%) |
| Manufacturing | 43 (78.2%) | 12 (21.8%) |
| Wholesale Trade | 25 (69.4%) | 11 (30.6%) |
| Retail Trade | 14 (73.7%) | 5 (26.3%) |
| Transportation & Warehousing | 19 (100.0%) | 0 (0.0%) |
| Utilities | 0 (0.0%) | 0 (0.0%) |
| Information | 3 (100.0%) | 0 (0.0%) |
| Finance & Insurance | 2 (66.7%) | 1 (33.3%) |
| Real Estate, Rental & Leasing | 0 (0.0%) | 0 (0.0%) |
| Professional & Scientific | 0 (0.0%) | 0 (0.0%) |
| Enterprise Management | 0 (0.0%) | 0 (0.0%) |
| Administrative & Support | 4 (25.0%) | 12 (75.0%) |
| Educational Services | 1 (8.3%) | 11 (91.7%) |
| Health Care & Social Assistance | 0 (0.0%) | 34 (100.0%) |
| Arts, Entertainment & Recreation | 0 (0.0%) | 0 (0.0%) |
| Accommodation & Food Services | 0 (0.0%) | 11 (100.0%) |
| Public Administration | 1 (16.7%) | 5 (83.3%) |
| Total | 160 (58.4%) | 114 (41.6%) |
Education in Hawkeye
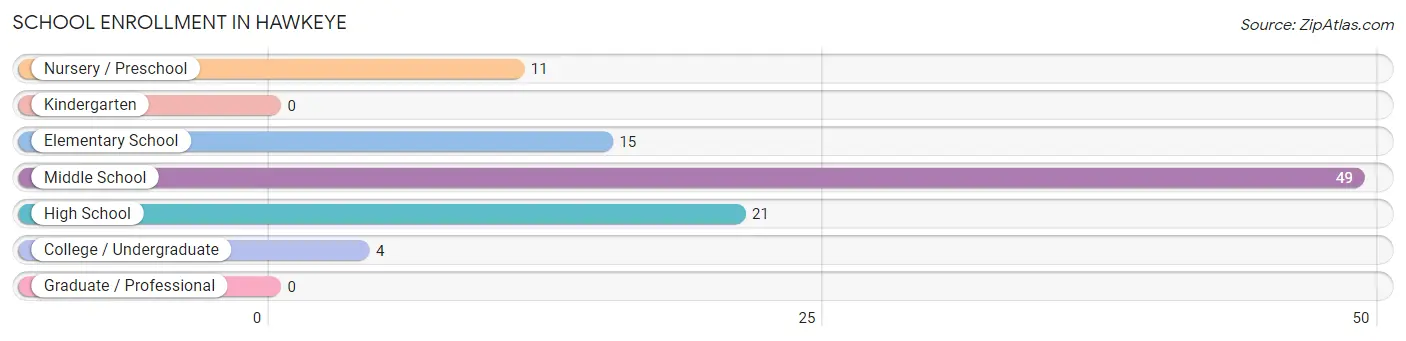
School Enrollment in Hawkeye
The most common levels of schooling among the 100 students in Hawkeye are middle school (49 | 49.0%), high school (21 | 21.0%), and elementary school (15 | 15.0%).
| School Level | # Students | % Students |
| Nursery / Preschool | 11 | 11.0% |
| Kindergarten | 0 | 0.0% |
| Elementary School | 15 | 15.0% |
| Middle School | 49 | 49.0% |
| High School | 21 | 21.0% |
| College / Undergraduate | 4 | 4.0% |
| Graduate / Professional | 0 | 0.0% |
| Total | 100 | 100.0% |
School Enrollment by Age by Funding Source in Hawkeye
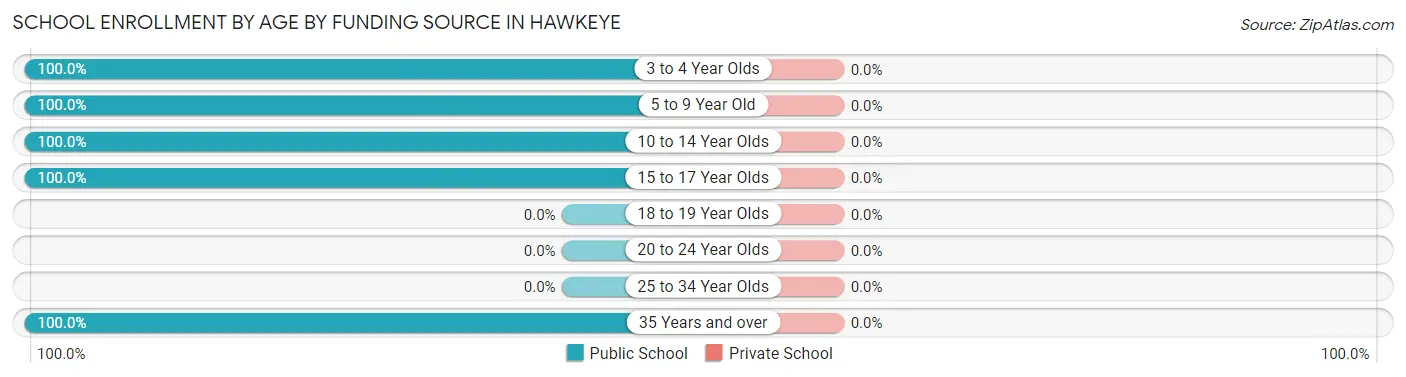
| Age Bracket | Public School | Private School |
| 3 to 4 Year Olds | 11 (100.0%) | 0 (0.0%) |
| 5 to 9 Year Old | 15 (100.0%) | 0 (0.0%) |
| 10 to 14 Year Olds | 53 (100.0%) | 0 (0.0%) |
| 15 to 17 Year Olds | 17 (100.0%) | 0 (0.0%) |
| 18 to 19 Year Olds | 0 (0.0%) | 0 (0.0%) |
| 20 to 24 Year Olds | 0 (0.0%) | 0 (0.0%) |
| 25 to 34 Year Olds | 0 (0.0%) | 0 (0.0%) |
| 35 Years and over | 4 (100.0%) | 0 (0.0%) |
| Total | 100 (100.0%) | 0 (0.0%) |
Educational Attainment by Field of Study in Hawkeye
Education (11 | 31.4%), science & technology (8 | 22.9%), business (4 | 11.4%), literature & languages (4 | 11.4%), and bio, nature & agricultural (2 | 5.7%) are the most common fields of study among 35 individuals in Hawkeye who have obtained a bachelor's degree or higher.
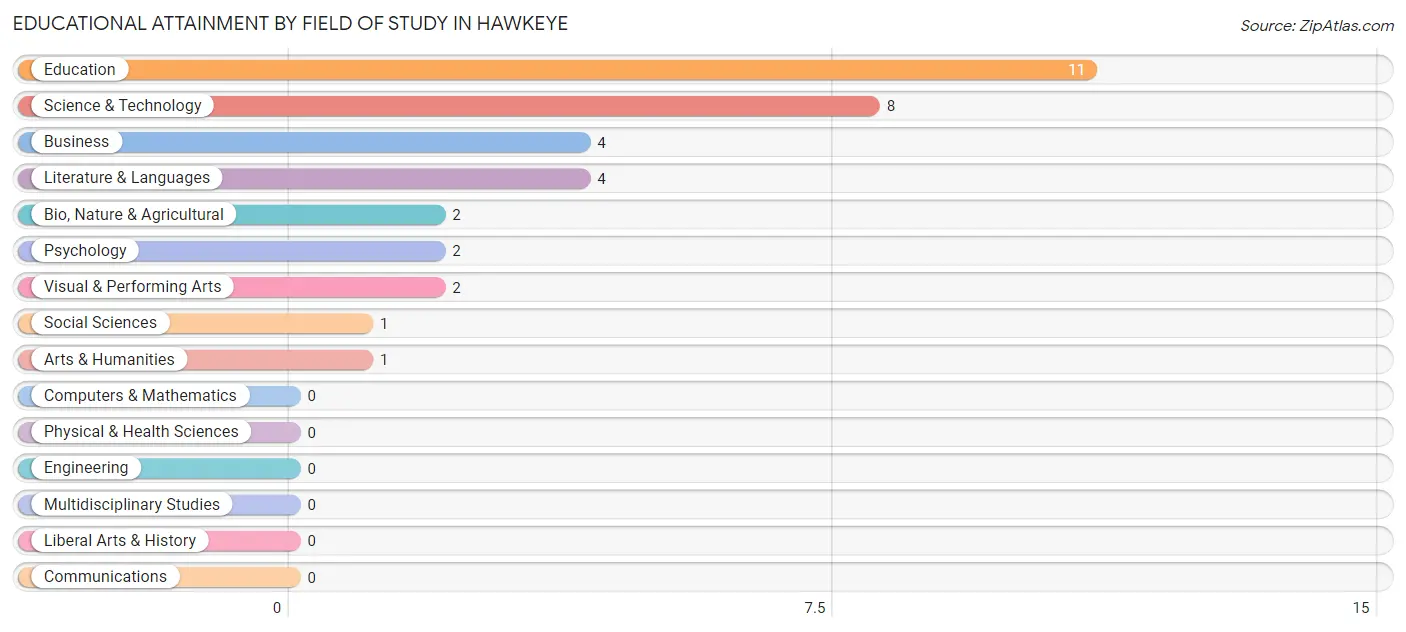
| Field of Study | # Graduates | % Graduates |
| Computers & Mathematics | 0 | 0.0% |
| Bio, Nature & Agricultural | 2 | 5.7% |
| Physical & Health Sciences | 0 | 0.0% |
| Psychology | 2 | 5.7% |
| Social Sciences | 1 | 2.9% |
| Engineering | 0 | 0.0% |
| Multidisciplinary Studies | 0 | 0.0% |
| Science & Technology | 8 | 22.9% |
| Business | 4 | 11.4% |
| Education | 11 | 31.4% |
| Literature & Languages | 4 | 11.4% |
| Liberal Arts & History | 0 | 0.0% |
| Visual & Performing Arts | 2 | 5.7% |
| Communications | 0 | 0.0% |
| Arts & Humanities | 1 | 2.9% |
| Total | 35 | 100.0% |
Transportation & Commute in Hawkeye
Vehicle Availability by Sex in Hawkeye
The most prevalent vehicle ownership categories in Hawkeye are males with 3 vehicles (62, accounting for 39.2%) and females with 3 vehicles (41, making up 58.5%).
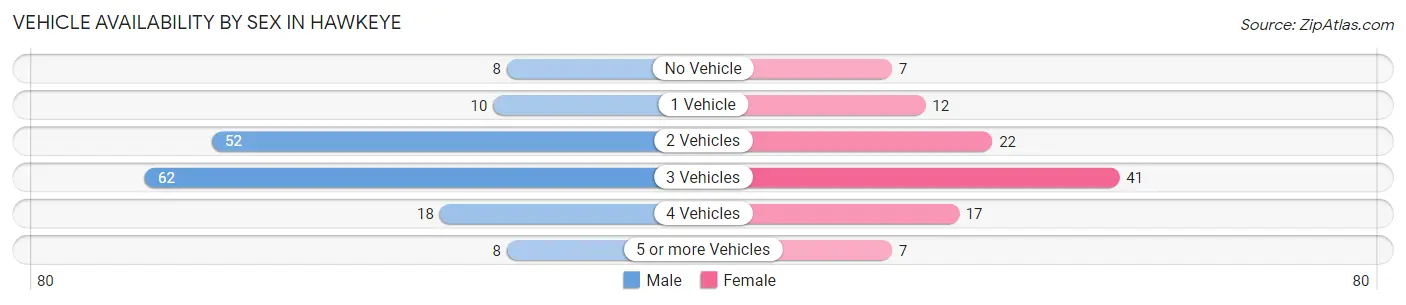
| Vehicles Available | Male | Female |
| No Vehicle | 8 (5.1%) | 7 (6.6%) |
| 1 Vehicle | 10 (6.3%) | 12 (11.3%) |
| 2 Vehicles | 52 (32.9%) | 22 (20.7%) |
| 3 Vehicles | 62 (39.2%) | 41 (38.7%) |
| 4 Vehicles | 18 (11.4%) | 17 (16.0%) |
| 5 or more Vehicles | 8 (5.1%) | 7 (6.6%) |
| Total | 158 (100.0%) | 106 (100.0%) |
Commute Time in Hawkeye
The most frequently occuring commute durations in Hawkeye are 10 to 14 minutes (39 commuters, 17.0%), 20 to 24 minutes (37 commuters, 16.1%), and 15 to 19 minutes (28 commuters, 12.2%).
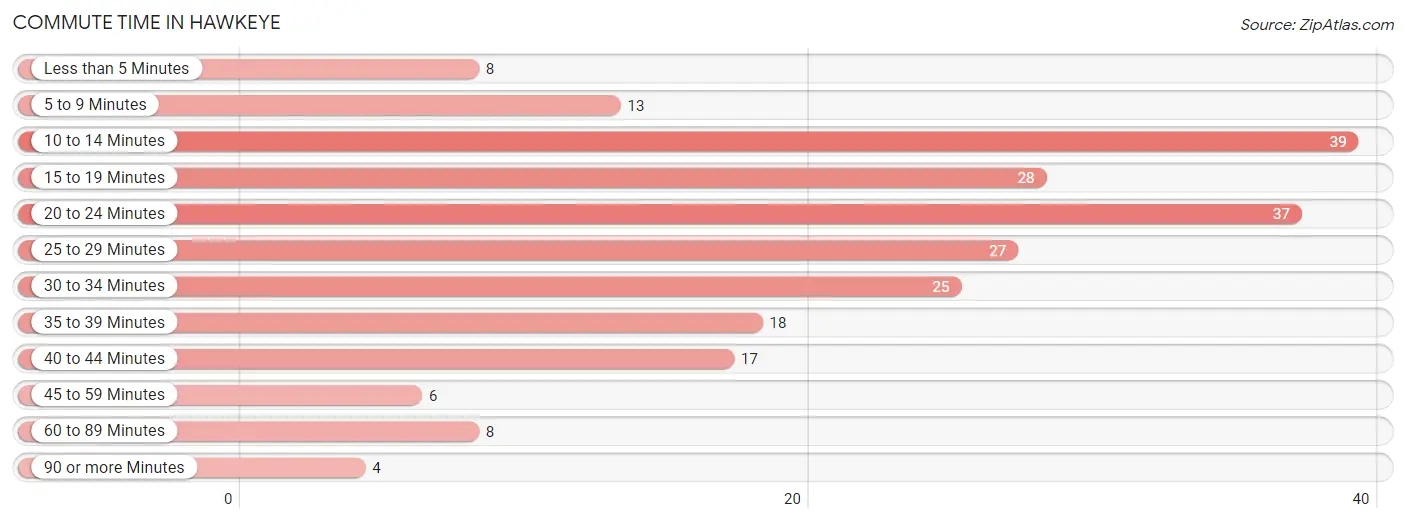
| Commute Time | # Commuters | % Commuters |
| Less than 5 Minutes | 8 | 3.5% |
| 5 to 9 Minutes | 13 | 5.7% |
| 10 to 14 Minutes | 39 | 17.0% |
| 15 to 19 Minutes | 28 | 12.2% |
| 20 to 24 Minutes | 37 | 16.1% |
| 25 to 29 Minutes | 27 | 11.7% |
| 30 to 34 Minutes | 25 | 10.9% |
| 35 to 39 Minutes | 18 | 7.8% |
| 40 to 44 Minutes | 17 | 7.4% |
| 45 to 59 Minutes | 6 | 2.6% |
| 60 to 89 Minutes | 8 | 3.5% |
| 90 or more Minutes | 4 | 1.7% |
Commute Time by Sex in Hawkeye
The most common commute times in Hawkeye are 20 to 24 minutes (30 commuters, 20.8%) for males and 10 to 14 minutes (21 commuters, 24.4%) for females.
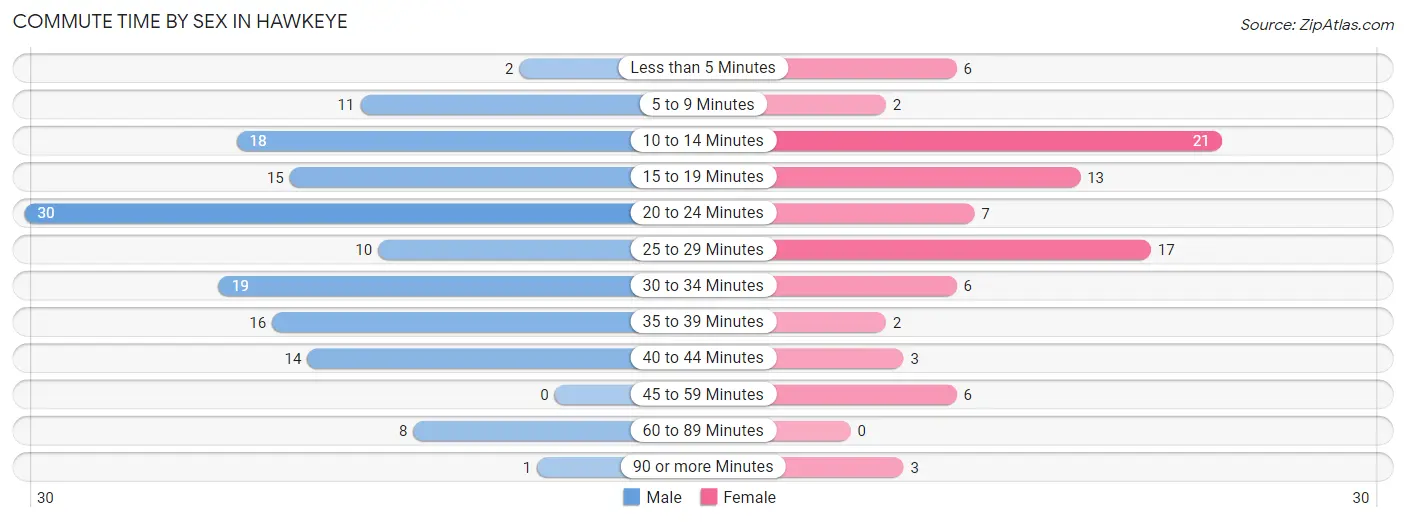
| Commute Time | Male | Female |
| Less than 5 Minutes | 2 (1.4%) | 6 (7.0%) |
| 5 to 9 Minutes | 11 (7.6%) | 2 (2.3%) |
| 10 to 14 Minutes | 18 (12.5%) | 21 (24.4%) |
| 15 to 19 Minutes | 15 (10.4%) | 13 (15.1%) |
| 20 to 24 Minutes | 30 (20.8%) | 7 (8.1%) |
| 25 to 29 Minutes | 10 (6.9%) | 17 (19.8%) |
| 30 to 34 Minutes | 19 (13.2%) | 6 (7.0%) |
| 35 to 39 Minutes | 16 (11.1%) | 2 (2.3%) |
| 40 to 44 Minutes | 14 (9.7%) | 3 (3.5%) |
| 45 to 59 Minutes | 0 (0.0%) | 6 (7.0%) |
| 60 to 89 Minutes | 8 (5.6%) | 0 (0.0%) |
| 90 or more Minutes | 1 (0.7%) | 3 (3.5%) |
Time of Departure to Work by Sex in Hawkeye
The most frequent times of departure to work in Hawkeye are 12:00 AM to 4:59 AM (35, 24.3%) for males and 7:30 AM to 7:59 AM (17, 19.8%) for females.
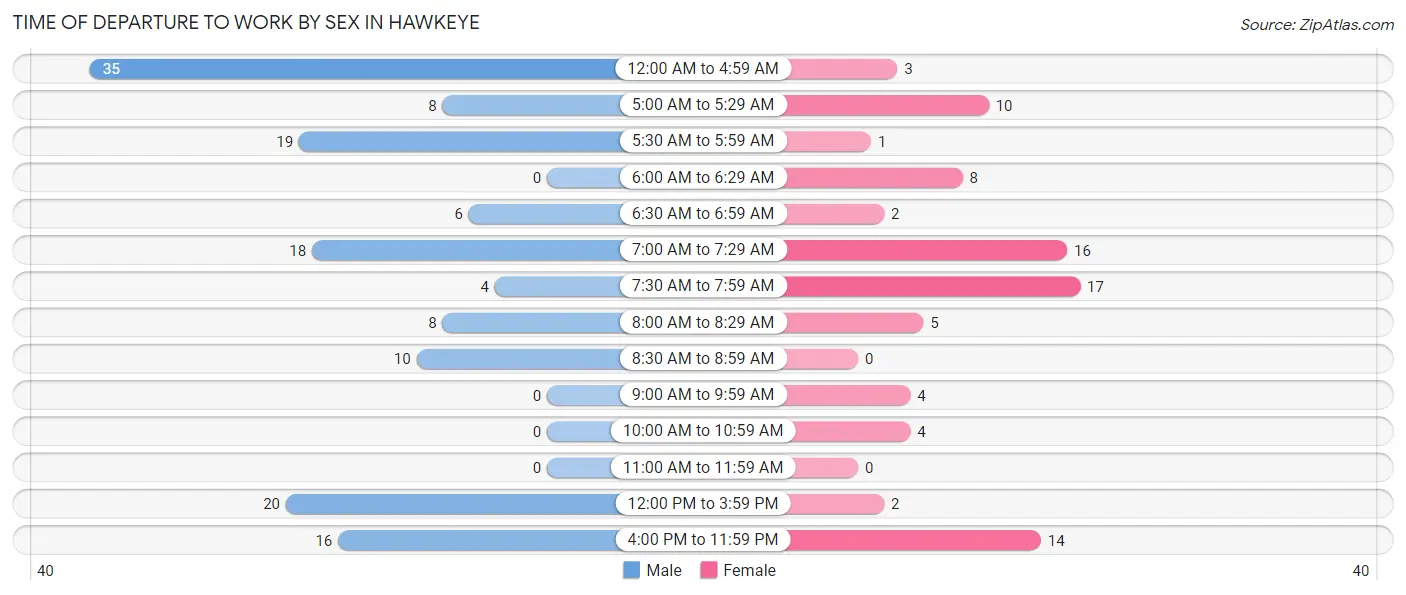
| Time of Departure | Male | Female |
| 12:00 AM to 4:59 AM | 35 (24.3%) | 3 (3.5%) |
| 5:00 AM to 5:29 AM | 8 (5.6%) | 10 (11.6%) |
| 5:30 AM to 5:59 AM | 19 (13.2%) | 1 (1.2%) |
| 6:00 AM to 6:29 AM | 0 (0.0%) | 8 (9.3%) |
| 6:30 AM to 6:59 AM | 6 (4.2%) | 2 (2.3%) |
| 7:00 AM to 7:29 AM | 18 (12.5%) | 16 (18.6%) |
| 7:30 AM to 7:59 AM | 4 (2.8%) | 17 (19.8%) |
| 8:00 AM to 8:29 AM | 8 (5.6%) | 5 (5.8%) |
| 8:30 AM to 8:59 AM | 10 (6.9%) | 0 (0.0%) |
| 9:00 AM to 9:59 AM | 0 (0.0%) | 4 (4.6%) |
| 10:00 AM to 10:59 AM | 0 (0.0%) | 4 (4.6%) |
| 11:00 AM to 11:59 AM | 0 (0.0%) | 0 (0.0%) |
| 12:00 PM to 3:59 PM | 20 (13.9%) | 2 (2.3%) |
| 4:00 PM to 11:59 PM | 16 (11.1%) | 14 (16.3%) |
| Total | 144 (100.0%) | 86 (100.0%) |
Housing Occupancy in Hawkeye
Occupancy by Ownership in Hawkeye
Of the total 207 dwellings in Hawkeye, owner-occupied units account for 159 (76.8%), while renter-occupied units make up 48 (23.2%).
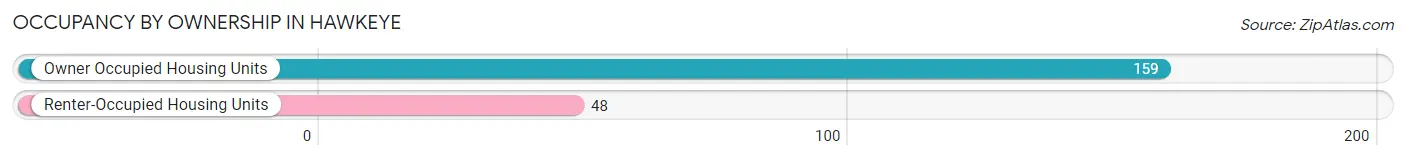
| Occupancy | # Housing Units | % Housing Units |
| Owner Occupied Housing Units | 159 | 76.8% |
| Renter-Occupied Housing Units | 48 | 23.2% |
| Total Occupied Housing Units | 207 | 100.0% |
Occupancy by Household Size in Hawkeye
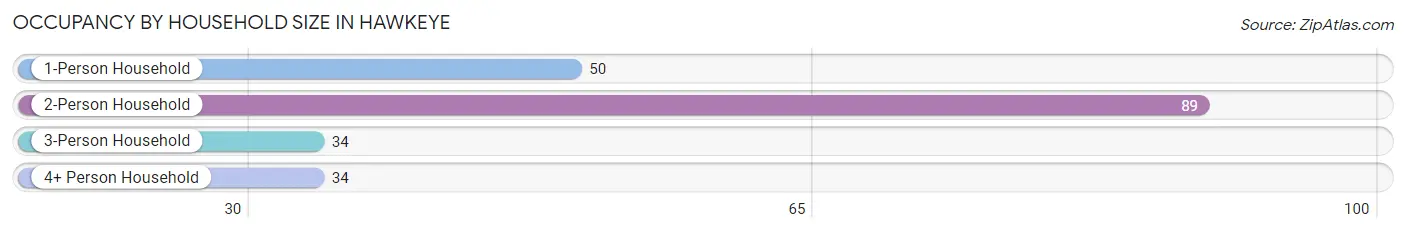
| Household Size | # Housing Units | % Housing Units |
| 1-Person Household | 50 | 24.1% |
| 2-Person Household | 89 | 43.0% |
| 3-Person Household | 34 | 16.4% |
| 4+ Person Household | 34 | 16.4% |
| Total Housing Units | 207 | 100.0% |
Occupancy by Ownership by Household Size in Hawkeye
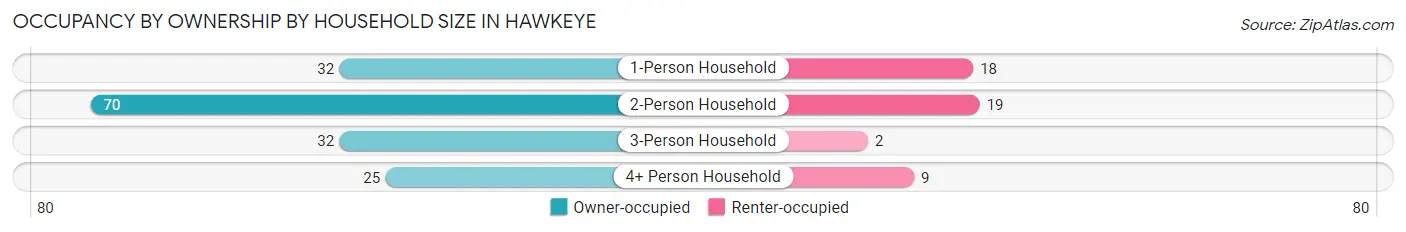
| Household Size | Owner-occupied | Renter-occupied |
| 1-Person Household | 32 (64.0%) | 18 (36.0%) |
| 2-Person Household | 70 (78.6%) | 19 (21.3%) |
| 3-Person Household | 32 (94.1%) | 2 (5.9%) |
| 4+ Person Household | 25 (73.5%) | 9 (26.5%) |
| Total Housing Units | 159 (76.8%) | 48 (23.2%) |
Occupancy by Educational Attainment in Hawkeye
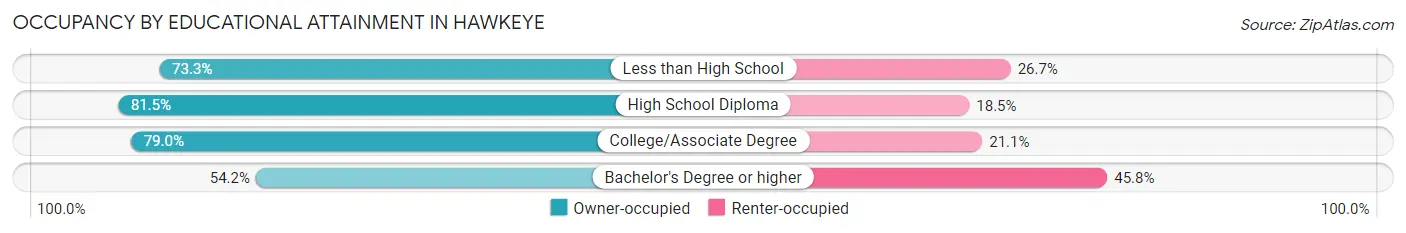
| Household Size | Owner-occupied | Renter-occupied |
| Less than High School | 11 (73.3%) | 4 (26.7%) |
| High School Diploma | 75 (81.5%) | 17 (18.5%) |
| College/Associate Degree | 60 (78.9%) | 16 (21.0%) |
| Bachelor's Degree or higher | 13 (54.2%) | 11 (45.8%) |
Occupancy by Age of Householder in Hawkeye
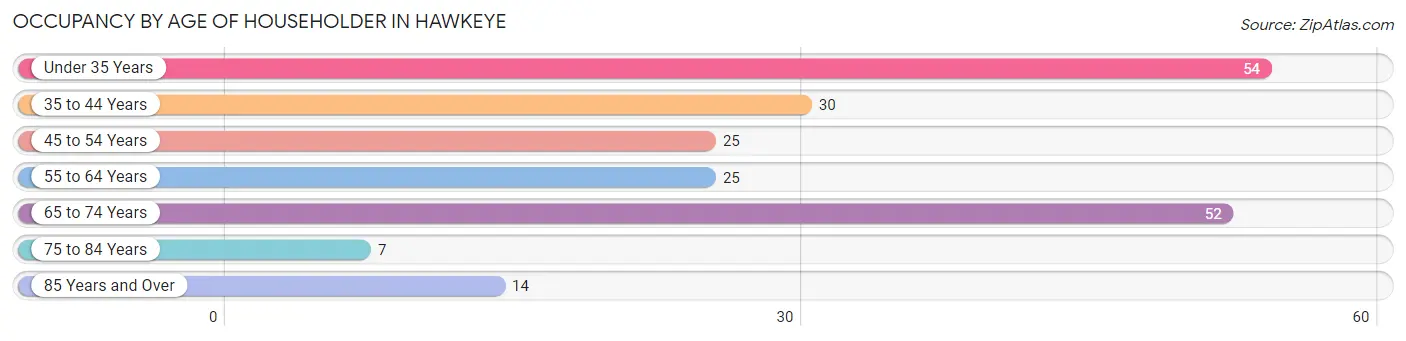
| Age Bracket | # Households | % Households |
| Under 35 Years | 54 | 26.1% |
| 35 to 44 Years | 30 | 14.5% |
| 45 to 54 Years | 25 | 12.1% |
| 55 to 64 Years | 25 | 12.1% |
| 65 to 74 Years | 52 | 25.1% |
| 75 to 84 Years | 7 | 3.4% |
| 85 Years and Over | 14 | 6.8% |
| Total | 207 | 100.0% |
Housing Finances in Hawkeye
Median Income by Occupancy in Hawkeye
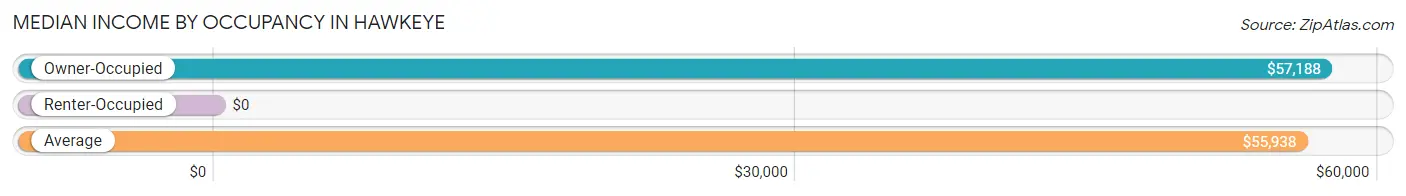
| Occupancy Type | # Households | Median Income |
| Owner-Occupied | 159 (76.8%) | $57,188 |
| Renter-Occupied | 48 (23.2%) | $0 |
| Average | 207 (100.0%) | $55,938 |
Occupancy by Householder Income Bracket in Hawkeye
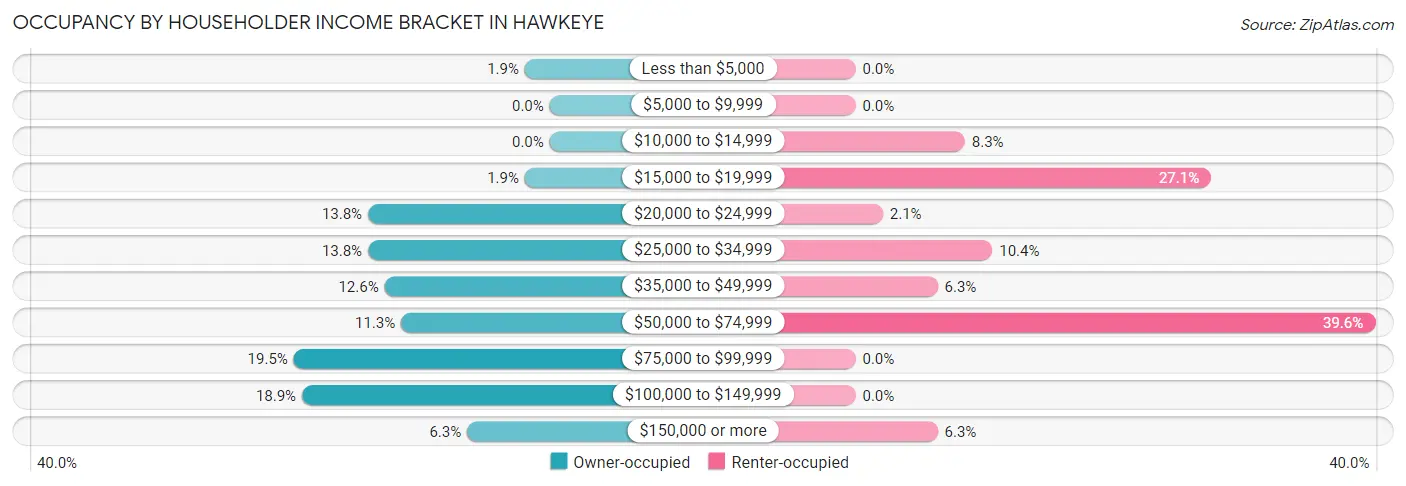
| Income Bracket | Owner-occupied | Renter-occupied |
| Less than $5,000 | 3 (1.9%) | 0 (0.0%) |
| $5,000 to $9,999 | 0 (0.0%) | 0 (0.0%) |
| $10,000 to $14,999 | 0 (0.0%) | 4 (8.3%) |
| $15,000 to $19,999 | 3 (1.9%) | 13 (27.1%) |
| $20,000 to $24,999 | 22 (13.8%) | 1 (2.1%) |
| $25,000 to $34,999 | 22 (13.8%) | 5 (10.4%) |
| $35,000 to $49,999 | 20 (12.6%) | 3 (6.2%) |
| $50,000 to $74,999 | 18 (11.3%) | 19 (39.6%) |
| $75,000 to $99,999 | 31 (19.5%) | 0 (0.0%) |
| $100,000 to $149,999 | 30 (18.9%) | 0 (0.0%) |
| $150,000 or more | 10 (6.3%) | 3 (6.2%) |
| Total | 159 (100.0%) | 48 (100.0%) |
Monthly Housing Cost Tiers in Hawkeye
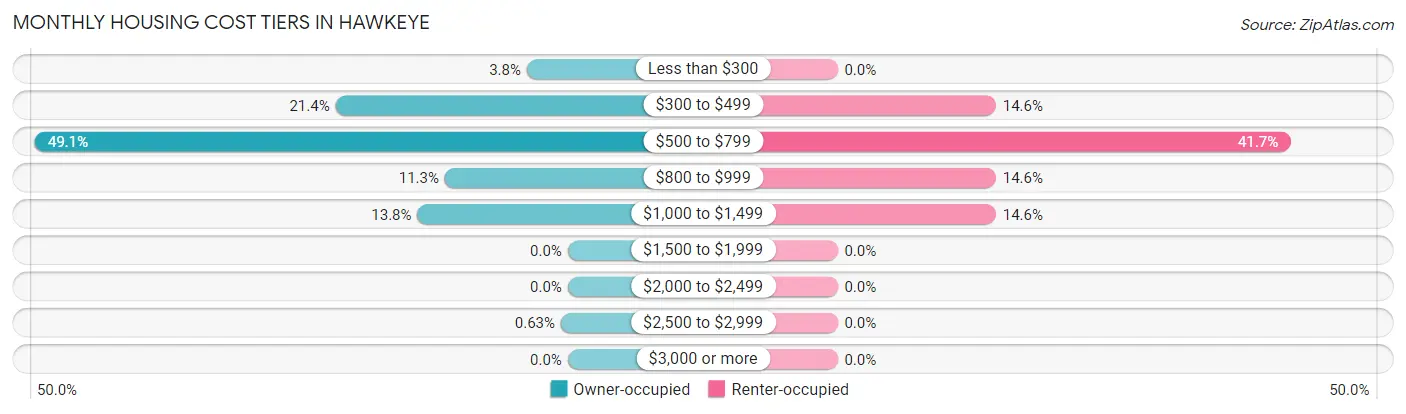
| Monthly Cost | Owner-occupied | Renter-occupied |
| Less than $300 | 6 (3.8%) | 0 (0.0%) |
| $300 to $499 | 34 (21.4%) | 7 (14.6%) |
| $500 to $799 | 78 (49.1%) | 20 (41.7%) |
| $800 to $999 | 18 (11.3%) | 7 (14.6%) |
| $1,000 to $1,499 | 22 (13.8%) | 7 (14.6%) |
| $1,500 to $1,999 | 0 (0.0%) | 0 (0.0%) |
| $2,000 to $2,499 | 0 (0.0%) | 0 (0.0%) |
| $2,500 to $2,999 | 1 (0.6%) | 0 (0.0%) |
| $3,000 or more | 0 (0.0%) | 0 (0.0%) |
| Total | 159 (100.0%) | 48 (100.0%) |
Physical Housing Characteristics in Hawkeye
Housing Structures in Hawkeye
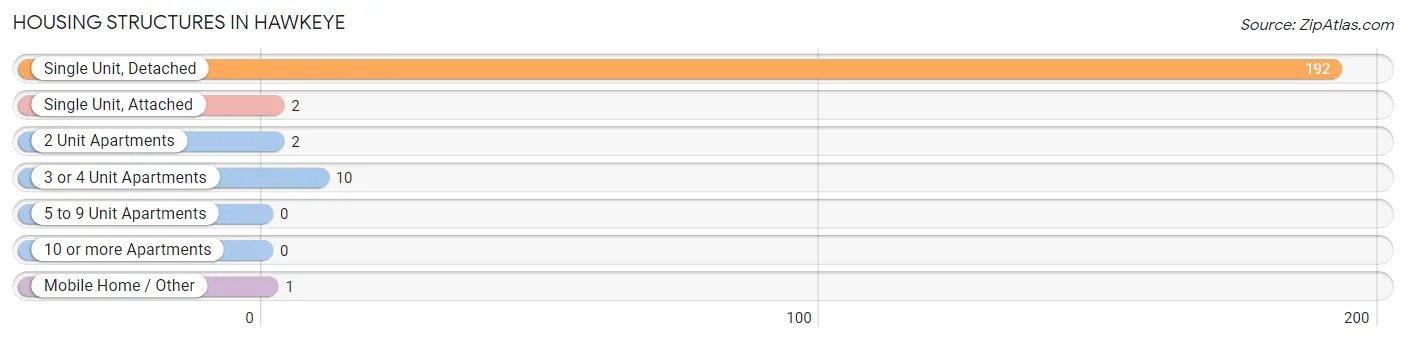
| Structure Type | # Housing Units | % Housing Units |
| Single Unit, Detached | 192 | 92.7% |
| Single Unit, Attached | 2 | 1.0% |
| 2 Unit Apartments | 2 | 1.0% |
| 3 or 4 Unit Apartments | 10 | 4.8% |
| 5 to 9 Unit Apartments | 0 | 0.0% |
| 10 or more Apartments | 0 | 0.0% |
| Mobile Home / Other | 1 | 0.5% |
| Total | 207 | 100.0% |
Housing Structures by Occupancy in Hawkeye
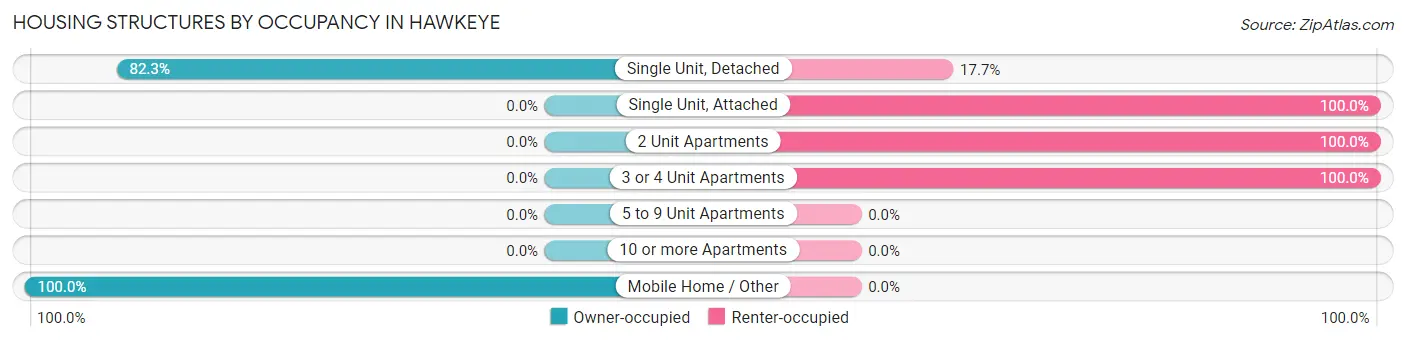
| Structure Type | Owner-occupied | Renter-occupied |
| Single Unit, Detached | 158 (82.3%) | 34 (17.7%) |
| Single Unit, Attached | 0 (0.0%) | 2 (100.0%) |
| 2 Unit Apartments | 0 (0.0%) | 2 (100.0%) |
| 3 or 4 Unit Apartments | 0 (0.0%) | 10 (100.0%) |
| 5 to 9 Unit Apartments | 0 (0.0%) | 0 (0.0%) |
| 10 or more Apartments | 0 (0.0%) | 0 (0.0%) |
| Mobile Home / Other | 1 (100.0%) | 0 (0.0%) |
| Total | 159 (76.8%) | 48 (23.2%) |
Housing Structures by Number of Rooms in Hawkeye
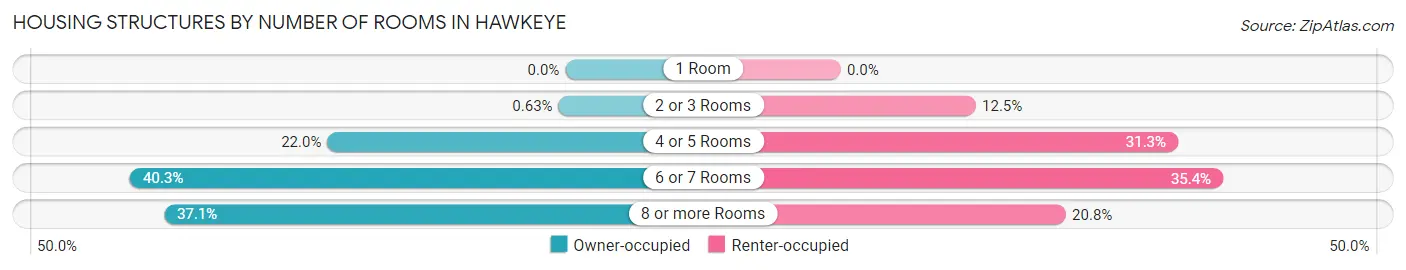
| Number of Rooms | Owner-occupied | Renter-occupied |
| 1 Room | 0 (0.0%) | 0 (0.0%) |
| 2 or 3 Rooms | 1 (0.6%) | 6 (12.5%) |
| 4 or 5 Rooms | 35 (22.0%) | 15 (31.2%) |
| 6 or 7 Rooms | 64 (40.3%) | 17 (35.4%) |
| 8 or more Rooms | 59 (37.1%) | 10 (20.8%) |
| Total | 159 (100.0%) | 48 (100.0%) |
Housing Structure by Heating Type in Hawkeye
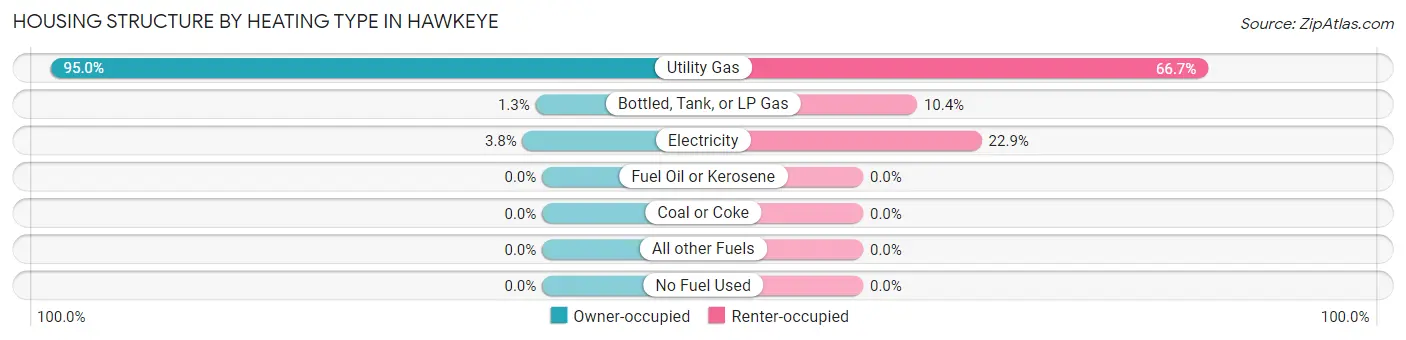
| Heating Type | Owner-occupied | Renter-occupied |
| Utility Gas | 151 (95.0%) | 32 (66.7%) |
| Bottled, Tank, or LP Gas | 2 (1.3%) | 5 (10.4%) |
| Electricity | 6 (3.8%) | 11 (22.9%) |
| Fuel Oil or Kerosene | 0 (0.0%) | 0 (0.0%) |
| Coal or Coke | 0 (0.0%) | 0 (0.0%) |
| All other Fuels | 0 (0.0%) | 0 (0.0%) |
| No Fuel Used | 0 (0.0%) | 0 (0.0%) |
| Total | 159 (100.0%) | 48 (100.0%) |
Household Vehicle Usage in Hawkeye
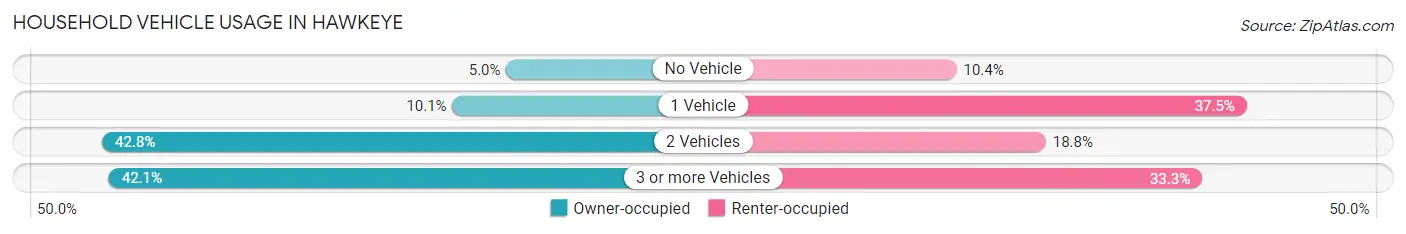
| Vehicles per Household | Owner-occupied | Renter-occupied |
| No Vehicle | 8 (5.0%) | 5 (10.4%) |
| 1 Vehicle | 16 (10.1%) | 18 (37.5%) |
| 2 Vehicles | 68 (42.8%) | 9 (18.8%) |
| 3 or more Vehicles | 67 (42.1%) | 16 (33.3%) |
| Total | 159 (100.0%) | 48 (100.0%) |
Real Estate & Mortgages in Hawkeye
Real Estate and Mortgage Overview in Hawkeye
| Characteristic | Without Mortgage | With Mortgage |
| Housing Units | 67 | 92 |
| Median Property Value | $75,800 | $80,600 |
| Median Household Income | $48,958 | $7 |
| Monthly Housing Costs | $428 | $0 |
| Real Estate Taxes | $850 | $0 |
Property Value by Mortgage Status in Hawkeye
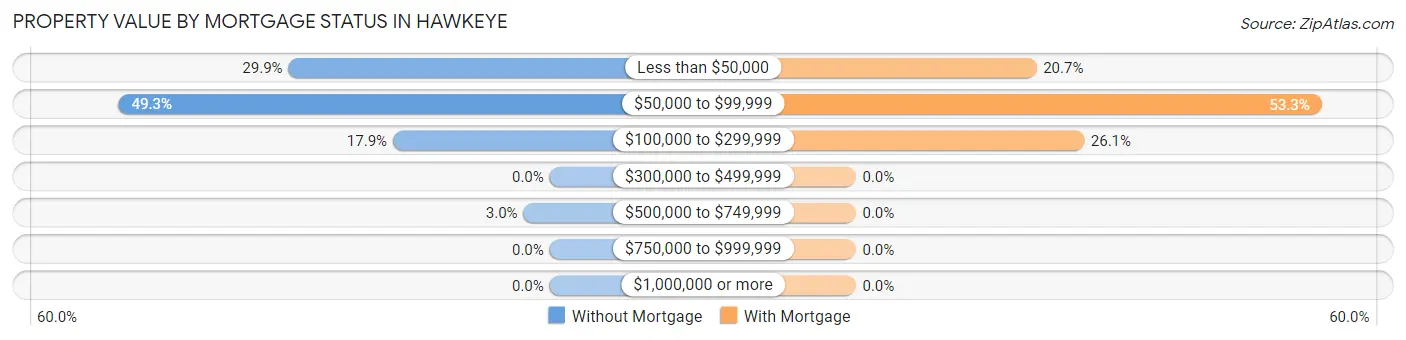
| Property Value | Without Mortgage | With Mortgage |
| Less than $50,000 | 20 (29.8%) | 19 (20.6%) |
| $50,000 to $99,999 | 33 (49.2%) | 49 (53.3%) |
| $100,000 to $299,999 | 12 (17.9%) | 24 (26.1%) |
| $300,000 to $499,999 | 0 (0.0%) | 0 (0.0%) |
| $500,000 to $749,999 | 2 (3.0%) | 0 (0.0%) |
| $750,000 to $999,999 | 0 (0.0%) | 0 (0.0%) |
| $1,000,000 or more | 0 (0.0%) | 0 (0.0%) |
| Total | 67 (100.0%) | 92 (100.0%) |
Household Income by Mortgage Status in Hawkeye
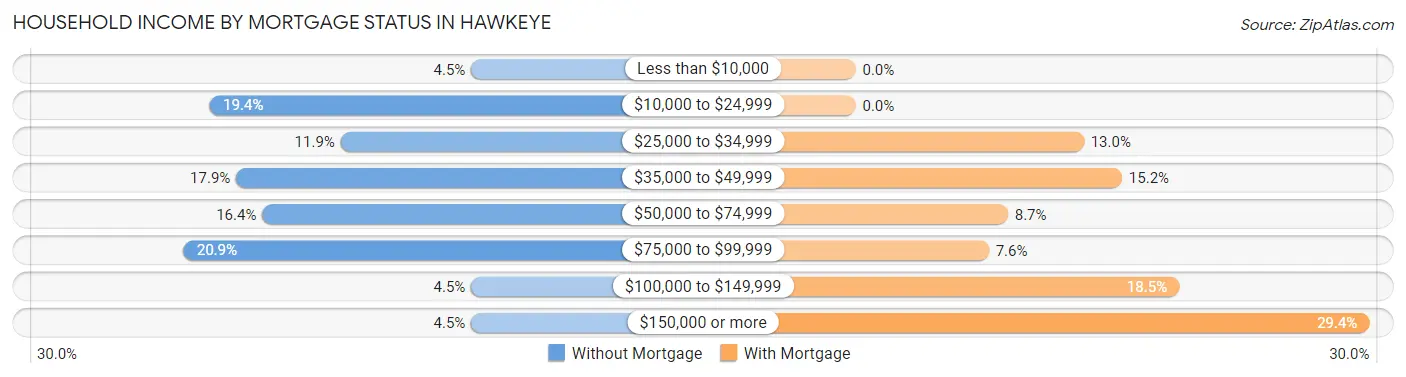
| Household Income | Without Mortgage | With Mortgage |
| Less than $10,000 | 3 (4.5%) | 0 (0.0%) |
| $10,000 to $24,999 | 13 (19.4%) | 0 (0.0%) |
| $25,000 to $34,999 | 8 (11.9%) | 12 (13.0%) |
| $35,000 to $49,999 | 12 (17.9%) | 14 (15.2%) |
| $50,000 to $74,999 | 11 (16.4%) | 8 (8.7%) |
| $75,000 to $99,999 | 14 (20.9%) | 7 (7.6%) |
| $100,000 to $149,999 | 3 (4.5%) | 17 (18.5%) |
| $150,000 or more | 3 (4.5%) | 27 (29.3%) |
| Total | 67 (100.0%) | 92 (100.0%) |
Property Value to Household Income Ratio in Hawkeye
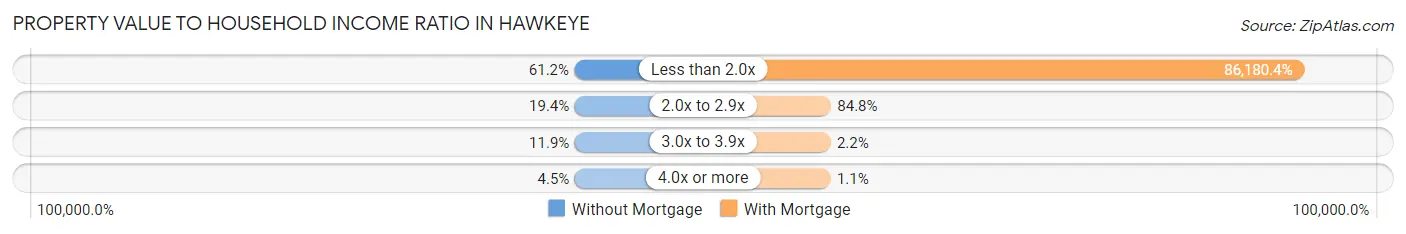
| Value-to-Income Ratio | Without Mortgage | With Mortgage |
| Less than 2.0x | 41 (61.2%) | 79,286 (86,180.4%) |
| 2.0x to 2.9x | 13 (19.4%) | 78 (84.8%) |
| 3.0x to 3.9x | 8 (11.9%) | 2 (2.2%) |
| 4.0x or more | 3 (4.5%) | 1 (1.1%) |
| Total | 67 (100.0%) | 92 (100.0%) |
Real Estate Taxes by Mortgage Status in Hawkeye
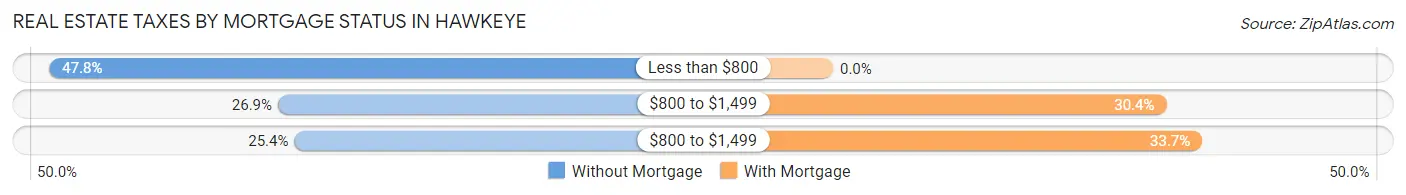
| Property Taxes | Without Mortgage | With Mortgage |
| Less than $800 | 32 (47.8%) | 0 (0.0%) |
| $800 to $1,499 | 18 (26.9%) | 28 (30.4%) |
| $800 to $1,499 | 17 (25.4%) | 31 (33.7%) |
| Total | 67 (100.0%) | 92 (100.0%) |
Health & Disability in Hawkeye
Health Insurance Coverage by Age in Hawkeye
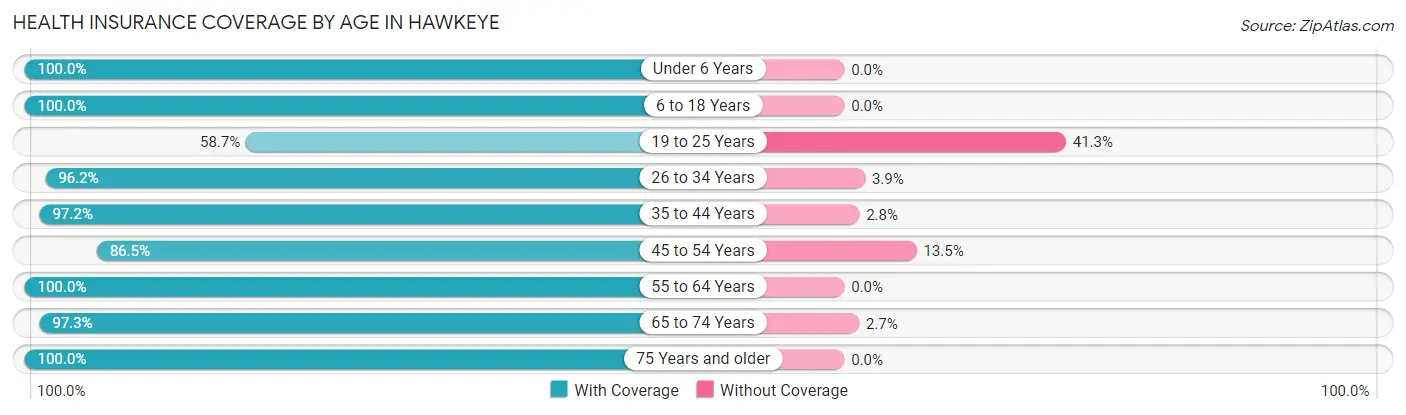
| Age Bracket | With Coverage | Without Coverage |
| Under 6 Years | 25 (100.0%) | 0 (0.0%) |
| 6 to 18 Years | 87 (100.0%) | 0 (0.0%) |
| 19 to 25 Years | 27 (58.7%) | 19 (41.3%) |
| 26 to 34 Years | 50 (96.2%) | 2 (3.8%) |
| 35 to 44 Years | 70 (97.2%) | 2 (2.8%) |
| 45 to 54 Years | 45 (86.5%) | 7 (13.5%) |
| 55 to 64 Years | 54 (100.0%) | 0 (0.0%) |
| 65 to 74 Years | 71 (97.3%) | 2 (2.7%) |
| 75 Years and older | 50 (100.0%) | 0 (0.0%) |
| Total | 479 (93.7%) | 32 (6.3%) |
Health Insurance Coverage by Citizenship Status in Hawkeye
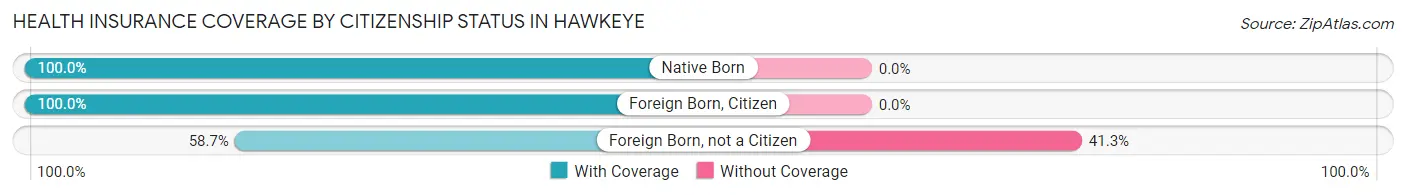
| Citizenship Status | With Coverage | Without Coverage |
| Native Born | 25 (100.0%) | 0 (0.0%) |
| Foreign Born, Citizen | 87 (100.0%) | 0 (0.0%) |
| Foreign Born, not a Citizen | 27 (58.7%) | 19 (41.3%) |
Health Insurance Coverage by Household Income in Hawkeye
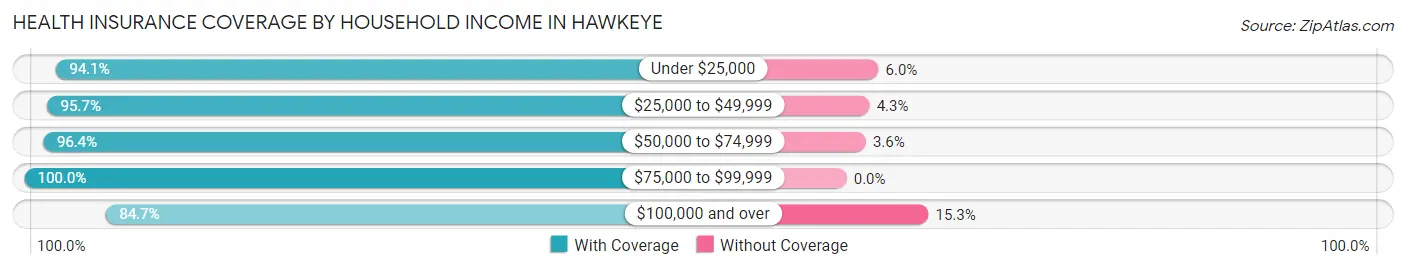
| Household Income | With Coverage | Without Coverage |
| Under $25,000 | 79 (94.1%) | 5 (5.9%) |
| $25,000 to $49,999 | 89 (95.7%) | 4 (4.3%) |
| $50,000 to $74,999 | 107 (96.4%) | 4 (3.6%) |
| $75,000 to $99,999 | 99 (100.0%) | 0 (0.0%) |
| $100,000 and over | 105 (84.7%) | 19 (15.3%) |
Public vs Private Health Insurance Coverage by Age in Hawkeye
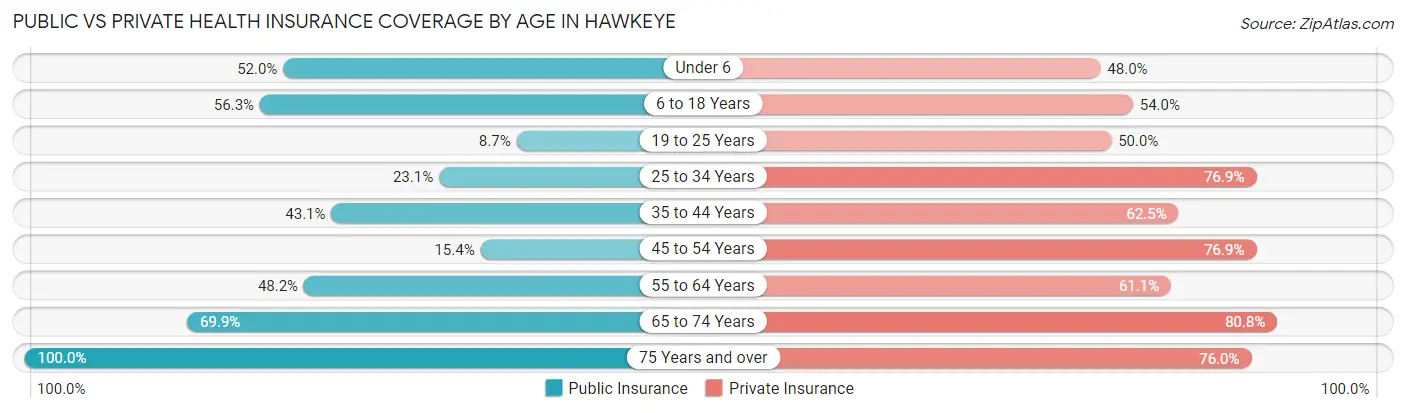
| Age Bracket | Public Insurance | Private Insurance |
| Under 6 | 13 (52.0%) | 12 (48.0%) |
| 6 to 18 Years | 49 (56.3%) | 47 (54.0%) |
| 19 to 25 Years | 4 (8.7%) | 23 (50.0%) |
| 25 to 34 Years | 12 (23.1%) | 40 (76.9%) |
| 35 to 44 Years | 31 (43.1%) | 45 (62.5%) |
| 45 to 54 Years | 8 (15.4%) | 40 (76.9%) |
| 55 to 64 Years | 26 (48.1%) | 33 (61.1%) |
| 65 to 74 Years | 51 (69.9%) | 59 (80.8%) |
| 75 Years and over | 50 (100.0%) | 38 (76.0%) |
| Total | 244 (47.7%) | 337 (65.9%) |
Disability Status by Sex by Age in Hawkeye
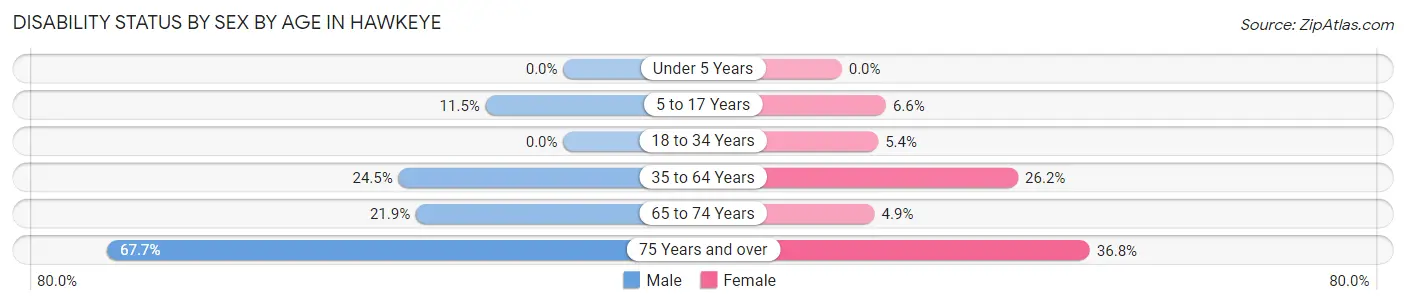
| Age Bracket | Male | Female |
| Under 5 Years | 0 (0.0%) | 0 (0.0%) |
| 5 to 17 Years | 3 (11.5%) | 4 (6.6%) |
| 18 to 34 Years | 0 (0.0%) | 2 (5.4%) |
| 35 to 64 Years | 23 (24.5%) | 22 (26.2%) |
| 65 to 74 Years | 7 (21.9%) | 2 (4.9%) |
| 75 Years and over | 21 (67.7%) | 7 (36.8%) |
Disability Class by Sex by Age in Hawkeye
Disability Class: Hearing Difficulty
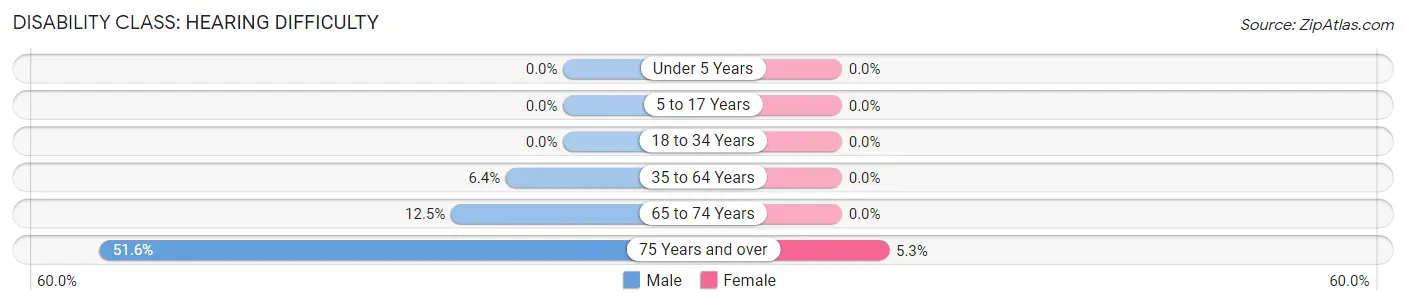
| Age Bracket | Male | Female |
| Under 5 Years | 0 (0.0%) | 0 (0.0%) |
| 5 to 17 Years | 0 (0.0%) | 0 (0.0%) |
| 18 to 34 Years | 0 (0.0%) | 0 (0.0%) |
| 35 to 64 Years | 6 (6.4%) | 0 (0.0%) |
| 65 to 74 Years | 4 (12.5%) | 0 (0.0%) |
| 75 Years and over | 16 (51.6%) | 1 (5.3%) |
Disability Class: Vision Difficulty
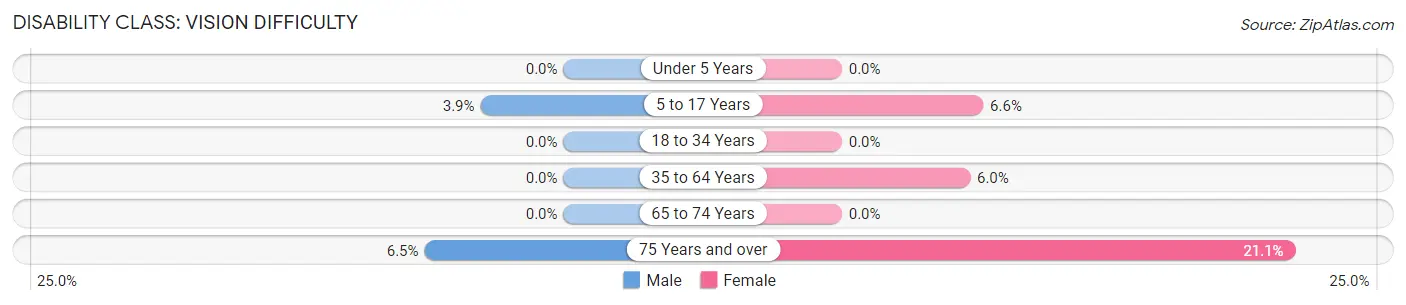
| Age Bracket | Male | Female |
| Under 5 Years | 0 (0.0%) | 0 (0.0%) |
| 5 to 17 Years | 1 (3.8%) | 4 (6.6%) |
| 18 to 34 Years | 0 (0.0%) | 0 (0.0%) |
| 35 to 64 Years | 0 (0.0%) | 5 (5.9%) |
| 65 to 74 Years | 0 (0.0%) | 0 (0.0%) |
| 75 Years and over | 2 (6.5%) | 4 (21.0%) |
Disability Class: Cognitive Difficulty
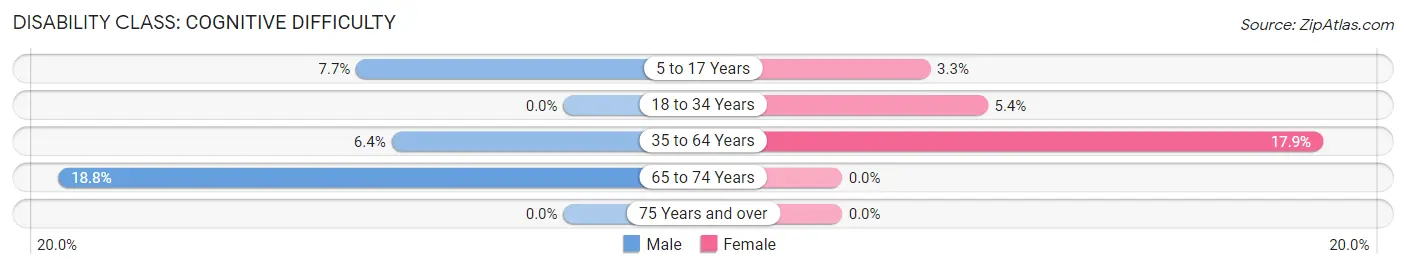
| Age Bracket | Male | Female |
| 5 to 17 Years | 2 (7.7%) | 2 (3.3%) |
| 18 to 34 Years | 0 (0.0%) | 2 (5.4%) |
| 35 to 64 Years | 6 (6.4%) | 15 (17.9%) |
| 65 to 74 Years | 6 (18.8%) | 0 (0.0%) |
| 75 Years and over | 0 (0.0%) | 0 (0.0%) |
Disability Class: Ambulatory Difficulty
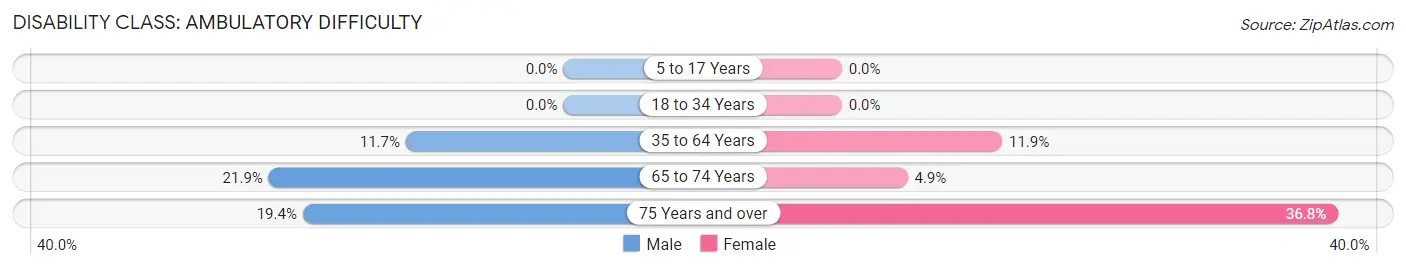
| Age Bracket | Male | Female |
| 5 to 17 Years | 0 (0.0%) | 0 (0.0%) |
| 18 to 34 Years | 0 (0.0%) | 0 (0.0%) |
| 35 to 64 Years | 11 (11.7%) | 10 (11.9%) |
| 65 to 74 Years | 7 (21.9%) | 2 (4.9%) |
| 75 Years and over | 6 (19.4%) | 7 (36.8%) |
Disability Class: Self-Care Difficulty
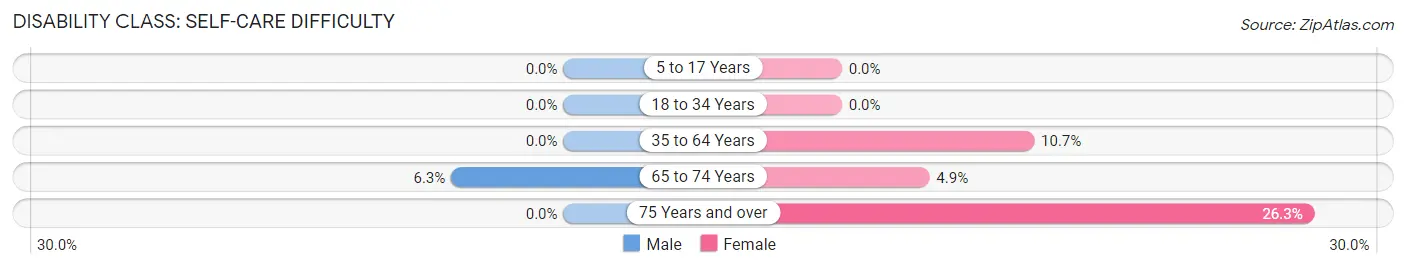
| Age Bracket | Male | Female |
| 5 to 17 Years | 0 (0.0%) | 0 (0.0%) |
| 18 to 34 Years | 0 (0.0%) | 0 (0.0%) |
| 35 to 64 Years | 0 (0.0%) | 9 (10.7%) |
| 65 to 74 Years | 2 (6.2%) | 2 (4.9%) |
| 75 Years and over | 0 (0.0%) | 5 (26.3%) |
Technology Access in Hawkeye
Computing Device Access in Hawkeye
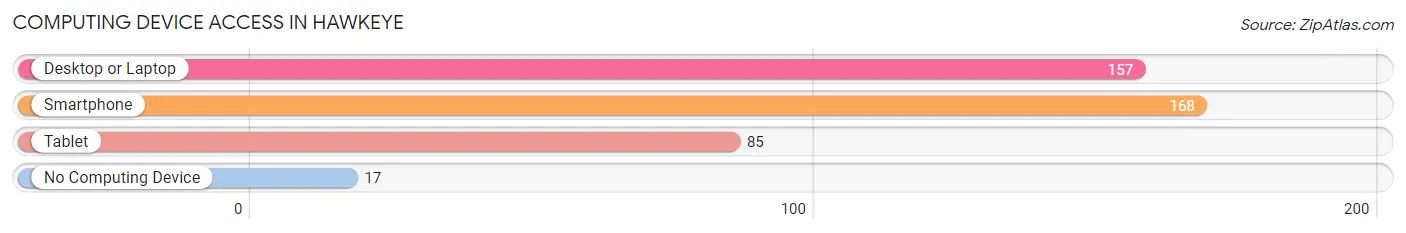
| Device Type | # Households | % Households |
| Desktop or Laptop | 157 | 75.8% |
| Smartphone | 168 | 81.2% |
| Tablet | 85 | 41.1% |
| No Computing Device | 17 | 8.2% |
| Total | 207 | 100.0% |
Internet Access in Hawkeye
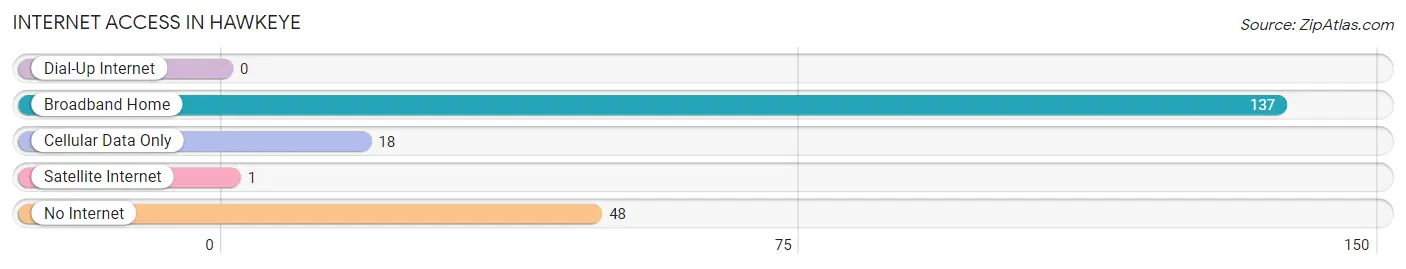
| Internet Type | # Households | % Households |
| Dial-Up Internet | 0 | 0.0% |
| Broadband Home | 137 | 66.2% |
| Cellular Data Only | 18 | 8.7% |
| Satellite Internet | 1 | 0.5% |
| No Internet | 48 | 23.2% |
| Total | 207 | 100.0% |
Hawkeye Summary
Hawkeye, Iowa is a small city located in the northeastern corner of the state, in Fayette County. It is situated on the banks of the Upper Iowa River, and is surrounded by rolling hills and lush farmland. The city has a population of just over 1,000 people, and is known for its small-town charm and friendly atmosphere.
History
The area that is now Hawkeye was first settled in the early 1800s by a group of German immigrants. The town was originally called “New Berlin”, and was founded in 1845. The name was changed to Hawkeye in 1851, in honor of the Native American tribe that once lived in the area.
The town grew slowly over the years, and by the early 1900s had become a thriving agricultural center. The town was home to several grain elevators, a creamery, and a number of other businesses. The town also had a railroad station, which connected it to the larger cities of Waterloo and Cedar Rapids.
In the 1950s, Hawkeye began to experience a period of growth and development. The town was home to a number of new businesses, including a furniture factory, a canning factory, and a feed mill. The town also had a number of new homes built, and the population began to grow.
Geography
Hawkeye is located in the northeastern corner of Iowa, in Fayette County. The city is situated on the banks of the Upper Iowa River, and is surrounded by rolling hills and lush farmland. The city is located about 40 miles from the state capital of Des Moines, and is about a two-hour drive from the larger cities of Cedar Rapids and Waterloo.
The city has a total area of 1.2 square miles, all of which is land. The city has a humid continental climate, with hot summers and cold winters. The average annual temperature is around 50 degrees Fahrenheit, and the average annual precipitation is around 35 inches.
Economy
The economy of Hawkeye is largely based on agriculture. The city is home to several grain elevators, a creamery, and a number of other businesses related to farming and agriculture. The city also has a number of small businesses, including a furniture factory, a canning factory, and a feed mill.
The city is also home to a number of manufacturing companies, including a plastics factory and a metal fabrication plant. The city also has a number of retail stores, including a grocery store, a hardware store, and a number of other small businesses.
Demographics
As of the 2010 census, the population of Hawkeye was 1,039. The racial makeup of the city was 97.3% White, 0.7% African American, 0.2% Native American, 0.2% Asian, 0.2% from other races, and 1.4% from two or more races. Hispanic or Latino of any race were 1.2% of the population.
The median income for a household in the city was $41,250, and the median income for a family was $50,000. The per capita income for the city was $20,845. About 8.3% of families and 10.2% of the population were below the poverty line, including 14.3% of those under age 18 and 8.2% of those age 65 or over.
Common Questions
What is Per Capita Income in Hawkeye?
Per Capita income in Hawkeye is $27,960.
What is the Median Family Income in Hawkeye?
Median Family Income in Hawkeye is $65,909.
What is the Median Household income in Hawkeye?
Median Household Income in Hawkeye is $55,938.
What is Income or Wage Gap in Hawkeye?
Income or Wage Gap in Hawkeye is 23.6%.
Women in Hawkeye earn 76.4 cents for every dollar earned by a man.
What is Inequality or Gini Index in Hawkeye?
Inequality or Gini Index in Hawkeye is 0.39.
What is the Total Population of Hawkeye?
Total Population of Hawkeye is 511.
What is the Total Male Population of Hawkeye?
Total Male Population of Hawkeye is 253.
What is the Total Female Population of Hawkeye?
Total Female Population of Hawkeye is 258.
What is the Ratio of Males per 100 Females in Hawkeye?
There are 98.06 Males per 100 Females in Hawkeye.
What is the Ratio of Females per 100 Males in Hawkeye?
There are 101.98 Females per 100 Males in Hawkeye.
What is the Median Population Age in Hawkeye?
Median Population Age in Hawkeye is 40.8 Years.
What is the Average Family Size in Hawkeye
Average Family Size in Hawkeye is 3.0 People.
What is the Average Household Size in Hawkeye
Average Household Size in Hawkeye is 2.5 People.
How Large is the Labor Force in Hawkeye?
There are 279 People in the Labor Forcein in Hawkeye.
What is the Percentage of People in the Labor Force in Hawkeye?
67.6% of People are in the Labor Force in Hawkeye.
What is the Unemployment Rate in Hawkeye?
Unemployment Rate in Hawkeye is 1.8%.