Harper, IA Map & Demographics
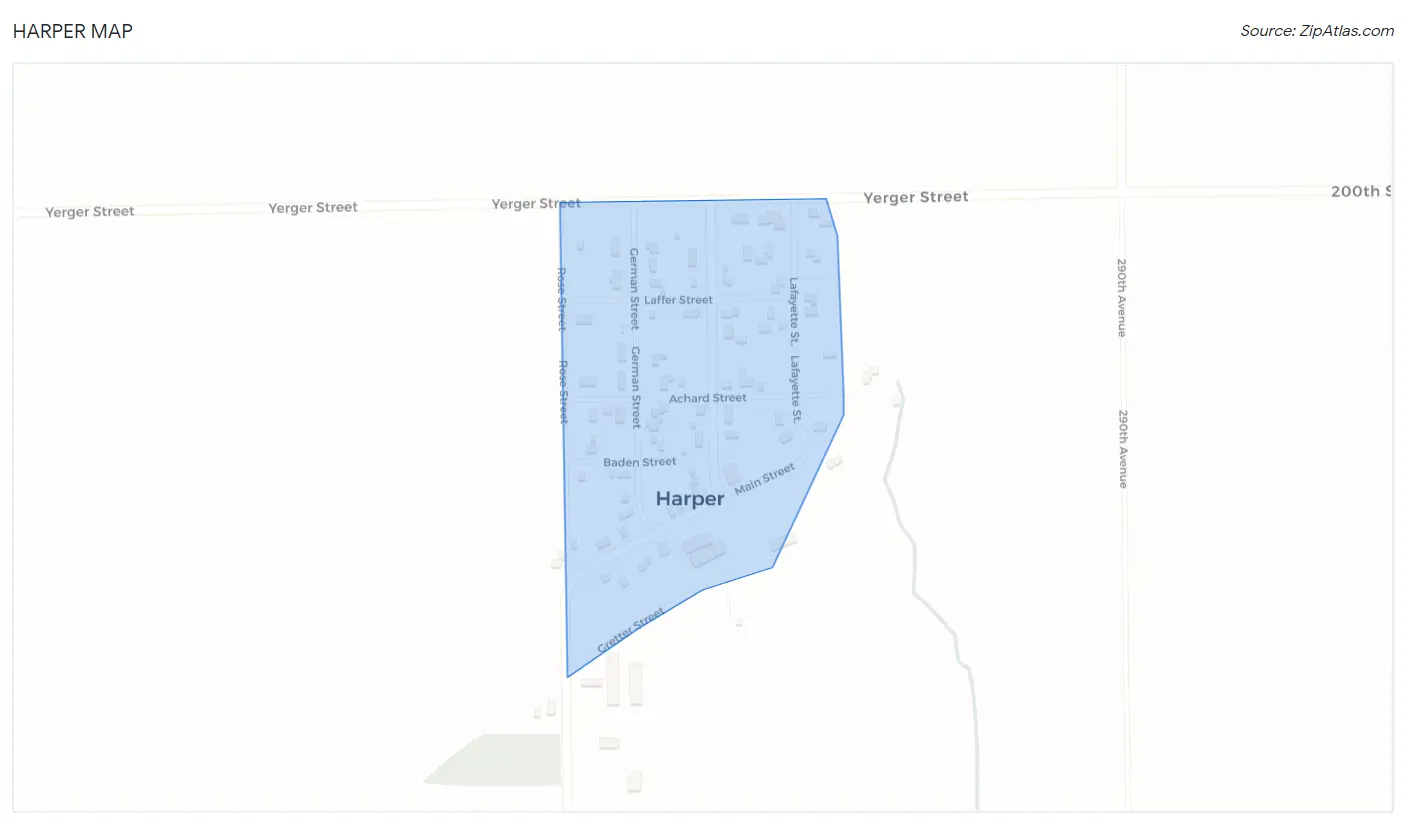
Harper Map
Harper Overview
$20,652
PER CAPITA INCOME
$92,813
AVG FAMILY INCOME
$70,000
AVG HOUSEHOLD INCOME
0.27
INEQUALITY / GINI INDEX
124
TOTAL POPULATION
52
MALE POPULATION
72
FEMALE POPULATION
72.22
MALES / 100 FEMALES
138.46
FEMALES / 100 MALES
22.2
MEDIAN AGE
4.6
AVG FAMILY SIZE
3.9
AVG HOUSEHOLD SIZE
63
LABOR FORCE [ PEOPLE ]
77.8%
PERCENT IN LABOR FORCE
11.1%
UNEMPLOYMENT RATE
Harper Zip Codes
Harper Area Codes
Income in Harper
Income Overview in Harper
Per Capita Income in Harper is $20,652, while median incomes of families and households are $92,813 and $70,000 respectively.
| Characteristic | Number | Measure |
| Per Capita Income | 124 | $20,652 |
| Median Family Income | 25 | $92,813 |
| Mean Family Income | 25 | $88,852 |
| Median Household Income | 32 | $70,000 |
| Mean Household Income | 32 | $76,666 |
| Income Deficit | 25 | $0 |
| Wage / Income Gap (%) | 124 | 0.00% |
| Wage / Income Gap ($) | 124 | 100.00¢ per $1 |
| Gini / Inequality Index | 124 | 0.27 |
Earnings by Sex in Harper
| Sex | Number | Average Earnings |
| Male | 26 (44.8%) | $0 |
| Female | 32 (55.2%) | $0 |
| Total | 58 (100.0%) | $0 |
Earnings by Sex by Income Bracket in Harper
The most common earnings brackets in Harper are $15,000 to $17,499 for men (7 | 26.9%) and $15,000 to $17,499 for women (6 | 18.8%).
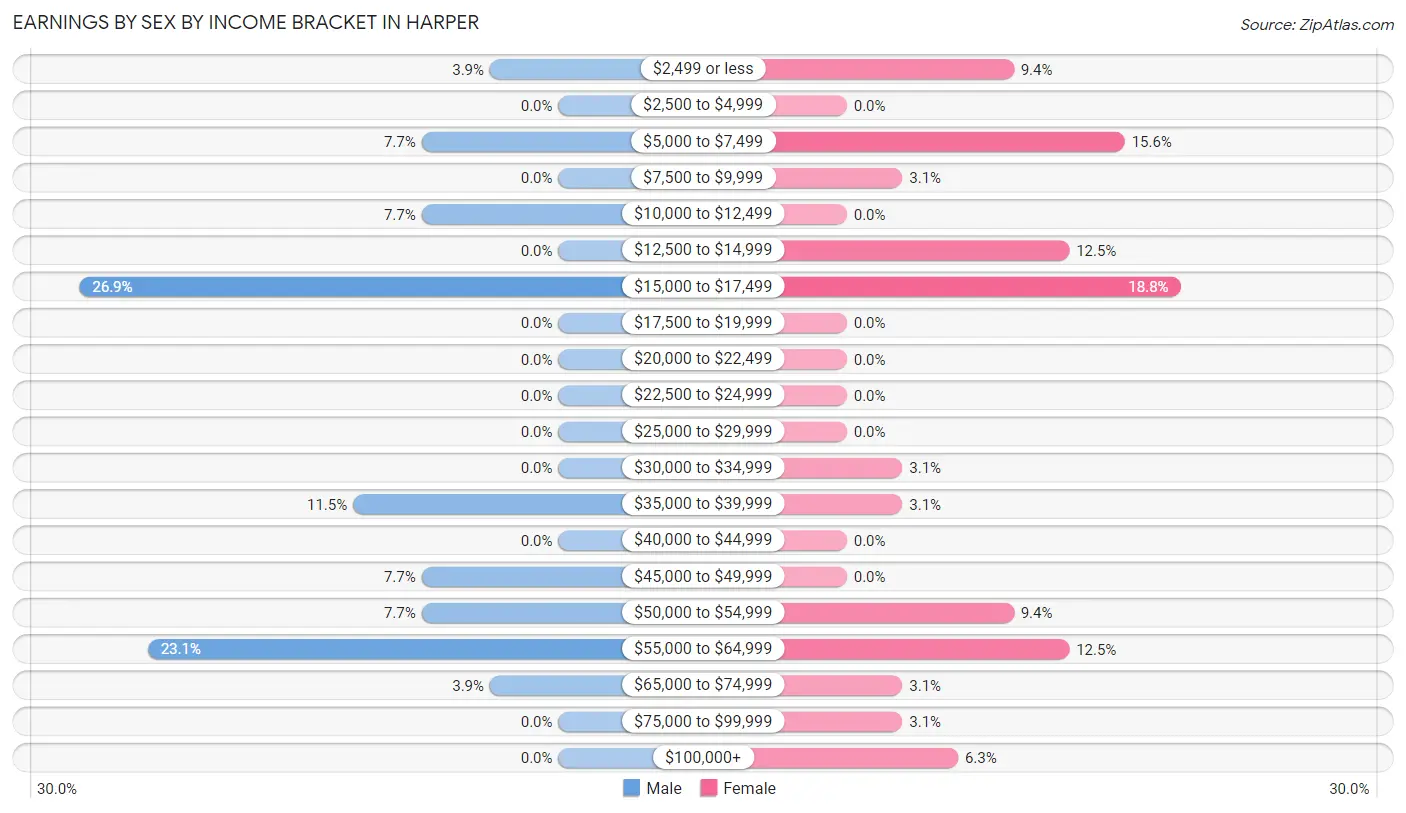
| Income | Male | Female |
| $2,499 or less | 1 (3.8%) | 3 (9.4%) |
| $2,500 to $4,999 | 0 (0.0%) | 0 (0.0%) |
| $5,000 to $7,499 | 2 (7.7%) | 5 (15.6%) |
| $7,500 to $9,999 | 0 (0.0%) | 1 (3.1%) |
| $10,000 to $12,499 | 2 (7.7%) | 0 (0.0%) |
| $12,500 to $14,999 | 0 (0.0%) | 4 (12.5%) |
| $15,000 to $17,499 | 7 (26.9%) | 6 (18.8%) |
| $17,500 to $19,999 | 0 (0.0%) | 0 (0.0%) |
| $20,000 to $22,499 | 0 (0.0%) | 0 (0.0%) |
| $22,500 to $24,999 | 0 (0.0%) | 0 (0.0%) |
| $25,000 to $29,999 | 0 (0.0%) | 0 (0.0%) |
| $30,000 to $34,999 | 0 (0.0%) | 1 (3.1%) |
| $35,000 to $39,999 | 3 (11.5%) | 1 (3.1%) |
| $40,000 to $44,999 | 0 (0.0%) | 0 (0.0%) |
| $45,000 to $49,999 | 2 (7.7%) | 0 (0.0%) |
| $50,000 to $54,999 | 2 (7.7%) | 3 (9.4%) |
| $55,000 to $64,999 | 6 (23.1%) | 4 (12.5%) |
| $65,000 to $74,999 | 1 (3.8%) | 1 (3.1%) |
| $75,000 to $99,999 | 0 (0.0%) | 1 (3.1%) |
| $100,000+ | 0 (0.0%) | 2 (6.2%) |
| Total | 26 (100.0%) | 32 (100.0%) |
Earnings by Sex by Educational Attainment in Harper
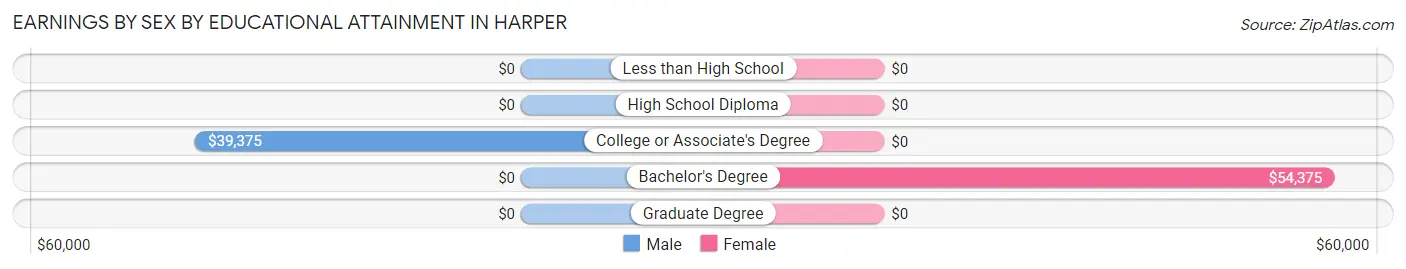
| Educational Attainment | Male Income | Female Income |
| Less than High School | - | - |
| High School Diploma | - | - |
| College or Associate's Degree | $39,375 | $0 |
| Bachelor's Degree | - | - |
| Graduate Degree | - | - |
| Total | $53,125 | $0 |
Family Income in Harper
Family Income Brackets in Harper
According to the Harper family income data, there are 9 families falling into the $100,000 to $149,999 income range, which is the most common income bracket and makes up 36.0% of all families.
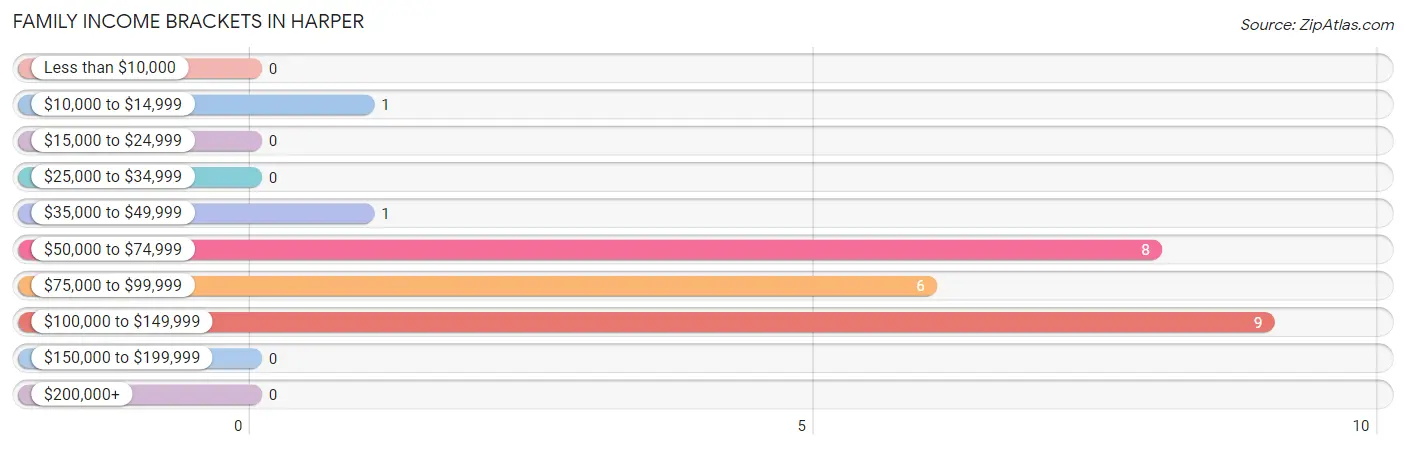
| Income Bracket | # Families | % Families |
| Less than $10,000 | 0 | 0.0% |
| $10,000 to $14,999 | 1 | 4.0% |
| $15,000 to $24,999 | 0 | 0.0% |
| $25,000 to $34,999 | 0 | 0.0% |
| $35,000 to $49,999 | 1 | 4.0% |
| $50,000 to $74,999 | 8 | 32.0% |
| $75,000 to $99,999 | 6 | 24.0% |
| $100,000 to $149,999 | 9 | 36.0% |
| $150,000 to $199,999 | 0 | 0.0% |
| $200,000+ | 0 | 0.0% |
Family Income by Famaliy Size in Harper
3-person families (4 | 16.0%) account for the highest median family income in Harper with $126,250 per family, while 3-person families (4 | 16.0%) have the highest median income of $42,083 per family member.
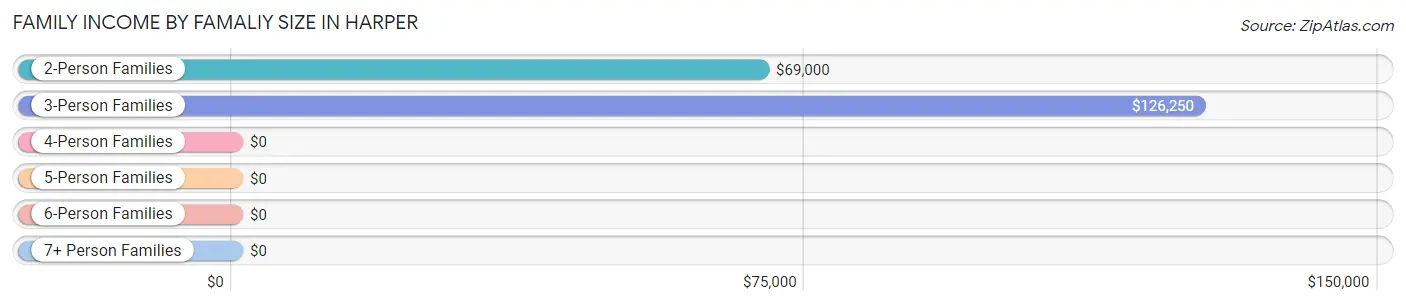
| Income Bracket | # Families | Median Income |
| 2-Person Families | 12 (48.0%) | $69,000 |
| 3-Person Families | 4 (16.0%) | $126,250 |
| 4-Person Families | 1 (4.0%) | $0 |
| 5-Person Families | 5 (20.0%) | $0 |
| 6-Person Families | 2 (8.0%) | $0 |
| 7+ Person Families | 1 (4.0%) | $0 |
| Total | 25 (100.0%) | $92,813 |
Family Income by Number of Earners in Harper
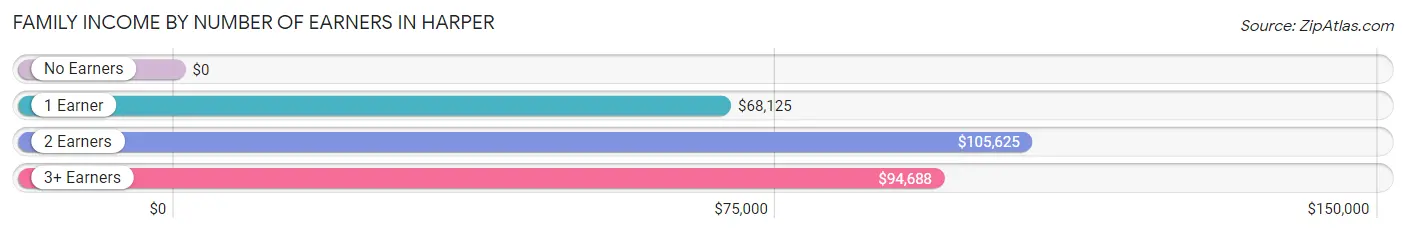
| Number of Earners | # Families | Median Income |
| No Earners | 4 (16.0%) | $0 |
| 1 Earner | 7 (28.0%) | $68,125 |
| 2 Earners | 7 (28.0%) | $105,625 |
| 3+ Earners | 7 (28.0%) | $94,688 |
| Total | 25 (100.0%) | $92,813 |
Household Income in Harper
Household Income Brackets in Harper
With 9 households falling in the category, the $100,000 to $149,999 income range is the most frequent in Harper, accounting for 28.1% of all households.
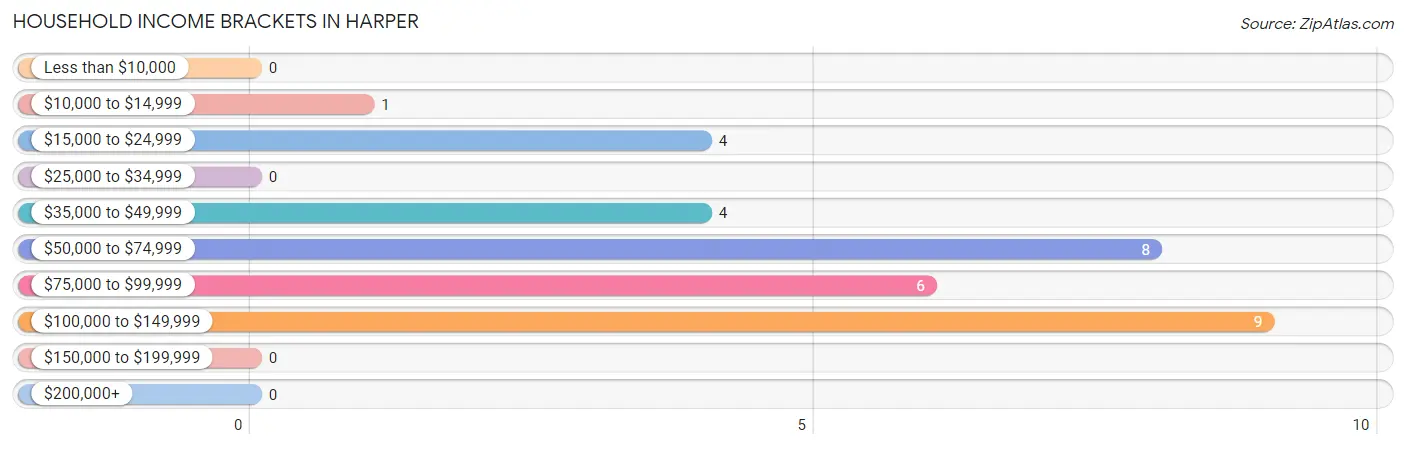
| Income Bracket | # Households | % Households |
| Less than $10,000 | 0 | 0.0% |
| $10,000 to $14,999 | 1 | 3.1% |
| $15,000 to $24,999 | 4 | 12.5% |
| $25,000 to $34,999 | 0 | 0.0% |
| $35,000 to $49,999 | 4 | 12.5% |
| $50,000 to $74,999 | 8 | 25.0% |
| $75,000 to $99,999 | 6 | 18.8% |
| $100,000 to $149,999 | 9 | 28.1% |
| $150,000 to $199,999 | 0 | 0.0% |
| $200,000+ | 0 | 0.0% |
Household Income by Householder Age in Harper
The median household income in Harper is $70,000, with the highest median household income of $94,375 found in the 25 to 44 years age bracket for the primary householder. A total of 16 households (50.0%) fall into this category.
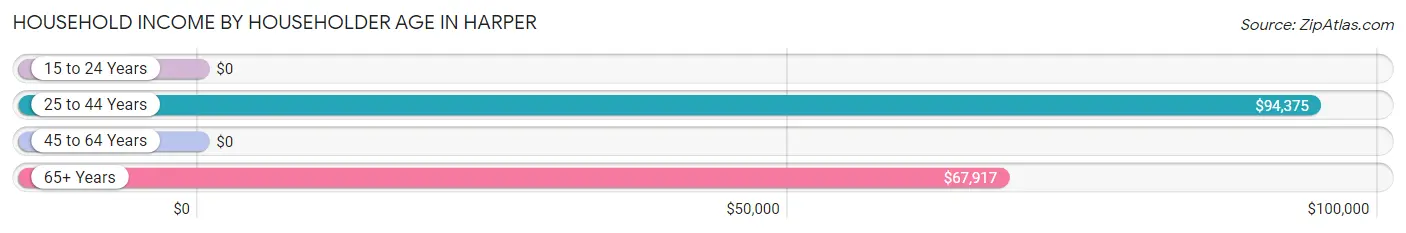
| Income Bracket | # Households | Median Income |
| 15 to 24 Years | 0 (0.0%) | $0 |
| 25 to 44 Years | 16 (50.0%) | $94,375 |
| 45 to 64 Years | 7 (21.9%) | $0 |
| 65+ Years | 9 (28.1%) | $67,917 |
| Total | 32 (100.0%) | $70,000 |
Poverty in Harper
Income Below Poverty by Sex and Age in Harper
With 3.9% poverty level for males and 4.2% for females among the residents of Harper, 18 to 24 year old males and 12 to 14 year old females are the most vulnerable to poverty, with 2 males (12.5%) and 2 females (11.1%) in their respective age groups living below the poverty level.
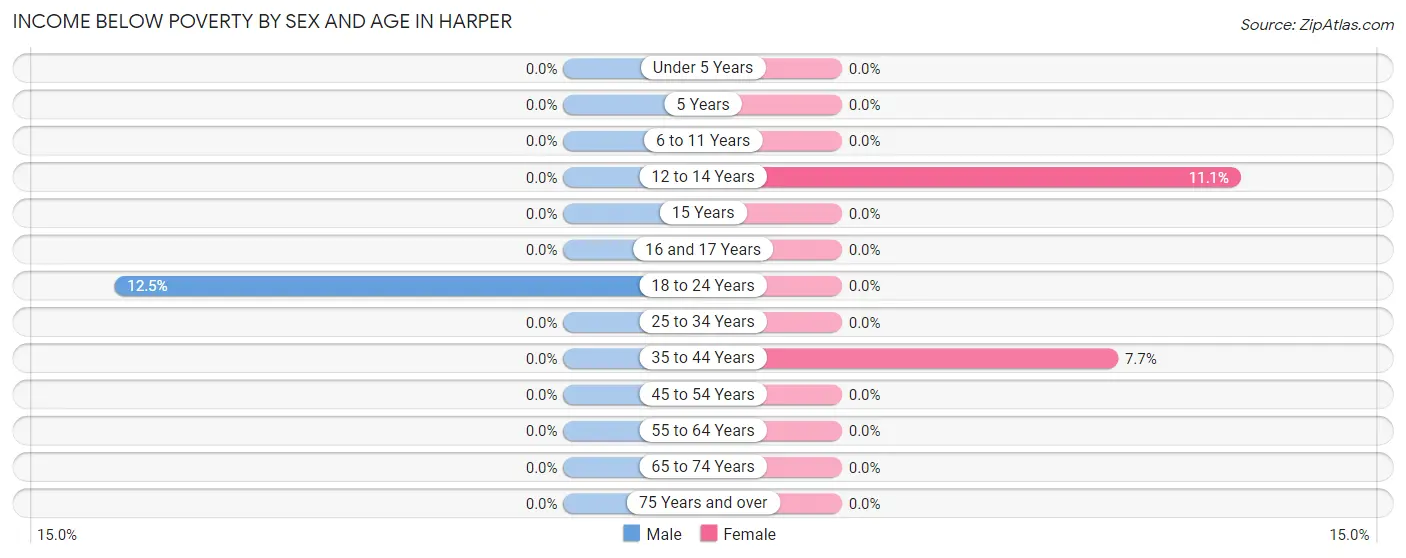
| Age Bracket | Male | Female |
| Under 5 Years | 0 (0.0%) | 0 (0.0%) |
| 5 Years | 0 (0.0%) | 0 (0.0%) |
| 6 to 11 Years | 0 (0.0%) | 0 (0.0%) |
| 12 to 14 Years | 0 (0.0%) | 2 (11.1%) |
| 15 Years | 0 (0.0%) | 0 (0.0%) |
| 16 and 17 Years | 0 (0.0%) | 0 (0.0%) |
| 18 to 24 Years | 2 (12.5%) | 0 (0.0%) |
| 25 to 34 Years | 0 (0.0%) | 0 (0.0%) |
| 35 to 44 Years | 0 (0.0%) | 1 (7.7%) |
| 45 to 54 Years | 0 (0.0%) | 0 (0.0%) |
| 55 to 64 Years | 0 (0.0%) | 0 (0.0%) |
| 65 to 74 Years | 0 (0.0%) | 0 (0.0%) |
| 75 Years and over | 0 (0.0%) | 0 (0.0%) |
| Total | 2 (3.9%) | 3 (4.2%) |
Income Above Poverty by Sex and Age in Harper
According to the poverty statistics in Harper, males aged under 5 years and females aged under 5 years are the age groups that are most secure financially, with 100.0% of males and 100.0% of females in these age groups living above the poverty line.
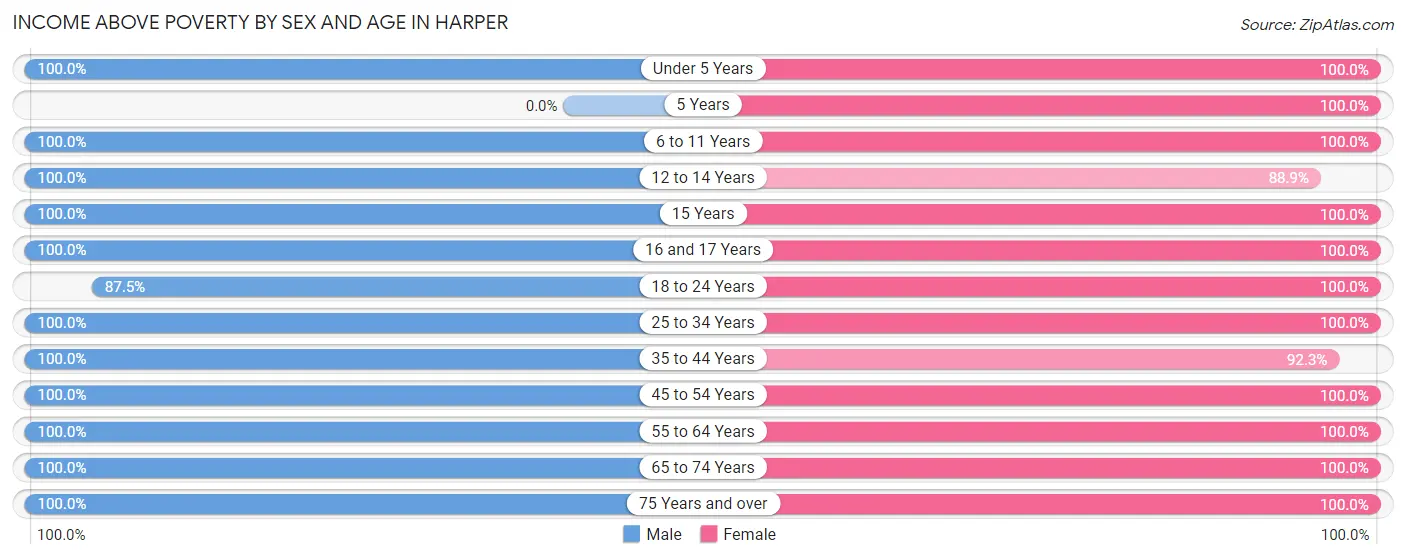
| Age Bracket | Male | Female |
| Under 5 Years | 3 (100.0%) | 3 (100.0%) |
| 5 Years | 0 (0.0%) | 2 (100.0%) |
| 6 to 11 Years | 2 (100.0%) | 5 (100.0%) |
| 12 to 14 Years | 2 (100.0%) | 16 (88.9%) |
| 15 Years | 2 (100.0%) | 5 (100.0%) |
| 16 and 17 Years | 1 (100.0%) | 1 (100.0%) |
| 18 to 24 Years | 14 (87.5%) | 6 (100.0%) |
| 25 to 34 Years | 2 (100.0%) | 7 (100.0%) |
| 35 to 44 Years | 12 (100.0%) | 12 (92.3%) |
| 45 to 54 Years | 4 (100.0%) | 2 (100.0%) |
| 55 to 64 Years | 1 (100.0%) | 2 (100.0%) |
| 65 to 74 Years | 4 (100.0%) | 7 (100.0%) |
| 75 Years and over | 2 (100.0%) | 1 (100.0%) |
| Total | 49 (96.1%) | 69 (95.8%) |
Income Below Poverty Among Married-Couple Families in Harper
| Children | Above Poverty | Below Poverty |
| No Children | 8 (100.0%) | 0 (0.0%) |
| 1 or 2 Children | 8 (100.0%) | 0 (0.0%) |
| 3 or 4 Children | 3 (100.0%) | 0 (0.0%) |
| 5 or more Children | 0 (0.0%) | 0 (0.0%) |
| Total | 19 (100.0%) | 0 (0.0%) |
Income Below Poverty Among Single-Parent Households in Harper
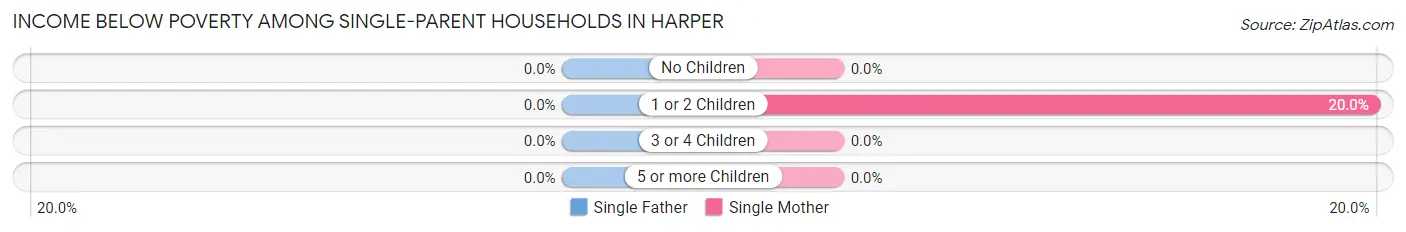
| Children | Single Father | Single Mother |
| No Children | 0 (0.0%) | 0 (0.0%) |
| 1 or 2 Children | 0 (0.0%) | 1 (20.0%) |
| 3 or 4 Children | 0 (0.0%) | 0 (0.0%) |
| 5 or more Children | 0 (0.0%) | 0 (0.0%) |
| Total | 0 (0.0%) | 1 (16.7%) |
Income Below Poverty Among Married-Couple vs Single-Parent Households in Harper
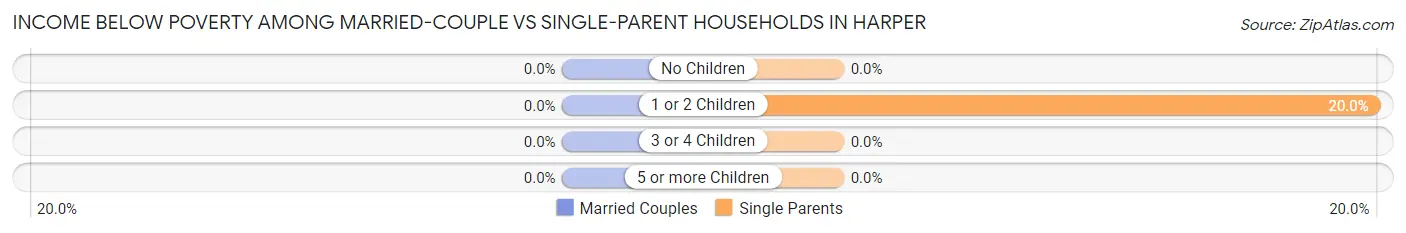
| Children | Married-Couple Families | Single-Parent Households |
| No Children | 0 (0.0%) | 0 (0.0%) |
| 1 or 2 Children | 0 (0.0%) | 1 (20.0%) |
| 3 or 4 Children | 0 (0.0%) | 0 (0.0%) |
| 5 or more Children | 0 (0.0%) | 0 (0.0%) |
| Total | 0 (0.0%) | 1 (16.7%) |
Race in Harper
The most populous races in Harper are White / Caucasian (115 | 92.7%), Two or more Races (6 | 4.8%), and Asian (1 | 0.8%).
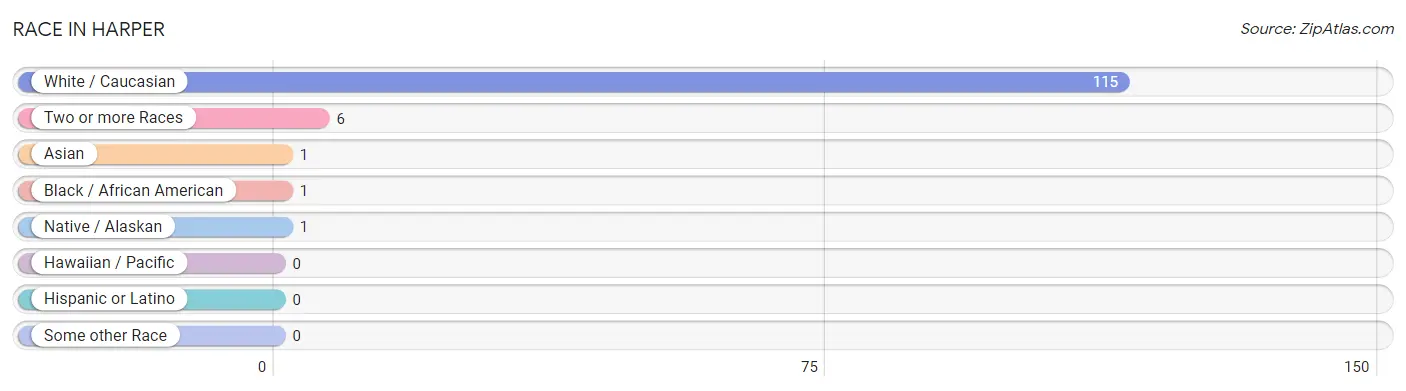
| Race | # Population | % Population |
| Asian | 1 | 0.8% |
| Black / African American | 1 | 0.8% |
| Hawaiian / Pacific | 0 | 0.0% |
| Hispanic or Latino | 0 | 0.0% |
| Native / Alaskan | 1 | 0.8% |
| White / Caucasian | 115 | 92.7% |
| Two or more Races | 6 | 4.8% |
| Some other Race | 0 | 0.0% |
| Total | 124 | 100.0% |
Ancestry in Harper
The most populous ancestries reported in Harper are English (32 | 25.8%), American (20 | 16.1%), German (11 | 8.9%), Irish (5 | 4.0%), and Thai (3 | 2.4%), together accounting for 57.3% of all Harper residents.
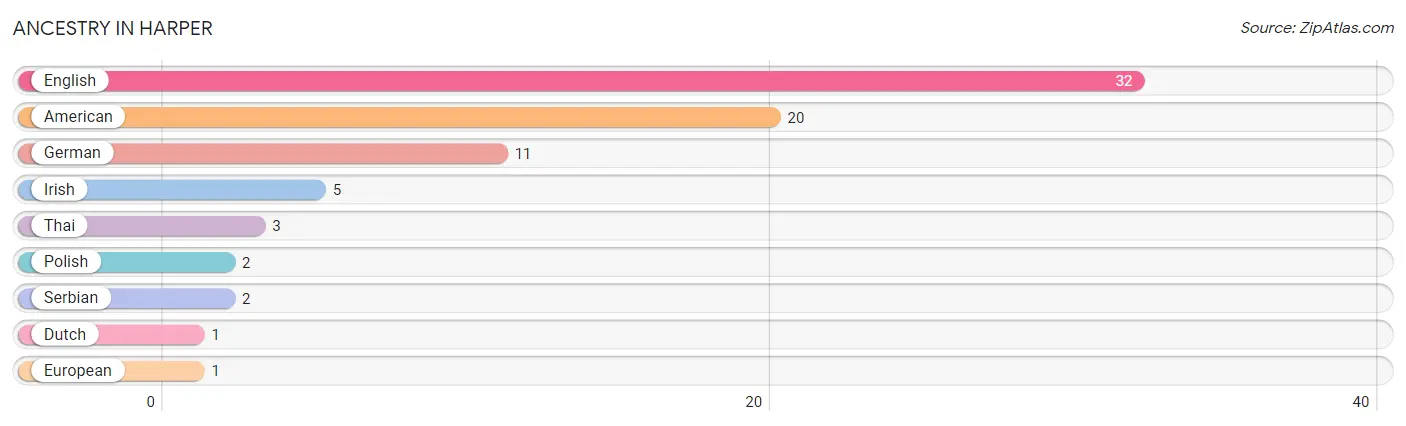
| Ancestry | # Population | % Population |
| American | 20 | 16.1% |
| Dutch | 1 | 0.8% |
| English | 32 | 25.8% |
| European | 1 | 0.8% |
| German | 11 | 8.9% |
| Irish | 5 | 4.0% |
| Polish | 2 | 1.6% |
| Serbian | 2 | 1.6% |
| Thai | 3 | 2.4% | View All 9 Rows |
Immigrants in Harper
The most numerous immigrant groups reported in Harper came from Asia (1 | 0.8%), India (1 | 0.8%), and South Central Asia (1 | 0.8%), together accounting for 2.4% of all Harper residents.
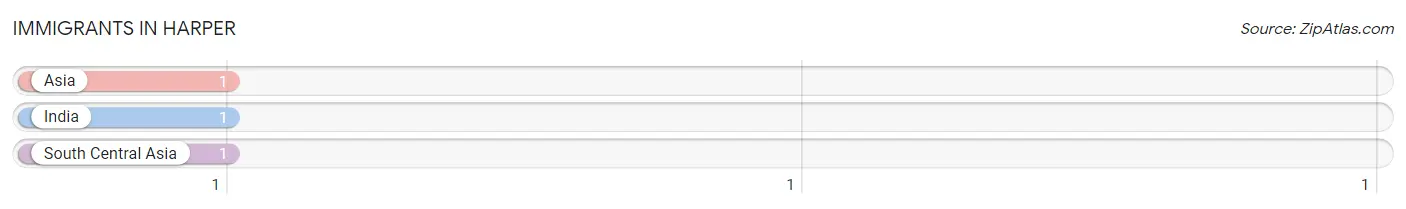
| Immigration Origin | # Population | % Population |
| Asia | 1 | 0.8% |
| India | 1 | 0.8% |
| South Central Asia | 1 | 0.8% | View All 3 Rows |
Sex and Age in Harper
Sex and Age in Harper
The most populous age groups in Harper are 15 to 19 Years (17 | 32.7%) for men and 10 to 14 Years (21 | 29.2%) for women.
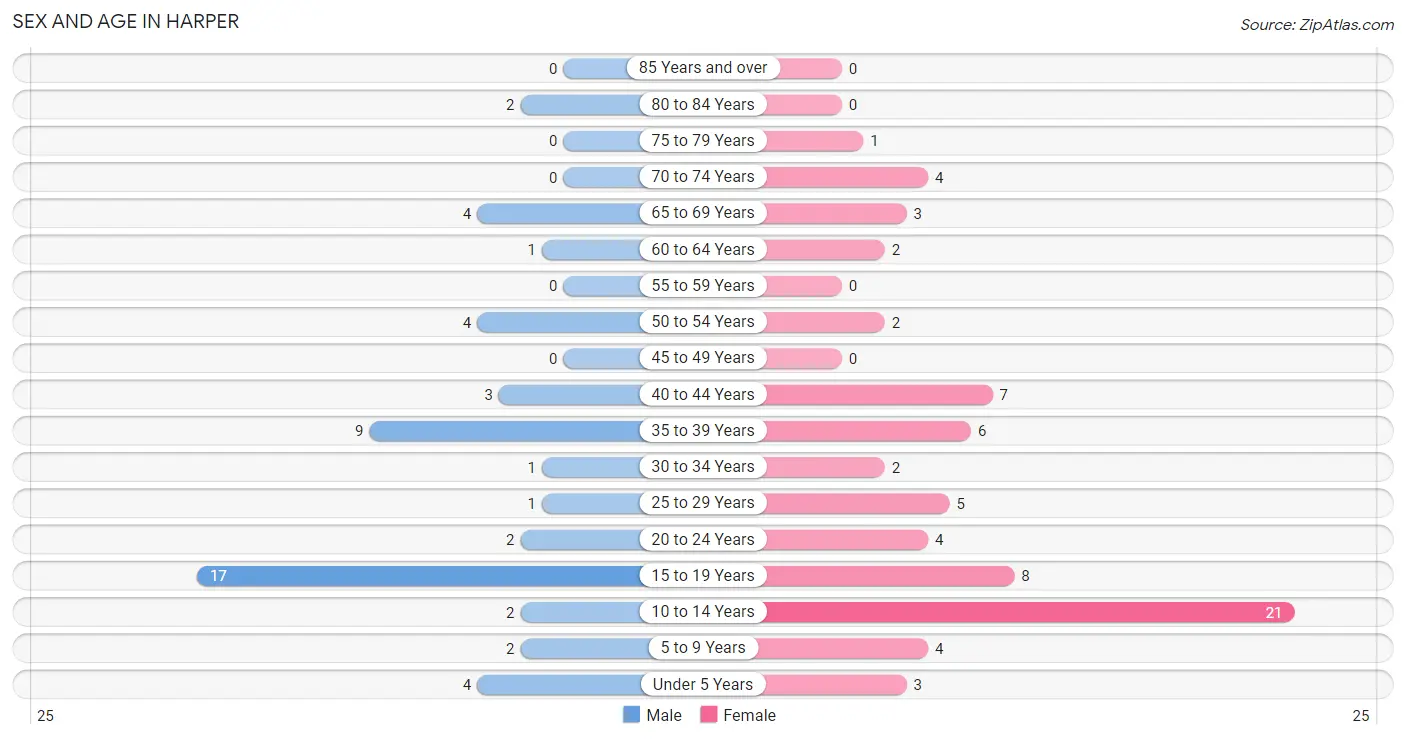
| Age Bracket | Male | Female |
| Under 5 Years | 4 (7.7%) | 3 (4.2%) |
| 5 to 9 Years | 2 (3.8%) | 4 (5.6%) |
| 10 to 14 Years | 2 (3.8%) | 21 (29.2%) |
| 15 to 19 Years | 17 (32.7%) | 8 (11.1%) |
| 20 to 24 Years | 2 (3.8%) | 4 (5.6%) |
| 25 to 29 Years | 1 (1.9%) | 5 (6.9%) |
| 30 to 34 Years | 1 (1.9%) | 2 (2.8%) |
| 35 to 39 Years | 9 (17.3%) | 6 (8.3%) |
| 40 to 44 Years | 3 (5.8%) | 7 (9.7%) |
| 45 to 49 Years | 0 (0.0%) | 0 (0.0%) |
| 50 to 54 Years | 4 (7.7%) | 2 (2.8%) |
| 55 to 59 Years | 0 (0.0%) | 0 (0.0%) |
| 60 to 64 Years | 1 (1.9%) | 2 (2.8%) |
| 65 to 69 Years | 4 (7.7%) | 3 (4.2%) |
| 70 to 74 Years | 0 (0.0%) | 4 (5.6%) |
| 75 to 79 Years | 0 (0.0%) | 1 (1.4%) |
| 80 to 84 Years | 2 (3.8%) | 0 (0.0%) |
| 85 Years and over | 0 (0.0%) | 0 (0.0%) |
| Total | 52 (100.0%) | 72 (100.0%) |
Families and Households in Harper
Median Family Size in Harper
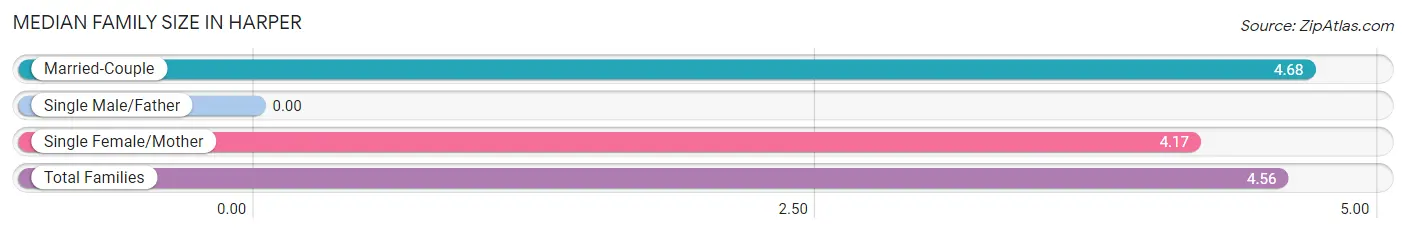
| Family Type | # Families | Family Size |
| Married-Couple | 19 (76.0%) | 4.68 |
| Single Male/Father | 0 (0.0%) | - |
| Single Female/Mother | 6 (24.0%) | 4.17 |
| Total Families | 25 (100.0%) | 4.56 |
Median Household Size in Harper
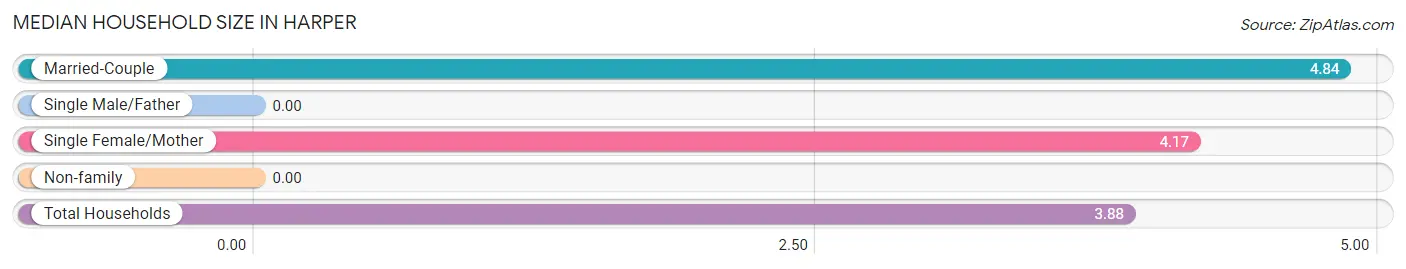
| Household Type | # Households | Household Size |
| Married-Couple | 19 (59.4%) | 4.84 |
| Single Male/Father | 0 (0.0%) | - |
| Single Female/Mother | 6 (18.8%) | 4.17 |
| Non-family | 7 (21.9%) | - |
| Total Households | 32 (100.0%) | 3.88 |
Household Size by Marriage Status in Harper
Out of a total of 32 households in Harper, 25 (78.1%) are family households, while 7 (21.9%) are nonfamily households. The most numerous type of family households are 2-person households, comprising 12, and the most common type of nonfamily households are 1-person households, comprising 7.
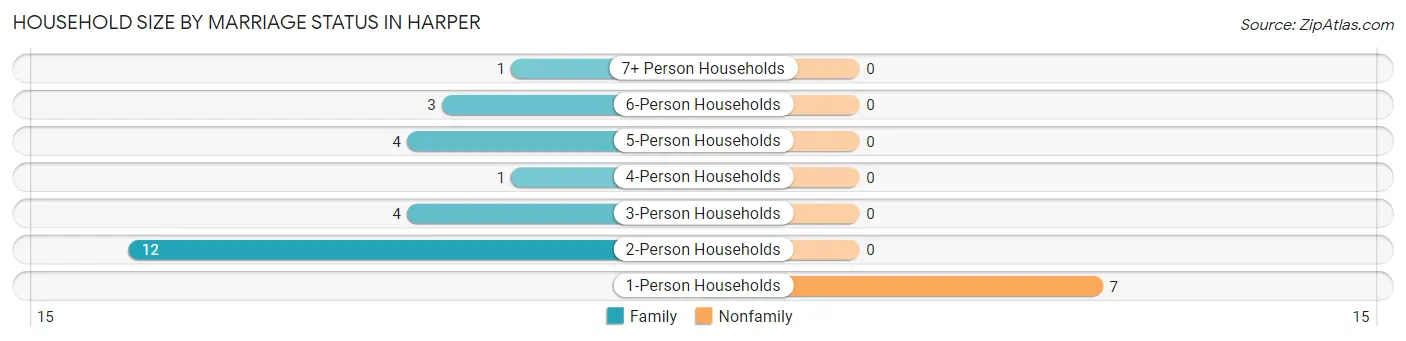
| Household Size | Family Households | Nonfamily Households |
| 1-Person Households | - | 7 (21.9%) |
| 2-Person Households | 12 (37.5%) | 0 (0.0%) |
| 3-Person Households | 4 (12.5%) | 0 (0.0%) |
| 4-Person Households | 1 (3.1%) | 0 (0.0%) |
| 5-Person Households | 4 (12.5%) | 0 (0.0%) |
| 6-Person Households | 3 (9.4%) | 0 (0.0%) |
| 7+ Person Households | 1 (3.1%) | 0 (0.0%) |
| Total | 25 (78.1%) | 7 (21.9%) |
Female Fertility in Harper
Fertility by Age in Harper
Average fertility rate in Harper is 31.0 births per 1,000 women. Women in the age bracket of 35 to 50 years have the highest fertility rate with 77.0 births per 1,000 women. Women in the age bracket of 35 to 50 years acount for 100.0% of all women with births.
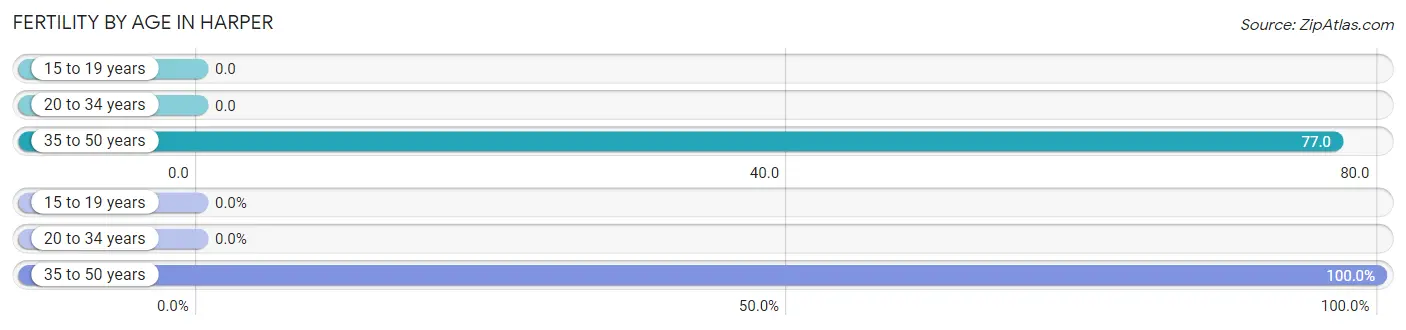
| Age Bracket | Women with Births | Births / 1,000 Women |
| 15 to 19 years | 0 (0.0%) | 0.0 |
| 20 to 34 years | 0 (0.0%) | 0.0 |
| 35 to 50 years | 1 (100.0%) | 77.0 |
| Total | 1 (100.0%) | 31.0 |
Fertility by Age by Marriage Status in Harper
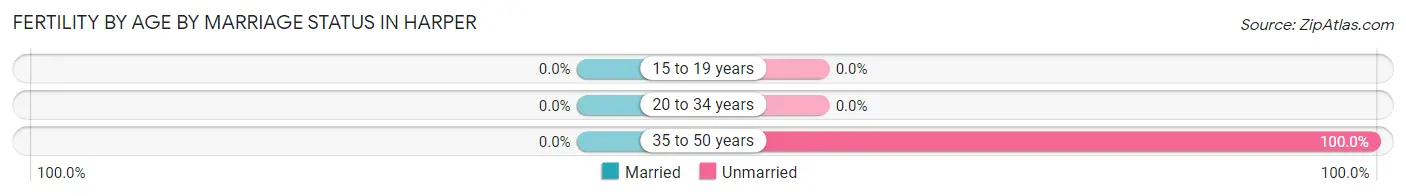
| Age Bracket | Married | Unmarried |
| 15 to 19 years | 0 (0.0%) | 0 (0.0%) |
| 20 to 34 years | 0 (0.0%) | 0 (0.0%) |
| 35 to 50 years | 0 (0.0%) | 1 (100.0%) |
| Total | 0 (0.0%) | 1 (100.0%) |
Fertility by Education in Harper
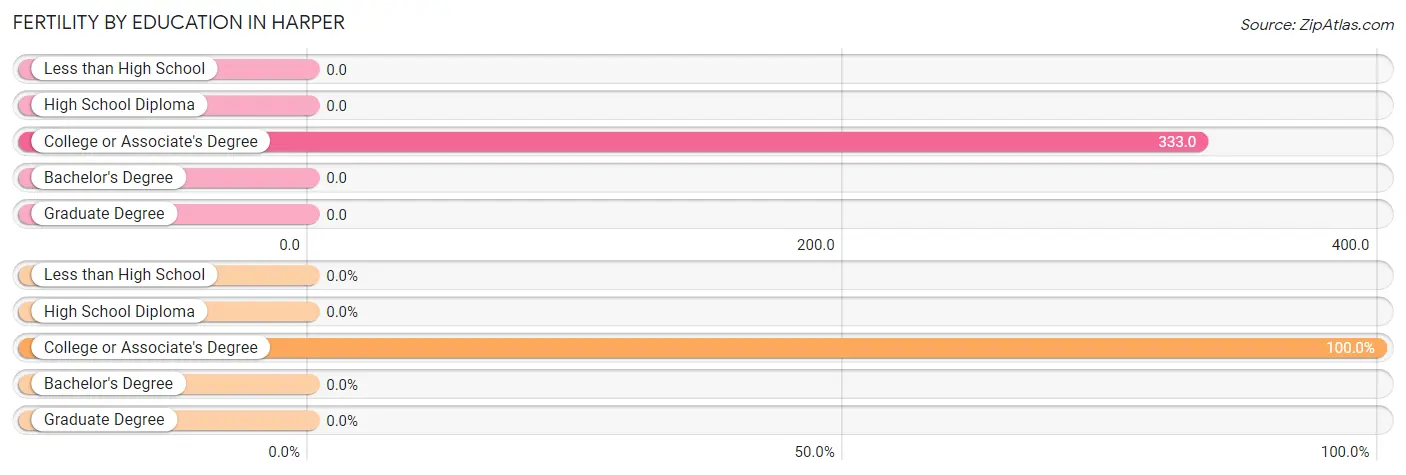
| Educational Attainment | Women with Births | Births / 1,000 Women |
| Less than High School | 0 (0.0%) | 0.0 |
| High School Diploma | 0 (0.0%) | 0.0 |
| College or Associate's Degree | 1 (100.0%) | 333.0 |
| Bachelor's Degree | 0 (0.0%) | 0.0 |
| Graduate Degree | 0 (0.0%) | 0.0 |
| Total | 1 (100.0%) | 31.0 |
Fertility by Education by Marriage Status in Harper
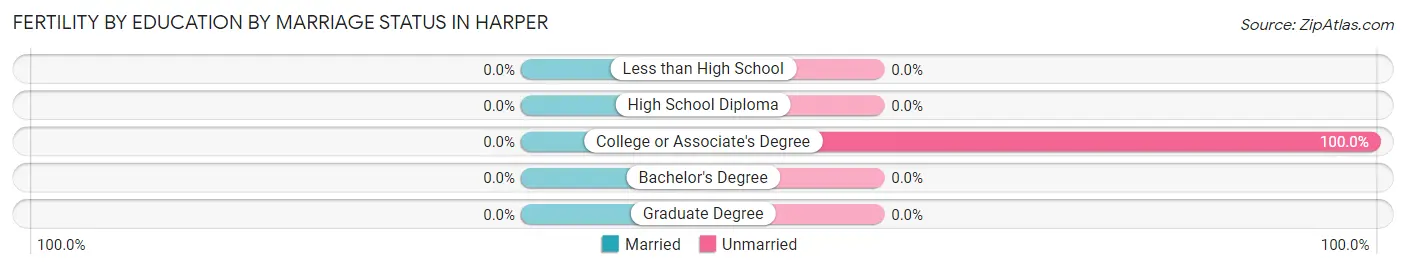
| Educational Attainment | Married | Unmarried |
| Less than High School | 0 (0.0%) | 0 (0.0%) |
| High School Diploma | 0 (0.0%) | 0 (0.0%) |
| College or Associate's Degree | 0 (0.0%) | 1 (100.0%) |
| Bachelor's Degree | 0 (0.0%) | 0 (0.0%) |
| Graduate Degree | 0 (0.0%) | 0 (0.0%) |
| Total | 0 (0.0%) | 1 (100.0%) |
Employment Characteristics in Harper
Employment by Class of Employer in Harper
Among the 52 employed individuals in Harper, private company employees (40 | 76.9%), not-for-profit organizations (4 | 7.7%), and state government employees (4 | 7.7%) make up the most common classes of employment.
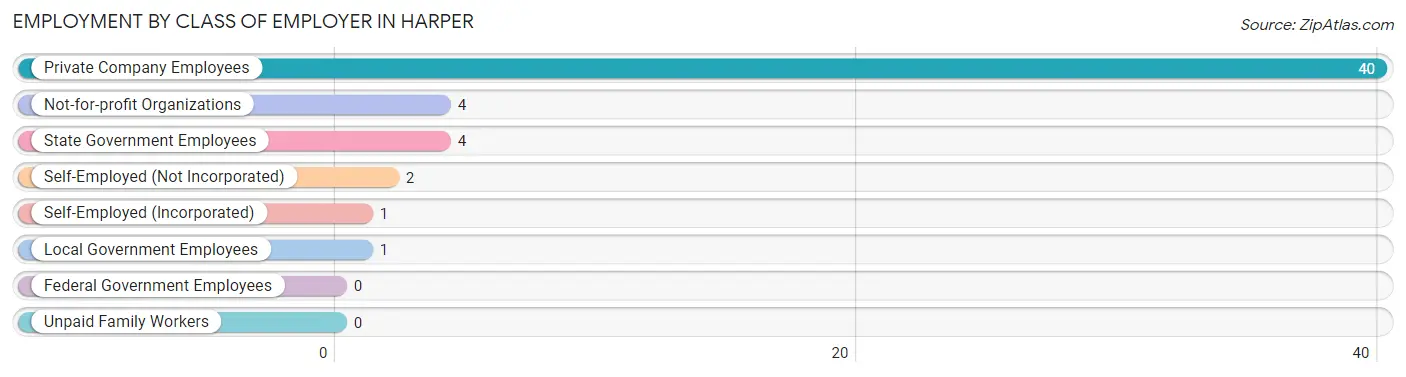
| Employer Class | # Employees | % Employees |
| Private Company Employees | 40 | 76.9% |
| Self-Employed (Incorporated) | 1 | 1.9% |
| Self-Employed (Not Incorporated) | 2 | 3.8% |
| Not-for-profit Organizations | 4 | 7.7% |
| Local Government Employees | 1 | 1.9% |
| State Government Employees | 4 | 7.7% |
| Federal Government Employees | 0 | 0.0% |
| Unpaid Family Workers | 0 | 0.0% |
| Total | 52 | 100.0% |
Employment Status by Age in Harper
According to the labor force statistics for Harper, out of the total population over 16 years of age (81), 77.8% or 63 individuals are in the labor force, with 11.1% or 7 of them unemployed. The age group with the highest labor force participation rate is 20 to 24 years, with 100.0% or 6 individuals in the labor force. Within the labor force, the 75 years and over age range has the highest percentage of unemployed individuals, with 100.0% or 1 of them being unemployed.
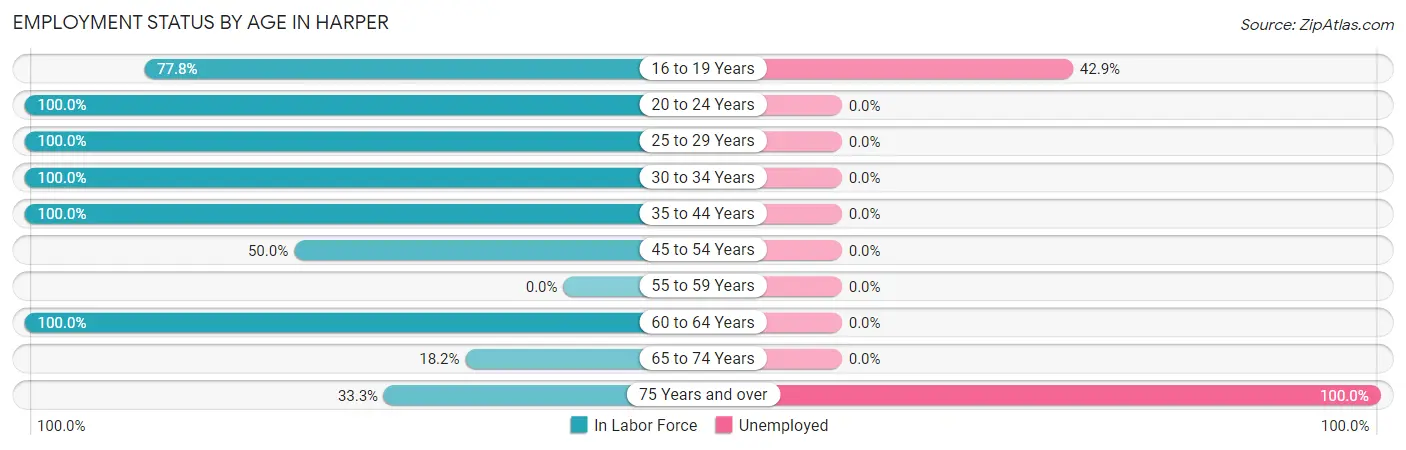
| Age Bracket | In Labor Force | Unemployed |
| 16 to 19 Years | 14 (77.8%) | 6 (42.9%) |
| 20 to 24 Years | 6 (100.0%) | 0 (0.0%) |
| 25 to 29 Years | 6 (100.0%) | 0 (0.0%) |
| 30 to 34 Years | 3 (100.0%) | 0 (0.0%) |
| 35 to 44 Years | 25 (100.0%) | 0 (0.0%) |
| 45 to 54 Years | 3 (50.0%) | 0 (0.0%) |
| 55 to 59 Years | 0 (0.0%) | 0 (0.0%) |
| 60 to 64 Years | 3 (100.0%) | 0 (0.0%) |
| 65 to 74 Years | 2 (18.2%) | 0 (0.0%) |
| 75 Years and over | 1 (33.3%) | 1 (100.0%) |
| Total | 63 (77.8%) | 7 (11.1%) |
Employment Status by Educational Attainment in Harper
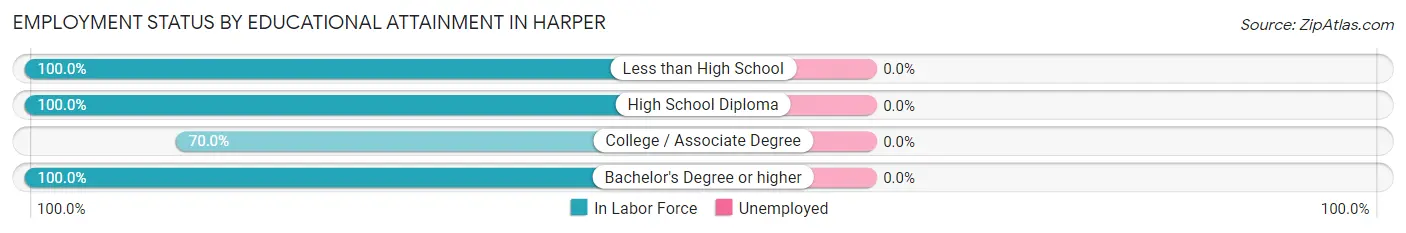
| Educational Attainment | In Labor Force | Unemployed |
| Less than High School | 6 (100.0%) | 0 (0.0%) |
| High School Diploma | 19 (100.0%) | 0 (0.0%) |
| College / Associate Degree | 7 (70.0%) | 0 (0.0%) |
| Bachelor's Degree or higher | 8 (100.0%) | 0 (0.0%) |
| Total | 40 (93.0%) | 0 (0.0%) |
Employment Occupations by Sex in Harper
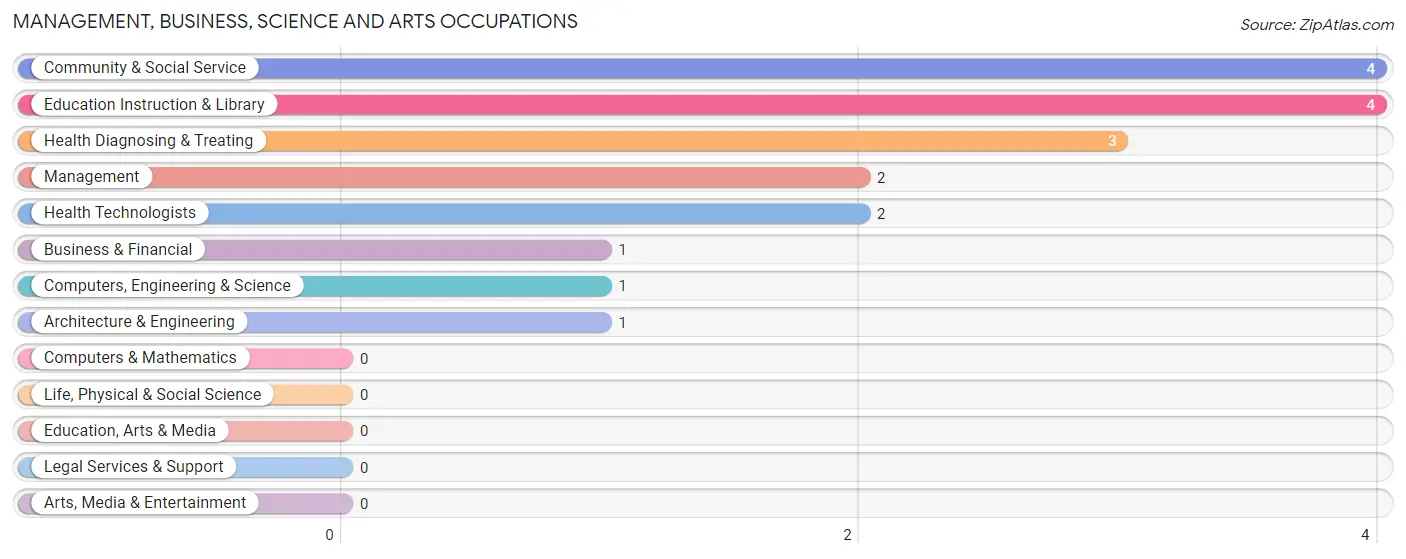
Management, Business, Science and Arts Occupations
The most common Management, Business, Science and Arts occupations in Harper are Community & Social Service (4 | 7.1%), Education Instruction & Library (4 | 7.1%), Health Diagnosing & Treating (3 | 5.4%), Management (2 | 3.6%), and Health Technologists (2 | 3.6%).
Management, Business, Science and Arts Occupations by Sex
Within the Management, Business, Science and Arts occupations in Harper, the most male-oriented occupations are Computers, Engineering & Science (100.0%), Architecture & Engineering (100.0%), and Health Technologists (50.0%), while the most female-oriented occupations are Management (100.0%), Business & Financial (100.0%), and Community & Social Service (100.0%).
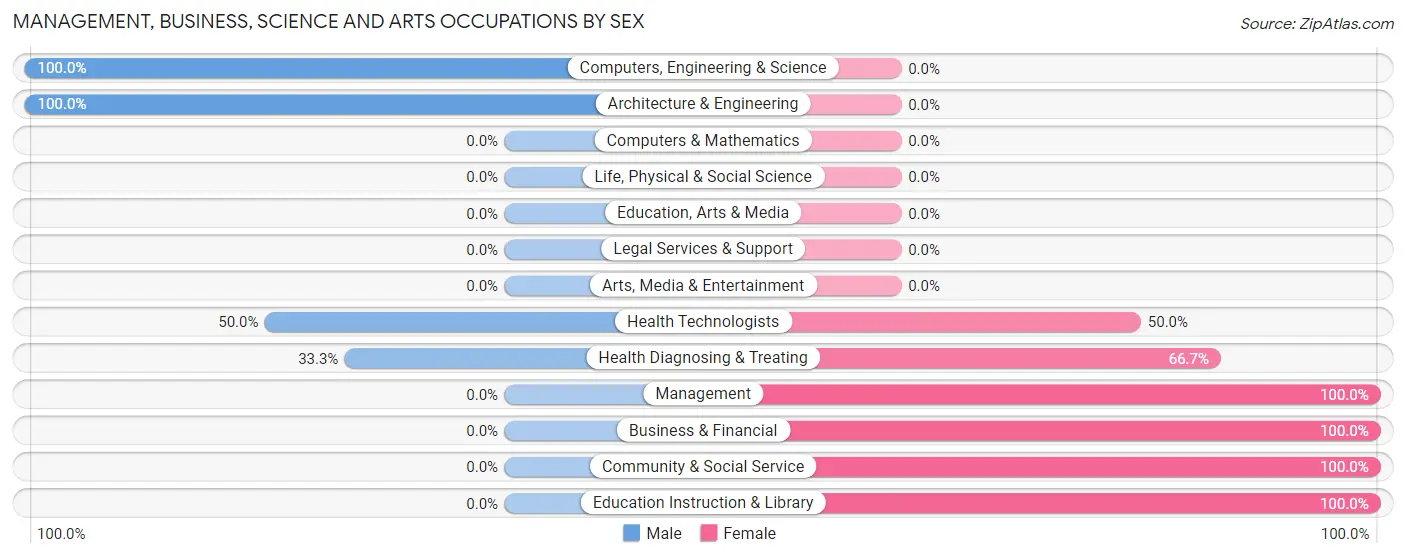
| Occupation | Male | Female |
| Management | 0 (0.0%) | 2 (100.0%) |
| Business & Financial | 0 (0.0%) | 1 (100.0%) |
| Computers, Engineering & Science | 1 (100.0%) | 0 (0.0%) |
| Computers & Mathematics | 0 (0.0%) | 0 (0.0%) |
| Architecture & Engineering | 1 (100.0%) | 0 (0.0%) |
| Life, Physical & Social Science | 0 (0.0%) | 0 (0.0%) |
| Community & Social Service | 0 (0.0%) | 4 (100.0%) |
| Education, Arts & Media | 0 (0.0%) | 0 (0.0%) |
| Legal Services & Support | 0 (0.0%) | 0 (0.0%) |
| Education Instruction & Library | 0 (0.0%) | 4 (100.0%) |
| Arts, Media & Entertainment | 0 (0.0%) | 0 (0.0%) |
| Health Diagnosing & Treating | 1 (33.3%) | 2 (66.7%) |
| Health Technologists | 1 (50.0%) | 1 (50.0%) |
| Total (Category) | 2 (18.2%) | 9 (81.8%) |
| Total (Overall) | 25 (44.6%) | 31 (55.4%) |
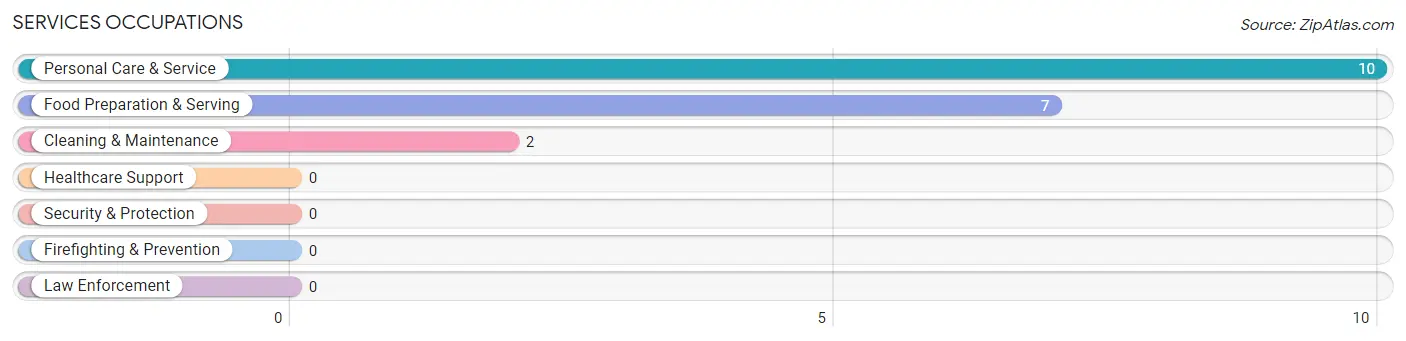
Services Occupations
The most common Services occupations in Harper are Personal Care & Service (10 | 17.9%), Food Preparation & Serving (7 | 12.5%), and Cleaning & Maintenance (2 | 3.6%).
Services Occupations by Sex
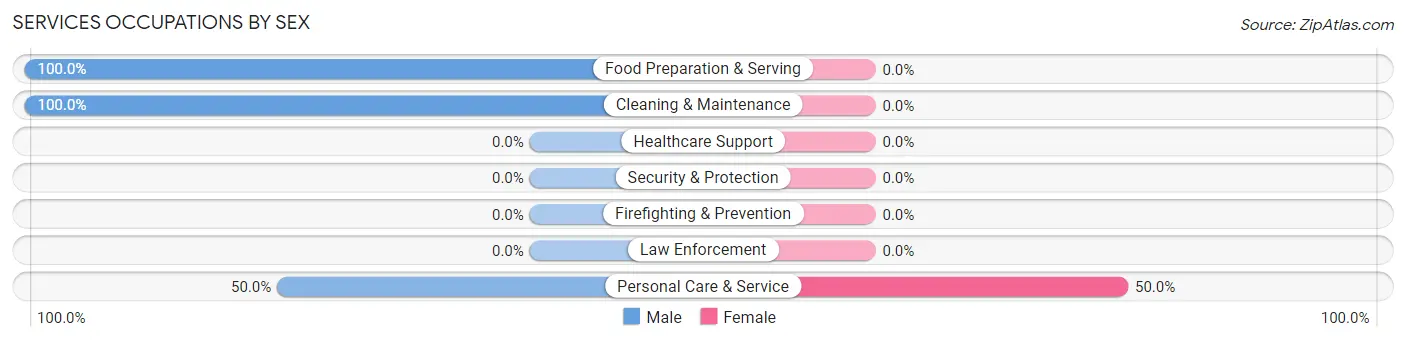
| Occupation | Male | Female |
| Healthcare Support | 0 (0.0%) | 0 (0.0%) |
| Security & Protection | 0 (0.0%) | 0 (0.0%) |
| Firefighting & Prevention | 0 (0.0%) | 0 (0.0%) |
| Law Enforcement | 0 (0.0%) | 0 (0.0%) |
| Food Preparation & Serving | 7 (100.0%) | 0 (0.0%) |
| Cleaning & Maintenance | 2 (100.0%) | 0 (0.0%) |
| Personal Care & Service | 5 (50.0%) | 5 (50.0%) |
| Total (Category) | 14 (73.7%) | 5 (26.3%) |
| Total (Overall) | 25 (44.6%) | 31 (55.4%) |
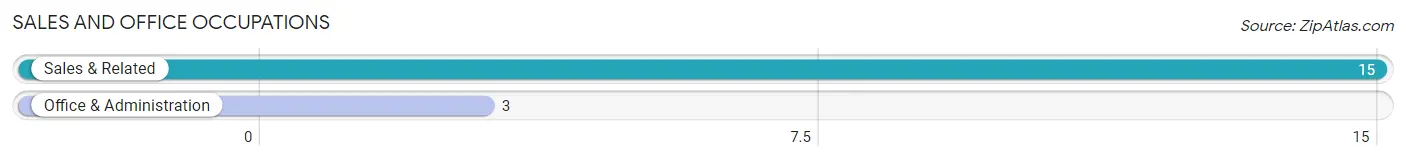
Sales and Office Occupations
The most common Sales and Office occupations in Harper are Sales & Related (15 | 26.8%), and Office & Administration (3 | 5.4%).
Sales and Office Occupations by Sex
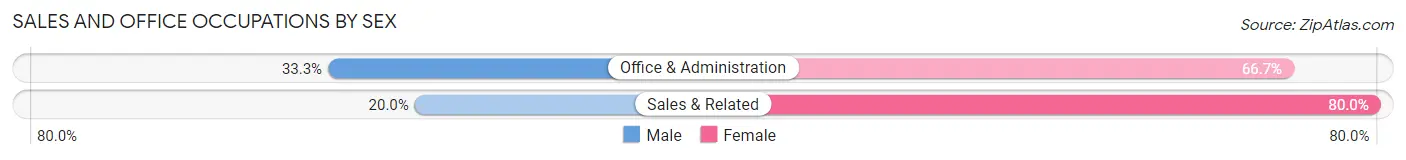
| Occupation | Male | Female |
| Sales & Related | 3 (20.0%) | 12 (80.0%) |
| Office & Administration | 1 (33.3%) | 2 (66.7%) |
| Total (Category) | 4 (22.2%) | 14 (77.8%) |
| Total (Overall) | 25 (44.6%) | 31 (55.4%) |
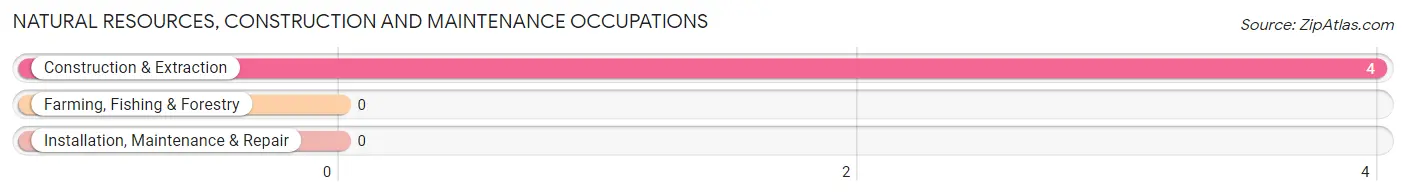
Natural Resources, Construction and Maintenance Occupations
The most common Natural Resources, Construction and Maintenance occupations in Harper are , and Construction & Extraction (4 | 7.1%).
Natural Resources, Construction and Maintenance Occupations by Sex
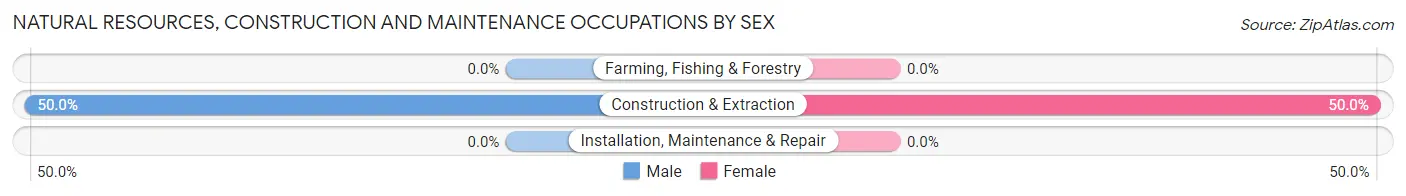
| Occupation | Male | Female |
| Farming, Fishing & Forestry | 0 (0.0%) | 0 (0.0%) |
| Construction & Extraction | 2 (50.0%) | 2 (50.0%) |
| Installation, Maintenance & Repair | 0 (0.0%) | 0 (0.0%) |
| Total (Category) | 2 (50.0%) | 2 (50.0%) |
| Total (Overall) | 25 (44.6%) | 31 (55.4%) |
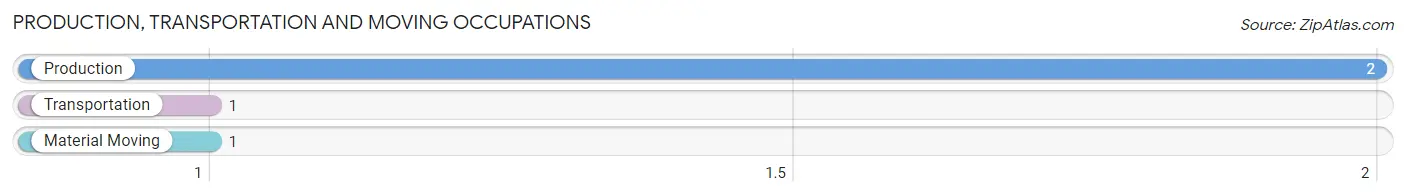
Production, Transportation and Moving Occupations
The most common Production, Transportation and Moving occupations in Harper are Production (2 | 3.6%), Transportation (1 | 1.8%), and Material Moving (1 | 1.8%).
Production, Transportation and Moving Occupations by Sex
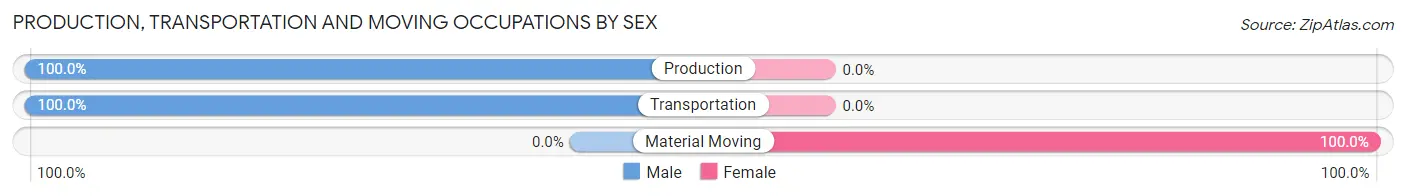
| Occupation | Male | Female |
| Production | 2 (100.0%) | 0 (0.0%) |
| Transportation | 1 (100.0%) | 0 (0.0%) |
| Material Moving | 0 (0.0%) | 1 (100.0%) |
| Total (Category) | 3 (75.0%) | 1 (25.0%) |
| Total (Overall) | 25 (44.6%) | 31 (55.4%) |
Employment Industries by Sex in Harper
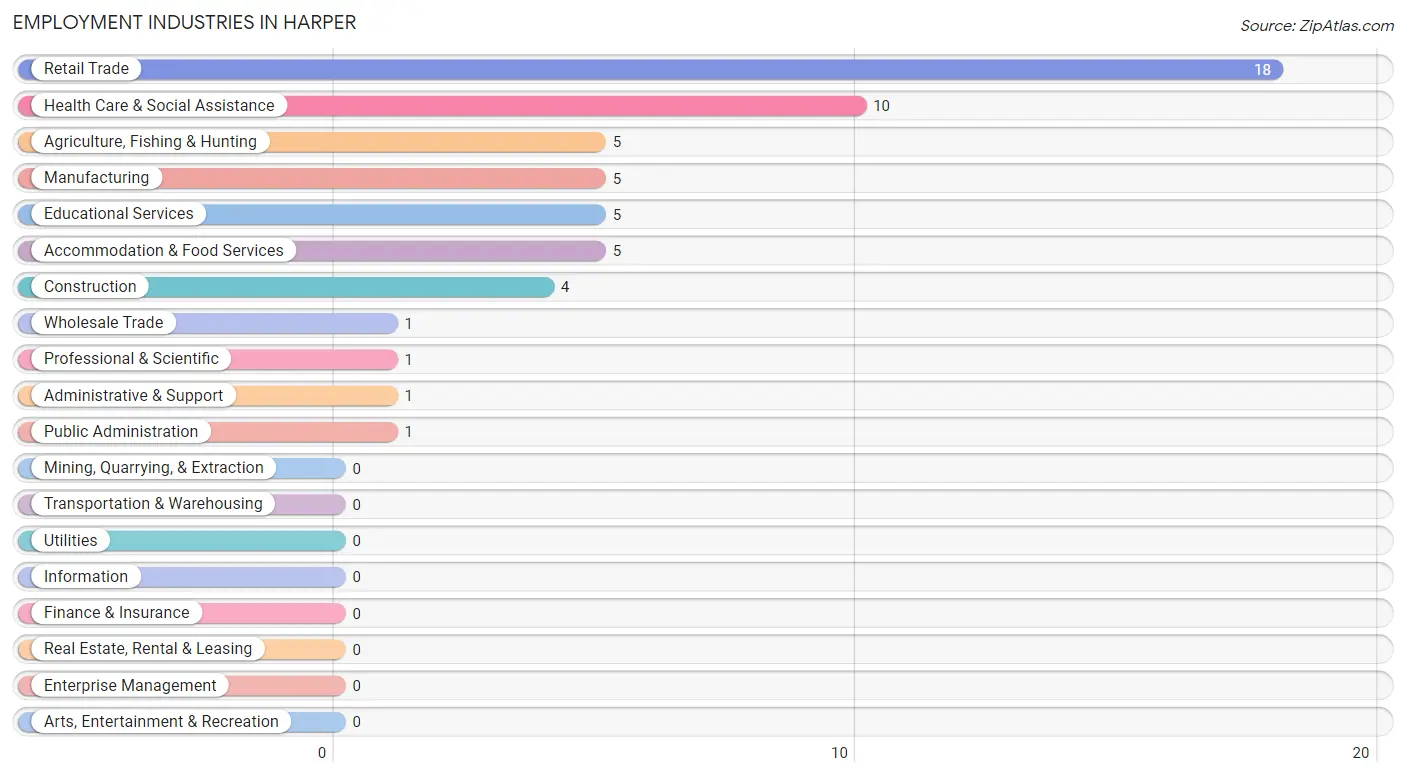
Employment Industries in Harper
The major employment industries in Harper include Retail Trade (18 | 32.1%), Health Care & Social Assistance (10 | 17.9%), Agriculture, Fishing & Hunting (5 | 8.9%), Manufacturing (5 | 8.9%), and Educational Services (5 | 8.9%).
Employment Industries by Sex in Harper
The Harper industries that see more men than women are Agriculture, Fishing & Hunting (100.0%), Wholesale Trade (100.0%), and Professional & Scientific (100.0%), whereas the industries that tend to have a higher number of women are Administrative & Support (100.0%), Educational Services (100.0%), and Health Care & Social Assistance (90.0%).
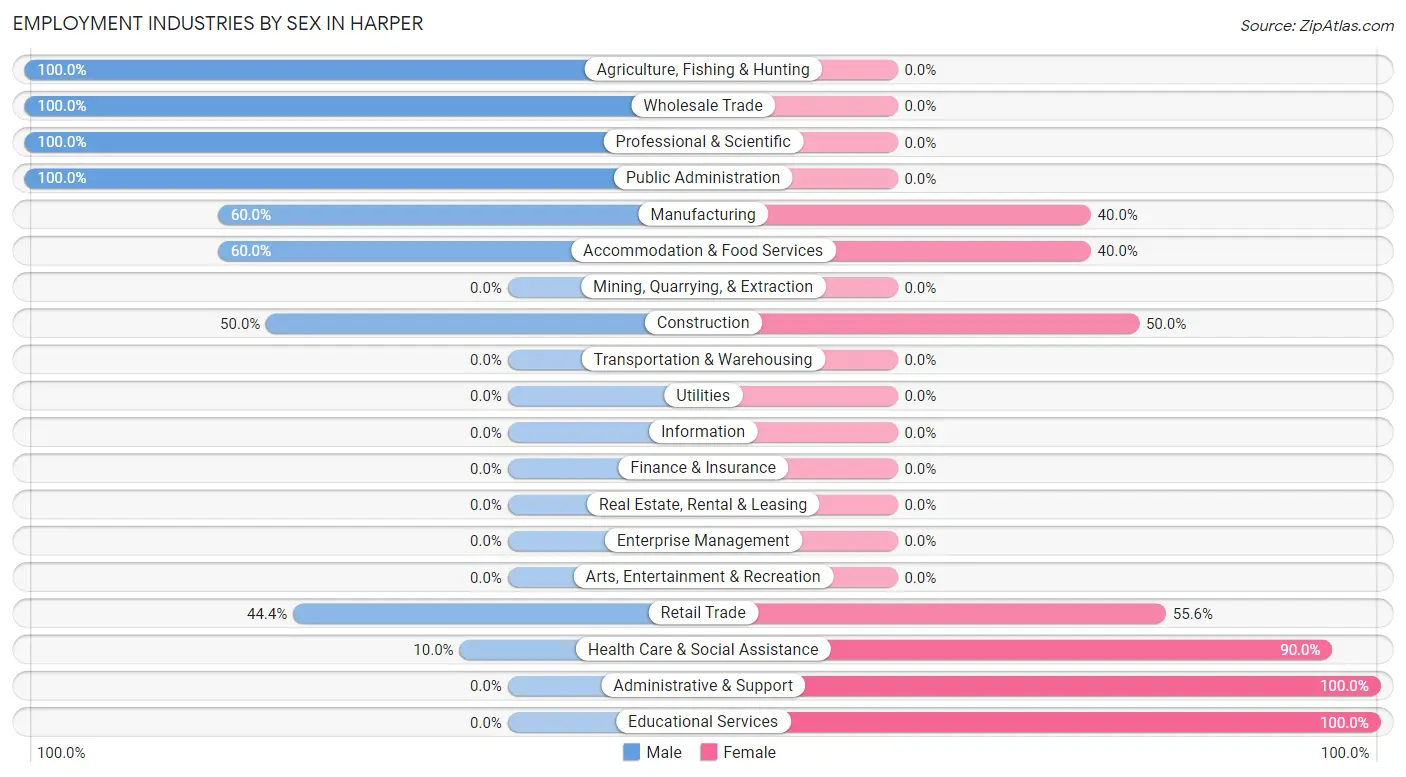
| Industry | Male | Female |
| Agriculture, Fishing & Hunting | 5 (100.0%) | 0 (0.0%) |
| Mining, Quarrying, & Extraction | 0 (0.0%) | 0 (0.0%) |
| Construction | 2 (50.0%) | 2 (50.0%) |
| Manufacturing | 3 (60.0%) | 2 (40.0%) |
| Wholesale Trade | 1 (100.0%) | 0 (0.0%) |
| Retail Trade | 8 (44.4%) | 10 (55.6%) |
| Transportation & Warehousing | 0 (0.0%) | 0 (0.0%) |
| Utilities | 0 (0.0%) | 0 (0.0%) |
| Information | 0 (0.0%) | 0 (0.0%) |
| Finance & Insurance | 0 (0.0%) | 0 (0.0%) |
| Real Estate, Rental & Leasing | 0 (0.0%) | 0 (0.0%) |
| Professional & Scientific | 1 (100.0%) | 0 (0.0%) |
| Enterprise Management | 0 (0.0%) | 0 (0.0%) |
| Administrative & Support | 0 (0.0%) | 1 (100.0%) |
| Educational Services | 0 (0.0%) | 5 (100.0%) |
| Health Care & Social Assistance | 1 (10.0%) | 9 (90.0%) |
| Arts, Entertainment & Recreation | 0 (0.0%) | 0 (0.0%) |
| Accommodation & Food Services | 3 (60.0%) | 2 (40.0%) |
| Public Administration | 1 (100.0%) | 0 (0.0%) |
| Total | 25 (44.6%) | 31 (55.4%) |
Education in Harper
School Enrollment in Harper
The most common levels of schooling among the 35 students in Harper are middle school (17 | 48.6%), high school (10 | 28.6%), and elementary school (4 | 11.4%).
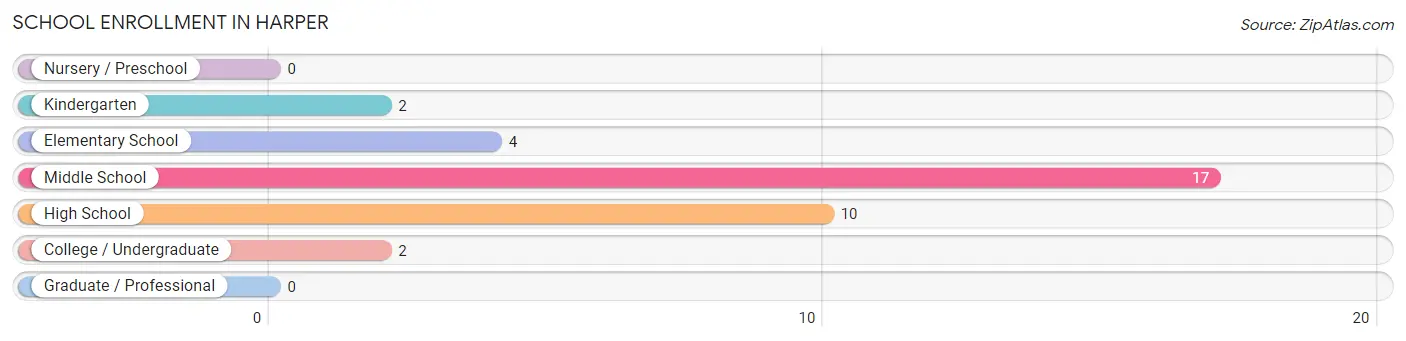
| School Level | # Students | % Students |
| Nursery / Preschool | 0 | 0.0% |
| Kindergarten | 2 | 5.7% |
| Elementary School | 4 | 11.4% |
| Middle School | 17 | 48.6% |
| High School | 10 | 28.6% |
| College / Undergraduate | 2 | 5.7% |
| Graduate / Professional | 0 | 0.0% |
| Total | 35 | 100.0% |
School Enrollment by Age by Funding Source in Harper
Out of a total of 35 students who are enrolled in schools in Harper, 2 (5.7%) attend a private institution, while the remaining 33 (94.3%) are enrolled in public schools. The age group of 10 to 14 year olds has the highest likelihood of being enrolled in private schools, with 2 (8.7% in the age bracket) enrolled. Conversely, the age group of 5 to 9 year old has the lowest likelihood of being enrolled in a private school, with 6 (100.0% in the age bracket) attending a public institution.
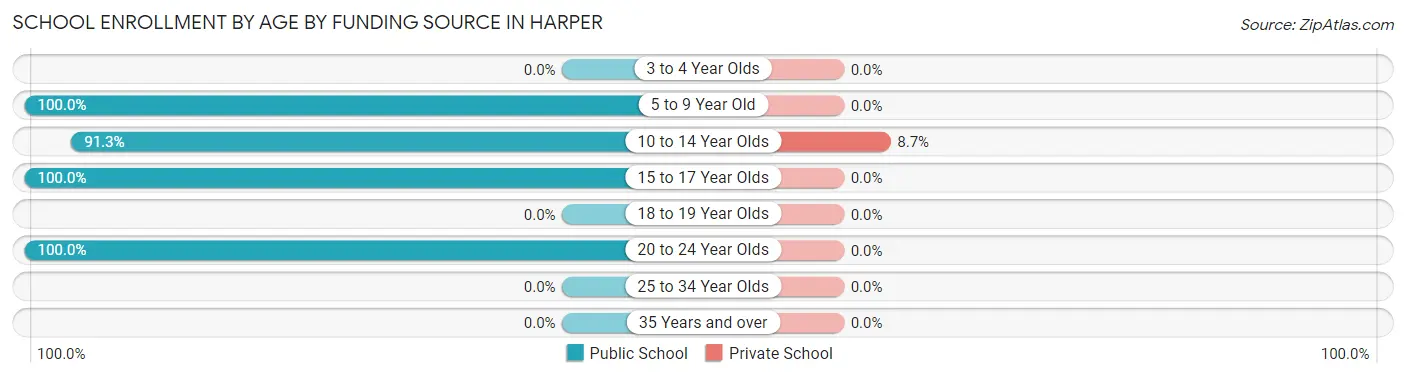
| Age Bracket | Public School | Private School |
| 3 to 4 Year Olds | 0 (0.0%) | 0 (0.0%) |
| 5 to 9 Year Old | 6 (100.0%) | 0 (0.0%) |
| 10 to 14 Year Olds | 21 (91.3%) | 2 (8.7%) |
| 15 to 17 Year Olds | 4 (100.0%) | 0 (0.0%) |
| 18 to 19 Year Olds | 0 (0.0%) | 0 (0.0%) |
| 20 to 24 Year Olds | 2 (100.0%) | 0 (0.0%) |
| 25 to 34 Year Olds | 0 (0.0%) | 0 (0.0%) |
| 35 Years and over | 0 (0.0%) | 0 (0.0%) |
| Total | 33 (94.3%) | 2 (5.7%) |
Educational Attainment by Field of Study in Harper
Science & technology (4 | 33.3%), education (3 | 25.0%), liberal arts & history (2 | 16.7%), arts & humanities (2 | 16.7%), and bio, nature & agricultural (1 | 8.3%) are the most common fields of study among 12 individuals in Harper who have obtained a bachelor's degree or higher.
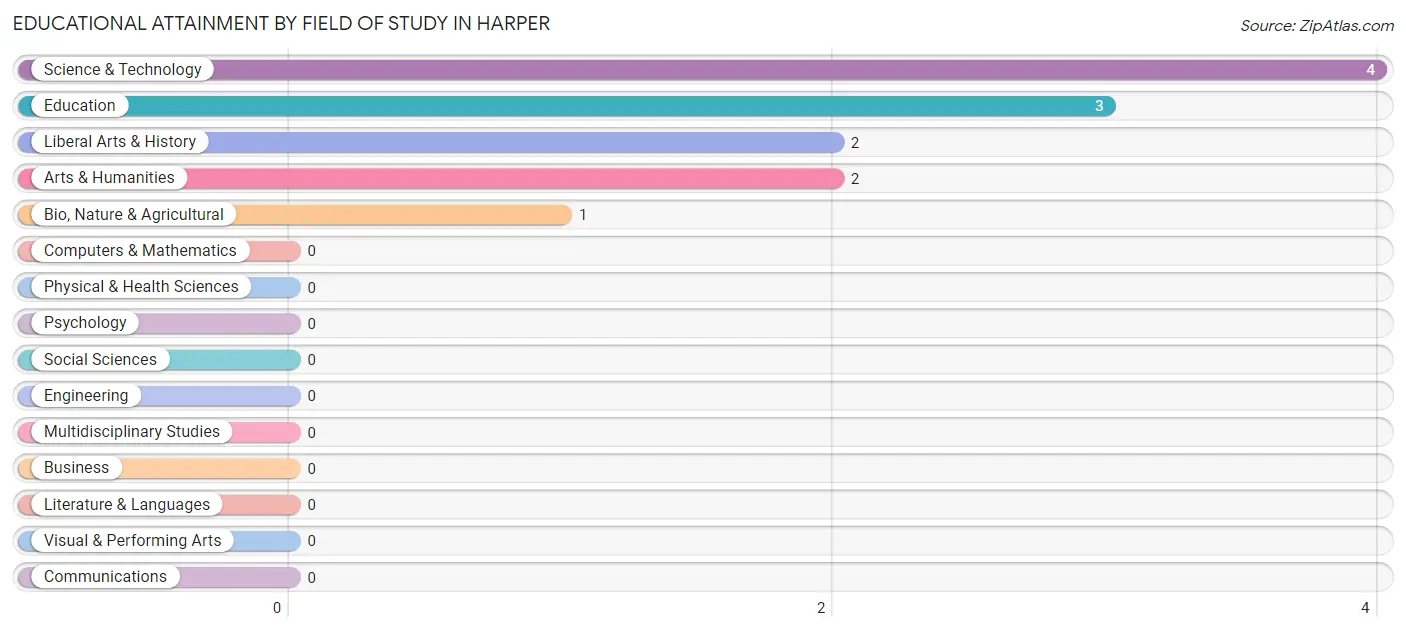
| Field of Study | # Graduates | % Graduates |
| Computers & Mathematics | 0 | 0.0% |
| Bio, Nature & Agricultural | 1 | 8.3% |
| Physical & Health Sciences | 0 | 0.0% |
| Psychology | 0 | 0.0% |
| Social Sciences | 0 | 0.0% |
| Engineering | 0 | 0.0% |
| Multidisciplinary Studies | 0 | 0.0% |
| Science & Technology | 4 | 33.3% |
| Business | 0 | 0.0% |
| Education | 3 | 25.0% |
| Literature & Languages | 0 | 0.0% |
| Liberal Arts & History | 2 | 16.7% |
| Visual & Performing Arts | 0 | 0.0% |
| Communications | 0 | 0.0% |
| Arts & Humanities | 2 | 16.7% |
| Total | 12 | 100.0% |
Transportation & Commute in Harper
Vehicle Availability by Sex in Harper
The most prevalent vehicle ownership categories in Harper are males with 5 or more vehicles (11, accounting for 44.0%) and females with 5 or more vehicles (4, making up 40.7%).
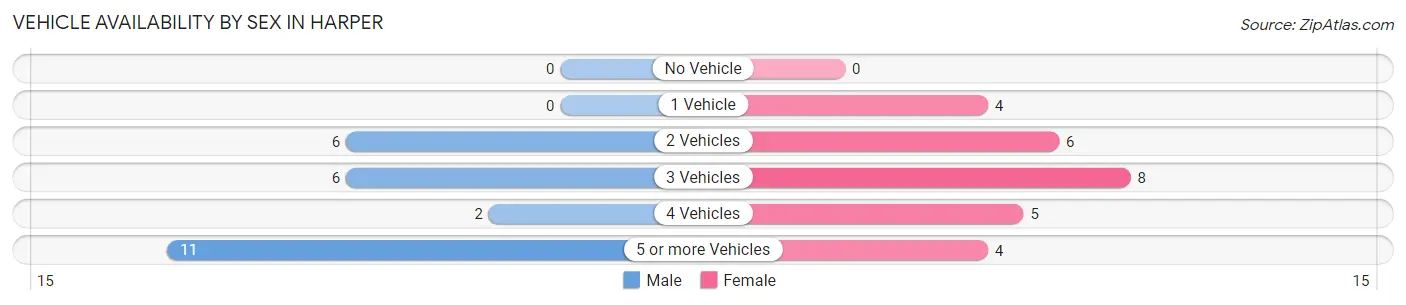
| Vehicles Available | Male | Female |
| No Vehicle | 0 (0.0%) | 0 (0.0%) |
| 1 Vehicle | 0 (0.0%) | 4 (14.8%) |
| 2 Vehicles | 6 (24.0%) | 6 (22.2%) |
| 3 Vehicles | 6 (24.0%) | 8 (29.6%) |
| 4 Vehicles | 2 (8.0%) | 5 (18.5%) |
| 5 or more Vehicles | 11 (44.0%) | 4 (14.8%) |
| Total | 25 (100.0%) | 27 (100.0%) |
Commute Time in Harper
The most frequently occuring commute durations in Harper are 15 to 19 minutes (18 commuters, 34.6%), 45 to 59 minutes (12 commuters, 23.1%), and 5 to 9 minutes (6 commuters, 11.5%).
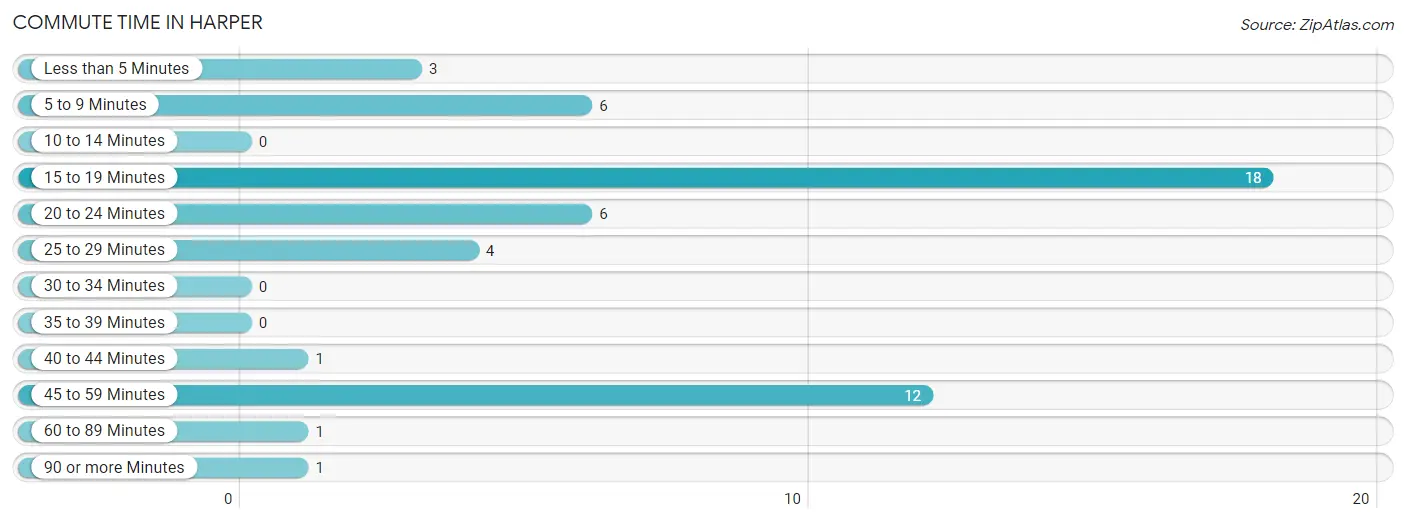
| Commute Time | # Commuters | % Commuters |
| Less than 5 Minutes | 3 | 5.8% |
| 5 to 9 Minutes | 6 | 11.5% |
| 10 to 14 Minutes | 0 | 0.0% |
| 15 to 19 Minutes | 18 | 34.6% |
| 20 to 24 Minutes | 6 | 11.5% |
| 25 to 29 Minutes | 4 | 7.7% |
| 30 to 34 Minutes | 0 | 0.0% |
| 35 to 39 Minutes | 0 | 0.0% |
| 40 to 44 Minutes | 1 | 1.9% |
| 45 to 59 Minutes | 12 | 23.1% |
| 60 to 89 Minutes | 1 | 1.9% |
| 90 or more Minutes | 1 | 1.9% |
Commute Time by Sex in Harper
The most common commute times in Harper are 15 to 19 minutes (13 commuters, 52.0%) for males and 45 to 59 minutes (7 commuters, 25.9%) for females.
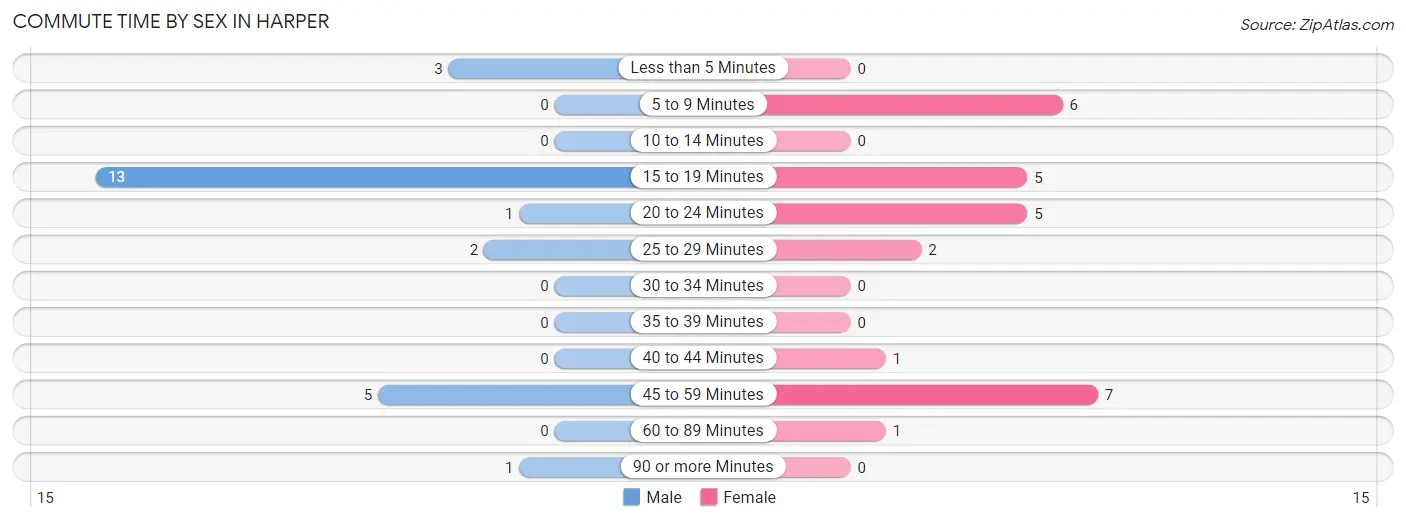
| Commute Time | Male | Female |
| Less than 5 Minutes | 3 (12.0%) | 0 (0.0%) |
| 5 to 9 Minutes | 0 (0.0%) | 6 (22.2%) |
| 10 to 14 Minutes | 0 (0.0%) | 0 (0.0%) |
| 15 to 19 Minutes | 13 (52.0%) | 5 (18.5%) |
| 20 to 24 Minutes | 1 (4.0%) | 5 (18.5%) |
| 25 to 29 Minutes | 2 (8.0%) | 2 (7.4%) |
| 30 to 34 Minutes | 0 (0.0%) | 0 (0.0%) |
| 35 to 39 Minutes | 0 (0.0%) | 0 (0.0%) |
| 40 to 44 Minutes | 0 (0.0%) | 1 (3.7%) |
| 45 to 59 Minutes | 5 (20.0%) | 7 (25.9%) |
| 60 to 89 Minutes | 0 (0.0%) | 1 (3.7%) |
| 90 or more Minutes | 1 (4.0%) | 0 (0.0%) |
Time of Departure to Work by Sex in Harper
The most frequent times of departure to work in Harper are 6:00 AM to 6:29 AM (7, 28.0%) for males and 7:30 AM to 7:59 AM (6, 22.2%) for females.
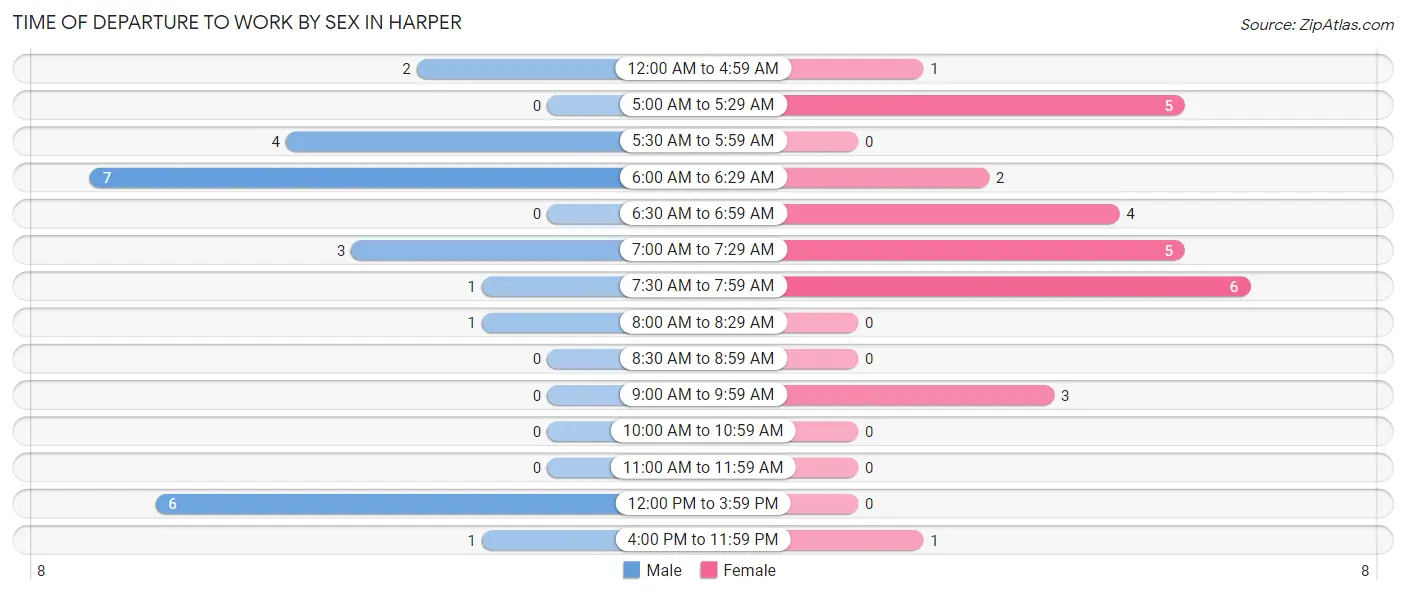
| Time of Departure | Male | Female |
| 12:00 AM to 4:59 AM | 2 (8.0%) | 1 (3.7%) |
| 5:00 AM to 5:29 AM | 0 (0.0%) | 5 (18.5%) |
| 5:30 AM to 5:59 AM | 4 (16.0%) | 0 (0.0%) |
| 6:00 AM to 6:29 AM | 7 (28.0%) | 2 (7.4%) |
| 6:30 AM to 6:59 AM | 0 (0.0%) | 4 (14.8%) |
| 7:00 AM to 7:29 AM | 3 (12.0%) | 5 (18.5%) |
| 7:30 AM to 7:59 AM | 1 (4.0%) | 6 (22.2%) |
| 8:00 AM to 8:29 AM | 1 (4.0%) | 0 (0.0%) |
| 8:30 AM to 8:59 AM | 0 (0.0%) | 0 (0.0%) |
| 9:00 AM to 9:59 AM | 0 (0.0%) | 3 (11.1%) |
| 10:00 AM to 10:59 AM | 0 (0.0%) | 0 (0.0%) |
| 11:00 AM to 11:59 AM | 0 (0.0%) | 0 (0.0%) |
| 12:00 PM to 3:59 PM | 6 (24.0%) | 0 (0.0%) |
| 4:00 PM to 11:59 PM | 1 (4.0%) | 1 (3.7%) |
| Total | 25 (100.0%) | 27 (100.0%) |
Housing Occupancy in Harper
Occupancy by Ownership in Harper
Of the total 32 dwellings in Harper, owner-occupied units account for 29 (90.6%), while renter-occupied units make up 3 (9.4%).
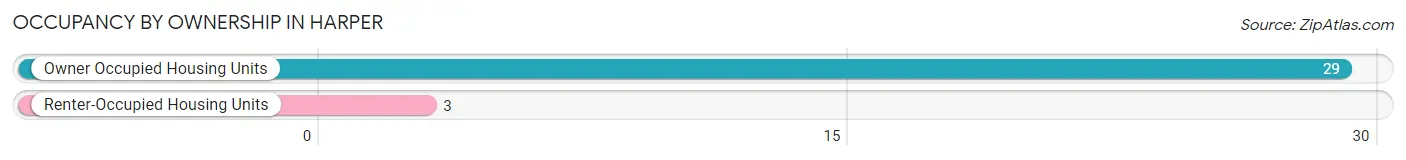
| Occupancy | # Housing Units | % Housing Units |
| Owner Occupied Housing Units | 29 | 90.6% |
| Renter-Occupied Housing Units | 3 | 9.4% |
| Total Occupied Housing Units | 32 | 100.0% |
Occupancy by Household Size in Harper
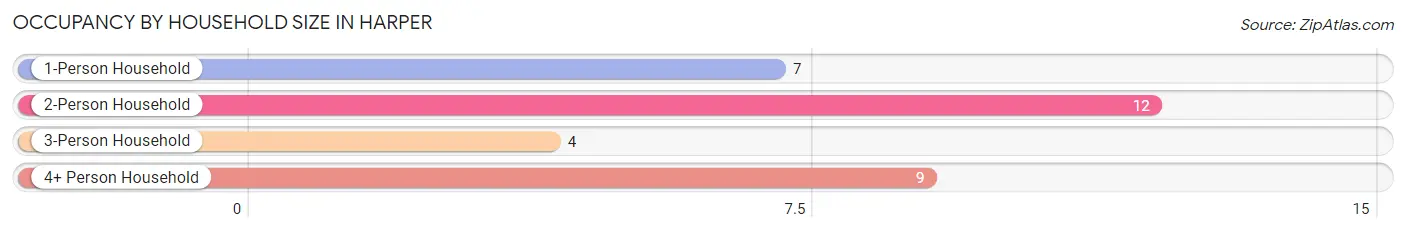
| Household Size | # Housing Units | % Housing Units |
| 1-Person Household | 7 | 21.9% |
| 2-Person Household | 12 | 37.5% |
| 3-Person Household | 4 | 12.5% |
| 4+ Person Household | 9 | 28.1% |
| Total Housing Units | 32 | 100.0% |
Occupancy by Ownership by Household Size in Harper
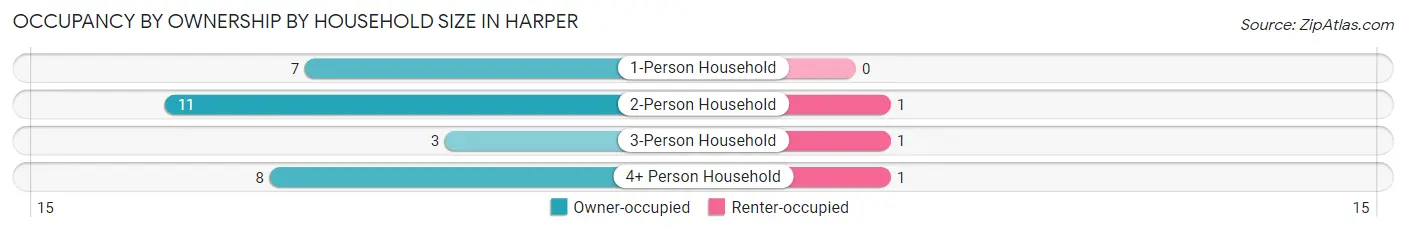
| Household Size | Owner-occupied | Renter-occupied |
| 1-Person Household | 7 (100.0%) | 0 (0.0%) |
| 2-Person Household | 11 (91.7%) | 1 (8.3%) |
| 3-Person Household | 3 (75.0%) | 1 (25.0%) |
| 4+ Person Household | 8 (88.9%) | 1 (11.1%) |
| Total Housing Units | 29 (90.6%) | 3 (9.4%) |
Occupancy by Educational Attainment in Harper
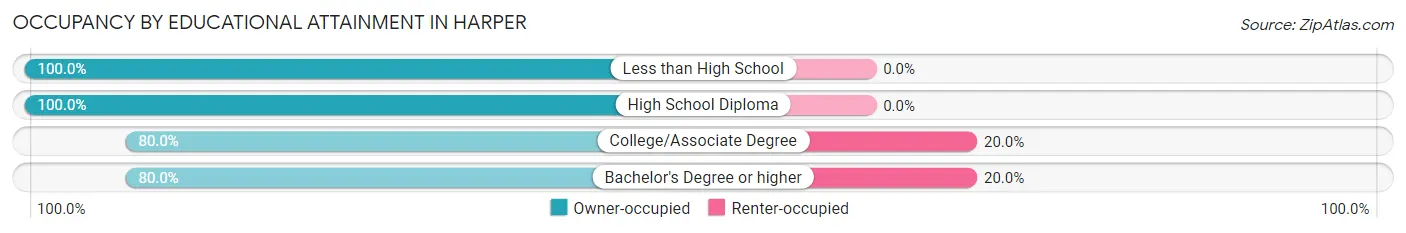
| Household Size | Owner-occupied | Renter-occupied |
| Less than High School | 3 (100.0%) | 0 (0.0%) |
| High School Diploma | 14 (100.0%) | 0 (0.0%) |
| College/Associate Degree | 8 (80.0%) | 2 (20.0%) |
| Bachelor's Degree or higher | 4 (80.0%) | 1 (20.0%) |
Occupancy by Age of Householder in Harper
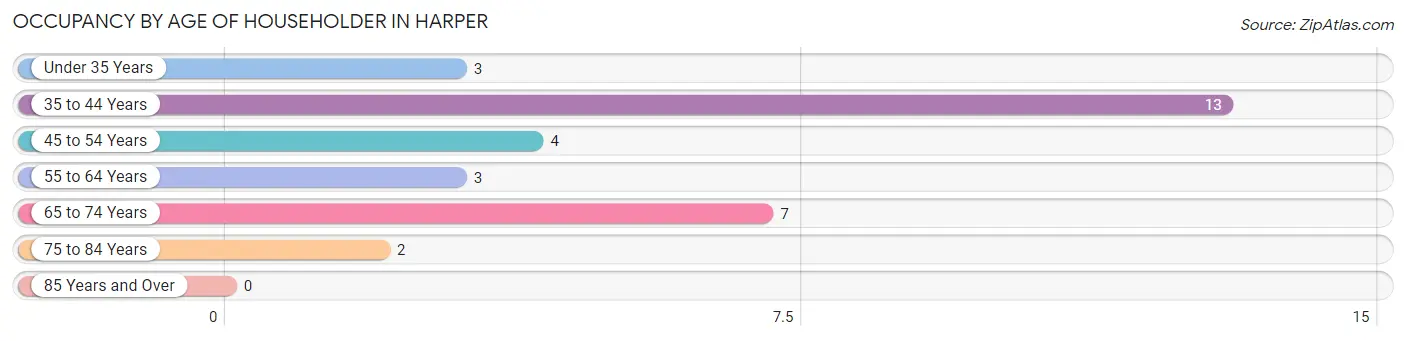
| Age Bracket | # Households | % Households |
| Under 35 Years | 3 | 9.4% |
| 35 to 44 Years | 13 | 40.6% |
| 45 to 54 Years | 4 | 12.5% |
| 55 to 64 Years | 3 | 9.4% |
| 65 to 74 Years | 7 | 21.9% |
| 75 to 84 Years | 2 | 6.2% |
| 85 Years and Over | 0 | 0.0% |
| Total | 32 | 100.0% |
Housing Finances in Harper
Median Income by Occupancy in Harper
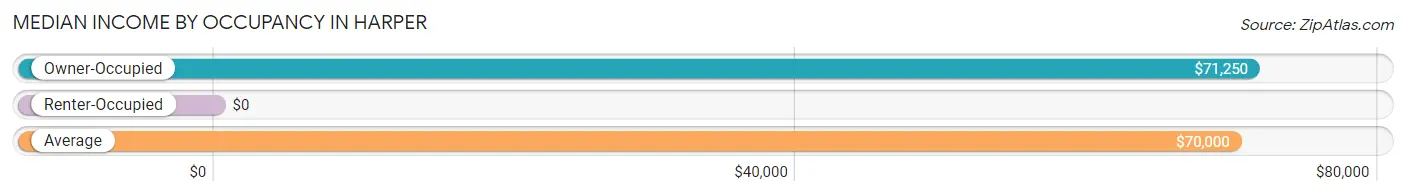
| Occupancy Type | # Households | Median Income |
| Owner-Occupied | 29 (90.6%) | $71,250 |
| Renter-Occupied | 3 (9.4%) | $0 |
| Average | 32 (100.0%) | $70,000 |
Occupancy by Householder Income Bracket in Harper
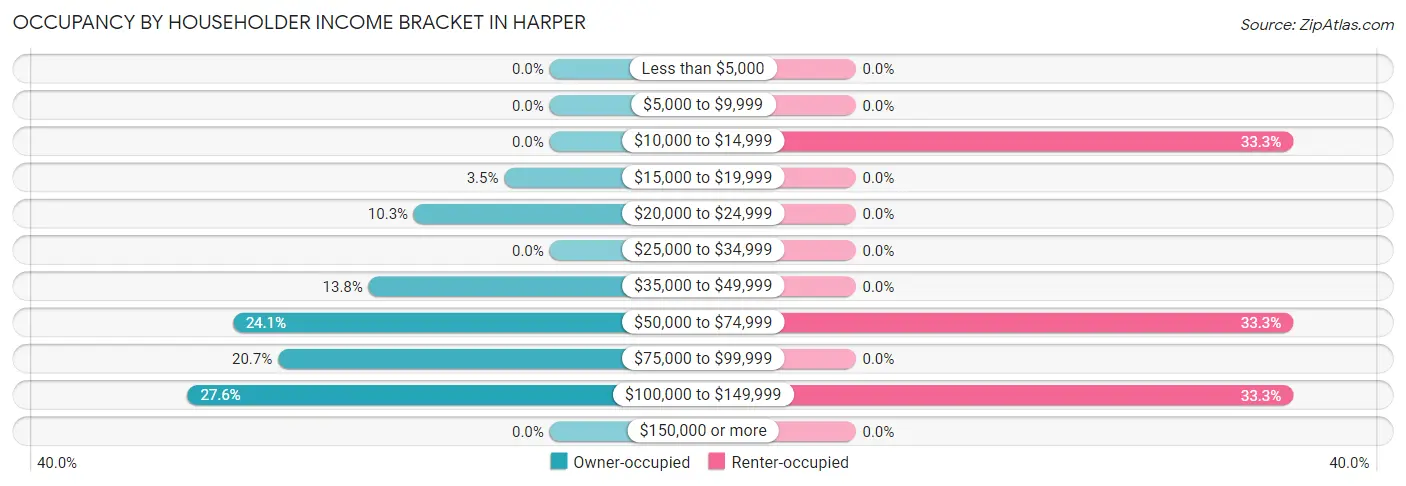
| Income Bracket | Owner-occupied | Renter-occupied |
| Less than $5,000 | 0 (0.0%) | 0 (0.0%) |
| $5,000 to $9,999 | 0 (0.0%) | 0 (0.0%) |
| $10,000 to $14,999 | 0 (0.0%) | 1 (33.3%) |
| $15,000 to $19,999 | 1 (3.5%) | 0 (0.0%) |
| $20,000 to $24,999 | 3 (10.3%) | 0 (0.0%) |
| $25,000 to $34,999 | 0 (0.0%) | 0 (0.0%) |
| $35,000 to $49,999 | 4 (13.8%) | 0 (0.0%) |
| $50,000 to $74,999 | 7 (24.1%) | 1 (33.3%) |
| $75,000 to $99,999 | 6 (20.7%) | 0 (0.0%) |
| $100,000 to $149,999 | 8 (27.6%) | 1 (33.3%) |
| $150,000 or more | 0 (0.0%) | 0 (0.0%) |
| Total | 29 (100.0%) | 3 (100.0%) |
Monthly Housing Cost Tiers in Harper
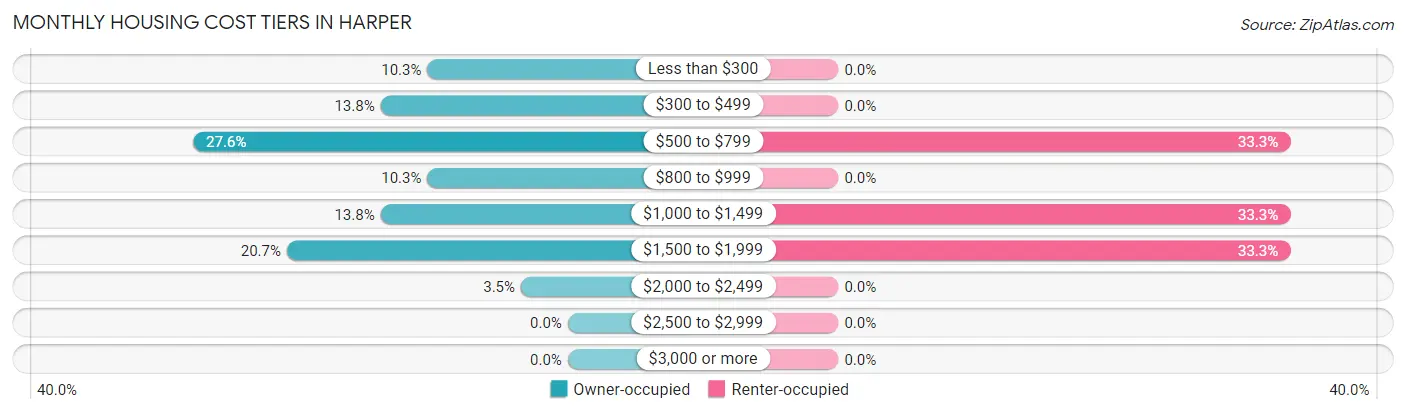
| Monthly Cost | Owner-occupied | Renter-occupied |
| Less than $300 | 3 (10.3%) | 0 (0.0%) |
| $300 to $499 | 4 (13.8%) | 0 (0.0%) |
| $500 to $799 | 8 (27.6%) | 1 (33.3%) |
| $800 to $999 | 3 (10.3%) | 0 (0.0%) |
| $1,000 to $1,499 | 4 (13.8%) | 1 (33.3%) |
| $1,500 to $1,999 | 6 (20.7%) | 1 (33.3%) |
| $2,000 to $2,499 | 1 (3.5%) | 0 (0.0%) |
| $2,500 to $2,999 | 0 (0.0%) | 0 (0.0%) |
| $3,000 or more | 0 (0.0%) | 0 (0.0%) |
| Total | 29 (100.0%) | 3 (100.0%) |
Physical Housing Characteristics in Harper
Housing Structures in Harper
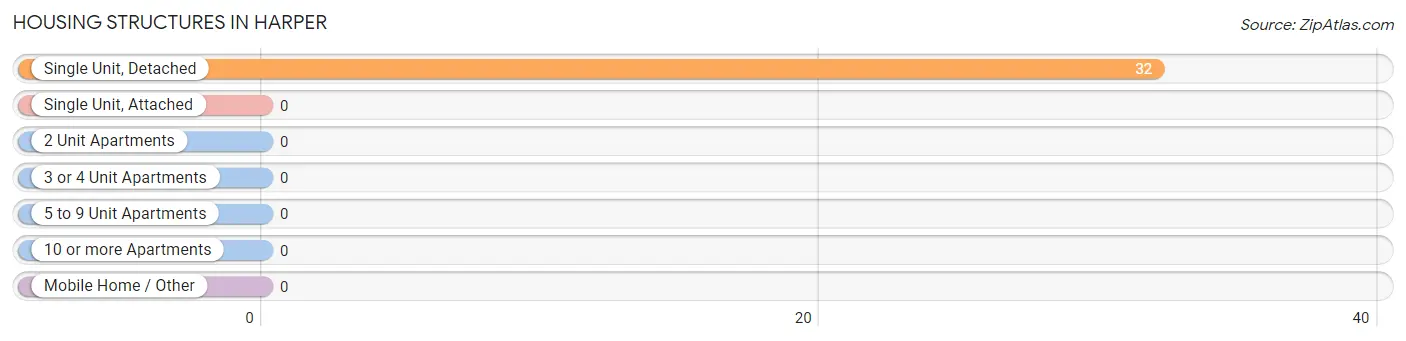
| Structure Type | # Housing Units | % Housing Units |
| Single Unit, Detached | 32 | 100.0% |
| Single Unit, Attached | 0 | 0.0% |
| 2 Unit Apartments | 0 | 0.0% |
| 3 or 4 Unit Apartments | 0 | 0.0% |
| 5 to 9 Unit Apartments | 0 | 0.0% |
| 10 or more Apartments | 0 | 0.0% |
| Mobile Home / Other | 0 | 0.0% |
| Total | 32 | 100.0% |
Housing Structures by Occupancy in Harper
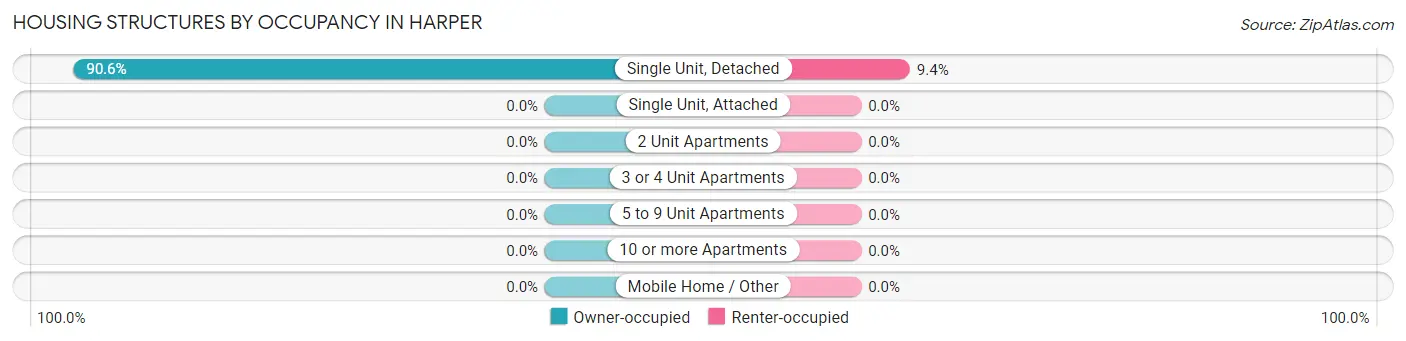
| Structure Type | Owner-occupied | Renter-occupied |
| Single Unit, Detached | 29 (90.6%) | 3 (9.4%) |
| Single Unit, Attached | 0 (0.0%) | 0 (0.0%) |
| 2 Unit Apartments | 0 (0.0%) | 0 (0.0%) |
| 3 or 4 Unit Apartments | 0 (0.0%) | 0 (0.0%) |
| 5 to 9 Unit Apartments | 0 (0.0%) | 0 (0.0%) |
| 10 or more Apartments | 0 (0.0%) | 0 (0.0%) |
| Mobile Home / Other | 0 (0.0%) | 0 (0.0%) |
| Total | 29 (90.6%) | 3 (9.4%) |
Housing Structures by Number of Rooms in Harper
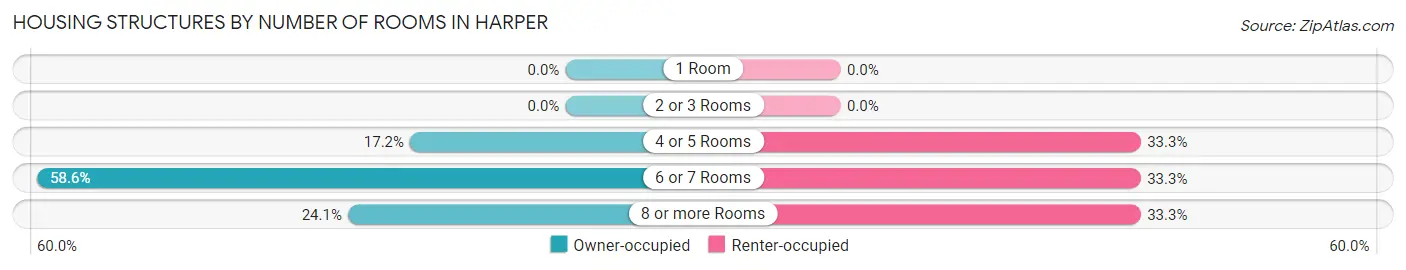
| Number of Rooms | Owner-occupied | Renter-occupied |
| 1 Room | 0 (0.0%) | 0 (0.0%) |
| 2 or 3 Rooms | 0 (0.0%) | 0 (0.0%) |
| 4 or 5 Rooms | 5 (17.2%) | 1 (33.3%) |
| 6 or 7 Rooms | 17 (58.6%) | 1 (33.3%) |
| 8 or more Rooms | 7 (24.1%) | 1 (33.3%) |
| Total | 29 (100.0%) | 3 (100.0%) |
Housing Structure by Heating Type in Harper
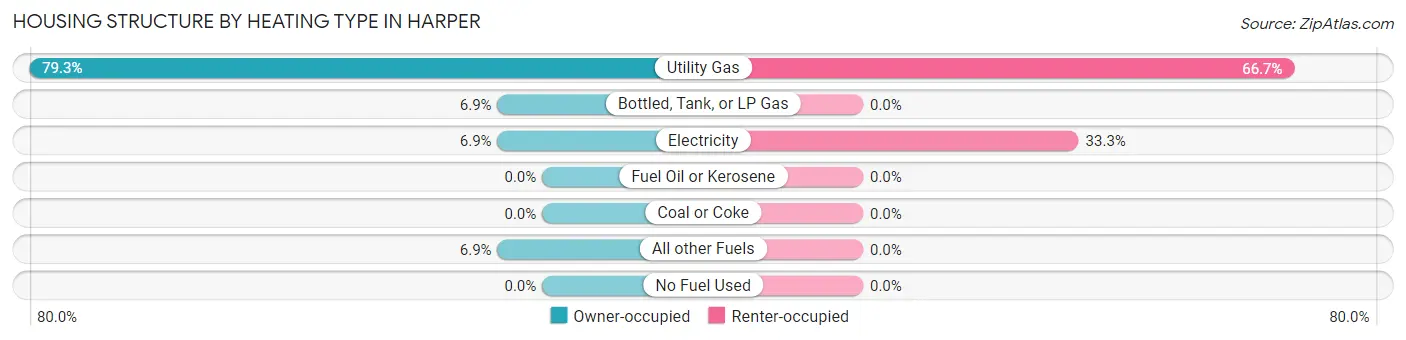
| Heating Type | Owner-occupied | Renter-occupied |
| Utility Gas | 23 (79.3%) | 2 (66.7%) |
| Bottled, Tank, or LP Gas | 2 (6.9%) | 0 (0.0%) |
| Electricity | 2 (6.9%) | 1 (33.3%) |
| Fuel Oil or Kerosene | 0 (0.0%) | 0 (0.0%) |
| Coal or Coke | 0 (0.0%) | 0 (0.0%) |
| All other Fuels | 2 (6.9%) | 0 (0.0%) |
| No Fuel Used | 0 (0.0%) | 0 (0.0%) |
| Total | 29 (100.0%) | 3 (100.0%) |
Household Vehicle Usage in Harper
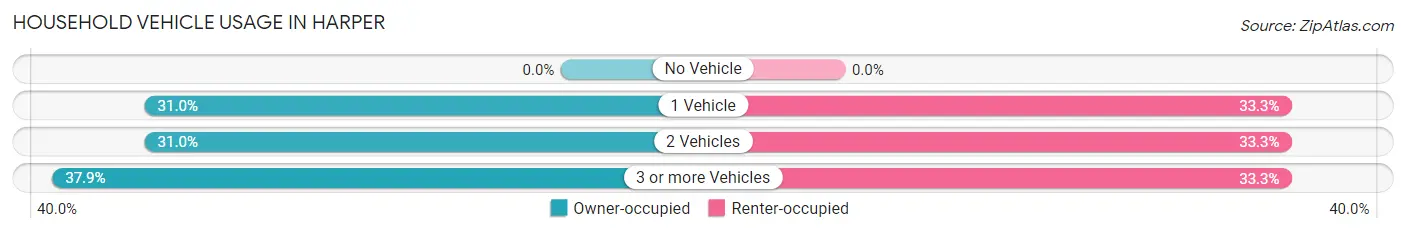
| Vehicles per Household | Owner-occupied | Renter-occupied |
| No Vehicle | 0 (0.0%) | 0 (0.0%) |
| 1 Vehicle | 9 (31.0%) | 1 (33.3%) |
| 2 Vehicles | 9 (31.0%) | 1 (33.3%) |
| 3 or more Vehicles | 11 (37.9%) | 1 (33.3%) |
| Total | 29 (100.0%) | 3 (100.0%) |
Real Estate & Mortgages in Harper
Real Estate and Mortgage Overview in Harper
| Characteristic | Without Mortgage | With Mortgage |
| Housing Units | 11 | 18 |
| Median Property Value | $78,300 | $90,000 |
| Median Household Income | $68,438 | $0 |
| Monthly Housing Costs | $381 | $0 |
| Real Estate Taxes | $1,188 | $0 |
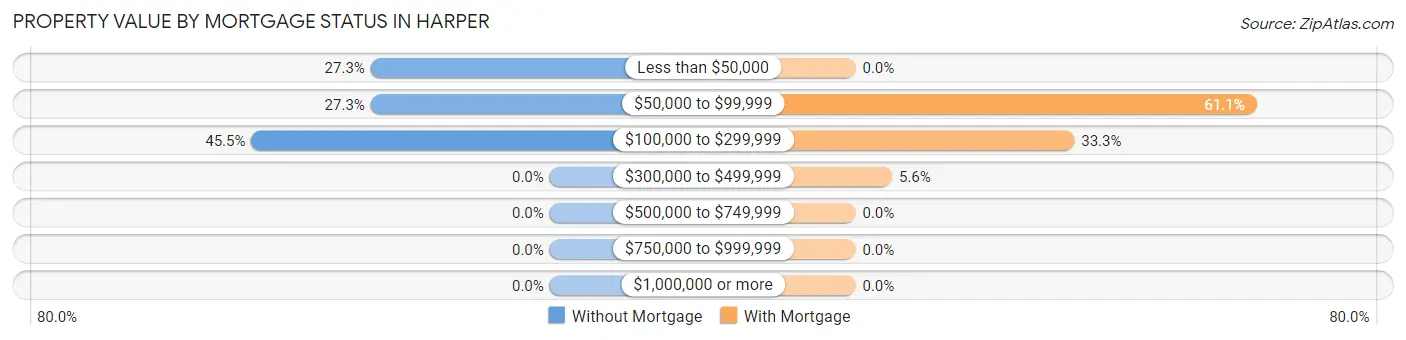
Property Value by Mortgage Status in Harper
| Property Value | Without Mortgage | With Mortgage |
| Less than $50,000 | 3 (27.3%) | 0 (0.0%) |
| $50,000 to $99,999 | 3 (27.3%) | 11 (61.1%) |
| $100,000 to $299,999 | 5 (45.5%) | 6 (33.3%) |
| $300,000 to $499,999 | 0 (0.0%) | 1 (5.6%) |
| $500,000 to $749,999 | 0 (0.0%) | 0 (0.0%) |
| $750,000 to $999,999 | 0 (0.0%) | 0 (0.0%) |
| $1,000,000 or more | 0 (0.0%) | 0 (0.0%) |
| Total | 11 (100.0%) | 18 (100.0%) |
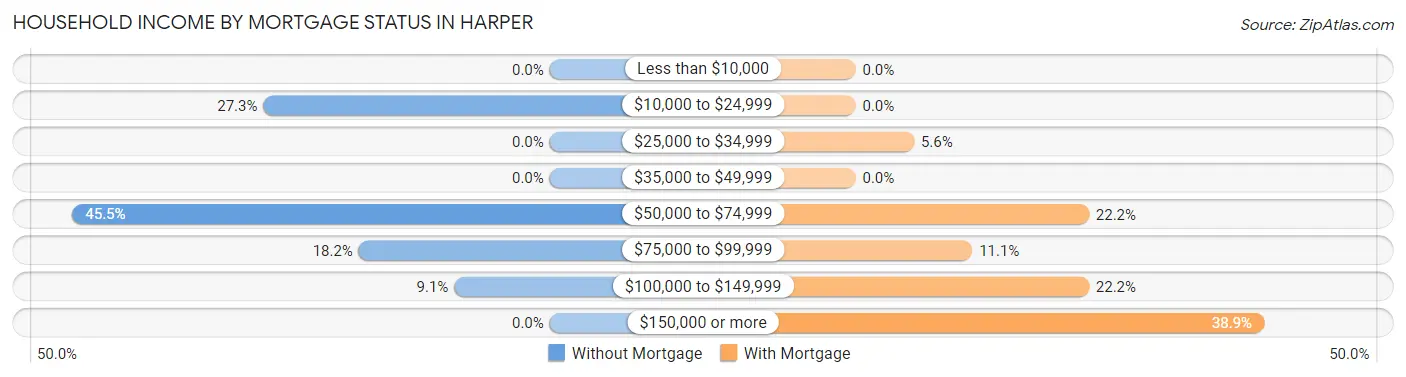
Household Income by Mortgage Status in Harper
| Household Income | Without Mortgage | With Mortgage |
| Less than $10,000 | 0 (0.0%) | 0 (0.0%) |
| $10,000 to $24,999 | 3 (27.3%) | 0 (0.0%) |
| $25,000 to $34,999 | 0 (0.0%) | 1 (5.6%) |
| $35,000 to $49,999 | 0 (0.0%) | 0 (0.0%) |
| $50,000 to $74,999 | 5 (45.5%) | 4 (22.2%) |
| $75,000 to $99,999 | 2 (18.2%) | 2 (11.1%) |
| $100,000 to $149,999 | 1 (9.1%) | 4 (22.2%) |
| $150,000 or more | 0 (0.0%) | 7 (38.9%) |
| Total | 11 (100.0%) | 18 (100.0%) |
Property Value to Household Income Ratio in Harper
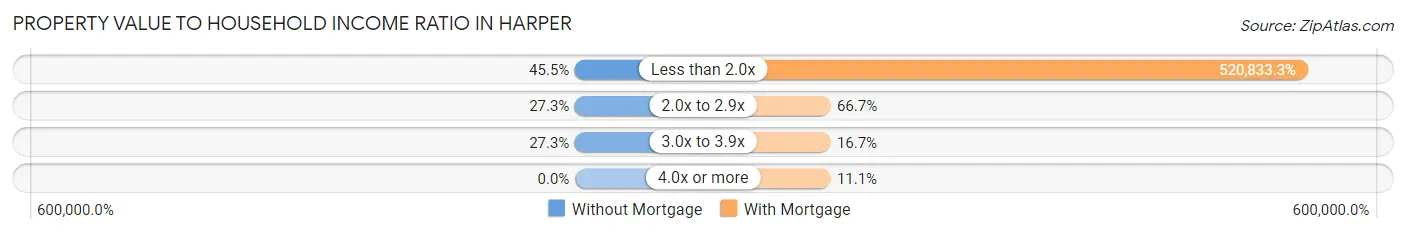
| Value-to-Income Ratio | Without Mortgage | With Mortgage |
| Less than 2.0x | 5 (45.5%) | 93,750 (520,833.3%) |
| 2.0x to 2.9x | 3 (27.3%) | 12 (66.7%) |
| 3.0x to 3.9x | 3 (27.3%) | 3 (16.7%) |
| 4.0x or more | 0 (0.0%) | 2 (11.1%) |
| Total | 11 (100.0%) | 18 (100.0%) |
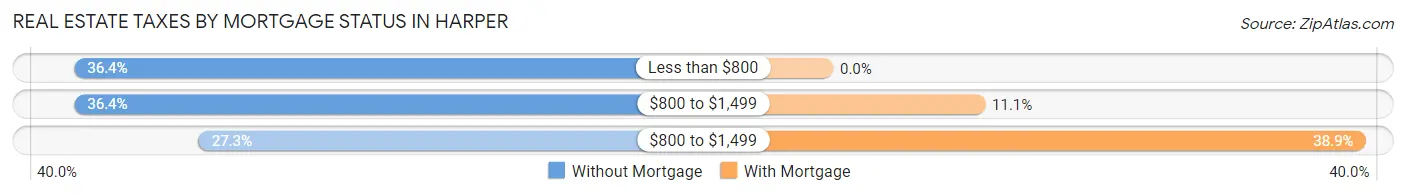
Real Estate Taxes by Mortgage Status in Harper
| Property Taxes | Without Mortgage | With Mortgage |
| Less than $800 | 4 (36.4%) | 0 (0.0%) |
| $800 to $1,499 | 4 (36.4%) | 2 (11.1%) |
| $800 to $1,499 | 3 (27.3%) | 7 (38.9%) |
| Total | 11 (100.0%) | 18 (100.0%) |
Health & Disability in Harper
Health Insurance Coverage by Age in Harper
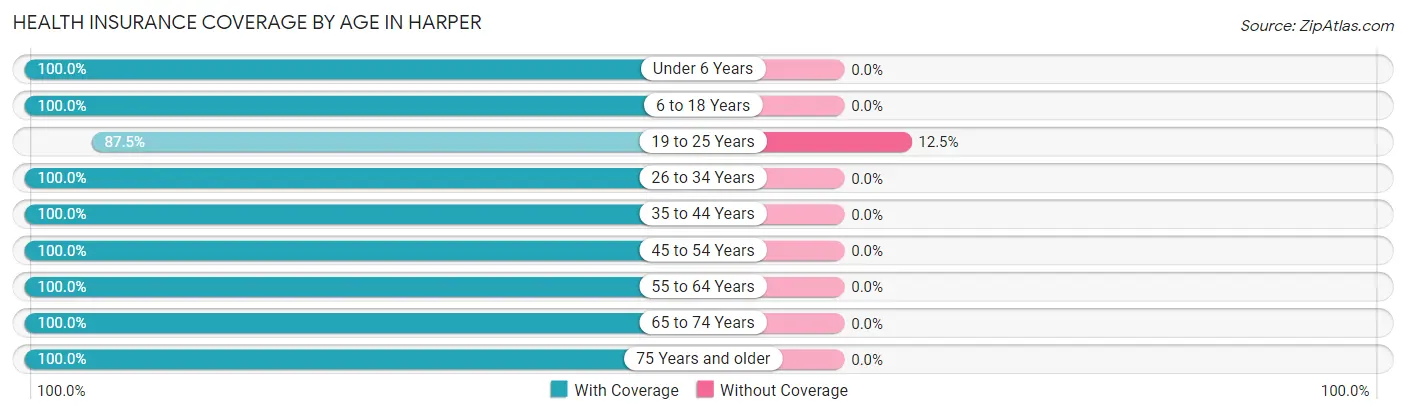
| Age Bracket | With Coverage | Without Coverage |
| Under 6 Years | 9 (100.0%) | 0 (0.0%) |
| 6 to 18 Years | 42 (100.0%) | 0 (0.0%) |
| 19 to 25 Years | 14 (87.5%) | 2 (12.5%) |
| 26 to 34 Years | 9 (100.0%) | 0 (0.0%) |
| 35 to 44 Years | 25 (100.0%) | 0 (0.0%) |
| 45 to 54 Years | 6 (100.0%) | 0 (0.0%) |
| 55 to 64 Years | 3 (100.0%) | 0 (0.0%) |
| 65 to 74 Years | 11 (100.0%) | 0 (0.0%) |
| 75 Years and older | 3 (100.0%) | 0 (0.0%) |
| Total | 122 (98.4%) | 2 (1.6%) |
Health Insurance Coverage by Citizenship Status in Harper
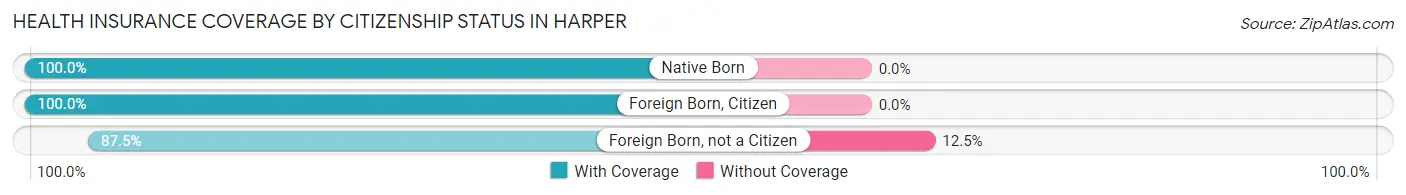
| Citizenship Status | With Coverage | Without Coverage |
| Native Born | 9 (100.0%) | 0 (0.0%) |
| Foreign Born, Citizen | 42 (100.0%) | 0 (0.0%) |
| Foreign Born, not a Citizen | 14 (87.5%) | 2 (12.5%) |
Health Insurance Coverage by Household Income in Harper
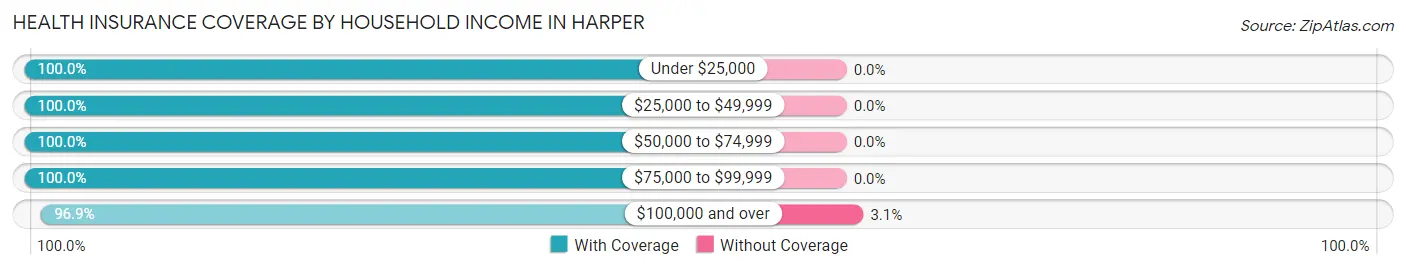
| Household Income | With Coverage | Without Coverage |
| Under $25,000 | 7 (100.0%) | 0 (0.0%) |
| $25,000 to $49,999 | 6 (100.0%) | 0 (0.0%) |
| $50,000 to $74,999 | 18 (100.0%) | 0 (0.0%) |
| $75,000 to $99,999 | 29 (100.0%) | 0 (0.0%) |
| $100,000 and over | 62 (96.9%) | 2 (3.1%) |
Public vs Private Health Insurance Coverage by Age in Harper
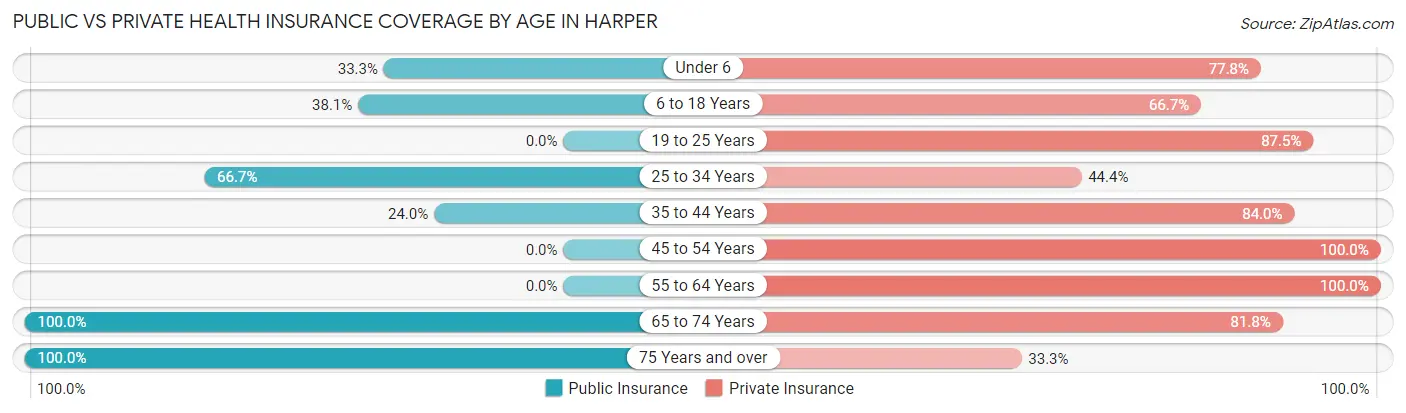
| Age Bracket | Public Insurance | Private Insurance |
| Under 6 | 3 (33.3%) | 7 (77.8%) |
| 6 to 18 Years | 16 (38.1%) | 28 (66.7%) |
| 19 to 25 Years | 0 (0.0%) | 14 (87.5%) |
| 25 to 34 Years | 6 (66.7%) | 4 (44.4%) |
| 35 to 44 Years | 6 (24.0%) | 21 (84.0%) |
| 45 to 54 Years | 0 (0.0%) | 6 (100.0%) |
| 55 to 64 Years | 0 (0.0%) | 3 (100.0%) |
| 65 to 74 Years | 11 (100.0%) | 9 (81.8%) |
| 75 Years and over | 3 (100.0%) | 1 (33.3%) |
| Total | 45 (36.3%) | 93 (75.0%) |
Disability Status by Sex by Age in Harper
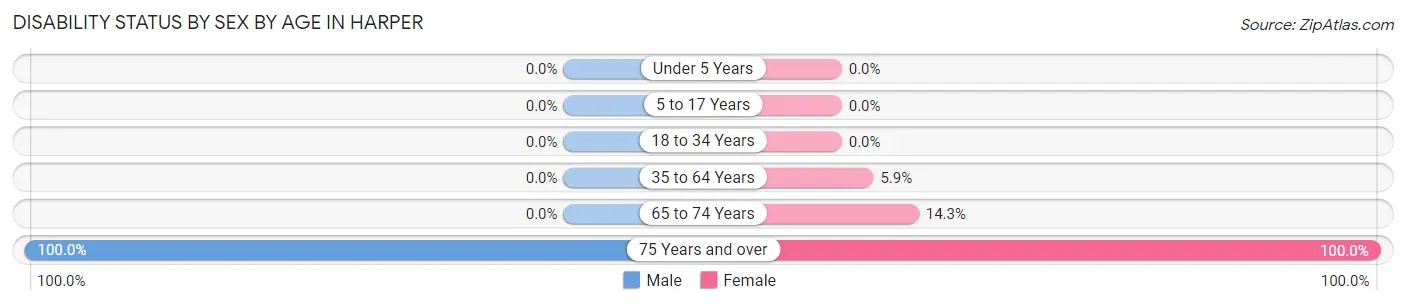
| Age Bracket | Male | Female |
| Under 5 Years | 0 (0.0%) | 0 (0.0%) |
| 5 to 17 Years | 0 (0.0%) | 0 (0.0%) |
| 18 to 34 Years | 0 (0.0%) | 0 (0.0%) |
| 35 to 64 Years | 0 (0.0%) | 1 (5.9%) |
| 65 to 74 Years | 0 (0.0%) | 1 (14.3%) |
| 75 Years and over | 2 (100.0%) | 1 (100.0%) |
Disability Class by Sex by Age in Harper
Disability Class: Hearing Difficulty
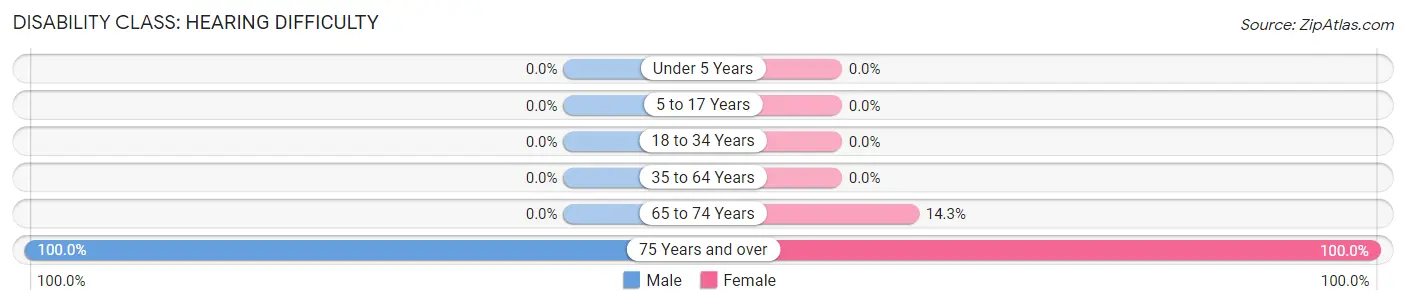
| Age Bracket | Male | Female |
| Under 5 Years | 0 (0.0%) | 0 (0.0%) |
| 5 to 17 Years | 0 (0.0%) | 0 (0.0%) |
| 18 to 34 Years | 0 (0.0%) | 0 (0.0%) |
| 35 to 64 Years | 0 (0.0%) | 0 (0.0%) |
| 65 to 74 Years | 0 (0.0%) | 1 (14.3%) |
| 75 Years and over | 2 (100.0%) | 1 (100.0%) |
Disability Class: Vision Difficulty
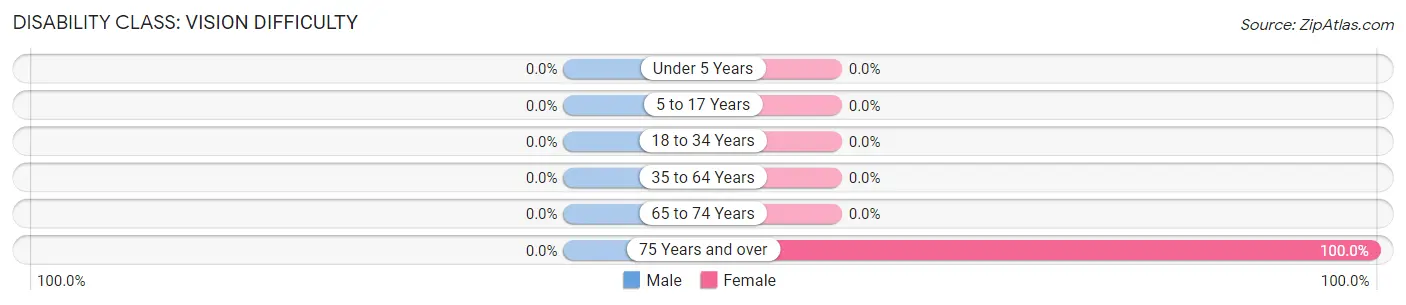
| Age Bracket | Male | Female |
| Under 5 Years | 0 (0.0%) | 0 (0.0%) |
| 5 to 17 Years | 0 (0.0%) | 0 (0.0%) |
| 18 to 34 Years | 0 (0.0%) | 0 (0.0%) |
| 35 to 64 Years | 0 (0.0%) | 0 (0.0%) |
| 65 to 74 Years | 0 (0.0%) | 0 (0.0%) |
| 75 Years and over | 0 (0.0%) | 1 (100.0%) |
Disability Class: Cognitive Difficulty
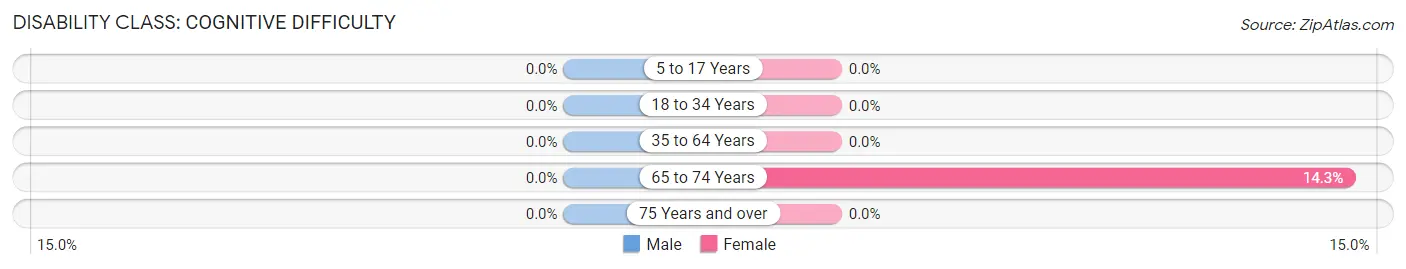
| Age Bracket | Male | Female |
| 5 to 17 Years | 0 (0.0%) | 0 (0.0%) |
| 18 to 34 Years | 0 (0.0%) | 0 (0.0%) |
| 35 to 64 Years | 0 (0.0%) | 0 (0.0%) |
| 65 to 74 Years | 0 (0.0%) | 1 (14.3%) |
| 75 Years and over | 0 (0.0%) | 0 (0.0%) |
Disability Class: Ambulatory Difficulty
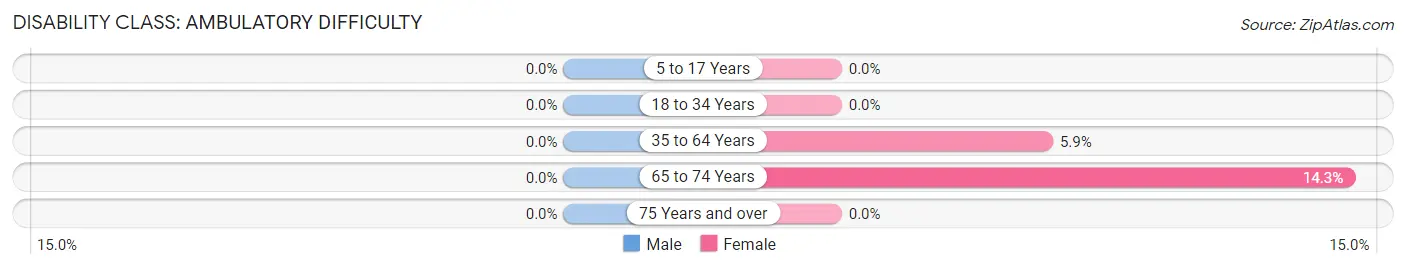
| Age Bracket | Male | Female |
| 5 to 17 Years | 0 (0.0%) | 0 (0.0%) |
| 18 to 34 Years | 0 (0.0%) | 0 (0.0%) |
| 35 to 64 Years | 0 (0.0%) | 1 (5.9%) |
| 65 to 74 Years | 0 (0.0%) | 1 (14.3%) |
| 75 Years and over | 0 (0.0%) | 0 (0.0%) |
Disability Class: Self-Care Difficulty
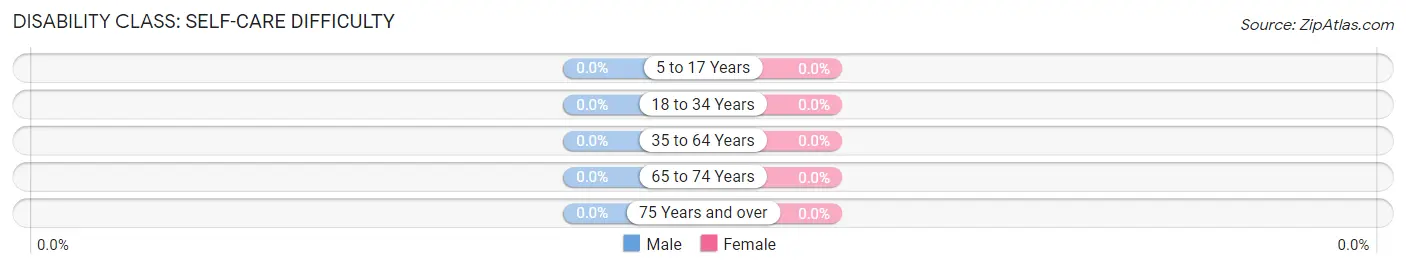
| Age Bracket | Male | Female |
| 5 to 17 Years | 0 (0.0%) | 0 (0.0%) |
| 18 to 34 Years | 0 (0.0%) | 0 (0.0%) |
| 35 to 64 Years | 0 (0.0%) | 0 (0.0%) |
| 65 to 74 Years | 0 (0.0%) | 0 (0.0%) |
| 75 Years and over | 0 (0.0%) | 0 (0.0%) |
Technology Access in Harper
Computing Device Access in Harper
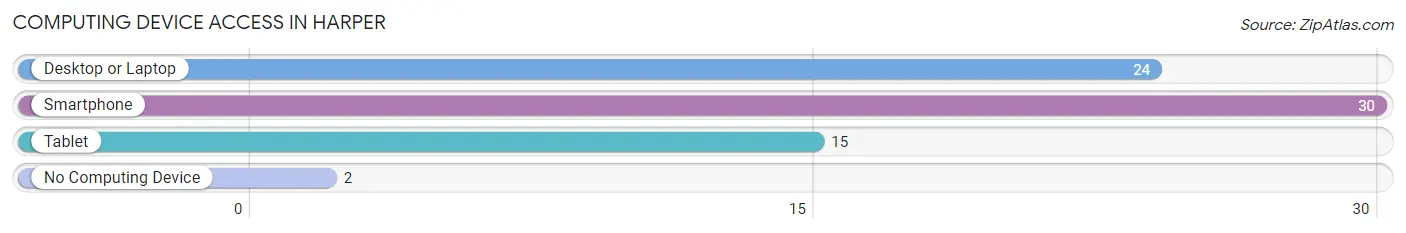
| Device Type | # Households | % Households |
| Desktop or Laptop | 24 | 75.0% |
| Smartphone | 30 | 93.8% |
| Tablet | 15 | 46.9% |
| No Computing Device | 2 | 6.2% |
| Total | 32 | 100.0% |
Internet Access in Harper
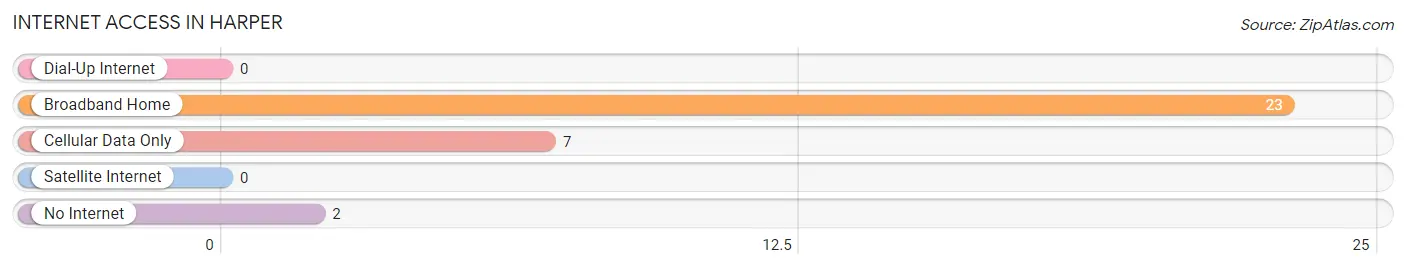
| Internet Type | # Households | % Households |
| Dial-Up Internet | 0 | 0.0% |
| Broadband Home | 23 | 71.9% |
| Cellular Data Only | 7 | 21.9% |
| Satellite Internet | 0 | 0.0% |
| No Internet | 2 | 6.2% |
| Total | 32 | 100.0% |
Harper Summary
Harper, Iowa is a small town located in the southwestern corner of the state, in Shelby County. It is situated along the West Nishnabotna River, and is home to a population of just over 500 people. The town was founded in 1856, and has a rich history of farming and small-town life.
Geography
Harper is located in the southwestern corner of Iowa, in Shelby County. It is situated along the West Nishnabotna River, and is surrounded by rolling hills and farmland. The town is located about 25 miles from the Missouri border, and is about an hour and a half drive from Des Moines. The town is located in the Central Time Zone, and has an elevation of 945 feet.
Economy
Harper’s economy is largely based on agriculture. The town is home to several farms, and the surrounding area is known for its production of corn, soybeans, and other crops. The town also has a few small businesses, including a grocery store, a hardware store, and a few restaurants.
Demographics
As of the 2010 census, Harper had a population of 514 people. The racial makeup of the town was 97.3% White, 0.6% African American, 0.2% Native American, 0.2% Asian, 0.4% from other races, and 1.3% from two or more races. Hispanic or Latino of any race were 1.2% of the population.
The median age in Harper was 43.7 years, with 24.3% of the population under the age of 18, and 11.3% over the age of 65. The median household income was $45,000, and the median family income was $50,000. The per capita income was $20,000.
Conclusion
Harper, Iowa is a small town located in the southwestern corner of the state, in Shelby County. It is situated along the West Nishnabotna River, and is home to a population of just over 500 people. The town was founded in 1856, and has a rich history of farming and small-town life. The town’s economy is largely based on agriculture, and the town also has a few small businesses. The population of Harper is mostly White, with a small percentage of African American, Native American, and Asian residents. The median age in Harper is 43.7 years, and the median household income is $45,000.
Common Questions
What is Per Capita Income in Harper?
Per Capita income in Harper is $20,652.
What is the Median Family Income in Harper?
Median Family Income in Harper is $92,813.
What is the Median Household income in Harper?
Median Household Income in Harper is $70,000.
What is Inequality or Gini Index in Harper?
Inequality or Gini Index in Harper is 0.27.
What is the Total Population of Harper?
Total Population of Harper is 124.
What is the Total Male Population of Harper?
Total Male Population of Harper is 52.
What is the Total Female Population of Harper?
Total Female Population of Harper is 72.
What is the Ratio of Males per 100 Females in Harper?
There are 72.22 Males per 100 Females in Harper.
What is the Ratio of Females per 100 Males in Harper?
There are 138.46 Females per 100 Males in Harper.
What is the Median Population Age in Harper?
Median Population Age in Harper is 22.2 Years.
What is the Average Family Size in Harper
Average Family Size in Harper is 4.6 People.
What is the Average Household Size in Harper
Average Household Size in Harper is 3.9 People.
How Large is the Labor Force in Harper?
There are 63 People in the Labor Forcein in Harper.
What is the Percentage of People in the Labor Force in Harper?
77.8% of People are in the Labor Force in Harper.
What is the Unemployment Rate in Harper?
Unemployment Rate in Harper is 11.1%.