Greenfield, IA Map & Demographics
Greenfield Map
Greenfield Overview
$33,123
PER CAPITA INCOME
$90,250
AVG FAMILY INCOME
$50,598
AVG HOUSEHOLD INCOME
31.4%
WAGE / INCOME GAP [ % ]
68.6¢/ $1
WAGE / INCOME GAP [ $ ]
0.43
INEQUALITY / GINI INDEX
1,778
TOTAL POPULATION
932
MALE POPULATION
846
FEMALE POPULATION
110.17
MALES / 100 FEMALES
90.77
FEMALES / 100 MALES
50.6
MEDIAN AGE
2.9
AVG FAMILY SIZE
1.9
AVG HOUSEHOLD SIZE
828
LABOR FORCE [ PEOPLE ]
55.8%
PERCENT IN LABOR FORCE
2.9%
UNEMPLOYMENT RATE
Greenfield Zip Codes
Greenfield Area Codes
Income in Greenfield
Income Overview in Greenfield
Per Capita Income in Greenfield is $33,123, while median incomes of families and households are $90,250 and $50,598 respectively.
| Characteristic | Number | Measure |
| Per Capita Income | 1,778 | $33,123 |
| Median Family Income | 378 | $90,250 |
| Mean Family Income | 378 | $90,700 |
| Median Household Income | 883 | $50,598 |
| Mean Household Income | 883 | $62,968 |
| Income Deficit | 378 | $0 |
| Wage / Income Gap (%) | 1,778 | 31.37% |
| Wage / Income Gap ($) | 1,778 | 68.63¢ per $1 |
| Gini / Inequality Index | 1,778 | 0.43 |
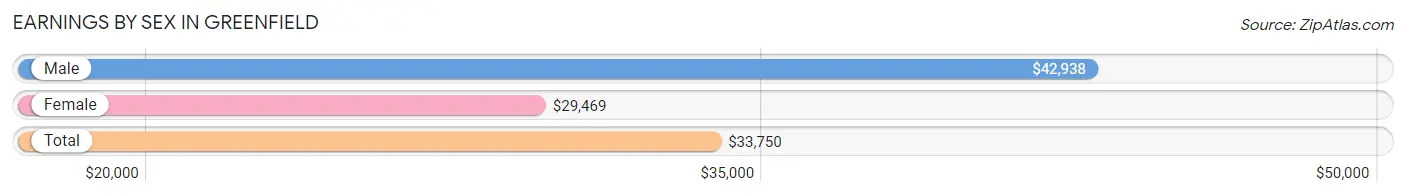
Earnings by Sex in Greenfield
Average Earnings in Greenfield are $33,750, $42,938 for men and $29,469 for women, a difference of 31.4%.
| Sex | Number | Average Earnings |
| Male | 511 (55.2%) | $42,938 |
| Female | 415 (44.8%) | $29,469 |
| Total | 926 (100.0%) | $33,750 |
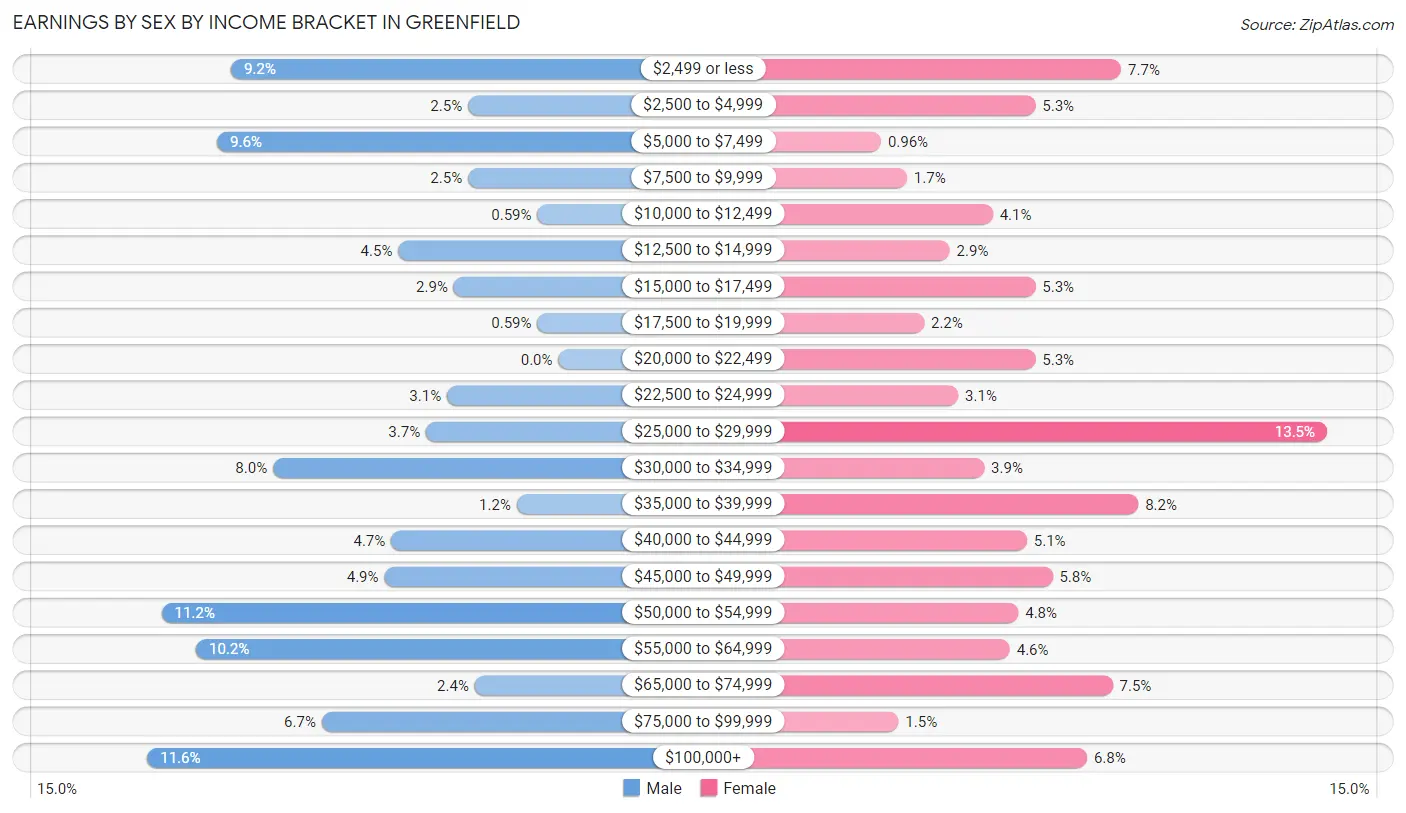
Earnings by Sex by Income Bracket in Greenfield
The most common earnings brackets in Greenfield are $100,000+ for men (59 | 11.6%) and $25,000 to $29,999 for women (56 | 13.5%).
| Income | Male | Female |
| $2,499 or less | 47 (9.2%) | 32 (7.7%) |
| $2,500 to $4,999 | 13 (2.5%) | 22 (5.3%) |
| $5,000 to $7,499 | 49 (9.6%) | 4 (1.0%) |
| $7,500 to $9,999 | 13 (2.5%) | 7 (1.7%) |
| $10,000 to $12,499 | 3 (0.6%) | 17 (4.1%) |
| $12,500 to $14,999 | 23 (4.5%) | 12 (2.9%) |
| $15,000 to $17,499 | 15 (2.9%) | 22 (5.3%) |
| $17,500 to $19,999 | 3 (0.6%) | 9 (2.2%) |
| $20,000 to $22,499 | 0 (0.0%) | 22 (5.3%) |
| $22,500 to $24,999 | 16 (3.1%) | 13 (3.1%) |
| $25,000 to $29,999 | 19 (3.7%) | 56 (13.5%) |
| $30,000 to $34,999 | 41 (8.0%) | 16 (3.9%) |
| $35,000 to $39,999 | 6 (1.2%) | 34 (8.2%) |
| $40,000 to $44,999 | 24 (4.7%) | 21 (5.1%) |
| $45,000 to $49,999 | 25 (4.9%) | 24 (5.8%) |
| $50,000 to $54,999 | 57 (11.2%) | 20 (4.8%) |
| $55,000 to $64,999 | 52 (10.2%) | 19 (4.6%) |
| $65,000 to $74,999 | 12 (2.4%) | 31 (7.5%) |
| $75,000 to $99,999 | 34 (6.7%) | 6 (1.5%) |
| $100,000+ | 59 (11.6%) | 28 (6.8%) |
| Total | 511 (100.0%) | 415 (100.0%) |
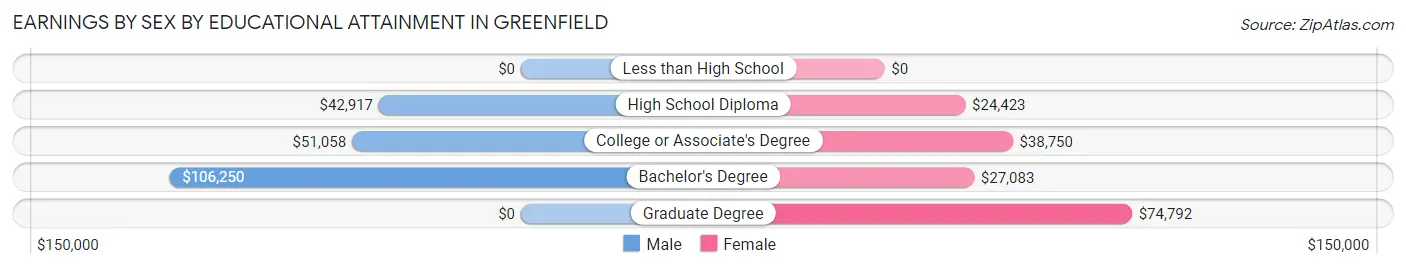
Earnings by Sex by Educational Attainment in Greenfield
Average earnings in Greenfield are $47,308 for men and $35,924 for women, a difference of 24.1%. Men with an educational attainment of bachelor's degree enjoy the highest average annual earnings of $106,250, while those with high school diploma education earn the least with $42,917. Women with an educational attainment of graduate degree earn the most with the average annual earnings of $74,792, while those with high school diploma education have the smallest earnings of $24,423.
| Educational Attainment | Male Income | Female Income |
| Less than High School | - | - |
| High School Diploma | $42,917 | $24,423 |
| College or Associate's Degree | $51,058 | $38,750 |
| Bachelor's Degree | $106,250 | $27,083 |
| Graduate Degree | - | - |
| Total | $47,308 | $35,924 |
Family Income in Greenfield
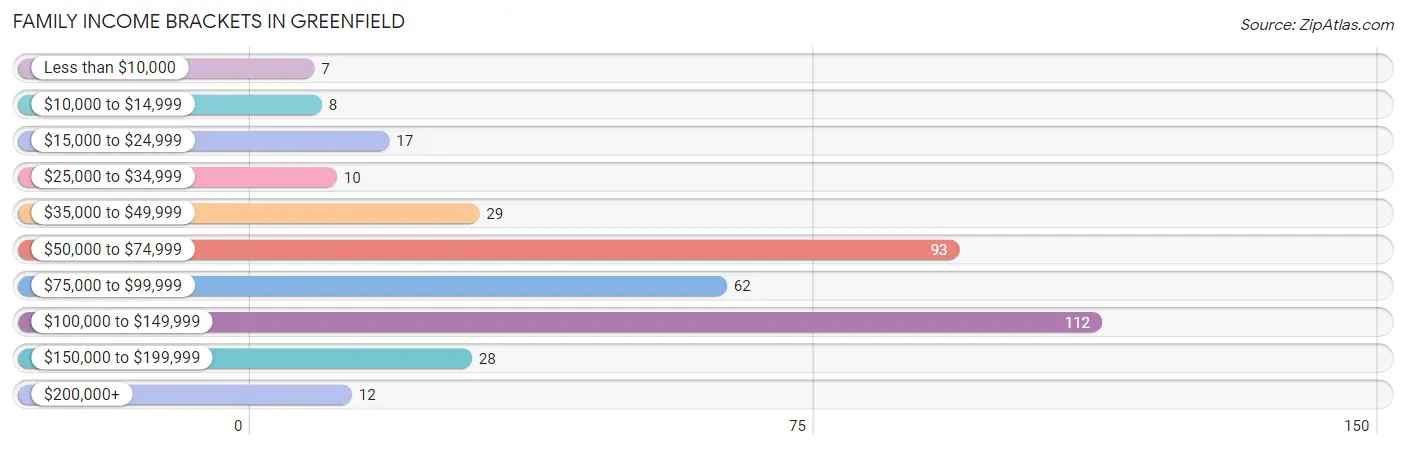
Family Income Brackets in Greenfield
According to the Greenfield family income data, there are 112 families falling into the $100,000 to $149,999 income range, which is the most common income bracket and makes up 29.6% of all families. Conversely, the less than $10,000 income bracket is the least frequent group with only 7 families (1.8%) belonging to this category.
| Income Bracket | # Families | % Families |
| Less than $10,000 | 7 | 1.9% |
| $10,000 to $14,999 | 8 | 2.1% |
| $15,000 to $24,999 | 17 | 4.5% |
| $25,000 to $34,999 | 10 | 2.6% |
| $35,000 to $49,999 | 29 | 7.7% |
| $50,000 to $74,999 | 93 | 24.6% |
| $75,000 to $99,999 | 62 | 16.4% |
| $100,000 to $149,999 | 112 | 29.6% |
| $150,000 to $199,999 | 28 | 7.4% |
| $200,000+ | 12 | 3.2% |
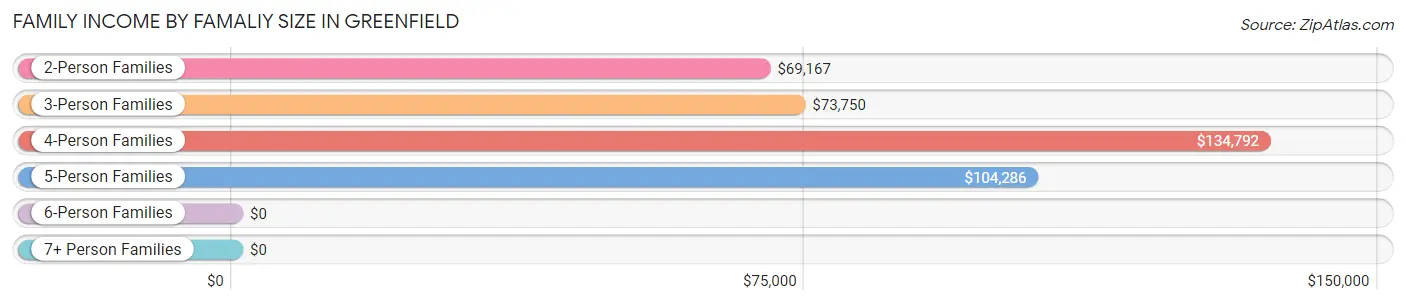
Family Income by Famaliy Size in Greenfield
4-person families (53 | 14.0%) account for the highest median family income in Greenfield with $134,792 per family, while 2-person families (258 | 68.2%) have the highest median income of $34,584 per family member.
| Income Bracket | # Families | Median Income |
| 2-Person Families | 258 (68.2%) | $69,167 |
| 3-Person Families | 42 (11.1%) | $73,750 |
| 4-Person Families | 53 (14.0%) | $134,792 |
| 5-Person Families | 20 (5.3%) | $104,286 |
| 6-Person Families | 5 (1.3%) | $0 |
| 7+ Person Families | 0 (0.0%) | $0 |
| Total | 378 (100.0%) | $90,250 |
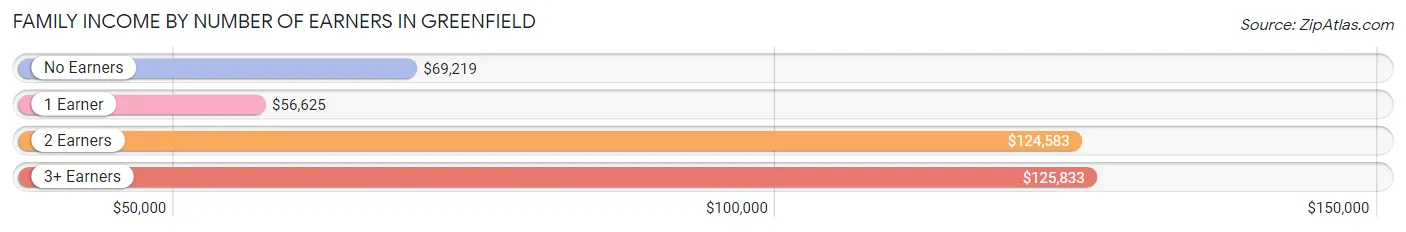
Family Income by Number of Earners in Greenfield
The median family income in Greenfield is $90,250, with families comprising 3+ earners (40) having the highest median family income of $125,833, while families with 1 earner (129) have the lowest median family income of $56,625, accounting for 10.6% and 34.1% of families, respectively.
| Number of Earners | # Families | Median Income |
| No Earners | 79 (20.9%) | $69,219 |
| 1 Earner | 129 (34.1%) | $56,625 |
| 2 Earners | 130 (34.4%) | $124,583 |
| 3+ Earners | 40 (10.6%) | $125,833 |
| Total | 378 (100.0%) | $90,250 |
Household Income in Greenfield
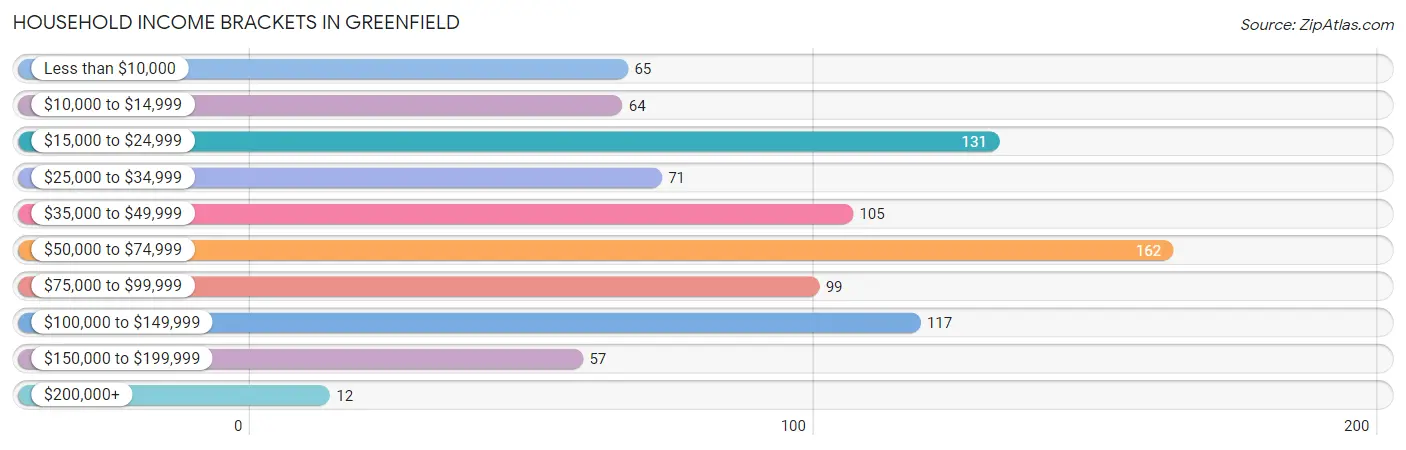
Household Income Brackets in Greenfield
With 162 households falling in the category, the $50,000 to $74,999 income range is the most frequent in Greenfield, accounting for 18.3% of all households. In contrast, only 12 households (1.4%) fall into the $200,000+ income bracket, making it the least populous group.
| Income Bracket | # Households | % Households |
| Less than $10,000 | 65 | 7.4% |
| $10,000 to $14,999 | 64 | 7.2% |
| $15,000 to $24,999 | 131 | 14.8% |
| $25,000 to $34,999 | 71 | 8.0% |
| $35,000 to $49,999 | 105 | 11.9% |
| $50,000 to $74,999 | 162 | 18.3% |
| $75,000 to $99,999 | 99 | 11.2% |
| $100,000 to $149,999 | 117 | 13.3% |
| $150,000 to $199,999 | 57 | 6.5% |
| $200,000+ | 12 | 1.4% |
Household Income by Householder Age in Greenfield
The median household income in Greenfield is $50,598, with the highest median household income of $79,375 found in the 25 to 44 years age bracket for the primary householder. A total of 207 households (23.4%) fall into this category. Meanwhile, the 15 to 24 years age bracket for the primary householder has the lowest median household income of $30,577, with 44 households (5.0%) in this group.
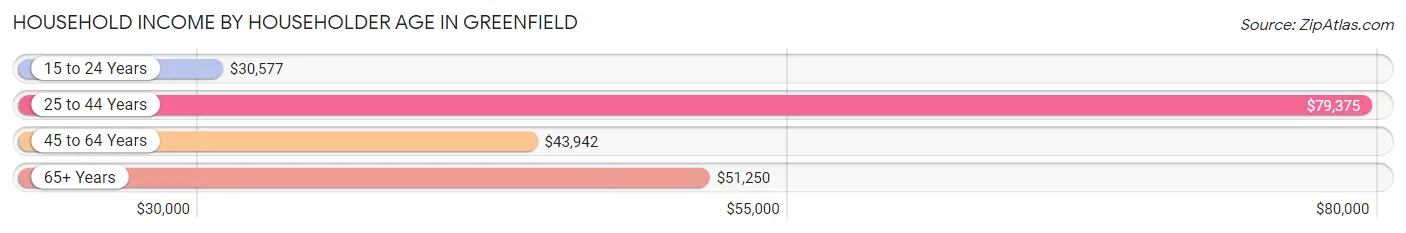
| Income Bracket | # Households | Median Income |
| 15 to 24 Years | 44 (5.0%) | $30,577 |
| 25 to 44 Years | 207 (23.4%) | $79,375 |
| 45 to 64 Years | 303 (34.3%) | $43,942 |
| 65+ Years | 329 (37.3%) | $51,250 |
| Total | 883 (100.0%) | $50,598 |
Poverty in Greenfield
Income Below Poverty by Sex and Age in Greenfield
With 15.1% poverty level for males and 16.9% for females among the residents of Greenfield, 18 to 24 year old males and 18 to 24 year old females are the most vulnerable to poverty, with 23 males (39.7%) and 30 females (50.0%) in their respective age groups living below the poverty level.
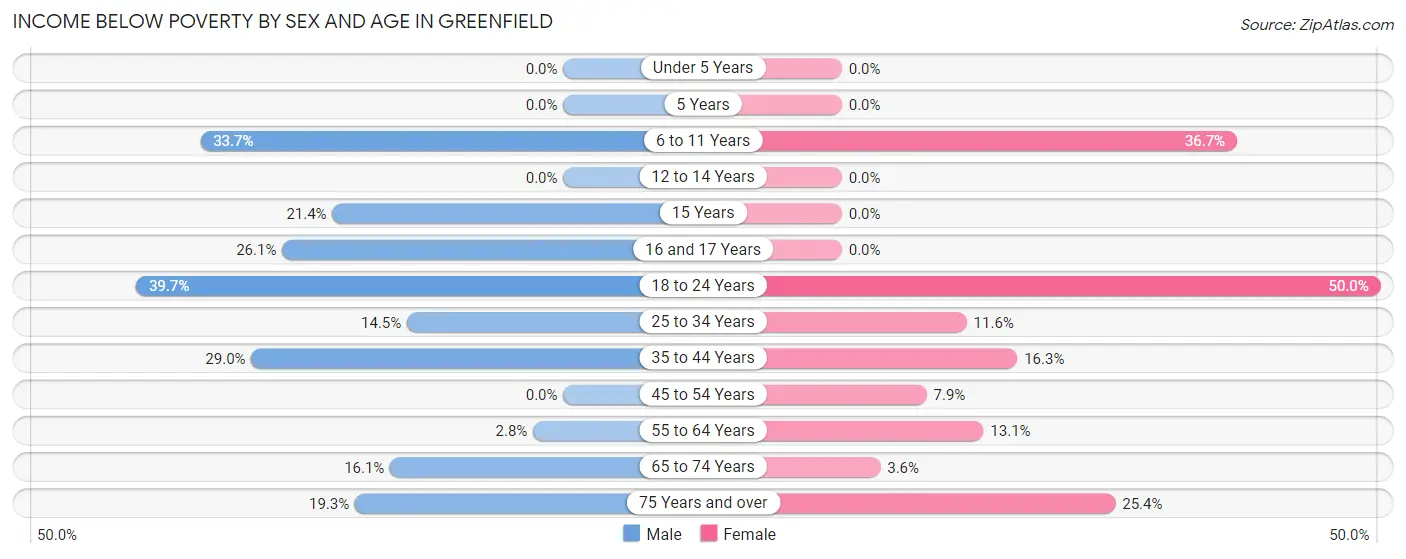
| Age Bracket | Male | Female |
| Under 5 Years | 0 (0.0%) | 0 (0.0%) |
| 5 Years | 0 (0.0%) | 0 (0.0%) |
| 6 to 11 Years | 31 (33.7%) | 22 (36.7%) |
| 12 to 14 Years | 0 (0.0%) | 0 (0.0%) |
| 15 Years | 3 (21.4%) | 0 (0.0%) |
| 16 and 17 Years | 6 (26.1%) | 0 (0.0%) |
| 18 to 24 Years | 23 (39.7%) | 30 (50.0%) |
| 25 to 34 Years | 19 (14.5%) | 8 (11.6%) |
| 35 to 44 Years | 11 (28.9%) | 14 (16.3%) |
| 45 to 54 Years | 0 (0.0%) | 7 (7.9%) |
| 55 to 64 Years | 4 (2.8%) | 18 (13.1%) |
| 65 to 74 Years | 18 (16.1%) | 4 (3.6%) |
| 75 Years and over | 23 (19.3%) | 33 (25.4%) |
| Total | 138 (15.1%) | 136 (16.9%) |
Income Above Poverty by Sex and Age in Greenfield
According to the poverty statistics in Greenfield, males aged under 5 years and females aged under 5 years are the age groups that are most secure financially, with 100.0% of males and 100.0% of females in these age groups living above the poverty line.
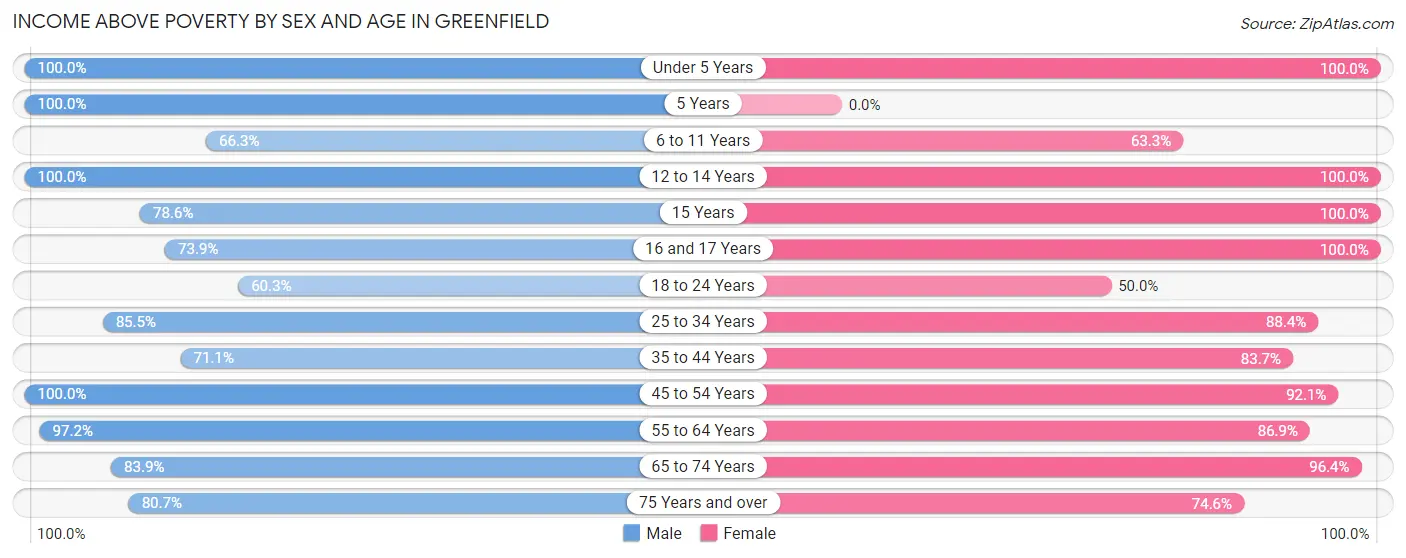
| Age Bracket | Male | Female |
| Under 5 Years | 61 (100.0%) | 17 (100.0%) |
| 5 Years | 12 (100.0%) | 0 (0.0%) |
| 6 to 11 Years | 61 (66.3%) | 38 (63.3%) |
| 12 to 14 Years | 11 (100.0%) | 9 (100.0%) |
| 15 Years | 11 (78.6%) | 13 (100.0%) |
| 16 and 17 Years | 17 (73.9%) | 23 (100.0%) |
| 18 to 24 Years | 35 (60.3%) | 30 (50.0%) |
| 25 to 34 Years | 112 (85.5%) | 61 (88.4%) |
| 35 to 44 Years | 27 (71.1%) | 72 (83.7%) |
| 45 to 54 Years | 98 (100.0%) | 82 (92.1%) |
| 55 to 64 Years | 139 (97.2%) | 119 (86.9%) |
| 65 to 74 Years | 94 (83.9%) | 108 (96.4%) |
| 75 Years and over | 96 (80.7%) | 97 (74.6%) |
| Total | 774 (84.9%) | 669 (83.1%) |
Income Below Poverty Among Married-Couple Families in Greenfield
The poverty statistics for married-couple families in Greenfield show that 4.5% or 13 of the total 289 families live below the poverty line. Families with no children have the highest poverty rate of 6.2%, comprising of 13 families. On the other hand, families with 1 or 2 children have the lowest poverty rate of 0.0%, which includes 0 families.
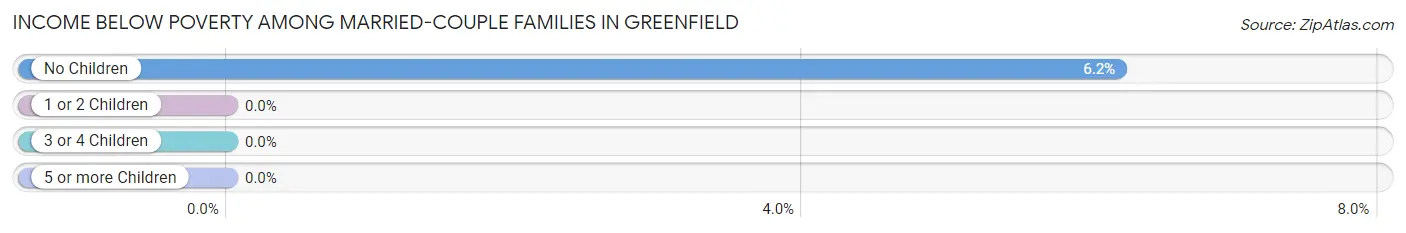
| Children | Above Poverty | Below Poverty |
| No Children | 197 (93.8%) | 13 (6.2%) |
| 1 or 2 Children | 58 (100.0%) | 0 (0.0%) |
| 3 or 4 Children | 21 (100.0%) | 0 (0.0%) |
| 5 or more Children | 0 (0.0%) | 0 (0.0%) |
| Total | 276 (95.5%) | 13 (4.5%) |
Income Below Poverty Among Single-Parent Households in Greenfield
According to the poverty data in Greenfield, 7.9% or 3 single-father households and 31.4% or 16 single-mother households are living below the poverty line. Among single-father households, those with 1 or 2 children have the highest poverty rate, with 3 households (13.6%) experiencing poverty. Likewise, among single-mother households, those with 1 or 2 children have the highest poverty rate, with 16 households (45.7%) falling below the poverty line.
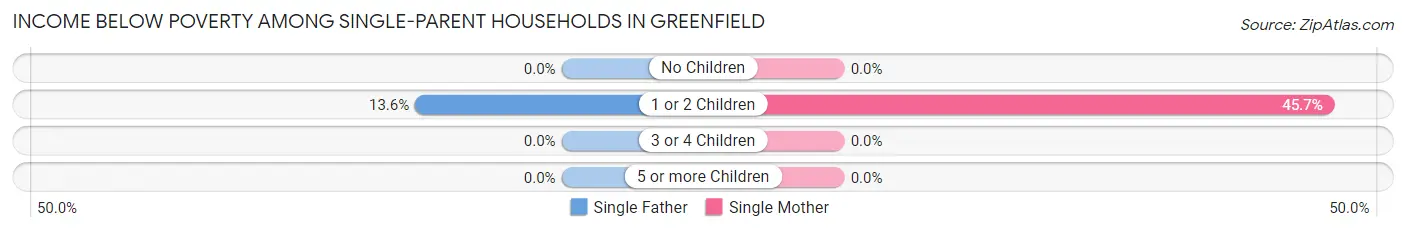
| Children | Single Father | Single Mother |
| No Children | 0 (0.0%) | 0 (0.0%) |
| 1 or 2 Children | 3 (13.6%) | 16 (45.7%) |
| 3 or 4 Children | 0 (0.0%) | 0 (0.0%) |
| 5 or more Children | 0 (0.0%) | 0 (0.0%) |
| Total | 3 (7.9%) | 16 (31.4%) |
Income Below Poverty Among Married-Couple vs Single-Parent Households in Greenfield
The poverty data for Greenfield shows that 13 of the married-couple family households (4.5%) and 19 of the single-parent households (21.3%) are living below the poverty level. Within the married-couple family households, those with no children have the highest poverty rate, with 13 households (6.2%) falling below the poverty line. Among the single-parent households, those with 1 or 2 children have the highest poverty rate, with 19 household (33.3%) living below poverty.
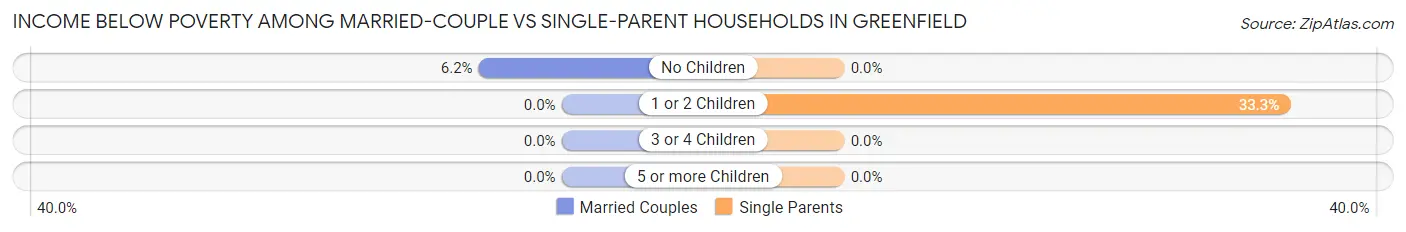
| Children | Married-Couple Families | Single-Parent Households |
| No Children | 13 (6.2%) | 0 (0.0%) |
| 1 or 2 Children | 0 (0.0%) | 19 (33.3%) |
| 3 or 4 Children | 0 (0.0%) | 0 (0.0%) |
| 5 or more Children | 0 (0.0%) | 0 (0.0%) |
| Total | 13 (4.5%) | 19 (21.3%) |
Race in Greenfield
The most populous races in Greenfield are White / Caucasian (1,663 | 93.5%), Two or more Races (50 | 2.8%), and Black / African American (42 | 2.4%).
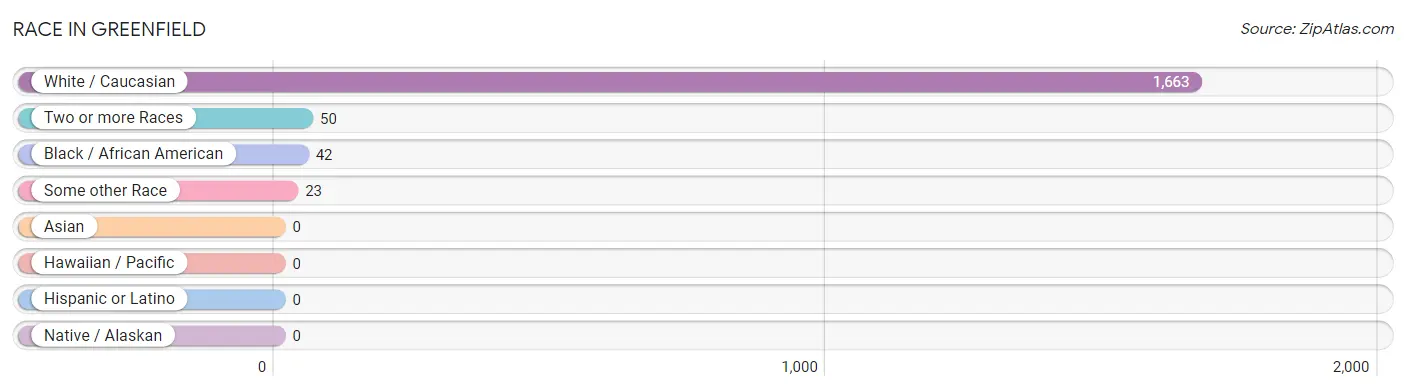
| Race | # Population | % Population |
| Asian | 0 | 0.0% |
| Black / African American | 42 | 2.4% |
| Hawaiian / Pacific | 0 | 0.0% |
| Hispanic or Latino | 0 | 0.0% |
| Native / Alaskan | 0 | 0.0% |
| White / Caucasian | 1,663 | 93.5% |
| Two or more Races | 50 | 2.8% |
| Some other Race | 23 | 1.3% |
| Total | 1,778 | 100.0% |
Ancestry in Greenfield
The most populous ancestries reported in Greenfield are German (567 | 31.9%), Irish (301 | 16.9%), English (163 | 9.2%), Danish (96 | 5.4%), and American (79 | 4.4%), together accounting for 67.8% of all Greenfield residents.
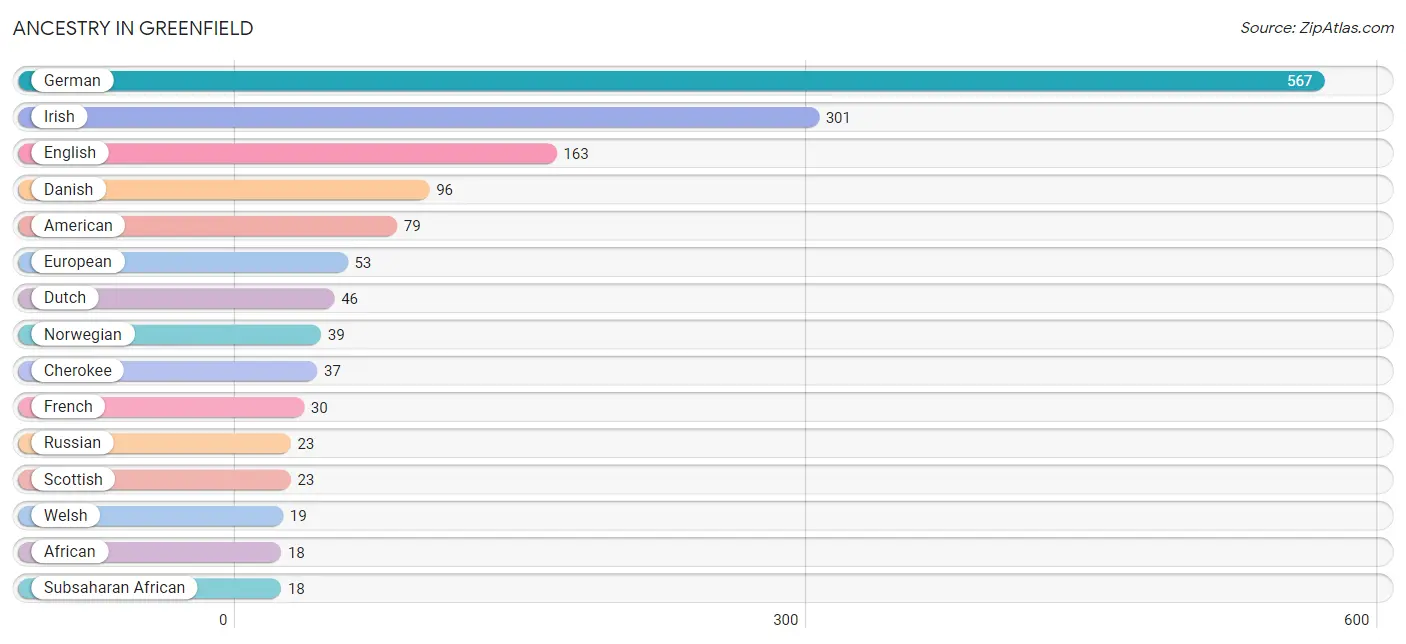
| Ancestry | # Population | % Population |
| African | 18 | 1.0% |
| American | 79 | 4.4% |
| Belgian | 6 | 0.3% |
| Blackfeet | 13 | 0.7% |
| Cherokee | 37 | 2.1% |
| Czech | 8 | 0.4% |
| Danish | 96 | 5.4% |
| Dutch | 46 | 2.6% |
| English | 163 | 9.2% |
| European | 53 | 3.0% |
| French | 30 | 1.7% |
| German | 567 | 31.9% |
| Irish | 301 | 16.9% |
| Italian | 7 | 0.4% |
| Norwegian | 39 | 2.2% |
| Polish | 6 | 0.3% |
| Russian | 23 | 1.3% |
| Scotch-Irish | 7 | 0.4% |
| Scottish | 23 | 1.3% |
| Subsaharan African | 18 | 1.0% |
| Swedish | 17 | 1.0% |
| Swiss | 6 | 0.3% |
| Welsh | 19 | 1.1% | View All 23 Rows |
Immigrants in Greenfield
The most numerous immigrant groups reported in Greenfield came from , and Canada (23 | 1.3%), together accounting for 1.3% of all Greenfield residents.

| Immigration Origin | # Population | % Population |
| Canada | 23 | 1.3% | View All 1 Rows |
Sex and Age in Greenfield
Sex and Age in Greenfield
The most populous age groups in Greenfield are 60 to 64 Years (105 | 11.3%) for men and 85 Years and over (81 | 9.6%) for women.
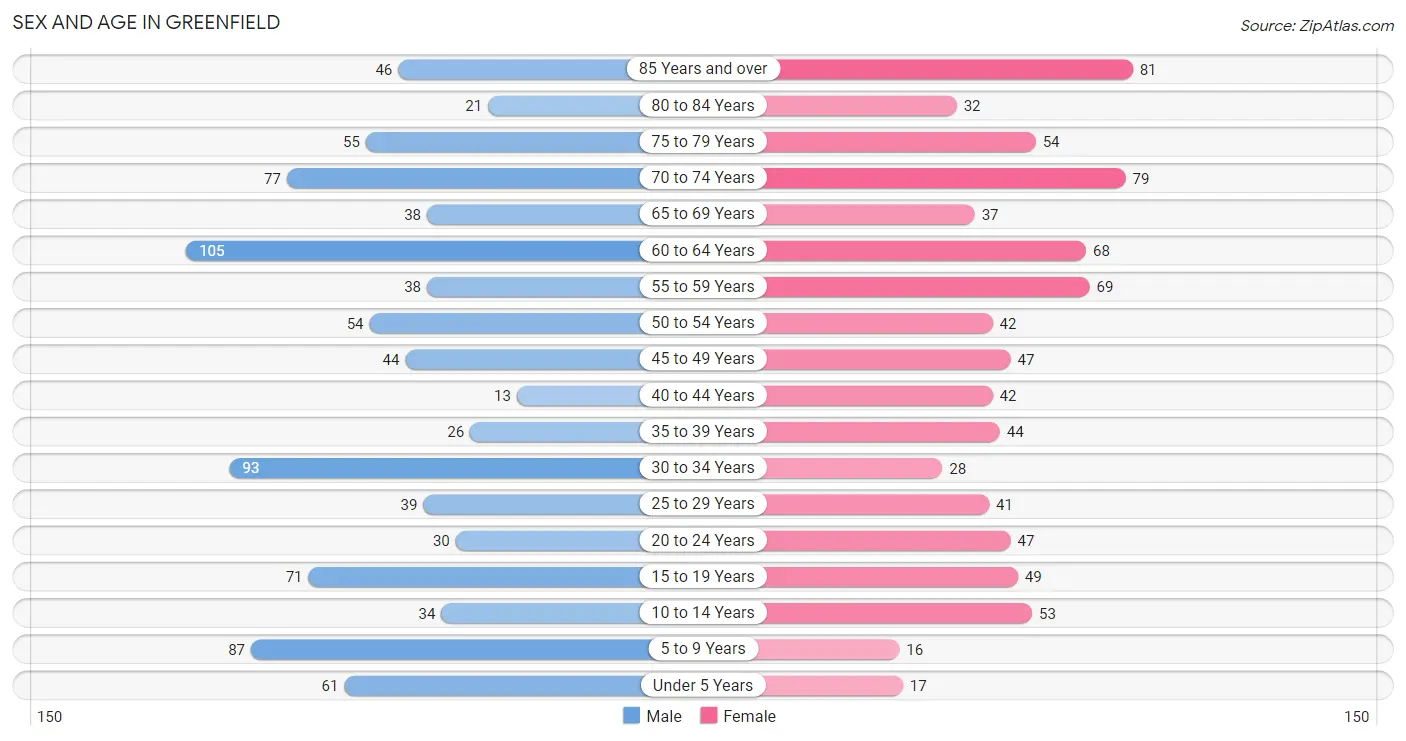
| Age Bracket | Male | Female |
| Under 5 Years | 61 (6.6%) | 17 (2.0%) |
| 5 to 9 Years | 87 (9.3%) | 16 (1.9%) |
| 10 to 14 Years | 34 (3.6%) | 53 (6.3%) |
| 15 to 19 Years | 71 (7.6%) | 49 (5.8%) |
| 20 to 24 Years | 30 (3.2%) | 47 (5.6%) |
| 25 to 29 Years | 39 (4.2%) | 41 (4.9%) |
| 30 to 34 Years | 93 (10.0%) | 28 (3.3%) |
| 35 to 39 Years | 26 (2.8%) | 44 (5.2%) |
| 40 to 44 Years | 13 (1.4%) | 42 (5.0%) |
| 45 to 49 Years | 44 (4.7%) | 47 (5.6%) |
| 50 to 54 Years | 54 (5.8%) | 42 (5.0%) |
| 55 to 59 Years | 38 (4.1%) | 69 (8.2%) |
| 60 to 64 Years | 105 (11.3%) | 68 (8.0%) |
| 65 to 69 Years | 38 (4.1%) | 37 (4.4%) |
| 70 to 74 Years | 77 (8.3%) | 79 (9.3%) |
| 75 to 79 Years | 55 (5.9%) | 54 (6.4%) |
| 80 to 84 Years | 21 (2.2%) | 32 (3.8%) |
| 85 Years and over | 46 (4.9%) | 81 (9.6%) |
| Total | 932 (100.0%) | 846 (100.0%) |
Families and Households in Greenfield
Median Family Size in Greenfield
The median family size in Greenfield is 2.88 persons per family, with single female/mother families (51 | 13.5%) accounting for the largest median family size of 3.37 persons per family. On the other hand, single male/father families (38 | 10.1%) represent the smallest median family size with 2.32 persons per family.
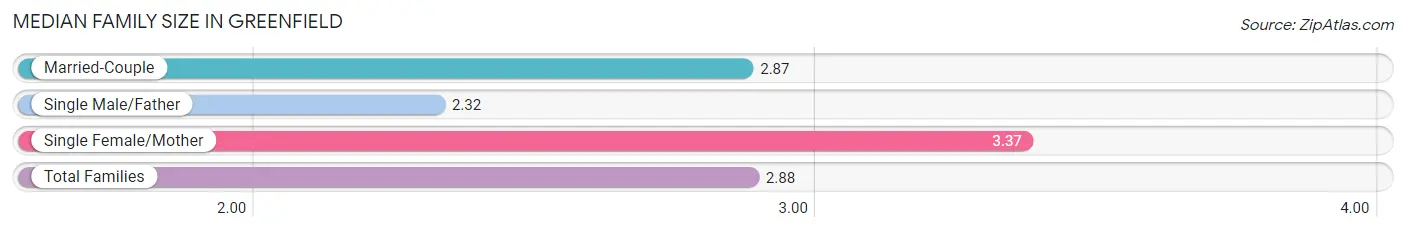
| Family Type | # Families | Family Size |
| Married-Couple | 289 (76.5%) | 2.87 |
| Single Male/Father | 38 (10.1%) | 2.32 |
| Single Female/Mother | 51 (13.5%) | 3.37 |
| Total Families | 378 (100.0%) | 2.88 |
Median Household Size in Greenfield
The median household size in Greenfield is 1.95 persons per household, with single female/mother households (51 | 5.8%) accounting for the largest median household size of 3.63 persons per household. non-family households (505 | 57.2%) represent the smallest median household size with 1.18 persons per household.
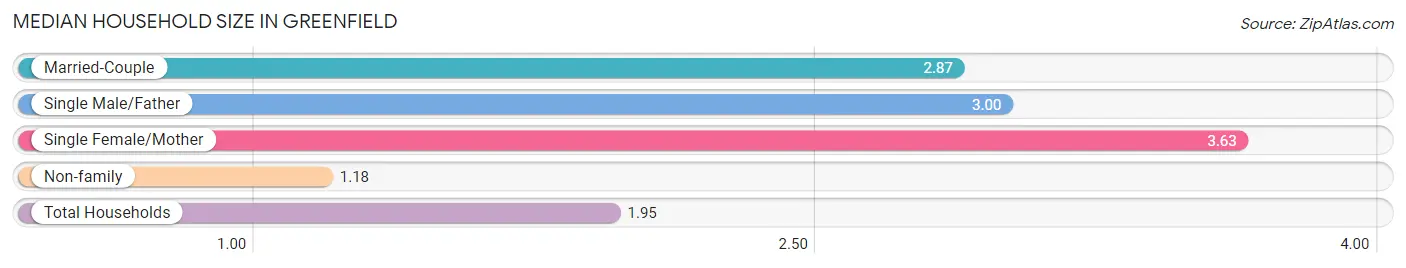
| Household Type | # Households | Household Size |
| Married-Couple | 289 (32.7%) | 2.87 |
| Single Male/Father | 38 (4.3%) | 3.00 |
| Single Female/Mother | 51 (5.8%) | 3.63 |
| Non-family | 505 (57.2%) | 1.18 |
| Total Households | 883 (100.0%) | 1.95 |
Household Size by Marriage Status in Greenfield
Out of a total of 883 households in Greenfield, 378 (42.8%) are family households, while 505 (57.2%) are nonfamily households. The most numerous type of family households are 2-person households, comprising 241, and the most common type of nonfamily households are 1-person households, comprising 447.
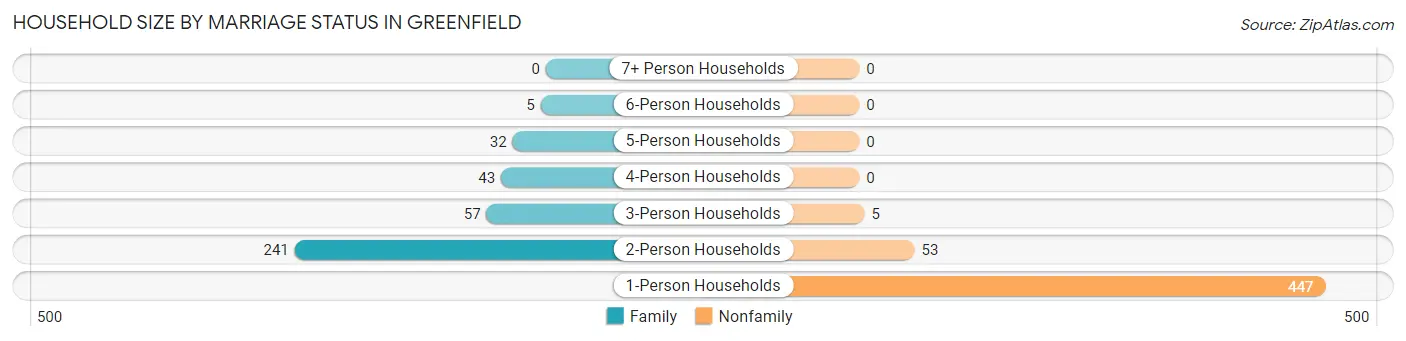
| Household Size | Family Households | Nonfamily Households |
| 1-Person Households | - | 447 (50.6%) |
| 2-Person Households | 241 (27.3%) | 53 (6.0%) |
| 3-Person Households | 57 (6.5%) | 5 (0.6%) |
| 4-Person Households | 43 (4.9%) | 0 (0.0%) |
| 5-Person Households | 32 (3.6%) | 0 (0.0%) |
| 6-Person Households | 5 (0.6%) | 0 (0.0%) |
| 7+ Person Households | 0 (0.0%) | 0 (0.0%) |
| Total | 378 (42.8%) | 505 (57.2%) |
Female Fertility in Greenfield
Fertility by Age in Greenfield
Average fertility rate in Greenfield is 69.0 births per 1,000 women. Women in the age bracket of 20 to 34 years have the highest fertility rate with 181.0 births per 1,000 women. Women in the age bracket of 20 to 34 years acount for 100.0% of all women with births.
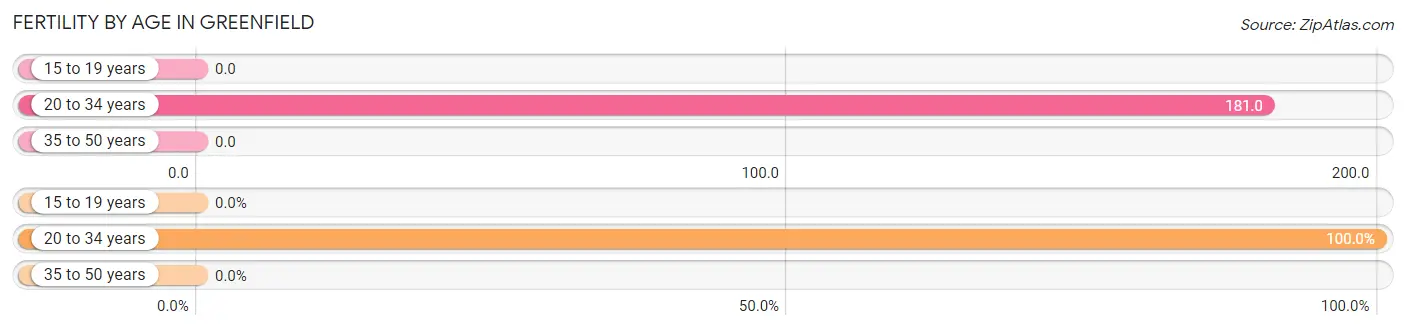
| Age Bracket | Women with Births | Births / 1,000 Women |
| 15 to 19 years | 0 (0.0%) | 0.0 |
| 20 to 34 years | 21 (100.0%) | 181.0 |
| 35 to 50 years | 0 (0.0%) | 0.0 |
| Total | 21 (100.0%) | 69.0 |
Fertility by Age by Marriage Status in Greenfield
28.6% of women with births (21) in Greenfield are married. The highest percentage of unmarried women with births falls into 20 to 34 years age bracket with 71.4% of them unmarried at the time of birth, while the lowest percentage of unmarried women with births belong to 20 to 34 years age bracket with 71.4% of them unmarried.
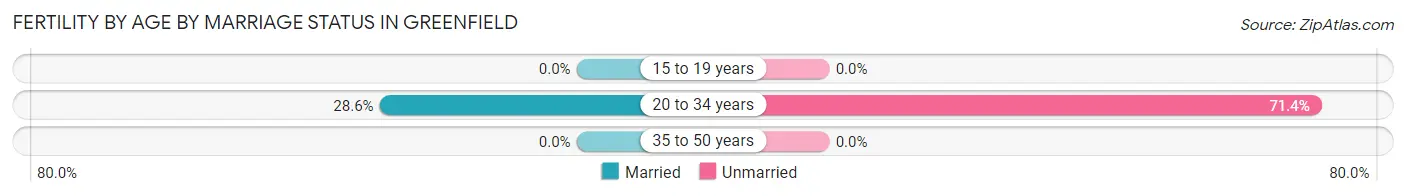
| Age Bracket | Married | Unmarried |
| 15 to 19 years | 0 (0.0%) | 0 (0.0%) |
| 20 to 34 years | 6 (28.6%) | 15 (71.4%) |
| 35 to 50 years | 0 (0.0%) | 0 (0.0%) |
| Total | 6 (28.6%) | 15 (71.4%) |
Fertility by Education in Greenfield
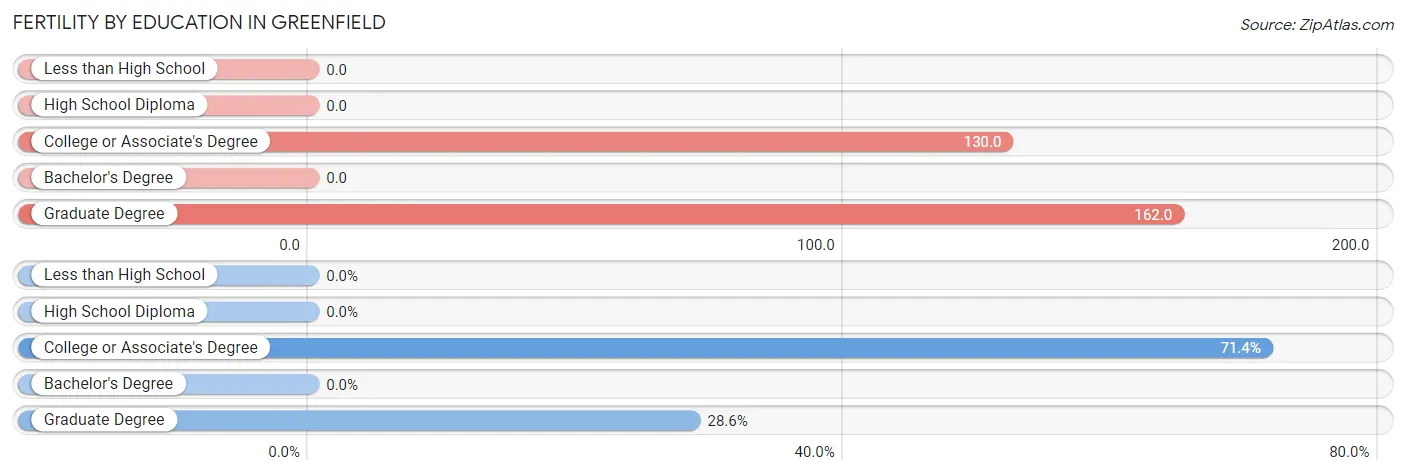
| Educational Attainment | Women with Births | Births / 1,000 Women |
| Less than High School | 0 (0.0%) | 0.0 |
| High School Diploma | 0 (0.0%) | 0.0 |
| College or Associate's Degree | 15 (71.4%) | 130.0 |
| Bachelor's Degree | 0 (0.0%) | 0.0 |
| Graduate Degree | 6 (28.6%) | 162.0 |
| Total | 21 (100.0%) | 69.0 |
Fertility by Education by Marriage Status in Greenfield
71.4% of women with births in Greenfield are unmarried. Women with the educational attainment of graduate degree are most likely to be married with 100.0% of them married at childbirth, while women with the educational attainment of college or associate's degree are least likely to be married with 100.0% of them unmarried at childbirth.
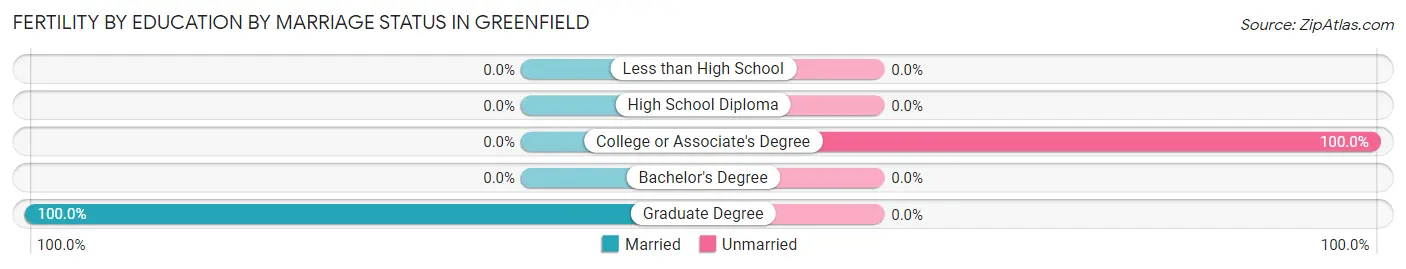
| Educational Attainment | Married | Unmarried |
| Less than High School | 0 (0.0%) | 0 (0.0%) |
| High School Diploma | 0 (0.0%) | 0 (0.0%) |
| College or Associate's Degree | 0 (0.0%) | 15 (100.0%) |
| Bachelor's Degree | 0 (0.0%) | 0 (0.0%) |
| Graduate Degree | 6 (100.0%) | 0 (0.0%) |
| Total | 6 (28.6%) | 15 (71.4%) |
Employment Characteristics in Greenfield
Employment by Class of Employer in Greenfield
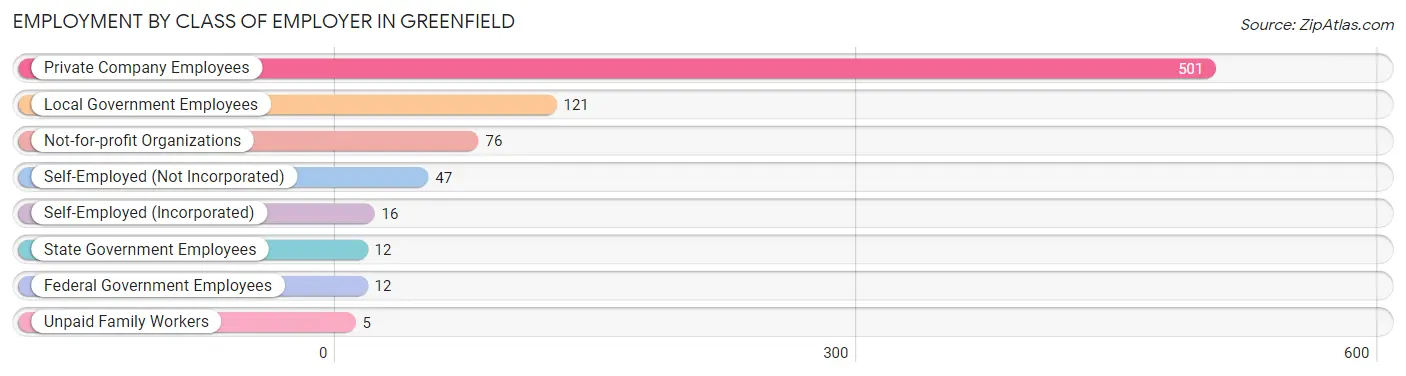
Among the 790 employed individuals in Greenfield, private company employees (501 | 63.4%), local government employees (121 | 15.3%), and not-for-profit organizations (76 | 9.6%) make up the most common classes of employment.
| Employer Class | # Employees | % Employees |
| Private Company Employees | 501 | 63.4% |
| Self-Employed (Incorporated) | 16 | 2.0% |
| Self-Employed (Not Incorporated) | 47 | 5.9% |
| Not-for-profit Organizations | 76 | 9.6% |
| Local Government Employees | 121 | 15.3% |
| State Government Employees | 12 | 1.5% |
| Federal Government Employees | 12 | 1.5% |
| Unpaid Family Workers | 5 | 0.6% |
| Total | 790 | 100.0% |
Employment Status by Age in Greenfield
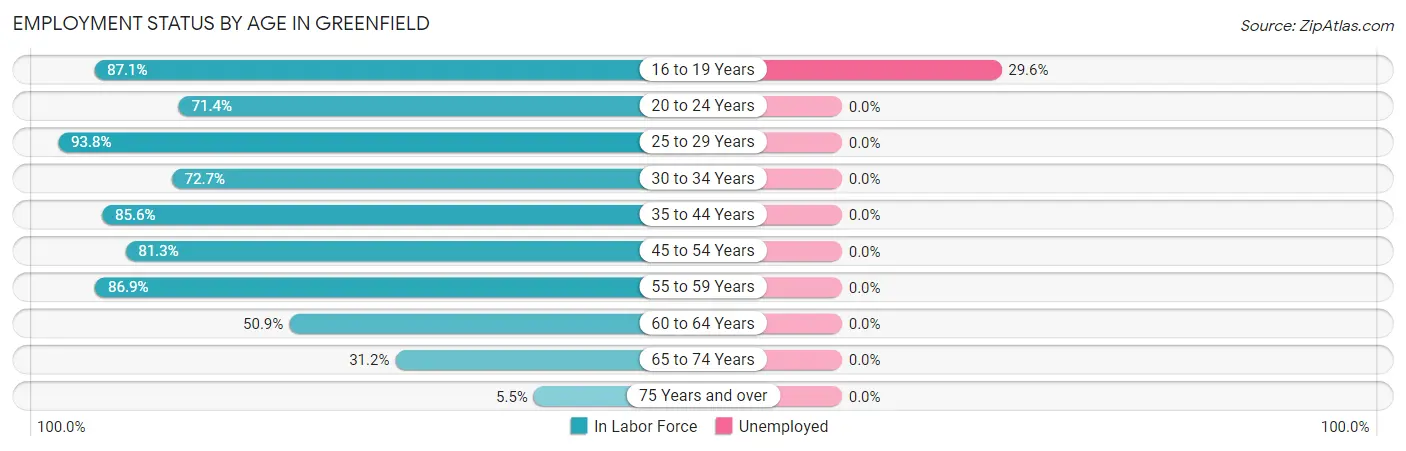
According to the labor force statistics for Greenfield, out of the total population over 16 years of age (1,483), 55.8% or 828 individuals are in the labor force, with 2.9% or 24 of them unemployed. The age group with the highest labor force participation rate is 25 to 29 years, with 93.8% or 75 individuals in the labor force. Within the labor force, the 16 to 19 years age range has the highest percentage of unemployed individuals, with 29.6% or 24 of them being unemployed.
| Age Bracket | In Labor Force | Unemployed |
| 16 to 19 Years | 81 (87.1%) | 24 (29.6%) |
| 20 to 24 Years | 55 (71.4%) | 0 (0.0%) |
| 25 to 29 Years | 75 (93.8%) | 0 (0.0%) |
| 30 to 34 Years | 88 (72.7%) | 0 (0.0%) |
| 35 to 44 Years | 107 (85.6%) | 0 (0.0%) |
| 45 to 54 Years | 152 (81.3%) | 0 (0.0%) |
| 55 to 59 Years | 93 (86.9%) | 0 (0.0%) |
| 60 to 64 Years | 88 (50.9%) | 0 (0.0%) |
| 65 to 74 Years | 72 (31.2%) | 0 (0.0%) |
| 75 Years and over | 16 (5.5%) | 0 (0.0%) |
| Total | 828 (55.8%) | 24 (2.9%) |
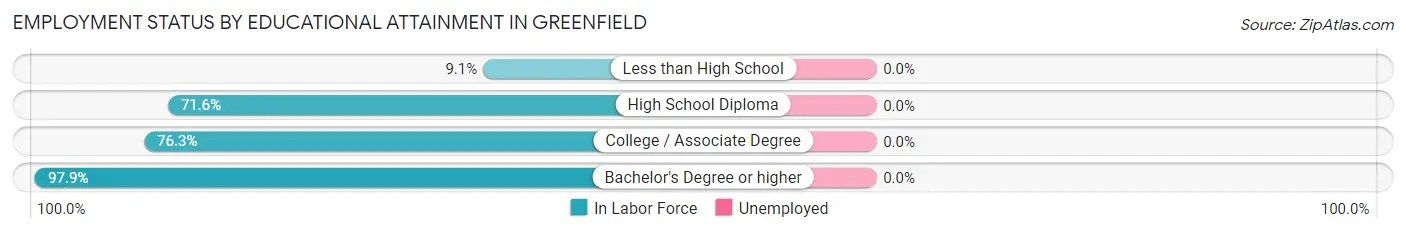
Employment Status by Educational Attainment in Greenfield
| Educational Attainment | In Labor Force | Unemployed |
| Less than High School | 4 (9.1%) | 0 (0.0%) |
| High School Diploma | 199 (71.6%) | 0 (0.0%) |
| College / Associate Degree | 216 (76.3%) | 0 (0.0%) |
| Bachelor's Degree or higher | 184 (97.9%) | 0 (0.0%) |
| Total | 603 (76.0%) | 0 (0.0%) |
Employment Occupations by Sex in Greenfield
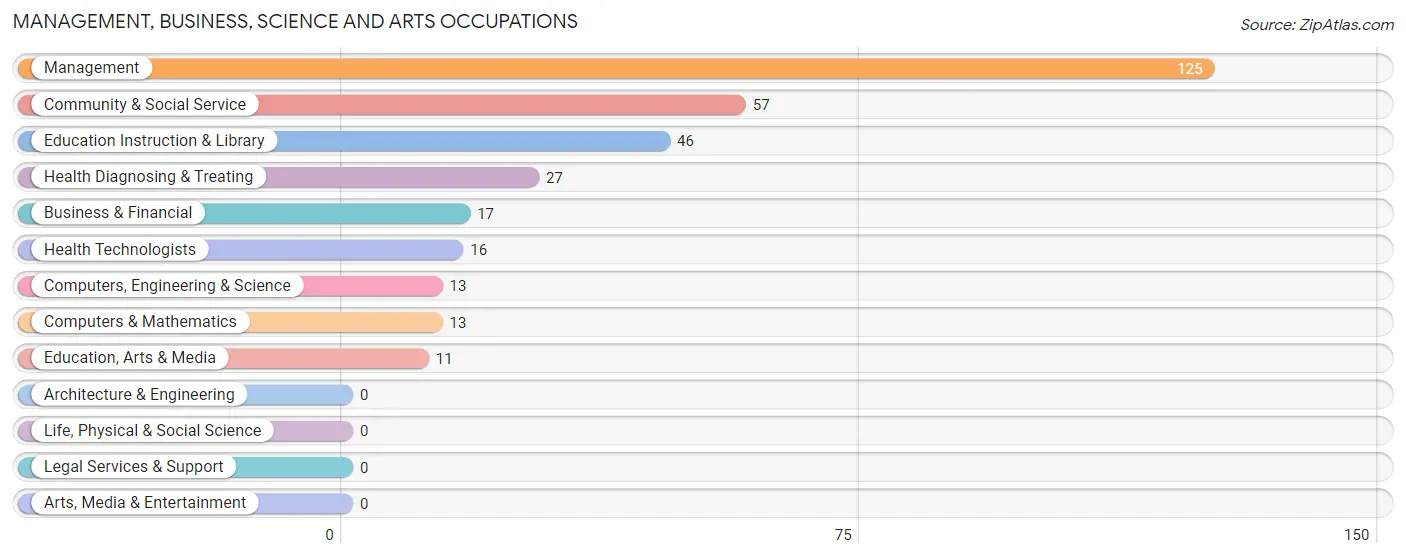
Management, Business, Science and Arts Occupations
The most common Management, Business, Science and Arts occupations in Greenfield are Management (125 | 15.6%), Community & Social Service (57 | 7.1%), Education Instruction & Library (46 | 5.7%), Health Diagnosing & Treating (27 | 3.4%), and Business & Financial (17 | 2.1%).
Management, Business, Science and Arts Occupations by Sex
Within the Management, Business, Science and Arts occupations in Greenfield, the most male-oriented occupations are Computers, Engineering & Science (100.0%), Computers & Mathematics (100.0%), and Business & Financial (70.6%), while the most female-oriented occupations are Health Technologists (81.2%), Education Instruction & Library (73.9%), and Health Diagnosing & Treating (70.4%).
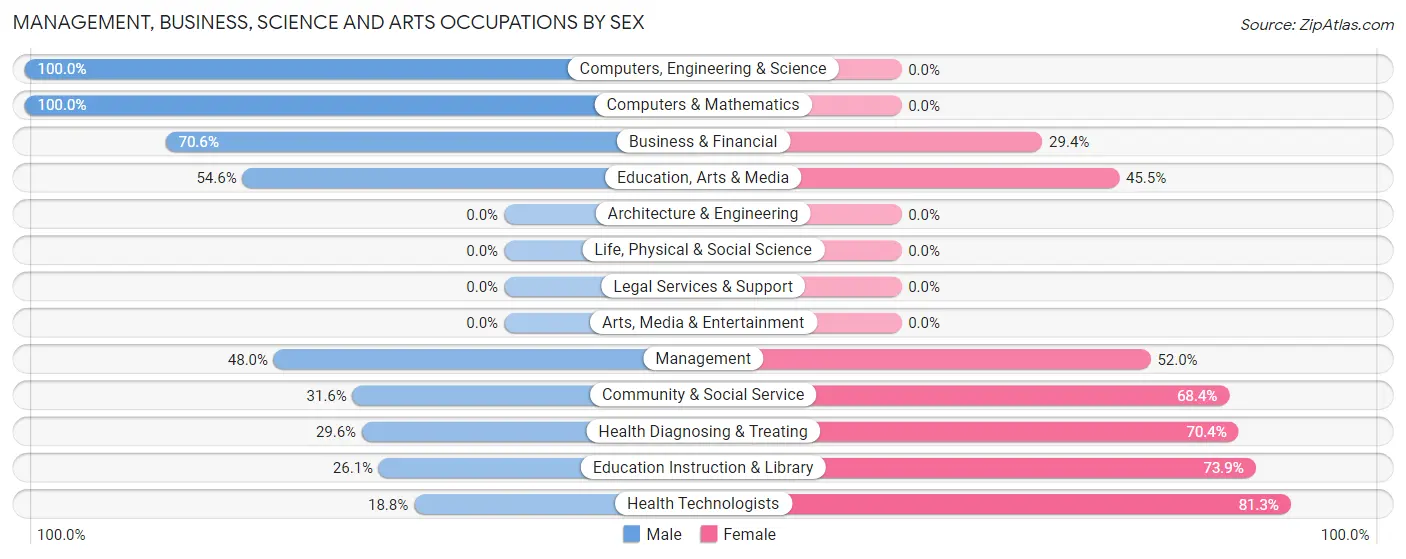
| Occupation | Male | Female |
| Management | 60 (48.0%) | 65 (52.0%) |
| Business & Financial | 12 (70.6%) | 5 (29.4%) |
| Computers, Engineering & Science | 13 (100.0%) | 0 (0.0%) |
| Computers & Mathematics | 13 (100.0%) | 0 (0.0%) |
| Architecture & Engineering | 0 (0.0%) | 0 (0.0%) |
| Life, Physical & Social Science | 0 (0.0%) | 0 (0.0%) |
| Community & Social Service | 18 (31.6%) | 39 (68.4%) |
| Education, Arts & Media | 6 (54.5%) | 5 (45.5%) |
| Legal Services & Support | 0 (0.0%) | 0 (0.0%) |
| Education Instruction & Library | 12 (26.1%) | 34 (73.9%) |
| Arts, Media & Entertainment | 0 (0.0%) | 0 (0.0%) |
| Health Diagnosing & Treating | 8 (29.6%) | 19 (70.4%) |
| Health Technologists | 3 (18.8%) | 13 (81.2%) |
| Total (Category) | 111 (46.4%) | 128 (53.6%) |
| Total (Overall) | 424 (52.8%) | 379 (47.2%) |
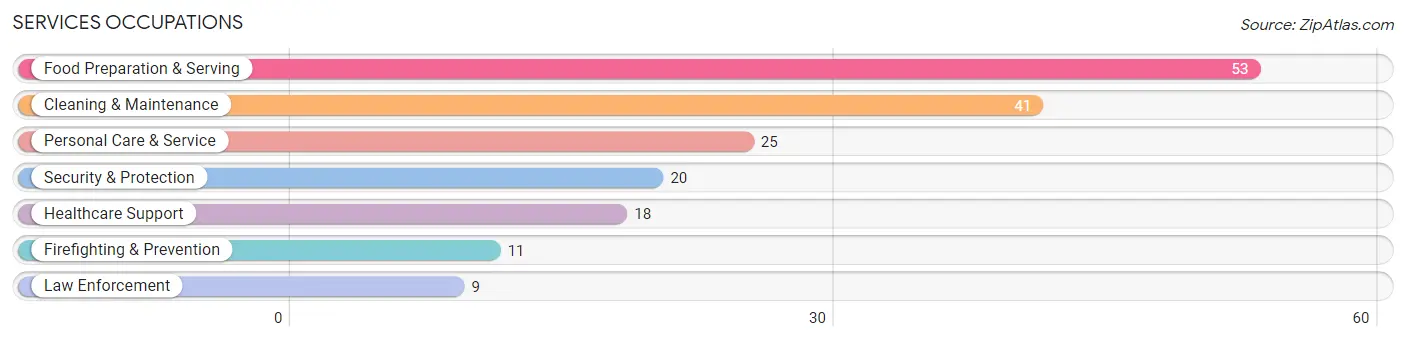
Services Occupations
The most common Services occupations in Greenfield are Food Preparation & Serving (53 | 6.6%), Cleaning & Maintenance (41 | 5.1%), Personal Care & Service (25 | 3.1%), Security & Protection (20 | 2.5%), and Healthcare Support (18 | 2.2%).
Services Occupations by Sex
Within the Services occupations in Greenfield, the most male-oriented occupations are Security & Protection (100.0%), Firefighting & Prevention (100.0%), and Law Enforcement (100.0%), while the most female-oriented occupations are Healthcare Support (100.0%), Food Preparation & Serving (90.6%), and Personal Care & Service (60.0%).
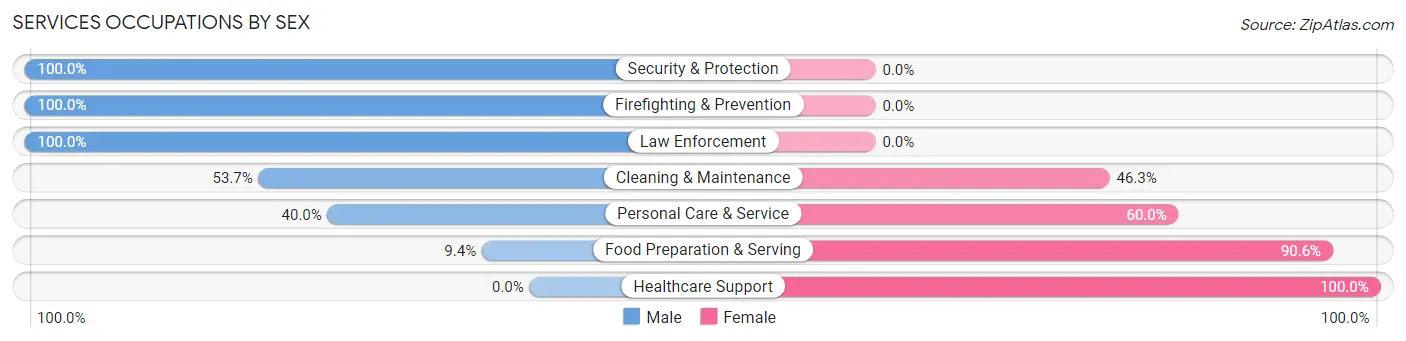
| Occupation | Male | Female |
| Healthcare Support | 0 (0.0%) | 18 (100.0%) |
| Security & Protection | 20 (100.0%) | 0 (0.0%) |
| Firefighting & Prevention | 11 (100.0%) | 0 (0.0%) |
| Law Enforcement | 9 (100.0%) | 0 (0.0%) |
| Food Preparation & Serving | 5 (9.4%) | 48 (90.6%) |
| Cleaning & Maintenance | 22 (53.7%) | 19 (46.3%) |
| Personal Care & Service | 10 (40.0%) | 15 (60.0%) |
| Total (Category) | 57 (36.3%) | 100 (63.7%) |
| Total (Overall) | 424 (52.8%) | 379 (47.2%) |
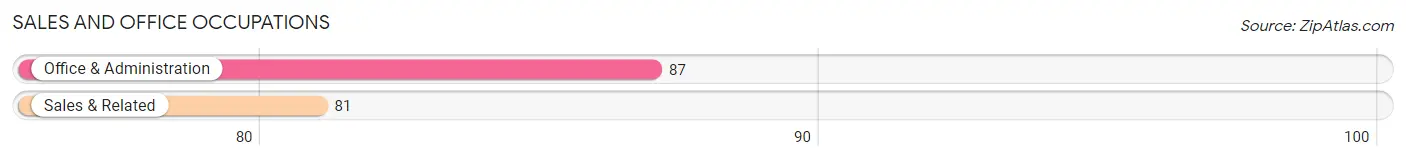
Sales and Office Occupations
The most common Sales and Office occupations in Greenfield are Office & Administration (87 | 10.8%), and Sales & Related (81 | 10.1%).
Sales and Office Occupations by Sex
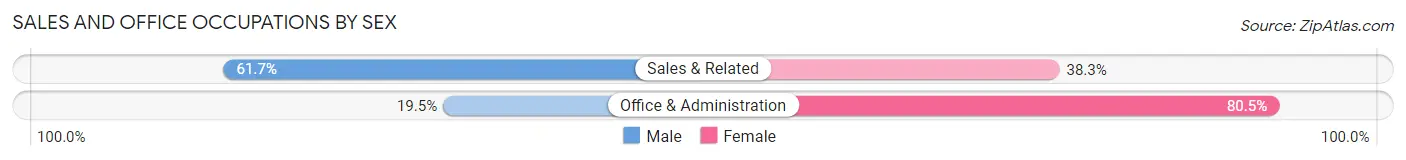
| Occupation | Male | Female |
| Sales & Related | 50 (61.7%) | 31 (38.3%) |
| Office & Administration | 17 (19.5%) | 70 (80.5%) |
| Total (Category) | 67 (39.9%) | 101 (60.1%) |
| Total (Overall) | 424 (52.8%) | 379 (47.2%) |
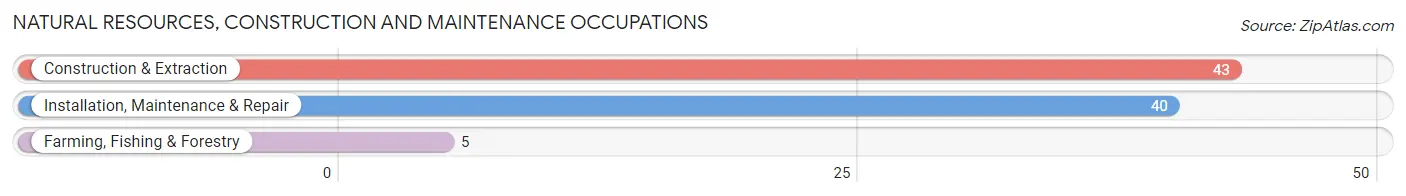
Natural Resources, Construction and Maintenance Occupations
The most common Natural Resources, Construction and Maintenance occupations in Greenfield are Construction & Extraction (43 | 5.3%), Installation, Maintenance & Repair (40 | 5.0%), and Farming, Fishing & Forestry (5 | 0.6%).
Natural Resources, Construction and Maintenance Occupations by Sex
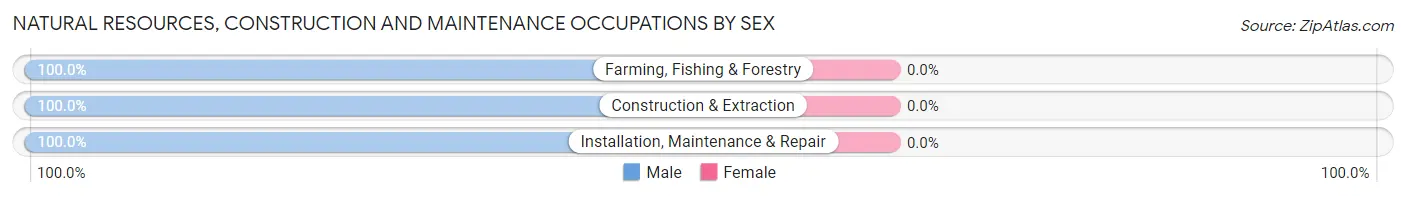
| Occupation | Male | Female |
| Farming, Fishing & Forestry | 5 (100.0%) | 0 (0.0%) |
| Construction & Extraction | 43 (100.0%) | 0 (0.0%) |
| Installation, Maintenance & Repair | 40 (100.0%) | 0 (0.0%) |
| Total (Category) | 88 (100.0%) | 0 (0.0%) |
| Total (Overall) | 424 (52.8%) | 379 (47.2%) |
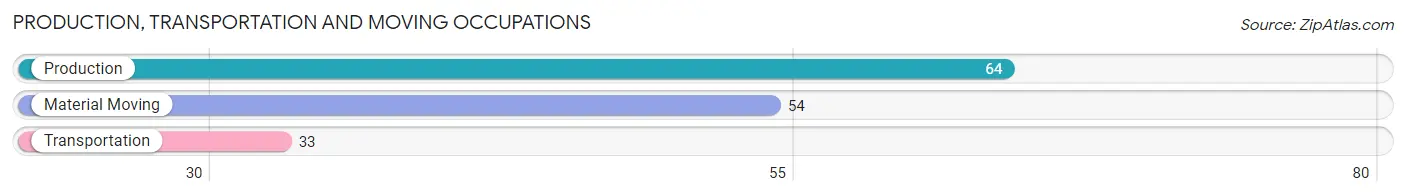
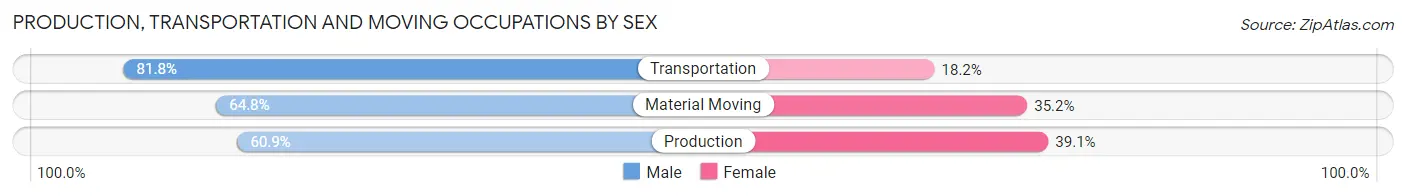
Production, Transportation and Moving Occupations
The most common Production, Transportation and Moving occupations in Greenfield are Production (64 | 8.0%), Material Moving (54 | 6.7%), and Transportation (33 | 4.1%).
Production, Transportation and Moving Occupations by Sex
| Occupation | Male | Female |
| Production | 39 (60.9%) | 25 (39.1%) |
| Transportation | 27 (81.8%) | 6 (18.2%) |
| Material Moving | 35 (64.8%) | 19 (35.2%) |
| Total (Category) | 101 (66.9%) | 50 (33.1%) |
| Total (Overall) | 424 (52.8%) | 379 (47.2%) |
Employment Industries by Sex in Greenfield
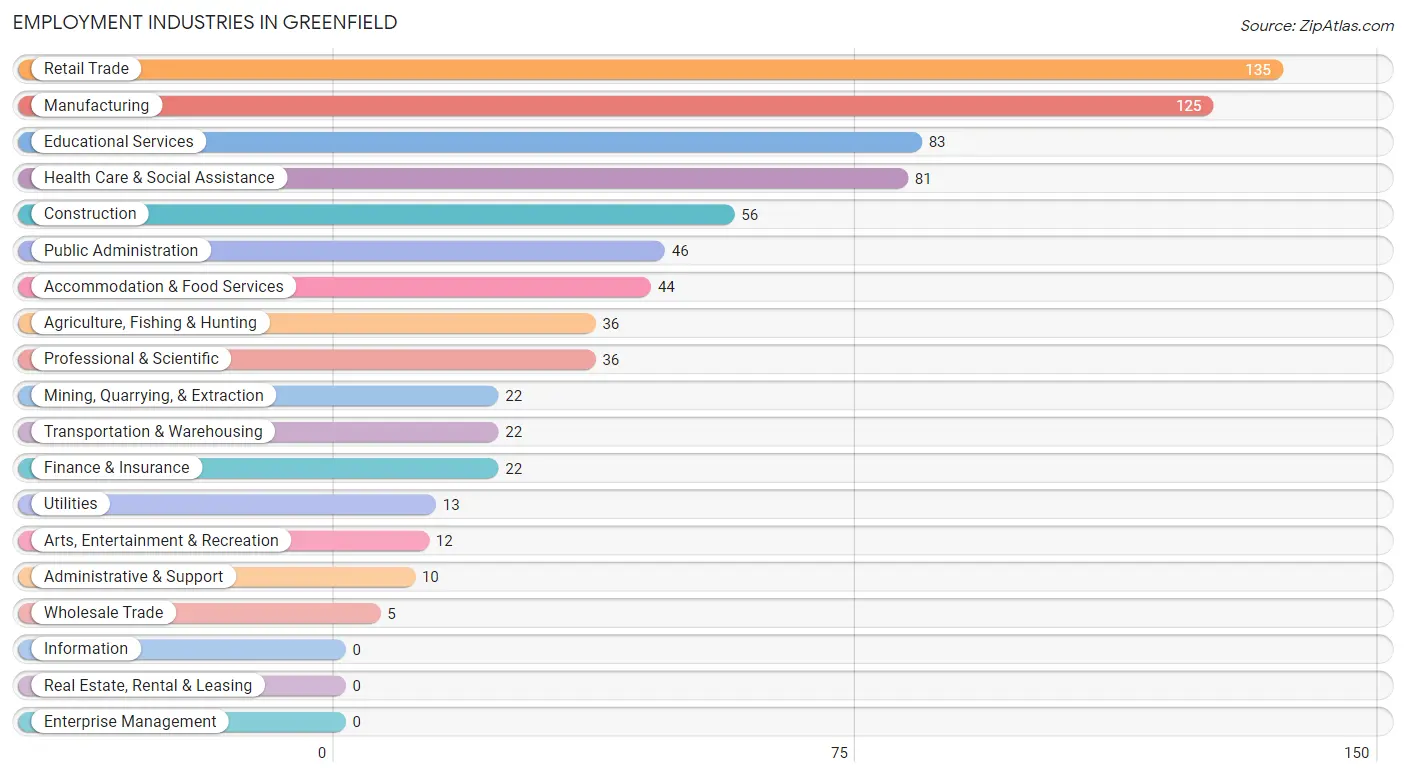
Employment Industries in Greenfield
The major employment industries in Greenfield include Retail Trade (135 | 16.8%), Manufacturing (125 | 15.6%), Educational Services (83 | 10.3%), Health Care & Social Assistance (81 | 10.1%), and Construction (56 | 7.0%).
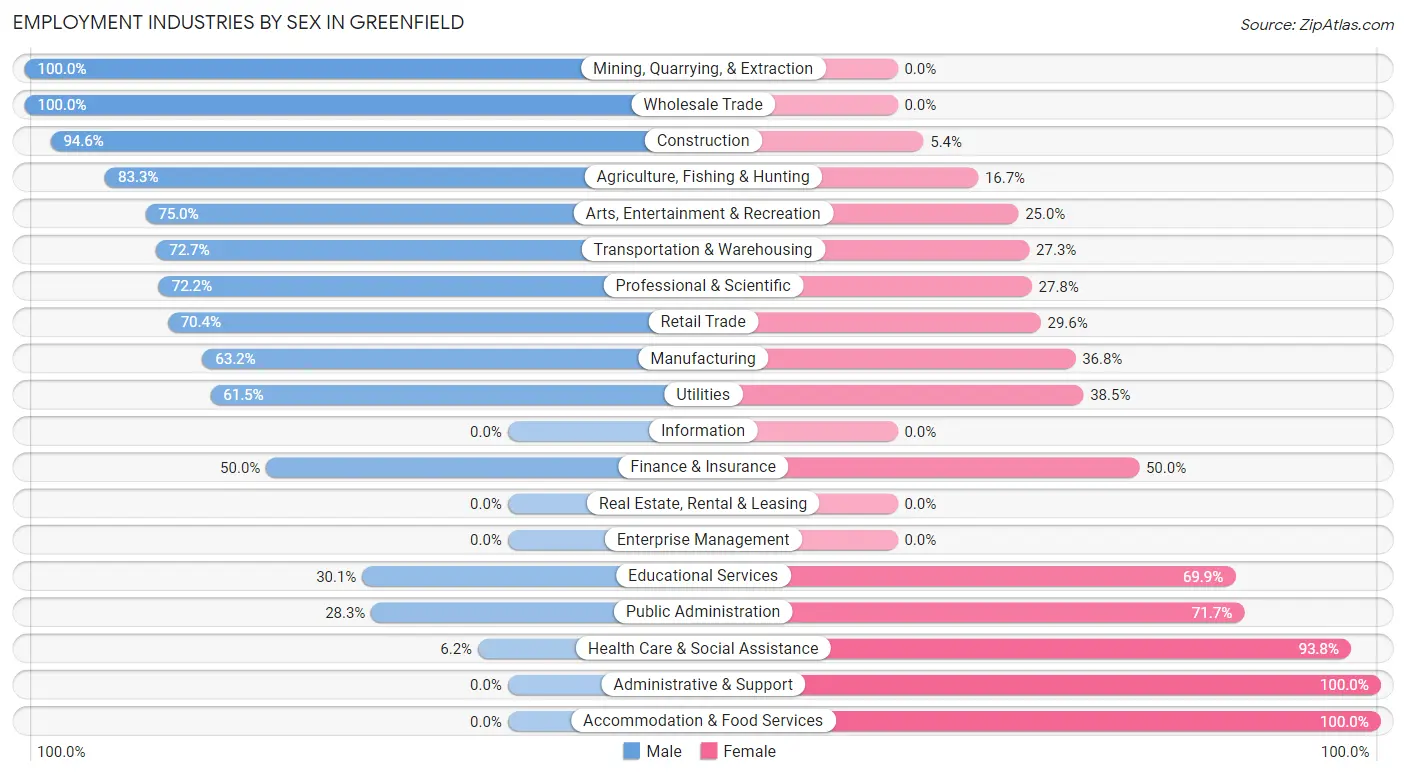
Employment Industries by Sex in Greenfield
The Greenfield industries that see more men than women are Mining, Quarrying, & Extraction (100.0%), Wholesale Trade (100.0%), and Construction (94.6%), whereas the industries that tend to have a higher number of women are Administrative & Support (100.0%), Accommodation & Food Services (100.0%), and Health Care & Social Assistance (93.8%).
| Industry | Male | Female |
| Agriculture, Fishing & Hunting | 30 (83.3%) | 6 (16.7%) |
| Mining, Quarrying, & Extraction | 22 (100.0%) | 0 (0.0%) |
| Construction | 53 (94.6%) | 3 (5.4%) |
| Manufacturing | 79 (63.2%) | 46 (36.8%) |
| Wholesale Trade | 5 (100.0%) | 0 (0.0%) |
| Retail Trade | 95 (70.4%) | 40 (29.6%) |
| Transportation & Warehousing | 16 (72.7%) | 6 (27.3%) |
| Utilities | 8 (61.5%) | 5 (38.5%) |
| Information | 0 (0.0%) | 0 (0.0%) |
| Finance & Insurance | 11 (50.0%) | 11 (50.0%) |
| Real Estate, Rental & Leasing | 0 (0.0%) | 0 (0.0%) |
| Professional & Scientific | 26 (72.2%) | 10 (27.8%) |
| Enterprise Management | 0 (0.0%) | 0 (0.0%) |
| Administrative & Support | 0 (0.0%) | 10 (100.0%) |
| Educational Services | 25 (30.1%) | 58 (69.9%) |
| Health Care & Social Assistance | 5 (6.2%) | 76 (93.8%) |
| Arts, Entertainment & Recreation | 9 (75.0%) | 3 (25.0%) |
| Accommodation & Food Services | 0 (0.0%) | 44 (100.0%) |
| Public Administration | 13 (28.3%) | 33 (71.7%) |
| Total | 424 (52.8%) | 379 (47.2%) |
Education in Greenfield
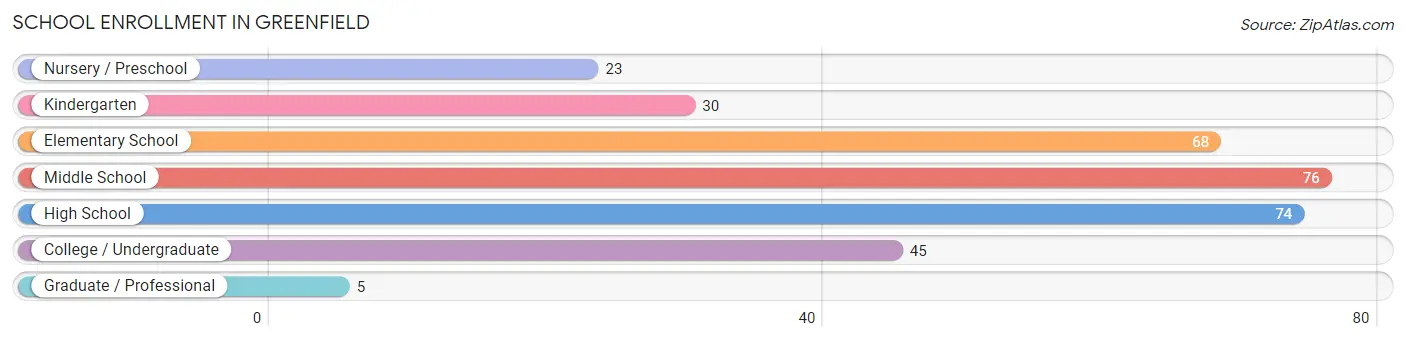
School Enrollment in Greenfield
The most common levels of schooling among the 321 students in Greenfield are middle school (76 | 23.7%), high school (74 | 23.1%), and elementary school (68 | 21.2%).
| School Level | # Students | % Students |
| Nursery / Preschool | 23 | 7.2% |
| Kindergarten | 30 | 9.3% |
| Elementary School | 68 | 21.2% |
| Middle School | 76 | 23.7% |
| High School | 74 | 23.1% |
| College / Undergraduate | 45 | 14.0% |
| Graduate / Professional | 5 | 1.6% |
| Total | 321 | 100.0% |
School Enrollment by Age by Funding Source in Greenfield
Out of a total of 321 students who are enrolled in schools in Greenfield, 18 (5.6%) attend a private institution, while the remaining 303 (94.4%) are enrolled in public schools. The age group of 25 to 34 year olds has the highest likelihood of being enrolled in private schools, with 7 (50.0% in the age bracket) enrolled. Conversely, the age group of 3 to 4 year olds has the lowest likelihood of being enrolled in a private school, with 11 (100.0% in the age bracket) attending a public institution.
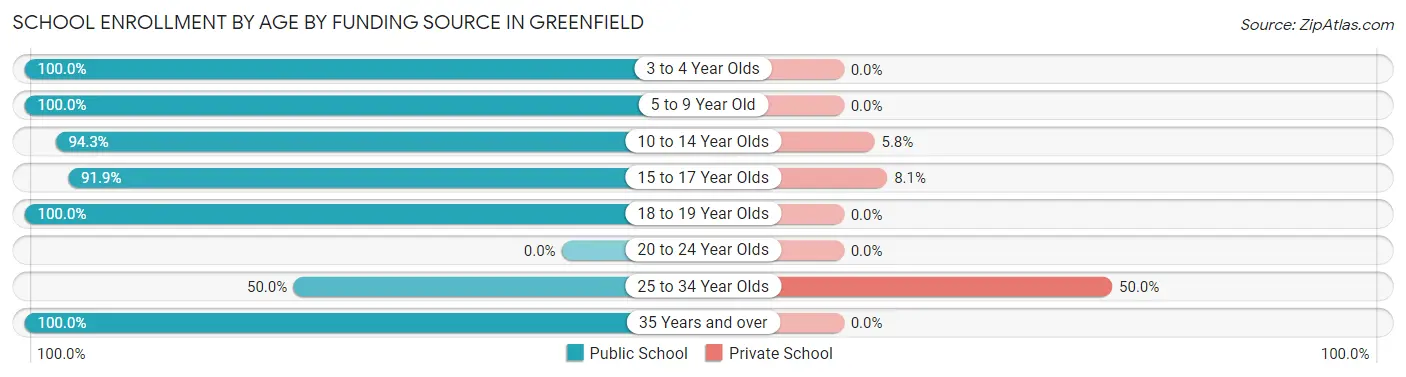
| Age Bracket | Public School | Private School |
| 3 to 4 Year Olds | 11 (100.0%) | 0 (0.0%) |
| 5 to 9 Year Old | 99 (100.0%) | 0 (0.0%) |
| 10 to 14 Year Olds | 82 (94.3%) | 5 (5.8%) |
| 15 to 17 Year Olds | 68 (91.9%) | 6 (8.1%) |
| 18 to 19 Year Olds | 28 (100.0%) | 0 (0.0%) |
| 20 to 24 Year Olds | 0 (0.0%) | 0 (0.0%) |
| 25 to 34 Year Olds | 7 (50.0%) | 7 (50.0%) |
| 35 Years and over | 8 (100.0%) | 0 (0.0%) |
| Total | 303 (94.4%) | 18 (5.6%) |
Educational Attainment by Field of Study in Greenfield
Education (103 | 36.3%), business (68 | 23.9%), bio, nature & agricultural (36 | 12.7%), psychology (16 | 5.6%), and science & technology (15 | 5.3%) are the most common fields of study among 284 individuals in Greenfield who have obtained a bachelor's degree or higher.
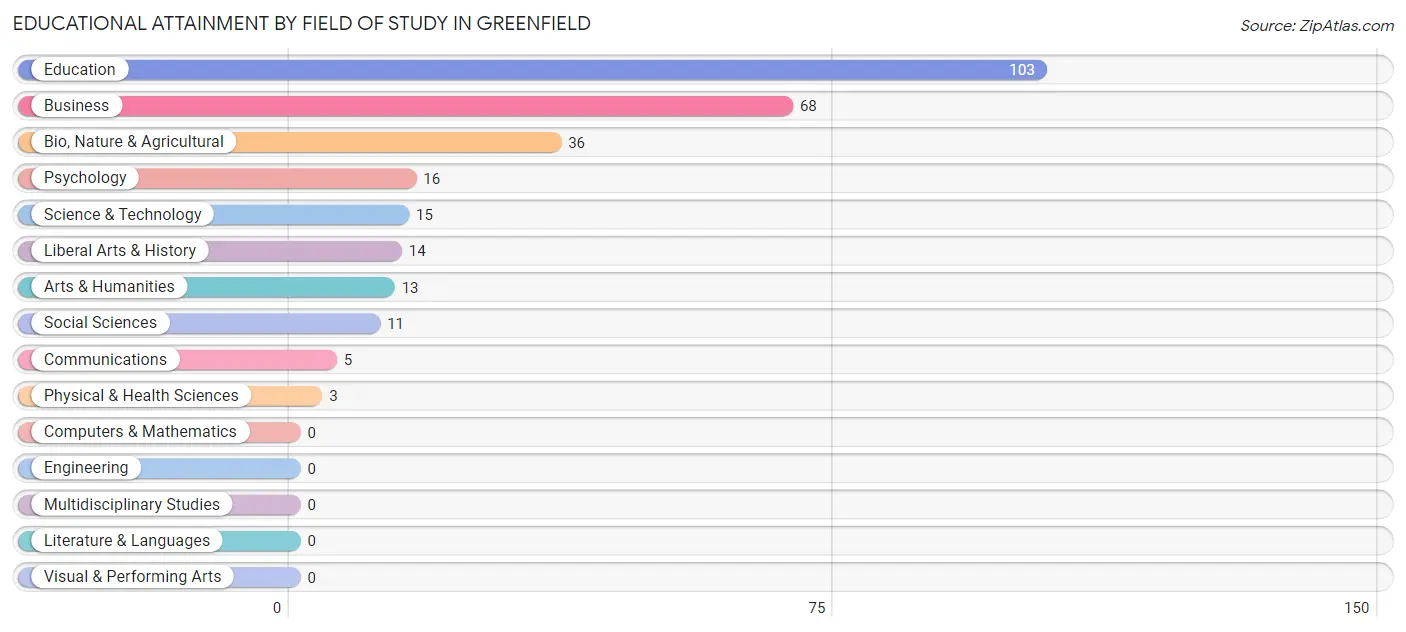
| Field of Study | # Graduates | % Graduates |
| Computers & Mathematics | 0 | 0.0% |
| Bio, Nature & Agricultural | 36 | 12.7% |
| Physical & Health Sciences | 3 | 1.1% |
| Psychology | 16 | 5.6% |
| Social Sciences | 11 | 3.9% |
| Engineering | 0 | 0.0% |
| Multidisciplinary Studies | 0 | 0.0% |
| Science & Technology | 15 | 5.3% |
| Business | 68 | 23.9% |
| Education | 103 | 36.3% |
| Literature & Languages | 0 | 0.0% |
| Liberal Arts & History | 14 | 4.9% |
| Visual & Performing Arts | 0 | 0.0% |
| Communications | 5 | 1.8% |
| Arts & Humanities | 13 | 4.6% |
| Total | 284 | 100.0% |
Transportation & Commute in Greenfield
Vehicle Availability by Sex in Greenfield
The most prevalent vehicle ownership categories in Greenfield are males with 2 vehicles (159, accounting for 38.1%) and females with 2 vehicles (121, making up 42.6%).
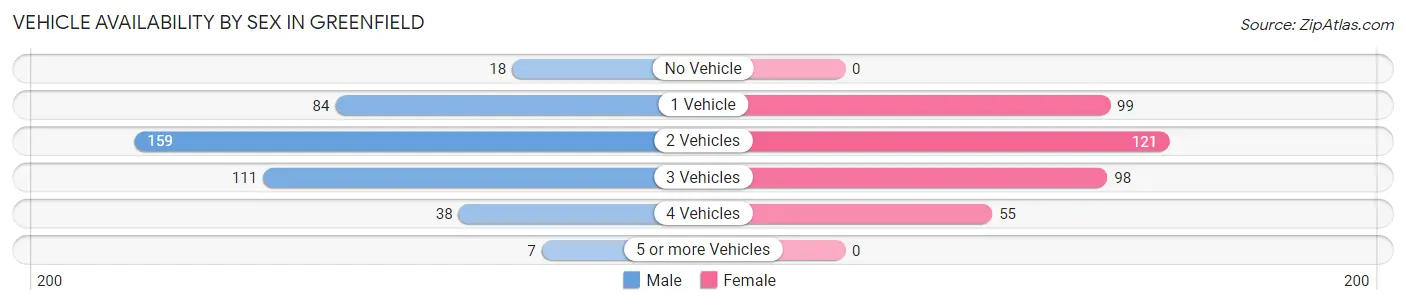
| Vehicles Available | Male | Female |
| No Vehicle | 18 (4.3%) | 0 (0.0%) |
| 1 Vehicle | 84 (20.1%) | 99 (26.5%) |
| 2 Vehicles | 159 (38.1%) | 121 (32.4%) |
| 3 Vehicles | 111 (26.6%) | 98 (26.3%) |
| 4 Vehicles | 38 (9.1%) | 55 (14.7%) |
| 5 or more Vehicles | 7 (1.7%) | 0 (0.0%) |
| Total | 417 (100.0%) | 373 (100.0%) |
Commute Time in Greenfield
The most frequently occuring commute durations in Greenfield are 5 to 9 minutes (245 commuters, 31.3%), less than 5 minutes (142 commuters, 18.2%), and 30 to 34 minutes (82 commuters, 10.5%).
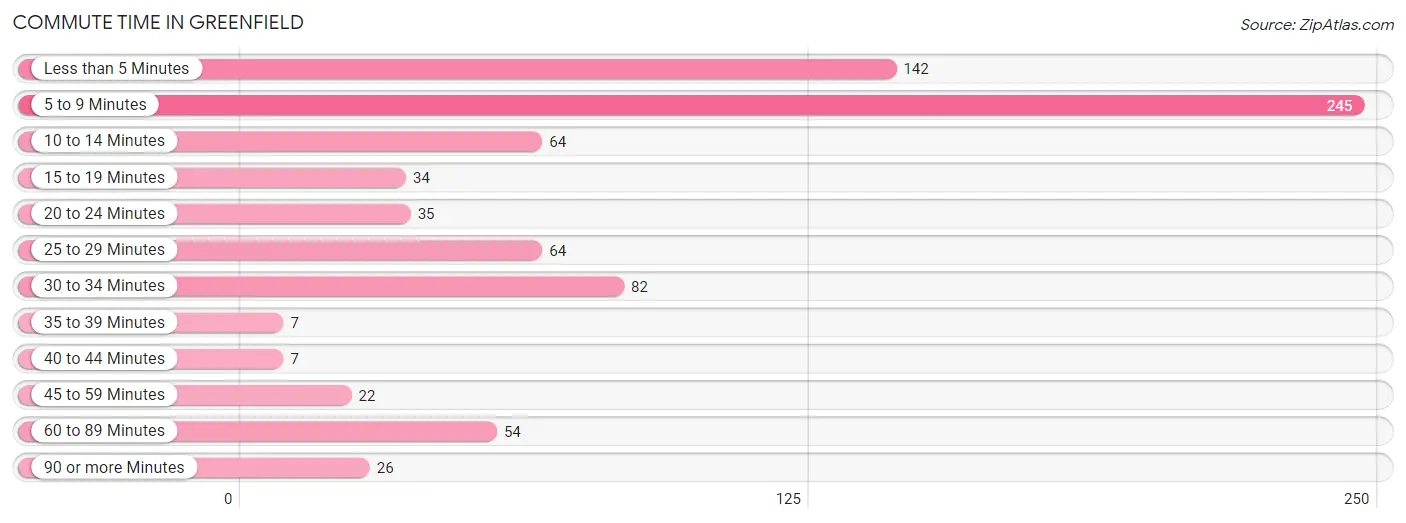
| Commute Time | # Commuters | % Commuters |
| Less than 5 Minutes | 142 | 18.2% |
| 5 to 9 Minutes | 245 | 31.3% |
| 10 to 14 Minutes | 64 | 8.2% |
| 15 to 19 Minutes | 34 | 4.3% |
| 20 to 24 Minutes | 35 | 4.5% |
| 25 to 29 Minutes | 64 | 8.2% |
| 30 to 34 Minutes | 82 | 10.5% |
| 35 to 39 Minutes | 7 | 0.9% |
| 40 to 44 Minutes | 7 | 0.9% |
| 45 to 59 Minutes | 22 | 2.8% |
| 60 to 89 Minutes | 54 | 6.9% |
| 90 or more Minutes | 26 | 3.3% |
Commute Time by Sex in Greenfield
The most common commute times in Greenfield are 5 to 9 minutes (133 commuters, 31.9%) for males and 5 to 9 minutes (112 commuters, 30.7%) for females.
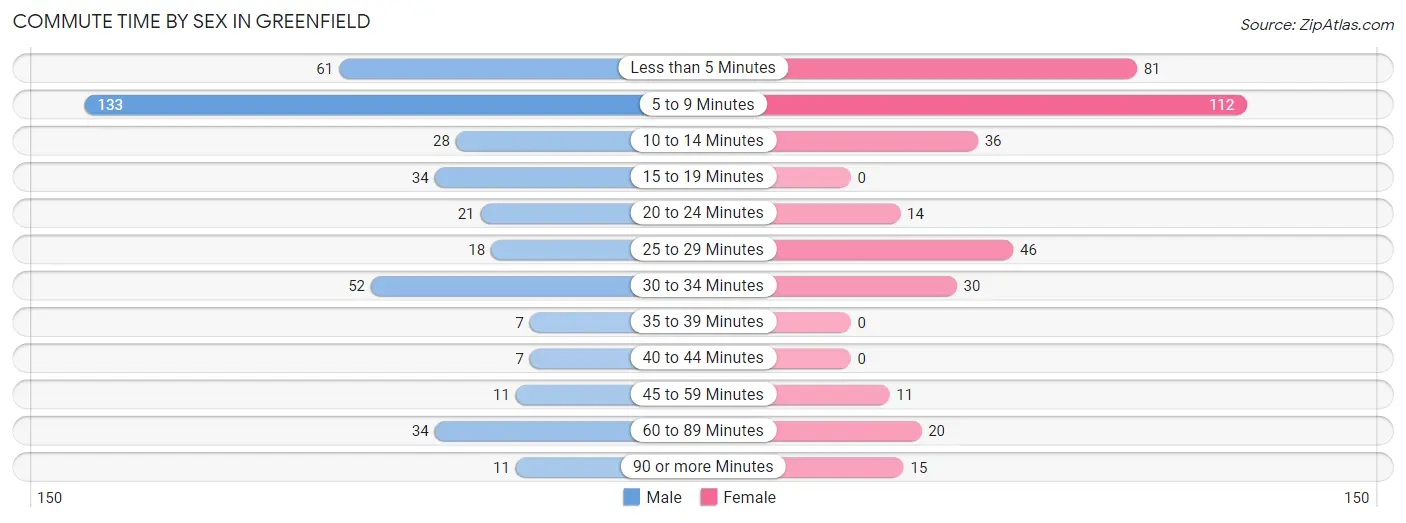
| Commute Time | Male | Female |
| Less than 5 Minutes | 61 (14.6%) | 81 (22.2%) |
| 5 to 9 Minutes | 133 (31.9%) | 112 (30.7%) |
| 10 to 14 Minutes | 28 (6.7%) | 36 (9.9%) |
| 15 to 19 Minutes | 34 (8.2%) | 0 (0.0%) |
| 20 to 24 Minutes | 21 (5.0%) | 14 (3.8%) |
| 25 to 29 Minutes | 18 (4.3%) | 46 (12.6%) |
| 30 to 34 Minutes | 52 (12.5%) | 30 (8.2%) |
| 35 to 39 Minutes | 7 (1.7%) | 0 (0.0%) |
| 40 to 44 Minutes | 7 (1.7%) | 0 (0.0%) |
| 45 to 59 Minutes | 11 (2.6%) | 11 (3.0%) |
| 60 to 89 Minutes | 34 (8.2%) | 20 (5.5%) |
| 90 or more Minutes | 11 (2.6%) | 15 (4.1%) |
Time of Departure to Work by Sex in Greenfield
The most frequent times of departure to work in Greenfield are 6:30 AM to 6:59 AM (80, 19.2%) for males and 7:30 AM to 7:59 AM (63, 17.3%) for females.
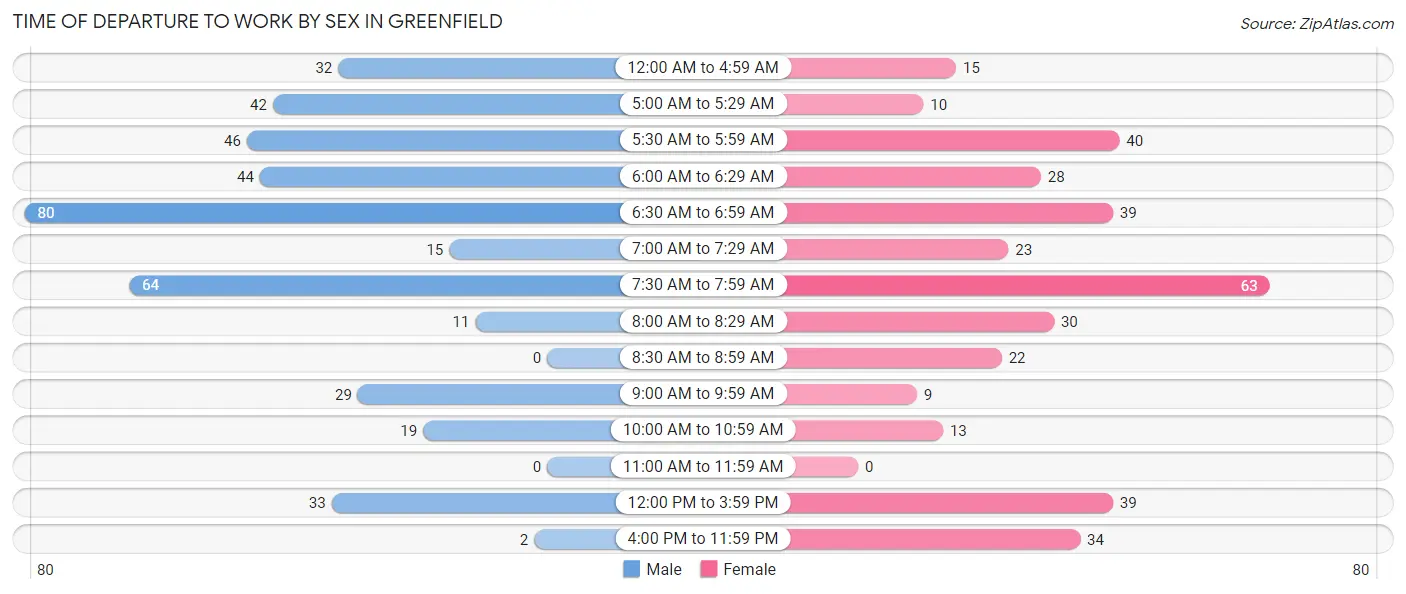
| Time of Departure | Male | Female |
| 12:00 AM to 4:59 AM | 32 (7.7%) | 15 (4.1%) |
| 5:00 AM to 5:29 AM | 42 (10.1%) | 10 (2.7%) |
| 5:30 AM to 5:59 AM | 46 (11.0%) | 40 (11.0%) |
| 6:00 AM to 6:29 AM | 44 (10.5%) | 28 (7.7%) |
| 6:30 AM to 6:59 AM | 80 (19.2%) | 39 (10.7%) |
| 7:00 AM to 7:29 AM | 15 (3.6%) | 23 (6.3%) |
| 7:30 AM to 7:59 AM | 64 (15.3%) | 63 (17.3%) |
| 8:00 AM to 8:29 AM | 11 (2.6%) | 30 (8.2%) |
| 8:30 AM to 8:59 AM | 0 (0.0%) | 22 (6.0%) |
| 9:00 AM to 9:59 AM | 29 (7.0%) | 9 (2.5%) |
| 10:00 AM to 10:59 AM | 19 (4.6%) | 13 (3.6%) |
| 11:00 AM to 11:59 AM | 0 (0.0%) | 0 (0.0%) |
| 12:00 PM to 3:59 PM | 33 (7.9%) | 39 (10.7%) |
| 4:00 PM to 11:59 PM | 2 (0.5%) | 34 (9.3%) |
| Total | 417 (100.0%) | 365 (100.0%) |
Housing Occupancy in Greenfield
Occupancy by Ownership in Greenfield
Of the total 883 dwellings in Greenfield, owner-occupied units account for 518 (58.7%), while renter-occupied units make up 365 (41.3%).
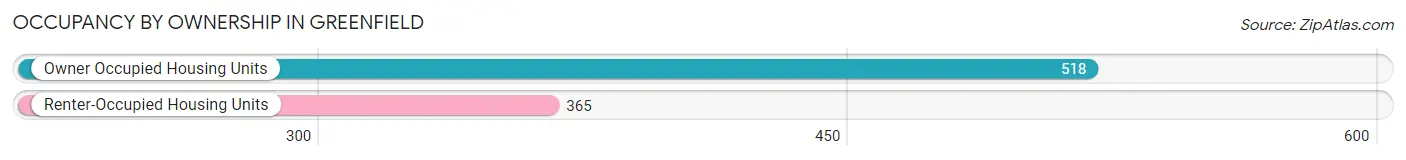
| Occupancy | # Housing Units | % Housing Units |
| Owner Occupied Housing Units | 518 | 58.7% |
| Renter-Occupied Housing Units | 365 | 41.3% |
| Total Occupied Housing Units | 883 | 100.0% |
Occupancy by Household Size in Greenfield
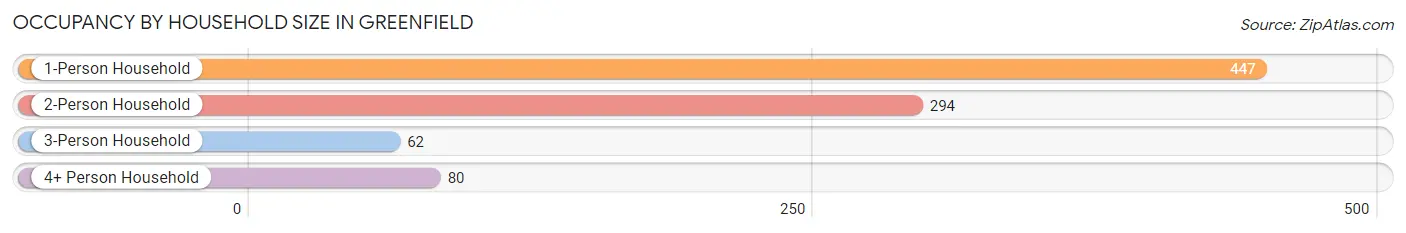
| Household Size | # Housing Units | % Housing Units |
| 1-Person Household | 447 | 50.6% |
| 2-Person Household | 294 | 33.3% |
| 3-Person Household | 62 | 7.0% |
| 4+ Person Household | 80 | 9.1% |
| Total Housing Units | 883 | 100.0% |
Occupancy by Ownership by Household Size in Greenfield
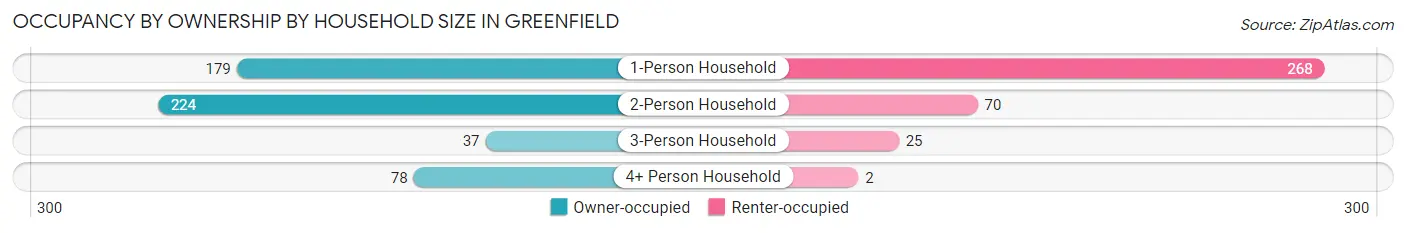
| Household Size | Owner-occupied | Renter-occupied |
| 1-Person Household | 179 (40.0%) | 268 (60.0%) |
| 2-Person Household | 224 (76.2%) | 70 (23.8%) |
| 3-Person Household | 37 (59.7%) | 25 (40.3%) |
| 4+ Person Household | 78 (97.5%) | 2 (2.5%) |
| Total Housing Units | 518 (58.7%) | 365 (41.3%) |
Occupancy by Educational Attainment in Greenfield
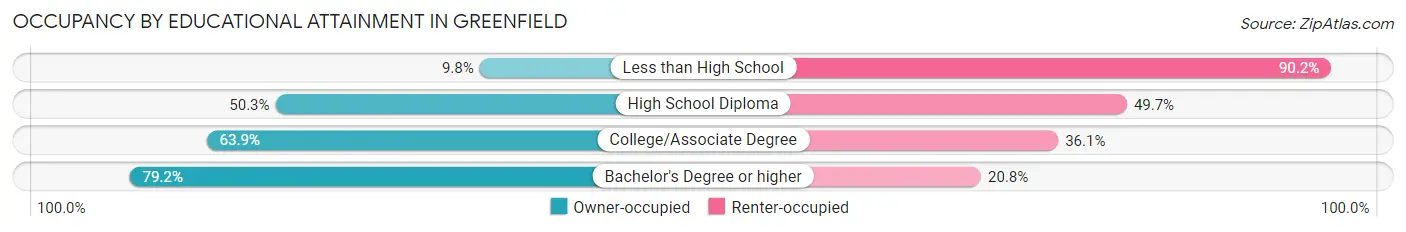
| Household Size | Owner-occupied | Renter-occupied |
| Less than High School | 5 (9.8%) | 46 (90.2%) |
| High School Diploma | 180 (50.3%) | 178 (49.7%) |
| College/Associate Degree | 177 (63.9%) | 100 (36.1%) |
| Bachelor's Degree or higher | 156 (79.2%) | 41 (20.8%) |
Occupancy by Age of Householder in Greenfield
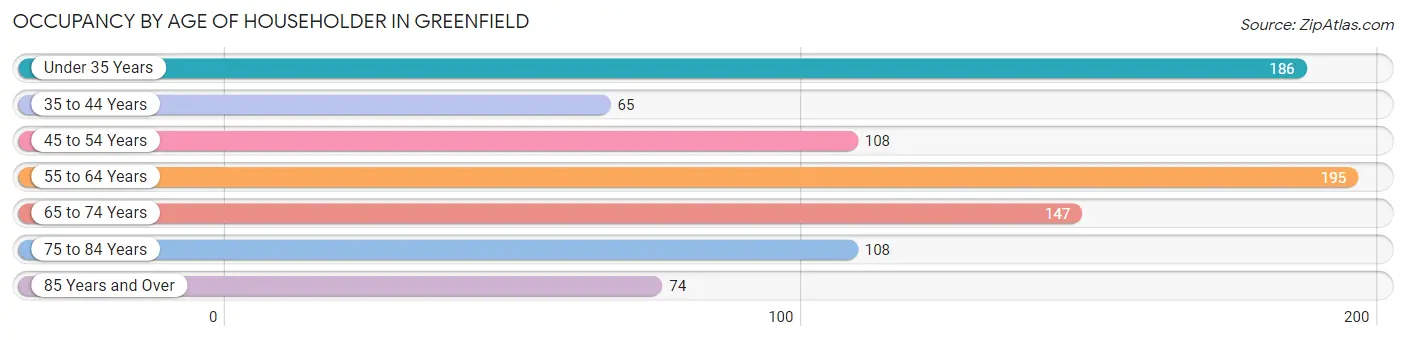
| Age Bracket | # Households | % Households |
| Under 35 Years | 186 | 21.1% |
| 35 to 44 Years | 65 | 7.4% |
| 45 to 54 Years | 108 | 12.2% |
| 55 to 64 Years | 195 | 22.1% |
| 65 to 74 Years | 147 | 16.7% |
| 75 to 84 Years | 108 | 12.2% |
| 85 Years and Over | 74 | 8.4% |
| Total | 883 | 100.0% |
Housing Finances in Greenfield
Median Income by Occupancy in Greenfield
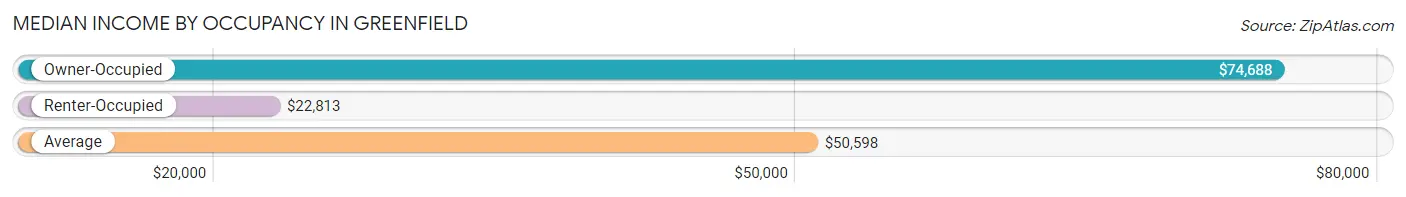
| Occupancy Type | # Households | Median Income |
| Owner-Occupied | 518 (58.7%) | $74,688 |
| Renter-Occupied | 365 (41.3%) | $22,813 |
| Average | 883 (100.0%) | $50,598 |
Occupancy by Householder Income Bracket in Greenfield
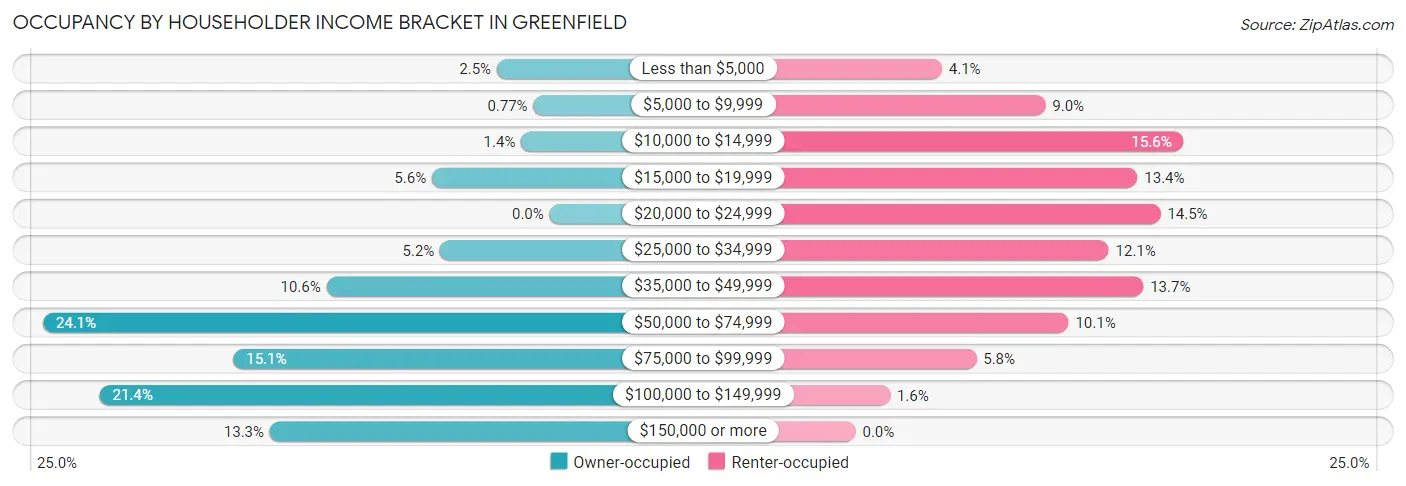
| Income Bracket | Owner-occupied | Renter-occupied |
| Less than $5,000 | 13 (2.5%) | 15 (4.1%) |
| $5,000 to $9,999 | 4 (0.8%) | 33 (9.0%) |
| $10,000 to $14,999 | 7 (1.3%) | 57 (15.6%) |
| $15,000 to $19,999 | 29 (5.6%) | 49 (13.4%) |
| $20,000 to $24,999 | 0 (0.0%) | 53 (14.5%) |
| $25,000 to $34,999 | 27 (5.2%) | 44 (12.0%) |
| $35,000 to $49,999 | 55 (10.6%) | 50 (13.7%) |
| $50,000 to $74,999 | 125 (24.1%) | 37 (10.1%) |
| $75,000 to $99,999 | 78 (15.1%) | 21 (5.8%) |
| $100,000 to $149,999 | 111 (21.4%) | 6 (1.6%) |
| $150,000 or more | 69 (13.3%) | 0 (0.0%) |
| Total | 518 (100.0%) | 365 (100.0%) |
Monthly Housing Cost Tiers in Greenfield
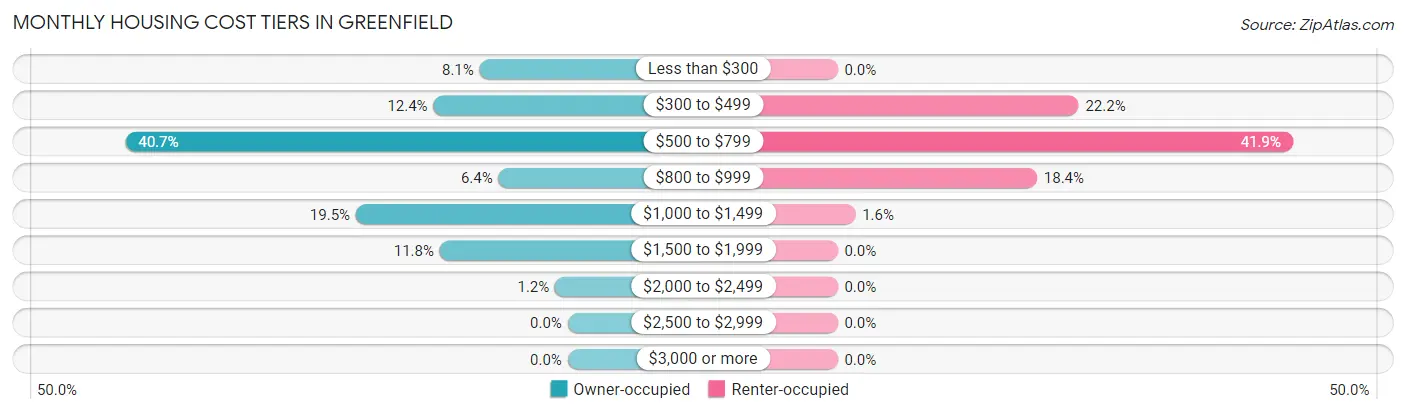
| Monthly Cost | Owner-occupied | Renter-occupied |
| Less than $300 | 42 (8.1%) | 0 (0.0%) |
| $300 to $499 | 64 (12.4%) | 81 (22.2%) |
| $500 to $799 | 211 (40.7%) | 153 (41.9%) |
| $800 to $999 | 33 (6.4%) | 67 (18.4%) |
| $1,000 to $1,499 | 101 (19.5%) | 6 (1.6%) |
| $1,500 to $1,999 | 61 (11.8%) | 0 (0.0%) |
| $2,000 to $2,499 | 6 (1.2%) | 0 (0.0%) |
| $2,500 to $2,999 | 0 (0.0%) | 0 (0.0%) |
| $3,000 or more | 0 (0.0%) | 0 (0.0%) |
| Total | 518 (100.0%) | 365 (100.0%) |
Physical Housing Characteristics in Greenfield
Housing Structures in Greenfield
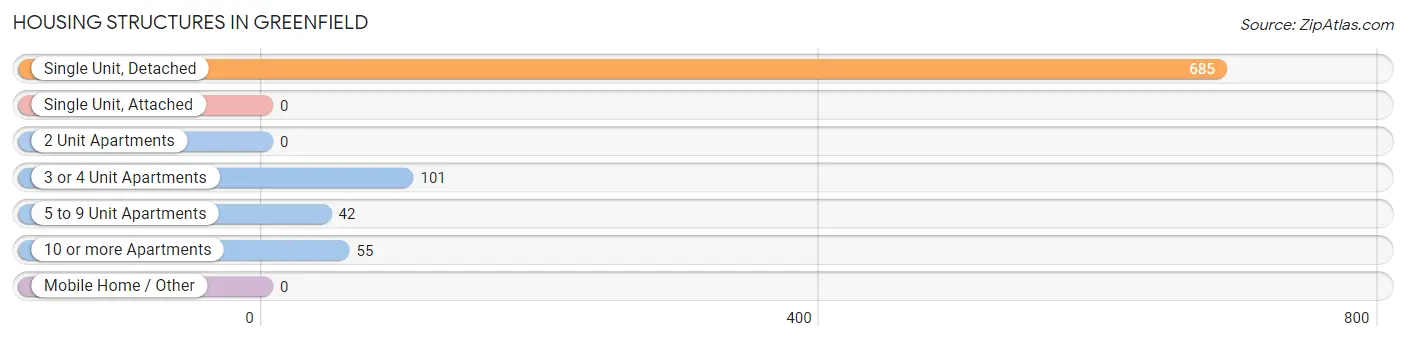
| Structure Type | # Housing Units | % Housing Units |
| Single Unit, Detached | 685 | 77.6% |
| Single Unit, Attached | 0 | 0.0% |
| 2 Unit Apartments | 0 | 0.0% |
| 3 or 4 Unit Apartments | 101 | 11.4% |
| 5 to 9 Unit Apartments | 42 | 4.8% |
| 10 or more Apartments | 55 | 6.2% |
| Mobile Home / Other | 0 | 0.0% |
| Total | 883 | 100.0% |
Housing Structures by Occupancy in Greenfield
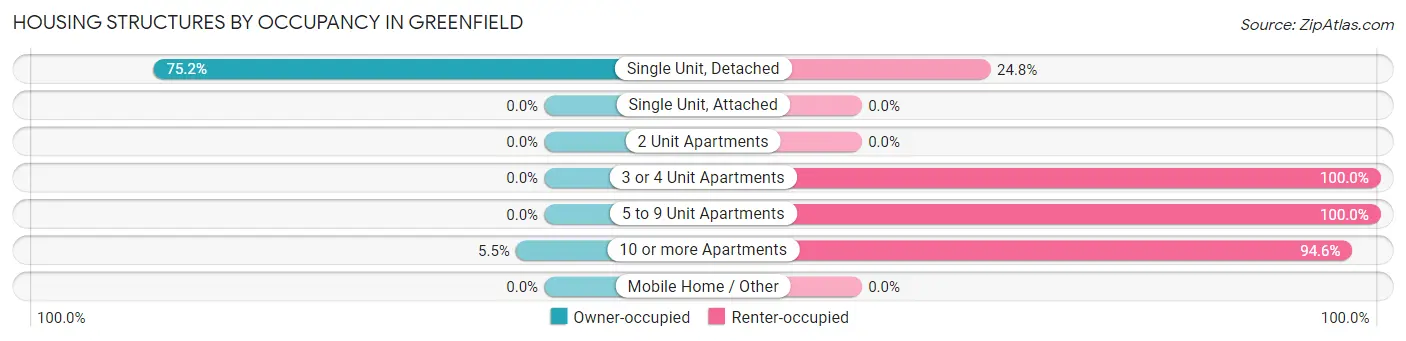
| Structure Type | Owner-occupied | Renter-occupied |
| Single Unit, Detached | 515 (75.2%) | 170 (24.8%) |
| Single Unit, Attached | 0 (0.0%) | 0 (0.0%) |
| 2 Unit Apartments | 0 (0.0%) | 0 (0.0%) |
| 3 or 4 Unit Apartments | 0 (0.0%) | 101 (100.0%) |
| 5 to 9 Unit Apartments | 0 (0.0%) | 42 (100.0%) |
| 10 or more Apartments | 3 (5.4%) | 52 (94.6%) |
| Mobile Home / Other | 0 (0.0%) | 0 (0.0%) |
| Total | 518 (58.7%) | 365 (41.3%) |
Housing Structures by Number of Rooms in Greenfield
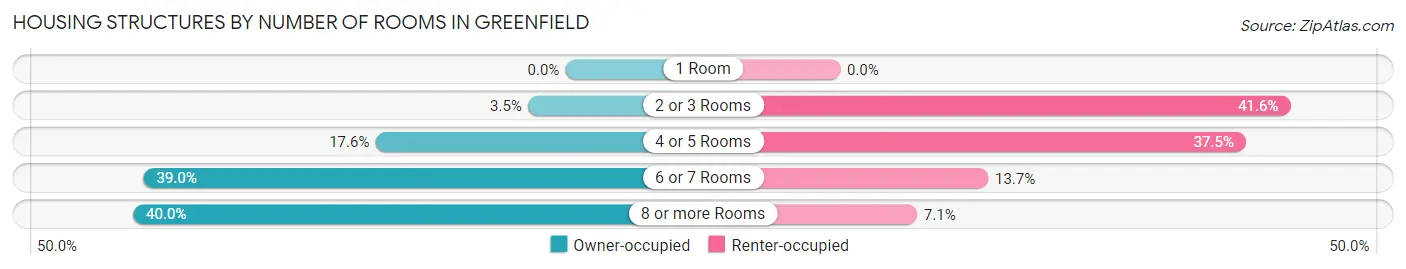
| Number of Rooms | Owner-occupied | Renter-occupied |
| 1 Room | 0 (0.0%) | 0 (0.0%) |
| 2 or 3 Rooms | 18 (3.5%) | 152 (41.6%) |
| 4 or 5 Rooms | 91 (17.6%) | 137 (37.5%) |
| 6 or 7 Rooms | 202 (39.0%) | 50 (13.7%) |
| 8 or more Rooms | 207 (40.0%) | 26 (7.1%) |
| Total | 518 (100.0%) | 365 (100.0%) |
Housing Structure by Heating Type in Greenfield
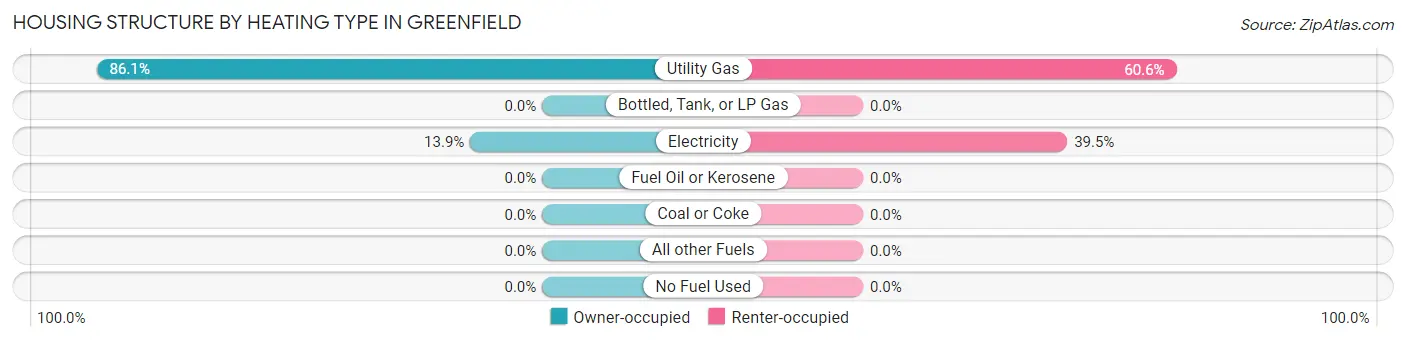
| Heating Type | Owner-occupied | Renter-occupied |
| Utility Gas | 446 (86.1%) | 221 (60.6%) |
| Bottled, Tank, or LP Gas | 0 (0.0%) | 0 (0.0%) |
| Electricity | 72 (13.9%) | 144 (39.5%) |
| Fuel Oil or Kerosene | 0 (0.0%) | 0 (0.0%) |
| Coal or Coke | 0 (0.0%) | 0 (0.0%) |
| All other Fuels | 0 (0.0%) | 0 (0.0%) |
| No Fuel Used | 0 (0.0%) | 0 (0.0%) |
| Total | 518 (100.0%) | 365 (100.0%) |
Household Vehicle Usage in Greenfield
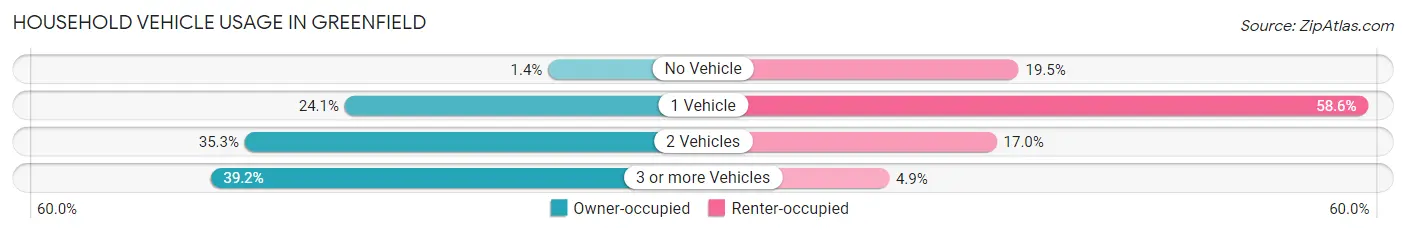
| Vehicles per Household | Owner-occupied | Renter-occupied |
| No Vehicle | 7 (1.3%) | 71 (19.5%) |
| 1 Vehicle | 125 (24.1%) | 214 (58.6%) |
| 2 Vehicles | 183 (35.3%) | 62 (17.0%) |
| 3 or more Vehicles | 203 (39.2%) | 18 (4.9%) |
| Total | 518 (100.0%) | 365 (100.0%) |
Real Estate & Mortgages in Greenfield
Real Estate and Mortgage Overview in Greenfield
| Characteristic | Without Mortgage | With Mortgage |
| Housing Units | 288 | 230 |
| Median Property Value | $107,100 | $134,900 |
| Median Household Income | $60,000 | $52 |
| Monthly Housing Costs | $539 | $0 |
| Real Estate Taxes | $1,856 | $9 |
Property Value by Mortgage Status in Greenfield
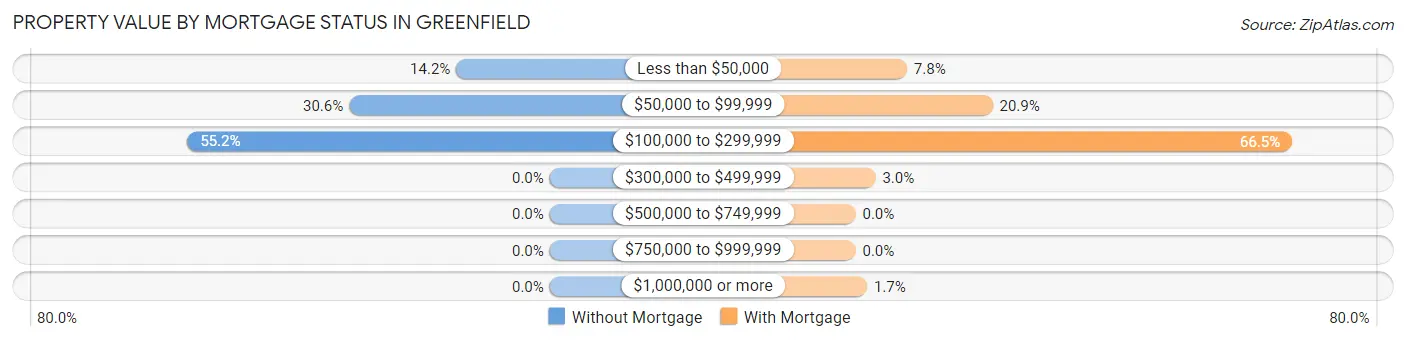
| Property Value | Without Mortgage | With Mortgage |
| Less than $50,000 | 41 (14.2%) | 18 (7.8%) |
| $50,000 to $99,999 | 88 (30.6%) | 48 (20.9%) |
| $100,000 to $299,999 | 159 (55.2%) | 153 (66.5%) |
| $300,000 to $499,999 | 0 (0.0%) | 7 (3.0%) |
| $500,000 to $749,999 | 0 (0.0%) | 0 (0.0%) |
| $750,000 to $999,999 | 0 (0.0%) | 0 (0.0%) |
| $1,000,000 or more | 0 (0.0%) | 4 (1.7%) |
| Total | 288 (100.0%) | 230 (100.0%) |
Household Income by Mortgage Status in Greenfield
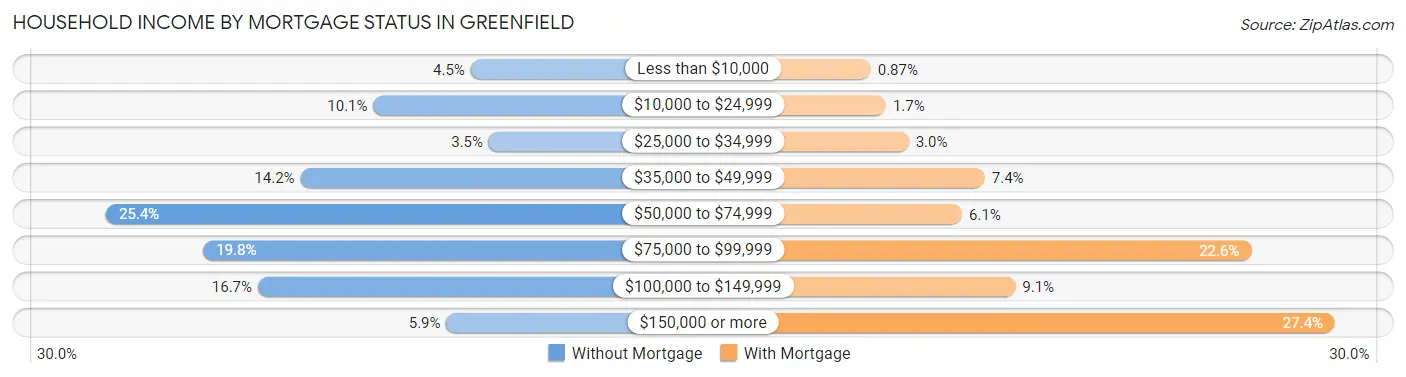
| Household Income | Without Mortgage | With Mortgage |
| Less than $10,000 | 13 (4.5%) | 2 (0.9%) |
| $10,000 to $24,999 | 29 (10.1%) | 4 (1.7%) |
| $25,000 to $34,999 | 10 (3.5%) | 7 (3.0%) |
| $35,000 to $49,999 | 41 (14.2%) | 17 (7.4%) |
| $50,000 to $74,999 | 73 (25.4%) | 14 (6.1%) |
| $75,000 to $99,999 | 57 (19.8%) | 52 (22.6%) |
| $100,000 to $149,999 | 48 (16.7%) | 21 (9.1%) |
| $150,000 or more | 17 (5.9%) | 63 (27.4%) |
| Total | 288 (100.0%) | 230 (100.0%) |
Property Value to Household Income Ratio in Greenfield
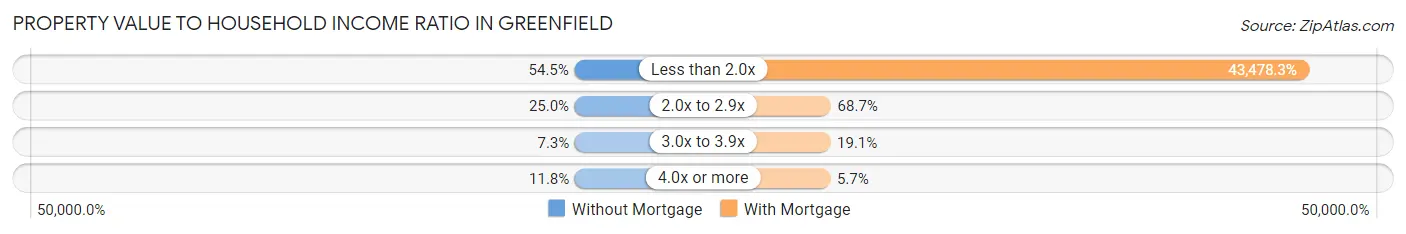
| Value-to-Income Ratio | Without Mortgage | With Mortgage |
| Less than 2.0x | 157 (54.5%) | 100,000 (43,478.3%) |
| 2.0x to 2.9x | 72 (25.0%) | 158 (68.7%) |
| 3.0x to 3.9x | 21 (7.3%) | 44 (19.1%) |
| 4.0x or more | 34 (11.8%) | 13 (5.7%) |
| Total | 288 (100.0%) | 230 (100.0%) |
Real Estate Taxes by Mortgage Status in Greenfield
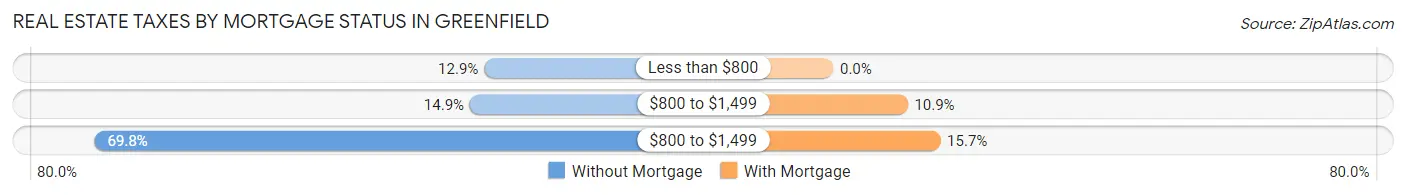
| Property Taxes | Without Mortgage | With Mortgage |
| Less than $800 | 37 (12.9%) | 0 (0.0%) |
| $800 to $1,499 | 43 (14.9%) | 25 (10.9%) |
| $800 to $1,499 | 201 (69.8%) | 36 (15.7%) |
| Total | 288 (100.0%) | 230 (100.0%) |
Health & Disability in Greenfield
Health Insurance Coverage by Age in Greenfield
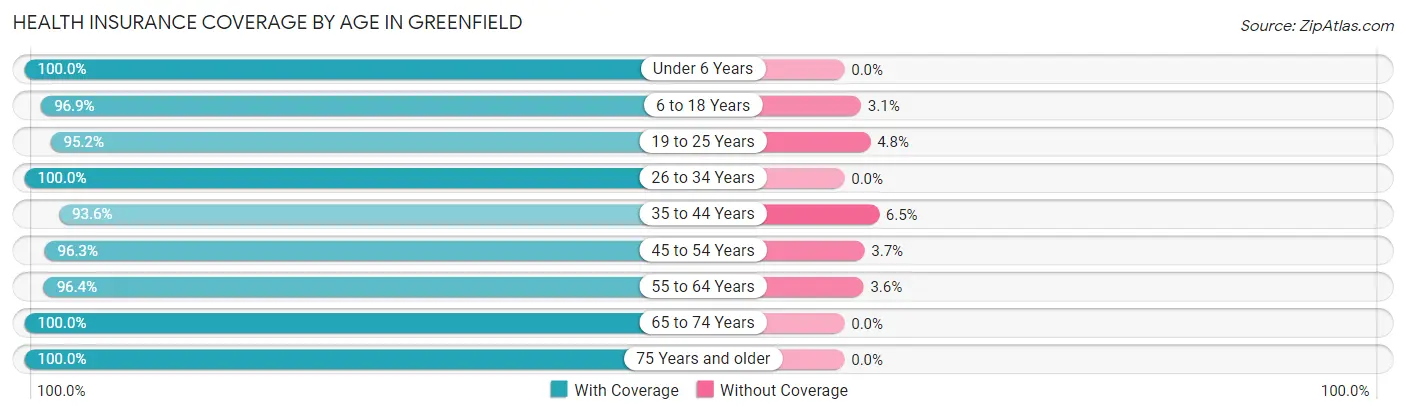
| Age Bracket | With Coverage | Without Coverage |
| Under 6 Years | 96 (100.0%) | 0 (0.0%) |
| 6 to 18 Years | 250 (96.9%) | 8 (3.1%) |
| 19 to 25 Years | 118 (95.2%) | 6 (4.8%) |
| 26 to 34 Years | 181 (100.0%) | 0 (0.0%) |
| 35 to 44 Years | 116 (93.5%) | 8 (6.5%) |
| 45 to 54 Years | 180 (96.3%) | 7 (3.7%) |
| 55 to 64 Years | 270 (96.4%) | 10 (3.6%) |
| 65 to 74 Years | 224 (100.0%) | 0 (0.0%) |
| 75 Years and older | 249 (100.0%) | 0 (0.0%) |
| Total | 1,684 (97.7%) | 39 (2.3%) |
Health Insurance Coverage by Citizenship Status in Greenfield
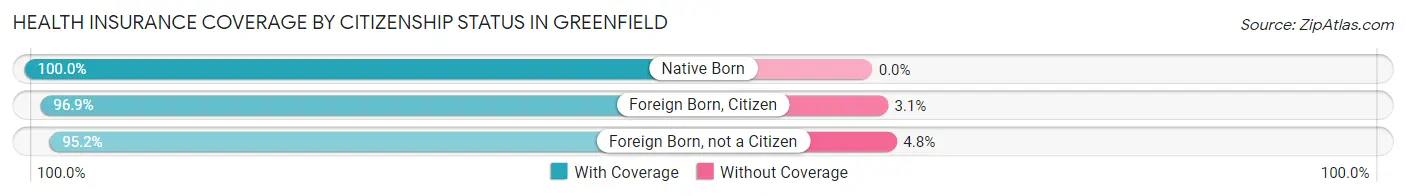
| Citizenship Status | With Coverage | Without Coverage |
| Native Born | 96 (100.0%) | 0 (0.0%) |
| Foreign Born, Citizen | 250 (96.9%) | 8 (3.1%) |
| Foreign Born, not a Citizen | 118 (95.2%) | 6 (4.8%) |
Health Insurance Coverage by Household Income in Greenfield
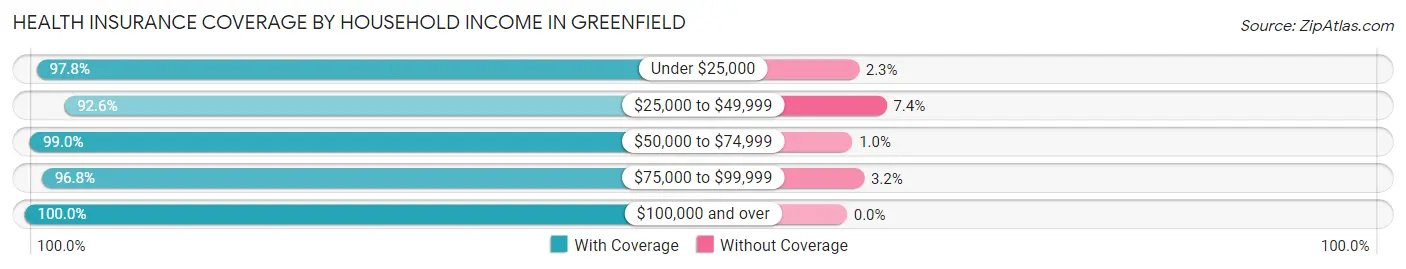
| Household Income | With Coverage | Without Coverage |
| Under $25,000 | 348 (97.8%) | 8 (2.2%) |
| $25,000 to $49,999 | 249 (92.6%) | 20 (7.4%) |
| $50,000 to $74,999 | 291 (99.0%) | 3 (1.0%) |
| $75,000 to $99,999 | 241 (96.8%) | 8 (3.2%) |
| $100,000 and over | 555 (100.0%) | 0 (0.0%) |
Public vs Private Health Insurance Coverage by Age in Greenfield
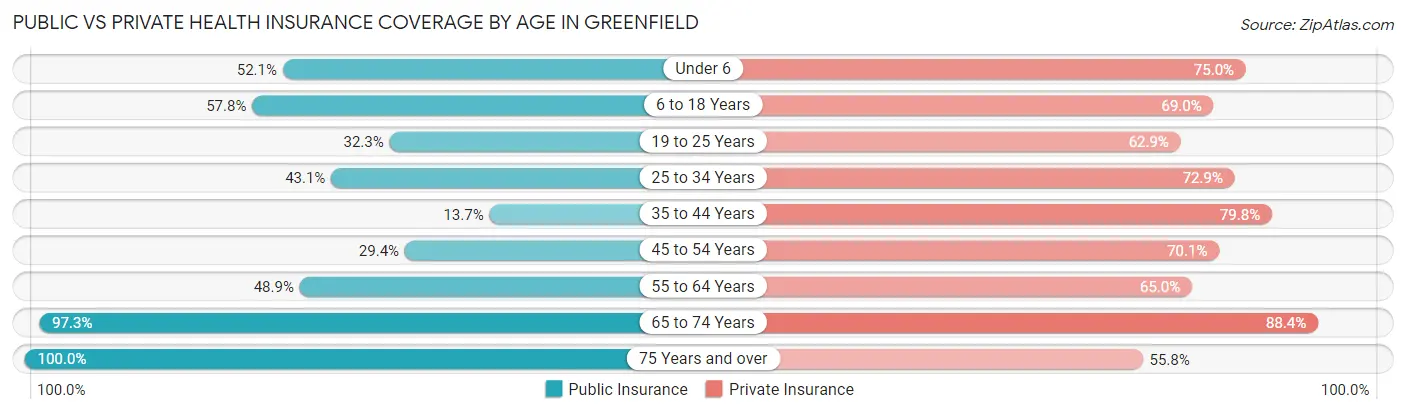
| Age Bracket | Public Insurance | Private Insurance |
| Under 6 | 50 (52.1%) | 72 (75.0%) |
| 6 to 18 Years | 149 (57.8%) | 178 (69.0%) |
| 19 to 25 Years | 40 (32.3%) | 78 (62.9%) |
| 25 to 34 Years | 78 (43.1%) | 132 (72.9%) |
| 35 to 44 Years | 17 (13.7%) | 99 (79.8%) |
| 45 to 54 Years | 55 (29.4%) | 131 (70.1%) |
| 55 to 64 Years | 137 (48.9%) | 182 (65.0%) |
| 65 to 74 Years | 218 (97.3%) | 198 (88.4%) |
| 75 Years and over | 249 (100.0%) | 139 (55.8%) |
| Total | 993 (57.6%) | 1,209 (70.2%) |
Disability Status by Sex by Age in Greenfield
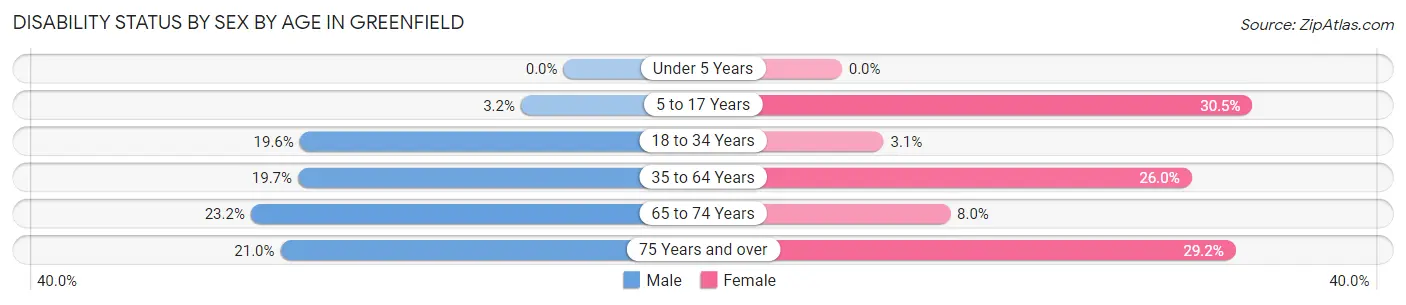
| Age Bracket | Male | Female |
| Under 5 Years | 0 (0.0%) | 0 (0.0%) |
| 5 to 17 Years | 5 (3.2%) | 32 (30.5%) |
| 18 to 34 Years | 37 (19.6%) | 4 (3.1%) |
| 35 to 64 Years | 55 (19.7%) | 81 (26.0%) |
| 65 to 74 Years | 26 (23.2%) | 9 (8.0%) |
| 75 Years and over | 25 (21.0%) | 38 (29.2%) |
Disability Class by Sex by Age in Greenfield
Disability Class: Hearing Difficulty
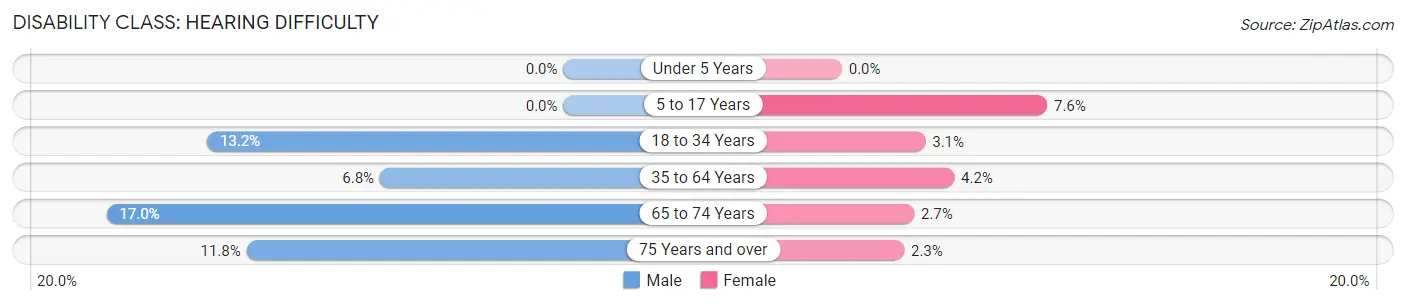
| Age Bracket | Male | Female |
| Under 5 Years | 0 (0.0%) | 0 (0.0%) |
| 5 to 17 Years | 0 (0.0%) | 8 (7.6%) |
| 18 to 34 Years | 25 (13.2%) | 4 (3.1%) |
| 35 to 64 Years | 19 (6.8%) | 13 (4.2%) |
| 65 to 74 Years | 19 (17.0%) | 3 (2.7%) |
| 75 Years and over | 14 (11.8%) | 3 (2.3%) |
Disability Class: Vision Difficulty
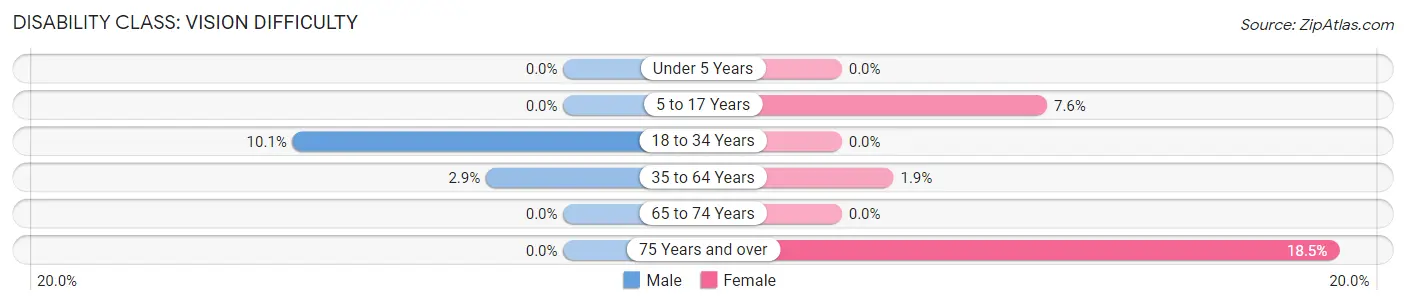
| Age Bracket | Male | Female |
| Under 5 Years | 0 (0.0%) | 0 (0.0%) |
| 5 to 17 Years | 0 (0.0%) | 8 (7.6%) |
| 18 to 34 Years | 19 (10.1%) | 0 (0.0%) |
| 35 to 64 Years | 8 (2.9%) | 6 (1.9%) |
| 65 to 74 Years | 0 (0.0%) | 0 (0.0%) |
| 75 Years and over | 0 (0.0%) | 24 (18.5%) |
Disability Class: Cognitive Difficulty
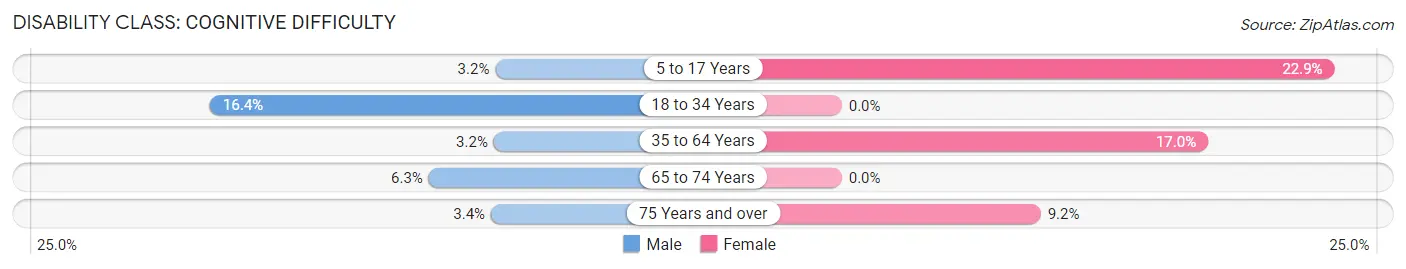
| Age Bracket | Male | Female |
| 5 to 17 Years | 5 (3.2%) | 24 (22.9%) |
| 18 to 34 Years | 31 (16.4%) | 0 (0.0%) |
| 35 to 64 Years | 9 (3.2%) | 53 (17.0%) |
| 65 to 74 Years | 7 (6.2%) | 0 (0.0%) |
| 75 Years and over | 4 (3.4%) | 12 (9.2%) |
Disability Class: Ambulatory Difficulty
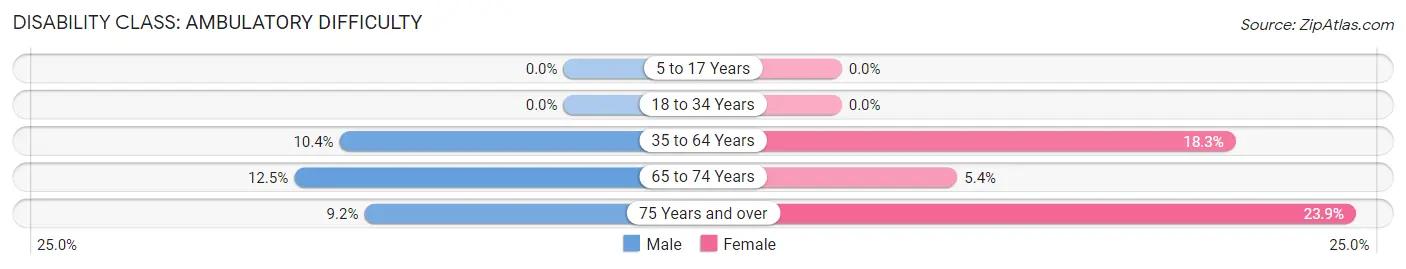
| Age Bracket | Male | Female |
| 5 to 17 Years | 0 (0.0%) | 0 (0.0%) |
| 18 to 34 Years | 0 (0.0%) | 0 (0.0%) |
| 35 to 64 Years | 29 (10.4%) | 57 (18.3%) |
| 65 to 74 Years | 14 (12.5%) | 6 (5.4%) |
| 75 Years and over | 11 (9.2%) | 31 (23.8%) |
Disability Class: Self-Care Difficulty
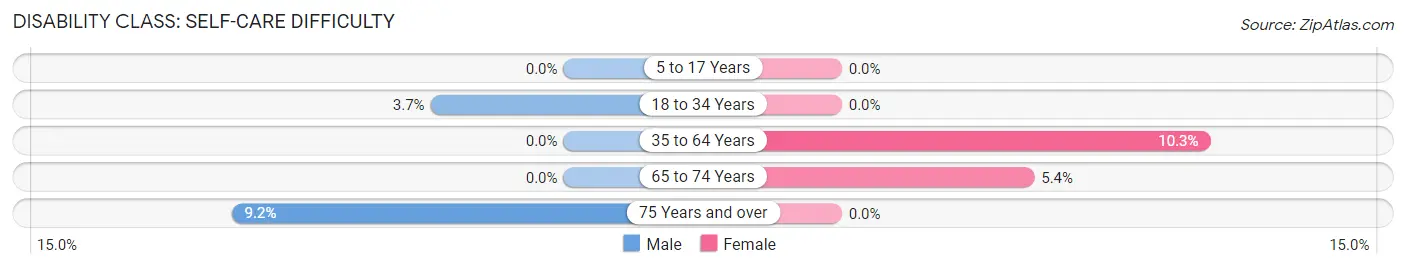
| Age Bracket | Male | Female |
| 5 to 17 Years | 0 (0.0%) | 0 (0.0%) |
| 18 to 34 Years | 7 (3.7%) | 0 (0.0%) |
| 35 to 64 Years | 0 (0.0%) | 32 (10.3%) |
| 65 to 74 Years | 0 (0.0%) | 6 (5.4%) |
| 75 Years and over | 11 (9.2%) | 0 (0.0%) |
Technology Access in Greenfield
Computing Device Access in Greenfield
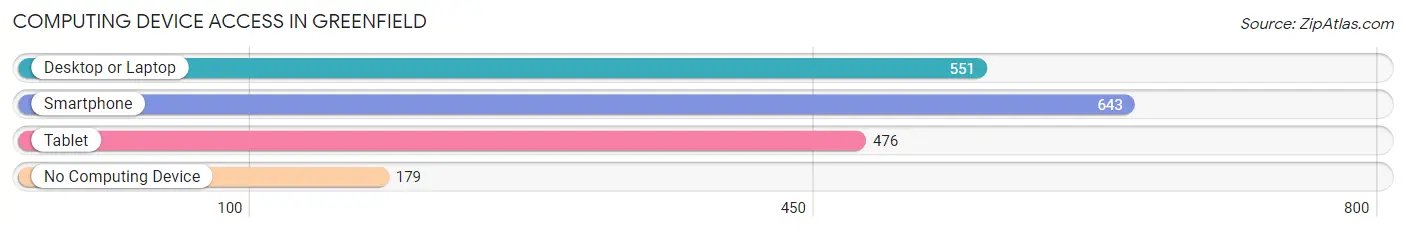
| Device Type | # Households | % Households |
| Desktop or Laptop | 551 | 62.4% |
| Smartphone | 643 | 72.8% |
| Tablet | 476 | 53.9% |
| No Computing Device | 179 | 20.3% |
| Total | 883 | 100.0% |
Internet Access in Greenfield
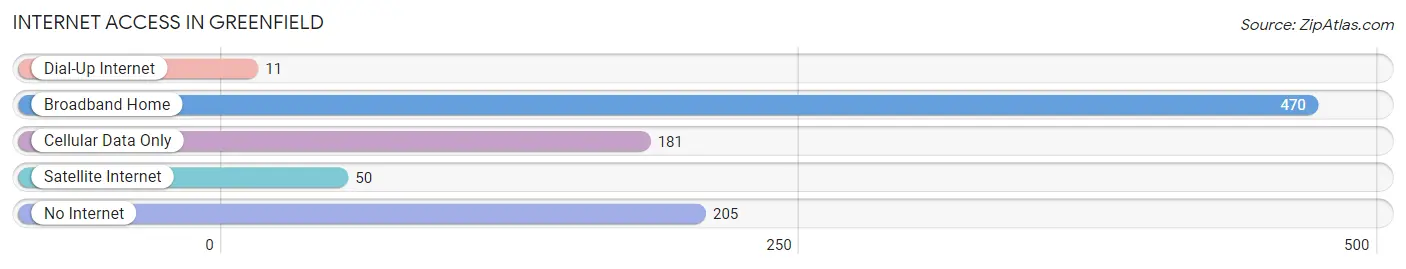
| Internet Type | # Households | % Households |
| Dial-Up Internet | 11 | 1.3% |
| Broadband Home | 470 | 53.2% |
| Cellular Data Only | 181 | 20.5% |
| Satellite Internet | 50 | 5.7% |
| No Internet | 205 | 23.2% |
| Total | 883 | 100.0% |
Greenfield Summary
Greenfield, Iowa is a small city located in Adair County in the southwestern part of the state. It is situated along the Middle Nodaway River and is the county seat. The city has a population of 2,717 people, according to the 2010 census.
History
Greenfield was founded in 1855 by a group of settlers from Ohio. The city was named after Greenfield, Ohio, the hometown of the settlers. The city was incorporated in 1858 and was the first city in Adair County.
The city was an important stop on the Chicago, Burlington and Quincy Railroad, which ran through the city in the late 19th century. The railroad brought economic growth to the city and helped to make it a center of commerce in the region.
In the early 20th century, Greenfield was a major producer of coal and other minerals. The city was also home to several manufacturing plants, including a brick factory and a flour mill.
Geography
Greenfield is located in southwestern Iowa, about 50 miles northwest of Des Moines. The city is situated along the Middle Nodaway River and is surrounded by rolling hills and farmland. The city has a total area of 2.2 square miles, all of which is land.
Climate
Greenfield has a humid continental climate, with hot summers and cold winters. The average annual temperature is 50°F, with an average high of 75°F in the summer and an average low of 25°F in the winter. The city receives an average of 36 inches of precipitation per year.
Economy
Greenfield’s economy is largely based on agriculture and manufacturing. The city is home to several manufacturing plants, including a brick factory and a flour mill. The city is also home to several agricultural businesses, including a dairy farm and a hog farm.
Demographics
According to the 2010 census, Greenfield has a population of 2,717 people. The city has a median household income of $41,944 and a median age of 38.7 years. The city is predominantly white, with 92.3% of the population identifying as white. The city also has a small Hispanic population, with 4.2% of the population identifying as Hispanic or Latino.
Greenfield is a small city with a rich history and a diverse economy. The city is home to several manufacturing plants and agricultural businesses, and is a popular destination for tourists and outdoor enthusiasts. The city has a population of 2,717 people, with a median household income of $41,944 and a median age of 38.7 years. Greenfield is predominantly white, with 92.3% of the population identifying as white. The city also has a small Hispanic population, with 4.2% of the population identifying as Hispanic or Latino.
Common Questions
What is Per Capita Income in Greenfield?
Per Capita income in Greenfield is $33,123.
What is the Median Family Income in Greenfield?
Median Family Income in Greenfield is $90,250.
What is the Median Household income in Greenfield?
Median Household Income in Greenfield is $50,598.
What is Income or Wage Gap in Greenfield?
Income or Wage Gap in Greenfield is 31.4%.
Women in Greenfield earn 68.6 cents for every dollar earned by a man.
What is Inequality or Gini Index in Greenfield?
Inequality or Gini Index in Greenfield is 0.43.
What is the Total Population of Greenfield?
Total Population of Greenfield is 1,778.
What is the Total Male Population of Greenfield?
Total Male Population of Greenfield is 932.
What is the Total Female Population of Greenfield?
Total Female Population of Greenfield is 846.
What is the Ratio of Males per 100 Females in Greenfield?
There are 110.17 Males per 100 Females in Greenfield.
What is the Ratio of Females per 100 Males in Greenfield?
There are 90.77 Females per 100 Males in Greenfield.
What is the Median Population Age in Greenfield?
Median Population Age in Greenfield is 50.6 Years.
What is the Average Family Size in Greenfield
Average Family Size in Greenfield is 2.9 People.
What is the Average Household Size in Greenfield
Average Household Size in Greenfield is 1.9 People.
How Large is the Labor Force in Greenfield?
There are 828 People in the Labor Forcein in Greenfield.
What is the Percentage of People in the Labor Force in Greenfield?
55.8% of People are in the Labor Force in Greenfield.
What is the Unemployment Rate in Greenfield?
Unemployment Rate in Greenfield is 2.9%.