Greeley, IA Map & Demographics
Greeley Map
Greeley Overview
$31,992
PER CAPITA INCOME
$86,667
AVG FAMILY INCOME
$64,167
AVG HOUSEHOLD INCOME
47.2%
WAGE / INCOME GAP [ % ]
52.8¢/ $1
WAGE / INCOME GAP [ $ ]
0.38
INEQUALITY / GINI INDEX
272
TOTAL POPULATION
126
MALE POPULATION
146
FEMALE POPULATION
86.30
MALES / 100 FEMALES
115.87
FEMALES / 100 MALES
34.1
MEDIAN AGE
2.8
AVG FAMILY SIZE
2.4
AVG HOUSEHOLD SIZE
165
LABOR FORCE [ PEOPLE ]
76.7%
PERCENT IN LABOR FORCE
7.9%
UNEMPLOYMENT RATE
Greeley Zip Codes
Greeley Area Codes
Income in Greeley
Income Overview in Greeley
Per Capita Income in Greeley is $31,992, while median incomes of families and households are $86,667 and $64,167 respectively.
| Characteristic | Number | Measure |
| Per Capita Income | 272 | $31,992 |
| Median Family Income | 78 | $86,667 |
| Mean Family Income | 78 | $90,786 |
| Median Household Income | 112 | $64,167 |
| Mean Household Income | 112 | $80,163 |
| Income Deficit | 78 | $0 |
| Wage / Income Gap (%) | 272 | 47.20% |
| Wage / Income Gap ($) | 272 | 52.80¢ per $1 |
| Gini / Inequality Index | 272 | 0.38 |
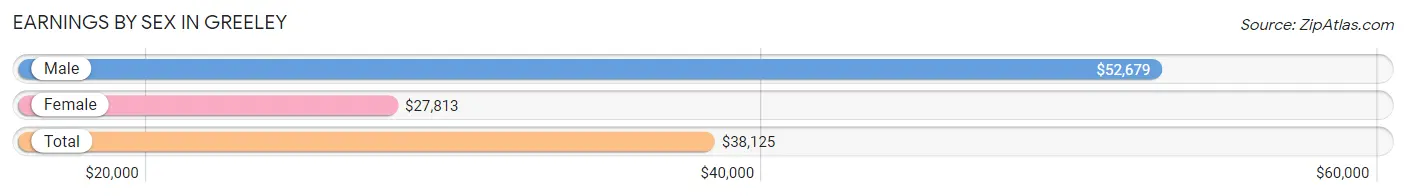
Earnings by Sex in Greeley
Average Earnings in Greeley are $38,125, $52,679 for men and $27,813 for women, a difference of 47.2%.
| Sex | Number | Average Earnings |
| Male | 84 (51.2%) | $52,679 |
| Female | 80 (48.8%) | $27,813 |
| Total | 164 (100.0%) | $38,125 |
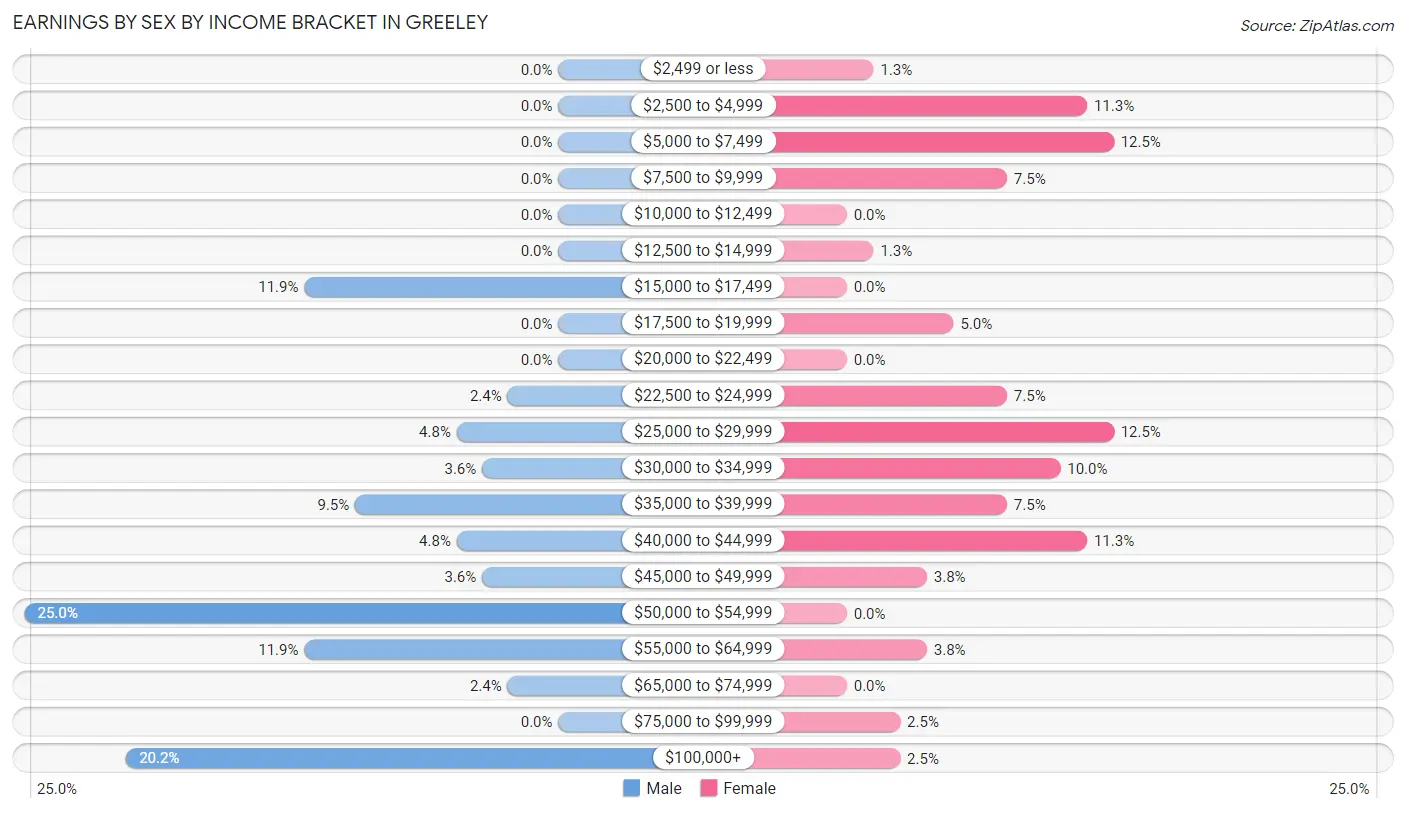
Earnings by Sex by Income Bracket in Greeley
The most common earnings brackets in Greeley are $50,000 to $54,999 for men (21 | 25.0%) and $5,000 to $7,499 for women (10 | 12.5%).
| Income | Male | Female |
| $2,499 or less | 0 (0.0%) | 1 (1.3%) |
| $2,500 to $4,999 | 0 (0.0%) | 9 (11.3%) |
| $5,000 to $7,499 | 0 (0.0%) | 10 (12.5%) |
| $7,500 to $9,999 | 0 (0.0%) | 6 (7.5%) |
| $10,000 to $12,499 | 0 (0.0%) | 0 (0.0%) |
| $12,500 to $14,999 | 0 (0.0%) | 1 (1.3%) |
| $15,000 to $17,499 | 10 (11.9%) | 0 (0.0%) |
| $17,500 to $19,999 | 0 (0.0%) | 4 (5.0%) |
| $20,000 to $22,499 | 0 (0.0%) | 0 (0.0%) |
| $22,500 to $24,999 | 2 (2.4%) | 6 (7.5%) |
| $25,000 to $29,999 | 4 (4.8%) | 10 (12.5%) |
| $30,000 to $34,999 | 3 (3.6%) | 8 (10.0%) |
| $35,000 to $39,999 | 8 (9.5%) | 6 (7.5%) |
| $40,000 to $44,999 | 4 (4.8%) | 9 (11.3%) |
| $45,000 to $49,999 | 3 (3.6%) | 3 (3.7%) |
| $50,000 to $54,999 | 21 (25.0%) | 0 (0.0%) |
| $55,000 to $64,999 | 10 (11.9%) | 3 (3.7%) |
| $65,000 to $74,999 | 2 (2.4%) | 0 (0.0%) |
| $75,000 to $99,999 | 0 (0.0%) | 2 (2.5%) |
| $100,000+ | 17 (20.2%) | 2 (2.5%) |
| Total | 84 (100.0%) | 80 (100.0%) |
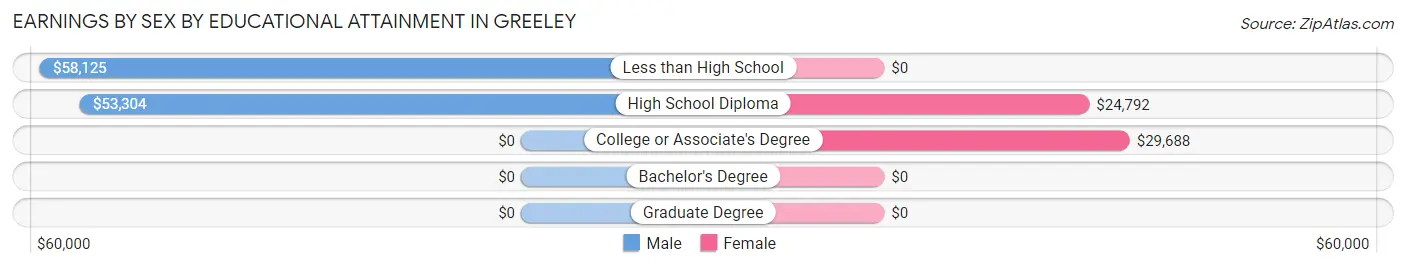
Earnings by Sex by Educational Attainment in Greeley
Average earnings in Greeley are $53,393 for men and $29,219 for women, a difference of 45.3%. Men with an educational attainment of less than high school enjoy the highest average annual earnings of $58,125, while those with high school diploma education earn the least with $53,304. Women with an educational attainment of college or associate's degree earn the most with the average annual earnings of $29,688, while those with high school diploma education have the smallest earnings of $24,792.
| Educational Attainment | Male Income | Female Income |
| Less than High School | $58,125 | $0 |
| High School Diploma | $53,304 | $24,792 |
| College or Associate's Degree | - | - |
| Bachelor's Degree | - | - |
| Graduate Degree | - | - |
| Total | $53,393 | $29,219 |
Family Income in Greeley
Family Income Brackets in Greeley
According to the Greeley family income data, there are 23 families falling into the $75,000 to $99,999 income range, which is the most common income bracket and makes up 29.5% of all families.
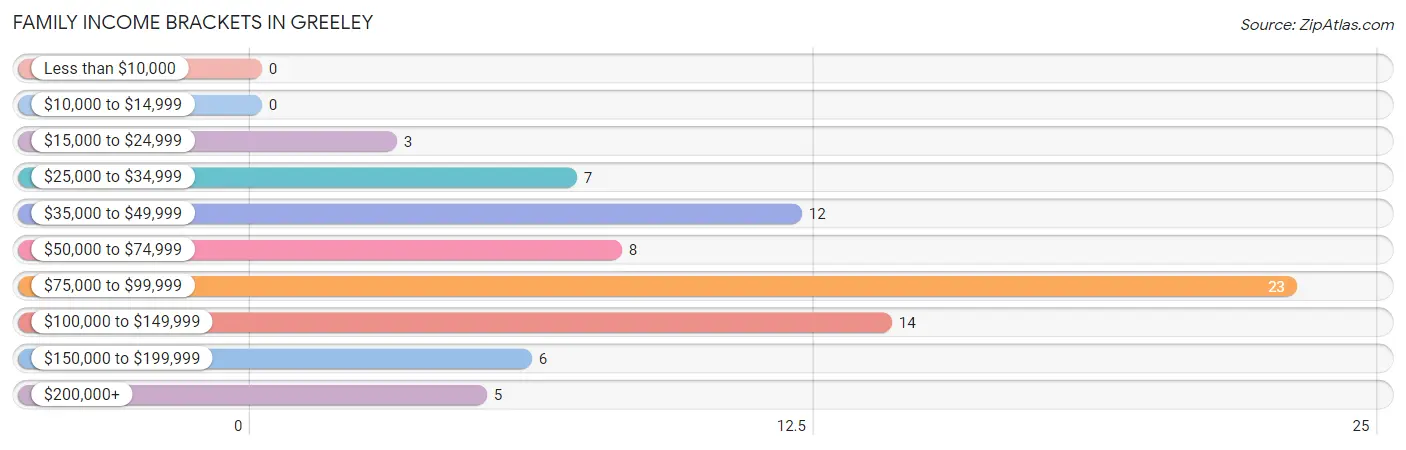
| Income Bracket | # Families | % Families |
| Less than $10,000 | 0 | 0.0% |
| $10,000 to $14,999 | 0 | 0.0% |
| $15,000 to $24,999 | 3 | 3.8% |
| $25,000 to $34,999 | 7 | 9.0% |
| $35,000 to $49,999 | 12 | 15.4% |
| $50,000 to $74,999 | 8 | 10.3% |
| $75,000 to $99,999 | 23 | 29.5% |
| $100,000 to $149,999 | 14 | 17.9% |
| $150,000 to $199,999 | 6 | 7.7% |
| $200,000+ | 5 | 6.4% |
Family Income by Famaliy Size in Greeley
3-person families (21 | 26.9%) account for the highest median family income in Greeley with $88,375 per family, while 2-person families (43 | 55.1%) have the highest median income of $42,604 per family member.
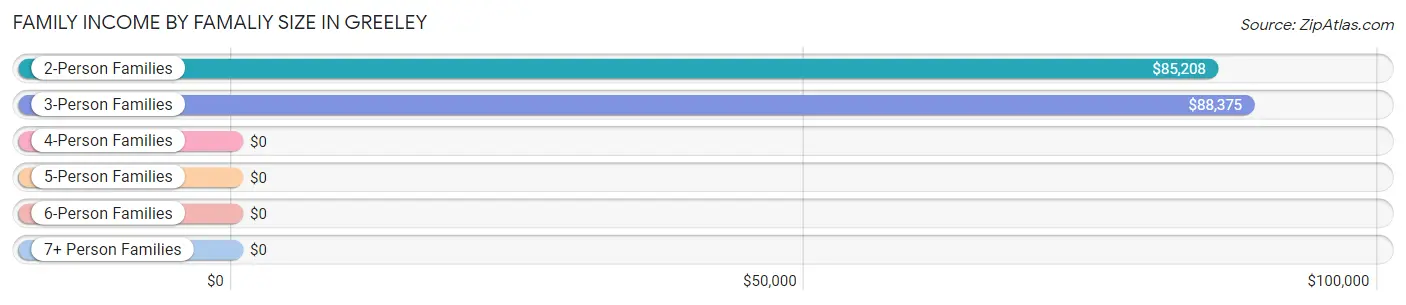
| Income Bracket | # Families | Median Income |
| 2-Person Families | 43 (55.1%) | $85,208 |
| 3-Person Families | 21 (26.9%) | $88,375 |
| 4-Person Families | 8 (10.3%) | $0 |
| 5-Person Families | 4 (5.1%) | $0 |
| 6-Person Families | 0 (0.0%) | $0 |
| 7+ Person Families | 2 (2.6%) | $0 |
| Total | 78 (100.0%) | $86,667 |
Family Income by Number of Earners in Greeley
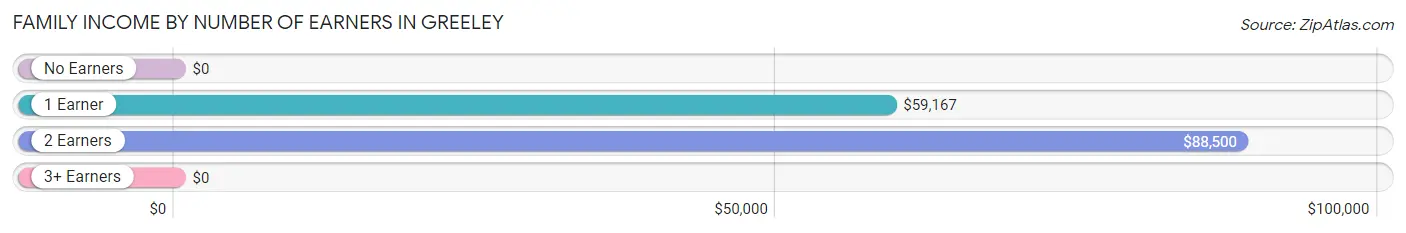
| Number of Earners | # Families | Median Income |
| No Earners | 9 (11.5%) | $0 |
| 1 Earner | 12 (15.4%) | $59,167 |
| 2 Earners | 52 (66.7%) | $88,500 |
| 3+ Earners | 5 (6.4%) | $0 |
| Total | 78 (100.0%) | $86,667 |
Household Income in Greeley
Household Income Brackets in Greeley
With 25 households falling in the category, the $75,000 to $99,999 income range is the most frequent in Greeley, accounting for 22.3% of all households. In contrast, only 2 households (1.8%) fall into the $10,000 to $14,999 income bracket, making it the least populous group.
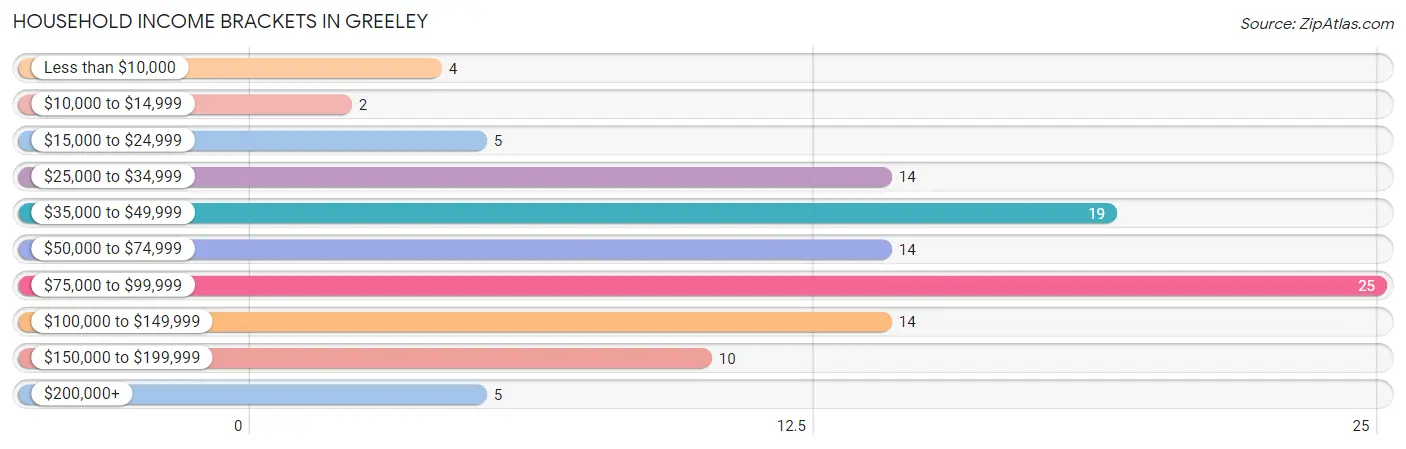
| Income Bracket | # Households | % Households |
| Less than $10,000 | 4 | 3.6% |
| $10,000 to $14,999 | 2 | 1.8% |
| $15,000 to $24,999 | 5 | 4.5% |
| $25,000 to $34,999 | 14 | 12.5% |
| $35,000 to $49,999 | 19 | 17.0% |
| $50,000 to $74,999 | 14 | 12.5% |
| $75,000 to $99,999 | 25 | 22.3% |
| $100,000 to $149,999 | 14 | 12.5% |
| $150,000 to $199,999 | 10 | 8.9% |
| $200,000+ | 5 | 4.5% |
Household Income by Householder Age in Greeley
The median household income in Greeley is $64,167, with the highest median household income of $88,500 found in the 25 to 44 years age bracket for the primary householder. A total of 36 households (32.1%) fall into this category. Meanwhile, the 15 to 24 years age bracket for the primary householder has the lowest median household income of $0, with 11 households (9.8%) in this group.
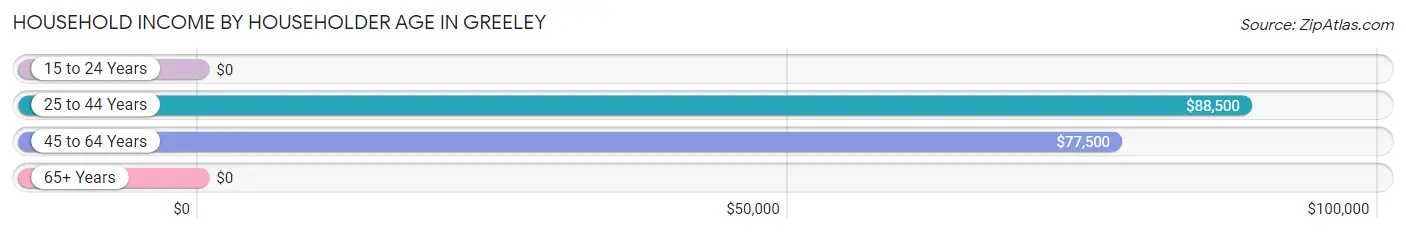
| Income Bracket | # Households | Median Income |
| 15 to 24 Years | 11 (9.8%) | $0 |
| 25 to 44 Years | 36 (32.1%) | $88,500 |
| 45 to 64 Years | 42 (37.5%) | $77,500 |
| 65+ Years | 23 (20.5%) | $0 |
| Total | 112 (100.0%) | $64,167 |
Poverty in Greeley
Income Below Poverty by Sex and Age in Greeley
With 11.1% poverty level for males and 20.5% for females among the residents of Greeley, 6 to 11 year old males and under 5 year old females are the most vulnerable to poverty, with 3 males (60.0%) and 15 females (88.2%) in their respective age groups living below the poverty level.
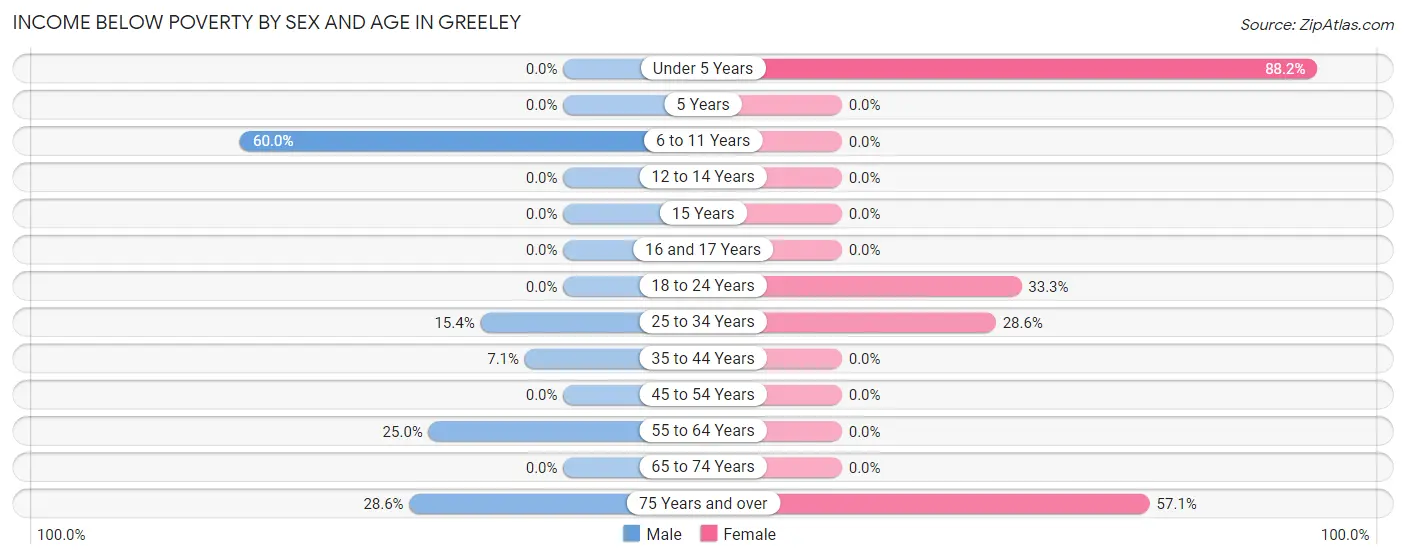
| Age Bracket | Male | Female |
| Under 5 Years | 0 (0.0%) | 15 (88.2%) |
| 5 Years | 0 (0.0%) | 0 (0.0%) |
| 6 to 11 Years | 3 (60.0%) | 0 (0.0%) |
| 12 to 14 Years | 0 (0.0%) | 0 (0.0%) |
| 15 Years | 0 (0.0%) | 0 (0.0%) |
| 16 and 17 Years | 0 (0.0%) | 0 (0.0%) |
| 18 to 24 Years | 0 (0.0%) | 5 (33.3%) |
| 25 to 34 Years | 4 (15.4%) | 6 (28.6%) |
| 35 to 44 Years | 1 (7.1%) | 0 (0.0%) |
| 45 to 54 Years | 0 (0.0%) | 0 (0.0%) |
| 55 to 64 Years | 4 (25.0%) | 0 (0.0%) |
| 65 to 74 Years | 0 (0.0%) | 0 (0.0%) |
| 75 Years and over | 2 (28.6%) | 4 (57.1%) |
| Total | 14 (11.1%) | 30 (20.5%) |
Income Above Poverty by Sex and Age in Greeley
According to the poverty statistics in Greeley, males aged under 5 years and females aged 5 years are the age groups that are most secure financially, with 100.0% of males and 100.0% of females in these age groups living above the poverty line.
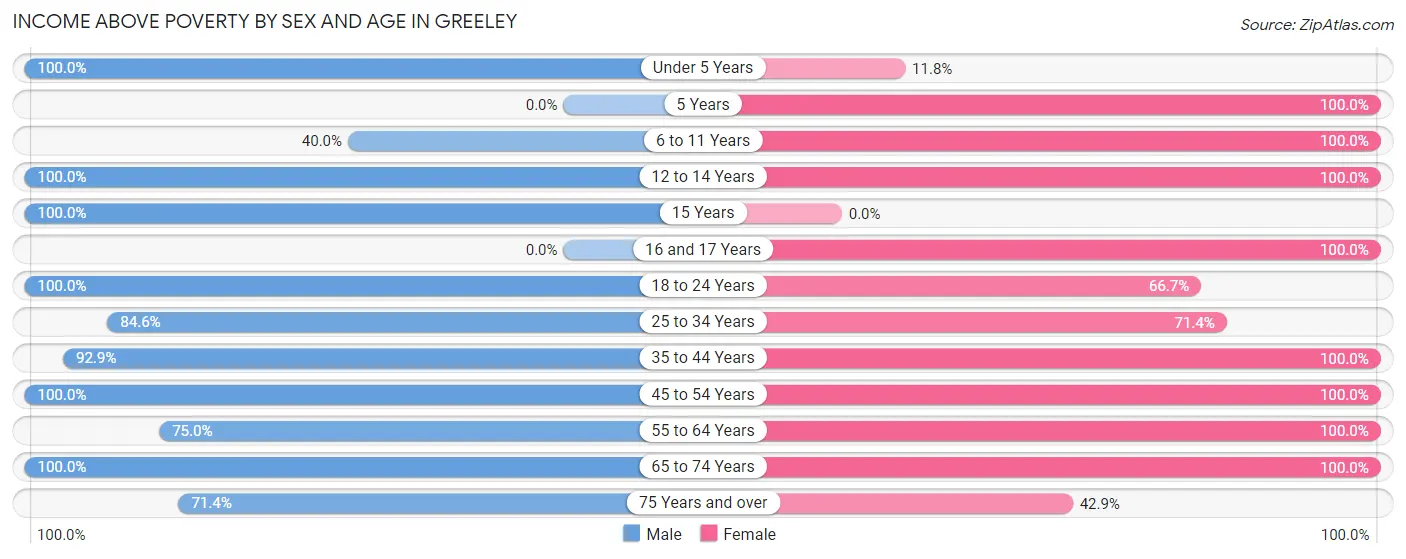
| Age Bracket | Male | Female |
| Under 5 Years | 11 (100.0%) | 2 (11.8%) |
| 5 Years | 0 (0.0%) | 3 (100.0%) |
| 6 to 11 Years | 2 (40.0%) | 9 (100.0%) |
| 12 to 14 Years | 4 (100.0%) | 5 (100.0%) |
| 15 Years | 3 (100.0%) | 0 (0.0%) |
| 16 and 17 Years | 0 (0.0%) | 10 (100.0%) |
| 18 to 24 Years | 16 (100.0%) | 10 (66.7%) |
| 25 to 34 Years | 22 (84.6%) | 15 (71.4%) |
| 35 to 44 Years | 13 (92.9%) | 13 (100.0%) |
| 45 to 54 Years | 19 (100.0%) | 16 (100.0%) |
| 55 to 64 Years | 12 (75.0%) | 20 (100.0%) |
| 65 to 74 Years | 5 (100.0%) | 10 (100.0%) |
| 75 Years and over | 5 (71.4%) | 3 (42.9%) |
| Total | 112 (88.9%) | 116 (79.4%) |
Income Below Poverty Among Married-Couple Families in Greeley
The poverty statistics for married-couple families in Greeley show that 6.0% or 4 of the total 67 families live below the poverty line. Families with 1 or 2 children have the highest poverty rate of 20.0%, comprising of 4 families. On the other hand, families with no children have the lowest poverty rate of 0.0%, which includes 0 families.
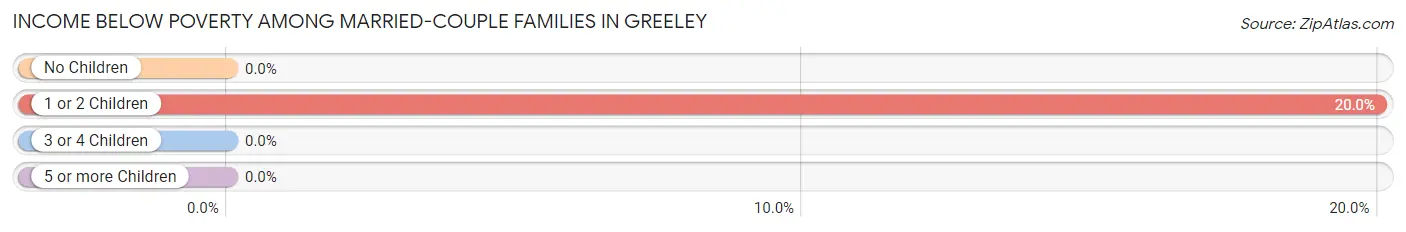
| Children | Above Poverty | Below Poverty |
| No Children | 41 (100.0%) | 0 (0.0%) |
| 1 or 2 Children | 16 (80.0%) | 4 (20.0%) |
| 3 or 4 Children | 4 (100.0%) | 0 (0.0%) |
| 5 or more Children | 2 (100.0%) | 0 (0.0%) |
| Total | 63 (94.0%) | 4 (6.0%) |
Income Below Poverty Among Single-Parent Households in Greeley
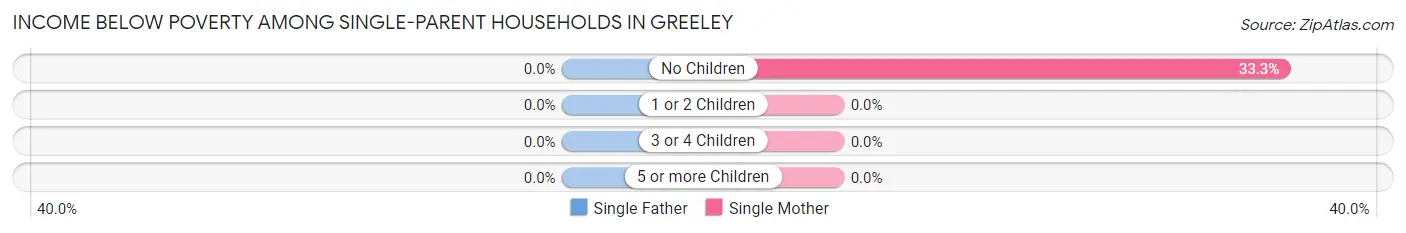
| Children | Single Father | Single Mother |
| No Children | 0 (0.0%) | 3 (33.3%) |
| 1 or 2 Children | 0 (0.0%) | 0 (0.0%) |
| 3 or 4 Children | 0 (0.0%) | 0 (0.0%) |
| 5 or more Children | 0 (0.0%) | 0 (0.0%) |
| Total | 0 (0.0%) | 3 (27.3%) |
Income Below Poverty Among Married-Couple vs Single-Parent Households in Greeley
The poverty data for Greeley shows that 4 of the married-couple family households (6.0%) and 3 of the single-parent households (27.3%) are living below the poverty level. Within the married-couple family households, those with 1 or 2 children have the highest poverty rate, with 4 households (20.0%) falling below the poverty line. Among the single-parent households, those with no children have the highest poverty rate, with 3 household (33.3%) living below poverty.
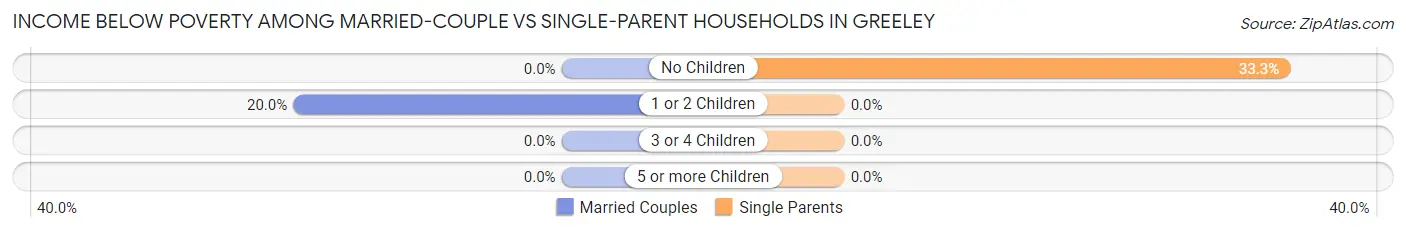
| Children | Married-Couple Families | Single-Parent Households |
| No Children | 0 (0.0%) | 3 (33.3%) |
| 1 or 2 Children | 4 (20.0%) | 0 (0.0%) |
| 3 or 4 Children | 0 (0.0%) | 0 (0.0%) |
| 5 or more Children | 0 (0.0%) | 0 (0.0%) |
| Total | 4 (6.0%) | 3 (27.3%) |
Race in Greeley
The most populous races in Greeley are White / Caucasian (267 | 98.2%), and Two or more Races (5 | 1.8%).
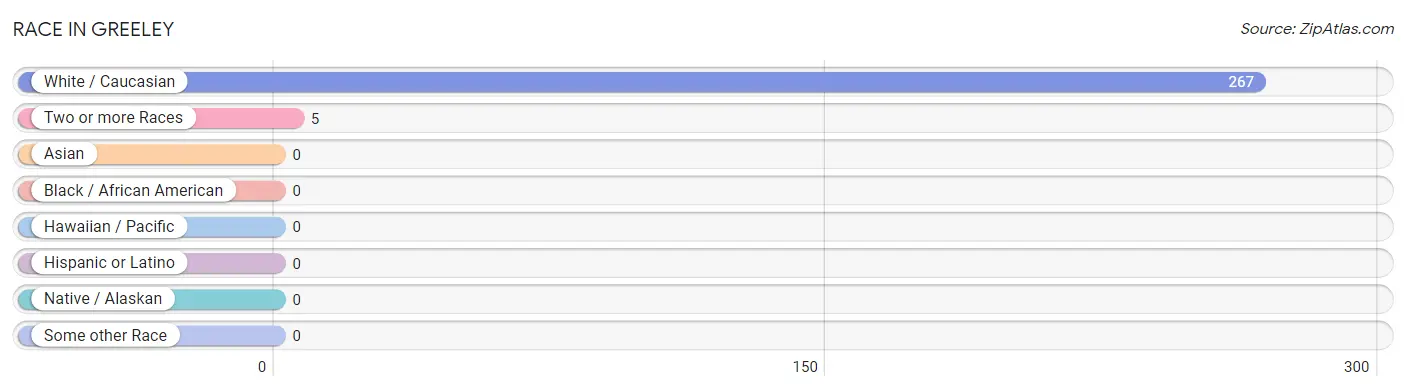
| Race | # Population | % Population |
| Asian | 0 | 0.0% |
| Black / African American | 0 | 0.0% |
| Hawaiian / Pacific | 0 | 0.0% |
| Hispanic or Latino | 0 | 0.0% |
| Native / Alaskan | 0 | 0.0% |
| White / Caucasian | 267 | 98.2% |
| Two or more Races | 5 | 1.8% |
| Some other Race | 0 | 0.0% |
| Total | 272 | 100.0% |
Ancestry in Greeley
The most populous ancestries reported in Greeley are German (65 | 23.9%), English (41 | 15.1%), Irish (35 | 12.9%), American (14 | 5.1%), and European (5 | 1.8%), together accounting for 58.8% of all Greeley residents.
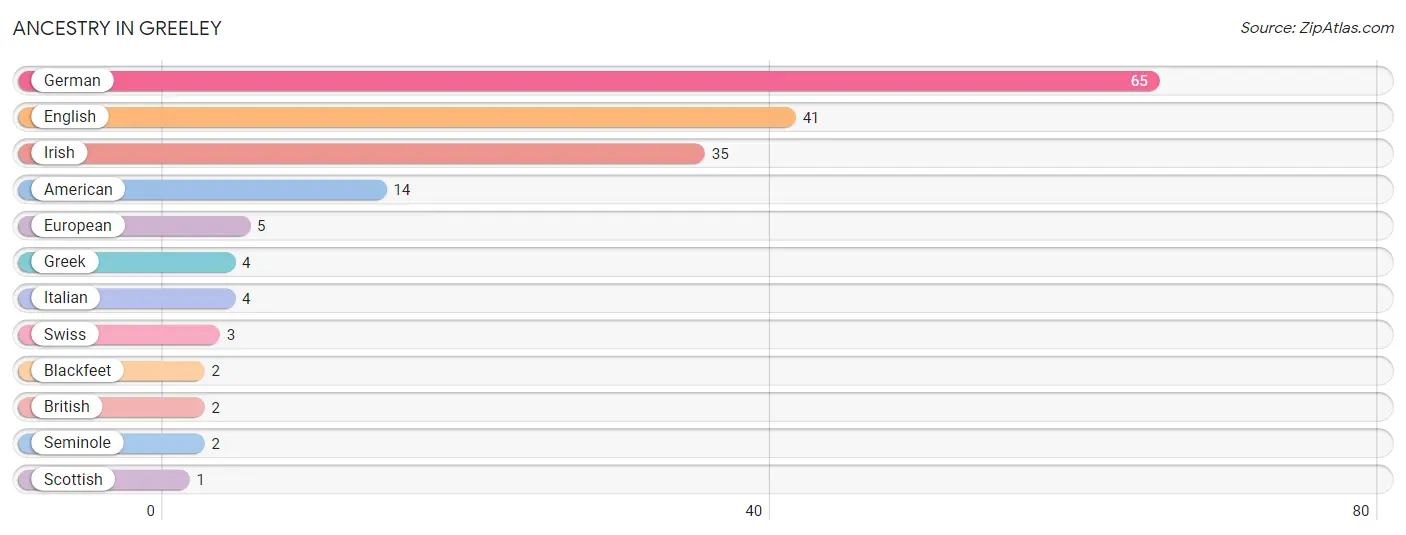
| Ancestry | # Population | % Population |
| American | 14 | 5.1% |
| Blackfeet | 2 | 0.7% |
| British | 2 | 0.7% |
| English | 41 | 15.1% |
| European | 5 | 1.8% |
| German | 65 | 23.9% |
| Greek | 4 | 1.5% |
| Irish | 35 | 12.9% |
| Italian | 4 | 1.5% |
| Scottish | 1 | 0.4% |
| Seminole | 2 | 0.7% |
| Swiss | 3 | 1.1% | View All 12 Rows |
Immigrants in Greeley

| Immigration Origin | # Population | % Population | View All 0 Rows |
Sex and Age in Greeley
Sex and Age in Greeley
The most populous age groups in Greeley are 25 to 29 Years (18 | 14.3%) for men and 30 to 34 Years (18 | 12.3%) for women.
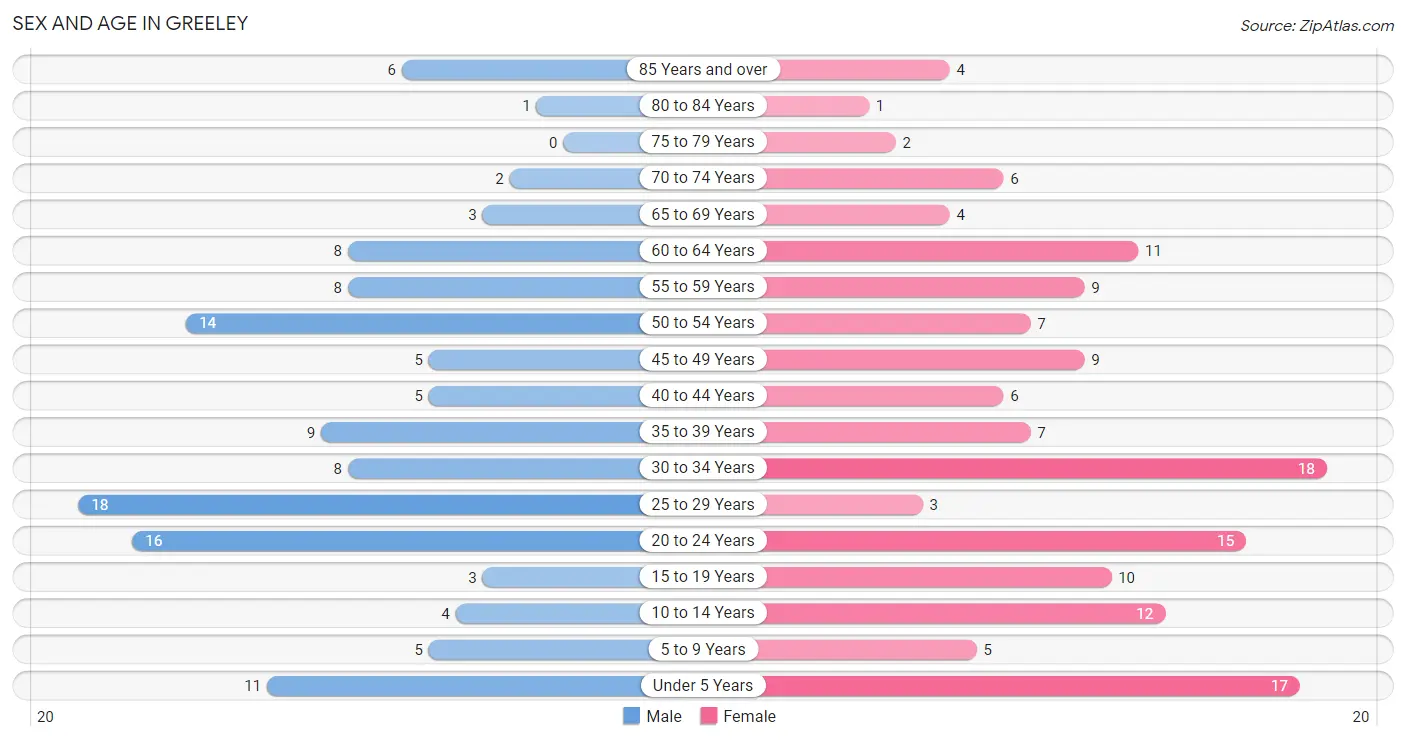
| Age Bracket | Male | Female |
| Under 5 Years | 11 (8.7%) | 17 (11.6%) |
| 5 to 9 Years | 5 (4.0%) | 5 (3.4%) |
| 10 to 14 Years | 4 (3.2%) | 12 (8.2%) |
| 15 to 19 Years | 3 (2.4%) | 10 (6.9%) |
| 20 to 24 Years | 16 (12.7%) | 15 (10.3%) |
| 25 to 29 Years | 18 (14.3%) | 3 (2.1%) |
| 30 to 34 Years | 8 (6.4%) | 18 (12.3%) |
| 35 to 39 Years | 9 (7.1%) | 7 (4.8%) |
| 40 to 44 Years | 5 (4.0%) | 6 (4.1%) |
| 45 to 49 Years | 5 (4.0%) | 9 (6.2%) |
| 50 to 54 Years | 14 (11.1%) | 7 (4.8%) |
| 55 to 59 Years | 8 (6.4%) | 9 (6.2%) |
| 60 to 64 Years | 8 (6.4%) | 11 (7.5%) |
| 65 to 69 Years | 3 (2.4%) | 4 (2.7%) |
| 70 to 74 Years | 2 (1.6%) | 6 (4.1%) |
| 75 to 79 Years | 0 (0.0%) | 2 (1.4%) |
| 80 to 84 Years | 1 (0.8%) | 1 (0.7%) |
| 85 Years and over | 6 (4.8%) | 4 (2.7%) |
| Total | 126 (100.0%) | 146 (100.0%) |
Families and Households in Greeley
Median Family Size in Greeley
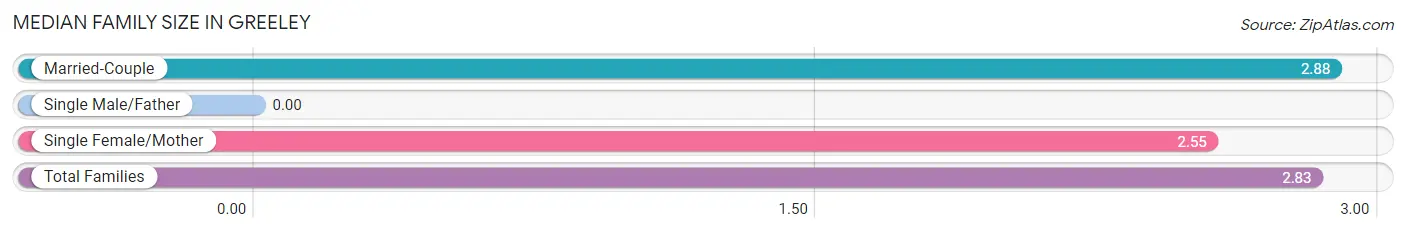
| Family Type | # Families | Family Size |
| Married-Couple | 67 (85.9%) | 2.88 |
| Single Male/Father | 0 (0.0%) | - |
| Single Female/Mother | 11 (14.1%) | 2.55 |
| Total Families | 78 (100.0%) | 2.83 |
Median Household Size in Greeley
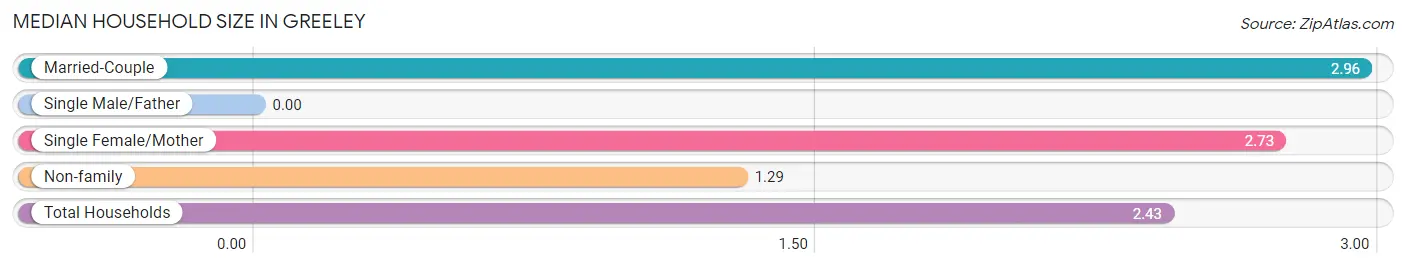
| Household Type | # Households | Household Size |
| Married-Couple | 67 (59.8%) | 2.96 |
| Single Male/Father | 0 (0.0%) | - |
| Single Female/Mother | 11 (9.8%) | 2.73 |
| Non-family | 34 (30.4%) | 1.29 |
| Total Households | 112 (100.0%) | 2.43 |
Household Size by Marriage Status in Greeley
Out of a total of 112 households in Greeley, 78 (69.6%) are family households, while 34 (30.4%) are nonfamily households. The most numerous type of family households are 2-person households, comprising 37, and the most common type of nonfamily households are 1-person households, comprising 25.
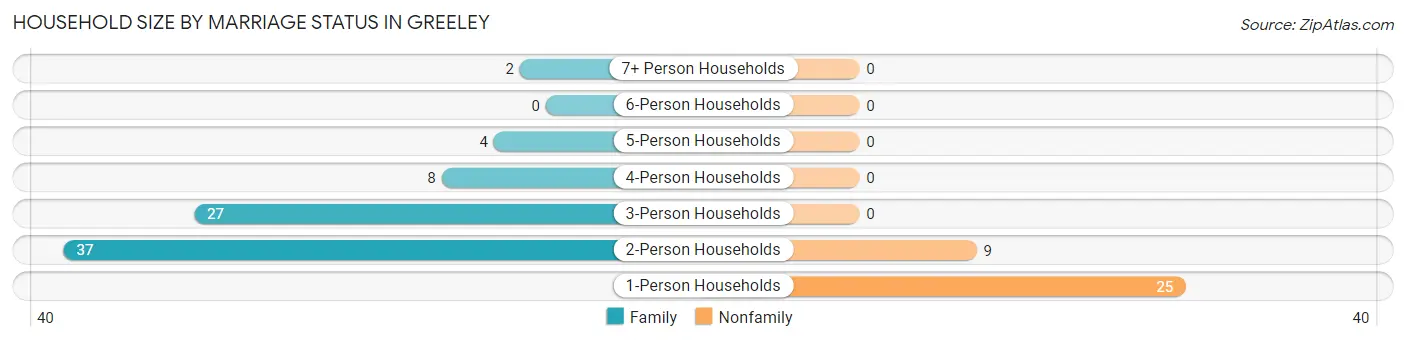
| Household Size | Family Households | Nonfamily Households |
| 1-Person Households | - | 25 (22.3%) |
| 2-Person Households | 37 (33.0%) | 9 (8.0%) |
| 3-Person Households | 27 (24.1%) | 0 (0.0%) |
| 4-Person Households | 8 (7.1%) | 0 (0.0%) |
| 5-Person Households | 4 (3.6%) | 0 (0.0%) |
| 6-Person Households | 0 (0.0%) | 0 (0.0%) |
| 7+ Person Households | 2 (1.8%) | 0 (0.0%) |
| Total | 78 (69.6%) | 34 (30.4%) |
Female Fertility in Greeley
Fertility by Age in Greeley
| Age Bracket | Women with Births | Births / 1,000 Women |
| 15 to 19 years | 0 (0.0%) | 0.0 |
| 20 to 34 years | 0 (0.0%) | 0.0 |
| 35 to 50 years | 0 (0.0%) | 0.0 |
| Total | 0 (0.0%) | 0.0 |
Fertility by Age by Marriage Status in Greeley
| Age Bracket | Married | Unmarried |
| 15 to 19 years | 0 (0.0%) | 0 (0.0%) |
| 20 to 34 years | 0 (0.0%) | 0 (0.0%) |
| 35 to 50 years | 0 (0.0%) | 0 (0.0%) |
| Total | 0 (0.0%) | 0 (0.0%) |
Fertility by Education in Greeley
| Educational Attainment | Women with Births | Births / 1,000 Women |
| Less than High School | 0 (0.0%) | 0.0 |
| High School Diploma | 0 (0.0%) | 0.0 |
| College or Associate's Degree | 0 (0.0%) | 0.0 |
| Bachelor's Degree | 0 (0.0%) | 0.0 |
| Graduate Degree | 0 (0.0%) | 0.0 |
| Total | 0 (0.0%) | 0.0 |
Fertility by Education by Marriage Status in Greeley
| Educational Attainment | Married | Unmarried |
| Less than High School | 0 (0.0%) | 0 (0.0%) |
| High School Diploma | 0 (0.0%) | 0 (0.0%) |
| College or Associate's Degree | 0 (0.0%) | 0 (0.0%) |
| Bachelor's Degree | 0 (0.0%) | 0 (0.0%) |
| Graduate Degree | 0 (0.0%) | 0 (0.0%) |
| Total | 0 (0.0%) | 0 (0.0%) |
Employment Characteristics in Greeley
Employment by Class of Employer in Greeley
Among the 152 employed individuals in Greeley, private company employees (103 | 67.8%), self-employed (not incorporated) (25 | 16.5%), and not-for-profit organizations (14 | 9.2%) make up the most common classes of employment.
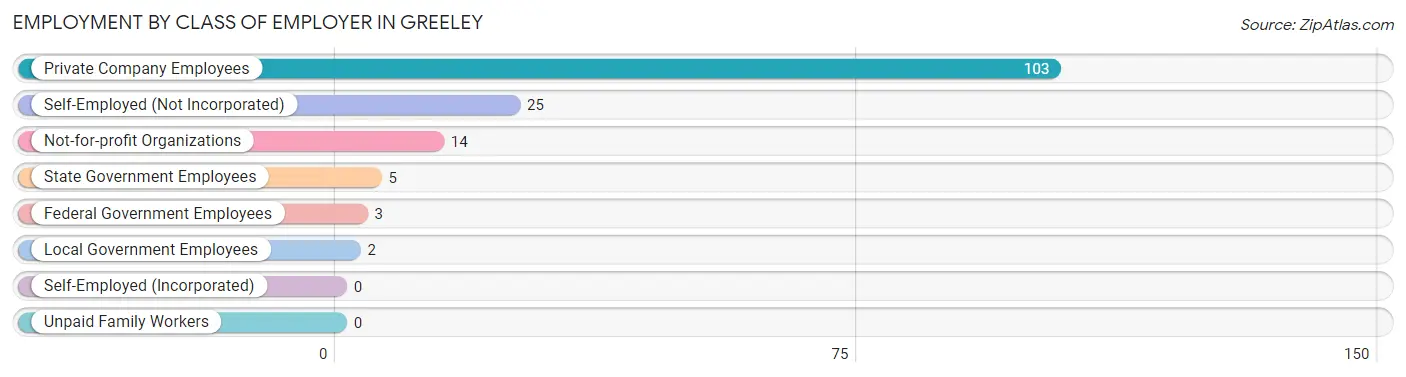
| Employer Class | # Employees | % Employees |
| Private Company Employees | 103 | 67.8% |
| Self-Employed (Incorporated) | 0 | 0.0% |
| Self-Employed (Not Incorporated) | 25 | 16.5% |
| Not-for-profit Organizations | 14 | 9.2% |
| Local Government Employees | 2 | 1.3% |
| State Government Employees | 5 | 3.3% |
| Federal Government Employees | 3 | 2.0% |
| Unpaid Family Workers | 0 | 0.0% |
| Total | 152 | 100.0% |
Employment Status by Age in Greeley
According to the labor force statistics for Greeley, out of the total population over 16 years of age (215), 76.7% or 165 individuals are in the labor force, with 7.9% or 13 of them unemployed. The age group with the highest labor force participation rate is 20 to 24 years, with 100.0% or 31 individuals in the labor force. Within the labor force, the 75 years and over age range has the highest percentage of unemployed individuals, with 100.0% or 2 of them being unemployed.
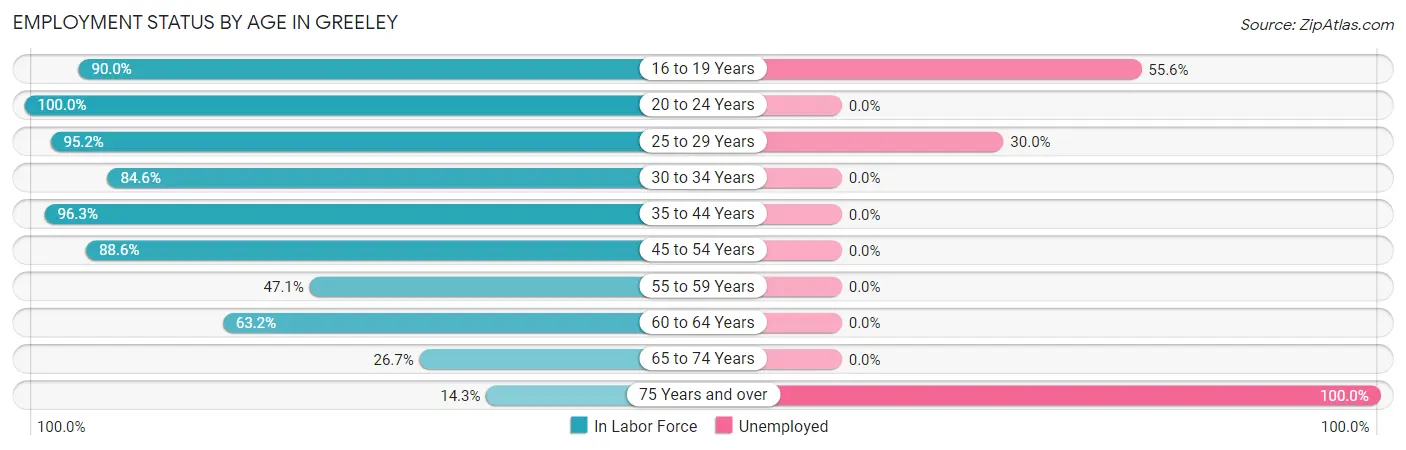
| Age Bracket | In Labor Force | Unemployed |
| 16 to 19 Years | 9 (90.0%) | 5 (55.6%) |
| 20 to 24 Years | 31 (100.0%) | 0 (0.0%) |
| 25 to 29 Years | 20 (95.2%) | 6 (30.0%) |
| 30 to 34 Years | 22 (84.6%) | 0 (0.0%) |
| 35 to 44 Years | 26 (96.3%) | 0 (0.0%) |
| 45 to 54 Years | 31 (88.6%) | 0 (0.0%) |
| 55 to 59 Years | 8 (47.1%) | 0 (0.0%) |
| 60 to 64 Years | 12 (63.2%) | 0 (0.0%) |
| 65 to 74 Years | 4 (26.7%) | 0 (0.0%) |
| 75 Years and over | 2 (14.3%) | 2 (100.0%) |
| Total | 165 (76.7%) | 13 (7.9%) |
Employment Status by Educational Attainment in Greeley
According to labor force statistics for Greeley, 82.1% of individuals (119) out of the total population between 25 and 64 years of age (145) are in the labor force, with 5.0% or 6 of them being unemployed. The group with the highest labor force participation rate are those with the educational attainment of bachelor's degree or higher, with 100.0% or 8 individuals in the labor force. Within the labor force, individuals with high school diploma education have the highest percentage of unemployment, with 8.1% or 6 of them being unemployed.
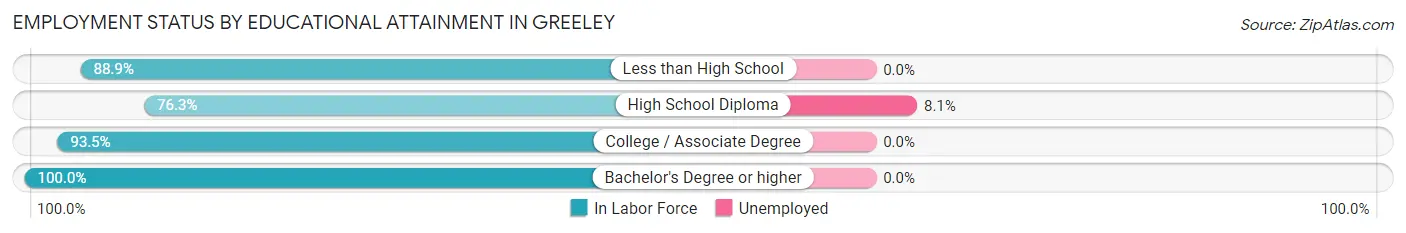
| Educational Attainment | In Labor Force | Unemployed |
| Less than High School | 8 (88.9%) | 0 (0.0%) |
| High School Diploma | 74 (76.3%) | 8 (8.1%) |
| College / Associate Degree | 29 (93.5%) | 0 (0.0%) |
| Bachelor's Degree or higher | 8 (100.0%) | 0 (0.0%) |
| Total | 119 (82.1%) | 7 (5.0%) |
Employment Occupations by Sex in Greeley
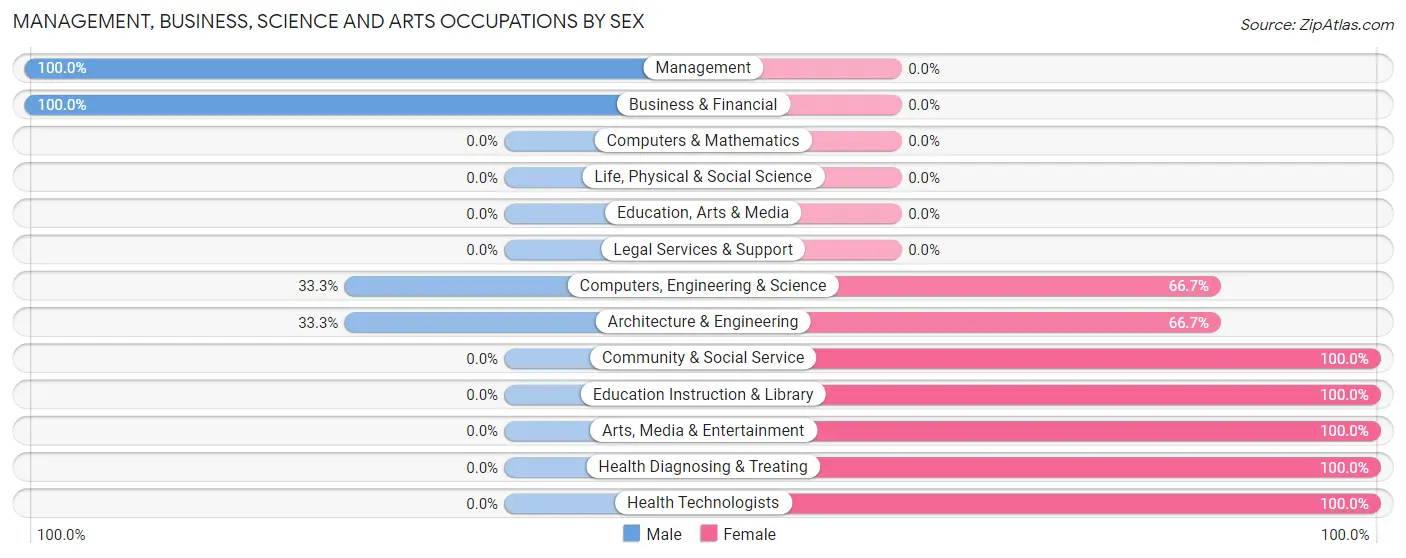
Management, Business, Science and Arts Occupations
The most common Management, Business, Science and Arts occupations in Greeley are Health Diagnosing & Treating (11 | 7.2%), Community & Social Service (9 | 5.9%), Education Instruction & Library (6 | 4.0%), Health Technologists (4 | 2.6%), and Computers, Engineering & Science (3 | 2.0%).
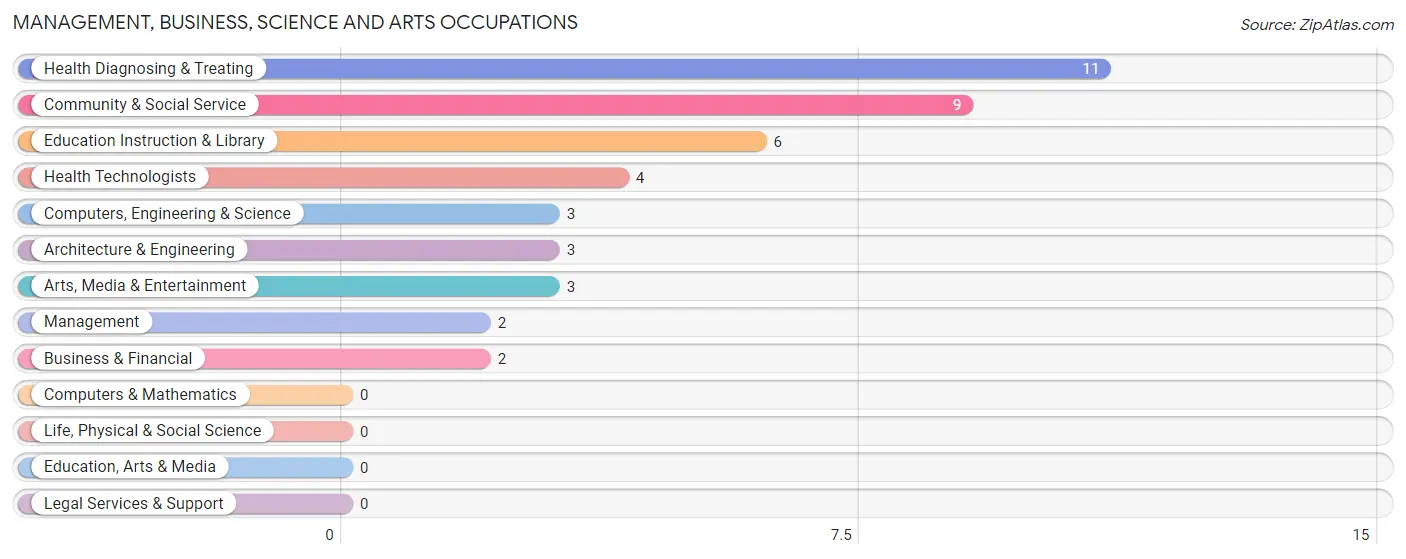
Management, Business, Science and Arts Occupations by Sex
Within the Management, Business, Science and Arts occupations in Greeley, the most male-oriented occupations are Management (100.0%), Business & Financial (100.0%), and Computers, Engineering & Science (33.3%), while the most female-oriented occupations are Community & Social Service (100.0%), Education Instruction & Library (100.0%), and Arts, Media & Entertainment (100.0%).
| Occupation | Male | Female |
| Management | 2 (100.0%) | 0 (0.0%) |
| Business & Financial | 2 (100.0%) | 0 (0.0%) |
| Computers, Engineering & Science | 1 (33.3%) | 2 (66.7%) |
| Computers & Mathematics | 0 (0.0%) | 0 (0.0%) |
| Architecture & Engineering | 1 (33.3%) | 2 (66.7%) |
| Life, Physical & Social Science | 0 (0.0%) | 0 (0.0%) |
| Community & Social Service | 0 (0.0%) | 9 (100.0%) |
| Education, Arts & Media | 0 (0.0%) | 0 (0.0%) |
| Legal Services & Support | 0 (0.0%) | 0 (0.0%) |
| Education Instruction & Library | 0 (0.0%) | 6 (100.0%) |
| Arts, Media & Entertainment | 0 (0.0%) | 3 (100.0%) |
| Health Diagnosing & Treating | 0 (0.0%) | 11 (100.0%) |
| Health Technologists | 0 (0.0%) | 4 (100.0%) |
| Total (Category) | 5 (18.5%) | 22 (81.5%) |
| Total (Overall) | 78 (51.3%) | 74 (48.7%) |
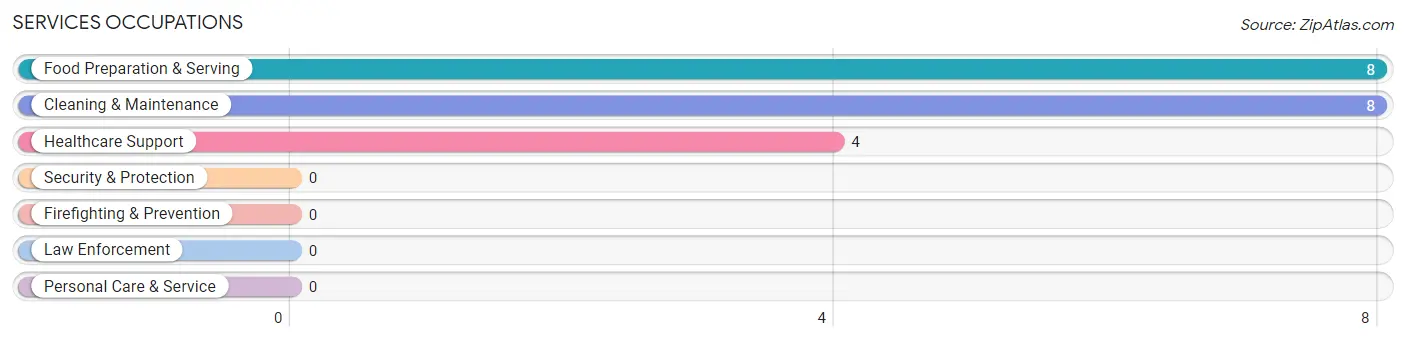
Services Occupations
The most common Services occupations in Greeley are Food Preparation & Serving (8 | 5.3%), Cleaning & Maintenance (8 | 5.3%), and Healthcare Support (4 | 2.6%).
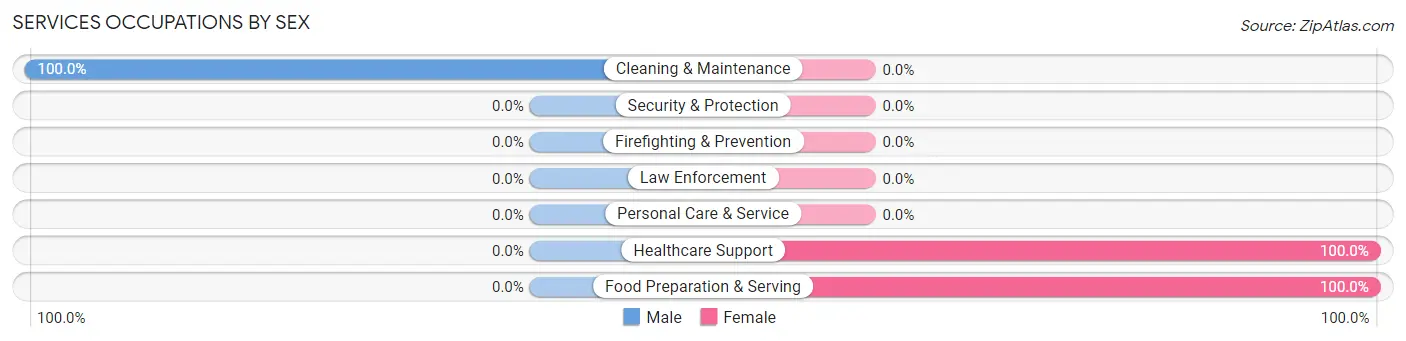
Services Occupations by Sex
| Occupation | Male | Female |
| Healthcare Support | 0 (0.0%) | 4 (100.0%) |
| Security & Protection | 0 (0.0%) | 0 (0.0%) |
| Firefighting & Prevention | 0 (0.0%) | 0 (0.0%) |
| Law Enforcement | 0 (0.0%) | 0 (0.0%) |
| Food Preparation & Serving | 0 (0.0%) | 8 (100.0%) |
| Cleaning & Maintenance | 8 (100.0%) | 0 (0.0%) |
| Personal Care & Service | 0 (0.0%) | 0 (0.0%) |
| Total (Category) | 8 (40.0%) | 12 (60.0%) |
| Total (Overall) | 78 (51.3%) | 74 (48.7%) |
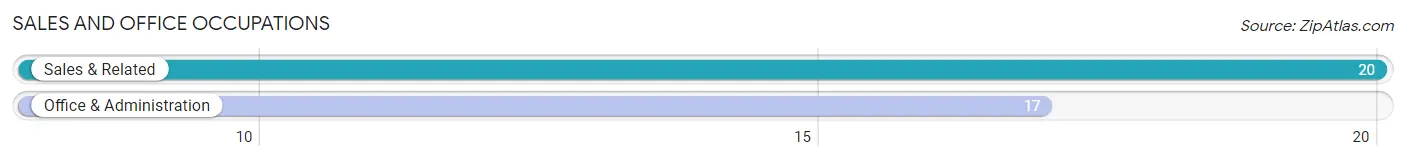
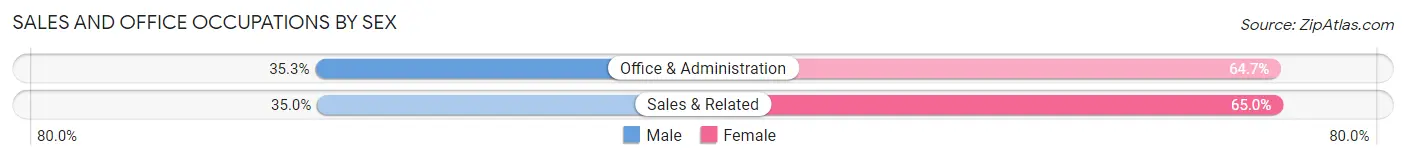
Sales and Office Occupations
The most common Sales and Office occupations in Greeley are Sales & Related (20 | 13.2%), and Office & Administration (17 | 11.2%).
Sales and Office Occupations by Sex
| Occupation | Male | Female |
| Sales & Related | 7 (35.0%) | 13 (65.0%) |
| Office & Administration | 6 (35.3%) | 11 (64.7%) |
| Total (Category) | 13 (35.1%) | 24 (64.9%) |
| Total (Overall) | 78 (51.3%) | 74 (48.7%) |
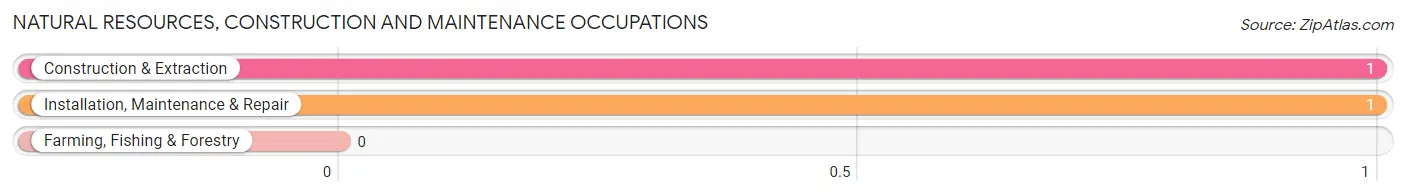
Natural Resources, Construction and Maintenance Occupations
The most common Natural Resources, Construction and Maintenance occupations in Greeley are Construction & Extraction (1 | 0.7%), and Installation, Maintenance & Repair (1 | 0.7%).
Natural Resources, Construction and Maintenance Occupations by Sex
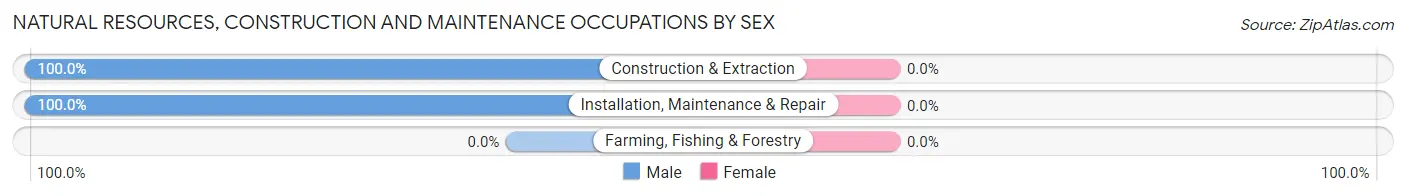
| Occupation | Male | Female |
| Farming, Fishing & Forestry | 0 (0.0%) | 0 (0.0%) |
| Construction & Extraction | 1 (100.0%) | 0 (0.0%) |
| Installation, Maintenance & Repair | 1 (100.0%) | 0 (0.0%) |
| Total (Category) | 2 (100.0%) | 0 (0.0%) |
| Total (Overall) | 78 (51.3%) | 74 (48.7%) |
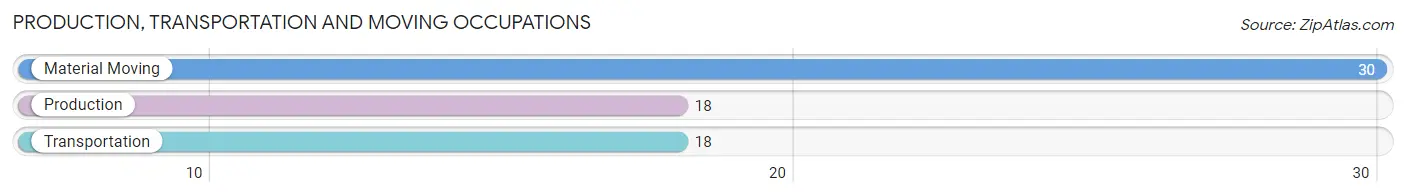
Production, Transportation and Moving Occupations
The most common Production, Transportation and Moving occupations in Greeley are Material Moving (30 | 19.7%), Production (18 | 11.8%), and Transportation (18 | 11.8%).
Production, Transportation and Moving Occupations by Sex
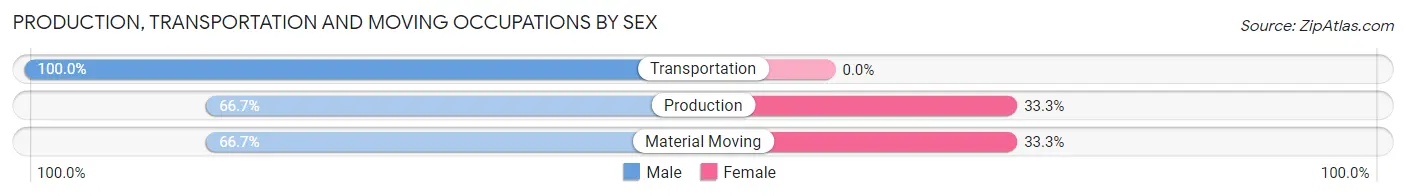
| Occupation | Male | Female |
| Production | 12 (66.7%) | 6 (33.3%) |
| Transportation | 18 (100.0%) | 0 (0.0%) |
| Material Moving | 20 (66.7%) | 10 (33.3%) |
| Total (Category) | 50 (75.8%) | 16 (24.2%) |
| Total (Overall) | 78 (51.3%) | 74 (48.7%) |
Employment Industries by Sex in Greeley
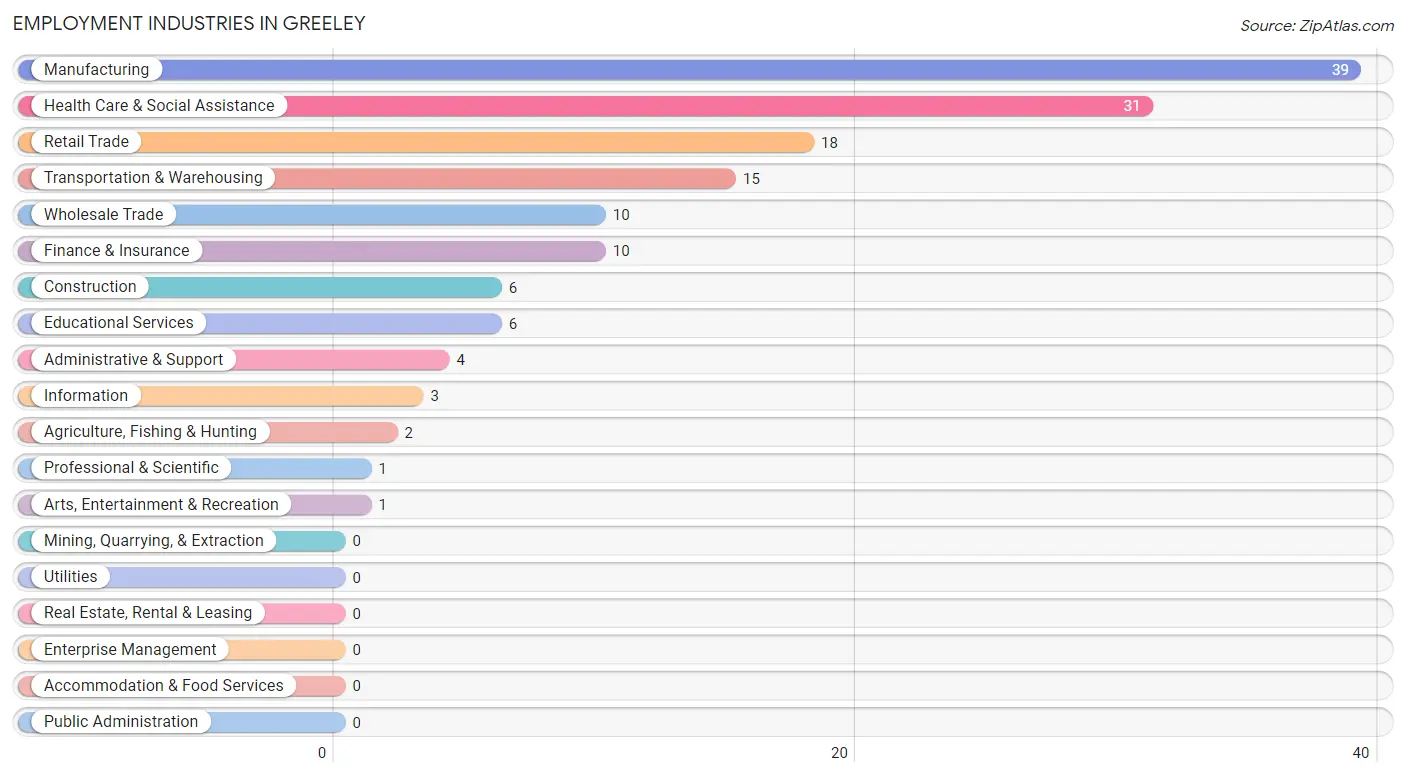
Employment Industries in Greeley
The major employment industries in Greeley include Manufacturing (39 | 25.7%), Health Care & Social Assistance (31 | 20.4%), Retail Trade (18 | 11.8%), Transportation & Warehousing (15 | 9.9%), and Wholesale Trade (10 | 6.6%).
Employment Industries by Sex in Greeley
The Greeley industries that see more men than women are Agriculture, Fishing & Hunting (100.0%), Construction (100.0%), and Wholesale Trade (100.0%), whereas the industries that tend to have a higher number of women are Information (100.0%), Educational Services (100.0%), and Health Care & Social Assistance (100.0%).
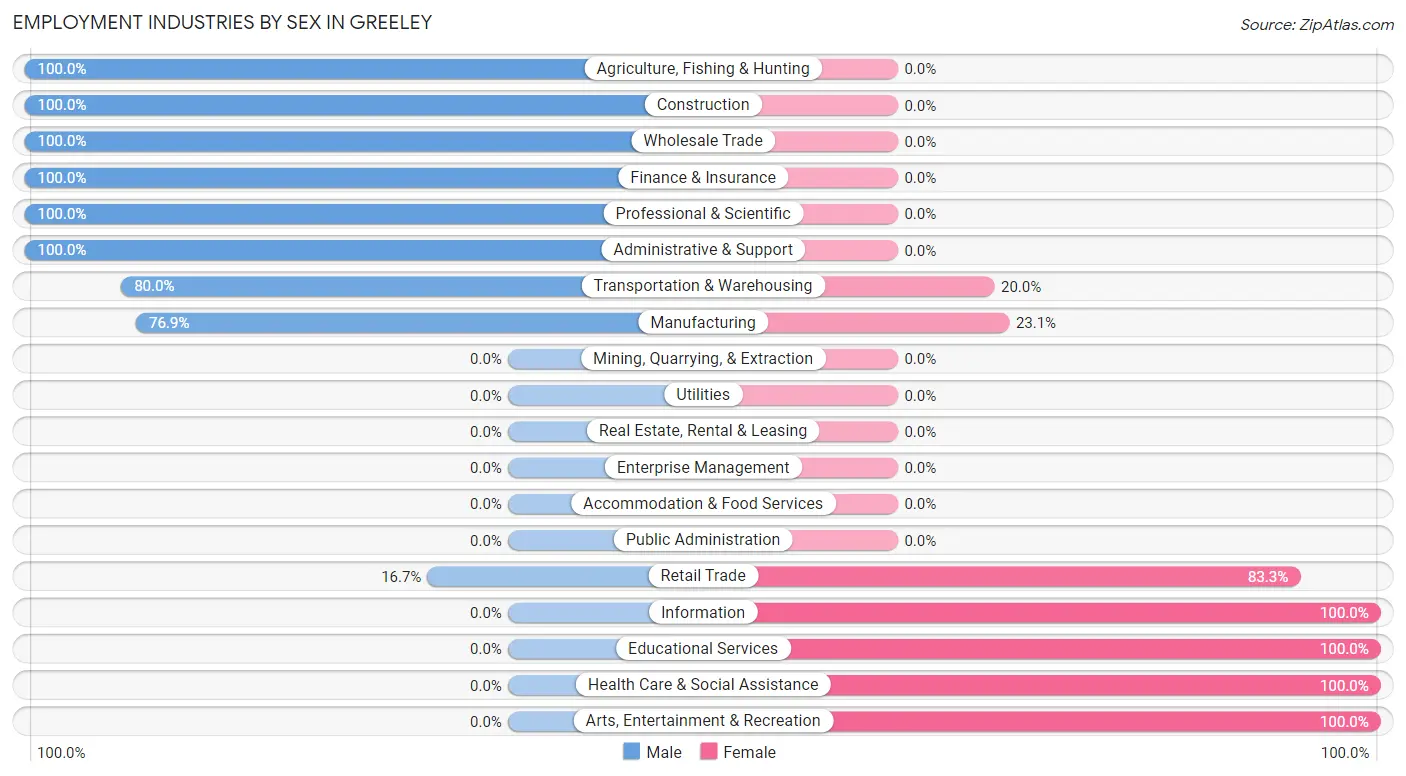
| Industry | Male | Female |
| Agriculture, Fishing & Hunting | 2 (100.0%) | 0 (0.0%) |
| Mining, Quarrying, & Extraction | 0 (0.0%) | 0 (0.0%) |
| Construction | 6 (100.0%) | 0 (0.0%) |
| Manufacturing | 30 (76.9%) | 9 (23.1%) |
| Wholesale Trade | 10 (100.0%) | 0 (0.0%) |
| Retail Trade | 3 (16.7%) | 15 (83.3%) |
| Transportation & Warehousing | 12 (80.0%) | 3 (20.0%) |
| Utilities | 0 (0.0%) | 0 (0.0%) |
| Information | 0 (0.0%) | 3 (100.0%) |
| Finance & Insurance | 10 (100.0%) | 0 (0.0%) |
| Real Estate, Rental & Leasing | 0 (0.0%) | 0 (0.0%) |
| Professional & Scientific | 1 (100.0%) | 0 (0.0%) |
| Enterprise Management | 0 (0.0%) | 0 (0.0%) |
| Administrative & Support | 4 (100.0%) | 0 (0.0%) |
| Educational Services | 0 (0.0%) | 6 (100.0%) |
| Health Care & Social Assistance | 0 (0.0%) | 31 (100.0%) |
| Arts, Entertainment & Recreation | 0 (0.0%) | 1 (100.0%) |
| Accommodation & Food Services | 0 (0.0%) | 0 (0.0%) |
| Public Administration | 0 (0.0%) | 0 (0.0%) |
| Total | 78 (51.3%) | 74 (48.7%) |
Education in Greeley
School Enrollment in Greeley
The most common levels of schooling among the 66 students in Greeley are nursery / preschool (23 | 34.8%), high school (18 | 27.3%), and middle school (11 | 16.7%).
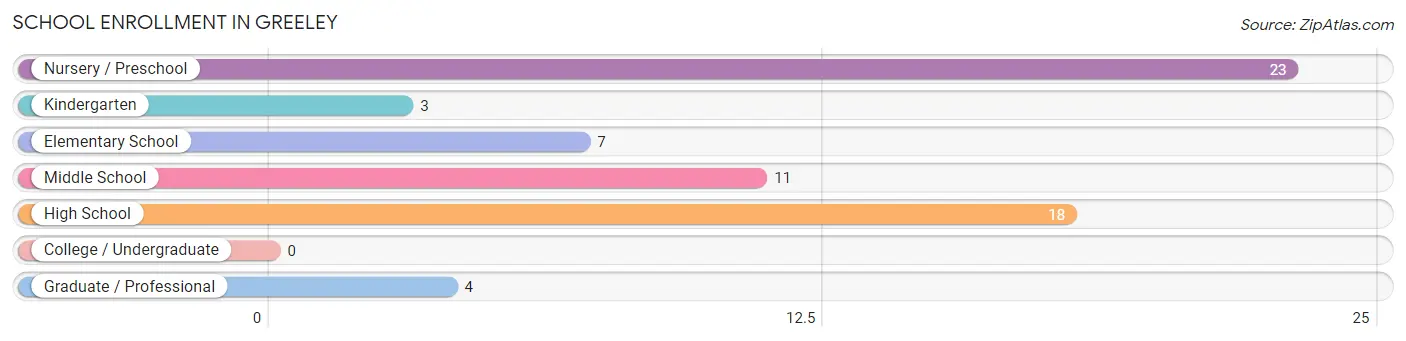
| School Level | # Students | % Students |
| Nursery / Preschool | 23 | 34.8% |
| Kindergarten | 3 | 4.5% |
| Elementary School | 7 | 10.6% |
| Middle School | 11 | 16.7% |
| High School | 18 | 27.3% |
| College / Undergraduate | 0 | 0.0% |
| Graduate / Professional | 4 | 6.1% |
| Total | 66 | 100.0% |
School Enrollment by Age by Funding Source in Greeley
Out of a total of 66 students who are enrolled in schools in Greeley, 2 (3.0%) attend a private institution, while the remaining 64 (97.0%) are enrolled in public schools. The age group of 35 years and over has the highest likelihood of being enrolled in private schools, with 2 (50.0% in the age bracket) enrolled. Conversely, the age group of 3 to 4 year olds has the lowest likelihood of being enrolled in a private school, with 23 (100.0% in the age bracket) attending a public institution.
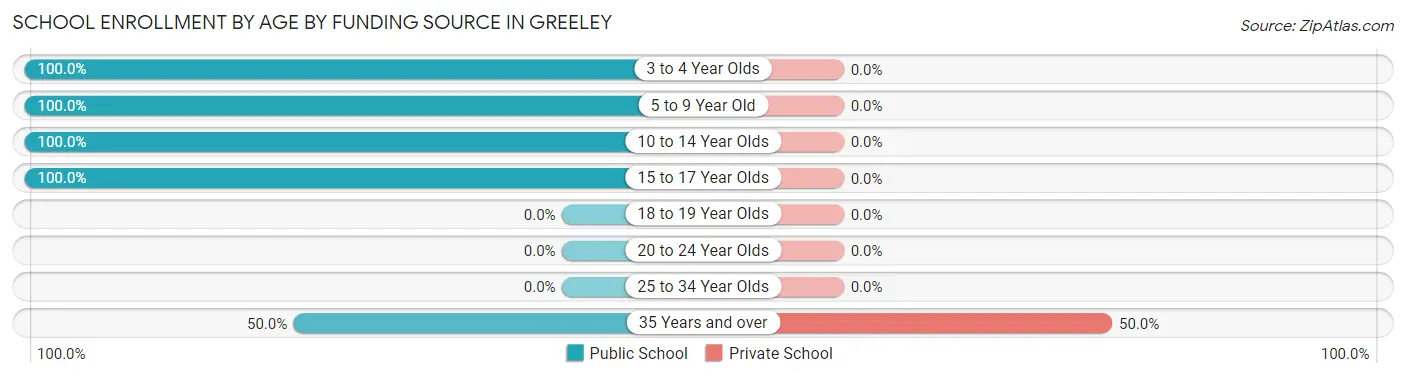
| Age Bracket | Public School | Private School |
| 3 to 4 Year Olds | 23 (100.0%) | 0 (0.0%) |
| 5 to 9 Year Old | 10 (100.0%) | 0 (0.0%) |
| 10 to 14 Year Olds | 16 (100.0%) | 0 (0.0%) |
| 15 to 17 Year Olds | 13 (100.0%) | 0 (0.0%) |
| 18 to 19 Year Olds | 0 (0.0%) | 0 (0.0%) |
| 20 to 24 Year Olds | 0 (0.0%) | 0 (0.0%) |
| 25 to 34 Year Olds | 0 (0.0%) | 0 (0.0%) |
| 35 Years and over | 2 (50.0%) | 2 (50.0%) |
| Total | 64 (97.0%) | 2 (3.0%) |
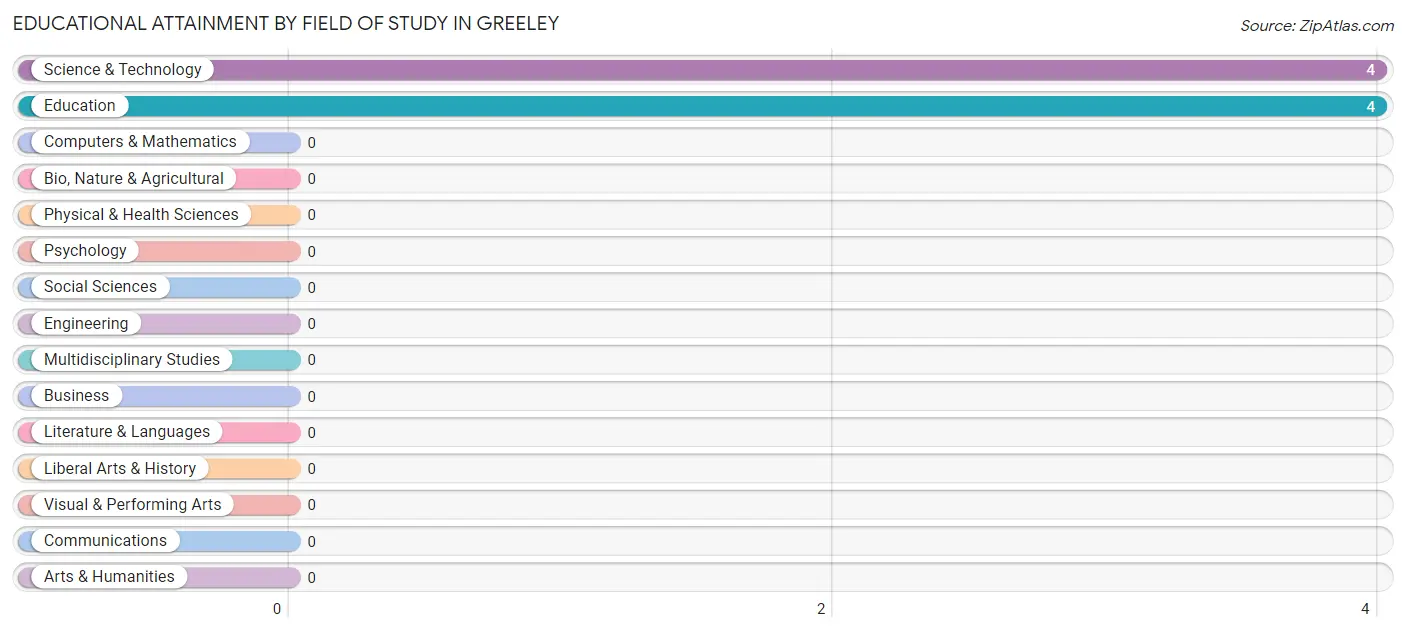
Educational Attainment by Field of Study in Greeley
Science & technology (4 | 50.0%), and education (4 | 50.0%) are the most common fields of study among 8 individuals in Greeley who have obtained a bachelor's degree or higher.
| Field of Study | # Graduates | % Graduates |
| Computers & Mathematics | 0 | 0.0% |
| Bio, Nature & Agricultural | 0 | 0.0% |
| Physical & Health Sciences | 0 | 0.0% |
| Psychology | 0 | 0.0% |
| Social Sciences | 0 | 0.0% |
| Engineering | 0 | 0.0% |
| Multidisciplinary Studies | 0 | 0.0% |
| Science & Technology | 4 | 50.0% |
| Business | 0 | 0.0% |
| Education | 4 | 50.0% |
| Literature & Languages | 0 | 0.0% |
| Liberal Arts & History | 0 | 0.0% |
| Visual & Performing Arts | 0 | 0.0% |
| Communications | 0 | 0.0% |
| Arts & Humanities | 0 | 0.0% |
| Total | 8 | 100.0% |
Transportation & Commute in Greeley
Vehicle Availability by Sex in Greeley
The most prevalent vehicle ownership categories in Greeley are males with 2 vehicles (33, accounting for 42.3%) and females with 2 vehicles (21, making up 44.6%).
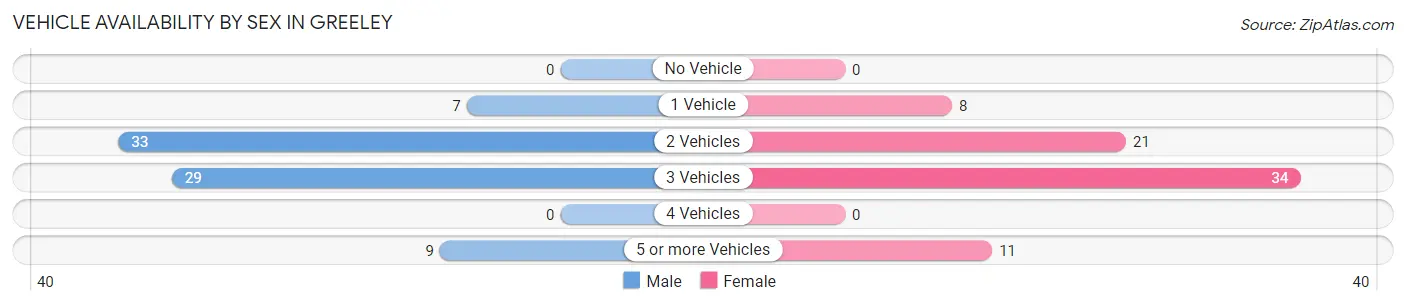
| Vehicles Available | Male | Female |
| No Vehicle | 0 (0.0%) | 0 (0.0%) |
| 1 Vehicle | 7 (9.0%) | 8 (10.8%) |
| 2 Vehicles | 33 (42.3%) | 21 (28.4%) |
| 3 Vehicles | 29 (37.2%) | 34 (46.0%) |
| 4 Vehicles | 0 (0.0%) | 0 (0.0%) |
| 5 or more Vehicles | 9 (11.5%) | 11 (14.9%) |
| Total | 78 (100.0%) | 74 (100.0%) |
Commute Time in Greeley
The most frequently occuring commute durations in Greeley are 20 to 24 minutes (28 commuters, 19.4%), 15 to 19 minutes (24 commuters, 16.7%), and 25 to 29 minutes (23 commuters, 16.0%).
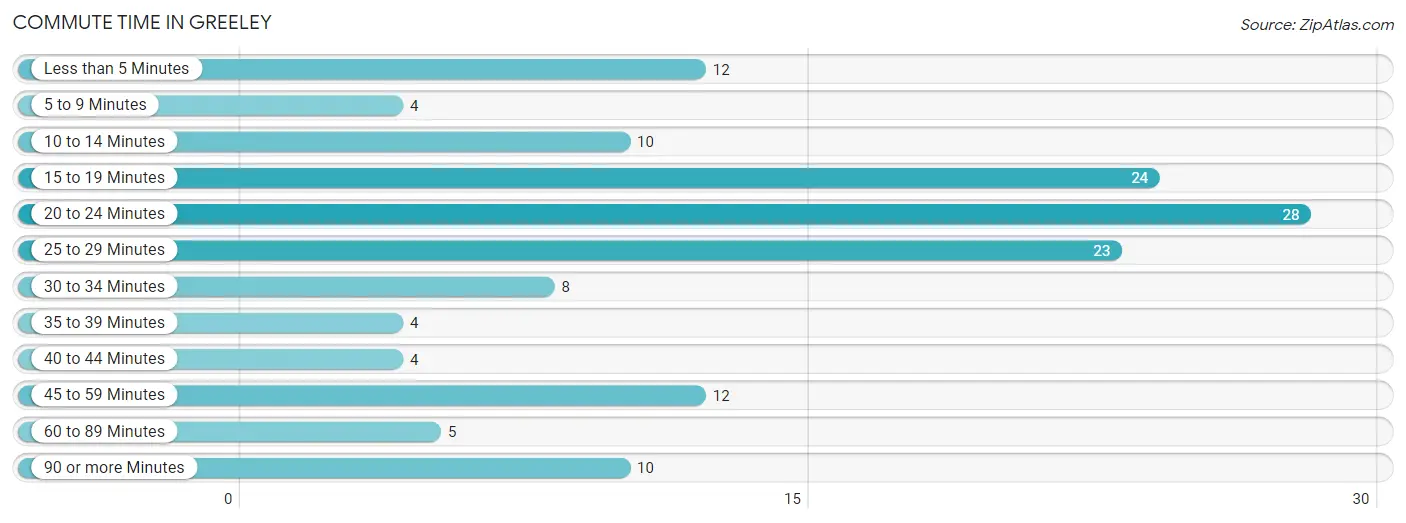
| Commute Time | # Commuters | % Commuters |
| Less than 5 Minutes | 12 | 8.3% |
| 5 to 9 Minutes | 4 | 2.8% |
| 10 to 14 Minutes | 10 | 6.9% |
| 15 to 19 Minutes | 24 | 16.7% |
| 20 to 24 Minutes | 28 | 19.4% |
| 25 to 29 Minutes | 23 | 16.0% |
| 30 to 34 Minutes | 8 | 5.6% |
| 35 to 39 Minutes | 4 | 2.8% |
| 40 to 44 Minutes | 4 | 2.8% |
| 45 to 59 Minutes | 12 | 8.3% |
| 60 to 89 Minutes | 5 | 3.5% |
| 90 or more Minutes | 10 | 6.9% |
Commute Time by Sex in Greeley
The most common commute times in Greeley are 20 to 24 minutes (17 commuters, 23.0%) for males and 15 to 19 minutes (14 commuters, 20.0%) for females.
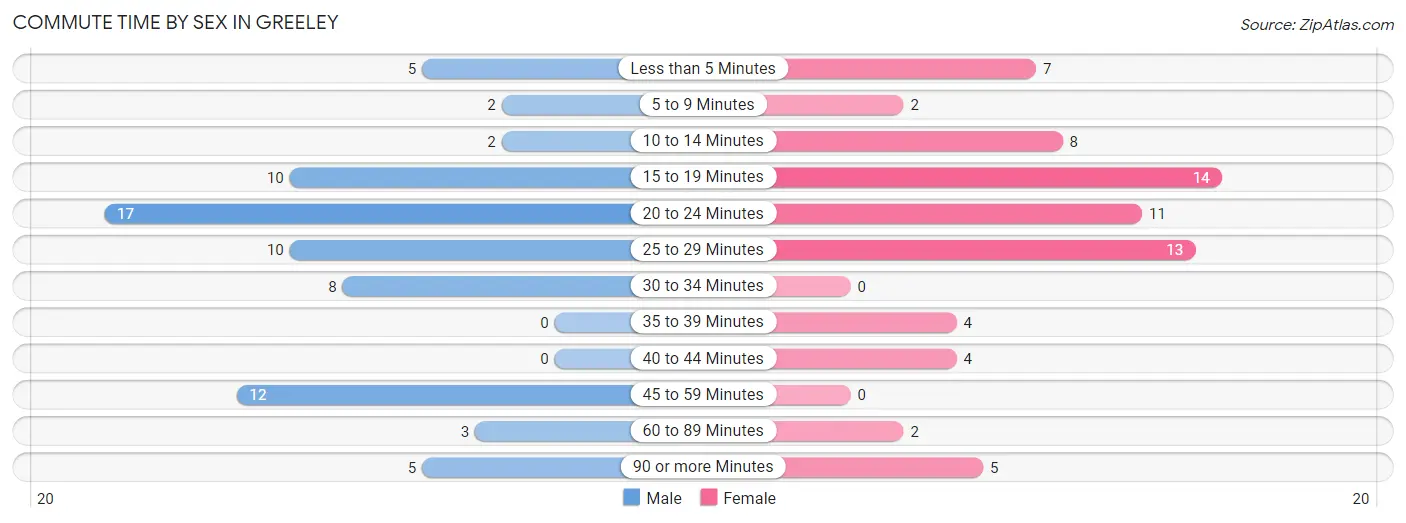
| Commute Time | Male | Female |
| Less than 5 Minutes | 5 (6.8%) | 7 (10.0%) |
| 5 to 9 Minutes | 2 (2.7%) | 2 (2.9%) |
| 10 to 14 Minutes | 2 (2.7%) | 8 (11.4%) |
| 15 to 19 Minutes | 10 (13.5%) | 14 (20.0%) |
| 20 to 24 Minutes | 17 (23.0%) | 11 (15.7%) |
| 25 to 29 Minutes | 10 (13.5%) | 13 (18.6%) |
| 30 to 34 Minutes | 8 (10.8%) | 0 (0.0%) |
| 35 to 39 Minutes | 0 (0.0%) | 4 (5.7%) |
| 40 to 44 Minutes | 0 (0.0%) | 4 (5.7%) |
| 45 to 59 Minutes | 12 (16.2%) | 0 (0.0%) |
| 60 to 89 Minutes | 3 (4.1%) | 2 (2.9%) |
| 90 or more Minutes | 5 (6.8%) | 5 (7.1%) |
Time of Departure to Work by Sex in Greeley
The most frequent times of departure to work in Greeley are 12:00 PM to 3:59 PM (16, 21.6%) for males and 7:00 AM to 7:29 AM (19, 27.1%) for females.
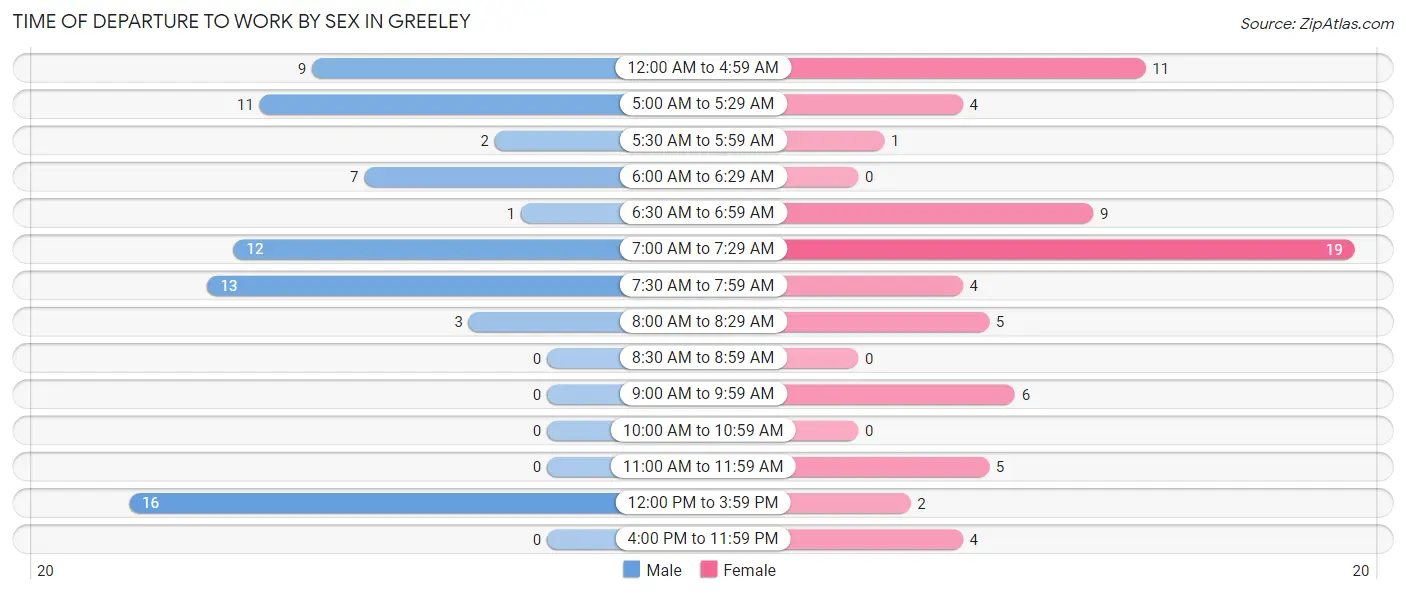
| Time of Departure | Male | Female |
| 12:00 AM to 4:59 AM | 9 (12.2%) | 11 (15.7%) |
| 5:00 AM to 5:29 AM | 11 (14.9%) | 4 (5.7%) |
| 5:30 AM to 5:59 AM | 2 (2.7%) | 1 (1.4%) |
| 6:00 AM to 6:29 AM | 7 (9.5%) | 0 (0.0%) |
| 6:30 AM to 6:59 AM | 1 (1.3%) | 9 (12.9%) |
| 7:00 AM to 7:29 AM | 12 (16.2%) | 19 (27.1%) |
| 7:30 AM to 7:59 AM | 13 (17.6%) | 4 (5.7%) |
| 8:00 AM to 8:29 AM | 3 (4.1%) | 5 (7.1%) |
| 8:30 AM to 8:59 AM | 0 (0.0%) | 0 (0.0%) |
| 9:00 AM to 9:59 AM | 0 (0.0%) | 6 (8.6%) |
| 10:00 AM to 10:59 AM | 0 (0.0%) | 0 (0.0%) |
| 11:00 AM to 11:59 AM | 0 (0.0%) | 5 (7.1%) |
| 12:00 PM to 3:59 PM | 16 (21.6%) | 2 (2.9%) |
| 4:00 PM to 11:59 PM | 0 (0.0%) | 4 (5.7%) |
| Total | 74 (100.0%) | 70 (100.0%) |
Housing Occupancy in Greeley
Occupancy by Ownership in Greeley
Of the total 112 dwellings in Greeley, owner-occupied units account for 81 (72.3%), while renter-occupied units make up 31 (27.7%).
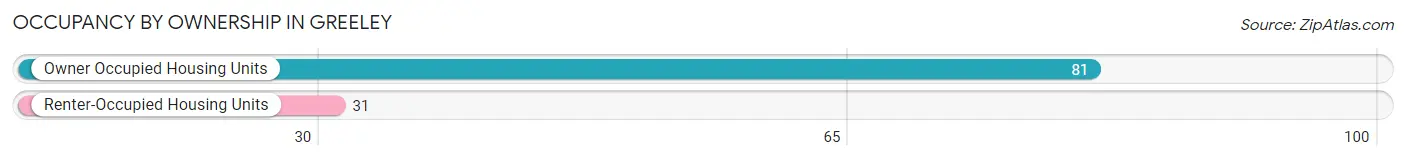
| Occupancy | # Housing Units | % Housing Units |
| Owner Occupied Housing Units | 81 | 72.3% |
| Renter-Occupied Housing Units | 31 | 27.7% |
| Total Occupied Housing Units | 112 | 100.0% |
Occupancy by Household Size in Greeley
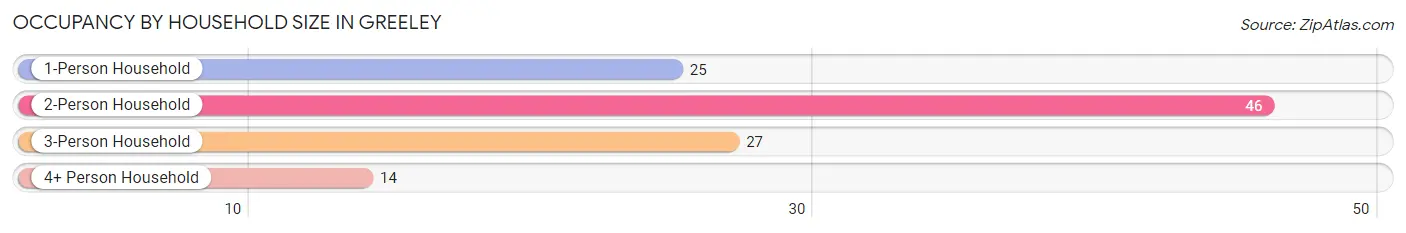
| Household Size | # Housing Units | % Housing Units |
| 1-Person Household | 25 | 22.3% |
| 2-Person Household | 46 | 41.1% |
| 3-Person Household | 27 | 24.1% |
| 4+ Person Household | 14 | 12.5% |
| Total Housing Units | 112 | 100.0% |
Occupancy by Ownership by Household Size in Greeley
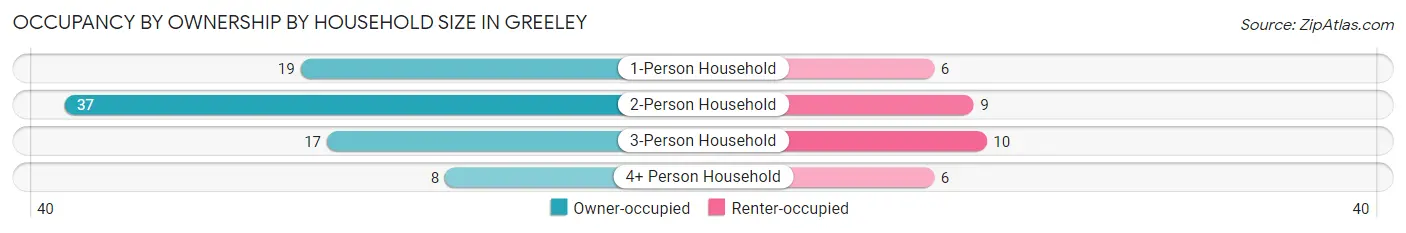
| Household Size | Owner-occupied | Renter-occupied |
| 1-Person Household | 19 (76.0%) | 6 (24.0%) |
| 2-Person Household | 37 (80.4%) | 9 (19.6%) |
| 3-Person Household | 17 (63.0%) | 10 (37.0%) |
| 4+ Person Household | 8 (57.1%) | 6 (42.9%) |
| Total Housing Units | 81 (72.3%) | 31 (27.7%) |
Occupancy by Educational Attainment in Greeley
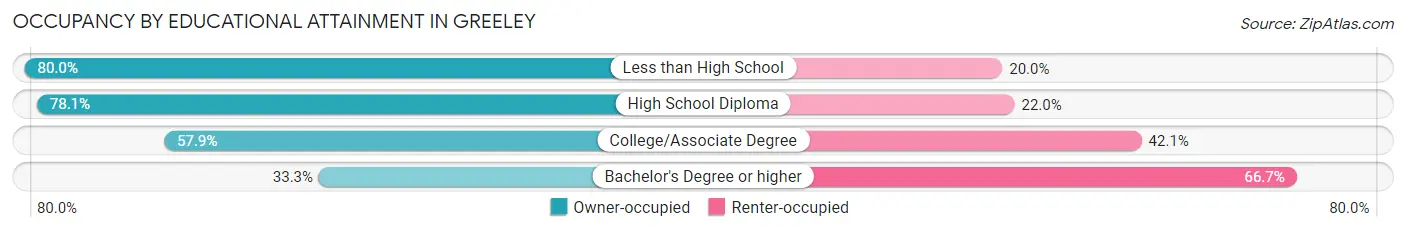
| Household Size | Owner-occupied | Renter-occupied |
| Less than High School | 4 (80.0%) | 1 (20.0%) |
| High School Diploma | 64 (78.0%) | 18 (22.0%) |
| College/Associate Degree | 11 (57.9%) | 8 (42.1%) |
| Bachelor's Degree or higher | 2 (33.3%) | 4 (66.7%) |
Occupancy by Age of Householder in Greeley
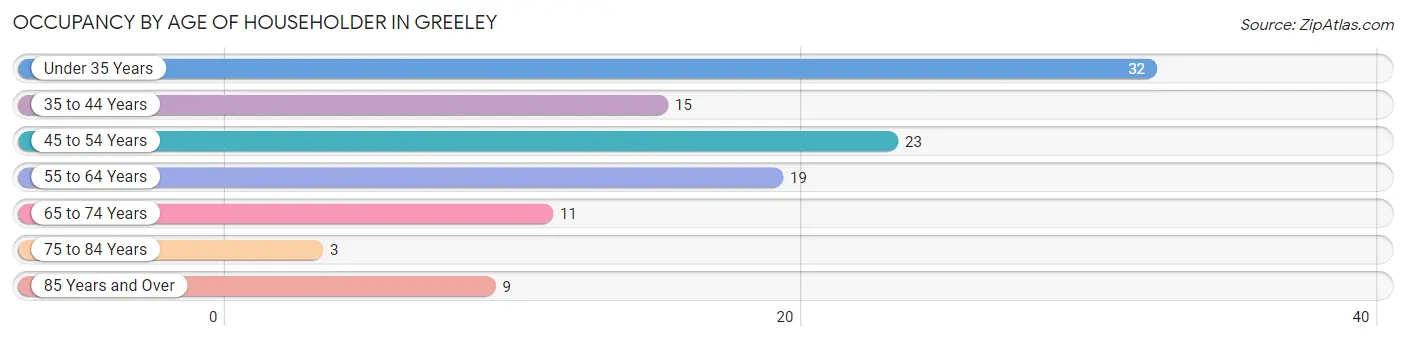
| Age Bracket | # Households | % Households |
| Under 35 Years | 32 | 28.6% |
| 35 to 44 Years | 15 | 13.4% |
| 45 to 54 Years | 23 | 20.5% |
| 55 to 64 Years | 19 | 17.0% |
| 65 to 74 Years | 11 | 9.8% |
| 75 to 84 Years | 3 | 2.7% |
| 85 Years and Over | 9 | 8.0% |
| Total | 112 | 100.0% |
Housing Finances in Greeley
Median Income by Occupancy in Greeley
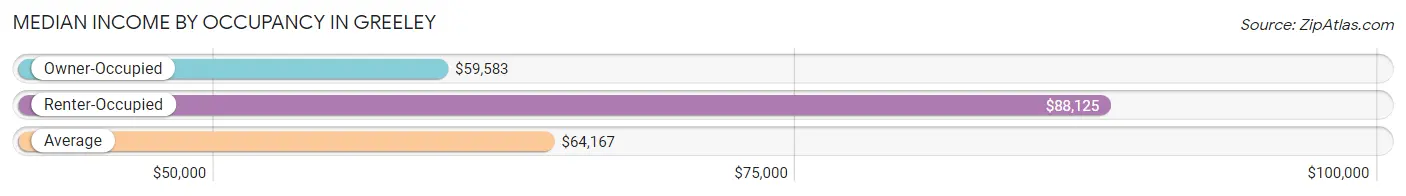
| Occupancy Type | # Households | Median Income |
| Owner-Occupied | 81 (72.3%) | $59,583 |
| Renter-Occupied | 31 (27.7%) | $88,125 |
| Average | 112 (100.0%) | $64,167 |
Occupancy by Householder Income Bracket in Greeley
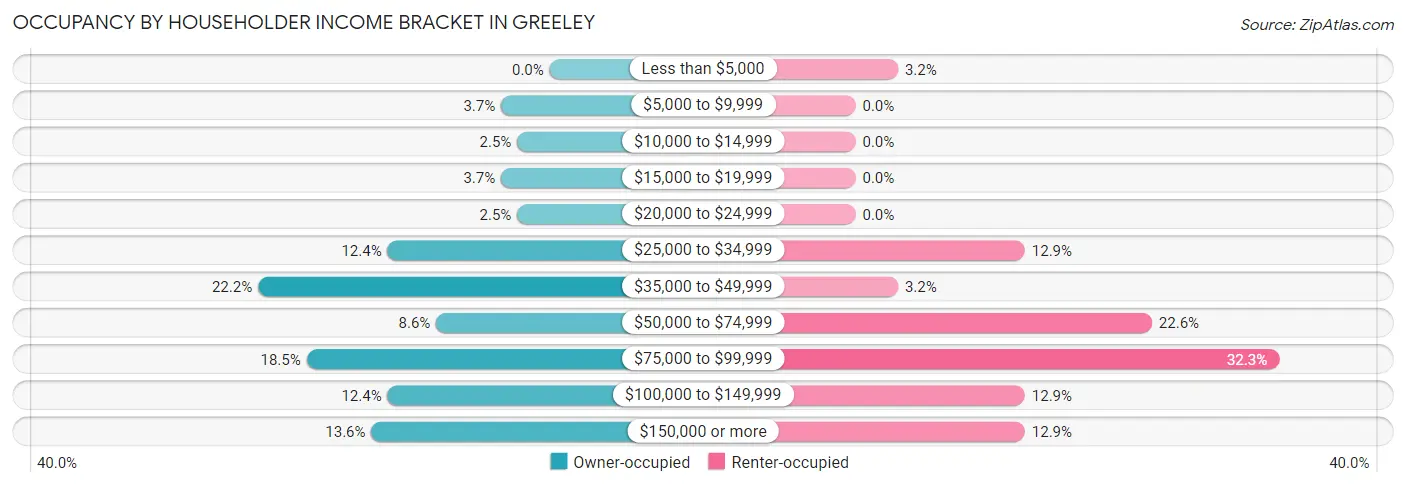
| Income Bracket | Owner-occupied | Renter-occupied |
| Less than $5,000 | 0 (0.0%) | 1 (3.2%) |
| $5,000 to $9,999 | 3 (3.7%) | 0 (0.0%) |
| $10,000 to $14,999 | 2 (2.5%) | 0 (0.0%) |
| $15,000 to $19,999 | 3 (3.7%) | 0 (0.0%) |
| $20,000 to $24,999 | 2 (2.5%) | 0 (0.0%) |
| $25,000 to $34,999 | 10 (12.3%) | 4 (12.9%) |
| $35,000 to $49,999 | 18 (22.2%) | 1 (3.2%) |
| $50,000 to $74,999 | 7 (8.6%) | 7 (22.6%) |
| $75,000 to $99,999 | 15 (18.5%) | 10 (32.3%) |
| $100,000 to $149,999 | 10 (12.3%) | 4 (12.9%) |
| $150,000 or more | 11 (13.6%) | 4 (12.9%) |
| Total | 81 (100.0%) | 31 (100.0%) |
Monthly Housing Cost Tiers in Greeley
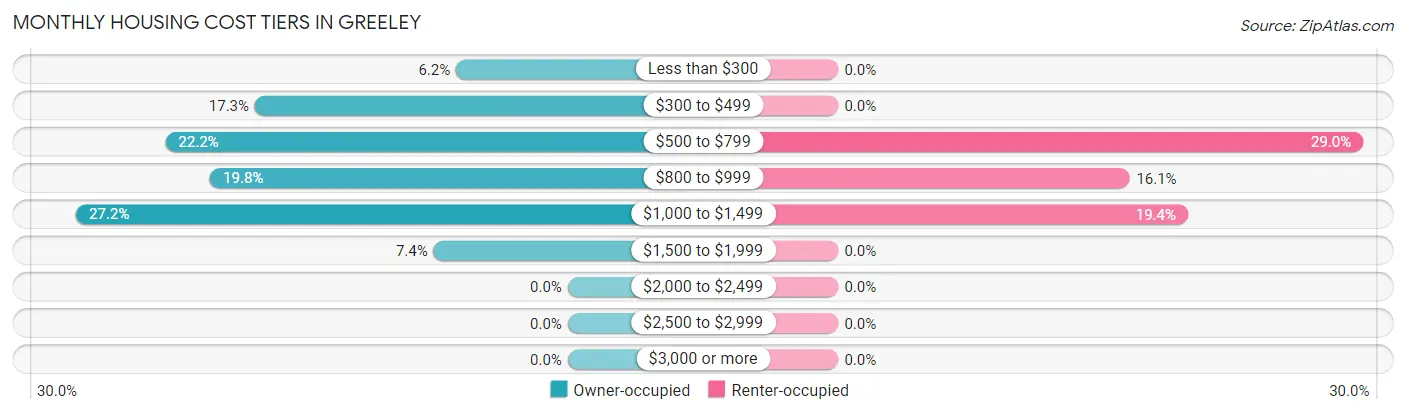
| Monthly Cost | Owner-occupied | Renter-occupied |
| Less than $300 | 5 (6.2%) | 0 (0.0%) |
| $300 to $499 | 14 (17.3%) | 0 (0.0%) |
| $500 to $799 | 18 (22.2%) | 9 (29.0%) |
| $800 to $999 | 16 (19.8%) | 5 (16.1%) |
| $1,000 to $1,499 | 22 (27.2%) | 6 (19.4%) |
| $1,500 to $1,999 | 6 (7.4%) | 0 (0.0%) |
| $2,000 to $2,499 | 0 (0.0%) | 0 (0.0%) |
| $2,500 to $2,999 | 0 (0.0%) | 0 (0.0%) |
| $3,000 or more | 0 (0.0%) | 0 (0.0%) |
| Total | 81 (100.0%) | 31 (100.0%) |
Physical Housing Characteristics in Greeley
Housing Structures in Greeley
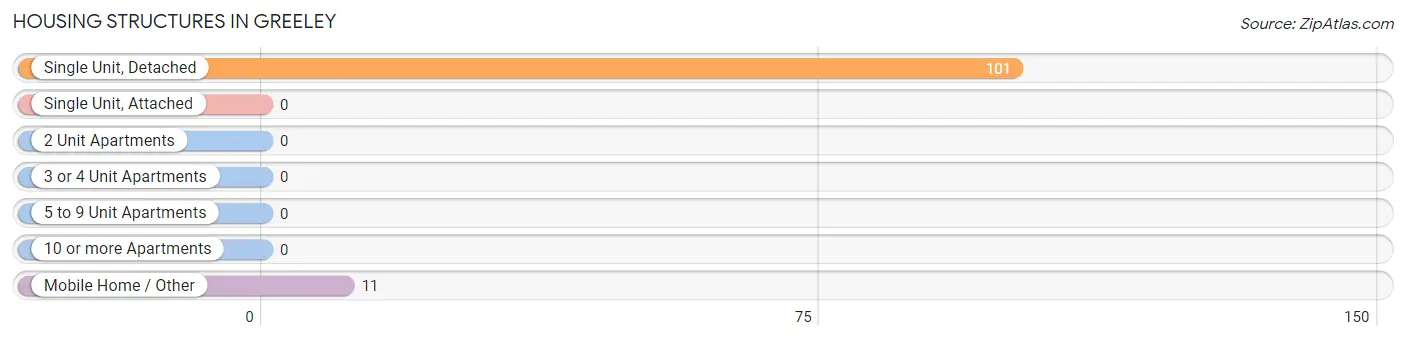
| Structure Type | # Housing Units | % Housing Units |
| Single Unit, Detached | 101 | 90.2% |
| Single Unit, Attached | 0 | 0.0% |
| 2 Unit Apartments | 0 | 0.0% |
| 3 or 4 Unit Apartments | 0 | 0.0% |
| 5 to 9 Unit Apartments | 0 | 0.0% |
| 10 or more Apartments | 0 | 0.0% |
| Mobile Home / Other | 11 | 9.8% |
| Total | 112 | 100.0% |
Housing Structures by Occupancy in Greeley
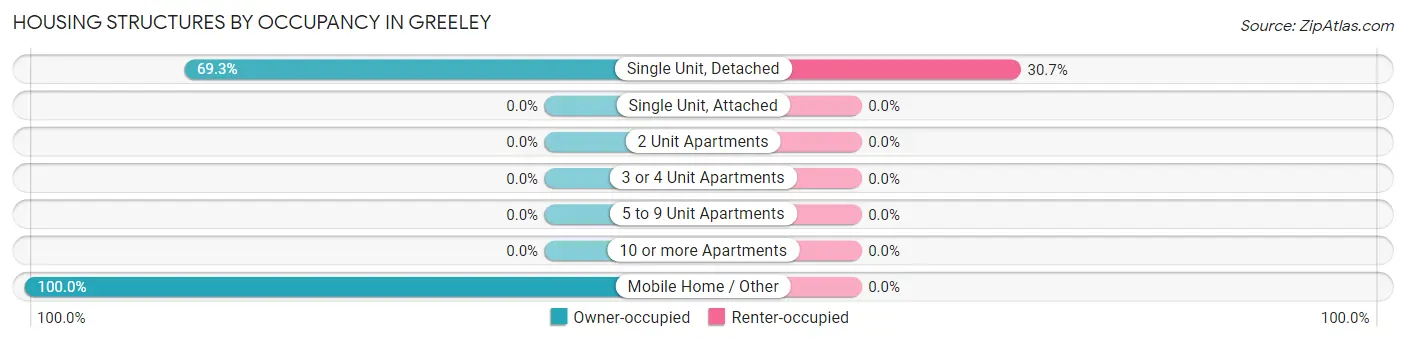
| Structure Type | Owner-occupied | Renter-occupied |
| Single Unit, Detached | 70 (69.3%) | 31 (30.7%) |
| Single Unit, Attached | 0 (0.0%) | 0 (0.0%) |
| 2 Unit Apartments | 0 (0.0%) | 0 (0.0%) |
| 3 or 4 Unit Apartments | 0 (0.0%) | 0 (0.0%) |
| 5 to 9 Unit Apartments | 0 (0.0%) | 0 (0.0%) |
| 10 or more Apartments | 0 (0.0%) | 0 (0.0%) |
| Mobile Home / Other | 11 (100.0%) | 0 (0.0%) |
| Total | 81 (72.3%) | 31 (27.7%) |
Housing Structures by Number of Rooms in Greeley
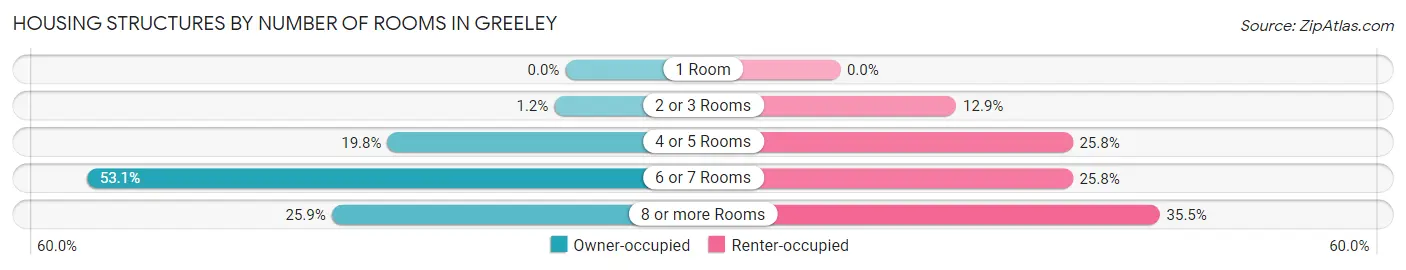
| Number of Rooms | Owner-occupied | Renter-occupied |
| 1 Room | 0 (0.0%) | 0 (0.0%) |
| 2 or 3 Rooms | 1 (1.2%) | 4 (12.9%) |
| 4 or 5 Rooms | 16 (19.8%) | 8 (25.8%) |
| 6 or 7 Rooms | 43 (53.1%) | 8 (25.8%) |
| 8 or more Rooms | 21 (25.9%) | 11 (35.5%) |
| Total | 81 (100.0%) | 31 (100.0%) |
Housing Structure by Heating Type in Greeley
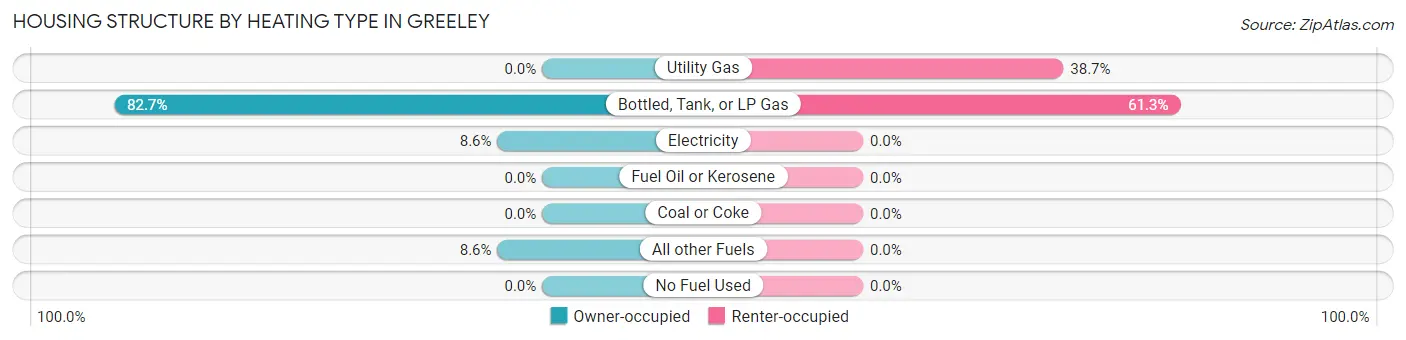
| Heating Type | Owner-occupied | Renter-occupied |
| Utility Gas | 0 (0.0%) | 12 (38.7%) |
| Bottled, Tank, or LP Gas | 67 (82.7%) | 19 (61.3%) |
| Electricity | 7 (8.6%) | 0 (0.0%) |
| Fuel Oil or Kerosene | 0 (0.0%) | 0 (0.0%) |
| Coal or Coke | 0 (0.0%) | 0 (0.0%) |
| All other Fuels | 7 (8.6%) | 0 (0.0%) |
| No Fuel Used | 0 (0.0%) | 0 (0.0%) |
| Total | 81 (100.0%) | 31 (100.0%) |
Household Vehicle Usage in Greeley
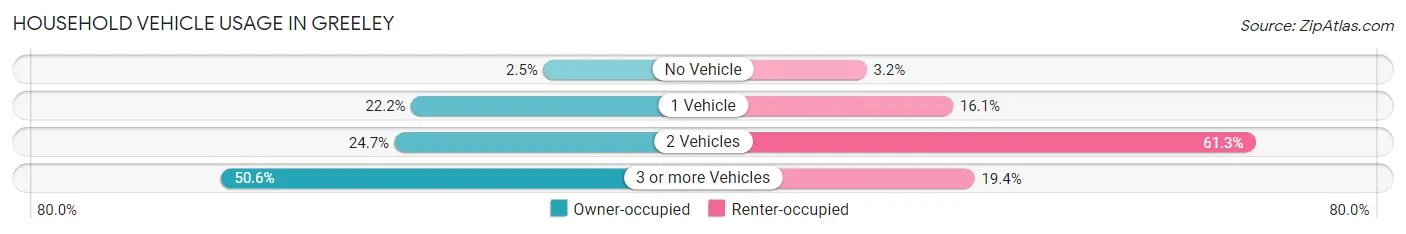
| Vehicles per Household | Owner-occupied | Renter-occupied |
| No Vehicle | 2 (2.5%) | 1 (3.2%) |
| 1 Vehicle | 18 (22.2%) | 5 (16.1%) |
| 2 Vehicles | 20 (24.7%) | 19 (61.3%) |
| 3 or more Vehicles | 41 (50.6%) | 6 (19.4%) |
| Total | 81 (100.0%) | 31 (100.0%) |
Real Estate & Mortgages in Greeley
Real Estate and Mortgage Overview in Greeley
| Characteristic | Without Mortgage | With Mortgage |
| Housing Units | 43 | 38 |
| Median Property Value | $59,400 | $108,300 |
| Median Household Income | $45,313 | $6 |
| Monthly Housing Costs | $550 | $0 |
| Real Estate Taxes | $1,313 | $3 |
Property Value by Mortgage Status in Greeley
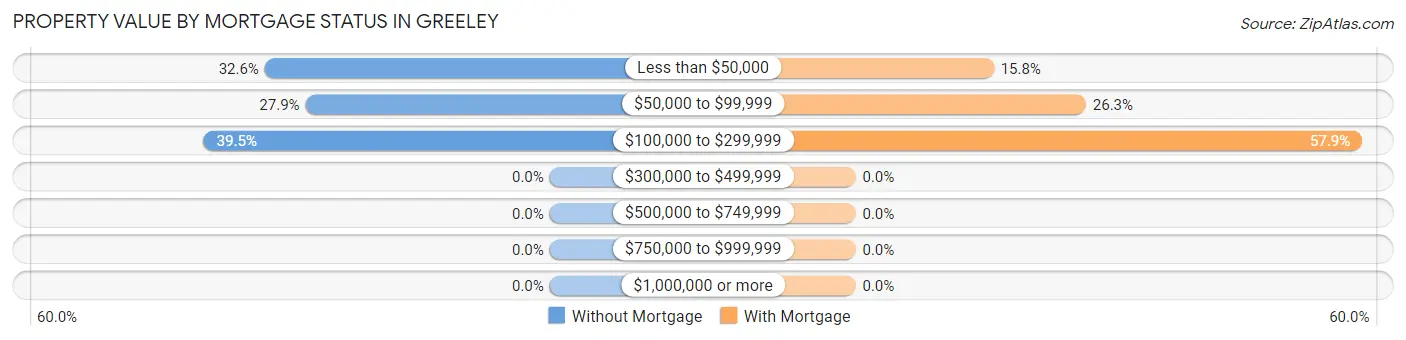
| Property Value | Without Mortgage | With Mortgage |
| Less than $50,000 | 14 (32.6%) | 6 (15.8%) |
| $50,000 to $99,999 | 12 (27.9%) | 10 (26.3%) |
| $100,000 to $299,999 | 17 (39.5%) | 22 (57.9%) |
| $300,000 to $499,999 | 0 (0.0%) | 0 (0.0%) |
| $500,000 to $749,999 | 0 (0.0%) | 0 (0.0%) |
| $750,000 to $999,999 | 0 (0.0%) | 0 (0.0%) |
| $1,000,000 or more | 0 (0.0%) | 0 (0.0%) |
| Total | 43 (100.0%) | 38 (100.0%) |
Household Income by Mortgage Status in Greeley
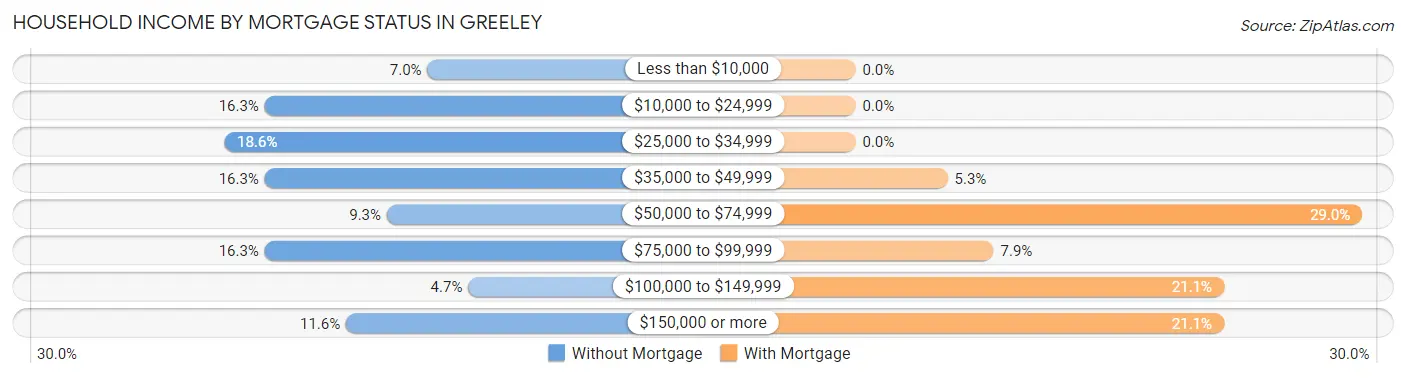
| Household Income | Without Mortgage | With Mortgage |
| Less than $10,000 | 3 (7.0%) | 0 (0.0%) |
| $10,000 to $24,999 | 7 (16.3%) | 0 (0.0%) |
| $25,000 to $34,999 | 8 (18.6%) | 0 (0.0%) |
| $35,000 to $49,999 | 7 (16.3%) | 2 (5.3%) |
| $50,000 to $74,999 | 4 (9.3%) | 11 (28.9%) |
| $75,000 to $99,999 | 7 (16.3%) | 3 (7.9%) |
| $100,000 to $149,999 | 2 (4.6%) | 8 (21.0%) |
| $150,000 or more | 5 (11.6%) | 8 (21.0%) |
| Total | 43 (100.0%) | 38 (100.0%) |
Property Value to Household Income Ratio in Greeley
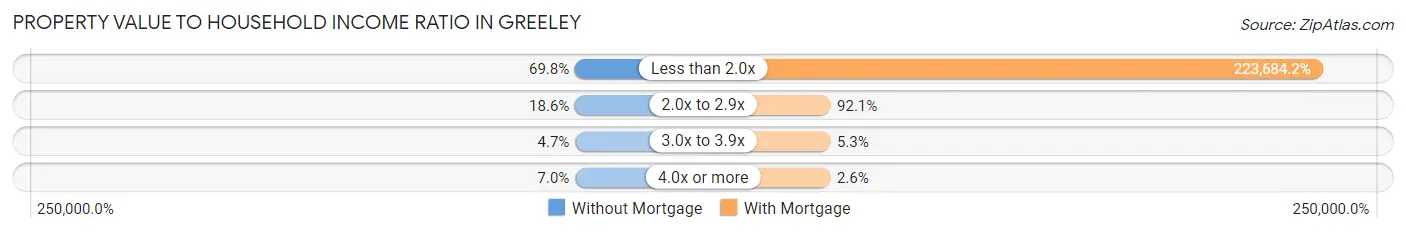
| Value-to-Income Ratio | Without Mortgage | With Mortgage |
| Less than 2.0x | 30 (69.8%) | 85,000 (223,684.2%) |
| 2.0x to 2.9x | 8 (18.6%) | 35 (92.1%) |
| 3.0x to 3.9x | 2 (4.6%) | 2 (5.3%) |
| 4.0x or more | 3 (7.0%) | 1 (2.6%) |
| Total | 43 (100.0%) | 38 (100.0%) |
Real Estate Taxes by Mortgage Status in Greeley
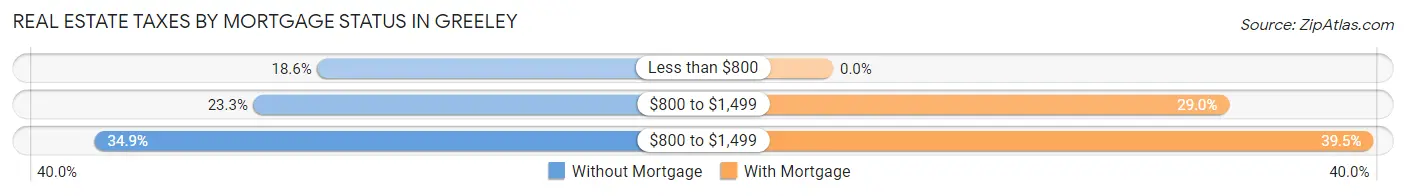
| Property Taxes | Without Mortgage | With Mortgage |
| Less than $800 | 8 (18.6%) | 0 (0.0%) |
| $800 to $1,499 | 10 (23.3%) | 11 (28.9%) |
| $800 to $1,499 | 15 (34.9%) | 15 (39.5%) |
| Total | 43 (100.0%) | 38 (100.0%) |
Health & Disability in Greeley
Health Insurance Coverage by Age in Greeley
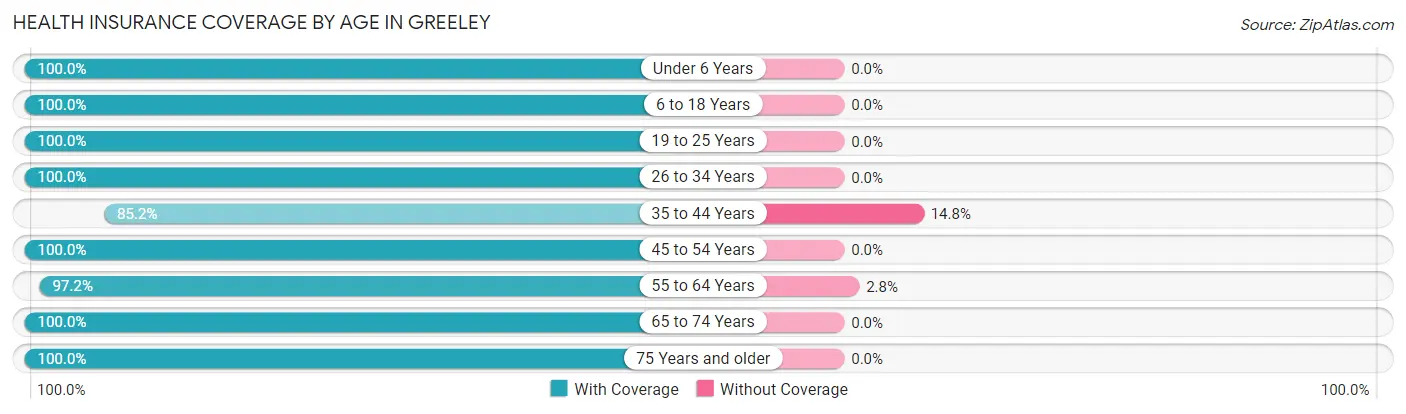
| Age Bracket | With Coverage | Without Coverage |
| Under 6 Years | 31 (100.0%) | 0 (0.0%) |
| 6 to 18 Years | 36 (100.0%) | 0 (0.0%) |
| 19 to 25 Years | 48 (100.0%) | 0 (0.0%) |
| 26 to 34 Years | 30 (100.0%) | 0 (0.0%) |
| 35 to 44 Years | 23 (85.2%) | 4 (14.8%) |
| 45 to 54 Years | 35 (100.0%) | 0 (0.0%) |
| 55 to 64 Years | 35 (97.2%) | 1 (2.8%) |
| 65 to 74 Years | 15 (100.0%) | 0 (0.0%) |
| 75 Years and older | 14 (100.0%) | 0 (0.0%) |
| Total | 267 (98.2%) | 5 (1.8%) |
Health Insurance Coverage by Citizenship Status in Greeley
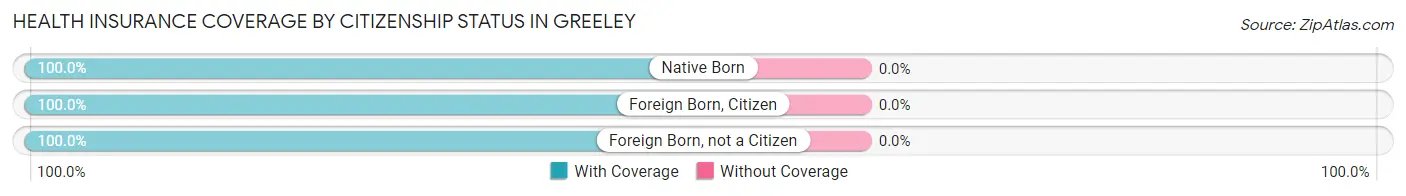
| Citizenship Status | With Coverage | Without Coverage |
| Native Born | 31 (100.0%) | 0 (0.0%) |
| Foreign Born, Citizen | 36 (100.0%) | 0 (0.0%) |
| Foreign Born, not a Citizen | 48 (100.0%) | 0 (0.0%) |
Health Insurance Coverage by Household Income in Greeley
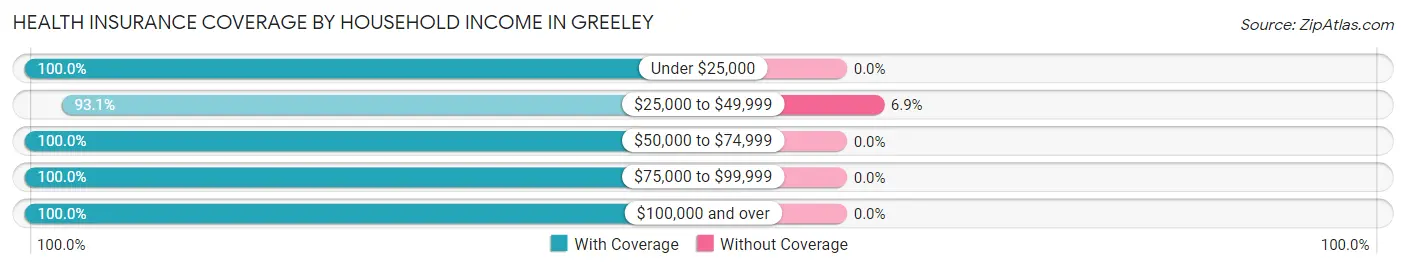
| Household Income | With Coverage | Without Coverage |
| Under $25,000 | 15 (100.0%) | 0 (0.0%) |
| $25,000 to $49,999 | 67 (93.1%) | 5 (6.9%) |
| $50,000 to $74,999 | 37 (100.0%) | 0 (0.0%) |
| $75,000 to $99,999 | 61 (100.0%) | 0 (0.0%) |
| $100,000 and over | 87 (100.0%) | 0 (0.0%) |
Public vs Private Health Insurance Coverage by Age in Greeley
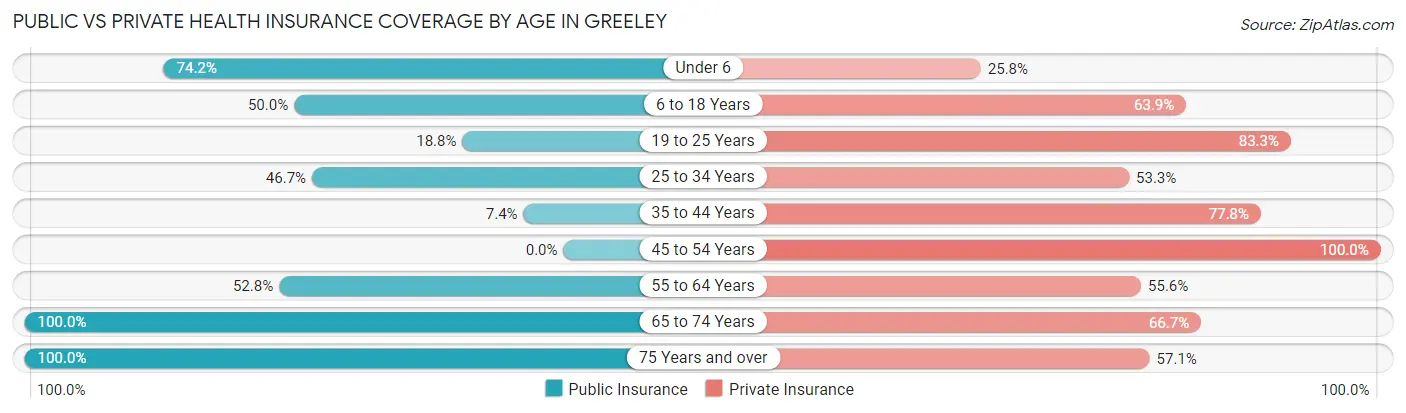
| Age Bracket | Public Insurance | Private Insurance |
| Under 6 | 23 (74.2%) | 8 (25.8%) |
| 6 to 18 Years | 18 (50.0%) | 23 (63.9%) |
| 19 to 25 Years | 9 (18.8%) | 40 (83.3%) |
| 25 to 34 Years | 14 (46.7%) | 16 (53.3%) |
| 35 to 44 Years | 2 (7.4%) | 21 (77.8%) |
| 45 to 54 Years | 0 (0.0%) | 35 (100.0%) |
| 55 to 64 Years | 19 (52.8%) | 20 (55.6%) |
| 65 to 74 Years | 15 (100.0%) | 10 (66.7%) |
| 75 Years and over | 14 (100.0%) | 8 (57.1%) |
| Total | 114 (41.9%) | 181 (66.5%) |
Disability Status by Sex by Age in Greeley
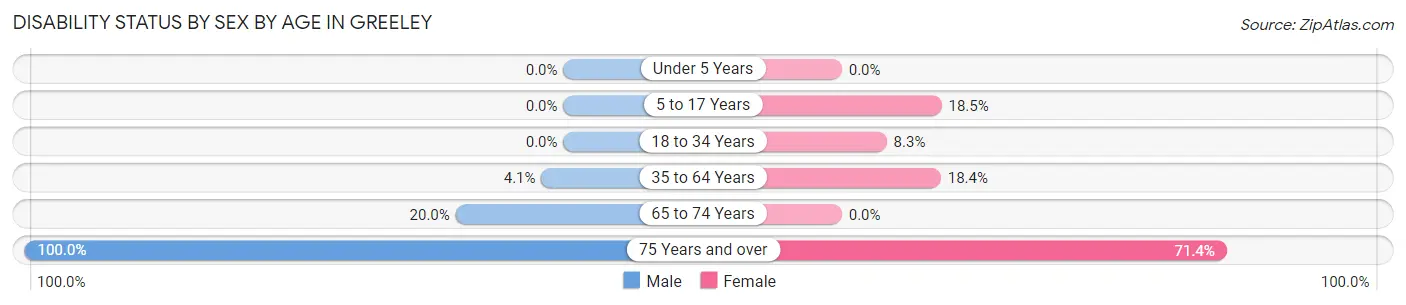
| Age Bracket | Male | Female |
| Under 5 Years | 0 (0.0%) | 0 (0.0%) |
| 5 to 17 Years | 0 (0.0%) | 5 (18.5%) |
| 18 to 34 Years | 0 (0.0%) | 3 (8.3%) |
| 35 to 64 Years | 2 (4.1%) | 9 (18.4%) |
| 65 to 74 Years | 1 (20.0%) | 0 (0.0%) |
| 75 Years and over | 7 (100.0%) | 5 (71.4%) |
Disability Class by Sex by Age in Greeley
Disability Class: Hearing Difficulty
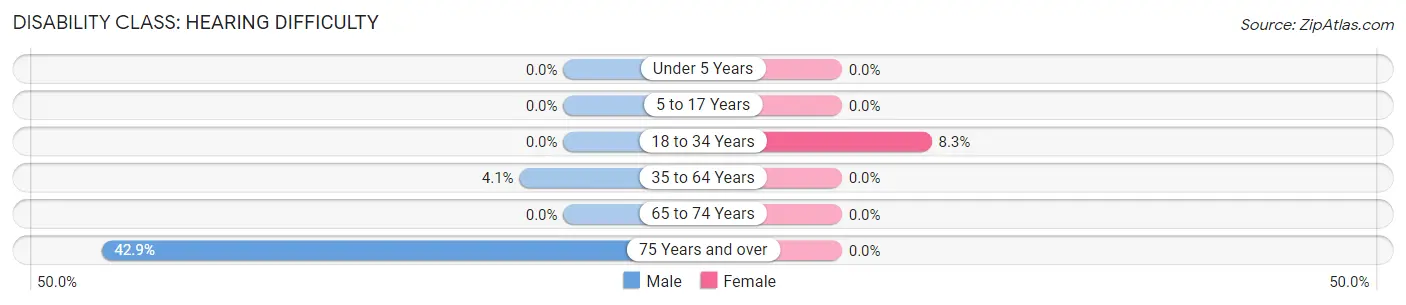
| Age Bracket | Male | Female |
| Under 5 Years | 0 (0.0%) | 0 (0.0%) |
| 5 to 17 Years | 0 (0.0%) | 0 (0.0%) |
| 18 to 34 Years | 0 (0.0%) | 3 (8.3%) |
| 35 to 64 Years | 2 (4.1%) | 0 (0.0%) |
| 65 to 74 Years | 0 (0.0%) | 0 (0.0%) |
| 75 Years and over | 3 (42.9%) | 0 (0.0%) |
Disability Class: Vision Difficulty
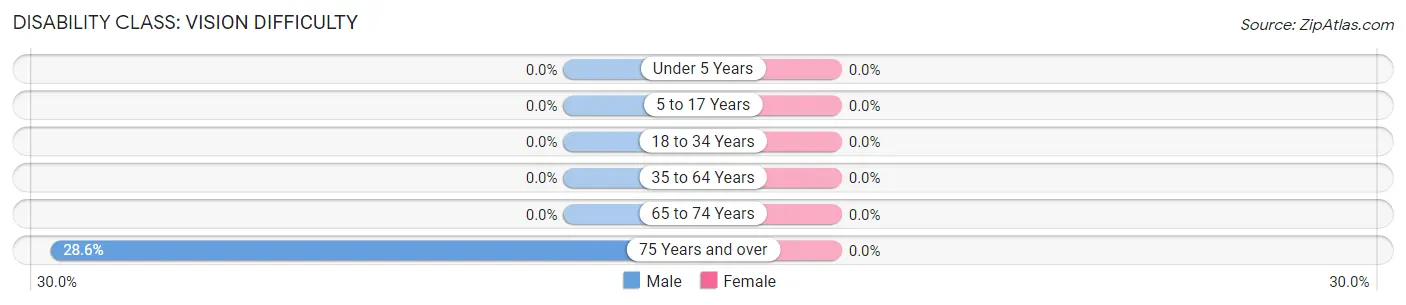
| Age Bracket | Male | Female |
| Under 5 Years | 0 (0.0%) | 0 (0.0%) |
| 5 to 17 Years | 0 (0.0%) | 0 (0.0%) |
| 18 to 34 Years | 0 (0.0%) | 0 (0.0%) |
| 35 to 64 Years | 0 (0.0%) | 0 (0.0%) |
| 65 to 74 Years | 0 (0.0%) | 0 (0.0%) |
| 75 Years and over | 2 (28.6%) | 0 (0.0%) |
Disability Class: Cognitive Difficulty
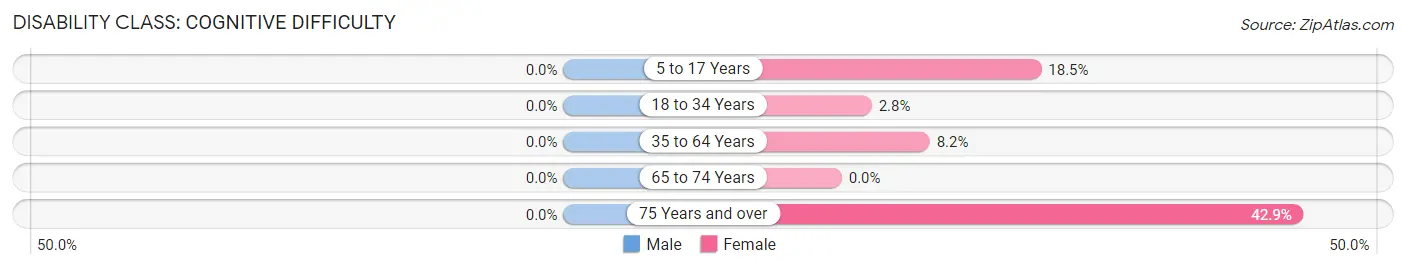
| Age Bracket | Male | Female |
| 5 to 17 Years | 0 (0.0%) | 5 (18.5%) |
| 18 to 34 Years | 0 (0.0%) | 1 (2.8%) |
| 35 to 64 Years | 0 (0.0%) | 4 (8.2%) |
| 65 to 74 Years | 0 (0.0%) | 0 (0.0%) |
| 75 Years and over | 0 (0.0%) | 3 (42.9%) |
Disability Class: Ambulatory Difficulty
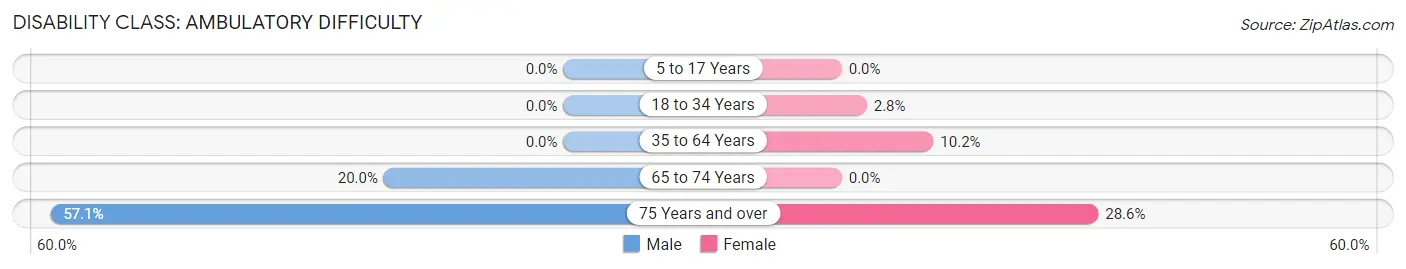
| Age Bracket | Male | Female |
| 5 to 17 Years | 0 (0.0%) | 0 (0.0%) |
| 18 to 34 Years | 0 (0.0%) | 1 (2.8%) |
| 35 to 64 Years | 0 (0.0%) | 5 (10.2%) |
| 65 to 74 Years | 1 (20.0%) | 0 (0.0%) |
| 75 Years and over | 4 (57.1%) | 2 (28.6%) |
Disability Class: Self-Care Difficulty
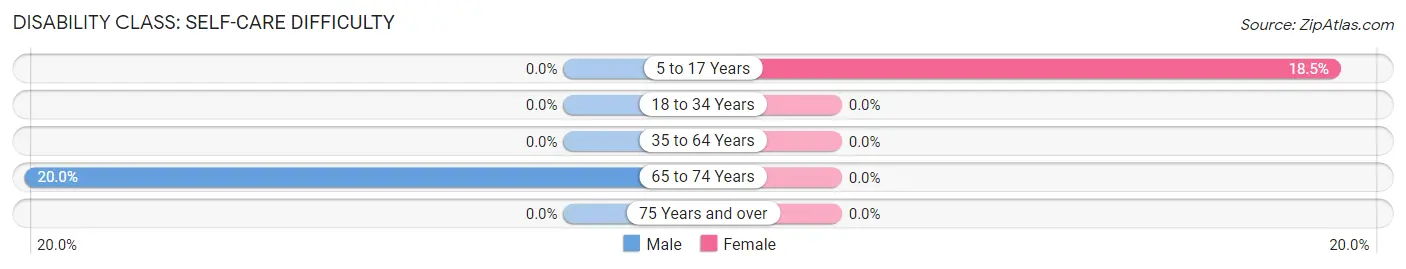
| Age Bracket | Male | Female |
| 5 to 17 Years | 0 (0.0%) | 5 (18.5%) |
| 18 to 34 Years | 0 (0.0%) | 0 (0.0%) |
| 35 to 64 Years | 0 (0.0%) | 0 (0.0%) |
| 65 to 74 Years | 1 (20.0%) | 0 (0.0%) |
| 75 Years and over | 0 (0.0%) | 0 (0.0%) |
Technology Access in Greeley
Computing Device Access in Greeley
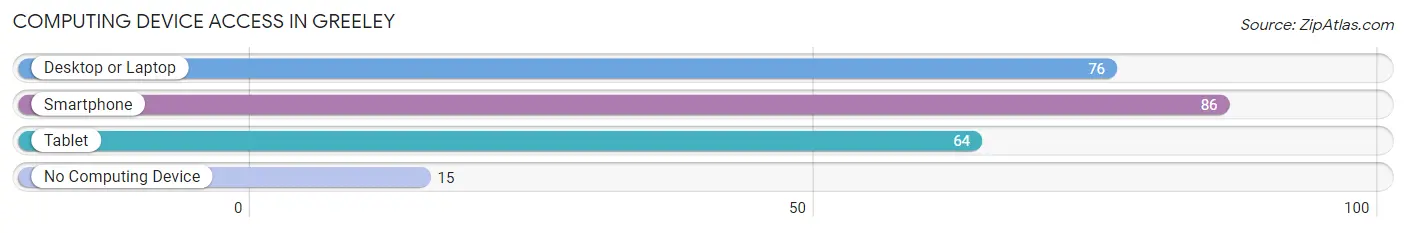
| Device Type | # Households | % Households |
| Desktop or Laptop | 76 | 67.9% |
| Smartphone | 86 | 76.8% |
| Tablet | 64 | 57.1% |
| No Computing Device | 15 | 13.4% |
| Total | 112 | 100.0% |
Internet Access in Greeley
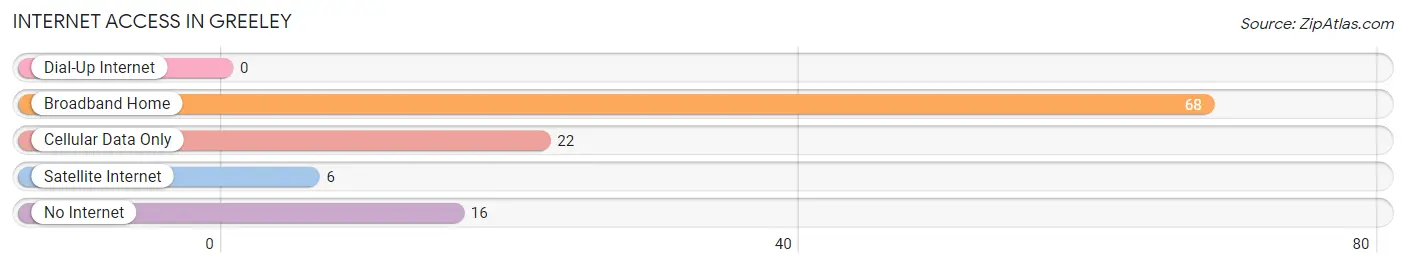
| Internet Type | # Households | % Households |
| Dial-Up Internet | 0 | 0.0% |
| Broadband Home | 68 | 60.7% |
| Cellular Data Only | 22 | 19.6% |
| Satellite Internet | 6 | 5.4% |
| No Internet | 16 | 14.3% |
| Total | 112 | 100.0% |
Greeley Summary
Greeley, Iowa is a small town located in the northwest corner of the state, in the county of Delaware. It is situated on the banks of the Maquoketa River, and is home to a population of just over 500 people. The town was founded in 1854, and has a rich history of farming, industry, and small-town life.
Geography
Greeley is located in the northwest corner of Iowa, in the county of Delaware. It is situated on the banks of the Maquoketa River, and is surrounded by rolling hills and farmland. The town is located about 25 miles from Dubuque, and is about an hour and a half drive from the state capital of Des Moines. The town is also close to the Mississippi River, which is just a few miles away.
Economy
Greeley’s economy is largely based on agriculture and small businesses. The town is home to several small businesses, including a grocery store, a hardware store, a restaurant, and a few other small shops. The town also has a few small manufacturing businesses, such as a furniture factory and a woodworking shop. The town is also home to a few farms, which produce corn, soybeans, and other crops.
Demographics
Greeley’s population is just over 500 people, with a median age of 44. The town is predominantly white, with a small percentage of African Americans and Hispanics. The town has a low poverty rate, with only about 10% of the population living below the poverty line. The town also has a low unemployment rate, with only about 4% of the population unemployed.
History
Greeley was founded in 1854 by a group of settlers from New York. The town was named after Horace Greeley, a prominent newspaper editor and politician from the mid-1800s. The town quickly grew, and by the early 1900s, it had become a thriving agricultural and industrial center. The town was home to several factories, including a furniture factory, a woodworking shop, and a canning factory. The town also had a thriving business district, with several stores and restaurants.
Greeley experienced a period of decline in the mid-1900s, as many of the factories and businesses closed. The town was also hit hard by the Great Depression, and many of the residents were forced to leave in search of work. However, the town has since seen a resurgence, and is now home to a thriving small business community.
Greeley is a small town with a rich history and a bright future. The town is home to a diverse population, and is a great place to live and work. The town is also home to a thriving economy, with a variety of businesses and industries. Greeley is a great place to call home, and is sure to continue to grow and thrive in the years to come.
Common Questions
What is Per Capita Income in Greeley?
Per Capita income in Greeley is $31,992.
What is the Median Family Income in Greeley?
Median Family Income in Greeley is $86,667.
What is the Median Household income in Greeley?
Median Household Income in Greeley is $64,167.
What is Income or Wage Gap in Greeley?
Income or Wage Gap in Greeley is 47.2%.
Women in Greeley earn 52.8 cents for every dollar earned by a man.
What is Inequality or Gini Index in Greeley?
Inequality or Gini Index in Greeley is 0.38.
What is the Total Population of Greeley?
Total Population of Greeley is 272.
What is the Total Male Population of Greeley?
Total Male Population of Greeley is 126.
What is the Total Female Population of Greeley?
Total Female Population of Greeley is 146.
What is the Ratio of Males per 100 Females in Greeley?
There are 86.30 Males per 100 Females in Greeley.
What is the Ratio of Females per 100 Males in Greeley?
There are 115.87 Females per 100 Males in Greeley.
What is the Median Population Age in Greeley?
Median Population Age in Greeley is 34.1 Years.
What is the Average Family Size in Greeley
Average Family Size in Greeley is 2.8 People.
What is the Average Household Size in Greeley
Average Household Size in Greeley is 2.4 People.
How Large is the Labor Force in Greeley?
There are 165 People in the Labor Forcein in Greeley.
What is the Percentage of People in the Labor Force in Greeley?
76.7% of People are in the Labor Force in Greeley.
What is the Unemployment Rate in Greeley?
Unemployment Rate in Greeley is 7.9%.