Grandview, IA Map & Demographics
Grandview Map
Grandview Overview
$30,997
PER CAPITA INCOME
$58,250
AVG FAMILY INCOME
$43,583
AVG HOUSEHOLD INCOME
61.8%
WAGE / INCOME GAP [ % ]
38.2¢/ $1
WAGE / INCOME GAP [ $ ]
0.37
INEQUALITY / GINI INDEX
434
TOTAL POPULATION
219
MALE POPULATION
215
FEMALE POPULATION
101.86
MALES / 100 FEMALES
98.17
FEMALES / 100 MALES
57.4
MEDIAN AGE
2.4
AVG FAMILY SIZE
1.9
AVG HOUSEHOLD SIZE
168
LABOR FORCE [ PEOPLE ]
49.0%
PERCENT IN LABOR FORCE
Grandview Zip Codes
Grandview Area Codes
Income in Grandview
Income Overview in Grandview
Per Capita Income in Grandview is $30,997, while median incomes of families and households are $58,250 and $43,583 respectively.
| Characteristic | Number | Measure |
| Per Capita Income | 434 | $30,997 |
| Median Family Income | 135 | $58,250 |
| Mean Family Income | 135 | $73,293 |
| Median Household Income | 235 | $43,583 |
| Mean Household Income | 235 | $59,693 |
| Income Deficit | 135 | $0 |
| Wage / Income Gap (%) | 434 | 61.82% |
| Wage / Income Gap ($) | 434 | 38.18¢ per $1 |
| Gini / Inequality Index | 434 | 0.37 |
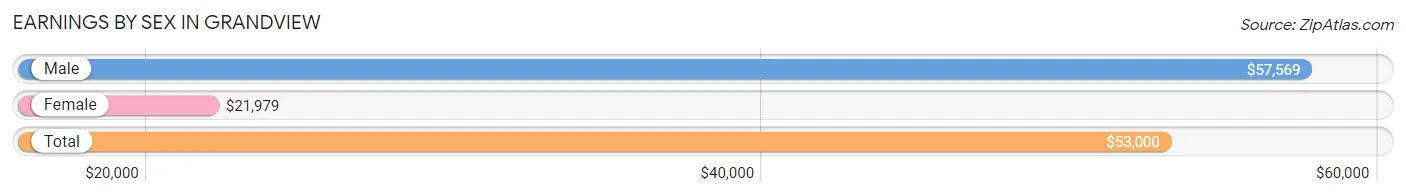
Earnings by Sex in Grandview
Average Earnings in Grandview are $53,000, $57,569 for men and $21,979 for women, a difference of 61.8%.
| Sex | Number | Average Earnings |
| Male | 103 (59.2%) | $57,569 |
| Female | 71 (40.8%) | $21,979 |
| Total | 174 (100.0%) | $53,000 |
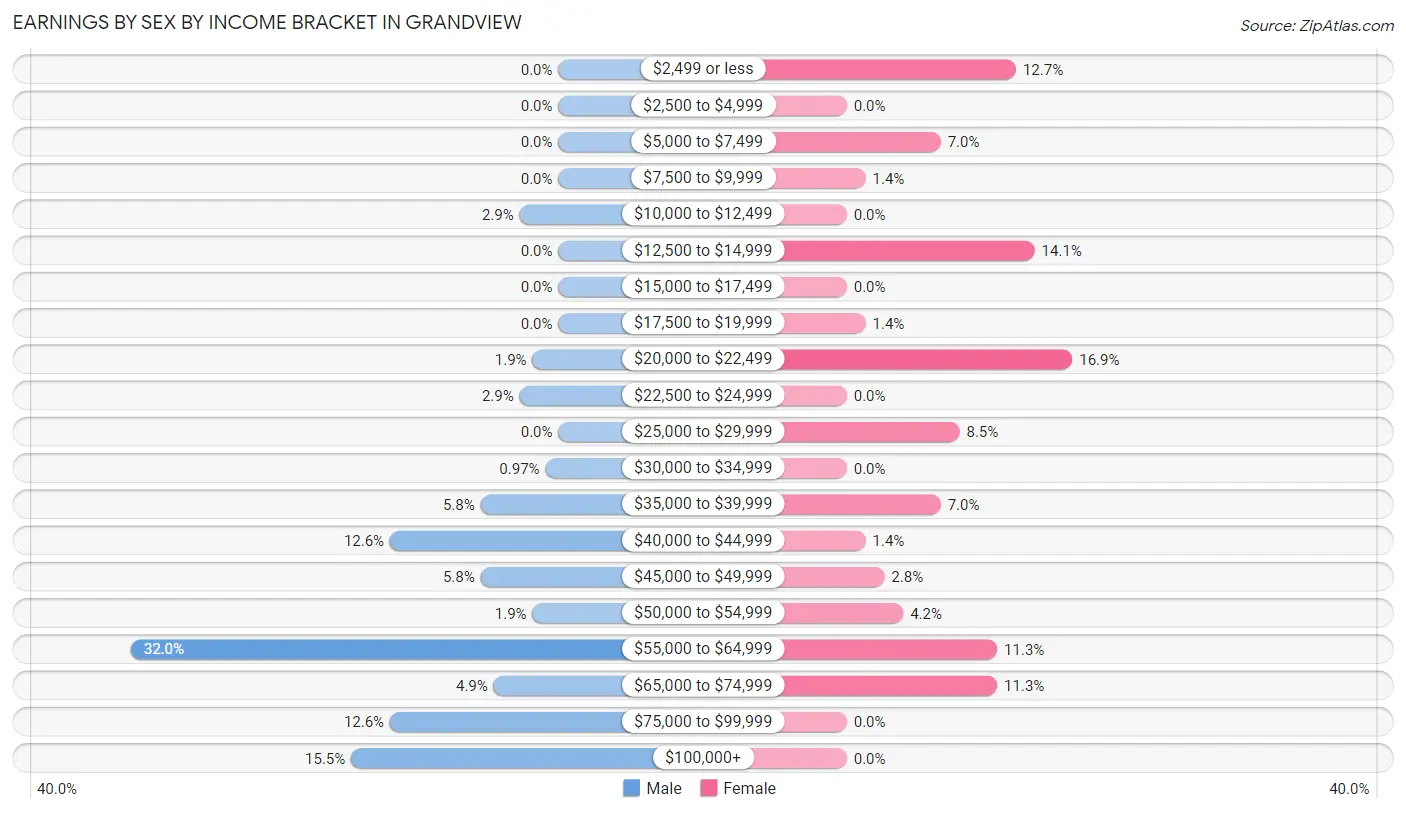
Earnings by Sex by Income Bracket in Grandview
The most common earnings brackets in Grandview are $55,000 to $64,999 for men (33 | 32.0%) and $20,000 to $22,499 for women (12 | 16.9%).
| Income | Male | Female |
| $2,499 or less | 0 (0.0%) | 9 (12.7%) |
| $2,500 to $4,999 | 0 (0.0%) | 0 (0.0%) |
| $5,000 to $7,499 | 0 (0.0%) | 5 (7.0%) |
| $7,500 to $9,999 | 0 (0.0%) | 1 (1.4%) |
| $10,000 to $12,499 | 3 (2.9%) | 0 (0.0%) |
| $12,500 to $14,999 | 0 (0.0%) | 10 (14.1%) |
| $15,000 to $17,499 | 0 (0.0%) | 0 (0.0%) |
| $17,500 to $19,999 | 0 (0.0%) | 1 (1.4%) |
| $20,000 to $22,499 | 2 (1.9%) | 12 (16.9%) |
| $22,500 to $24,999 | 3 (2.9%) | 0 (0.0%) |
| $25,000 to $29,999 | 0 (0.0%) | 6 (8.5%) |
| $30,000 to $34,999 | 1 (1.0%) | 0 (0.0%) |
| $35,000 to $39,999 | 6 (5.8%) | 5 (7.0%) |
| $40,000 to $44,999 | 13 (12.6%) | 1 (1.4%) |
| $45,000 to $49,999 | 6 (5.8%) | 2 (2.8%) |
| $50,000 to $54,999 | 2 (1.9%) | 3 (4.2%) |
| $55,000 to $64,999 | 33 (32.0%) | 8 (11.3%) |
| $65,000 to $74,999 | 5 (4.9%) | 8 (11.3%) |
| $75,000 to $99,999 | 13 (12.6%) | 0 (0.0%) |
| $100,000+ | 16 (15.5%) | 0 (0.0%) |
| Total | 103 (100.0%) | 71 (100.0%) |
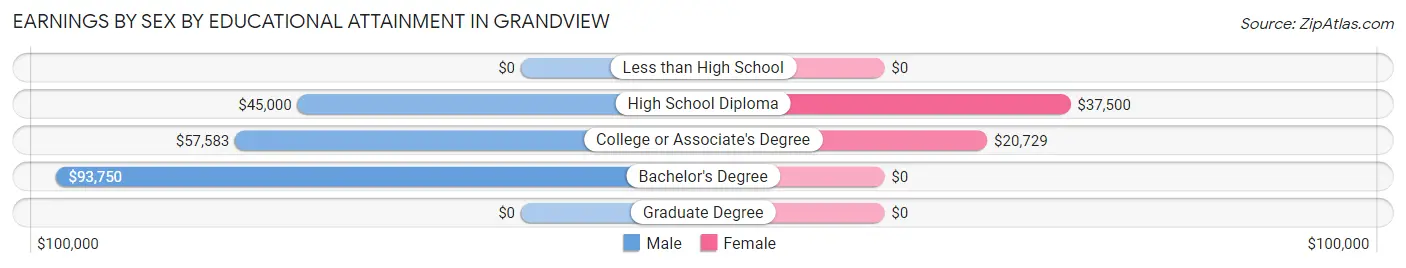
Earnings by Sex by Educational Attainment in Grandview
Average earnings in Grandview are $57,569 for men and $21,979 for women, a difference of 61.8%. Men with an educational attainment of bachelor's degree enjoy the highest average annual earnings of $93,750, while those with high school diploma education earn the least with $45,000. Women with an educational attainment of high school diploma earn the most with the average annual earnings of $37,500, while those with college or associate's degree education have the smallest earnings of $20,729.
| Educational Attainment | Male Income | Female Income |
| Less than High School | - | - |
| High School Diploma | $45,000 | $37,500 |
| College or Associate's Degree | $57,583 | $20,729 |
| Bachelor's Degree | $93,750 | $0 |
| Graduate Degree | - | - |
| Total | $57,569 | $21,979 |
Family Income in Grandview
Family Income Brackets in Grandview
According to the Grandview family income data, there are 36 families falling into the $50,000 to $74,999 income range, which is the most common income bracket and makes up 26.7% of all families.
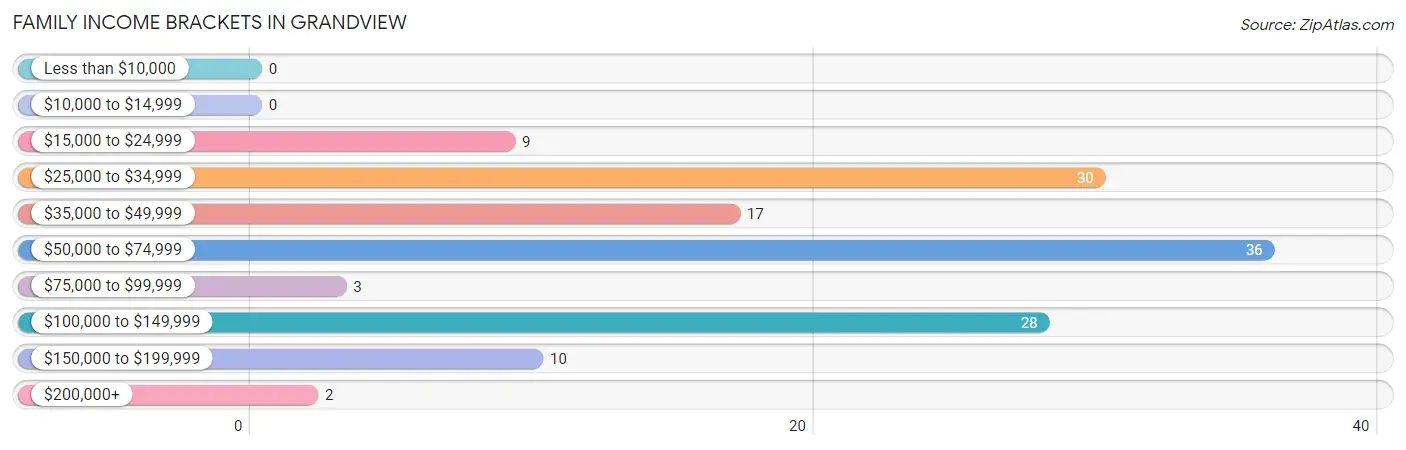
| Income Bracket | # Families | % Families |
| Less than $10,000 | 0 | 0.0% |
| $10,000 to $14,999 | 0 | 0.0% |
| $15,000 to $24,999 | 9 | 6.7% |
| $25,000 to $34,999 | 30 | 22.2% |
| $35,000 to $49,999 | 17 | 12.6% |
| $50,000 to $74,999 | 36 | 26.7% |
| $75,000 to $99,999 | 3 | 2.2% |
| $100,000 to $149,999 | 28 | 20.7% |
| $150,000 to $199,999 | 10 | 7.4% |
| $200,000+ | 2 | 1.5% |
Family Income by Famaliy Size in Grandview
2-person families (91 | 67.4%) account for the highest median family income in Grandview with $58,417 per family, while 2-person families (91 | 67.4%) have the highest median income of $29,208 per family member.
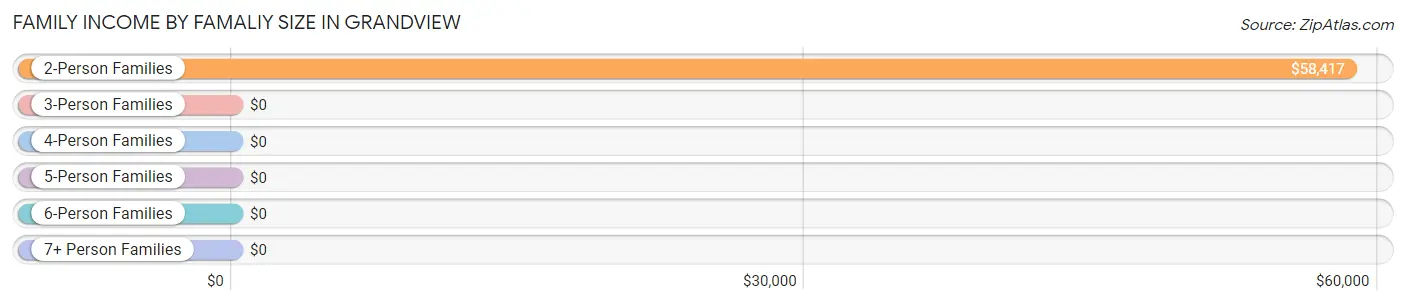
| Income Bracket | # Families | Median Income |
| 2-Person Families | 91 (67.4%) | $58,417 |
| 3-Person Families | 17 (12.6%) | $0 |
| 4-Person Families | 20 (14.8%) | $0 |
| 5-Person Families | 7 (5.2%) | $0 |
| 6-Person Families | 0 (0.0%) | $0 |
| 7+ Person Families | 0 (0.0%) | $0 |
| Total | 135 (100.0%) | $58,250 |
Family Income by Number of Earners in Grandview
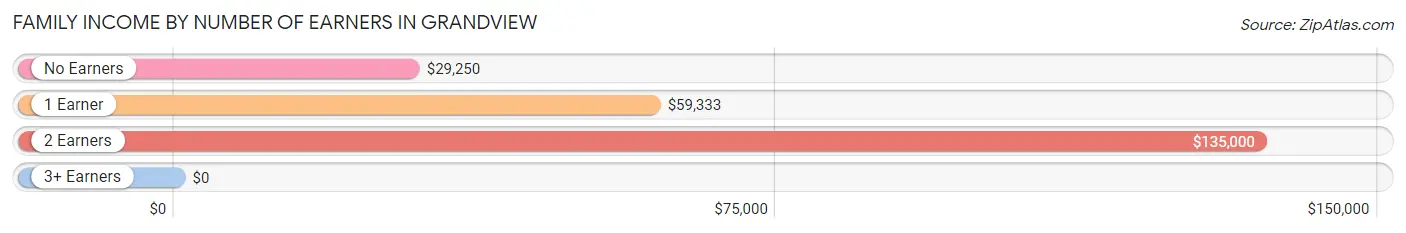
| Number of Earners | # Families | Median Income |
| No Earners | 42 (31.1%) | $29,250 |
| 1 Earner | 62 (45.9%) | $59,333 |
| 2 Earners | 26 (19.3%) | $135,000 |
| 3+ Earners | 5 (3.7%) | $0 |
| Total | 135 (100.0%) | $58,250 |
Household Income in Grandview
Household Income Brackets in Grandview
With 64 households falling in the category, the $25,000 to $34,999 income range is the most frequent in Grandview, accounting for 27.2% of all households. In contrast, only 2 households (0.9%) fall into the $200,000+ income bracket, making it the least populous group.
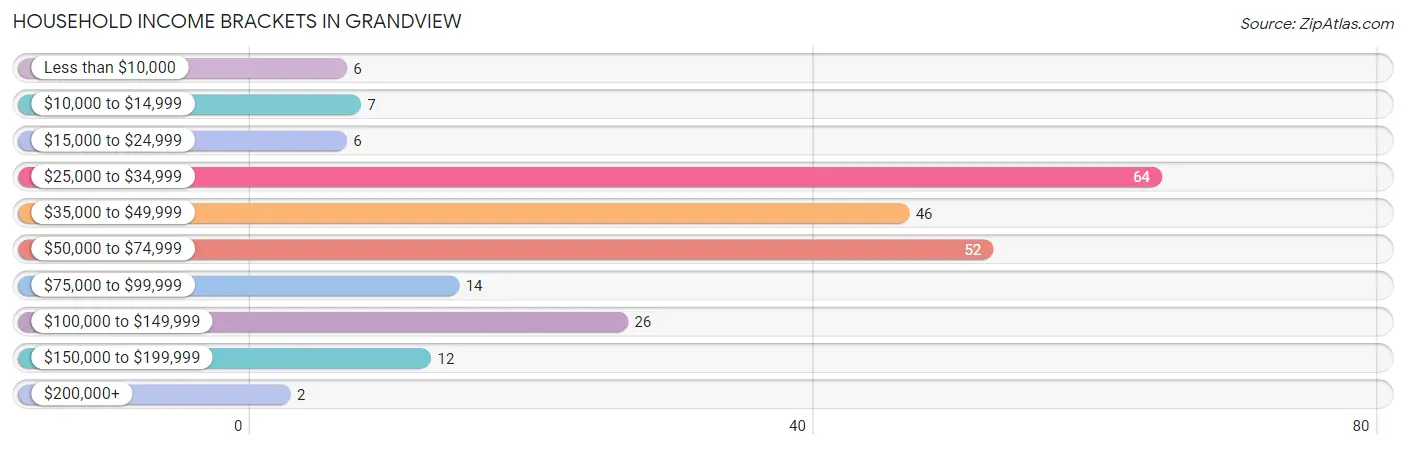
| Income Bracket | # Households | % Households |
| Less than $10,000 | 6 | 2.6% |
| $10,000 to $14,999 | 7 | 3.0% |
| $15,000 to $24,999 | 6 | 2.6% |
| $25,000 to $34,999 | 64 | 27.2% |
| $35,000 to $49,999 | 46 | 19.6% |
| $50,000 to $74,999 | 52 | 22.1% |
| $75,000 to $99,999 | 14 | 6.0% |
| $100,000 to $149,999 | 26 | 11.1% |
| $150,000 to $199,999 | 12 | 5.1% |
| $200,000+ | 2 | 0.9% |
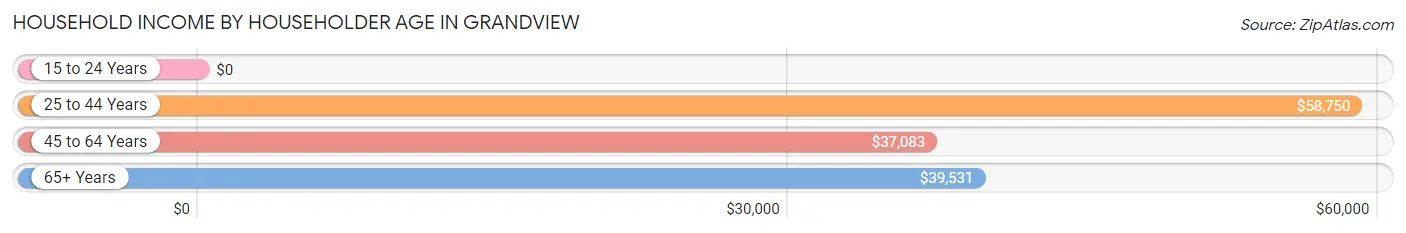
Household Income by Householder Age in Grandview
The median household income in Grandview is $43,583, with the highest median household income of $58,750 found in the 25 to 44 years age bracket for the primary householder. A total of 69 households (29.4%) fall into this category.
| Income Bracket | # Households | Median Income |
| 15 to 24 Years | 0 (0.0%) | $0 |
| 25 to 44 Years | 69 (29.4%) | $58,750 |
| 45 to 64 Years | 71 (30.2%) | $37,083 |
| 65+ Years | 95 (40.4%) | $39,531 |
| Total | 235 (100.0%) | $43,583 |
Poverty in Grandview
Income Below Poverty by Sex and Age in Grandview
With 9.6% poverty level for males and 8.4% for females among the residents of Grandview, 6 to 11 year old males and 25 to 34 year old females are the most vulnerable to poverty, with 10 males (90.9%) and 9 females (60.0%) in their respective age groups living below the poverty level.
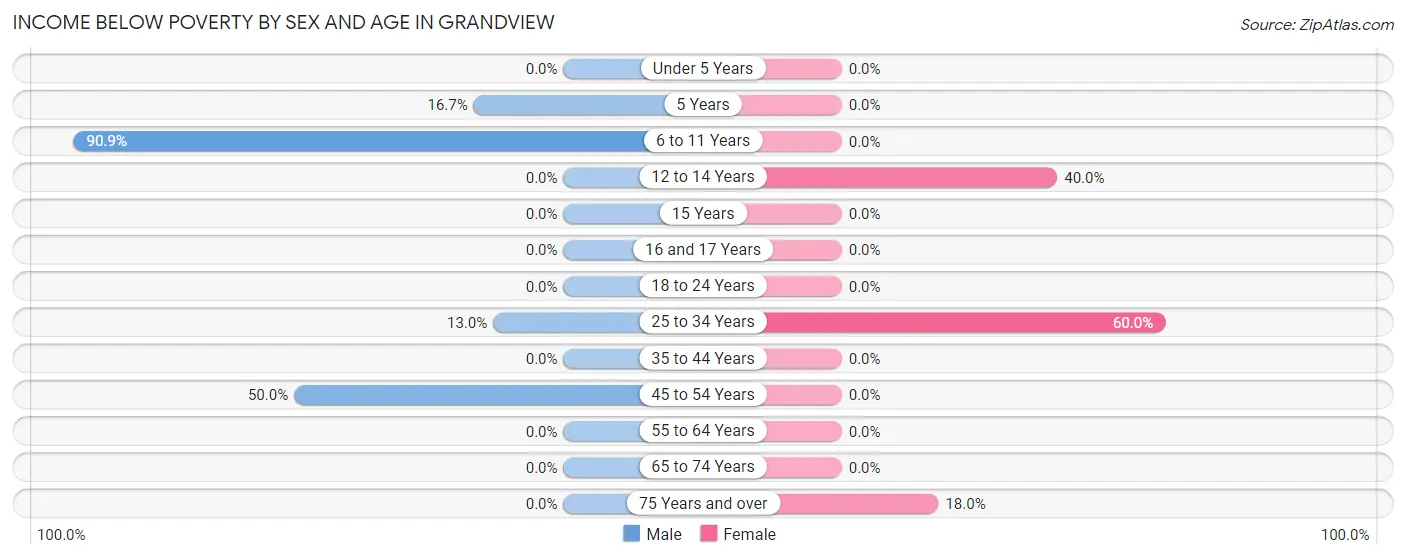
| Age Bracket | Male | Female |
| Under 5 Years | 0 (0.0%) | 0 (0.0%) |
| 5 Years | 2 (16.7%) | 0 (0.0%) |
| 6 to 11 Years | 10 (90.9%) | 0 (0.0%) |
| 12 to 14 Years | 0 (0.0%) | 2 (40.0%) |
| 15 Years | 0 (0.0%) | 0 (0.0%) |
| 16 and 17 Years | 0 (0.0%) | 0 (0.0%) |
| 18 to 24 Years | 0 (0.0%) | 0 (0.0%) |
| 25 to 34 Years | 3 (13.0%) | 9 (60.0%) |
| 35 to 44 Years | 0 (0.0%) | 0 (0.0%) |
| 45 to 54 Years | 6 (50.0%) | 0 (0.0%) |
| 55 to 64 Years | 0 (0.0%) | 0 (0.0%) |
| 65 to 74 Years | 0 (0.0%) | 0 (0.0%) |
| 75 Years and over | 0 (0.0%) | 7 (17.9%) |
| Total | 21 (9.6%) | 18 (8.4%) |
Income Above Poverty by Sex and Age in Grandview
According to the poverty statistics in Grandview, males aged under 5 years and females aged under 5 years are the age groups that are most secure financially, with 100.0% of males and 100.0% of females in these age groups living above the poverty line.
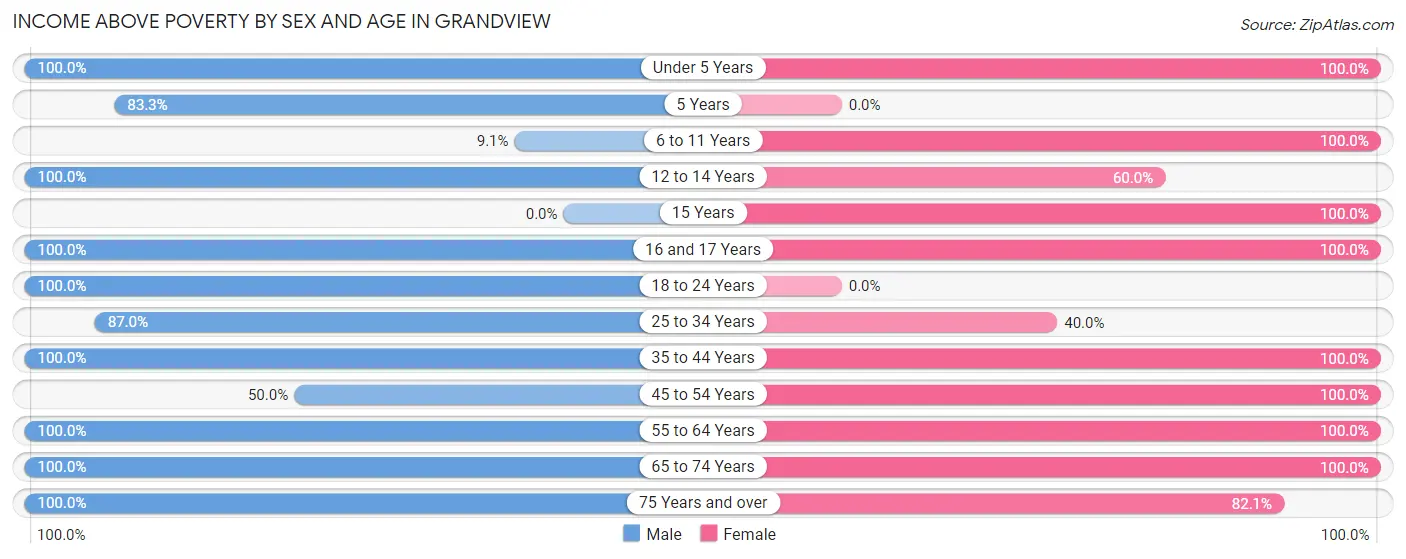
| Age Bracket | Male | Female |
| Under 5 Years | 13 (100.0%) | 4 (100.0%) |
| 5 Years | 10 (83.3%) | 0 (0.0%) |
| 6 to 11 Years | 1 (9.1%) | 30 (100.0%) |
| 12 to 14 Years | 1 (100.0%) | 3 (60.0%) |
| 15 Years | 0 (0.0%) | 15 (100.0%) |
| 16 and 17 Years | 2 (100.0%) | 3 (100.0%) |
| 18 to 24 Years | 4 (100.0%) | 0 (0.0%) |
| 25 to 34 Years | 20 (87.0%) | 6 (40.0%) |
| 35 to 44 Years | 42 (100.0%) | 17 (100.0%) |
| 45 to 54 Years | 6 (50.0%) | 5 (100.0%) |
| 55 to 64 Years | 49 (100.0%) | 50 (100.0%) |
| 65 to 74 Years | 23 (100.0%) | 32 (100.0%) |
| 75 Years and over | 27 (100.0%) | 32 (82.1%) |
| Total | 198 (90.4%) | 197 (91.6%) |
Income Below Poverty Among Married-Couple Families in Grandview
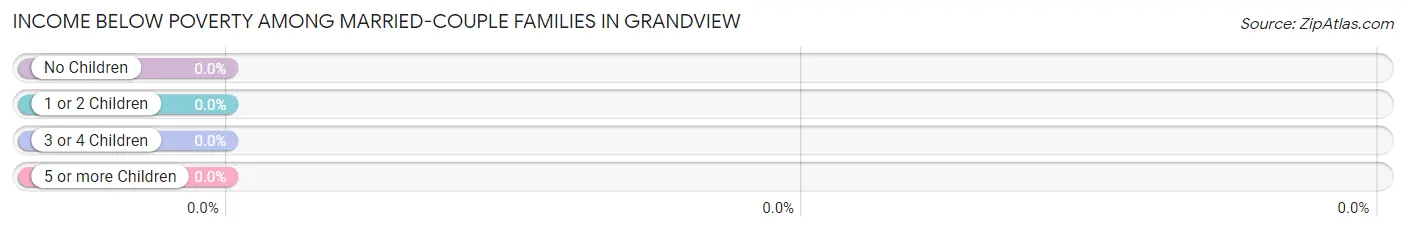
| Children | Above Poverty | Below Poverty |
| No Children | 62 (100.0%) | 0 (0.0%) |
| 1 or 2 Children | 10 (100.0%) | 0 (0.0%) |
| 3 or 4 Children | 5 (100.0%) | 0 (0.0%) |
| 5 or more Children | 0 (0.0%) | 0 (0.0%) |
| Total | 77 (100.0%) | 0 (0.0%) |
Income Below Poverty Among Single-Parent Households in Grandview
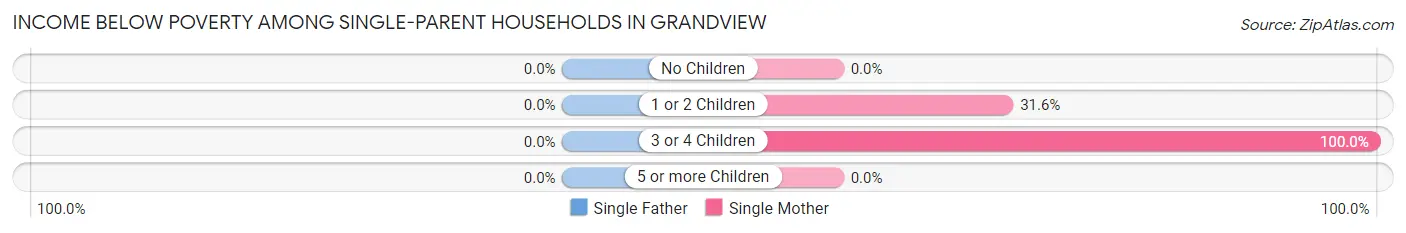
| Children | Single Father | Single Mother |
| No Children | 0 (0.0%) | 0 (0.0%) |
| 1 or 2 Children | 0 (0.0%) | 6 (31.6%) |
| 3 or 4 Children | 0 (0.0%) | 3 (100.0%) |
| 5 or more Children | 0 (0.0%) | 0 (0.0%) |
| Total | 0 (0.0%) | 9 (34.6%) |
Income Below Poverty Among Married-Couple vs Single-Parent Households in Grandview
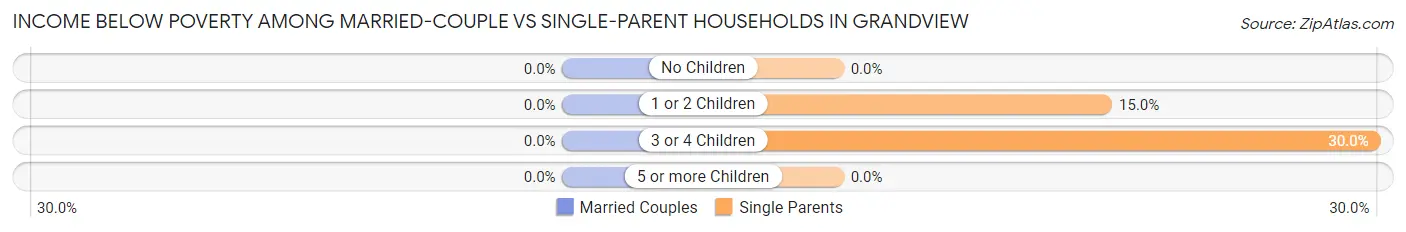
| Children | Married-Couple Families | Single-Parent Households |
| No Children | 0 (0.0%) | 0 (0.0%) |
| 1 or 2 Children | 0 (0.0%) | 6 (15.0%) |
| 3 or 4 Children | 0 (0.0%) | 3 (30.0%) |
| 5 or more Children | 0 (0.0%) | 0 (0.0%) |
| Total | 0 (0.0%) | 9 (15.5%) |
Race in Grandview
The most populous races in Grandview are White / Caucasian (409 | 94.2%), Two or more Races (15 | 3.5%), and Hispanic or Latino (7 | 1.6%).
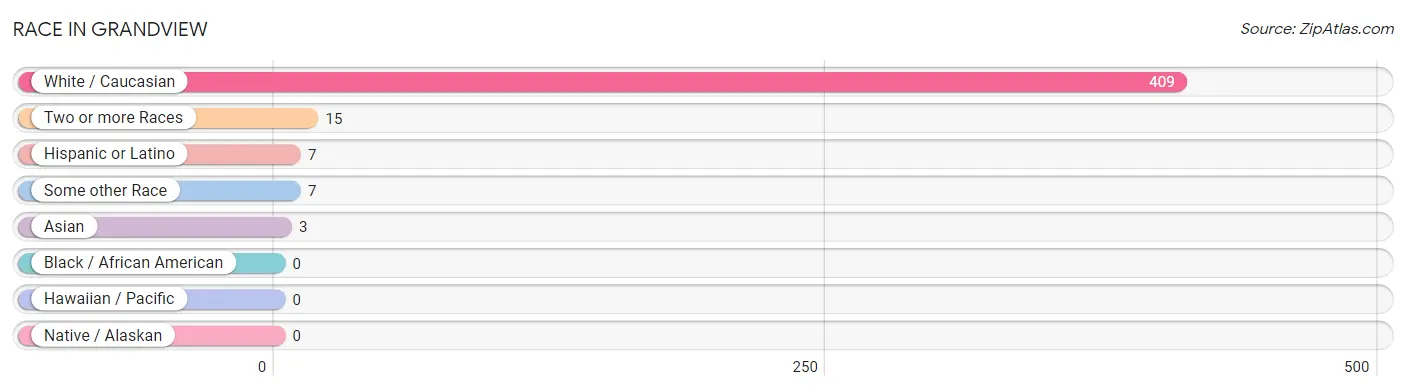
| Race | # Population | % Population |
| Asian | 3 | 0.7% |
| Black / African American | 0 | 0.0% |
| Hawaiian / Pacific | 0 | 0.0% |
| Hispanic or Latino | 7 | 1.6% |
| Native / Alaskan | 0 | 0.0% |
| White / Caucasian | 409 | 94.2% |
| Two or more Races | 15 | 3.5% |
| Some other Race | 7 | 1.6% |
| Total | 434 | 100.0% |
Ancestry in Grandview
The most populous ancestries reported in Grandview are German (103 | 23.7%), Scottish (65 | 15.0%), Irish (46 | 10.6%), English (41 | 9.5%), and American (20 | 4.6%), together accounting for 63.4% of all Grandview residents.
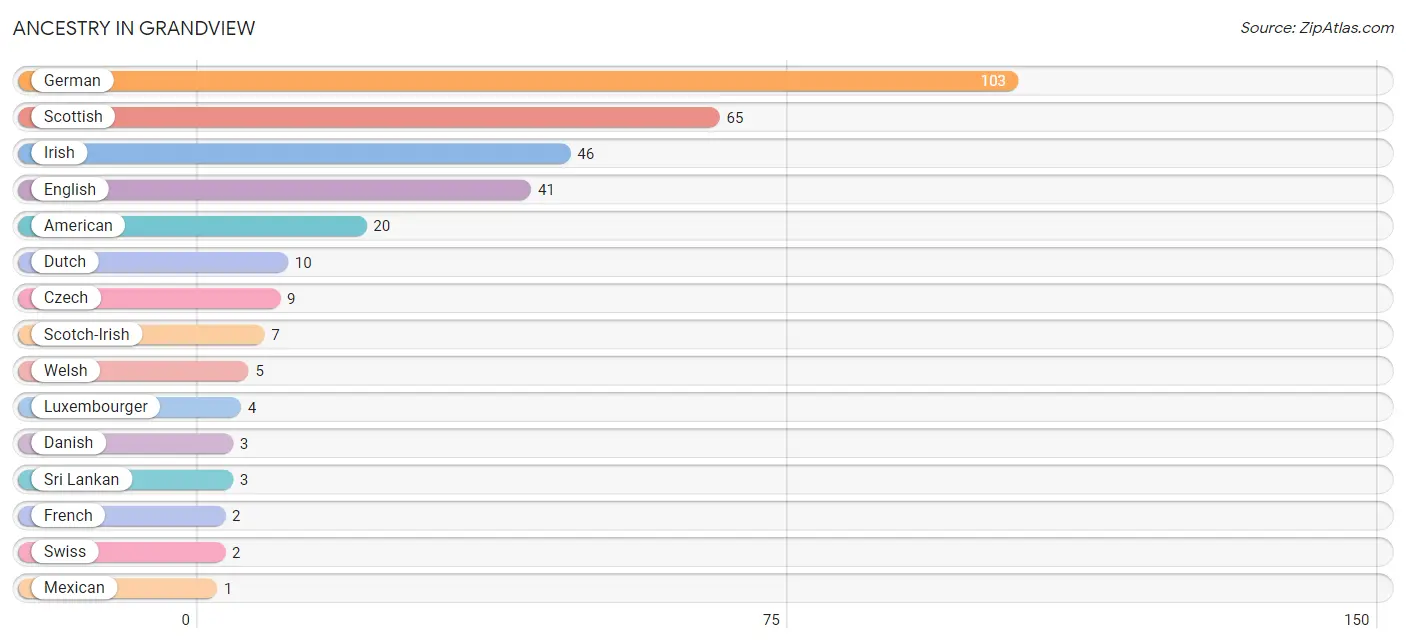
| Ancestry | # Population | % Population |
| American | 20 | 4.6% |
| Czech | 9 | 2.1% |
| Danish | 3 | 0.7% |
| Dutch | 10 | 2.3% |
| English | 41 | 9.5% |
| French | 2 | 0.5% |
| German | 103 | 23.7% |
| Irish | 46 | 10.6% |
| Luxembourger | 4 | 0.9% |
| Mexican | 1 | 0.2% |
| Scotch-Irish | 7 | 1.6% |
| Scottish | 65 | 15.0% |
| Sri Lankan | 3 | 0.7% |
| Swiss | 2 | 0.5% |
| Welsh | 5 | 1.1% | View All 15 Rows |
Immigrants in Grandview
The most numerous immigrant groups reported in Grandview came from Central America (7 | 1.6%), Latin America (7 | 1.6%), Mexico (7 | 1.6%), Asia (3 | 0.7%), and South Eastern Asia (3 | 0.7%), together accounting for 6.2% of all Grandview residents.
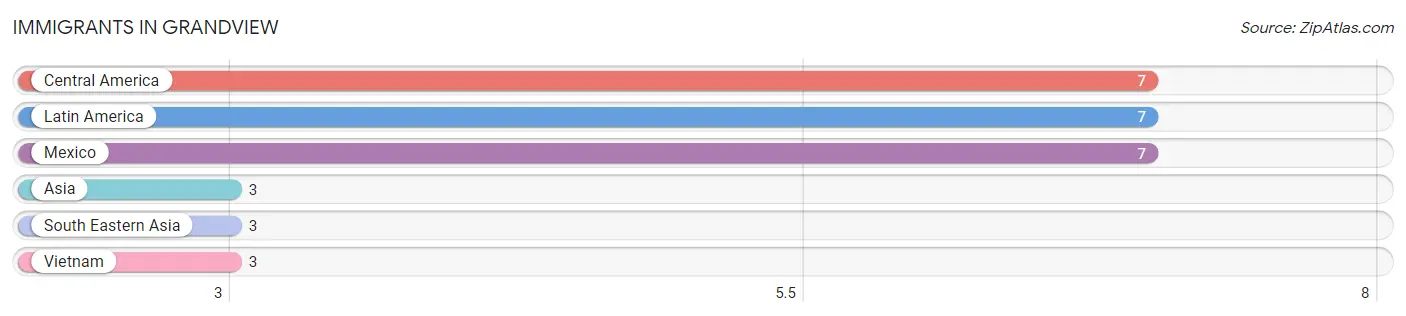
| Immigration Origin | # Population | % Population |
| Asia | 3 | 0.7% |
| Central America | 7 | 1.6% |
| Latin America | 7 | 1.6% |
| Mexico | 7 | 1.6% |
| South Eastern Asia | 3 | 0.7% |
| Vietnam | 3 | 0.7% | View All 6 Rows |
Sex and Age in Grandview
Sex and Age in Grandview
The most populous age groups in Grandview are 60 to 64 Years (46 | 21.0%) for men and 60 to 64 Years (41 | 19.1%) for women.
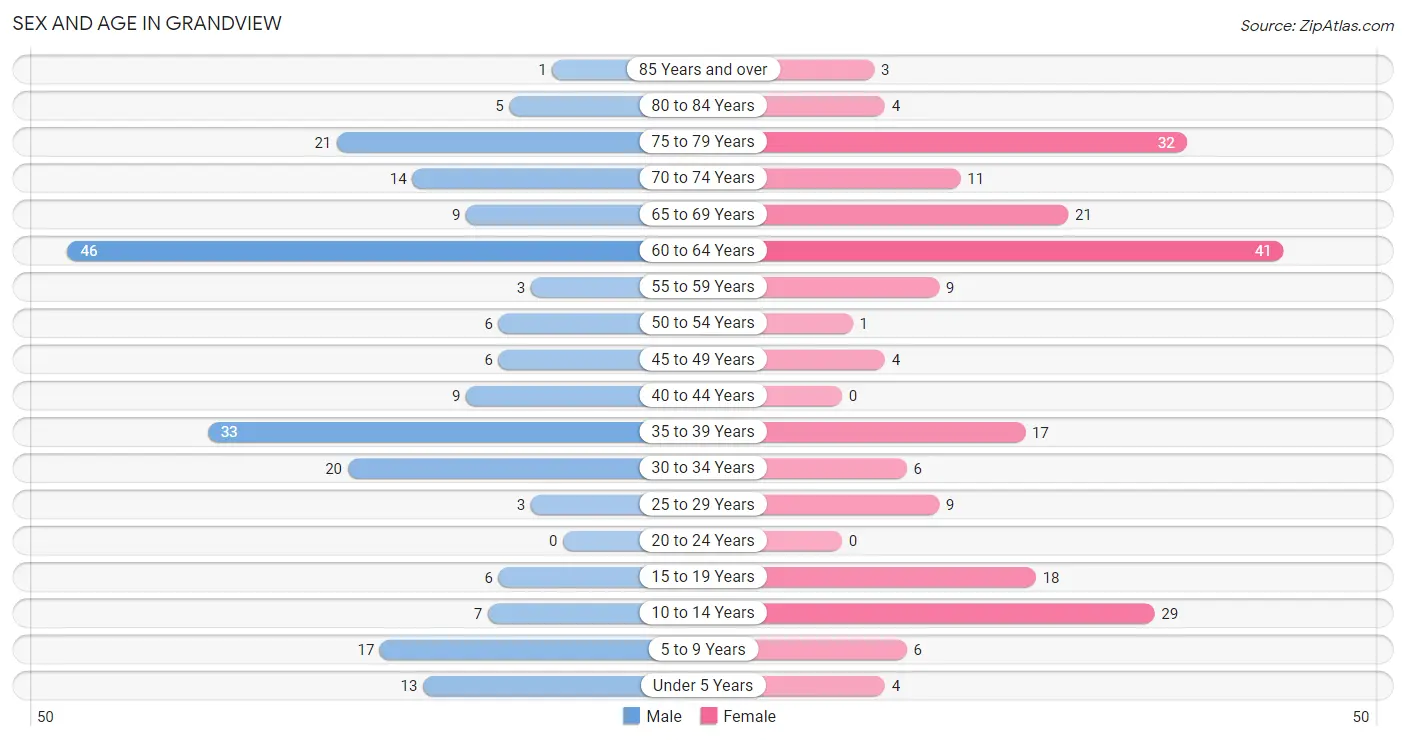
| Age Bracket | Male | Female |
| Under 5 Years | 13 (5.9%) | 4 (1.9%) |
| 5 to 9 Years | 17 (7.8%) | 6 (2.8%) |
| 10 to 14 Years | 7 (3.2%) | 29 (13.5%) |
| 15 to 19 Years | 6 (2.7%) | 18 (8.4%) |
| 20 to 24 Years | 0 (0.0%) | 0 (0.0%) |
| 25 to 29 Years | 3 (1.4%) | 9 (4.2%) |
| 30 to 34 Years | 20 (9.1%) | 6 (2.8%) |
| 35 to 39 Years | 33 (15.1%) | 17 (7.9%) |
| 40 to 44 Years | 9 (4.1%) | 0 (0.0%) |
| 45 to 49 Years | 6 (2.7%) | 4 (1.9%) |
| 50 to 54 Years | 6 (2.7%) | 1 (0.5%) |
| 55 to 59 Years | 3 (1.4%) | 9 (4.2%) |
| 60 to 64 Years | 46 (21.0%) | 41 (19.1%) |
| 65 to 69 Years | 9 (4.1%) | 21 (9.8%) |
| 70 to 74 Years | 14 (6.4%) | 11 (5.1%) |
| 75 to 79 Years | 21 (9.6%) | 32 (14.9%) |
| 80 to 84 Years | 5 (2.3%) | 4 (1.9%) |
| 85 Years and over | 1 (0.5%) | 3 (1.4%) |
| Total | 219 (100.0%) | 215 (100.0%) |
Families and Households in Grandview
Median Family Size in Grandview
The median family size in Grandview is 2.43 persons per family, with single female/mother families (26 | 19.3%) accounting for the largest median family size of 2.62 persons per family. On the other hand, single male/father families (32 | 23.7%) represent the smallest median family size with 2.25 persons per family.
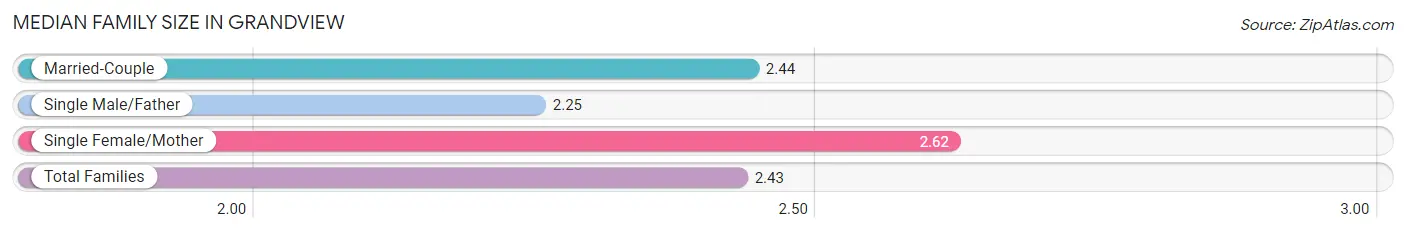
| Family Type | # Families | Family Size |
| Married-Couple | 77 (57.0%) | 2.44 |
| Single Male/Father | 32 (23.7%) | 2.25 |
| Single Female/Mother | 26 (19.3%) | 2.62 |
| Total Families | 135 (100.0%) | 2.43 |
Median Household Size in Grandview
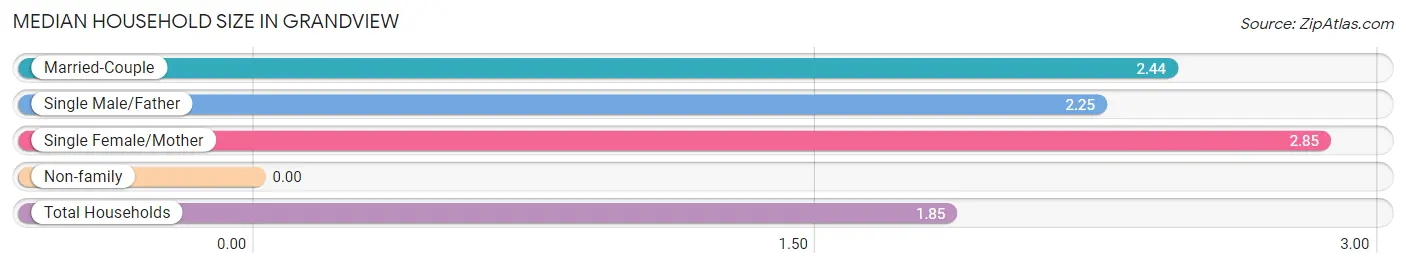
| Household Type | # Households | Household Size |
| Married-Couple | 77 (32.8%) | 2.44 |
| Single Male/Father | 32 (13.6%) | 2.25 |
| Single Female/Mother | 26 (11.1%) | 2.85 |
| Non-family | 100 (42.5%) | - |
| Total Households | 235 (100.0%) | 1.85 |
Household Size by Marriage Status in Grandview
Out of a total of 235 households in Grandview, 135 (57.5%) are family households, while 100 (42.5%) are nonfamily households. The most numerous type of family households are 2-person households, comprising 89, and the most common type of nonfamily households are 1-person households, comprising 100.
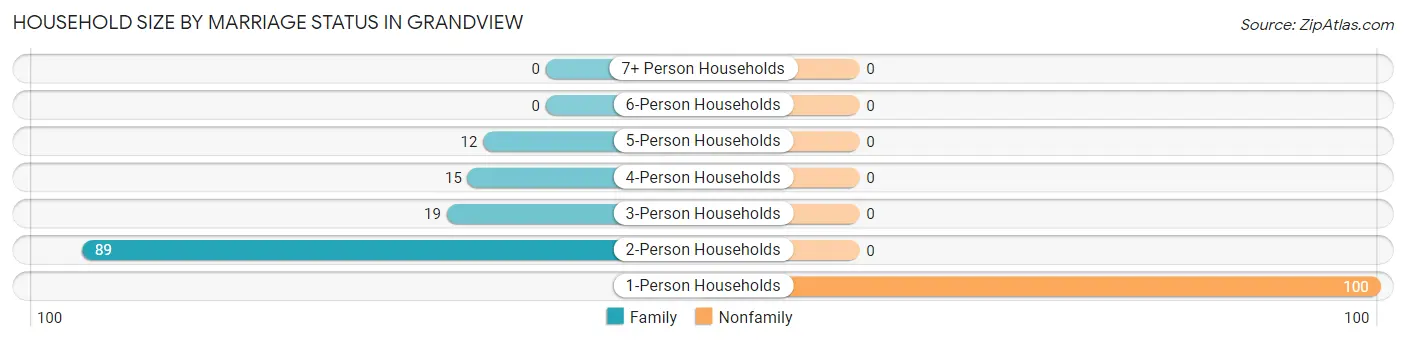
| Household Size | Family Households | Nonfamily Households |
| 1-Person Households | - | 100 (42.5%) |
| 2-Person Households | 89 (37.9%) | 0 (0.0%) |
| 3-Person Households | 19 (8.1%) | 0 (0.0%) |
| 4-Person Households | 15 (6.4%) | 0 (0.0%) |
| 5-Person Households | 12 (5.1%) | 0 (0.0%) |
| 6-Person Households | 0 (0.0%) | 0 (0.0%) |
| 7+ Person Households | 0 (0.0%) | 0 (0.0%) |
| Total | 135 (57.5%) | 100 (42.5%) |
Female Fertility in Grandview
Fertility by Age in Grandview
Average fertility rate in Grandview is 56.0 births per 1,000 women. Women in the age bracket of 20 to 34 years have the highest fertility rate with 200.0 births per 1,000 women. Women in the age bracket of 20 to 34 years acount for 100.0% of all women with births.
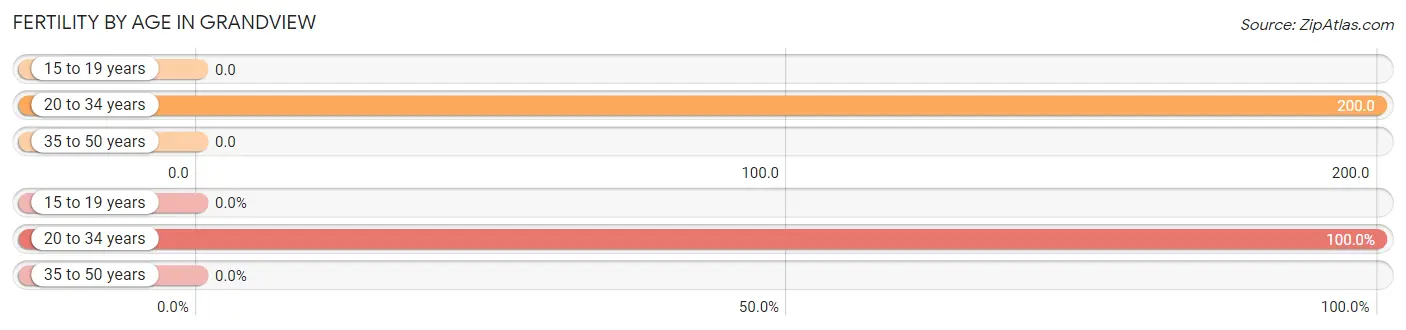
| Age Bracket | Women with Births | Births / 1,000 Women |
| 15 to 19 years | 0 (0.0%) | 0.0 |
| 20 to 34 years | 3 (100.0%) | 200.0 |
| 35 to 50 years | 0 (0.0%) | 0.0 |
| Total | 3 (100.0%) | 56.0 |
Fertility by Age by Marriage Status in Grandview
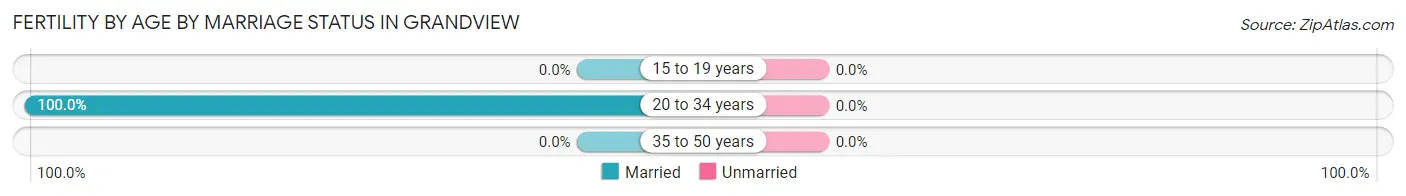
| Age Bracket | Married | Unmarried |
| 15 to 19 years | 0 (0.0%) | 0 (0.0%) |
| 20 to 34 years | 3 (100.0%) | 0 (0.0%) |
| 35 to 50 years | 0 (0.0%) | 0 (0.0%) |
| Total | 3 (100.0%) | 0 (0.0%) |
Fertility by Education in Grandview
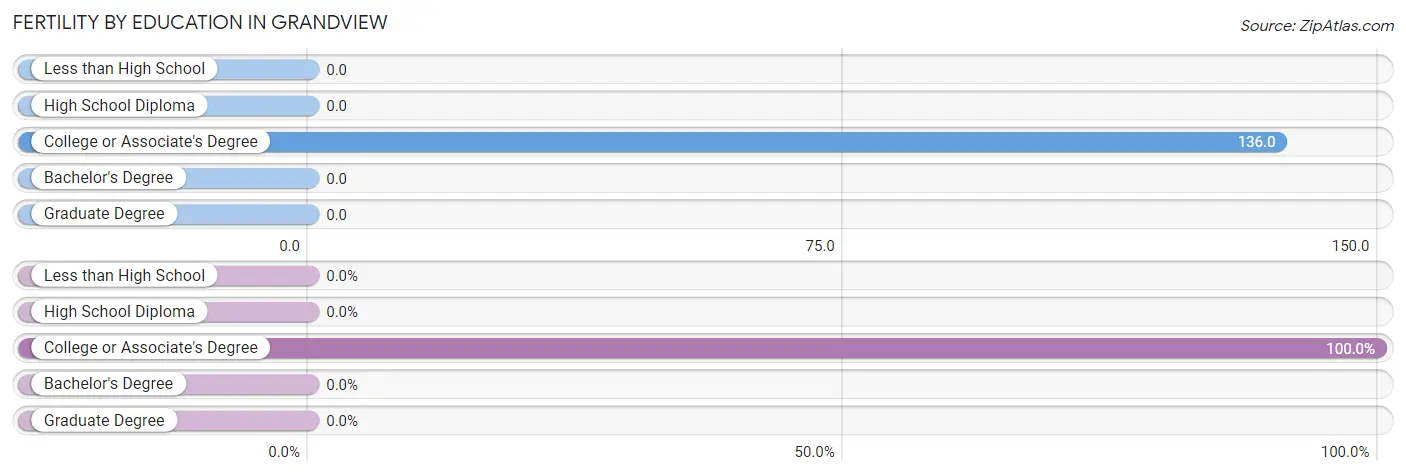
| Educational Attainment | Women with Births | Births / 1,000 Women |
| Less than High School | 0 (0.0%) | 0.0 |
| High School Diploma | 0 (0.0%) | 0.0 |
| College or Associate's Degree | 3 (100.0%) | 136.0 |
| Bachelor's Degree | 0 (0.0%) | 0.0 |
| Graduate Degree | 0 (0.0%) | 0.0 |
| Total | 3 (100.0%) | 56.0 |
Fertility by Education by Marriage Status in Grandview
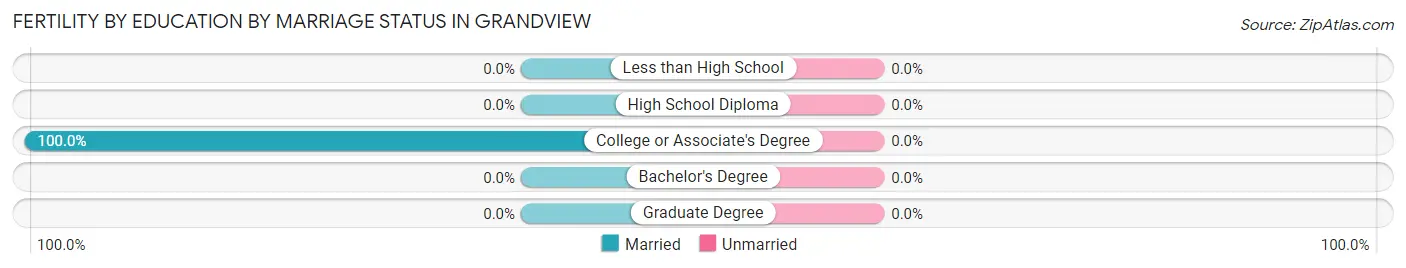
| Educational Attainment | Married | Unmarried |
| Less than High School | 0 (0.0%) | 0 (0.0%) |
| High School Diploma | 0 (0.0%) | 0 (0.0%) |
| College or Associate's Degree | 3 (100.0%) | 0 (0.0%) |
| Bachelor's Degree | 0 (0.0%) | 0 (0.0%) |
| Graduate Degree | 0 (0.0%) | 0 (0.0%) |
| Total | 3 (100.0%) | 0 (0.0%) |
Employment Characteristics in Grandview
Employment by Class of Employer in Grandview
Among the 161 employed individuals in Grandview, private company employees (127 | 78.9%), local government employees (11 | 6.8%), and self-employed (not incorporated) (8 | 5.0%) make up the most common classes of employment.
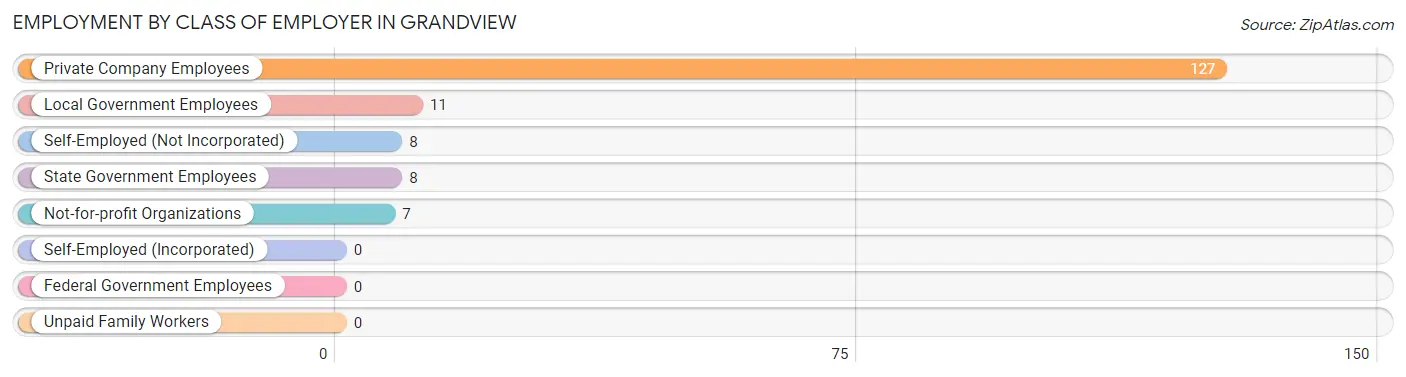
| Employer Class | # Employees | % Employees |
| Private Company Employees | 127 | 78.9% |
| Self-Employed (Incorporated) | 0 | 0.0% |
| Self-Employed (Not Incorporated) | 8 | 5.0% |
| Not-for-profit Organizations | 7 | 4.3% |
| Local Government Employees | 11 | 6.8% |
| State Government Employees | 8 | 5.0% |
| Federal Government Employees | 0 | 0.0% |
| Unpaid Family Workers | 0 | 0.0% |
| Total | 161 | 100.0% |
Employment Status by Age in Grandview
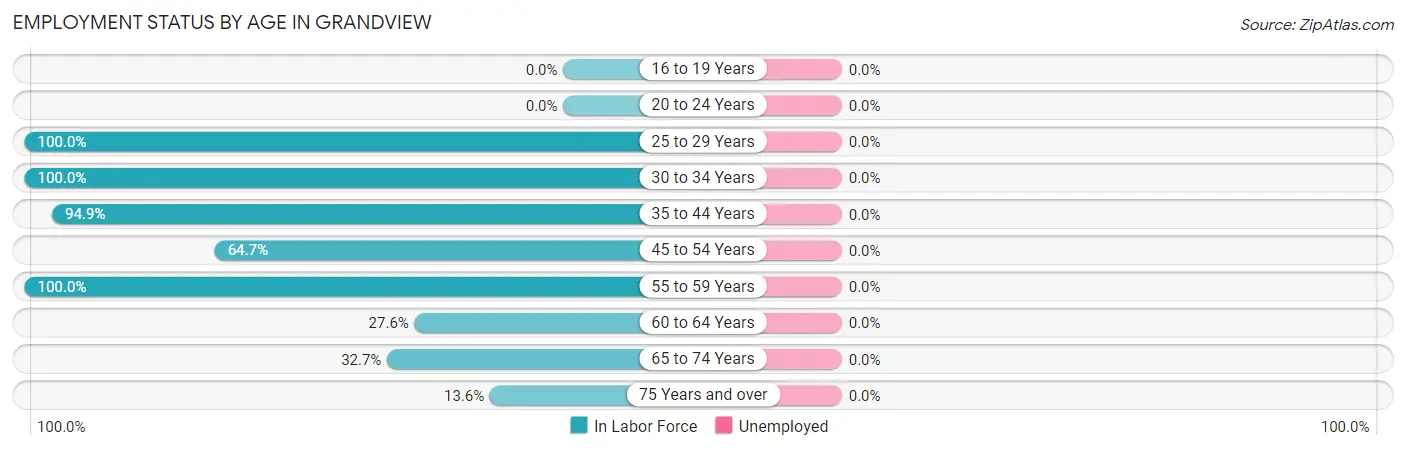
| Age Bracket | In Labor Force | Unemployed |
| 16 to 19 Years | 0 (0.0%) | 0 (0.0%) |
| 20 to 24 Years | 0 (0.0%) | 0 (0.0%) |
| 25 to 29 Years | 12 (100.0%) | 0 (0.0%) |
| 30 to 34 Years | 26 (100.0%) | 0 (0.0%) |
| 35 to 44 Years | 56 (94.9%) | 0 (0.0%) |
| 45 to 54 Years | 11 (64.7%) | 0 (0.0%) |
| 55 to 59 Years | 12 (100.0%) | 0 (0.0%) |
| 60 to 64 Years | 24 (27.6%) | 0 (0.0%) |
| 65 to 74 Years | 18 (32.7%) | 0 (0.0%) |
| 75 Years and over | 9 (13.6%) | 0 (0.0%) |
| Total | 168 (49.0%) | 0 (0.0%) |
Employment Status by Educational Attainment in Grandview
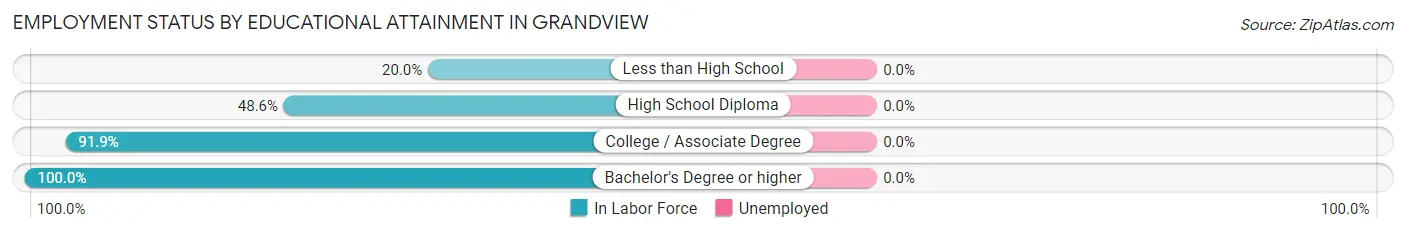
| Educational Attainment | In Labor Force | Unemployed |
| Less than High School | 2 (20.0%) | 0 (0.0%) |
| High School Diploma | 54 (48.6%) | 0 (0.0%) |
| College / Associate Degree | 79 (91.9%) | 0 (0.0%) |
| Bachelor's Degree or higher | 6 (100.0%) | 0 (0.0%) |
| Total | 141 (66.2%) | 0 (0.0%) |
Employment Occupations by Sex in Grandview
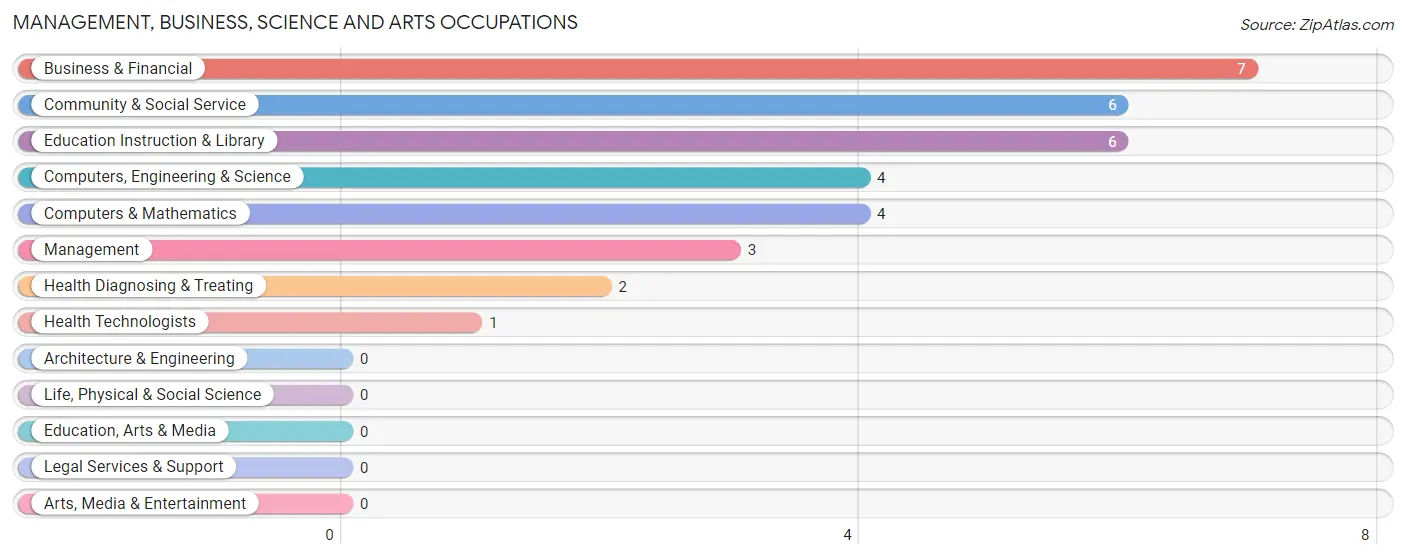
Management, Business, Science and Arts Occupations
The most common Management, Business, Science and Arts occupations in Grandview are Business & Financial (7 | 4.2%), Community & Social Service (6 | 3.6%), Education Instruction & Library (6 | 3.6%), Computers, Engineering & Science (4 | 2.4%), and Computers & Mathematics (4 | 2.4%).
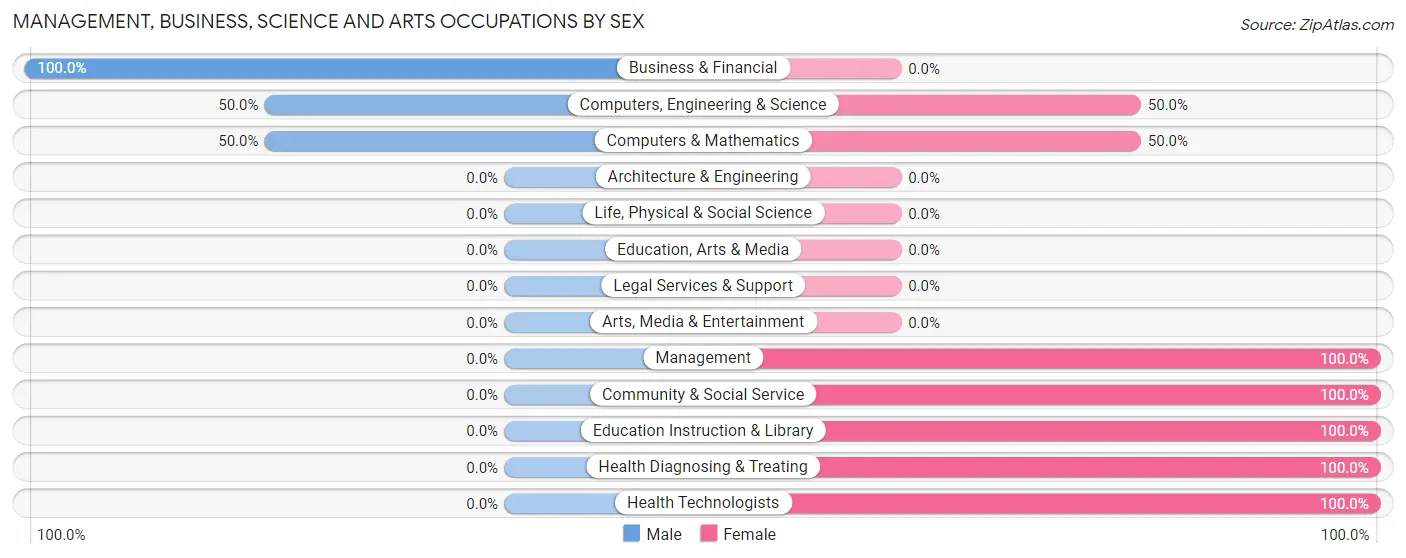
Management, Business, Science and Arts Occupations by Sex
Within the Management, Business, Science and Arts occupations in Grandview, the most male-oriented occupations are Business & Financial (100.0%), Computers, Engineering & Science (50.0%), and Computers & Mathematics (50.0%), while the most female-oriented occupations are Management (100.0%), Community & Social Service (100.0%), and Education Instruction & Library (100.0%).
| Occupation | Male | Female |
| Management | 0 (0.0%) | 3 (100.0%) |
| Business & Financial | 7 (100.0%) | 0 (0.0%) |
| Computers, Engineering & Science | 2 (50.0%) | 2 (50.0%) |
| Computers & Mathematics | 2 (50.0%) | 2 (50.0%) |
| Architecture & Engineering | 0 (0.0%) | 0 (0.0%) |
| Life, Physical & Social Science | 0 (0.0%) | 0 (0.0%) |
| Community & Social Service | 0 (0.0%) | 6 (100.0%) |
| Education, Arts & Media | 0 (0.0%) | 0 (0.0%) |
| Legal Services & Support | 0 (0.0%) | 0 (0.0%) |
| Education Instruction & Library | 0 (0.0%) | 6 (100.0%) |
| Arts, Media & Entertainment | 0 (0.0%) | 0 (0.0%) |
| Health Diagnosing & Treating | 0 (0.0%) | 2 (100.0%) |
| Health Technologists | 0 (0.0%) | 1 (100.0%) |
| Total (Category) | 9 (40.9%) | 13 (59.1%) |
| Total (Overall) | 103 (61.3%) | 65 (38.7%) |
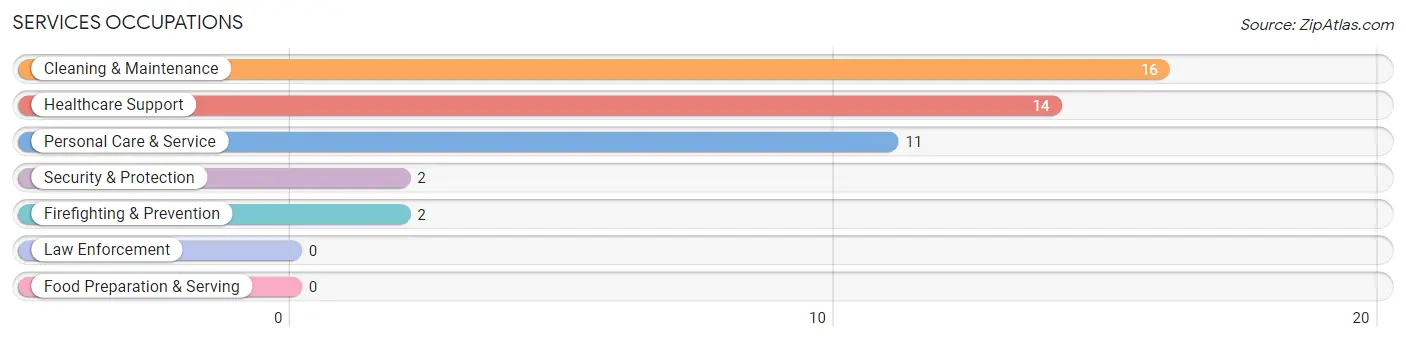
Services Occupations
The most common Services occupations in Grandview are Cleaning & Maintenance (16 | 9.5%), Healthcare Support (14 | 8.3%), Personal Care & Service (11 | 6.6%), Security & Protection (2 | 1.2%), and Firefighting & Prevention (2 | 1.2%).
Services Occupations by Sex
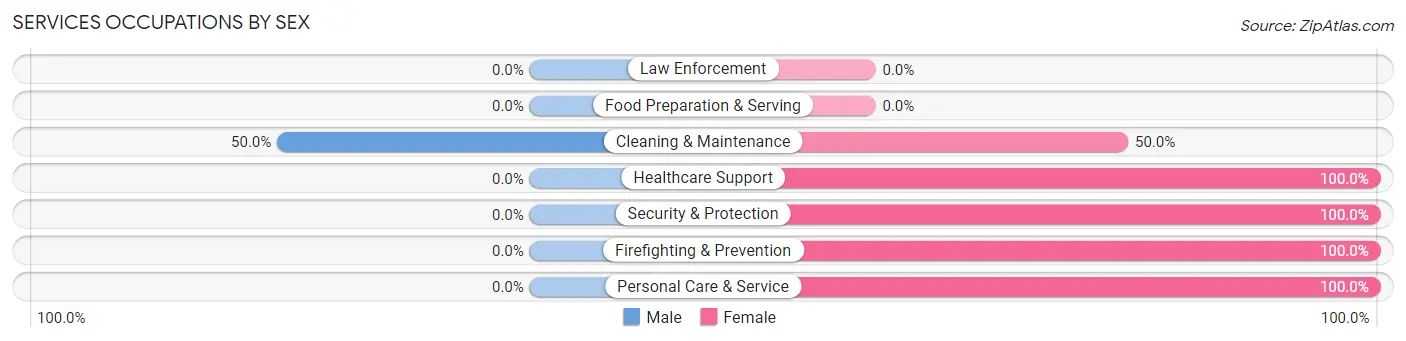
| Occupation | Male | Female |
| Healthcare Support | 0 (0.0%) | 14 (100.0%) |
| Security & Protection | 0 (0.0%) | 2 (100.0%) |
| Firefighting & Prevention | 0 (0.0%) | 2 (100.0%) |
| Law Enforcement | 0 (0.0%) | 0 (0.0%) |
| Food Preparation & Serving | 0 (0.0%) | 0 (0.0%) |
| Cleaning & Maintenance | 8 (50.0%) | 8 (50.0%) |
| Personal Care & Service | 0 (0.0%) | 11 (100.0%) |
| Total (Category) | 8 (18.6%) | 35 (81.4%) |
| Total (Overall) | 103 (61.3%) | 65 (38.7%) |
Sales and Office Occupations
The most common Sales and Office occupations in Grandview are Office & Administration (11 | 6.6%), and Sales & Related (8 | 4.8%).

Sales and Office Occupations by Sex

| Occupation | Male | Female |
| Sales & Related | 3 (37.5%) | 5 (62.5%) |
| Office & Administration | 7 (63.6%) | 4 (36.4%) |
| Total (Category) | 10 (52.6%) | 9 (47.4%) |
| Total (Overall) | 103 (61.3%) | 65 (38.7%) |
Natural Resources, Construction and Maintenance Occupations
The most common Natural Resources, Construction and Maintenance occupations in Grandview are Installation, Maintenance & Repair (20 | 11.9%), and Construction & Extraction (16 | 9.5%).

Natural Resources, Construction and Maintenance Occupations by Sex

| Occupation | Male | Female |
| Farming, Fishing & Forestry | 0 (0.0%) | 0 (0.0%) |
| Construction & Extraction | 16 (100.0%) | 0 (0.0%) |
| Installation, Maintenance & Repair | 20 (100.0%) | 0 (0.0%) |
| Total (Category) | 36 (100.0%) | 0 (0.0%) |
| Total (Overall) | 103 (61.3%) | 65 (38.7%) |
Production, Transportation and Moving Occupations
The most common Production, Transportation and Moving occupations in Grandview are Material Moving (24 | 14.3%), Production (18 | 10.7%), and Transportation (6 | 3.6%).
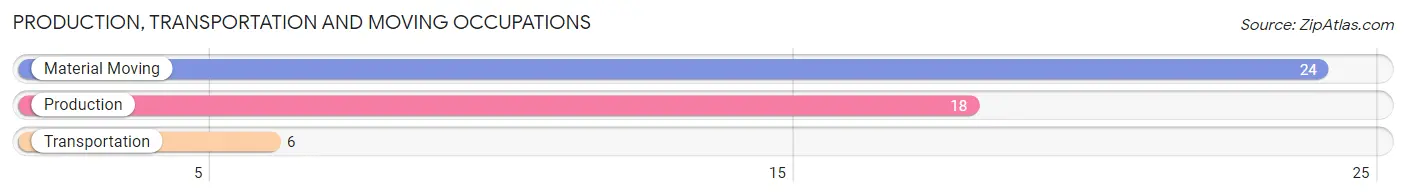
Production, Transportation and Moving Occupations by Sex
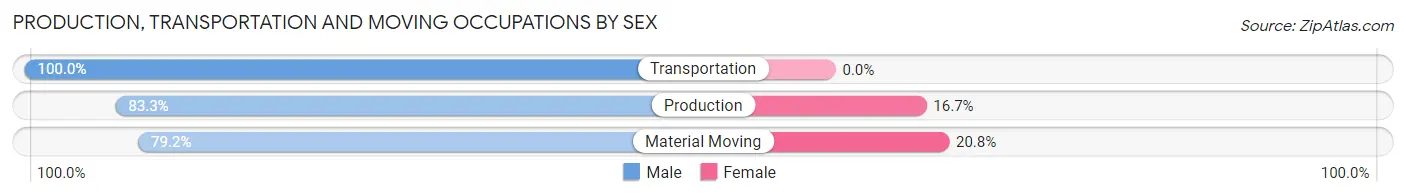
| Occupation | Male | Female |
| Production | 15 (83.3%) | 3 (16.7%) |
| Transportation | 6 (100.0%) | 0 (0.0%) |
| Material Moving | 19 (79.2%) | 5 (20.8%) |
| Total (Category) | 40 (83.3%) | 8 (16.7%) |
| Total (Overall) | 103 (61.3%) | 65 (38.7%) |
Employment Industries by Sex in Grandview
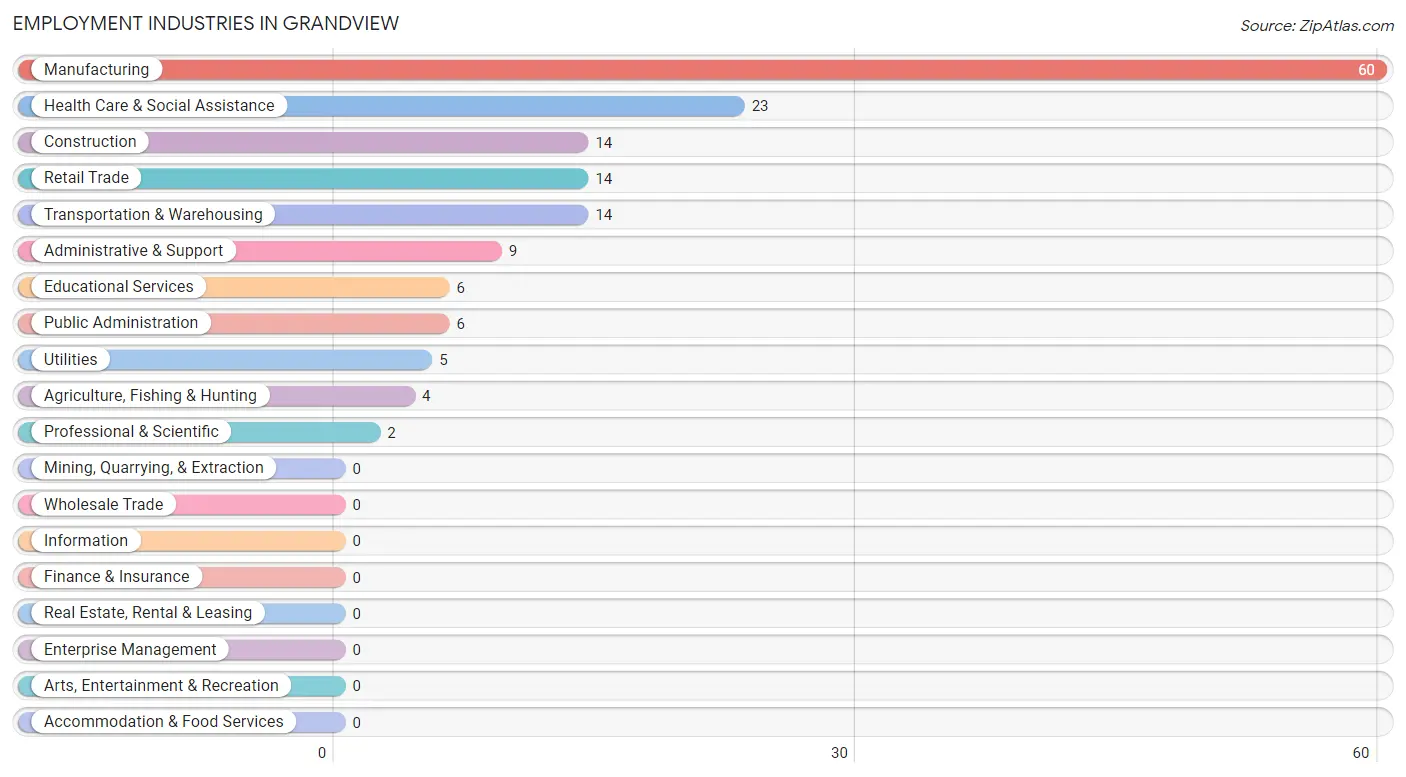
Employment Industries in Grandview
The major employment industries in Grandview include Manufacturing (60 | 35.7%), Health Care & Social Assistance (23 | 13.7%), Construction (14 | 8.3%), Retail Trade (14 | 8.3%), and Transportation & Warehousing (14 | 8.3%).
Employment Industries by Sex in Grandview
The Grandview industries that see more men than women are Construction (100.0%), Utilities (100.0%), and Administrative & Support (100.0%), whereas the industries that tend to have a higher number of women are Professional & Scientific (100.0%), Educational Services (100.0%), and Health Care & Social Assistance (100.0%).
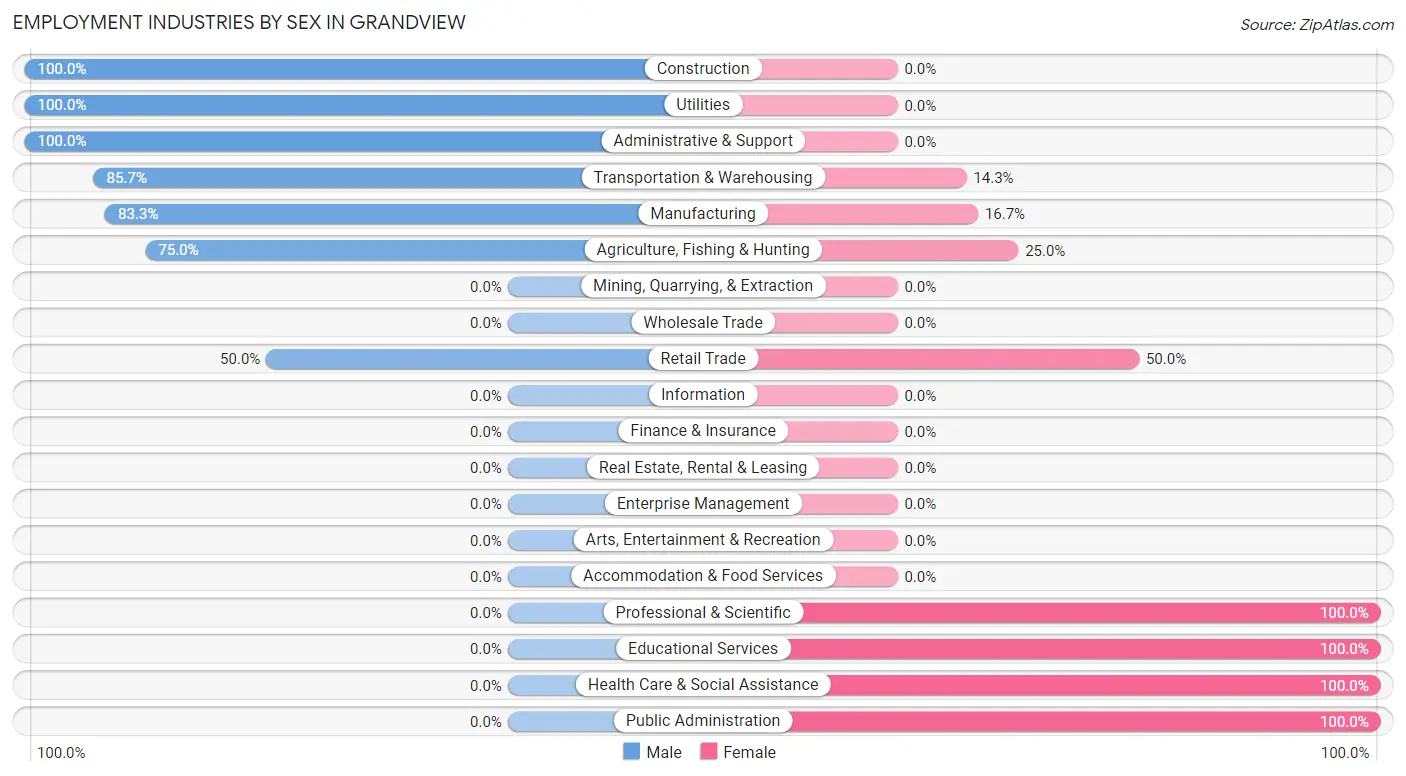
| Industry | Male | Female |
| Agriculture, Fishing & Hunting | 3 (75.0%) | 1 (25.0%) |
| Mining, Quarrying, & Extraction | 0 (0.0%) | 0 (0.0%) |
| Construction | 14 (100.0%) | 0 (0.0%) |
| Manufacturing | 50 (83.3%) | 10 (16.7%) |
| Wholesale Trade | 0 (0.0%) | 0 (0.0%) |
| Retail Trade | 7 (50.0%) | 7 (50.0%) |
| Transportation & Warehousing | 12 (85.7%) | 2 (14.3%) |
| Utilities | 5 (100.0%) | 0 (0.0%) |
| Information | 0 (0.0%) | 0 (0.0%) |
| Finance & Insurance | 0 (0.0%) | 0 (0.0%) |
| Real Estate, Rental & Leasing | 0 (0.0%) | 0 (0.0%) |
| Professional & Scientific | 0 (0.0%) | 2 (100.0%) |
| Enterprise Management | 0 (0.0%) | 0 (0.0%) |
| Administrative & Support | 9 (100.0%) | 0 (0.0%) |
| Educational Services | 0 (0.0%) | 6 (100.0%) |
| Health Care & Social Assistance | 0 (0.0%) | 23 (100.0%) |
| Arts, Entertainment & Recreation | 0 (0.0%) | 0 (0.0%) |
| Accommodation & Food Services | 0 (0.0%) | 0 (0.0%) |
| Public Administration | 0 (0.0%) | 6 (100.0%) |
| Total | 103 (61.3%) | 65 (38.7%) |
Education in Grandview
School Enrollment in Grandview
The most common levels of schooling among the 88 students in Grandview are elementary school (33 | 37.5%), middle school (18 | 20.4%), and high school (16 | 18.2%).
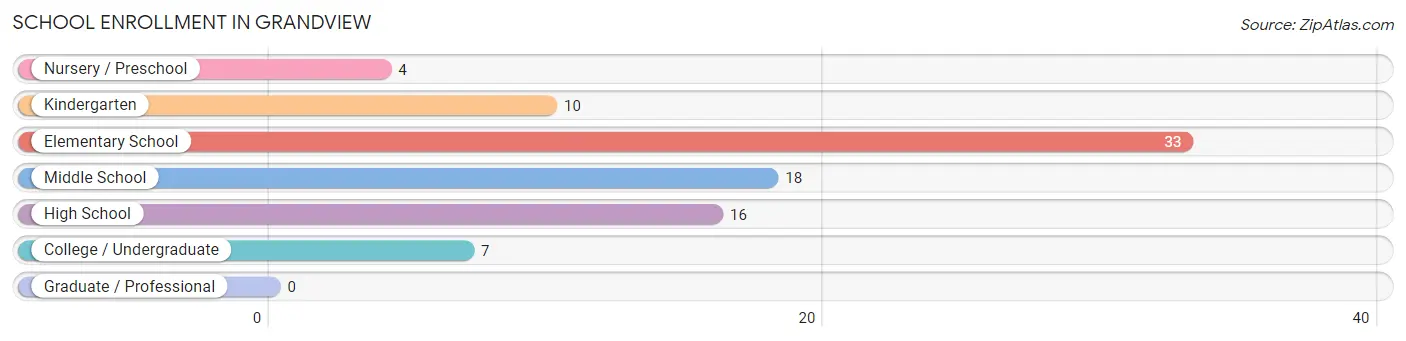
| School Level | # Students | % Students |
| Nursery / Preschool | 4 | 4.5% |
| Kindergarten | 10 | 11.4% |
| Elementary School | 33 | 37.5% |
| Middle School | 18 | 20.4% |
| High School | 16 | 18.2% |
| College / Undergraduate | 7 | 8.0% |
| Graduate / Professional | 0 | 0.0% |
| Total | 88 | 100.0% |
School Enrollment by Age by Funding Source in Grandview
Out of a total of 88 students who are enrolled in schools in Grandview, 3 (3.4%) attend a private institution, while the remaining 85 (96.6%) are enrolled in public schools. The age group of 15 to 17 year olds has the highest likelihood of being enrolled in private schools, with 3 (15.0% in the age bracket) enrolled. Conversely, the age group of 3 to 4 year olds has the lowest likelihood of being enrolled in a private school, with 2 (100.0% in the age bracket) attending a public institution.
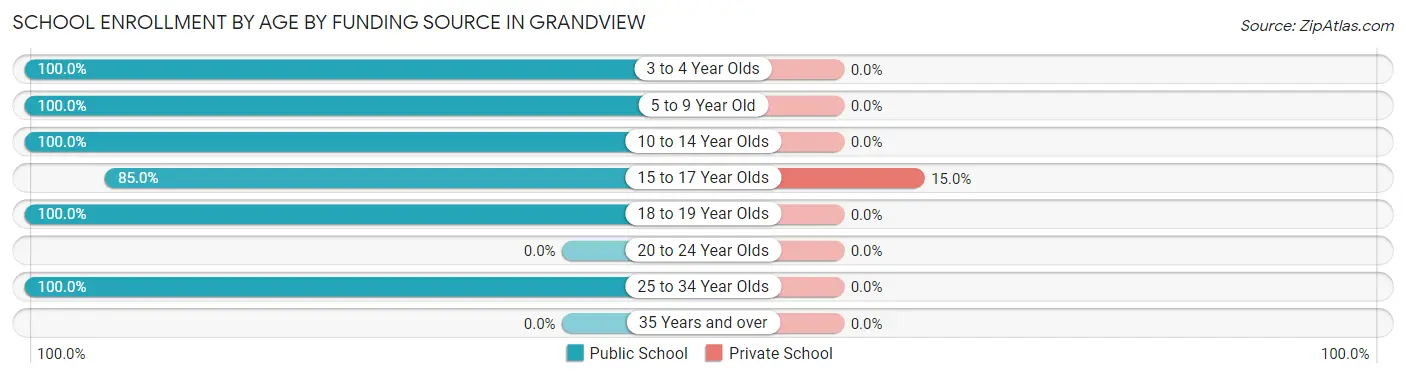
| Age Bracket | Public School | Private School |
| 3 to 4 Year Olds | 2 (100.0%) | 0 (0.0%) |
| 5 to 9 Year Old | 23 (100.0%) | 0 (0.0%) |
| 10 to 14 Year Olds | 36 (100.0%) | 0 (0.0%) |
| 15 to 17 Year Olds | 17 (85.0%) | 3 (15.0%) |
| 18 to 19 Year Olds | 4 (100.0%) | 0 (0.0%) |
| 20 to 24 Year Olds | 0 (0.0%) | 0 (0.0%) |
| 25 to 34 Year Olds | 3 (100.0%) | 0 (0.0%) |
| 35 Years and over | 0 (0.0%) | 0 (0.0%) |
| Total | 85 (96.6%) | 3 (3.4%) |
Educational Attainment by Field of Study in Grandview
Business (19 | 63.3%), engineering (6 | 20.0%), education (3 | 10.0%), and science & technology (2 | 6.7%) are the most common fields of study among 30 individuals in Grandview who have obtained a bachelor's degree or higher.
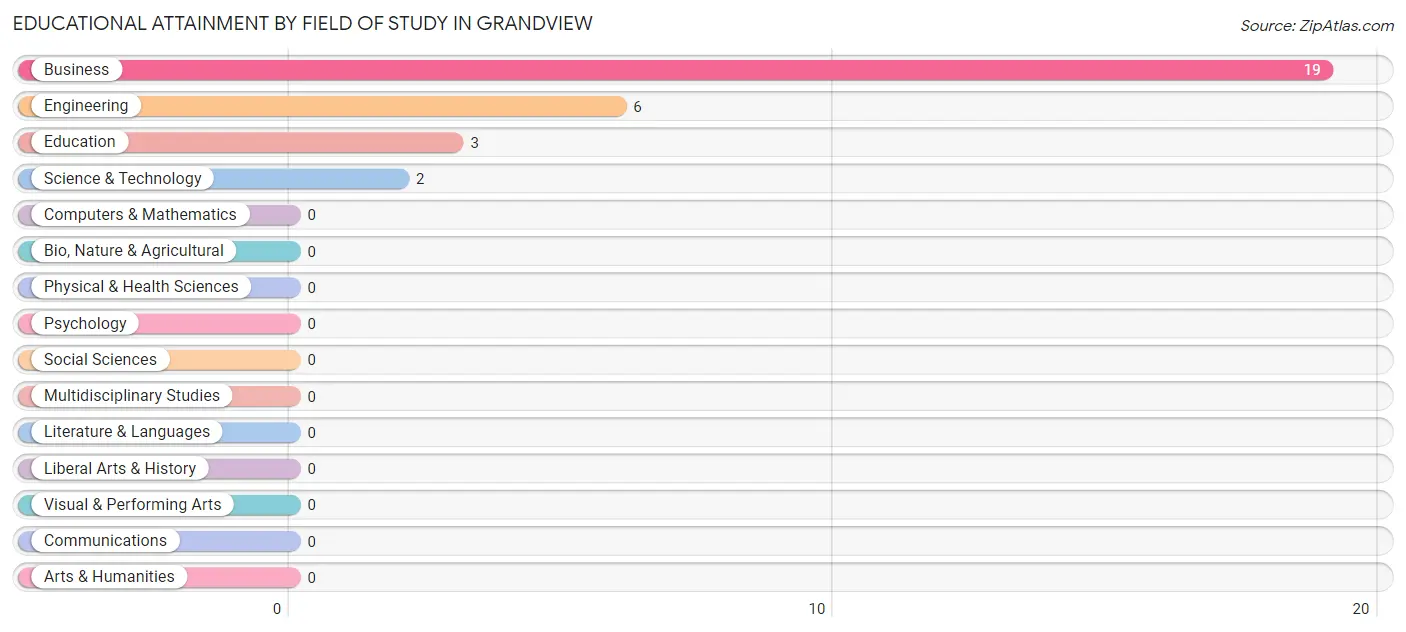
| Field of Study | # Graduates | % Graduates |
| Computers & Mathematics | 0 | 0.0% |
| Bio, Nature & Agricultural | 0 | 0.0% |
| Physical & Health Sciences | 0 | 0.0% |
| Psychology | 0 | 0.0% |
| Social Sciences | 0 | 0.0% |
| Engineering | 6 | 20.0% |
| Multidisciplinary Studies | 0 | 0.0% |
| Science & Technology | 2 | 6.7% |
| Business | 19 | 63.3% |
| Education | 3 | 10.0% |
| Literature & Languages | 0 | 0.0% |
| Liberal Arts & History | 0 | 0.0% |
| Visual & Performing Arts | 0 | 0.0% |
| Communications | 0 | 0.0% |
| Arts & Humanities | 0 | 0.0% |
| Total | 30 | 100.0% |
Transportation & Commute in Grandview
Vehicle Availability by Sex in Grandview
The most prevalent vehicle ownership categories in Grandview are males with 2 vehicles (49, accounting for 51.0%) and females with 2 vehicles (21, making up 75.4%).
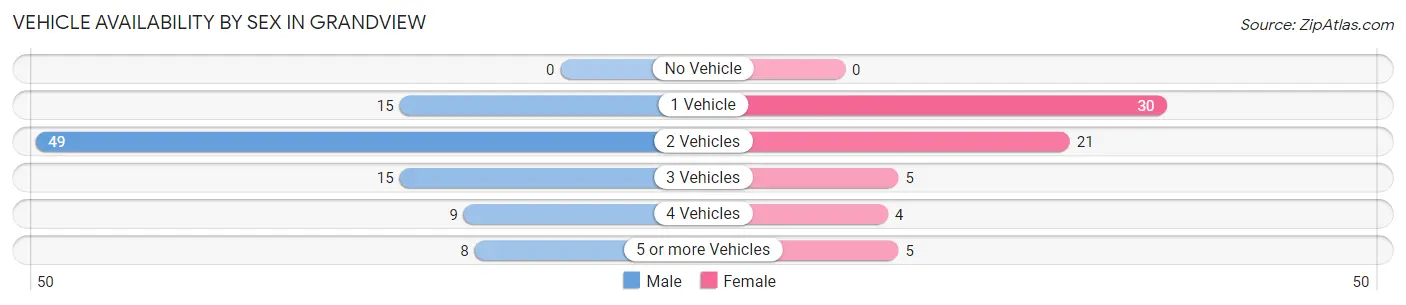
| Vehicles Available | Male | Female |
| No Vehicle | 0 (0.0%) | 0 (0.0%) |
| 1 Vehicle | 15 (15.6%) | 30 (46.2%) |
| 2 Vehicles | 49 (51.0%) | 21 (32.3%) |
| 3 Vehicles | 15 (15.6%) | 5 (7.7%) |
| 4 Vehicles | 9 (9.4%) | 4 (6.1%) |
| 5 or more Vehicles | 8 (8.3%) | 5 (7.7%) |
| Total | 96 (100.0%) | 65 (100.0%) |
Commute Time in Grandview
The most frequently occuring commute durations in Grandview are 20 to 24 minutes (26 commuters, 16.4%), 15 to 19 minutes (25 commuters, 15.7%), and 30 to 34 minutes (24 commuters, 15.1%).
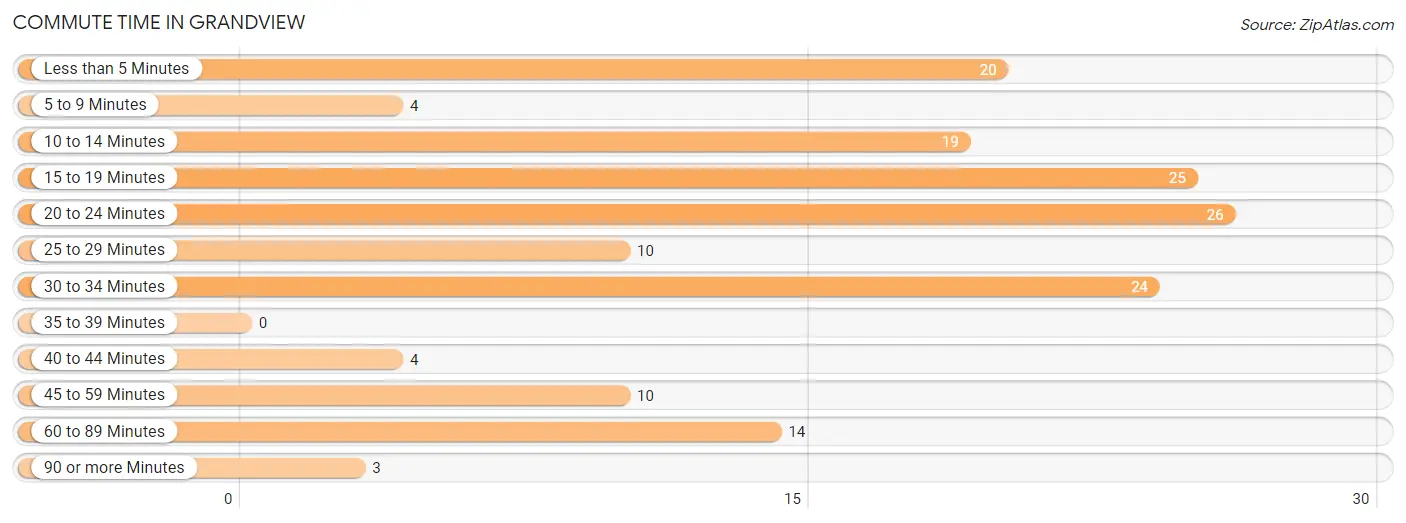
| Commute Time | # Commuters | % Commuters |
| Less than 5 Minutes | 20 | 12.6% |
| 5 to 9 Minutes | 4 | 2.5% |
| 10 to 14 Minutes | 19 | 11.9% |
| 15 to 19 Minutes | 25 | 15.7% |
| 20 to 24 Minutes | 26 | 16.4% |
| 25 to 29 Minutes | 10 | 6.3% |
| 30 to 34 Minutes | 24 | 15.1% |
| 35 to 39 Minutes | 0 | 0.0% |
| 40 to 44 Minutes | 4 | 2.5% |
| 45 to 59 Minutes | 10 | 6.3% |
| 60 to 89 Minutes | 14 | 8.8% |
| 90 or more Minutes | 3 | 1.9% |
Commute Time by Sex in Grandview
The most common commute times in Grandview are 15 to 19 minutes (22 commuters, 22.9%) for males and 20 to 24 minutes (23 commuters, 36.5%) for females.
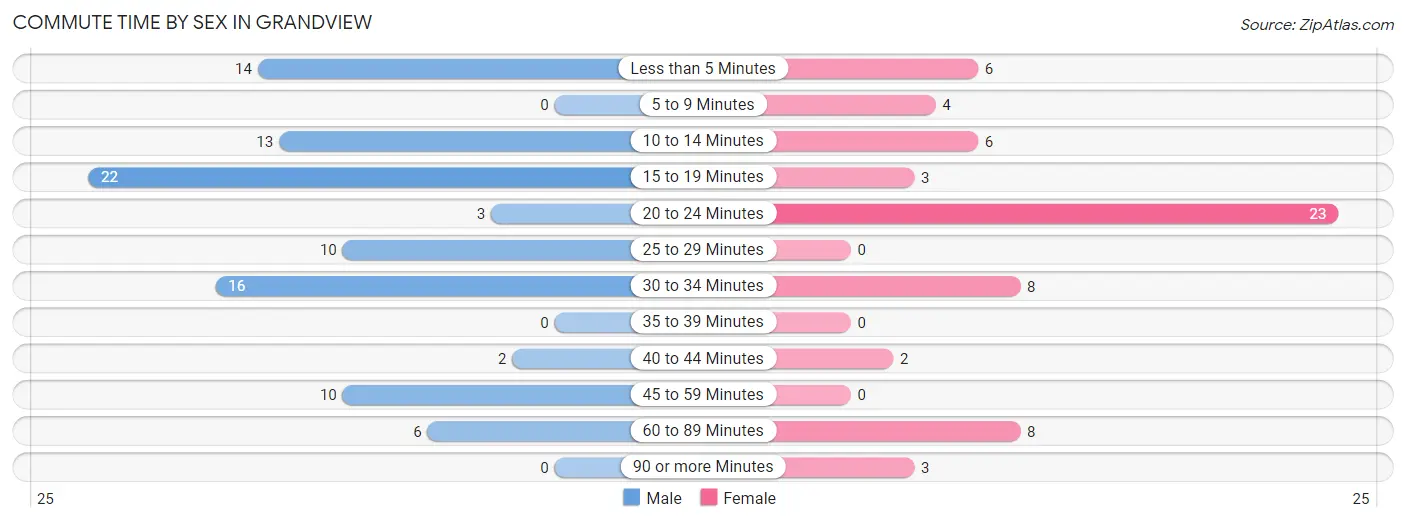
| Commute Time | Male | Female |
| Less than 5 Minutes | 14 (14.6%) | 6 (9.5%) |
| 5 to 9 Minutes | 0 (0.0%) | 4 (6.4%) |
| 10 to 14 Minutes | 13 (13.5%) | 6 (9.5%) |
| 15 to 19 Minutes | 22 (22.9%) | 3 (4.8%) |
| 20 to 24 Minutes | 3 (3.1%) | 23 (36.5%) |
| 25 to 29 Minutes | 10 (10.4%) | 0 (0.0%) |
| 30 to 34 Minutes | 16 (16.7%) | 8 (12.7%) |
| 35 to 39 Minutes | 0 (0.0%) | 0 (0.0%) |
| 40 to 44 Minutes | 2 (2.1%) | 2 (3.2%) |
| 45 to 59 Minutes | 10 (10.4%) | 0 (0.0%) |
| 60 to 89 Minutes | 6 (6.2%) | 8 (12.7%) |
| 90 or more Minutes | 0 (0.0%) | 3 (4.8%) |
Time of Departure to Work by Sex in Grandview
The most frequent times of departure to work in Grandview are 6:30 AM to 6:59 AM (35, 36.5%) for males and 7:00 AM to 7:29 AM (11, 17.5%) for females.
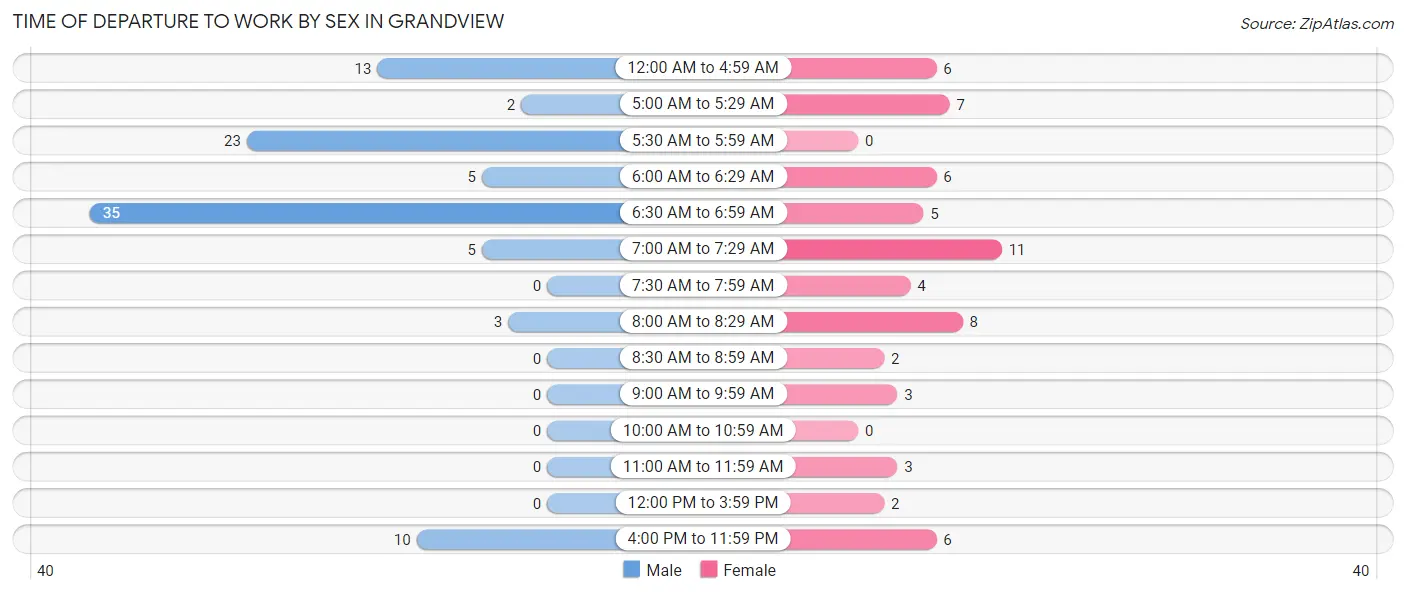
| Time of Departure | Male | Female |
| 12:00 AM to 4:59 AM | 13 (13.5%) | 6 (9.5%) |
| 5:00 AM to 5:29 AM | 2 (2.1%) | 7 (11.1%) |
| 5:30 AM to 5:59 AM | 23 (24.0%) | 0 (0.0%) |
| 6:00 AM to 6:29 AM | 5 (5.2%) | 6 (9.5%) |
| 6:30 AM to 6:59 AM | 35 (36.5%) | 5 (7.9%) |
| 7:00 AM to 7:29 AM | 5 (5.2%) | 11 (17.5%) |
| 7:30 AM to 7:59 AM | 0 (0.0%) | 4 (6.4%) |
| 8:00 AM to 8:29 AM | 3 (3.1%) | 8 (12.7%) |
| 8:30 AM to 8:59 AM | 0 (0.0%) | 2 (3.2%) |
| 9:00 AM to 9:59 AM | 0 (0.0%) | 3 (4.8%) |
| 10:00 AM to 10:59 AM | 0 (0.0%) | 0 (0.0%) |
| 11:00 AM to 11:59 AM | 0 (0.0%) | 3 (4.8%) |
| 12:00 PM to 3:59 PM | 0 (0.0%) | 2 (3.2%) |
| 4:00 PM to 11:59 PM | 10 (10.4%) | 6 (9.5%) |
| Total | 96 (100.0%) | 63 (100.0%) |
Housing Occupancy in Grandview
Occupancy by Ownership in Grandview
Of the total 235 dwellings in Grandview, owner-occupied units account for 199 (84.7%), while renter-occupied units make up 36 (15.3%).
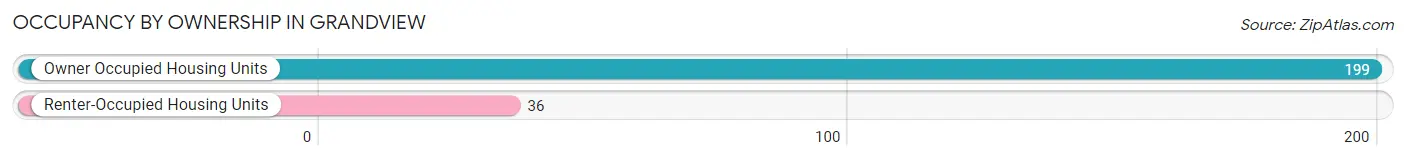
| Occupancy | # Housing Units | % Housing Units |
| Owner Occupied Housing Units | 199 | 84.7% |
| Renter-Occupied Housing Units | 36 | 15.3% |
| Total Occupied Housing Units | 235 | 100.0% |
Occupancy by Household Size in Grandview
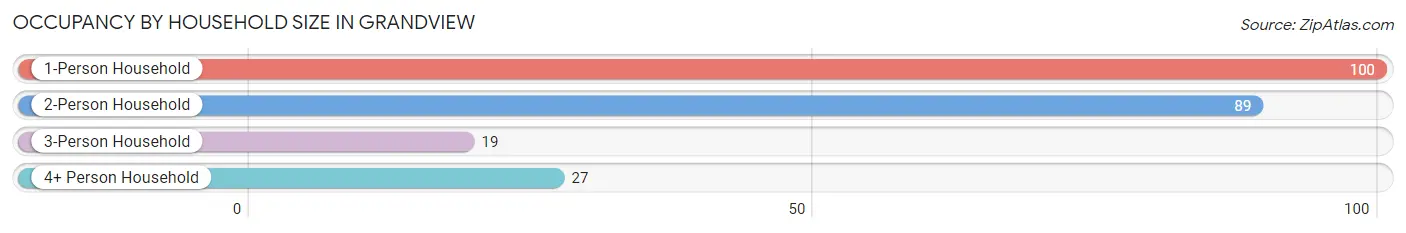
| Household Size | # Housing Units | % Housing Units |
| 1-Person Household | 100 | 42.5% |
| 2-Person Household | 89 | 37.9% |
| 3-Person Household | 19 | 8.1% |
| 4+ Person Household | 27 | 11.5% |
| Total Housing Units | 235 | 100.0% |
Occupancy by Ownership by Household Size in Grandview
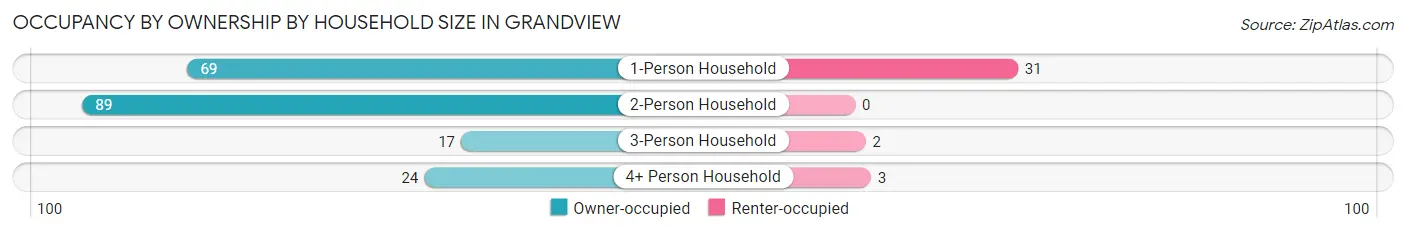
| Household Size | Owner-occupied | Renter-occupied |
| 1-Person Household | 69 (69.0%) | 31 (31.0%) |
| 2-Person Household | 89 (100.0%) | 0 (0.0%) |
| 3-Person Household | 17 (89.5%) | 2 (10.5%) |
| 4+ Person Household | 24 (88.9%) | 3 (11.1%) |
| Total Housing Units | 199 (84.7%) | 36 (15.3%) |
Occupancy by Educational Attainment in Grandview
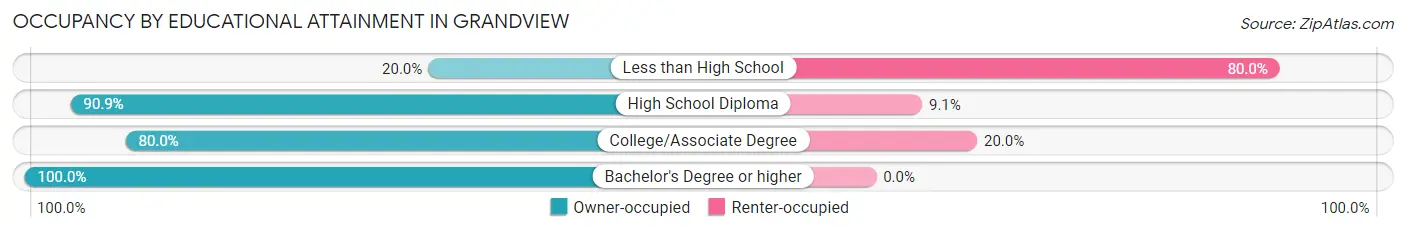
| Household Size | Owner-occupied | Renter-occupied |
| Less than High School | 2 (20.0%) | 8 (80.0%) |
| High School Diploma | 110 (90.9%) | 11 (9.1%) |
| College/Associate Degree | 68 (80.0%) | 17 (20.0%) |
| Bachelor's Degree or higher | 19 (100.0%) | 0 (0.0%) |
Occupancy by Age of Householder in Grandview
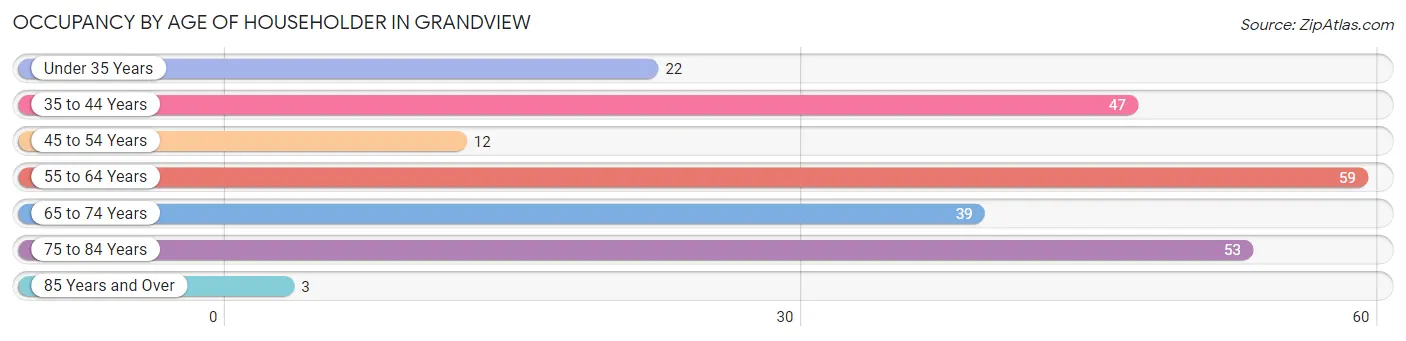
| Age Bracket | # Households | % Households |
| Under 35 Years | 22 | 9.4% |
| 35 to 44 Years | 47 | 20.0% |
| 45 to 54 Years | 12 | 5.1% |
| 55 to 64 Years | 59 | 25.1% |
| 65 to 74 Years | 39 | 16.6% |
| 75 to 84 Years | 53 | 22.6% |
| 85 Years and Over | 3 | 1.3% |
| Total | 235 | 100.0% |
Housing Finances in Grandview
Median Income by Occupancy in Grandview
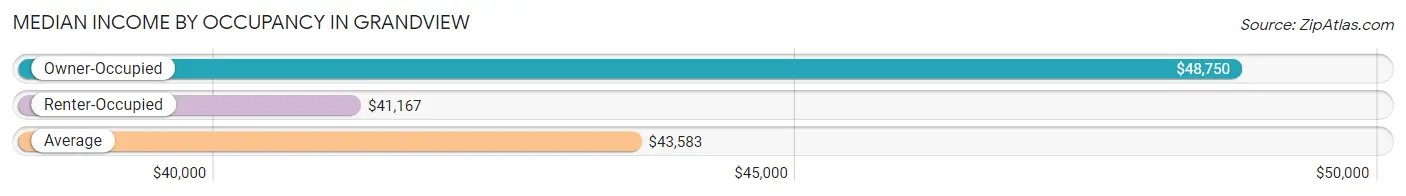
| Occupancy Type | # Households | Median Income |
| Owner-Occupied | 199 (84.7%) | $48,750 |
| Renter-Occupied | 36 (15.3%) | $41,167 |
| Average | 235 (100.0%) | $43,583 |
Occupancy by Householder Income Bracket in Grandview
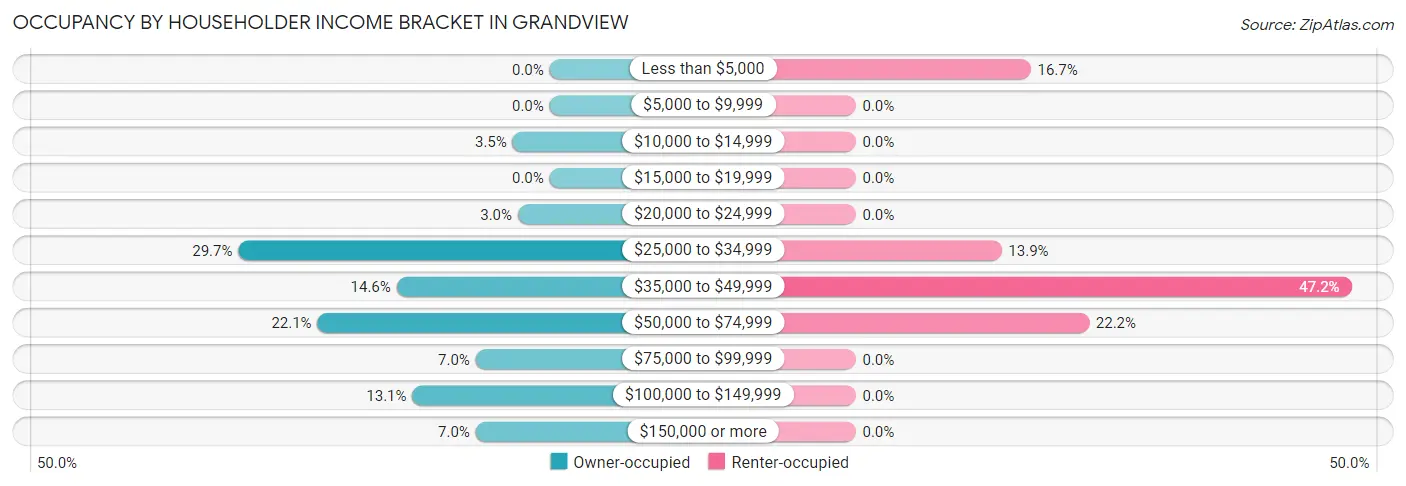
| Income Bracket | Owner-occupied | Renter-occupied |
| Less than $5,000 | 0 (0.0%) | 6 (16.7%) |
| $5,000 to $9,999 | 0 (0.0%) | 0 (0.0%) |
| $10,000 to $14,999 | 7 (3.5%) | 0 (0.0%) |
| $15,000 to $19,999 | 0 (0.0%) | 0 (0.0%) |
| $20,000 to $24,999 | 6 (3.0%) | 0 (0.0%) |
| $25,000 to $34,999 | 59 (29.6%) | 5 (13.9%) |
| $35,000 to $49,999 | 29 (14.6%) | 17 (47.2%) |
| $50,000 to $74,999 | 44 (22.1%) | 8 (22.2%) |
| $75,000 to $99,999 | 14 (7.0%) | 0 (0.0%) |
| $100,000 to $149,999 | 26 (13.1%) | 0 (0.0%) |
| $150,000 or more | 14 (7.0%) | 0 (0.0%) |
| Total | 199 (100.0%) | 36 (100.0%) |
Monthly Housing Cost Tiers in Grandview
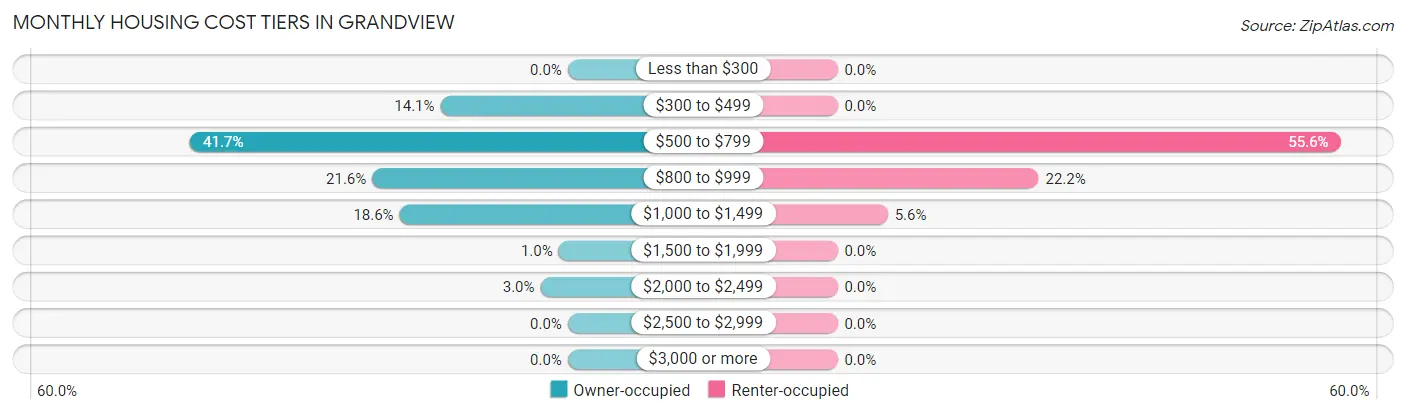
| Monthly Cost | Owner-occupied | Renter-occupied |
| Less than $300 | 0 (0.0%) | 0 (0.0%) |
| $300 to $499 | 28 (14.1%) | 0 (0.0%) |
| $500 to $799 | 83 (41.7%) | 20 (55.6%) |
| $800 to $999 | 43 (21.6%) | 8 (22.2%) |
| $1,000 to $1,499 | 37 (18.6%) | 2 (5.6%) |
| $1,500 to $1,999 | 2 (1.0%) | 0 (0.0%) |
| $2,000 to $2,499 | 6 (3.0%) | 0 (0.0%) |
| $2,500 to $2,999 | 0 (0.0%) | 0 (0.0%) |
| $3,000 or more | 0 (0.0%) | 0 (0.0%) |
| Total | 199 (100.0%) | 36 (100.0%) |
Physical Housing Characteristics in Grandview
Housing Structures in Grandview
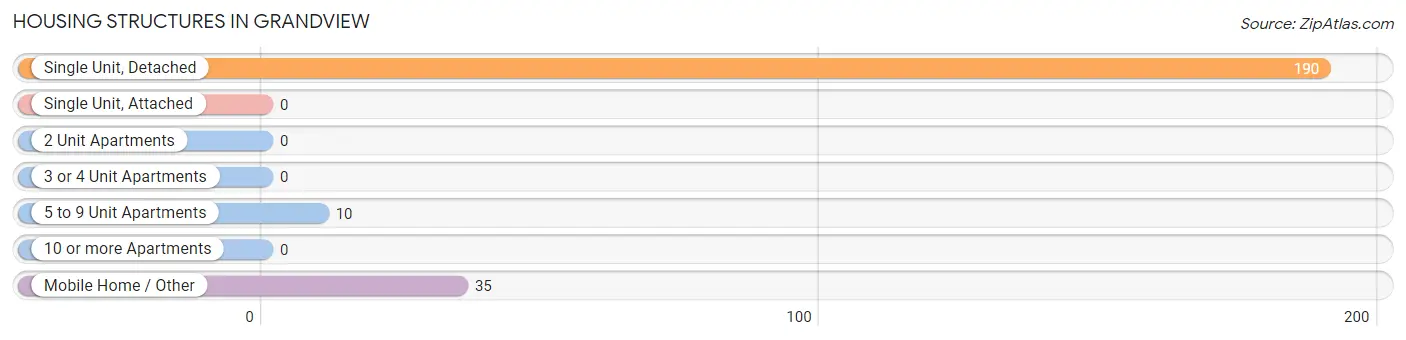
| Structure Type | # Housing Units | % Housing Units |
| Single Unit, Detached | 190 | 80.8% |
| Single Unit, Attached | 0 | 0.0% |
| 2 Unit Apartments | 0 | 0.0% |
| 3 or 4 Unit Apartments | 0 | 0.0% |
| 5 to 9 Unit Apartments | 10 | 4.3% |
| 10 or more Apartments | 0 | 0.0% |
| Mobile Home / Other | 35 | 14.9% |
| Total | 235 | 100.0% |
Housing Structures by Occupancy in Grandview
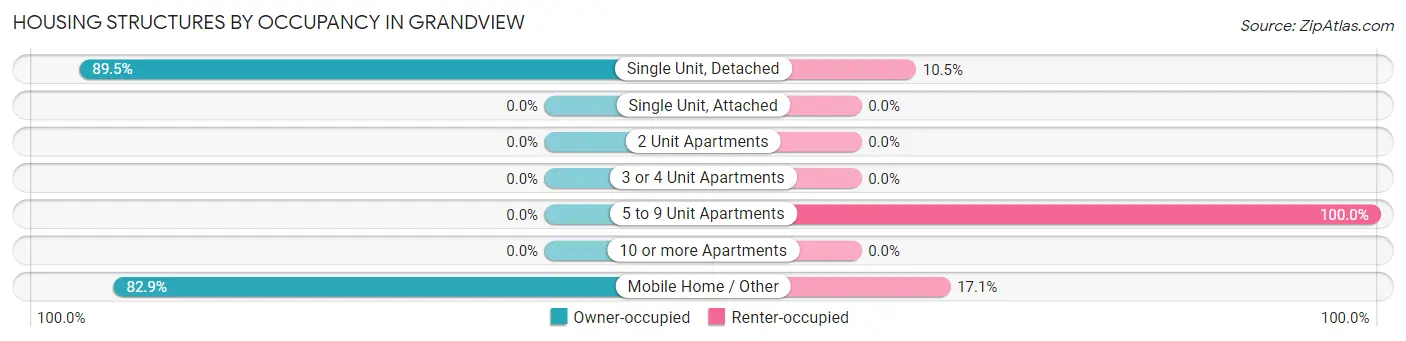
| Structure Type | Owner-occupied | Renter-occupied |
| Single Unit, Detached | 170 (89.5%) | 20 (10.5%) |
| Single Unit, Attached | 0 (0.0%) | 0 (0.0%) |
| 2 Unit Apartments | 0 (0.0%) | 0 (0.0%) |
| 3 or 4 Unit Apartments | 0 (0.0%) | 0 (0.0%) |
| 5 to 9 Unit Apartments | 0 (0.0%) | 10 (100.0%) |
| 10 or more Apartments | 0 (0.0%) | 0 (0.0%) |
| Mobile Home / Other | 29 (82.9%) | 6 (17.1%) |
| Total | 199 (84.7%) | 36 (15.3%) |
Housing Structures by Number of Rooms in Grandview
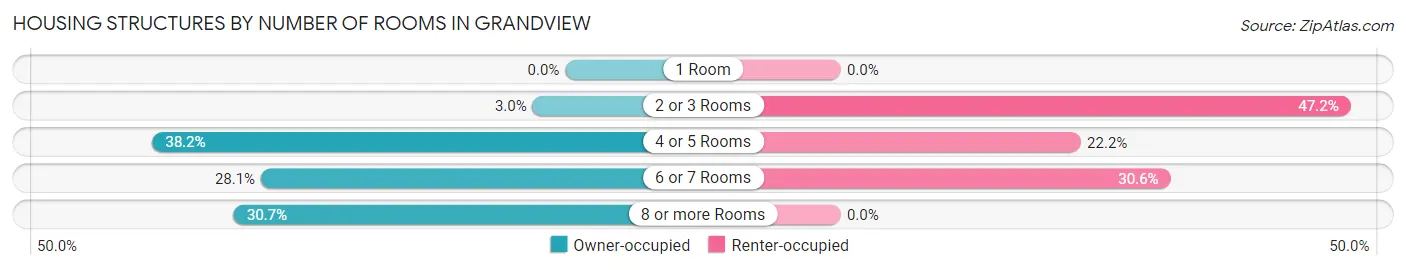
| Number of Rooms | Owner-occupied | Renter-occupied |
| 1 Room | 0 (0.0%) | 0 (0.0%) |
| 2 or 3 Rooms | 6 (3.0%) | 17 (47.2%) |
| 4 or 5 Rooms | 76 (38.2%) | 8 (22.2%) |
| 6 or 7 Rooms | 56 (28.1%) | 11 (30.6%) |
| 8 or more Rooms | 61 (30.6%) | 0 (0.0%) |
| Total | 199 (100.0%) | 36 (100.0%) |
Housing Structure by Heating Type in Grandview
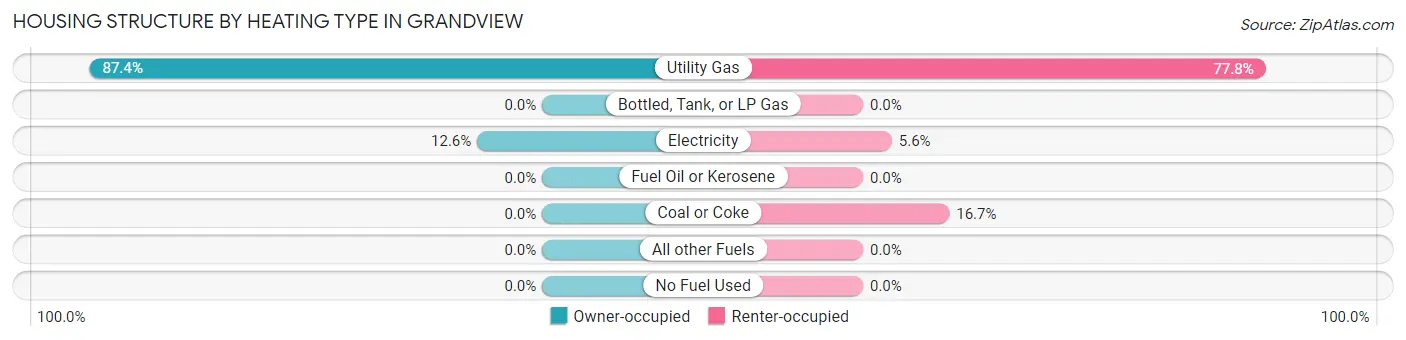
| Heating Type | Owner-occupied | Renter-occupied |
| Utility Gas | 174 (87.4%) | 28 (77.8%) |
| Bottled, Tank, or LP Gas | 0 (0.0%) | 0 (0.0%) |
| Electricity | 25 (12.6%) | 2 (5.6%) |
| Fuel Oil or Kerosene | 0 (0.0%) | 0 (0.0%) |
| Coal or Coke | 0 (0.0%) | 6 (16.7%) |
| All other Fuels | 0 (0.0%) | 0 (0.0%) |
| No Fuel Used | 0 (0.0%) | 0 (0.0%) |
| Total | 199 (100.0%) | 36 (100.0%) |
Household Vehicle Usage in Grandview
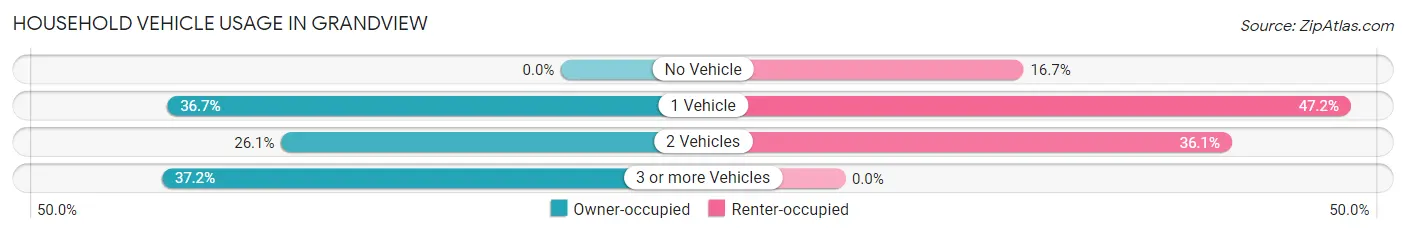
| Vehicles per Household | Owner-occupied | Renter-occupied |
| No Vehicle | 0 (0.0%) | 6 (16.7%) |
| 1 Vehicle | 73 (36.7%) | 17 (47.2%) |
| 2 Vehicles | 52 (26.1%) | 13 (36.1%) |
| 3 or more Vehicles | 74 (37.2%) | 0 (0.0%) |
| Total | 199 (100.0%) | 36 (100.0%) |
Real Estate & Mortgages in Grandview
Real Estate and Mortgage Overview in Grandview
| Characteristic | Without Mortgage | With Mortgage |
| Housing Units | 108 | 91 |
| Median Property Value | $142,300 | $109,900 |
| Median Household Income | $36,667 | $6 |
| Monthly Housing Costs | $635 | $0 |
| Real Estate Taxes | $2,024 | $0 |
Property Value by Mortgage Status in Grandview
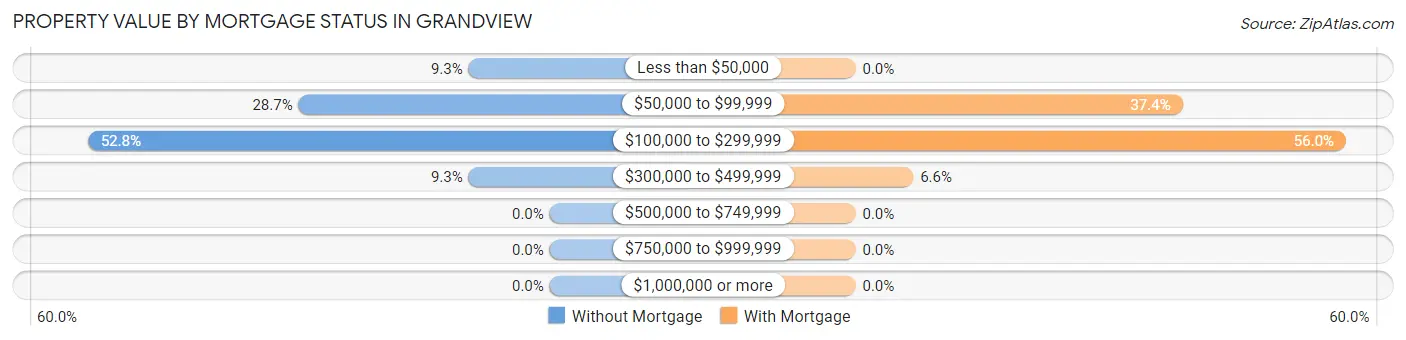
| Property Value | Without Mortgage | With Mortgage |
| Less than $50,000 | 10 (9.3%) | 0 (0.0%) |
| $50,000 to $99,999 | 31 (28.7%) | 34 (37.4%) |
| $100,000 to $299,999 | 57 (52.8%) | 51 (56.0%) |
| $300,000 to $499,999 | 10 (9.3%) | 6 (6.6%) |
| $500,000 to $749,999 | 0 (0.0%) | 0 (0.0%) |
| $750,000 to $999,999 | 0 (0.0%) | 0 (0.0%) |
| $1,000,000 or more | 0 (0.0%) | 0 (0.0%) |
| Total | 108 (100.0%) | 91 (100.0%) |
Household Income by Mortgage Status in Grandview
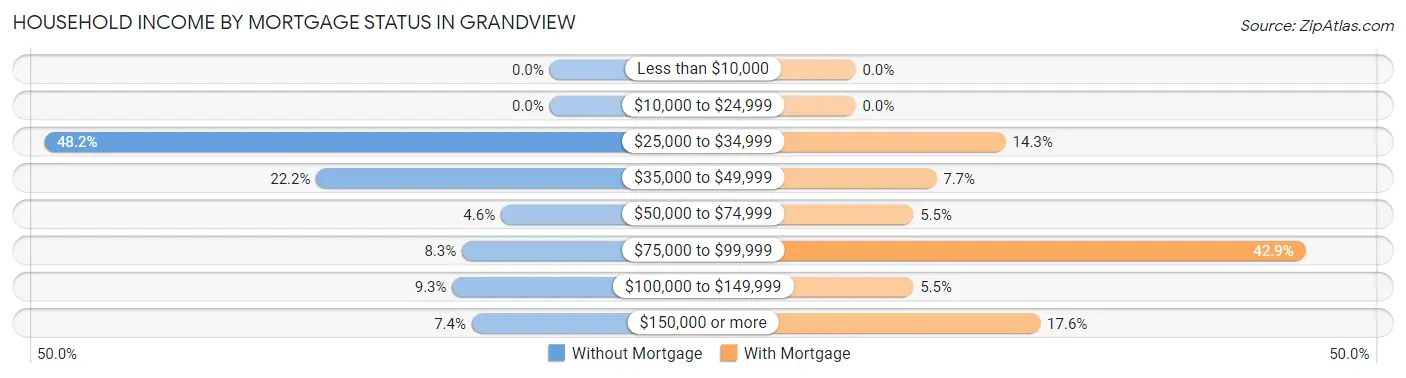
| Household Income | Without Mortgage | With Mortgage |
| Less than $10,000 | 0 (0.0%) | 0 (0.0%) |
| $10,000 to $24,999 | 0 (0.0%) | 0 (0.0%) |
| $25,000 to $34,999 | 52 (48.1%) | 13 (14.3%) |
| $35,000 to $49,999 | 24 (22.2%) | 7 (7.7%) |
| $50,000 to $74,999 | 5 (4.6%) | 5 (5.5%) |
| $75,000 to $99,999 | 9 (8.3%) | 39 (42.9%) |
| $100,000 to $149,999 | 10 (9.3%) | 5 (5.5%) |
| $150,000 or more | 8 (7.4%) | 16 (17.6%) |
| Total | 108 (100.0%) | 91 (100.0%) |
Property Value to Household Income Ratio in Grandview
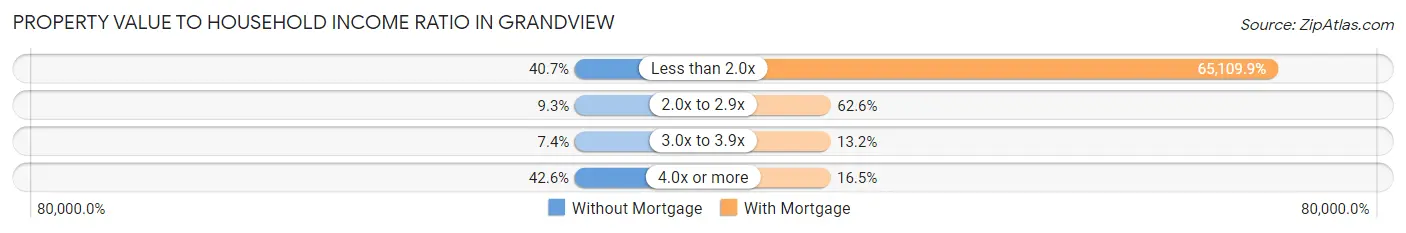
| Value-to-Income Ratio | Without Mortgage | With Mortgage |
| Less than 2.0x | 44 (40.7%) | 59,250 (65,109.9%) |
| 2.0x to 2.9x | 10 (9.3%) | 57 (62.6%) |
| 3.0x to 3.9x | 8 (7.4%) | 12 (13.2%) |
| 4.0x or more | 46 (42.6%) | 15 (16.5%) |
| Total | 108 (100.0%) | 91 (100.0%) |
Real Estate Taxes by Mortgage Status in Grandview
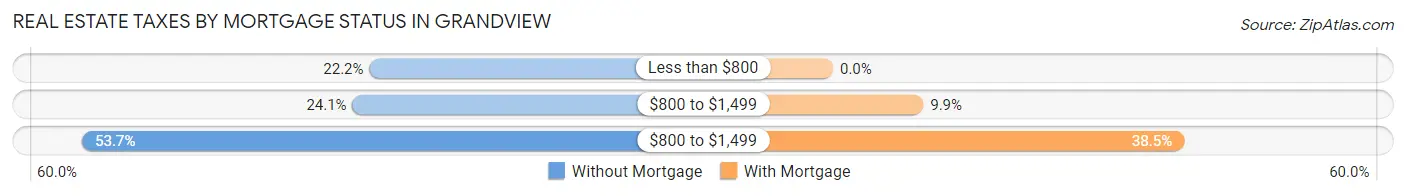
| Property Taxes | Without Mortgage | With Mortgage |
| Less than $800 | 24 (22.2%) | 0 (0.0%) |
| $800 to $1,499 | 26 (24.1%) | 9 (9.9%) |
| $800 to $1,499 | 58 (53.7%) | 35 (38.5%) |
| Total | 108 (100.0%) | 91 (100.0%) |
Health & Disability in Grandview
Health Insurance Coverage by Age in Grandview
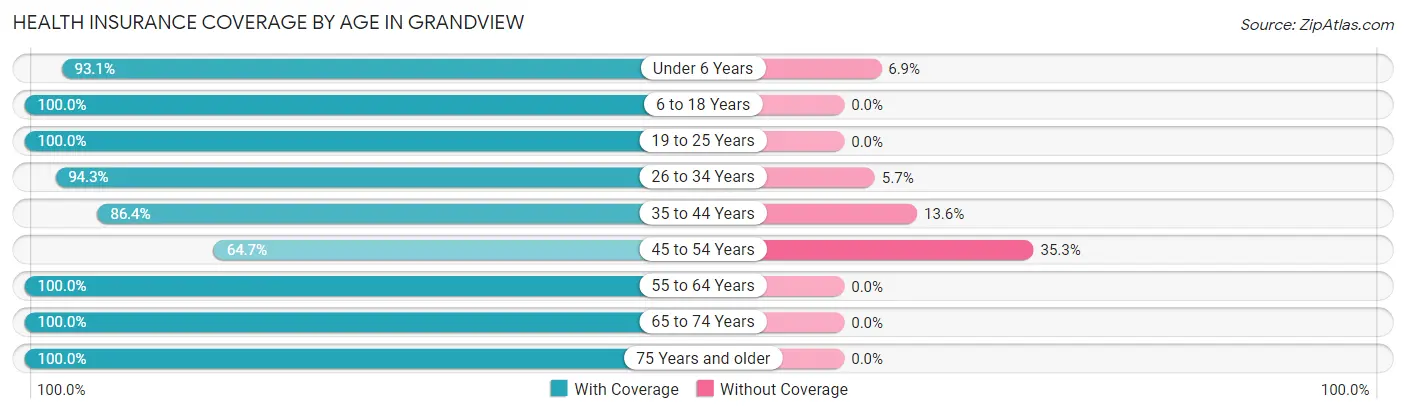
| Age Bracket | With Coverage | Without Coverage |
| Under 6 Years | 27 (93.1%) | 2 (6.9%) |
| 6 to 18 Years | 67 (100.0%) | 0 (0.0%) |
| 19 to 25 Years | 7 (100.0%) | 0 (0.0%) |
| 26 to 34 Years | 33 (94.3%) | 2 (5.7%) |
| 35 to 44 Years | 51 (86.4%) | 8 (13.6%) |
| 45 to 54 Years | 11 (64.7%) | 6 (35.3%) |
| 55 to 64 Years | 99 (100.0%) | 0 (0.0%) |
| 65 to 74 Years | 55 (100.0%) | 0 (0.0%) |
| 75 Years and older | 66 (100.0%) | 0 (0.0%) |
| Total | 416 (95.9%) | 18 (4.2%) |
Health Insurance Coverage by Citizenship Status in Grandview

| Citizenship Status | With Coverage | Without Coverage |
| Native Born | 27 (93.1%) | 2 (6.9%) |
| Foreign Born, Citizen | 67 (100.0%) | 0 (0.0%) |
| Foreign Born, not a Citizen | 7 (100.0%) | 0 (0.0%) |
Health Insurance Coverage by Household Income in Grandview
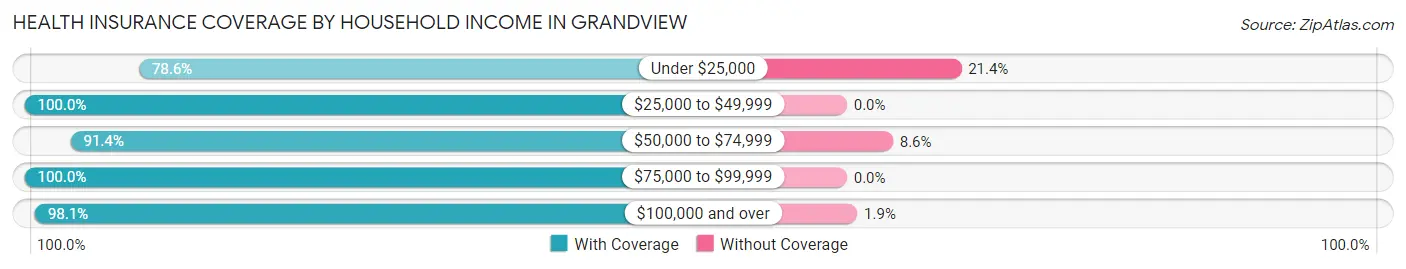
| Household Income | With Coverage | Without Coverage |
| Under $25,000 | 22 (78.6%) | 6 (21.4%) |
| $25,000 to $49,999 | 170 (100.0%) | 0 (0.0%) |
| $50,000 to $74,999 | 106 (91.4%) | 10 (8.6%) |
| $75,000 to $99,999 | 17 (100.0%) | 0 (0.0%) |
| $100,000 and over | 101 (98.1%) | 2 (1.9%) |
Public vs Private Health Insurance Coverage by Age in Grandview
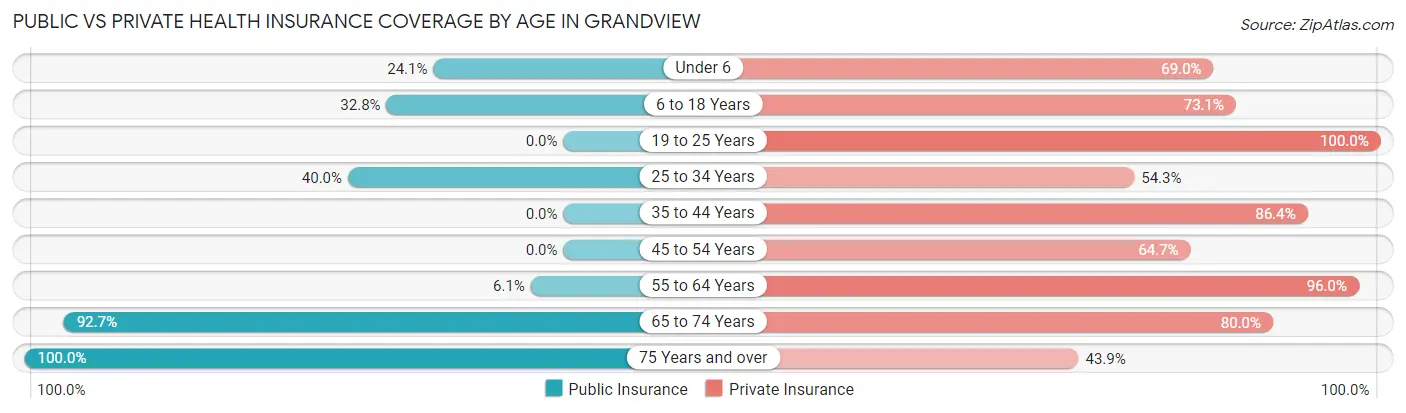
| Age Bracket | Public Insurance | Private Insurance |
| Under 6 | 7 (24.1%) | 20 (69.0%) |
| 6 to 18 Years | 22 (32.8%) | 49 (73.1%) |
| 19 to 25 Years | 0 (0.0%) | 7 (100.0%) |
| 25 to 34 Years | 14 (40.0%) | 19 (54.3%) |
| 35 to 44 Years | 0 (0.0%) | 51 (86.4%) |
| 45 to 54 Years | 0 (0.0%) | 11 (64.7%) |
| 55 to 64 Years | 6 (6.1%) | 95 (96.0%) |
| 65 to 74 Years | 51 (92.7%) | 44 (80.0%) |
| 75 Years and over | 66 (100.0%) | 29 (43.9%) |
| Total | 166 (38.3%) | 325 (74.9%) |
Disability Status by Sex by Age in Grandview
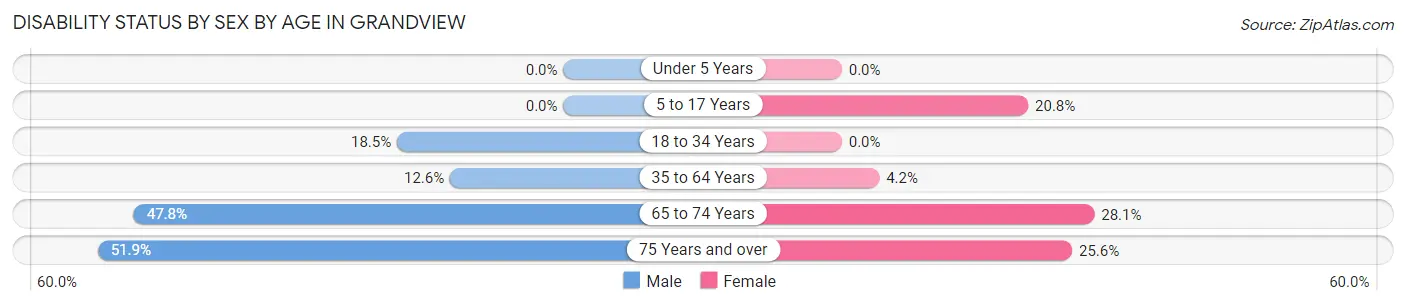
| Age Bracket | Male | Female |
| Under 5 Years | 0 (0.0%) | 0 (0.0%) |
| 5 to 17 Years | 0 (0.0%) | 11 (20.7%) |
| 18 to 34 Years | 5 (18.5%) | 0 (0.0%) |
| 35 to 64 Years | 13 (12.6%) | 3 (4.2%) |
| 65 to 74 Years | 11 (47.8%) | 9 (28.1%) |
| 75 Years and over | 14 (51.8%) | 10 (25.6%) |
Disability Class by Sex by Age in Grandview
Disability Class: Hearing Difficulty
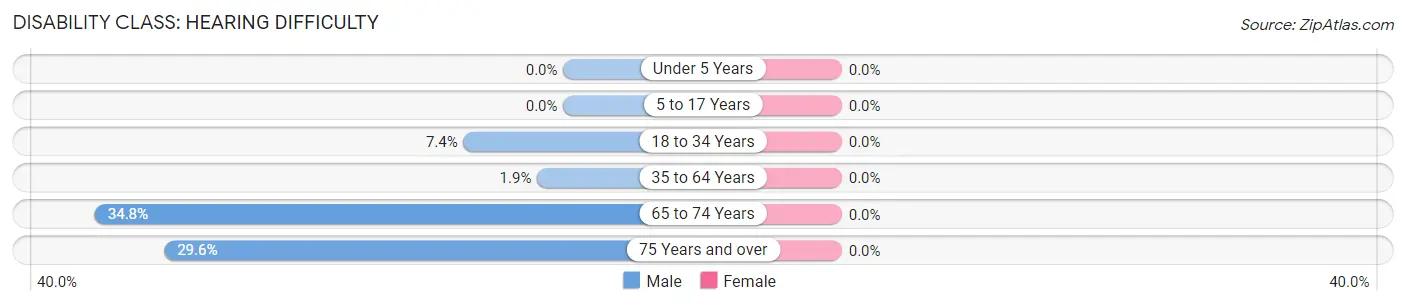
| Age Bracket | Male | Female |
| Under 5 Years | 0 (0.0%) | 0 (0.0%) |
| 5 to 17 Years | 0 (0.0%) | 0 (0.0%) |
| 18 to 34 Years | 2 (7.4%) | 0 (0.0%) |
| 35 to 64 Years | 2 (1.9%) | 0 (0.0%) |
| 65 to 74 Years | 8 (34.8%) | 0 (0.0%) |
| 75 Years and over | 8 (29.6%) | 0 (0.0%) |
Disability Class: Vision Difficulty
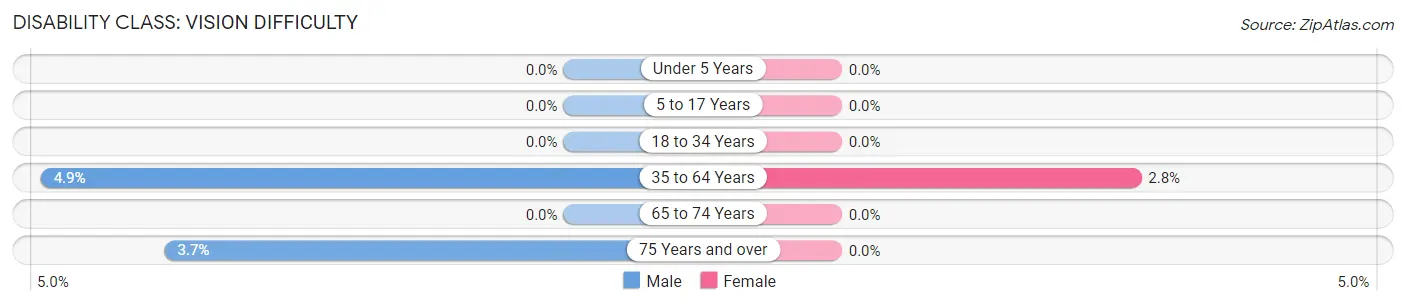
| Age Bracket | Male | Female |
| Under 5 Years | 0 (0.0%) | 0 (0.0%) |
| 5 to 17 Years | 0 (0.0%) | 0 (0.0%) |
| 18 to 34 Years | 0 (0.0%) | 0 (0.0%) |
| 35 to 64 Years | 5 (4.9%) | 2 (2.8%) |
| 65 to 74 Years | 0 (0.0%) | 0 (0.0%) |
| 75 Years and over | 1 (3.7%) | 0 (0.0%) |
Disability Class: Cognitive Difficulty
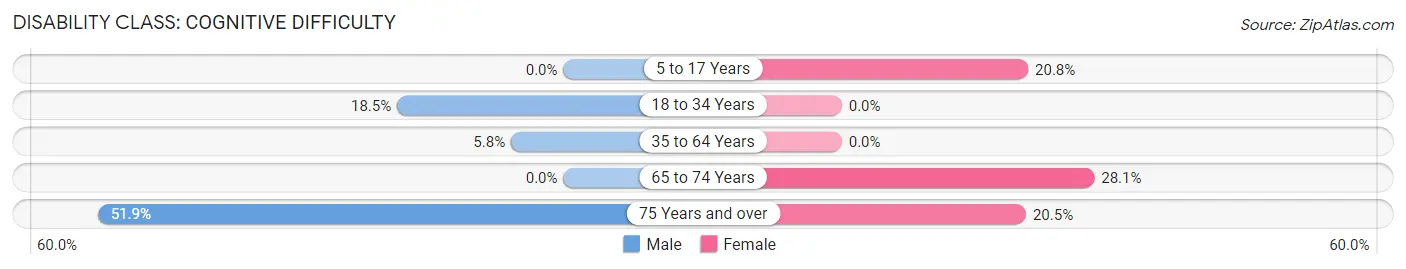
| Age Bracket | Male | Female |
| 5 to 17 Years | 0 (0.0%) | 11 (20.7%) |
| 18 to 34 Years | 5 (18.5%) | 0 (0.0%) |
| 35 to 64 Years | 6 (5.8%) | 0 (0.0%) |
| 65 to 74 Years | 0 (0.0%) | 9 (28.1%) |
| 75 Years and over | 14 (51.8%) | 8 (20.5%) |
Disability Class: Ambulatory Difficulty
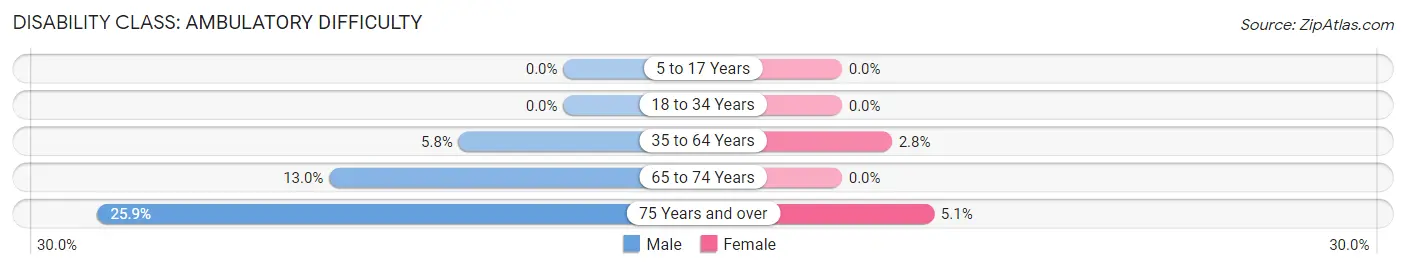
| Age Bracket | Male | Female |
| 5 to 17 Years | 0 (0.0%) | 0 (0.0%) |
| 18 to 34 Years | 0 (0.0%) | 0 (0.0%) |
| 35 to 64 Years | 6 (5.8%) | 2 (2.8%) |
| 65 to 74 Years | 3 (13.0%) | 0 (0.0%) |
| 75 Years and over | 7 (25.9%) | 2 (5.1%) |
Disability Class: Self-Care Difficulty
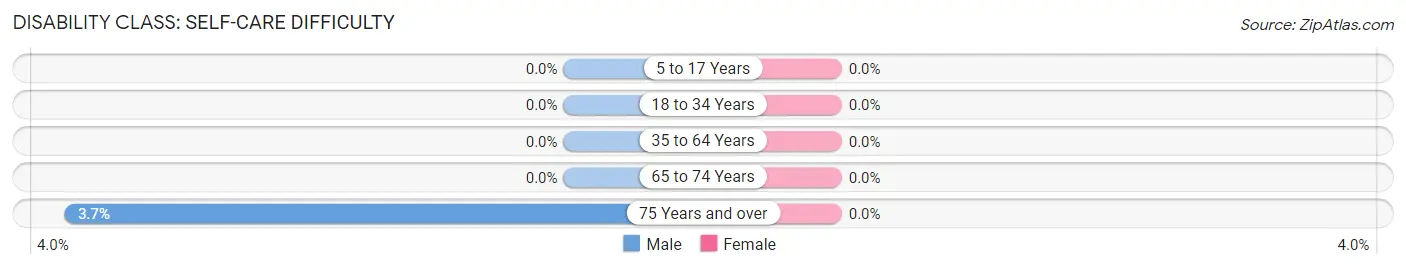
| Age Bracket | Male | Female |
| 5 to 17 Years | 0 (0.0%) | 0 (0.0%) |
| 18 to 34 Years | 0 (0.0%) | 0 (0.0%) |
| 35 to 64 Years | 0 (0.0%) | 0 (0.0%) |
| 65 to 74 Years | 0 (0.0%) | 0 (0.0%) |
| 75 Years and over | 1 (3.7%) | 0 (0.0%) |
Technology Access in Grandview
Computing Device Access in Grandview
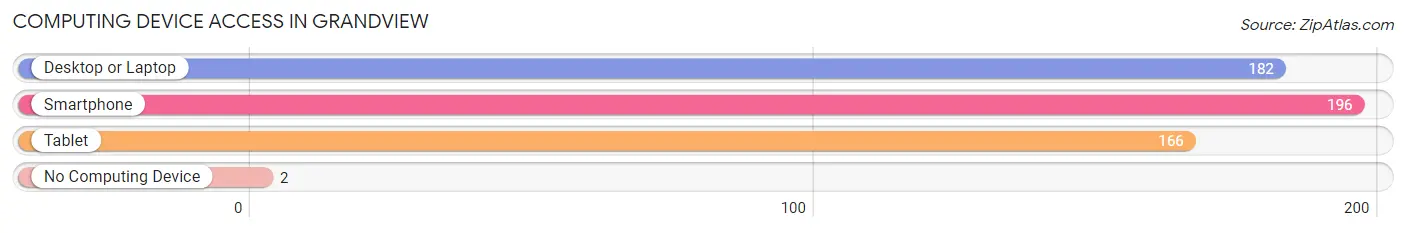
| Device Type | # Households | % Households |
| Desktop or Laptop | 182 | 77.4% |
| Smartphone | 196 | 83.4% |
| Tablet | 166 | 70.6% |
| No Computing Device | 2 | 0.9% |
| Total | 235 | 100.0% |
Internet Access in Grandview
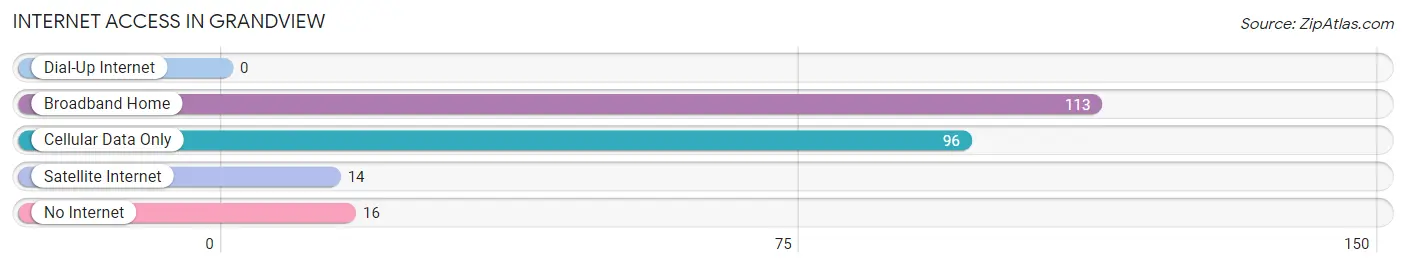
| Internet Type | # Households | % Households |
| Dial-Up Internet | 0 | 0.0% |
| Broadband Home | 113 | 48.1% |
| Cellular Data Only | 96 | 40.8% |
| Satellite Internet | 14 | 6.0% |
| No Internet | 16 | 6.8% |
| Total | 235 | 100.0% |
Grandview Summary
Geography
Grandview is a small city located in the southeastern corner of Iowa, in the county of Lee. It is situated on the banks of the Mississippi River, and is bordered by the cities of Fort Madison and Keokuk. The city has a total area of 1.2 square miles, all of which is land.
History
Grandview was founded in 1837 by a group of settlers from Ohio. The city was originally known as Grandview Station, and was a stop on the Chicago, Burlington and Quincy Railroad. The city was officially incorporated in 1871, and was named after the nearby Grandview Bluffs.
In the late 19th century, Grandview was a thriving agricultural community, with a population of over 1,000 people. The city was home to several businesses, including a flour mill, a sawmill, a brickyard, and a creamery.
In the early 20th century, Grandview experienced a period of growth and prosperity. The city was home to several factories, including a canning factory, a furniture factory, and a shoe factory. The city also had a thriving retail sector, with several stores and restaurants.
Economy
Grandview’s economy is largely based on agriculture and manufacturing. The city is home to several large farms, which produce corn, soybeans, and other crops. The city also has several manufacturing plants, which produce a variety of products, including furniture, clothing, and automotive parts.
The city also has a thriving retail sector, with several stores and restaurants. The city is home to several banks, and is also home to a branch of the University of Iowa.
Demographics
As of the 2010 census, Grandview had a population of 1,845 people. The racial makeup of the city was 95.3% White, 0.7% African American, 0.3% Native American, 0.7% Asian, 0.1% Pacific Islander, and 2.0% from other races. Hispanic or Latino of any race were 2.2% of the population.
The median household income in Grandview was $37,917, and the median family income was $45,625. The per capita income for the city was $19,945. About 11.2% of families and 14.2% of the population were below the poverty line, including 19.2% of those under age 18 and 8.3% of those age 65 or over.
Grandview is a small city with a rich history and a diverse economy. The city is home to several large farms, manufacturing plants, and retail stores. The city also has a thriving educational sector, with a branch of the University of Iowa. The city has a population of 1,845 people, with a median household income of $37,917.
Common Questions
What is Per Capita Income in Grandview?
Per Capita income in Grandview is $30,997.
What is the Median Family Income in Grandview?
Median Family Income in Grandview is $58,250.
What is the Median Household income in Grandview?
Median Household Income in Grandview is $43,583.
What is Income or Wage Gap in Grandview?
Income or Wage Gap in Grandview is 61.8%.
Women in Grandview earn 38.2 cents for every dollar earned by a man.
What is Inequality or Gini Index in Grandview?
Inequality or Gini Index in Grandview is 0.37.
What is the Total Population of Grandview?
Total Population of Grandview is 434.
What is the Total Male Population of Grandview?
Total Male Population of Grandview is 219.
What is the Total Female Population of Grandview?
Total Female Population of Grandview is 215.
What is the Ratio of Males per 100 Females in Grandview?
There are 101.86 Males per 100 Females in Grandview.
What is the Ratio of Females per 100 Males in Grandview?
There are 98.17 Females per 100 Males in Grandview.
What is the Median Population Age in Grandview?
Median Population Age in Grandview is 57.4 Years.
What is the Average Family Size in Grandview
Average Family Size in Grandview is 2.4 People.
What is the Average Household Size in Grandview
Average Household Size in Grandview is 1.9 People.
How Large is the Labor Force in Grandview?
There are 168 People in the Labor Forcein in Grandview.
What is the Percentage of People in the Labor Force in Grandview?
49.0% of People are in the Labor Force in Grandview.