Fort Madison, IA Map & Demographics
Fort Madison Map
Fort Madison Overview
$29,084
PER CAPITA INCOME
$63,906
AVG FAMILY INCOME
$48,944
AVG HOUSEHOLD INCOME
42.4%
WAGE / INCOME GAP [ % ]
57.6¢/ $1
WAGE / INCOME GAP [ $ ]
0.44
INEQUALITY / GINI INDEX
10,293
TOTAL POPULATION
5,359
MALE POPULATION
4,934
FEMALE POPULATION
108.61
MALES / 100 FEMALES
92.07
FEMALES / 100 MALES
43.0
MEDIAN AGE
2.9
AVG FAMILY SIZE
2.1
AVG HOUSEHOLD SIZE
4,840
LABOR FORCE [ PEOPLE ]
57.3%
PERCENT IN LABOR FORCE
5.6%
UNEMPLOYMENT RATE
Fort Madison Zip Codes
Fort Madison Area Codes
Income in Fort Madison
Income Overview in Fort Madison
Per Capita Income in Fort Madison is $29,084, while median incomes of families and households are $63,906 and $48,944 respectively.
| Characteristic | Number | Measure |
| Per Capita Income | 10,293 | $29,084 |
| Median Family Income | 2,477 | $63,906 |
| Mean Family Income | 2,477 | $82,803 |
| Median Household Income | 4,442 | $48,944 |
| Mean Household Income | 4,442 | $65,999 |
| Income Deficit | 2,477 | $0 |
| Wage / Income Gap (%) | 10,293 | 42.43% |
| Wage / Income Gap ($) | 10,293 | 57.57¢ per $1 |
| Gini / Inequality Index | 10,293 | 0.44 |
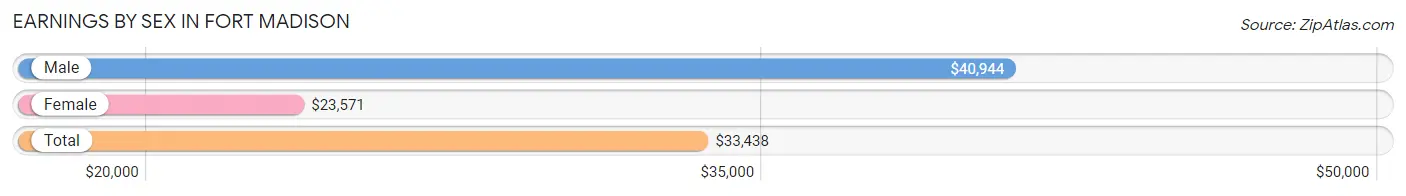
Earnings by Sex in Fort Madison
Average Earnings in Fort Madison are $33,438, $40,944 for men and $23,571 for women, a difference of 42.4%.
| Sex | Number | Average Earnings |
| Male | 2,870 (55.6%) | $40,944 |
| Female | 2,290 (44.4%) | $23,571 |
| Total | 5,160 (100.0%) | $33,438 |
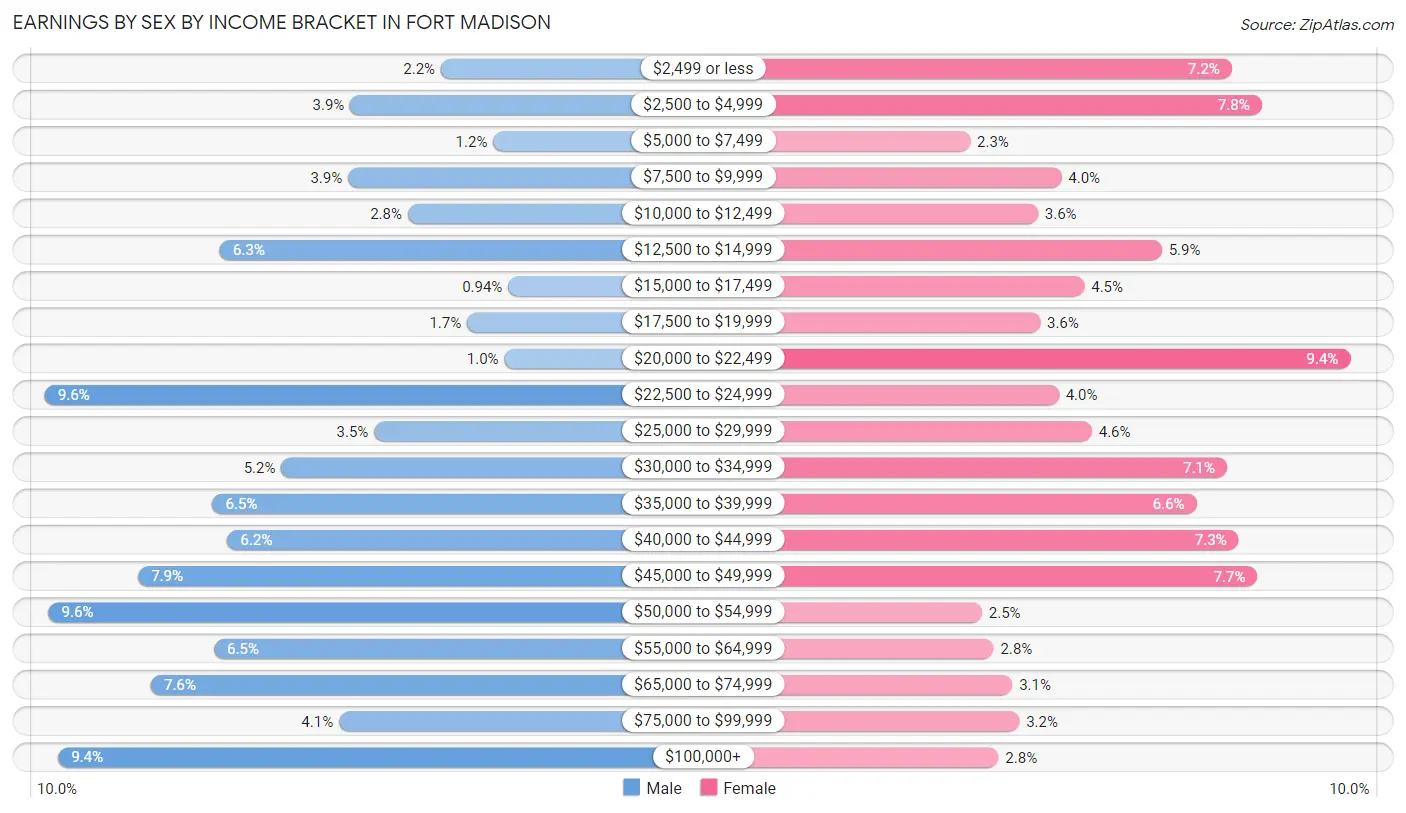
Earnings by Sex by Income Bracket in Fort Madison
The most common earnings brackets in Fort Madison are $22,500 to $24,999 for men (276 | 9.6%) and $20,000 to $22,499 for women (216 | 9.4%).
| Income | Male | Female |
| $2,499 or less | 63 (2.2%) | 165 (7.2%) |
| $2,500 to $4,999 | 112 (3.9%) | 178 (7.8%) |
| $5,000 to $7,499 | 35 (1.2%) | 53 (2.3%) |
| $7,500 to $9,999 | 113 (3.9%) | 92 (4.0%) |
| $10,000 to $12,499 | 81 (2.8%) | 82 (3.6%) |
| $12,500 to $14,999 | 182 (6.3%) | 135 (5.9%) |
| $15,000 to $17,499 | 27 (0.9%) | 102 (4.4%) |
| $17,500 to $19,999 | 49 (1.7%) | 83 (3.6%) |
| $20,000 to $22,499 | 29 (1.0%) | 216 (9.4%) |
| $22,500 to $24,999 | 276 (9.6%) | 91 (4.0%) |
| $25,000 to $29,999 | 99 (3.5%) | 105 (4.6%) |
| $30,000 to $34,999 | 149 (5.2%) | 163 (7.1%) |
| $35,000 to $39,999 | 186 (6.5%) | 150 (6.6%) |
| $40,000 to $44,999 | 178 (6.2%) | 168 (7.3%) |
| $45,000 to $49,999 | 226 (7.9%) | 176 (7.7%) |
| $50,000 to $54,999 | 274 (9.6%) | 58 (2.5%) |
| $55,000 to $64,999 | 185 (6.5%) | 63 (2.8%) |
| $65,000 to $74,999 | 219 (7.6%) | 71 (3.1%) |
| $75,000 to $99,999 | 118 (4.1%) | 74 (3.2%) |
| $100,000+ | 269 (9.4%) | 65 (2.8%) |
| Total | 2,870 (100.0%) | 2,290 (100.0%) |
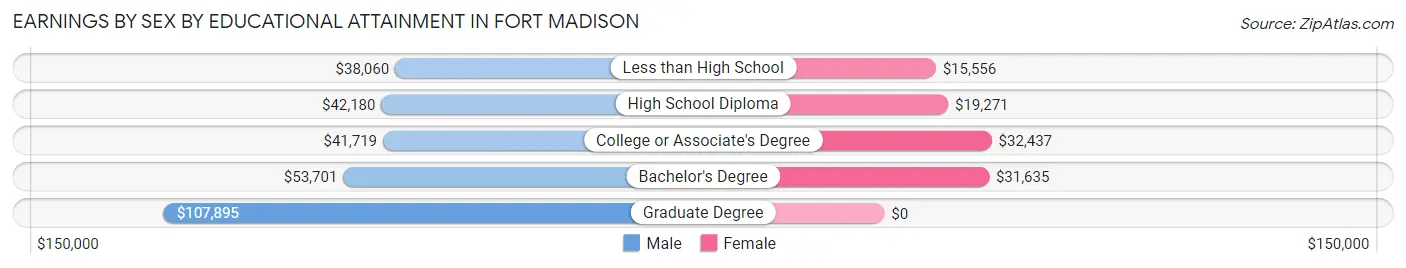
Earnings by Sex by Educational Attainment in Fort Madison
Average earnings in Fort Madison are $45,158 for men and $30,307 for women, a difference of 32.9%. Men with an educational attainment of graduate degree enjoy the highest average annual earnings of $107,895, while those with less than high school education earn the least with $38,060. Women with an educational attainment of college or associate's degree earn the most with the average annual earnings of $32,437, while those with less than high school education have the smallest earnings of $15,556.
| Educational Attainment | Male Income | Female Income |
| Less than High School | $38,060 | $15,556 |
| High School Diploma | $42,180 | $19,271 |
| College or Associate's Degree | $41,719 | $32,437 |
| Bachelor's Degree | $53,701 | $31,635 |
| Graduate Degree | $107,895 | $0 |
| Total | $45,158 | $30,307 |
Family Income in Fort Madison
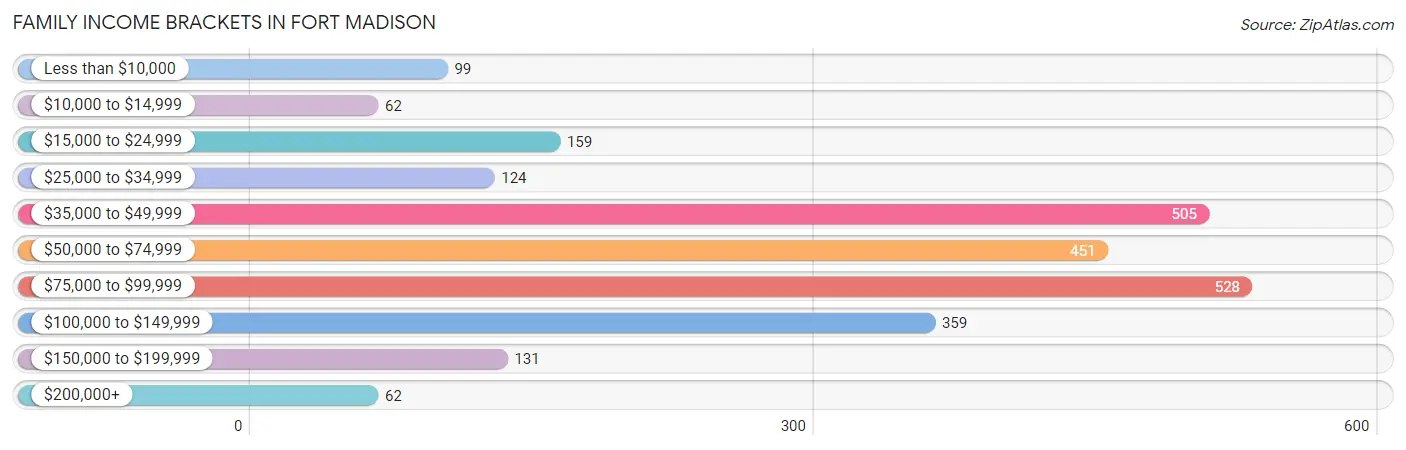
Family Income Brackets in Fort Madison
According to the Fort Madison family income data, there are 528 families falling into the $75,000 to $99,999 income range, which is the most common income bracket and makes up 21.3% of all families. Conversely, the $10,000 to $14,999 income bracket is the least frequent group with only 62 families (2.5%) belonging to this category.
| Income Bracket | # Families | % Families |
| Less than $10,000 | 99 | 4.0% |
| $10,000 to $14,999 | 62 | 2.5% |
| $15,000 to $24,999 | 159 | 6.4% |
| $25,000 to $34,999 | 124 | 5.0% |
| $35,000 to $49,999 | 505 | 20.4% |
| $50,000 to $74,999 | 451 | 18.2% |
| $75,000 to $99,999 | 528 | 21.3% |
| $100,000 to $149,999 | 359 | 14.5% |
| $150,000 to $199,999 | 131 | 5.3% |
| $200,000+ | 62 | 2.5% |
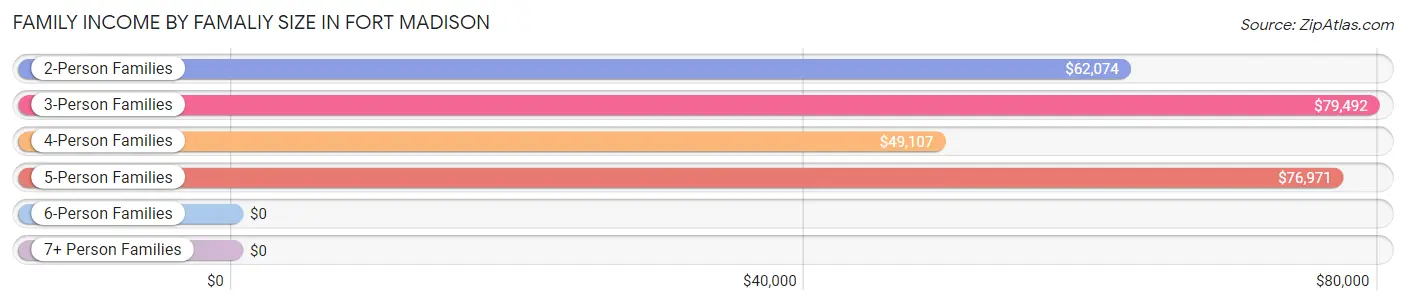
Family Income by Famaliy Size in Fort Madison
3-person families (353 | 14.2%) account for the highest median family income in Fort Madison with $79,492 per family, while 2-person families (1,346 | 54.3%) have the highest median income of $31,037 per family member.
| Income Bracket | # Families | Median Income |
| 2-Person Families | 1,346 (54.3%) | $62,074 |
| 3-Person Families | 353 (14.2%) | $79,492 |
| 4-Person Families | 593 (23.9%) | $49,107 |
| 5-Person Families | 183 (7.4%) | $76,971 |
| 6-Person Families | 0 (0.0%) | $0 |
| 7+ Person Families | 2 (0.1%) | $0 |
| Total | 2,477 (100.0%) | $63,906 |
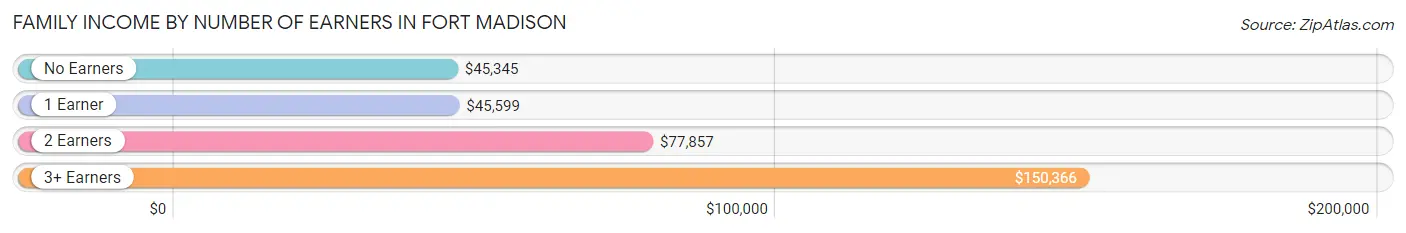
Family Income by Number of Earners in Fort Madison
The median family income in Fort Madison is $63,906, with families comprising 3+ earners (170) having the highest median family income of $150,366, while families with no earners (360) have the lowest median family income of $45,345, accounting for 6.9% and 14.5% of families, respectively.
| Number of Earners | # Families | Median Income |
| No Earners | 360 (14.5%) | $45,345 |
| 1 Earner | 803 (32.4%) | $45,599 |
| 2 Earners | 1,144 (46.2%) | $77,857 |
| 3+ Earners | 170 (6.9%) | $150,366 |
| Total | 2,477 (100.0%) | $63,906 |
Household Income in Fort Madison
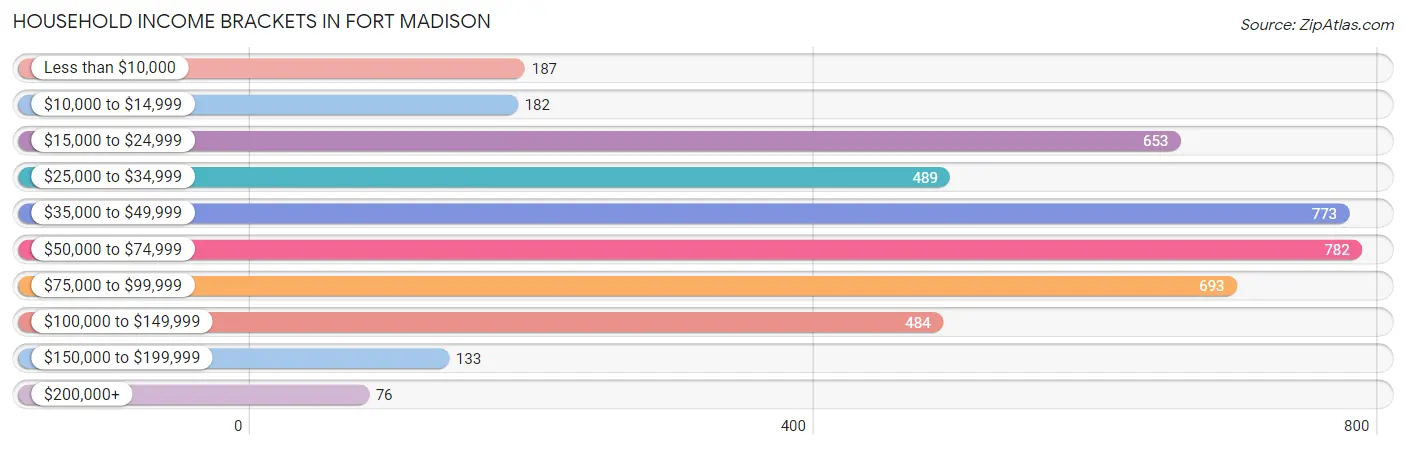
Household Income Brackets in Fort Madison
With 782 households falling in the category, the $50,000 to $74,999 income range is the most frequent in Fort Madison, accounting for 17.6% of all households. In contrast, only 76 households (1.7%) fall into the $200,000+ income bracket, making it the least populous group.
| Income Bracket | # Households | % Households |
| Less than $10,000 | 187 | 4.2% |
| $10,000 to $14,999 | 182 | 4.1% |
| $15,000 to $24,999 | 653 | 14.7% |
| $25,000 to $34,999 | 489 | 11.0% |
| $35,000 to $49,999 | 773 | 17.4% |
| $50,000 to $74,999 | 782 | 17.6% |
| $75,000 to $99,999 | 693 | 15.6% |
| $100,000 to $149,999 | 484 | 10.9% |
| $150,000 to $199,999 | 133 | 3.0% |
| $200,000+ | 76 | 1.7% |
Household Income by Householder Age in Fort Madison
The median household income in Fort Madison is $48,944, with the highest median household income of $63,125 found in the 45 to 64 years age bracket for the primary householder. A total of 1,604 households (36.1%) fall into this category. Meanwhile, the 65+ years age bracket for the primary householder has the lowest median household income of $32,885, with 1,316 households (29.6%) in this group.
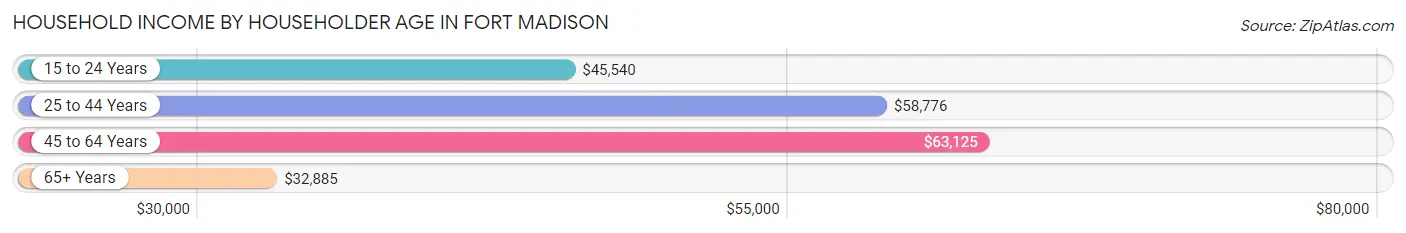
| Income Bracket | # Households | Median Income |
| 15 to 24 Years | 226 (5.1%) | $45,540 |
| 25 to 44 Years | 1,296 (29.2%) | $58,776 |
| 45 to 64 Years | 1,604 (36.1%) | $63,125 |
| 65+ Years | 1,316 (29.6%) | $32,885 |
| Total | 4,442 (100.0%) | $48,944 |
Poverty in Fort Madison
Income Below Poverty by Sex and Age in Fort Madison
With 11.1% poverty level for males and 17.7% for females among the residents of Fort Madison, 12 to 14 year old males and under 5 year old females are the most vulnerable to poverty, with 31 males (36.9%) and 128 females (45.2%) in their respective age groups living below the poverty level.
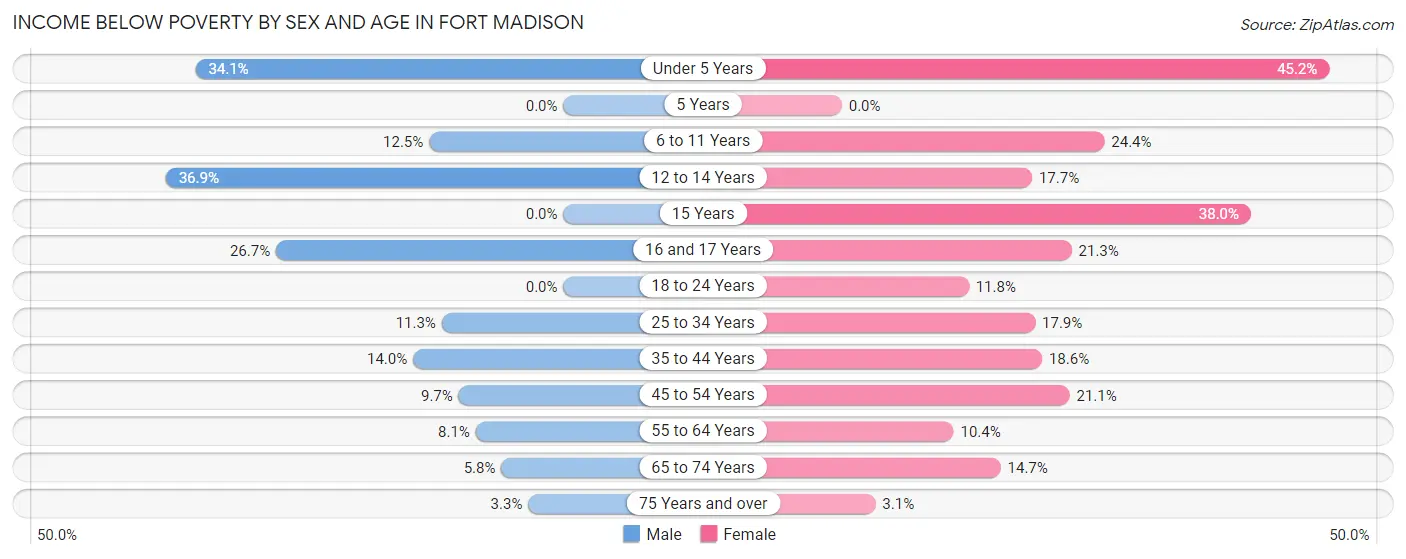
| Age Bracket | Male | Female |
| Under 5 Years | 85 (34.1%) | 128 (45.2%) |
| 5 Years | 0 (0.0%) | 0 (0.0%) |
| 6 to 11 Years | 44 (12.5%) | 97 (24.4%) |
| 12 to 14 Years | 31 (36.9%) | 30 (17.6%) |
| 15 Years | 0 (0.0%) | 52 (38.0%) |
| 16 and 17 Years | 32 (26.7%) | 16 (21.3%) |
| 18 to 24 Years | 0 (0.0%) | 39 (11.8%) |
| 25 to 34 Years | 70 (11.3%) | 87 (17.9%) |
| 35 to 44 Years | 82 (14.0%) | 110 (18.6%) |
| 45 to 54 Years | 59 (9.7%) | 115 (21.1%) |
| 55 to 64 Years | 63 (8.1%) | 70 (10.4%) |
| 65 to 74 Years | 31 (5.8%) | 103 (14.7%) |
| 75 Years and over | 7 (3.3%) | 15 (3.1%) |
| Total | 504 (11.1%) | 862 (17.7%) |
Income Above Poverty by Sex and Age in Fort Madison
According to the poverty statistics in Fort Madison, males aged 5 years and females aged 5 years are the age groups that are most secure financially, with 100.0% of males and 100.0% of females in these age groups living above the poverty line.
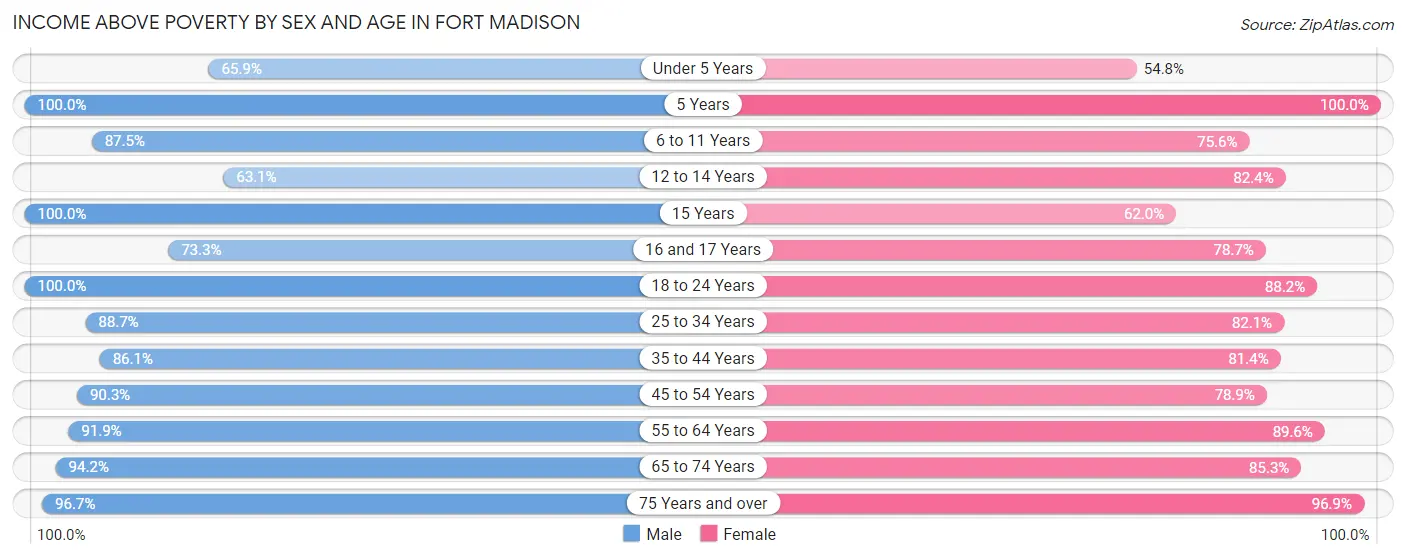
| Age Bracket | Male | Female |
| Under 5 Years | 164 (65.9%) | 155 (54.8%) |
| 5 Years | 28 (100.0%) | 2 (100.0%) |
| 6 to 11 Years | 309 (87.5%) | 301 (75.6%) |
| 12 to 14 Years | 53 (63.1%) | 140 (82.4%) |
| 15 Years | 82 (100.0%) | 85 (62.0%) |
| 16 and 17 Years | 88 (73.3%) | 59 (78.7%) |
| 18 to 24 Years | 298 (100.0%) | 292 (88.2%) |
| 25 to 34 Years | 550 (88.7%) | 398 (82.1%) |
| 35 to 44 Years | 506 (86.1%) | 482 (81.4%) |
| 45 to 54 Years | 548 (90.3%) | 429 (78.9%) |
| 55 to 64 Years | 711 (91.9%) | 605 (89.6%) |
| 65 to 74 Years | 507 (94.2%) | 596 (85.3%) |
| 75 Years and over | 208 (96.7%) | 465 (96.9%) |
| Total | 4,052 (88.9%) | 4,009 (82.3%) |
Income Below Poverty Among Married-Couple Families in Fort Madison
The poverty statistics for married-couple families in Fort Madison show that 9.5% or 180 of the total 1,891 families live below the poverty line. Families with 1 or 2 children have the highest poverty rate of 19.4%, comprising of 103 families. On the other hand, families with 3 or 4 children have the lowest poverty rate of 0.0%, which includes 0 families.
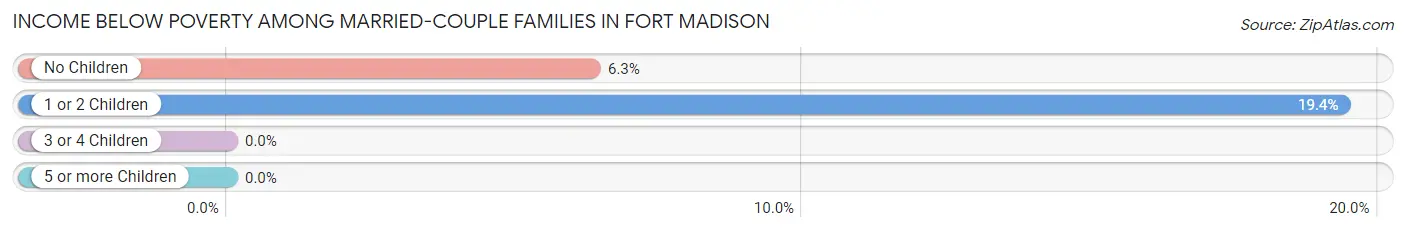
| Children | Above Poverty | Below Poverty |
| No Children | 1,141 (93.7%) | 77 (6.3%) |
| 1 or 2 Children | 429 (80.6%) | 103 (19.4%) |
| 3 or 4 Children | 139 (100.0%) | 0 (0.0%) |
| 5 or more Children | 2 (100.0%) | 0 (0.0%) |
| Total | 1,711 (90.5%) | 180 (9.5%) |
Income Below Poverty Among Single-Parent Households in Fort Madison
According to the poverty data in Fort Madison, 23.8% or 39 single-father households and 21.3% or 90 single-mother households are living below the poverty line. Among single-father households, those with 3 or 4 children have the highest poverty rate, with 27 households (100.0%) experiencing poverty. Likewise, among single-mother households, those with 1 or 2 children have the highest poverty rate, with 66 households (32.0%) falling below the poverty line.
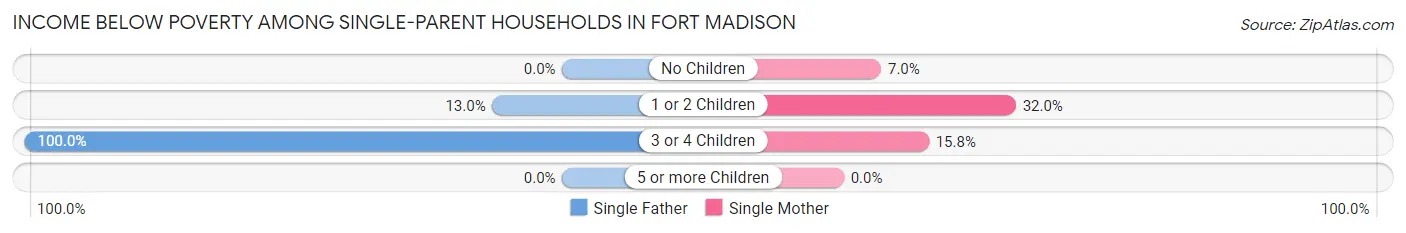
| Children | Single Father | Single Mother |
| No Children | 0 (0.0%) | 8 (7.0%) |
| 1 or 2 Children | 12 (13.0%) | 66 (32.0%) |
| 3 or 4 Children | 27 (100.0%) | 16 (15.8%) |
| 5 or more Children | 0 (0.0%) | 0 (0.0%) |
| Total | 39 (23.8%) | 90 (21.3%) |
Income Below Poverty Among Married-Couple vs Single-Parent Households in Fort Madison
The poverty data for Fort Madison shows that 180 of the married-couple family households (9.5%) and 129 of the single-parent households (22.0%) are living below the poverty level. Within the married-couple family households, those with 1 or 2 children have the highest poverty rate, with 103 households (19.4%) falling below the poverty line. Among the single-parent households, those with 3 or 4 children have the highest poverty rate, with 43 household (33.6%) living below poverty.
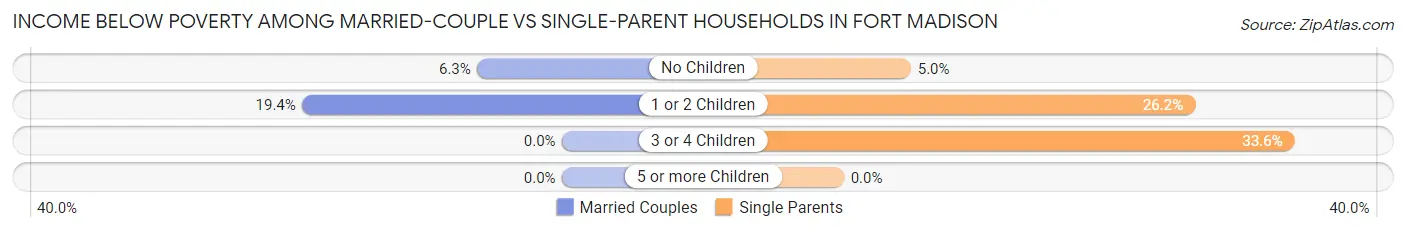
| Children | Married-Couple Families | Single-Parent Households |
| No Children | 77 (6.3%) | 8 (5.0%) |
| 1 or 2 Children | 103 (19.4%) | 78 (26.2%) |
| 3 or 4 Children | 0 (0.0%) | 43 (33.6%) |
| 5 or more Children | 0 (0.0%) | 0 (0.0%) |
| Total | 180 (9.5%) | 129 (22.0%) |
Race in Fort Madison
The most populous races in Fort Madison are White / Caucasian (9,479 | 92.1%), Hispanic or Latino (606 | 5.9%), and Black / African American (410 | 4.0%).
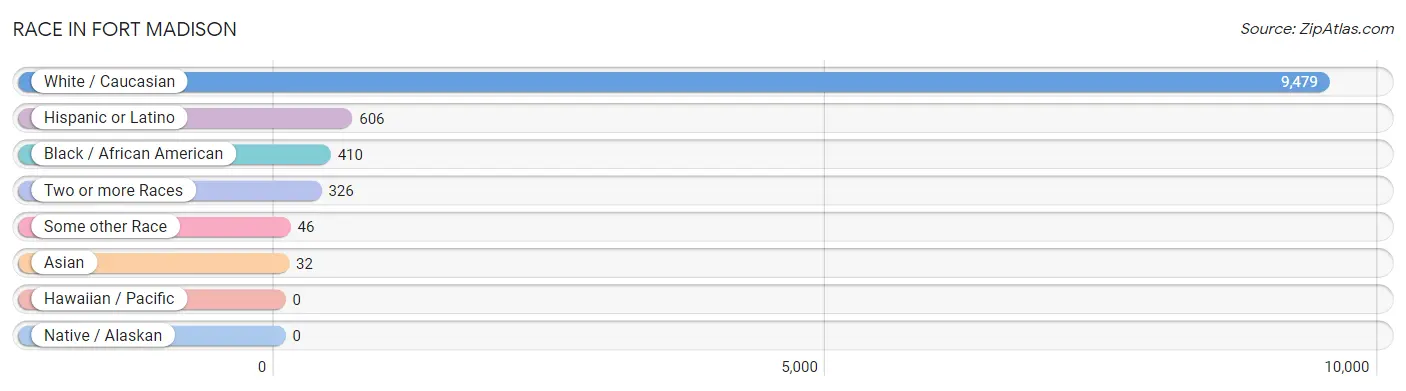
| Race | # Population | % Population |
| Asian | 32 | 0.3% |
| Black / African American | 410 | 4.0% |
| Hawaiian / Pacific | 0 | 0.0% |
| Hispanic or Latino | 606 | 5.9% |
| Native / Alaskan | 0 | 0.0% |
| White / Caucasian | 9,479 | 92.1% |
| Two or more Races | 326 | 3.2% |
| Some other Race | 46 | 0.4% |
| Total | 10,293 | 100.0% |
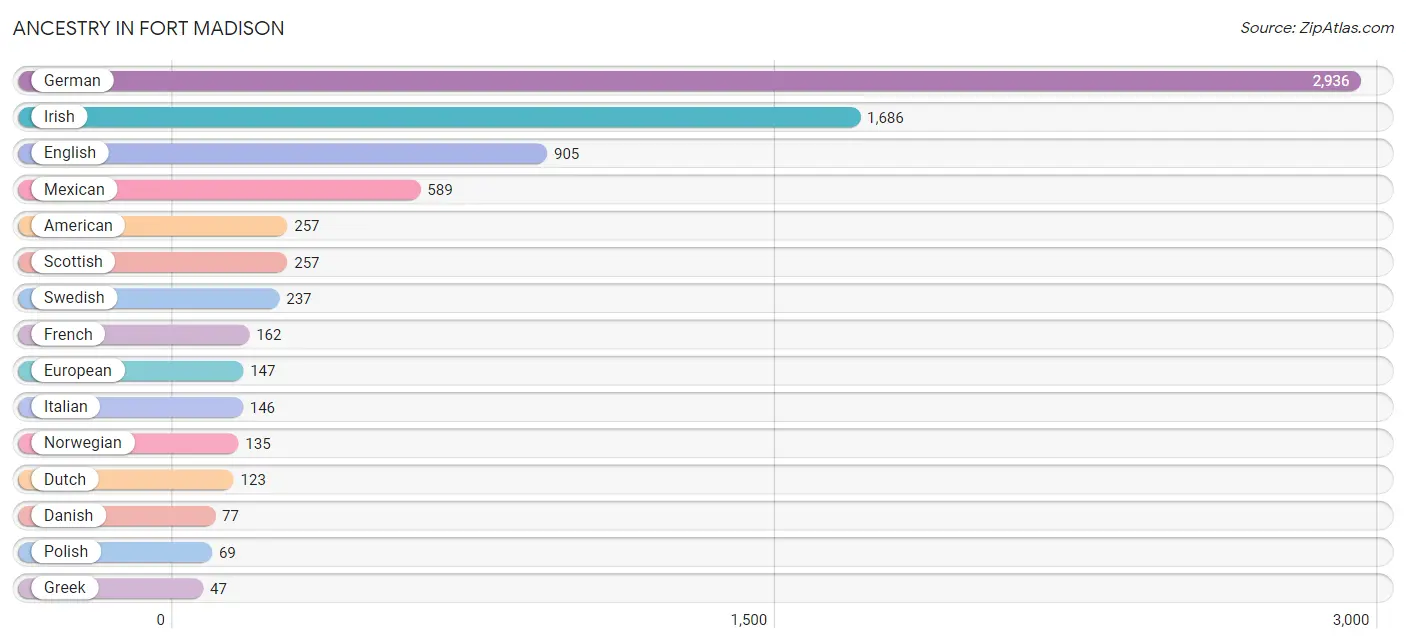
Ancestry in Fort Madison
The most populous ancestries reported in Fort Madison are German (2,936 | 28.5%), Irish (1,686 | 16.4%), English (905 | 8.8%), Mexican (589 | 5.7%), and American (257 | 2.5%), together accounting for 61.9% of all Fort Madison residents.
| Ancestry | # Population | % Population |
| African | 12 | 0.1% |
| American | 257 | 2.5% |
| Arab | 10 | 0.1% |
| Belgian | 6 | 0.1% |
| Bhutanese | 4 | 0.0% |
| British | 19 | 0.2% |
| Burmese | 28 | 0.3% |
| Cherokee | 16 | 0.2% |
| Choctaw | 13 | 0.1% |
| Croatian | 38 | 0.4% |
| Czech | 22 | 0.2% |
| Danish | 77 | 0.7% |
| Dutch | 123 | 1.2% |
| Eastern European | 34 | 0.3% |
| English | 905 | 8.8% |
| European | 147 | 1.4% |
| French | 162 | 1.6% |
| French Canadian | 8 | 0.1% |
| German | 2,936 | 28.5% |
| Greek | 47 | 0.5% |
| Iranian | 8 | 0.1% |
| Irish | 1,686 | 16.4% |
| Italian | 146 | 1.4% |
| Lebanese | 10 | 0.1% |
| Mexican | 589 | 5.7% |
| Northern European | 8 | 0.1% |
| Norwegian | 135 | 1.3% |
| Polish | 69 | 0.7% |
| Russian | 36 | 0.4% |
| Scandinavian | 41 | 0.4% |
| Scotch-Irish | 43 | 0.4% |
| Scottish | 257 | 2.5% |
| Spanish | 16 | 0.2% |
| Subsaharan African | 20 | 0.2% |
| Sudanese | 8 | 0.1% |
| Swedish | 237 | 2.3% |
| Welsh | 34 | 0.3% | View All 37 Rows |
Immigrants in Fort Madison
The most numerous immigrant groups reported in Fort Madison came from Latin America (117 | 1.1%), Central America (112 | 1.1%), Mexico (112 | 1.1%), Europe (62 | 0.6%), and Germany (62 | 0.6%), together accounting for 4.5% of all Fort Madison residents.
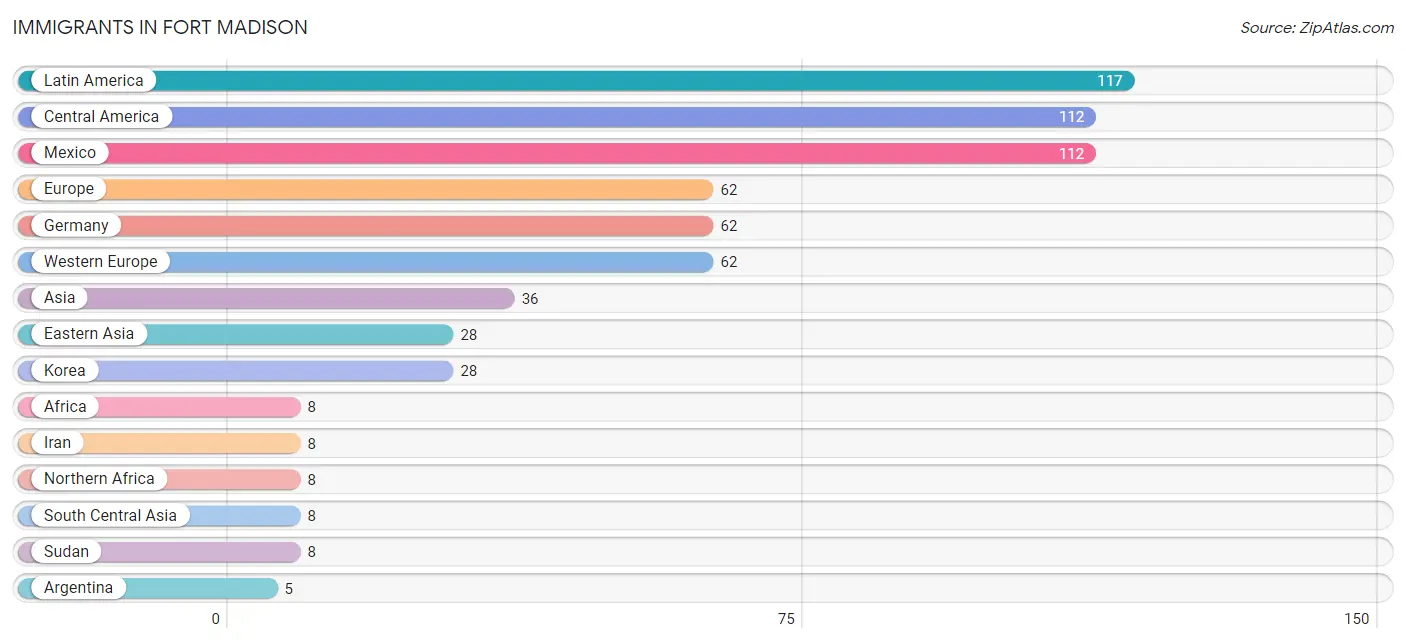
| Immigration Origin | # Population | % Population |
| Africa | 8 | 0.1% |
| Argentina | 5 | 0.1% |
| Asia | 36 | 0.4% |
| Central America | 112 | 1.1% |
| Eastern Asia | 28 | 0.3% |
| Europe | 62 | 0.6% |
| Germany | 62 | 0.6% |
| Iran | 8 | 0.1% |
| Korea | 28 | 0.3% |
| Latin America | 117 | 1.1% |
| Mexico | 112 | 1.1% |
| Northern Africa | 8 | 0.1% |
| South America | 5 | 0.1% |
| South Central Asia | 8 | 0.1% |
| Sudan | 8 | 0.1% |
| Western Europe | 62 | 0.6% | View All 16 Rows |
Sex and Age in Fort Madison
Sex and Age in Fort Madison
The most populous age groups in Fort Madison are 60 to 64 Years (470 | 8.8%) for men and 70 to 74 Years (392 | 7.9%) for women.
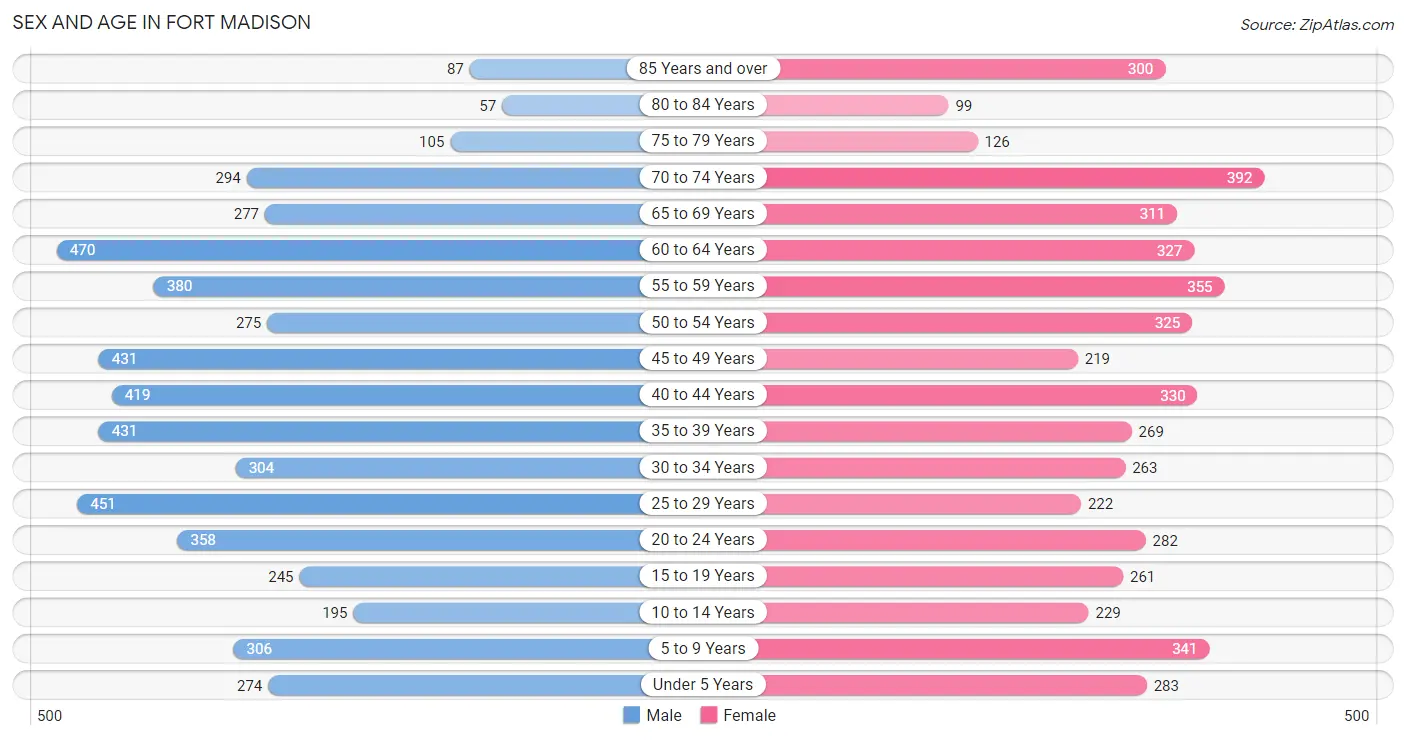
| Age Bracket | Male | Female |
| Under 5 Years | 274 (5.1%) | 283 (5.7%) |
| 5 to 9 Years | 306 (5.7%) | 341 (6.9%) |
| 10 to 14 Years | 195 (3.6%) | 229 (4.6%) |
| 15 to 19 Years | 245 (4.6%) | 261 (5.3%) |
| 20 to 24 Years | 358 (6.7%) | 282 (5.7%) |
| 25 to 29 Years | 451 (8.4%) | 222 (4.5%) |
| 30 to 34 Years | 304 (5.7%) | 263 (5.3%) |
| 35 to 39 Years | 431 (8.0%) | 269 (5.4%) |
| 40 to 44 Years | 419 (7.8%) | 330 (6.7%) |
| 45 to 49 Years | 431 (8.0%) | 219 (4.4%) |
| 50 to 54 Years | 275 (5.1%) | 325 (6.6%) |
| 55 to 59 Years | 380 (7.1%) | 355 (7.2%) |
| 60 to 64 Years | 470 (8.8%) | 327 (6.6%) |
| 65 to 69 Years | 277 (5.2%) | 311 (6.3%) |
| 70 to 74 Years | 294 (5.5%) | 392 (7.9%) |
| 75 to 79 Years | 105 (2.0%) | 126 (2.5%) |
| 80 to 84 Years | 57 (1.1%) | 99 (2.0%) |
| 85 Years and over | 87 (1.6%) | 300 (6.1%) |
| Total | 5,359 (100.0%) | 4,934 (100.0%) |
Families and Households in Fort Madison
Median Family Size in Fort Madison
The median family size in Fort Madison is 2.85 persons per family, with single female/mother families (422 | 17.0%) accounting for the largest median family size of 3.1 persons per family. On the other hand, single male/father families (164 | 6.6%) represent the smallest median family size with 2.29 persons per family.
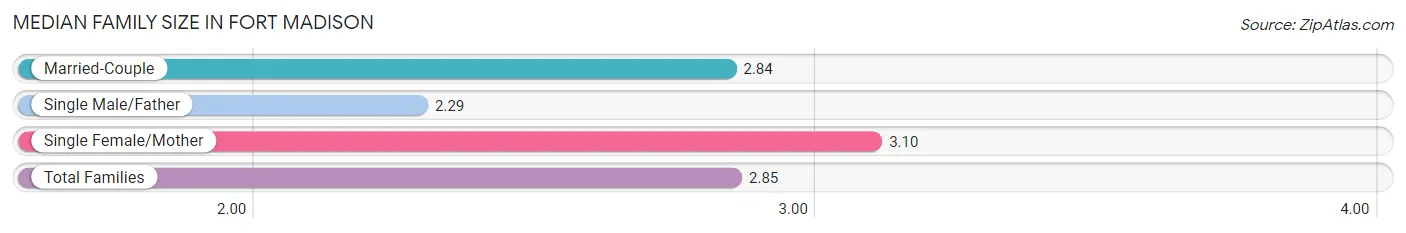
| Family Type | # Families | Family Size |
| Married-Couple | 1,891 (76.3%) | 2.84 |
| Single Male/Father | 164 (6.6%) | 2.29 |
| Single Female/Mother | 422 (17.0%) | 3.10 |
| Total Families | 2,477 (100.0%) | 2.85 |
Median Household Size in Fort Madison
The median household size in Fort Madison is 2.14 persons per household, with single female/mother households (422 | 9.5%) accounting for the largest median household size of 3.36 persons per household. non-family households (1,965 | 44.2%) represent the smallest median household size with 1.14 persons per household.
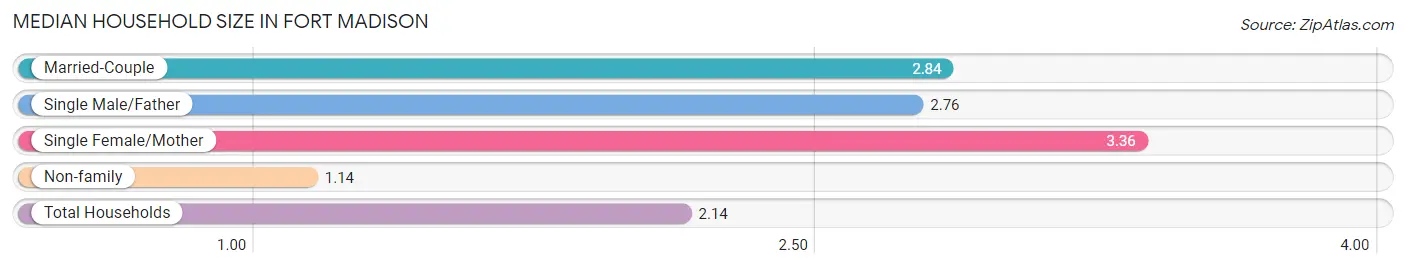
| Household Type | # Households | Household Size |
| Married-Couple | 1,891 (42.6%) | 2.84 |
| Single Male/Father | 164 (3.7%) | 2.76 |
| Single Female/Mother | 422 (9.5%) | 3.36 |
| Non-family | 1,965 (44.2%) | 1.14 |
| Total Households | 4,442 (100.0%) | 2.14 |
Household Size by Marriage Status in Fort Madison
Out of a total of 4,442 households in Fort Madison, 2,477 (55.8%) are family households, while 1,965 (44.2%) are nonfamily households. The most numerous type of family households are 2-person households, comprising 1,244, and the most common type of nonfamily households are 1-person households, comprising 1,747.
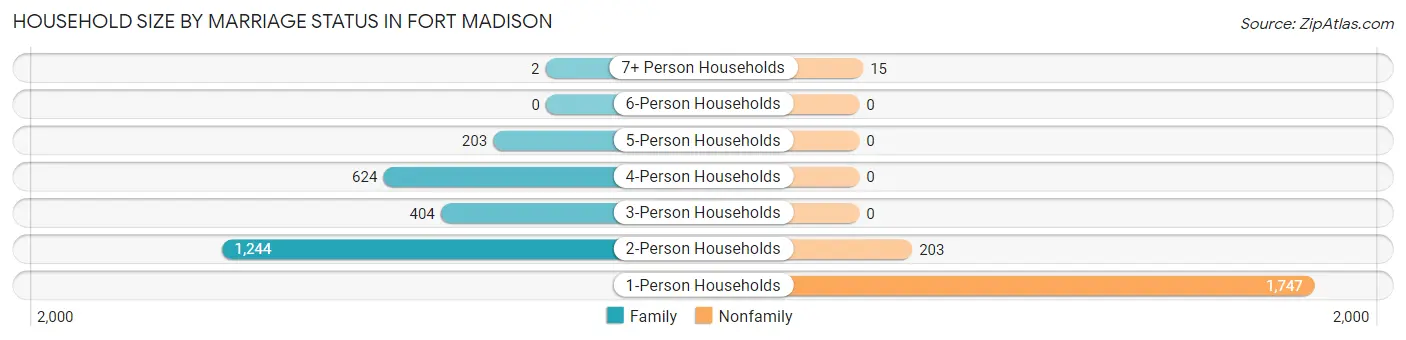
| Household Size | Family Households | Nonfamily Households |
| 1-Person Households | - | 1,747 (39.3%) |
| 2-Person Households | 1,244 (28.0%) | 203 (4.6%) |
| 3-Person Households | 404 (9.1%) | 0 (0.0%) |
| 4-Person Households | 624 (14.1%) | 0 (0.0%) |
| 5-Person Households | 203 (4.6%) | 0 (0.0%) |
| 6-Person Households | 0 (0.0%) | 0 (0.0%) |
| 7+ Person Households | 2 (0.1%) | 15 (0.3%) |
| Total | 2,477 (55.8%) | 1,965 (44.2%) |
Female Fertility in Fort Madison
Fertility by Age in Fort Madison
Average fertility rate in Fort Madison is 91.0 births per 1,000 women. Women in the age bracket of 20 to 34 years have the highest fertility rate with 201.0 births per 1,000 women. Women in the age bracket of 20 to 34 years acount for 90.6% of all women with births.
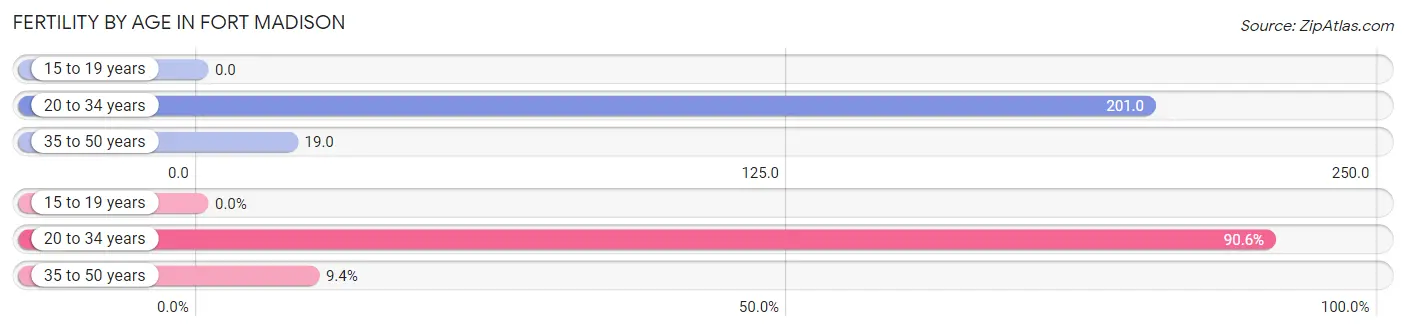
| Age Bracket | Women with Births | Births / 1,000 Women |
| 15 to 19 years | 0 (0.0%) | 0.0 |
| 20 to 34 years | 154 (90.6%) | 201.0 |
| 35 to 50 years | 16 (9.4%) | 19.0 |
| Total | 170 (100.0%) | 91.0 |
Fertility by Age by Marriage Status in Fort Madison
74.7% of women with births (170) in Fort Madison are married. The highest percentage of unmarried women with births falls into 35 to 50 years age bracket with 100.0% of them unmarried at the time of birth, while the lowest percentage of unmarried women with births belong to 20 to 34 years age bracket with 17.5% of them unmarried.
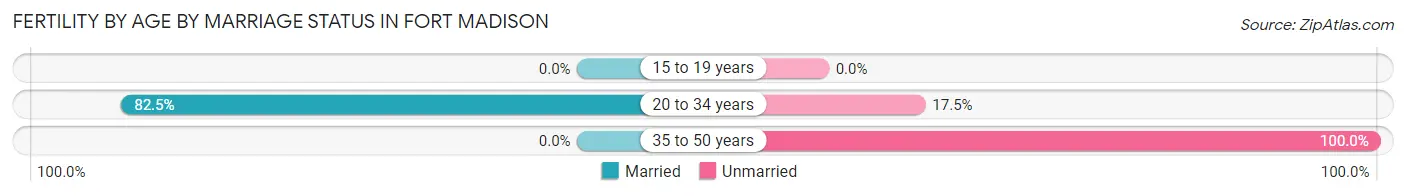
| Age Bracket | Married | Unmarried |
| 15 to 19 years | 0 (0.0%) | 0 (0.0%) |
| 20 to 34 years | 127 (82.5%) | 27 (17.5%) |
| 35 to 50 years | 0 (0.0%) | 16 (100.0%) |
| Total | 127 (74.7%) | 43 (25.3%) |
Fertility by Education in Fort Madison
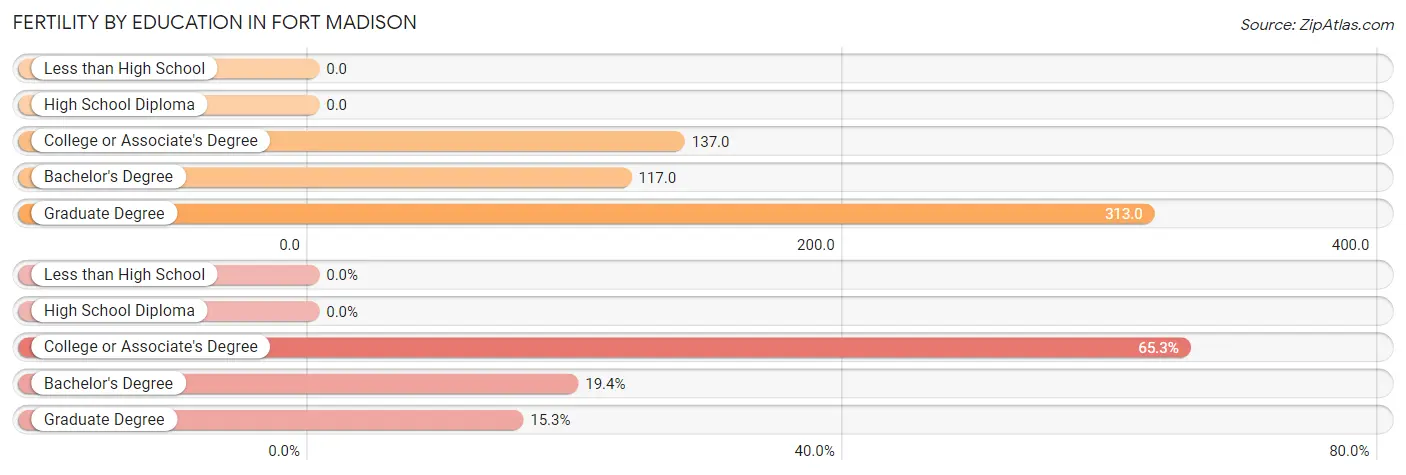
| Educational Attainment | Women with Births | Births / 1,000 Women |
| Less than High School | 0 (0.0%) | 0.0 |
| High School Diploma | 0 (0.0%) | 0.0 |
| College or Associate's Degree | 111 (65.3%) | 137.0 |
| Bachelor's Degree | 33 (19.4%) | 117.0 |
| Graduate Degree | 26 (15.3%) | 313.0 |
| Total | 170 (100.0%) | 91.0 |
Fertility by Education by Marriage Status in Fort Madison
25.3% of women with births in Fort Madison are unmarried. Women with the educational attainment of graduate degree are most likely to be married with 100.0% of them married at childbirth, while women with the educational attainment of bachelor's degree are least likely to be married with 39.4% of them unmarried at childbirth.
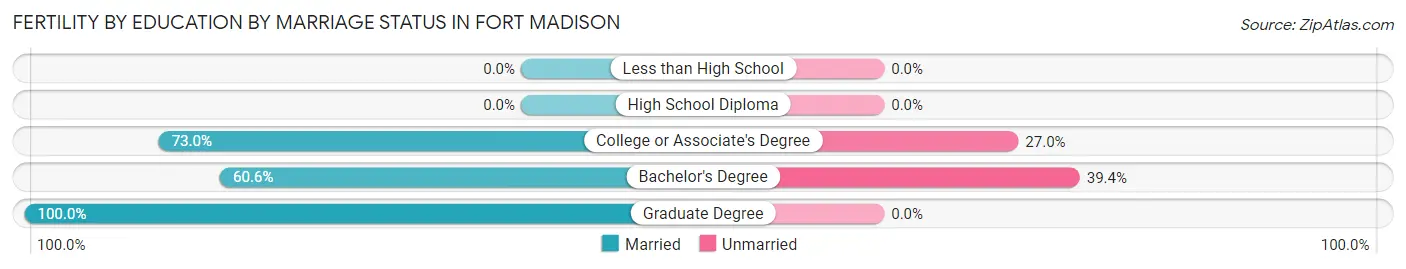
| Educational Attainment | Married | Unmarried |
| Less than High School | 0 (0.0%) | 0 (0.0%) |
| High School Diploma | 0 (0.0%) | 0 (0.0%) |
| College or Associate's Degree | 81 (73.0%) | 30 (27.0%) |
| Bachelor's Degree | 20 (60.6%) | 13 (39.4%) |
| Graduate Degree | 26 (100.0%) | 0 (0.0%) |
| Total | 127 (74.7%) | 43 (25.3%) |
Employment Characteristics in Fort Madison
Employment by Class of Employer in Fort Madison
Among the 4,497 employed individuals in Fort Madison, private company employees (3,378 | 75.1%), not-for-profit organizations (375 | 8.3%), and local government employees (263 | 5.9%) make up the most common classes of employment.
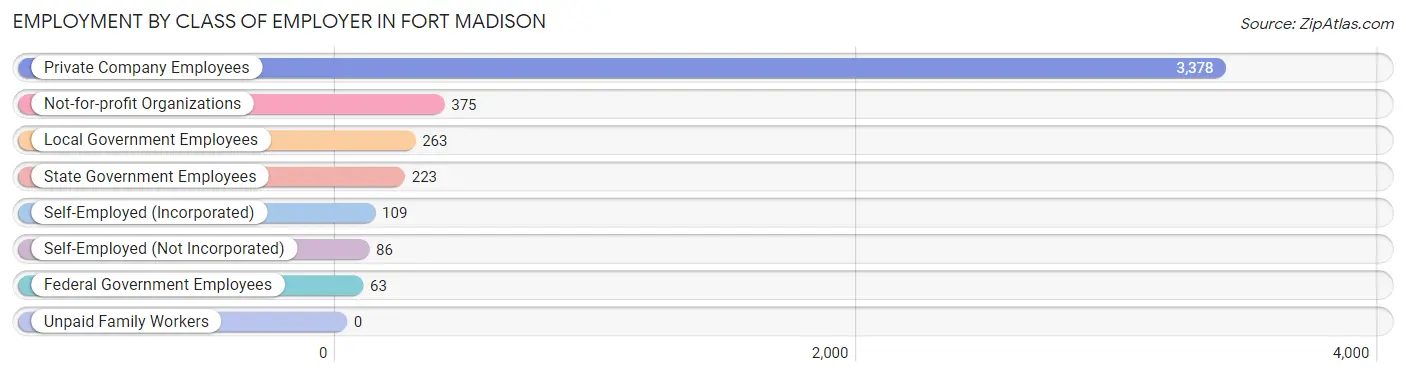
| Employer Class | # Employees | % Employees |
| Private Company Employees | 3,378 | 75.1% |
| Self-Employed (Incorporated) | 109 | 2.4% |
| Self-Employed (Not Incorporated) | 86 | 1.9% |
| Not-for-profit Organizations | 375 | 8.3% |
| Local Government Employees | 263 | 5.9% |
| State Government Employees | 223 | 5.0% |
| Federal Government Employees | 63 | 1.4% |
| Unpaid Family Workers | 0 | 0.0% |
| Total | 4,497 | 100.0% |
Employment Status by Age in Fort Madison
According to the labor force statistics for Fort Madison, out of the total population over 16 years of age (8,446), 57.3% or 4,840 individuals are in the labor force, with 5.6% or 271 of them unemployed. The age group with the highest labor force participation rate is 25 to 29 years, with 87.2% or 587 individuals in the labor force. Within the labor force, the 25 to 29 years age range has the highest percentage of unemployed individuals, with 13.6% or 80 of them being unemployed.
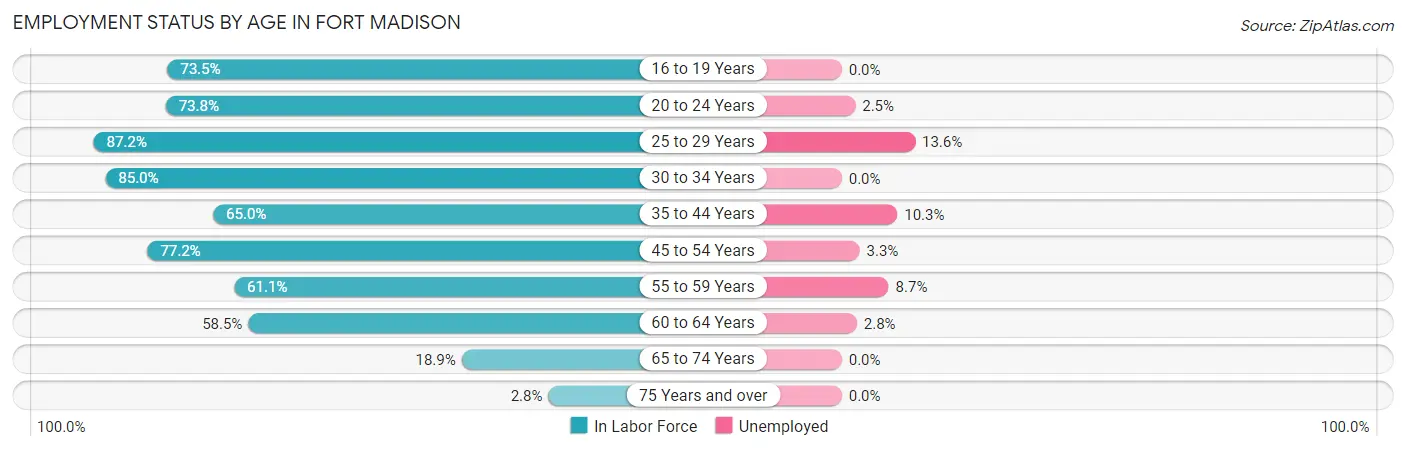
| Age Bracket | In Labor Force | Unemployed |
| 16 to 19 Years | 211 (73.5%) | 0 (0.0%) |
| 20 to 24 Years | 472 (73.8%) | 12 (2.5%) |
| 25 to 29 Years | 587 (87.2%) | 80 (13.6%) |
| 30 to 34 Years | 482 (85.0%) | 0 (0.0%) |
| 35 to 44 Years | 942 (65.0%) | 97 (10.3%) |
| 45 to 54 Years | 965 (77.2%) | 32 (3.3%) |
| 55 to 59 Years | 449 (61.1%) | 39 (8.7%) |
| 60 to 64 Years | 466 (58.5%) | 13 (2.8%) |
| 65 to 74 Years | 241 (18.9%) | 0 (0.0%) |
| 75 Years and over | 22 (2.8%) | 0 (0.0%) |
| Total | 4,840 (57.3%) | 271 (5.6%) |
Employment Status by Educational Attainment in Fort Madison
According to labor force statistics for Fort Madison, 71.1% of individuals (3,890) out of the total population between 25 and 64 years of age (5,471) are in the labor force, with 6.7% or 261 of them being unemployed. The group with the highest labor force participation rate are those with the educational attainment of bachelor's degree or higher, with 93.1% or 895 individuals in the labor force. Within the labor force, individuals with less than high school education have the highest percentage of unemployment, with 30.3% or 56 of them being unemployed.
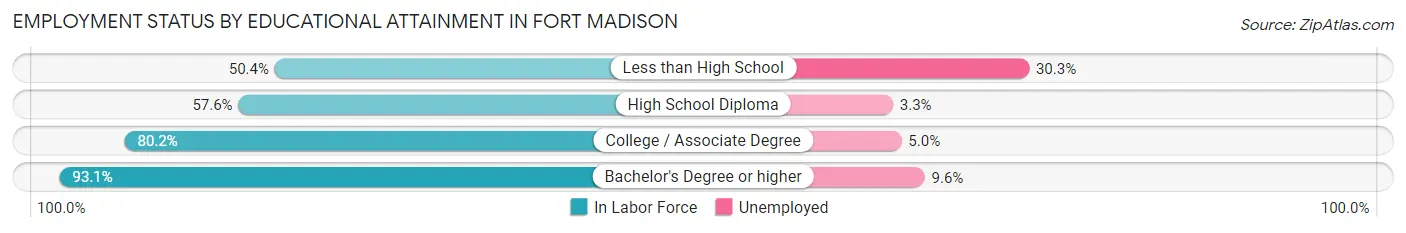
| Educational Attainment | In Labor Force | Unemployed |
| Less than High School | 185 (50.4%) | 111 (30.3%) |
| High School Diploma | 1,303 (57.6%) | 75 (3.3%) |
| College / Associate Degree | 1,509 (80.2%) | 94 (5.0%) |
| Bachelor's Degree or higher | 895 (93.1%) | 92 (9.6%) |
| Total | 3,890 (71.1%) | 367 (6.7%) |
Employment Occupations by Sex in Fort Madison
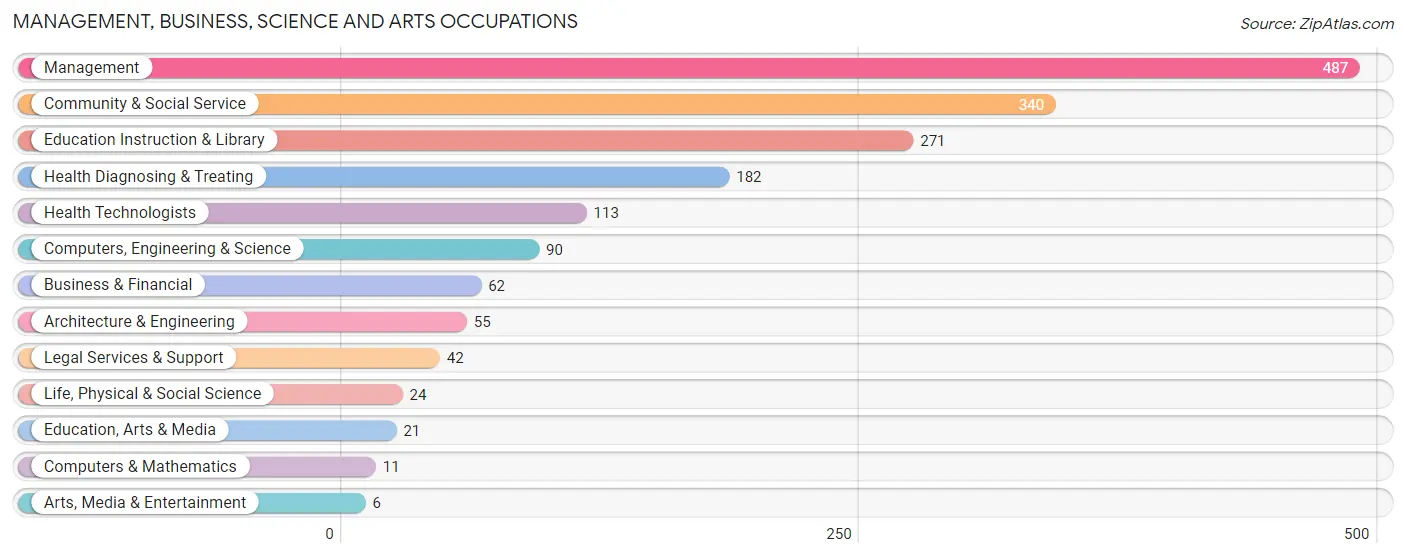
Management, Business, Science and Arts Occupations
The most common Management, Business, Science and Arts occupations in Fort Madison are Management (487 | 10.7%), Community & Social Service (340 | 7.4%), Education Instruction & Library (271 | 5.9%), Health Diagnosing & Treating (182 | 4.0%), and Health Technologists (113 | 2.5%).
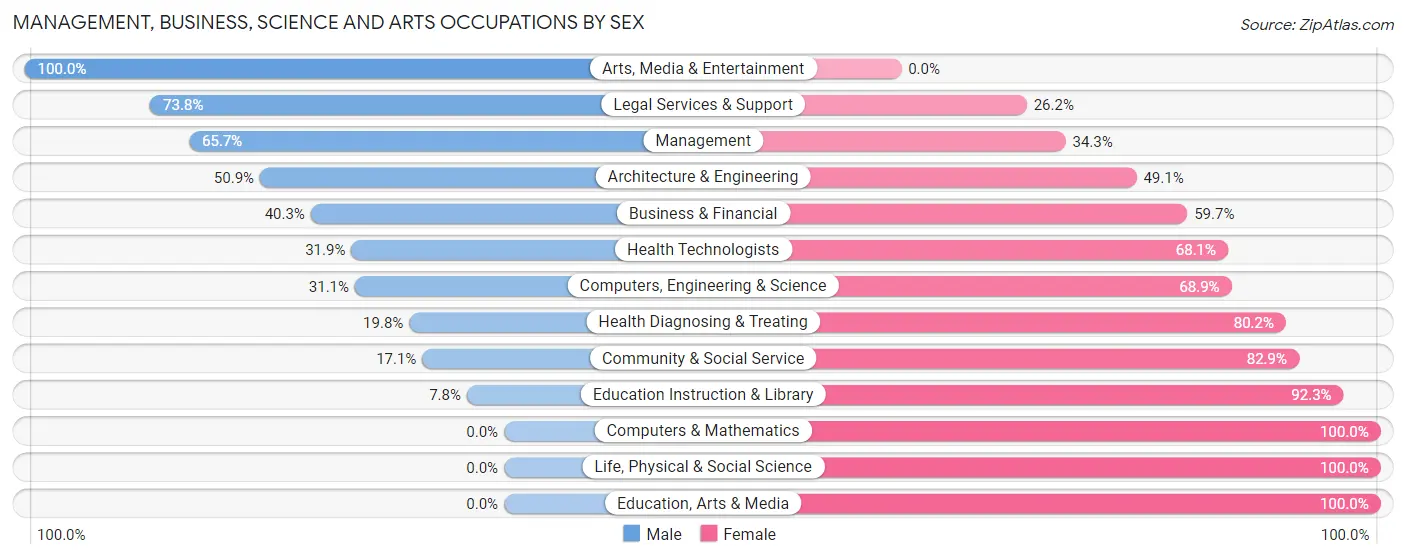
Management, Business, Science and Arts Occupations by Sex
Within the Management, Business, Science and Arts occupations in Fort Madison, the most male-oriented occupations are Arts, Media & Entertainment (100.0%), Legal Services & Support (73.8%), and Management (65.7%), while the most female-oriented occupations are Computers & Mathematics (100.0%), Life, Physical & Social Science (100.0%), and Education, Arts & Media (100.0%).
| Occupation | Male | Female |
| Management | 320 (65.7%) | 167 (34.3%) |
| Business & Financial | 25 (40.3%) | 37 (59.7%) |
| Computers, Engineering & Science | 28 (31.1%) | 62 (68.9%) |
| Computers & Mathematics | 0 (0.0%) | 11 (100.0%) |
| Architecture & Engineering | 28 (50.9%) | 27 (49.1%) |
| Life, Physical & Social Science | 0 (0.0%) | 24 (100.0%) |
| Community & Social Service | 58 (17.1%) | 282 (82.9%) |
| Education, Arts & Media | 0 (0.0%) | 21 (100.0%) |
| Legal Services & Support | 31 (73.8%) | 11 (26.2%) |
| Education Instruction & Library | 21 (7.7%) | 250 (92.2%) |
| Arts, Media & Entertainment | 6 (100.0%) | 0 (0.0%) |
| Health Diagnosing & Treating | 36 (19.8%) | 146 (80.2%) |
| Health Technologists | 36 (31.9%) | 77 (68.1%) |
| Total (Category) | 467 (40.2%) | 694 (59.8%) |
| Total (Overall) | 2,560 (56.1%) | 2,004 (43.9%) |
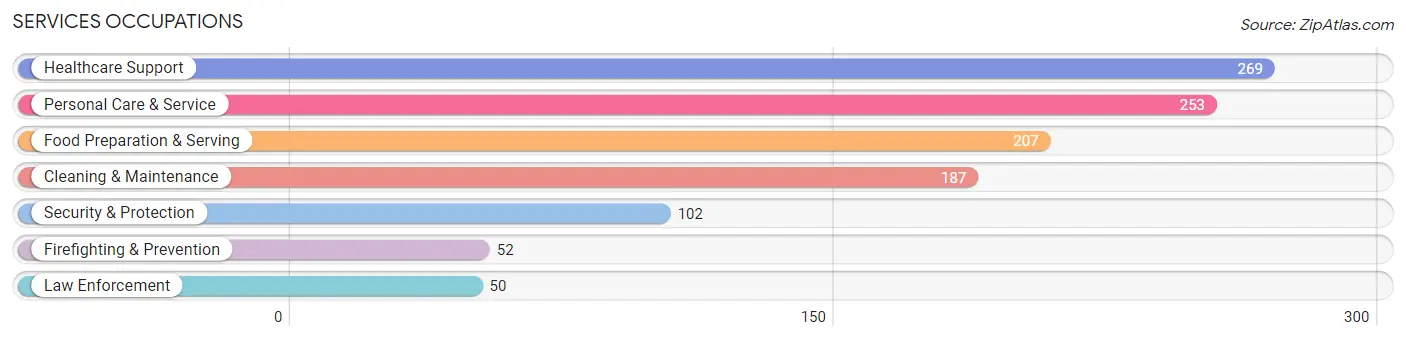
Services Occupations
The most common Services occupations in Fort Madison are Healthcare Support (269 | 5.9%), Personal Care & Service (253 | 5.5%), Food Preparation & Serving (207 | 4.5%), Cleaning & Maintenance (187 | 4.1%), and Security & Protection (102 | 2.2%).
Services Occupations by Sex
Within the Services occupations in Fort Madison, the most male-oriented occupations are Law Enforcement (100.0%), Security & Protection (92.2%), and Firefighting & Prevention (84.6%), while the most female-oriented occupations are Healthcare Support (100.0%), Cleaning & Maintenance (71.1%), and Food Preparation & Serving (59.4%).

| Occupation | Male | Female |
| Healthcare Support | 0 (0.0%) | 269 (100.0%) |
| Security & Protection | 94 (92.2%) | 8 (7.8%) |
| Firefighting & Prevention | 44 (84.6%) | 8 (15.4%) |
| Law Enforcement | 50 (100.0%) | 0 (0.0%) |
| Food Preparation & Serving | 84 (40.6%) | 123 (59.4%) |
| Cleaning & Maintenance | 54 (28.9%) | 133 (71.1%) |
| Personal Care & Service | 138 (54.5%) | 115 (45.5%) |
| Total (Category) | 370 (36.3%) | 648 (63.6%) |
| Total (Overall) | 2,560 (56.1%) | 2,004 (43.9%) |
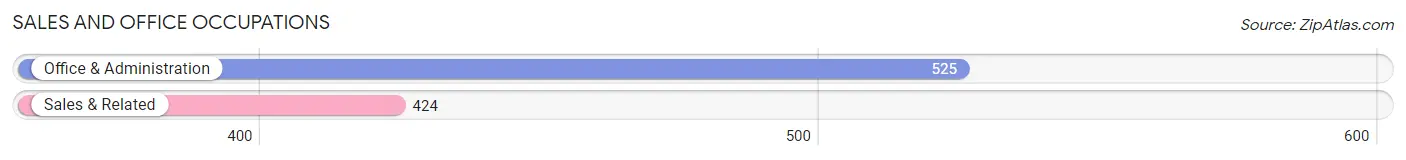
Sales and Office Occupations
The most common Sales and Office occupations in Fort Madison are Office & Administration (525 | 11.5%), and Sales & Related (424 | 9.3%).
Sales and Office Occupations by Sex
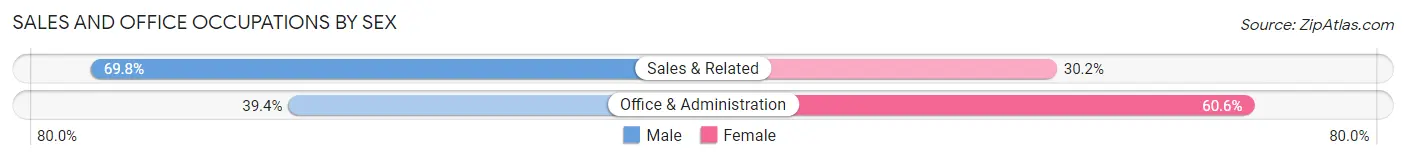
| Occupation | Male | Female |
| Sales & Related | 296 (69.8%) | 128 (30.2%) |
| Office & Administration | 207 (39.4%) | 318 (60.6%) |
| Total (Category) | 503 (53.0%) | 446 (47.0%) |
| Total (Overall) | 2,560 (56.1%) | 2,004 (43.9%) |
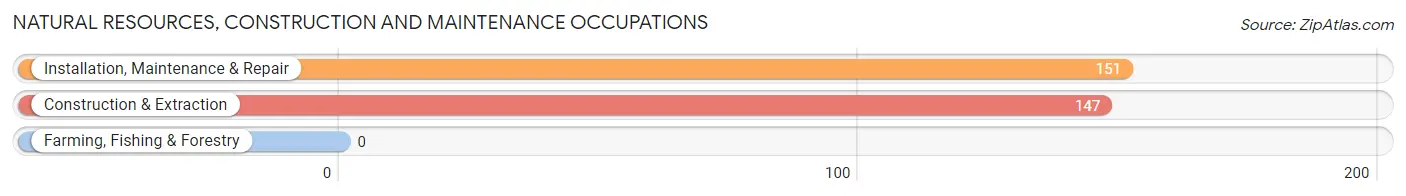
Natural Resources, Construction and Maintenance Occupations
The most common Natural Resources, Construction and Maintenance occupations in Fort Madison are Installation, Maintenance & Repair (151 | 3.3%), and Construction & Extraction (147 | 3.2%).
Natural Resources, Construction and Maintenance Occupations by Sex
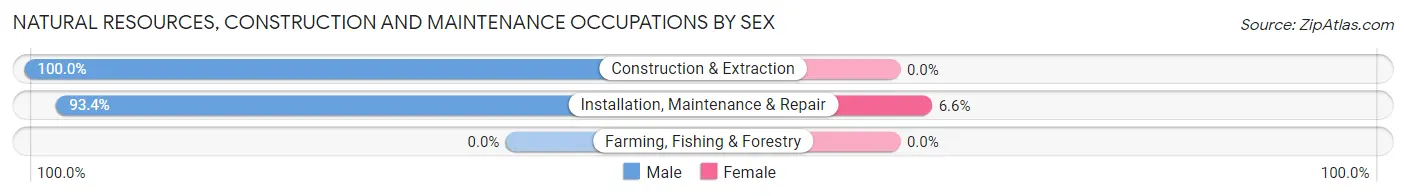
| Occupation | Male | Female |
| Farming, Fishing & Forestry | 0 (0.0%) | 0 (0.0%) |
| Construction & Extraction | 147 (100.0%) | 0 (0.0%) |
| Installation, Maintenance & Repair | 141 (93.4%) | 10 (6.6%) |
| Total (Category) | 288 (96.6%) | 10 (3.4%) |
| Total (Overall) | 2,560 (56.1%) | 2,004 (43.9%) |
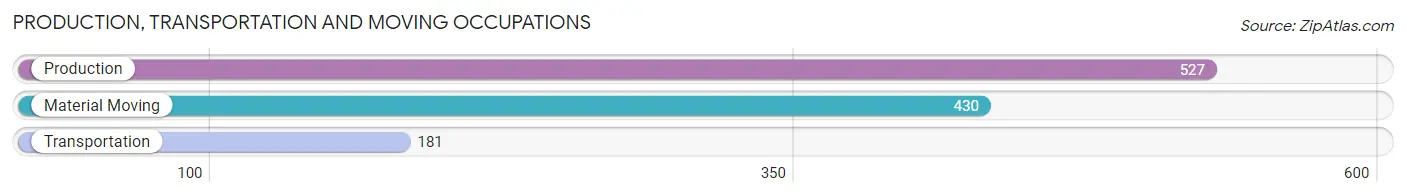
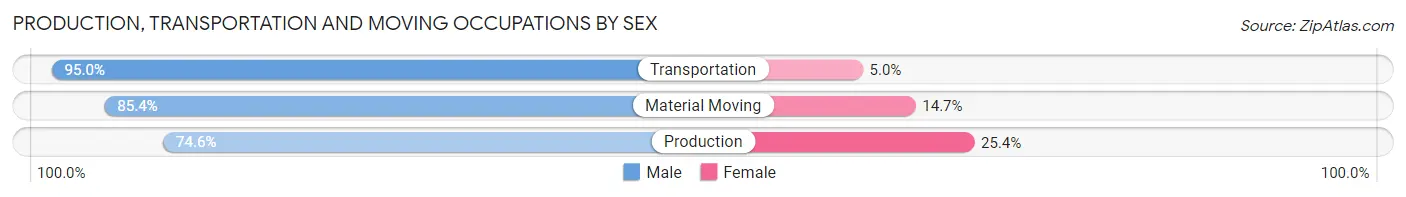
Production, Transportation and Moving Occupations
The most common Production, Transportation and Moving occupations in Fort Madison are Production (527 | 11.6%), Material Moving (430 | 9.4%), and Transportation (181 | 4.0%).
Production, Transportation and Moving Occupations by Sex
| Occupation | Male | Female |
| Production | 393 (74.6%) | 134 (25.4%) |
| Transportation | 172 (95.0%) | 9 (5.0%) |
| Material Moving | 367 (85.4%) | 63 (14.6%) |
| Total (Category) | 932 (81.9%) | 206 (18.1%) |
| Total (Overall) | 2,560 (56.1%) | 2,004 (43.9%) |
Employment Industries by Sex in Fort Madison
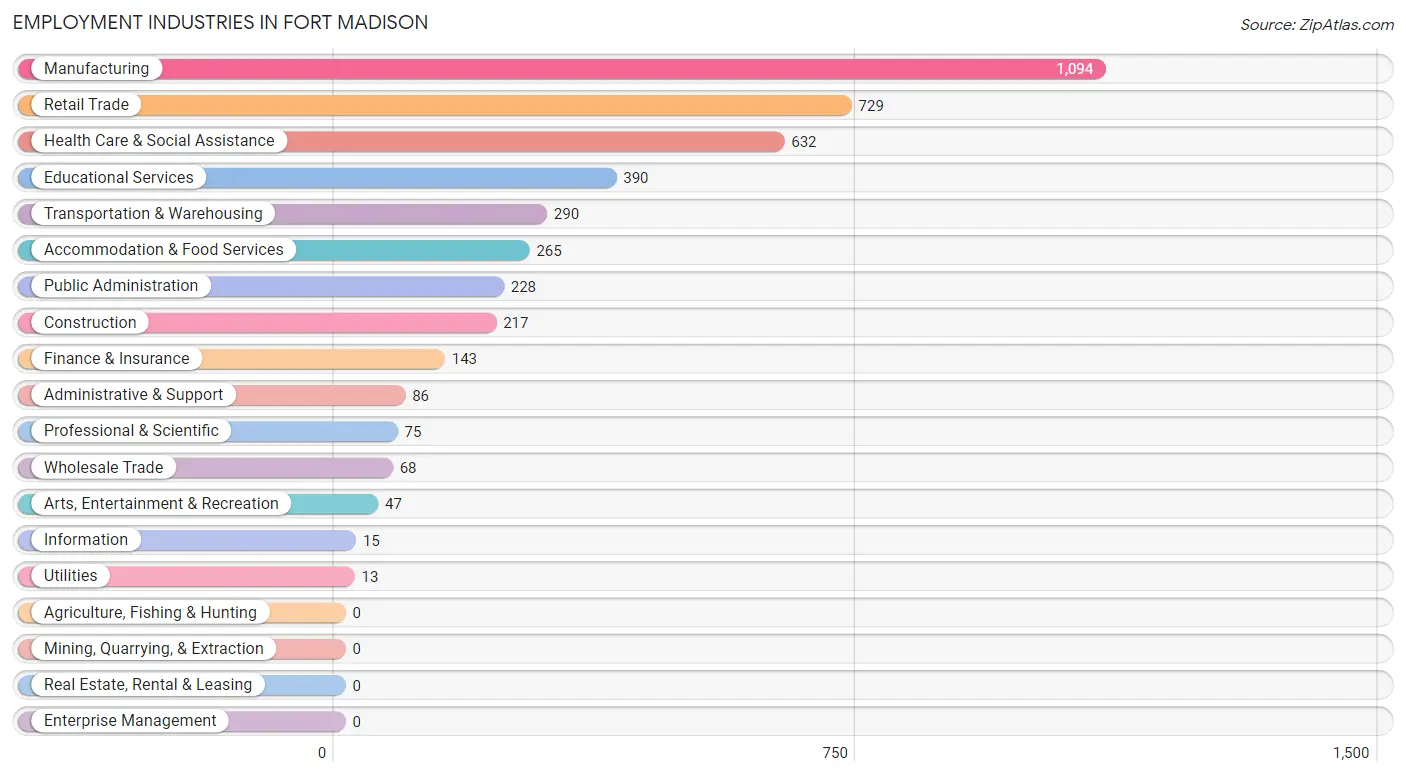
Employment Industries in Fort Madison
The major employment industries in Fort Madison include Manufacturing (1,094 | 24.0%), Retail Trade (729 | 16.0%), Health Care & Social Assistance (632 | 13.9%), Educational Services (390 | 8.6%), and Transportation & Warehousing (290 | 6.4%).
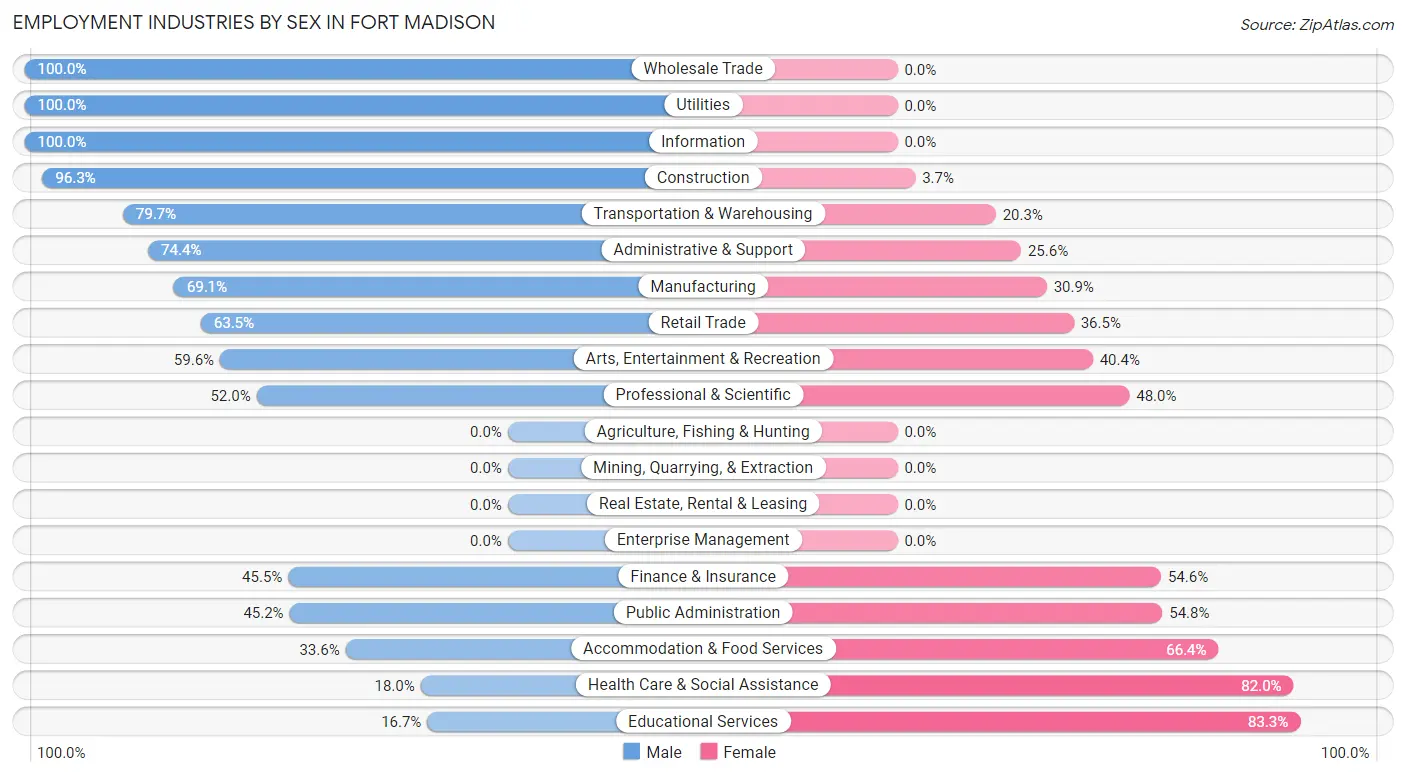
Employment Industries by Sex in Fort Madison
The Fort Madison industries that see more men than women are Wholesale Trade (100.0%), Utilities (100.0%), and Information (100.0%), whereas the industries that tend to have a higher number of women are Educational Services (83.3%), Health Care & Social Assistance (82.0%), and Accommodation & Food Services (66.4%).
| Industry | Male | Female |
| Agriculture, Fishing & Hunting | 0 (0.0%) | 0 (0.0%) |
| Mining, Quarrying, & Extraction | 0 (0.0%) | 0 (0.0%) |
| Construction | 209 (96.3%) | 8 (3.7%) |
| Manufacturing | 756 (69.1%) | 338 (30.9%) |
| Wholesale Trade | 68 (100.0%) | 0 (0.0%) |
| Retail Trade | 463 (63.5%) | 266 (36.5%) |
| Transportation & Warehousing | 231 (79.7%) | 59 (20.3%) |
| Utilities | 13 (100.0%) | 0 (0.0%) |
| Information | 15 (100.0%) | 0 (0.0%) |
| Finance & Insurance | 65 (45.5%) | 78 (54.5%) |
| Real Estate, Rental & Leasing | 0 (0.0%) | 0 (0.0%) |
| Professional & Scientific | 39 (52.0%) | 36 (48.0%) |
| Enterprise Management | 0 (0.0%) | 0 (0.0%) |
| Administrative & Support | 64 (74.4%) | 22 (25.6%) |
| Educational Services | 65 (16.7%) | 325 (83.3%) |
| Health Care & Social Assistance | 114 (18.0%) | 518 (82.0%) |
| Arts, Entertainment & Recreation | 28 (59.6%) | 19 (40.4%) |
| Accommodation & Food Services | 89 (33.6%) | 176 (66.4%) |
| Public Administration | 103 (45.2%) | 125 (54.8%) |
| Total | 2,560 (56.1%) | 2,004 (43.9%) |
Education in Fort Madison
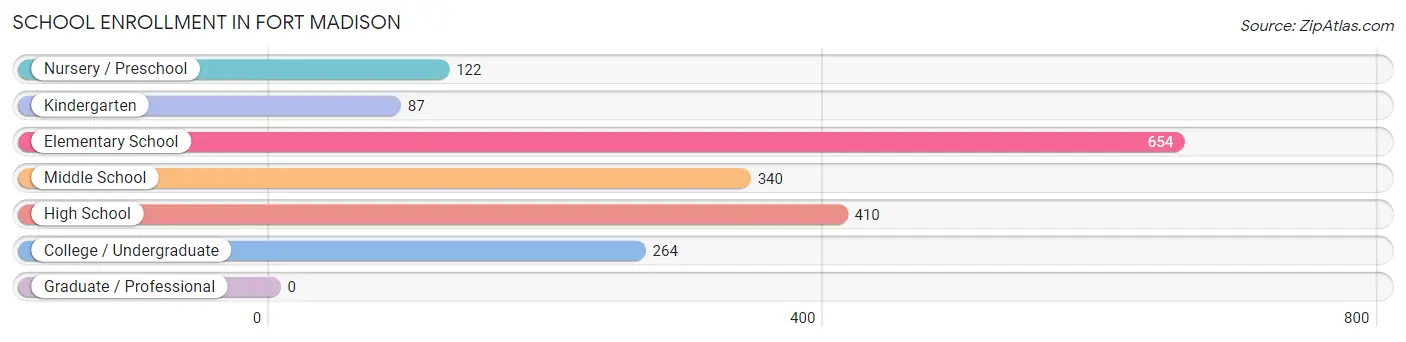
School Enrollment in Fort Madison
The most common levels of schooling among the 1,877 students in Fort Madison are elementary school (654 | 34.8%), high school (410 | 21.8%), and middle school (340 | 18.1%).
| School Level | # Students | % Students |
| Nursery / Preschool | 122 | 6.5% |
| Kindergarten | 87 | 4.6% |
| Elementary School | 654 | 34.8% |
| Middle School | 340 | 18.1% |
| High School | 410 | 21.8% |
| College / Undergraduate | 264 | 14.1% |
| Graduate / Professional | 0 | 0.0% |
| Total | 1,877 | 100.0% |
School Enrollment by Age by Funding Source in Fort Madison
Out of a total of 1,877 students who are enrolled in schools in Fort Madison, 242 (12.9%) attend a private institution, while the remaining 1,635 (87.1%) are enrolled in public schools. The age group of 35 years and over has the highest likelihood of being enrolled in private schools, with 53 (100.0% in the age bracket) enrolled. Conversely, the age group of 3 to 4 year olds has the lowest likelihood of being enrolled in a private school, with 107 (100.0% in the age bracket) attending a public institution.
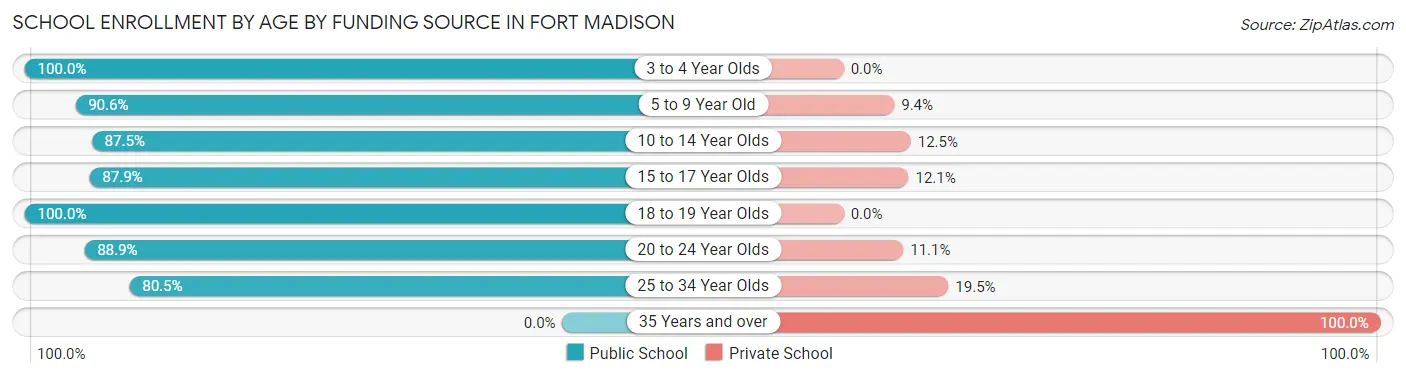
| Age Bracket | Public School | Private School |
| 3 to 4 Year Olds | 107 (100.0%) | 0 (0.0%) |
| 5 to 9 Year Old | 586 (90.6%) | 61 (9.4%) |
| 10 to 14 Year Olds | 371 (87.5%) | 53 (12.5%) |
| 15 to 17 Year Olds | 364 (87.9%) | 50 (12.1%) |
| 18 to 19 Year Olds | 60 (100.0%) | 0 (0.0%) |
| 20 to 24 Year Olds | 80 (88.9%) | 10 (11.1%) |
| 25 to 34 Year Olds | 66 (80.5%) | 16 (19.5%) |
| 35 Years and over | 0 (0.0%) | 53 (100.0%) |
| Total | 1,635 (87.1%) | 242 (12.9%) |
Educational Attainment by Field of Study in Fort Madison
Business (286 | 19.8%), education (234 | 16.2%), arts & humanities (182 | 12.6%), science & technology (140 | 9.7%), and engineering (126 | 8.7%) are the most common fields of study among 1,444 individuals in Fort Madison who have obtained a bachelor's degree or higher.
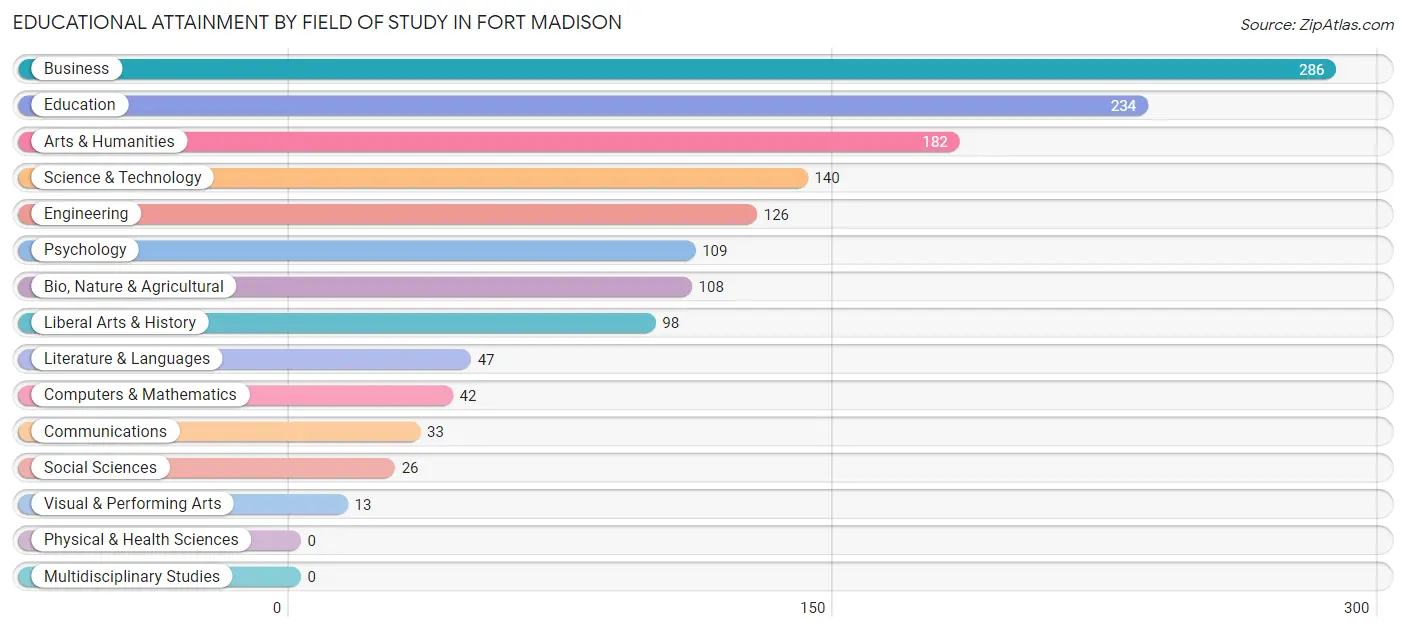
| Field of Study | # Graduates | % Graduates |
| Computers & Mathematics | 42 | 2.9% |
| Bio, Nature & Agricultural | 108 | 7.5% |
| Physical & Health Sciences | 0 | 0.0% |
| Psychology | 109 | 7.5% |
| Social Sciences | 26 | 1.8% |
| Engineering | 126 | 8.7% |
| Multidisciplinary Studies | 0 | 0.0% |
| Science & Technology | 140 | 9.7% |
| Business | 286 | 19.8% |
| Education | 234 | 16.2% |
| Literature & Languages | 47 | 3.3% |
| Liberal Arts & History | 98 | 6.8% |
| Visual & Performing Arts | 13 | 0.9% |
| Communications | 33 | 2.3% |
| Arts & Humanities | 182 | 12.6% |
| Total | 1,444 | 100.0% |
Transportation & Commute in Fort Madison
Vehicle Availability by Sex in Fort Madison
The most prevalent vehicle ownership categories in Fort Madison are males with 2 vehicles (955, accounting for 37.7%) and females with 2 vehicles (702, making up 48.6%).
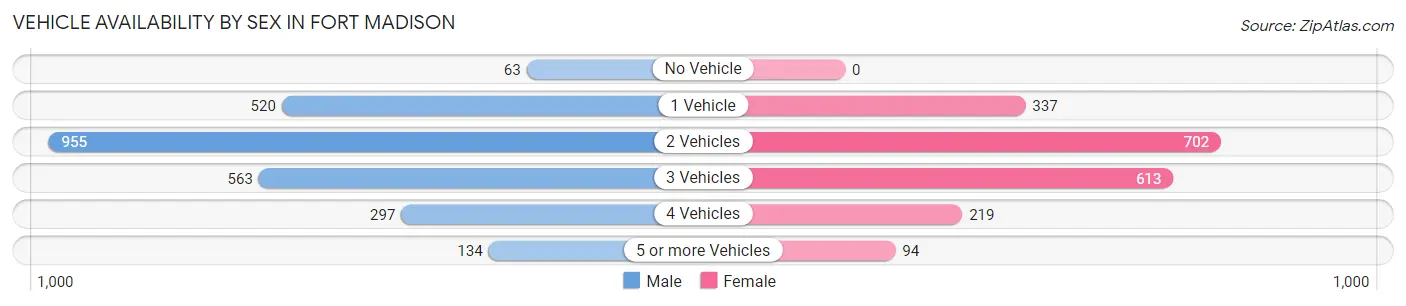
| Vehicles Available | Male | Female |
| No Vehicle | 63 (2.5%) | 0 (0.0%) |
| 1 Vehicle | 520 (20.5%) | 337 (17.2%) |
| 2 Vehicles | 955 (37.7%) | 702 (35.7%) |
| 3 Vehicles | 563 (22.2%) | 613 (31.2%) |
| 4 Vehicles | 297 (11.7%) | 219 (11.2%) |
| 5 or more Vehicles | 134 (5.3%) | 94 (4.8%) |
| Total | 2,532 (100.0%) | 1,965 (100.0%) |
Commute Time in Fort Madison
The most frequently occuring commute durations in Fort Madison are 10 to 14 minutes (841 commuters, 19.7%), 15 to 19 minutes (764 commuters, 17.9%), and 5 to 9 minutes (732 commuters, 17.1%).
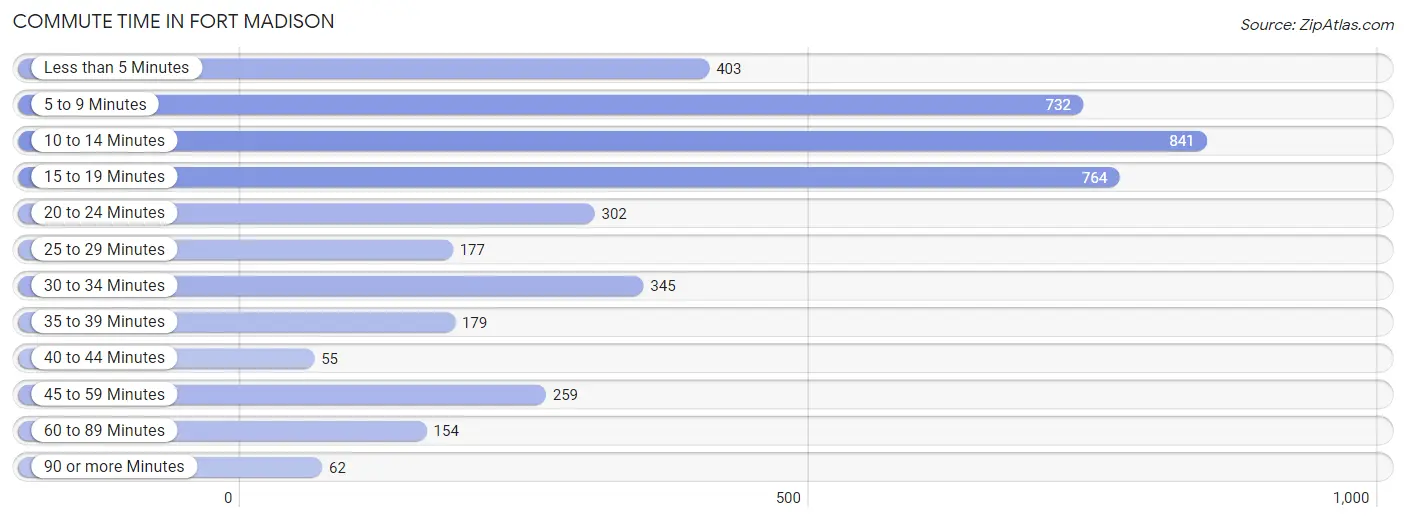
| Commute Time | # Commuters | % Commuters |
| Less than 5 Minutes | 403 | 9.4% |
| 5 to 9 Minutes | 732 | 17.1% |
| 10 to 14 Minutes | 841 | 19.7% |
| 15 to 19 Minutes | 764 | 17.9% |
| 20 to 24 Minutes | 302 | 7.1% |
| 25 to 29 Minutes | 177 | 4.1% |
| 30 to 34 Minutes | 345 | 8.1% |
| 35 to 39 Minutes | 179 | 4.2% |
| 40 to 44 Minutes | 55 | 1.3% |
| 45 to 59 Minutes | 259 | 6.1% |
| 60 to 89 Minutes | 154 | 3.6% |
| 90 or more Minutes | 62 | 1.5% |
Commute Time by Sex in Fort Madison
The most common commute times in Fort Madison are 10 to 14 minutes (560 commuters, 22.4%) for males and 5 to 9 minutes (378 commuters, 21.3%) for females.
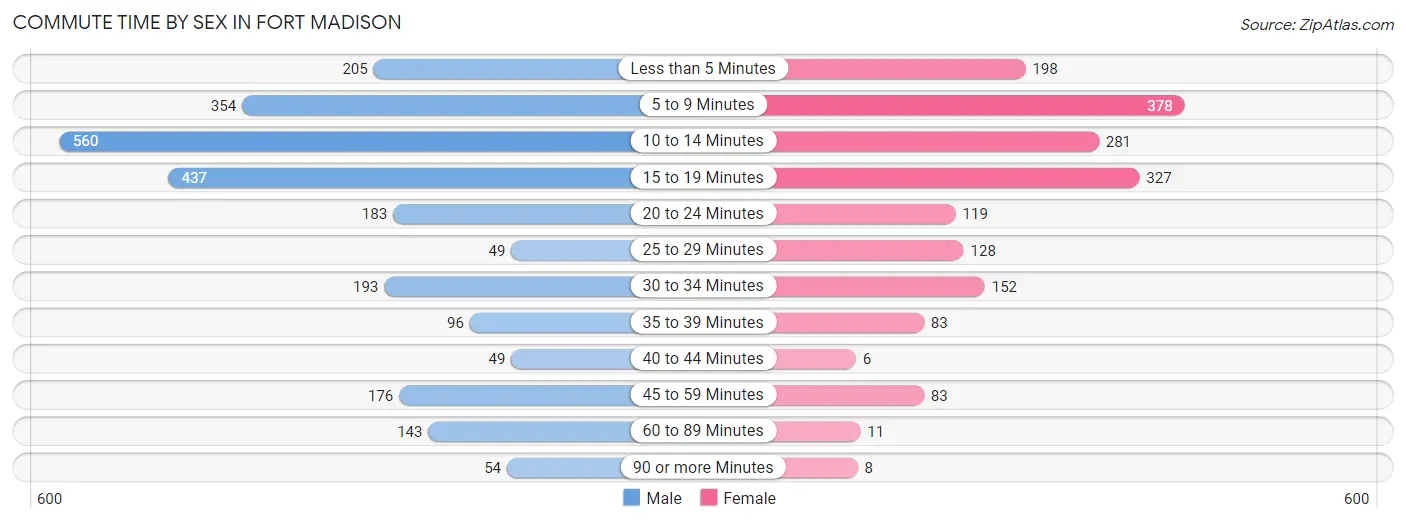
| Commute Time | Male | Female |
| Less than 5 Minutes | 205 (8.2%) | 198 (11.2%) |
| 5 to 9 Minutes | 354 (14.2%) | 378 (21.3%) |
| 10 to 14 Minutes | 560 (22.4%) | 281 (15.8%) |
| 15 to 19 Minutes | 437 (17.5%) | 327 (18.4%) |
| 20 to 24 Minutes | 183 (7.3%) | 119 (6.7%) |
| 25 to 29 Minutes | 49 (2.0%) | 128 (7.2%) |
| 30 to 34 Minutes | 193 (7.7%) | 152 (8.6%) |
| 35 to 39 Minutes | 96 (3.8%) | 83 (4.7%) |
| 40 to 44 Minutes | 49 (2.0%) | 6 (0.3%) |
| 45 to 59 Minutes | 176 (7.0%) | 83 (4.7%) |
| 60 to 89 Minutes | 143 (5.7%) | 11 (0.6%) |
| 90 or more Minutes | 54 (2.2%) | 8 (0.4%) |
Time of Departure to Work by Sex in Fort Madison
The most frequent times of departure to work in Fort Madison are 12:00 PM to 3:59 PM (336, 13.5%) for males and 6:30 AM to 6:59 AM (322, 18.1%) for females.
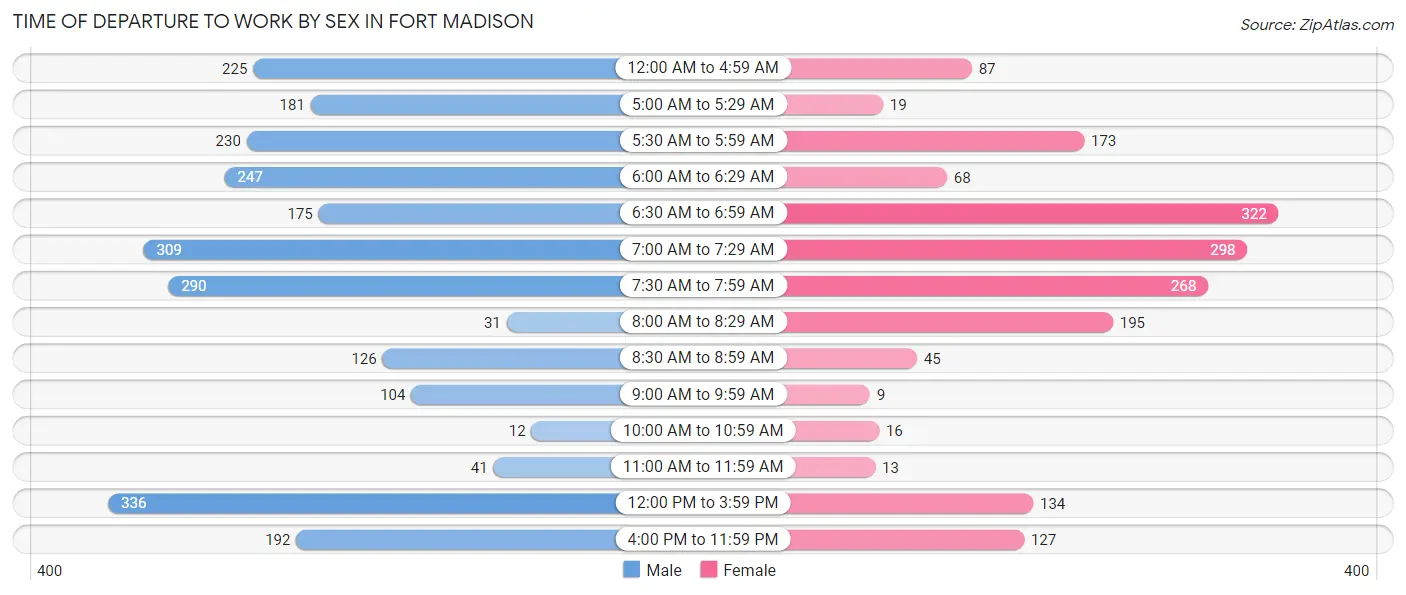
| Time of Departure | Male | Female |
| 12:00 AM to 4:59 AM | 225 (9.0%) | 87 (4.9%) |
| 5:00 AM to 5:29 AM | 181 (7.2%) | 19 (1.1%) |
| 5:30 AM to 5:59 AM | 230 (9.2%) | 173 (9.8%) |
| 6:00 AM to 6:29 AM | 247 (9.9%) | 68 (3.8%) |
| 6:30 AM to 6:59 AM | 175 (7.0%) | 322 (18.1%) |
| 7:00 AM to 7:29 AM | 309 (12.4%) | 298 (16.8%) |
| 7:30 AM to 7:59 AM | 290 (11.6%) | 268 (15.1%) |
| 8:00 AM to 8:29 AM | 31 (1.2%) | 195 (11.0%) |
| 8:30 AM to 8:59 AM | 126 (5.0%) | 45 (2.5%) |
| 9:00 AM to 9:59 AM | 104 (4.2%) | 9 (0.5%) |
| 10:00 AM to 10:59 AM | 12 (0.5%) | 16 (0.9%) |
| 11:00 AM to 11:59 AM | 41 (1.6%) | 13 (0.7%) |
| 12:00 PM to 3:59 PM | 336 (13.5%) | 134 (7.5%) |
| 4:00 PM to 11:59 PM | 192 (7.7%) | 127 (7.2%) |
| Total | 2,499 (100.0%) | 1,774 (100.0%) |
Housing Occupancy in Fort Madison
Occupancy by Ownership in Fort Madison
Of the total 4,442 dwellings in Fort Madison, owner-occupied units account for 3,217 (72.4%), while renter-occupied units make up 1,225 (27.6%).
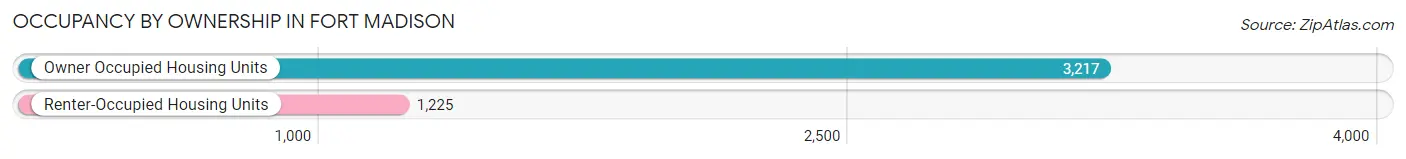
| Occupancy | # Housing Units | % Housing Units |
| Owner Occupied Housing Units | 3,217 | 72.4% |
| Renter-Occupied Housing Units | 1,225 | 27.6% |
| Total Occupied Housing Units | 4,442 | 100.0% |
Occupancy by Household Size in Fort Madison
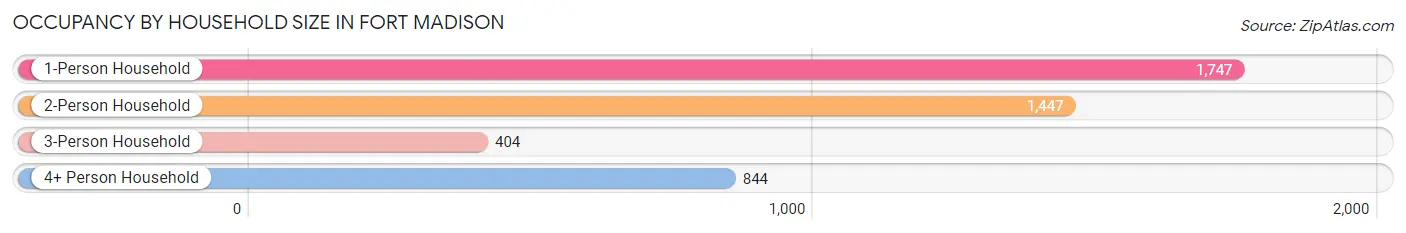
| Household Size | # Housing Units | % Housing Units |
| 1-Person Household | 1,747 | 39.3% |
| 2-Person Household | 1,447 | 32.6% |
| 3-Person Household | 404 | 9.1% |
| 4+ Person Household | 844 | 19.0% |
| Total Housing Units | 4,442 | 100.0% |
Occupancy by Ownership by Household Size in Fort Madison
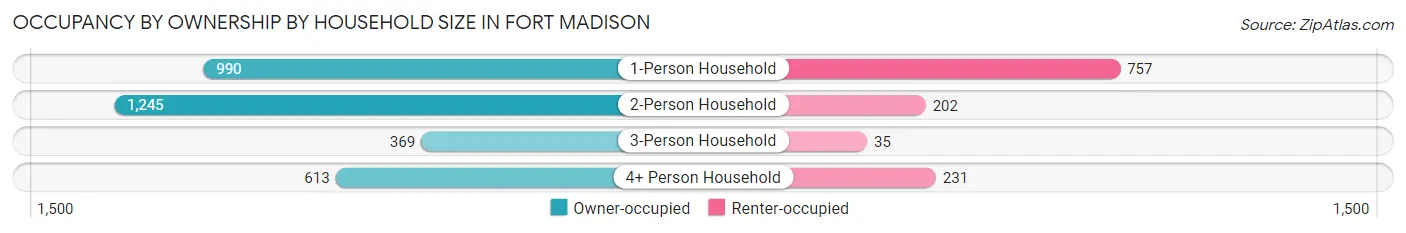
| Household Size | Owner-occupied | Renter-occupied |
| 1-Person Household | 990 (56.7%) | 757 (43.3%) |
| 2-Person Household | 1,245 (86.0%) | 202 (14.0%) |
| 3-Person Household | 369 (91.3%) | 35 (8.7%) |
| 4+ Person Household | 613 (72.6%) | 231 (27.4%) |
| Total Housing Units | 3,217 (72.4%) | 1,225 (27.6%) |
Occupancy by Educational Attainment in Fort Madison
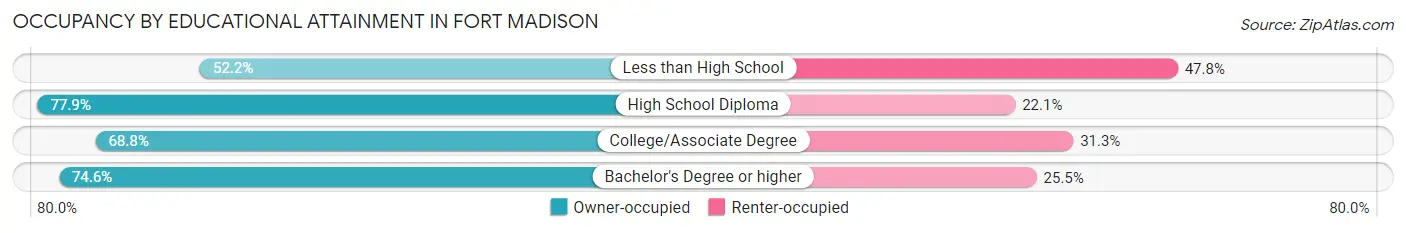
| Household Size | Owner-occupied | Renter-occupied |
| Less than High School | 120 (52.2%) | 110 (47.8%) |
| High School Diploma | 1,321 (77.9%) | 374 (22.1%) |
| College/Associate Degree | 1,190 (68.8%) | 541 (31.2%) |
| Bachelor's Degree or higher | 586 (74.6%) | 200 (25.5%) |
Occupancy by Age of Householder in Fort Madison
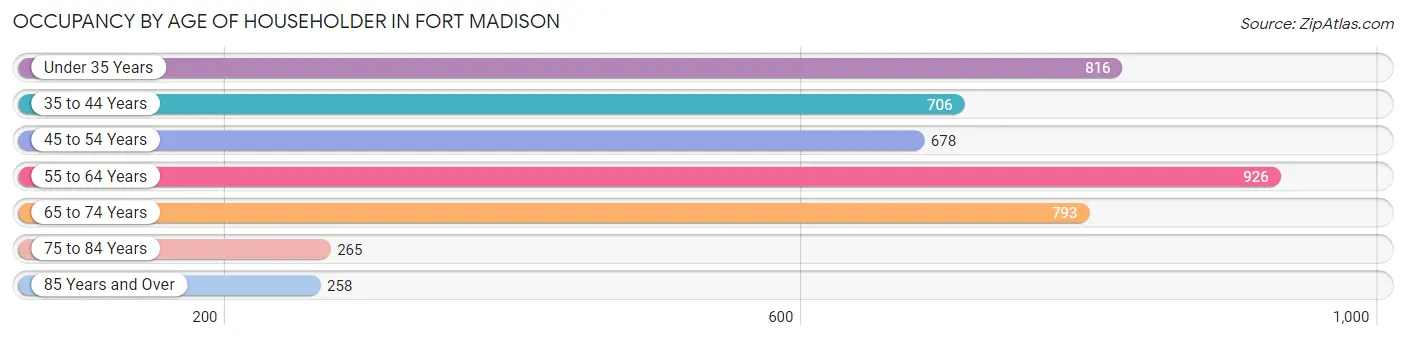
| Age Bracket | # Households | % Households |
| Under 35 Years | 816 | 18.4% |
| 35 to 44 Years | 706 | 15.9% |
| 45 to 54 Years | 678 | 15.3% |
| 55 to 64 Years | 926 | 20.8% |
| 65 to 74 Years | 793 | 17.8% |
| 75 to 84 Years | 265 | 6.0% |
| 85 Years and Over | 258 | 5.8% |
| Total | 4,442 | 100.0% |
Housing Finances in Fort Madison
Median Income by Occupancy in Fort Madison
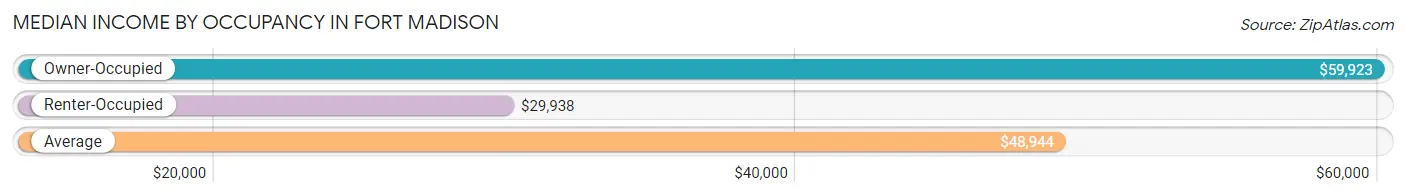
| Occupancy Type | # Households | Median Income |
| Owner-Occupied | 3,217 (72.4%) | $59,923 |
| Renter-Occupied | 1,225 (27.6%) | $29,938 |
| Average | 4,442 (100.0%) | $48,944 |
Occupancy by Householder Income Bracket in Fort Madison
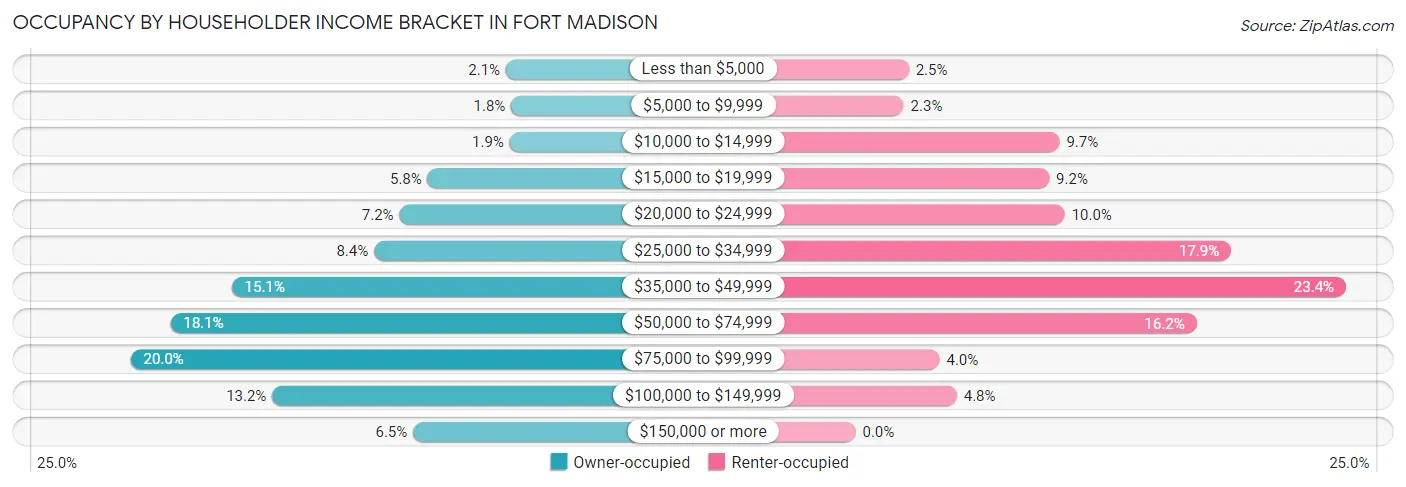
| Income Bracket | Owner-occupied | Renter-occupied |
| Less than $5,000 | 67 (2.1%) | 31 (2.5%) |
| $5,000 to $9,999 | 59 (1.8%) | 28 (2.3%) |
| $10,000 to $14,999 | 61 (1.9%) | 119 (9.7%) |
| $15,000 to $19,999 | 187 (5.8%) | 113 (9.2%) |
| $20,000 to $24,999 | 230 (7.1%) | 122 (10.0%) |
| $25,000 to $34,999 | 269 (8.4%) | 219 (17.9%) |
| $35,000 to $49,999 | 487 (15.1%) | 286 (23.4%) |
| $50,000 to $74,999 | 581 (18.1%) | 199 (16.2%) |
| $75,000 to $99,999 | 642 (20.0%) | 49 (4.0%) |
| $100,000 to $149,999 | 425 (13.2%) | 59 (4.8%) |
| $150,000 or more | 209 (6.5%) | 0 (0.0%) |
| Total | 3,217 (100.0%) | 1,225 (100.0%) |
Monthly Housing Cost Tiers in Fort Madison
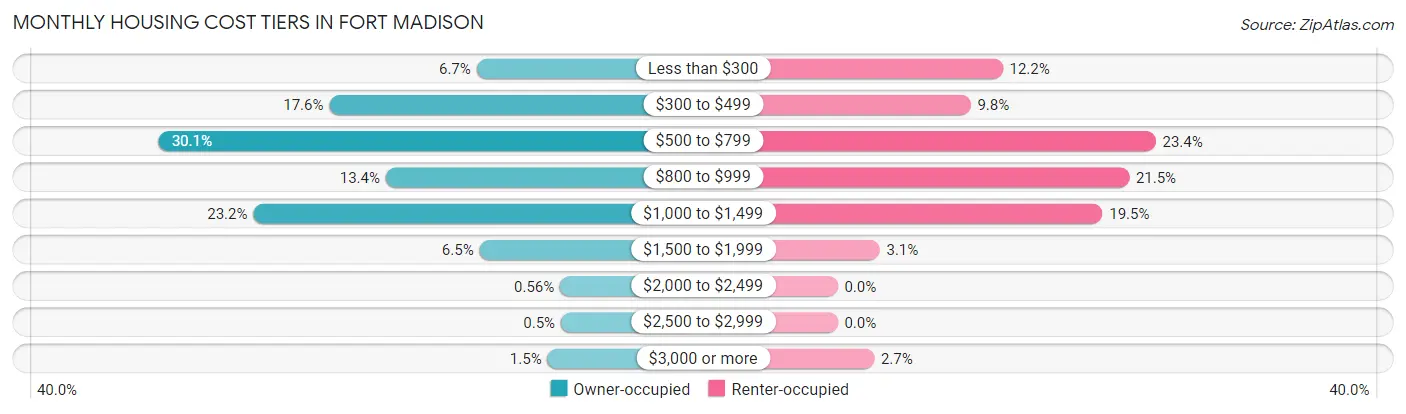
| Monthly Cost | Owner-occupied | Renter-occupied |
| Less than $300 | 216 (6.7%) | 149 (12.2%) |
| $300 to $499 | 565 (17.6%) | 120 (9.8%) |
| $500 to $799 | 969 (30.1%) | 287 (23.4%) |
| $800 to $999 | 431 (13.4%) | 263 (21.5%) |
| $1,000 to $1,499 | 745 (23.2%) | 239 (19.5%) |
| $1,500 to $1,999 | 209 (6.5%) | 38 (3.1%) |
| $2,000 to $2,499 | 18 (0.6%) | 0 (0.0%) |
| $2,500 to $2,999 | 16 (0.5%) | 0 (0.0%) |
| $3,000 or more | 48 (1.5%) | 33 (2.7%) |
| Total | 3,217 (100.0%) | 1,225 (100.0%) |
Physical Housing Characteristics in Fort Madison
Housing Structures in Fort Madison
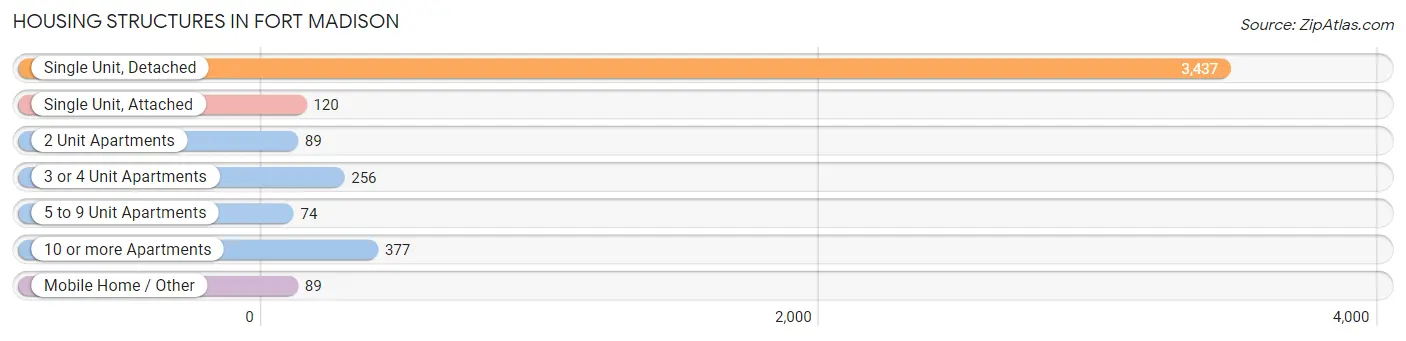
| Structure Type | # Housing Units | % Housing Units |
| Single Unit, Detached | 3,437 | 77.4% |
| Single Unit, Attached | 120 | 2.7% |
| 2 Unit Apartments | 89 | 2.0% |
| 3 or 4 Unit Apartments | 256 | 5.8% |
| 5 to 9 Unit Apartments | 74 | 1.7% |
| 10 or more Apartments | 377 | 8.5% |
| Mobile Home / Other | 89 | 2.0% |
| Total | 4,442 | 100.0% |
Housing Structures by Occupancy in Fort Madison
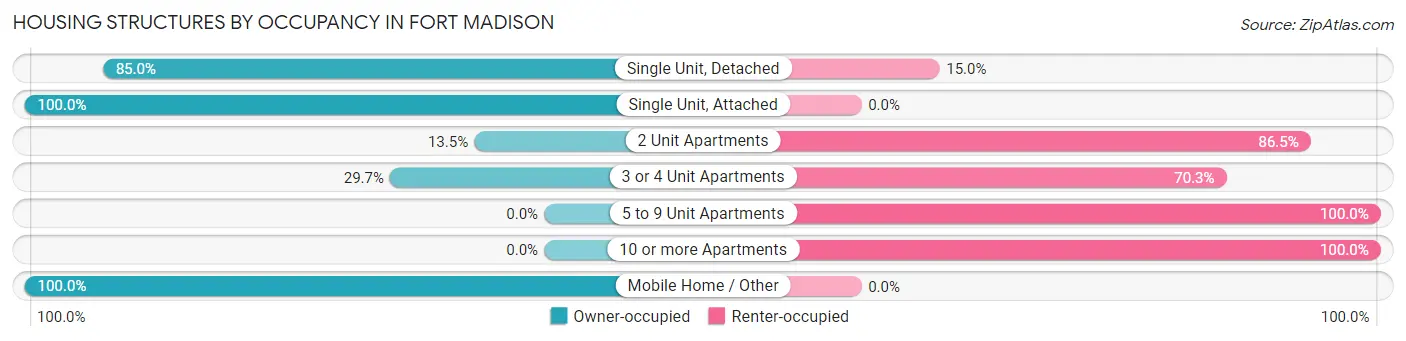
| Structure Type | Owner-occupied | Renter-occupied |
| Single Unit, Detached | 2,920 (85.0%) | 517 (15.0%) |
| Single Unit, Attached | 120 (100.0%) | 0 (0.0%) |
| 2 Unit Apartments | 12 (13.5%) | 77 (86.5%) |
| 3 or 4 Unit Apartments | 76 (29.7%) | 180 (70.3%) |
| 5 to 9 Unit Apartments | 0 (0.0%) | 74 (100.0%) |
| 10 or more Apartments | 0 (0.0%) | 377 (100.0%) |
| Mobile Home / Other | 89 (100.0%) | 0 (0.0%) |
| Total | 3,217 (72.4%) | 1,225 (27.6%) |
Housing Structures by Number of Rooms in Fort Madison

| Number of Rooms | Owner-occupied | Renter-occupied |
| 1 Room | 0 (0.0%) | 51 (4.2%) |
| 2 or 3 Rooms | 84 (2.6%) | 347 (28.3%) |
| 4 or 5 Rooms | 1,015 (31.6%) | 588 (48.0%) |
| 6 or 7 Rooms | 1,377 (42.8%) | 214 (17.5%) |
| 8 or more Rooms | 741 (23.0%) | 25 (2.0%) |
| Total | 3,217 (100.0%) | 1,225 (100.0%) |
Housing Structure by Heating Type in Fort Madison
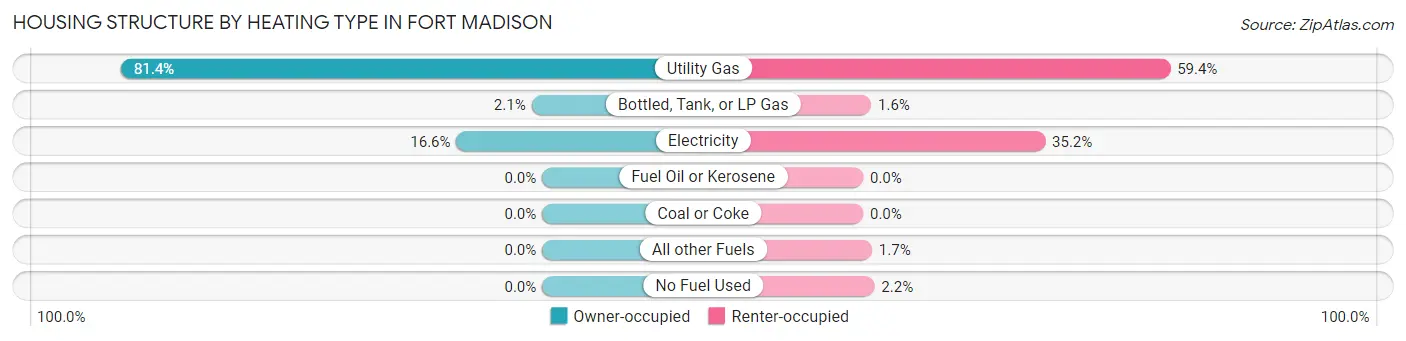
| Heating Type | Owner-occupied | Renter-occupied |
| Utility Gas | 2,618 (81.4%) | 727 (59.4%) |
| Bottled, Tank, or LP Gas | 66 (2.1%) | 19 (1.5%) |
| Electricity | 533 (16.6%) | 431 (35.2%) |
| Fuel Oil or Kerosene | 0 (0.0%) | 0 (0.0%) |
| Coal or Coke | 0 (0.0%) | 0 (0.0%) |
| All other Fuels | 0 (0.0%) | 21 (1.7%) |
| No Fuel Used | 0 (0.0%) | 27 (2.2%) |
| Total | 3,217 (100.0%) | 1,225 (100.0%) |
Household Vehicle Usage in Fort Madison
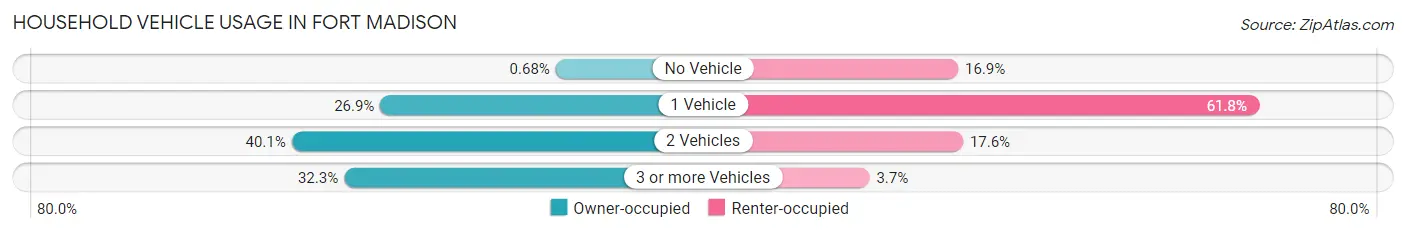
| Vehicles per Household | Owner-occupied | Renter-occupied |
| No Vehicle | 22 (0.7%) | 207 (16.9%) |
| 1 Vehicle | 865 (26.9%) | 757 (61.8%) |
| 2 Vehicles | 1,291 (40.1%) | 216 (17.6%) |
| 3 or more Vehicles | 1,039 (32.3%) | 45 (3.7%) |
| Total | 3,217 (100.0%) | 1,225 (100.0%) |
Real Estate & Mortgages in Fort Madison
Real Estate and Mortgage Overview in Fort Madison
| Characteristic | Without Mortgage | With Mortgage |
| Housing Units | 1,390 | 1,827 |
| Median Property Value | $85,100 | $98,000 |
| Median Household Income | $50,781 | $146 |
| Monthly Housing Costs | $477 | $48 |
| Real Estate Taxes | $1,265 | $53 |
Property Value by Mortgage Status in Fort Madison
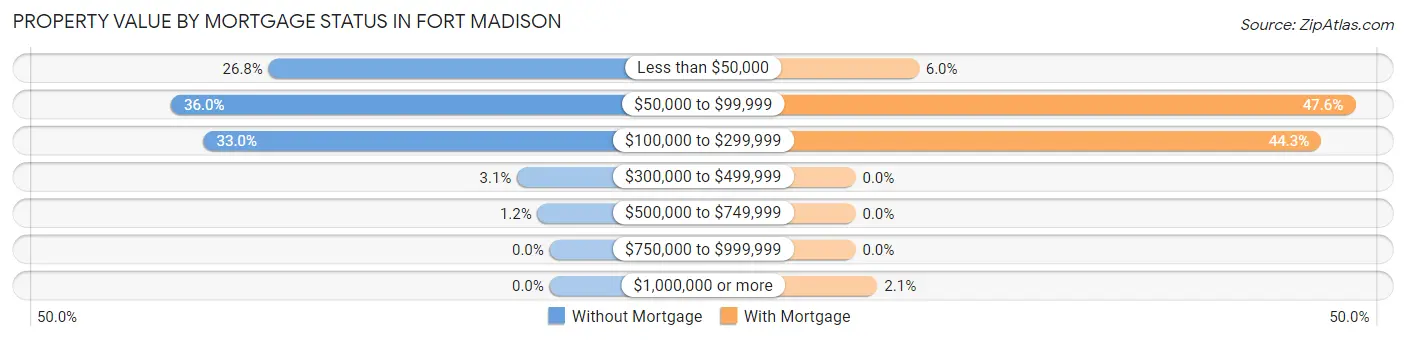
| Property Value | Without Mortgage | With Mortgage |
| Less than $50,000 | 372 (26.8%) | 110 (6.0%) |
| $50,000 to $99,999 | 501 (36.0%) | 869 (47.6%) |
| $100,000 to $299,999 | 458 (33.0%) | 810 (44.3%) |
| $300,000 to $499,999 | 43 (3.1%) | 0 (0.0%) |
| $500,000 to $749,999 | 16 (1.1%) | 0 (0.0%) |
| $750,000 to $999,999 | 0 (0.0%) | 0 (0.0%) |
| $1,000,000 or more | 0 (0.0%) | 38 (2.1%) |
| Total | 1,390 (100.0%) | 1,827 (100.0%) |
Household Income by Mortgage Status in Fort Madison
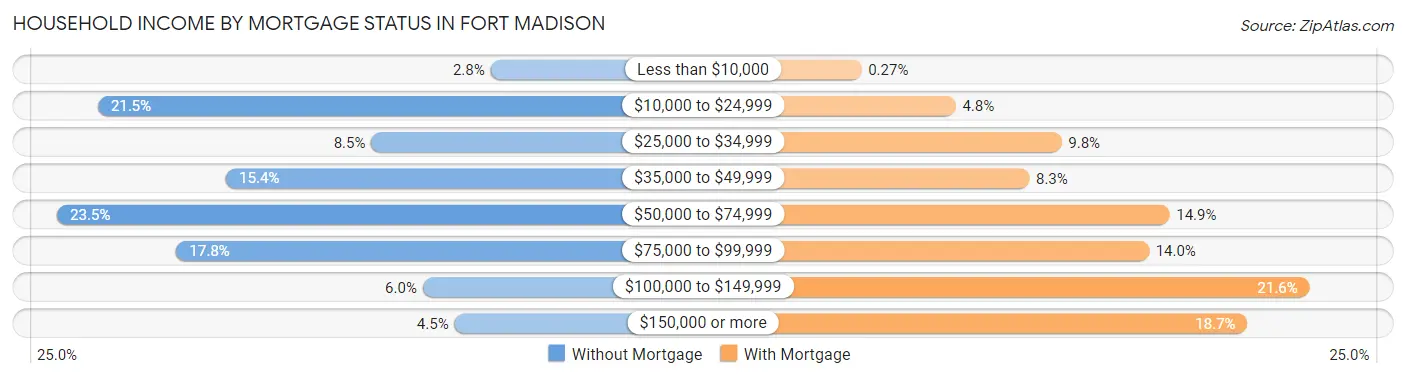
| Household Income | Without Mortgage | With Mortgage |
| Less than $10,000 | 39 (2.8%) | 5 (0.3%) |
| $10,000 to $24,999 | 299 (21.5%) | 87 (4.8%) |
| $25,000 to $34,999 | 118 (8.5%) | 179 (9.8%) |
| $35,000 to $49,999 | 214 (15.4%) | 151 (8.3%) |
| $50,000 to $74,999 | 326 (23.4%) | 273 (14.9%) |
| $75,000 to $99,999 | 247 (17.8%) | 255 (14.0%) |
| $100,000 to $149,999 | 84 (6.0%) | 395 (21.6%) |
| $150,000 or more | 63 (4.5%) | 341 (18.7%) |
| Total | 1,390 (100.0%) | 1,827 (100.0%) |
Property Value to Household Income Ratio in Fort Madison
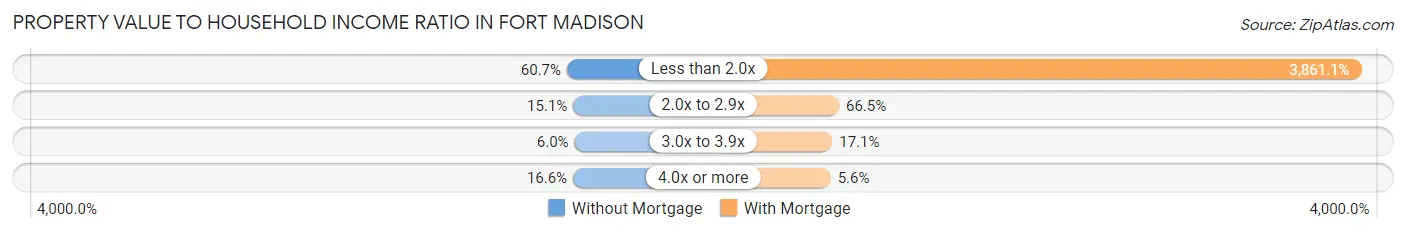
| Value-to-Income Ratio | Without Mortgage | With Mortgage |
| Less than 2.0x | 843 (60.7%) | 70,542 (3,861.1%) |
| 2.0x to 2.9x | 210 (15.1%) | 1,214 (66.4%) |
| 3.0x to 3.9x | 84 (6.0%) | 312 (17.1%) |
| 4.0x or more | 231 (16.6%) | 103 (5.6%) |
| Total | 1,390 (100.0%) | 1,827 (100.0%) |
Real Estate Taxes by Mortgage Status in Fort Madison
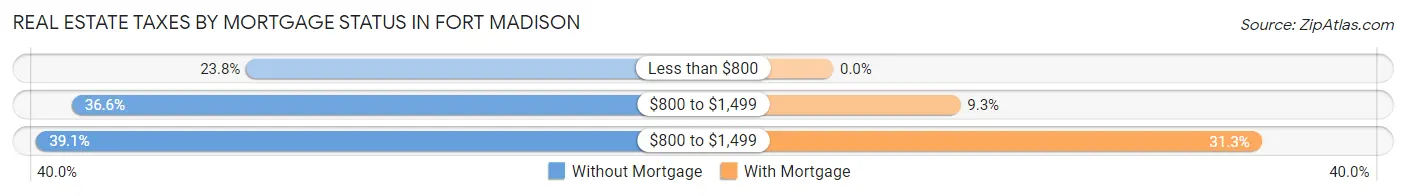
| Property Taxes | Without Mortgage | With Mortgage |
| Less than $800 | 331 (23.8%) | 0 (0.0%) |
| $800 to $1,499 | 508 (36.5%) | 170 (9.3%) |
| $800 to $1,499 | 544 (39.1%) | 572 (31.3%) |
| Total | 1,390 (100.0%) | 1,827 (100.0%) |
Health & Disability in Fort Madison
Health Insurance Coverage by Age in Fort Madison

| Age Bracket | With Coverage | Without Coverage |
| Under 6 Years | 587 (100.0%) | 0 (0.0%) |
| 6 to 18 Years | 1,515 (100.0%) | 0 (0.0%) |
| 19 to 25 Years | 653 (88.7%) | 83 (11.3%) |
| 26 to 34 Years | 794 (84.7%) | 144 (15.3%) |
| 35 to 44 Years | 1,134 (96.1%) | 46 (3.9%) |
| 45 to 54 Years | 1,099 (95.5%) | 52 (4.5%) |
| 55 to 64 Years | 1,292 (89.2%) | 157 (10.8%) |
| 65 to 74 Years | 1,237 (100.0%) | 0 (0.0%) |
| 75 Years and older | 688 (99.0%) | 7 (1.0%) |
| Total | 8,999 (94.9%) | 489 (5.1%) |
Health Insurance Coverage by Citizenship Status in Fort Madison
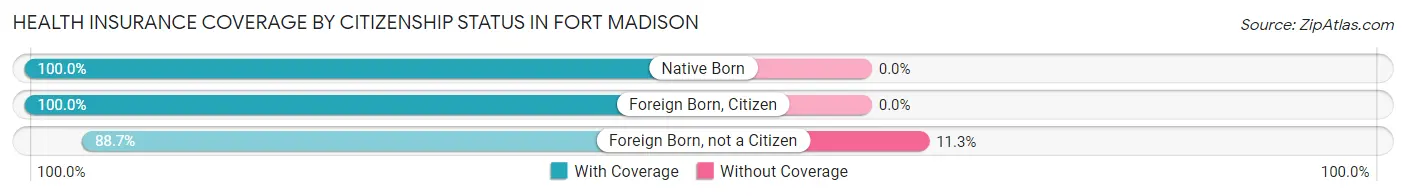
| Citizenship Status | With Coverage | Without Coverage |
| Native Born | 587 (100.0%) | 0 (0.0%) |
| Foreign Born, Citizen | 1,515 (100.0%) | 0 (0.0%) |
| Foreign Born, not a Citizen | 653 (88.7%) | 83 (11.3%) |
Health Insurance Coverage by Household Income in Fort Madison
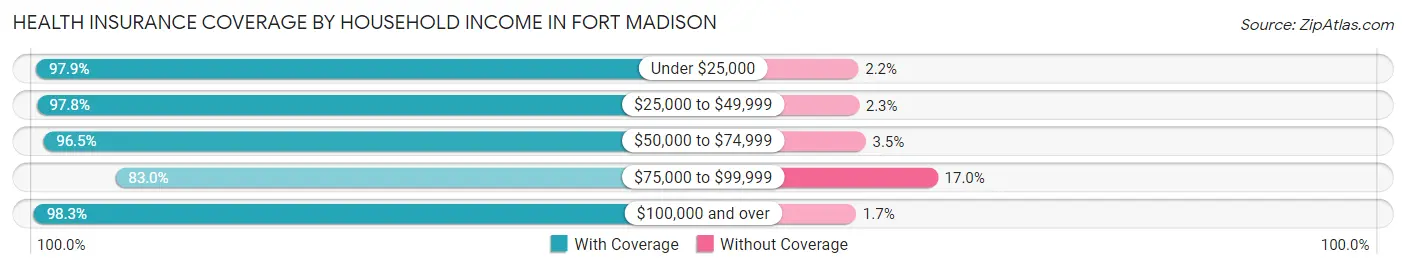
| Household Income | With Coverage | Without Coverage |
| Under $25,000 | 1,592 (97.9%) | 35 (2.1%) |
| $25,000 to $49,999 | 2,263 (97.8%) | 52 (2.2%) |
| $50,000 to $74,999 | 1,704 (96.5%) | 62 (3.5%) |
| $75,000 to $99,999 | 1,483 (83.0%) | 304 (17.0%) |
| $100,000 and over | 1,957 (98.3%) | 34 (1.7%) |
Public vs Private Health Insurance Coverage by Age in Fort Madison
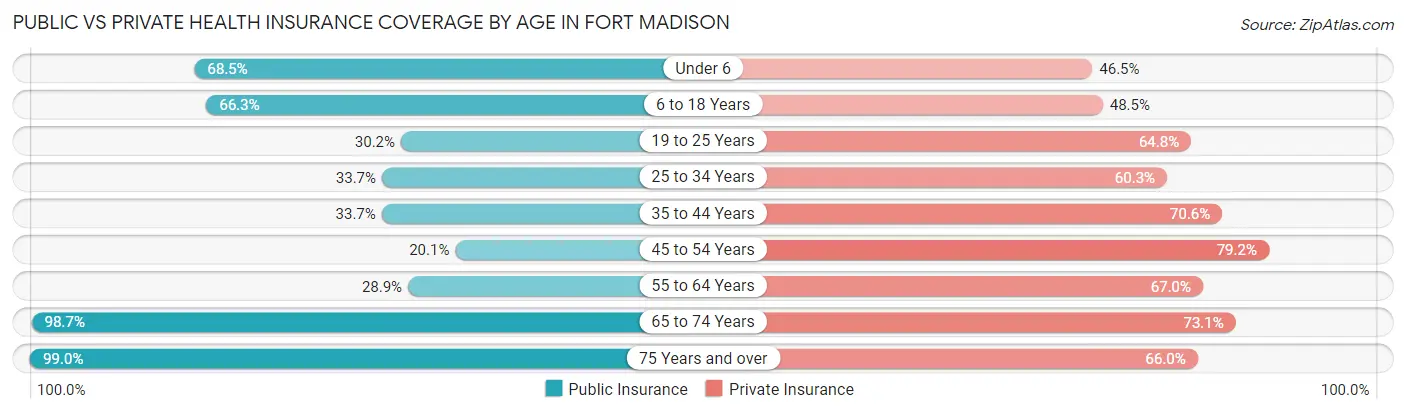
| Age Bracket | Public Insurance | Private Insurance |
| Under 6 | 402 (68.5%) | 273 (46.5%) |
| 6 to 18 Years | 1,004 (66.3%) | 734 (48.4%) |
| 19 to 25 Years | 222 (30.2%) | 477 (64.8%) |
| 25 to 34 Years | 316 (33.7%) | 566 (60.3%) |
| 35 to 44 Years | 398 (33.7%) | 833 (70.6%) |
| 45 to 54 Years | 231 (20.1%) | 912 (79.2%) |
| 55 to 64 Years | 418 (28.8%) | 971 (67.0%) |
| 65 to 74 Years | 1,221 (98.7%) | 904 (73.1%) |
| 75 Years and over | 688 (99.0%) | 459 (66.0%) |
| Total | 4,900 (51.6%) | 6,129 (64.6%) |
Disability Status by Sex by Age in Fort Madison
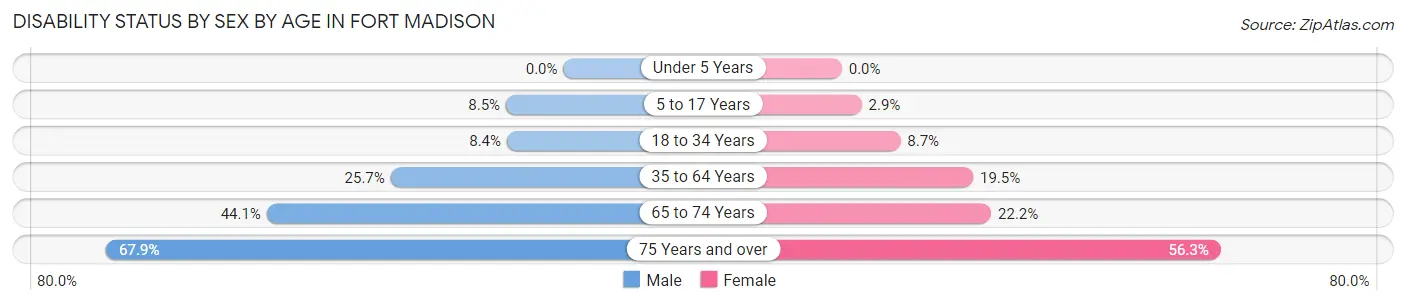
| Age Bracket | Male | Female |
| Under 5 Years | 0 (0.0%) | 0 (0.0%) |
| 5 to 17 Years | 60 (8.5%) | 23 (2.9%) |
| 18 to 34 Years | 77 (8.4%) | 71 (8.7%) |
| 35 to 64 Years | 505 (25.7%) | 353 (19.5%) |
| 65 to 74 Years | 237 (44.1%) | 155 (22.2%) |
| 75 Years and over | 146 (67.9%) | 270 (56.2%) |
Disability Class by Sex by Age in Fort Madison
Disability Class: Hearing Difficulty
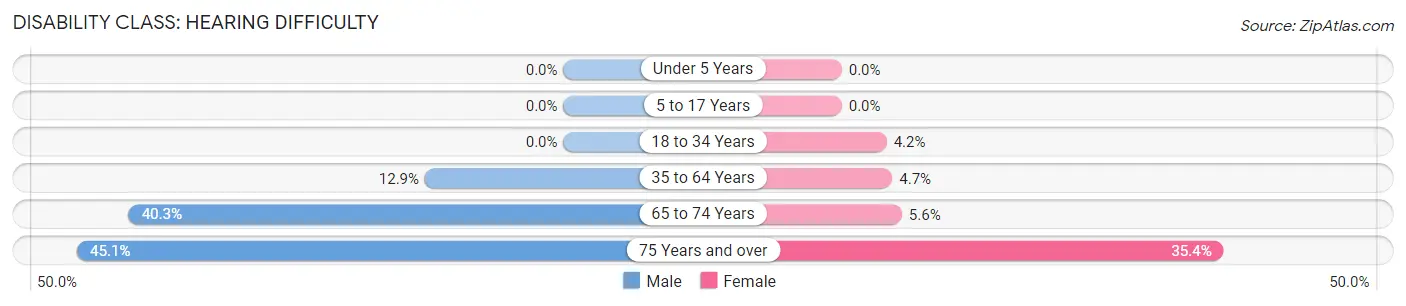
| Age Bracket | Male | Female |
| Under 5 Years | 0 (0.0%) | 0 (0.0%) |
| 5 to 17 Years | 0 (0.0%) | 0 (0.0%) |
| 18 to 34 Years | 0 (0.0%) | 34 (4.2%) |
| 35 to 64 Years | 253 (12.9%) | 85 (4.7%) |
| 65 to 74 Years | 217 (40.3%) | 39 (5.6%) |
| 75 Years and over | 97 (45.1%) | 170 (35.4%) |
Disability Class: Vision Difficulty
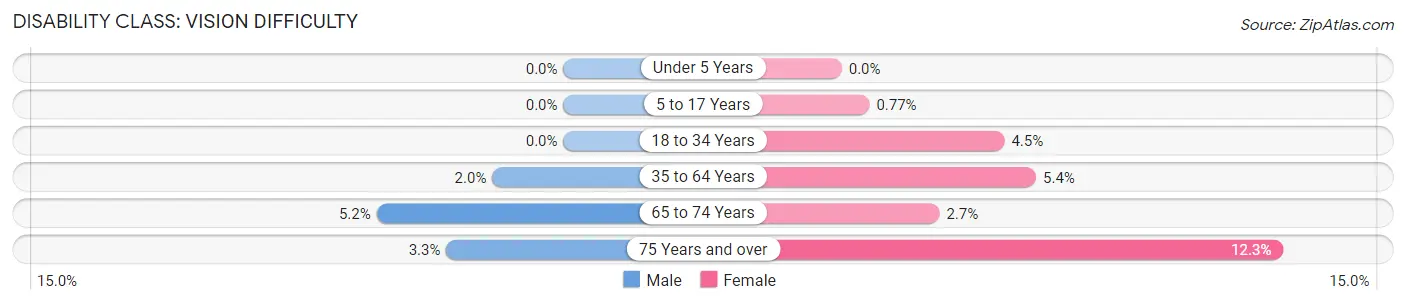
| Age Bracket | Male | Female |
| Under 5 Years | 0 (0.0%) | 0 (0.0%) |
| 5 to 17 Years | 0 (0.0%) | 6 (0.8%) |
| 18 to 34 Years | 0 (0.0%) | 37 (4.5%) |
| 35 to 64 Years | 39 (2.0%) | 98 (5.4%) |
| 65 to 74 Years | 28 (5.2%) | 19 (2.7%) |
| 75 Years and over | 7 (3.3%) | 59 (12.3%) |
Disability Class: Cognitive Difficulty
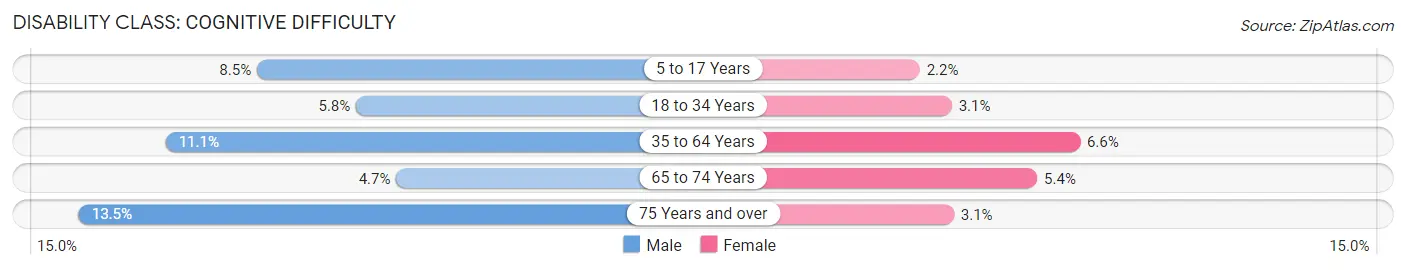
| Age Bracket | Male | Female |
| 5 to 17 Years | 60 (8.5%) | 17 (2.2%) |
| 18 to 34 Years | 53 (5.8%) | 25 (3.1%) |
| 35 to 64 Years | 218 (11.1%) | 120 (6.6%) |
| 65 to 74 Years | 25 (4.6%) | 38 (5.4%) |
| 75 Years and over | 29 (13.5%) | 15 (3.1%) |
Disability Class: Ambulatory Difficulty
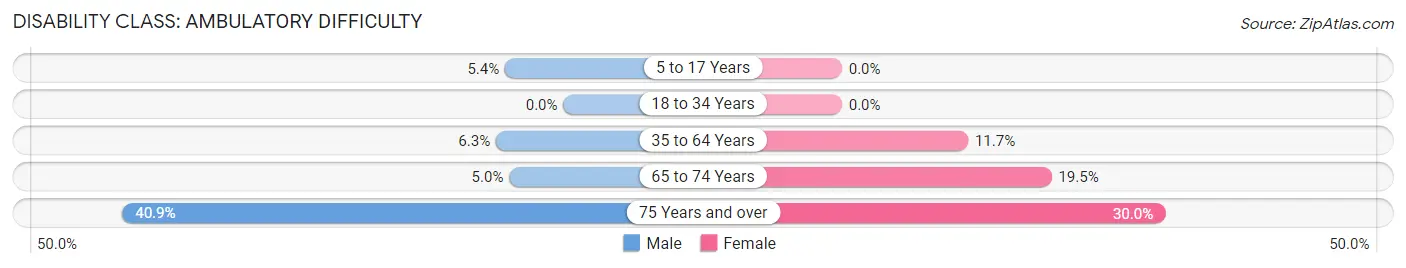
| Age Bracket | Male | Female |
| 5 to 17 Years | 38 (5.4%) | 0 (0.0%) |
| 18 to 34 Years | 0 (0.0%) | 0 (0.0%) |
| 35 to 64 Years | 123 (6.2%) | 212 (11.7%) |
| 65 to 74 Years | 27 (5.0%) | 136 (19.5%) |
| 75 Years and over | 88 (40.9%) | 144 (30.0%) |
Disability Class: Self-Care Difficulty
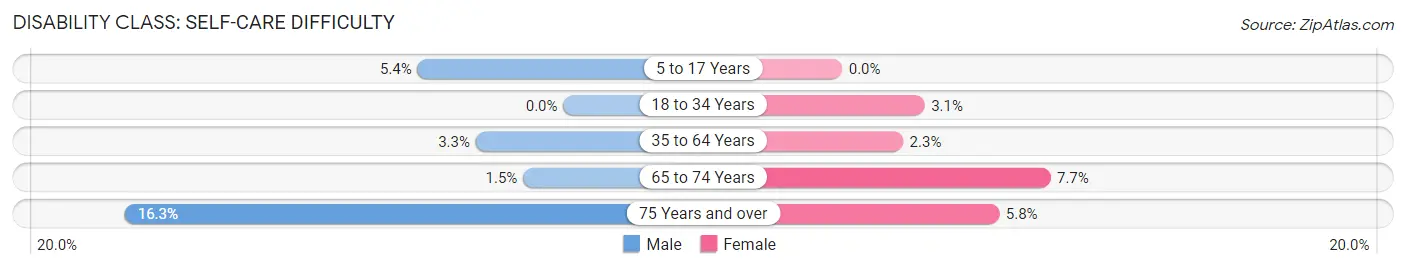
| Age Bracket | Male | Female |
| 5 to 17 Years | 38 (5.4%) | 0 (0.0%) |
| 18 to 34 Years | 0 (0.0%) | 25 (3.1%) |
| 35 to 64 Years | 64 (3.3%) | 41 (2.3%) |
| 65 to 74 Years | 8 (1.5%) | 54 (7.7%) |
| 75 Years and over | 35 (16.3%) | 28 (5.8%) |
Technology Access in Fort Madison
Computing Device Access in Fort Madison
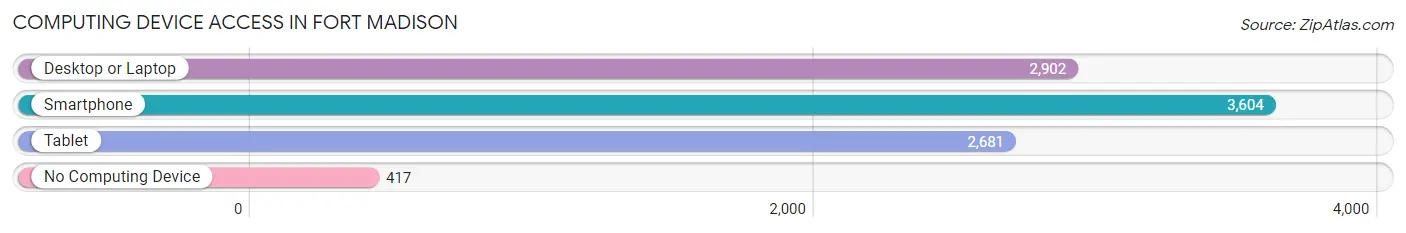
| Device Type | # Households | % Households |
| Desktop or Laptop | 2,902 | 65.3% |
| Smartphone | 3,604 | 81.1% |
| Tablet | 2,681 | 60.4% |
| No Computing Device | 417 | 9.4% |
| Total | 4,442 | 100.0% |
Internet Access in Fort Madison
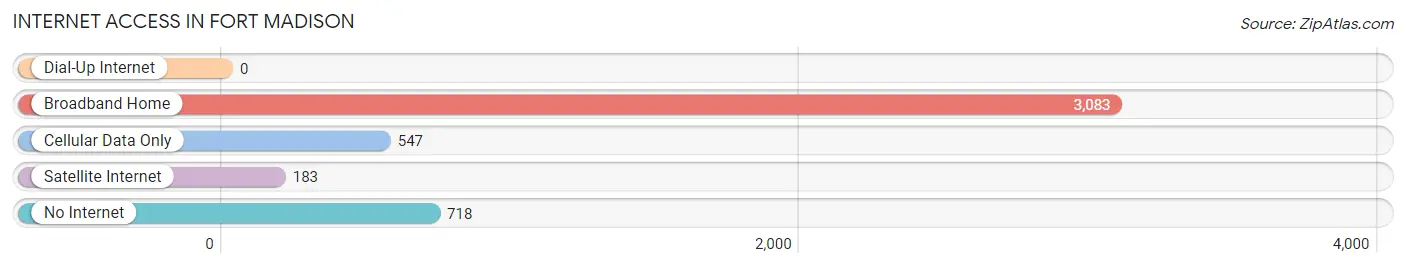
| Internet Type | # Households | % Households |
| Dial-Up Internet | 0 | 0.0% |
| Broadband Home | 3,083 | 69.4% |
| Cellular Data Only | 547 | 12.3% |
| Satellite Internet | 183 | 4.1% |
| No Internet | 718 | 16.2% |
| Total | 4,442 | 100.0% |
Fort Madison Summary
Introduction
Fort Madison is a city located in Lee County, Iowa, United States. It is the county seat of Lee County and is located along the Mississippi River. The city is home to a population of 11,051 people as of the 2010 census. The city is known for its historic downtown area, which is home to many historic buildings and businesses. The city is also home to a number of parks and recreational areas, as well as a variety of cultural and educational institutions.
History
The area that is now Fort Madison was first settled by Europeans in 1808, when a trading post was established by the American Fur Company. The post was located near the site of an old Sauk Indian village, and was named Fort Madison in honor of James Madison, the fourth President of the United States. The fort was abandoned in 1813, but the settlement that grew up around it continued to thrive.
In 1832, the city was officially incorporated as the City of Fort Madison. The city quickly grew in size and importance, becoming a major port on the Mississippi River. The city was also a major center for the production of brick and tile, and was home to a number of manufacturing plants.
In the late 19th century, Fort Madison was a major center for the railroad industry, with several major railroads running through the city. The city was also home to a number of large industries, including a large meatpacking plant and a large brewery.
Geography
Fort Madison is located in southeastern Iowa, along the Mississippi River. The city is situated on the west bank of the river, and is bordered by the cities of Keokuk to the north, Burlington to the east, and West Point to the south. The city covers an area of 8.3 square miles, and has an elevation of 590 feet.
The city is located in a region of rolling hills and fertile farmland. The climate is humid continental, with hot, humid summers and cold, snowy winters. The average annual temperature is 54 degrees Fahrenheit, and the average annual precipitation is 36 inches.
Economy
The economy of Fort Madison is largely based on manufacturing and agriculture. The city is home to a number of manufacturing plants, including a large meatpacking plant and a large brewery. The city is also home to a number of agricultural businesses, including a large grain elevator and a number of dairy farms.
The city is also home to a number of retail businesses, including a number of antique stores and specialty shops. The city is also home to a number of educational and cultural institutions, including a community college and a number of museums.
Demographics
As of the 2010 census, the population of Fort Madison was 11,051. The racial makeup of the city was 90.2% White, 4.3% African American, 0.5% Native American, 0.7% Asian, 0.1% Pacific Islander, and 3.2% from other races. The median household income was $37,945, and the median family income was $45,945.
Conclusion
Fort Madison is a city located in Lee County, Iowa, United States. It is the county seat of Lee County and is located along the Mississippi River. The city is home to a population of 11,051 people as of the 2010 census. The city is known for its historic downtown area, which is home to many historic buildings and businesses. The city is also home to a number of parks and recreational areas, as well as a variety of cultural and educational institutions. The economy of Fort Madison is largely based on manufacturing and agriculture, and the city is home to a number of retail businesses, educational and cultural institutions. The racial makeup of the city is 90.2% White, 4.3% African American, 0.5% Native American, 0.7% Asian, 0.1% Pacific Islander, and 3.2% from other races. The median household income was $37,945, and the median family income was $45,945.
Common Questions
What is Per Capita Income in Fort Madison?
Per Capita income in Fort Madison is $29,084.
What is the Median Family Income in Fort Madison?
Median Family Income in Fort Madison is $63,906.
What is the Median Household income in Fort Madison?
Median Household Income in Fort Madison is $48,944.
What is Income or Wage Gap in Fort Madison?
Income or Wage Gap in Fort Madison is 42.4%.
Women in Fort Madison earn 57.6 cents for every dollar earned by a man.
What is Inequality or Gini Index in Fort Madison?
Inequality or Gini Index in Fort Madison is 0.44.
What is the Total Population of Fort Madison?
Total Population of Fort Madison is 10,293.
What is the Total Male Population of Fort Madison?
Total Male Population of Fort Madison is 5,359.
What is the Total Female Population of Fort Madison?
Total Female Population of Fort Madison is 4,934.
What is the Ratio of Males per 100 Females in Fort Madison?
There are 108.61 Males per 100 Females in Fort Madison.
What is the Ratio of Females per 100 Males in Fort Madison?
There are 92.07 Females per 100 Males in Fort Madison.
What is the Median Population Age in Fort Madison?
Median Population Age in Fort Madison is 43.0 Years.
What is the Average Family Size in Fort Madison
Average Family Size in Fort Madison is 2.9 People.
What is the Average Household Size in Fort Madison
Average Household Size in Fort Madison is 2.1 People.
How Large is the Labor Force in Fort Madison?
There are 4,840 People in the Labor Forcein in Fort Madison.
What is the Percentage of People in the Labor Force in Fort Madison?
57.3% of People are in the Labor Force in Fort Madison.
What is the Unemployment Rate in Fort Madison?
Unemployment Rate in Fort Madison is 5.6%.