Evansdale, IA Map & Demographics
Evansdale Map
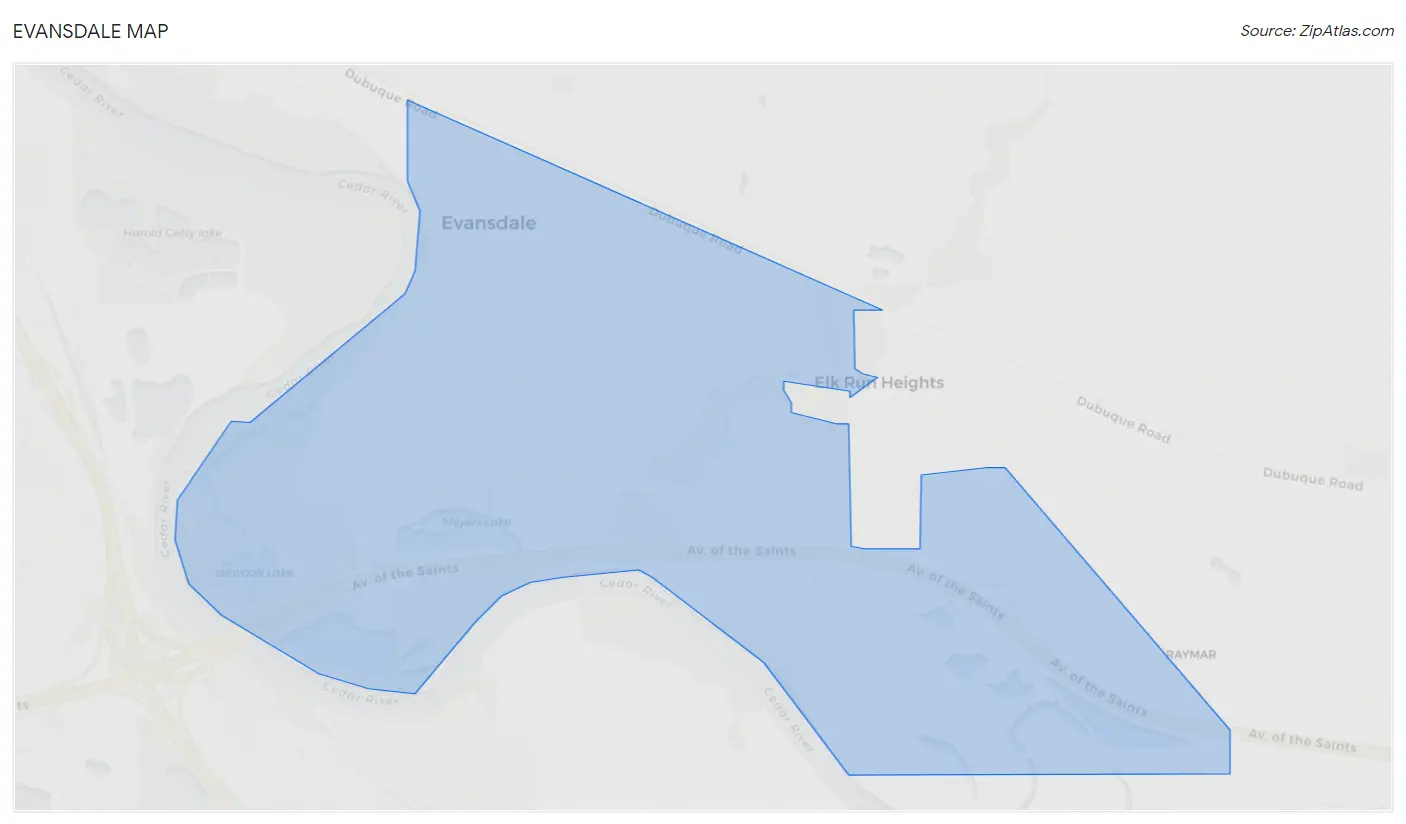
Evansdale Overview
$30,484
PER CAPITA INCOME
$61,367
AVG FAMILY INCOME
$54,575
AVG HOUSEHOLD INCOME
19.1%
WAGE / INCOME GAP [ % ]
80.9¢/ $1
WAGE / INCOME GAP [ $ ]
0.38
INEQUALITY / GINI INDEX
4,561
TOTAL POPULATION
2,322
MALE POPULATION
2,239
FEMALE POPULATION
103.71
MALES / 100 FEMALES
96.43
FEMALES / 100 MALES
40.3
MEDIAN AGE
2.9
AVG FAMILY SIZE
2.1
AVG HOUSEHOLD SIZE
2,705
LABOR FORCE [ PEOPLE ]
72.4%
PERCENT IN LABOR FORCE
7.9%
UNEMPLOYMENT RATE
Evansdale Zip Codes
Evansdale Area Codes
Income in Evansdale
Income Overview in Evansdale
Per Capita Income in Evansdale is $30,484, while median incomes of families and households are $61,367 and $54,575 respectively.
| Characteristic | Number | Measure |
| Per Capita Income | 4,561 | $30,484 |
| Median Family Income | 1,051 | $61,367 |
| Mean Family Income | 1,051 | $68,972 |
| Median Household Income | 2,166 | $54,575 |
| Mean Household Income | 2,166 | $63,990 |
| Income Deficit | 1,051 | $0 |
| Wage / Income Gap (%) | 4,561 | 19.07% |
| Wage / Income Gap ($) | 4,561 | 80.93¢ per $1 |
| Gini / Inequality Index | 4,561 | 0.38 |
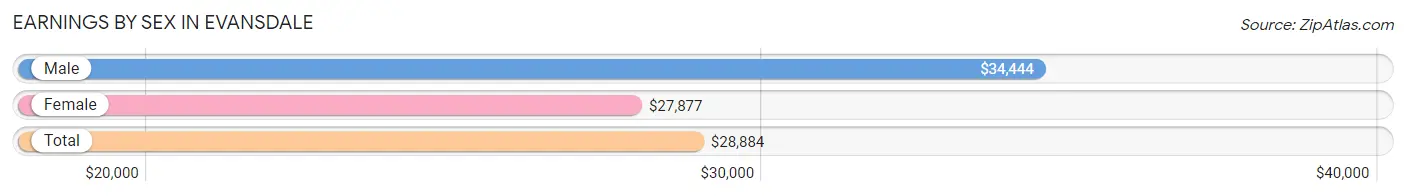
Earnings by Sex in Evansdale
Average Earnings in Evansdale are $28,884, $34,444 for men and $27,877 for women, a difference of 19.1%.
| Sex | Number | Average Earnings |
| Male | 1,492 (54.7%) | $34,444 |
| Female | 1,236 (45.3%) | $27,877 |
| Total | 2,728 (100.0%) | $28,884 |
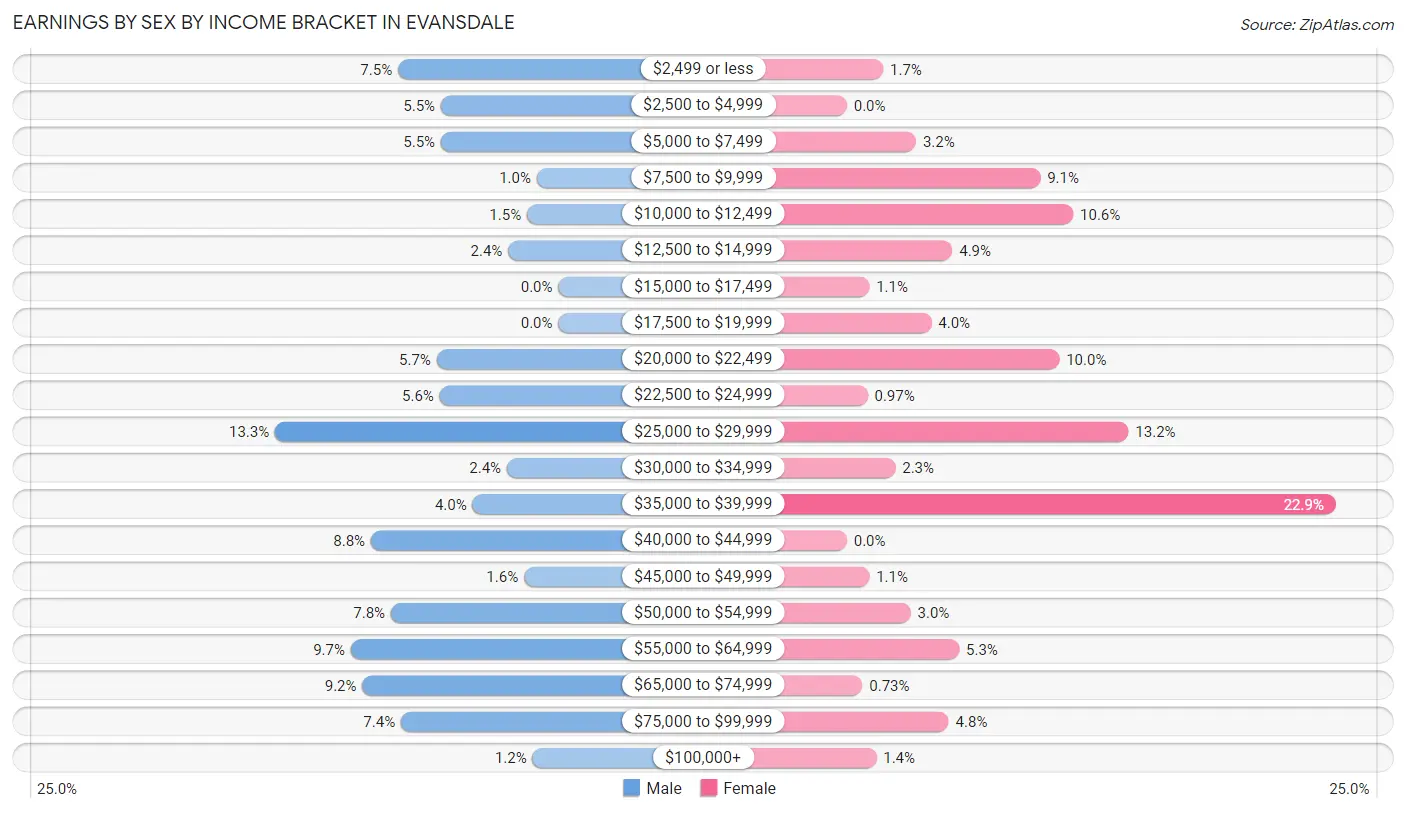
Earnings by Sex by Income Bracket in Evansdale
The most common earnings brackets in Evansdale are $25,000 to $29,999 for men (198 | 13.3%) and $35,000 to $39,999 for women (283 | 22.9%).
| Income | Male | Female |
| $2,499 or less | 112 (7.5%) | 21 (1.7%) |
| $2,500 to $4,999 | 82 (5.5%) | 0 (0.0%) |
| $5,000 to $7,499 | 82 (5.5%) | 40 (3.2%) |
| $7,500 to $9,999 | 15 (1.0%) | 112 (9.1%) |
| $10,000 to $12,499 | 22 (1.5%) | 131 (10.6%) |
| $12,500 to $14,999 | 35 (2.4%) | 61 (4.9%) |
| $15,000 to $17,499 | 0 (0.0%) | 13 (1.1%) |
| $17,500 to $19,999 | 0 (0.0%) | 49 (4.0%) |
| $20,000 to $22,499 | 85 (5.7%) | 123 (10.0%) |
| $22,500 to $24,999 | 83 (5.6%) | 12 (1.0%) |
| $25,000 to $29,999 | 198 (13.3%) | 163 (13.2%) |
| $30,000 to $34,999 | 36 (2.4%) | 28 (2.3%) |
| $35,000 to $39,999 | 60 (4.0%) | 283 (22.9%) |
| $40,000 to $44,999 | 131 (8.8%) | 0 (0.0%) |
| $45,000 to $49,999 | 24 (1.6%) | 13 (1.1%) |
| $50,000 to $54,999 | 117 (7.8%) | 37 (3.0%) |
| $55,000 to $64,999 | 145 (9.7%) | 65 (5.3%) |
| $65,000 to $74,999 | 137 (9.2%) | 9 (0.7%) |
| $75,000 to $99,999 | 110 (7.4%) | 59 (4.8%) |
| $100,000+ | 18 (1.2%) | 17 (1.4%) |
| Total | 1,492 (100.0%) | 1,236 (100.0%) |
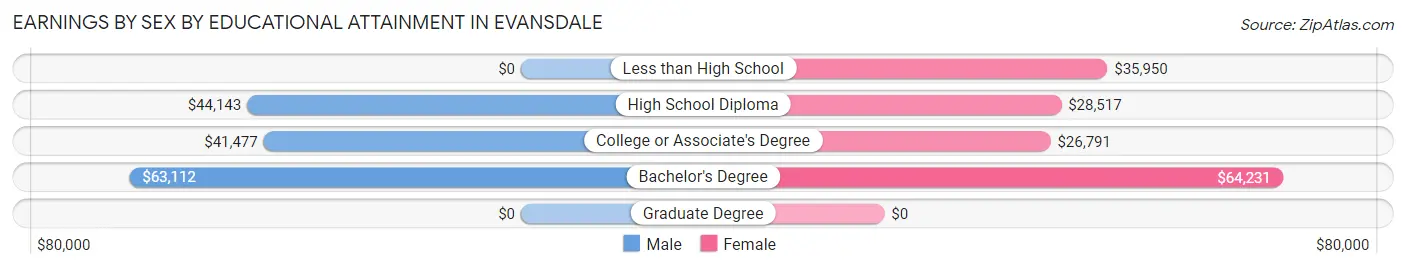
Earnings by Sex by Educational Attainment in Evansdale
Average earnings in Evansdale are $41,341 for men and $29,831 for women, a difference of 27.8%. Men with an educational attainment of bachelor's degree enjoy the highest average annual earnings of $63,112, while those with college or associate's degree education earn the least with $41,477. Women with an educational attainment of bachelor's degree earn the most with the average annual earnings of $64,231, while those with college or associate's degree education have the smallest earnings of $26,791.
| Educational Attainment | Male Income | Female Income |
| Less than High School | - | - |
| High School Diploma | $44,143 | $28,517 |
| College or Associate's Degree | $41,477 | $26,791 |
| Bachelor's Degree | $63,112 | $64,231 |
| Graduate Degree | - | - |
| Total | $41,341 | $29,831 |
Family Income in Evansdale
Family Income Brackets in Evansdale
According to the Evansdale family income data, there are 257 families falling into the $100,000 to $149,999 income range, which is the most common income bracket and makes up 24.4% of all families. Conversely, the $200,000+ income bracket is the least frequent group with only 17 families (1.6%) belonging to this category.
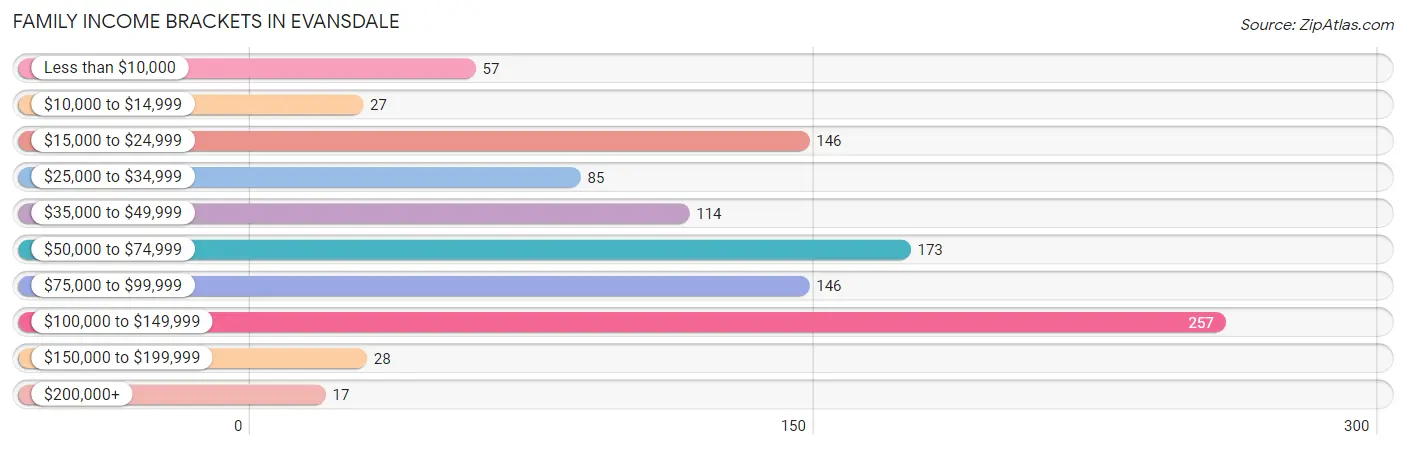
| Income Bracket | # Families | % Families |
| Less than $10,000 | 57 | 5.4% |
| $10,000 to $14,999 | 27 | 2.6% |
| $15,000 to $24,999 | 146 | 13.9% |
| $25,000 to $34,999 | 85 | 8.1% |
| $35,000 to $49,999 | 114 | 10.8% |
| $50,000 to $74,999 | 173 | 16.5% |
| $75,000 to $99,999 | 146 | 13.9% |
| $100,000 to $149,999 | 257 | 24.5% |
| $150,000 to $199,999 | 28 | 2.7% |
| $200,000+ | 17 | 1.6% |
Family Income by Famaliy Size in Evansdale
2-person families (557 | 53.0%) account for the highest median family income in Evansdale with $62,708 per family, while 2-person families (557 | 53.0%) have the highest median income of $31,354 per family member.
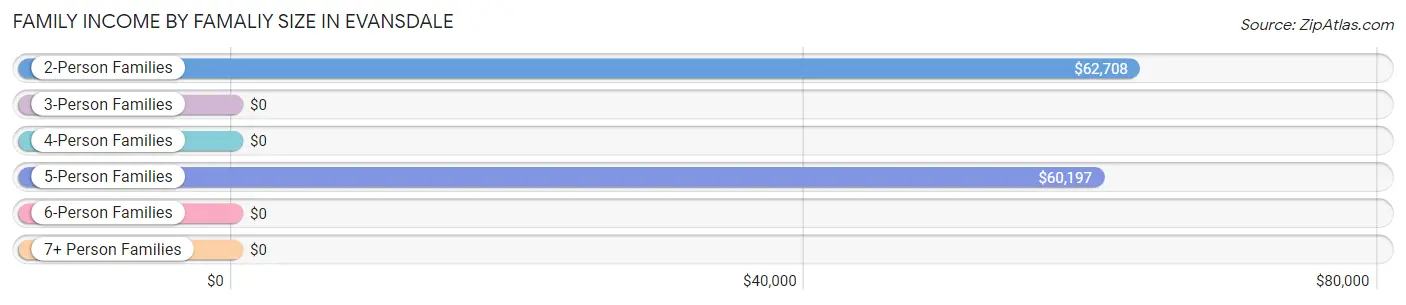
| Income Bracket | # Families | Median Income |
| 2-Person Families | 557 (53.0%) | $62,708 |
| 3-Person Families | 237 (22.6%) | $0 |
| 4-Person Families | 172 (16.4%) | $0 |
| 5-Person Families | 85 (8.1%) | $60,197 |
| 6-Person Families | 0 (0.0%) | $0 |
| 7+ Person Families | 0 (0.0%) | $0 |
| Total | 1,051 (100.0%) | $61,367 |
Family Income by Number of Earners in Evansdale
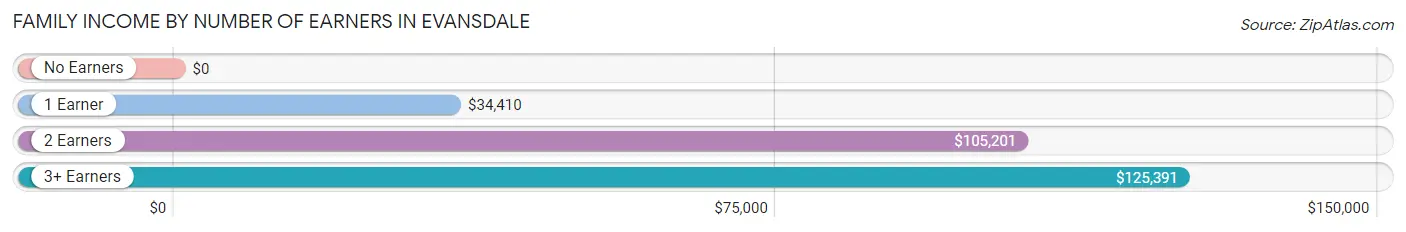
| Number of Earners | # Families | Median Income |
| No Earners | 148 (14.1%) | $0 |
| 1 Earner | 341 (32.5%) | $34,410 |
| 2 Earners | 427 (40.6%) | $105,201 |
| 3+ Earners | 135 (12.8%) | $125,391 |
| Total | 1,051 (100.0%) | $61,367 |
Household Income in Evansdale
Household Income Brackets in Evansdale
With 429 households falling in the category, the $50,000 to $74,999 income range is the most frequent in Evansdale, accounting for 19.8% of all households. In contrast, only 50 households (2.3%) fall into the $150,000 to $199,999 income bracket, making it the least populous group.
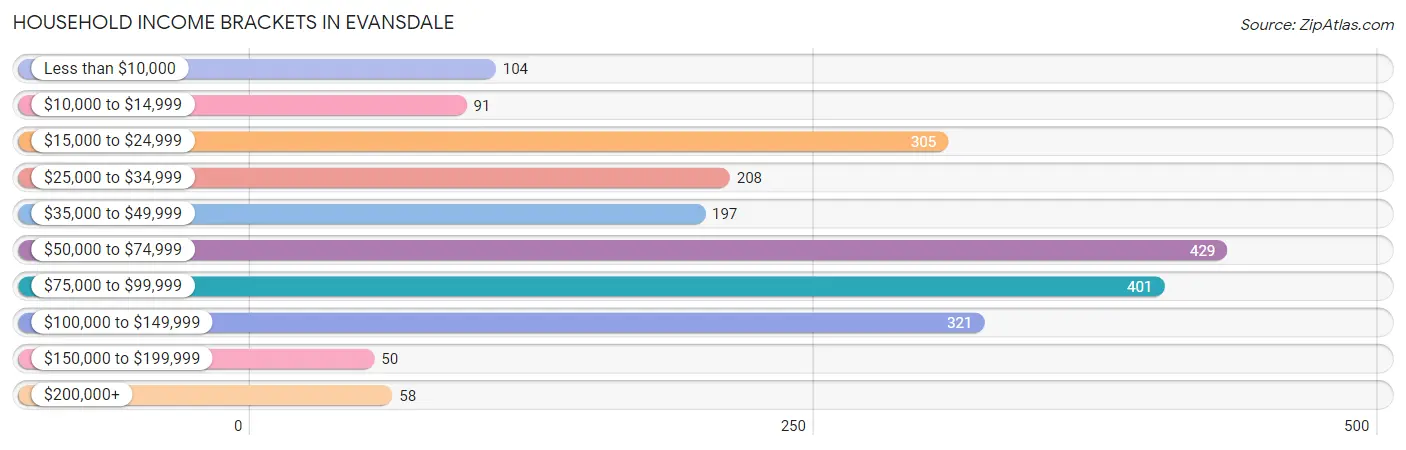
| Income Bracket | # Households | % Households |
| Less than $10,000 | 104 | 4.8% |
| $10,000 to $14,999 | 91 | 4.2% |
| $15,000 to $24,999 | 305 | 14.1% |
| $25,000 to $34,999 | 208 | 9.6% |
| $35,000 to $49,999 | 197 | 9.1% |
| $50,000 to $74,999 | 429 | 19.8% |
| $75,000 to $99,999 | 401 | 18.5% |
| $100,000 to $149,999 | 321 | 14.8% |
| $150,000 to $199,999 | 50 | 2.3% |
| $200,000+ | 58 | 2.7% |
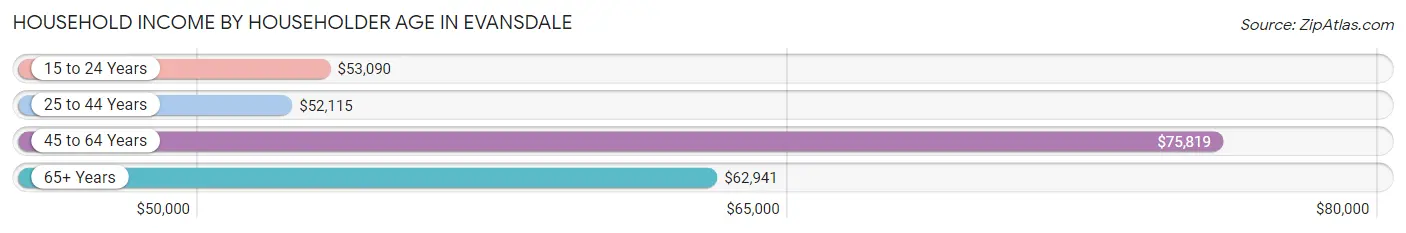
Household Income by Householder Age in Evansdale
The median household income in Evansdale is $54,575, with the highest median household income of $75,819 found in the 45 to 64 years age bracket for the primary householder. A total of 636 households (29.4%) fall into this category. Meanwhile, the 25 to 44 years age bracket for the primary householder has the lowest median household income of $52,115, with 674 households (31.1%) in this group.
| Income Bracket | # Households | Median Income |
| 15 to 24 Years | 136 (6.3%) | $53,090 |
| 25 to 44 Years | 674 (31.1%) | $52,115 |
| 45 to 64 Years | 636 (29.4%) | $75,819 |
| 65+ Years | 720 (33.2%) | $62,941 |
| Total | 2,166 (100.0%) | $54,575 |
Poverty in Evansdale
Income Below Poverty by Sex and Age in Evansdale
With 13.2% poverty level for males and 27.7% for females among the residents of Evansdale, 12 to 14 year old males and 18 to 24 year old females are the most vulnerable to poverty, with 102 males (54.8%) and 133 females (61.6%) in their respective age groups living below the poverty level.
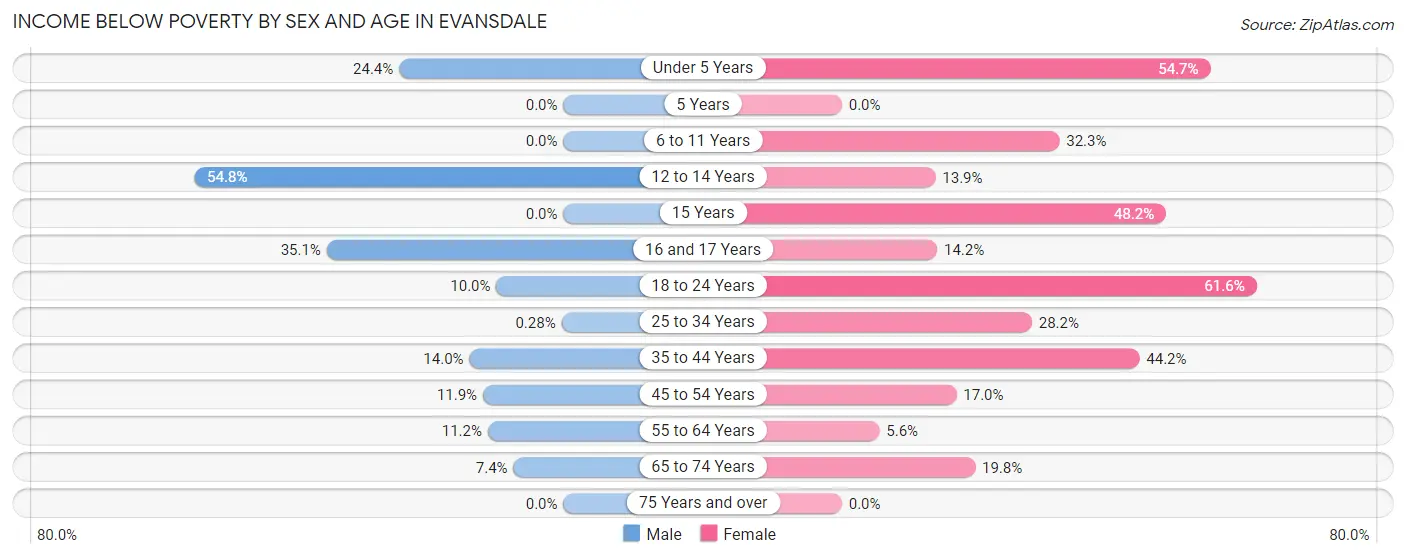
| Age Bracket | Male | Female |
| Under 5 Years | 10 (24.4%) | 58 (54.7%) |
| 5 Years | 0 (0.0%) | 0 (0.0%) |
| 6 to 11 Years | 0 (0.0%) | 83 (32.3%) |
| 12 to 14 Years | 102 (54.8%) | 10 (13.9%) |
| 15 Years | 0 (0.0%) | 13 (48.1%) |
| 16 and 17 Years | 39 (35.1%) | 15 (14.1%) |
| 18 to 24 Years | 22 (10.0%) | 133 (61.6%) |
| 25 to 34 Years | 1 (0.3%) | 55 (28.2%) |
| 35 to 44 Years | 36 (14.0%) | 114 (44.2%) |
| 45 to 54 Years | 40 (11.9%) | 49 (17.0%) |
| 55 to 64 Years | 33 (11.2%) | 15 (5.6%) |
| 65 to 74 Years | 24 (7.4%) | 72 (19.8%) |
| 75 Years and over | 0 (0.0%) | 0 (0.0%) |
| Total | 307 (13.2%) | 617 (27.7%) |
Income Above Poverty by Sex and Age in Evansdale
According to the poverty statistics in Evansdale, males aged 6 to 11 years and females aged 75 years and over are the age groups that are most secure financially, with 100.0% of males and 100.0% of females in these age groups living above the poverty line.
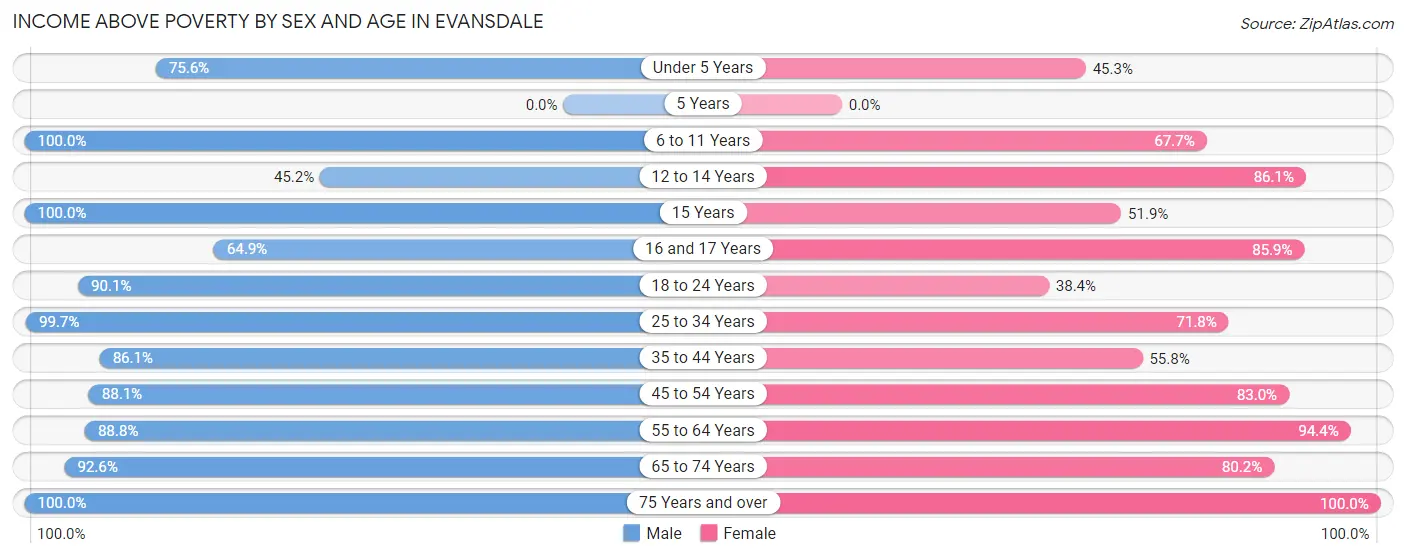
| Age Bracket | Male | Female |
| Under 5 Years | 31 (75.6%) | 48 (45.3%) |
| 5 Years | 0 (0.0%) | 0 (0.0%) |
| 6 to 11 Years | 67 (100.0%) | 174 (67.7%) |
| 12 to 14 Years | 84 (45.2%) | 62 (86.1%) |
| 15 Years | 56 (100.0%) | 14 (51.8%) |
| 16 and 17 Years | 72 (64.9%) | 91 (85.9%) |
| 18 to 24 Years | 199 (90.0%) | 83 (38.4%) |
| 25 to 34 Years | 350 (99.7%) | 140 (71.8%) |
| 35 to 44 Years | 222 (86.1%) | 144 (55.8%) |
| 45 to 54 Years | 295 (88.1%) | 239 (83.0%) |
| 55 to 64 Years | 261 (88.8%) | 254 (94.4%) |
| 65 to 74 Years | 300 (92.6%) | 292 (80.2%) |
| 75 Years and over | 78 (100.0%) | 68 (100.0%) |
| Total | 2,015 (86.8%) | 1,609 (72.3%) |
Income Below Poverty Among Married-Couple Families in Evansdale
The poverty statistics for married-couple families in Evansdale show that 4.0% or 21 of the total 521 families live below the poverty line. Families with 1 or 2 children have the highest poverty rate of 4.4%, comprising of 6 families. On the other hand, families with 3 or 4 children have the lowest poverty rate of 0.0%, which includes 0 families.
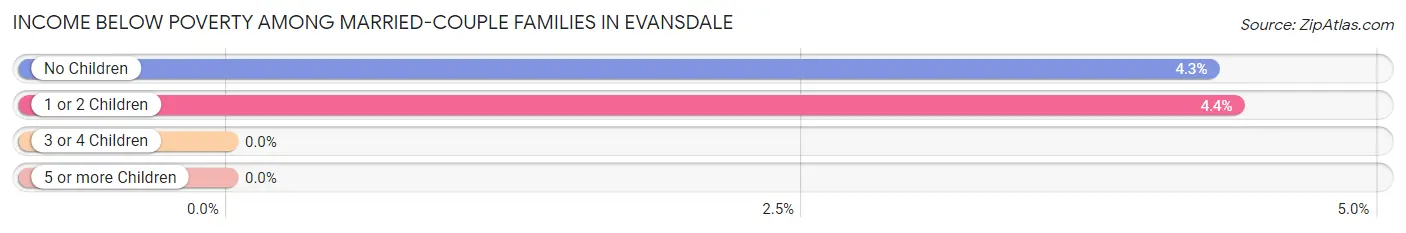
| Children | Above Poverty | Below Poverty |
| No Children | 336 (95.7%) | 15 (4.3%) |
| 1 or 2 Children | 131 (95.6%) | 6 (4.4%) |
| 3 or 4 Children | 33 (100.0%) | 0 (0.0%) |
| 5 or more Children | 0 (0.0%) | 0 (0.0%) |
| Total | 500 (96.0%) | 21 (4.0%) |
Income Below Poverty Among Single-Parent Households in Evansdale
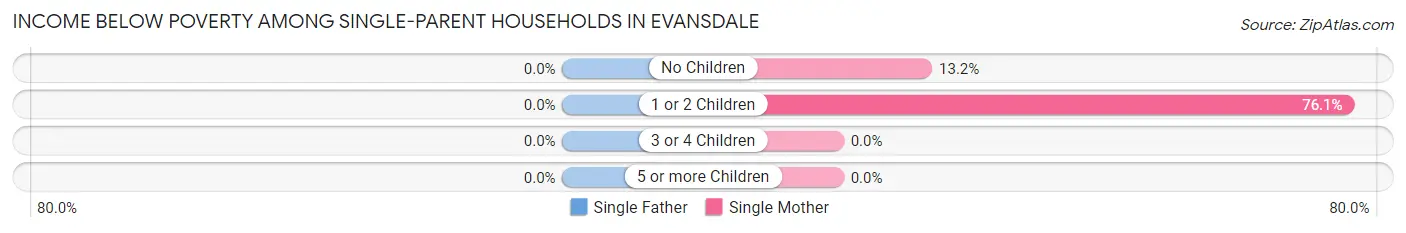
| Children | Single Father | Single Mother |
| No Children | 0 (0.0%) | 17 (13.2%) |
| 1 or 2 Children | 0 (0.0%) | 159 (76.1%) |
| 3 or 4 Children | 0 (0.0%) | 0 (0.0%) |
| 5 or more Children | 0 (0.0%) | 0 (0.0%) |
| Total | 0 (0.0%) | 176 (45.1%) |
Income Below Poverty Among Married-Couple vs Single-Parent Households in Evansdale
The poverty data for Evansdale shows that 21 of the married-couple family households (4.0%) and 176 of the single-parent households (33.2%) are living below the poverty level. Within the married-couple family households, those with 1 or 2 children have the highest poverty rate, with 6 households (4.4%) falling below the poverty line. Among the single-parent households, those with 1 or 2 children have the highest poverty rate, with 159 household (53.9%) living below poverty.
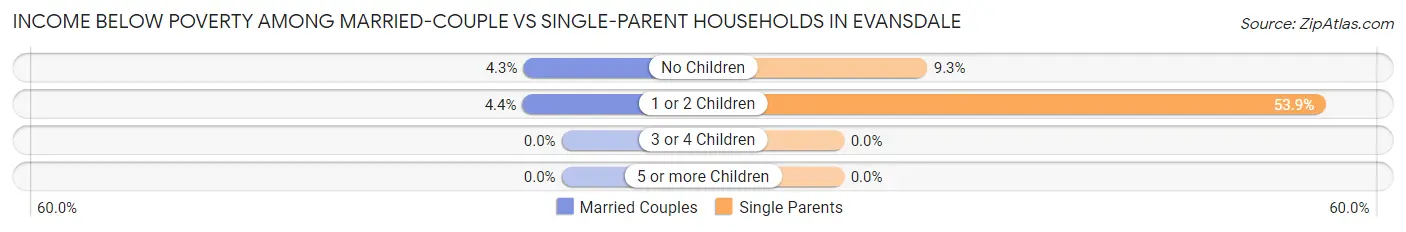
| Children | Married-Couple Families | Single-Parent Households |
| No Children | 15 (4.3%) | 17 (9.3%) |
| 1 or 2 Children | 6 (4.4%) | 159 (53.9%) |
| 3 or 4 Children | 0 (0.0%) | 0 (0.0%) |
| 5 or more Children | 0 (0.0%) | 0 (0.0%) |
| Total | 21 (4.0%) | 176 (33.2%) |
Race in Evansdale
The most populous races in Evansdale are White / Caucasian (4,094 | 89.8%), Black / African American (239 | 5.2%), and Two or more Races (221 | 4.9%).
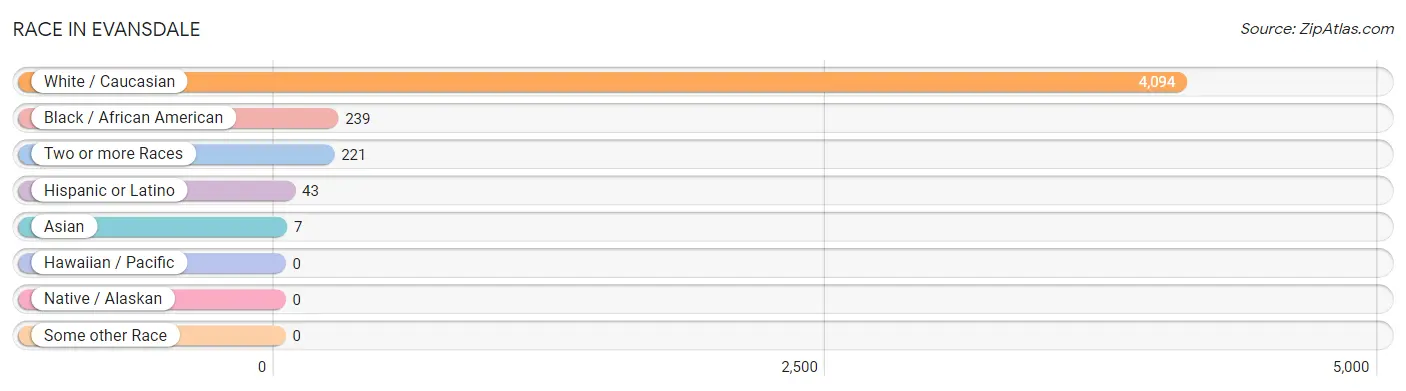
| Race | # Population | % Population |
| Asian | 7 | 0.2% |
| Black / African American | 239 | 5.2% |
| Hawaiian / Pacific | 0 | 0.0% |
| Hispanic or Latino | 43 | 0.9% |
| Native / Alaskan | 0 | 0.0% |
| White / Caucasian | 4,094 | 89.8% |
| Two or more Races | 221 | 4.9% |
| Some other Race | 0 | 0.0% |
| Total | 4,561 | 100.0% |
Ancestry in Evansdale
The most populous ancestries reported in Evansdale are German (1,499 | 32.9%), Irish (827 | 18.1%), English (372 | 8.2%), American (352 | 7.7%), and Norwegian (187 | 4.1%), together accounting for 71.0% of all Evansdale residents.
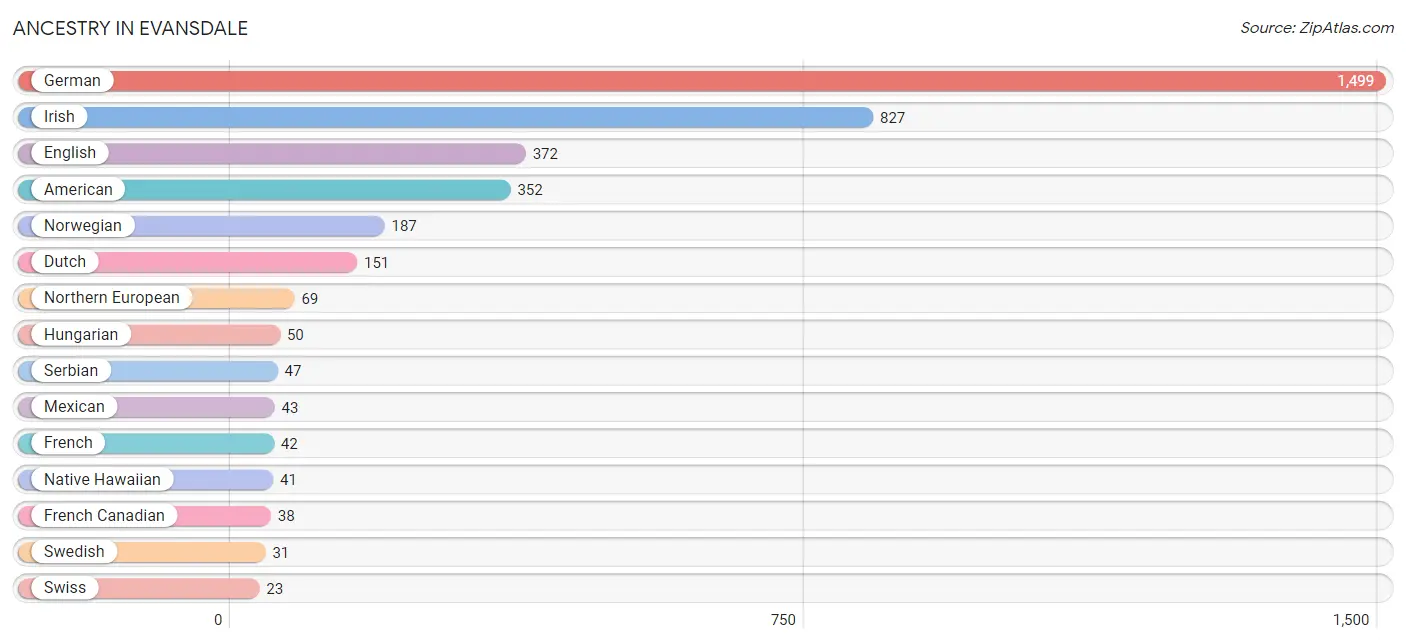
| Ancestry | # Population | % Population |
| American | 352 | 7.7% |
| Czech | 12 | 0.3% |
| Czechoslovakian | 22 | 0.5% |
| Dutch | 151 | 3.3% |
| English | 372 | 8.2% |
| European | 16 | 0.4% |
| French | 42 | 0.9% |
| French Canadian | 38 | 0.8% |
| German | 1,499 | 32.9% |
| Greek | 13 | 0.3% |
| Hungarian | 50 | 1.1% |
| Irish | 827 | 18.1% |
| Italian | 13 | 0.3% |
| Mexican | 43 | 0.9% |
| Native Hawaiian | 41 | 0.9% |
| Northern European | 69 | 1.5% |
| Norwegian | 187 | 4.1% |
| Polish | 18 | 0.4% |
| Scottish | 16 | 0.4% |
| Serbian | 47 | 1.0% |
| Sioux | 14 | 0.3% |
| Swedish | 31 | 0.7% |
| Swiss | 23 | 0.5% |
| Welsh | 13 | 0.3% | View All 24 Rows |
Immigrants in Evansdale

| Immigration Origin | # Population | % Population | View All 0 Rows |
Sex and Age in Evansdale
Sex and Age in Evansdale
The most populous age groups in Evansdale are 25 to 29 Years (293 | 12.6%) for men and 70 to 74 Years (207 | 9.2%) for women.
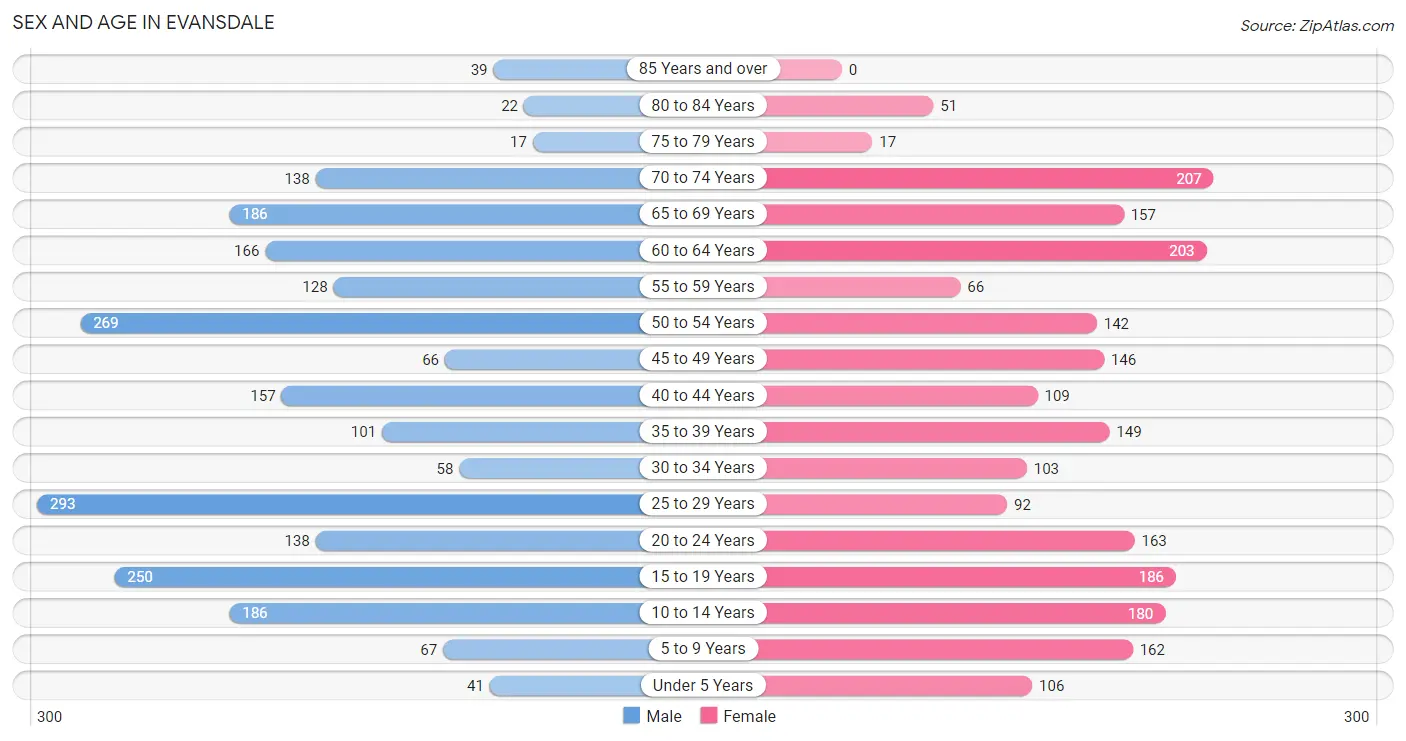
| Age Bracket | Male | Female |
| Under 5 Years | 41 (1.8%) | 106 (4.7%) |
| 5 to 9 Years | 67 (2.9%) | 162 (7.2%) |
| 10 to 14 Years | 186 (8.0%) | 180 (8.0%) |
| 15 to 19 Years | 250 (10.8%) | 186 (8.3%) |
| 20 to 24 Years | 138 (5.9%) | 163 (7.3%) |
| 25 to 29 Years | 293 (12.6%) | 92 (4.1%) |
| 30 to 34 Years | 58 (2.5%) | 103 (4.6%) |
| 35 to 39 Years | 101 (4.3%) | 149 (6.7%) |
| 40 to 44 Years | 157 (6.8%) | 109 (4.9%) |
| 45 to 49 Years | 66 (2.8%) | 146 (6.5%) |
| 50 to 54 Years | 269 (11.6%) | 142 (6.3%) |
| 55 to 59 Years | 128 (5.5%) | 66 (2.9%) |
| 60 to 64 Years | 166 (7.1%) | 203 (9.1%) |
| 65 to 69 Years | 186 (8.0%) | 157 (7.0%) |
| 70 to 74 Years | 138 (5.9%) | 207 (9.2%) |
| 75 to 79 Years | 17 (0.7%) | 17 (0.8%) |
| 80 to 84 Years | 22 (0.9%) | 51 (2.3%) |
| 85 Years and over | 39 (1.7%) | 0 (0.0%) |
| Total | 2,322 (100.0%) | 2,239 (100.0%) |
Families and Households in Evansdale
Median Family Size in Evansdale
The median family size in Evansdale is 2.87 persons per family, with single female/mother families (390 | 37.1%) accounting for the largest median family size of 2.97 persons per family. On the other hand, single male/father families (140 | 13.3%) represent the smallest median family size with 2.28 persons per family.
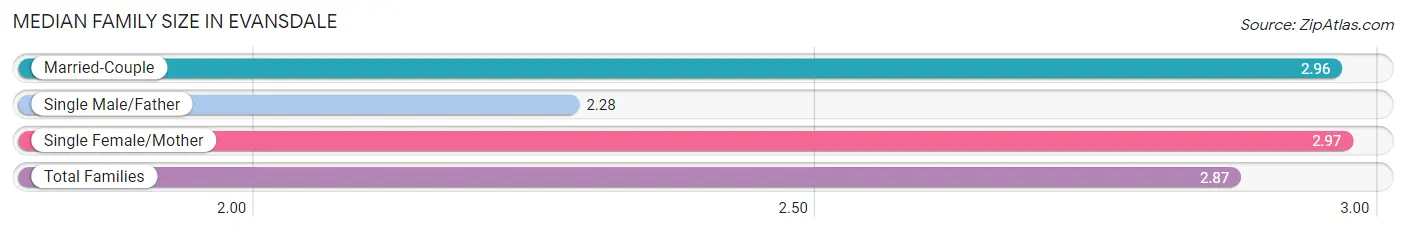
| Family Type | # Families | Family Size |
| Married-Couple | 521 (49.6%) | 2.96 |
| Single Male/Father | 140 (13.3%) | 2.28 |
| Single Female/Mother | 390 (37.1%) | 2.97 |
| Total Families | 1,051 (100.0%) | 2.87 |
Median Household Size in Evansdale
The median household size in Evansdale is 2.10 persons per household, with single female/mother households (390 | 18.0%) accounting for the largest median household size of 3.32 persons per household. non-family households (1,115 | 51.5%) represent the smallest median household size with 1.24 persons per household.
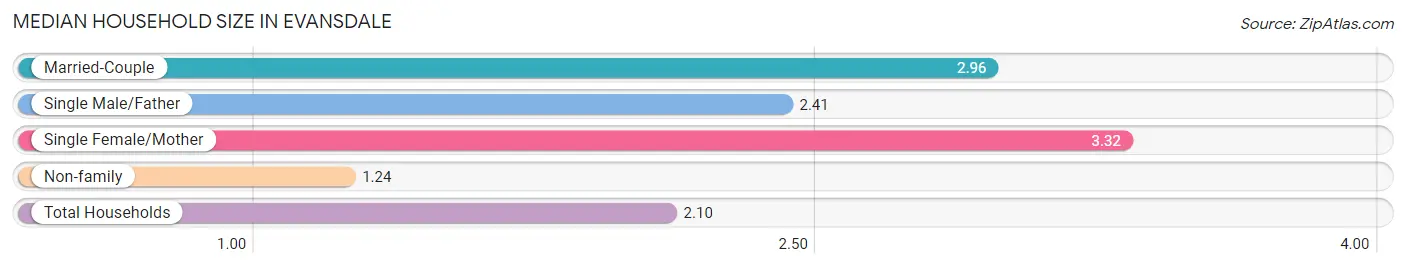
| Household Type | # Households | Household Size |
| Married-Couple | 521 (24.0%) | 2.96 |
| Single Male/Father | 140 (6.5%) | 2.41 |
| Single Female/Mother | 390 (18.0%) | 3.32 |
| Non-family | 1,115 (51.5%) | 1.24 |
| Total Households | 2,166 (100.0%) | 2.10 |
Household Size by Marriage Status in Evansdale
Out of a total of 2,166 households in Evansdale, 1,051 (48.5%) are family households, while 1,115 (51.5%) are nonfamily households. The most numerous type of family households are 2-person households, comprising 521, and the most common type of nonfamily households are 1-person households, comprising 905.
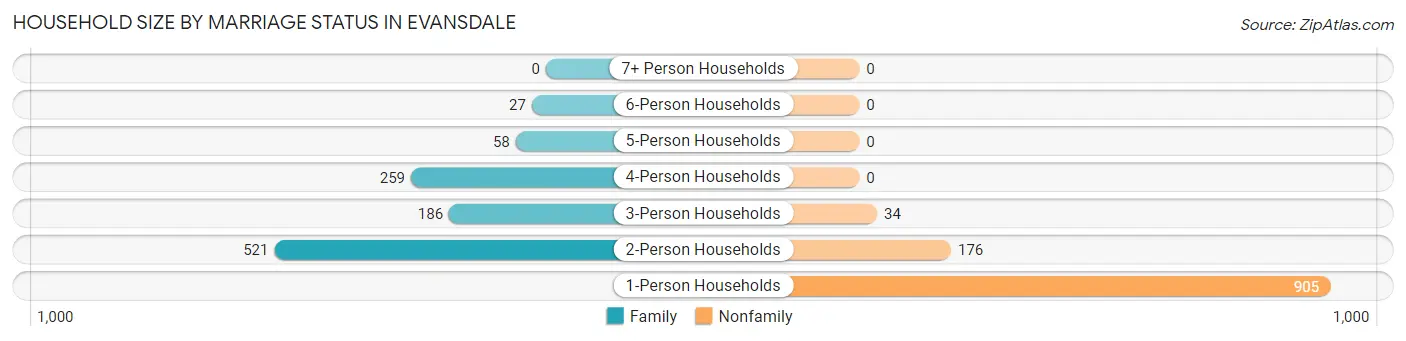
| Household Size | Family Households | Nonfamily Households |
| 1-Person Households | - | 905 (41.8%) |
| 2-Person Households | 521 (24.0%) | 176 (8.1%) |
| 3-Person Households | 186 (8.6%) | 34 (1.6%) |
| 4-Person Households | 259 (12.0%) | 0 (0.0%) |
| 5-Person Households | 58 (2.7%) | 0 (0.0%) |
| 6-Person Households | 27 (1.3%) | 0 (0.0%) |
| 7+ Person Households | 0 (0.0%) | 0 (0.0%) |
| Total | 1,051 (48.5%) | 1,115 (51.5%) |
Female Fertility in Evansdale
Fertility by Age in Evansdale
Average fertility rate in Evansdale is 70.0 births per 1,000 women. Women in the age bracket of 35 to 50 years have the highest fertility rate with 94.0 births per 1,000 women. Women in the age bracket of 35 to 50 years acount for 62.5% of all women with births.
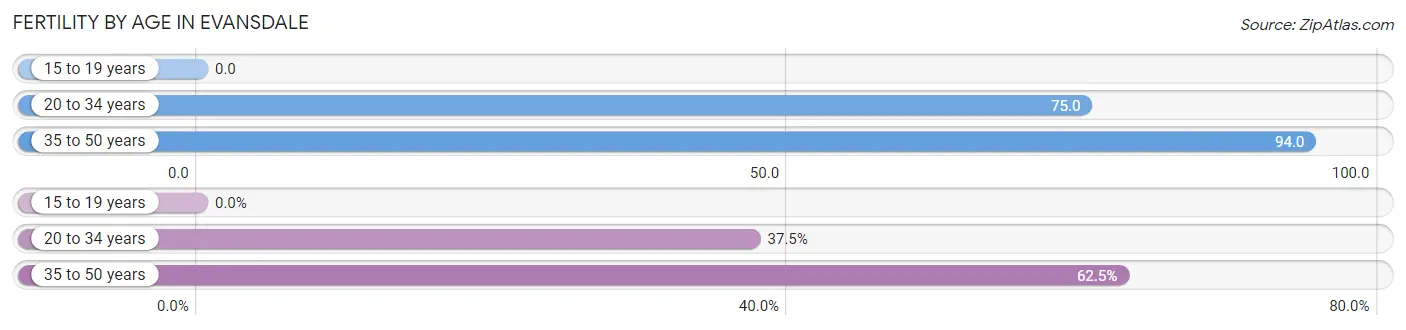
| Age Bracket | Women with Births | Births / 1,000 Women |
| 15 to 19 years | 0 (0.0%) | 0.0 |
| 20 to 34 years | 27 (37.5%) | 75.0 |
| 35 to 50 years | 45 (62.5%) | 94.0 |
| Total | 72 (100.0%) | 70.0 |
Fertility by Age by Marriage Status in Evansdale
31.9% of women with births (72) in Evansdale are married. The highest percentage of unmarried women with births falls into 20 to 34 years age bracket with 100.0% of them unmarried at the time of birth, while the lowest percentage of unmarried women with births belong to 35 to 50 years age bracket with 48.9% of them unmarried.
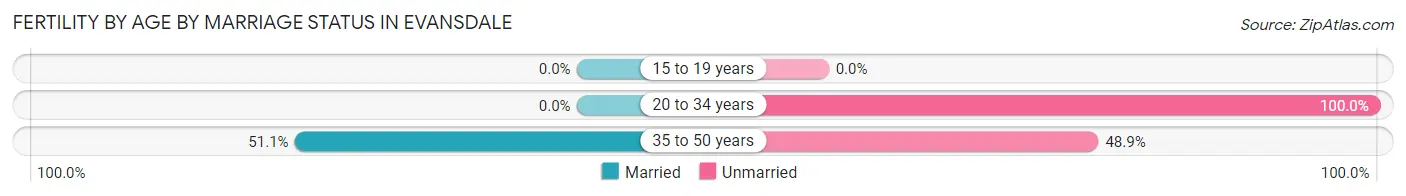
| Age Bracket | Married | Unmarried |
| 15 to 19 years | 0 (0.0%) | 0 (0.0%) |
| 20 to 34 years | 0 (0.0%) | 27 (100.0%) |
| 35 to 50 years | 23 (51.1%) | 22 (48.9%) |
| Total | 23 (31.9%) | 49 (68.1%) |
Fertility by Education in Evansdale
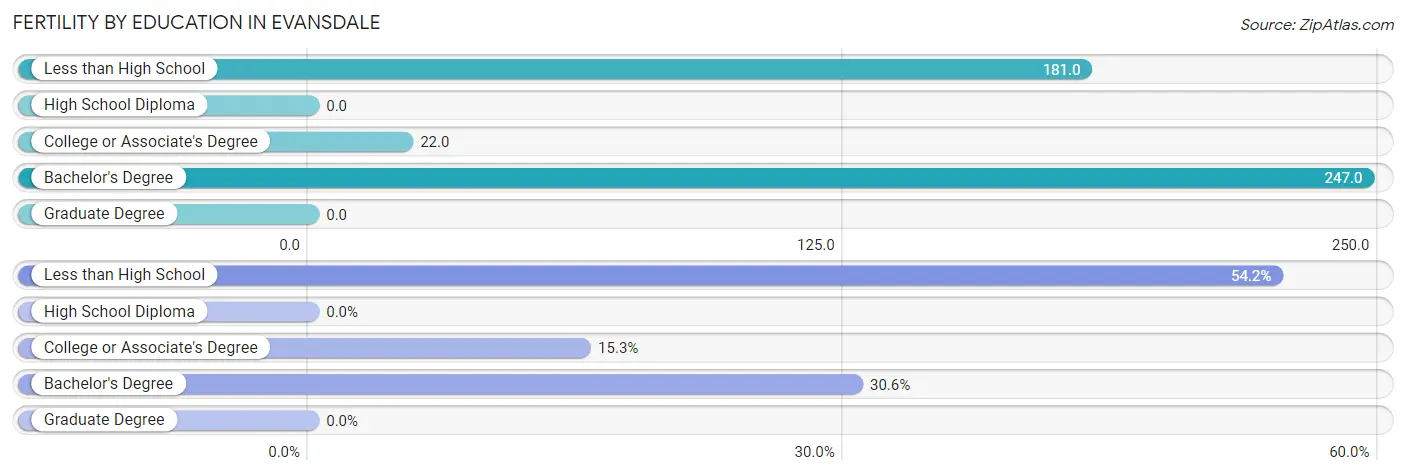
| Educational Attainment | Women with Births | Births / 1,000 Women |
| Less than High School | 39 (54.2%) | 181.0 |
| High School Diploma | 0 (0.0%) | 0.0 |
| College or Associate's Degree | 11 (15.3%) | 22.0 |
| Bachelor's Degree | 22 (30.6%) | 247.0 |
| Graduate Degree | 0 (0.0%) | 0.0 |
| Total | 72 (100.0%) | 70.0 |
Fertility by Education by Marriage Status in Evansdale
68.1% of women with births in Evansdale are unmarried. Women with the educational attainment of college or associate's degree are most likely to be married with 100.0% of them married at childbirth, while women with the educational attainment of bachelor's degree are least likely to be married with 100.0% of them unmarried at childbirth.
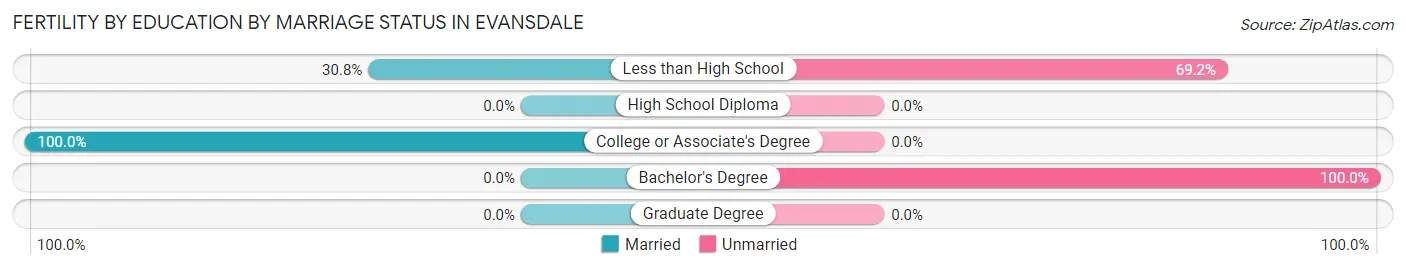
| Educational Attainment | Married | Unmarried |
| Less than High School | 12 (30.8%) | 27 (69.2%) |
| High School Diploma | 0 (0.0%) | 0 (0.0%) |
| College or Associate's Degree | 11 (100.0%) | 0 (0.0%) |
| Bachelor's Degree | 0 (0.0%) | 22 (100.0%) |
| Graduate Degree | 0 (0.0%) | 0 (0.0%) |
| Total | 23 (31.9%) | 49 (68.1%) |
Employment Characteristics in Evansdale
Employment by Class of Employer in Evansdale
Among the 2,453 employed individuals in Evansdale, private company employees (1,876 | 76.5%), not-for-profit organizations (234 | 9.5%), and self-employed (incorporated) (85 | 3.5%) make up the most common classes of employment.
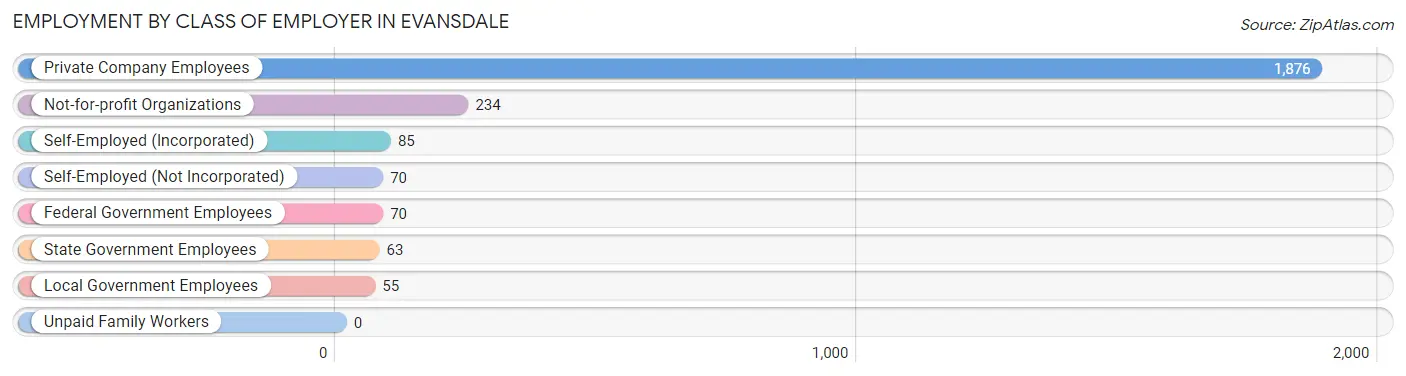
| Employer Class | # Employees | % Employees |
| Private Company Employees | 1,876 | 76.5% |
| Self-Employed (Incorporated) | 85 | 3.5% |
| Self-Employed (Not Incorporated) | 70 | 2.9% |
| Not-for-profit Organizations | 234 | 9.5% |
| Local Government Employees | 55 | 2.2% |
| State Government Employees | 63 | 2.6% |
| Federal Government Employees | 70 | 2.9% |
| Unpaid Family Workers | 0 | 0.0% |
| Total | 2,453 | 100.0% |
Employment Status by Age in Evansdale
According to the labor force statistics for Evansdale, out of the total population over 16 years of age (3,736), 72.4% or 2,705 individuals are in the labor force, with 7.9% or 214 of them unemployed. The age group with the highest labor force participation rate is 25 to 29 years, with 99.7% or 384 individuals in the labor force. Within the labor force, the 65 to 74 years age range has the highest percentage of unemployed individuals, with 44.9% or 129 of them being unemployed.
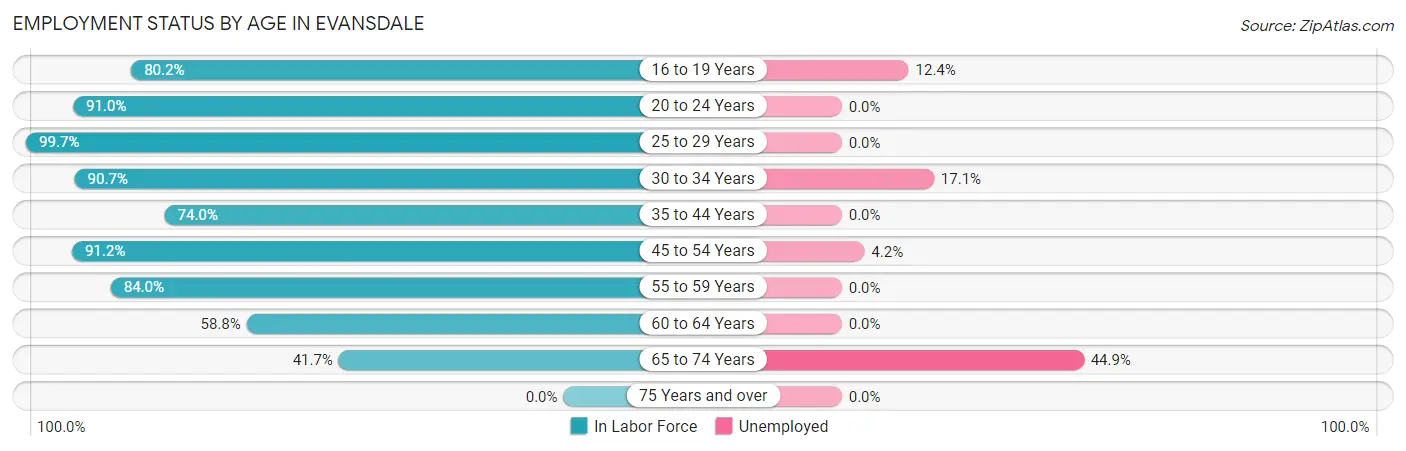
| Age Bracket | In Labor Force | Unemployed |
| 16 to 19 Years | 283 (80.2%) | 35 (12.4%) |
| 20 to 24 Years | 274 (91.0%) | 0 (0.0%) |
| 25 to 29 Years | 384 (99.7%) | 0 (0.0%) |
| 30 to 34 Years | 146 (90.7%) | 25 (17.1%) |
| 35 to 44 Years | 382 (74.0%) | 0 (0.0%) |
| 45 to 54 Years | 568 (91.2%) | 24 (4.2%) |
| 55 to 59 Years | 163 (84.0%) | 0 (0.0%) |
| 60 to 64 Years | 217 (58.8%) | 0 (0.0%) |
| 65 to 74 Years | 287 (41.7%) | 129 (44.9%) |
| 75 Years and over | 0 (0.0%) | 0 (0.0%) |
| Total | 2,705 (72.4%) | 214 (7.9%) |
Employment Status by Educational Attainment in Evansdale
According to labor force statistics for Evansdale, 82.7% of individuals (1,859) out of the total population between 25 and 64 years of age (2,248) are in the labor force, with 2.6% or 48 of them being unemployed. The group with the highest labor force participation rate are those with the educational attainment of high school diploma, with 85.7% or 744 individuals in the labor force. Within the labor force, individuals with high school diploma education have the highest percentage of unemployment, with 3.2% or 24 of them being unemployed.
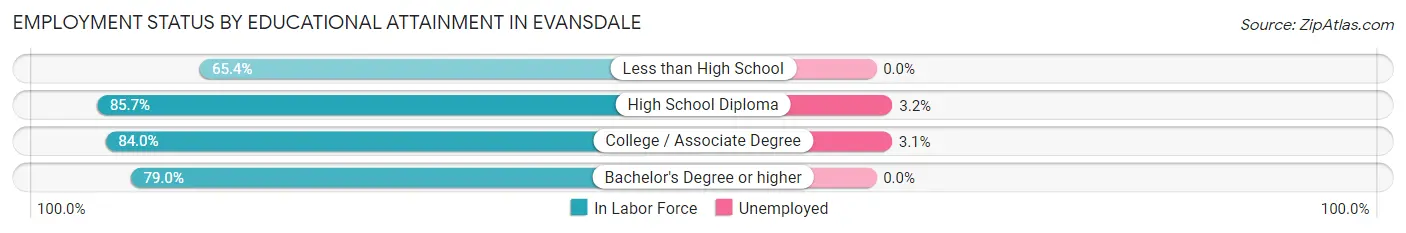
| Educational Attainment | In Labor Force | Unemployed |
| Less than High School | 106 (65.4%) | 0 (0.0%) |
| High School Diploma | 744 (85.7%) | 28 (3.2%) |
| College / Associate Degree | 795 (84.0%) | 29 (3.1%) |
| Bachelor's Degree or higher | 215 (79.0%) | 0 (0.0%) |
| Total | 1,859 (82.7%) | 58 (2.6%) |
Employment Occupations by Sex in Evansdale
Management, Business, Science and Arts Occupations
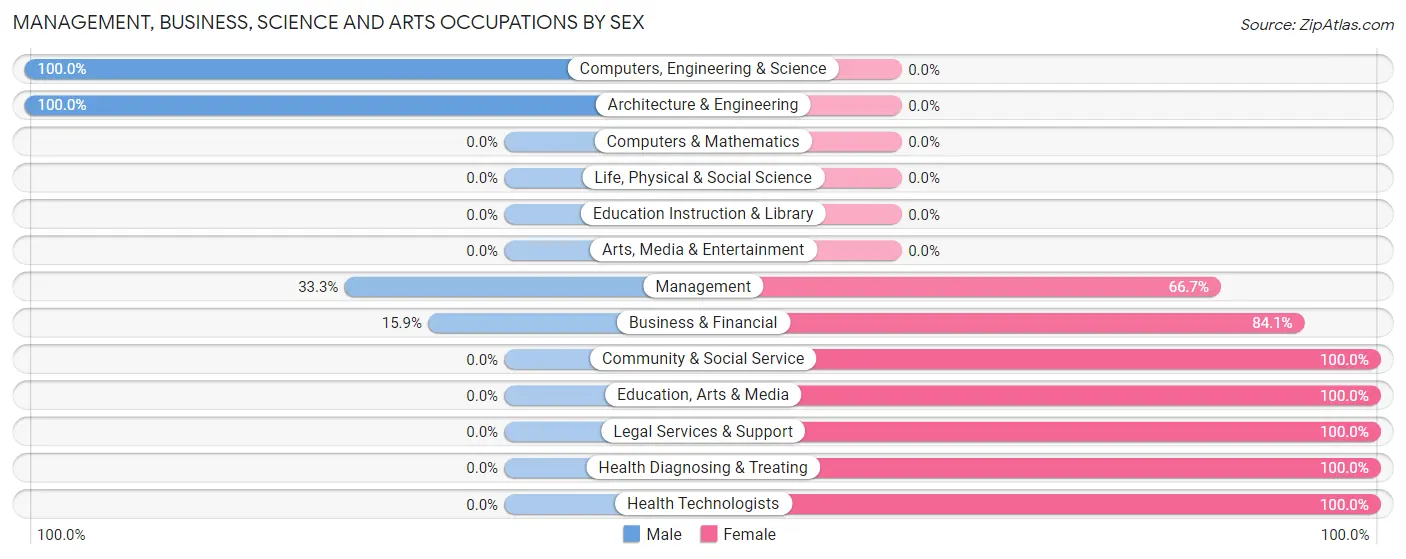
The most common Management, Business, Science and Arts occupations in Evansdale are Business & Financial (107 | 4.3%), Health Diagnosing & Treating (64 | 2.6%), Management (48 | 1.9%), Community & Social Service (47 | 1.9%), and Health Technologists (44 | 1.8%).
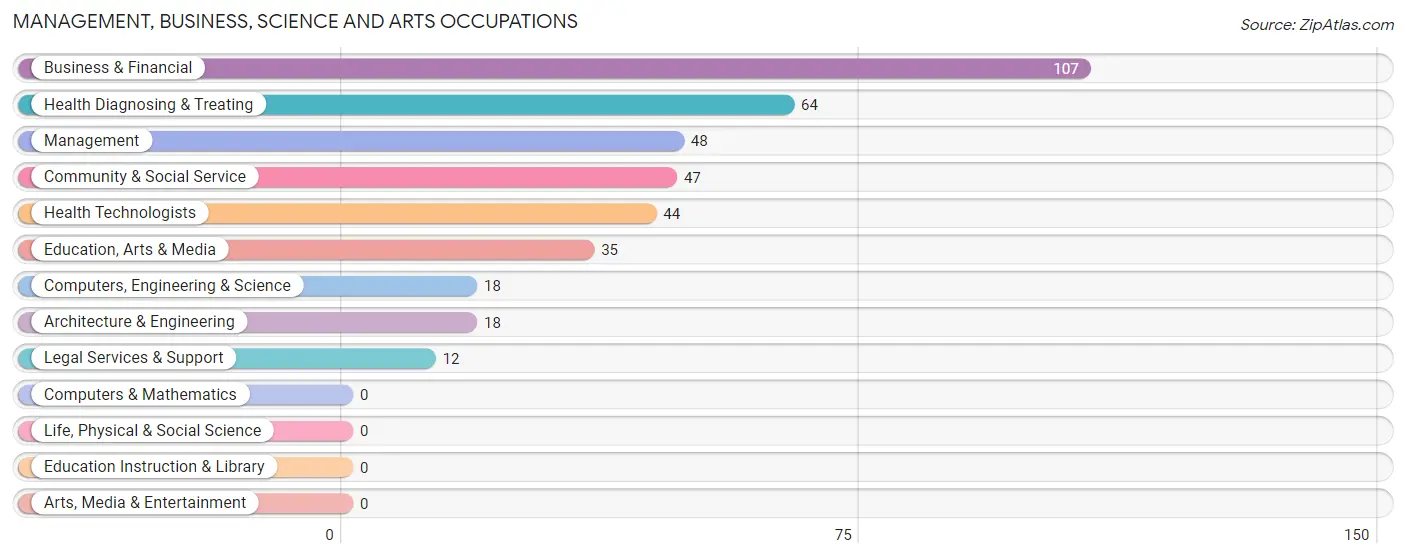
Management, Business, Science and Arts Occupations by Sex
Within the Management, Business, Science and Arts occupations in Evansdale, the most male-oriented occupations are Computers, Engineering & Science (100.0%), Architecture & Engineering (100.0%), and Management (33.3%), while the most female-oriented occupations are Community & Social Service (100.0%), Education, Arts & Media (100.0%), and Legal Services & Support (100.0%).
| Occupation | Male | Female |
| Management | 16 (33.3%) | 32 (66.7%) |
| Business & Financial | 17 (15.9%) | 90 (84.1%) |
| Computers, Engineering & Science | 18 (100.0%) | 0 (0.0%) |
| Computers & Mathematics | 0 (0.0%) | 0 (0.0%) |
| Architecture & Engineering | 18 (100.0%) | 0 (0.0%) |
| Life, Physical & Social Science | 0 (0.0%) | 0 (0.0%) |
| Community & Social Service | 0 (0.0%) | 47 (100.0%) |
| Education, Arts & Media | 0 (0.0%) | 35 (100.0%) |
| Legal Services & Support | 0 (0.0%) | 12 (100.0%) |
| Education Instruction & Library | 0 (0.0%) | 0 (0.0%) |
| Arts, Media & Entertainment | 0 (0.0%) | 0 (0.0%) |
| Health Diagnosing & Treating | 0 (0.0%) | 64 (100.0%) |
| Health Technologists | 0 (0.0%) | 44 (100.0%) |
| Total (Category) | 51 (18.0%) | 233 (82.0%) |
| Total (Overall) | 1,422 (57.1%) | 1,069 (42.9%) |
Services Occupations
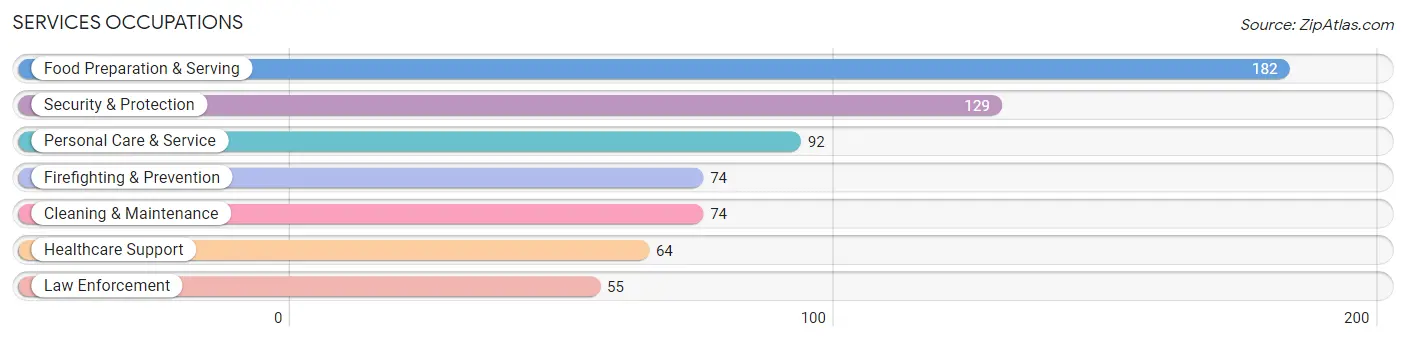
The most common Services occupations in Evansdale are Food Preparation & Serving (182 | 7.3%), Security & Protection (129 | 5.2%), Personal Care & Service (92 | 3.7%), Firefighting & Prevention (74 | 3.0%), and Cleaning & Maintenance (74 | 3.0%).
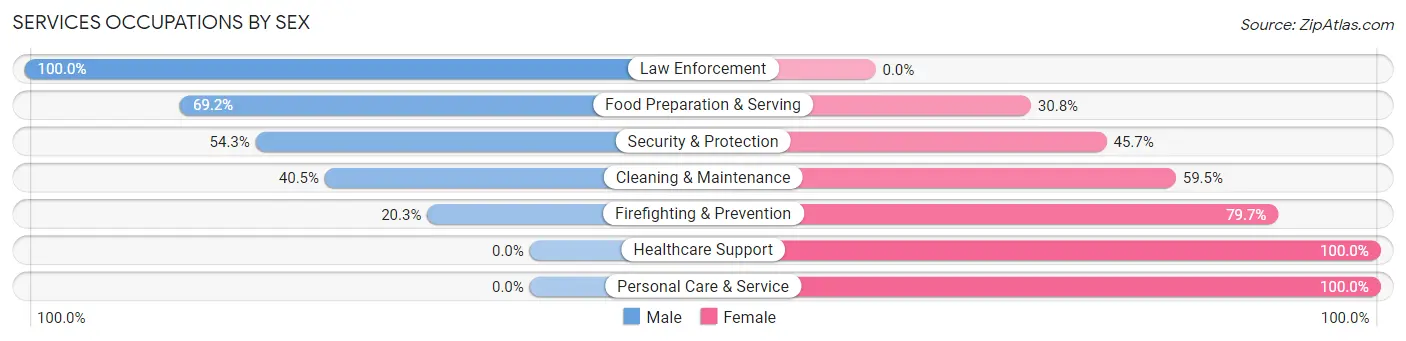
Services Occupations by Sex
Within the Services occupations in Evansdale, the most male-oriented occupations are Law Enforcement (100.0%), Food Preparation & Serving (69.2%), and Security & Protection (54.3%), while the most female-oriented occupations are Healthcare Support (100.0%), Personal Care & Service (100.0%), and Firefighting & Prevention (79.7%).
| Occupation | Male | Female |
| Healthcare Support | 0 (0.0%) | 64 (100.0%) |
| Security & Protection | 70 (54.3%) | 59 (45.7%) |
| Firefighting & Prevention | 15 (20.3%) | 59 (79.7%) |
| Law Enforcement | 55 (100.0%) | 0 (0.0%) |
| Food Preparation & Serving | 126 (69.2%) | 56 (30.8%) |
| Cleaning & Maintenance | 30 (40.5%) | 44 (59.5%) |
| Personal Care & Service | 0 (0.0%) | 92 (100.0%) |
| Total (Category) | 226 (41.8%) | 315 (58.2%) |
| Total (Overall) | 1,422 (57.1%) | 1,069 (42.9%) |
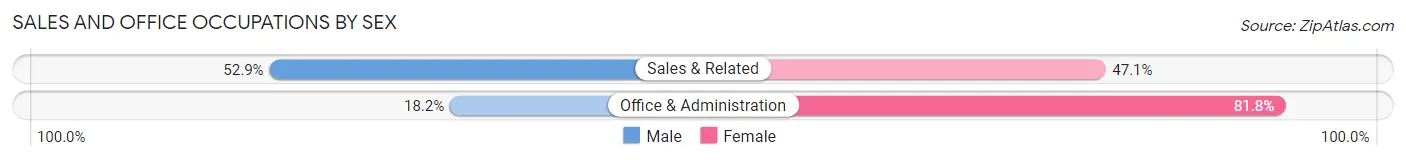
Sales and Office Occupations
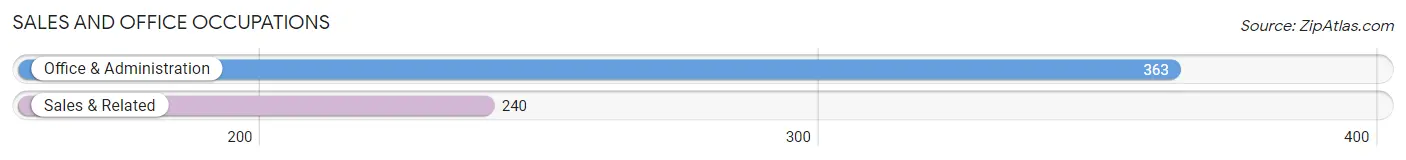
The most common Sales and Office occupations in Evansdale are Office & Administration (363 | 14.6%), and Sales & Related (240 | 9.6%).
Sales and Office Occupations by Sex
| Occupation | Male | Female |
| Sales & Related | 127 (52.9%) | 113 (47.1%) |
| Office & Administration | 66 (18.2%) | 297 (81.8%) |
| Total (Category) | 193 (32.0%) | 410 (68.0%) |
| Total (Overall) | 1,422 (57.1%) | 1,069 (42.9%) |
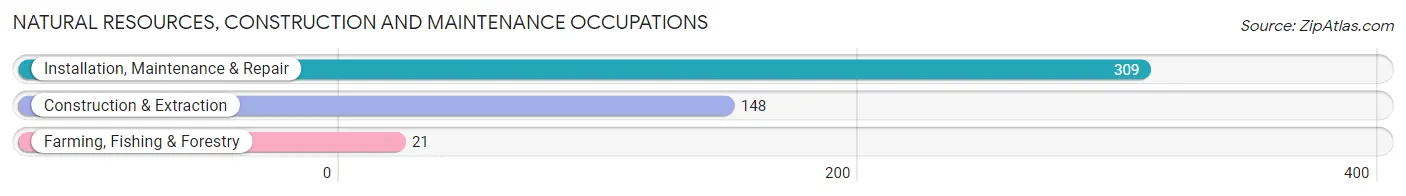
Natural Resources, Construction and Maintenance Occupations
The most common Natural Resources, Construction and Maintenance occupations in Evansdale are Installation, Maintenance & Repair (309 | 12.4%), Construction & Extraction (148 | 5.9%), and Farming, Fishing & Forestry (21 | 0.8%).
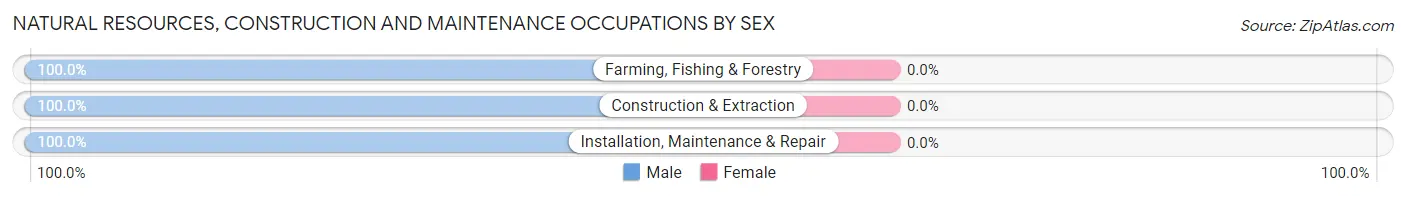
Natural Resources, Construction and Maintenance Occupations by Sex
| Occupation | Male | Female |
| Farming, Fishing & Forestry | 21 (100.0%) | 0 (0.0%) |
| Construction & Extraction | 148 (100.0%) | 0 (0.0%) |
| Installation, Maintenance & Repair | 309 (100.0%) | 0 (0.0%) |
| Total (Category) | 478 (100.0%) | 0 (0.0%) |
| Total (Overall) | 1,422 (57.1%) | 1,069 (42.9%) |
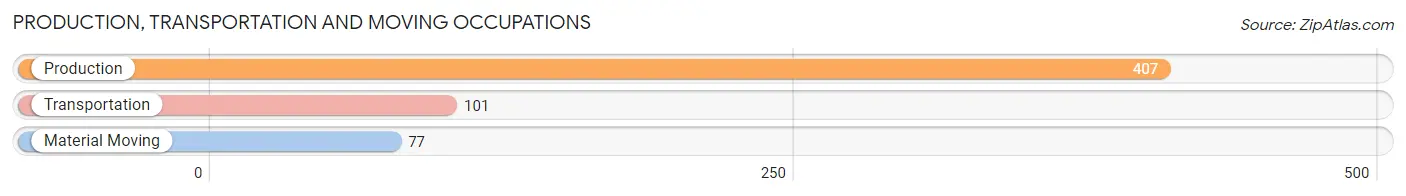
Production, Transportation and Moving Occupations
The most common Production, Transportation and Moving occupations in Evansdale are Production (407 | 16.3%), Transportation (101 | 4.1%), and Material Moving (77 | 3.1%).
Production, Transportation and Moving Occupations by Sex
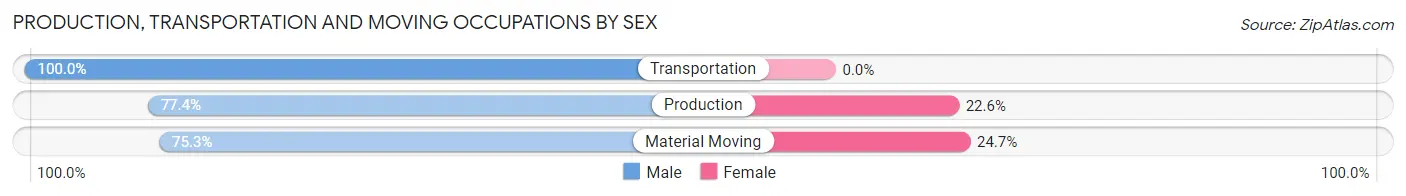
| Occupation | Male | Female |
| Production | 315 (77.4%) | 92 (22.6%) |
| Transportation | 101 (100.0%) | 0 (0.0%) |
| Material Moving | 58 (75.3%) | 19 (24.7%) |
| Total (Category) | 474 (81.0%) | 111 (19.0%) |
| Total (Overall) | 1,422 (57.1%) | 1,069 (42.9%) |
Employment Industries by Sex in Evansdale
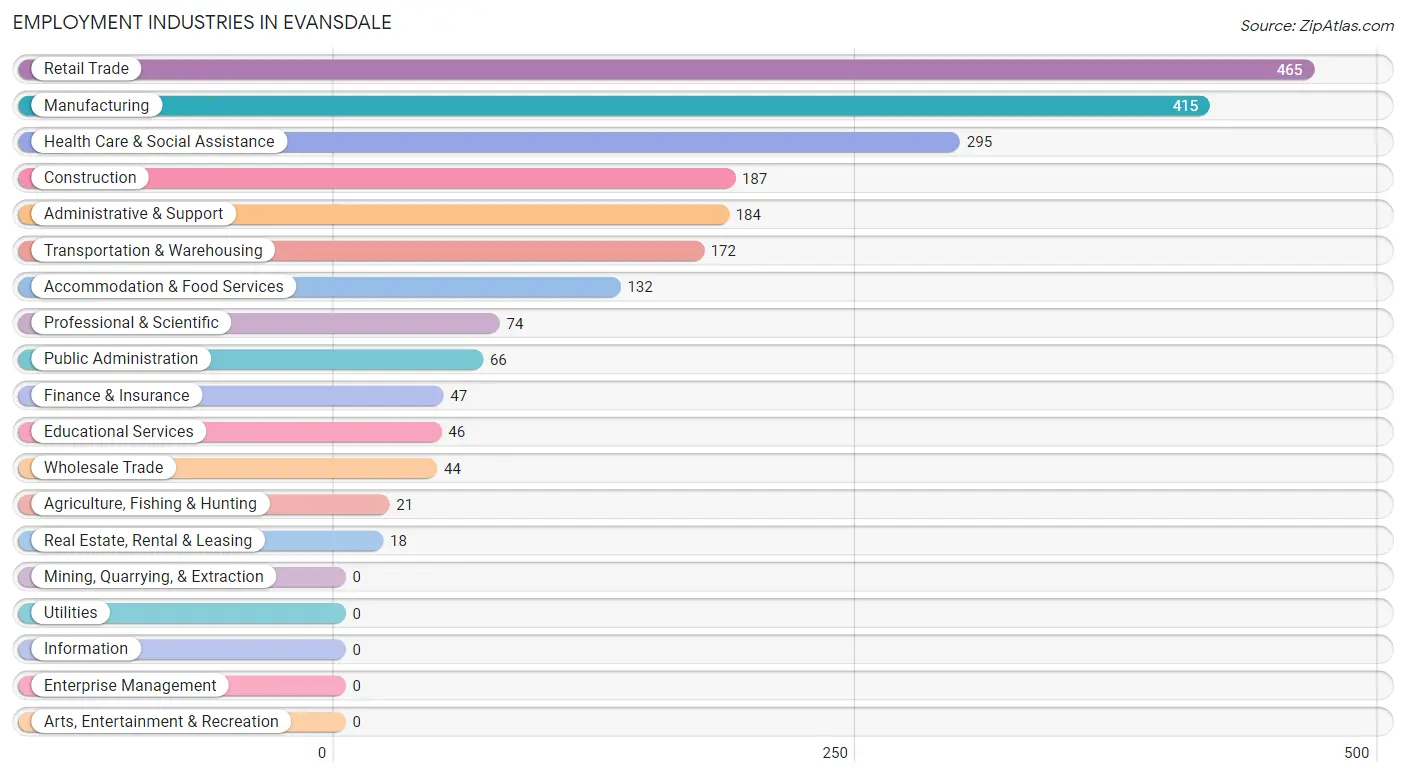
Employment Industries in Evansdale
The major employment industries in Evansdale include Retail Trade (465 | 18.7%), Manufacturing (415 | 16.7%), Health Care & Social Assistance (295 | 11.8%), Construction (187 | 7.5%), and Administrative & Support (184 | 7.4%).
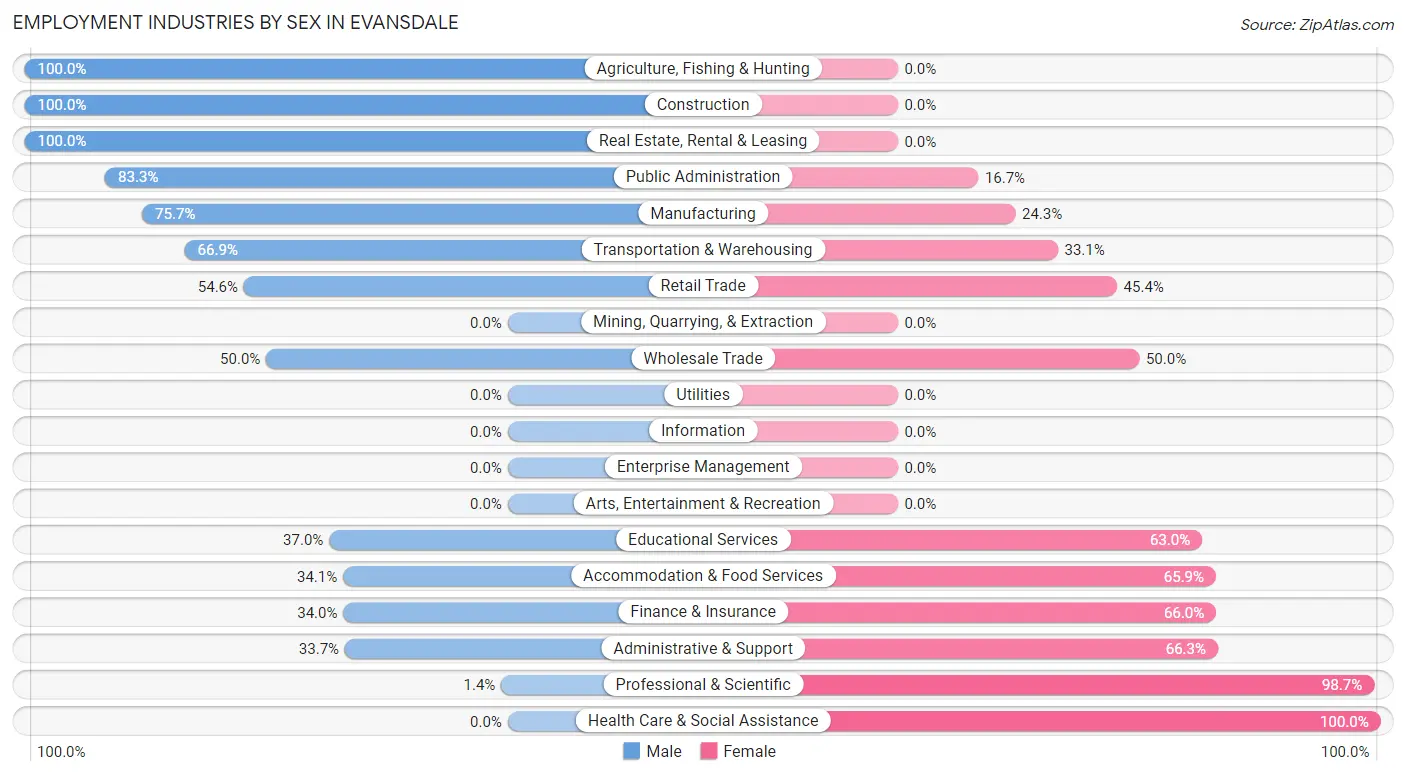
Employment Industries by Sex in Evansdale
The Evansdale industries that see more men than women are Agriculture, Fishing & Hunting (100.0%), Construction (100.0%), and Real Estate, Rental & Leasing (100.0%), whereas the industries that tend to have a higher number of women are Health Care & Social Assistance (100.0%), Professional & Scientific (98.7%), and Administrative & Support (66.3%).
| Industry | Male | Female |
| Agriculture, Fishing & Hunting | 21 (100.0%) | 0 (0.0%) |
| Mining, Quarrying, & Extraction | 0 (0.0%) | 0 (0.0%) |
| Construction | 187 (100.0%) | 0 (0.0%) |
| Manufacturing | 314 (75.7%) | 101 (24.3%) |
| Wholesale Trade | 22 (50.0%) | 22 (50.0%) |
| Retail Trade | 254 (54.6%) | 211 (45.4%) |
| Transportation & Warehousing | 115 (66.9%) | 57 (33.1%) |
| Utilities | 0 (0.0%) | 0 (0.0%) |
| Information | 0 (0.0%) | 0 (0.0%) |
| Finance & Insurance | 16 (34.0%) | 31 (66.0%) |
| Real Estate, Rental & Leasing | 18 (100.0%) | 0 (0.0%) |
| Professional & Scientific | 1 (1.3%) | 73 (98.7%) |
| Enterprise Management | 0 (0.0%) | 0 (0.0%) |
| Administrative & Support | 62 (33.7%) | 122 (66.3%) |
| Educational Services | 17 (37.0%) | 29 (63.0%) |
| Health Care & Social Assistance | 0 (0.0%) | 295 (100.0%) |
| Arts, Entertainment & Recreation | 0 (0.0%) | 0 (0.0%) |
| Accommodation & Food Services | 45 (34.1%) | 87 (65.9%) |
| Public Administration | 55 (83.3%) | 11 (16.7%) |
| Total | 1,422 (57.1%) | 1,069 (42.9%) |
Education in Evansdale
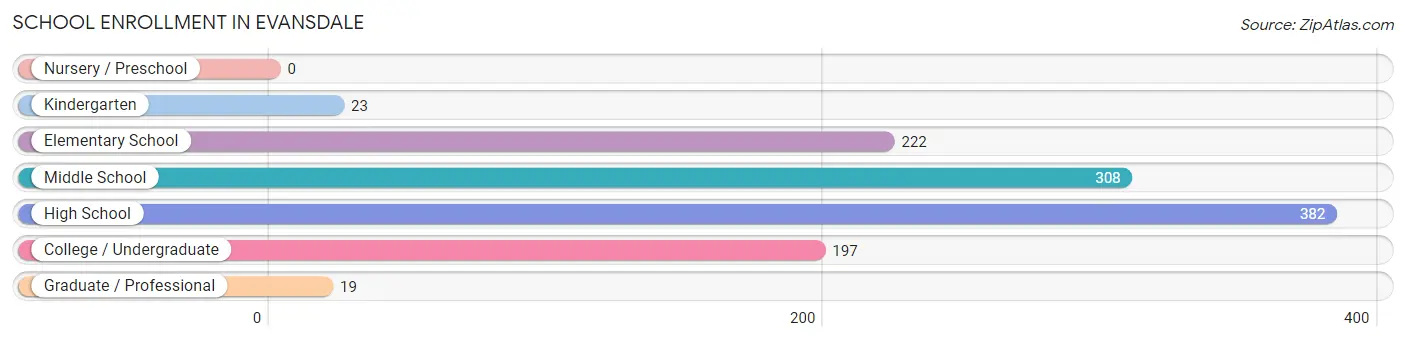
School Enrollment in Evansdale
The most common levels of schooling among the 1,151 students in Evansdale are high school (382 | 33.2%), middle school (308 | 26.8%), and elementary school (222 | 19.3%).
| School Level | # Students | % Students |
| Nursery / Preschool | 0 | 0.0% |
| Kindergarten | 23 | 2.0% |
| Elementary School | 222 | 19.3% |
| Middle School | 308 | 26.8% |
| High School | 382 | 33.2% |
| College / Undergraduate | 197 | 17.1% |
| Graduate / Professional | 19 | 1.7% |
| Total | 1,151 | 100.0% |
School Enrollment by Age by Funding Source in Evansdale
Out of a total of 1,151 students who are enrolled in schools in Evansdale, 67 (5.8%) attend a private institution, while the remaining 1,084 (94.2%) are enrolled in public schools. The age group of 20 to 24 year olds has the highest likelihood of being enrolled in private schools, with 36 (20.3% in the age bracket) enrolled. Conversely, the age group of 5 to 9 year old has the lowest likelihood of being enrolled in a private school, with 229 (100.0% in the age bracket) attending a public institution.
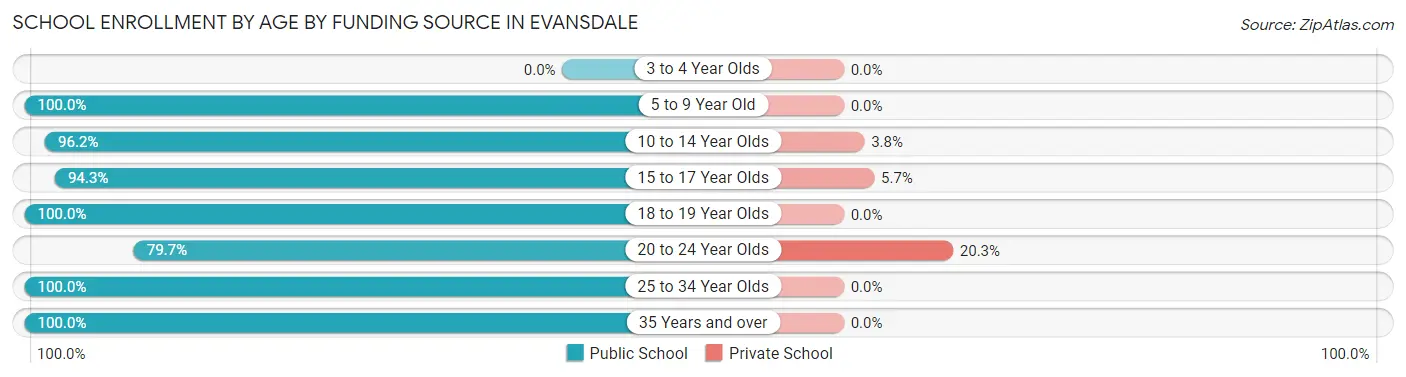
| Age Bracket | Public School | Private School |
| 3 to 4 Year Olds | 0 (0.0%) | 0 (0.0%) |
| 5 to 9 Year Old | 229 (100.0%) | 0 (0.0%) |
| 10 to 14 Year Olds | 352 (96.2%) | 14 (3.8%) |
| 15 to 17 Year Olds | 283 (94.3%) | 17 (5.7%) |
| 18 to 19 Year Olds | 47 (100.0%) | 0 (0.0%) |
| 20 to 24 Year Olds | 141 (79.7%) | 36 (20.3%) |
| 25 to 34 Year Olds | 1 (100.0%) | 0 (0.0%) |
| 35 Years and over | 31 (100.0%) | 0 (0.0%) |
| Total | 1,084 (94.2%) | 67 (5.8%) |
Educational Attainment by Field of Study in Evansdale
Arts & humanities (81 | 23.0%), business (74 | 21.0%), psychology (65 | 18.5%), education (30 | 8.5%), and visual & performing arts (27 | 7.7%) are the most common fields of study among 352 individuals in Evansdale who have obtained a bachelor's degree or higher.
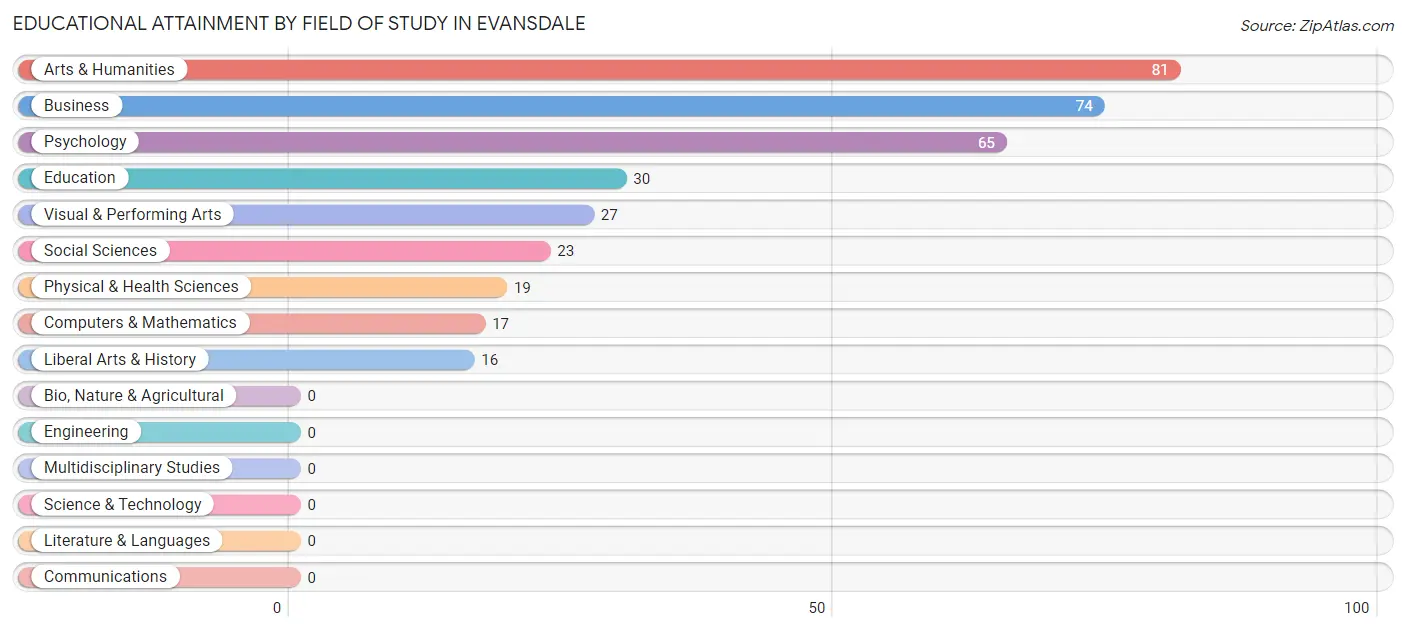
| Field of Study | # Graduates | % Graduates |
| Computers & Mathematics | 17 | 4.8% |
| Bio, Nature & Agricultural | 0 | 0.0% |
| Physical & Health Sciences | 19 | 5.4% |
| Psychology | 65 | 18.5% |
| Social Sciences | 23 | 6.5% |
| Engineering | 0 | 0.0% |
| Multidisciplinary Studies | 0 | 0.0% |
| Science & Technology | 0 | 0.0% |
| Business | 74 | 21.0% |
| Education | 30 | 8.5% |
| Literature & Languages | 0 | 0.0% |
| Liberal Arts & History | 16 | 4.5% |
| Visual & Performing Arts | 27 | 7.7% |
| Communications | 0 | 0.0% |
| Arts & Humanities | 81 | 23.0% |
| Total | 352 | 100.0% |
Transportation & Commute in Evansdale
Vehicle Availability by Sex in Evansdale
The most prevalent vehicle ownership categories in Evansdale are males with 3 vehicles (458, accounting for 32.8%) and females with 3 vehicles (302, making up 43.4%).
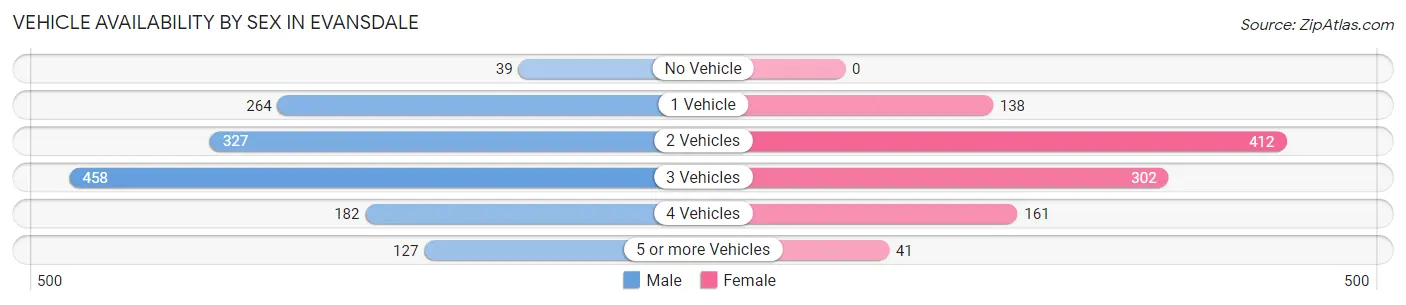
| Vehicles Available | Male | Female |
| No Vehicle | 39 (2.8%) | 0 (0.0%) |
| 1 Vehicle | 264 (18.9%) | 138 (13.1%) |
| 2 Vehicles | 327 (23.4%) | 412 (39.1%) |
| 3 Vehicles | 458 (32.8%) | 302 (28.6%) |
| 4 Vehicles | 182 (13.0%) | 161 (15.3%) |
| 5 or more Vehicles | 127 (9.1%) | 41 (3.9%) |
| Total | 1,397 (100.0%) | 1,054 (100.0%) |
Commute Time in Evansdale
The most frequently occuring commute durations in Evansdale are 15 to 19 minutes (536 commuters, 22.9%), 10 to 14 minutes (483 commuters, 20.6%), and 5 to 9 minutes (450 commuters, 19.2%).
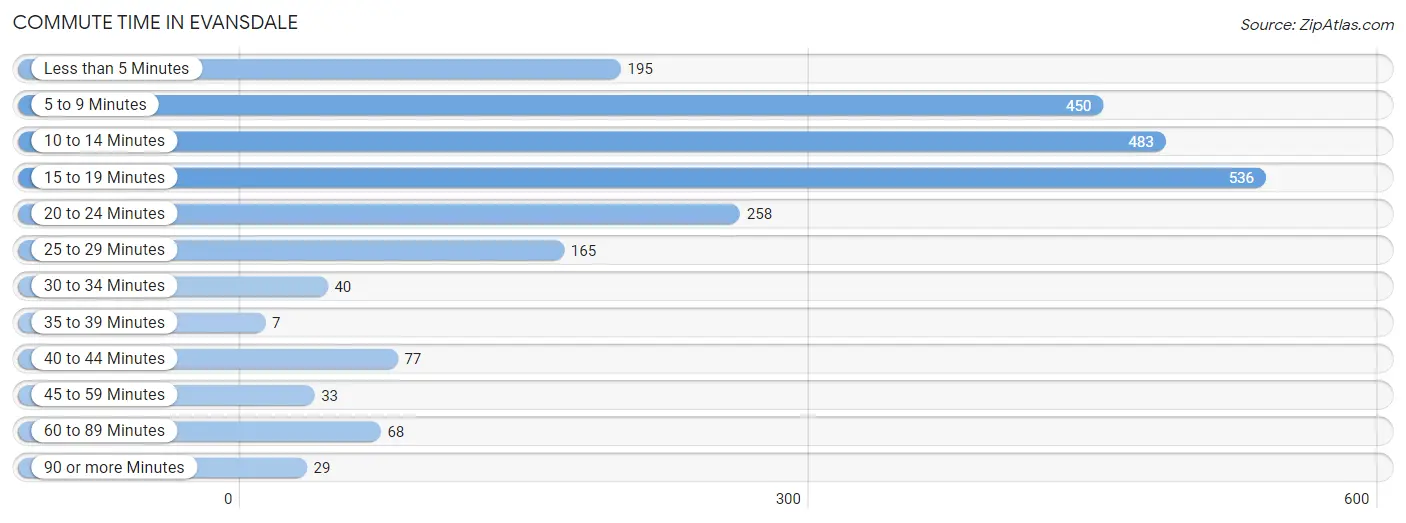
| Commute Time | # Commuters | % Commuters |
| Less than 5 Minutes | 195 | 8.3% |
| 5 to 9 Minutes | 450 | 19.2% |
| 10 to 14 Minutes | 483 | 20.6% |
| 15 to 19 Minutes | 536 | 22.9% |
| 20 to 24 Minutes | 258 | 11.0% |
| 25 to 29 Minutes | 165 | 7.0% |
| 30 to 34 Minutes | 40 | 1.7% |
| 35 to 39 Minutes | 7 | 0.3% |
| 40 to 44 Minutes | 77 | 3.3% |
| 45 to 59 Minutes | 33 | 1.4% |
| 60 to 89 Minutes | 68 | 2.9% |
| 90 or more Minutes | 29 | 1.2% |
Commute Time by Sex in Evansdale
The most common commute times in Evansdale are 10 to 14 minutes (355 commuters, 25.4%) for males and 15 to 19 minutes (212 commuters, 22.5%) for females.
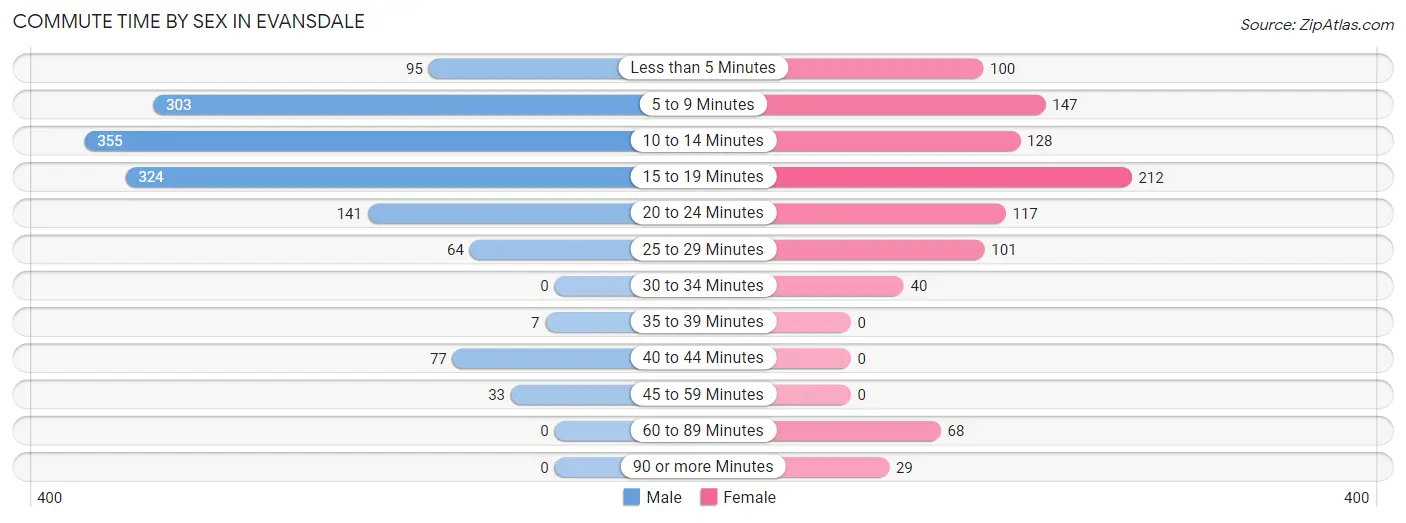
| Commute Time | Male | Female |
| Less than 5 Minutes | 95 (6.8%) | 100 (10.6%) |
| 5 to 9 Minutes | 303 (21.7%) | 147 (15.6%) |
| 10 to 14 Minutes | 355 (25.4%) | 128 (13.6%) |
| 15 to 19 Minutes | 324 (23.2%) | 212 (22.5%) |
| 20 to 24 Minutes | 141 (10.1%) | 117 (12.4%) |
| 25 to 29 Minutes | 64 (4.6%) | 101 (10.7%) |
| 30 to 34 Minutes | 0 (0.0%) | 40 (4.3%) |
| 35 to 39 Minutes | 7 (0.5%) | 0 (0.0%) |
| 40 to 44 Minutes | 77 (5.5%) | 0 (0.0%) |
| 45 to 59 Minutes | 33 (2.4%) | 0 (0.0%) |
| 60 to 89 Minutes | 0 (0.0%) | 68 (7.2%) |
| 90 or more Minutes | 0 (0.0%) | 29 (3.1%) |
Time of Departure to Work by Sex in Evansdale
The most frequent times of departure to work in Evansdale are 7:30 AM to 7:59 AM (240, 17.2%) for males and 7:30 AM to 7:59 AM (251, 26.7%) for females.
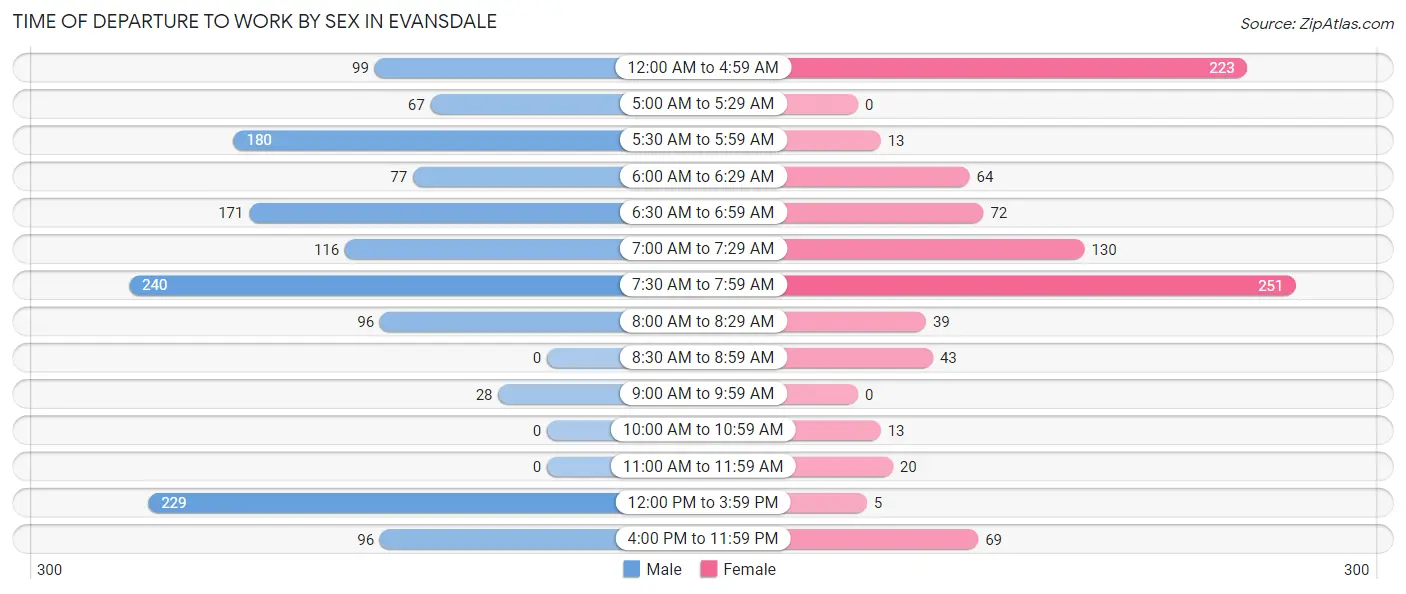
| Time of Departure | Male | Female |
| 12:00 AM to 4:59 AM | 99 (7.1%) | 223 (23.7%) |
| 5:00 AM to 5:29 AM | 67 (4.8%) | 0 (0.0%) |
| 5:30 AM to 5:59 AM | 180 (12.9%) | 13 (1.4%) |
| 6:00 AM to 6:29 AM | 77 (5.5%) | 64 (6.8%) |
| 6:30 AM to 6:59 AM | 171 (12.2%) | 72 (7.6%) |
| 7:00 AM to 7:29 AM | 116 (8.3%) | 130 (13.8%) |
| 7:30 AM to 7:59 AM | 240 (17.2%) | 251 (26.7%) |
| 8:00 AM to 8:29 AM | 96 (6.9%) | 39 (4.1%) |
| 8:30 AM to 8:59 AM | 0 (0.0%) | 43 (4.6%) |
| 9:00 AM to 9:59 AM | 28 (2.0%) | 0 (0.0%) |
| 10:00 AM to 10:59 AM | 0 (0.0%) | 13 (1.4%) |
| 11:00 AM to 11:59 AM | 0 (0.0%) | 20 (2.1%) |
| 12:00 PM to 3:59 PM | 229 (16.4%) | 5 (0.5%) |
| 4:00 PM to 11:59 PM | 96 (6.9%) | 69 (7.3%) |
| Total | 1,399 (100.0%) | 942 (100.0%) |
Housing Occupancy in Evansdale
Occupancy by Ownership in Evansdale
Of the total 2,166 dwellings in Evansdale, owner-occupied units account for 1,396 (64.4%), while renter-occupied units make up 770 (35.5%).
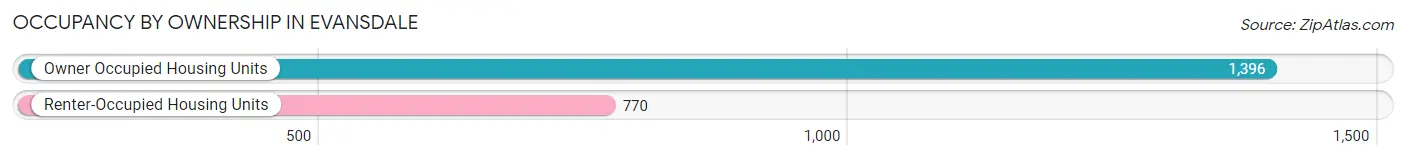
| Occupancy | # Housing Units | % Housing Units |
| Owner Occupied Housing Units | 1,396 | 64.4% |
| Renter-Occupied Housing Units | 770 | 35.5% |
| Total Occupied Housing Units | 2,166 | 100.0% |
Occupancy by Household Size in Evansdale
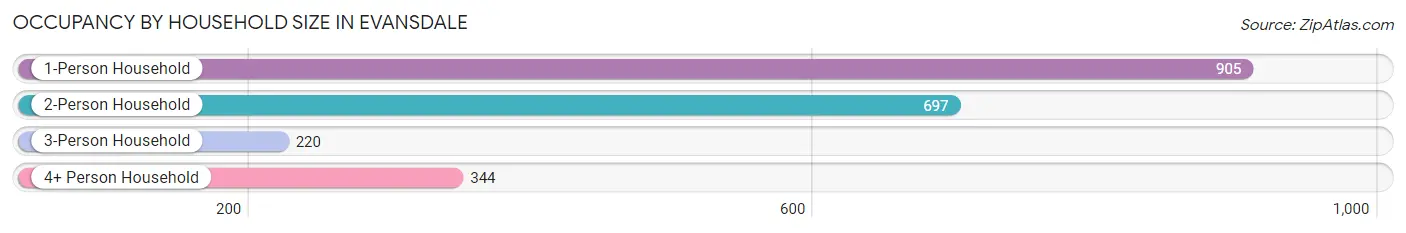
| Household Size | # Housing Units | % Housing Units |
| 1-Person Household | 905 | 41.8% |
| 2-Person Household | 697 | 32.2% |
| 3-Person Household | 220 | 10.2% |
| 4+ Person Household | 344 | 15.9% |
| Total Housing Units | 2,166 | 100.0% |
Occupancy by Ownership by Household Size in Evansdale
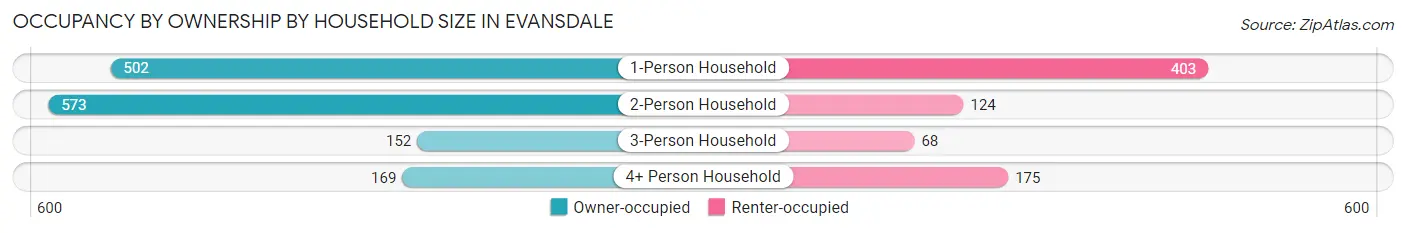
| Household Size | Owner-occupied | Renter-occupied |
| 1-Person Household | 502 (55.5%) | 403 (44.5%) |
| 2-Person Household | 573 (82.2%) | 124 (17.8%) |
| 3-Person Household | 152 (69.1%) | 68 (30.9%) |
| 4+ Person Household | 169 (49.1%) | 175 (50.9%) |
| Total Housing Units | 1,396 (64.4%) | 770 (35.5%) |
Occupancy by Educational Attainment in Evansdale
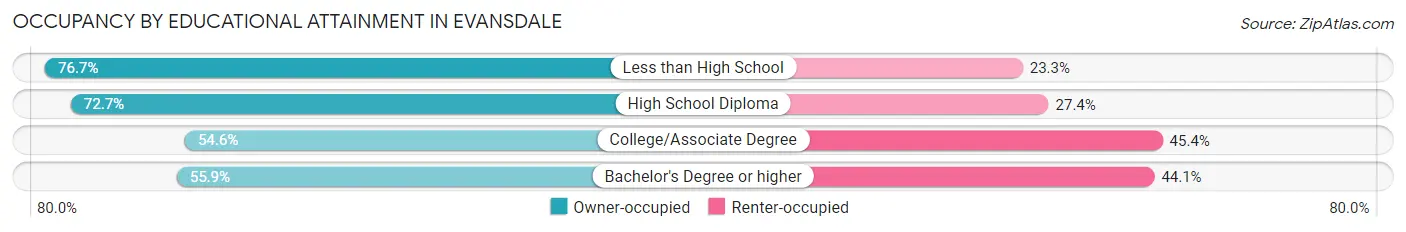
| Household Size | Owner-occupied | Renter-occupied |
| Less than High School | 231 (76.7%) | 70 (23.3%) |
| High School Diploma | 579 (72.7%) | 218 (27.4%) |
| College/Associate Degree | 443 (54.6%) | 369 (45.4%) |
| Bachelor's Degree or higher | 143 (55.9%) | 113 (44.1%) |
Occupancy by Age of Householder in Evansdale
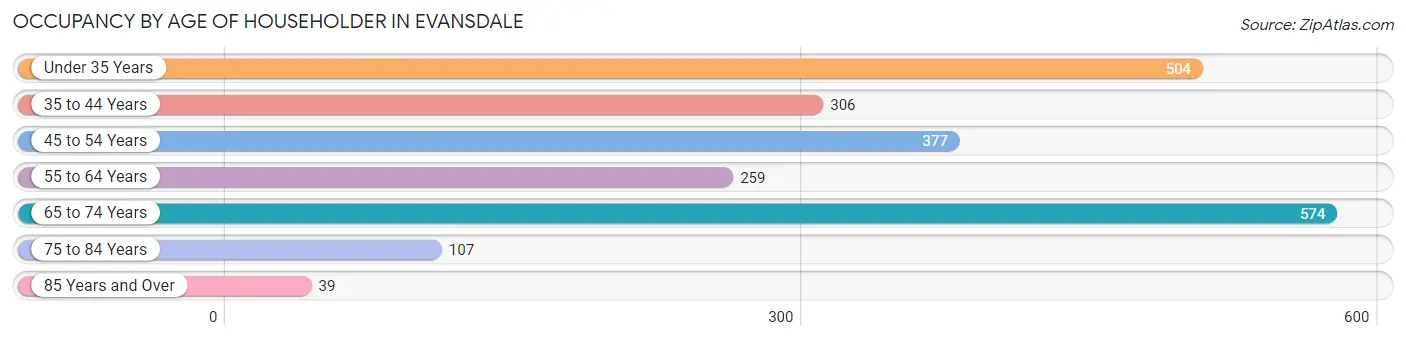
| Age Bracket | # Households | % Households |
| Under 35 Years | 504 | 23.3% |
| 35 to 44 Years | 306 | 14.1% |
| 45 to 54 Years | 377 | 17.4% |
| 55 to 64 Years | 259 | 12.0% |
| 65 to 74 Years | 574 | 26.5% |
| 75 to 84 Years | 107 | 4.9% |
| 85 Years and Over | 39 | 1.8% |
| Total | 2,166 | 100.0% |
Housing Finances in Evansdale
Median Income by Occupancy in Evansdale
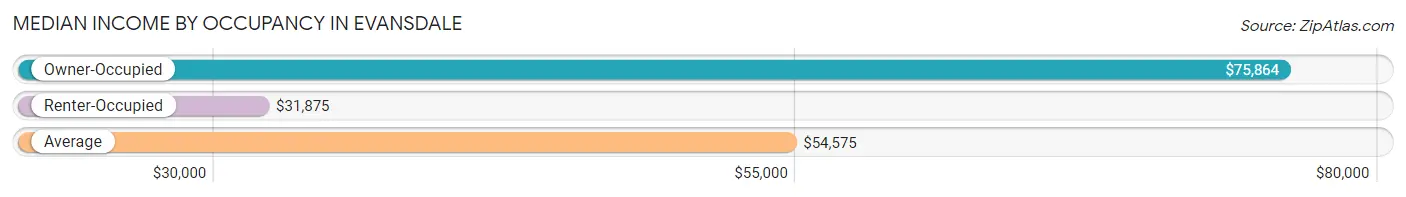
| Occupancy Type | # Households | Median Income |
| Owner-Occupied | 1,396 (64.4%) | $75,864 |
| Renter-Occupied | 770 (35.5%) | $31,875 |
| Average | 2,166 (100.0%) | $54,575 |
Occupancy by Householder Income Bracket in Evansdale
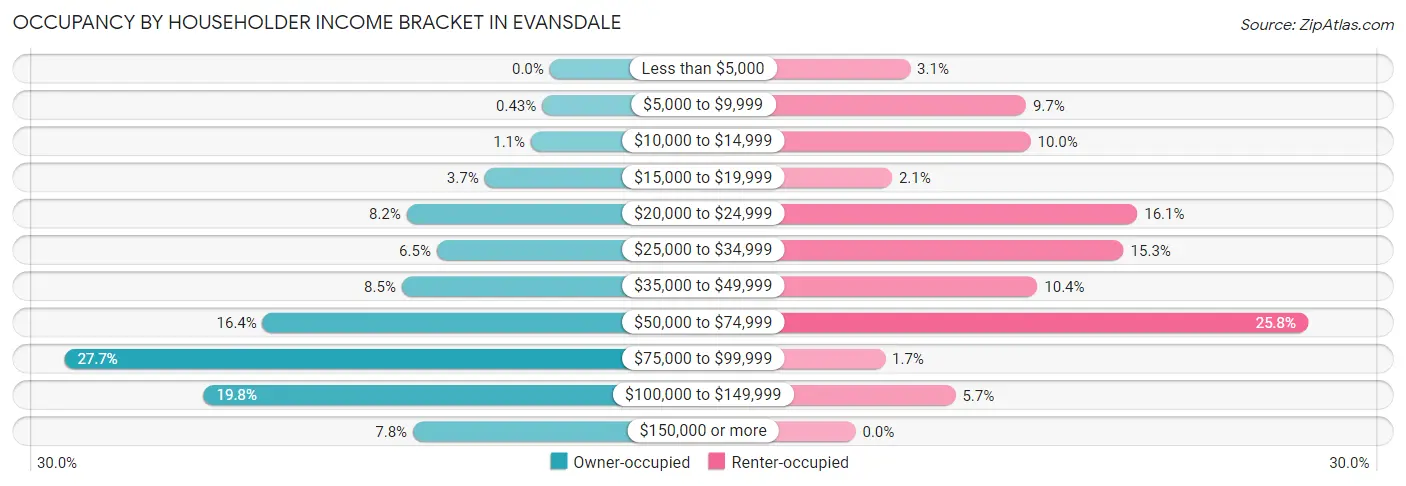
| Income Bracket | Owner-occupied | Renter-occupied |
| Less than $5,000 | 0 (0.0%) | 24 (3.1%) |
| $5,000 to $9,999 | 6 (0.4%) | 75 (9.7%) |
| $10,000 to $14,999 | 15 (1.1%) | 77 (10.0%) |
| $15,000 to $19,999 | 52 (3.7%) | 16 (2.1%) |
| $20,000 to $24,999 | 114 (8.2%) | 124 (16.1%) |
| $25,000 to $34,999 | 90 (6.5%) | 118 (15.3%) |
| $35,000 to $49,999 | 118 (8.5%) | 80 (10.4%) |
| $50,000 to $74,999 | 229 (16.4%) | 199 (25.8%) |
| $75,000 to $99,999 | 387 (27.7%) | 13 (1.7%) |
| $100,000 to $149,999 | 276 (19.8%) | 44 (5.7%) |
| $150,000 or more | 109 (7.8%) | 0 (0.0%) |
| Total | 1,396 (100.0%) | 770 (100.0%) |
Monthly Housing Cost Tiers in Evansdale
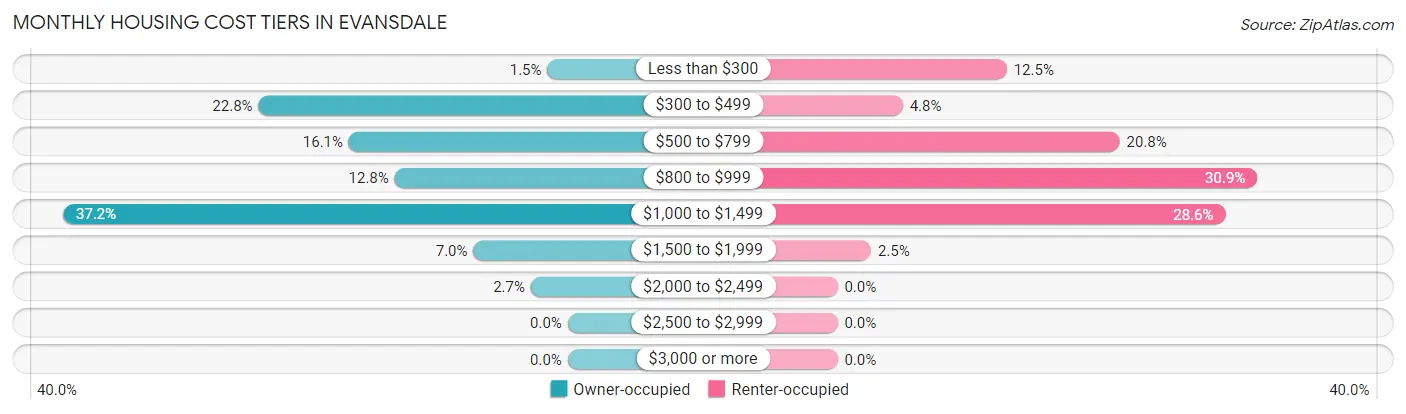
| Monthly Cost | Owner-occupied | Renter-occupied |
| Less than $300 | 21 (1.5%) | 96 (12.5%) |
| $300 to $499 | 318 (22.8%) | 37 (4.8%) |
| $500 to $799 | 225 (16.1%) | 160 (20.8%) |
| $800 to $999 | 178 (12.8%) | 238 (30.9%) |
| $1,000 to $1,499 | 519 (37.2%) | 220 (28.6%) |
| $1,500 to $1,999 | 97 (7.0%) | 19 (2.5%) |
| $2,000 to $2,499 | 38 (2.7%) | 0 (0.0%) |
| $2,500 to $2,999 | 0 (0.0%) | 0 (0.0%) |
| $3,000 or more | 0 (0.0%) | 0 (0.0%) |
| Total | 1,396 (100.0%) | 770 (100.0%) |
Physical Housing Characteristics in Evansdale
Housing Structures in Evansdale
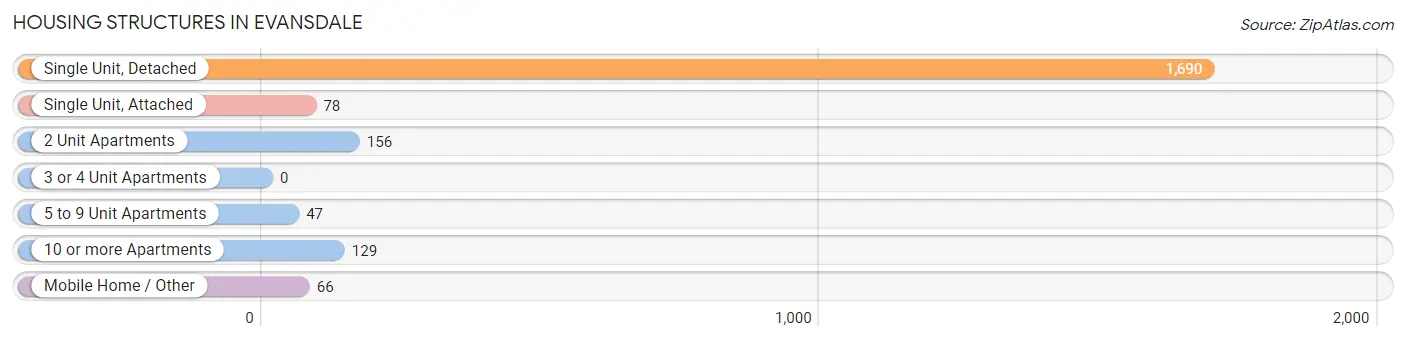
| Structure Type | # Housing Units | % Housing Units |
| Single Unit, Detached | 1,690 | 78.0% |
| Single Unit, Attached | 78 | 3.6% |
| 2 Unit Apartments | 156 | 7.2% |
| 3 or 4 Unit Apartments | 0 | 0.0% |
| 5 to 9 Unit Apartments | 47 | 2.2% |
| 10 or more Apartments | 129 | 6.0% |
| Mobile Home / Other | 66 | 3.0% |
| Total | 2,166 | 100.0% |
Housing Structures by Occupancy in Evansdale
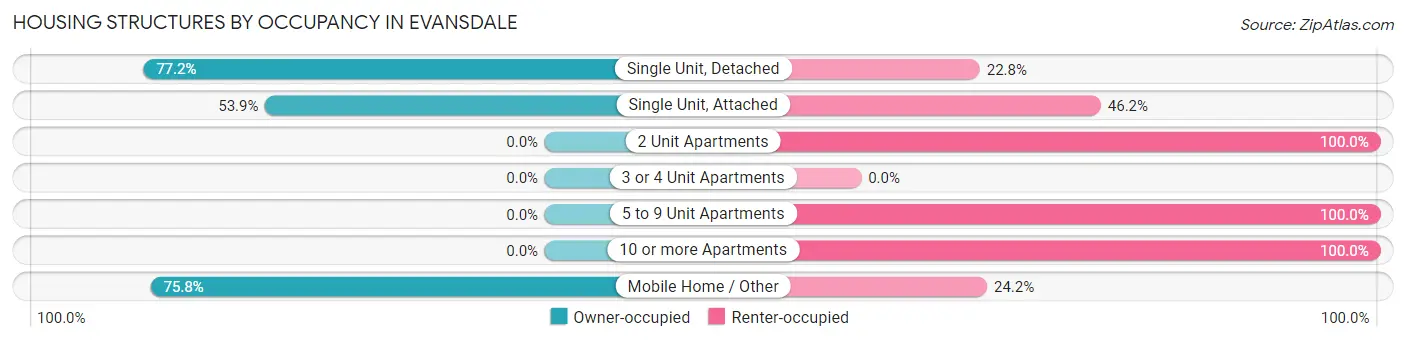
| Structure Type | Owner-occupied | Renter-occupied |
| Single Unit, Detached | 1,304 (77.2%) | 386 (22.8%) |
| Single Unit, Attached | 42 (53.8%) | 36 (46.2%) |
| 2 Unit Apartments | 0 (0.0%) | 156 (100.0%) |
| 3 or 4 Unit Apartments | 0 (0.0%) | 0 (0.0%) |
| 5 to 9 Unit Apartments | 0 (0.0%) | 47 (100.0%) |
| 10 or more Apartments | 0 (0.0%) | 129 (100.0%) |
| Mobile Home / Other | 50 (75.8%) | 16 (24.2%) |
| Total | 1,396 (64.4%) | 770 (35.5%) |
Housing Structures by Number of Rooms in Evansdale
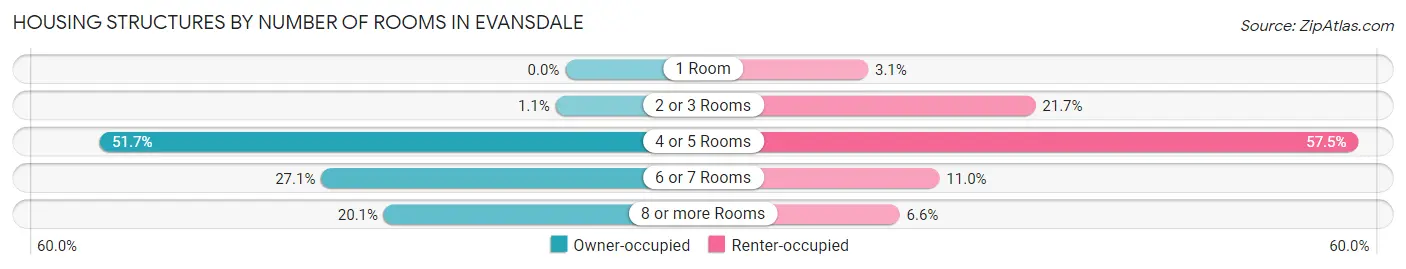
| Number of Rooms | Owner-occupied | Renter-occupied |
| 1 Room | 0 (0.0%) | 24 (3.1%) |
| 2 or 3 Rooms | 15 (1.1%) | 167 (21.7%) |
| 4 or 5 Rooms | 722 (51.7%) | 443 (57.5%) |
| 6 or 7 Rooms | 378 (27.1%) | 85 (11.0%) |
| 8 or more Rooms | 281 (20.1%) | 51 (6.6%) |
| Total | 1,396 (100.0%) | 770 (100.0%) |
Housing Structure by Heating Type in Evansdale
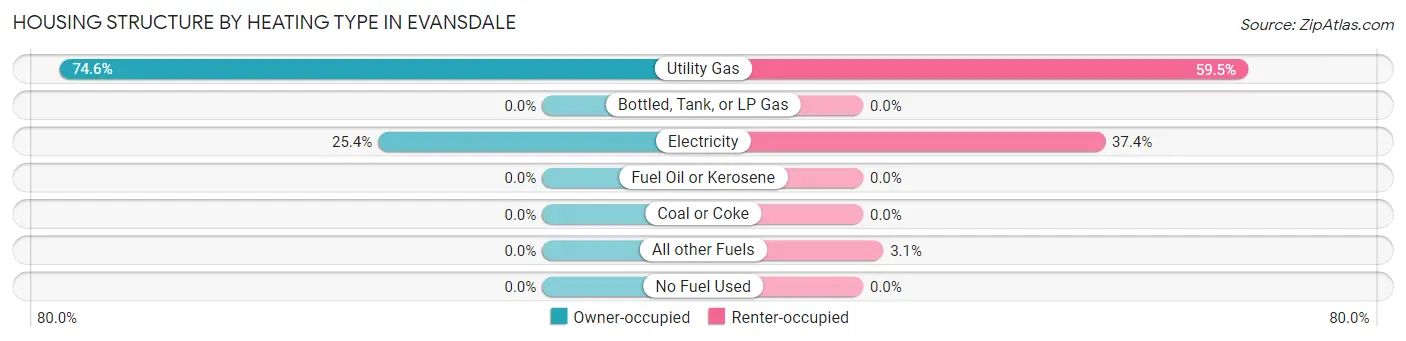
| Heating Type | Owner-occupied | Renter-occupied |
| Utility Gas | 1,042 (74.6%) | 458 (59.5%) |
| Bottled, Tank, or LP Gas | 0 (0.0%) | 0 (0.0%) |
| Electricity | 354 (25.4%) | 288 (37.4%) |
| Fuel Oil or Kerosene | 0 (0.0%) | 0 (0.0%) |
| Coal or Coke | 0 (0.0%) | 0 (0.0%) |
| All other Fuels | 0 (0.0%) | 24 (3.1%) |
| No Fuel Used | 0 (0.0%) | 0 (0.0%) |
| Total | 1,396 (100.0%) | 770 (100.0%) |
Household Vehicle Usage in Evansdale
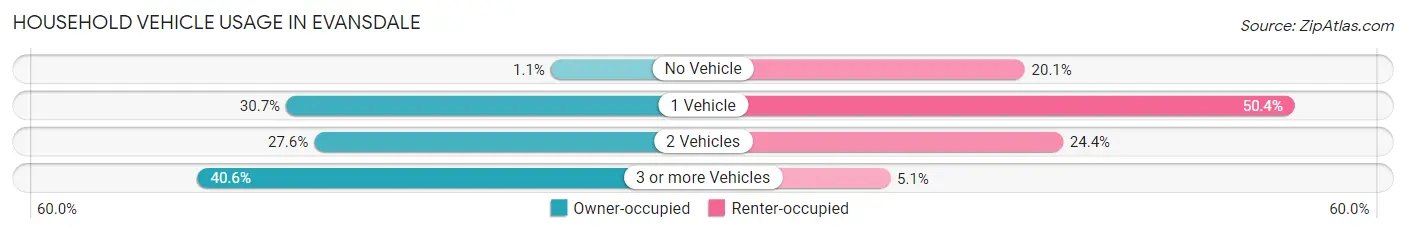
| Vehicles per Household | Owner-occupied | Renter-occupied |
| No Vehicle | 15 (1.1%) | 155 (20.1%) |
| 1 Vehicle | 429 (30.7%) | 388 (50.4%) |
| 2 Vehicles | 385 (27.6%) | 188 (24.4%) |
| 3 or more Vehicles | 567 (40.6%) | 39 (5.1%) |
| Total | 1,396 (100.0%) | 770 (100.0%) |
Real Estate & Mortgages in Evansdale
Real Estate and Mortgage Overview in Evansdale
| Characteristic | Without Mortgage | With Mortgage |
| Housing Units | 431 | 965 |
| Median Property Value | $93,800 | $142,600 |
| Median Household Income | $63,984 | $45 |
| Monthly Housing Costs | $399 | $0 |
| Real Estate Taxes | $1,453 | $55 |
Property Value by Mortgage Status in Evansdale
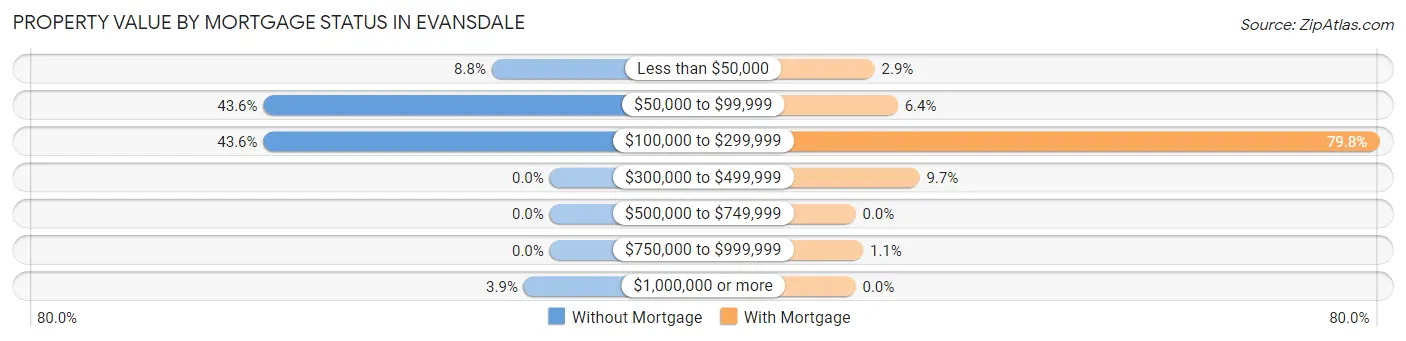
| Property Value | Without Mortgage | With Mortgage |
| Less than $50,000 | 38 (8.8%) | 28 (2.9%) |
| $50,000 to $99,999 | 188 (43.6%) | 62 (6.4%) |
| $100,000 to $299,999 | 188 (43.6%) | 770 (79.8%) |
| $300,000 to $499,999 | 0 (0.0%) | 94 (9.7%) |
| $500,000 to $749,999 | 0 (0.0%) | 0 (0.0%) |
| $750,000 to $999,999 | 0 (0.0%) | 11 (1.1%) |
| $1,000,000 or more | 17 (3.9%) | 0 (0.0%) |
| Total | 431 (100.0%) | 965 (100.0%) |
Household Income by Mortgage Status in Evansdale
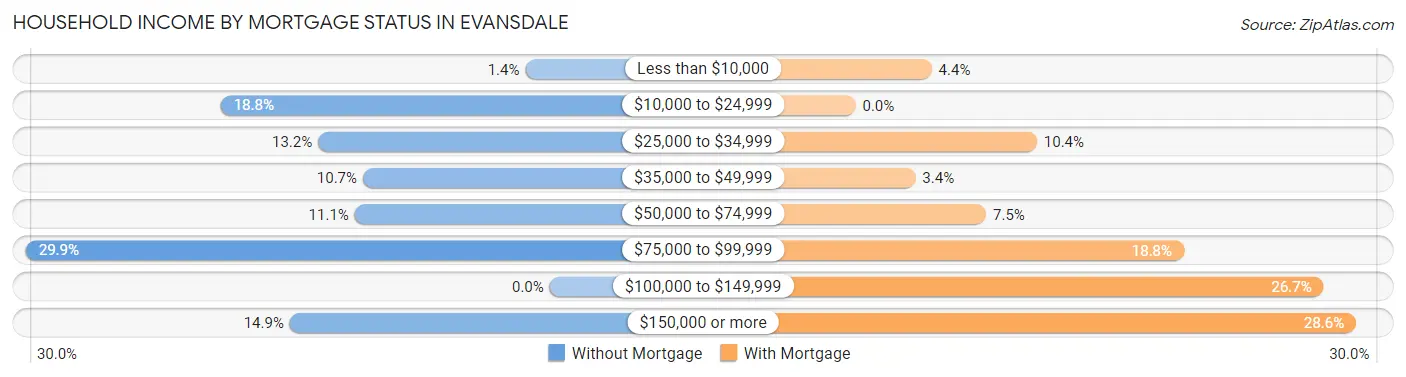
| Household Income | Without Mortgage | With Mortgage |
| Less than $10,000 | 6 (1.4%) | 42 (4.3%) |
| $10,000 to $24,999 | 81 (18.8%) | 0 (0.0%) |
| $25,000 to $34,999 | 57 (13.2%) | 100 (10.4%) |
| $35,000 to $49,999 | 46 (10.7%) | 33 (3.4%) |
| $50,000 to $74,999 | 48 (11.1%) | 72 (7.5%) |
| $75,000 to $99,999 | 129 (29.9%) | 181 (18.8%) |
| $100,000 to $149,999 | 0 (0.0%) | 258 (26.7%) |
| $150,000 or more | 64 (14.8%) | 276 (28.6%) |
| Total | 431 (100.0%) | 965 (100.0%) |
Property Value to Household Income Ratio in Evansdale
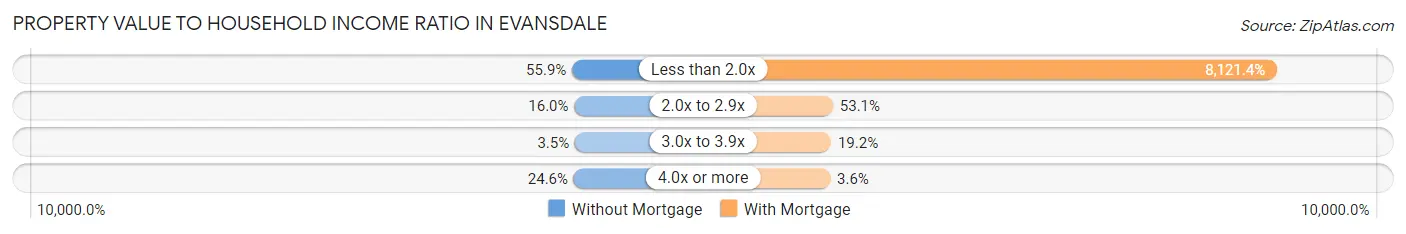
| Value-to-Income Ratio | Without Mortgage | With Mortgage |
| Less than 2.0x | 241 (55.9%) | 78,371 (8,121.3%) |
| 2.0x to 2.9x | 69 (16.0%) | 512 (53.1%) |
| 3.0x to 3.9x | 15 (3.5%) | 185 (19.2%) |
| 4.0x or more | 106 (24.6%) | 35 (3.6%) |
| Total | 431 (100.0%) | 965 (100.0%) |
Real Estate Taxes by Mortgage Status in Evansdale
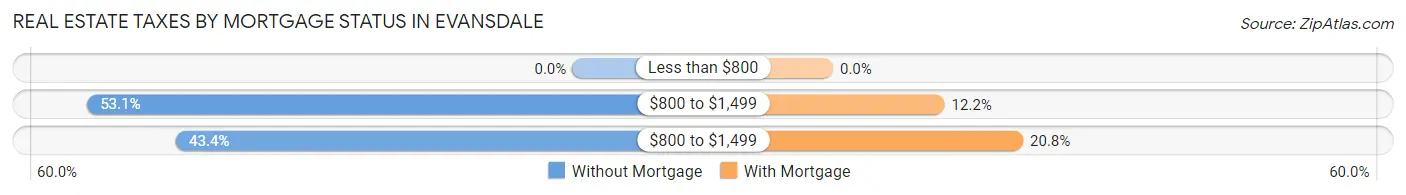
| Property Taxes | Without Mortgage | With Mortgage |
| Less than $800 | 0 (0.0%) | 0 (0.0%) |
| $800 to $1,499 | 229 (53.1%) | 118 (12.2%) |
| $800 to $1,499 | 187 (43.4%) | 201 (20.8%) |
| Total | 431 (100.0%) | 965 (100.0%) |
Health & Disability in Evansdale
Health Insurance Coverage by Age in Evansdale
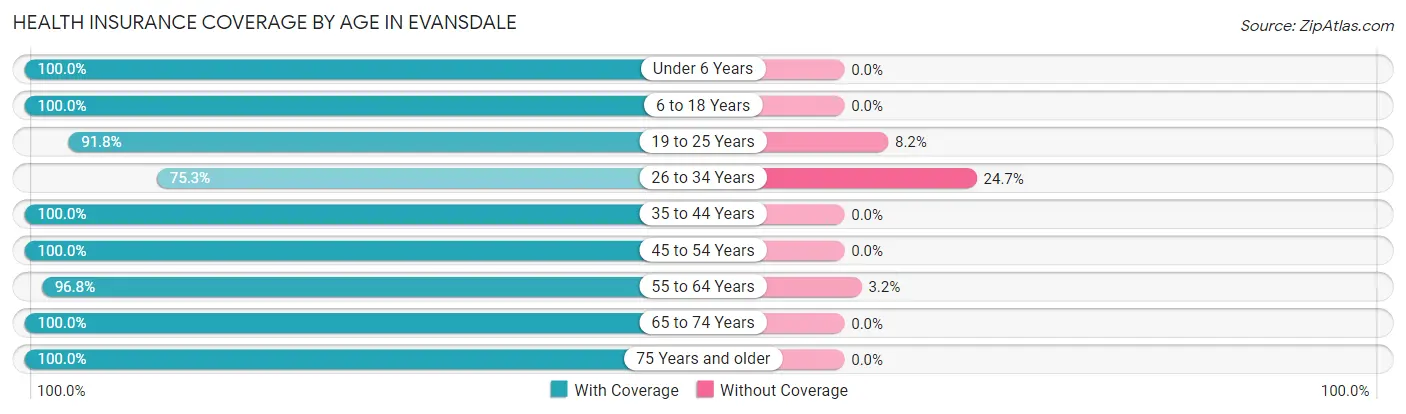
| Age Bracket | With Coverage | Without Coverage |
| Under 6 Years | 147 (100.0%) | 0 (0.0%) |
| 6 to 18 Years | 979 (100.0%) | 0 (0.0%) |
| 19 to 25 Years | 405 (91.8%) | 36 (8.2%) |
| 26 to 34 Years | 345 (75.3%) | 113 (24.7%) |
| 35 to 44 Years | 516 (100.0%) | 0 (0.0%) |
| 45 to 54 Years | 623 (100.0%) | 0 (0.0%) |
| 55 to 64 Years | 545 (96.8%) | 18 (3.2%) |
| 65 to 74 Years | 688 (100.0%) | 0 (0.0%) |
| 75 Years and older | 146 (100.0%) | 0 (0.0%) |
| Total | 4,394 (96.3%) | 167 (3.7%) |
Health Insurance Coverage by Citizenship Status in Evansdale
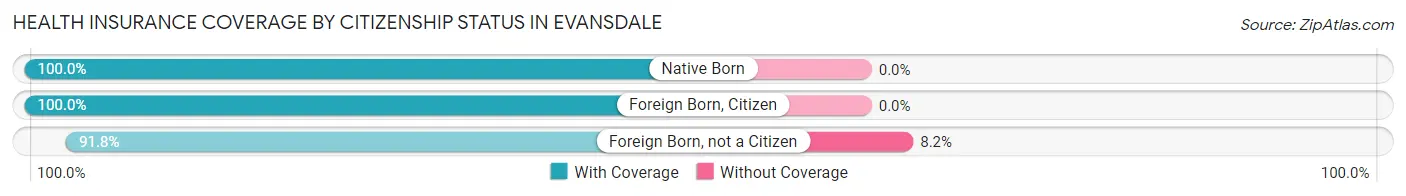
| Citizenship Status | With Coverage | Without Coverage |
| Native Born | 147 (100.0%) | 0 (0.0%) |
| Foreign Born, Citizen | 979 (100.0%) | 0 (0.0%) |
| Foreign Born, not a Citizen | 405 (91.8%) | 36 (8.2%) |
Health Insurance Coverage by Household Income in Evansdale
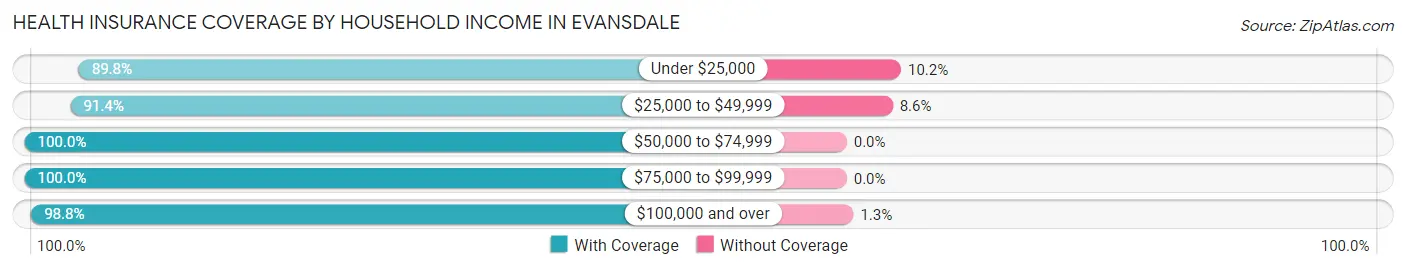
| Household Income | With Coverage | Without Coverage |
| Under $25,000 | 752 (89.8%) | 85 (10.2%) |
| $25,000 to $49,999 | 723 (91.4%) | 68 (8.6%) |
| $50,000 to $74,999 | 1,000 (100.0%) | 0 (0.0%) |
| $75,000 to $99,999 | 805 (100.0%) | 0 (0.0%) |
| $100,000 and over | 1,103 (98.8%) | 14 (1.3%) |
Public vs Private Health Insurance Coverage by Age in Evansdale
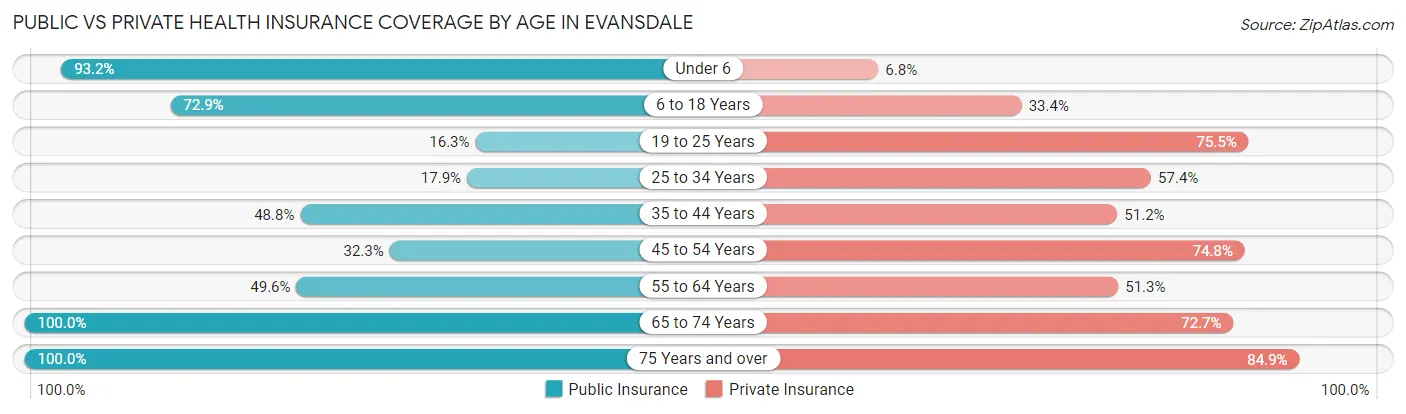
| Age Bracket | Public Insurance | Private Insurance |
| Under 6 | 137 (93.2%) | 10 (6.8%) |
| 6 to 18 Years | 714 (72.9%) | 327 (33.4%) |
| 19 to 25 Years | 72 (16.3%) | 333 (75.5%) |
| 25 to 34 Years | 82 (17.9%) | 263 (57.4%) |
| 35 to 44 Years | 252 (48.8%) | 264 (51.2%) |
| 45 to 54 Years | 201 (32.3%) | 466 (74.8%) |
| 55 to 64 Years | 279 (49.6%) | 289 (51.3%) |
| 65 to 74 Years | 688 (100.0%) | 500 (72.7%) |
| 75 Years and over | 146 (100.0%) | 124 (84.9%) |
| Total | 2,571 (56.4%) | 2,576 (56.5%) |
Disability Status by Sex by Age in Evansdale
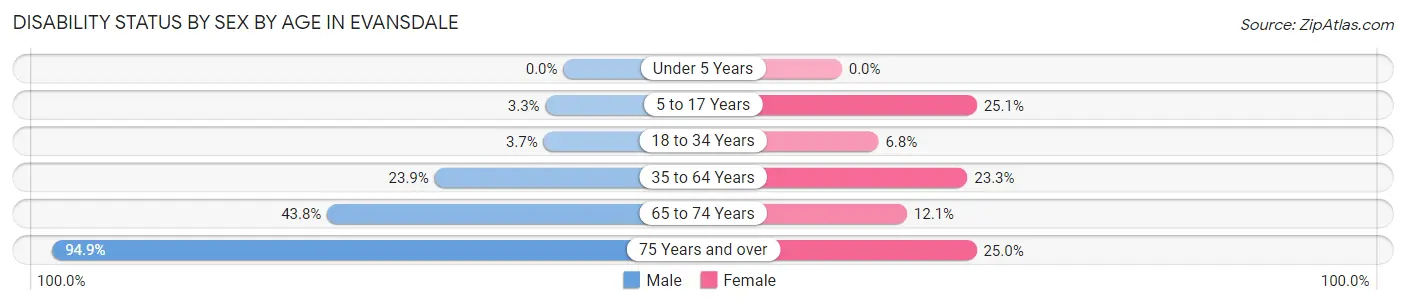
| Age Bracket | Male | Female |
| Under 5 Years | 0 (0.0%) | 0 (0.0%) |
| 5 to 17 Years | 14 (3.3%) | 119 (25.1%) |
| 18 to 34 Years | 21 (3.7%) | 28 (6.8%) |
| 35 to 64 Years | 212 (23.9%) | 190 (23.3%) |
| 65 to 74 Years | 142 (43.8%) | 44 (12.1%) |
| 75 Years and over | 74 (94.9%) | 17 (25.0%) |
Disability Class by Sex by Age in Evansdale
Disability Class: Hearing Difficulty
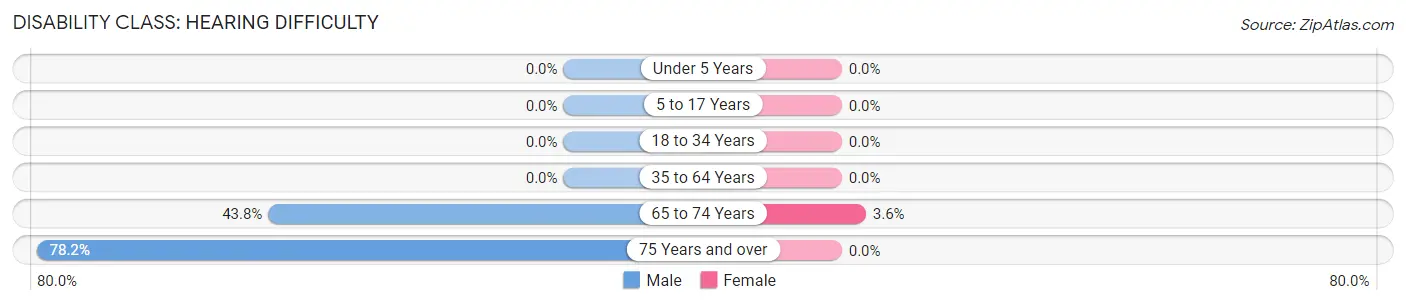
| Age Bracket | Male | Female |
| Under 5 Years | 0 (0.0%) | 0 (0.0%) |
| 5 to 17 Years | 0 (0.0%) | 0 (0.0%) |
| 18 to 34 Years | 0 (0.0%) | 0 (0.0%) |
| 35 to 64 Years | 0 (0.0%) | 0 (0.0%) |
| 65 to 74 Years | 142 (43.8%) | 13 (3.6%) |
| 75 Years and over | 61 (78.2%) | 0 (0.0%) |
Disability Class: Vision Difficulty
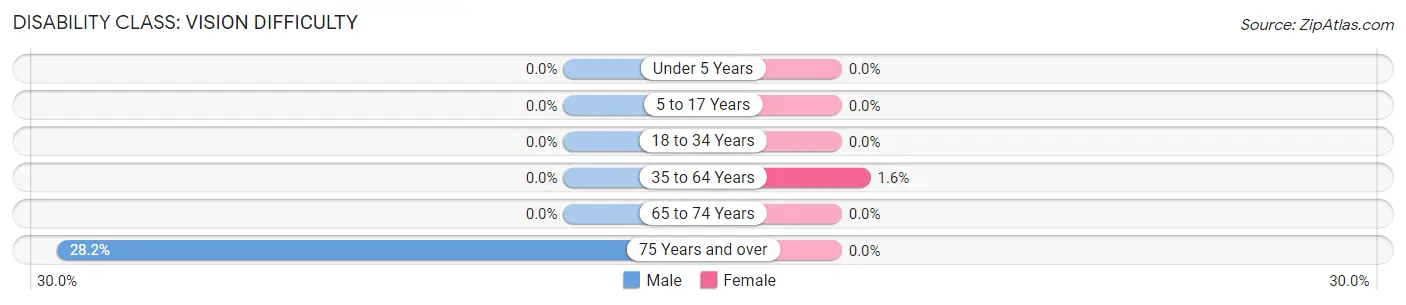
| Age Bracket | Male | Female |
| Under 5 Years | 0 (0.0%) | 0 (0.0%) |
| 5 to 17 Years | 0 (0.0%) | 0 (0.0%) |
| 18 to 34 Years | 0 (0.0%) | 0 (0.0%) |
| 35 to 64 Years | 0 (0.0%) | 13 (1.6%) |
| 65 to 74 Years | 0 (0.0%) | 0 (0.0%) |
| 75 Years and over | 22 (28.2%) | 0 (0.0%) |
Disability Class: Cognitive Difficulty
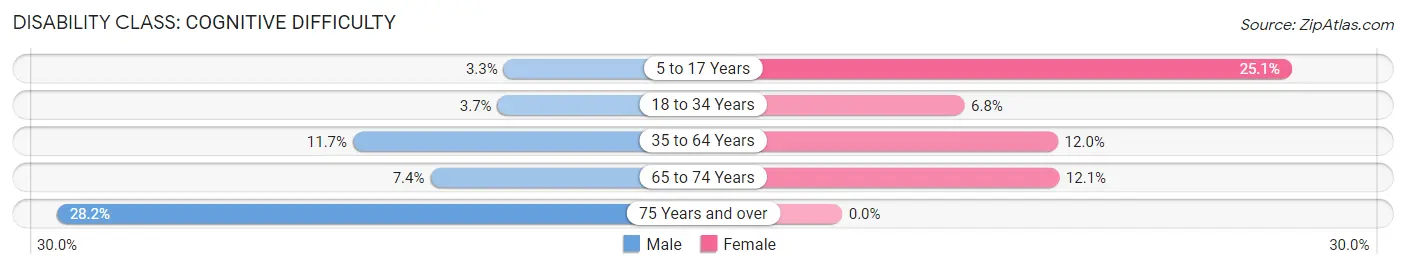
| Age Bracket | Male | Female |
| 5 to 17 Years | 14 (3.3%) | 119 (25.1%) |
| 18 to 34 Years | 21 (3.7%) | 28 (6.8%) |
| 35 to 64 Years | 104 (11.7%) | 98 (12.0%) |
| 65 to 74 Years | 24 (7.4%) | 44 (12.1%) |
| 75 Years and over | 22 (28.2%) | 0 (0.0%) |
Disability Class: Ambulatory Difficulty
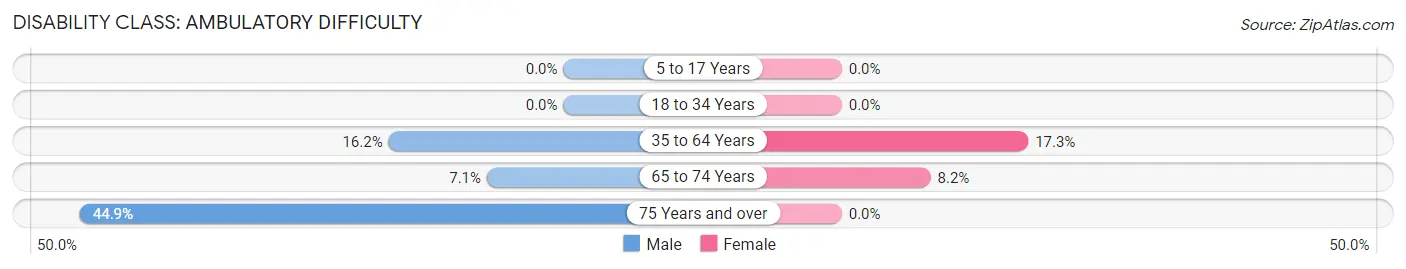
| Age Bracket | Male | Female |
| 5 to 17 Years | 0 (0.0%) | 0 (0.0%) |
| 18 to 34 Years | 0 (0.0%) | 0 (0.0%) |
| 35 to 64 Years | 144 (16.2%) | 141 (17.3%) |
| 65 to 74 Years | 23 (7.1%) | 30 (8.2%) |
| 75 Years and over | 35 (44.9%) | 0 (0.0%) |
Disability Class: Self-Care Difficulty
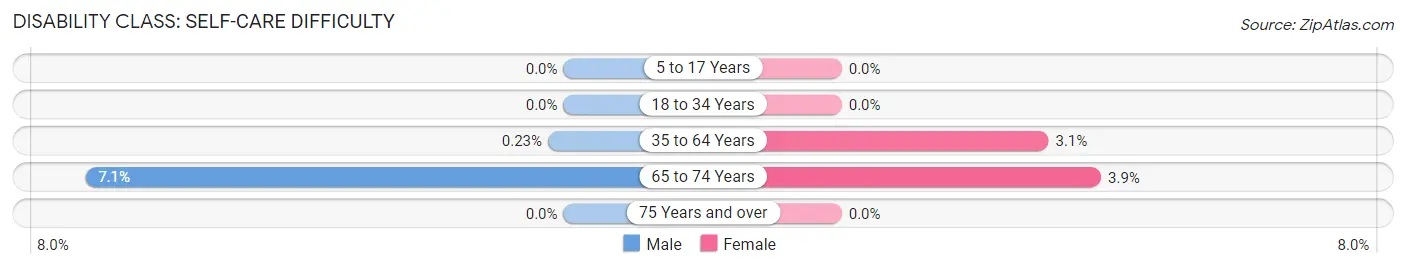
| Age Bracket | Male | Female |
| 5 to 17 Years | 0 (0.0%) | 0 (0.0%) |
| 18 to 34 Years | 0 (0.0%) | 0 (0.0%) |
| 35 to 64 Years | 2 (0.2%) | 25 (3.1%) |
| 65 to 74 Years | 23 (7.1%) | 14 (3.8%) |
| 75 Years and over | 0 (0.0%) | 0 (0.0%) |
Technology Access in Evansdale
Computing Device Access in Evansdale
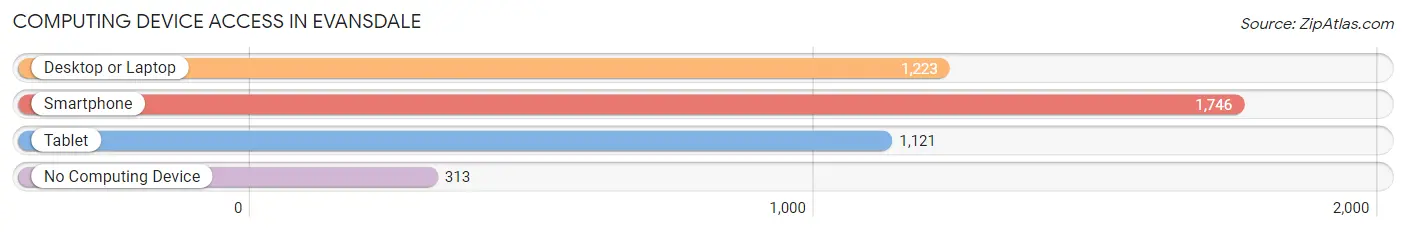
| Device Type | # Households | % Households |
| Desktop or Laptop | 1,223 | 56.5% |
| Smartphone | 1,746 | 80.6% |
| Tablet | 1,121 | 51.7% |
| No Computing Device | 313 | 14.4% |
| Total | 2,166 | 100.0% |
Internet Access in Evansdale
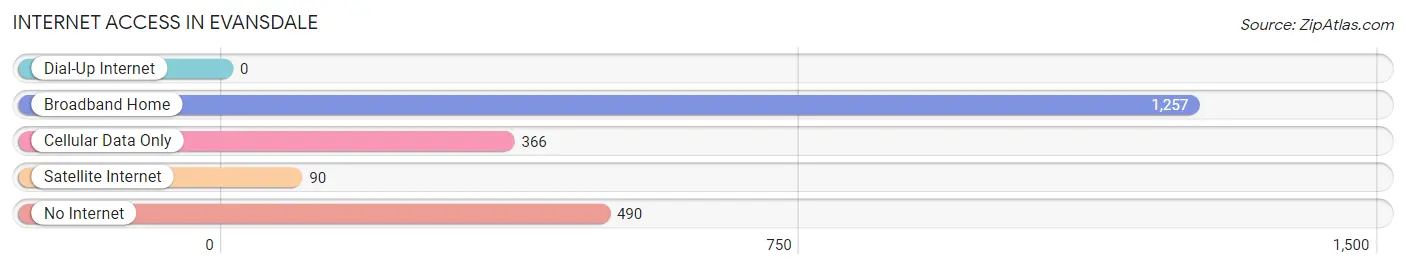
| Internet Type | # Households | % Households |
| Dial-Up Internet | 0 | 0.0% |
| Broadband Home | 1,257 | 58.0% |
| Cellular Data Only | 366 | 16.9% |
| Satellite Internet | 90 | 4.2% |
| No Internet | 490 | 22.6% |
| Total | 2,166 | 100.0% |
Evansdale Summary
Evansdale, Iowa is a small city located in Black Hawk County, Iowa. It is part of the Waterloo-Cedar Falls Metropolitan Statistical Area and is located just north of Waterloo. The city has a population of 5,741 as of the 2010 census.
History
Evansdale was founded in 1855 by William Evans, a Welsh immigrant. The city was originally known as Evans' Dale, but the name was eventually shortened to Evansdale. The city was incorporated in 1876 and has remained a small, rural community ever since.
The city was home to a number of industries in the early 20th century, including a brickyard, a creamery, a flour mill, and a sawmill. The city also had a number of small businesses, including a grocery store, a hardware store, and a blacksmith shop.
Geography
Evansdale is located in Black Hawk County, Iowa, just north of Waterloo. The city is situated on the banks of the Cedar River and is surrounded by rolling hills and farmland. The city has a total area of 2.2 square miles, all of which is land.
Economy
Evansdale is a small, rural community with a largely agricultural economy. The city is home to a number of small businesses, including a grocery store, a hardware store, and a blacksmith shop. The city also has a number of manufacturing and industrial businesses, including a brickyard, a creamery, a flour mill, and a sawmill.
Demographics
As of the 2010 census, Evansdale had a population of 5,741. The racial makeup of the city was 95.3% White, 1.2% African American, 0.3% Native American, 0.7% Asian, 0.1% Pacific Islander, 0.7% from other races, and 1.9% from two or more races. Hispanic or Latino of any race were 2.2% of the population.
The median income for a household in Evansdale was $45,938, and the median income for a family was $51,938. The per capita income for the city was $20,938. About 8.2% of families and 10.2% of the population were below the poverty line, including 14.2% of those under age 18 and 6.2% of those age 65 or over.
Common Questions
What is Per Capita Income in Evansdale?
Per Capita income in Evansdale is $30,484.
What is the Median Family Income in Evansdale?
Median Family Income in Evansdale is $61,367.
What is the Median Household income in Evansdale?
Median Household Income in Evansdale is $54,575.
What is Income or Wage Gap in Evansdale?
Income or Wage Gap in Evansdale is 19.1%.
Women in Evansdale earn 80.9 cents for every dollar earned by a man.
What is Inequality or Gini Index in Evansdale?
Inequality or Gini Index in Evansdale is 0.38.
What is the Total Population of Evansdale?
Total Population of Evansdale is 4,561.
What is the Total Male Population of Evansdale?
Total Male Population of Evansdale is 2,322.
What is the Total Female Population of Evansdale?
Total Female Population of Evansdale is 2,239.
What is the Ratio of Males per 100 Females in Evansdale?
There are 103.71 Males per 100 Females in Evansdale.
What is the Ratio of Females per 100 Males in Evansdale?
There are 96.43 Females per 100 Males in Evansdale.
What is the Median Population Age in Evansdale?
Median Population Age in Evansdale is 40.3 Years.
What is the Average Family Size in Evansdale
Average Family Size in Evansdale is 2.9 People.
What is the Average Household Size in Evansdale
Average Household Size in Evansdale is 2.1 People.
How Large is the Labor Force in Evansdale?
There are 2,705 People in the Labor Forcein in Evansdale.
What is the Percentage of People in the Labor Force in Evansdale?
72.4% of People are in the Labor Force in Evansdale.
What is the Unemployment Rate in Evansdale?
Unemployment Rate in Evansdale is 7.9%.