Epworth, IA Map & Demographics
Epworth Map
Epworth Overview
$30,811
PER CAPITA INCOME
$95,417
AVG FAMILY INCOME
$69,188
AVG HOUSEHOLD INCOME
22.9%
WAGE / INCOME GAP [ % ]
77.1¢/ $1
WAGE / INCOME GAP [ $ ]
0.37
INEQUALITY / GINI INDEX
1,982
TOTAL POPULATION
1,002
MALE POPULATION
980
FEMALE POPULATION
102.24
MALES / 100 FEMALES
97.80
FEMALES / 100 MALES
34.3
MEDIAN AGE
3.4
AVG FAMILY SIZE
2.5
AVG HOUSEHOLD SIZE
1,052
LABOR FORCE [ PEOPLE ]
71.4%
PERCENT IN LABOR FORCE
1.9%
UNEMPLOYMENT RATE
Epworth Zip Codes
Epworth Area Codes
Income in Epworth
Income Overview in Epworth
Per Capita Income in Epworth is $30,811, while median incomes of families and households are $95,417 and $69,188 respectively.
| Characteristic | Number | Measure |
| Per Capita Income | 1,982 | $30,811 |
| Median Family Income | 453 | $95,417 |
| Mean Family Income | 453 | $101,853 |
| Median Household Income | 759 | $69,188 |
| Mean Household Income | 759 | $79,202 |
| Income Deficit | 453 | $0 |
| Wage / Income Gap (%) | 1,982 | 22.87% |
| Wage / Income Gap ($) | 1,982 | 77.13¢ per $1 |
| Gini / Inequality Index | 1,982 | 0.37 |
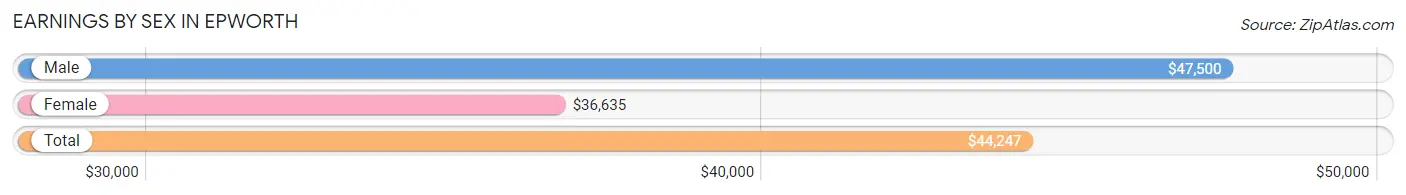
Earnings by Sex in Epworth
Average Earnings in Epworth are $44,247, $47,500 for men and $36,635 for women, a difference of 22.9%.
| Sex | Number | Average Earnings |
| Male | 538 (48.5%) | $47,500 |
| Female | 572 (51.5%) | $36,635 |
| Total | 1,110 (100.0%) | $44,247 |
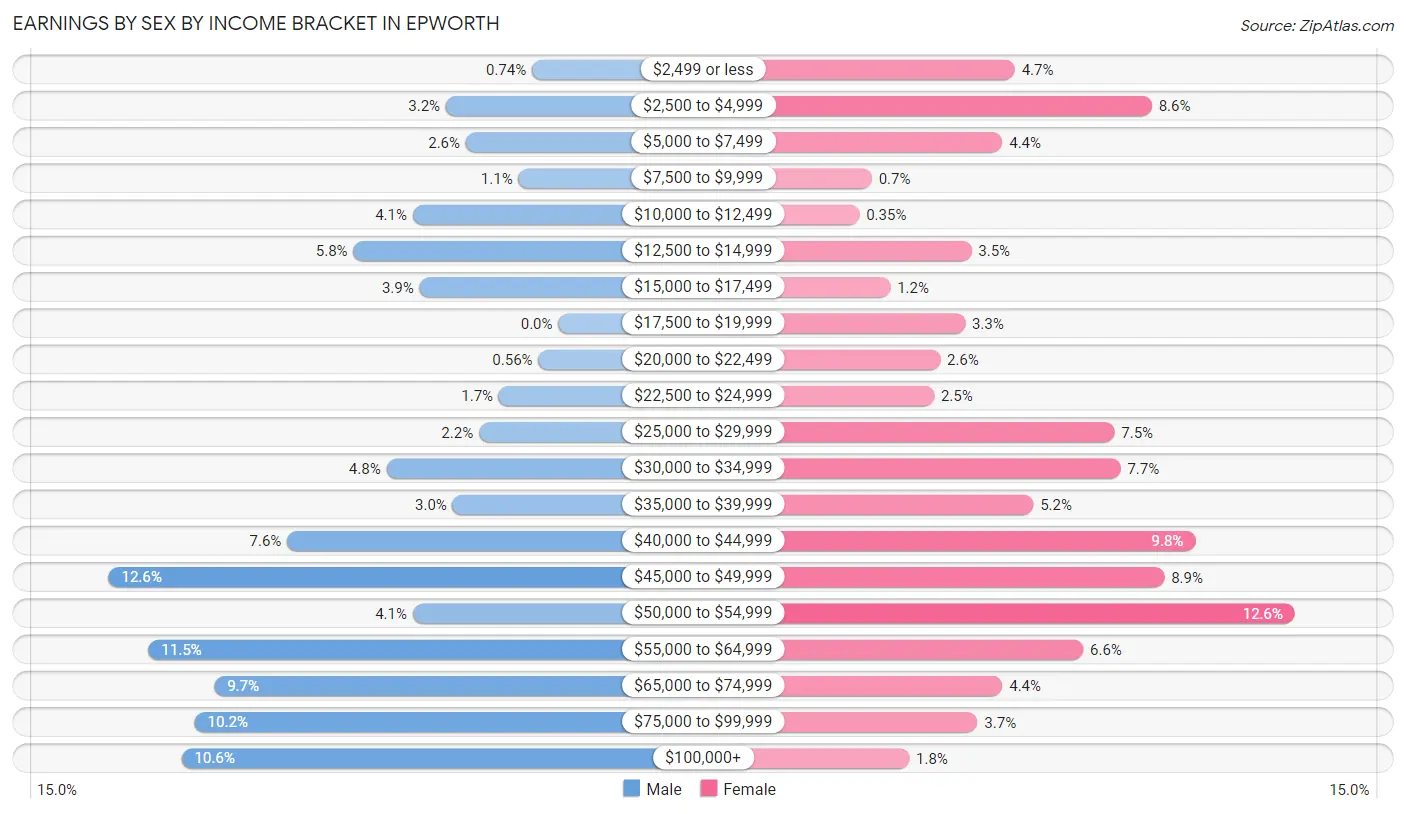
Earnings by Sex by Income Bracket in Epworth
The most common earnings brackets in Epworth are $45,000 to $49,999 for men (68 | 12.6%) and $50,000 to $54,999 for women (72 | 12.6%).
| Income | Male | Female |
| $2,499 or less | 4 (0.7%) | 27 (4.7%) |
| $2,500 to $4,999 | 17 (3.2%) | 49 (8.6%) |
| $5,000 to $7,499 | 14 (2.6%) | 25 (4.4%) |
| $7,500 to $9,999 | 6 (1.1%) | 4 (0.7%) |
| $10,000 to $12,499 | 22 (4.1%) | 2 (0.4%) |
| $12,500 to $14,999 | 31 (5.8%) | 20 (3.5%) |
| $15,000 to $17,499 | 21 (3.9%) | 7 (1.2%) |
| $17,500 to $19,999 | 0 (0.0%) | 19 (3.3%) |
| $20,000 to $22,499 | 3 (0.6%) | 15 (2.6%) |
| $22,500 to $24,999 | 9 (1.7%) | 14 (2.5%) |
| $25,000 to $29,999 | 12 (2.2%) | 43 (7.5%) |
| $30,000 to $34,999 | 26 (4.8%) | 44 (7.7%) |
| $35,000 to $39,999 | 16 (3.0%) | 30 (5.2%) |
| $40,000 to $44,999 | 41 (7.6%) | 56 (9.8%) |
| $45,000 to $49,999 | 68 (12.6%) | 51 (8.9%) |
| $50,000 to $54,999 | 22 (4.1%) | 72 (12.6%) |
| $55,000 to $64,999 | 62 (11.5%) | 38 (6.6%) |
| $65,000 to $74,999 | 52 (9.7%) | 25 (4.4%) |
| $75,000 to $99,999 | 55 (10.2%) | 21 (3.7%) |
| $100,000+ | 57 (10.6%) | 10 (1.8%) |
| Total | 538 (100.0%) | 572 (100.0%) |
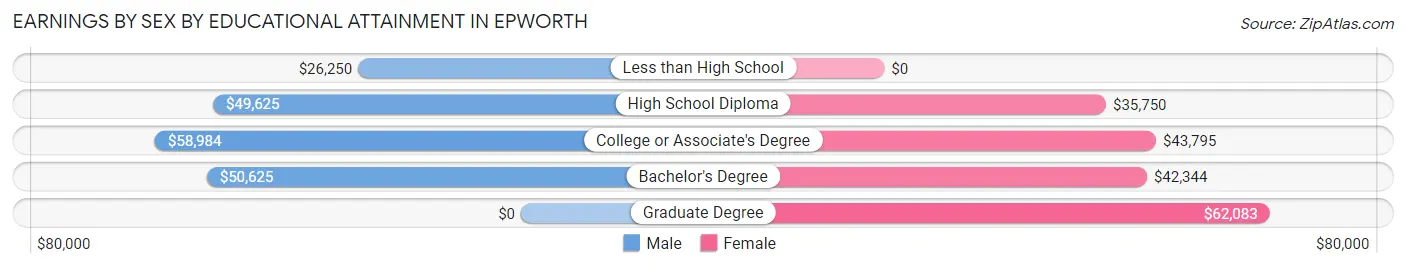
Earnings by Sex by Educational Attainment in Epworth
Average earnings in Epworth are $52,857 for men and $43,040 for women, a difference of 18.6%. Men with an educational attainment of college or associate's degree enjoy the highest average annual earnings of $58,984, while those with less than high school education earn the least with $26,250. Women with an educational attainment of graduate degree earn the most with the average annual earnings of $62,083, while those with high school diploma education have the smallest earnings of $35,750.
| Educational Attainment | Male Income | Female Income |
| Less than High School | $26,250 | $0 |
| High School Diploma | $49,625 | $35,750 |
| College or Associate's Degree | $58,984 | $43,795 |
| Bachelor's Degree | $50,625 | $42,344 |
| Graduate Degree | - | - |
| Total | $52,857 | $43,040 |
Family Income in Epworth
Family Income Brackets in Epworth
According to the Epworth family income data, there are 154 families falling into the $100,000 to $149,999 income range, which is the most common income bracket and makes up 34.0% of all families.
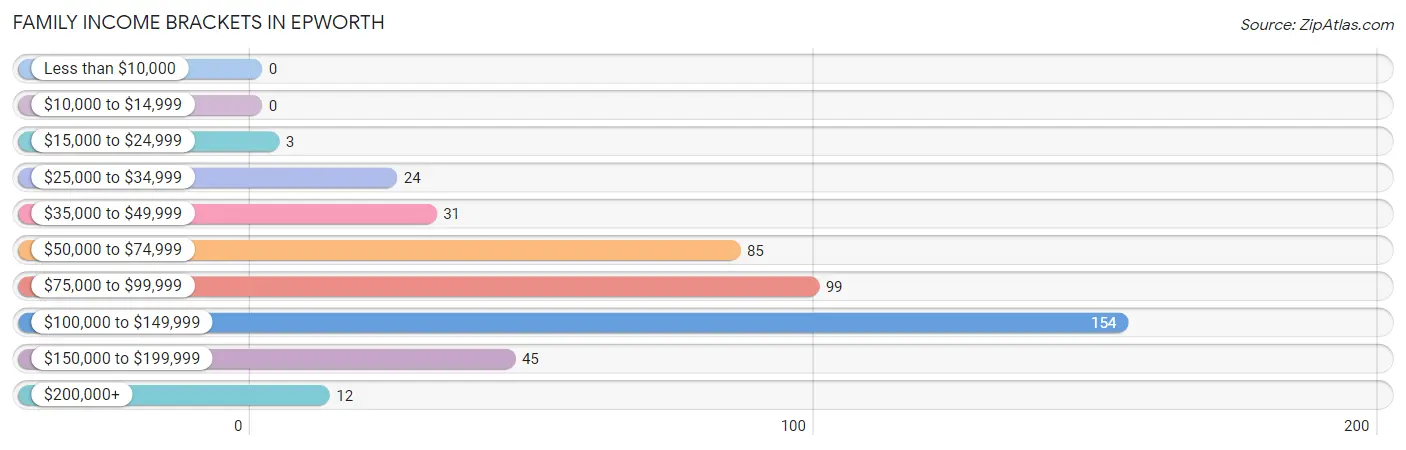
| Income Bracket | # Families | % Families |
| Less than $10,000 | 0 | 0.0% |
| $10,000 to $14,999 | 0 | 0.0% |
| $15,000 to $24,999 | 3 | 0.7% |
| $25,000 to $34,999 | 24 | 5.3% |
| $35,000 to $49,999 | 31 | 6.8% |
| $50,000 to $74,999 | 85 | 18.8% |
| $75,000 to $99,999 | 99 | 21.9% |
| $100,000 to $149,999 | 154 | 34.0% |
| $150,000 to $199,999 | 45 | 9.9% |
| $200,000+ | 12 | 2.6% |
Family Income by Famaliy Size in Epworth
6-person families (20 | 4.4%) account for the highest median family income in Epworth with $116,250 per family, while 2-person families (147 | 32.5%) have the highest median income of $37,656 per family member.
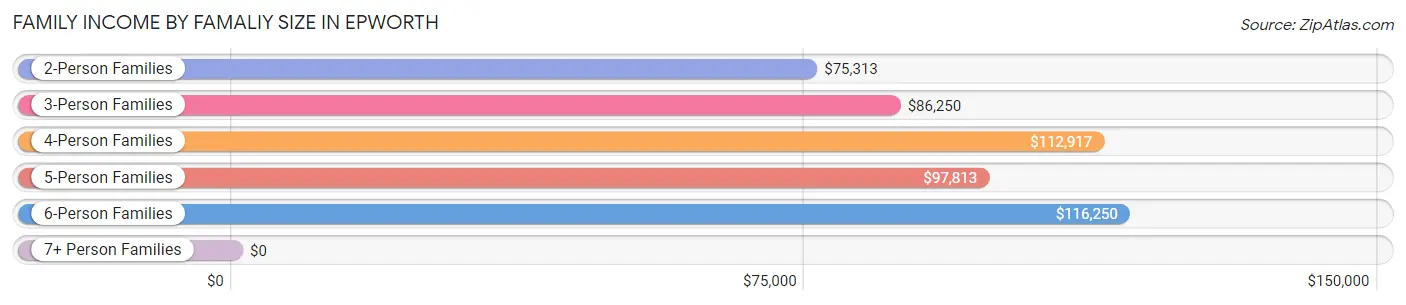
| Income Bracket | # Families | Median Income |
| 2-Person Families | 147 (32.5%) | $75,313 |
| 3-Person Families | 103 (22.7%) | $86,250 |
| 4-Person Families | 118 (26.1%) | $112,917 |
| 5-Person Families | 59 (13.0%) | $97,813 |
| 6-Person Families | 20 (4.4%) | $116,250 |
| 7+ Person Families | 6 (1.3%) | $0 |
| Total | 453 (100.0%) | $95,417 |
Family Income by Number of Earners in Epworth
The median family income in Epworth is $95,417, with families comprising 3+ earners (63) having the highest median family income of $139,583, while families with no earners (41) have the lowest median family income of $48,125, accounting for 13.9% and 9.0% of families, respectively.
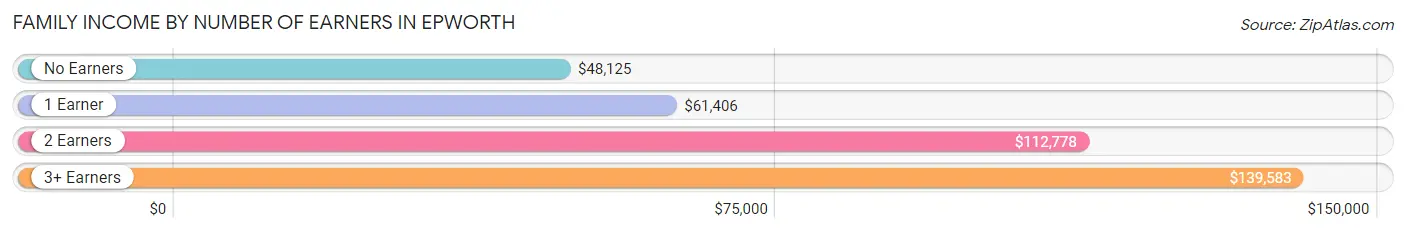
| Number of Earners | # Families | Median Income |
| No Earners | 41 (9.0%) | $48,125 |
| 1 Earner | 77 (17.0%) | $61,406 |
| 2 Earners | 272 (60.0%) | $112,778 |
| 3+ Earners | 63 (13.9%) | $139,583 |
| Total | 453 (100.0%) | $95,417 |
Household Income in Epworth
Household Income Brackets in Epworth
With 179 households falling in the category, the $100,000 to $149,999 income range is the most frequent in Epworth, accounting for 23.6% of all households. In contrast, only 14 households (1.8%) fall into the less than $10,000 income bracket, making it the least populous group.
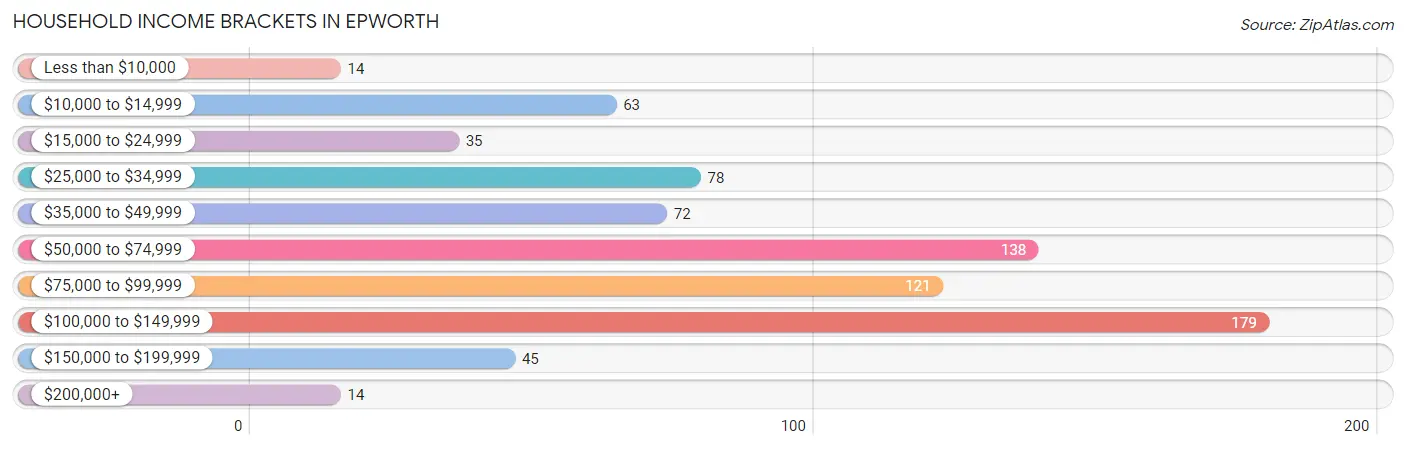
| Income Bracket | # Households | % Households |
| Less than $10,000 | 14 | 1.8% |
| $10,000 to $14,999 | 63 | 8.3% |
| $15,000 to $24,999 | 35 | 4.6% |
| $25,000 to $34,999 | 78 | 10.3% |
| $35,000 to $49,999 | 72 | 9.5% |
| $50,000 to $74,999 | 138 | 18.2% |
| $75,000 to $99,999 | 121 | 15.9% |
| $100,000 to $149,999 | 179 | 23.6% |
| $150,000 to $199,999 | 45 | 5.9% |
| $200,000+ | 14 | 1.8% |
Household Income by Householder Age in Epworth
The median household income in Epworth is $69,188, with the highest median household income of $89,688 found in the 25 to 44 years age bracket for the primary householder. A total of 274 households (36.1%) fall into this category. Meanwhile, the 65+ years age bracket for the primary householder has the lowest median household income of $31,985, with 217 households (28.6%) in this group.
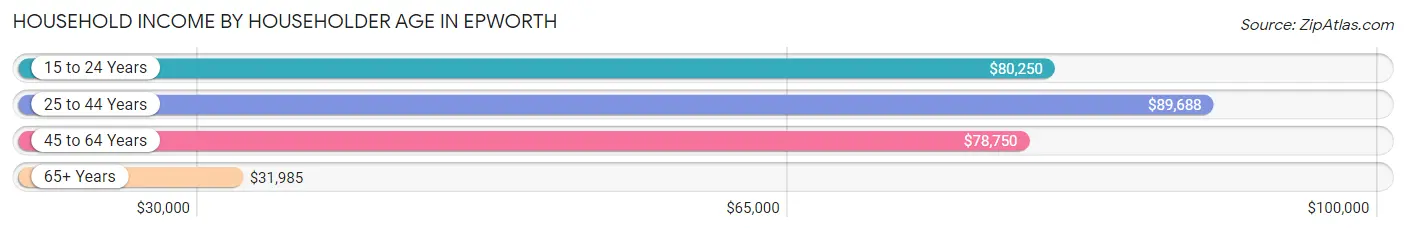
| Income Bracket | # Households | Median Income |
| 15 to 24 Years | 24 (3.2%) | $80,250 |
| 25 to 44 Years | 274 (36.1%) | $89,688 |
| 45 to 64 Years | 244 (32.2%) | $78,750 |
| 65+ Years | 217 (28.6%) | $31,985 |
| Total | 759 (100.0%) | $69,188 |
Poverty in Epworth
Income Below Poverty by Sex and Age in Epworth
With 4.3% poverty level for males and 6.9% for females among the residents of Epworth, 5 year old males and 75 year old and over females are the most vulnerable to poverty, with 4 males (14.3%) and 17 females (21.5%) in their respective age groups living below the poverty level.
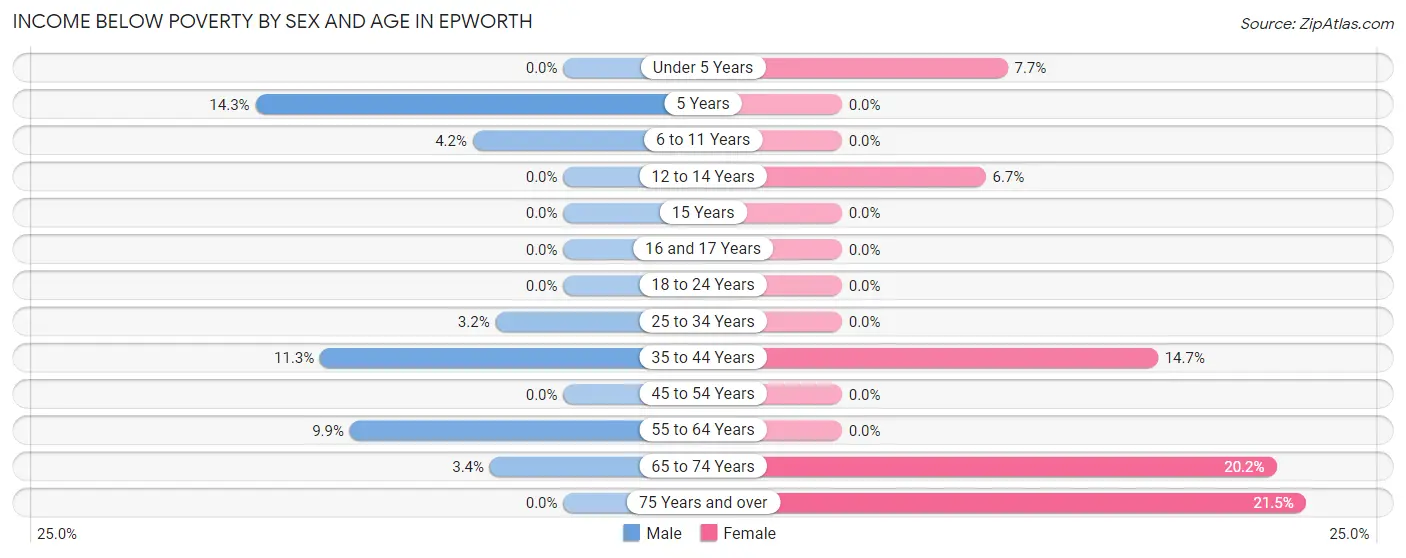
| Age Bracket | Male | Female |
| Under 5 Years | 0 (0.0%) | 4 (7.7%) |
| 5 Years | 4 (14.3%) | 0 (0.0%) |
| 6 to 11 Years | 5 (4.2%) | 0 (0.0%) |
| 12 to 14 Years | 0 (0.0%) | 4 (6.7%) |
| 15 Years | 0 (0.0%) | 0 (0.0%) |
| 16 and 17 Years | 0 (0.0%) | 0 (0.0%) |
| 18 to 24 Years | 0 (0.0%) | 0 (0.0%) |
| 25 to 34 Years | 4 (3.2%) | 0 (0.0%) |
| 35 to 44 Years | 14 (11.3%) | 17 (14.7%) |
| 45 to 54 Years | 0 (0.0%) | 0 (0.0%) |
| 55 to 64 Years | 11 (9.9%) | 0 (0.0%) |
| 65 to 74 Years | 3 (3.4%) | 25 (20.2%) |
| 75 Years and over | 0 (0.0%) | 17 (21.5%) |
| Total | 41 (4.3%) | 67 (6.9%) |
Income Above Poverty by Sex and Age in Epworth
According to the poverty statistics in Epworth, males aged under 5 years and females aged 5 years are the age groups that are most secure financially, with 100.0% of males and 100.0% of females in these age groups living above the poverty line.
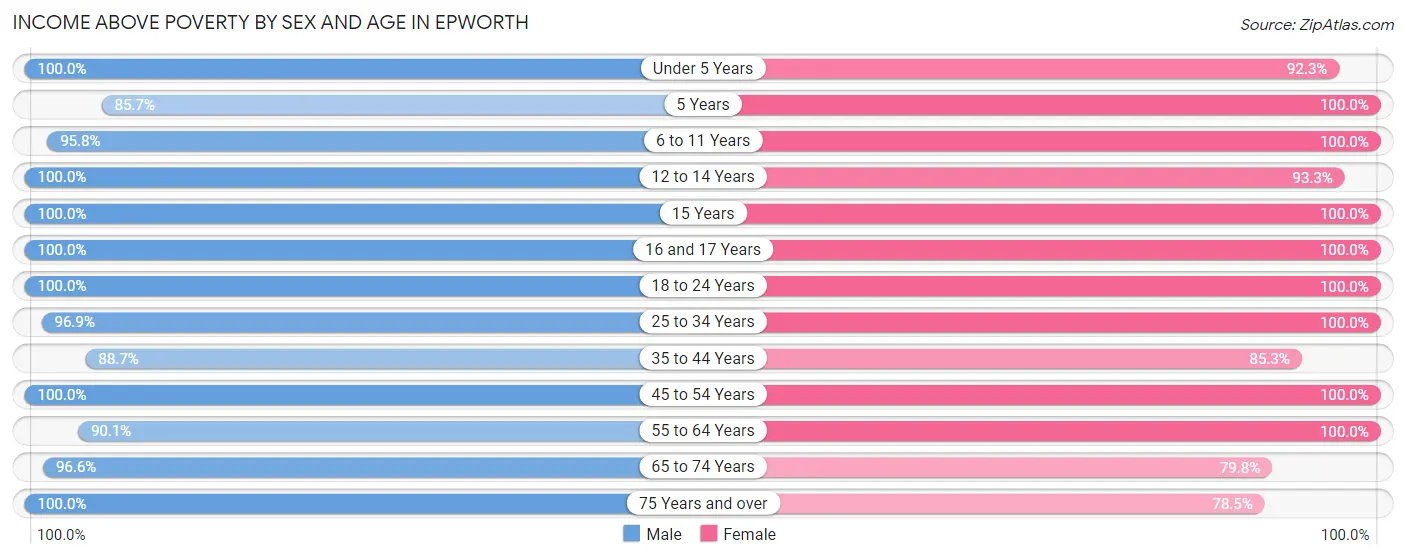
| Age Bracket | Male | Female |
| Under 5 Years | 62 (100.0%) | 48 (92.3%) |
| 5 Years | 24 (85.7%) | 18 (100.0%) |
| 6 to 11 Years | 114 (95.8%) | 79 (100.0%) |
| 12 to 14 Years | 61 (100.0%) | 56 (93.3%) |
| 15 Years | 23 (100.0%) | 6 (100.0%) |
| 16 and 17 Years | 15 (100.0%) | 14 (100.0%) |
| 18 to 24 Years | 58 (100.0%) | 91 (100.0%) |
| 25 to 34 Years | 123 (96.9%) | 137 (100.0%) |
| 35 to 44 Years | 110 (88.7%) | 99 (85.3%) |
| 45 to 54 Years | 91 (100.0%) | 76 (100.0%) |
| 55 to 64 Years | 100 (90.1%) | 119 (100.0%) |
| 65 to 74 Years | 85 (96.6%) | 99 (79.8%) |
| 75 Years and over | 41 (100.0%) | 62 (78.5%) |
| Total | 907 (95.7%) | 904 (93.1%) |
Income Below Poverty Among Married-Couple Families in Epworth
The poverty statistics for married-couple families in Epworth show that 1.0% or 4 of the total 406 families live below the poverty line. Families with 3 or 4 children have the highest poverty rate of 5.6%, comprising of 4 families. On the other hand, families with no children have the lowest poverty rate of 0.0%, which includes 0 families.
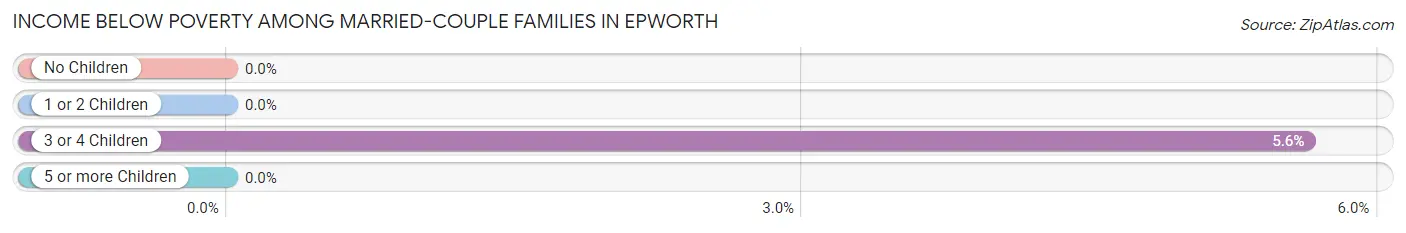
| Children | Above Poverty | Below Poverty |
| No Children | 182 (100.0%) | 0 (0.0%) |
| 1 or 2 Children | 149 (100.0%) | 0 (0.0%) |
| 3 or 4 Children | 67 (94.4%) | 4 (5.6%) |
| 5 or more Children | 4 (100.0%) | 0 (0.0%) |
| Total | 402 (99.0%) | 4 (1.0%) |
Income Below Poverty Among Single-Parent Households in Epworth
| Children | Single Father | Single Mother |
| No Children | 0 (0.0%) | 0 (0.0%) |
| 1 or 2 Children | 0 (0.0%) | 0 (0.0%) |
| 3 or 4 Children | 0 (0.0%) | 0 (0.0%) |
| 5 or more Children | 0 (0.0%) | 0 (0.0%) |
| Total | 0 (0.0%) | 0 (0.0%) |
Income Below Poverty Among Married-Couple vs Single-Parent Households in Epworth
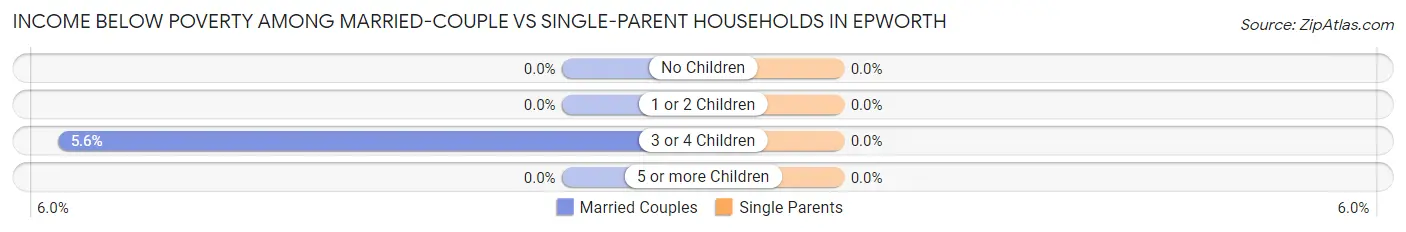
| Children | Married-Couple Families | Single-Parent Households |
| No Children | 0 (0.0%) | 0 (0.0%) |
| 1 or 2 Children | 0 (0.0%) | 0 (0.0%) |
| 3 or 4 Children | 4 (5.6%) | 0 (0.0%) |
| 5 or more Children | 0 (0.0%) | 0 (0.0%) |
| Total | 4 (1.0%) | 0 (0.0%) |
Race in Epworth
The most populous races in Epworth are White / Caucasian (1,953 | 98.5%), Hispanic or Latino (36 | 1.8%), and Two or more Races (17 | 0.9%).
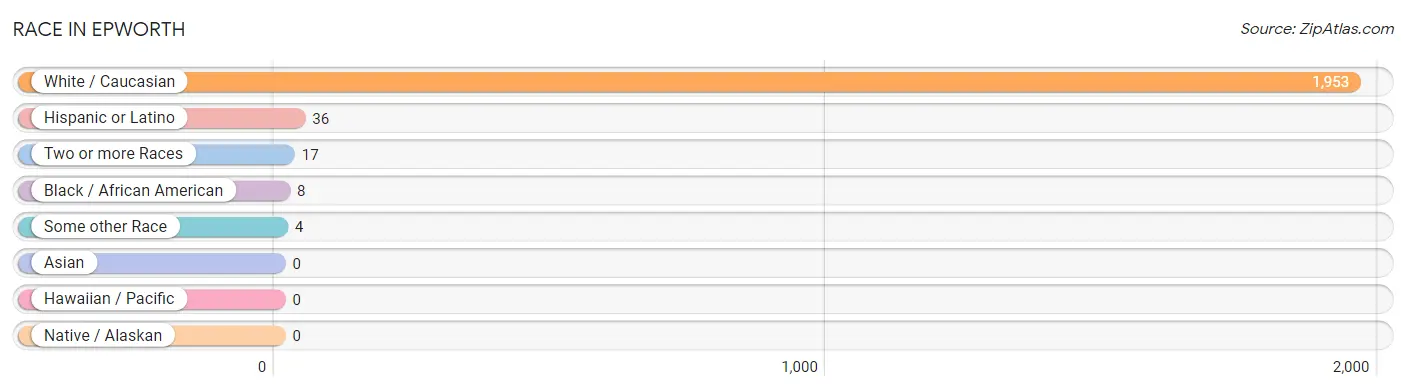
| Race | # Population | % Population |
| Asian | 0 | 0.0% |
| Black / African American | 8 | 0.4% |
| Hawaiian / Pacific | 0 | 0.0% |
| Hispanic or Latino | 36 | 1.8% |
| Native / Alaskan | 0 | 0.0% |
| White / Caucasian | 1,953 | 98.5% |
| Two or more Races | 17 | 0.9% |
| Some other Race | 4 | 0.2% |
| Total | 1,982 | 100.0% |
Ancestry in Epworth
The most populous ancestries reported in Epworth are German (890 | 44.9%), Irish (398 | 20.1%), English (114 | 5.8%), American (78 | 3.9%), and Dutch (39 | 2.0%), together accounting for 76.6% of all Epworth residents.
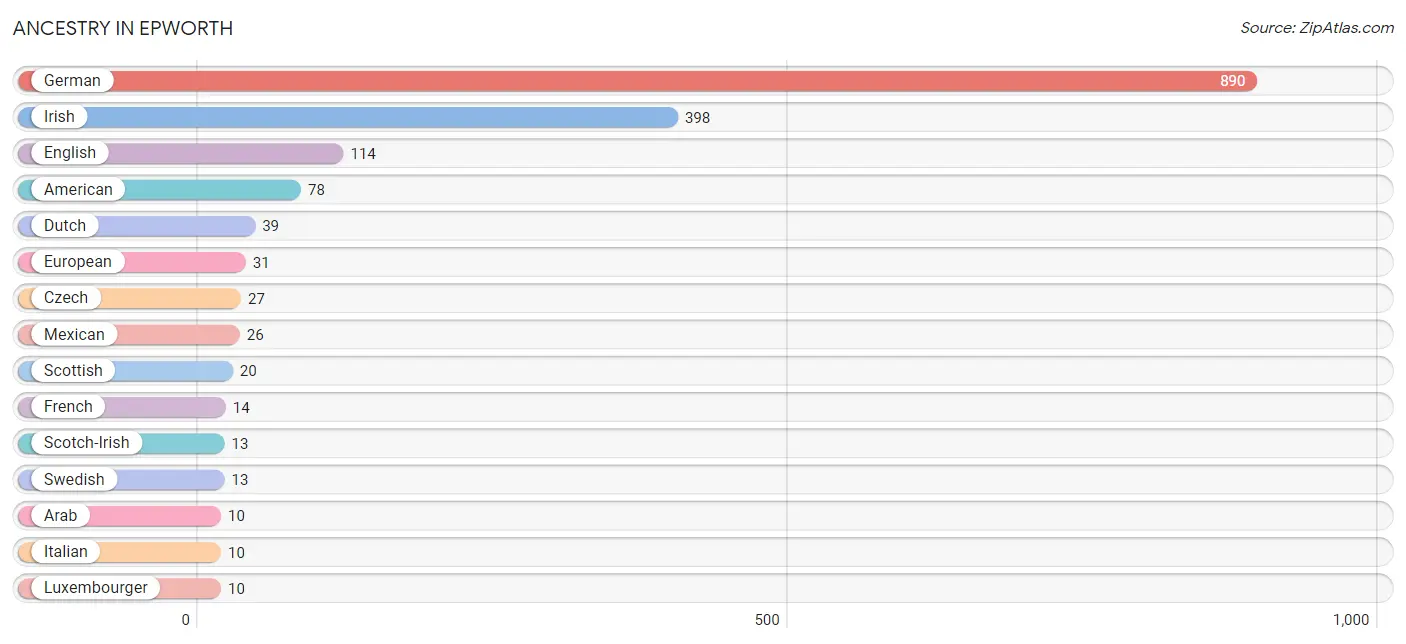
| Ancestry | # Population | % Population |
| American | 78 | 3.9% |
| Arab | 10 | 0.5% |
| Austrian | 3 | 0.2% |
| Croatian | 1 | 0.1% |
| Czech | 27 | 1.4% |
| Czechoslovakian | 2 | 0.1% |
| Dutch | 39 | 2.0% |
| English | 114 | 5.8% |
| European | 31 | 1.6% |
| French | 14 | 0.7% |
| German | 890 | 44.9% |
| Irish | 398 | 20.1% |
| Italian | 10 | 0.5% |
| Luxembourger | 10 | 0.5% |
| Mexican | 26 | 1.3% |
| Moroccan | 10 | 0.5% |
| Norwegian | 5 | 0.3% |
| Polish | 8 | 0.4% |
| Scotch-Irish | 13 | 0.7% |
| Scottish | 20 | 1.0% |
| Slovene | 1 | 0.1% |
| Spaniard | 10 | 0.5% |
| Swedish | 13 | 0.7% |
| Ukrainian | 3 | 0.2% | View All 24 Rows |
Immigrants in Epworth
The most numerous immigrant groups reported in Epworth came from Europe (1 | 0.1%), Germany (1 | 0.1%), and Western Europe (1 | 0.1%), together accounting for 0.2% of all Epworth residents.
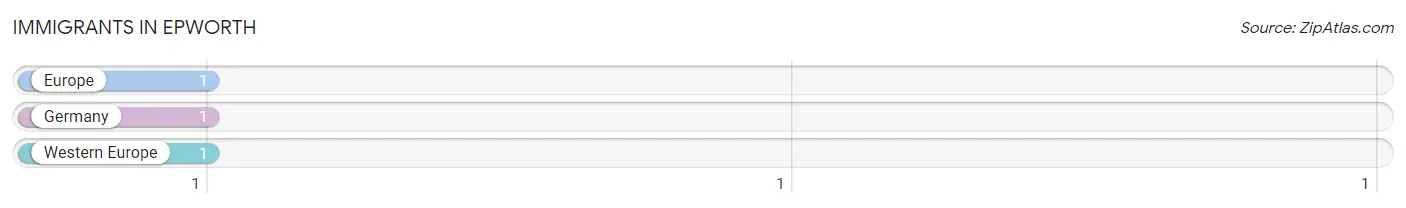
| Immigration Origin | # Population | % Population |
| Europe | 1 | 0.1% |
| Germany | 1 | 0.1% |
| Western Europe | 1 | 0.1% | View All 3 Rows |
Sex and Age in Epworth
Sex and Age in Epworth
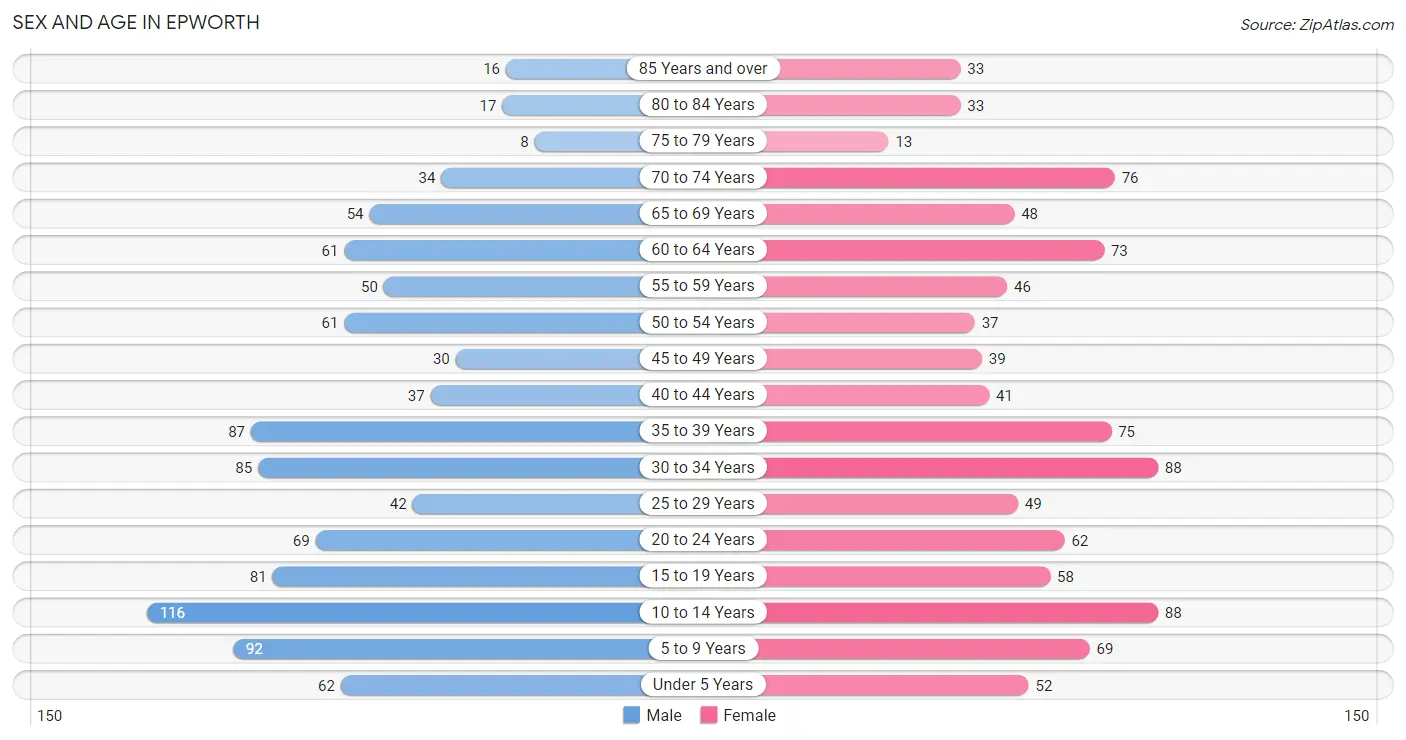
The most populous age groups in Epworth are 10 to 14 Years (116 | 11.6%) for men and 10 to 14 Years (88 | 9.0%) for women.
| Age Bracket | Male | Female |
| Under 5 Years | 62 (6.2%) | 52 (5.3%) |
| 5 to 9 Years | 92 (9.2%) | 69 (7.0%) |
| 10 to 14 Years | 116 (11.6%) | 88 (9.0%) |
| 15 to 19 Years | 81 (8.1%) | 58 (5.9%) |
| 20 to 24 Years | 69 (6.9%) | 62 (6.3%) |
| 25 to 29 Years | 42 (4.2%) | 49 (5.0%) |
| 30 to 34 Years | 85 (8.5%) | 88 (9.0%) |
| 35 to 39 Years | 87 (8.7%) | 75 (7.6%) |
| 40 to 44 Years | 37 (3.7%) | 41 (4.2%) |
| 45 to 49 Years | 30 (3.0%) | 39 (4.0%) |
| 50 to 54 Years | 61 (6.1%) | 37 (3.8%) |
| 55 to 59 Years | 50 (5.0%) | 46 (4.7%) |
| 60 to 64 Years | 61 (6.1%) | 73 (7.4%) |
| 65 to 69 Years | 54 (5.4%) | 48 (4.9%) |
| 70 to 74 Years | 34 (3.4%) | 76 (7.8%) |
| 75 to 79 Years | 8 (0.8%) | 13 (1.3%) |
| 80 to 84 Years | 17 (1.7%) | 33 (3.4%) |
| 85 Years and over | 16 (1.6%) | 33 (3.4%) |
| Total | 1,002 (100.0%) | 980 (100.0%) |
Families and Households in Epworth
Median Family Size in Epworth
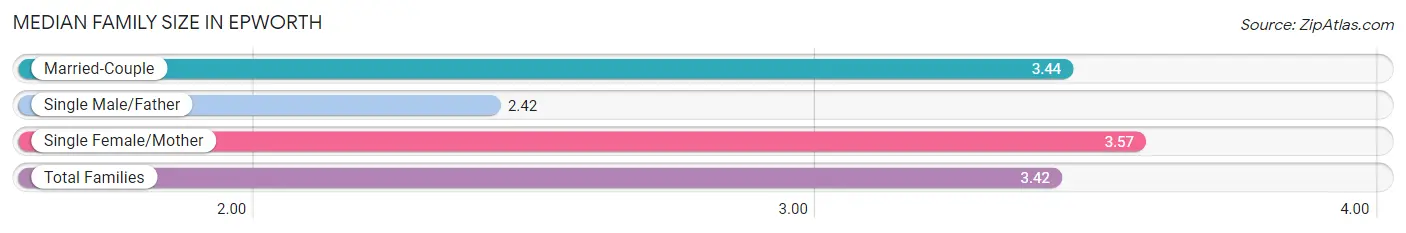
The median family size in Epworth is 3.42 persons per family, with single female/mother families (35 | 7.7%) accounting for the largest median family size of 3.57 persons per family. On the other hand, single male/father families (12 | 2.6%) represent the smallest median family size with 2.42 persons per family.
| Family Type | # Families | Family Size |
| Married-Couple | 406 (89.6%) | 3.44 |
| Single Male/Father | 12 (2.6%) | 2.42 |
| Single Female/Mother | 35 (7.7%) | 3.57 |
| Total Families | 453 (100.0%) | 3.42 |
Median Household Size in Epworth
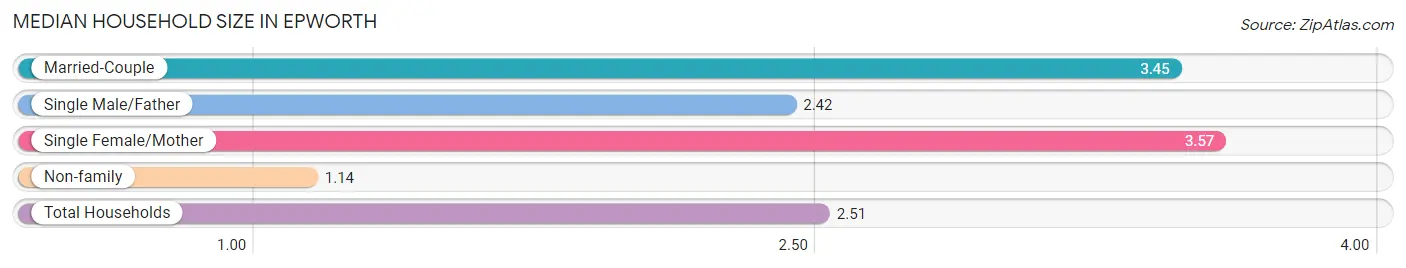
The median household size in Epworth is 2.51 persons per household, with single female/mother households (35 | 4.6%) accounting for the largest median household size of 3.57 persons per household. non-family households (306 | 40.3%) represent the smallest median household size with 1.14 persons per household.
| Household Type | # Households | Household Size |
| Married-Couple | 406 (53.5%) | 3.45 |
| Single Male/Father | 12 (1.6%) | 2.42 |
| Single Female/Mother | 35 (4.6%) | 3.57 |
| Non-family | 306 (40.3%) | 1.14 |
| Total Households | 759 (100.0%) | 2.51 |
Household Size by Marriage Status in Epworth
Out of a total of 759 households in Epworth, 453 (59.7%) are family households, while 306 (40.3%) are nonfamily households. The most numerous type of family households are 2-person households, comprising 147, and the most common type of nonfamily households are 1-person households, comprising 263.
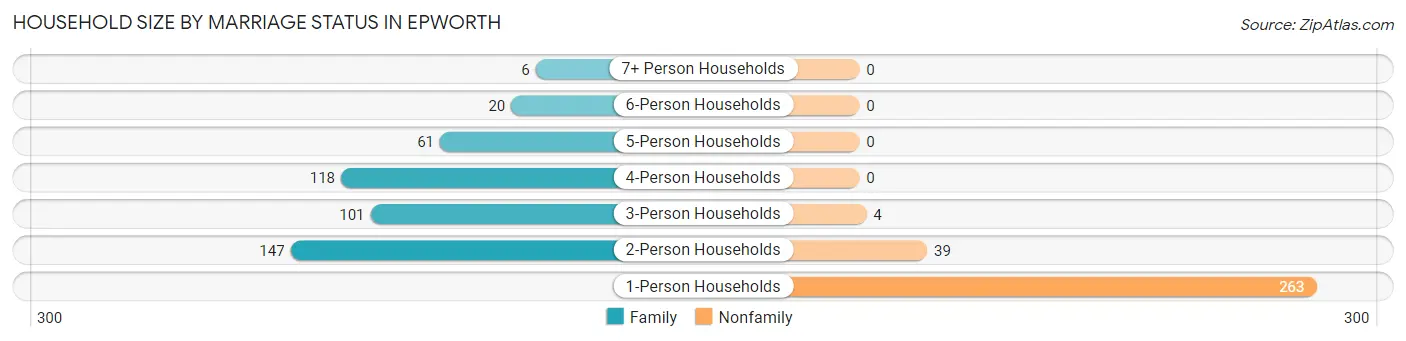
| Household Size | Family Households | Nonfamily Households |
| 1-Person Households | - | 263 (34.6%) |
| 2-Person Households | 147 (19.4%) | 39 (5.1%) |
| 3-Person Households | 101 (13.3%) | 4 (0.5%) |
| 4-Person Households | 118 (15.5%) | 0 (0.0%) |
| 5-Person Households | 61 (8.0%) | 0 (0.0%) |
| 6-Person Households | 20 (2.6%) | 0 (0.0%) |
| 7+ Person Households | 6 (0.8%) | 0 (0.0%) |
| Total | 453 (59.7%) | 306 (40.3%) |
Female Fertility in Epworth
Fertility by Age in Epworth
Average fertility rate in Epworth is 81.0 births per 1,000 women. Women in the age bracket of 20 to 34 years have the highest fertility rate with 151.0 births per 1,000 women. Women in the age bracket of 20 to 34 years acount for 88.2% of all women with births.
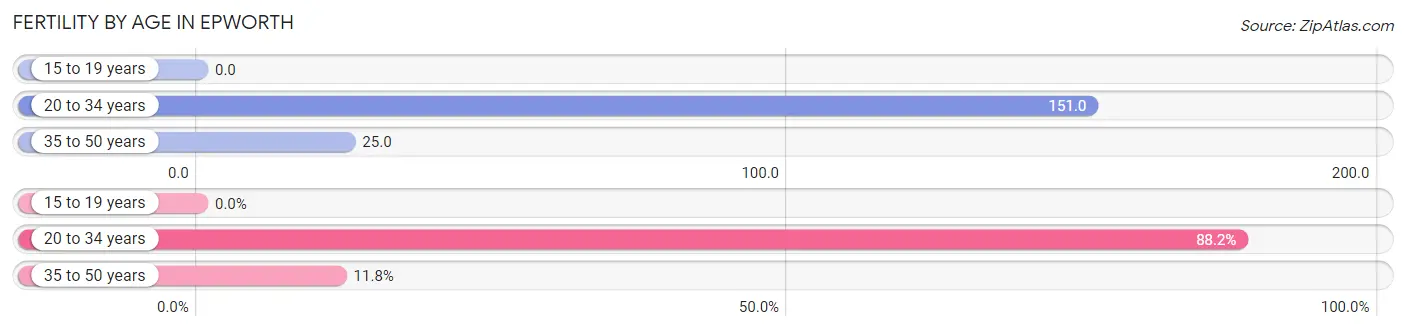
| Age Bracket | Women with Births | Births / 1,000 Women |
| 15 to 19 years | 0 (0.0%) | 0.0 |
| 20 to 34 years | 30 (88.2%) | 151.0 |
| 35 to 50 years | 4 (11.8%) | 25.0 |
| Total | 34 (100.0%) | 81.0 |
Fertility by Age by Marriage Status in Epworth
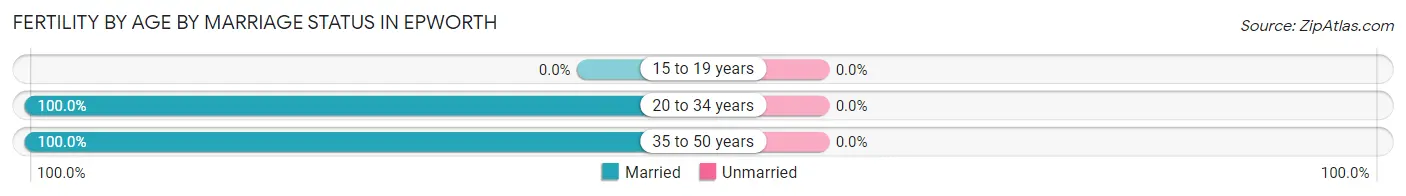
| Age Bracket | Married | Unmarried |
| 15 to 19 years | 0 (0.0%) | 0 (0.0%) |
| 20 to 34 years | 30 (100.0%) | 0 (0.0%) |
| 35 to 50 years | 4 (100.0%) | 0 (0.0%) |
| Total | 34 (100.0%) | 0 (0.0%) |
Fertility by Education in Epworth
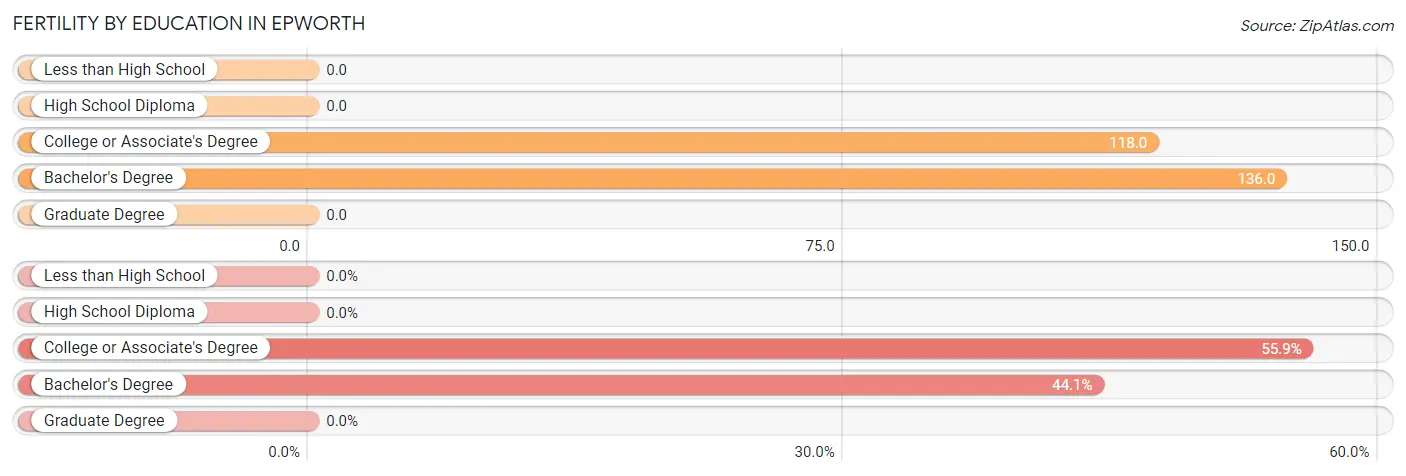
| Educational Attainment | Women with Births | Births / 1,000 Women |
| Less than High School | 0 (0.0%) | 0.0 |
| High School Diploma | 0 (0.0%) | 0.0 |
| College or Associate's Degree | 19 (55.9%) | 118.0 |
| Bachelor's Degree | 15 (44.1%) | 136.0 |
| Graduate Degree | 0 (0.0%) | 0.0 |
| Total | 34 (100.0%) | 81.0 |
Fertility by Education by Marriage Status in Epworth
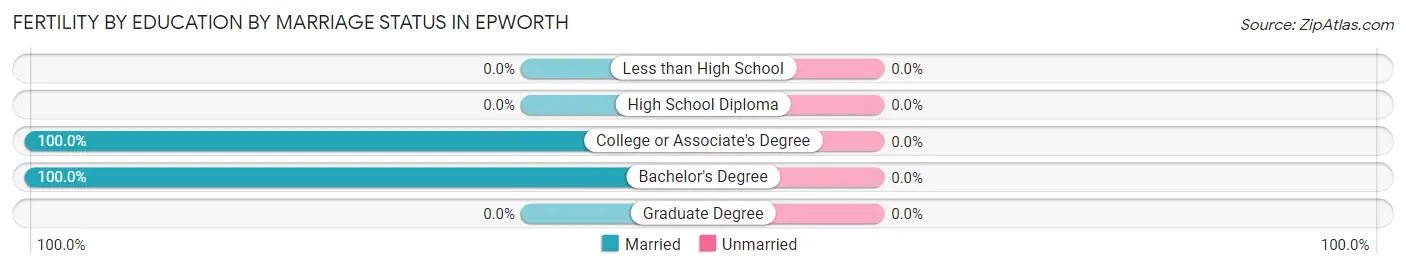
| Educational Attainment | Married | Unmarried |
| Less than High School | 0 (0.0%) | 0 (0.0%) |
| High School Diploma | 0 (0.0%) | 0 (0.0%) |
| College or Associate's Degree | 19 (100.0%) | 0 (0.0%) |
| Bachelor's Degree | 15 (100.0%) | 0 (0.0%) |
| Graduate Degree | 0 (0.0%) | 0 (0.0%) |
| Total | 34 (100.0%) | 0 (0.0%) |
Employment Characteristics in Epworth
Employment by Class of Employer in Epworth
Among the 1,014 employed individuals in Epworth, private company employees (641 | 63.2%), local government employees (119 | 11.7%), and not-for-profit organizations (95 | 9.4%) make up the most common classes of employment.
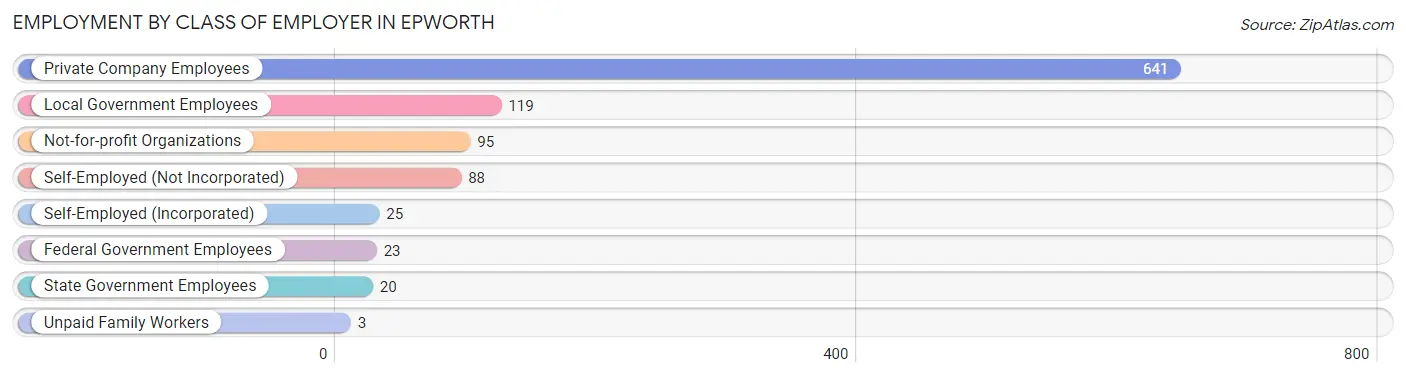
| Employer Class | # Employees | % Employees |
| Private Company Employees | 641 | 63.2% |
| Self-Employed (Incorporated) | 25 | 2.5% |
| Self-Employed (Not Incorporated) | 88 | 8.7% |
| Not-for-profit Organizations | 95 | 9.4% |
| Local Government Employees | 119 | 11.7% |
| State Government Employees | 20 | 2.0% |
| Federal Government Employees | 23 | 2.3% |
| Unpaid Family Workers | 3 | 0.3% |
| Total | 1,014 | 100.0% |
Employment Status by Age in Epworth
According to the labor force statistics for Epworth, out of the total population over 16 years of age (1,474), 71.4% or 1,052 individuals are in the labor force, with 1.9% or 20 of them unemployed. The age group with the highest labor force participation rate is 30 to 34 years, with 98.3% or 170 individuals in the labor force. Within the labor force, the 20 to 24 years age range has the highest percentage of unemployed individuals, with 5.4% or 5 of them being unemployed.
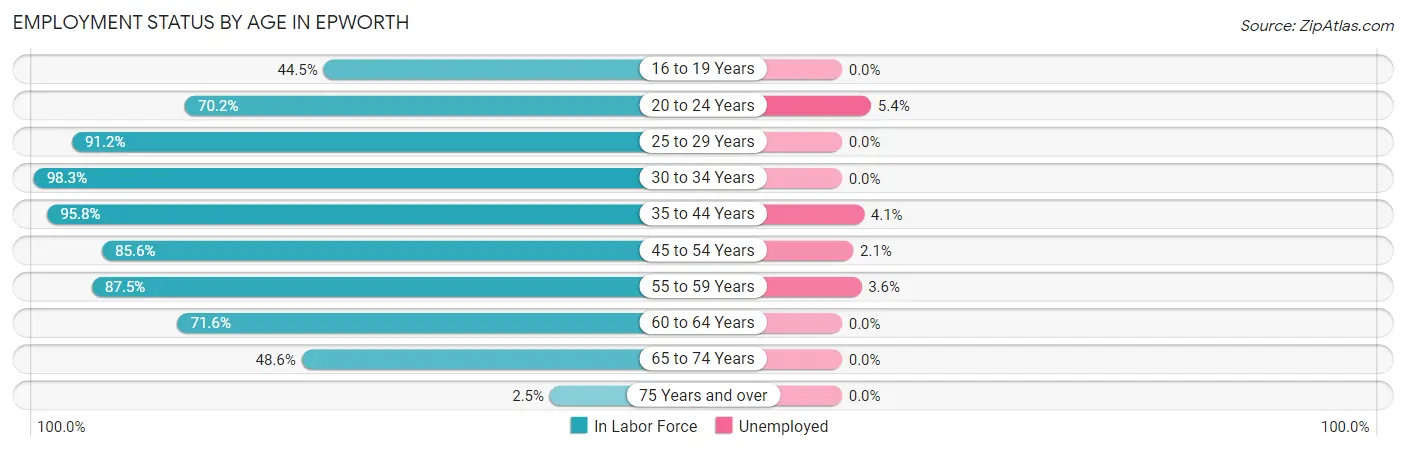
| Age Bracket | In Labor Force | Unemployed |
| 16 to 19 Years | 49 (44.5%) | 0 (0.0%) |
| 20 to 24 Years | 92 (70.2%) | 5 (5.4%) |
| 25 to 29 Years | 83 (91.2%) | 0 (0.0%) |
| 30 to 34 Years | 170 (98.3%) | 0 (0.0%) |
| 35 to 44 Years | 230 (95.8%) | 9 (4.1%) |
| 45 to 54 Years | 143 (85.6%) | 3 (2.1%) |
| 55 to 59 Years | 84 (87.5%) | 3 (3.6%) |
| 60 to 64 Years | 96 (71.6%) | 0 (0.0%) |
| 65 to 74 Years | 103 (48.6%) | 0 (0.0%) |
| 75 Years and over | 3 (2.5%) | 0 (0.0%) |
| Total | 1,052 (71.4%) | 20 (1.9%) |
Employment Status by Educational Attainment in Epworth
According to labor force statistics for Epworth, 89.5% of individuals (806) out of the total population between 25 and 64 years of age (901) are in the labor force, with 1.9% or 15 of them being unemployed. The group with the highest labor force participation rate are those with the educational attainment of bachelor's degree or higher, with 93.5% or 230 individuals in the labor force. Within the labor force, individuals with college / associate degree education have the highest percentage of unemployment, with 4.4% or 13 of them being unemployed.
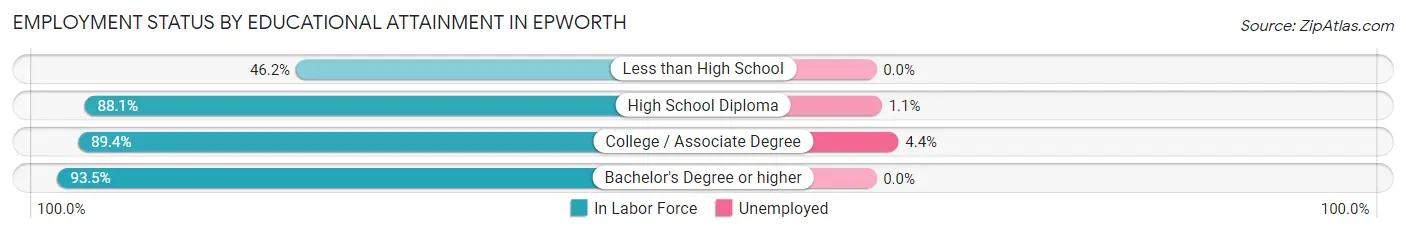
| Educational Attainment | In Labor Force | Unemployed |
| Less than High School | 6 (46.2%) | 0 (0.0%) |
| High School Diploma | 282 (88.1%) | 4 (1.1%) |
| College / Associate Degree | 288 (89.4%) | 14 (4.4%) |
| Bachelor's Degree or higher | 230 (93.5%) | 0 (0.0%) |
| Total | 806 (89.5%) | 17 (1.9%) |
Employment Occupations by Sex in Epworth
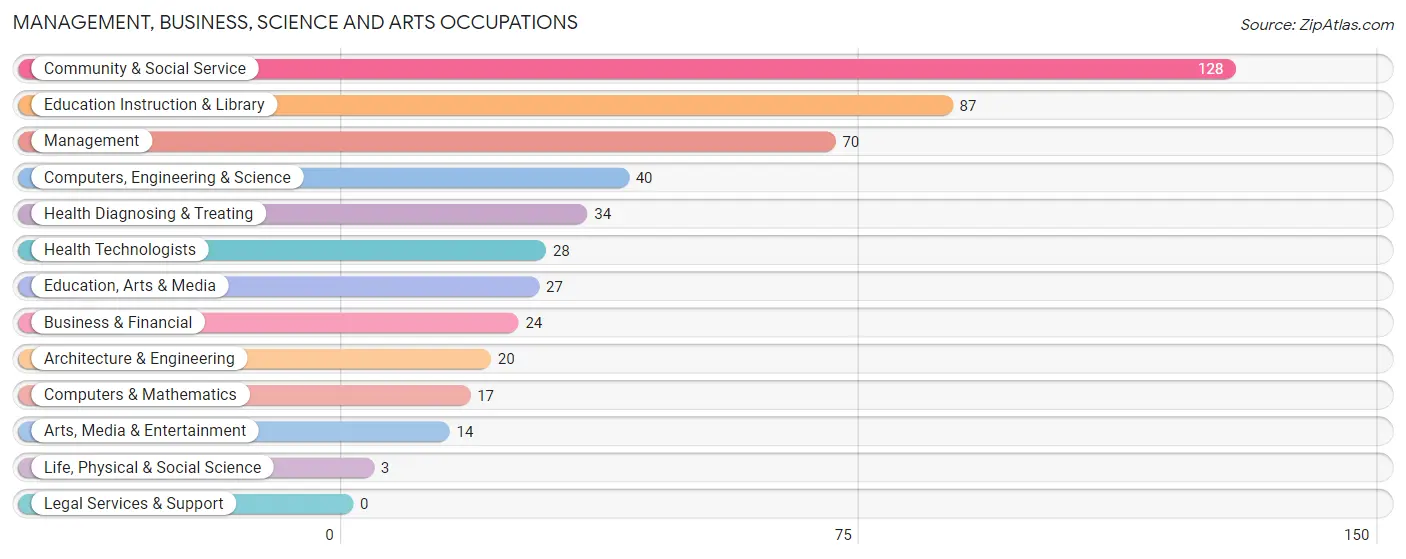
Management, Business, Science and Arts Occupations
The most common Management, Business, Science and Arts occupations in Epworth are Community & Social Service (128 | 12.6%), Education Instruction & Library (87 | 8.5%), Management (70 | 6.9%), Computers, Engineering & Science (40 | 3.9%), and Health Diagnosing & Treating (34 | 3.3%).
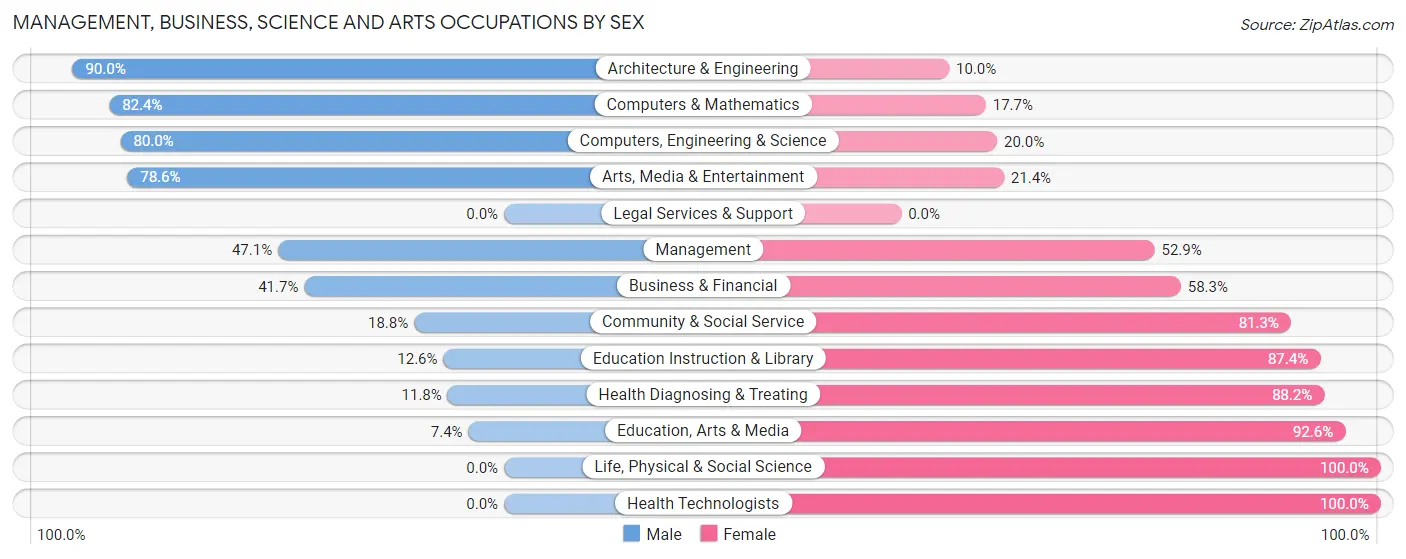
Management, Business, Science and Arts Occupations by Sex
Within the Management, Business, Science and Arts occupations in Epworth, the most male-oriented occupations are Architecture & Engineering (90.0%), Computers & Mathematics (82.4%), and Computers, Engineering & Science (80.0%), while the most female-oriented occupations are Life, Physical & Social Science (100.0%), Health Technologists (100.0%), and Education, Arts & Media (92.6%).
| Occupation | Male | Female |
| Management | 33 (47.1%) | 37 (52.9%) |
| Business & Financial | 10 (41.7%) | 14 (58.3%) |
| Computers, Engineering & Science | 32 (80.0%) | 8 (20.0%) |
| Computers & Mathematics | 14 (82.4%) | 3 (17.6%) |
| Architecture & Engineering | 18 (90.0%) | 2 (10.0%) |
| Life, Physical & Social Science | 0 (0.0%) | 3 (100.0%) |
| Community & Social Service | 24 (18.8%) | 104 (81.2%) |
| Education, Arts & Media | 2 (7.4%) | 25 (92.6%) |
| Legal Services & Support | 0 (0.0%) | 0 (0.0%) |
| Education Instruction & Library | 11 (12.6%) | 76 (87.4%) |
| Arts, Media & Entertainment | 11 (78.6%) | 3 (21.4%) |
| Health Diagnosing & Treating | 4 (11.8%) | 30 (88.2%) |
| Health Technologists | 0 (0.0%) | 28 (100.0%) |
| Total (Category) | 103 (34.8%) | 193 (65.2%) |
| Total (Overall) | 500 (49.0%) | 520 (51.0%) |
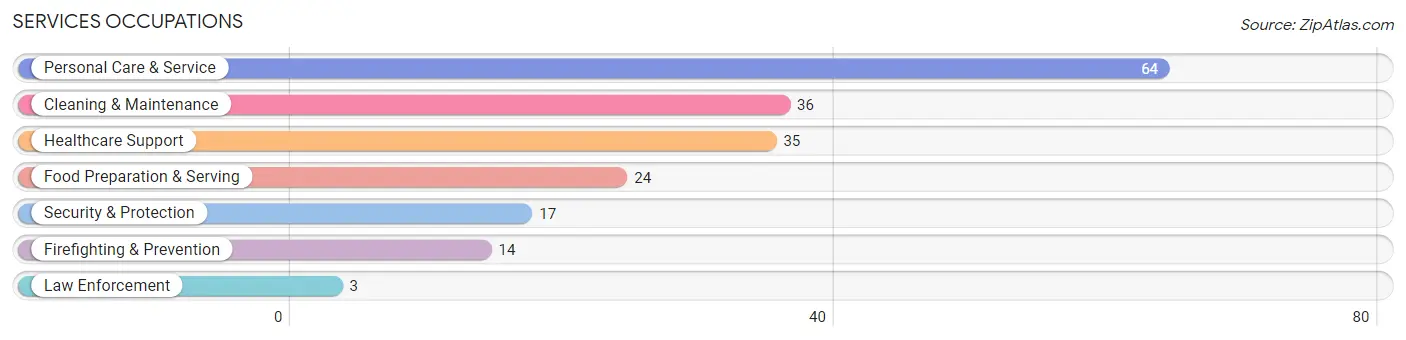
Services Occupations
The most common Services occupations in Epworth are Personal Care & Service (64 | 6.3%), Cleaning & Maintenance (36 | 3.5%), Healthcare Support (35 | 3.4%), Food Preparation & Serving (24 | 2.4%), and Security & Protection (17 | 1.7%).
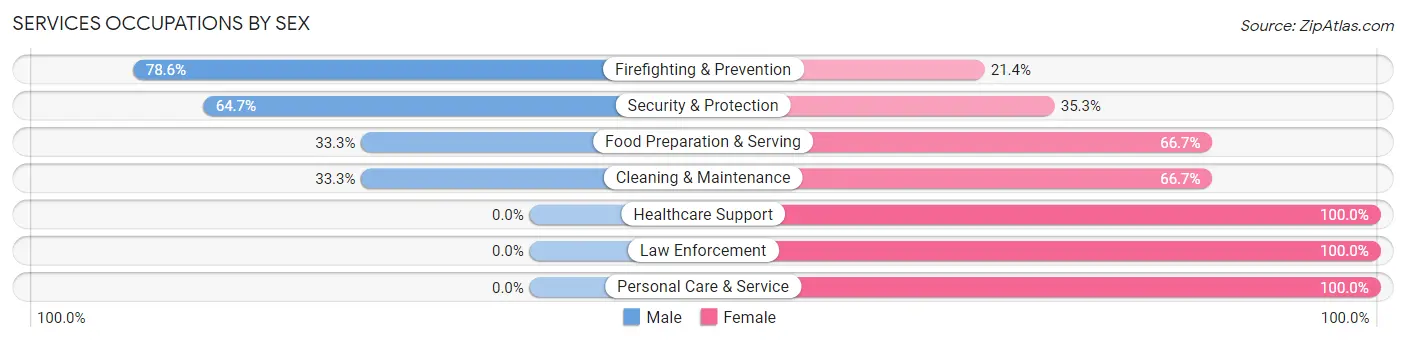
Services Occupations by Sex
Within the Services occupations in Epworth, the most male-oriented occupations are Firefighting & Prevention (78.6%), Security & Protection (64.7%), and Food Preparation & Serving (33.3%), while the most female-oriented occupations are Healthcare Support (100.0%), Law Enforcement (100.0%), and Personal Care & Service (100.0%).
| Occupation | Male | Female |
| Healthcare Support | 0 (0.0%) | 35 (100.0%) |
| Security & Protection | 11 (64.7%) | 6 (35.3%) |
| Firefighting & Prevention | 11 (78.6%) | 3 (21.4%) |
| Law Enforcement | 0 (0.0%) | 3 (100.0%) |
| Food Preparation & Serving | 8 (33.3%) | 16 (66.7%) |
| Cleaning & Maintenance | 12 (33.3%) | 24 (66.7%) |
| Personal Care & Service | 0 (0.0%) | 64 (100.0%) |
| Total (Category) | 31 (17.6%) | 145 (82.4%) |
| Total (Overall) | 500 (49.0%) | 520 (51.0%) |
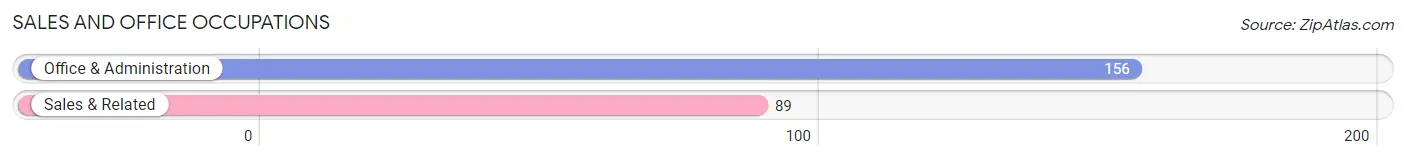
Sales and Office Occupations
The most common Sales and Office occupations in Epworth are Office & Administration (156 | 15.3%), and Sales & Related (89 | 8.7%).
Sales and Office Occupations by Sex
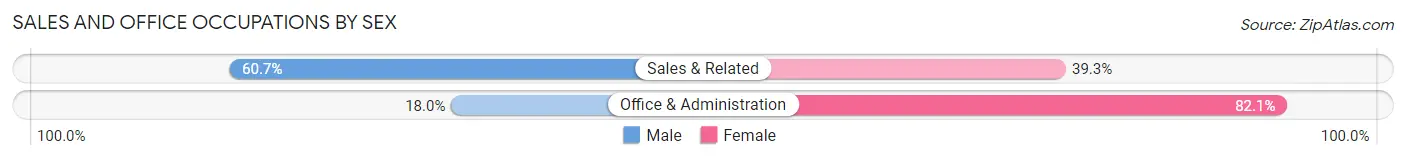
| Occupation | Male | Female |
| Sales & Related | 54 (60.7%) | 35 (39.3%) |
| Office & Administration | 28 (17.9%) | 128 (82.1%) |
| Total (Category) | 82 (33.5%) | 163 (66.5%) |
| Total (Overall) | 500 (49.0%) | 520 (51.0%) |
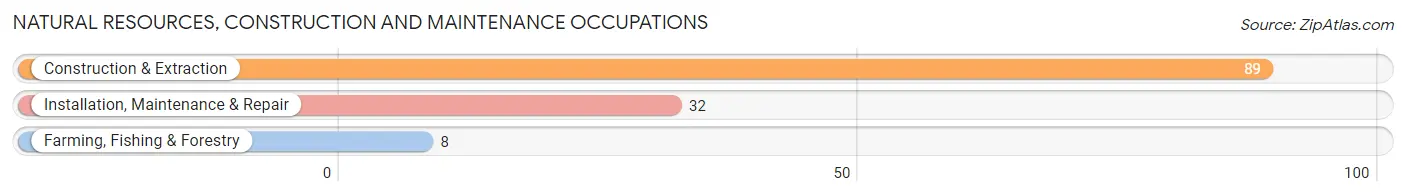
Natural Resources, Construction and Maintenance Occupations
The most common Natural Resources, Construction and Maintenance occupations in Epworth are Construction & Extraction (89 | 8.7%), Installation, Maintenance & Repair (32 | 3.1%), and Farming, Fishing & Forestry (8 | 0.8%).
Natural Resources, Construction and Maintenance Occupations by Sex
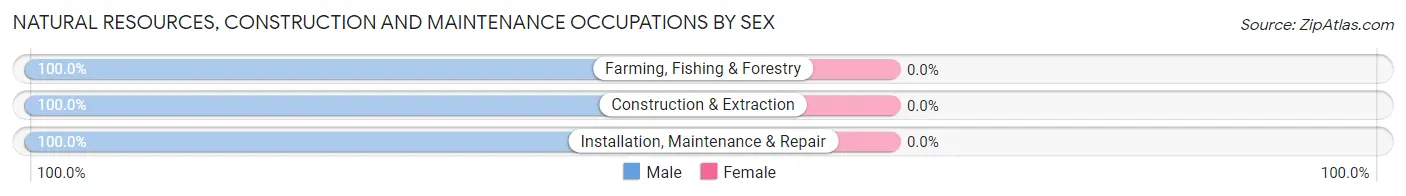
| Occupation | Male | Female |
| Farming, Fishing & Forestry | 8 (100.0%) | 0 (0.0%) |
| Construction & Extraction | 89 (100.0%) | 0 (0.0%) |
| Installation, Maintenance & Repair | 32 (100.0%) | 0 (0.0%) |
| Total (Category) | 129 (100.0%) | 0 (0.0%) |
| Total (Overall) | 500 (49.0%) | 520 (51.0%) |
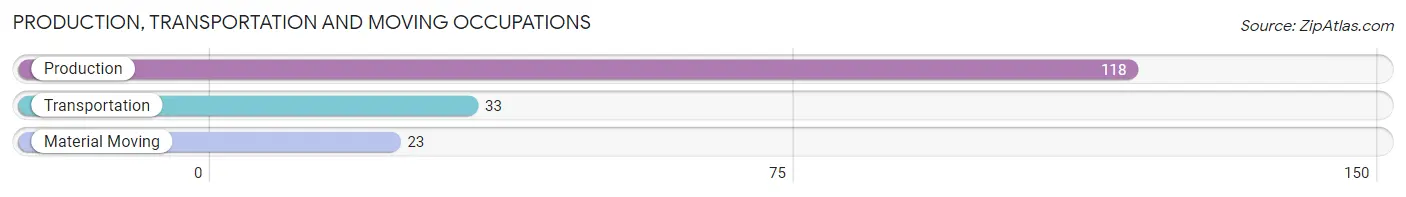
Production, Transportation and Moving Occupations
The most common Production, Transportation and Moving occupations in Epworth are Production (118 | 11.6%), Transportation (33 | 3.2%), and Material Moving (23 | 2.2%).
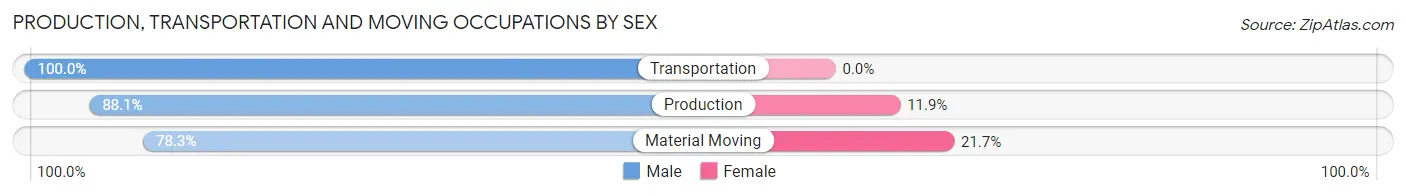
Production, Transportation and Moving Occupations by Sex
| Occupation | Male | Female |
| Production | 104 (88.1%) | 14 (11.9%) |
| Transportation | 33 (100.0%) | 0 (0.0%) |
| Material Moving | 18 (78.3%) | 5 (21.7%) |
| Total (Category) | 155 (89.1%) | 19 (10.9%) |
| Total (Overall) | 500 (49.0%) | 520 (51.0%) |
Employment Industries by Sex in Epworth
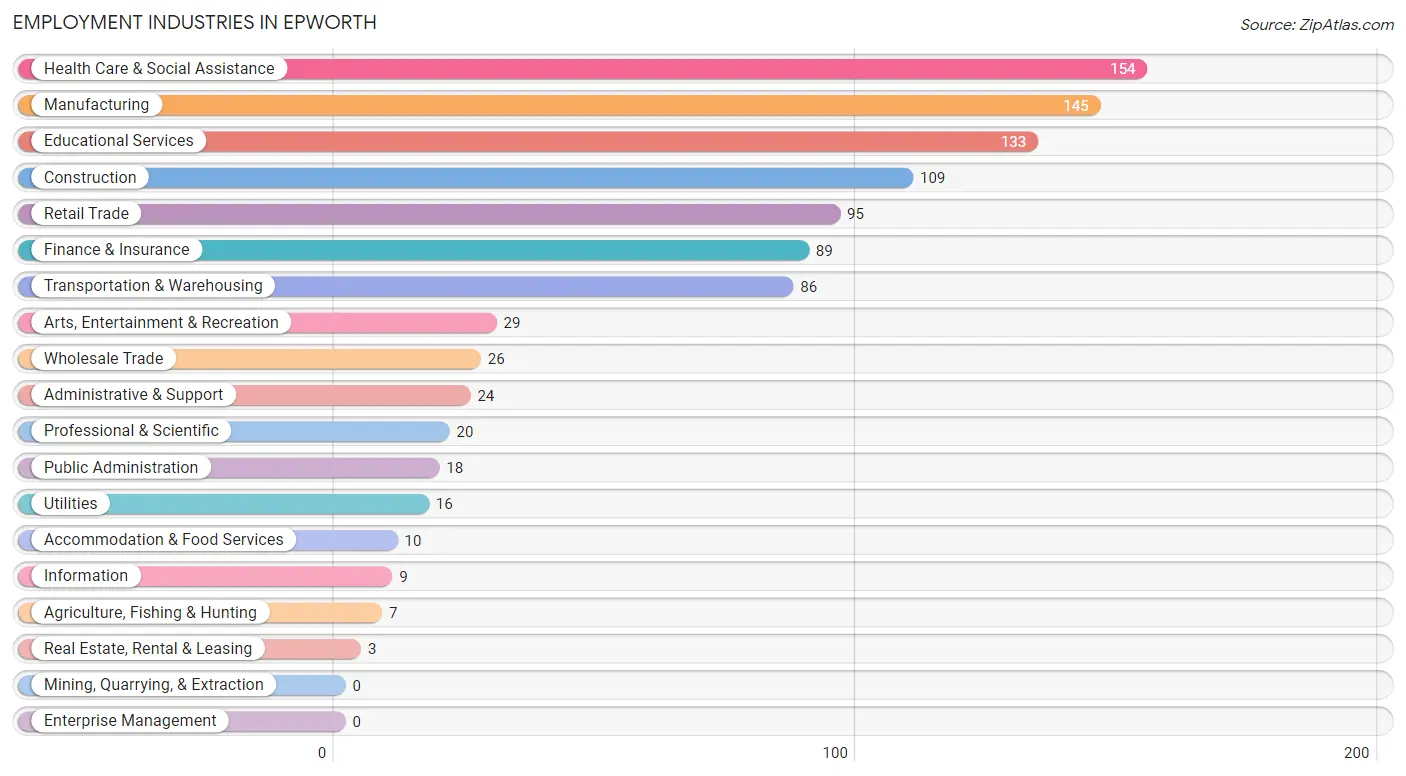
Employment Industries in Epworth
The major employment industries in Epworth include Health Care & Social Assistance (154 | 15.1%), Manufacturing (145 | 14.2%), Educational Services (133 | 13.0%), Construction (109 | 10.7%), and Retail Trade (95 | 9.3%).
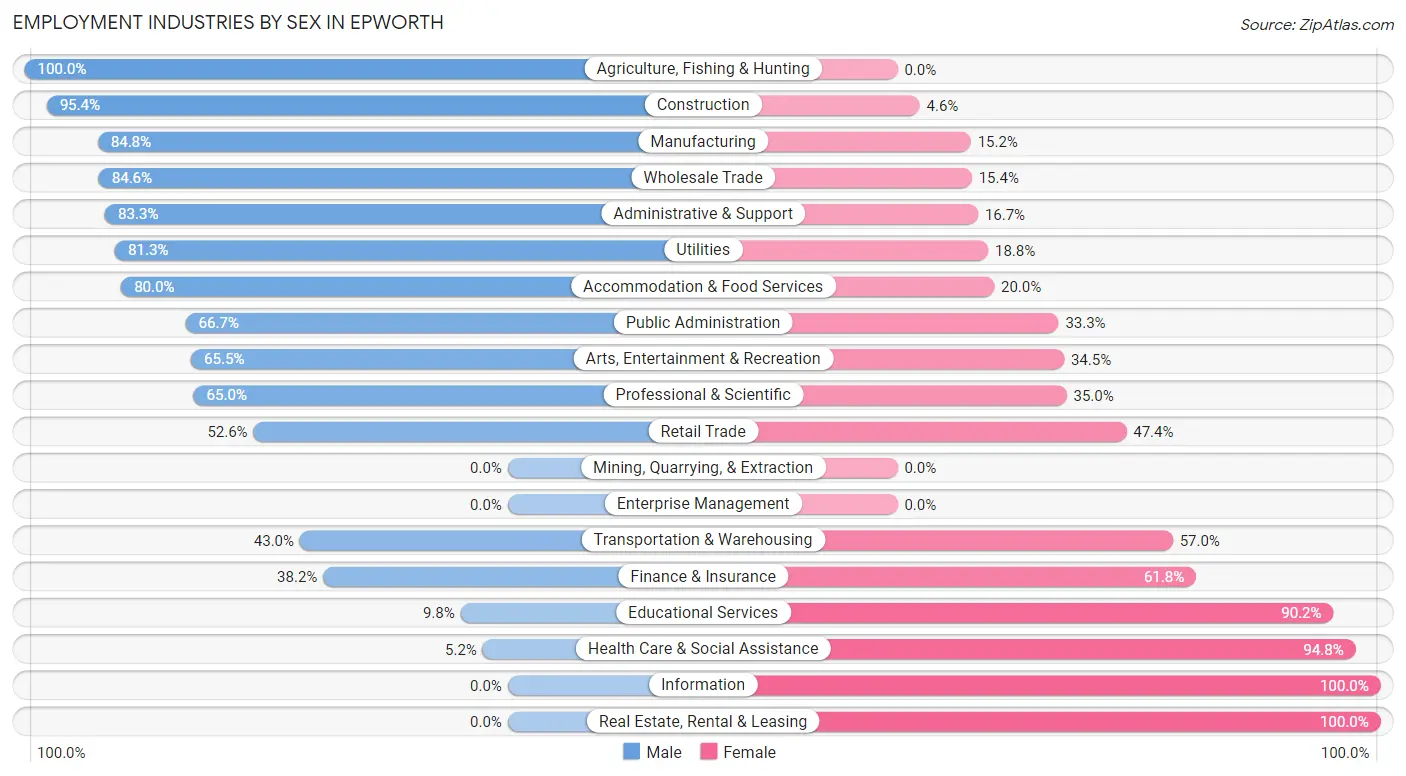
Employment Industries by Sex in Epworth
The Epworth industries that see more men than women are Agriculture, Fishing & Hunting (100.0%), Construction (95.4%), and Manufacturing (84.8%), whereas the industries that tend to have a higher number of women are Information (100.0%), Real Estate, Rental & Leasing (100.0%), and Health Care & Social Assistance (94.8%).
| Industry | Male | Female |
| Agriculture, Fishing & Hunting | 7 (100.0%) | 0 (0.0%) |
| Mining, Quarrying, & Extraction | 0 (0.0%) | 0 (0.0%) |
| Construction | 104 (95.4%) | 5 (4.6%) |
| Manufacturing | 123 (84.8%) | 22 (15.2%) |
| Wholesale Trade | 22 (84.6%) | 4 (15.4%) |
| Retail Trade | 50 (52.6%) | 45 (47.4%) |
| Transportation & Warehousing | 37 (43.0%) | 49 (57.0%) |
| Utilities | 13 (81.2%) | 3 (18.8%) |
| Information | 0 (0.0%) | 9 (100.0%) |
| Finance & Insurance | 34 (38.2%) | 55 (61.8%) |
| Real Estate, Rental & Leasing | 0 (0.0%) | 3 (100.0%) |
| Professional & Scientific | 13 (65.0%) | 7 (35.0%) |
| Enterprise Management | 0 (0.0%) | 0 (0.0%) |
| Administrative & Support | 20 (83.3%) | 4 (16.7%) |
| Educational Services | 13 (9.8%) | 120 (90.2%) |
| Health Care & Social Assistance | 8 (5.2%) | 146 (94.8%) |
| Arts, Entertainment & Recreation | 19 (65.5%) | 10 (34.5%) |
| Accommodation & Food Services | 8 (80.0%) | 2 (20.0%) |
| Public Administration | 12 (66.7%) | 6 (33.3%) |
| Total | 500 (49.0%) | 520 (51.0%) |
Education in Epworth
School Enrollment in Epworth
The most common levels of schooling among the 611 students in Epworth are middle school (164 | 26.8%), college / undergraduate (144 | 23.6%), and elementary school (109 | 17.8%).
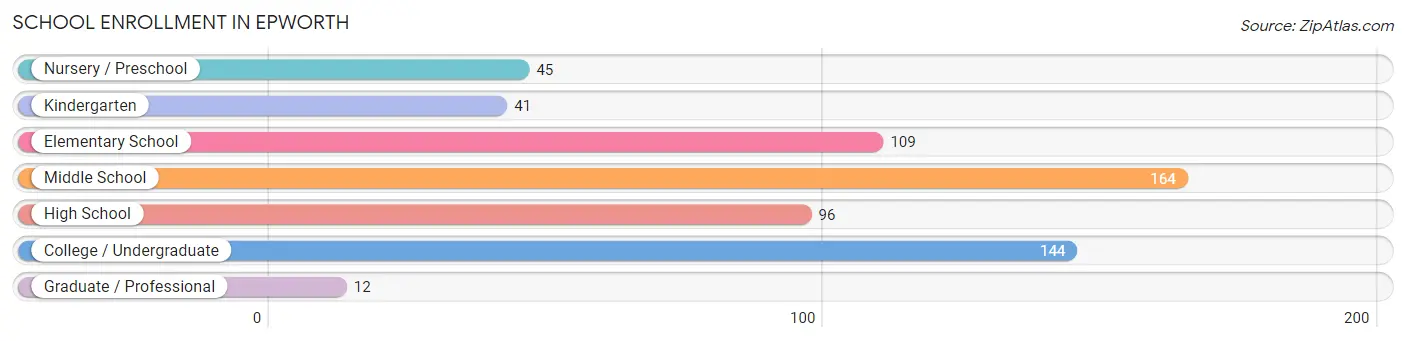
| School Level | # Students | % Students |
| Nursery / Preschool | 45 | 7.4% |
| Kindergarten | 41 | 6.7% |
| Elementary School | 109 | 17.8% |
| Middle School | 164 | 26.8% |
| High School | 96 | 15.7% |
| College / Undergraduate | 144 | 23.6% |
| Graduate / Professional | 12 | 2.0% |
| Total | 611 | 100.0% |
School Enrollment by Age by Funding Source in Epworth
Out of a total of 611 students who are enrolled in schools in Epworth, 132 (21.6%) attend a private institution, while the remaining 479 (78.4%) are enrolled in public schools. The age group of 20 to 24 year olds has the highest likelihood of being enrolled in private schools, with 35 (60.3% in the age bracket) enrolled. Conversely, the age group of 25 to 34 year olds has the lowest likelihood of being enrolled in a private school, with 13 (100.0% in the age bracket) attending a public institution.
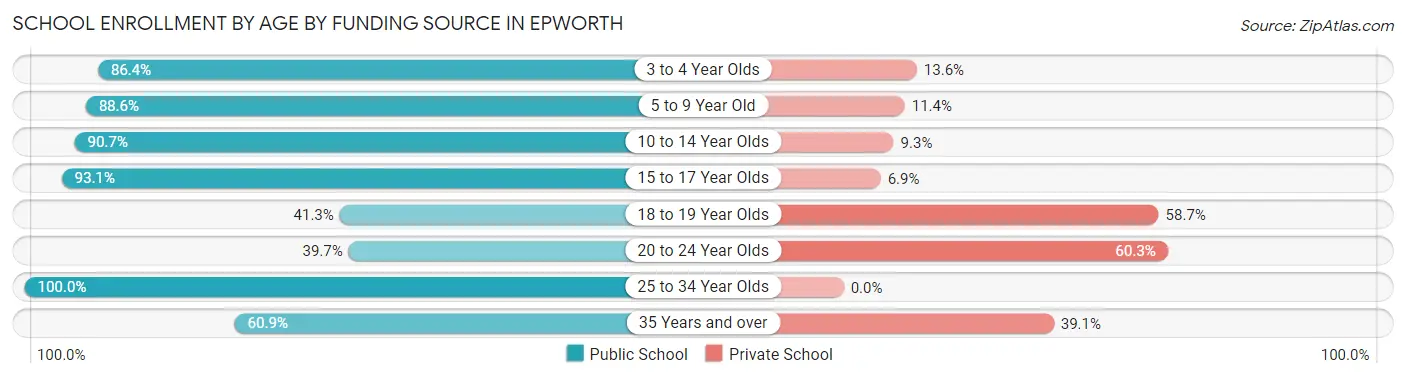
| Age Bracket | Public School | Private School |
| 3 to 4 Year Olds | 19 (86.4%) | 3 (13.6%) |
| 5 to 9 Year Old | 140 (88.6%) | 18 (11.4%) |
| 10 to 14 Year Olds | 185 (90.7%) | 19 (9.3%) |
| 15 to 17 Year Olds | 54 (93.1%) | 4 (6.9%) |
| 18 to 19 Year Olds | 31 (41.3%) | 44 (58.7%) |
| 20 to 24 Year Olds | 23 (39.7%) | 35 (60.3%) |
| 25 to 34 Year Olds | 13 (100.0%) | 0 (0.0%) |
| 35 Years and over | 14 (60.9%) | 9 (39.1%) |
| Total | 479 (78.4%) | 132 (21.6%) |
Educational Attainment by Field of Study in Epworth
Education (121 | 36.7%), business (51 | 15.4%), science & technology (43 | 13.0%), arts & humanities (40 | 12.1%), and social sciences (20 | 6.1%) are the most common fields of study among 330 individuals in Epworth who have obtained a bachelor's degree or higher.
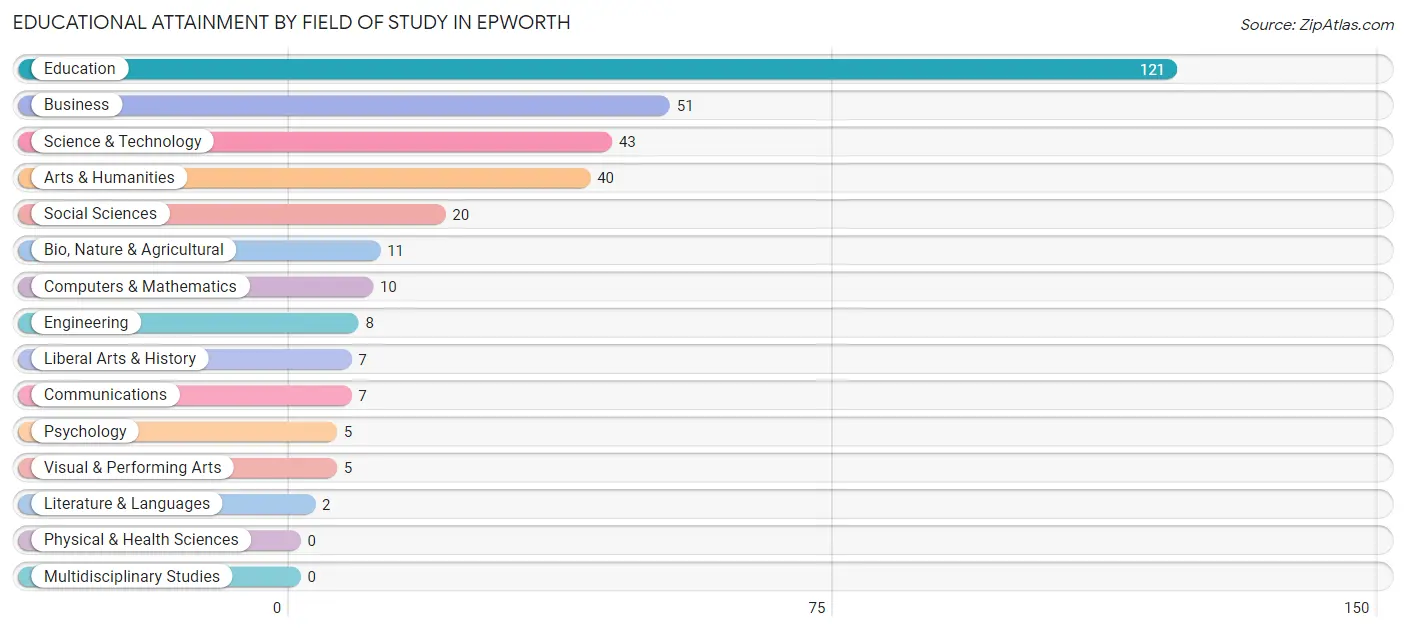
| Field of Study | # Graduates | % Graduates |
| Computers & Mathematics | 10 | 3.0% |
| Bio, Nature & Agricultural | 11 | 3.3% |
| Physical & Health Sciences | 0 | 0.0% |
| Psychology | 5 | 1.5% |
| Social Sciences | 20 | 6.1% |
| Engineering | 8 | 2.4% |
| Multidisciplinary Studies | 0 | 0.0% |
| Science & Technology | 43 | 13.0% |
| Business | 51 | 15.4% |
| Education | 121 | 36.7% |
| Literature & Languages | 2 | 0.6% |
| Liberal Arts & History | 7 | 2.1% |
| Visual & Performing Arts | 5 | 1.5% |
| Communications | 7 | 2.1% |
| Arts & Humanities | 40 | 12.1% |
| Total | 330 | 100.0% |
Transportation & Commute in Epworth
Vehicle Availability by Sex in Epworth
The most prevalent vehicle ownership categories in Epworth are males with 2 vehicles (247, accounting for 50.4%) and females with 2 vehicles (254, making up 47.8%).
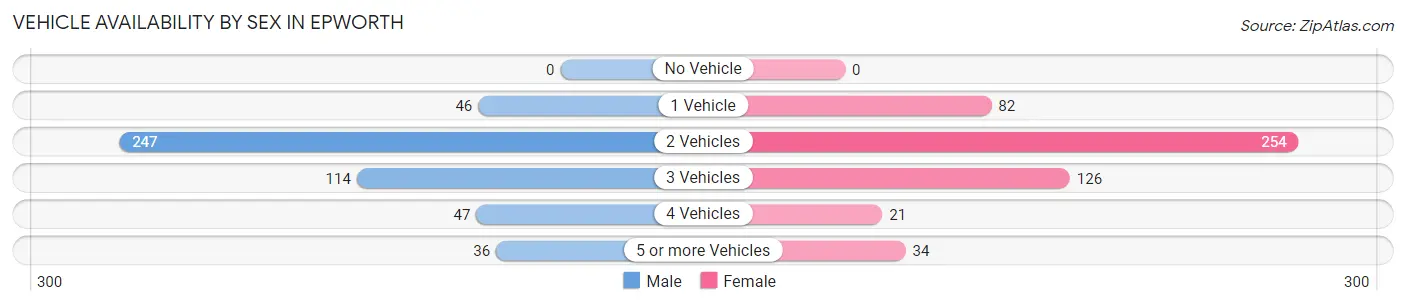
| Vehicles Available | Male | Female |
| No Vehicle | 0 (0.0%) | 0 (0.0%) |
| 1 Vehicle | 46 (9.4%) | 82 (15.9%) |
| 2 Vehicles | 247 (50.4%) | 254 (49.1%) |
| 3 Vehicles | 114 (23.3%) | 126 (24.4%) |
| 4 Vehicles | 47 (9.6%) | 21 (4.1%) |
| 5 or more Vehicles | 36 (7.3%) | 34 (6.6%) |
| Total | 490 (100.0%) | 517 (100.0%) |
Commute Time in Epworth
The most frequently occuring commute durations in Epworth are 15 to 19 minutes (209 commuters, 22.4%), 5 to 9 minutes (152 commuters, 16.3%), and 10 to 14 minutes (150 commuters, 16.1%).
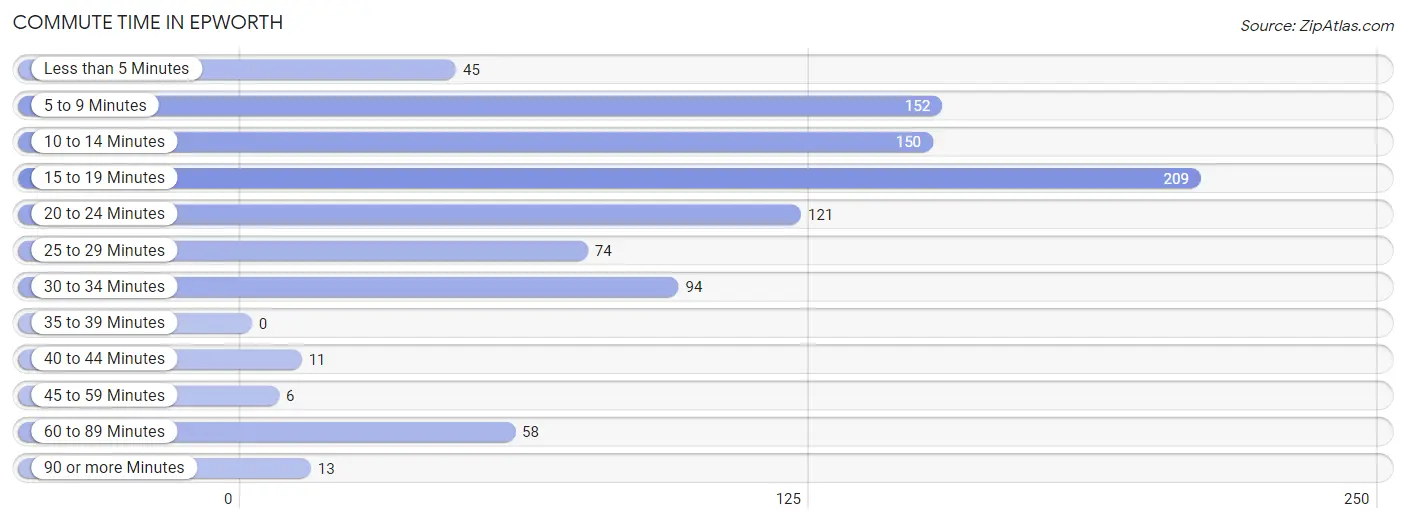
| Commute Time | # Commuters | % Commuters |
| Less than 5 Minutes | 45 | 4.8% |
| 5 to 9 Minutes | 152 | 16.3% |
| 10 to 14 Minutes | 150 | 16.1% |
| 15 to 19 Minutes | 209 | 22.4% |
| 20 to 24 Minutes | 121 | 13.0% |
| 25 to 29 Minutes | 74 | 7.9% |
| 30 to 34 Minutes | 94 | 10.1% |
| 35 to 39 Minutes | 0 | 0.0% |
| 40 to 44 Minutes | 11 | 1.2% |
| 45 to 59 Minutes | 6 | 0.6% |
| 60 to 89 Minutes | 58 | 6.2% |
| 90 or more Minutes | 13 | 1.4% |
Commute Time by Sex in Epworth
The most common commute times in Epworth are 10 to 14 minutes (116 commuters, 23.6%) for males and 15 to 19 minutes (122 commuters, 27.6%) for females.
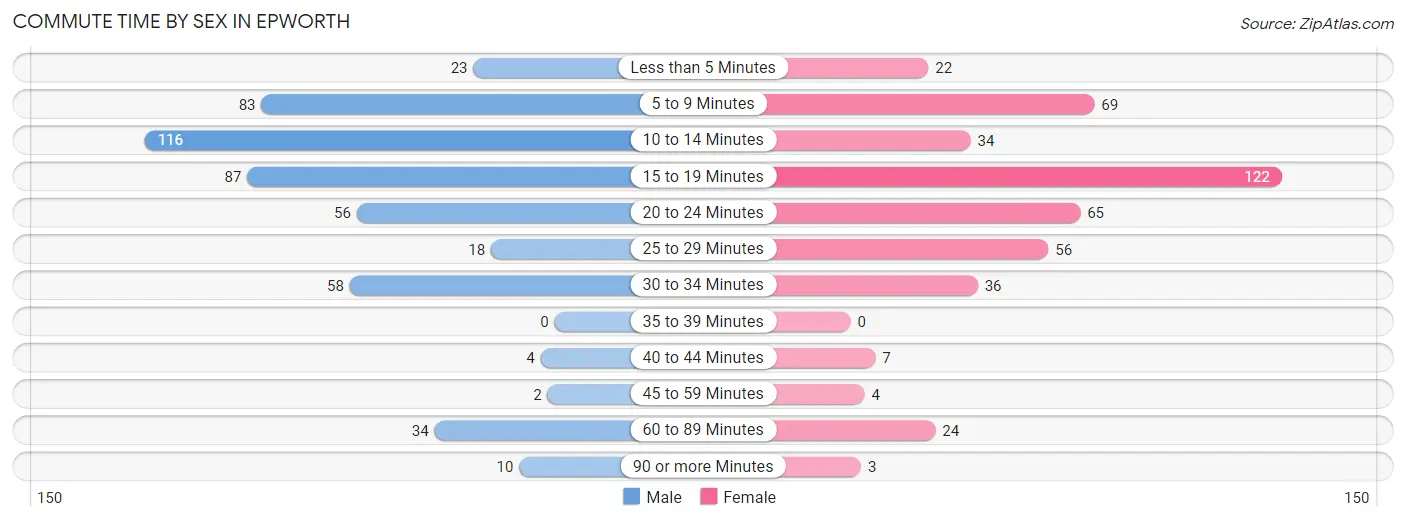
| Commute Time | Male | Female |
| Less than 5 Minutes | 23 (4.7%) | 22 (5.0%) |
| 5 to 9 Minutes | 83 (16.9%) | 69 (15.6%) |
| 10 to 14 Minutes | 116 (23.6%) | 34 (7.7%) |
| 15 to 19 Minutes | 87 (17.7%) | 122 (27.6%) |
| 20 to 24 Minutes | 56 (11.4%) | 65 (14.7%) |
| 25 to 29 Minutes | 18 (3.7%) | 56 (12.7%) |
| 30 to 34 Minutes | 58 (11.8%) | 36 (8.1%) |
| 35 to 39 Minutes | 0 (0.0%) | 0 (0.0%) |
| 40 to 44 Minutes | 4 (0.8%) | 7 (1.6%) |
| 45 to 59 Minutes | 2 (0.4%) | 4 (0.9%) |
| 60 to 89 Minutes | 34 (6.9%) | 24 (5.4%) |
| 90 or more Minutes | 10 (2.0%) | 3 (0.7%) |
Time of Departure to Work by Sex in Epworth
The most frequent times of departure to work in Epworth are 6:30 AM to 6:59 AM (84, 17.1%) for males and 6:30 AM to 6:59 AM (113, 25.6%) for females.
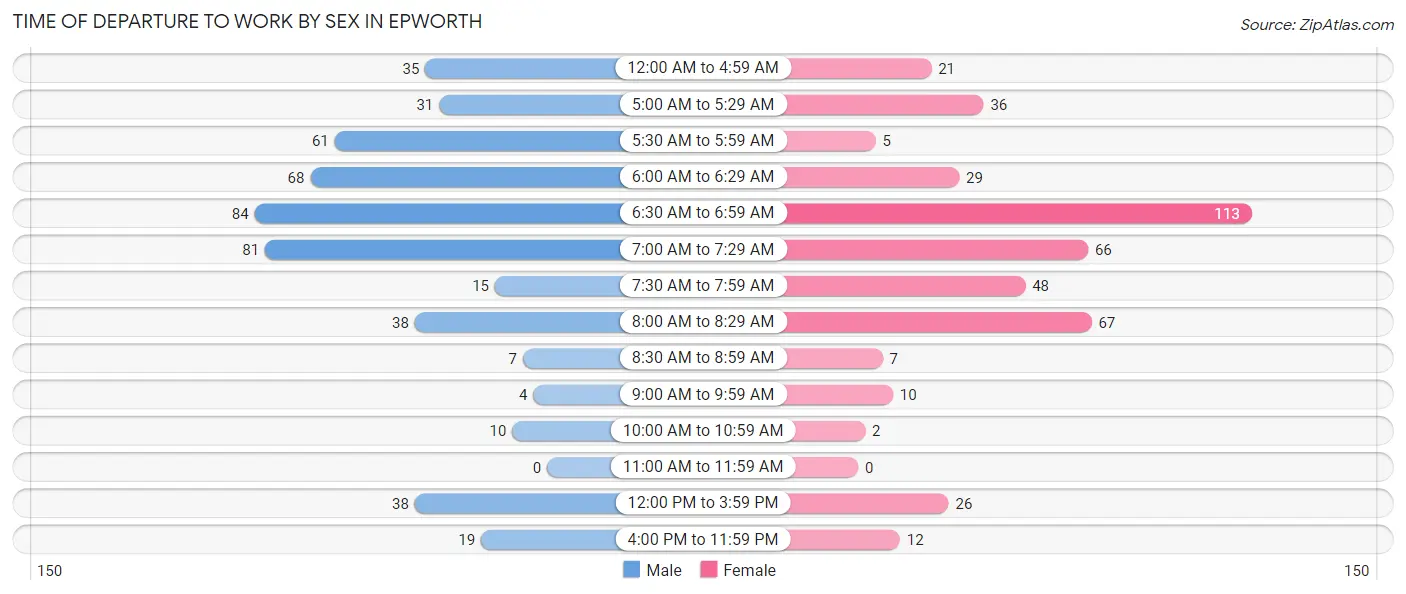
| Time of Departure | Male | Female |
| 12:00 AM to 4:59 AM | 35 (7.1%) | 21 (4.8%) |
| 5:00 AM to 5:29 AM | 31 (6.3%) | 36 (8.1%) |
| 5:30 AM to 5:59 AM | 61 (12.4%) | 5 (1.1%) |
| 6:00 AM to 6:29 AM | 68 (13.9%) | 29 (6.6%) |
| 6:30 AM to 6:59 AM | 84 (17.1%) | 113 (25.6%) |
| 7:00 AM to 7:29 AM | 81 (16.5%) | 66 (14.9%) |
| 7:30 AM to 7:59 AM | 15 (3.0%) | 48 (10.9%) |
| 8:00 AM to 8:29 AM | 38 (7.7%) | 67 (15.2%) |
| 8:30 AM to 8:59 AM | 7 (1.4%) | 7 (1.6%) |
| 9:00 AM to 9:59 AM | 4 (0.8%) | 10 (2.3%) |
| 10:00 AM to 10:59 AM | 10 (2.0%) | 2 (0.4%) |
| 11:00 AM to 11:59 AM | 0 (0.0%) | 0 (0.0%) |
| 12:00 PM to 3:59 PM | 38 (7.7%) | 26 (5.9%) |
| 4:00 PM to 11:59 PM | 19 (3.9%) | 12 (2.7%) |
| Total | 491 (100.0%) | 442 (100.0%) |
Housing Occupancy in Epworth
Occupancy by Ownership in Epworth
Of the total 759 dwellings in Epworth, owner-occupied units account for 625 (82.4%), while renter-occupied units make up 134 (17.6%).
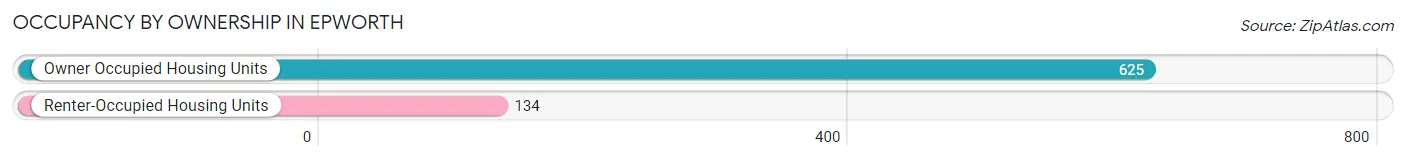
| Occupancy | # Housing Units | % Housing Units |
| Owner Occupied Housing Units | 625 | 82.4% |
| Renter-Occupied Housing Units | 134 | 17.6% |
| Total Occupied Housing Units | 759 | 100.0% |
Occupancy by Household Size in Epworth
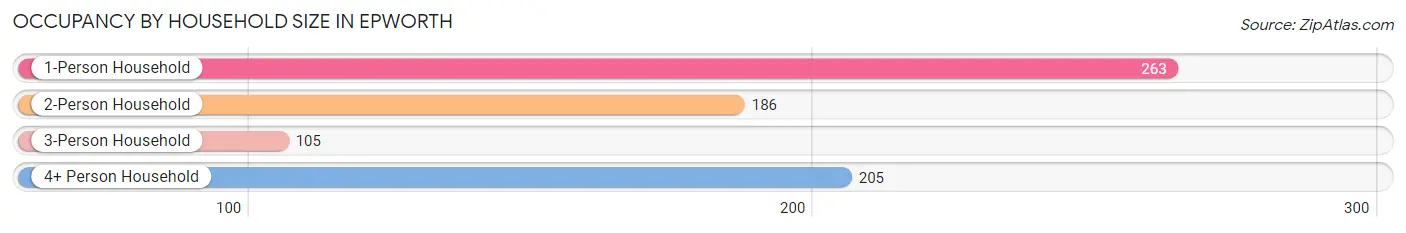
| Household Size | # Housing Units | % Housing Units |
| 1-Person Household | 263 | 34.6% |
| 2-Person Household | 186 | 24.5% |
| 3-Person Household | 105 | 13.8% |
| 4+ Person Household | 205 | 27.0% |
| Total Housing Units | 759 | 100.0% |
Occupancy by Ownership by Household Size in Epworth
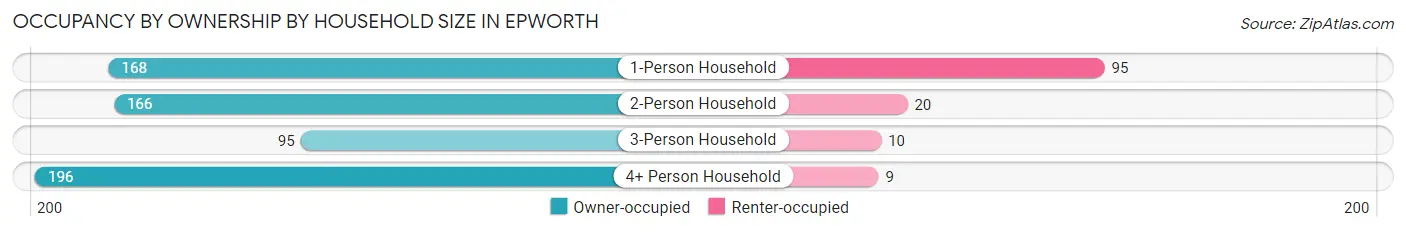
| Household Size | Owner-occupied | Renter-occupied |
| 1-Person Household | 168 (63.9%) | 95 (36.1%) |
| 2-Person Household | 166 (89.2%) | 20 (10.7%) |
| 3-Person Household | 95 (90.5%) | 10 (9.5%) |
| 4+ Person Household | 196 (95.6%) | 9 (4.4%) |
| Total Housing Units | 625 (82.4%) | 134 (17.6%) |
Occupancy by Educational Attainment in Epworth
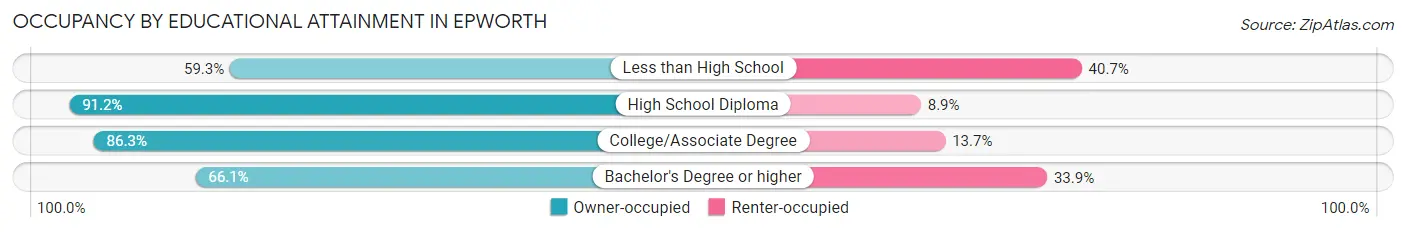
| Household Size | Owner-occupied | Renter-occupied |
| Less than High School | 16 (59.3%) | 11 (40.7%) |
| High School Diploma | 278 (91.1%) | 27 (8.8%) |
| College/Associate Degree | 208 (86.3%) | 33 (13.7%) |
| Bachelor's Degree or higher | 123 (66.1%) | 63 (33.9%) |
Occupancy by Age of Householder in Epworth
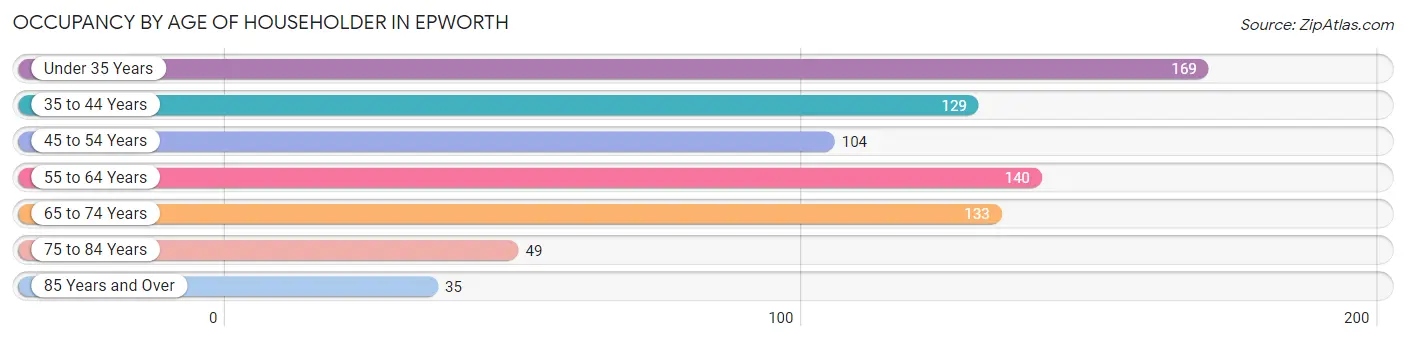
| Age Bracket | # Households | % Households |
| Under 35 Years | 169 | 22.3% |
| 35 to 44 Years | 129 | 17.0% |
| 45 to 54 Years | 104 | 13.7% |
| 55 to 64 Years | 140 | 18.4% |
| 65 to 74 Years | 133 | 17.5% |
| 75 to 84 Years | 49 | 6.5% |
| 85 Years and Over | 35 | 4.6% |
| Total | 759 | 100.0% |
Housing Finances in Epworth
Median Income by Occupancy in Epworth
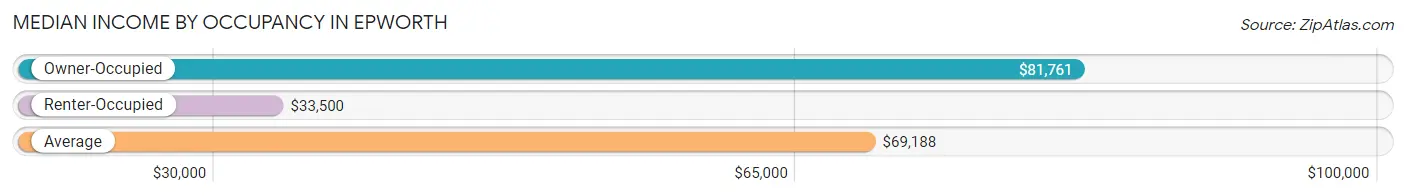
| Occupancy Type | # Households | Median Income |
| Owner-Occupied | 625 (82.4%) | $81,761 |
| Renter-Occupied | 134 (17.6%) | $33,500 |
| Average | 759 (100.0%) | $69,188 |
Occupancy by Householder Income Bracket in Epworth
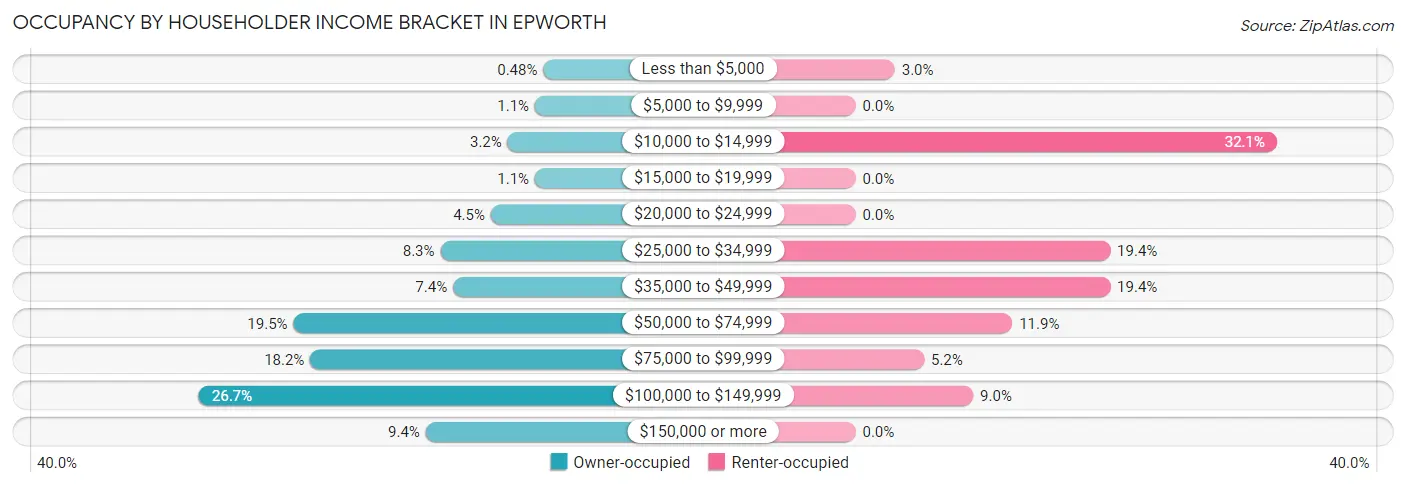
| Income Bracket | Owner-occupied | Renter-occupied |
| Less than $5,000 | 3 (0.5%) | 4 (3.0%) |
| $5,000 to $9,999 | 7 (1.1%) | 0 (0.0%) |
| $10,000 to $14,999 | 20 (3.2%) | 43 (32.1%) |
| $15,000 to $19,999 | 7 (1.1%) | 0 (0.0%) |
| $20,000 to $24,999 | 28 (4.5%) | 0 (0.0%) |
| $25,000 to $34,999 | 52 (8.3%) | 26 (19.4%) |
| $35,000 to $49,999 | 46 (7.4%) | 26 (19.4%) |
| $50,000 to $74,999 | 122 (19.5%) | 16 (11.9%) |
| $75,000 to $99,999 | 114 (18.2%) | 7 (5.2%) |
| $100,000 to $149,999 | 167 (26.7%) | 12 (9.0%) |
| $150,000 or more | 59 (9.4%) | 0 (0.0%) |
| Total | 625 (100.0%) | 134 (100.0%) |
Monthly Housing Cost Tiers in Epworth
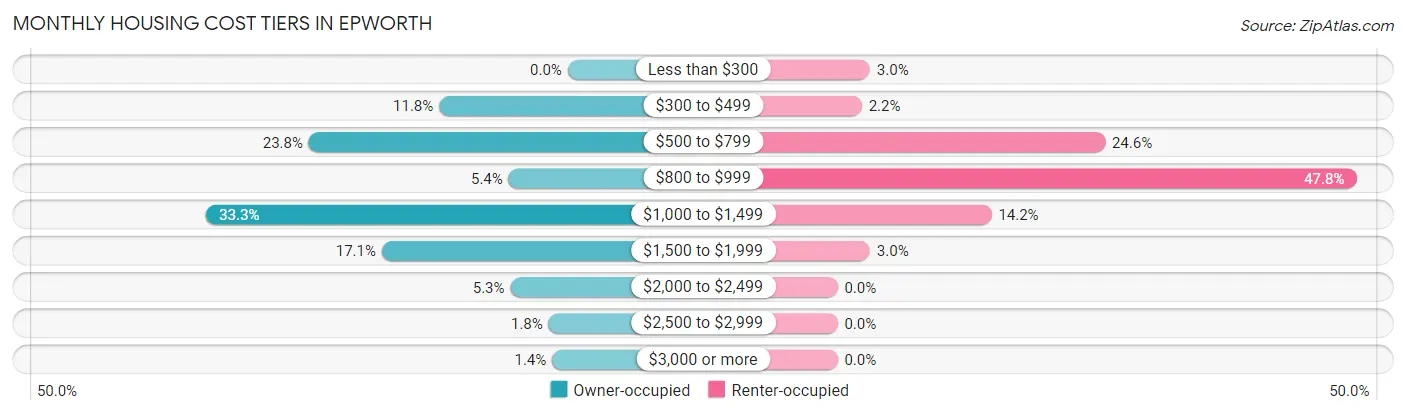
| Monthly Cost | Owner-occupied | Renter-occupied |
| Less than $300 | 0 (0.0%) | 4 (3.0%) |
| $300 to $499 | 74 (11.8%) | 3 (2.2%) |
| $500 to $799 | 149 (23.8%) | 33 (24.6%) |
| $800 to $999 | 34 (5.4%) | 64 (47.8%) |
| $1,000 to $1,499 | 208 (33.3%) | 19 (14.2%) |
| $1,500 to $1,999 | 107 (17.1%) | 4 (3.0%) |
| $2,000 to $2,499 | 33 (5.3%) | 0 (0.0%) |
| $2,500 to $2,999 | 11 (1.8%) | 0 (0.0%) |
| $3,000 or more | 9 (1.4%) | 0 (0.0%) |
| Total | 625 (100.0%) | 134 (100.0%) |
Physical Housing Characteristics in Epworth
Housing Structures in Epworth
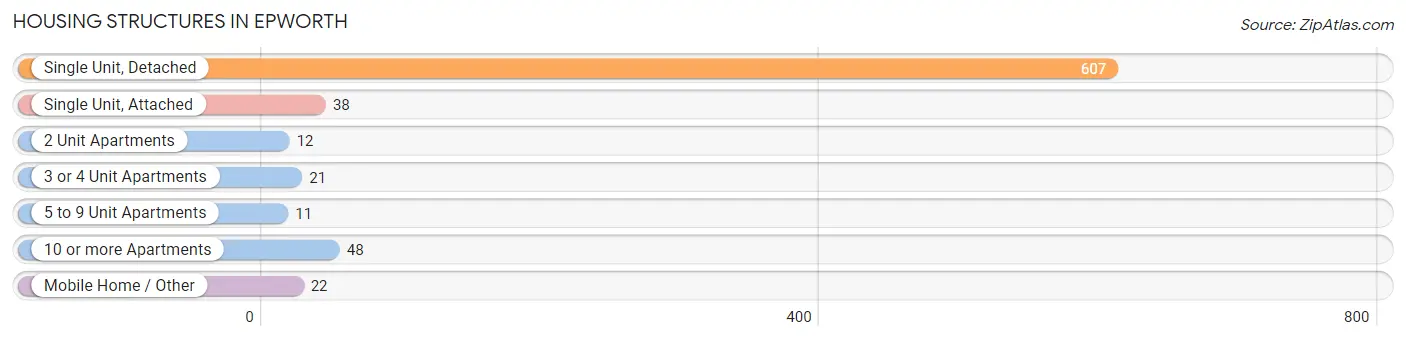
| Structure Type | # Housing Units | % Housing Units |
| Single Unit, Detached | 607 | 80.0% |
| Single Unit, Attached | 38 | 5.0% |
| 2 Unit Apartments | 12 | 1.6% |
| 3 or 4 Unit Apartments | 21 | 2.8% |
| 5 to 9 Unit Apartments | 11 | 1.5% |
| 10 or more Apartments | 48 | 6.3% |
| Mobile Home / Other | 22 | 2.9% |
| Total | 759 | 100.0% |
Housing Structures by Occupancy in Epworth
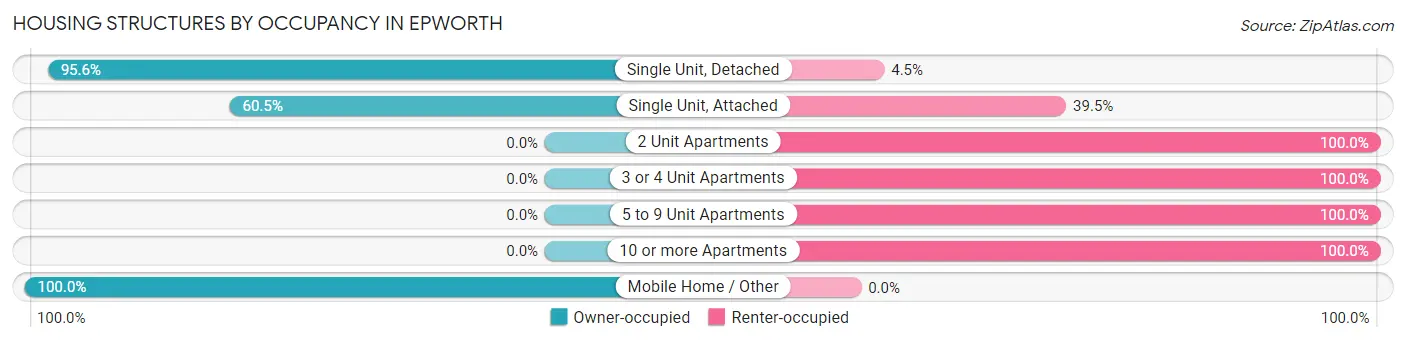
| Structure Type | Owner-occupied | Renter-occupied |
| Single Unit, Detached | 580 (95.6%) | 27 (4.4%) |
| Single Unit, Attached | 23 (60.5%) | 15 (39.5%) |
| 2 Unit Apartments | 0 (0.0%) | 12 (100.0%) |
| 3 or 4 Unit Apartments | 0 (0.0%) | 21 (100.0%) |
| 5 to 9 Unit Apartments | 0 (0.0%) | 11 (100.0%) |
| 10 or more Apartments | 0 (0.0%) | 48 (100.0%) |
| Mobile Home / Other | 22 (100.0%) | 0 (0.0%) |
| Total | 625 (82.4%) | 134 (17.6%) |
Housing Structures by Number of Rooms in Epworth
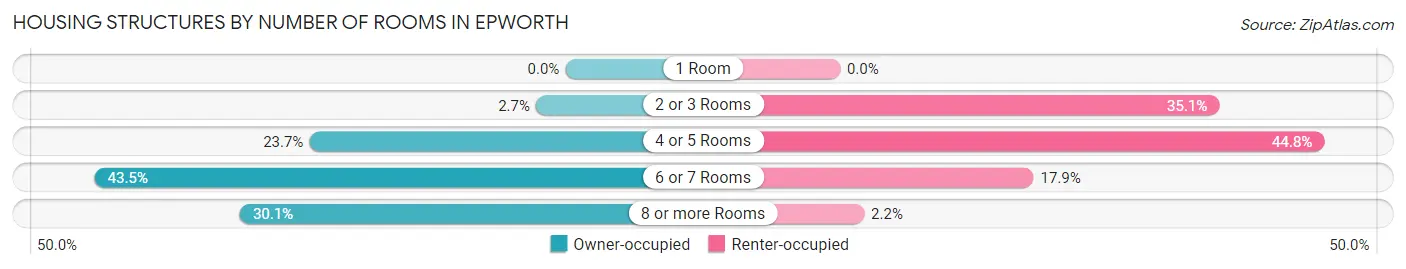
| Number of Rooms | Owner-occupied | Renter-occupied |
| 1 Room | 0 (0.0%) | 0 (0.0%) |
| 2 or 3 Rooms | 17 (2.7%) | 47 (35.1%) |
| 4 or 5 Rooms | 148 (23.7%) | 60 (44.8%) |
| 6 or 7 Rooms | 272 (43.5%) | 24 (17.9%) |
| 8 or more Rooms | 188 (30.1%) | 3 (2.2%) |
| Total | 625 (100.0%) | 134 (100.0%) |
Housing Structure by Heating Type in Epworth
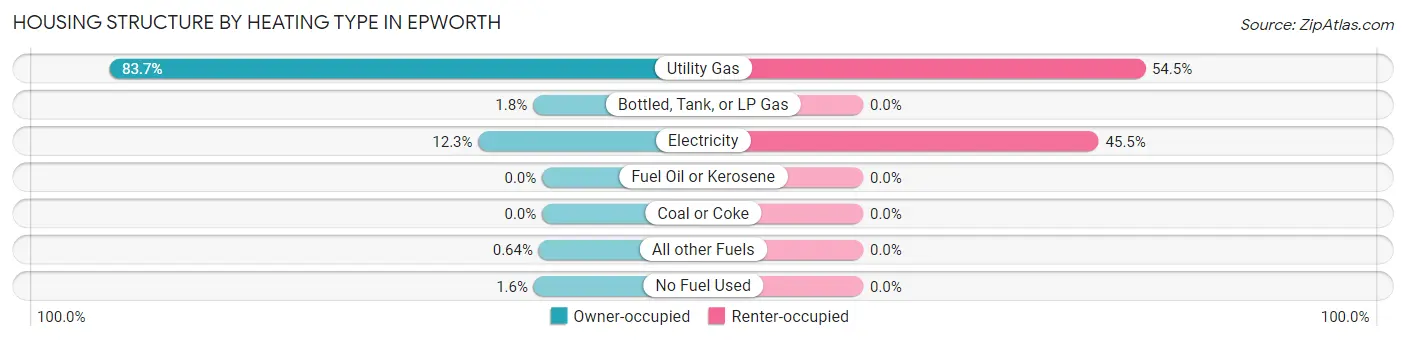
| Heating Type | Owner-occupied | Renter-occupied |
| Utility Gas | 523 (83.7%) | 73 (54.5%) |
| Bottled, Tank, or LP Gas | 11 (1.8%) | 0 (0.0%) |
| Electricity | 77 (12.3%) | 61 (45.5%) |
| Fuel Oil or Kerosene | 0 (0.0%) | 0 (0.0%) |
| Coal or Coke | 0 (0.0%) | 0 (0.0%) |
| All other Fuels | 4 (0.6%) | 0 (0.0%) |
| No Fuel Used | 10 (1.6%) | 0 (0.0%) |
| Total | 625 (100.0%) | 134 (100.0%) |
Household Vehicle Usage in Epworth
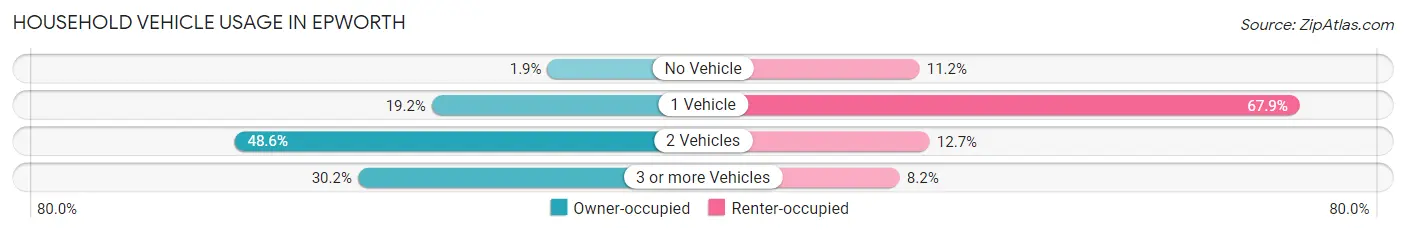
| Vehicles per Household | Owner-occupied | Renter-occupied |
| No Vehicle | 12 (1.9%) | 15 (11.2%) |
| 1 Vehicle | 120 (19.2%) | 91 (67.9%) |
| 2 Vehicles | 304 (48.6%) | 17 (12.7%) |
| 3 or more Vehicles | 189 (30.2%) | 11 (8.2%) |
| Total | 625 (100.0%) | 134 (100.0%) |
Real Estate & Mortgages in Epworth
Real Estate and Mortgage Overview in Epworth
| Characteristic | Without Mortgage | With Mortgage |
| Housing Units | 219 | 406 |
| Median Property Value | $187,200 | $222,800 |
| Median Household Income | $50,673 | $46 |
| Monthly Housing Costs | $563 | $9 |
| Real Estate Taxes | $2,292 | $10 |
Property Value by Mortgage Status in Epworth
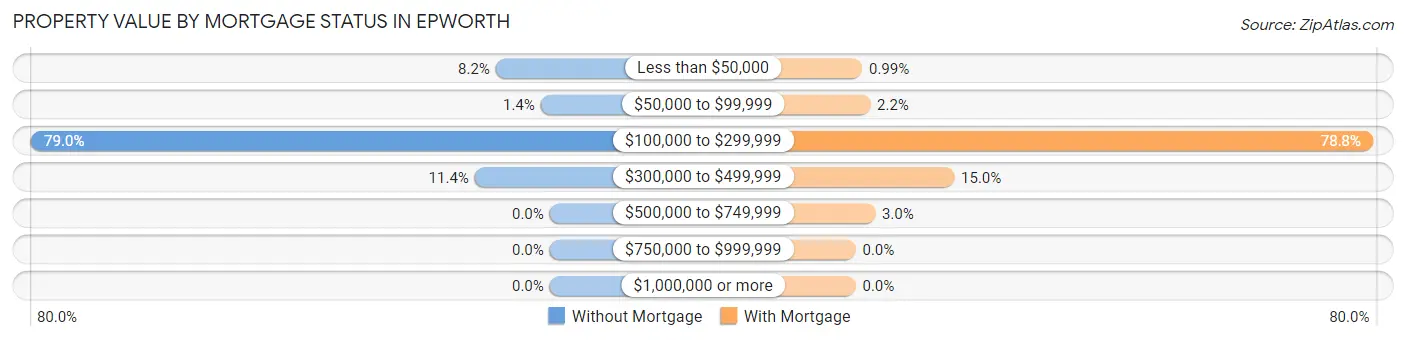
| Property Value | Without Mortgage | With Mortgage |
| Less than $50,000 | 18 (8.2%) | 4 (1.0%) |
| $50,000 to $99,999 | 3 (1.4%) | 9 (2.2%) |
| $100,000 to $299,999 | 173 (79.0%) | 320 (78.8%) |
| $300,000 to $499,999 | 25 (11.4%) | 61 (15.0%) |
| $500,000 to $749,999 | 0 (0.0%) | 12 (3.0%) |
| $750,000 to $999,999 | 0 (0.0%) | 0 (0.0%) |
| $1,000,000 or more | 0 (0.0%) | 0 (0.0%) |
| Total | 219 (100.0%) | 406 (100.0%) |
Household Income by Mortgage Status in Epworth
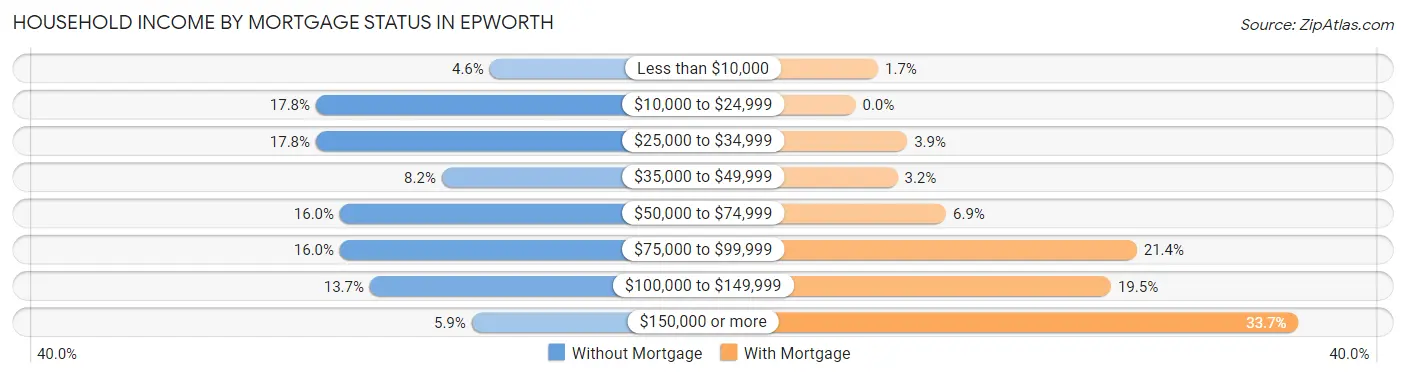
| Household Income | Without Mortgage | With Mortgage |
| Less than $10,000 | 10 (4.6%) | 7 (1.7%) |
| $10,000 to $24,999 | 39 (17.8%) | 0 (0.0%) |
| $25,000 to $34,999 | 39 (17.8%) | 16 (3.9%) |
| $35,000 to $49,999 | 18 (8.2%) | 13 (3.2%) |
| $50,000 to $74,999 | 35 (16.0%) | 28 (6.9%) |
| $75,000 to $99,999 | 35 (16.0%) | 87 (21.4%) |
| $100,000 to $149,999 | 30 (13.7%) | 79 (19.5%) |
| $150,000 or more | 13 (5.9%) | 137 (33.7%) |
| Total | 219 (100.0%) | 406 (100.0%) |
Property Value to Household Income Ratio in Epworth
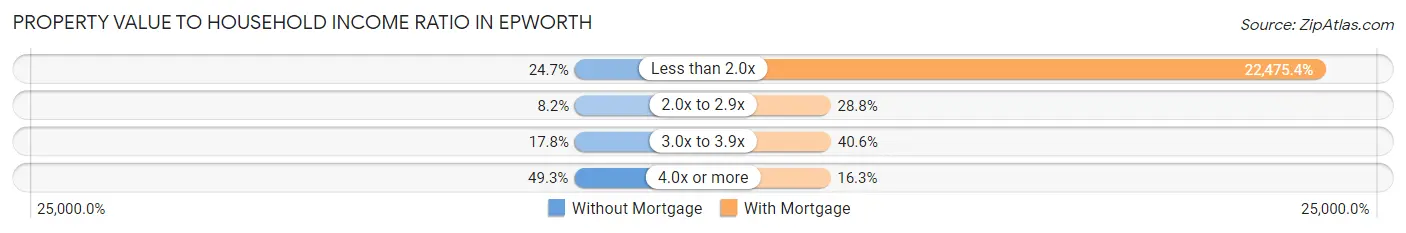
| Value-to-Income Ratio | Without Mortgage | With Mortgage |
| Less than 2.0x | 54 (24.7%) | 91,250 (22,475.4%) |
| 2.0x to 2.9x | 18 (8.2%) | 117 (28.8%) |
| 3.0x to 3.9x | 39 (17.8%) | 165 (40.6%) |
| 4.0x or more | 108 (49.3%) | 66 (16.3%) |
| Total | 219 (100.0%) | 406 (100.0%) |
Real Estate Taxes by Mortgage Status in Epworth
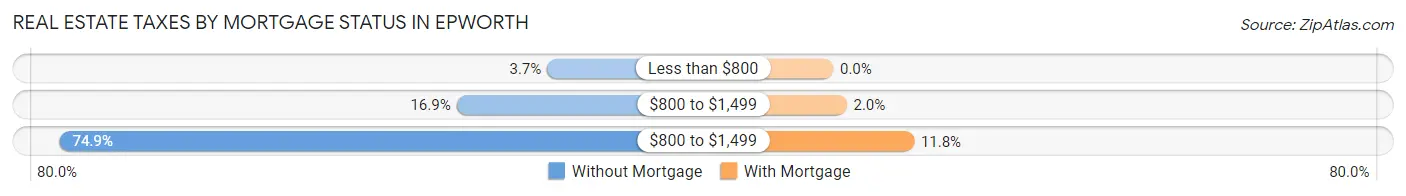
| Property Taxes | Without Mortgage | With Mortgage |
| Less than $800 | 8 (3.6%) | 0 (0.0%) |
| $800 to $1,499 | 37 (16.9%) | 8 (2.0%) |
| $800 to $1,499 | 164 (74.9%) | 48 (11.8%) |
| Total | 219 (100.0%) | 406 (100.0%) |
Health & Disability in Epworth
Health Insurance Coverage by Age in Epworth
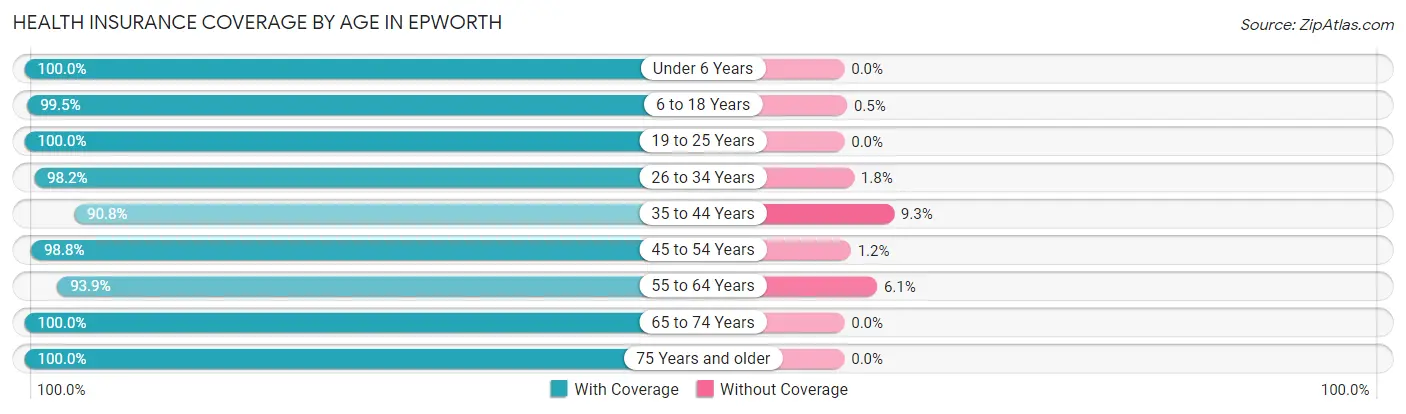
| Age Bracket | With Coverage | Without Coverage |
| Under 6 Years | 160 (100.0%) | 0 (0.0%) |
| 6 to 18 Years | 401 (99.5%) | 2 (0.5%) |
| 19 to 25 Years | 227 (100.0%) | 0 (0.0%) |
| 26 to 34 Years | 219 (98.2%) | 4 (1.8%) |
| 35 to 44 Years | 206 (90.7%) | 21 (9.2%) |
| 45 to 54 Years | 165 (98.8%) | 2 (1.2%) |
| 55 to 64 Years | 216 (93.9%) | 14 (6.1%) |
| 65 to 74 Years | 212 (100.0%) | 0 (0.0%) |
| 75 Years and older | 120 (100.0%) | 0 (0.0%) |
| Total | 1,926 (97.8%) | 43 (2.2%) |
Health Insurance Coverage by Citizenship Status in Epworth
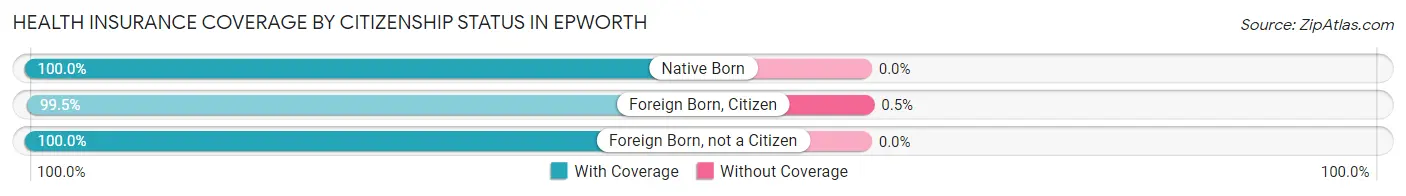
| Citizenship Status | With Coverage | Without Coverage |
| Native Born | 160 (100.0%) | 0 (0.0%) |
| Foreign Born, Citizen | 401 (99.5%) | 2 (0.5%) |
| Foreign Born, not a Citizen | 227 (100.0%) | 0 (0.0%) |
Health Insurance Coverage by Household Income in Epworth
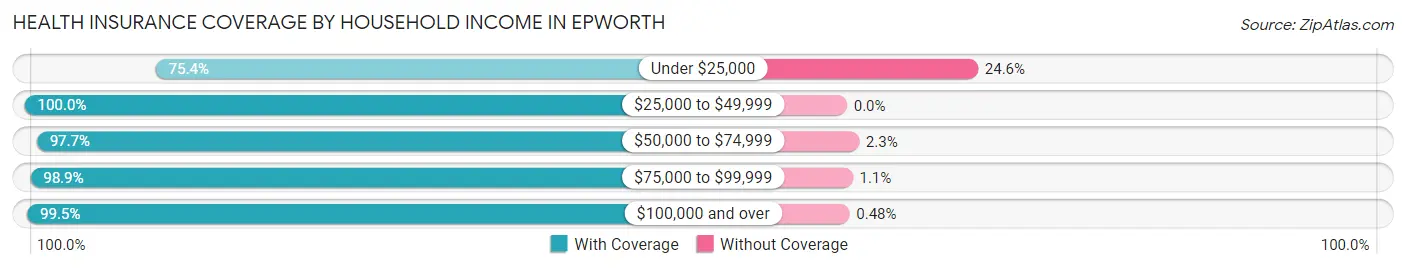
| Household Income | With Coverage | Without Coverage |
| Under $25,000 | 86 (75.4%) | 28 (24.6%) |
| $25,000 to $49,999 | 263 (100.0%) | 0 (0.0%) |
| $50,000 to $74,999 | 302 (97.7%) | 7 (2.3%) |
| $75,000 to $99,999 | 371 (98.9%) | 4 (1.1%) |
| $100,000 and over | 824 (99.5%) | 4 (0.5%) |
Public vs Private Health Insurance Coverage by Age in Epworth
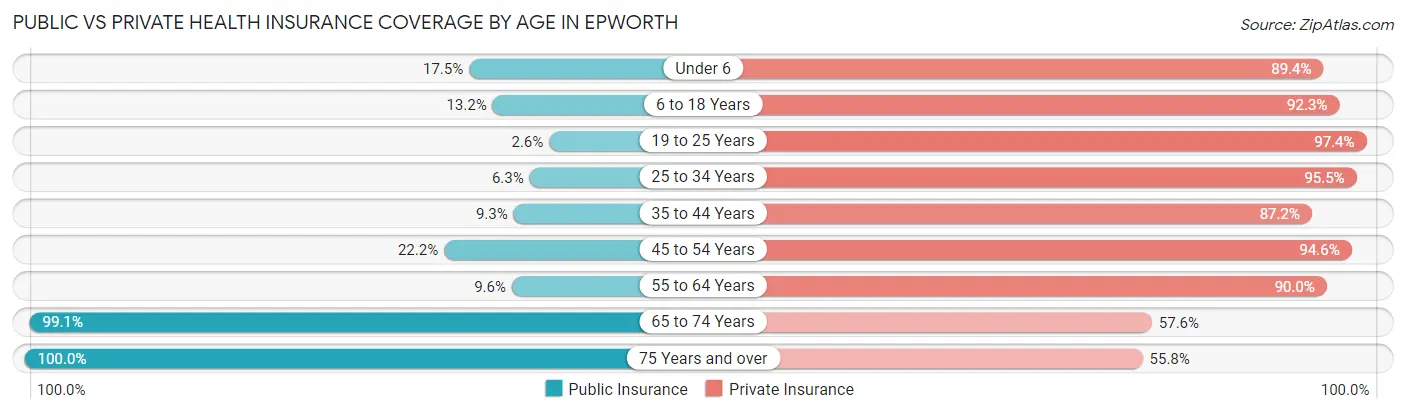
| Age Bracket | Public Insurance | Private Insurance |
| Under 6 | 28 (17.5%) | 143 (89.4%) |
| 6 to 18 Years | 53 (13.2%) | 372 (92.3%) |
| 19 to 25 Years | 6 (2.6%) | 221 (97.4%) |
| 25 to 34 Years | 14 (6.3%) | 213 (95.5%) |
| 35 to 44 Years | 21 (9.2%) | 198 (87.2%) |
| 45 to 54 Years | 37 (22.2%) | 158 (94.6%) |
| 55 to 64 Years | 22 (9.6%) | 207 (90.0%) |
| 65 to 74 Years | 210 (99.1%) | 122 (57.6%) |
| 75 Years and over | 120 (100.0%) | 67 (55.8%) |
| Total | 511 (26.0%) | 1,701 (86.4%) |
Disability Status by Sex by Age in Epworth
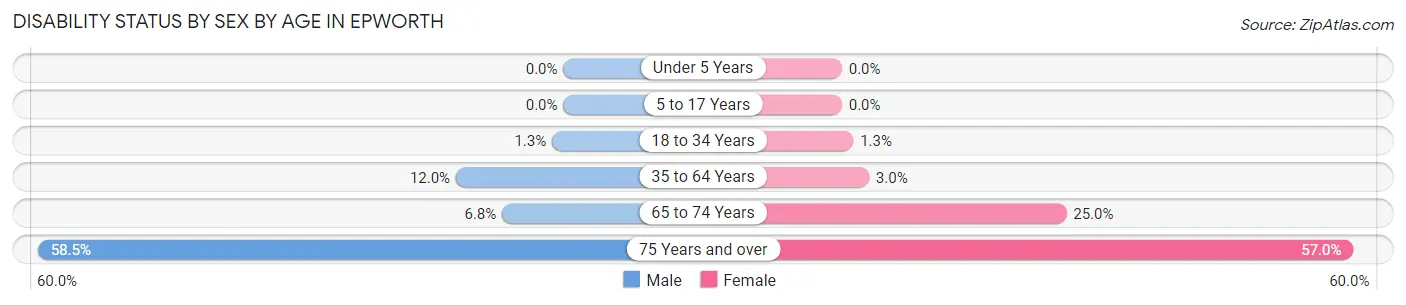
| Age Bracket | Male | Female |
| Under 5 Years | 0 (0.0%) | 0 (0.0%) |
| 5 to 17 Years | 0 (0.0%) | 0 (0.0%) |
| 18 to 34 Years | 3 (1.3%) | 3 (1.3%) |
| 35 to 64 Years | 39 (12.0%) | 9 (3.0%) |
| 65 to 74 Years | 6 (6.8%) | 31 (25.0%) |
| 75 Years and over | 24 (58.5%) | 45 (57.0%) |
Disability Class by Sex by Age in Epworth
Disability Class: Hearing Difficulty
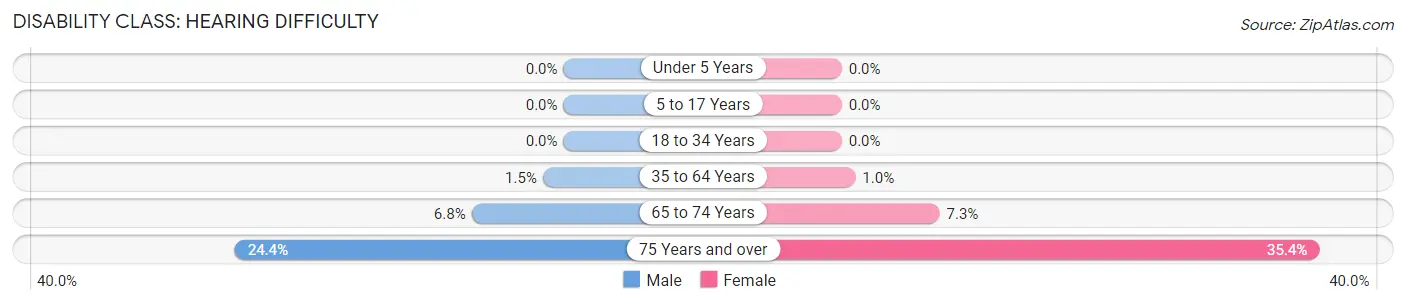
| Age Bracket | Male | Female |
| Under 5 Years | 0 (0.0%) | 0 (0.0%) |
| 5 to 17 Years | 0 (0.0%) | 0 (0.0%) |
| 18 to 34 Years | 0 (0.0%) | 0 (0.0%) |
| 35 to 64 Years | 5 (1.5%) | 3 (1.0%) |
| 65 to 74 Years | 6 (6.8%) | 9 (7.3%) |
| 75 Years and over | 10 (24.4%) | 28 (35.4%) |
Disability Class: Vision Difficulty
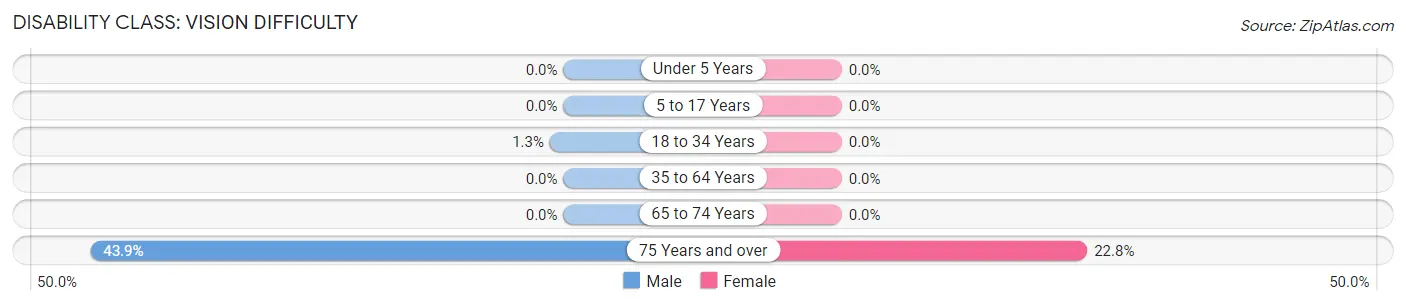
| Age Bracket | Male | Female |
| Under 5 Years | 0 (0.0%) | 0 (0.0%) |
| 5 to 17 Years | 0 (0.0%) | 0 (0.0%) |
| 18 to 34 Years | 3 (1.3%) | 0 (0.0%) |
| 35 to 64 Years | 0 (0.0%) | 0 (0.0%) |
| 65 to 74 Years | 0 (0.0%) | 0 (0.0%) |
| 75 Years and over | 18 (43.9%) | 18 (22.8%) |
Disability Class: Cognitive Difficulty
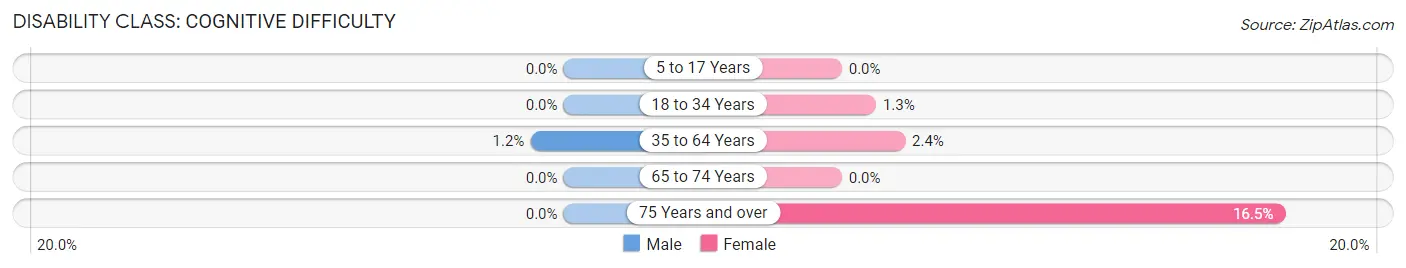
| Age Bracket | Male | Female |
| 5 to 17 Years | 0 (0.0%) | 0 (0.0%) |
| 18 to 34 Years | 0 (0.0%) | 3 (1.3%) |
| 35 to 64 Years | 4 (1.2%) | 7 (2.4%) |
| 65 to 74 Years | 0 (0.0%) | 0 (0.0%) |
| 75 Years and over | 0 (0.0%) | 13 (16.5%) |
Disability Class: Ambulatory Difficulty
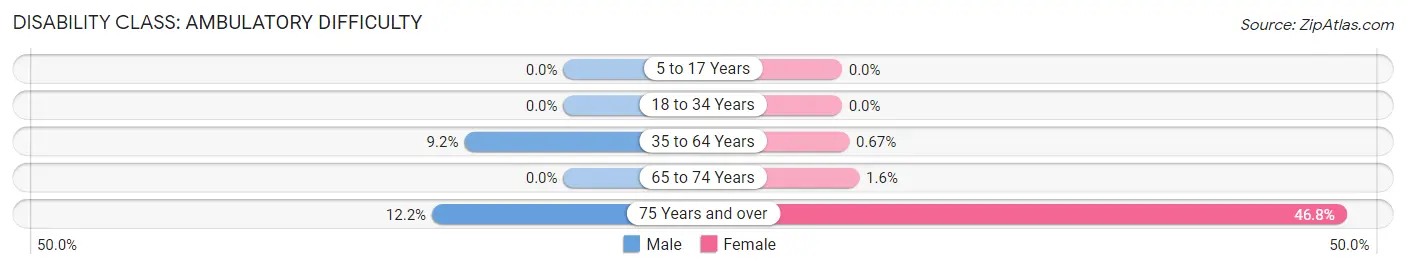
| Age Bracket | Male | Female |
| 5 to 17 Years | 0 (0.0%) | 0 (0.0%) |
| 18 to 34 Years | 0 (0.0%) | 0 (0.0%) |
| 35 to 64 Years | 30 (9.2%) | 2 (0.7%) |
| 65 to 74 Years | 0 (0.0%) | 2 (1.6%) |
| 75 Years and over | 5 (12.2%) | 37 (46.8%) |
Disability Class: Self-Care Difficulty
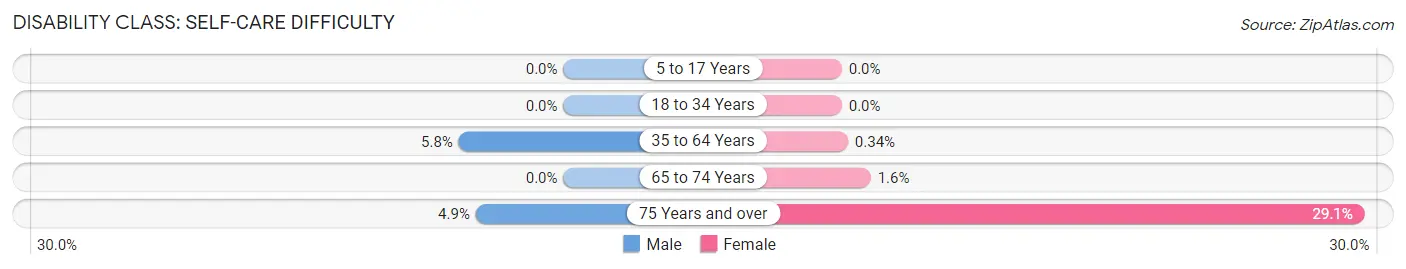
| Age Bracket | Male | Female |
| 5 to 17 Years | 0 (0.0%) | 0 (0.0%) |
| 18 to 34 Years | 0 (0.0%) | 0 (0.0%) |
| 35 to 64 Years | 19 (5.8%) | 1 (0.3%) |
| 65 to 74 Years | 0 (0.0%) | 2 (1.6%) |
| 75 Years and over | 2 (4.9%) | 23 (29.1%) |
Technology Access in Epworth
Computing Device Access in Epworth
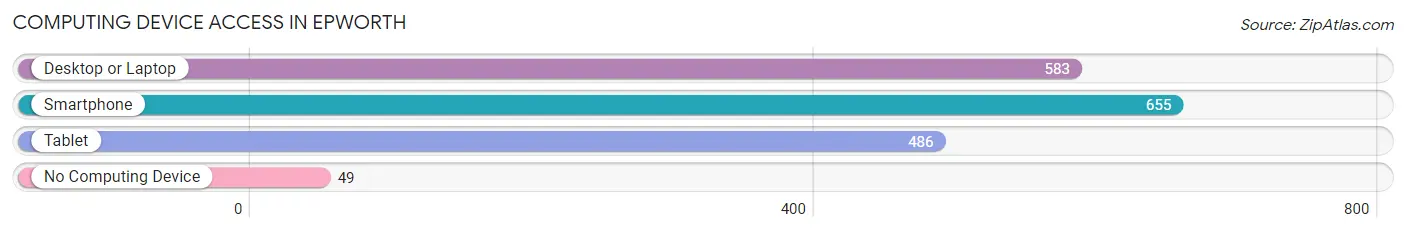
| Device Type | # Households | % Households |
| Desktop or Laptop | 583 | 76.8% |
| Smartphone | 655 | 86.3% |
| Tablet | 486 | 64.0% |
| No Computing Device | 49 | 6.5% |
| Total | 759 | 100.0% |
Internet Access in Epworth
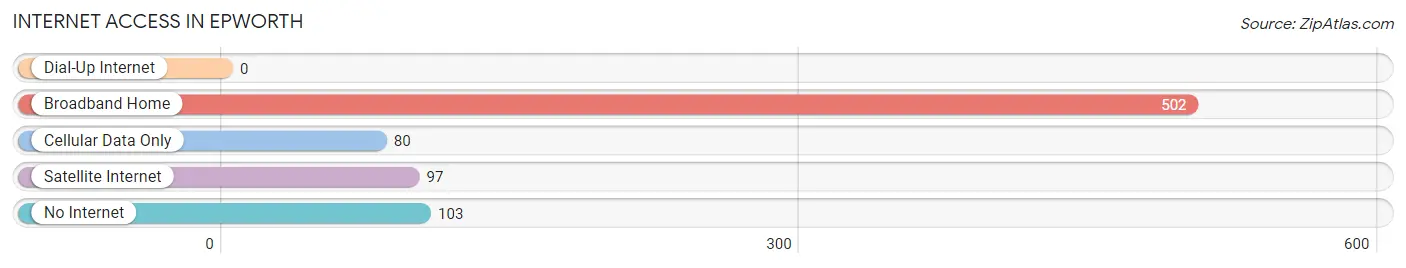
| Internet Type | # Households | % Households |
| Dial-Up Internet | 0 | 0.0% |
| Broadband Home | 502 | 66.1% |
| Cellular Data Only | 80 | 10.5% |
| Satellite Internet | 97 | 12.8% |
| No Internet | 103 | 13.6% |
| Total | 759 | 100.0% |
Epworth Summary
Epworth, Iowa is a small city located in Dubuque County, Iowa. It is situated on the banks of the Mississippi River, just south of the city of Dubuque. The city has a population of approximately 1,800 people and is part of the Dubuque Metropolitan Statistical Area.
History
Epworth was founded in 1855 by a group of German immigrants who had come to the area in search of religious freedom. The city was named after the town of Epworth in England, which was the birthplace of John Wesley, the founder of the Methodist Church. The city was incorporated in 1858 and has remained a small, rural community ever since.
The city was home to a number of industries in the late 19th and early 20th centuries, including a flour mill, a brickyard, a sawmill, and a creamery. The city also had a number of churches, including the Methodist Church, the Catholic Church, and the Lutheran Church.
Geography
Epworth is located in the rolling hills of the Driftless Area of Iowa. The city is situated on the banks of the Mississippi River, just south of the city of Dubuque. The city is surrounded by a number of small towns and villages, including Dyersville, Farley, and New Vienna.
The city has a total area of 1.2 square miles, all of which is land. The city is located at an elevation of 645 feet above sea level.
Economy
Epworth’s economy is largely based on agriculture and tourism. The city is home to a number of small businesses, including a grocery store, a hardware store, and a few restaurants. The city also has a number of small manufacturing companies, including a furniture factory and a printing company.
The city is also home to a number of tourist attractions, including the National Mississippi River Museum and Aquarium, the Dubuque County Historical Society, and the Dubuque Arboretum and Botanical Gardens.
Demographics
As of the 2010 census, the population of Epworth was 1,811. The racial makeup of the city was 97.3% White, 0.7% African American, 0.2% Native American, 0.3% Asian, 0.1% Pacific Islander, 0.4% from other races, and 1.0% from two or more races. Hispanic or Latino of any race were 1.3% of the population.
The median income for a household in the city was $45,938, and the median income for a family was $51,250. The per capita income for the city was $20,945. About 6.2% of families and 8.2% of the population were below the poverty line, including 10.2% of those under age 18 and 8.3% of those age 65 or over.
Common Questions
What is Per Capita Income in Epworth?
Per Capita income in Epworth is $30,811.
What is the Median Family Income in Epworth?
Median Family Income in Epworth is $95,417.
What is the Median Household income in Epworth?
Median Household Income in Epworth is $69,188.
What is Income or Wage Gap in Epworth?
Income or Wage Gap in Epworth is 22.9%.
Women in Epworth earn 77.1 cents for every dollar earned by a man.
What is Inequality or Gini Index in Epworth?
Inequality or Gini Index in Epworth is 0.37.
What is the Total Population of Epworth?
Total Population of Epworth is 1,982.
What is the Total Male Population of Epworth?
Total Male Population of Epworth is 1,002.
What is the Total Female Population of Epworth?
Total Female Population of Epworth is 980.
What is the Ratio of Males per 100 Females in Epworth?
There are 102.24 Males per 100 Females in Epworth.
What is the Ratio of Females per 100 Males in Epworth?
There are 97.80 Females per 100 Males in Epworth.
What is the Median Population Age in Epworth?
Median Population Age in Epworth is 34.3 Years.
What is the Average Family Size in Epworth
Average Family Size in Epworth is 3.4 People.
What is the Average Household Size in Epworth
Average Household Size in Epworth is 2.5 People.
How Large is the Labor Force in Epworth?
There are 1,052 People in the Labor Forcein in Epworth.
What is the Percentage of People in the Labor Force in Epworth?
71.4% of People are in the Labor Force in Epworth.
What is the Unemployment Rate in Epworth?
Unemployment Rate in Epworth is 1.9%.