Elkader, IA Map & Demographics
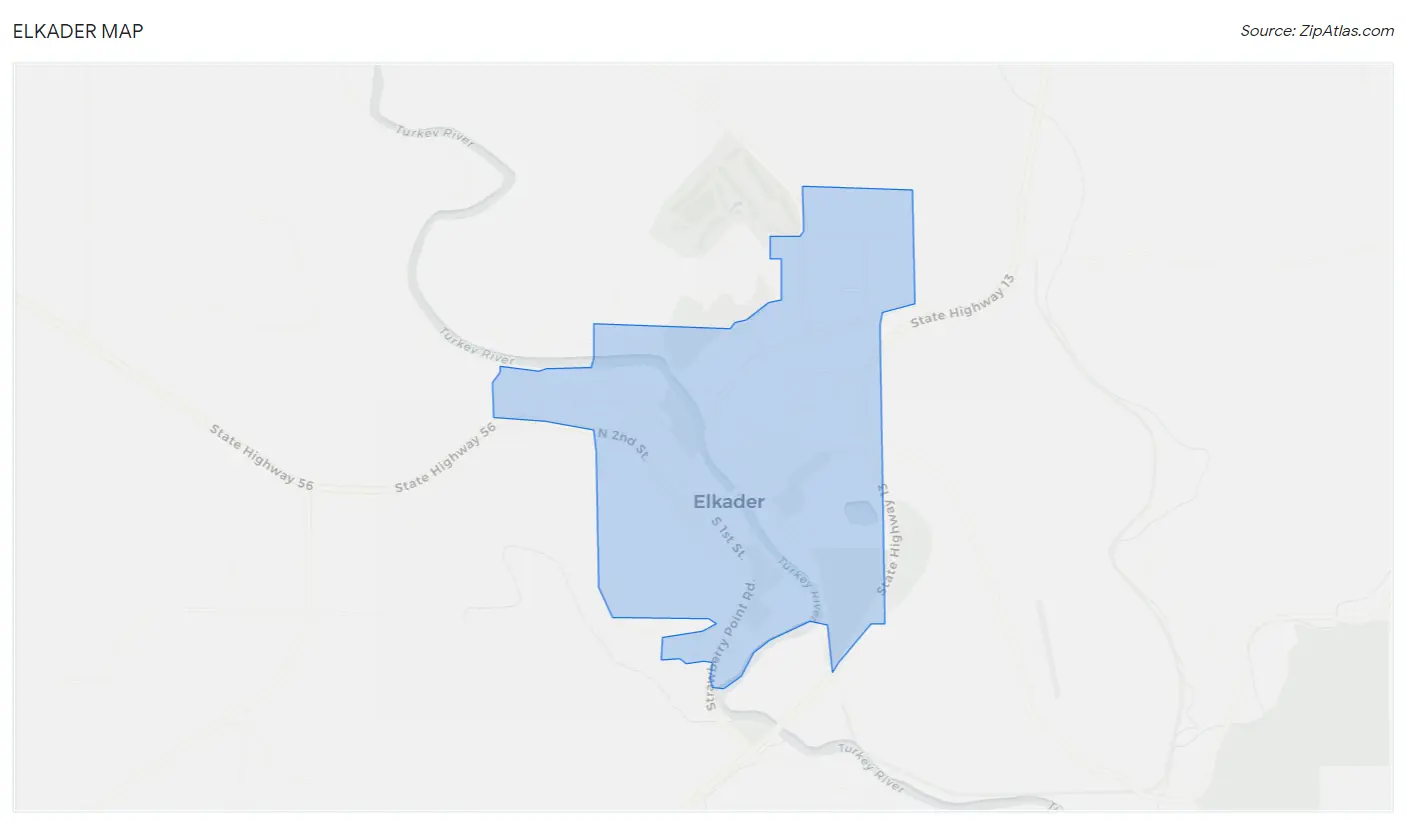
Elkader Map
Elkader Overview
$31,946
PER CAPITA INCOME
$98,015
AVG FAMILY INCOME
$62,574
AVG HOUSEHOLD INCOME
28.4%
WAGE / INCOME GAP [ % ]
71.6¢/ $1
WAGE / INCOME GAP [ $ ]
0.40
INEQUALITY / GINI INDEX
1,326
TOTAL POPULATION
629
MALE POPULATION
697
FEMALE POPULATION
90.24
MALES / 100 FEMALES
110.81
FEMALES / 100 MALES
41.0
MEDIAN AGE
3.0
AVG FAMILY SIZE
2.2
AVG HOUSEHOLD SIZE
624
LABOR FORCE [ PEOPLE ]
61.2%
PERCENT IN LABOR FORCE
1.0%
UNEMPLOYMENT RATE
Elkader Zip Codes
Elkader Area Codes
Income in Elkader
Income Overview in Elkader
Per Capita Income in Elkader is $31,946, while median incomes of families and households are $98,015 and $62,574 respectively.
| Characteristic | Number | Measure |
| Per Capita Income | 1,326 | $31,946 |
| Median Family Income | 313 | $98,015 |
| Mean Family Income | 313 | $89,063 |
| Median Household Income | 597 | $62,574 |
| Mean Household Income | 597 | $71,641 |
| Income Deficit | 313 | $0 |
| Wage / Income Gap (%) | 1,326 | 28.44% |
| Wage / Income Gap ($) | 1,326 | 71.56¢ per $1 |
| Gini / Inequality Index | 1,326 | 0.40 |
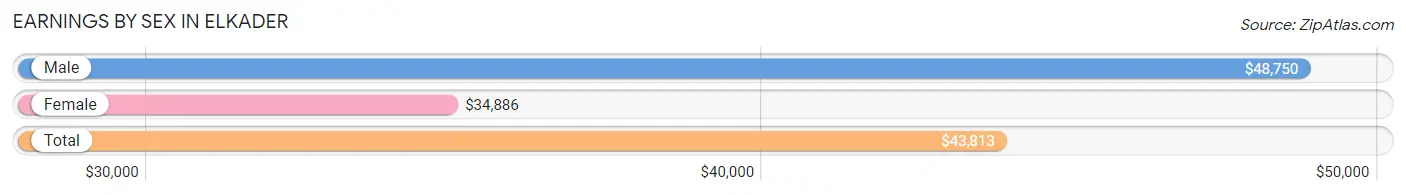
Earnings by Sex in Elkader
Average Earnings in Elkader are $43,813, $48,750 for men and $34,886 for women, a difference of 28.4%.
| Sex | Number | Average Earnings |
| Male | 374 (56.9%) | $48,750 |
| Female | 283 (43.1%) | $34,886 |
| Total | 657 (100.0%) | $43,813 |
Earnings by Sex by Income Bracket in Elkader
The most common earnings brackets in Elkader are $55,000 to $64,999 for men (67 | 17.9%) and $45,000 to $49,999 for women (60 | 21.2%).
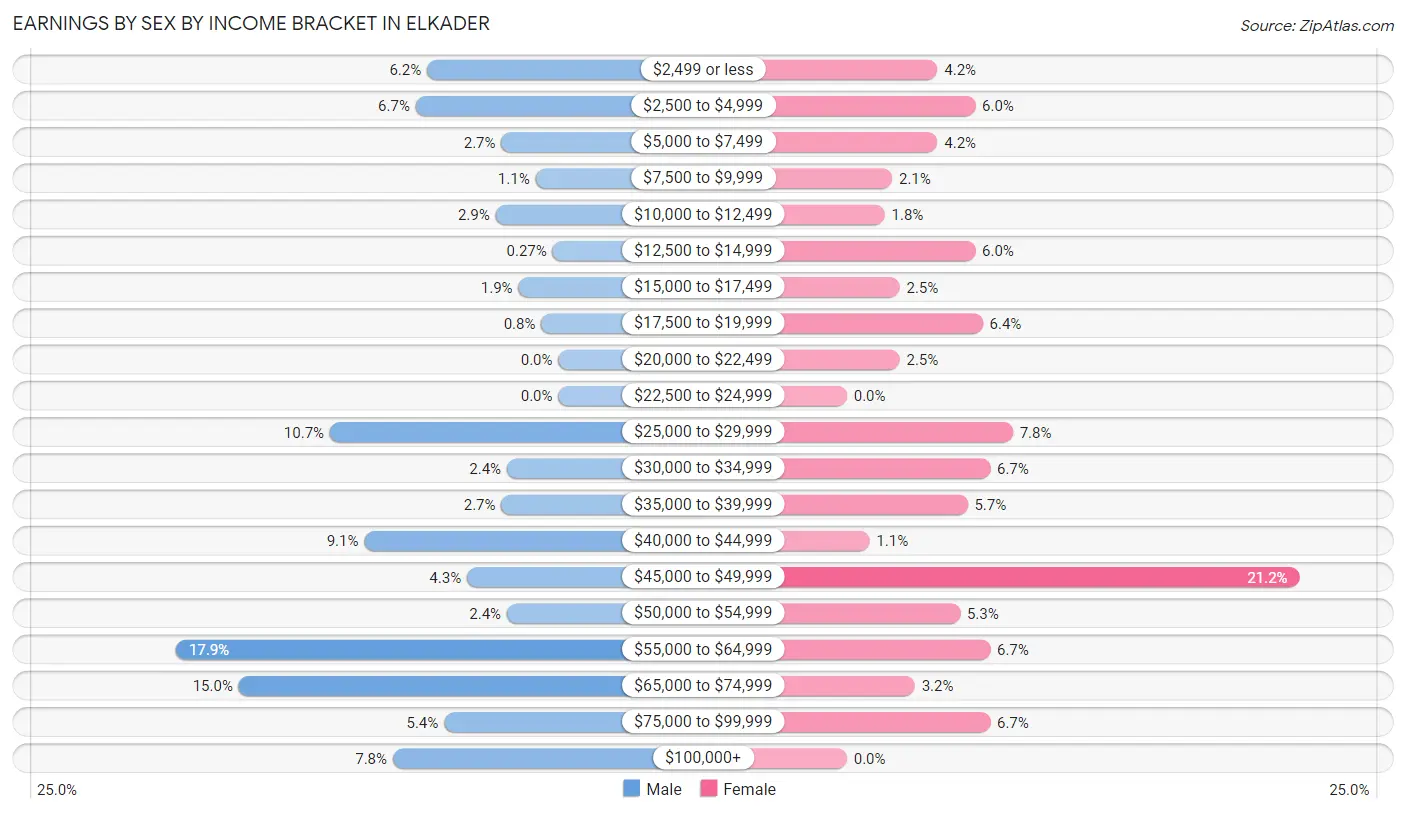
| Income | Male | Female |
| $2,499 or less | 23 (6.1%) | 12 (4.2%) |
| $2,500 to $4,999 | 25 (6.7%) | 17 (6.0%) |
| $5,000 to $7,499 | 10 (2.7%) | 12 (4.2%) |
| $7,500 to $9,999 | 4 (1.1%) | 6 (2.1%) |
| $10,000 to $12,499 | 11 (2.9%) | 5 (1.8%) |
| $12,500 to $14,999 | 1 (0.3%) | 17 (6.0%) |
| $15,000 to $17,499 | 7 (1.9%) | 7 (2.5%) |
| $17,500 to $19,999 | 3 (0.8%) | 18 (6.4%) |
| $20,000 to $22,499 | 0 (0.0%) | 7 (2.5%) |
| $22,500 to $24,999 | 0 (0.0%) | 0 (0.0%) |
| $25,000 to $29,999 | 40 (10.7%) | 22 (7.8%) |
| $30,000 to $34,999 | 9 (2.4%) | 19 (6.7%) |
| $35,000 to $39,999 | 10 (2.7%) | 16 (5.7%) |
| $40,000 to $44,999 | 34 (9.1%) | 3 (1.1%) |
| $45,000 to $49,999 | 16 (4.3%) | 60 (21.2%) |
| $50,000 to $54,999 | 9 (2.4%) | 15 (5.3%) |
| $55,000 to $64,999 | 67 (17.9%) | 19 (6.7%) |
| $65,000 to $74,999 | 56 (15.0%) | 9 (3.2%) |
| $75,000 to $99,999 | 20 (5.3%) | 19 (6.7%) |
| $100,000+ | 29 (7.7%) | 0 (0.0%) |
| Total | 374 (100.0%) | 283 (100.0%) |
Earnings by Sex by Educational Attainment in Elkader
Average earnings in Elkader are $55,625 for men and $35,417 for women, a difference of 36.3%. Men with an educational attainment of graduate degree enjoy the highest average annual earnings of $101,563, while those with college or associate's degree education earn the least with $42,059. Women with an educational attainment of graduate degree earn the most with the average annual earnings of $58,750, while those with less than high school education have the smallest earnings of $18,333.
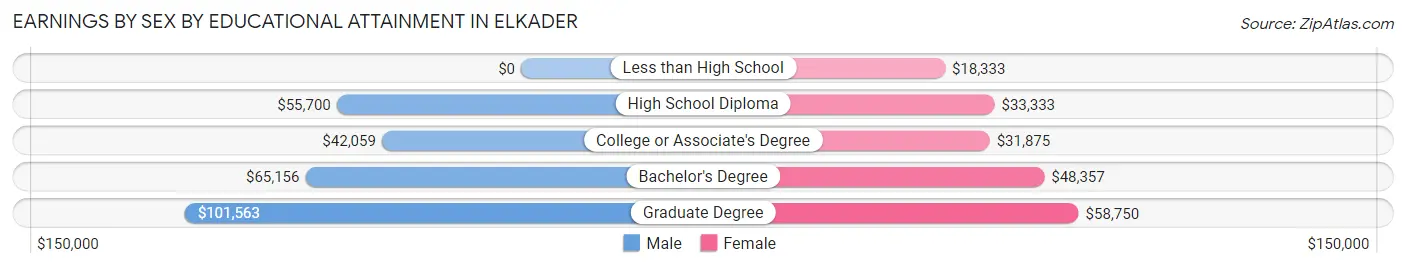
| Educational Attainment | Male Income | Female Income |
| Less than High School | - | - |
| High School Diploma | $55,700 | $33,333 |
| College or Associate's Degree | $42,059 | $31,875 |
| Bachelor's Degree | $65,156 | $48,357 |
| Graduate Degree | $101,563 | $58,750 |
| Total | $55,625 | $35,417 |
Family Income in Elkader
Family Income Brackets in Elkader
According to the Elkader family income data, there are 111 families falling into the $100,000 to $149,999 income range, which is the most common income bracket and makes up 35.5% of all families.
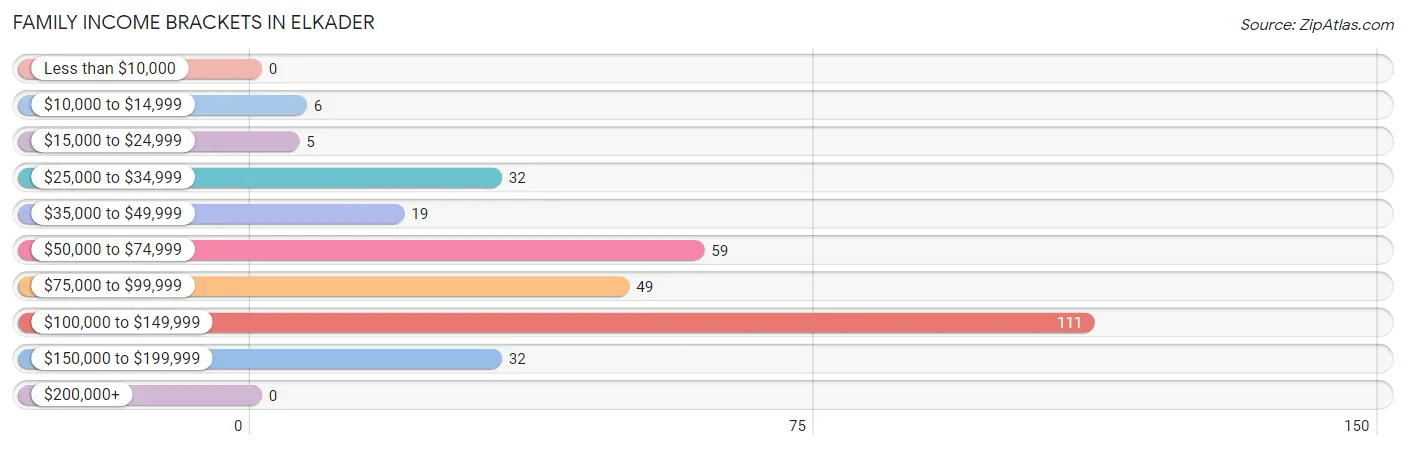
| Income Bracket | # Families | % Families |
| Less than $10,000 | 0 | 0.0% |
| $10,000 to $14,999 | 6 | 1.9% |
| $15,000 to $24,999 | 5 | 1.6% |
| $25,000 to $34,999 | 32 | 10.2% |
| $35,000 to $49,999 | 19 | 6.1% |
| $50,000 to $74,999 | 59 | 18.8% |
| $75,000 to $99,999 | 49 | 15.7% |
| $100,000 to $149,999 | 111 | 35.5% |
| $150,000 to $199,999 | 32 | 10.2% |
| $200,000+ | 0 | 0.0% |
Family Income by Famaliy Size in Elkader
5-person families (90 | 28.7%) account for the highest median family income in Elkader with $106,286 per family, while 2-person families (152 | 48.6%) have the highest median income of $33,594 per family member.
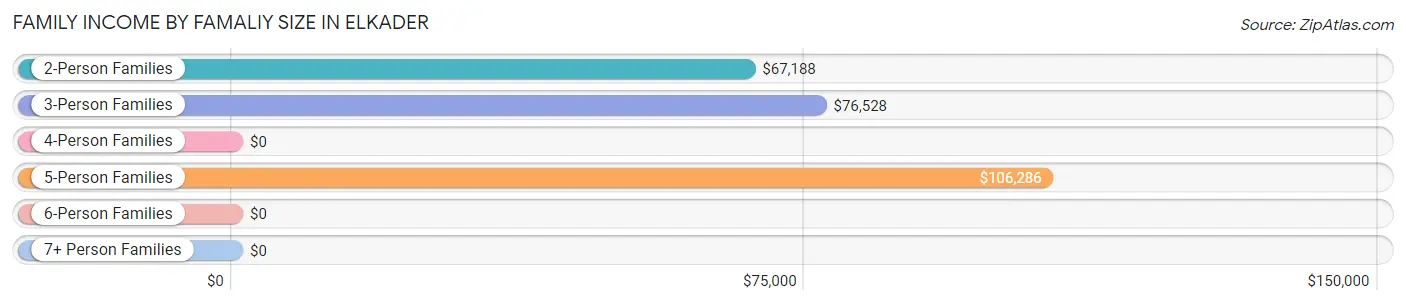
| Income Bracket | # Families | Median Income |
| 2-Person Families | 152 (48.6%) | $67,188 |
| 3-Person Families | 49 (15.7%) | $76,528 |
| 4-Person Families | 18 (5.8%) | $0 |
| 5-Person Families | 90 (28.7%) | $106,286 |
| 6-Person Families | 2 (0.6%) | $0 |
| 7+ Person Families | 2 (0.6%) | $0 |
| Total | 313 (100.0%) | $98,015 |
Family Income by Number of Earners in Elkader
The median family income in Elkader is $98,015, with families comprising 3+ earners (24) having the highest median family income of $151,250, while families with no earners (22) have the lowest median family income of $57,500, accounting for 7.7% and 7.0% of families, respectively.
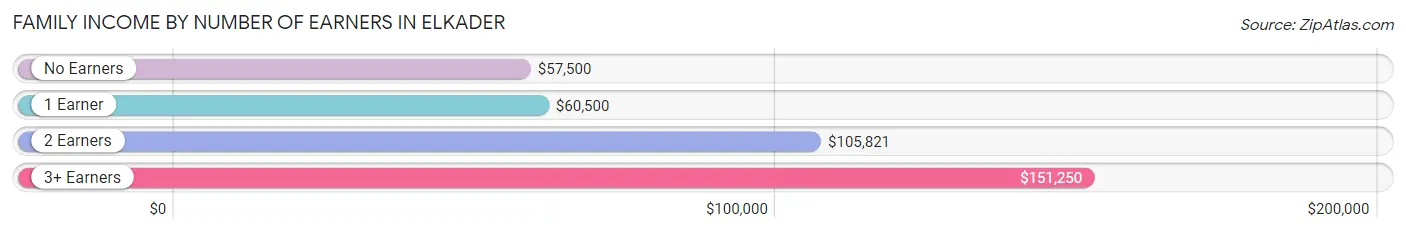
| Number of Earners | # Families | Median Income |
| No Earners | 22 (7.0%) | $57,500 |
| 1 Earner | 122 (39.0%) | $60,500 |
| 2 Earners | 145 (46.3%) | $105,821 |
| 3+ Earners | 24 (7.7%) | $151,250 |
| Total | 313 (100.0%) | $98,015 |
Household Income in Elkader
Household Income Brackets in Elkader
With 135 households falling in the category, the $100,000 to $149,999 income range is the most frequent in Elkader, accounting for 22.6% of all households. In contrast, only 6 households (1.0%) fall into the $200,000+ income bracket, making it the least populous group.
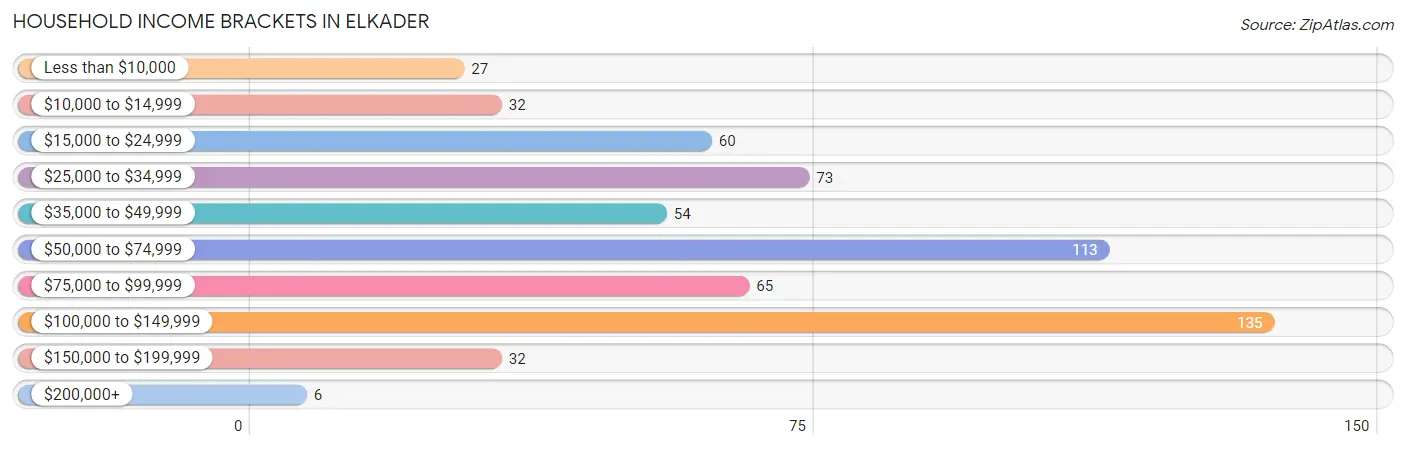
| Income Bracket | # Households | % Households |
| Less than $10,000 | 27 | 4.5% |
| $10,000 to $14,999 | 32 | 5.4% |
| $15,000 to $24,999 | 60 | 10.1% |
| $25,000 to $34,999 | 73 | 12.2% |
| $35,000 to $49,999 | 54 | 9.0% |
| $50,000 to $74,999 | 113 | 18.9% |
| $75,000 to $99,999 | 65 | 10.9% |
| $100,000 to $149,999 | 135 | 22.6% |
| $150,000 to $199,999 | 32 | 5.4% |
| $200,000+ | 6 | 1.0% |
Household Income by Householder Age in Elkader
The median household income in Elkader is $62,574, with the highest median household income of $99,083 found in the 25 to 44 years age bracket for the primary householder. A total of 157 households (26.3%) fall into this category. Meanwhile, the 15 to 24 years age bracket for the primary householder has the lowest median household income of $0, with 16 households (2.7%) in this group.
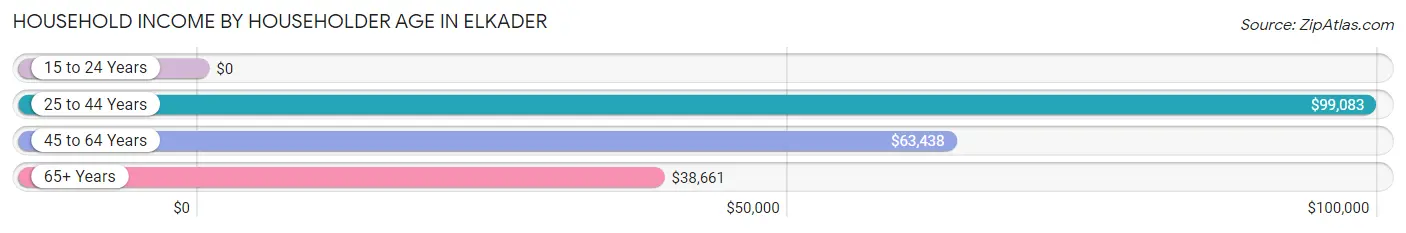
| Income Bracket | # Households | Median Income |
| 15 to 24 Years | 16 (2.7%) | $0 |
| 25 to 44 Years | 157 (26.3%) | $99,083 |
| 45 to 64 Years | 163 (27.3%) | $63,438 |
| 65+ Years | 261 (43.7%) | $38,661 |
| Total | 597 (100.0%) | $62,574 |
Poverty in Elkader
Income Below Poverty by Sex and Age in Elkader
With 4.0% poverty level for males and 8.8% for females among the residents of Elkader, 12 to 14 year old males and 18 to 24 year old females are the most vulnerable to poverty, with 4 males (14.3%) and 2 females (100.0%) in their respective age groups living below the poverty level.
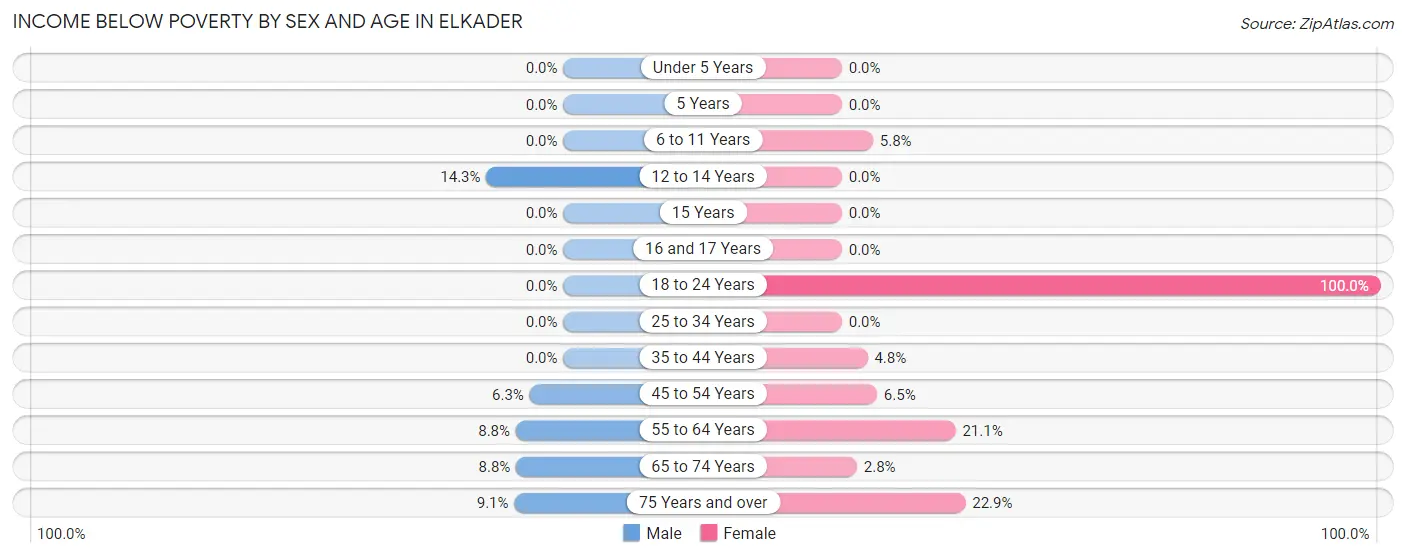
| Age Bracket | Male | Female |
| Under 5 Years | 0 (0.0%) | 0 (0.0%) |
| 5 Years | 0 (0.0%) | 0 (0.0%) |
| 6 to 11 Years | 0 (0.0%) | 3 (5.8%) |
| 12 to 14 Years | 4 (14.3%) | 0 (0.0%) |
| 15 Years | 0 (0.0%) | 0 (0.0%) |
| 16 and 17 Years | 0 (0.0%) | 0 (0.0%) |
| 18 to 24 Years | 0 (0.0%) | 2 (100.0%) |
| 25 to 34 Years | 0 (0.0%) | 0 (0.0%) |
| 35 to 44 Years | 0 (0.0%) | 4 (4.8%) |
| 45 to 54 Years | 3 (6.2%) | 3 (6.5%) |
| 55 to 64 Years | 6 (8.8%) | 23 (21.1%) |
| 65 to 74 Years | 7 (8.7%) | 3 (2.8%) |
| 75 Years and over | 4 (9.1%) | 22 (22.9%) |
| Total | 24 (4.0%) | 60 (8.8%) |
Income Above Poverty by Sex and Age in Elkader
According to the poverty statistics in Elkader, males aged under 5 years and females aged under 5 years are the age groups that are most secure financially, with 100.0% of males and 100.0% of females in these age groups living above the poverty line.
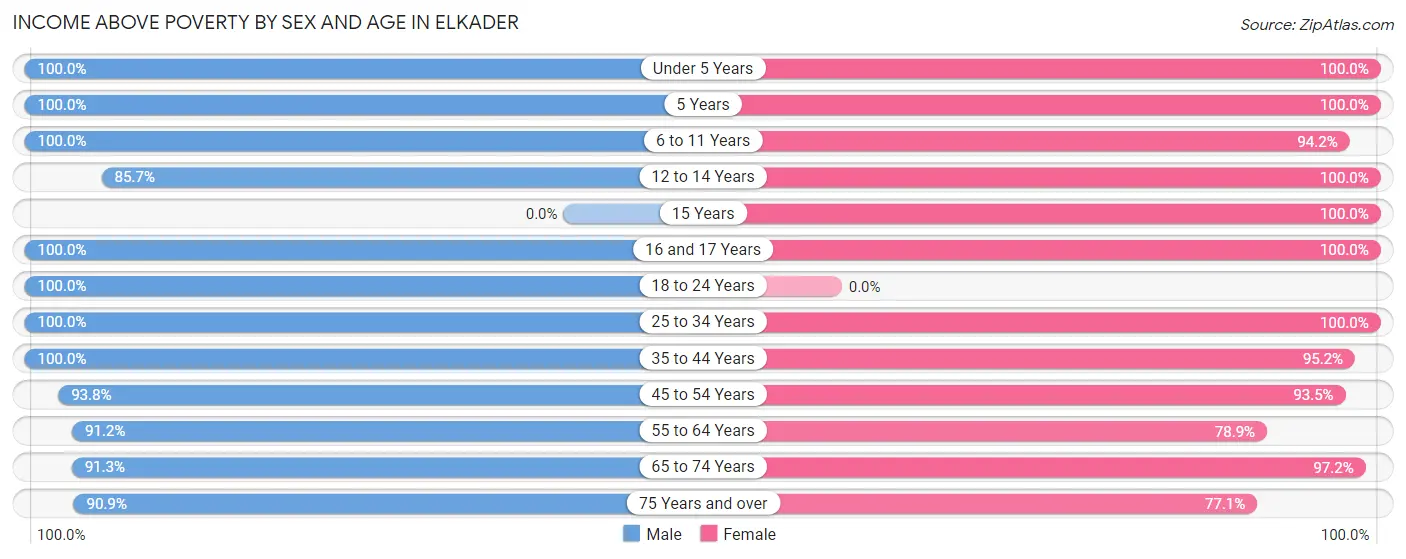
| Age Bracket | Male | Female |
| Under 5 Years | 26 (100.0%) | 36 (100.0%) |
| 5 Years | 24 (100.0%) | 14 (100.0%) |
| 6 to 11 Years | 65 (100.0%) | 49 (94.2%) |
| 12 to 14 Years | 24 (85.7%) | 44 (100.0%) |
| 15 Years | 0 (0.0%) | 4 (100.0%) |
| 16 and 17 Years | 25 (100.0%) | 3 (100.0%) |
| 18 to 24 Years | 38 (100.0%) | 0 (0.0%) |
| 25 to 34 Years | 62 (100.0%) | 88 (100.0%) |
| 35 to 44 Years | 94 (100.0%) | 80 (95.2%) |
| 45 to 54 Years | 45 (93.8%) | 43 (93.5%) |
| 55 to 64 Years | 62 (91.2%) | 86 (78.9%) |
| 65 to 74 Years | 73 (91.2%) | 104 (97.2%) |
| 75 Years and over | 40 (90.9%) | 74 (77.1%) |
| Total | 578 (96.0%) | 625 (91.2%) |
Income Below Poverty Among Married-Couple Families in Elkader
The poverty statistics for married-couple families in Elkader show that 0.7% or 2 of the total 266 families live below the poverty line. Families with no children have the highest poverty rate of 1.5%, comprising of 2 families. On the other hand, families with 1 or 2 children have the lowest poverty rate of 0.0%, which includes 0 families.
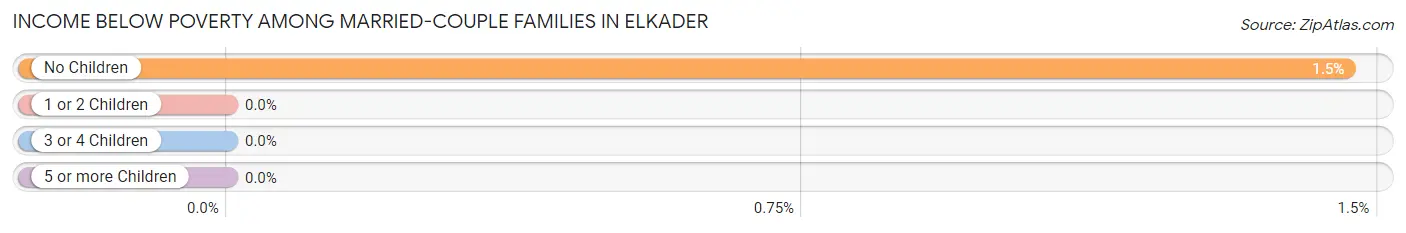
| Children | Above Poverty | Below Poverty |
| No Children | 135 (98.5%) | 2 (1.5%) |
| 1 or 2 Children | 53 (100.0%) | 0 (0.0%) |
| 3 or 4 Children | 74 (100.0%) | 0 (0.0%) |
| 5 or more Children | 2 (100.0%) | 0 (0.0%) |
| Total | 264 (99.3%) | 2 (0.7%) |
Income Below Poverty Among Single-Parent Households in Elkader
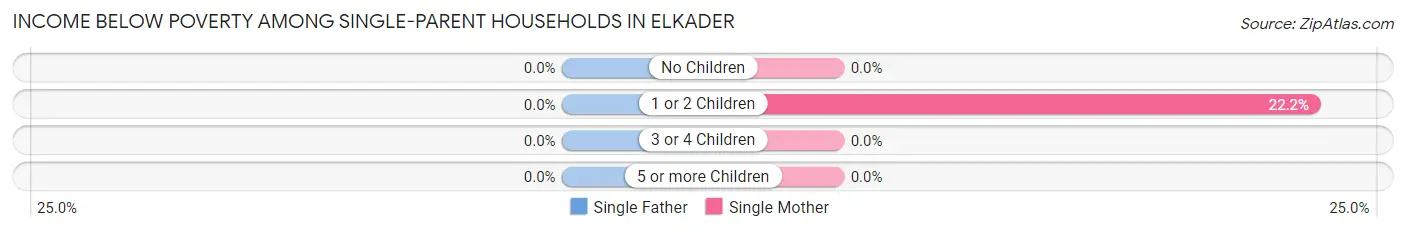
| Children | Single Father | Single Mother |
| No Children | 0 (0.0%) | 0 (0.0%) |
| 1 or 2 Children | 0 (0.0%) | 4 (22.2%) |
| 3 or 4 Children | 0 (0.0%) | 0 (0.0%) |
| 5 or more Children | 0 (0.0%) | 0 (0.0%) |
| Total | 0 (0.0%) | 4 (16.0%) |
Income Below Poverty Among Married-Couple vs Single-Parent Households in Elkader
The poverty data for Elkader shows that 2 of the married-couple family households (0.7%) and 4 of the single-parent households (8.5%) are living below the poverty level. Within the married-couple family households, those with no children have the highest poverty rate, with 2 households (1.5%) falling below the poverty line. Among the single-parent households, those with 1 or 2 children have the highest poverty rate, with 4 household (10.0%) living below poverty.
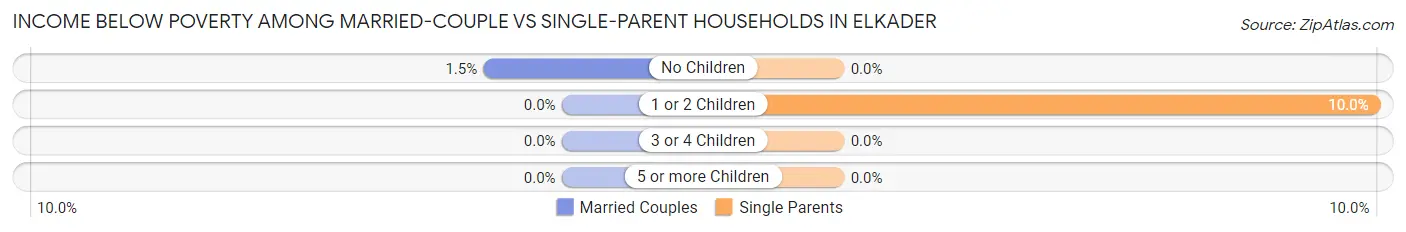
| Children | Married-Couple Families | Single-Parent Households |
| No Children | 2 (1.5%) | 0 (0.0%) |
| 1 or 2 Children | 0 (0.0%) | 4 (10.0%) |
| 3 or 4 Children | 0 (0.0%) | 0 (0.0%) |
| 5 or more Children | 0 (0.0%) | 0 (0.0%) |
| Total | 2 (0.7%) | 4 (8.5%) |
Race in Elkader
The most populous races in Elkader are White / Caucasian (1,259 | 95.0%), Two or more Races (54 | 4.1%), and Hispanic or Latino (45 | 3.4%).
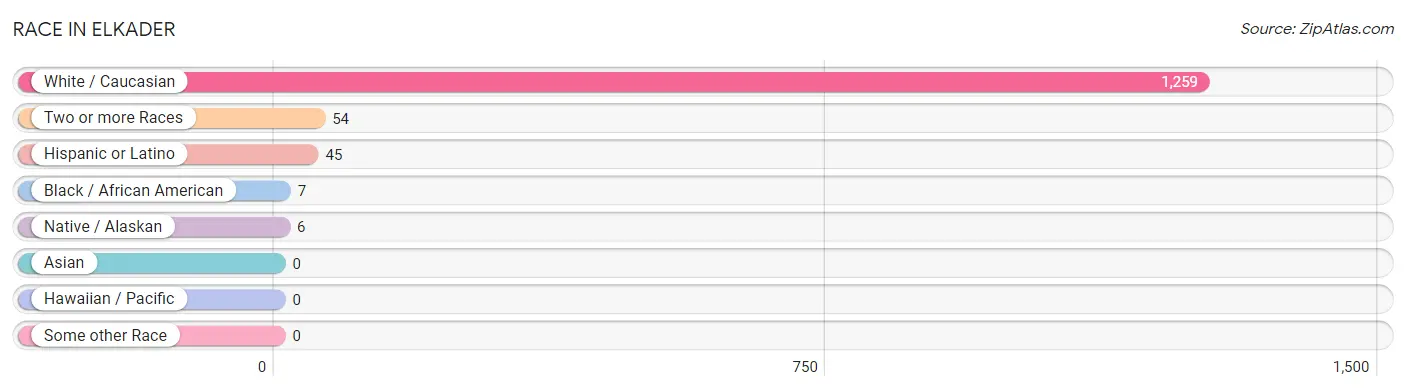
| Race | # Population | % Population |
| Asian | 0 | 0.0% |
| Black / African American | 7 | 0.5% |
| Hawaiian / Pacific | 0 | 0.0% |
| Hispanic or Latino | 45 | 3.4% |
| Native / Alaskan | 6 | 0.4% |
| White / Caucasian | 1,259 | 95.0% |
| Two or more Races | 54 | 4.1% |
| Some other Race | 0 | 0.0% |
| Total | 1,326 | 100.0% |
Ancestry in Elkader
The most populous ancestries reported in Elkader are German (684 | 51.6%), Irish (304 | 22.9%), Norwegian (149 | 11.2%), English (84 | 6.3%), and Mexican (45 | 3.4%), together accounting for 95.5% of all Elkader residents.
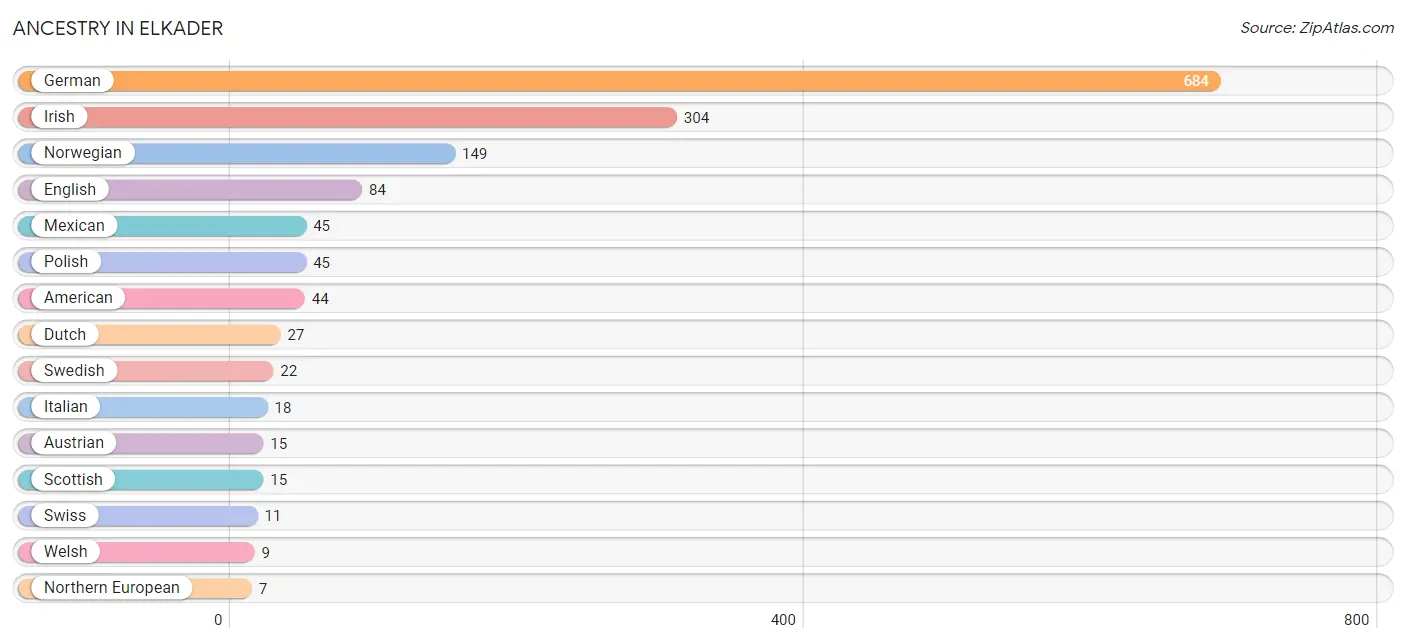
| Ancestry | # Population | % Population |
| African | 5 | 0.4% |
| American | 44 | 3.3% |
| Austrian | 15 | 1.1% |
| Belgian | 3 | 0.2% |
| Celtic | 3 | 0.2% |
| Cherokee | 3 | 0.2% |
| Czech | 4 | 0.3% |
| Dutch | 27 | 2.0% |
| Dutch West Indian | 3 | 0.2% |
| English | 84 | 6.3% |
| European | 2 | 0.2% |
| French | 6 | 0.4% |
| German | 684 | 51.6% |
| Greek | 1 | 0.1% |
| Irish | 304 | 22.9% |
| Italian | 18 | 1.4% |
| Mexican | 45 | 3.4% |
| Mexican American Indian | 3 | 0.2% |
| Northern European | 7 | 0.5% |
| Norwegian | 149 | 11.2% |
| Polish | 45 | 3.4% |
| Scandinavian | 3 | 0.2% |
| Scottish | 15 | 1.1% |
| Subsaharan African | 5 | 0.4% |
| Swedish | 22 | 1.7% |
| Swiss | 11 | 0.8% |
| Welsh | 9 | 0.7% | View All 27 Rows |
Immigrants in Elkader
The most numerous immigrant groups reported in Elkader came from Central America (32 | 2.4%), Latin America (32 | 2.4%), and Mexico (32 | 2.4%), together accounting for 7.2% of all Elkader residents.
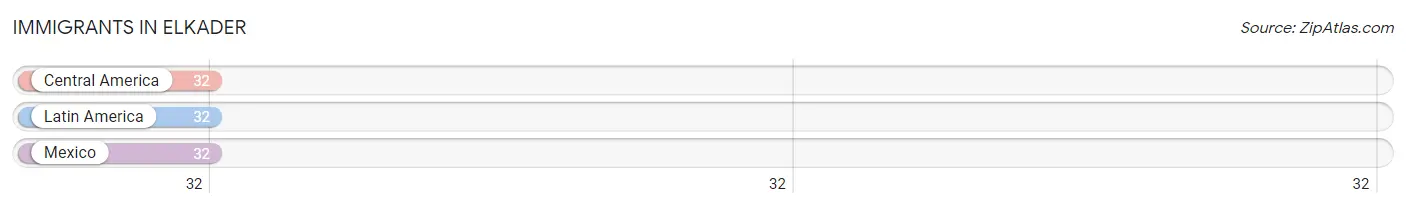
| Immigration Origin | # Population | % Population |
| Central America | 32 | 2.4% |
| Latin America | 32 | 2.4% |
| Mexico | 32 | 2.4% | View All 3 Rows |
Sex and Age in Elkader
Sex and Age in Elkader
The most populous age groups in Elkader are 5 to 9 Years (73 | 11.6%) for men and 85 Years and over (76 | 10.9%) for women.
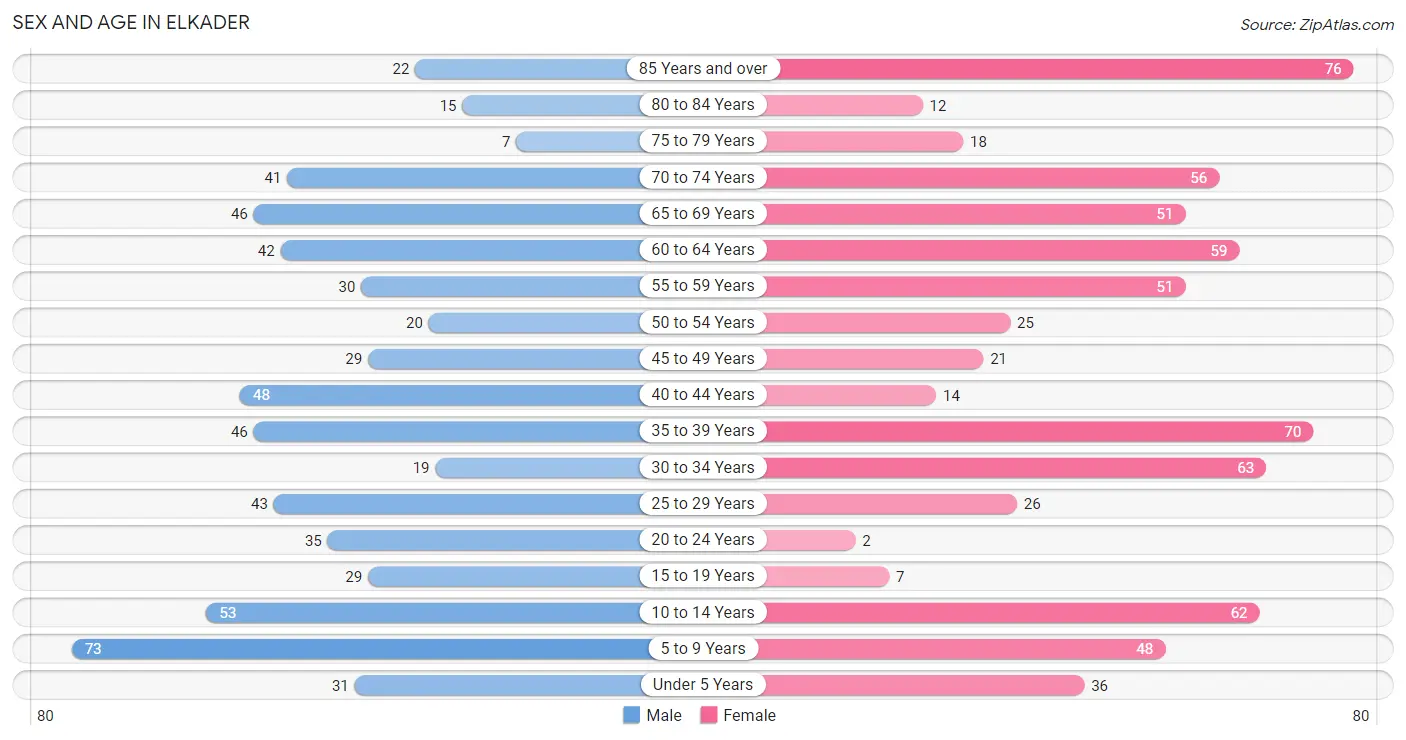
| Age Bracket | Male | Female |
| Under 5 Years | 31 (4.9%) | 36 (5.2%) |
| 5 to 9 Years | 73 (11.6%) | 48 (6.9%) |
| 10 to 14 Years | 53 (8.4%) | 62 (8.9%) |
| 15 to 19 Years | 29 (4.6%) | 7 (1.0%) |
| 20 to 24 Years | 35 (5.6%) | 2 (0.3%) |
| 25 to 29 Years | 43 (6.8%) | 26 (3.7%) |
| 30 to 34 Years | 19 (3.0%) | 63 (9.0%) |
| 35 to 39 Years | 46 (7.3%) | 70 (10.0%) |
| 40 to 44 Years | 48 (7.6%) | 14 (2.0%) |
| 45 to 49 Years | 29 (4.6%) | 21 (3.0%) |
| 50 to 54 Years | 20 (3.2%) | 25 (3.6%) |
| 55 to 59 Years | 30 (4.8%) | 51 (7.3%) |
| 60 to 64 Years | 42 (6.7%) | 59 (8.5%) |
| 65 to 69 Years | 46 (7.3%) | 51 (7.3%) |
| 70 to 74 Years | 41 (6.5%) | 56 (8.0%) |
| 75 to 79 Years | 7 (1.1%) | 18 (2.6%) |
| 80 to 84 Years | 15 (2.4%) | 12 (1.7%) |
| 85 Years and over | 22 (3.5%) | 76 (10.9%) |
| Total | 629 (100.0%) | 697 (100.0%) |
Families and Households in Elkader
Median Family Size in Elkader
The median family size in Elkader is 3.04 persons per family, with single female/mother families (25 | 8.0%) accounting for the largest median family size of 3.28 persons per family. On the other hand, single male/father families (22 | 7.0%) represent the smallest median family size with 2.23 persons per family.
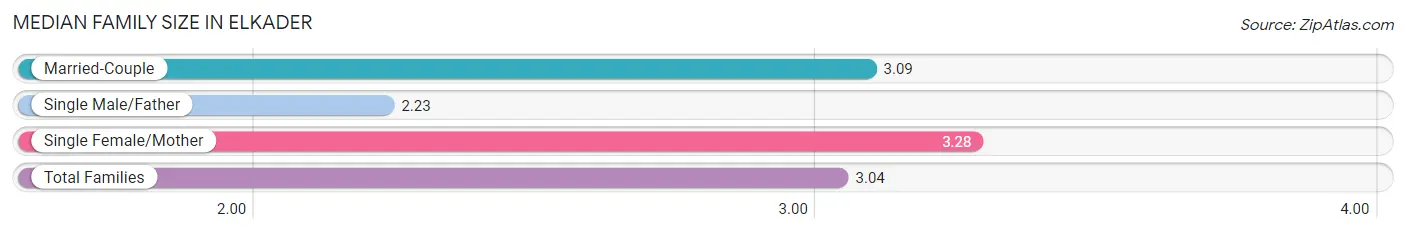
| Family Type | # Families | Family Size |
| Married-Couple | 266 (85.0%) | 3.09 |
| Single Male/Father | 22 (7.0%) | 2.23 |
| Single Female/Mother | 25 (8.0%) | 3.28 |
| Total Families | 313 (100.0%) | 3.04 |
Median Household Size in Elkader
The median household size in Elkader is 2.18 persons per household, with single female/mother households (25 | 4.2%) accounting for the largest median household size of 3.92 persons per household. non-family households (284 | 47.6%) represent the smallest median household size with 1.07 persons per household.
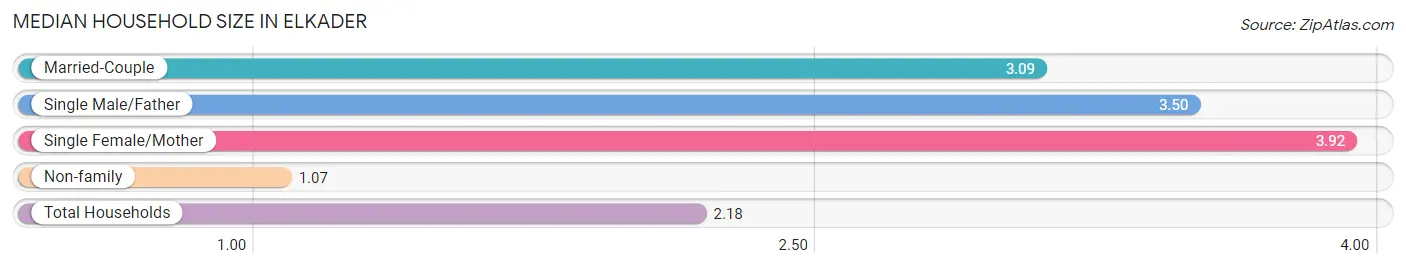
| Household Type | # Households | Household Size |
| Married-Couple | 266 (44.6%) | 3.09 |
| Single Male/Father | 22 (3.7%) | 3.50 |
| Single Female/Mother | 25 (4.2%) | 3.92 |
| Non-family | 284 (47.6%) | 1.07 |
| Total Households | 597 (100.0%) | 2.18 |
Household Size by Marriage Status in Elkader
Out of a total of 597 households in Elkader, 313 (52.4%) are family households, while 284 (47.6%) are nonfamily households. The most numerous type of family households are 2-person households, comprising 146, and the most common type of nonfamily households are 1-person households, comprising 270.
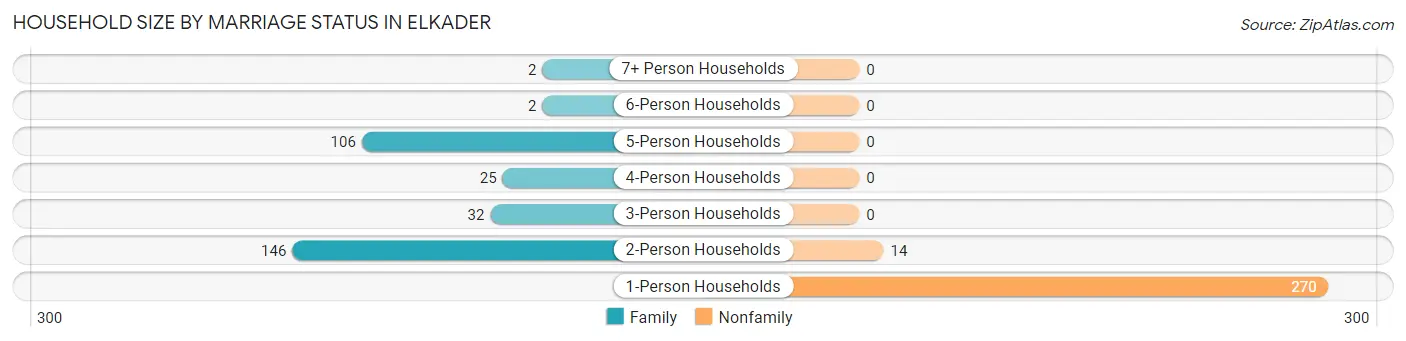
| Household Size | Family Households | Nonfamily Households |
| 1-Person Households | - | 270 (45.2%) |
| 2-Person Households | 146 (24.5%) | 14 (2.4%) |
| 3-Person Households | 32 (5.4%) | 0 (0.0%) |
| 4-Person Households | 25 (4.2%) | 0 (0.0%) |
| 5-Person Households | 106 (17.8%) | 0 (0.0%) |
| 6-Person Households | 2 (0.3%) | 0 (0.0%) |
| 7+ Person Households | 2 (0.3%) | 0 (0.0%) |
| Total | 313 (52.4%) | 284 (47.6%) |
Female Fertility in Elkader
Fertility by Age in Elkader
Average fertility rate in Elkader is 58.0 births per 1,000 women. Women in the age bracket of 35 to 50 years have the highest fertility rate with 65.0 births per 1,000 women. Women in the age bracket of 35 to 50 years acount for 58.3% of all women with births.
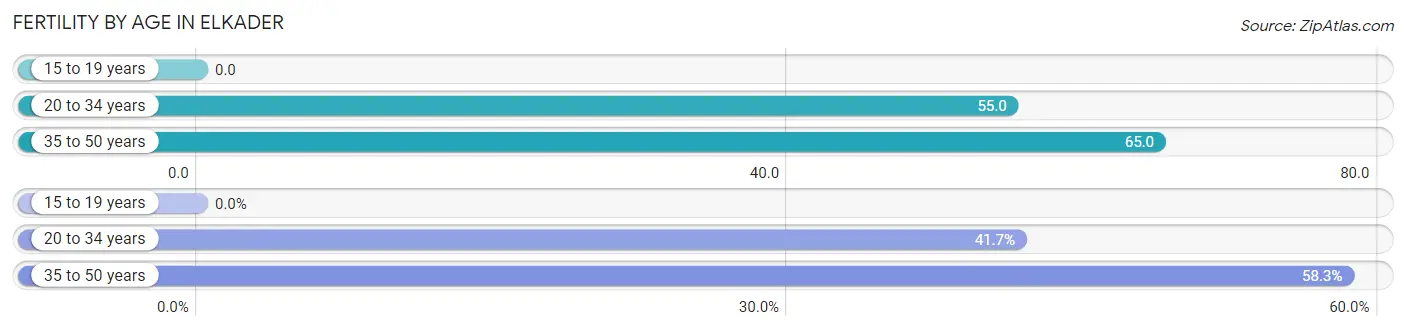
| Age Bracket | Women with Births | Births / 1,000 Women |
| 15 to 19 years | 0 (0.0%) | 0.0 |
| 20 to 34 years | 5 (41.7%) | 55.0 |
| 35 to 50 years | 7 (58.3%) | 65.0 |
| Total | 12 (100.0%) | 58.0 |
Fertility by Age by Marriage Status in Elkader
58.3% of women with births (12) in Elkader are married. The highest percentage of unmarried women with births falls into 20 to 34 years age bracket with 100.0% of them unmarried at the time of birth, while the lowest percentage of unmarried women with births belong to 35 to 50 years age bracket with 0.0% of them unmarried.
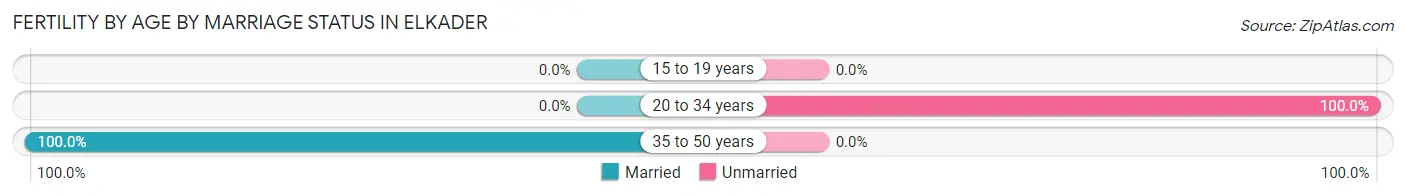
| Age Bracket | Married | Unmarried |
| 15 to 19 years | 0 (0.0%) | 0 (0.0%) |
| 20 to 34 years | 0 (0.0%) | 5 (100.0%) |
| 35 to 50 years | 7 (100.0%) | 0 (0.0%) |
| Total | 7 (58.3%) | 5 (41.7%) |
Fertility by Education in Elkader
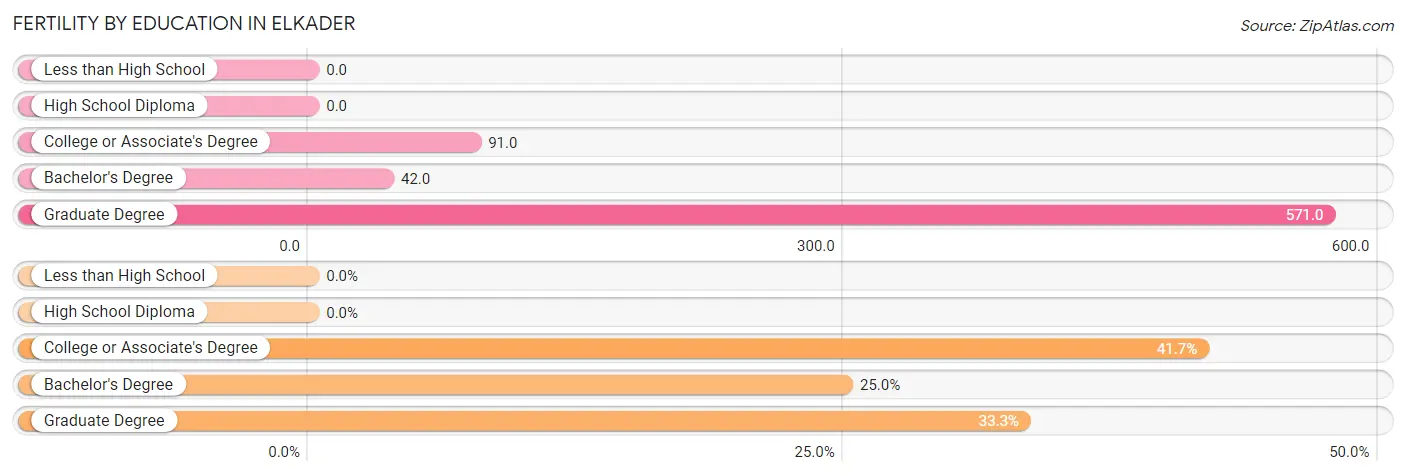
| Educational Attainment | Women with Births | Births / 1,000 Women |
| Less than High School | 0 (0.0%) | 0.0 |
| High School Diploma | 0 (0.0%) | 0.0 |
| College or Associate's Degree | 5 (41.7%) | 91.0 |
| Bachelor's Degree | 3 (25.0%) | 42.0 |
| Graduate Degree | 4 (33.3%) | 571.0 |
| Total | 12 (100.0%) | 58.0 |
Fertility by Education by Marriage Status in Elkader
41.7% of women with births in Elkader are unmarried. Women with the educational attainment of bachelor's degree are most likely to be married with 100.0% of them married at childbirth, while women with the educational attainment of college or associate's degree are least likely to be married with 100.0% of them unmarried at childbirth.
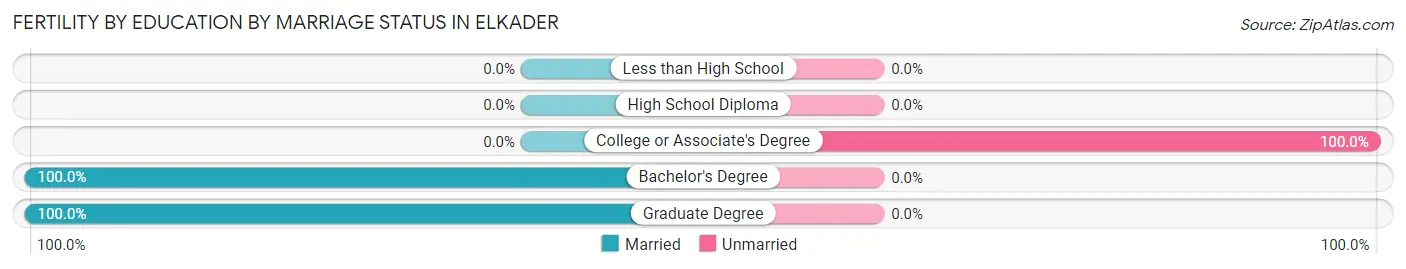
| Educational Attainment | Married | Unmarried |
| Less than High School | 0 (0.0%) | 0 (0.0%) |
| High School Diploma | 0 (0.0%) | 0 (0.0%) |
| College or Associate's Degree | 0 (0.0%) | 5 (100.0%) |
| Bachelor's Degree | 3 (100.0%) | 0 (0.0%) |
| Graduate Degree | 4 (100.0%) | 0 (0.0%) |
| Total | 7 (58.3%) | 5 (41.7%) |
Employment Characteristics in Elkader
Employment by Class of Employer in Elkader
Among the 618 employed individuals in Elkader, private company employees (392 | 63.4%), local government employees (99 | 16.0%), and not-for-profit organizations (46 | 7.4%) make up the most common classes of employment.
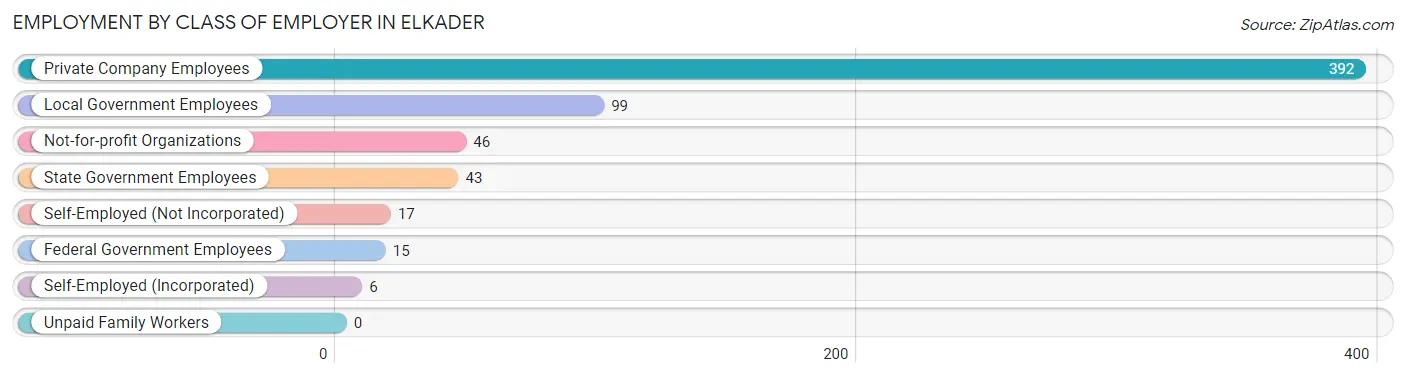
| Employer Class | # Employees | % Employees |
| Private Company Employees | 392 | 63.4% |
| Self-Employed (Incorporated) | 6 | 1.0% |
| Self-Employed (Not Incorporated) | 17 | 2.8% |
| Not-for-profit Organizations | 46 | 7.4% |
| Local Government Employees | 99 | 16.0% |
| State Government Employees | 43 | 7.0% |
| Federal Government Employees | 15 | 2.4% |
| Unpaid Family Workers | 0 | 0.0% |
| Total | 618 | 100.0% |
Employment Status by Age in Elkader
According to the labor force statistics for Elkader, out of the total population over 16 years of age (1,019), 61.2% or 624 individuals are in the labor force, with 1.0% or 6 of them unemployed. The age group with the highest labor force participation rate is 45 to 54 years, with 98.9% or 94 individuals in the labor force. Within the labor force, the 45 to 54 years age range has the highest percentage of unemployed individuals, with 6.4% or 6 of them being unemployed.
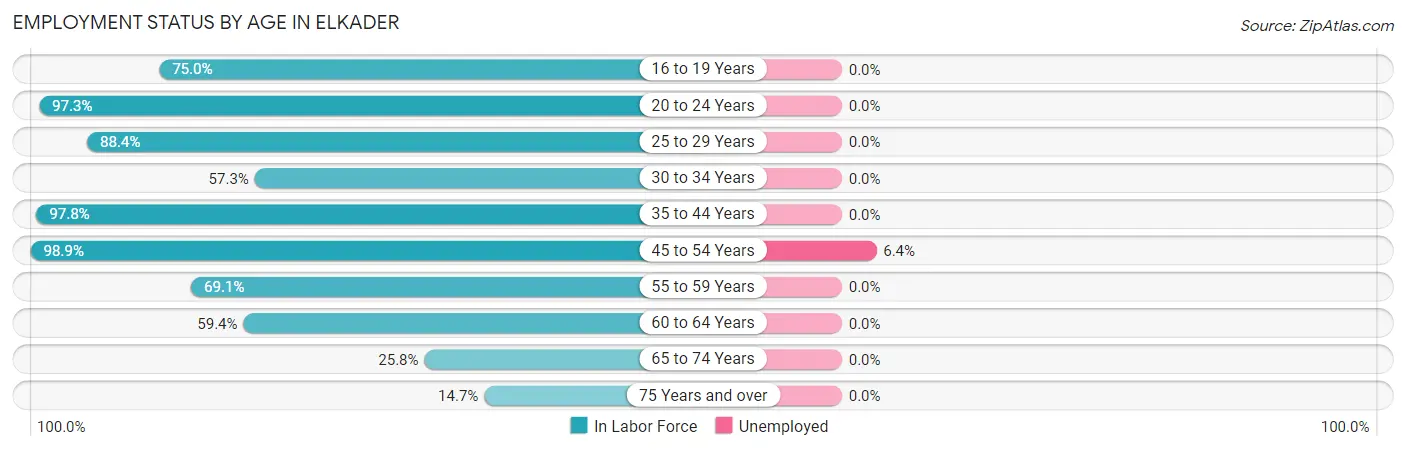
| Age Bracket | In Labor Force | Unemployed |
| 16 to 19 Years | 24 (75.0%) | 0 (0.0%) |
| 20 to 24 Years | 36 (97.3%) | 0 (0.0%) |
| 25 to 29 Years | 61 (88.4%) | 0 (0.0%) |
| 30 to 34 Years | 47 (57.3%) | 0 (0.0%) |
| 35 to 44 Years | 174 (97.8%) | 0 (0.0%) |
| 45 to 54 Years | 94 (98.9%) | 6 (6.4%) |
| 55 to 59 Years | 56 (69.1%) | 0 (0.0%) |
| 60 to 64 Years | 60 (59.4%) | 0 (0.0%) |
| 65 to 74 Years | 50 (25.8%) | 0 (0.0%) |
| 75 Years and over | 22 (14.7%) | 0 (0.0%) |
| Total | 624 (61.2%) | 6 (1.0%) |
Employment Status by Educational Attainment in Elkader
According to labor force statistics for Elkader, 81.2% of individuals (492) out of the total population between 25 and 64 years of age (606) are in the labor force, with 1.2% or 6 of them being unemployed. The group with the highest labor force participation rate are those with the educational attainment of less than high school, with 100.0% or 28 individuals in the labor force. Within the labor force, individuals with bachelor's degree or higher education have the highest percentage of unemployment, with 1.9% or 3 of them being unemployed.
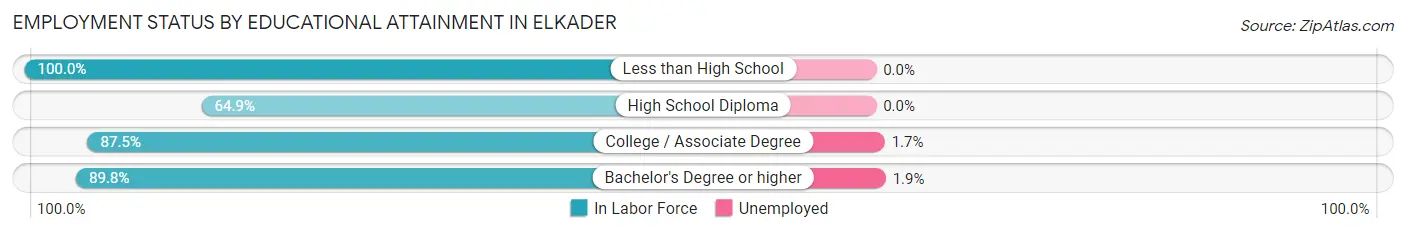
| Educational Attainment | In Labor Force | Unemployed |
| Less than High School | 28 (100.0%) | 0 (0.0%) |
| High School Diploma | 131 (64.9%) | 0 (0.0%) |
| College / Associate Degree | 175 (87.5%) | 3 (1.7%) |
| Bachelor's Degree or higher | 158 (89.8%) | 3 (1.9%) |
| Total | 492 (81.2%) | 7 (1.2%) |
Employment Occupations by Sex in Elkader
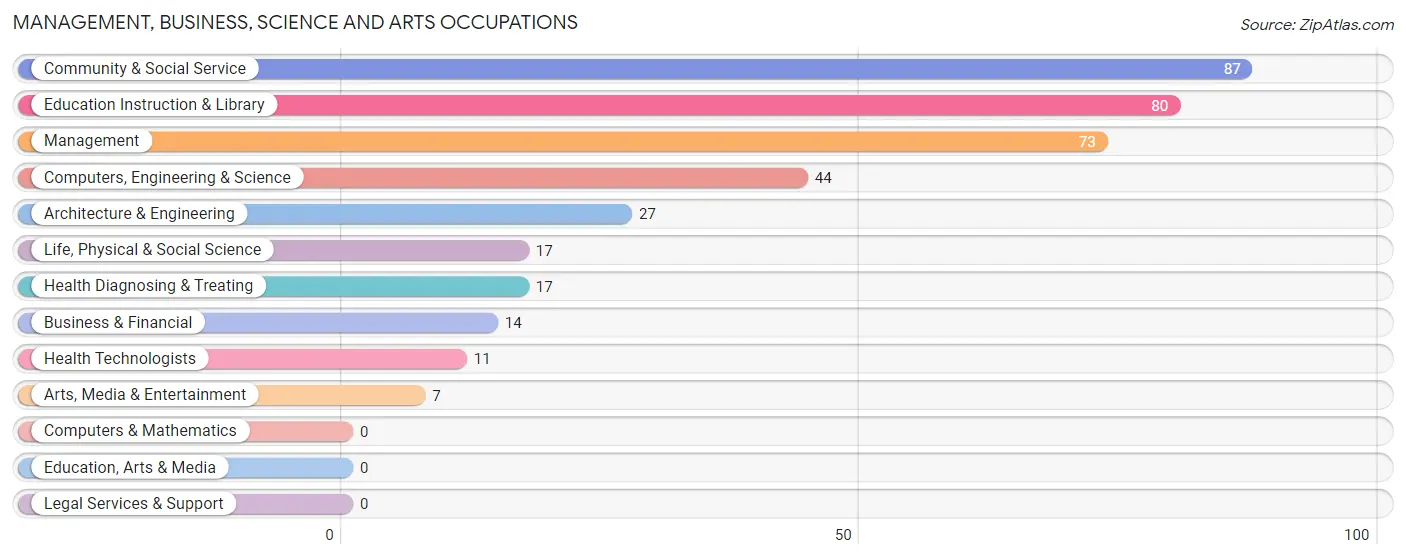
Management, Business, Science and Arts Occupations
The most common Management, Business, Science and Arts occupations in Elkader are Community & Social Service (87 | 14.1%), Education Instruction & Library (80 | 12.9%), Management (73 | 11.8%), Computers, Engineering & Science (44 | 7.1%), and Architecture & Engineering (27 | 4.4%).
Management, Business, Science and Arts Occupations by Sex
Within the Management, Business, Science and Arts occupations in Elkader, the most male-oriented occupations are Architecture & Engineering (100.0%), Arts, Media & Entertainment (100.0%), and Management (86.3%), while the most female-oriented occupations are Education Instruction & Library (88.7%), Community & Social Service (81.6%), and Health Diagnosing & Treating (76.5%).
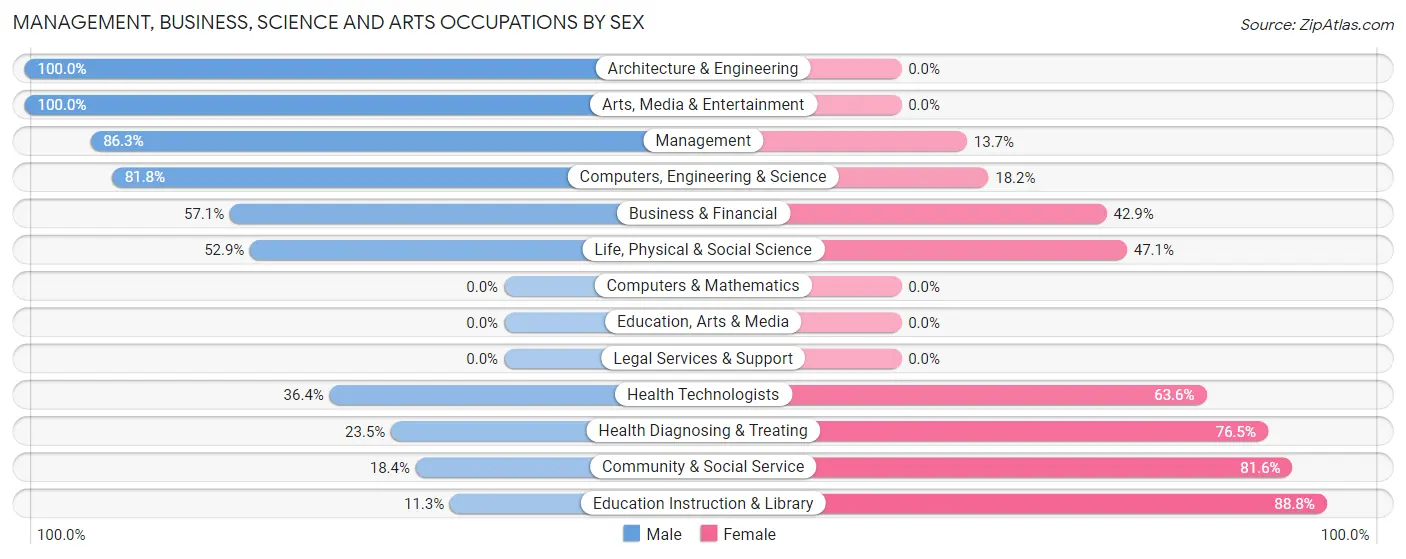
| Occupation | Male | Female |
| Management | 63 (86.3%) | 10 (13.7%) |
| Business & Financial | 8 (57.1%) | 6 (42.9%) |
| Computers, Engineering & Science | 36 (81.8%) | 8 (18.2%) |
| Computers & Mathematics | 0 (0.0%) | 0 (0.0%) |
| Architecture & Engineering | 27 (100.0%) | 0 (0.0%) |
| Life, Physical & Social Science | 9 (52.9%) | 8 (47.1%) |
| Community & Social Service | 16 (18.4%) | 71 (81.6%) |
| Education, Arts & Media | 0 (0.0%) | 0 (0.0%) |
| Legal Services & Support | 0 (0.0%) | 0 (0.0%) |
| Education Instruction & Library | 9 (11.3%) | 71 (88.7%) |
| Arts, Media & Entertainment | 7 (100.0%) | 0 (0.0%) |
| Health Diagnosing & Treating | 4 (23.5%) | 13 (76.5%) |
| Health Technologists | 4 (36.4%) | 7 (63.6%) |
| Total (Category) | 127 (54.0%) | 108 (46.0%) |
| Total (Overall) | 356 (57.6%) | 262 (42.4%) |
Services Occupations
The most common Services occupations in Elkader are Food Preparation & Serving (33 | 5.3%), Security & Protection (21 | 3.4%), Firefighting & Prevention (21 | 3.4%), Healthcare Support (20 | 3.2%), and Cleaning & Maintenance (15 | 2.4%).
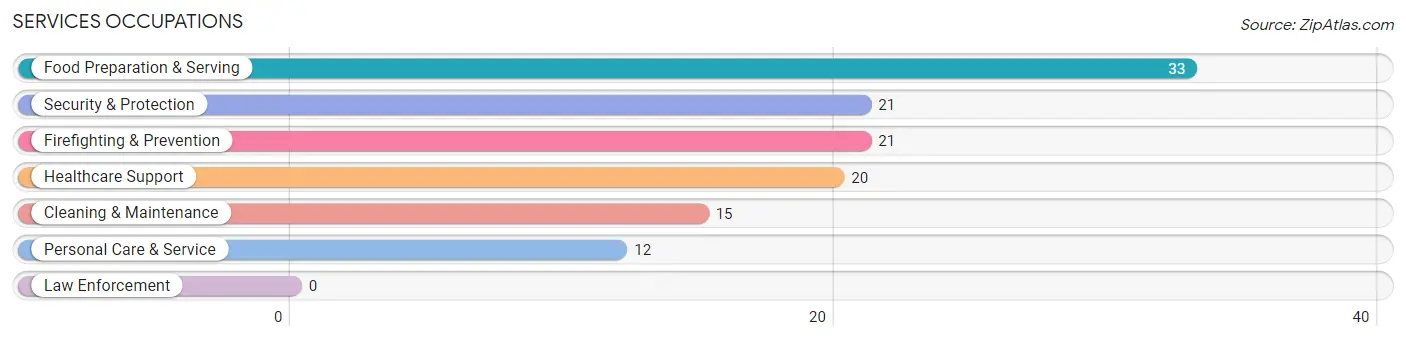
Services Occupations by Sex
Within the Services occupations in Elkader, the most male-oriented occupations are Cleaning & Maintenance (80.0%), Food Preparation & Serving (66.7%), and Security & Protection (47.6%), while the most female-oriented occupations are Healthcare Support (80.0%), Personal Care & Service (75.0%), and Security & Protection (52.4%).
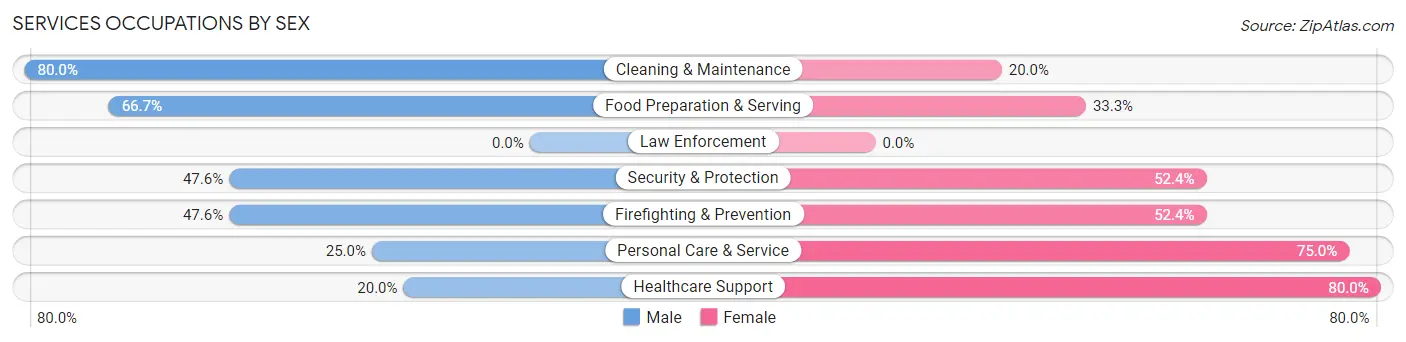
| Occupation | Male | Female |
| Healthcare Support | 4 (20.0%) | 16 (80.0%) |
| Security & Protection | 10 (47.6%) | 11 (52.4%) |
| Firefighting & Prevention | 10 (47.6%) | 11 (52.4%) |
| Law Enforcement | 0 (0.0%) | 0 (0.0%) |
| Food Preparation & Serving | 22 (66.7%) | 11 (33.3%) |
| Cleaning & Maintenance | 12 (80.0%) | 3 (20.0%) |
| Personal Care & Service | 3 (25.0%) | 9 (75.0%) |
| Total (Category) | 51 (50.5%) | 50 (49.5%) |
| Total (Overall) | 356 (57.6%) | 262 (42.4%) |
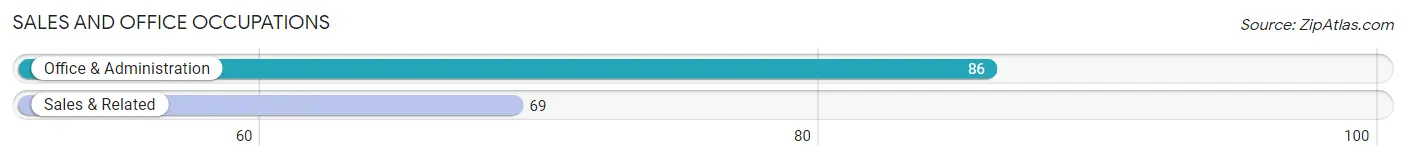
Sales and Office Occupations
The most common Sales and Office occupations in Elkader are Office & Administration (86 | 13.9%), and Sales & Related (69 | 11.2%).
Sales and Office Occupations by Sex
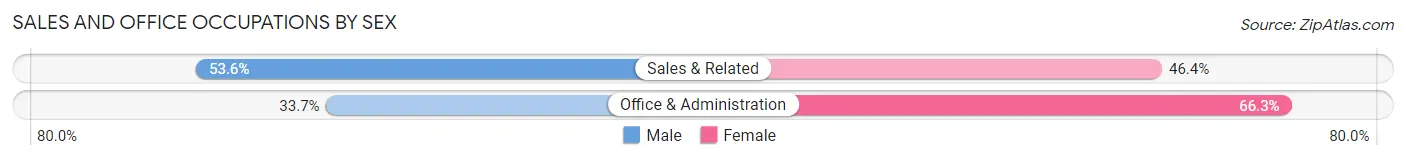
| Occupation | Male | Female |
| Sales & Related | 37 (53.6%) | 32 (46.4%) |
| Office & Administration | 29 (33.7%) | 57 (66.3%) |
| Total (Category) | 66 (42.6%) | 89 (57.4%) |
| Total (Overall) | 356 (57.6%) | 262 (42.4%) |
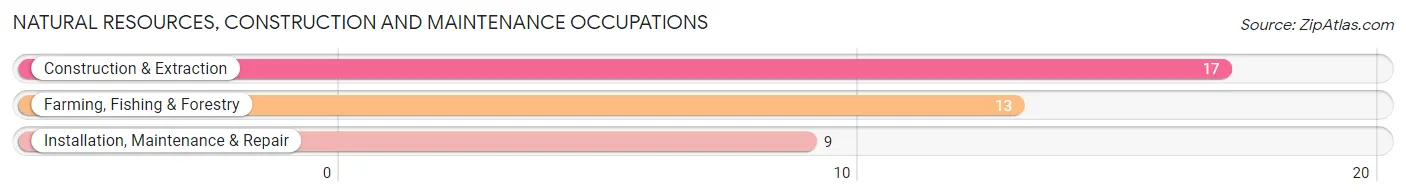
Natural Resources, Construction and Maintenance Occupations
The most common Natural Resources, Construction and Maintenance occupations in Elkader are Construction & Extraction (17 | 2.8%), Farming, Fishing & Forestry (13 | 2.1%), and Installation, Maintenance & Repair (9 | 1.5%).
Natural Resources, Construction and Maintenance Occupations by Sex
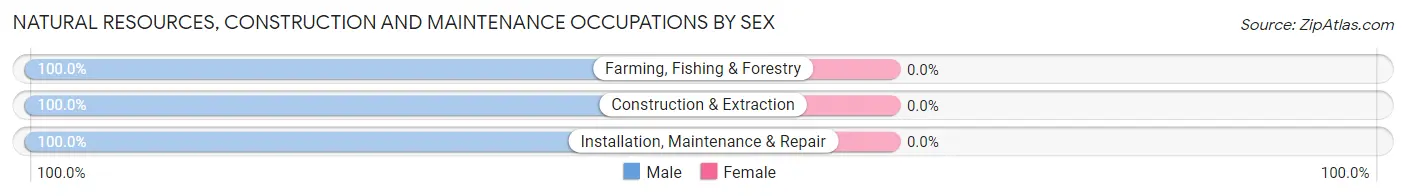
| Occupation | Male | Female |
| Farming, Fishing & Forestry | 13 (100.0%) | 0 (0.0%) |
| Construction & Extraction | 17 (100.0%) | 0 (0.0%) |
| Installation, Maintenance & Repair | 9 (100.0%) | 0 (0.0%) |
| Total (Category) | 39 (100.0%) | 0 (0.0%) |
| Total (Overall) | 356 (57.6%) | 262 (42.4%) |
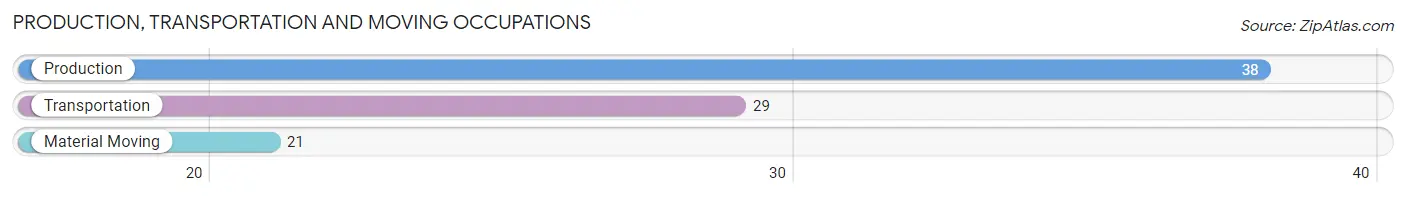
Production, Transportation and Moving Occupations
The most common Production, Transportation and Moving occupations in Elkader are Production (38 | 6.1%), Transportation (29 | 4.7%), and Material Moving (21 | 3.4%).
Production, Transportation and Moving Occupations by Sex
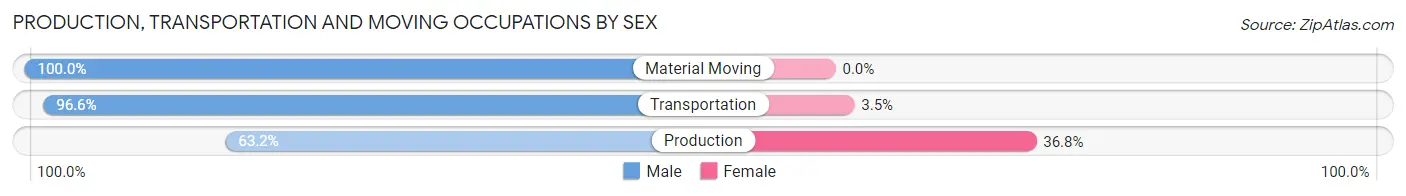
| Occupation | Male | Female |
| Production | 24 (63.2%) | 14 (36.8%) |
| Transportation | 28 (96.6%) | 1 (3.5%) |
| Material Moving | 21 (100.0%) | 0 (0.0%) |
| Total (Category) | 73 (83.0%) | 15 (17.1%) |
| Total (Overall) | 356 (57.6%) | 262 (42.4%) |
Employment Industries by Sex in Elkader
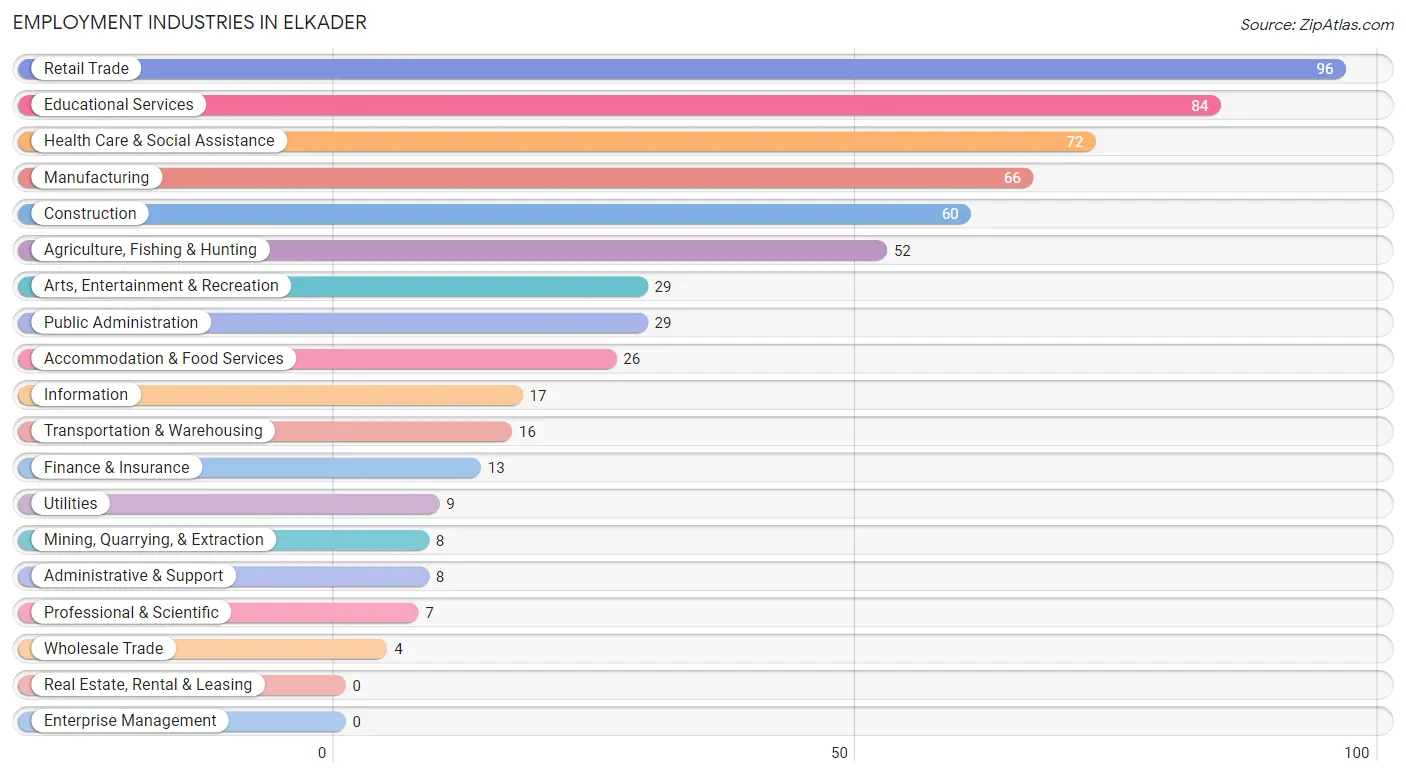
Employment Industries in Elkader
The major employment industries in Elkader include Retail Trade (96 | 15.5%), Educational Services (84 | 13.6%), Health Care & Social Assistance (72 | 11.7%), Manufacturing (66 | 10.7%), and Construction (60 | 9.7%).
Employment Industries by Sex in Elkader
The Elkader industries that see more men than women are Agriculture, Fishing & Hunting (100.0%), Wholesale Trade (100.0%), and Utilities (100.0%), whereas the industries that tend to have a higher number of women are Mining, Quarrying, & Extraction (100.0%), Professional & Scientific (100.0%), and Educational Services (85.7%).
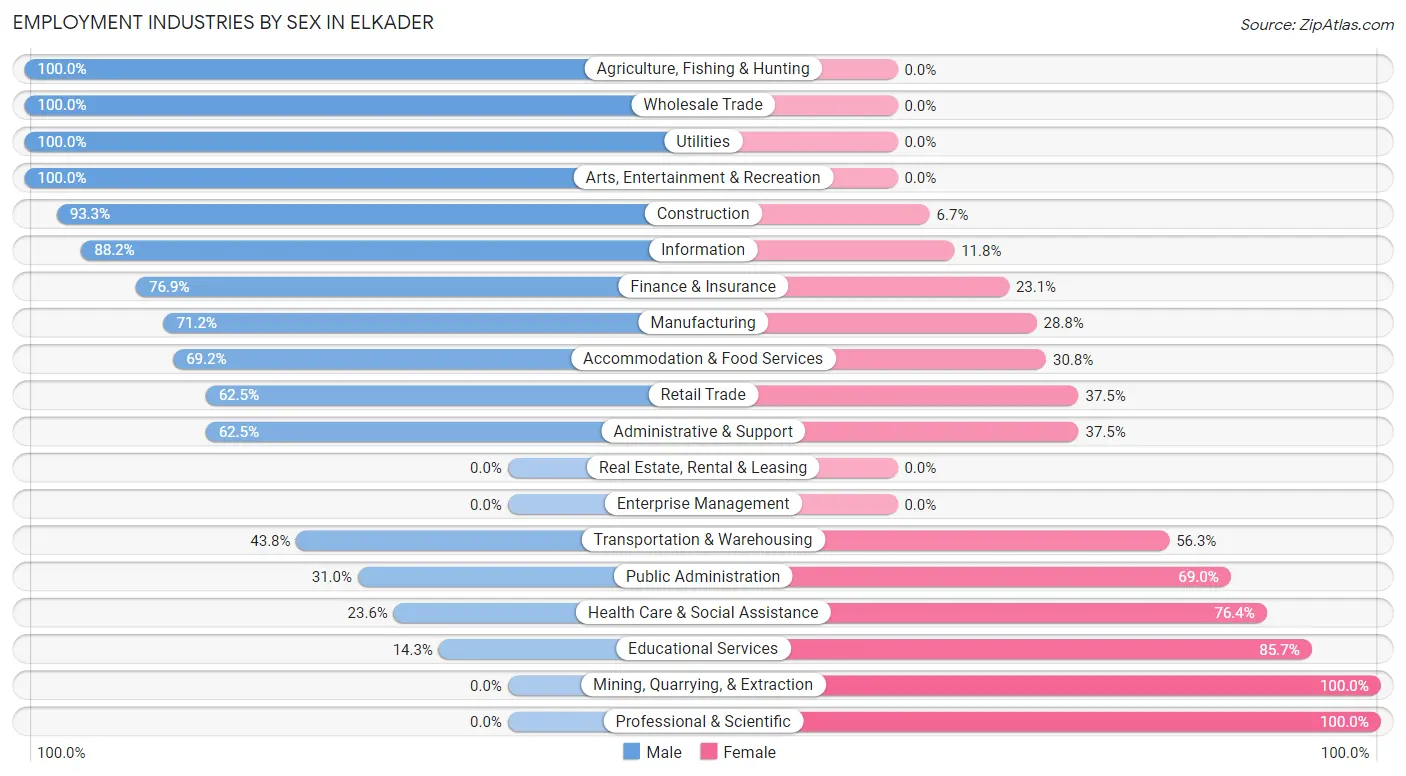
| Industry | Male | Female |
| Agriculture, Fishing & Hunting | 52 (100.0%) | 0 (0.0%) |
| Mining, Quarrying, & Extraction | 0 (0.0%) | 8 (100.0%) |
| Construction | 56 (93.3%) | 4 (6.7%) |
| Manufacturing | 47 (71.2%) | 19 (28.8%) |
| Wholesale Trade | 4 (100.0%) | 0 (0.0%) |
| Retail Trade | 60 (62.5%) | 36 (37.5%) |
| Transportation & Warehousing | 7 (43.8%) | 9 (56.2%) |
| Utilities | 9 (100.0%) | 0 (0.0%) |
| Information | 15 (88.2%) | 2 (11.8%) |
| Finance & Insurance | 10 (76.9%) | 3 (23.1%) |
| Real Estate, Rental & Leasing | 0 (0.0%) | 0 (0.0%) |
| Professional & Scientific | 0 (0.0%) | 7 (100.0%) |
| Enterprise Management | 0 (0.0%) | 0 (0.0%) |
| Administrative & Support | 5 (62.5%) | 3 (37.5%) |
| Educational Services | 12 (14.3%) | 72 (85.7%) |
| Health Care & Social Assistance | 17 (23.6%) | 55 (76.4%) |
| Arts, Entertainment & Recreation | 29 (100.0%) | 0 (0.0%) |
| Accommodation & Food Services | 18 (69.2%) | 8 (30.8%) |
| Public Administration | 9 (31.0%) | 20 (69.0%) |
| Total | 356 (57.6%) | 262 (42.4%) |
Education in Elkader
School Enrollment in Elkader
The most common levels of schooling among the 355 students in Elkader are elementary school (107 | 30.1%), college / undergraduate (79 | 22.3%), and middle school (71 | 20.0%).
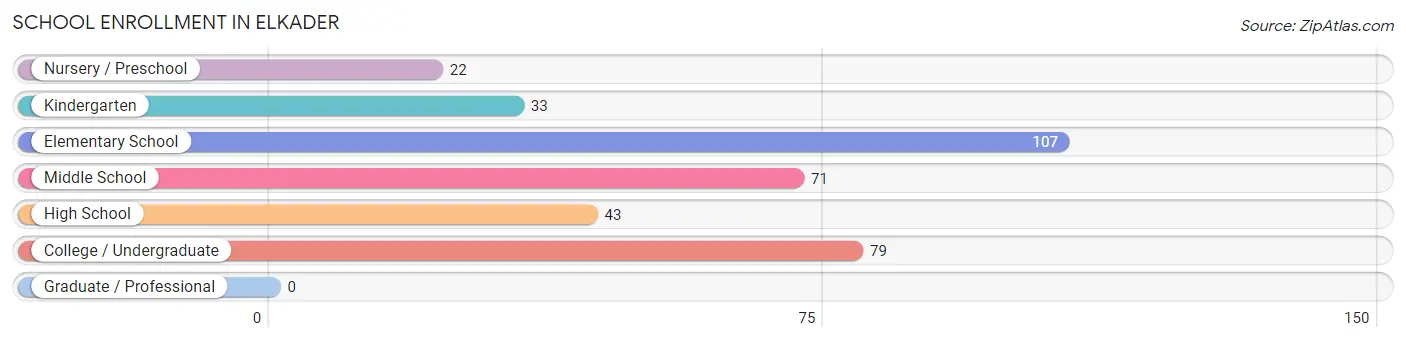
| School Level | # Students | % Students |
| Nursery / Preschool | 22 | 6.2% |
| Kindergarten | 33 | 9.3% |
| Elementary School | 107 | 30.1% |
| Middle School | 71 | 20.0% |
| High School | 43 | 12.1% |
| College / Undergraduate | 79 | 22.3% |
| Graduate / Professional | 0 | 0.0% |
| Total | 355 | 100.0% |
School Enrollment by Age by Funding Source in Elkader
Out of a total of 355 students who are enrolled in schools in Elkader, 37 (10.4%) attend a private institution, while the remaining 318 (89.6%) are enrolled in public schools. The age group of 3 to 4 year olds has the highest likelihood of being enrolled in private schools, with 12 (80.0% in the age bracket) enrolled. Conversely, the age group of 10 to 14 year olds has the lowest likelihood of being enrolled in a private school, with 106 (100.0% in the age bracket) attending a public institution.
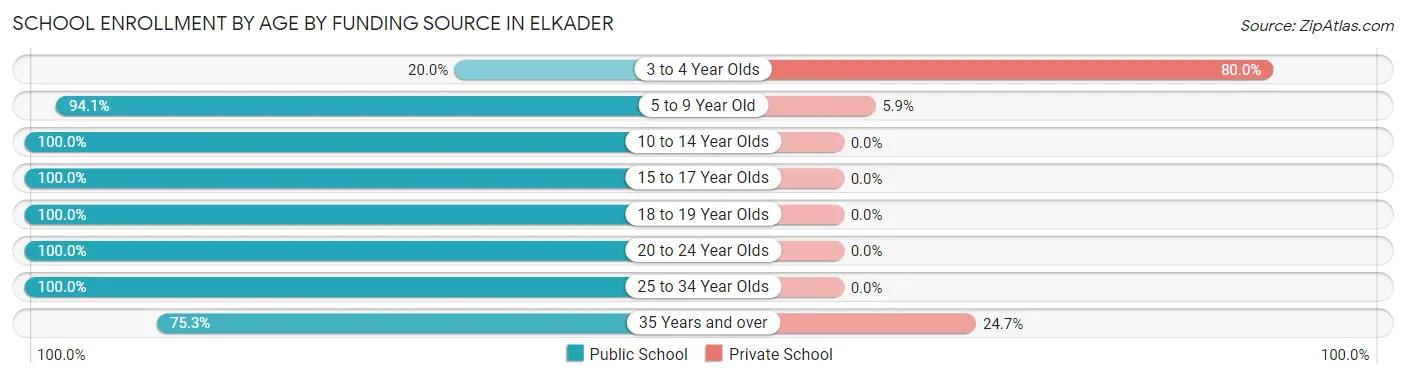
| Age Bracket | Public School | Private School |
| 3 to 4 Year Olds | 3 (20.0%) | 12 (80.0%) |
| 5 to 9 Year Old | 112 (94.1%) | 7 (5.9%) |
| 10 to 14 Year Olds | 106 (100.0%) | 0 (0.0%) |
| 15 to 17 Year Olds | 32 (100.0%) | 0 (0.0%) |
| 18 to 19 Year Olds | 4 (100.0%) | 0 (0.0%) |
| 20 to 24 Year Olds | 5 (100.0%) | 0 (0.0%) |
| 25 to 34 Year Olds | 1 (100.0%) | 0 (0.0%) |
| 35 Years and over | 55 (75.3%) | 18 (24.7%) |
| Total | 318 (89.6%) | 37 (10.4%) |
Educational Attainment by Field of Study in Elkader
Education (99 | 32.8%), arts & humanities (65 | 21.5%), business (40 | 13.3%), bio, nature & agricultural (31 | 10.3%), and science & technology (16 | 5.3%) are the most common fields of study among 302 individuals in Elkader who have obtained a bachelor's degree or higher.
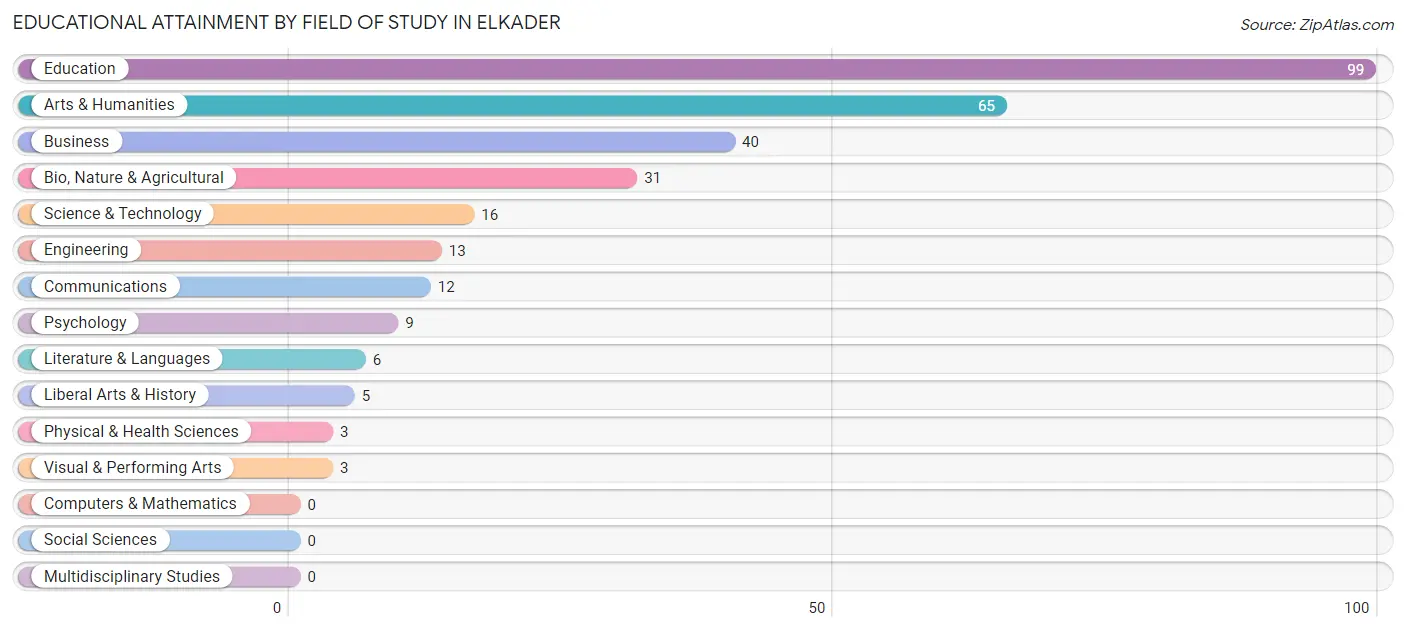
| Field of Study | # Graduates | % Graduates |
| Computers & Mathematics | 0 | 0.0% |
| Bio, Nature & Agricultural | 31 | 10.3% |
| Physical & Health Sciences | 3 | 1.0% |
| Psychology | 9 | 3.0% |
| Social Sciences | 0 | 0.0% |
| Engineering | 13 | 4.3% |
| Multidisciplinary Studies | 0 | 0.0% |
| Science & Technology | 16 | 5.3% |
| Business | 40 | 13.3% |
| Education | 99 | 32.8% |
| Literature & Languages | 6 | 2.0% |
| Liberal Arts & History | 5 | 1.7% |
| Visual & Performing Arts | 3 | 1.0% |
| Communications | 12 | 4.0% |
| Arts & Humanities | 65 | 21.5% |
| Total | 302 | 100.0% |
Transportation & Commute in Elkader
Vehicle Availability by Sex in Elkader
The most prevalent vehicle ownership categories in Elkader are males with 2 vehicles (161, accounting for 45.2%) and females with 2 vehicles (141, making up 61.5%).
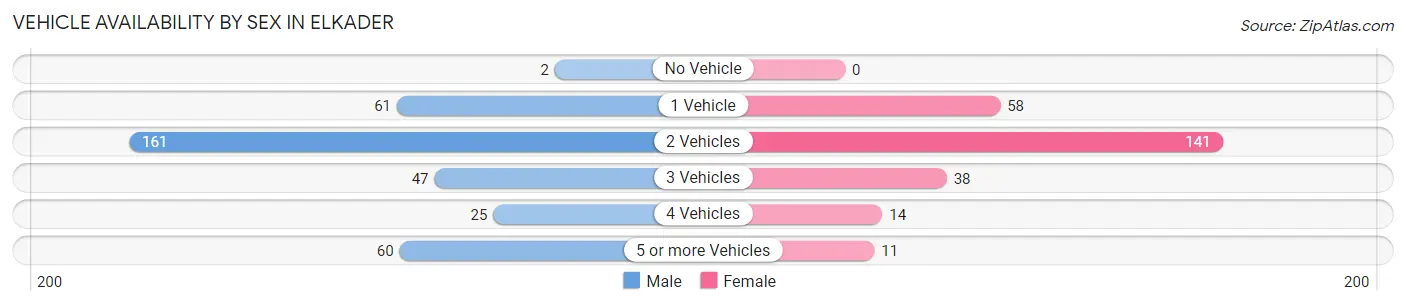
| Vehicles Available | Male | Female |
| No Vehicle | 2 (0.6%) | 0 (0.0%) |
| 1 Vehicle | 61 (17.1%) | 58 (22.1%) |
| 2 Vehicles | 161 (45.2%) | 141 (53.8%) |
| 3 Vehicles | 47 (13.2%) | 38 (14.5%) |
| 4 Vehicles | 25 (7.0%) | 14 (5.3%) |
| 5 or more Vehicles | 60 (16.9%) | 11 (4.2%) |
| Total | 356 (100.0%) | 262 (100.0%) |
Commute Time in Elkader
The most frequently occuring commute durations in Elkader are 5 to 9 minutes (162 commuters, 29.4%), less than 5 minutes (113 commuters, 20.5%), and 10 to 14 minutes (67 commuters, 12.2%).
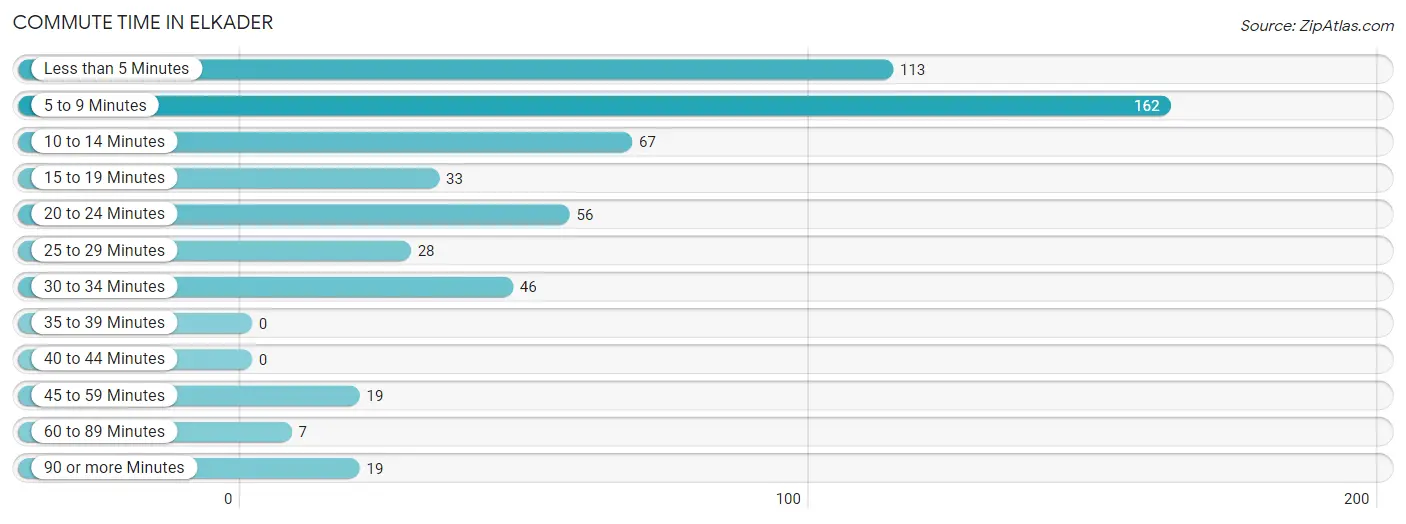
| Commute Time | # Commuters | % Commuters |
| Less than 5 Minutes | 113 | 20.5% |
| 5 to 9 Minutes | 162 | 29.4% |
| 10 to 14 Minutes | 67 | 12.2% |
| 15 to 19 Minutes | 33 | 6.0% |
| 20 to 24 Minutes | 56 | 10.2% |
| 25 to 29 Minutes | 28 | 5.1% |
| 30 to 34 Minutes | 46 | 8.4% |
| 35 to 39 Minutes | 0 | 0.0% |
| 40 to 44 Minutes | 0 | 0.0% |
| 45 to 59 Minutes | 19 | 3.5% |
| 60 to 89 Minutes | 7 | 1.3% |
| 90 or more Minutes | 19 | 3.5% |
Commute Time by Sex in Elkader
The most common commute times in Elkader are 5 to 9 minutes (90 commuters, 26.3%) for males and 5 to 9 minutes (72 commuters, 34.6%) for females.
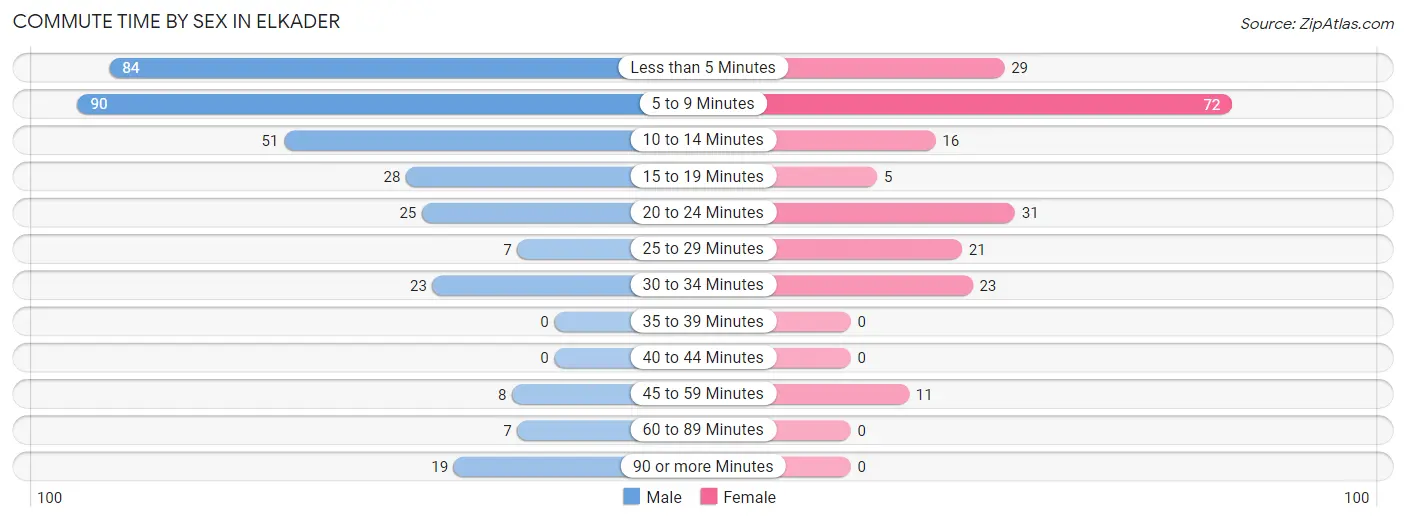
| Commute Time | Male | Female |
| Less than 5 Minutes | 84 (24.6%) | 29 (13.9%) |
| 5 to 9 Minutes | 90 (26.3%) | 72 (34.6%) |
| 10 to 14 Minutes | 51 (14.9%) | 16 (7.7%) |
| 15 to 19 Minutes | 28 (8.2%) | 5 (2.4%) |
| 20 to 24 Minutes | 25 (7.3%) | 31 (14.9%) |
| 25 to 29 Minutes | 7 (2.1%) | 21 (10.1%) |
| 30 to 34 Minutes | 23 (6.7%) | 23 (11.1%) |
| 35 to 39 Minutes | 0 (0.0%) | 0 (0.0%) |
| 40 to 44 Minutes | 0 (0.0%) | 0 (0.0%) |
| 45 to 59 Minutes | 8 (2.3%) | 11 (5.3%) |
| 60 to 89 Minutes | 7 (2.1%) | 0 (0.0%) |
| 90 or more Minutes | 19 (5.6%) | 0 (0.0%) |
Time of Departure to Work by Sex in Elkader
The most frequent times of departure to work in Elkader are 6:30 AM to 6:59 AM (72, 21.0%) for males and 7:30 AM to 7:59 AM (39, 18.8%) for females.
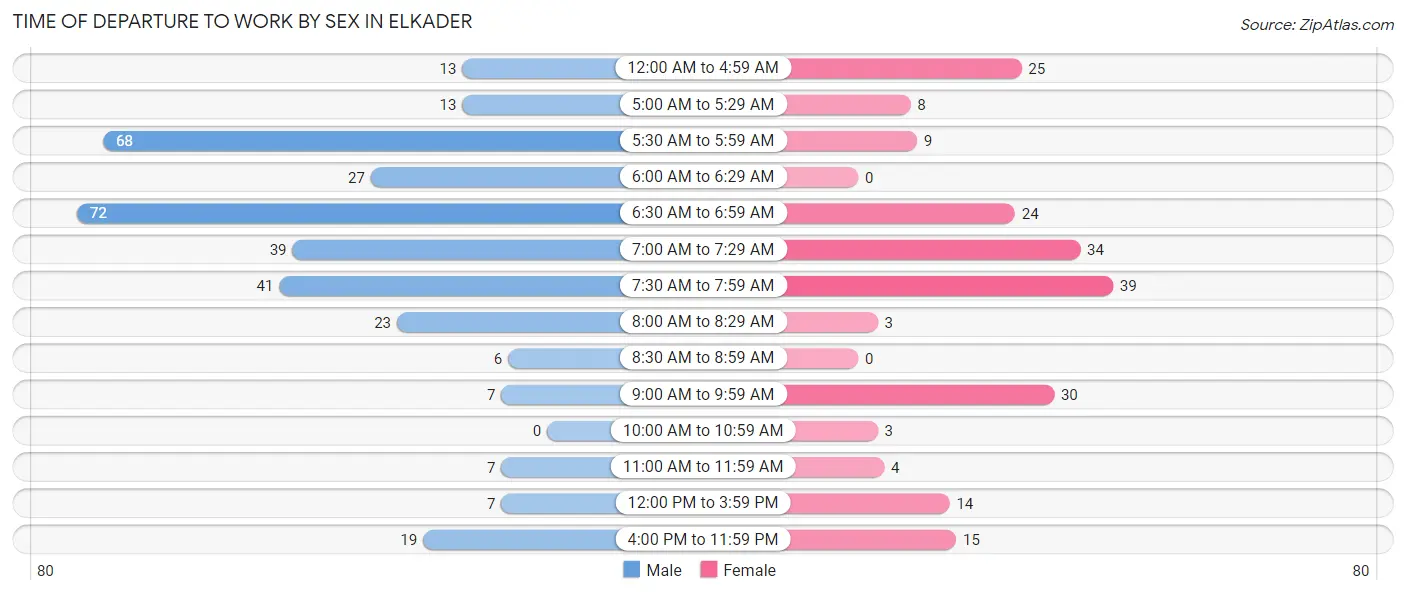
| Time of Departure | Male | Female |
| 12:00 AM to 4:59 AM | 13 (3.8%) | 25 (12.0%) |
| 5:00 AM to 5:29 AM | 13 (3.8%) | 8 (3.8%) |
| 5:30 AM to 5:59 AM | 68 (19.9%) | 9 (4.3%) |
| 6:00 AM to 6:29 AM | 27 (7.9%) | 0 (0.0%) |
| 6:30 AM to 6:59 AM | 72 (21.0%) | 24 (11.5%) |
| 7:00 AM to 7:29 AM | 39 (11.4%) | 34 (16.4%) |
| 7:30 AM to 7:59 AM | 41 (12.0%) | 39 (18.8%) |
| 8:00 AM to 8:29 AM | 23 (6.7%) | 3 (1.4%) |
| 8:30 AM to 8:59 AM | 6 (1.8%) | 0 (0.0%) |
| 9:00 AM to 9:59 AM | 7 (2.1%) | 30 (14.4%) |
| 10:00 AM to 10:59 AM | 0 (0.0%) | 3 (1.4%) |
| 11:00 AM to 11:59 AM | 7 (2.1%) | 4 (1.9%) |
| 12:00 PM to 3:59 PM | 7 (2.1%) | 14 (6.7%) |
| 4:00 PM to 11:59 PM | 19 (5.6%) | 15 (7.2%) |
| Total | 342 (100.0%) | 208 (100.0%) |
Housing Occupancy in Elkader
Occupancy by Ownership in Elkader
Of the total 597 dwellings in Elkader, owner-occupied units account for 407 (68.2%), while renter-occupied units make up 190 (31.8%).
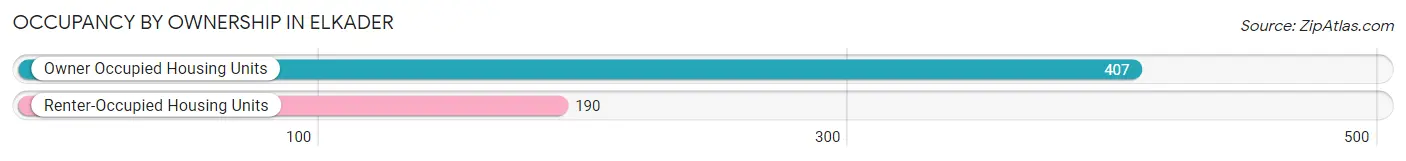
| Occupancy | # Housing Units | % Housing Units |
| Owner Occupied Housing Units | 407 | 68.2% |
| Renter-Occupied Housing Units | 190 | 31.8% |
| Total Occupied Housing Units | 597 | 100.0% |
Occupancy by Household Size in Elkader
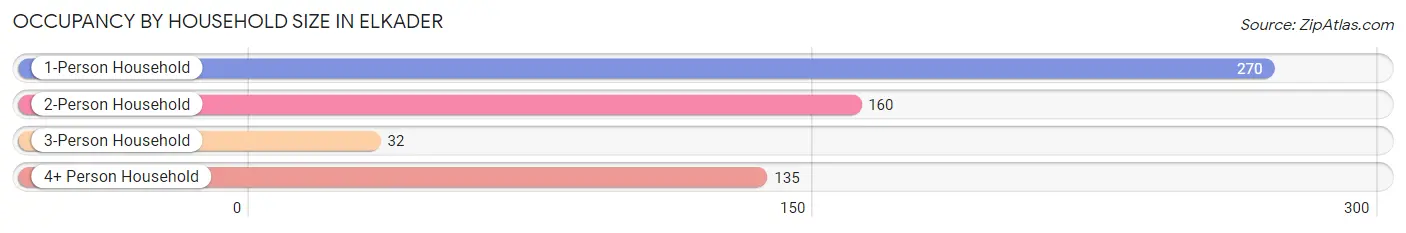
| Household Size | # Housing Units | % Housing Units |
| 1-Person Household | 270 | 45.2% |
| 2-Person Household | 160 | 26.8% |
| 3-Person Household | 32 | 5.4% |
| 4+ Person Household | 135 | 22.6% |
| Total Housing Units | 597 | 100.0% |
Occupancy by Ownership by Household Size in Elkader
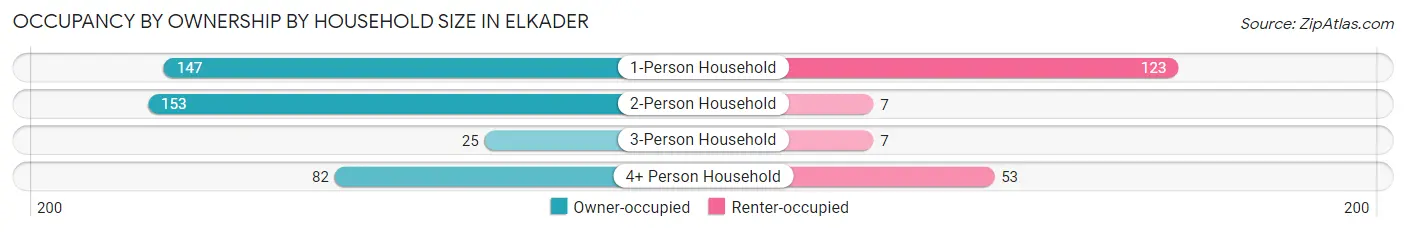
| Household Size | Owner-occupied | Renter-occupied |
| 1-Person Household | 147 (54.4%) | 123 (45.6%) |
| 2-Person Household | 153 (95.6%) | 7 (4.4%) |
| 3-Person Household | 25 (78.1%) | 7 (21.9%) |
| 4+ Person Household | 82 (60.7%) | 53 (39.3%) |
| Total Housing Units | 407 (68.2%) | 190 (31.8%) |
Occupancy by Educational Attainment in Elkader
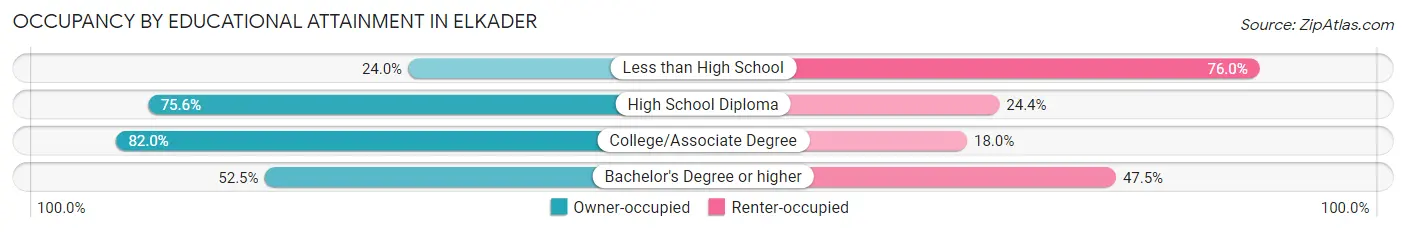
| Household Size | Owner-occupied | Renter-occupied |
| Less than High School | 6 (24.0%) | 19 (76.0%) |
| High School Diploma | 164 (75.6%) | 53 (24.4%) |
| College/Associate Degree | 141 (82.0%) | 31 (18.0%) |
| Bachelor's Degree or higher | 96 (52.5%) | 87 (47.5%) |
Occupancy by Age of Householder in Elkader
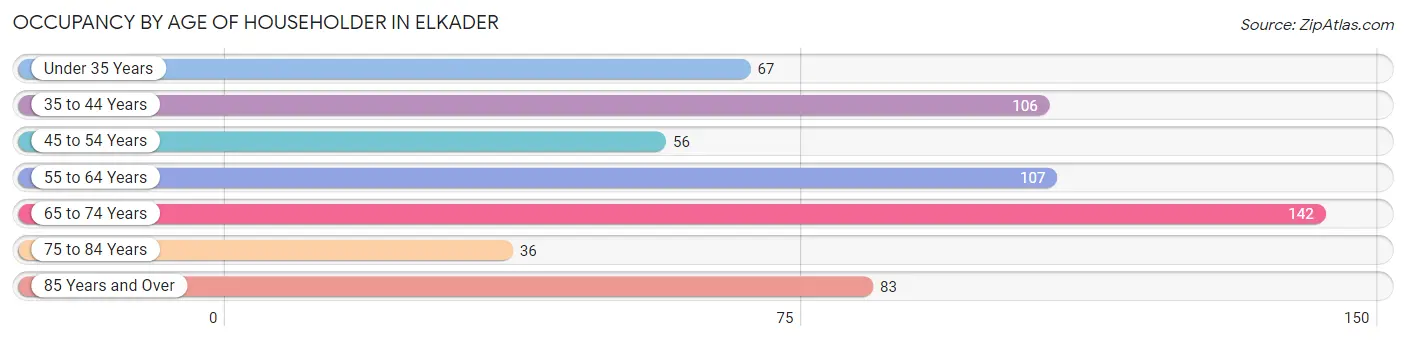
| Age Bracket | # Households | % Households |
| Under 35 Years | 67 | 11.2% |
| 35 to 44 Years | 106 | 17.8% |
| 45 to 54 Years | 56 | 9.4% |
| 55 to 64 Years | 107 | 17.9% |
| 65 to 74 Years | 142 | 23.8% |
| 75 to 84 Years | 36 | 6.0% |
| 85 Years and Over | 83 | 13.9% |
| Total | 597 | 100.0% |
Housing Finances in Elkader
Median Income by Occupancy in Elkader
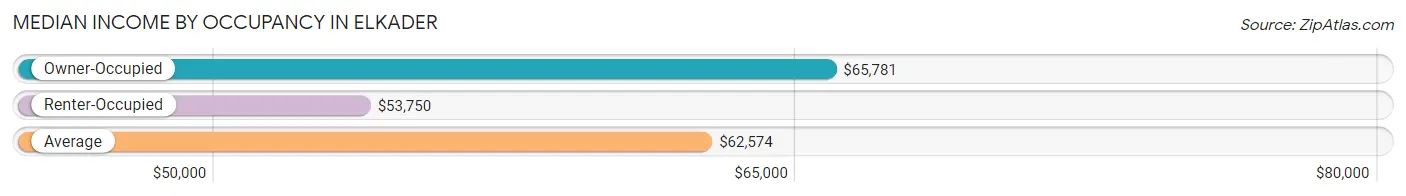
| Occupancy Type | # Households | Median Income |
| Owner-Occupied | 407 (68.2%) | $65,781 |
| Renter-Occupied | 190 (31.8%) | $53,750 |
| Average | 597 (100.0%) | $62,574 |
Occupancy by Householder Income Bracket in Elkader
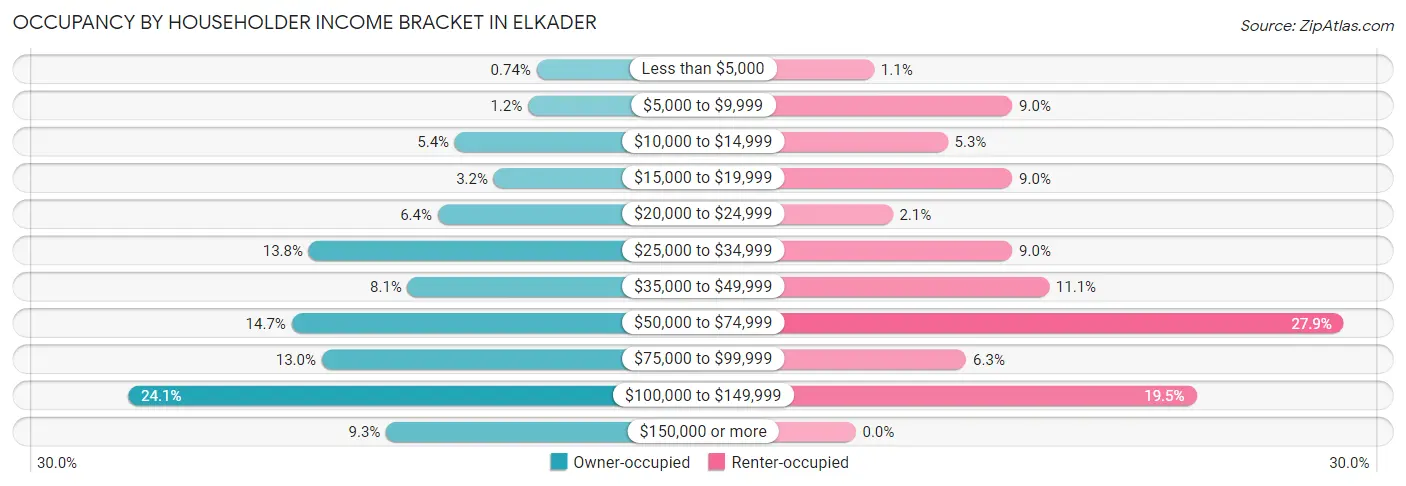
| Income Bracket | Owner-occupied | Renter-occupied |
| Less than $5,000 | 3 (0.7%) | 2 (1.1%) |
| $5,000 to $9,999 | 5 (1.2%) | 17 (8.9%) |
| $10,000 to $14,999 | 22 (5.4%) | 10 (5.3%) |
| $15,000 to $19,999 | 13 (3.2%) | 17 (8.9%) |
| $20,000 to $24,999 | 26 (6.4%) | 4 (2.1%) |
| $25,000 to $34,999 | 56 (13.8%) | 17 (8.9%) |
| $35,000 to $49,999 | 33 (8.1%) | 21 (11.1%) |
| $50,000 to $74,999 | 60 (14.7%) | 53 (27.9%) |
| $75,000 to $99,999 | 53 (13.0%) | 12 (6.3%) |
| $100,000 to $149,999 | 98 (24.1%) | 37 (19.5%) |
| $150,000 or more | 38 (9.3%) | 0 (0.0%) |
| Total | 407 (100.0%) | 190 (100.0%) |
Monthly Housing Cost Tiers in Elkader
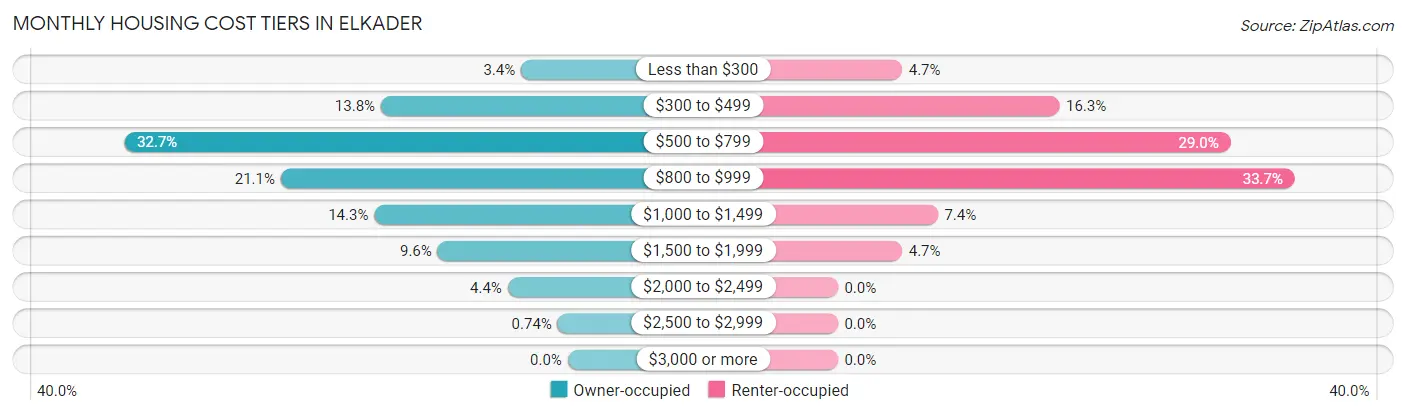
| Monthly Cost | Owner-occupied | Renter-occupied |
| Less than $300 | 14 (3.4%) | 9 (4.7%) |
| $300 to $499 | 56 (13.8%) | 31 (16.3%) |
| $500 to $799 | 133 (32.7%) | 55 (28.9%) |
| $800 to $999 | 86 (21.1%) | 64 (33.7%) |
| $1,000 to $1,499 | 58 (14.2%) | 14 (7.4%) |
| $1,500 to $1,999 | 39 (9.6%) | 9 (4.7%) |
| $2,000 to $2,499 | 18 (4.4%) | 0 (0.0%) |
| $2,500 to $2,999 | 3 (0.7%) | 0 (0.0%) |
| $3,000 or more | 0 (0.0%) | 0 (0.0%) |
| Total | 407 (100.0%) | 190 (100.0%) |
Physical Housing Characteristics in Elkader
Housing Structures in Elkader
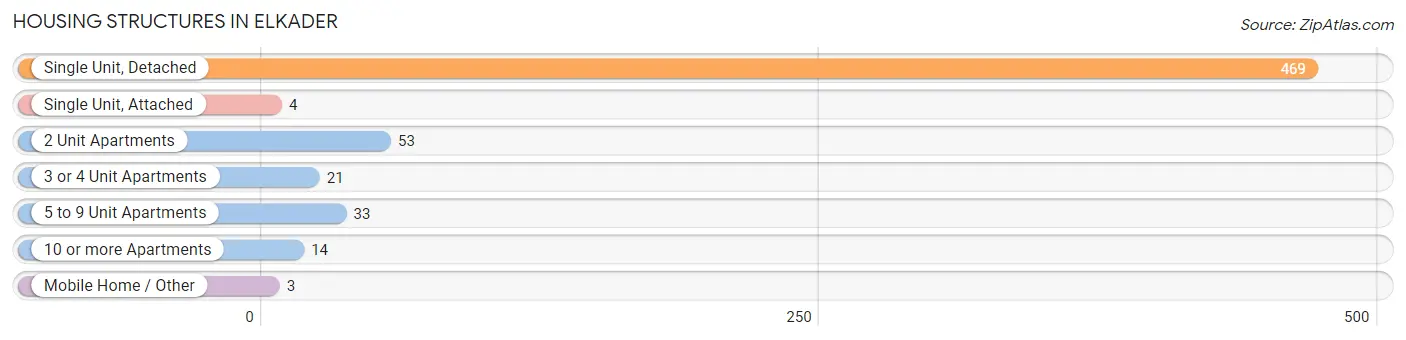
| Structure Type | # Housing Units | % Housing Units |
| Single Unit, Detached | 469 | 78.6% |
| Single Unit, Attached | 4 | 0.7% |
| 2 Unit Apartments | 53 | 8.9% |
| 3 or 4 Unit Apartments | 21 | 3.5% |
| 5 to 9 Unit Apartments | 33 | 5.5% |
| 10 or more Apartments | 14 | 2.4% |
| Mobile Home / Other | 3 | 0.5% |
| Total | 597 | 100.0% |
Housing Structures by Occupancy in Elkader
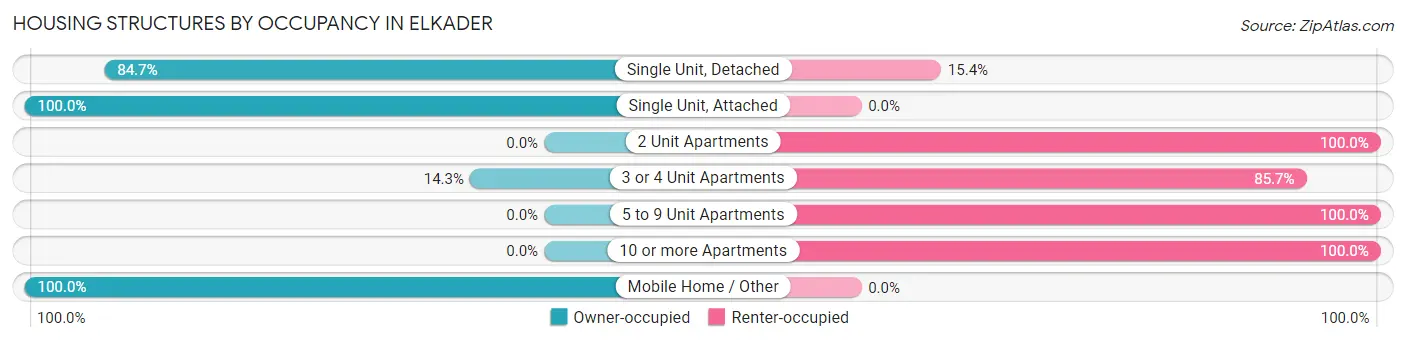
| Structure Type | Owner-occupied | Renter-occupied |
| Single Unit, Detached | 397 (84.7%) | 72 (15.3%) |
| Single Unit, Attached | 4 (100.0%) | 0 (0.0%) |
| 2 Unit Apartments | 0 (0.0%) | 53 (100.0%) |
| 3 or 4 Unit Apartments | 3 (14.3%) | 18 (85.7%) |
| 5 to 9 Unit Apartments | 0 (0.0%) | 33 (100.0%) |
| 10 or more Apartments | 0 (0.0%) | 14 (100.0%) |
| Mobile Home / Other | 3 (100.0%) | 0 (0.0%) |
| Total | 407 (68.2%) | 190 (31.8%) |
Housing Structures by Number of Rooms in Elkader
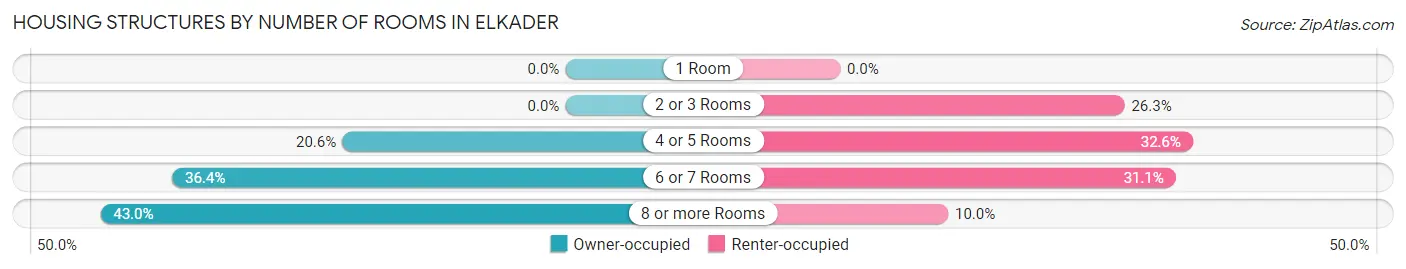
| Number of Rooms | Owner-occupied | Renter-occupied |
| 1 Room | 0 (0.0%) | 0 (0.0%) |
| 2 or 3 Rooms | 0 (0.0%) | 50 (26.3%) |
| 4 or 5 Rooms | 84 (20.6%) | 62 (32.6%) |
| 6 or 7 Rooms | 148 (36.4%) | 59 (31.0%) |
| 8 or more Rooms | 175 (43.0%) | 19 (10.0%) |
| Total | 407 (100.0%) | 190 (100.0%) |
Housing Structure by Heating Type in Elkader
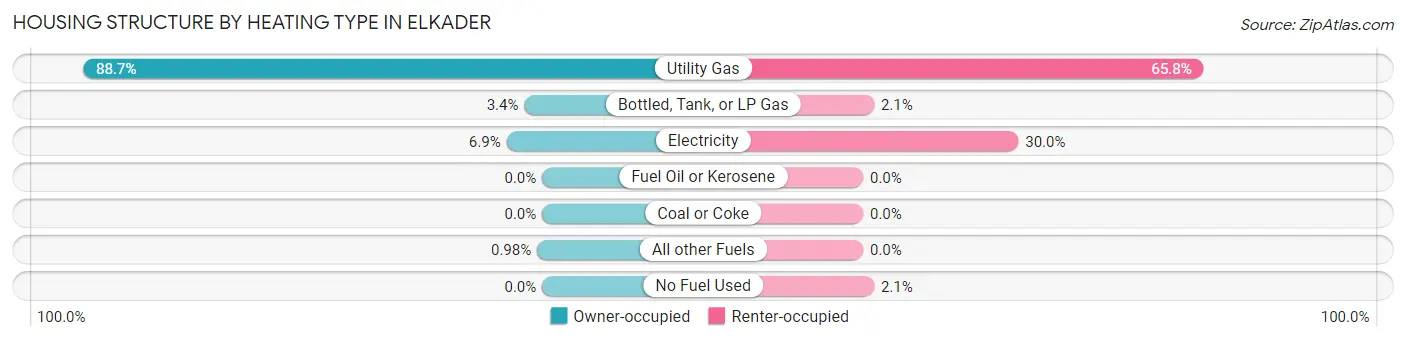
| Heating Type | Owner-occupied | Renter-occupied |
| Utility Gas | 361 (88.7%) | 125 (65.8%) |
| Bottled, Tank, or LP Gas | 14 (3.4%) | 4 (2.1%) |
| Electricity | 28 (6.9%) | 57 (30.0%) |
| Fuel Oil or Kerosene | 0 (0.0%) | 0 (0.0%) |
| Coal or Coke | 0 (0.0%) | 0 (0.0%) |
| All other Fuels | 4 (1.0%) | 0 (0.0%) |
| No Fuel Used | 0 (0.0%) | 4 (2.1%) |
| Total | 407 (100.0%) | 190 (100.0%) |
Household Vehicle Usage in Elkader
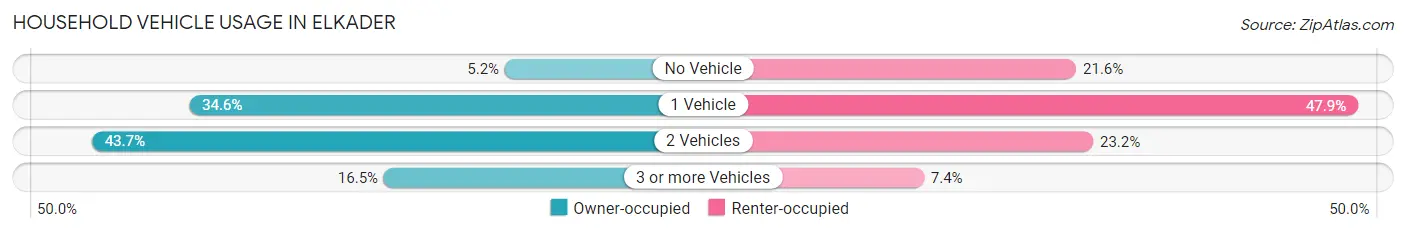
| Vehicles per Household | Owner-occupied | Renter-occupied |
| No Vehicle | 21 (5.2%) | 41 (21.6%) |
| 1 Vehicle | 141 (34.6%) | 91 (47.9%) |
| 2 Vehicles | 178 (43.7%) | 44 (23.2%) |
| 3 or more Vehicles | 67 (16.5%) | 14 (7.4%) |
| Total | 407 (100.0%) | 190 (100.0%) |
Real Estate & Mortgages in Elkader
Real Estate and Mortgage Overview in Elkader
| Characteristic | Without Mortgage | With Mortgage |
| Housing Units | 220 | 187 |
| Median Property Value | $134,800 | $122,900 |
| Median Household Income | $36,111 | $26 |
| Monthly Housing Costs | $566 | $0 |
| Real Estate Taxes | $2,109 | $0 |
Property Value by Mortgage Status in Elkader
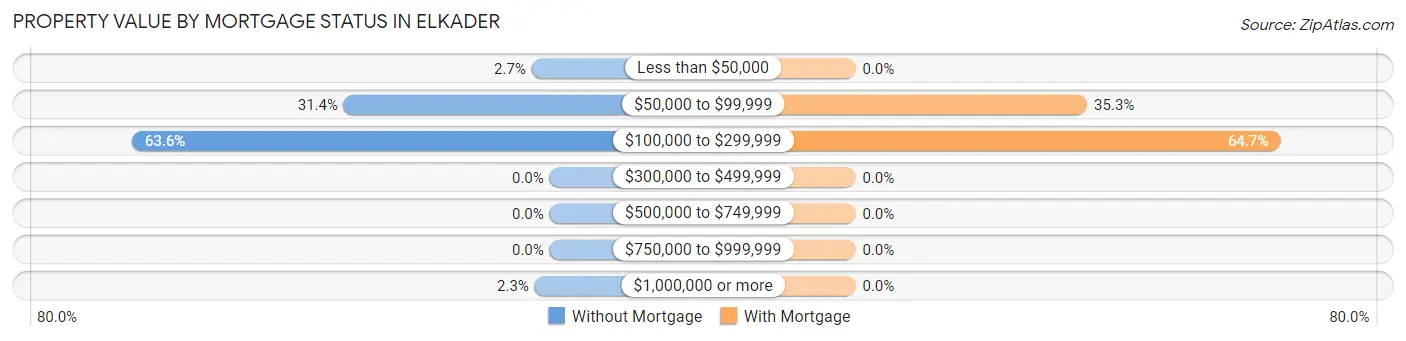
| Property Value | Without Mortgage | With Mortgage |
| Less than $50,000 | 6 (2.7%) | 0 (0.0%) |
| $50,000 to $99,999 | 69 (31.4%) | 66 (35.3%) |
| $100,000 to $299,999 | 140 (63.6%) | 121 (64.7%) |
| $300,000 to $499,999 | 0 (0.0%) | 0 (0.0%) |
| $500,000 to $749,999 | 0 (0.0%) | 0 (0.0%) |
| $750,000 to $999,999 | 0 (0.0%) | 0 (0.0%) |
| $1,000,000 or more | 5 (2.3%) | 0 (0.0%) |
| Total | 220 (100.0%) | 187 (100.0%) |
Household Income by Mortgage Status in Elkader
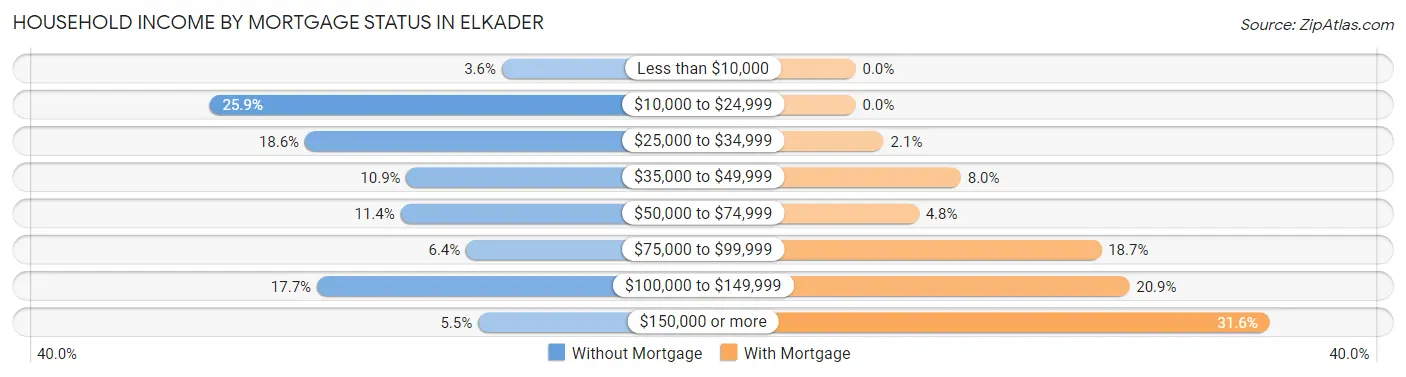
| Household Income | Without Mortgage | With Mortgage |
| Less than $10,000 | 8 (3.6%) | 0 (0.0%) |
| $10,000 to $24,999 | 57 (25.9%) | 0 (0.0%) |
| $25,000 to $34,999 | 41 (18.6%) | 4 (2.1%) |
| $35,000 to $49,999 | 24 (10.9%) | 15 (8.0%) |
| $50,000 to $74,999 | 25 (11.4%) | 9 (4.8%) |
| $75,000 to $99,999 | 14 (6.4%) | 35 (18.7%) |
| $100,000 to $149,999 | 39 (17.7%) | 39 (20.9%) |
| $150,000 or more | 12 (5.4%) | 59 (31.6%) |
| Total | 220 (100.0%) | 187 (100.0%) |
Property Value to Household Income Ratio in Elkader
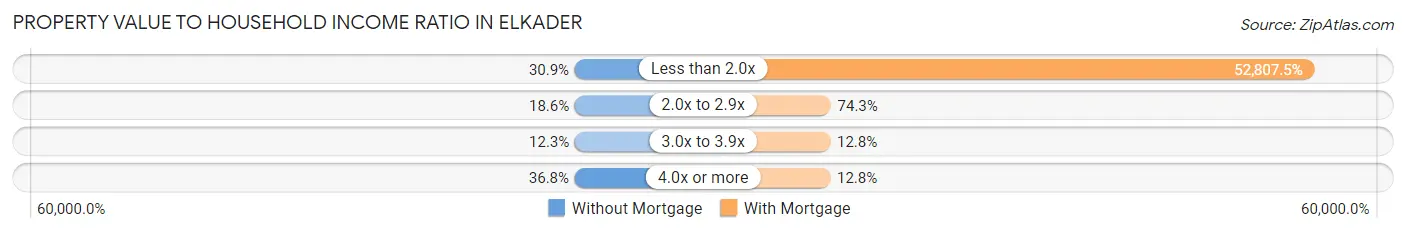
| Value-to-Income Ratio | Without Mortgage | With Mortgage |
| Less than 2.0x | 68 (30.9%) | 98,750 (52,807.5%) |
| 2.0x to 2.9x | 41 (18.6%) | 139 (74.3%) |
| 3.0x to 3.9x | 27 (12.3%) | 24 (12.8%) |
| 4.0x or more | 81 (36.8%) | 24 (12.8%) |
| Total | 220 (100.0%) | 187 (100.0%) |
Real Estate Taxes by Mortgage Status in Elkader
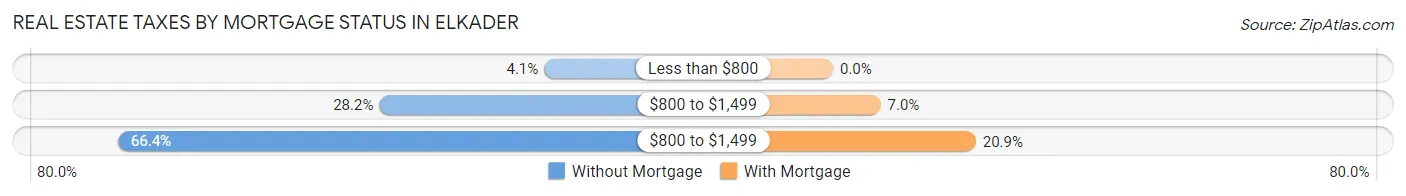
| Property Taxes | Without Mortgage | With Mortgage |
| Less than $800 | 9 (4.1%) | 0 (0.0%) |
| $800 to $1,499 | 62 (28.2%) | 13 (7.0%) |
| $800 to $1,499 | 146 (66.4%) | 39 (20.9%) |
| Total | 220 (100.0%) | 187 (100.0%) |
Health & Disability in Elkader
Health Insurance Coverage by Age in Elkader
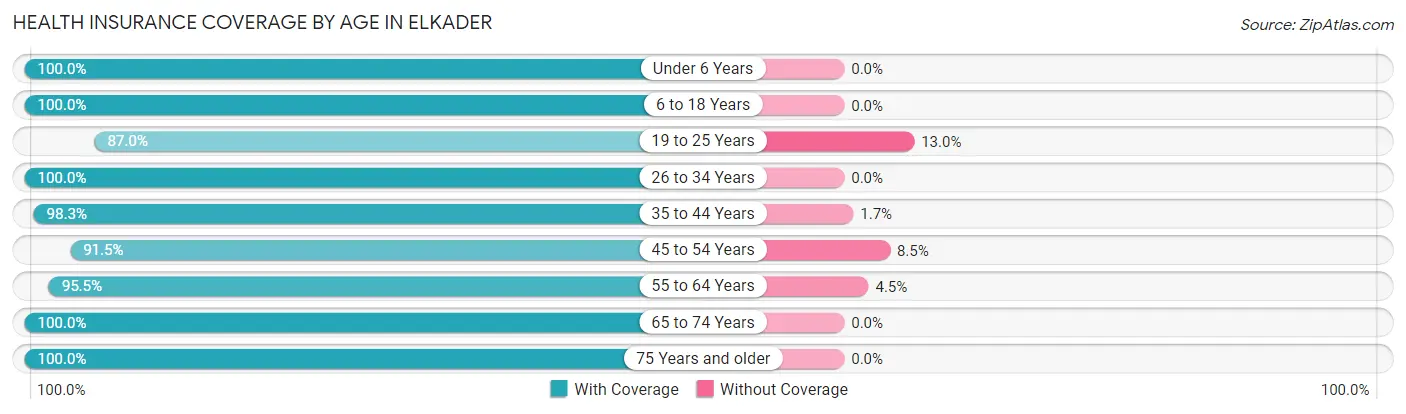
| Age Bracket | With Coverage | Without Coverage |
| Under 6 Years | 105 (100.0%) | 0 (0.0%) |
| 6 to 18 Years | 234 (100.0%) | 0 (0.0%) |
| 19 to 25 Years | 40 (87.0%) | 6 (13.0%) |
| 26 to 34 Years | 140 (100.0%) | 0 (0.0%) |
| 35 to 44 Years | 175 (98.3%) | 3 (1.7%) |
| 45 to 54 Years | 86 (91.5%) | 8 (8.5%) |
| 55 to 64 Years | 169 (95.5%) | 8 (4.5%) |
| 65 to 74 Years | 187 (100.0%) | 0 (0.0%) |
| 75 Years and older | 140 (100.0%) | 0 (0.0%) |
| Total | 1,276 (98.1%) | 25 (1.9%) |
Health Insurance Coverage by Citizenship Status in Elkader
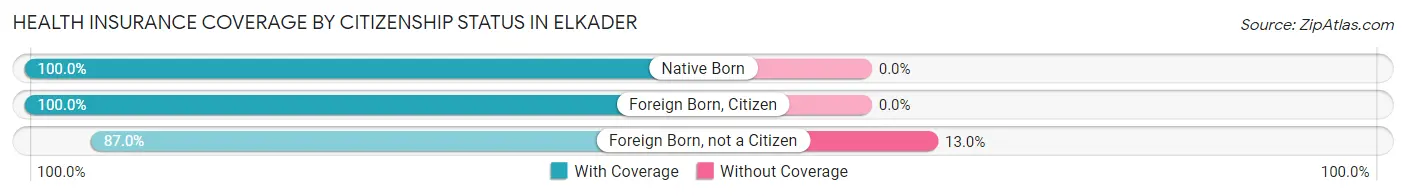
| Citizenship Status | With Coverage | Without Coverage |
| Native Born | 105 (100.0%) | 0 (0.0%) |
| Foreign Born, Citizen | 234 (100.0%) | 0 (0.0%) |
| Foreign Born, not a Citizen | 40 (87.0%) | 6 (13.0%) |
Health Insurance Coverage by Household Income in Elkader
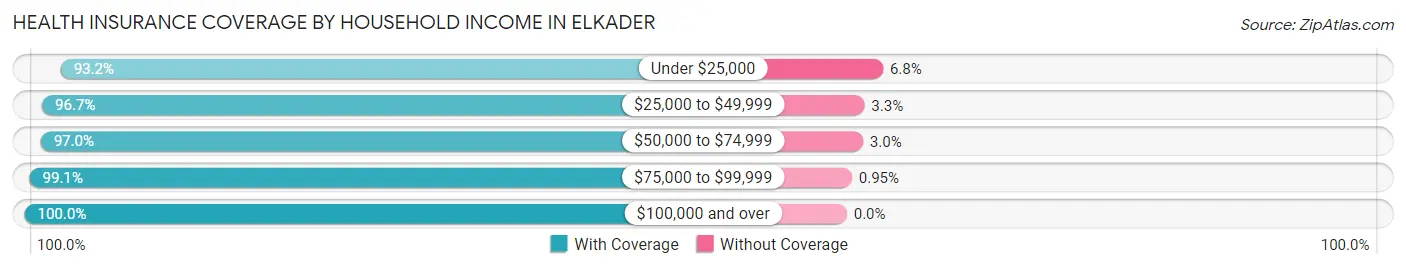
| Household Income | With Coverage | Without Coverage |
| Under $25,000 | 124 (93.2%) | 9 (6.8%) |
| $25,000 to $49,999 | 176 (96.7%) | 6 (3.3%) |
| $50,000 to $74,999 | 257 (97.0%) | 8 (3.0%) |
| $75,000 to $99,999 | 208 (99.1%) | 2 (0.9%) |
| $100,000 and over | 511 (100.0%) | 0 (0.0%) |
Public vs Private Health Insurance Coverage by Age in Elkader
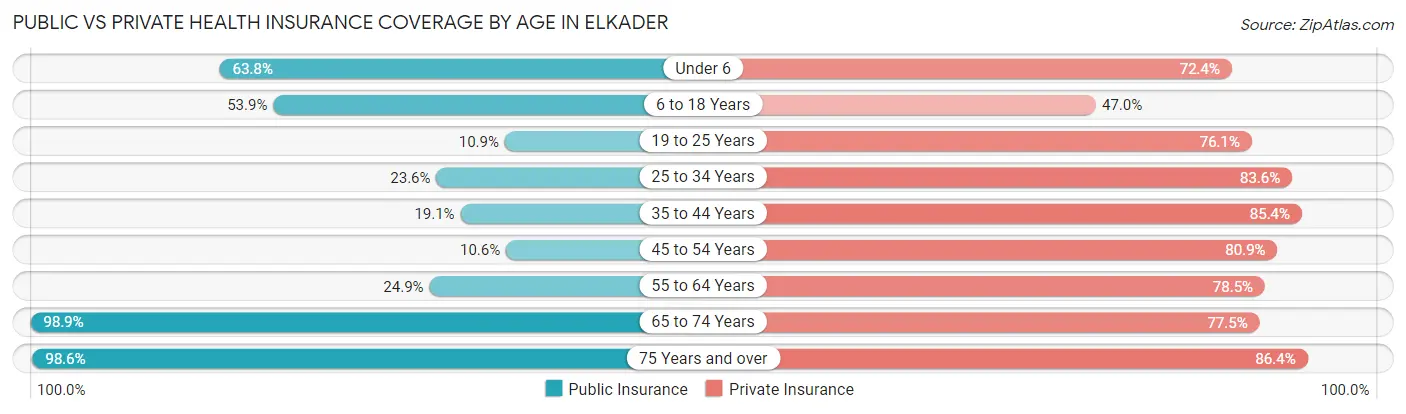
| Age Bracket | Public Insurance | Private Insurance |
| Under 6 | 67 (63.8%) | 76 (72.4%) |
| 6 to 18 Years | 126 (53.8%) | 110 (47.0%) |
| 19 to 25 Years | 5 (10.9%) | 35 (76.1%) |
| 25 to 34 Years | 33 (23.6%) | 117 (83.6%) |
| 35 to 44 Years | 34 (19.1%) | 152 (85.4%) |
| 45 to 54 Years | 10 (10.6%) | 76 (80.8%) |
| 55 to 64 Years | 44 (24.9%) | 139 (78.5%) |
| 65 to 74 Years | 185 (98.9%) | 145 (77.5%) |
| 75 Years and over | 138 (98.6%) | 121 (86.4%) |
| Total | 642 (49.3%) | 971 (74.6%) |
Disability Status by Sex by Age in Elkader
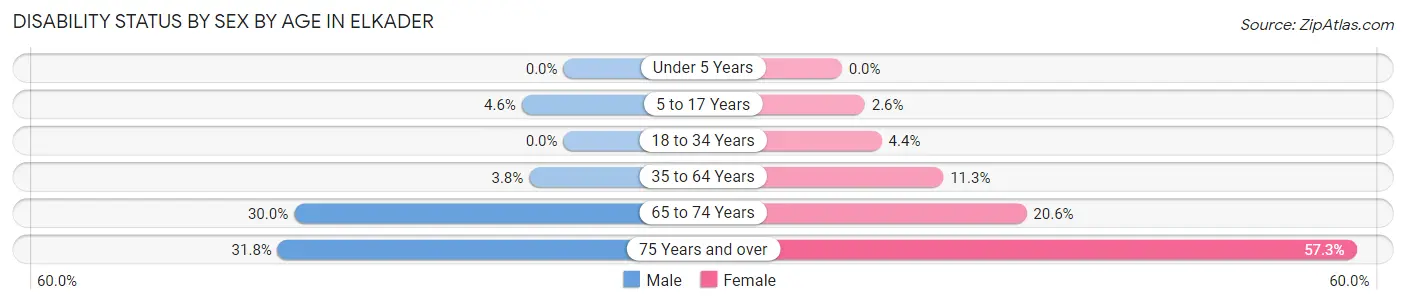
| Age Bracket | Male | Female |
| Under 5 Years | 0 (0.0%) | 0 (0.0%) |
| 5 to 17 Years | 7 (4.6%) | 3 (2.6%) |
| 18 to 34 Years | 0 (0.0%) | 4 (4.4%) |
| 35 to 64 Years | 8 (3.8%) | 27 (11.3%) |
| 65 to 74 Years | 24 (30.0%) | 22 (20.6%) |
| 75 Years and over | 14 (31.8%) | 55 (57.3%) |
Disability Class by Sex by Age in Elkader
Disability Class: Hearing Difficulty
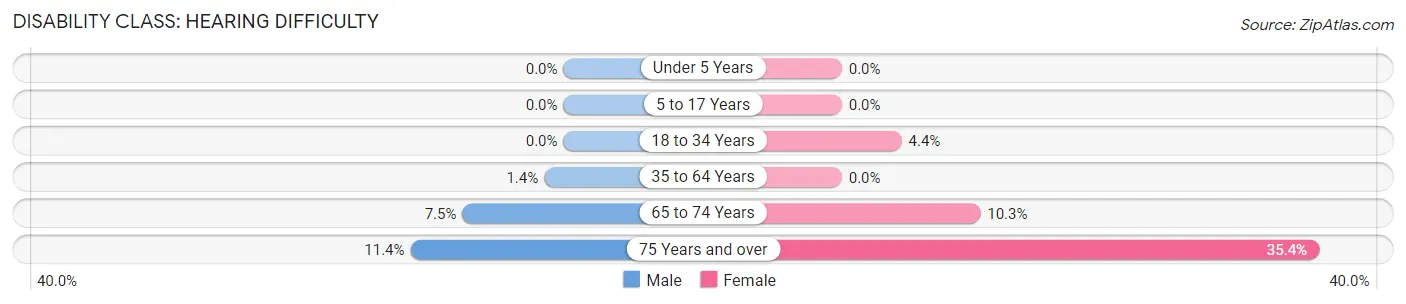
| Age Bracket | Male | Female |
| Under 5 Years | 0 (0.0%) | 0 (0.0%) |
| 5 to 17 Years | 0 (0.0%) | 0 (0.0%) |
| 18 to 34 Years | 0 (0.0%) | 4 (4.4%) |
| 35 to 64 Years | 3 (1.4%) | 0 (0.0%) |
| 65 to 74 Years | 6 (7.5%) | 11 (10.3%) |
| 75 Years and over | 5 (11.4%) | 34 (35.4%) |
Disability Class: Vision Difficulty
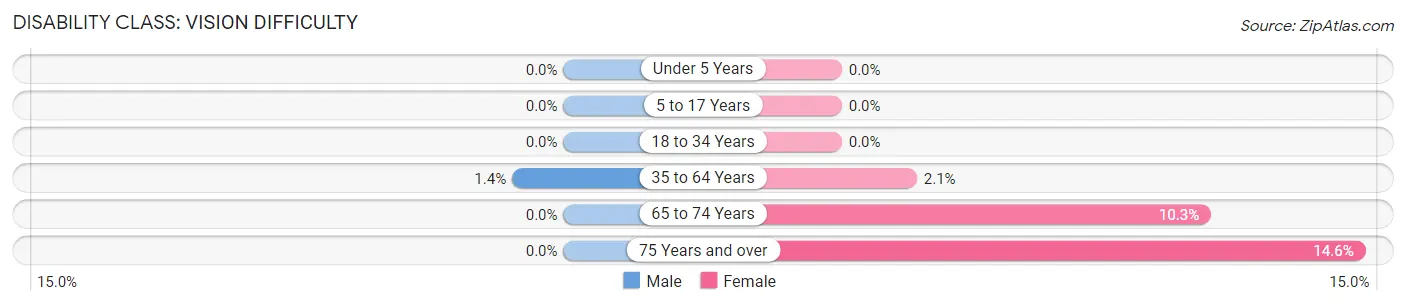
| Age Bracket | Male | Female |
| Under 5 Years | 0 (0.0%) | 0 (0.0%) |
| 5 to 17 Years | 0 (0.0%) | 0 (0.0%) |
| 18 to 34 Years | 0 (0.0%) | 0 (0.0%) |
| 35 to 64 Years | 3 (1.4%) | 5 (2.1%) |
| 65 to 74 Years | 0 (0.0%) | 11 (10.3%) |
| 75 Years and over | 0 (0.0%) | 14 (14.6%) |
Disability Class: Cognitive Difficulty
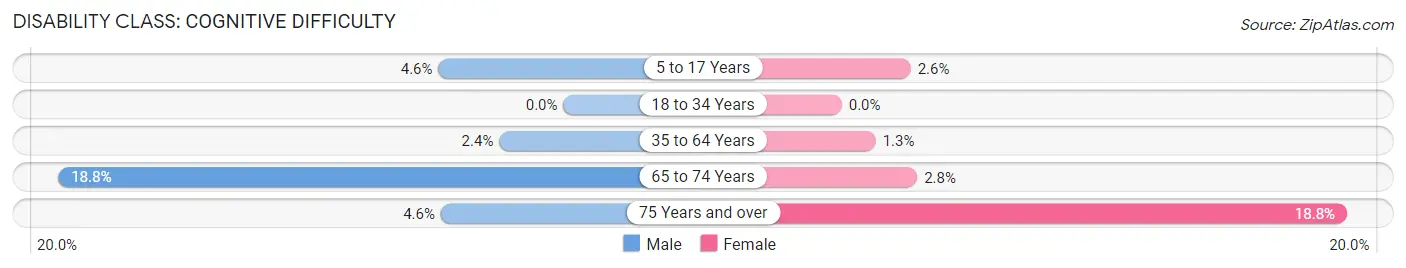
| Age Bracket | Male | Female |
| 5 to 17 Years | 7 (4.6%) | 3 (2.6%) |
| 18 to 34 Years | 0 (0.0%) | 0 (0.0%) |
| 35 to 64 Years | 5 (2.4%) | 3 (1.3%) |
| 65 to 74 Years | 15 (18.8%) | 3 (2.8%) |
| 75 Years and over | 2 (4.5%) | 18 (18.8%) |
Disability Class: Ambulatory Difficulty
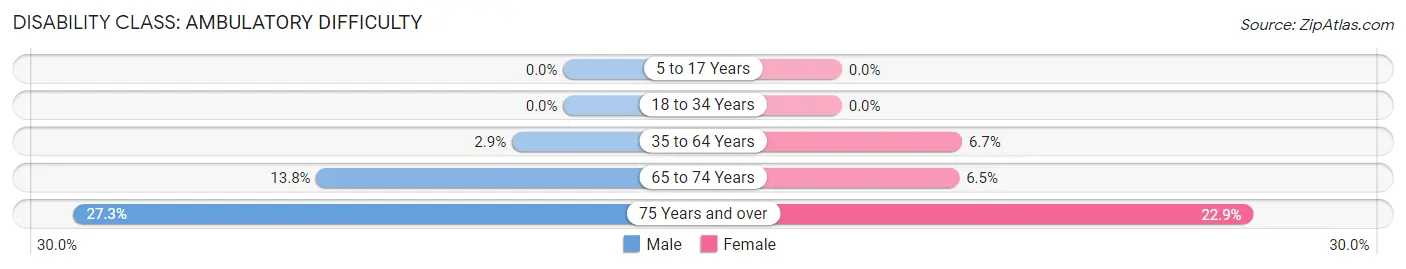
| Age Bracket | Male | Female |
| 5 to 17 Years | 0 (0.0%) | 0 (0.0%) |
| 18 to 34 Years | 0 (0.0%) | 0 (0.0%) |
| 35 to 64 Years | 6 (2.9%) | 16 (6.7%) |
| 65 to 74 Years | 11 (13.8%) | 7 (6.5%) |
| 75 Years and over | 12 (27.3%) | 22 (22.9%) |
Disability Class: Self-Care Difficulty
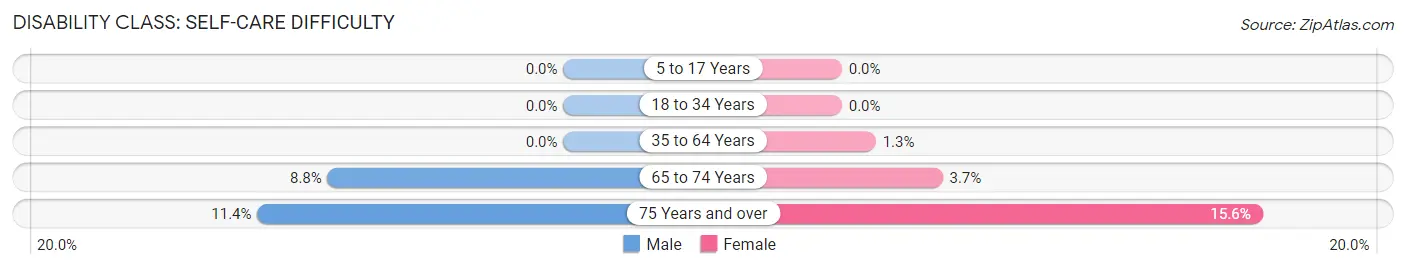
| Age Bracket | Male | Female |
| 5 to 17 Years | 0 (0.0%) | 0 (0.0%) |
| 18 to 34 Years | 0 (0.0%) | 0 (0.0%) |
| 35 to 64 Years | 0 (0.0%) | 3 (1.3%) |
| 65 to 74 Years | 7 (8.7%) | 4 (3.7%) |
| 75 Years and over | 5 (11.4%) | 15 (15.6%) |
Technology Access in Elkader
Computing Device Access in Elkader
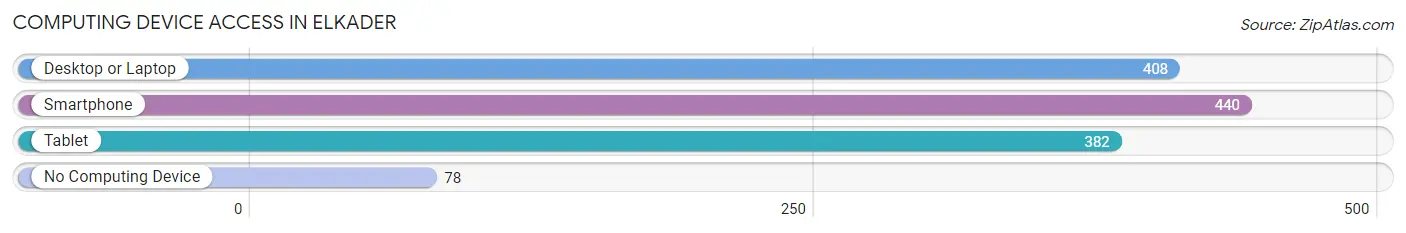
| Device Type | # Households | % Households |
| Desktop or Laptop | 408 | 68.3% |
| Smartphone | 440 | 73.7% |
| Tablet | 382 | 64.0% |
| No Computing Device | 78 | 13.1% |
| Total | 597 | 100.0% |
Internet Access in Elkader
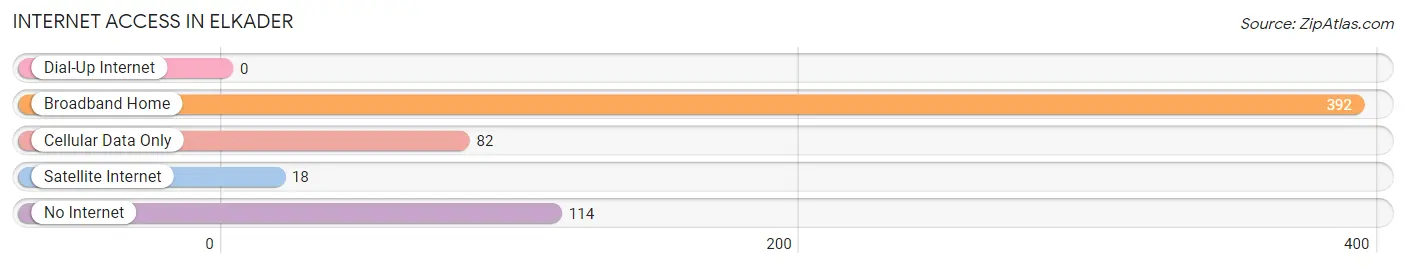
| Internet Type | # Households | % Households |
| Dial-Up Internet | 0 | 0.0% |
| Broadband Home | 392 | 65.7% |
| Cellular Data Only | 82 | 13.7% |
| Satellite Internet | 18 | 3.0% |
| No Internet | 114 | 19.1% |
| Total | 597 | 100.0% |
Elkader Summary
Elkader, Iowa is a small town located in Clayton County, Iowa. It is situated along the Turkey River and is the county seat of Clayton County. The population of Elkader was 1,273 at the 2010 census.
History
Elkader was founded in 1846 by a group of settlers from Pennsylvania. The town was named after Abd el-Kader, an Algerian leader who fought against the French in the 1830s. The settlers were inspired by his courage and named the town after him.
The town was incorporated in 1858 and quickly became a thriving community. It was a major trading center for the surrounding area and was home to several businesses, including a flour mill, a sawmill, a woolen mill, and a brewery.
In the late 19th century, Elkader was a major stop on the Chicago, Milwaukee, St. Paul and Pacific Railroad. The railroad brought new people and businesses to the town, and it continued to grow and prosper.
Geography
Elkader is located in the northeast corner of Clayton County, Iowa. It is situated along the Turkey River and is surrounded by rolling hills and farmland. The town is located about 30 miles from Dubuque, Iowa and about 90 miles from Cedar Rapids, Iowa.
The climate in Elkader is typical of the Midwest, with hot summers and cold winters. The average temperature in July is around 80 degrees Fahrenheit, and the average temperature in January is around 20 degrees Fahrenheit.
Economy
The economy of Elkader is largely based on agriculture. The town is home to several farms, and the surrounding area is known for its production of corn, soybeans, and other crops.
In addition to agriculture, Elkader is home to several businesses, including a grocery store, a hardware store, a bank, and several restaurants. The town also has a small industrial park, which is home to several small businesses.
Demographics
As of the 2010 census, the population of Elkader was 1,273. The racial makeup of the town was 97.3% White, 0.2% African American, 0.2% Native American, 0.2% Asian, 0.2% from other races, and 1.9% from two or more races. Hispanic or Latino of any race were 1.2% of the population.
The median income for a household in Elkader was $41,250, and the median income for a family was $50,000. The per capita income for the town was $20,845. About 8.3% of families and 10.2% of the population were below the poverty line, including 13.2% of those under age 18 and 8.3% of those age 65 or over.
Elkader is a small town with a rich history and a strong sense of community. It is a great place to live, work, and raise a family.
Common Questions
What is Per Capita Income in Elkader?
Per Capita income in Elkader is $31,946.
What is the Median Family Income in Elkader?
Median Family Income in Elkader is $98,015.
What is the Median Household income in Elkader?
Median Household Income in Elkader is $62,574.
What is Income or Wage Gap in Elkader?
Income or Wage Gap in Elkader is 28.4%.
Women in Elkader earn 71.6 cents for every dollar earned by a man.
What is Inequality or Gini Index in Elkader?
Inequality or Gini Index in Elkader is 0.40.
What is the Total Population of Elkader?
Total Population of Elkader is 1,326.
What is the Total Male Population of Elkader?
Total Male Population of Elkader is 629.
What is the Total Female Population of Elkader?
Total Female Population of Elkader is 697.
What is the Ratio of Males per 100 Females in Elkader?
There are 90.24 Males per 100 Females in Elkader.
What is the Ratio of Females per 100 Males in Elkader?
There are 110.81 Females per 100 Males in Elkader.
What is the Median Population Age in Elkader?
Median Population Age in Elkader is 41.0 Years.
What is the Average Family Size in Elkader
Average Family Size in Elkader is 3.0 People.
What is the Average Household Size in Elkader
Average Household Size in Elkader is 2.2 People.
How Large is the Labor Force in Elkader?
There are 624 People in the Labor Forcein in Elkader.
What is the Percentage of People in the Labor Force in Elkader?
61.2% of People are in the Labor Force in Elkader.
What is the Unemployment Rate in Elkader?
Unemployment Rate in Elkader is 1.0%.