Donnellson, IA Map & Demographics
Donnellson Map
Donnellson Overview
$28,274
PER CAPITA INCOME
$72,500
AVG FAMILY INCOME
$51,953
AVG HOUSEHOLD INCOME
35.3%
WAGE / INCOME GAP [ % ]
64.7¢/ $1
WAGE / INCOME GAP [ $ ]
0.44
INEQUALITY / GINI INDEX
920
TOTAL POPULATION
411
MALE POPULATION
509
FEMALE POPULATION
80.75
MALES / 100 FEMALES
123.84
FEMALES / 100 MALES
35.1
MEDIAN AGE
2.9
AVG FAMILY SIZE
2.4
AVG HOUSEHOLD SIZE
406
LABOR FORCE [ PEOPLE ]
60.2%
PERCENT IN LABOR FORCE
1.7%
UNEMPLOYMENT RATE
Donnellson Zip Codes
Donnellson Area Codes
Income in Donnellson
Income Overview in Donnellson
Per Capita Income in Donnellson is $28,274, while median incomes of families and households are $72,500 and $51,953 respectively.
| Characteristic | Number | Measure |
| Per Capita Income | 920 | $28,274 |
| Median Family Income | 244 | $72,500 |
| Mean Family Income | 244 | $83,168 |
| Median Household Income | 357 | $51,953 |
| Mean Household Income | 357 | $73,132 |
| Income Deficit | 244 | $0 |
| Wage / Income Gap (%) | 920 | 35.34% |
| Wage / Income Gap ($) | 920 | 64.66¢ per $1 |
| Gini / Inequality Index | 920 | 0.44 |
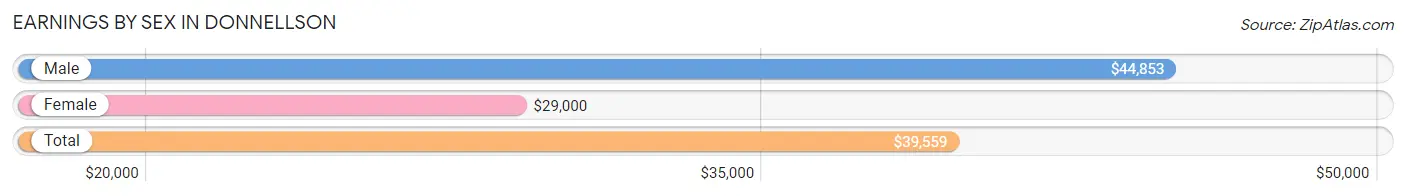
Earnings by Sex in Donnellson
Average Earnings in Donnellson are $39,559, $44,853 for men and $29,000 for women, a difference of 35.3%.
| Sex | Number | Average Earnings |
| Male | 220 (50.7%) | $44,853 |
| Female | 214 (49.3%) | $29,000 |
| Total | 434 (100.0%) | $39,559 |
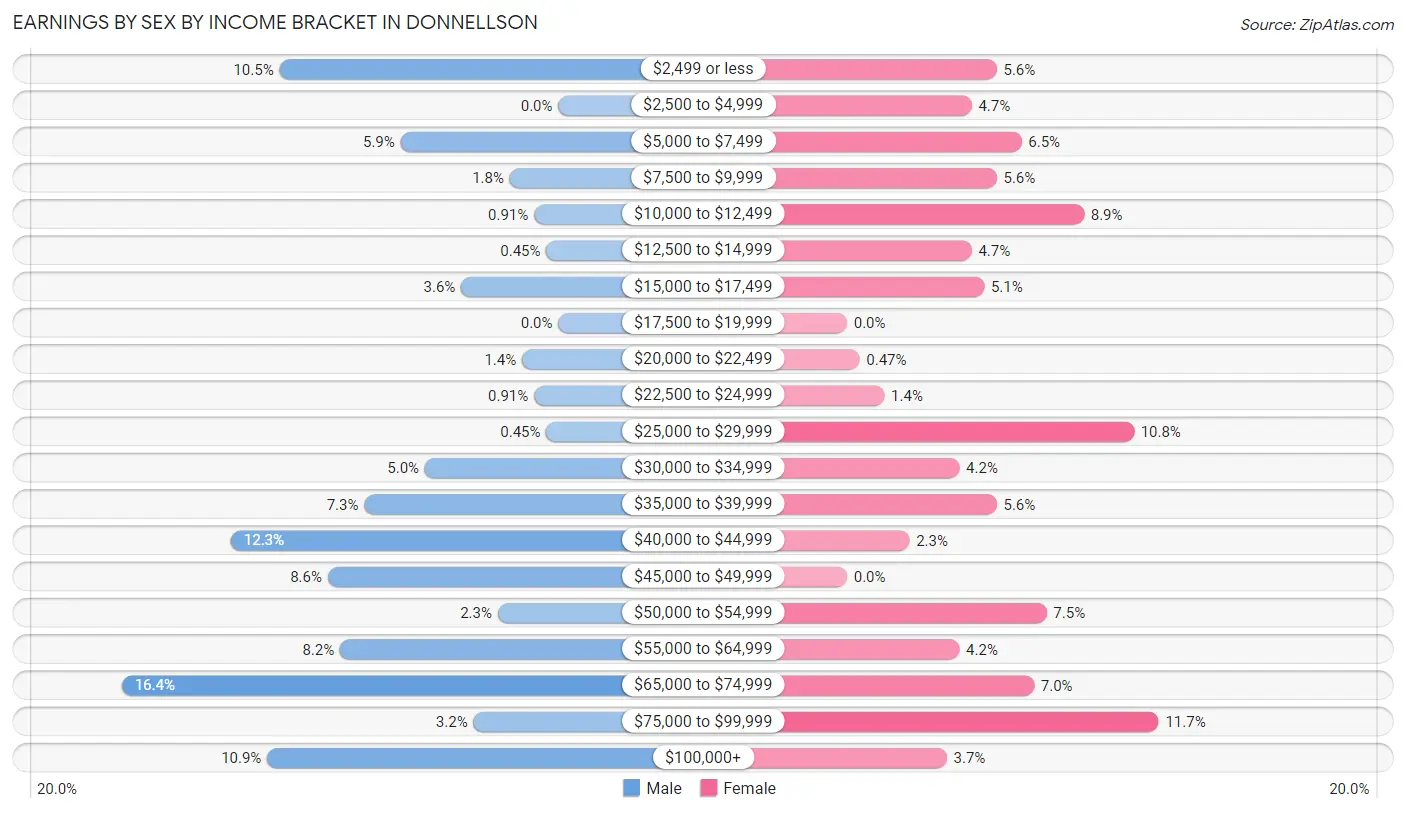
Earnings by Sex by Income Bracket in Donnellson
The most common earnings brackets in Donnellson are $65,000 to $74,999 for men (36 | 16.4%) and $75,000 to $99,999 for women (25 | 11.7%).
| Income | Male | Female |
| $2,499 or less | 23 (10.4%) | 12 (5.6%) |
| $2,500 to $4,999 | 0 (0.0%) | 10 (4.7%) |
| $5,000 to $7,499 | 13 (5.9%) | 14 (6.5%) |
| $7,500 to $9,999 | 4 (1.8%) | 12 (5.6%) |
| $10,000 to $12,499 | 2 (0.9%) | 19 (8.9%) |
| $12,500 to $14,999 | 1 (0.4%) | 10 (4.7%) |
| $15,000 to $17,499 | 8 (3.6%) | 11 (5.1%) |
| $17,500 to $19,999 | 0 (0.0%) | 0 (0.0%) |
| $20,000 to $22,499 | 3 (1.4%) | 1 (0.5%) |
| $22,500 to $24,999 | 2 (0.9%) | 3 (1.4%) |
| $25,000 to $29,999 | 1 (0.4%) | 23 (10.7%) |
| $30,000 to $34,999 | 11 (5.0%) | 9 (4.2%) |
| $35,000 to $39,999 | 16 (7.3%) | 12 (5.6%) |
| $40,000 to $44,999 | 27 (12.3%) | 5 (2.3%) |
| $45,000 to $49,999 | 19 (8.6%) | 0 (0.0%) |
| $50,000 to $54,999 | 5 (2.3%) | 16 (7.5%) |
| $55,000 to $64,999 | 18 (8.2%) | 9 (4.2%) |
| $65,000 to $74,999 | 36 (16.4%) | 15 (7.0%) |
| $75,000 to $99,999 | 7 (3.2%) | 25 (11.7%) |
| $100,000+ | 24 (10.9%) | 8 (3.7%) |
| Total | 220 (100.0%) | 214 (100.0%) |
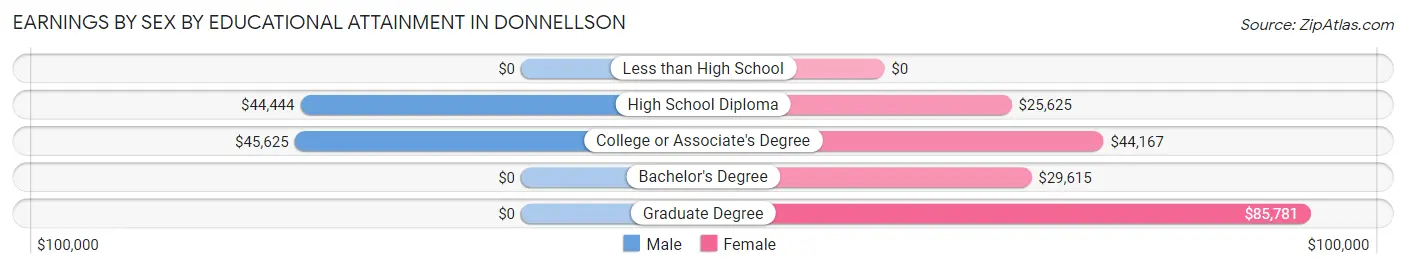
Earnings by Sex by Educational Attainment in Donnellson
Average earnings in Donnellson are $44,779 for men and $34,722 for women, a difference of 22.5%. Men with an educational attainment of college or associate's degree enjoy the highest average annual earnings of $45,625, while those with high school diploma education earn the least with $44,444. Women with an educational attainment of graduate degree earn the most with the average annual earnings of $85,781, while those with high school diploma education have the smallest earnings of $25,625.
| Educational Attainment | Male Income | Female Income |
| Less than High School | - | - |
| High School Diploma | $44,444 | $25,625 |
| College or Associate's Degree | $45,625 | $44,167 |
| Bachelor's Degree | - | - |
| Graduate Degree | - | - |
| Total | $44,779 | $34,722 |
Family Income in Donnellson
Family Income Brackets in Donnellson
According to the Donnellson family income data, there are 58 families falling into the $100,000 to $149,999 income range, which is the most common income bracket and makes up 23.8% of all families. Conversely, the $25,000 to $34,999 income bracket is the least frequent group with only 2 families (0.8%) belonging to this category.
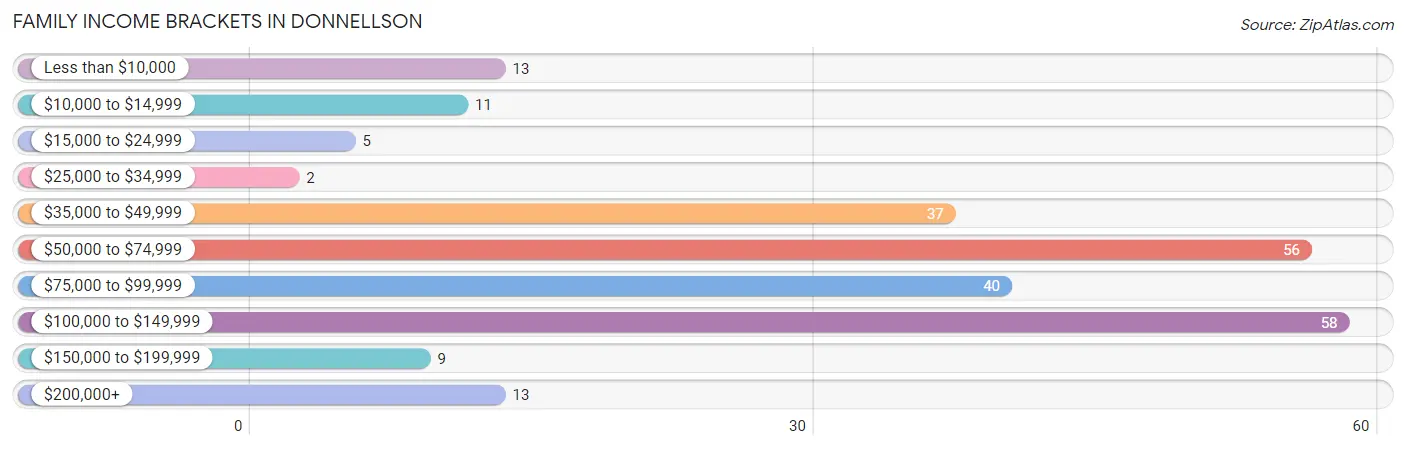
| Income Bracket | # Families | % Families |
| Less than $10,000 | 13 | 5.3% |
| $10,000 to $14,999 | 11 | 4.5% |
| $15,000 to $24,999 | 5 | 2.0% |
| $25,000 to $34,999 | 2 | 0.8% |
| $35,000 to $49,999 | 37 | 15.2% |
| $50,000 to $74,999 | 56 | 23.0% |
| $75,000 to $99,999 | 40 | 16.4% |
| $100,000 to $149,999 | 58 | 23.8% |
| $150,000 to $199,999 | 9 | 3.7% |
| $200,000+ | 13 | 5.3% |
Family Income by Famaliy Size in Donnellson
4-person families (51 | 20.9%) account for the highest median family income in Donnellson with $116,023 per family, while 2-person families (135 | 55.3%) have the highest median income of $33,840 per family member.
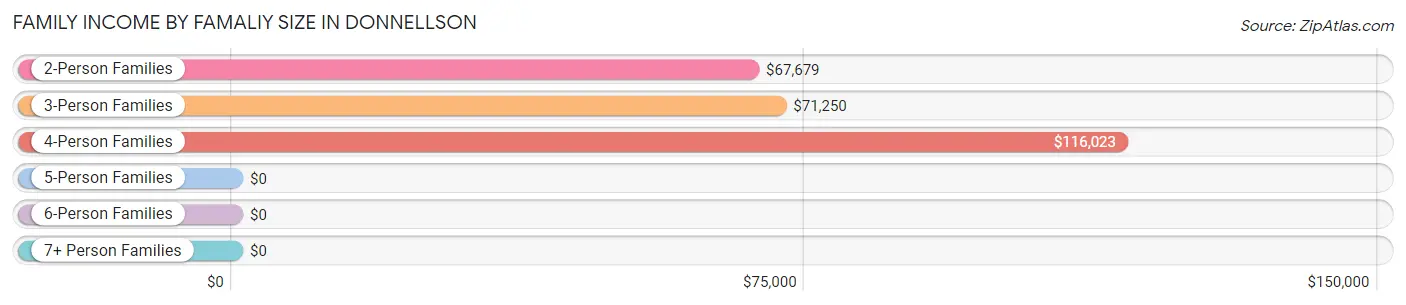
| Income Bracket | # Families | Median Income |
| 2-Person Families | 135 (55.3%) | $67,679 |
| 3-Person Families | 29 (11.9%) | $71,250 |
| 4-Person Families | 51 (20.9%) | $116,023 |
| 5-Person Families | 16 (6.6%) | $0 |
| 6-Person Families | 11 (4.5%) | $0 |
| 7+ Person Families | 2 (0.8%) | $0 |
| Total | 244 (100.0%) | $72,500 |
Family Income by Number of Earners in Donnellson
The median family income in Donnellson is $72,500, with families comprising 3+ earners (15) having the highest median family income of $245,625, while families with no earners (22) have the lowest median family income of $43,750, accounting for 6.1% and 9.0% of families, respectively.
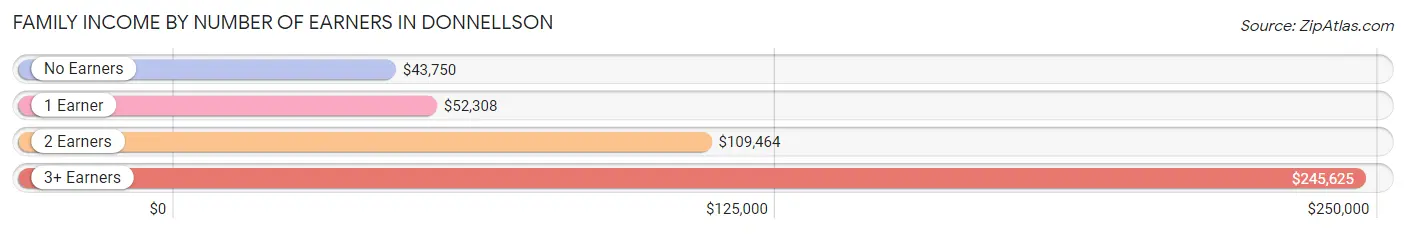
| Number of Earners | # Families | Median Income |
| No Earners | 22 (9.0%) | $43,750 |
| 1 Earner | 118 (48.4%) | $52,308 |
| 2 Earners | 89 (36.5%) | $109,464 |
| 3+ Earners | 15 (6.1%) | $245,625 |
| Total | 244 (100.0%) | $72,500 |
Household Income in Donnellson
Household Income Brackets in Donnellson
With 66 households falling in the category, the $100,000 to $149,999 income range is the most frequent in Donnellson, accounting for 18.5% of all households. In contrast, only 10 households (2.8%) fall into the $150,000 to $199,999 income bracket, making it the least populous group.
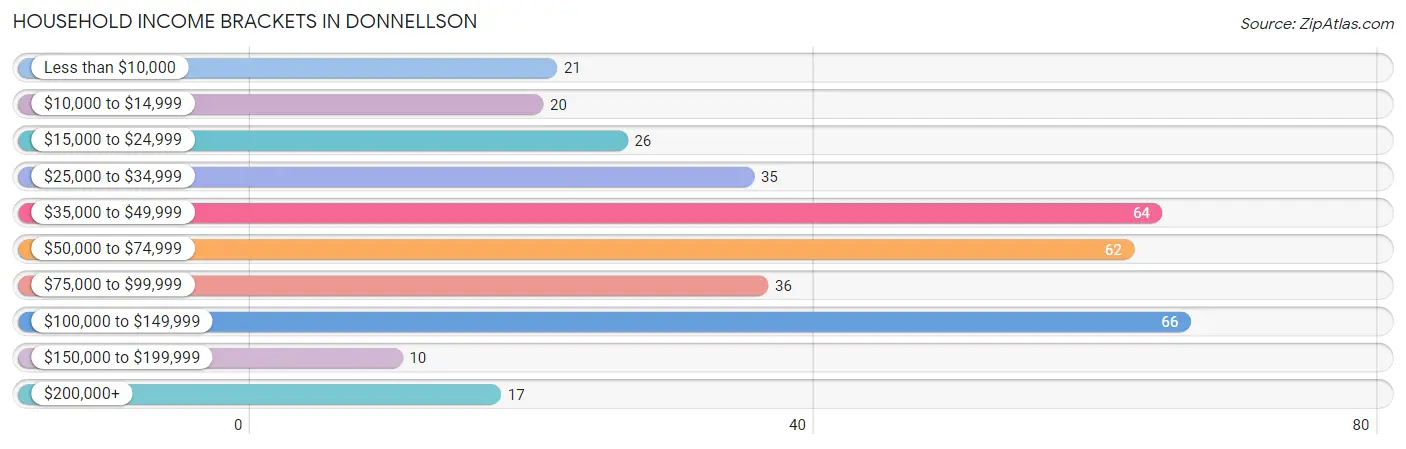
| Income Bracket | # Households | % Households |
| Less than $10,000 | 21 | 5.9% |
| $10,000 to $14,999 | 20 | 5.6% |
| $15,000 to $24,999 | 26 | 7.3% |
| $25,000 to $34,999 | 35 | 9.8% |
| $35,000 to $49,999 | 64 | 17.9% |
| $50,000 to $74,999 | 62 | 17.4% |
| $75,000 to $99,999 | 36 | 10.1% |
| $100,000 to $149,999 | 66 | 18.5% |
| $150,000 to $199,999 | 10 | 2.8% |
| $200,000+ | 17 | 4.8% |
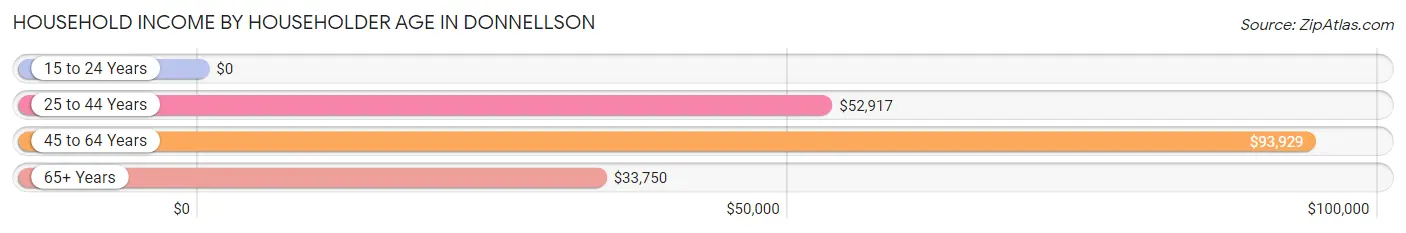
Household Income by Householder Age in Donnellson
The median household income in Donnellson is $51,953, with the highest median household income of $93,929 found in the 45 to 64 years age bracket for the primary householder. A total of 110 households (30.8%) fall into this category. Meanwhile, the 15 to 24 years age bracket for the primary householder has the lowest median household income of $0, with 8 households (2.2%) in this group.
| Income Bracket | # Households | Median Income |
| 15 to 24 Years | 8 (2.2%) | $0 |
| 25 to 44 Years | 129 (36.1%) | $52,917 |
| 45 to 64 Years | 110 (30.8%) | $93,929 |
| 65+ Years | 110 (30.8%) | $33,750 |
| Total | 357 (100.0%) | $51,953 |
Poverty in Donnellson
Income Below Poverty by Sex and Age in Donnellson
With 11.0% poverty level for males and 19.6% for females among the residents of Donnellson, 12 to 14 year old males and 18 to 24 year old females are the most vulnerable to poverty, with 11 males (50.0%) and 21 females (67.7%) in their respective age groups living below the poverty level.
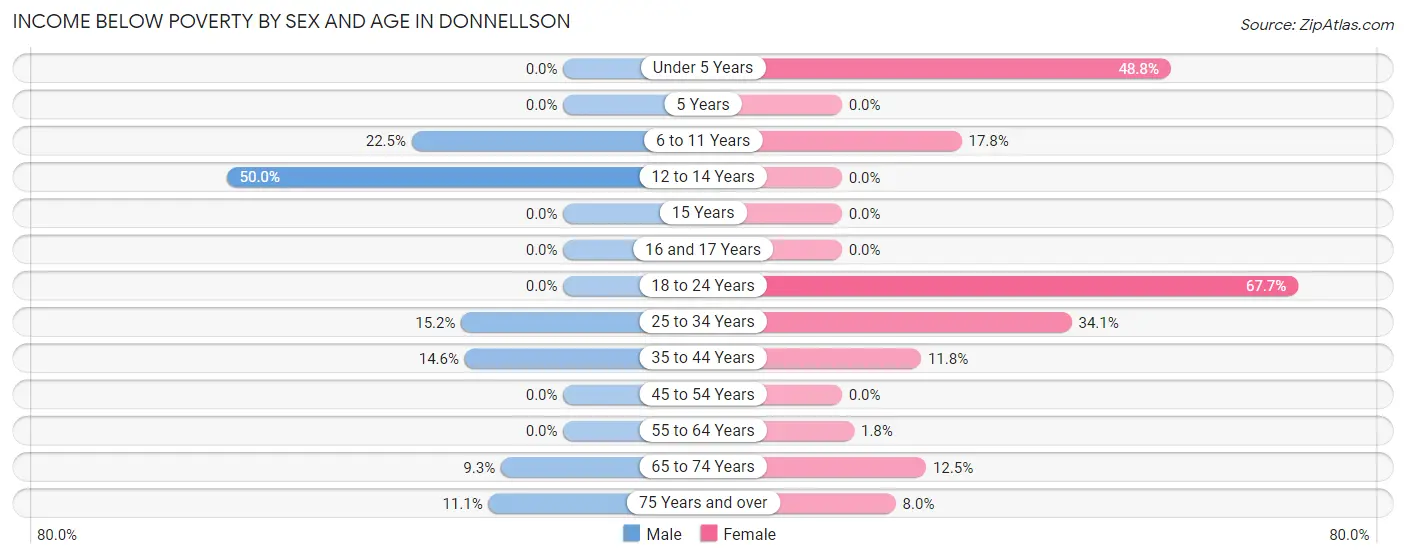
| Age Bracket | Male | Female |
| Under 5 Years | 0 (0.0%) | 21 (48.8%) |
| 5 Years | 0 (0.0%) | 0 (0.0%) |
| 6 to 11 Years | 9 (22.5%) | 8 (17.8%) |
| 12 to 14 Years | 11 (50.0%) | 0 (0.0%) |
| 15 Years | 0 (0.0%) | 0 (0.0%) |
| 16 and 17 Years | 0 (0.0%) | 0 (0.0%) |
| 18 to 24 Years | 0 (0.0%) | 21 (67.7%) |
| 25 to 34 Years | 10 (15.1%) | 29 (34.1%) |
| 35 to 44 Years | 6 (14.6%) | 6 (11.8%) |
| 45 to 54 Years | 0 (0.0%) | 0 (0.0%) |
| 55 to 64 Years | 0 (0.0%) | 1 (1.8%) |
| 65 to 74 Years | 5 (9.3%) | 4 (12.5%) |
| 75 Years and over | 2 (11.1%) | 4 (8.0%) |
| Total | 43 (11.0%) | 94 (19.6%) |
Income Above Poverty by Sex and Age in Donnellson
According to the poverty statistics in Donnellson, males aged under 5 years and females aged 12 to 14 years are the age groups that are most secure financially, with 100.0% of males and 100.0% of females in these age groups living above the poverty line.
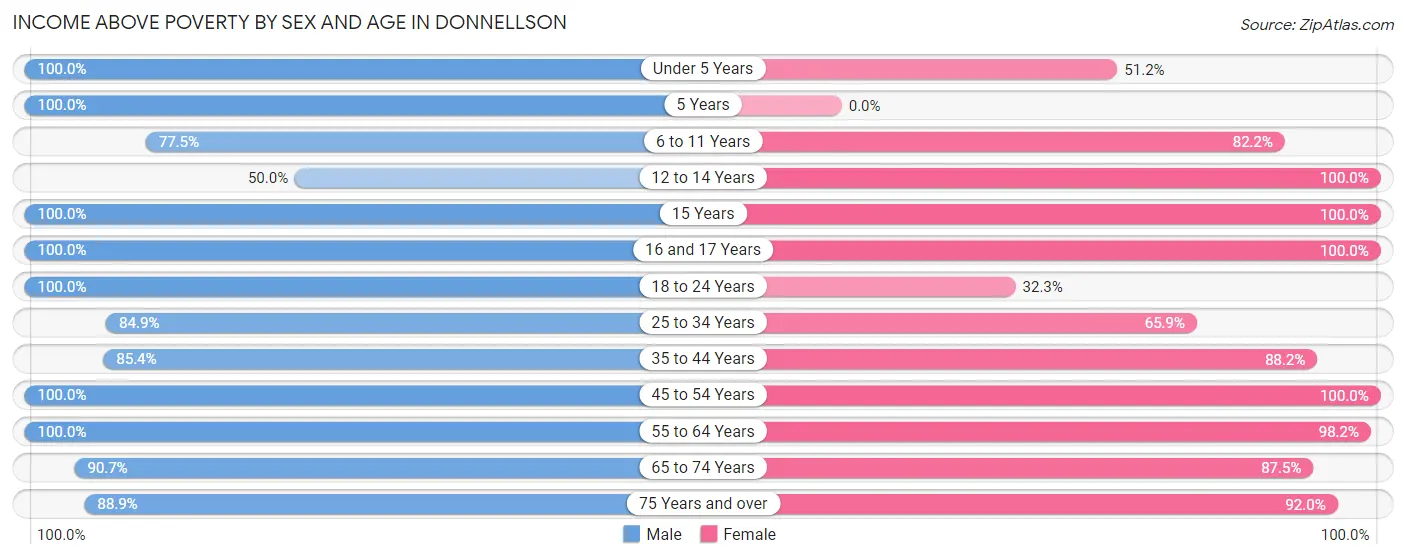
| Age Bracket | Male | Female |
| Under 5 Years | 34 (100.0%) | 22 (51.2%) |
| 5 Years | 7 (100.0%) | 0 (0.0%) |
| 6 to 11 Years | 31 (77.5%) | 37 (82.2%) |
| 12 to 14 Years | 11 (50.0%) | 39 (100.0%) |
| 15 Years | 7 (100.0%) | 7 (100.0%) |
| 16 and 17 Years | 5 (100.0%) | 9 (100.0%) |
| 18 to 24 Years | 15 (100.0%) | 10 (32.3%) |
| 25 to 34 Years | 56 (84.9%) | 56 (65.9%) |
| 35 to 44 Years | 35 (85.4%) | 45 (88.2%) |
| 45 to 54 Years | 48 (100.0%) | 32 (100.0%) |
| 55 to 64 Years | 33 (100.0%) | 54 (98.2%) |
| 65 to 74 Years | 49 (90.7%) | 28 (87.5%) |
| 75 Years and over | 16 (88.9%) | 46 (92.0%) |
| Total | 347 (89.0%) | 385 (80.4%) |
Income Below Poverty Among Married-Couple Families in Donnellson
The poverty statistics for married-couple families in Donnellson show that 5.8% or 9 of the total 154 families live below the poverty line. Families with 3 or 4 children have the highest poverty rate of 32.0%, comprising of 8 families. On the other hand, families with 1 or 2 children have the lowest poverty rate of 0.0%, which includes 0 families.
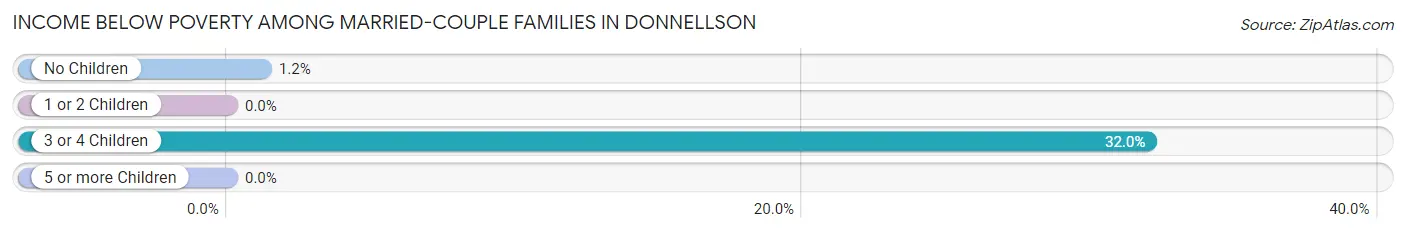
| Children | Above Poverty | Below Poverty |
| No Children | 84 (98.8%) | 1 (1.2%) |
| 1 or 2 Children | 44 (100.0%) | 0 (0.0%) |
| 3 or 4 Children | 17 (68.0%) | 8 (32.0%) |
| 5 or more Children | 0 (0.0%) | 0 (0.0%) |
| Total | 145 (94.2%) | 9 (5.8%) |
Income Below Poverty Among Single-Parent Households in Donnellson
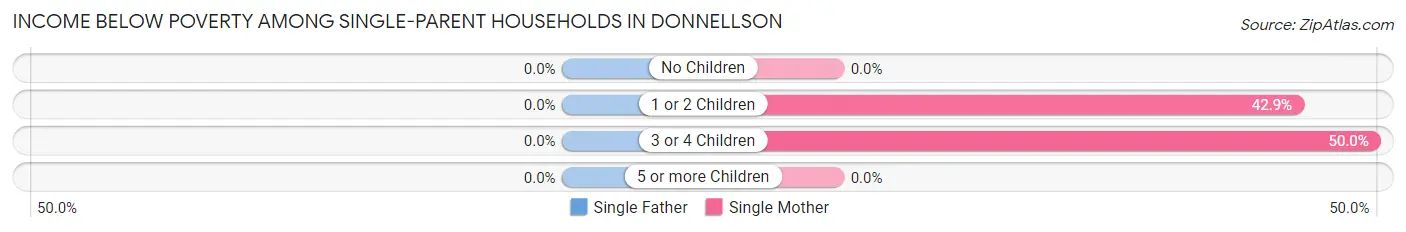
| Children | Single Father | Single Mother |
| No Children | 0 (0.0%) | 0 (0.0%) |
| 1 or 2 Children | 0 (0.0%) | 15 (42.9%) |
| 3 or 4 Children | 0 (0.0%) | 2 (50.0%) |
| 5 or more Children | 0 (0.0%) | 0 (0.0%) |
| Total | 0 (0.0%) | 17 (30.9%) |
Income Below Poverty Among Married-Couple vs Single-Parent Households in Donnellson
The poverty data for Donnellson shows that 9 of the married-couple family households (5.8%) and 17 of the single-parent households (18.9%) are living below the poverty level. Within the married-couple family households, those with 3 or 4 children have the highest poverty rate, with 8 households (32.0%) falling below the poverty line. Among the single-parent households, those with 1 or 2 children have the highest poverty rate, with 15 household (26.8%) living below poverty.
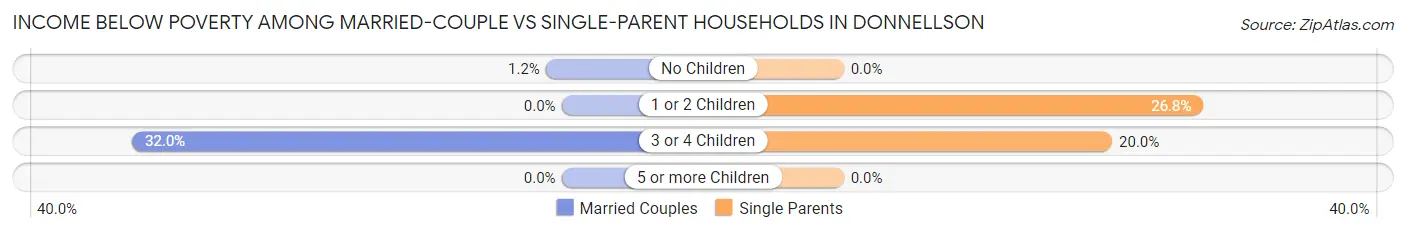
| Children | Married-Couple Families | Single-Parent Households |
| No Children | 1 (1.2%) | 0 (0.0%) |
| 1 or 2 Children | 0 (0.0%) | 15 (26.8%) |
| 3 or 4 Children | 8 (32.0%) | 2 (20.0%) |
| 5 or more Children | 0 (0.0%) | 0 (0.0%) |
| Total | 9 (5.8%) | 17 (18.9%) |
Race in Donnellson
The most populous races in Donnellson are White / Caucasian (882 | 95.9%), Black / African American (27 | 2.9%), and Two or more Races (11 | 1.2%).
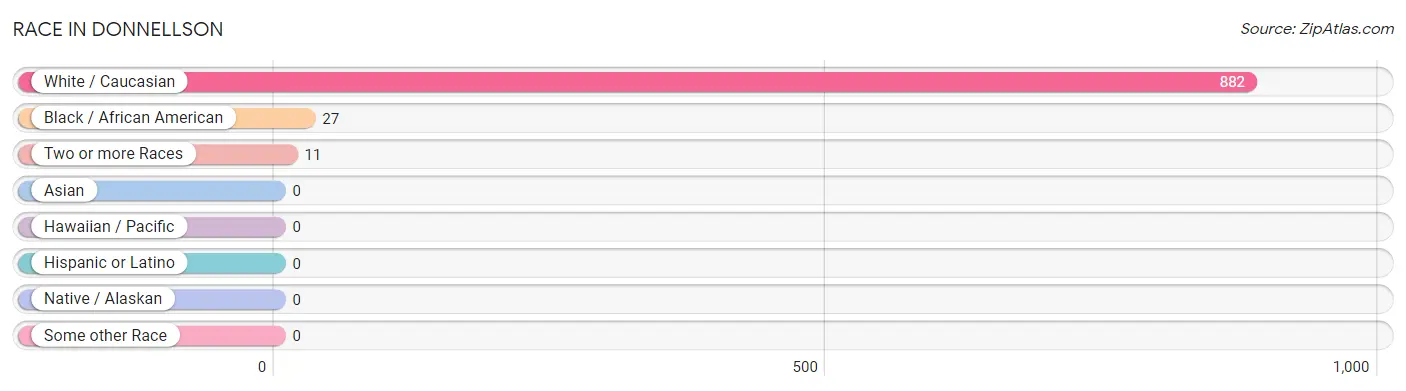
| Race | # Population | % Population |
| Asian | 0 | 0.0% |
| Black / African American | 27 | 2.9% |
| Hawaiian / Pacific | 0 | 0.0% |
| Hispanic or Latino | 0 | 0.0% |
| Native / Alaskan | 0 | 0.0% |
| White / Caucasian | 882 | 95.9% |
| Two or more Races | 11 | 1.2% |
| Some other Race | 0 | 0.0% |
| Total | 920 | 100.0% |
Ancestry in Donnellson
The most populous ancestries reported in Donnellson are German (253 | 27.5%), American (64 | 7.0%), Irish (51 | 5.5%), English (49 | 5.3%), and Dutch (25 | 2.7%), together accounting for 48.1% of all Donnellson residents.
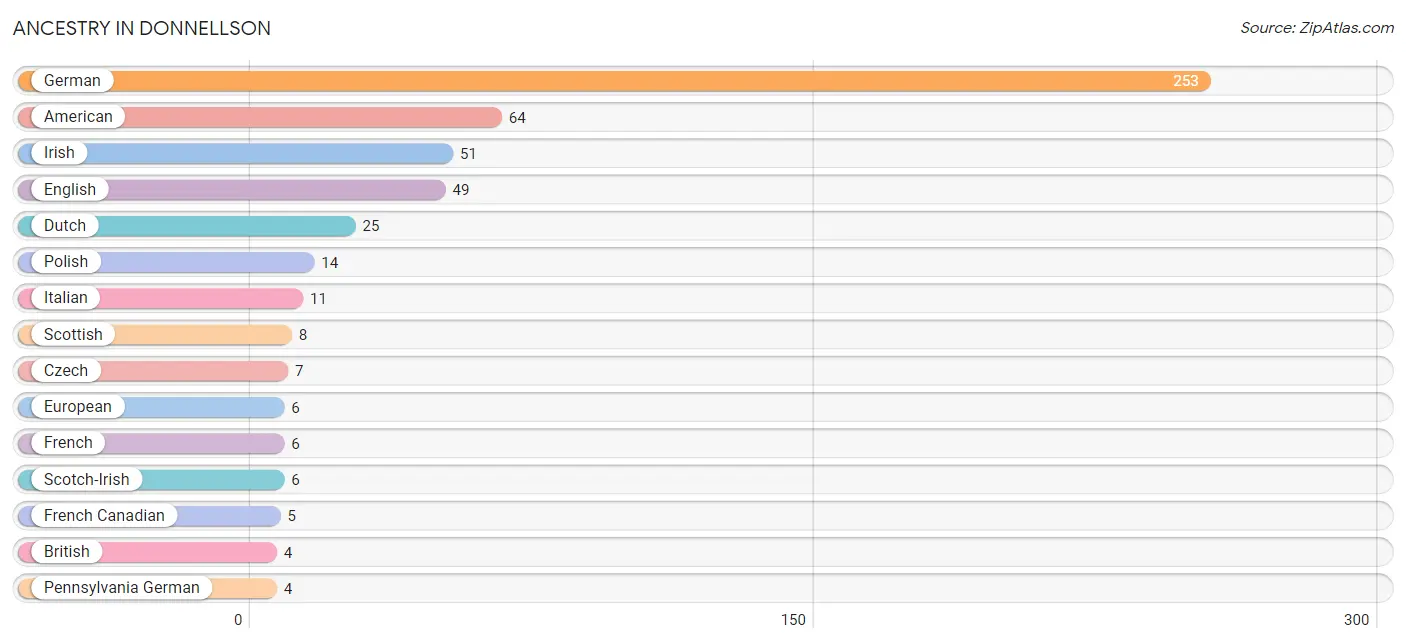
| Ancestry | # Population | % Population |
| American | 64 | 7.0% |
| Arab | 3 | 0.3% |
| British | 4 | 0.4% |
| Croatian | 1 | 0.1% |
| Czech | 7 | 0.8% |
| Danish | 2 | 0.2% |
| Dutch | 25 | 2.7% |
| English | 49 | 5.3% |
| European | 6 | 0.6% |
| French | 6 | 0.6% |
| French Canadian | 5 | 0.5% |
| German | 253 | 27.5% |
| Greek | 3 | 0.3% |
| Irish | 51 | 5.5% |
| Italian | 11 | 1.2% |
| Lebanese | 3 | 0.3% |
| Norwegian | 2 | 0.2% |
| Pennsylvania German | 4 | 0.4% |
| Polish | 14 | 1.5% |
| Russian | 4 | 0.4% |
| Scotch-Irish | 6 | 0.6% |
| Scottish | 8 | 0.9% |
| Swedish | 2 | 0.2% | View All 23 Rows |
Immigrants in Donnellson
The most numerous immigrant groups reported in Donnellson came from Europe (8 | 0.9%), Eastern Europe (4 | 0.4%), Germany (4 | 0.4%), Russia (4 | 0.4%), and Western Europe (4 | 0.4%), together accounting for 2.6% of all Donnellson residents.
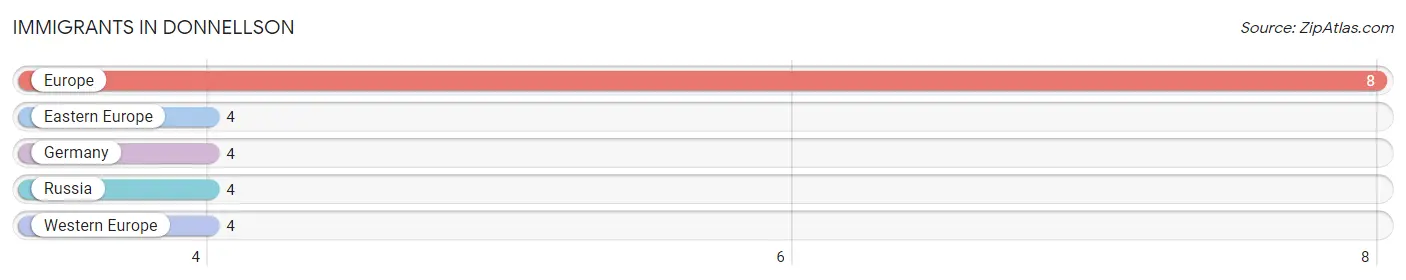
| Immigration Origin | # Population | % Population |
| Eastern Europe | 4 | 0.4% |
| Europe | 8 | 0.9% |
| Germany | 4 | 0.4% |
| Russia | 4 | 0.4% |
| Western Europe | 4 | 0.4% | View All 5 Rows |
Sex and Age in Donnellson
Sex and Age in Donnellson
The most populous age groups in Donnellson are 25 to 29 Years (40 | 9.7%) for men and 25 to 29 Years (47 | 9.2%) for women.
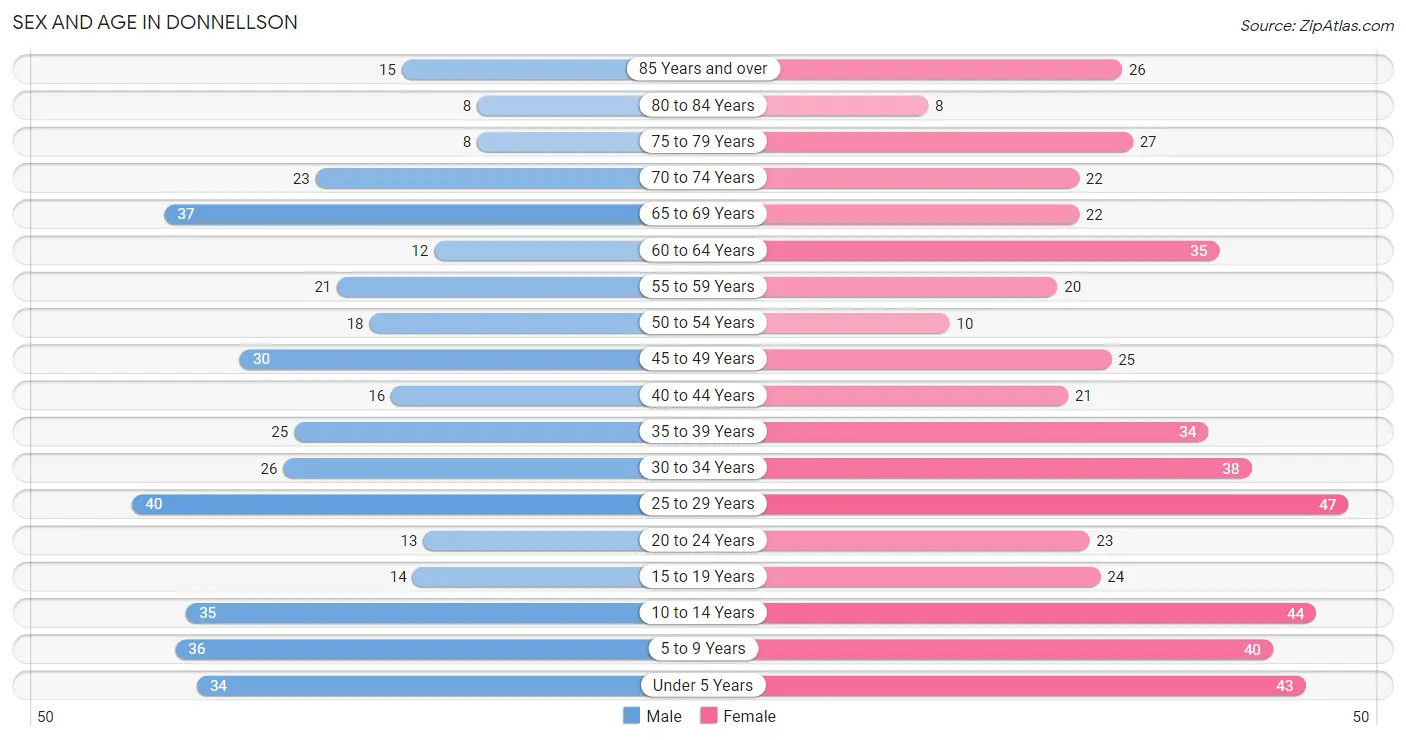
| Age Bracket | Male | Female |
| Under 5 Years | 34 (8.3%) | 43 (8.5%) |
| 5 to 9 Years | 36 (8.8%) | 40 (7.9%) |
| 10 to 14 Years | 35 (8.5%) | 44 (8.6%) |
| 15 to 19 Years | 14 (3.4%) | 24 (4.7%) |
| 20 to 24 Years | 13 (3.2%) | 23 (4.5%) |
| 25 to 29 Years | 40 (9.7%) | 47 (9.2%) |
| 30 to 34 Years | 26 (6.3%) | 38 (7.5%) |
| 35 to 39 Years | 25 (6.1%) | 34 (6.7%) |
| 40 to 44 Years | 16 (3.9%) | 21 (4.1%) |
| 45 to 49 Years | 30 (7.3%) | 25 (4.9%) |
| 50 to 54 Years | 18 (4.4%) | 10 (2.0%) |
| 55 to 59 Years | 21 (5.1%) | 20 (3.9%) |
| 60 to 64 Years | 12 (2.9%) | 35 (6.9%) |
| 65 to 69 Years | 37 (9.0%) | 22 (4.3%) |
| 70 to 74 Years | 23 (5.6%) | 22 (4.3%) |
| 75 to 79 Years | 8 (1.9%) | 27 (5.3%) |
| 80 to 84 Years | 8 (1.9%) | 8 (1.6%) |
| 85 Years and over | 15 (3.6%) | 26 (5.1%) |
| Total | 411 (100.0%) | 509 (100.0%) |
Families and Households in Donnellson
Median Family Size in Donnellson
The median family size in Donnellson is 2.92 persons per family, with married-couple families (154 | 63.1%) accounting for the largest median family size of 3.22 persons per family. On the other hand, single female/mother families (55 | 22.5%) represent the smallest median family size with 2.33 persons per family.
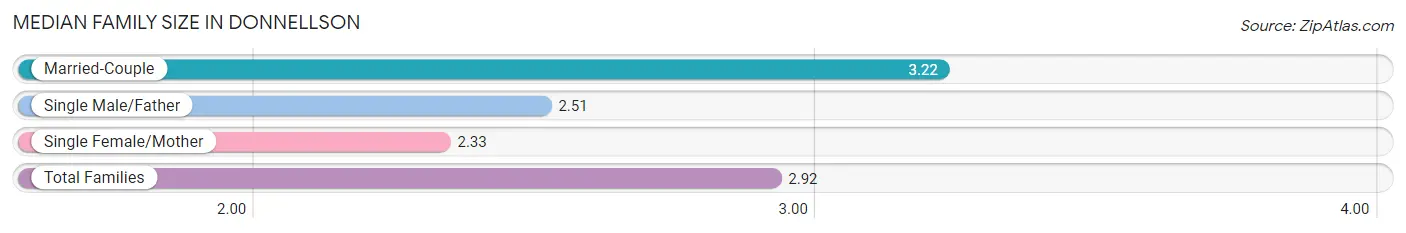
| Family Type | # Families | Family Size |
| Married-Couple | 154 (63.1%) | 3.22 |
| Single Male/Father | 35 (14.3%) | 2.51 |
| Single Female/Mother | 55 (22.5%) | 2.33 |
| Total Families | 244 (100.0%) | 2.92 |
Median Household Size in Donnellson
The median household size in Donnellson is 2.44 persons per household, with married-couple households (154 | 43.1%) accounting for the largest median household size of 3.22 persons per household. non-family households (113 | 31.7%) represent the smallest median household size with 1.12 persons per household.
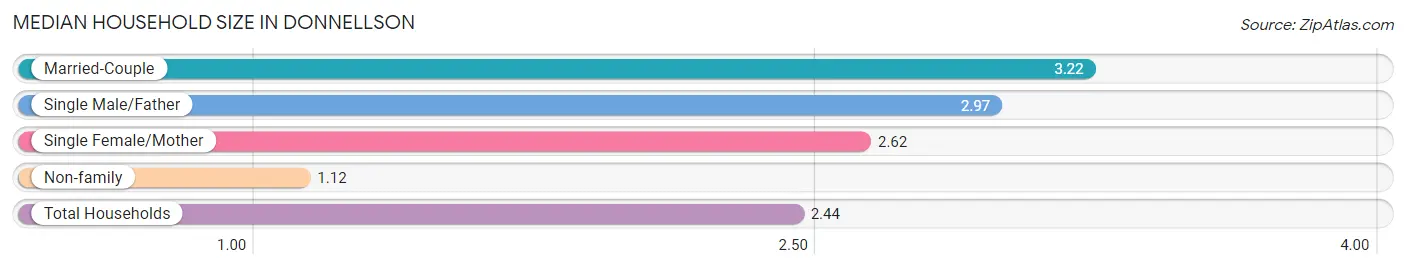
| Household Type | # Households | Household Size |
| Married-Couple | 154 (43.1%) | 3.22 |
| Single Male/Father | 35 (9.8%) | 2.97 |
| Single Female/Mother | 55 (15.4%) | 2.62 |
| Non-family | 113 (31.7%) | 1.12 |
| Total Households | 357 (100.0%) | 2.44 |
Household Size by Marriage Status in Donnellson
Out of a total of 357 households in Donnellson, 244 (68.3%) are family households, while 113 (31.7%) are nonfamily households. The most numerous type of family households are 2-person households, comprising 123, and the most common type of nonfamily households are 1-person households, comprising 98.
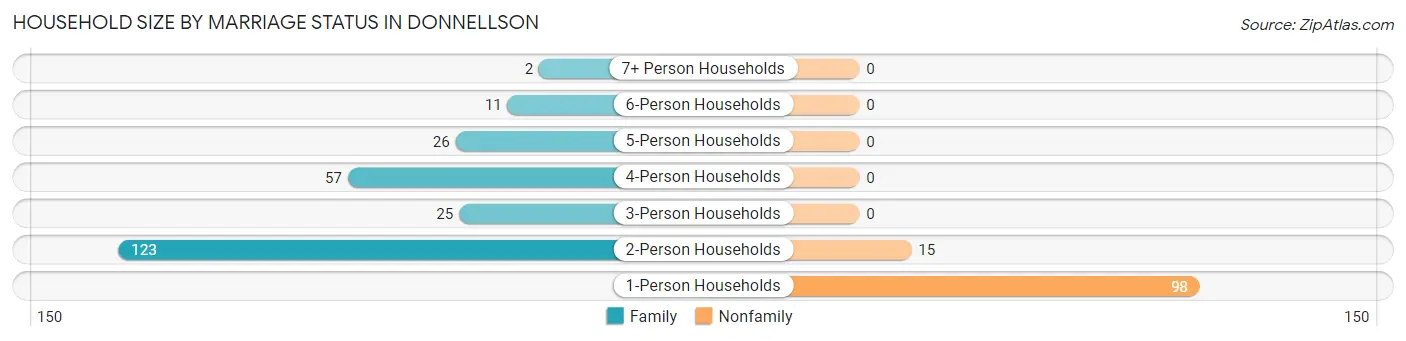
| Household Size | Family Households | Nonfamily Households |
| 1-Person Households | - | 98 (27.5%) |
| 2-Person Households | 123 (34.4%) | 15 (4.2%) |
| 3-Person Households | 25 (7.0%) | 0 (0.0%) |
| 4-Person Households | 57 (16.0%) | 0 (0.0%) |
| 5-Person Households | 26 (7.3%) | 0 (0.0%) |
| 6-Person Households | 11 (3.1%) | 0 (0.0%) |
| 7+ Person Households | 2 (0.6%) | 0 (0.0%) |
| Total | 244 (68.3%) | 113 (31.7%) |
Female Fertility in Donnellson
Fertility by Age in Donnellson
Average fertility rate in Donnellson is 88.0 births per 1,000 women. Women in the age bracket of 20 to 34 years have the highest fertility rate with 139.0 births per 1,000 women. Women in the age bracket of 20 to 34 years acount for 78.9% of all women with births.
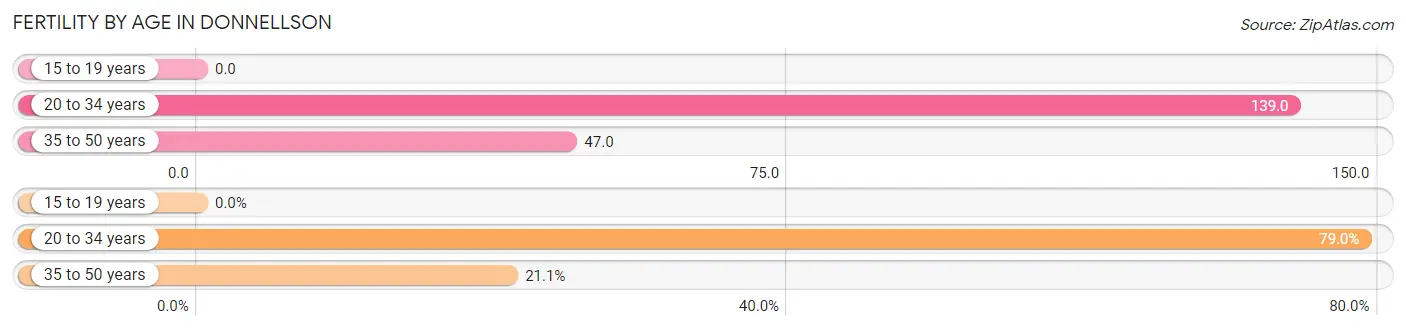
| Age Bracket | Women with Births | Births / 1,000 Women |
| 15 to 19 years | 0 (0.0%) | 0.0 |
| 20 to 34 years | 15 (78.9%) | 139.0 |
| 35 to 50 years | 4 (21.0%) | 47.0 |
| Total | 19 (100.0%) | 88.0 |
Fertility by Age by Marriage Status in Donnellson
47.4% of women with births (19) in Donnellson are married. The highest percentage of unmarried women with births falls into 20 to 34 years age bracket with 66.7% of them unmarried at the time of birth, while the lowest percentage of unmarried women with births belong to 35 to 50 years age bracket with 0.0% of them unmarried.
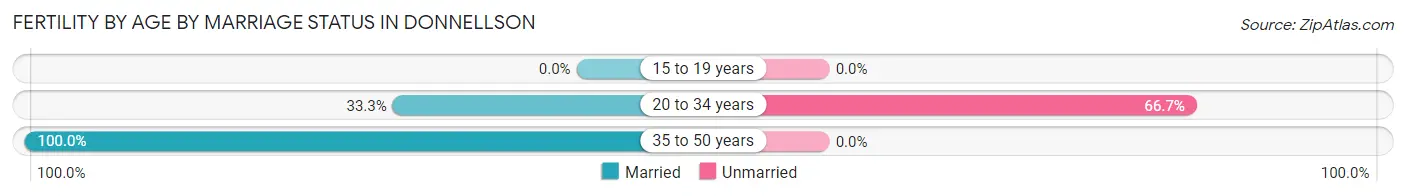
| Age Bracket | Married | Unmarried |
| 15 to 19 years | 0 (0.0%) | 0 (0.0%) |
| 20 to 34 years | 5 (33.3%) | 10 (66.7%) |
| 35 to 50 years | 4 (100.0%) | 0 (0.0%) |
| Total | 9 (47.4%) | 10 (52.6%) |
Fertility by Education in Donnellson
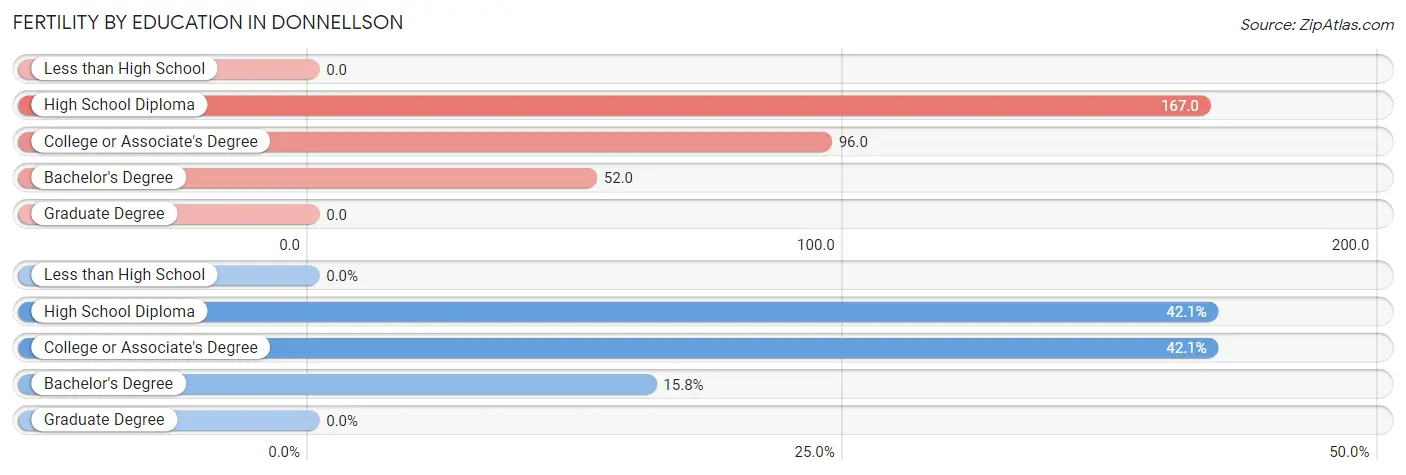
| Educational Attainment | Women with Births | Births / 1,000 Women |
| Less than High School | 0 (0.0%) | 0.0 |
| High School Diploma | 8 (42.1%) | 167.0 |
| College or Associate's Degree | 8 (42.1%) | 96.0 |
| Bachelor's Degree | 3 (15.8%) | 52.0 |
| Graduate Degree | 0 (0.0%) | 0.0 |
| Total | 19 (100.0%) | 88.0 |
Fertility by Education by Marriage Status in Donnellson
52.6% of women with births in Donnellson are unmarried. Women with the educational attainment of bachelor's degree are most likely to be married with 100.0% of them married at childbirth, while women with the educational attainment of high school diploma are least likely to be married with 75.0% of them unmarried at childbirth.
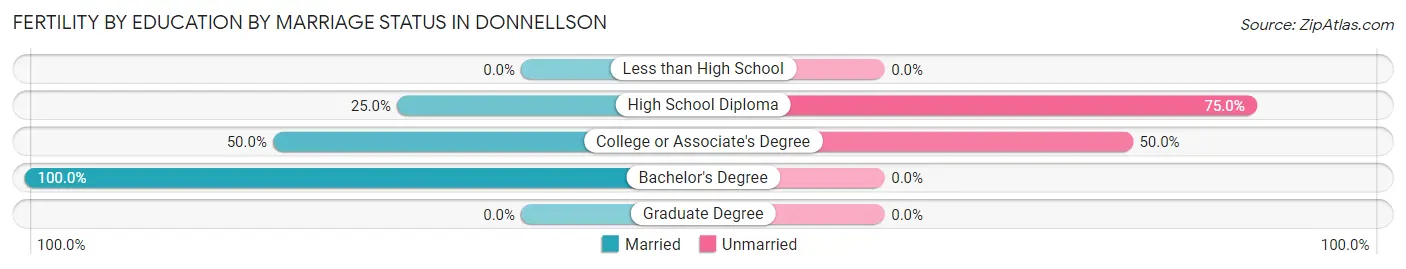
| Educational Attainment | Married | Unmarried |
| Less than High School | 0 (0.0%) | 0 (0.0%) |
| High School Diploma | 2 (25.0%) | 6 (75.0%) |
| College or Associate's Degree | 4 (50.0%) | 4 (50.0%) |
| Bachelor's Degree | 3 (100.0%) | 0 (0.0%) |
| Graduate Degree | 0 (0.0%) | 0 (0.0%) |
| Total | 9 (47.4%) | 10 (52.6%) |
Employment Characteristics in Donnellson
Employment by Class of Employer in Donnellson
Among the 395 employed individuals in Donnellson, private company employees (283 | 71.7%), not-for-profit organizations (29 | 7.3%), and self-employed (not incorporated) (26 | 6.6%) make up the most common classes of employment.
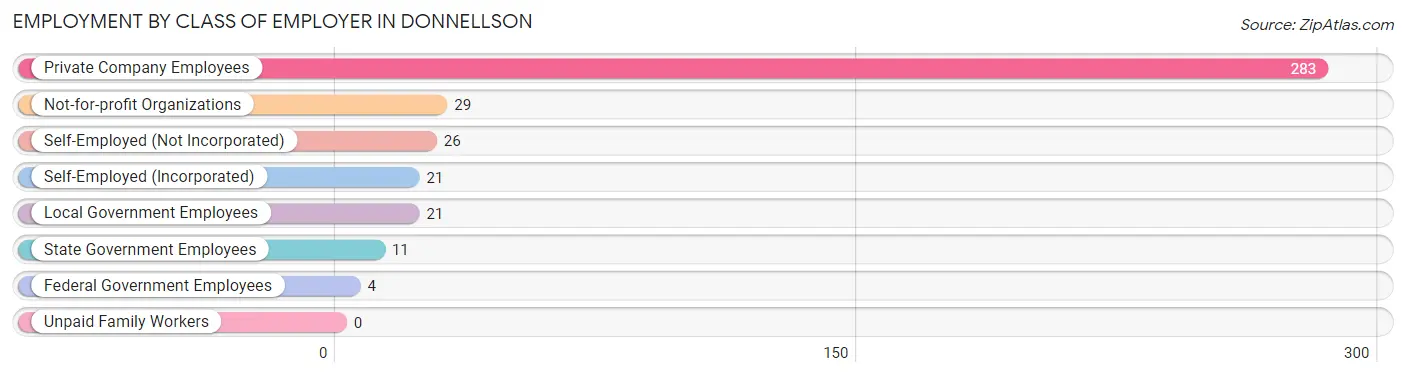
| Employer Class | # Employees | % Employees |
| Private Company Employees | 283 | 71.7% |
| Self-Employed (Incorporated) | 21 | 5.3% |
| Self-Employed (Not Incorporated) | 26 | 6.6% |
| Not-for-profit Organizations | 29 | 7.3% |
| Local Government Employees | 21 | 5.3% |
| State Government Employees | 11 | 2.8% |
| Federal Government Employees | 4 | 1.0% |
| Unpaid Family Workers | 0 | 0.0% |
| Total | 395 | 100.0% |
Employment Status by Age in Donnellson
According to the labor force statistics for Donnellson, out of the total population over 16 years of age (674), 60.2% or 406 individuals are in the labor force, with 1.7% or 7 of them unemployed. The age group with the highest labor force participation rate is 20 to 24 years, with 100.0% or 36 individuals in the labor force. Within the labor force, the 20 to 24 years age range has the highest percentage of unemployed individuals, with 11.1% or 4 of them being unemployed.
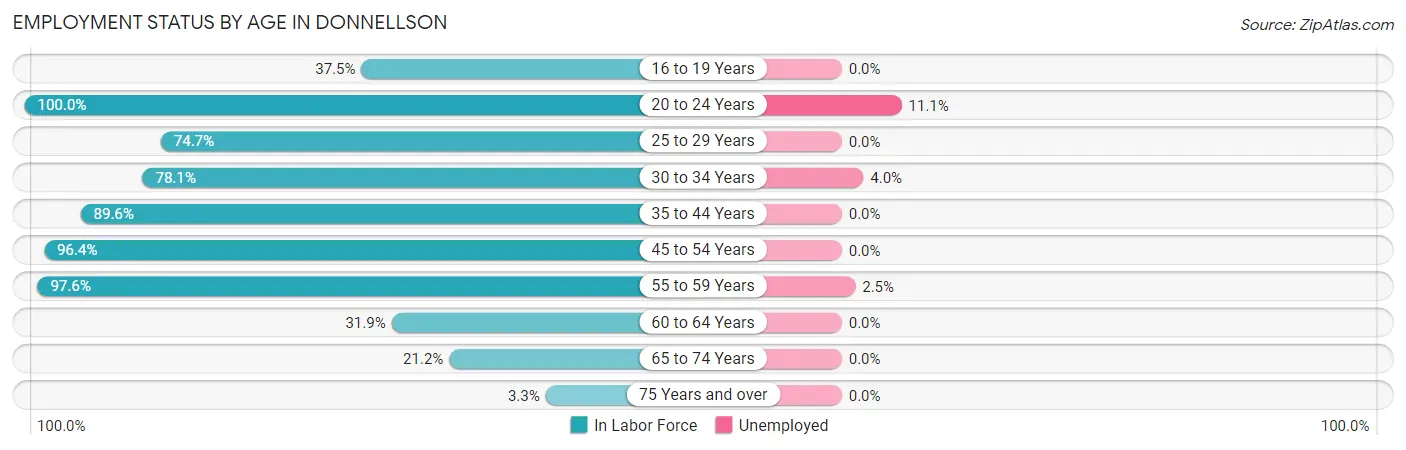
| Age Bracket | In Labor Force | Unemployed |
| 16 to 19 Years | 9 (37.5%) | 0 (0.0%) |
| 20 to 24 Years | 36 (100.0%) | 4 (11.1%) |
| 25 to 29 Years | 65 (74.7%) | 0 (0.0%) |
| 30 to 34 Years | 50 (78.1%) | 2 (4.0%) |
| 35 to 44 Years | 86 (89.6%) | 0 (0.0%) |
| 45 to 54 Years | 80 (96.4%) | 0 (0.0%) |
| 55 to 59 Years | 40 (97.6%) | 1 (2.5%) |
| 60 to 64 Years | 15 (31.9%) | 0 (0.0%) |
| 65 to 74 Years | 22 (21.2%) | 0 (0.0%) |
| 75 Years and over | 3 (3.3%) | 0 (0.0%) |
| Total | 406 (60.2%) | 7 (1.7%) |
Employment Status by Educational Attainment in Donnellson
According to labor force statistics for Donnellson, 80.4% of individuals (336) out of the total population between 25 and 64 years of age (418) are in the labor force, with 0.9% or 3 of them being unemployed. The group with the highest labor force participation rate are those with the educational attainment of less than high school, with 100.0% or 10 individuals in the labor force. Within the labor force, individuals with high school diploma education have the highest percentage of unemployment, with 2.0% or 2 of them being unemployed.
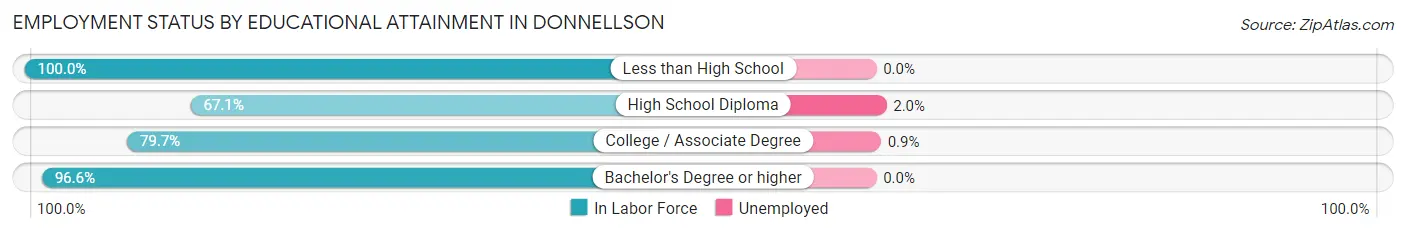
| Educational Attainment | In Labor Force | Unemployed |
| Less than High School | 10 (100.0%) | 0 (0.0%) |
| High School Diploma | 100 (67.1%) | 3 (2.0%) |
| College / Associate Degree | 114 (79.7%) | 1 (0.9%) |
| Bachelor's Degree or higher | 112 (96.6%) | 0 (0.0%) |
| Total | 336 (80.4%) | 4 (0.9%) |
Employment Occupations by Sex in Donnellson
Management, Business, Science and Arts Occupations
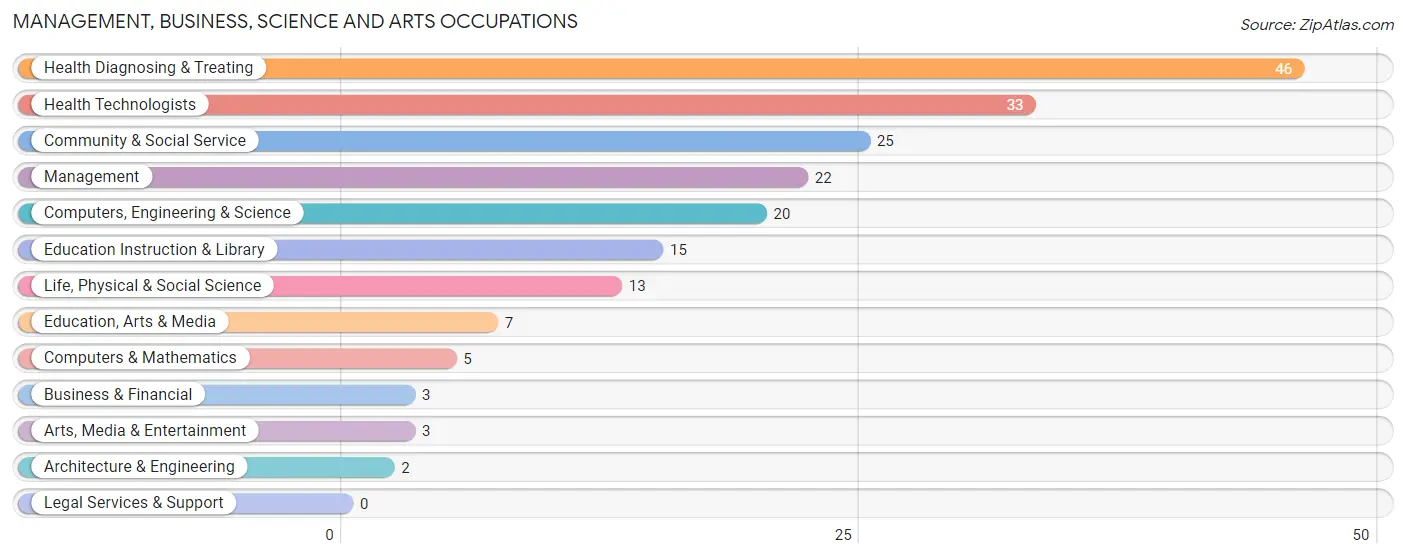
The most common Management, Business, Science and Arts occupations in Donnellson are Health Diagnosing & Treating (46 | 11.5%), Health Technologists (33 | 8.3%), Community & Social Service (25 | 6.3%), Management (22 | 5.5%), and Computers, Engineering & Science (20 | 5.0%).
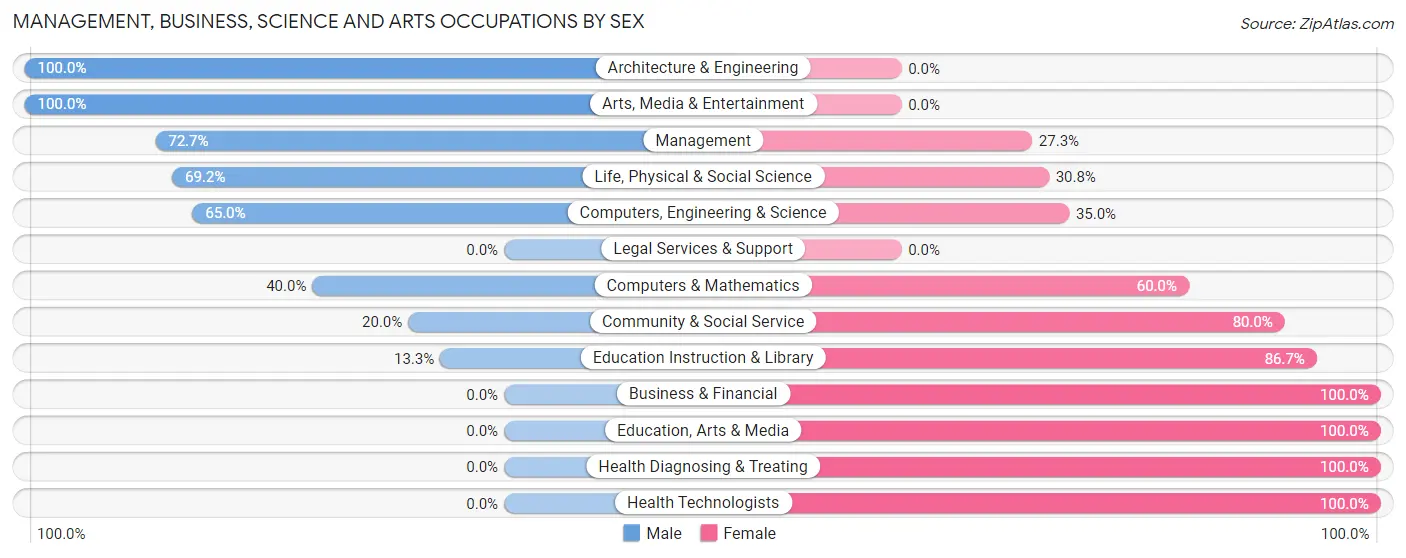
Management, Business, Science and Arts Occupations by Sex
Within the Management, Business, Science and Arts occupations in Donnellson, the most male-oriented occupations are Architecture & Engineering (100.0%), Arts, Media & Entertainment (100.0%), and Management (72.7%), while the most female-oriented occupations are Business & Financial (100.0%), Education, Arts & Media (100.0%), and Health Diagnosing & Treating (100.0%).
| Occupation | Male | Female |
| Management | 16 (72.7%) | 6 (27.3%) |
| Business & Financial | 0 (0.0%) | 3 (100.0%) |
| Computers, Engineering & Science | 13 (65.0%) | 7 (35.0%) |
| Computers & Mathematics | 2 (40.0%) | 3 (60.0%) |
| Architecture & Engineering | 2 (100.0%) | 0 (0.0%) |
| Life, Physical & Social Science | 9 (69.2%) | 4 (30.8%) |
| Community & Social Service | 5 (20.0%) | 20 (80.0%) |
| Education, Arts & Media | 0 (0.0%) | 7 (100.0%) |
| Legal Services & Support | 0 (0.0%) | 0 (0.0%) |
| Education Instruction & Library | 2 (13.3%) | 13 (86.7%) |
| Arts, Media & Entertainment | 3 (100.0%) | 0 (0.0%) |
| Health Diagnosing & Treating | 0 (0.0%) | 46 (100.0%) |
| Health Technologists | 0 (0.0%) | 33 (100.0%) |
| Total (Category) | 34 (29.3%) | 82 (70.7%) |
| Total (Overall) | 199 (49.9%) | 200 (50.1%) |
Services Occupations
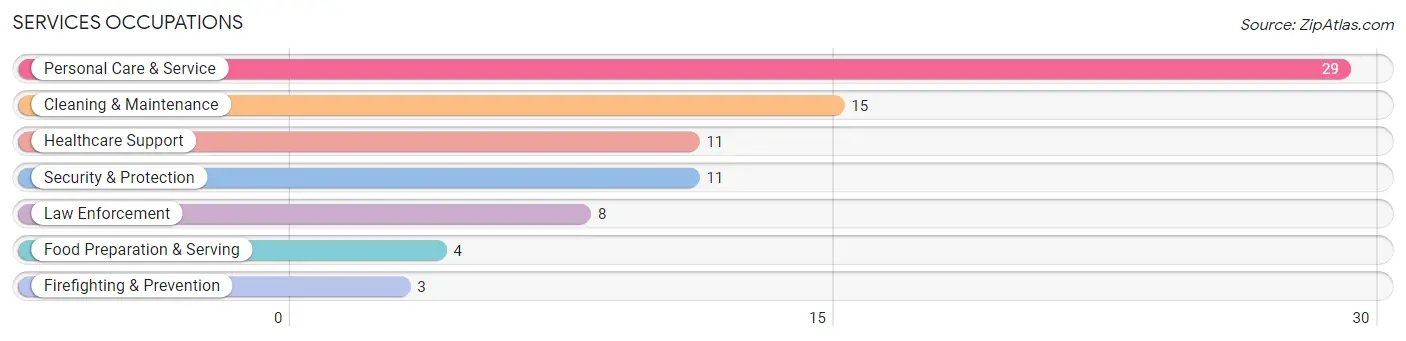
The most common Services occupations in Donnellson are Personal Care & Service (29 | 7.3%), Cleaning & Maintenance (15 | 3.8%), Healthcare Support (11 | 2.8%), Security & Protection (11 | 2.8%), and Law Enforcement (8 | 2.0%).
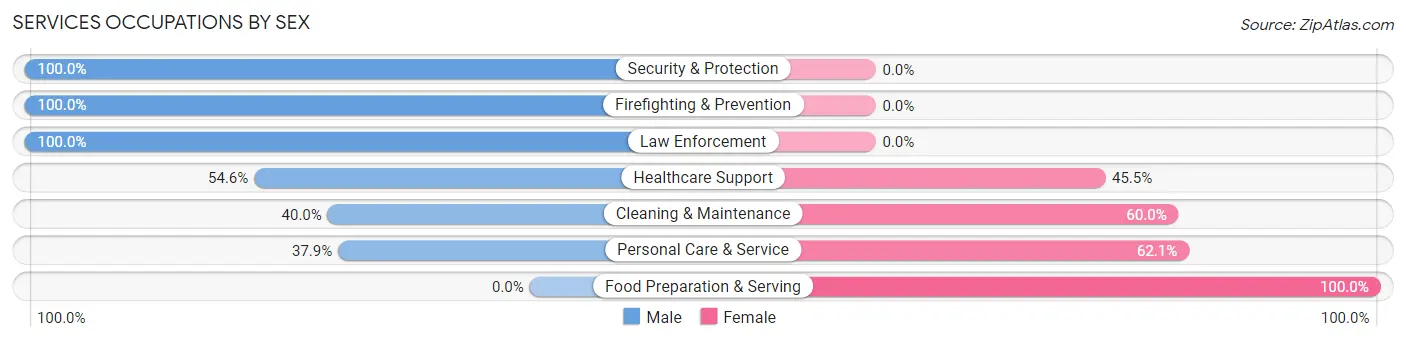
Services Occupations by Sex
Within the Services occupations in Donnellson, the most male-oriented occupations are Security & Protection (100.0%), Firefighting & Prevention (100.0%), and Law Enforcement (100.0%), while the most female-oriented occupations are Food Preparation & Serving (100.0%), Personal Care & Service (62.1%), and Cleaning & Maintenance (60.0%).
| Occupation | Male | Female |
| Healthcare Support | 6 (54.5%) | 5 (45.5%) |
| Security & Protection | 11 (100.0%) | 0 (0.0%) |
| Firefighting & Prevention | 3 (100.0%) | 0 (0.0%) |
| Law Enforcement | 8 (100.0%) | 0 (0.0%) |
| Food Preparation & Serving | 0 (0.0%) | 4 (100.0%) |
| Cleaning & Maintenance | 6 (40.0%) | 9 (60.0%) |
| Personal Care & Service | 11 (37.9%) | 18 (62.1%) |
| Total (Category) | 34 (48.6%) | 36 (51.4%) |
| Total (Overall) | 199 (49.9%) | 200 (50.1%) |
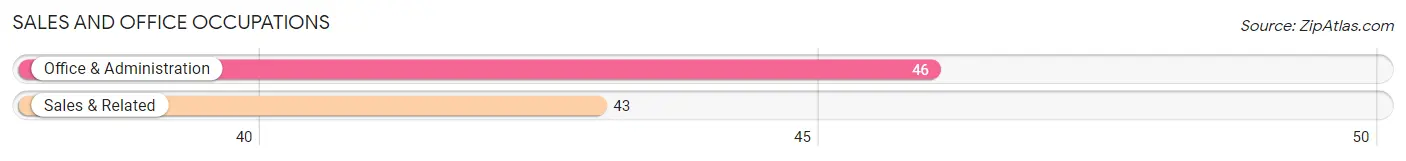
Sales and Office Occupations
The most common Sales and Office occupations in Donnellson are Office & Administration (46 | 11.5%), and Sales & Related (43 | 10.8%).
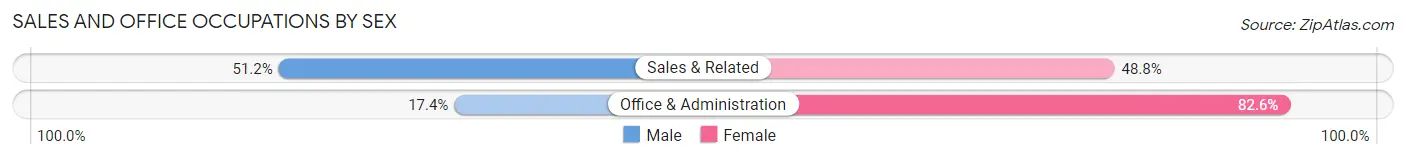
Sales and Office Occupations by Sex
| Occupation | Male | Female |
| Sales & Related | 22 (51.2%) | 21 (48.8%) |
| Office & Administration | 8 (17.4%) | 38 (82.6%) |
| Total (Category) | 30 (33.7%) | 59 (66.3%) |
| Total (Overall) | 199 (49.9%) | 200 (50.1%) |
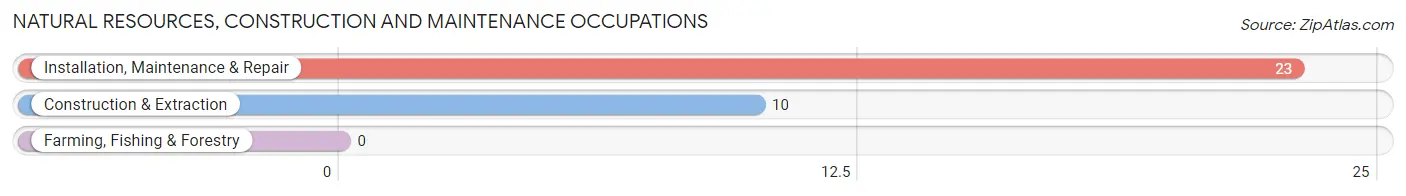
Natural Resources, Construction and Maintenance Occupations
The most common Natural Resources, Construction and Maintenance occupations in Donnellson are Installation, Maintenance & Repair (23 | 5.8%), and Construction & Extraction (10 | 2.5%).
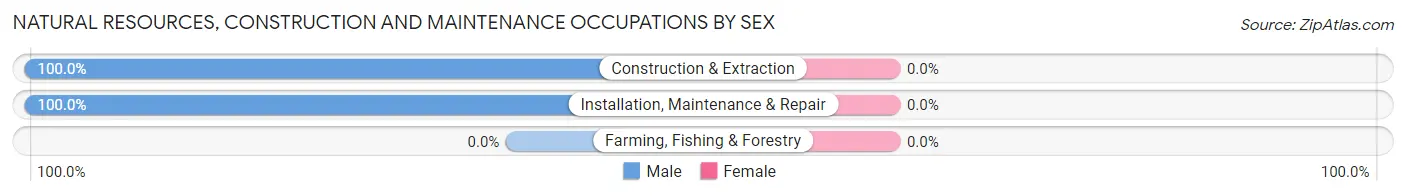
Natural Resources, Construction and Maintenance Occupations by Sex
| Occupation | Male | Female |
| Farming, Fishing & Forestry | 0 (0.0%) | 0 (0.0%) |
| Construction & Extraction | 10 (100.0%) | 0 (0.0%) |
| Installation, Maintenance & Repair | 23 (100.0%) | 0 (0.0%) |
| Total (Category) | 33 (100.0%) | 0 (0.0%) |
| Total (Overall) | 199 (49.9%) | 200 (50.1%) |
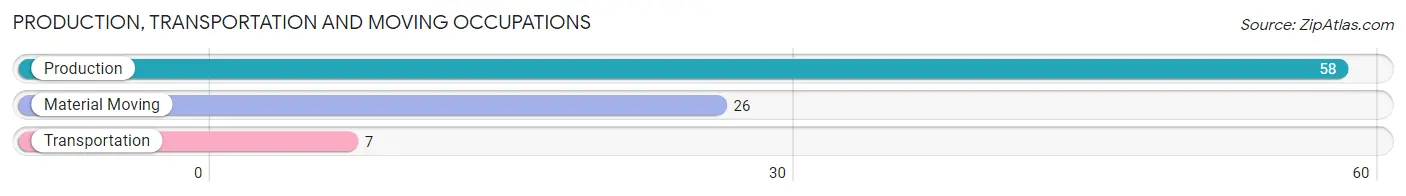
Production, Transportation and Moving Occupations
The most common Production, Transportation and Moving occupations in Donnellson are Production (58 | 14.5%), Material Moving (26 | 6.5%), and Transportation (7 | 1.8%).
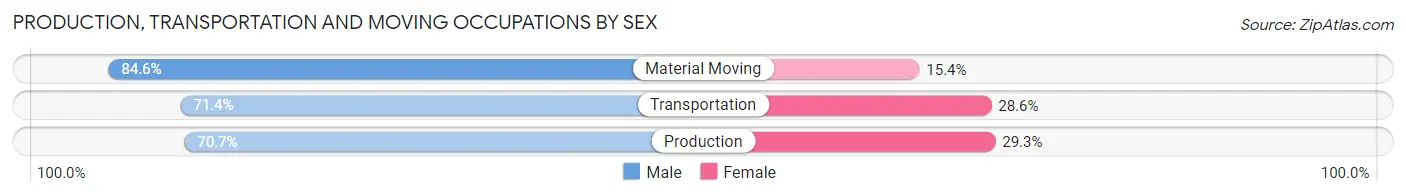
Production, Transportation and Moving Occupations by Sex
| Occupation | Male | Female |
| Production | 41 (70.7%) | 17 (29.3%) |
| Transportation | 5 (71.4%) | 2 (28.6%) |
| Material Moving | 22 (84.6%) | 4 (15.4%) |
| Total (Category) | 68 (74.7%) | 23 (25.3%) |
| Total (Overall) | 199 (49.9%) | 200 (50.1%) |
Employment Industries by Sex in Donnellson
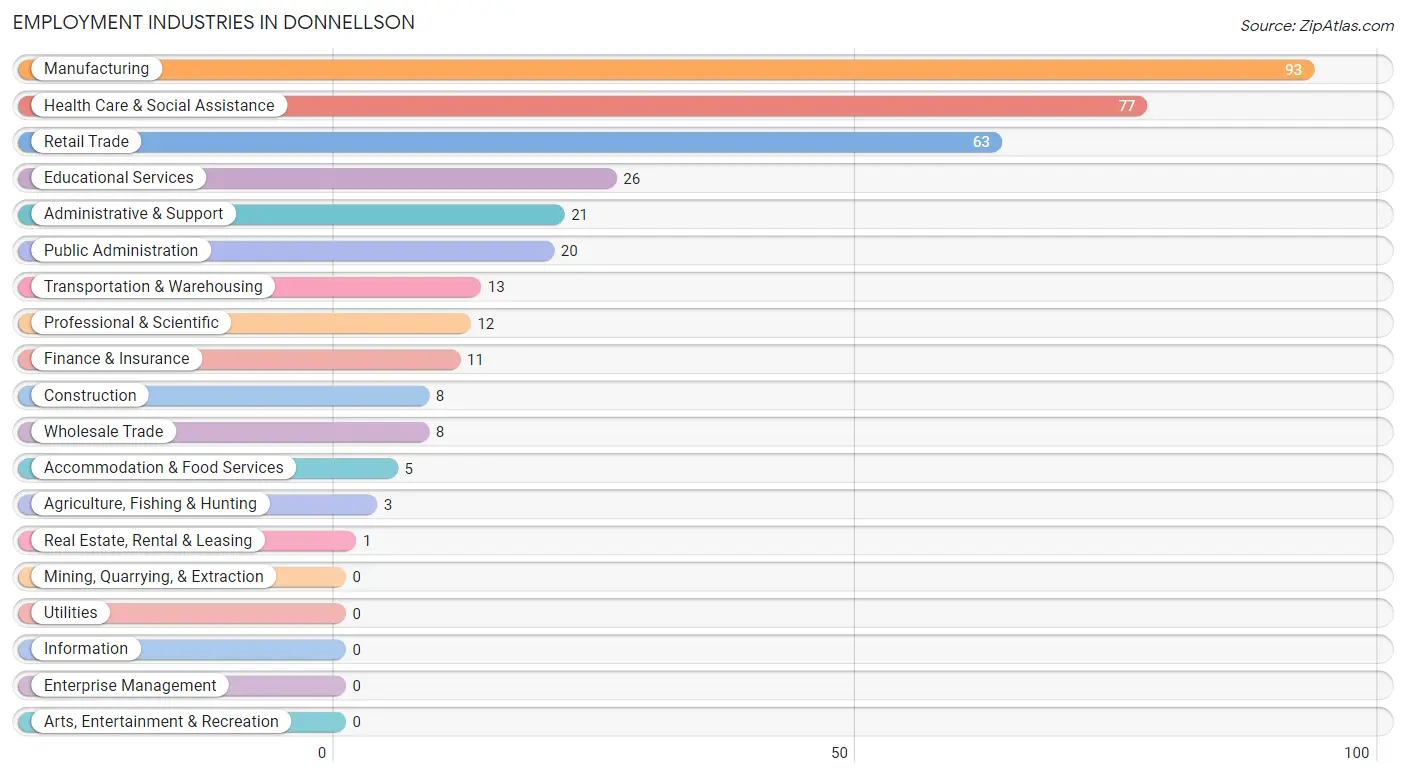
Employment Industries in Donnellson
The major employment industries in Donnellson include Manufacturing (93 | 23.3%), Health Care & Social Assistance (77 | 19.3%), Retail Trade (63 | 15.8%), Educational Services (26 | 6.5%), and Administrative & Support (21 | 5.3%).
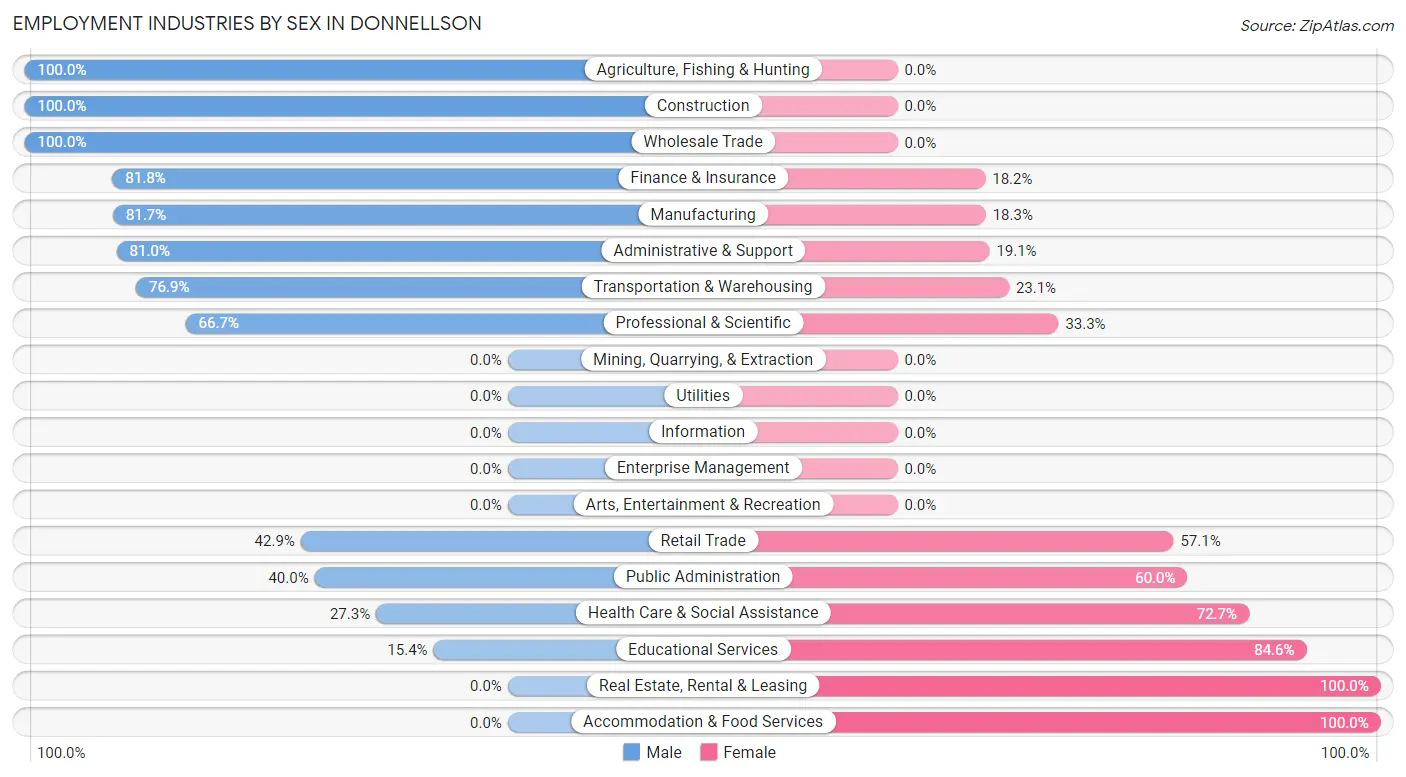
Employment Industries by Sex in Donnellson
The Donnellson industries that see more men than women are Agriculture, Fishing & Hunting (100.0%), Construction (100.0%), and Wholesale Trade (100.0%), whereas the industries that tend to have a higher number of women are Real Estate, Rental & Leasing (100.0%), Accommodation & Food Services (100.0%), and Educational Services (84.6%).
| Industry | Male | Female |
| Agriculture, Fishing & Hunting | 3 (100.0%) | 0 (0.0%) |
| Mining, Quarrying, & Extraction | 0 (0.0%) | 0 (0.0%) |
| Construction | 8 (100.0%) | 0 (0.0%) |
| Manufacturing | 76 (81.7%) | 17 (18.3%) |
| Wholesale Trade | 8 (100.0%) | 0 (0.0%) |
| Retail Trade | 27 (42.9%) | 36 (57.1%) |
| Transportation & Warehousing | 10 (76.9%) | 3 (23.1%) |
| Utilities | 0 (0.0%) | 0 (0.0%) |
| Information | 0 (0.0%) | 0 (0.0%) |
| Finance & Insurance | 9 (81.8%) | 2 (18.2%) |
| Real Estate, Rental & Leasing | 0 (0.0%) | 1 (100.0%) |
| Professional & Scientific | 8 (66.7%) | 4 (33.3%) |
| Enterprise Management | 0 (0.0%) | 0 (0.0%) |
| Administrative & Support | 17 (80.9%) | 4 (19.1%) |
| Educational Services | 4 (15.4%) | 22 (84.6%) |
| Health Care & Social Assistance | 21 (27.3%) | 56 (72.7%) |
| Arts, Entertainment & Recreation | 0 (0.0%) | 0 (0.0%) |
| Accommodation & Food Services | 0 (0.0%) | 5 (100.0%) |
| Public Administration | 8 (40.0%) | 12 (60.0%) |
| Total | 199 (49.9%) | 200 (50.1%) |
Education in Donnellson
School Enrollment in Donnellson
The most common levels of schooling among the 232 students in Donnellson are elementary school (67 | 28.9%), middle school (61 | 26.3%), and college / undergraduate (44 | 19.0%).
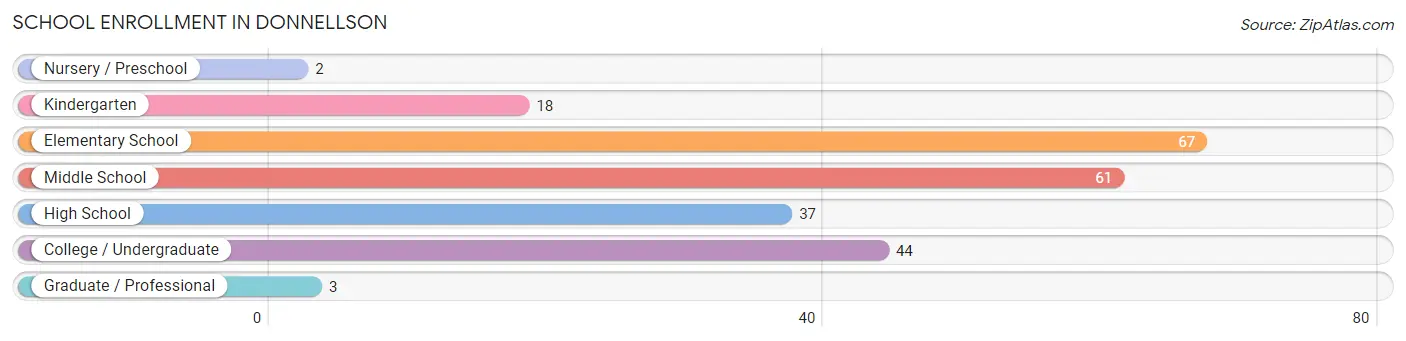
| School Level | # Students | % Students |
| Nursery / Preschool | 2 | 0.9% |
| Kindergarten | 18 | 7.8% |
| Elementary School | 67 | 28.9% |
| Middle School | 61 | 26.3% |
| High School | 37 | 16.0% |
| College / Undergraduate | 44 | 19.0% |
| Graduate / Professional | 3 | 1.3% |
| Total | 232 | 100.0% |
School Enrollment by Age by Funding Source in Donnellson
Out of a total of 232 students who are enrolled in schools in Donnellson, 32 (13.8%) attend a private institution, while the remaining 200 (86.2%) are enrolled in public schools. The age group of 25 to 34 year olds has the highest likelihood of being enrolled in private schools, with 13 (86.7% in the age bracket) enrolled. Conversely, the age group of 3 to 4 year olds has the lowest likelihood of being enrolled in a private school, with 2 (100.0% in the age bracket) attending a public institution.
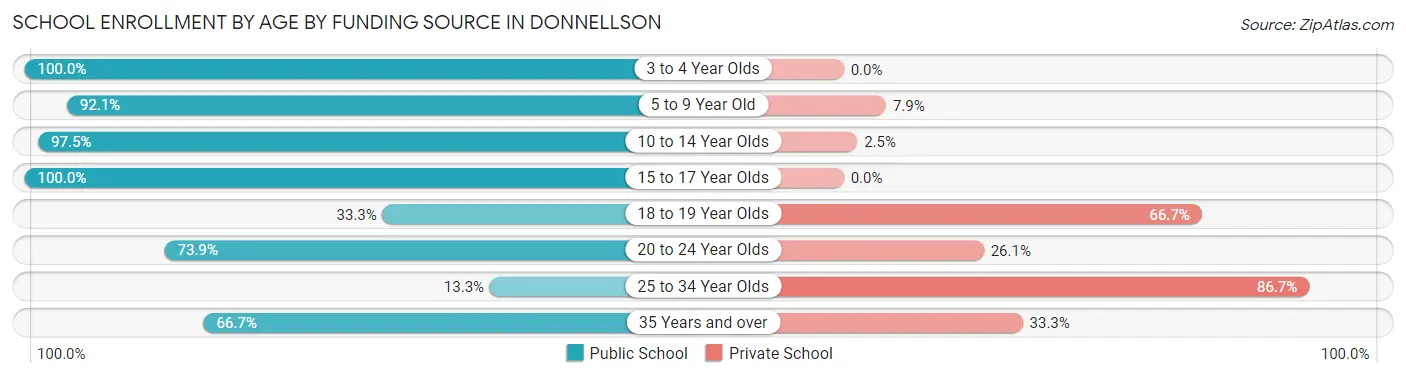
| Age Bracket | Public School | Private School |
| 3 to 4 Year Olds | 2 (100.0%) | 0 (0.0%) |
| 5 to 9 Year Old | 70 (92.1%) | 6 (7.9%) |
| 10 to 14 Year Olds | 77 (97.5%) | 2 (2.5%) |
| 15 to 17 Year Olds | 28 (100.0%) | 0 (0.0%) |
| 18 to 19 Year Olds | 2 (33.3%) | 4 (66.7%) |
| 20 to 24 Year Olds | 17 (73.9%) | 6 (26.1%) |
| 25 to 34 Year Olds | 2 (13.3%) | 13 (86.7%) |
| 35 Years and over | 2 (66.7%) | 1 (33.3%) |
| Total | 200 (86.2%) | 32 (13.8%) |
Educational Attainment by Field of Study in Donnellson
Arts & humanities (32 | 19.9%), business (28 | 17.4%), engineering (18 | 11.2%), communications (18 | 11.2%), and education (17 | 10.6%) are the most common fields of study among 161 individuals in Donnellson who have obtained a bachelor's degree or higher.
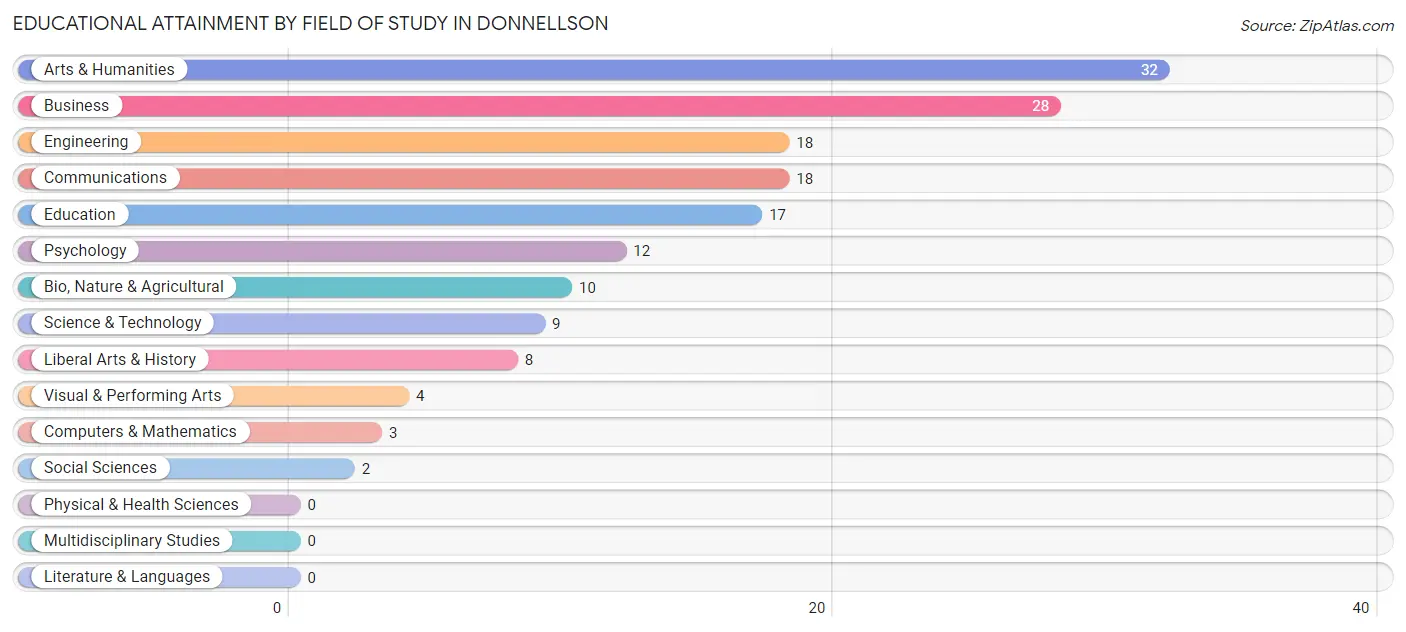
| Field of Study | # Graduates | % Graduates |
| Computers & Mathematics | 3 | 1.9% |
| Bio, Nature & Agricultural | 10 | 6.2% |
| Physical & Health Sciences | 0 | 0.0% |
| Psychology | 12 | 7.4% |
| Social Sciences | 2 | 1.2% |
| Engineering | 18 | 11.2% |
| Multidisciplinary Studies | 0 | 0.0% |
| Science & Technology | 9 | 5.6% |
| Business | 28 | 17.4% |
| Education | 17 | 10.6% |
| Literature & Languages | 0 | 0.0% |
| Liberal Arts & History | 8 | 5.0% |
| Visual & Performing Arts | 4 | 2.5% |
| Communications | 18 | 11.2% |
| Arts & Humanities | 32 | 19.9% |
| Total | 161 | 100.0% |
Transportation & Commute in Donnellson
Vehicle Availability by Sex in Donnellson
The most prevalent vehicle ownership categories in Donnellson are males with 2 vehicles (74, accounting for 38.0%) and females with 2 vehicles (114, making up 37.0%).
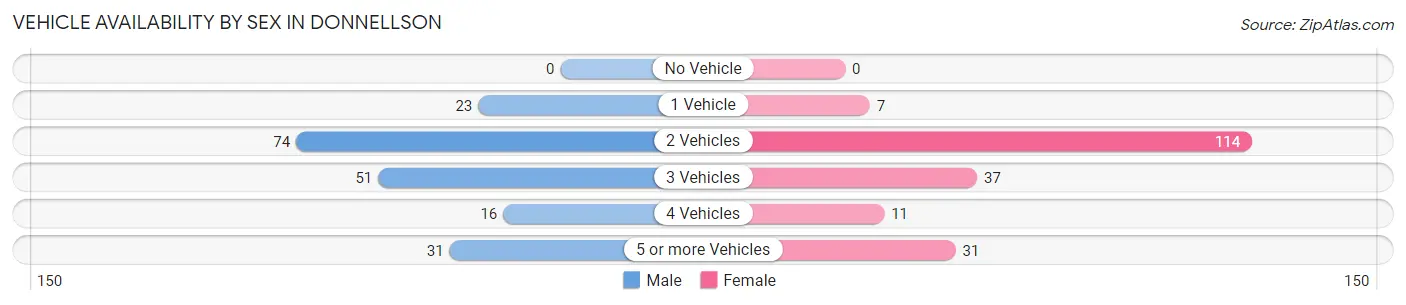
| Vehicles Available | Male | Female |
| No Vehicle | 0 (0.0%) | 0 (0.0%) |
| 1 Vehicle | 23 (11.8%) | 7 (3.5%) |
| 2 Vehicles | 74 (38.0%) | 114 (57.0%) |
| 3 Vehicles | 51 (26.2%) | 37 (18.5%) |
| 4 Vehicles | 16 (8.2%) | 11 (5.5%) |
| 5 or more Vehicles | 31 (15.9%) | 31 (15.5%) |
| Total | 195 (100.0%) | 200 (100.0%) |
Commute Time in Donnellson
The most frequently occuring commute durations in Donnellson are 25 to 29 minutes (102 commuters, 27.1%), 15 to 19 minutes (61 commuters, 16.2%), and 20 to 24 minutes (53 commuters, 14.1%).
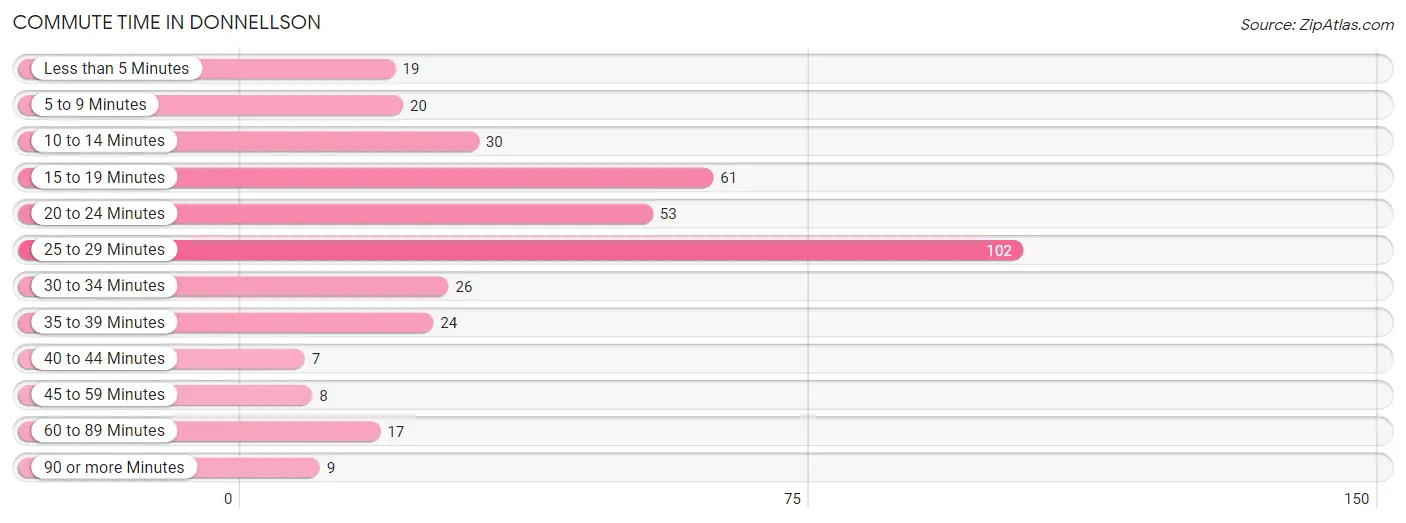
| Commute Time | # Commuters | % Commuters |
| Less than 5 Minutes | 19 | 5.1% |
| 5 to 9 Minutes | 20 | 5.3% |
| 10 to 14 Minutes | 30 | 8.0% |
| 15 to 19 Minutes | 61 | 16.2% |
| 20 to 24 Minutes | 53 | 14.1% |
| 25 to 29 Minutes | 102 | 27.1% |
| 30 to 34 Minutes | 26 | 6.9% |
| 35 to 39 Minutes | 24 | 6.4% |
| 40 to 44 Minutes | 7 | 1.9% |
| 45 to 59 Minutes | 8 | 2.1% |
| 60 to 89 Minutes | 17 | 4.5% |
| 90 or more Minutes | 9 | 2.4% |
Commute Time by Sex in Donnellson
The most common commute times in Donnellson are 15 to 19 minutes (42 commuters, 23.3%) for males and 25 to 29 minutes (74 commuters, 37.8%) for females.
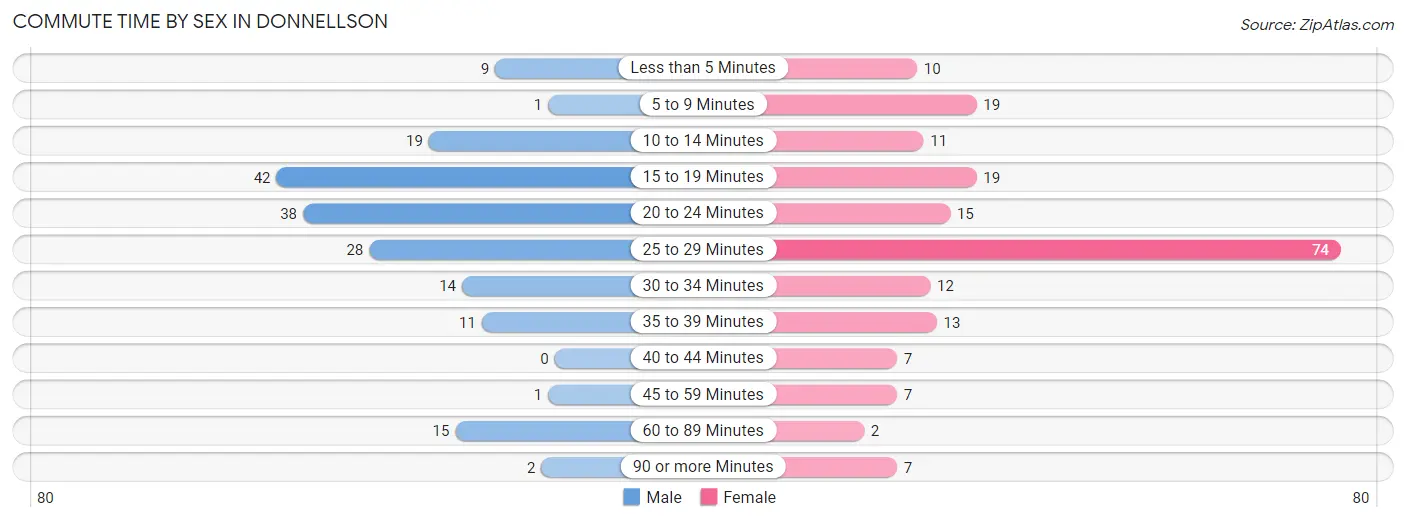
| Commute Time | Male | Female |
| Less than 5 Minutes | 9 (5.0%) | 10 (5.1%) |
| 5 to 9 Minutes | 1 (0.6%) | 19 (9.7%) |
| 10 to 14 Minutes | 19 (10.6%) | 11 (5.6%) |
| 15 to 19 Minutes | 42 (23.3%) | 19 (9.7%) |
| 20 to 24 Minutes | 38 (21.1%) | 15 (7.6%) |
| 25 to 29 Minutes | 28 (15.6%) | 74 (37.8%) |
| 30 to 34 Minutes | 14 (7.8%) | 12 (6.1%) |
| 35 to 39 Minutes | 11 (6.1%) | 13 (6.6%) |
| 40 to 44 Minutes | 0 (0.0%) | 7 (3.6%) |
| 45 to 59 Minutes | 1 (0.6%) | 7 (3.6%) |
| 60 to 89 Minutes | 15 (8.3%) | 2 (1.0%) |
| 90 or more Minutes | 2 (1.1%) | 7 (3.6%) |
Time of Departure to Work by Sex in Donnellson
The most frequent times of departure to work in Donnellson are 12:00 AM to 4:59 AM (29, 16.1%) for males and 5:30 AM to 5:59 AM (30, 15.3%) for females.
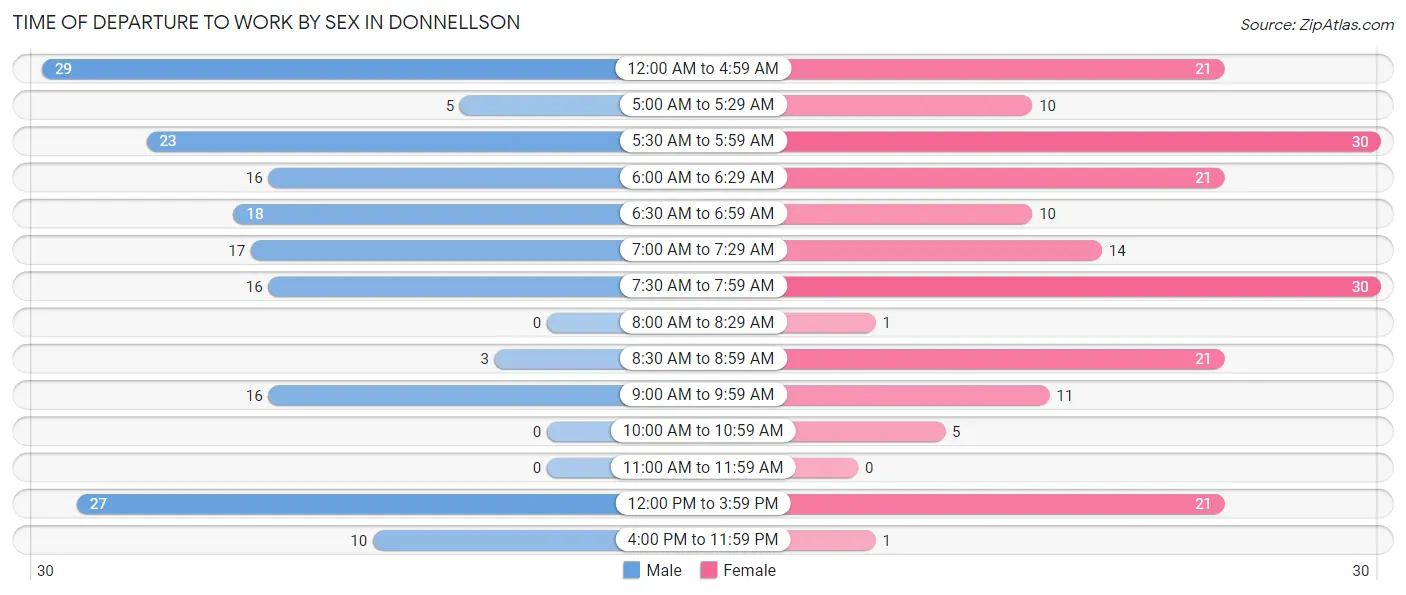
| Time of Departure | Male | Female |
| 12:00 AM to 4:59 AM | 29 (16.1%) | 21 (10.7%) |
| 5:00 AM to 5:29 AM | 5 (2.8%) | 10 (5.1%) |
| 5:30 AM to 5:59 AM | 23 (12.8%) | 30 (15.3%) |
| 6:00 AM to 6:29 AM | 16 (8.9%) | 21 (10.7%) |
| 6:30 AM to 6:59 AM | 18 (10.0%) | 10 (5.1%) |
| 7:00 AM to 7:29 AM | 17 (9.4%) | 14 (7.1%) |
| 7:30 AM to 7:59 AM | 16 (8.9%) | 30 (15.3%) |
| 8:00 AM to 8:29 AM | 0 (0.0%) | 1 (0.5%) |
| 8:30 AM to 8:59 AM | 3 (1.7%) | 21 (10.7%) |
| 9:00 AM to 9:59 AM | 16 (8.9%) | 11 (5.6%) |
| 10:00 AM to 10:59 AM | 0 (0.0%) | 5 (2.5%) |
| 11:00 AM to 11:59 AM | 0 (0.0%) | 0 (0.0%) |
| 12:00 PM to 3:59 PM | 27 (15.0%) | 21 (10.7%) |
| 4:00 PM to 11:59 PM | 10 (5.6%) | 1 (0.5%) |
| Total | 180 (100.0%) | 196 (100.0%) |
Housing Occupancy in Donnellson
Occupancy by Ownership in Donnellson
Of the total 357 dwellings in Donnellson, owner-occupied units account for 259 (72.6%), while renter-occupied units make up 98 (27.5%).
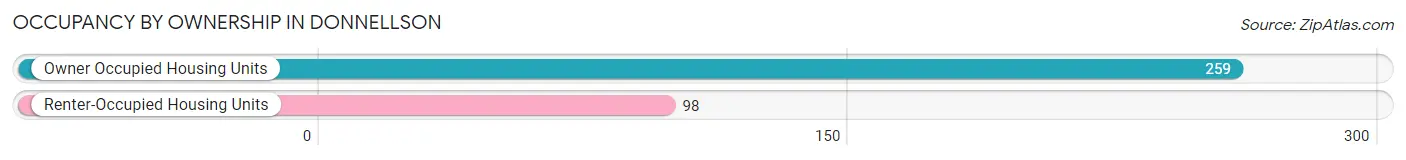
| Occupancy | # Housing Units | % Housing Units |
| Owner Occupied Housing Units | 259 | 72.6% |
| Renter-Occupied Housing Units | 98 | 27.5% |
| Total Occupied Housing Units | 357 | 100.0% |
Occupancy by Household Size in Donnellson
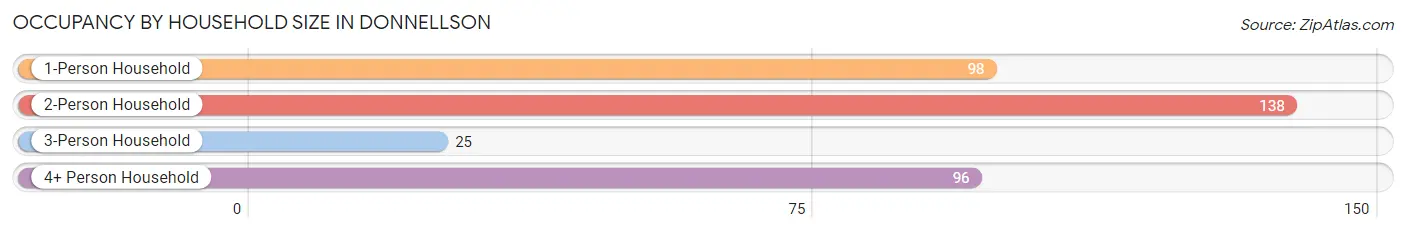
| Household Size | # Housing Units | % Housing Units |
| 1-Person Household | 98 | 27.5% |
| 2-Person Household | 138 | 38.7% |
| 3-Person Household | 25 | 7.0% |
| 4+ Person Household | 96 | 26.9% |
| Total Housing Units | 357 | 100.0% |
Occupancy by Ownership by Household Size in Donnellson
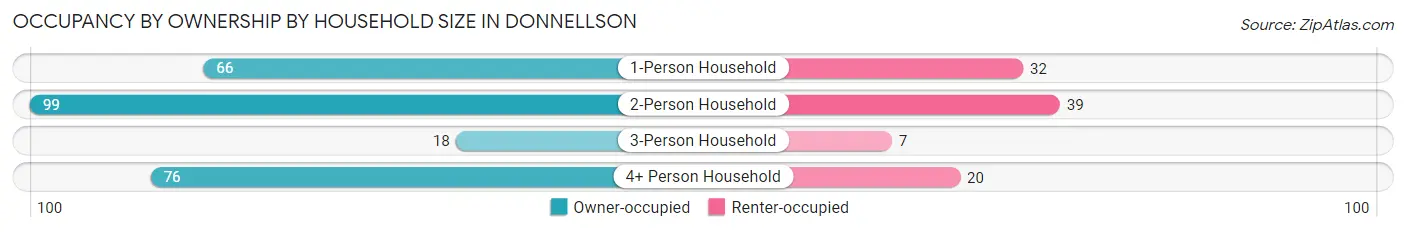
| Household Size | Owner-occupied | Renter-occupied |
| 1-Person Household | 66 (67.3%) | 32 (32.7%) |
| 2-Person Household | 99 (71.7%) | 39 (28.3%) |
| 3-Person Household | 18 (72.0%) | 7 (28.0%) |
| 4+ Person Household | 76 (79.2%) | 20 (20.8%) |
| Total Housing Units | 259 (72.6%) | 98 (27.5%) |
Occupancy by Educational Attainment in Donnellson
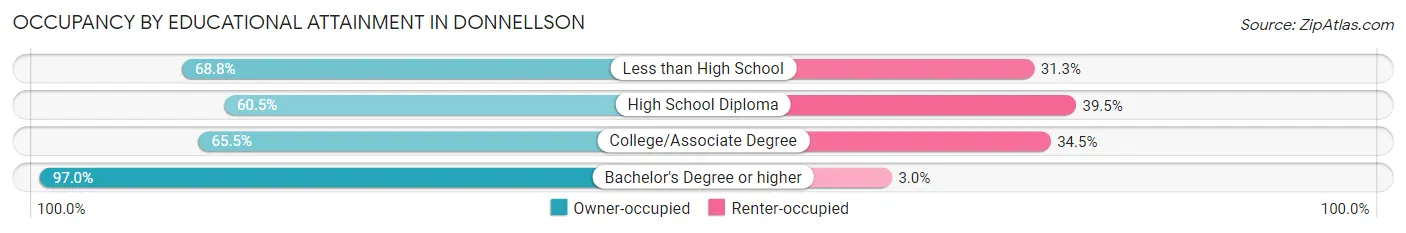
| Household Size | Owner-occupied | Renter-occupied |
| Less than High School | 11 (68.8%) | 5 (31.2%) |
| High School Diploma | 78 (60.5%) | 51 (39.5%) |
| College/Associate Degree | 74 (65.5%) | 39 (34.5%) |
| Bachelor's Degree or higher | 96 (97.0%) | 3 (3.0%) |
Occupancy by Age of Householder in Donnellson
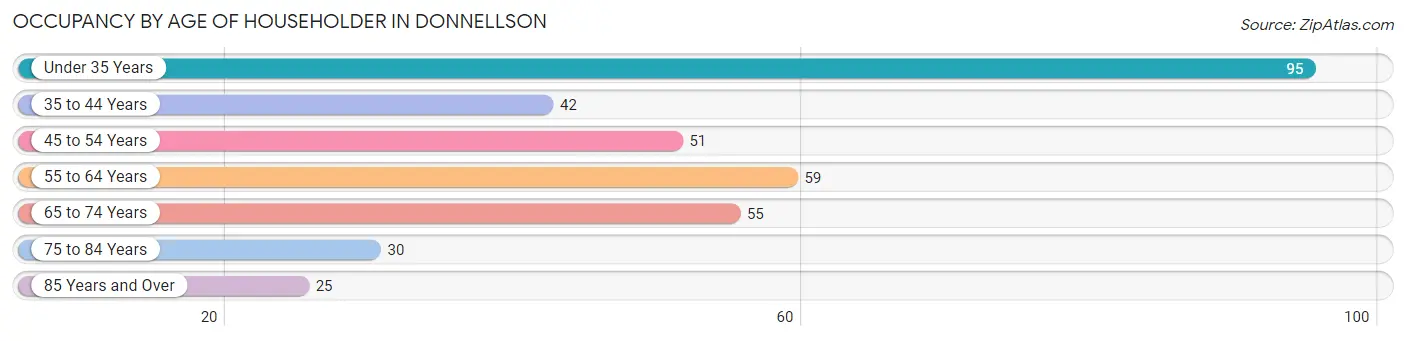
| Age Bracket | # Households | % Households |
| Under 35 Years | 95 | 26.6% |
| 35 to 44 Years | 42 | 11.8% |
| 45 to 54 Years | 51 | 14.3% |
| 55 to 64 Years | 59 | 16.5% |
| 65 to 74 Years | 55 | 15.4% |
| 75 to 84 Years | 30 | 8.4% |
| 85 Years and Over | 25 | 7.0% |
| Total | 357 | 100.0% |
Housing Finances in Donnellson
Median Income by Occupancy in Donnellson
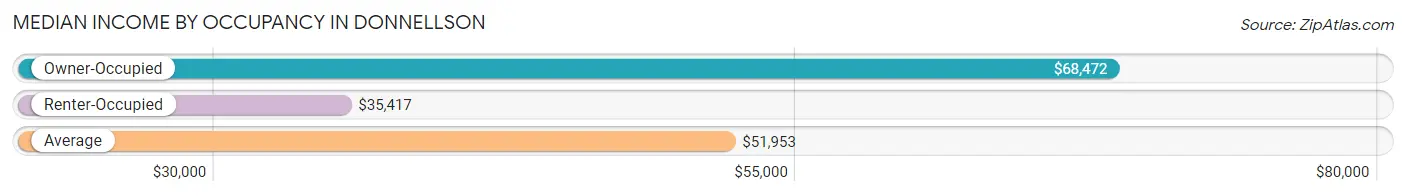
| Occupancy Type | # Households | Median Income |
| Owner-Occupied | 259 (72.6%) | $68,472 |
| Renter-Occupied | 98 (27.5%) | $35,417 |
| Average | 357 (100.0%) | $51,953 |
Occupancy by Householder Income Bracket in Donnellson
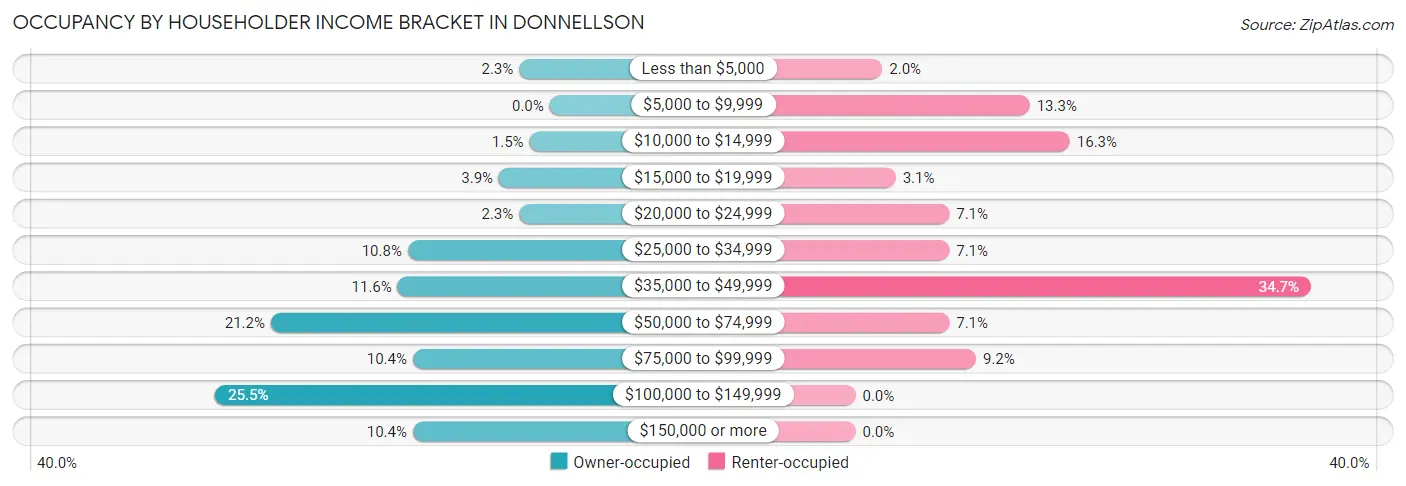
| Income Bracket | Owner-occupied | Renter-occupied |
| Less than $5,000 | 6 (2.3%) | 2 (2.0%) |
| $5,000 to $9,999 | 0 (0.0%) | 13 (13.3%) |
| $10,000 to $14,999 | 4 (1.5%) | 16 (16.3%) |
| $15,000 to $19,999 | 10 (3.9%) | 3 (3.1%) |
| $20,000 to $24,999 | 6 (2.3%) | 7 (7.1%) |
| $25,000 to $34,999 | 28 (10.8%) | 7 (7.1%) |
| $35,000 to $49,999 | 30 (11.6%) | 34 (34.7%) |
| $50,000 to $74,999 | 55 (21.2%) | 7 (7.1%) |
| $75,000 to $99,999 | 27 (10.4%) | 9 (9.2%) |
| $100,000 to $149,999 | 66 (25.5%) | 0 (0.0%) |
| $150,000 or more | 27 (10.4%) | 0 (0.0%) |
| Total | 259 (100.0%) | 98 (100.0%) |
Monthly Housing Cost Tiers in Donnellson
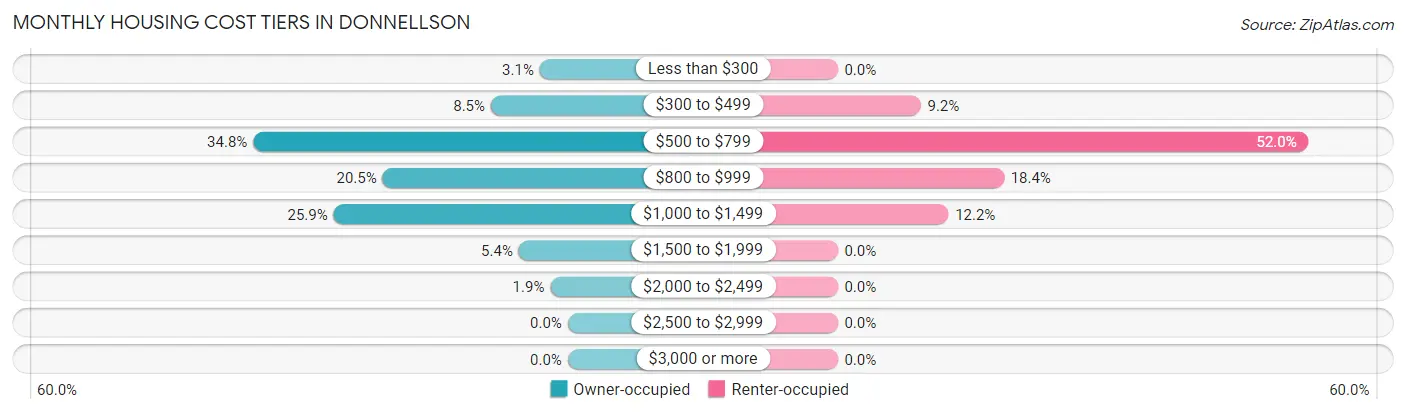
| Monthly Cost | Owner-occupied | Renter-occupied |
| Less than $300 | 8 (3.1%) | 0 (0.0%) |
| $300 to $499 | 22 (8.5%) | 9 (9.2%) |
| $500 to $799 | 90 (34.7%) | 51 (52.0%) |
| $800 to $999 | 53 (20.5%) | 18 (18.4%) |
| $1,000 to $1,499 | 67 (25.9%) | 12 (12.2%) |
| $1,500 to $1,999 | 14 (5.4%) | 0 (0.0%) |
| $2,000 to $2,499 | 5 (1.9%) | 0 (0.0%) |
| $2,500 to $2,999 | 0 (0.0%) | 0 (0.0%) |
| $3,000 or more | 0 (0.0%) | 0 (0.0%) |
| Total | 259 (100.0%) | 98 (100.0%) |
Physical Housing Characteristics in Donnellson
Housing Structures in Donnellson
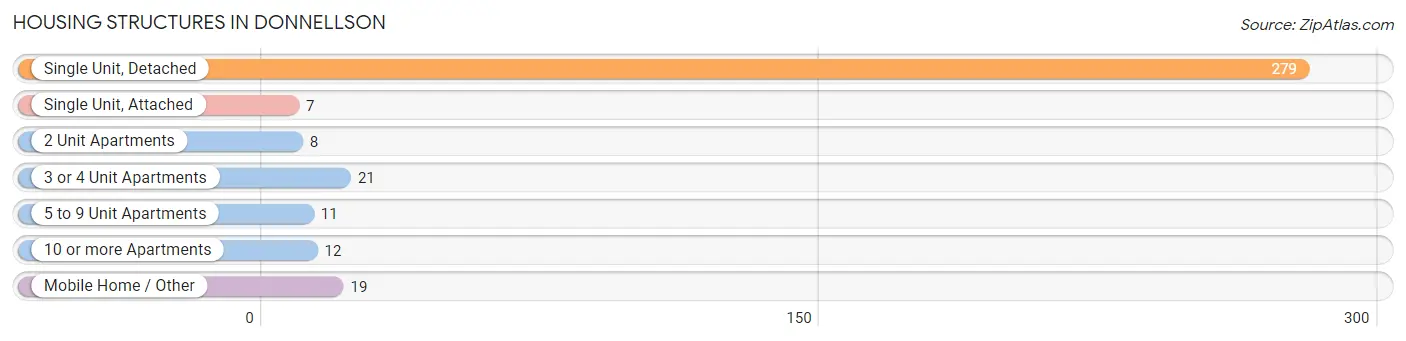
| Structure Type | # Housing Units | % Housing Units |
| Single Unit, Detached | 279 | 78.1% |
| Single Unit, Attached | 7 | 2.0% |
| 2 Unit Apartments | 8 | 2.2% |
| 3 or 4 Unit Apartments | 21 | 5.9% |
| 5 to 9 Unit Apartments | 11 | 3.1% |
| 10 or more Apartments | 12 | 3.4% |
| Mobile Home / Other | 19 | 5.3% |
| Total | 357 | 100.0% |
Housing Structures by Occupancy in Donnellson
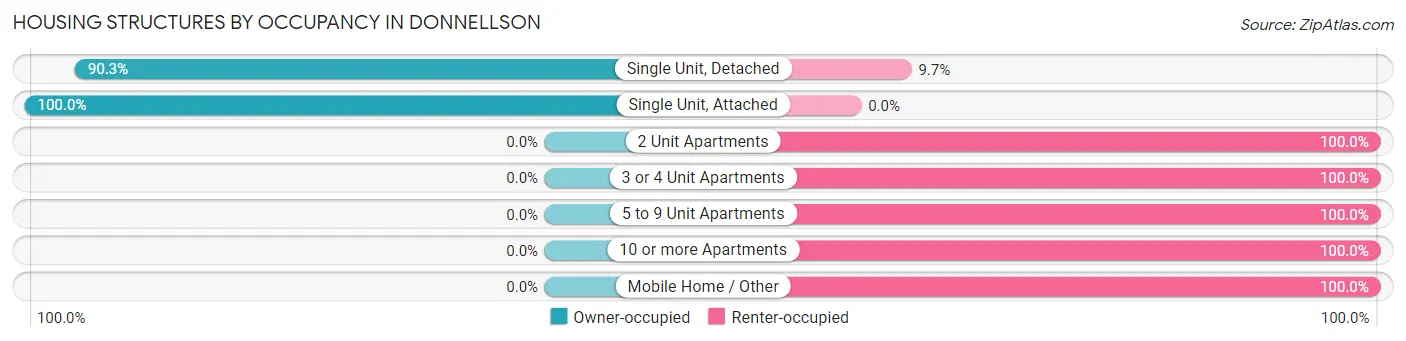
| Structure Type | Owner-occupied | Renter-occupied |
| Single Unit, Detached | 252 (90.3%) | 27 (9.7%) |
| Single Unit, Attached | 7 (100.0%) | 0 (0.0%) |
| 2 Unit Apartments | 0 (0.0%) | 8 (100.0%) |
| 3 or 4 Unit Apartments | 0 (0.0%) | 21 (100.0%) |
| 5 to 9 Unit Apartments | 0 (0.0%) | 11 (100.0%) |
| 10 or more Apartments | 0 (0.0%) | 12 (100.0%) |
| Mobile Home / Other | 0 (0.0%) | 19 (100.0%) |
| Total | 259 (72.6%) | 98 (27.5%) |
Housing Structures by Number of Rooms in Donnellson
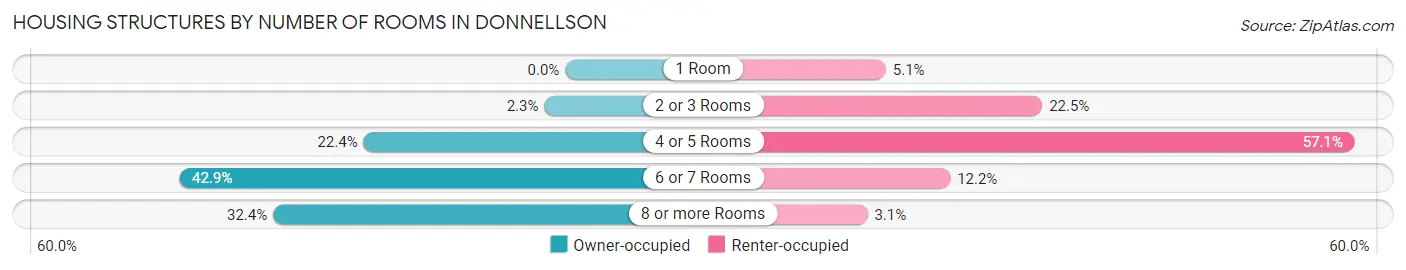
| Number of Rooms | Owner-occupied | Renter-occupied |
| 1 Room | 0 (0.0%) | 5 (5.1%) |
| 2 or 3 Rooms | 6 (2.3%) | 22 (22.5%) |
| 4 or 5 Rooms | 58 (22.4%) | 56 (57.1%) |
| 6 or 7 Rooms | 111 (42.9%) | 12 (12.2%) |
| 8 or more Rooms | 84 (32.4%) | 3 (3.1%) |
| Total | 259 (100.0%) | 98 (100.0%) |
Housing Structure by Heating Type in Donnellson
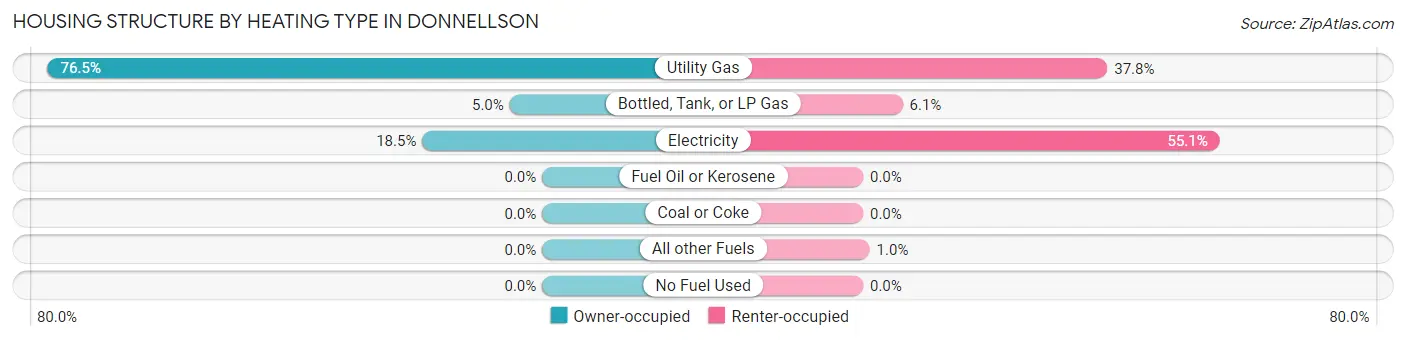
| Heating Type | Owner-occupied | Renter-occupied |
| Utility Gas | 198 (76.4%) | 37 (37.8%) |
| Bottled, Tank, or LP Gas | 13 (5.0%) | 6 (6.1%) |
| Electricity | 48 (18.5%) | 54 (55.1%) |
| Fuel Oil or Kerosene | 0 (0.0%) | 0 (0.0%) |
| Coal or Coke | 0 (0.0%) | 0 (0.0%) |
| All other Fuels | 0 (0.0%) | 1 (1.0%) |
| No Fuel Used | 0 (0.0%) | 0 (0.0%) |
| Total | 259 (100.0%) | 98 (100.0%) |
Household Vehicle Usage in Donnellson
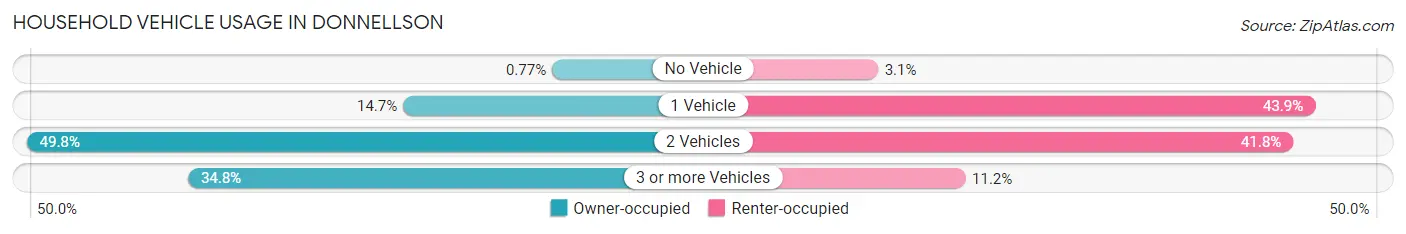
| Vehicles per Household | Owner-occupied | Renter-occupied |
| No Vehicle | 2 (0.8%) | 3 (3.1%) |
| 1 Vehicle | 38 (14.7%) | 43 (43.9%) |
| 2 Vehicles | 129 (49.8%) | 41 (41.8%) |
| 3 or more Vehicles | 90 (34.7%) | 11 (11.2%) |
| Total | 259 (100.0%) | 98 (100.0%) |
Real Estate & Mortgages in Donnellson
Real Estate and Mortgage Overview in Donnellson
| Characteristic | Without Mortgage | With Mortgage |
| Housing Units | 115 | 144 |
| Median Property Value | $122,300 | $130,900 |
| Median Household Income | $57,344 | $17 |
| Monthly Housing Costs | $615 | $0 |
| Real Estate Taxes | $1,607 | $0 |
Property Value by Mortgage Status in Donnellson
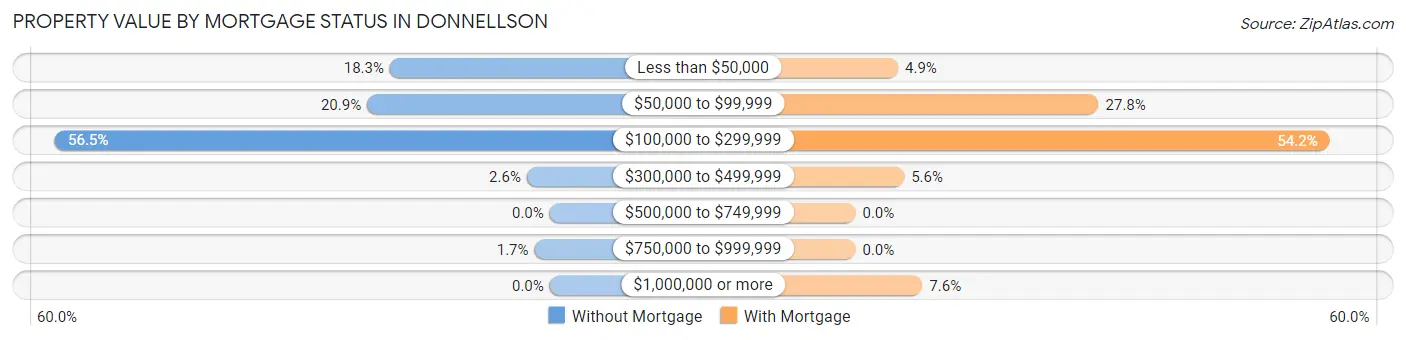
| Property Value | Without Mortgage | With Mortgage |
| Less than $50,000 | 21 (18.3%) | 7 (4.9%) |
| $50,000 to $99,999 | 24 (20.9%) | 40 (27.8%) |
| $100,000 to $299,999 | 65 (56.5%) | 78 (54.2%) |
| $300,000 to $499,999 | 3 (2.6%) | 8 (5.6%) |
| $500,000 to $749,999 | 0 (0.0%) | 0 (0.0%) |
| $750,000 to $999,999 | 2 (1.7%) | 0 (0.0%) |
| $1,000,000 or more | 0 (0.0%) | 11 (7.6%) |
| Total | 115 (100.0%) | 144 (100.0%) |
Household Income by Mortgage Status in Donnellson
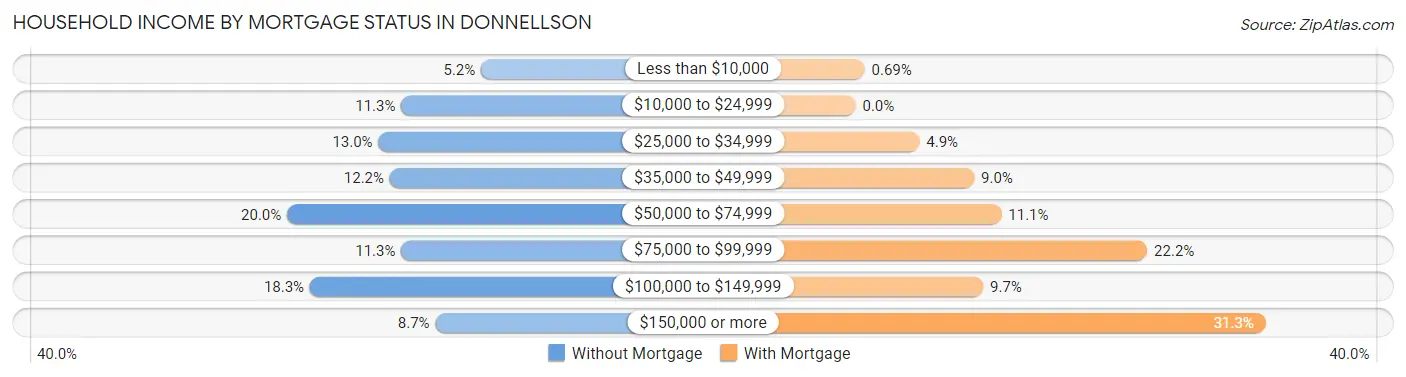
| Household Income | Without Mortgage | With Mortgage |
| Less than $10,000 | 6 (5.2%) | 1 (0.7%) |
| $10,000 to $24,999 | 13 (11.3%) | 0 (0.0%) |
| $25,000 to $34,999 | 15 (13.0%) | 7 (4.9%) |
| $35,000 to $49,999 | 14 (12.2%) | 13 (9.0%) |
| $50,000 to $74,999 | 23 (20.0%) | 16 (11.1%) |
| $75,000 to $99,999 | 13 (11.3%) | 32 (22.2%) |
| $100,000 to $149,999 | 21 (18.3%) | 14 (9.7%) |
| $150,000 or more | 10 (8.7%) | 45 (31.2%) |
| Total | 115 (100.0%) | 144 (100.0%) |
Property Value to Household Income Ratio in Donnellson
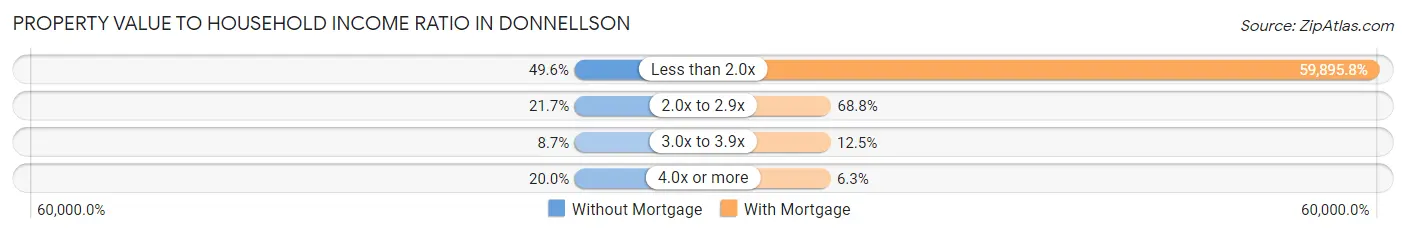
| Value-to-Income Ratio | Without Mortgage | With Mortgage |
| Less than 2.0x | 57 (49.6%) | 86,250 (59,895.8%) |
| 2.0x to 2.9x | 25 (21.7%) | 99 (68.8%) |
| 3.0x to 3.9x | 10 (8.7%) | 18 (12.5%) |
| 4.0x or more | 23 (20.0%) | 9 (6.2%) |
| Total | 115 (100.0%) | 144 (100.0%) |
Real Estate Taxes by Mortgage Status in Donnellson
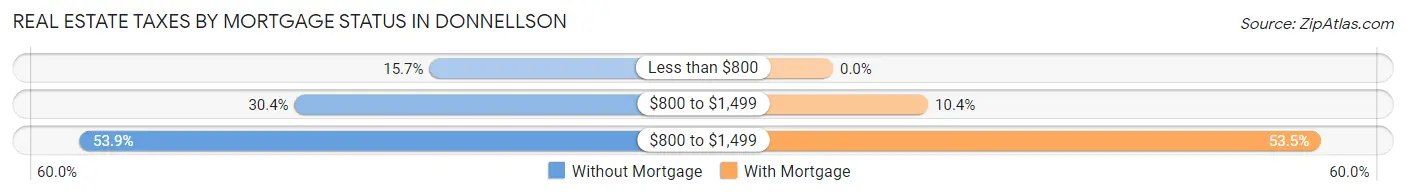
| Property Taxes | Without Mortgage | With Mortgage |
| Less than $800 | 18 (15.7%) | 0 (0.0%) |
| $800 to $1,499 | 35 (30.4%) | 15 (10.4%) |
| $800 to $1,499 | 62 (53.9%) | 77 (53.5%) |
| Total | 115 (100.0%) | 144 (100.0%) |
Health & Disability in Donnellson
Health Insurance Coverage by Age in Donnellson
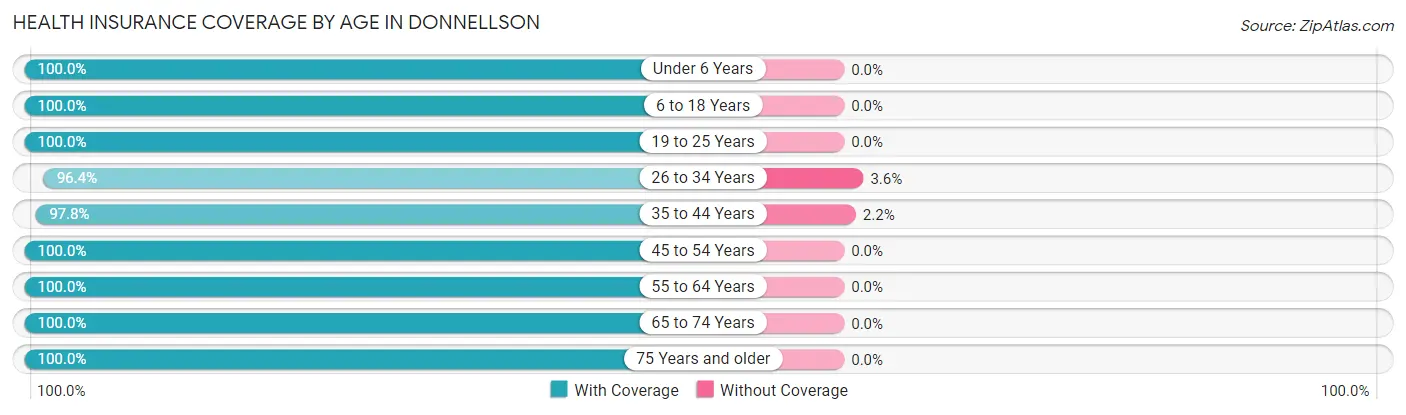
| Age Bracket | With Coverage | Without Coverage |
| Under 6 Years | 84 (100.0%) | 0 (0.0%) |
| 6 to 18 Years | 186 (100.0%) | 0 (0.0%) |
| 19 to 25 Years | 47 (100.0%) | 0 (0.0%) |
| 26 to 34 Years | 135 (96.4%) | 5 (3.6%) |
| 35 to 44 Years | 90 (97.8%) | 2 (2.2%) |
| 45 to 54 Years | 80 (100.0%) | 0 (0.0%) |
| 55 to 64 Years | 88 (100.0%) | 0 (0.0%) |
| 65 to 74 Years | 86 (100.0%) | 0 (0.0%) |
| 75 Years and older | 68 (100.0%) | 0 (0.0%) |
| Total | 864 (99.2%) | 7 (0.8%) |
Health Insurance Coverage by Citizenship Status in Donnellson
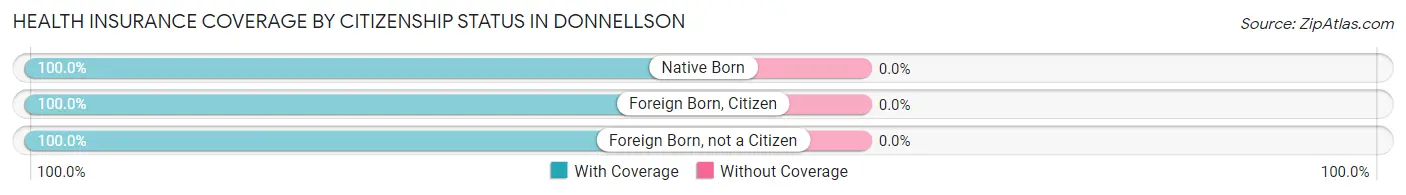
| Citizenship Status | With Coverage | Without Coverage |
| Native Born | 84 (100.0%) | 0 (0.0%) |
| Foreign Born, Citizen | 186 (100.0%) | 0 (0.0%) |
| Foreign Born, not a Citizen | 47 (100.0%) | 0 (0.0%) |
Health Insurance Coverage by Household Income in Donnellson
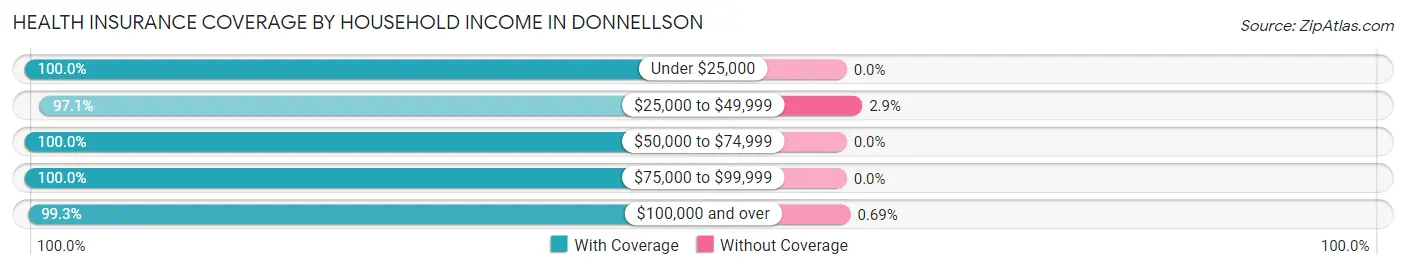
| Household Income | With Coverage | Without Coverage |
| Under $25,000 | 136 (100.0%) | 0 (0.0%) |
| $25,000 to $49,999 | 168 (97.1%) | 5 (2.9%) |
| $50,000 to $74,999 | 163 (100.0%) | 0 (0.0%) |
| $75,000 to $99,999 | 108 (100.0%) | 0 (0.0%) |
| $100,000 and over | 289 (99.3%) | 2 (0.7%) |
Public vs Private Health Insurance Coverage by Age in Donnellson
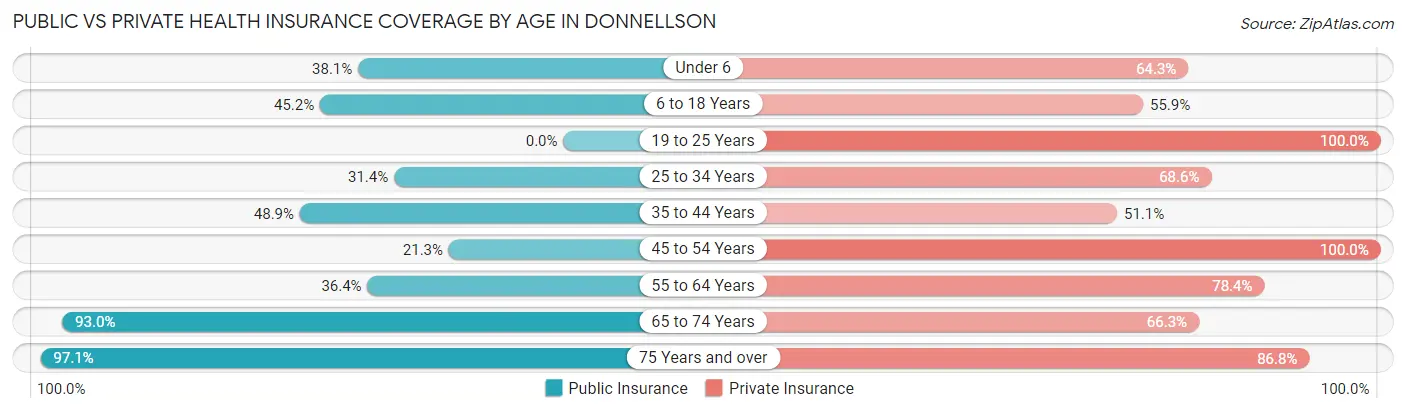
| Age Bracket | Public Insurance | Private Insurance |
| Under 6 | 32 (38.1%) | 54 (64.3%) |
| 6 to 18 Years | 84 (45.2%) | 104 (55.9%) |
| 19 to 25 Years | 0 (0.0%) | 47 (100.0%) |
| 25 to 34 Years | 44 (31.4%) | 96 (68.6%) |
| 35 to 44 Years | 45 (48.9%) | 47 (51.1%) |
| 45 to 54 Years | 17 (21.2%) | 80 (100.0%) |
| 55 to 64 Years | 32 (36.4%) | 69 (78.4%) |
| 65 to 74 Years | 80 (93.0%) | 57 (66.3%) |
| 75 Years and over | 66 (97.1%) | 59 (86.8%) |
| Total | 400 (45.9%) | 613 (70.4%) |
Disability Status by Sex by Age in Donnellson
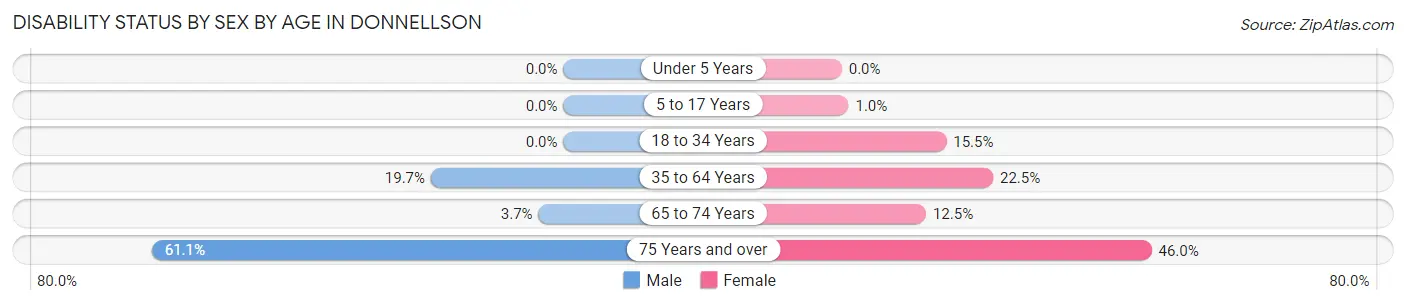
| Age Bracket | Male | Female |
| Under 5 Years | 0 (0.0%) | 0 (0.0%) |
| 5 to 17 Years | 0 (0.0%) | 1 (1.0%) |
| 18 to 34 Years | 0 (0.0%) | 18 (15.5%) |
| 35 to 64 Years | 24 (19.7%) | 31 (22.5%) |
| 65 to 74 Years | 2 (3.7%) | 4 (12.5%) |
| 75 Years and over | 11 (61.1%) | 23 (46.0%) |
Disability Class by Sex by Age in Donnellson
Disability Class: Hearing Difficulty
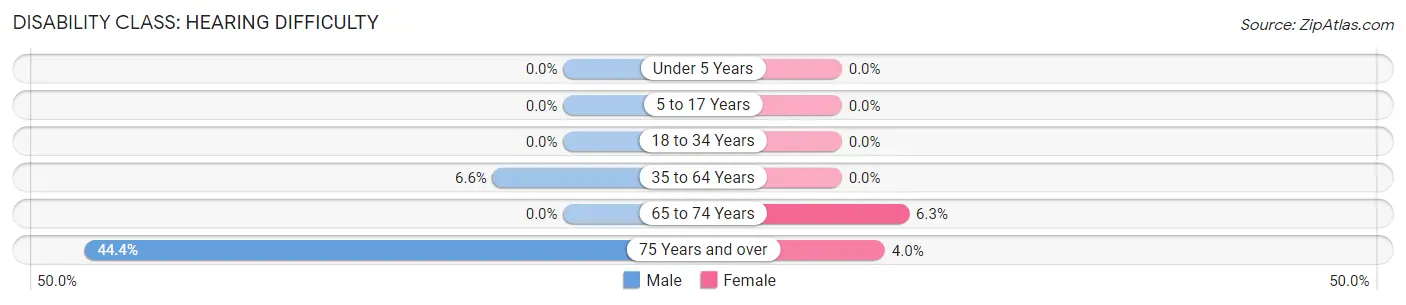
| Age Bracket | Male | Female |
| Under 5 Years | 0 (0.0%) | 0 (0.0%) |
| 5 to 17 Years | 0 (0.0%) | 0 (0.0%) |
| 18 to 34 Years | 0 (0.0%) | 0 (0.0%) |
| 35 to 64 Years | 8 (6.6%) | 0 (0.0%) |
| 65 to 74 Years | 0 (0.0%) | 2 (6.2%) |
| 75 Years and over | 8 (44.4%) | 2 (4.0%) |
Disability Class: Vision Difficulty
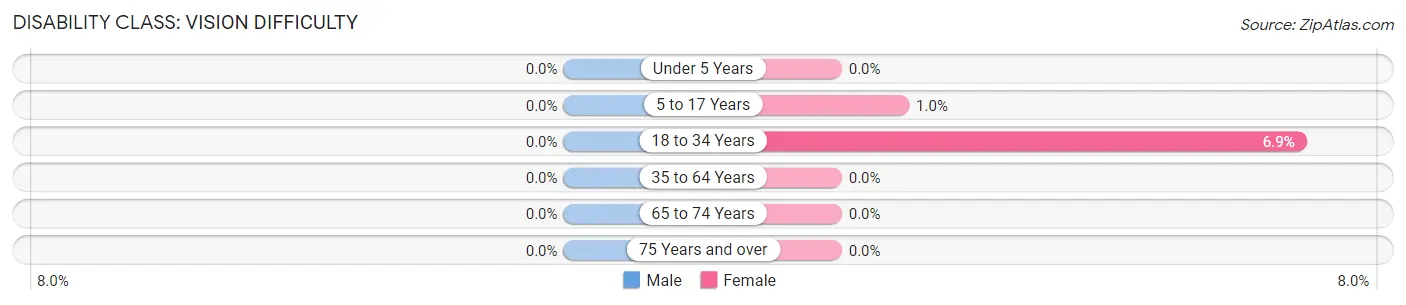
| Age Bracket | Male | Female |
| Under 5 Years | 0 (0.0%) | 0 (0.0%) |
| 5 to 17 Years | 0 (0.0%) | 1 (1.0%) |
| 18 to 34 Years | 0 (0.0%) | 8 (6.9%) |
| 35 to 64 Years | 0 (0.0%) | 0 (0.0%) |
| 65 to 74 Years | 0 (0.0%) | 0 (0.0%) |
| 75 Years and over | 0 (0.0%) | 0 (0.0%) |
Disability Class: Cognitive Difficulty
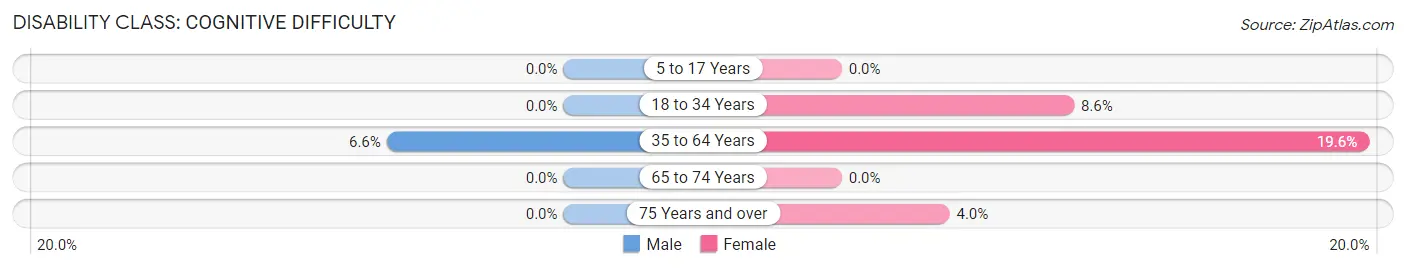
| Age Bracket | Male | Female |
| 5 to 17 Years | 0 (0.0%) | 0 (0.0%) |
| 18 to 34 Years | 0 (0.0%) | 10 (8.6%) |
| 35 to 64 Years | 8 (6.6%) | 27 (19.6%) |
| 65 to 74 Years | 0 (0.0%) | 0 (0.0%) |
| 75 Years and over | 0 (0.0%) | 2 (4.0%) |
Disability Class: Ambulatory Difficulty
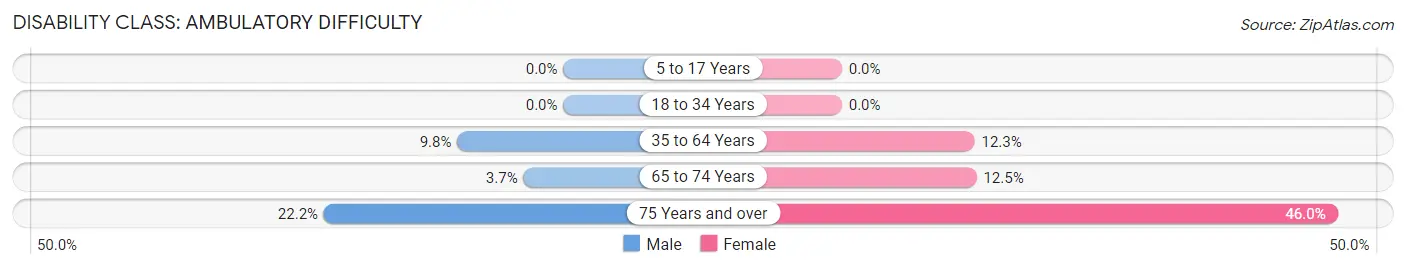
| Age Bracket | Male | Female |
| 5 to 17 Years | 0 (0.0%) | 0 (0.0%) |
| 18 to 34 Years | 0 (0.0%) | 0 (0.0%) |
| 35 to 64 Years | 12 (9.8%) | 17 (12.3%) |
| 65 to 74 Years | 2 (3.7%) | 4 (12.5%) |
| 75 Years and over | 4 (22.2%) | 23 (46.0%) |
Disability Class: Self-Care Difficulty
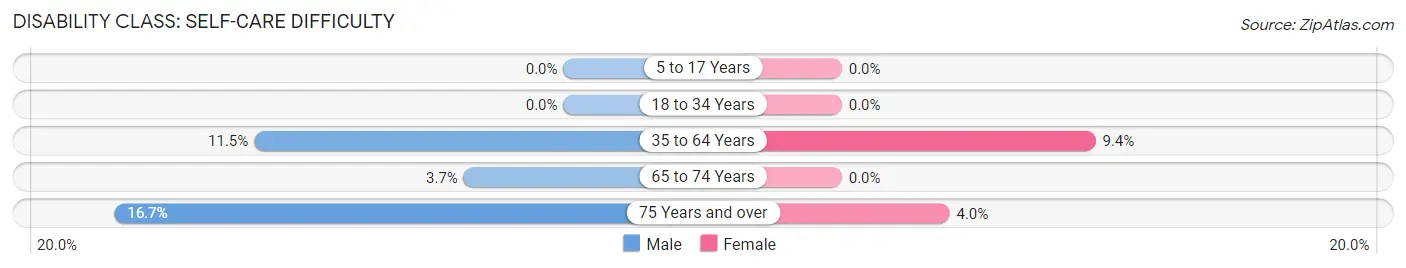
| Age Bracket | Male | Female |
| 5 to 17 Years | 0 (0.0%) | 0 (0.0%) |
| 18 to 34 Years | 0 (0.0%) | 0 (0.0%) |
| 35 to 64 Years | 14 (11.5%) | 13 (9.4%) |
| 65 to 74 Years | 2 (3.7%) | 0 (0.0%) |
| 75 Years and over | 3 (16.7%) | 2 (4.0%) |
Technology Access in Donnellson
Computing Device Access in Donnellson
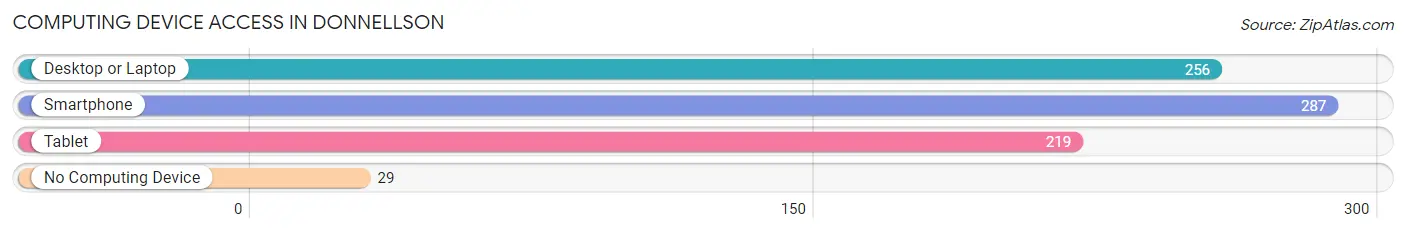
| Device Type | # Households | % Households |
| Desktop or Laptop | 256 | 71.7% |
| Smartphone | 287 | 80.4% |
| Tablet | 219 | 61.3% |
| No Computing Device | 29 | 8.1% |
| Total | 357 | 100.0% |
Internet Access in Donnellson
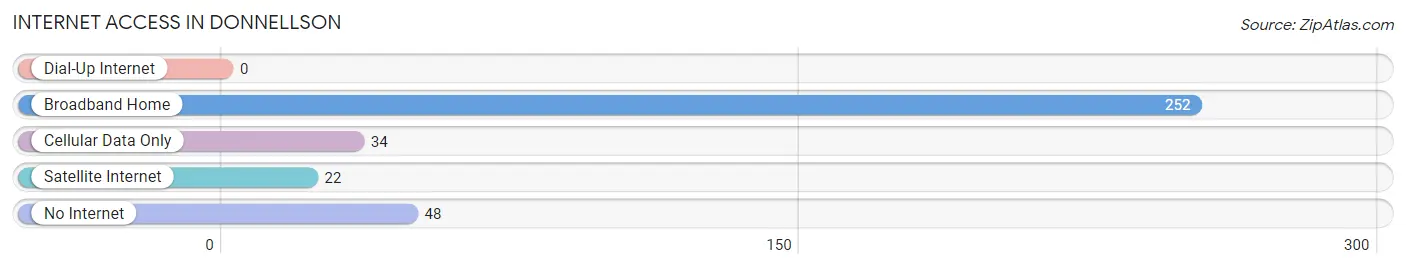
| Internet Type | # Households | % Households |
| Dial-Up Internet | 0 | 0.0% |
| Broadband Home | 252 | 70.6% |
| Cellular Data Only | 34 | 9.5% |
| Satellite Internet | 22 | 6.2% |
| No Internet | 48 | 13.5% |
| Total | 357 | 100.0% |
Donnellson Summary
History
The small town of Donnellson, Iowa is located in Lee County, Iowa, and is part of the Fort Madison-Keokuk, IA-IL Metropolitan Statistical Area. The town was founded in 1837 by William Donnell, who was a veteran of the War of 1812. Donnell was a farmer and a blacksmith, and he named the town after himself. The town was officially incorporated in 1851.
In the late 19th century, Donnellson was a thriving agricultural community. The town was home to several grain elevators, a flour mill, a creamery, and a canning factory. The town also had a railroad station, which was used to transport goods and passengers.
In the early 20th century, Donnellson experienced a period of growth and prosperity. The town was home to several businesses, including a bank, a hotel, a movie theater, and a variety of stores. The town also had a public library, a post office, and a fire department.
In the mid-20th century, Donnellson began to decline. The railroad station closed in the 1950s, and the town’s businesses began to close as well. By the 1970s, the town had become a virtual ghost town.
In the late 20th century, Donnellson began to experience a resurgence. The town was revitalized by the construction of a new school, a new library, and a new fire station. The town also began to attract new businesses, including a grocery store, a hardware store, and a restaurant.
Geography
Donnellson is located in Lee County, Iowa, in the southeastern part of the state. The town is situated on the banks of the Des Moines River, and is surrounded by rolling hills and farmland. The town is located approximately 25 miles south of the city of Fort Madison, and is about 90 miles west of the state capital of Des Moines.
The town has a total area of 0.7 square miles, all of which is land. The town has a humid continental climate, with hot, humid summers and cold, snowy winters. The average temperature in the summer is around 75 degrees Fahrenheit, and the average temperature in the winter is around 25 degrees Fahrenheit.
Economy
Donnellson’s economy is largely based on agriculture. The town is home to several grain elevators, and the surrounding area is used for growing corn, soybeans, and other crops. The town also has a few small businesses, including a grocery store, a hardware store, and a restaurant.
The town is also home to a few manufacturing companies, including a furniture factory and a plastics factory. The town is also home to a few small service businesses, including a gas station and a car repair shop.
Demographics
According to the 2010 census, Donnellson had a population of 845 people. The town has a median household income of $41,250, and the median age is 43. The town is predominantly white, with 95.3% of the population identifying as white. The town also has a small Hispanic population, with 2.2% of the population identifying as Hispanic or Latino. The town also has a small African American population, with 0.7% of the population identifying as African American.
Common Questions
What is Per Capita Income in Donnellson?
Per Capita income in Donnellson is $28,274.
What is the Median Family Income in Donnellson?
Median Family Income in Donnellson is $72,500.
What is the Median Household income in Donnellson?
Median Household Income in Donnellson is $51,953.
What is Income or Wage Gap in Donnellson?
Income or Wage Gap in Donnellson is 35.3%.
Women in Donnellson earn 64.7 cents for every dollar earned by a man.
What is Inequality or Gini Index in Donnellson?
Inequality or Gini Index in Donnellson is 0.44.
What is the Total Population of Donnellson?
Total Population of Donnellson is 920.
What is the Total Male Population of Donnellson?
Total Male Population of Donnellson is 411.
What is the Total Female Population of Donnellson?
Total Female Population of Donnellson is 509.
What is the Ratio of Males per 100 Females in Donnellson?
There are 80.75 Males per 100 Females in Donnellson.
What is the Ratio of Females per 100 Males in Donnellson?
There are 123.84 Females per 100 Males in Donnellson.
What is the Median Population Age in Donnellson?
Median Population Age in Donnellson is 35.1 Years.
What is the Average Family Size in Donnellson
Average Family Size in Donnellson is 2.9 People.
What is the Average Household Size in Donnellson
Average Household Size in Donnellson is 2.4 People.
How Large is the Labor Force in Donnellson?
There are 406 People in the Labor Forcein in Donnellson.
What is the Percentage of People in the Labor Force in Donnellson?
60.2% of People are in the Labor Force in Donnellson.
What is the Unemployment Rate in Donnellson?
Unemployment Rate in Donnellson is 1.7%.