Diagonal, IA Map & Demographics
Diagonal Map
Diagonal Overview
$21,866
PER CAPITA INCOME
$83,322
AVG FAMILY INCOME
$85,000
AVG HOUSEHOLD INCOME
67.7%
WAGE / INCOME GAP [ % ]
32.3¢/ $1
WAGE / INCOME GAP [ $ ]
0.26
INEQUALITY / GINI INDEX
463
TOTAL POPULATION
198
MALE POPULATION
265
FEMALE POPULATION
74.72
MALES / 100 FEMALES
133.84
FEMALES / 100 MALES
51.9
MEDIAN AGE
2.8
AVG FAMILY SIZE
2.5
AVG HOUSEHOLD SIZE
186
LABOR FORCE [ PEOPLE ]
47.8%
PERCENT IN LABOR FORCE
Diagonal Zip Codes
Diagonal Area Codes
Income in Diagonal
Income Overview in Diagonal
Per Capita Income in Diagonal is $21,866, while median incomes of families and households are $83,322 and $85,000 respectively.
| Characteristic | Number | Measure |
| Per Capita Income | 463 | $21,866 |
| Median Family Income | 95 | $83,322 |
| Mean Family Income | 95 | $85,341 |
| Median Household Income | 130 | $85,000 |
| Mean Household Income | 130 | $76,773 |
| Income Deficit | 95 | $0 |
| Wage / Income Gap (%) | 463 | 67.69% |
| Wage / Income Gap ($) | 463 | 32.31¢ per $1 |
| Gini / Inequality Index | 463 | 0.26 |
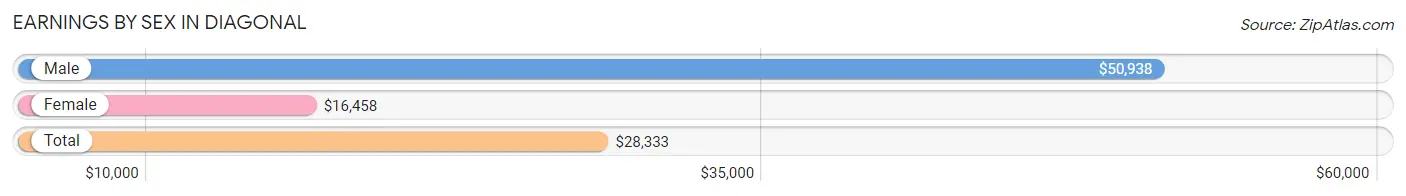
Earnings by Sex in Diagonal
Average Earnings in Diagonal are $28,333, $50,938 for men and $16,458 for women, a difference of 67.7%.
| Sex | Number | Average Earnings |
| Male | 83 (42.8%) | $50,938 |
| Female | 111 (57.2%) | $16,458 |
| Total | 194 (100.0%) | $28,333 |
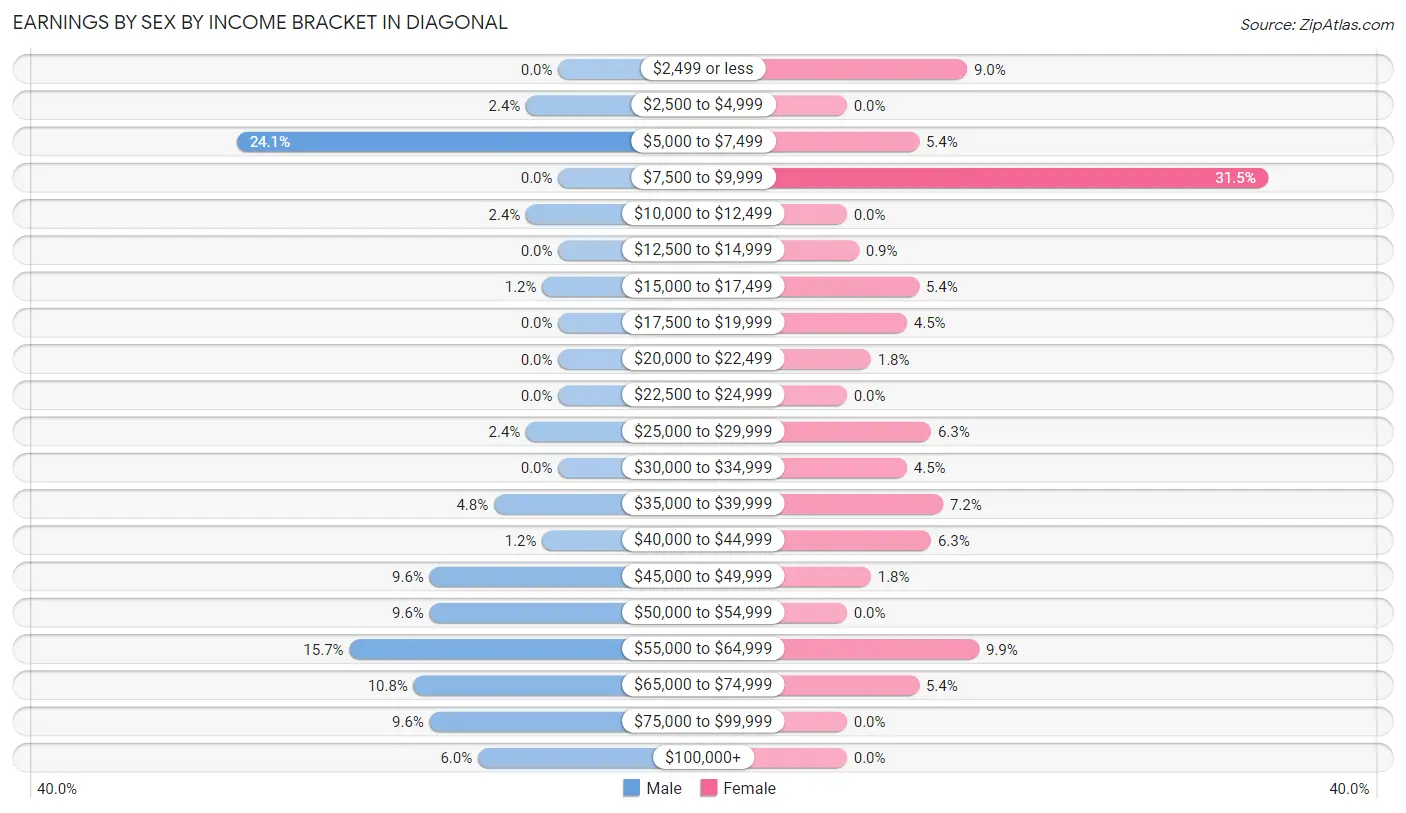
Earnings by Sex by Income Bracket in Diagonal
The most common earnings brackets in Diagonal are $5,000 to $7,499 for men (20 | 24.1%) and $7,500 to $9,999 for women (35 | 31.5%).
| Income | Male | Female |
| $2,499 or less | 0 (0.0%) | 10 (9.0%) |
| $2,500 to $4,999 | 2 (2.4%) | 0 (0.0%) |
| $5,000 to $7,499 | 20 (24.1%) | 6 (5.4%) |
| $7,500 to $9,999 | 0 (0.0%) | 35 (31.5%) |
| $10,000 to $12,499 | 2 (2.4%) | 0 (0.0%) |
| $12,500 to $14,999 | 0 (0.0%) | 1 (0.9%) |
| $15,000 to $17,499 | 1 (1.2%) | 6 (5.4%) |
| $17,500 to $19,999 | 0 (0.0%) | 5 (4.5%) |
| $20,000 to $22,499 | 0 (0.0%) | 2 (1.8%) |
| $22,500 to $24,999 | 0 (0.0%) | 0 (0.0%) |
| $25,000 to $29,999 | 2 (2.4%) | 7 (6.3%) |
| $30,000 to $34,999 | 0 (0.0%) | 5 (4.5%) |
| $35,000 to $39,999 | 4 (4.8%) | 8 (7.2%) |
| $40,000 to $44,999 | 1 (1.2%) | 7 (6.3%) |
| $45,000 to $49,999 | 8 (9.6%) | 2 (1.8%) |
| $50,000 to $54,999 | 8 (9.6%) | 0 (0.0%) |
| $55,000 to $64,999 | 13 (15.7%) | 11 (9.9%) |
| $65,000 to $74,999 | 9 (10.8%) | 6 (5.4%) |
| $75,000 to $99,999 | 8 (9.6%) | 0 (0.0%) |
| $100,000+ | 5 (6.0%) | 0 (0.0%) |
| Total | 83 (100.0%) | 111 (100.0%) |
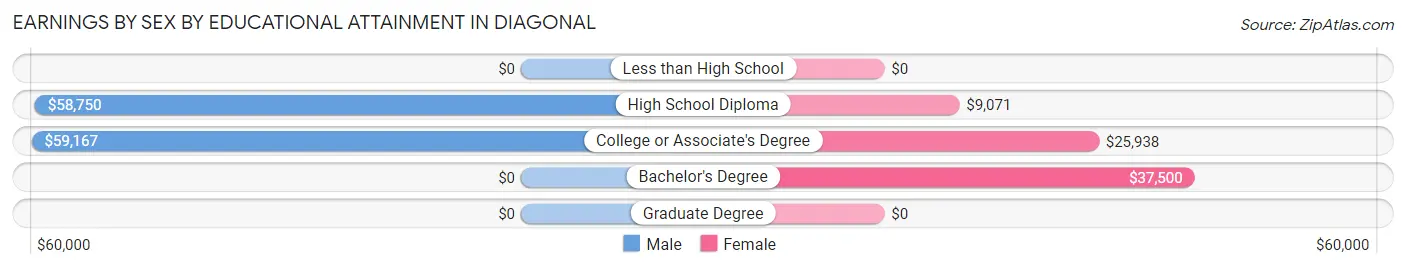
Earnings by Sex by Educational Attainment in Diagonal
Average earnings in Diagonal are $59,688 for men and $16,875 for women, a difference of 71.7%. Men with an educational attainment of college or associate's degree enjoy the highest average annual earnings of $59,167, while those with high school diploma education earn the least with $58,750. Women with an educational attainment of bachelor's degree earn the most with the average annual earnings of $37,500, while those with high school diploma education have the smallest earnings of $9,071.
| Educational Attainment | Male Income | Female Income |
| Less than High School | - | - |
| High School Diploma | $58,750 | $9,071 |
| College or Associate's Degree | $59,167 | $25,938 |
| Bachelor's Degree | - | - |
| Graduate Degree | - | - |
| Total | $59,688 | $16,875 |
Family Income in Diagonal
Family Income Brackets in Diagonal
According to the Diagonal family income data, there are 55 families falling into the $75,000 to $99,999 income range, which is the most common income bracket and makes up 57.9% of all families.
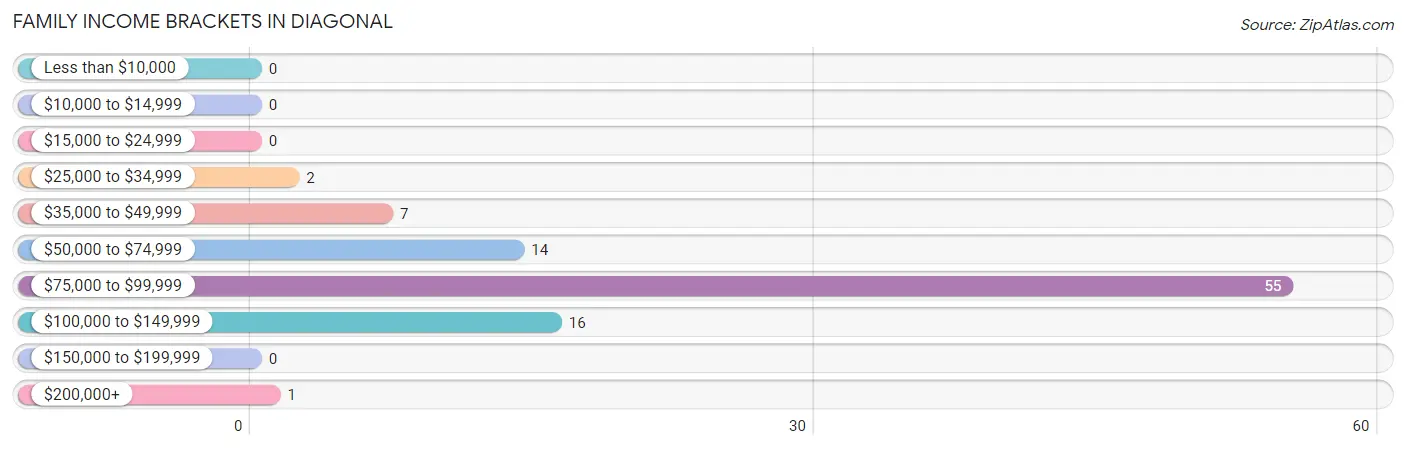
| Income Bracket | # Families | % Families |
| Less than $10,000 | 0 | 0.0% |
| $10,000 to $14,999 | 0 | 0.0% |
| $15,000 to $24,999 | 0 | 0.0% |
| $25,000 to $34,999 | 2 | 2.1% |
| $35,000 to $49,999 | 7 | 7.4% |
| $50,000 to $74,999 | 14 | 14.7% |
| $75,000 to $99,999 | 55 | 57.9% |
| $100,000 to $149,999 | 16 | 16.8% |
| $150,000 to $199,999 | 0 | 0.0% |
| $200,000+ | 1 | 1.1% |
Family Income by Famaliy Size in Diagonal
3-person families (9 | 9.5%) account for the highest median family income in Diagonal with $110,625 per family, while 2-person families (29 | 30.5%) have the highest median income of $38,840 per family member.
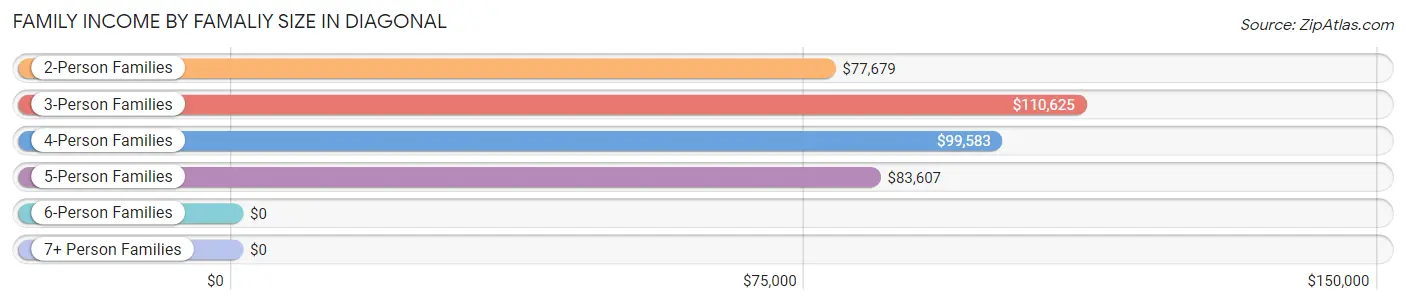
| Income Bracket | # Families | Median Income |
| 2-Person Families | 29 (30.5%) | $77,679 |
| 3-Person Families | 9 (9.5%) | $110,625 |
| 4-Person Families | 15 (15.8%) | $99,583 |
| 5-Person Families | 39 (41.0%) | $83,607 |
| 6-Person Families | 3 (3.2%) | $0 |
| 7+ Person Families | 0 (0.0%) | $0 |
| Total | 95 (100.0%) | $83,322 |
Family Income by Number of Earners in Diagonal
The median family income in Diagonal is $83,322, with families comprising 2 earners (26) having the highest median family income of $110,833, while families with no earners (5) have the lowest median family income of $40,625, accounting for 27.4% and 5.3% of families, respectively.
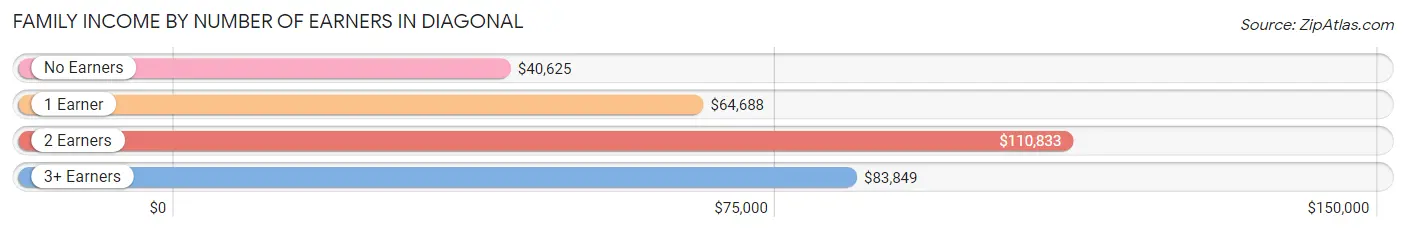
| Number of Earners | # Families | Median Income |
| No Earners | 5 (5.3%) | $40,625 |
| 1 Earner | 23 (24.2%) | $64,688 |
| 2 Earners | 26 (27.4%) | $110,833 |
| 3+ Earners | 41 (43.2%) | $83,849 |
| Total | 95 (100.0%) | $83,322 |
Household Income in Diagonal
Household Income Brackets in Diagonal
With 51 households falling in the category, the $75,000 to $99,999 income range is the most frequent in Diagonal, accounting for 39.2% of all households.
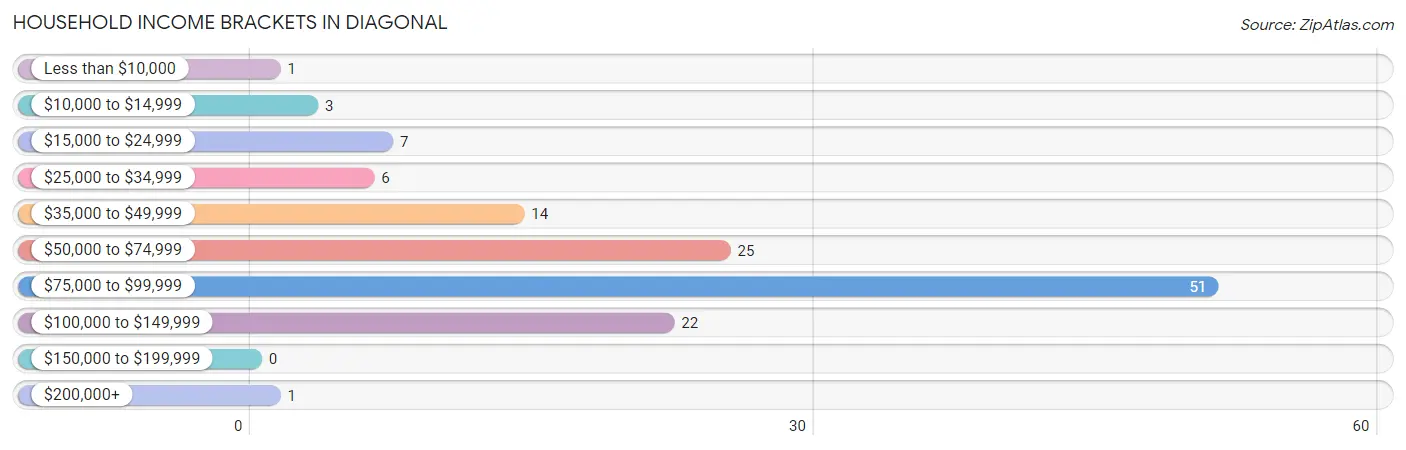
| Income Bracket | # Households | % Households |
| Less than $10,000 | 1 | 0.8% |
| $10,000 to $14,999 | 3 | 2.3% |
| $15,000 to $24,999 | 7 | 5.4% |
| $25,000 to $34,999 | 6 | 4.6% |
| $35,000 to $49,999 | 14 | 10.8% |
| $50,000 to $74,999 | 25 | 19.2% |
| $75,000 to $99,999 | 51 | 39.2% |
| $100,000 to $149,999 | 22 | 16.9% |
| $150,000 to $199,999 | 0 | 0.0% |
| $200,000+ | 1 | 0.8% |
Household Income by Householder Age in Diagonal
The median household income in Diagonal is $85,000, with the highest median household income of $85,714 found in the 45 to 64 years age bracket for the primary householder. A total of 64 households (49.2%) fall into this category. Meanwhile, the 15 to 24 years age bracket for the primary householder has the lowest median household income of $0, with 6 households (4.6%) in this group.
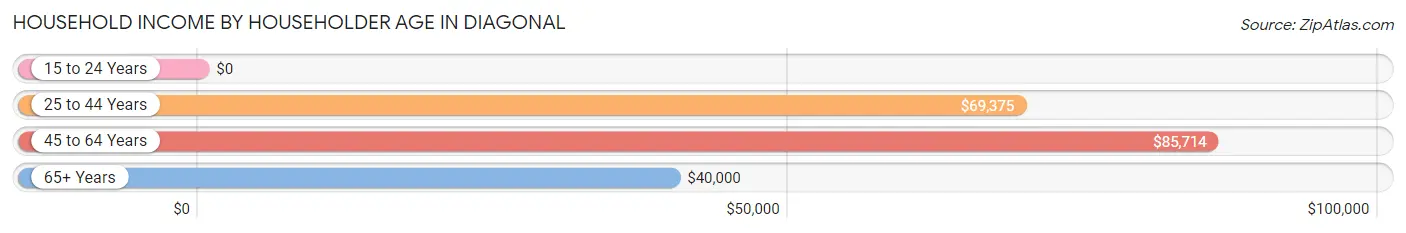
| Income Bracket | # Households | Median Income |
| 15 to 24 Years | 6 (4.6%) | $0 |
| 25 to 44 Years | 32 (24.6%) | $69,375 |
| 45 to 64 Years | 64 (49.2%) | $85,714 |
| 65+ Years | 28 (21.5%) | $40,000 |
| Total | 130 (100.0%) | $85,000 |
Poverty in Diagonal
Income Below Poverty by Sex and Age in Diagonal
With 4.9% poverty level for males and 9.8% for females among the residents of Diagonal, 25 to 34 year old males and 16 and 17 year old females are the most vulnerable to poverty, with 6 males (30.0%) and 12 females (66.7%) in their respective age groups living below the poverty level.
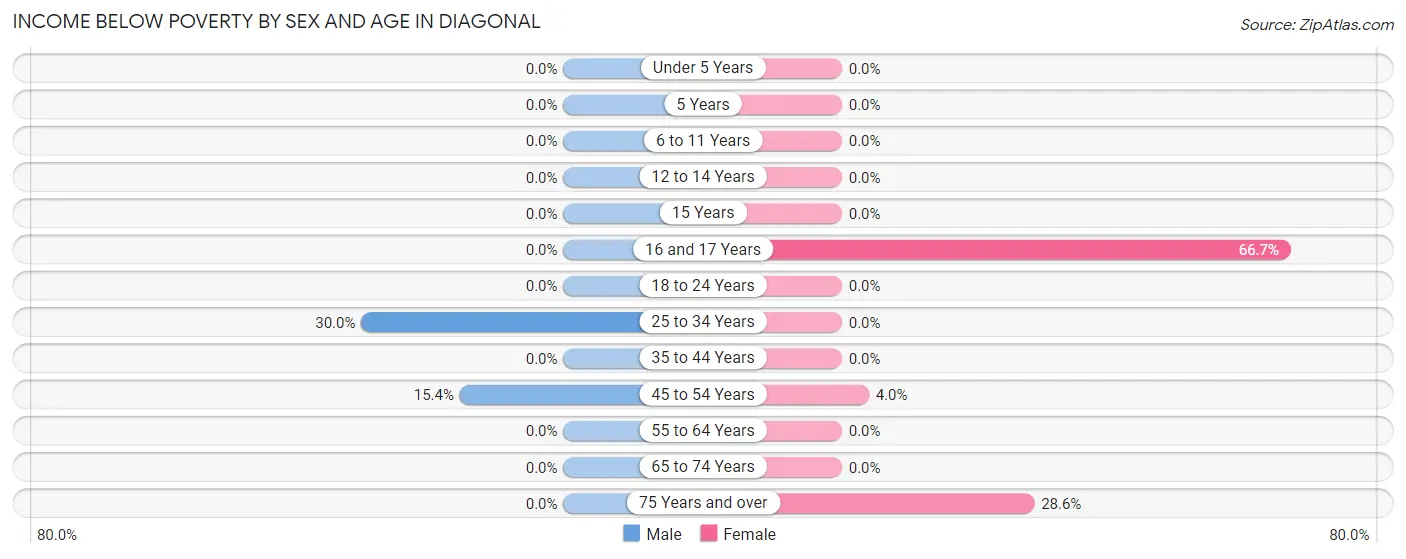
| Age Bracket | Male | Female |
| Under 5 Years | 0 (0.0%) | 0 (0.0%) |
| 5 Years | 0 (0.0%) | 0 (0.0%) |
| 6 to 11 Years | 0 (0.0%) | 0 (0.0%) |
| 12 to 14 Years | 0 (0.0%) | 0 (0.0%) |
| 15 Years | 0 (0.0%) | 0 (0.0%) |
| 16 and 17 Years | 0 (0.0%) | 12 (66.7%) |
| 18 to 24 Years | 0 (0.0%) | 0 (0.0%) |
| 25 to 34 Years | 6 (30.0%) | 0 (0.0%) |
| 35 to 44 Years | 0 (0.0%) | 0 (0.0%) |
| 45 to 54 Years | 2 (15.4%) | 2 (4.0%) |
| 55 to 64 Years | 0 (0.0%) | 0 (0.0%) |
| 65 to 74 Years | 0 (0.0%) | 0 (0.0%) |
| 75 Years and over | 0 (0.0%) | 2 (28.6%) |
| Total | 8 (4.9%) | 16 (9.8%) |
Income Above Poverty by Sex and Age in Diagonal
According to the poverty statistics in Diagonal, males aged under 5 years and females aged under 5 years are the age groups that are most secure financially, with 100.0% of males and 100.0% of females in these age groups living above the poverty line.
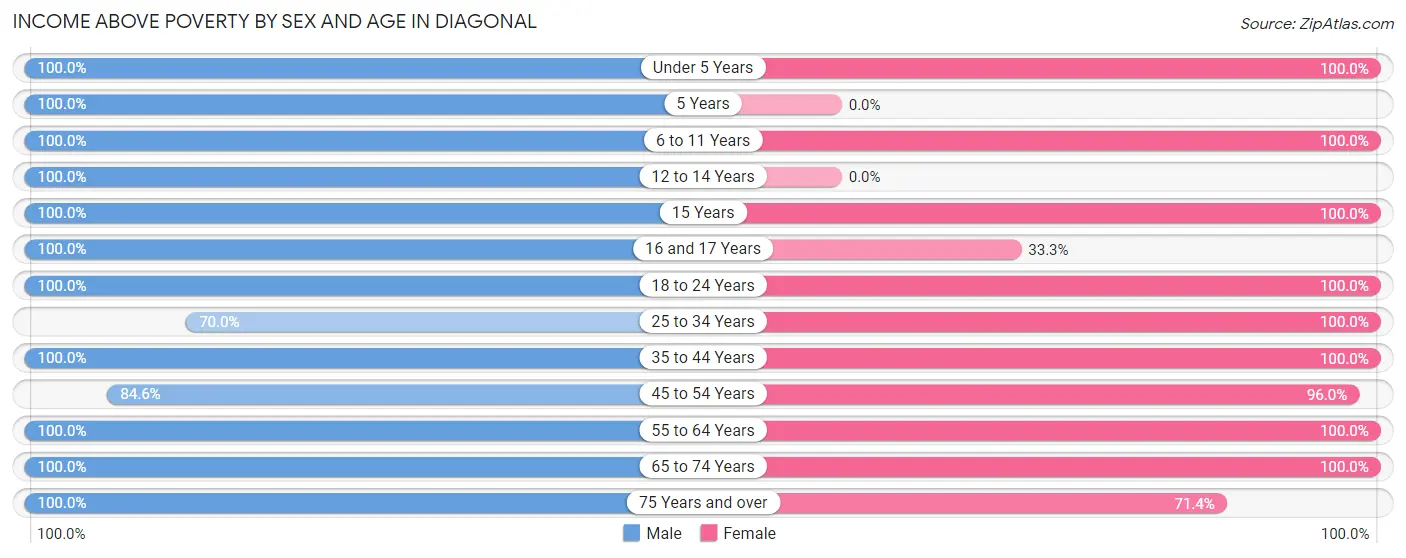
| Age Bracket | Male | Female |
| Under 5 Years | 9 (100.0%) | 10 (100.0%) |
| 5 Years | 3 (100.0%) | 0 (0.0%) |
| 6 to 11 Years | 19 (100.0%) | 6 (100.0%) |
| 12 to 14 Years | 11 (100.0%) | 0 (0.0%) |
| 15 Years | 8 (100.0%) | 4 (100.0%) |
| 16 and 17 Years | 2 (100.0%) | 6 (33.3%) |
| 18 to 24 Years | 26 (100.0%) | 13 (100.0%) |
| 25 to 34 Years | 14 (70.0%) | 25 (100.0%) |
| 35 to 44 Years | 19 (100.0%) | 10 (100.0%) |
| 45 to 54 Years | 11 (84.6%) | 48 (96.0%) |
| 55 to 64 Years | 9 (100.0%) | 7 (100.0%) |
| 65 to 74 Years | 18 (100.0%) | 14 (100.0%) |
| 75 Years and over | 5 (100.0%) | 5 (71.4%) |
| Total | 154 (95.1%) | 148 (90.2%) |
Income Below Poverty Among Married-Couple Families in Diagonal
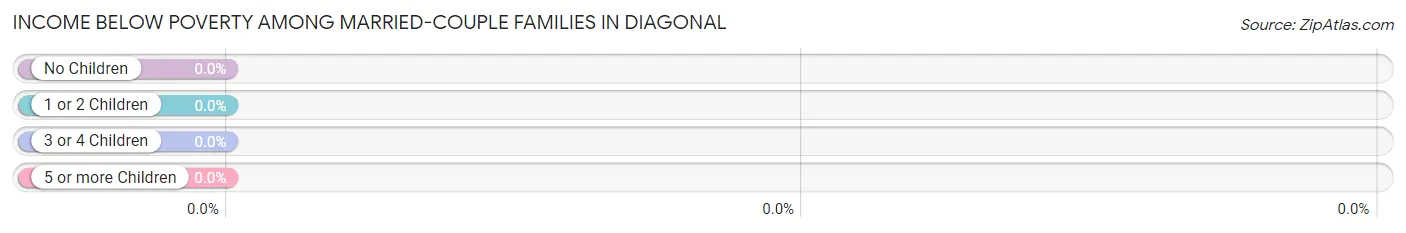
| Children | Above Poverty | Below Poverty |
| No Children | 24 (100.0%) | 0 (0.0%) |
| 1 or 2 Children | 55 (100.0%) | 0 (0.0%) |
| 3 or 4 Children | 5 (100.0%) | 0 (0.0%) |
| 5 or more Children | 0 (0.0%) | 0 (0.0%) |
| Total | 84 (100.0%) | 0 (0.0%) |
Income Below Poverty Among Single-Parent Households in Diagonal
| Children | Single Father | Single Mother |
| No Children | 0 (0.0%) | 0 (0.0%) |
| 1 or 2 Children | 0 (0.0%) | 0 (0.0%) |
| 3 or 4 Children | 0 (0.0%) | 0 (0.0%) |
| 5 or more Children | 0 (0.0%) | 0 (0.0%) |
| Total | 0 (0.0%) | 0 (0.0%) |
Income Below Poverty Among Married-Couple vs Single-Parent Households in Diagonal
| Children | Married-Couple Families | Single-Parent Households |
| No Children | 0 (0.0%) | 0 (0.0%) |
| 1 or 2 Children | 0 (0.0%) | 0 (0.0%) |
| 3 or 4 Children | 0 (0.0%) | 0 (0.0%) |
| 5 or more Children | 0 (0.0%) | 0 (0.0%) |
| Total | 0 (0.0%) | 0 (0.0%) |
Race in Diagonal
The most populous races in Diagonal are White / Caucasian (387 | 83.6%), Two or more Races (76 | 16.4%), and Hispanic or Latino (22 | 4.8%).
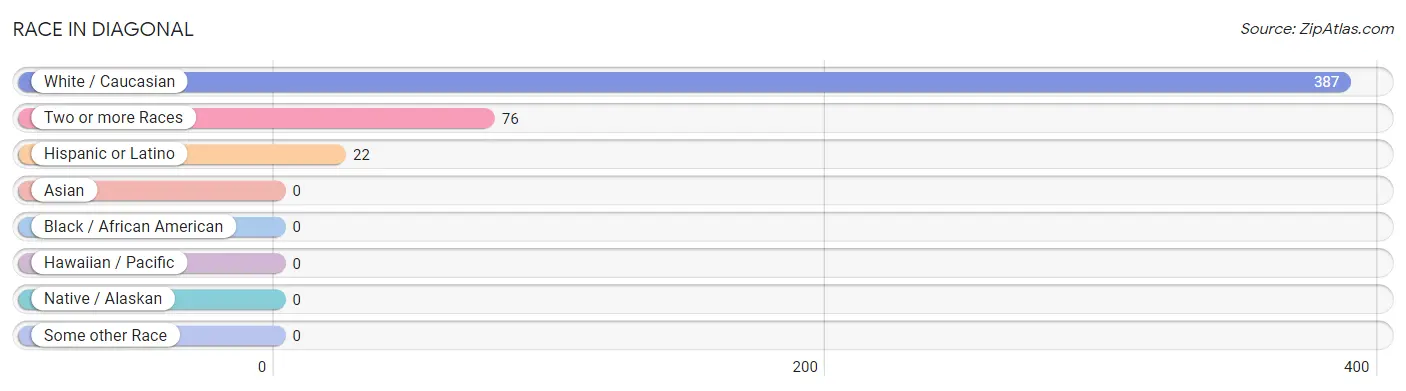
| Race | # Population | % Population |
| Asian | 0 | 0.0% |
| Black / African American | 0 | 0.0% |
| Hawaiian / Pacific | 0 | 0.0% |
| Hispanic or Latino | 22 | 4.8% |
| Native / Alaskan | 0 | 0.0% |
| White / Caucasian | 387 | 83.6% |
| Two or more Races | 76 | 16.4% |
| Some other Race | 0 | 0.0% |
| Total | 463 | 100.0% |
Ancestry in Diagonal
The most populous ancestries reported in Diagonal are German (137 | 29.6%), English (96 | 20.7%), Iroquois (57 | 12.3%), Irish (55 | 11.9%), and Scottish (36 | 7.8%), together accounting for 82.3% of all Diagonal residents.
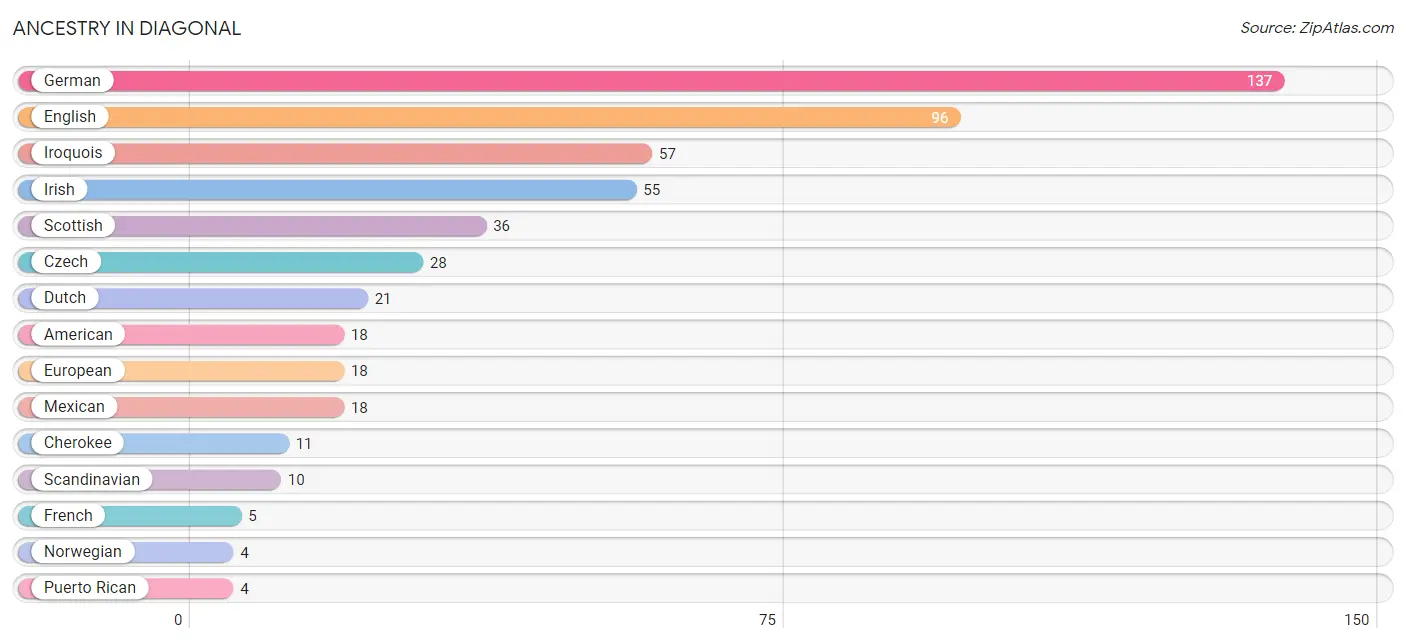
| Ancestry | # Population | % Population |
| American | 18 | 3.9% |
| Canadian | 2 | 0.4% |
| Cherokee | 11 | 2.4% |
| Czech | 28 | 6.0% |
| Dutch | 21 | 4.5% |
| English | 96 | 20.7% |
| European | 18 | 3.9% |
| French | 5 | 1.1% |
| German | 137 | 29.6% |
| Irish | 55 | 11.9% |
| Iroquois | 57 | 12.3% |
| Mexican | 18 | 3.9% |
| Norwegian | 4 | 0.9% |
| Puerto Rican | 4 | 0.9% |
| Scandinavian | 10 | 2.2% |
| Scottish | 36 | 7.8% | View All 16 Rows |
Immigrants in Diagonal

| Immigration Origin | # Population | % Population | View All 0 Rows |
Sex and Age in Diagonal
Sex and Age in Diagonal
The most populous age groups in Diagonal are 15 to 19 Years (24 | 12.1%) for men and 85 Years and over (57 | 21.5%) for women.
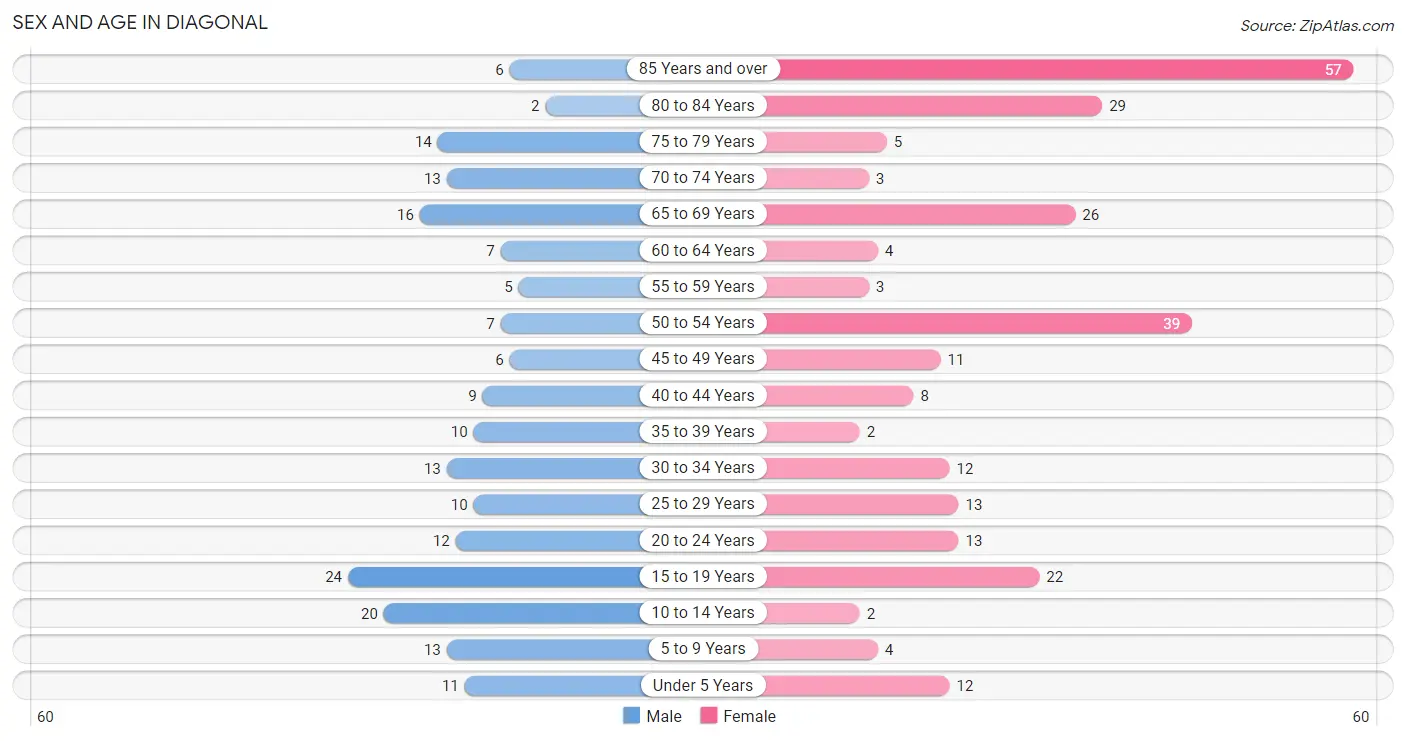
| Age Bracket | Male | Female |
| Under 5 Years | 11 (5.6%) | 12 (4.5%) |
| 5 to 9 Years | 13 (6.6%) | 4 (1.5%) |
| 10 to 14 Years | 20 (10.1%) | 2 (0.7%) |
| 15 to 19 Years | 24 (12.1%) | 22 (8.3%) |
| 20 to 24 Years | 12 (6.1%) | 13 (4.9%) |
| 25 to 29 Years | 10 (5.1%) | 13 (4.9%) |
| 30 to 34 Years | 13 (6.6%) | 12 (4.5%) |
| 35 to 39 Years | 10 (5.1%) | 2 (0.7%) |
| 40 to 44 Years | 9 (4.5%) | 8 (3.0%) |
| 45 to 49 Years | 6 (3.0%) | 11 (4.2%) |
| 50 to 54 Years | 7 (3.5%) | 39 (14.7%) |
| 55 to 59 Years | 5 (2.5%) | 3 (1.1%) |
| 60 to 64 Years | 7 (3.5%) | 4 (1.5%) |
| 65 to 69 Years | 16 (8.1%) | 26 (9.8%) |
| 70 to 74 Years | 13 (6.6%) | 3 (1.1%) |
| 75 to 79 Years | 14 (7.1%) | 5 (1.9%) |
| 80 to 84 Years | 2 (1.0%) | 29 (10.9%) |
| 85 Years and over | 6 (3.0%) | 57 (21.5%) |
| Total | 198 (100.0%) | 265 (100.0%) |
Families and Households in Diagonal
Median Family Size in Diagonal
The median family size in Diagonal is 2.76 persons per family, with married-couple families (84 | 88.4%) accounting for the largest median family size of 2.87 persons per family. On the other hand, single male/father families (4 | 4.2%) represent the smallest median family size with 1.75 persons per family.
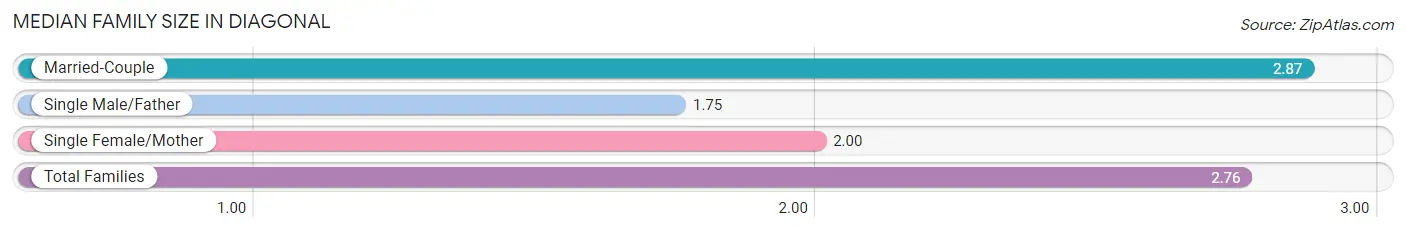
| Family Type | # Families | Family Size |
| Married-Couple | 84 (88.4%) | 2.87 |
| Single Male/Father | 4 (4.2%) | 1.75 |
| Single Female/Mother | 7 (7.4%) | 2.00 |
| Total Families | 95 (100.0%) | 2.76 |
Median Household Size in Diagonal
The median household size in Diagonal is 2.54 persons per household, with married-couple households (84 | 64.6%) accounting for the largest median household size of 3.01 persons per household. non-family households (35 | 26.9%) represent the smallest median household size with 1.43 persons per household.
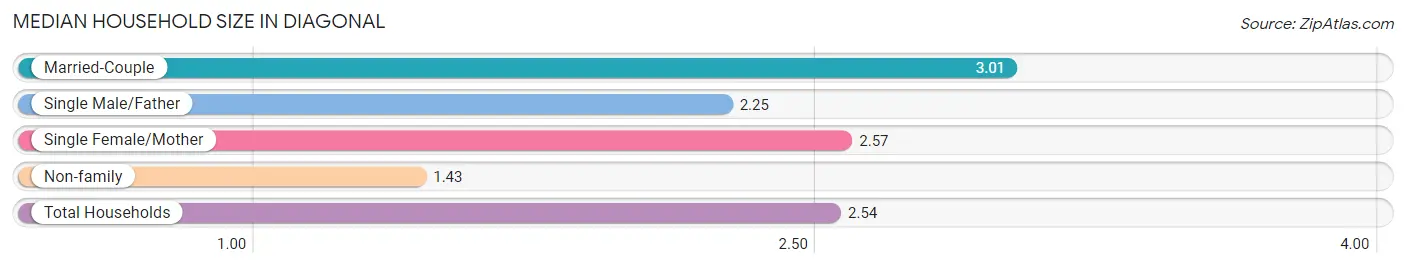
| Household Type | # Households | Household Size |
| Married-Couple | 84 (64.6%) | 3.01 |
| Single Male/Father | 4 (3.1%) | 2.25 |
| Single Female/Mother | 7 (5.4%) | 2.57 |
| Non-family | 35 (26.9%) | 1.43 |
| Total Households | 130 (100.0%) | 2.54 |
Household Size by Marriage Status in Diagonal
Out of a total of 130 households in Diagonal, 95 (73.1%) are family households, while 35 (26.9%) are nonfamily households. The most numerous type of family households are 7+ person households, comprising 35, and the most common type of nonfamily households are 1-person households, comprising 27.
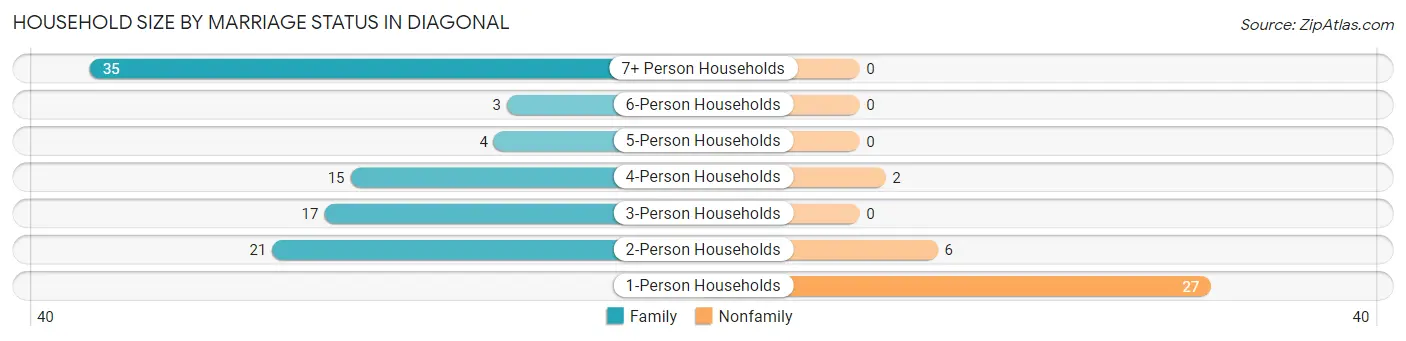
| Household Size | Family Households | Nonfamily Households |
| 1-Person Households | - | 27 (20.8%) |
| 2-Person Households | 21 (16.2%) | 6 (4.6%) |
| 3-Person Households | 17 (13.1%) | 0 (0.0%) |
| 4-Person Households | 15 (11.5%) | 2 (1.5%) |
| 5-Person Households | 4 (3.1%) | 0 (0.0%) |
| 6-Person Households | 3 (2.3%) | 0 (0.0%) |
| 7+ Person Households | 35 (26.9%) | 0 (0.0%) |
| Total | 95 (73.1%) | 35 (26.9%) |
Female Fertility in Diagonal
Fertility by Age in Diagonal
| Age Bracket | Women with Births | Births / 1,000 Women |
| 15 to 19 years | 0 (0.0%) | 0.0 |
| 20 to 34 years | 0 (0.0%) | 0.0 |
| 35 to 50 years | 0 (0.0%) | 0.0 |
| Total | 0 (0.0%) | 0.0 |
Fertility by Age by Marriage Status in Diagonal
| Age Bracket | Married | Unmarried |
| 15 to 19 years | 0 (0.0%) | 0 (0.0%) |
| 20 to 34 years | 0 (0.0%) | 0 (0.0%) |
| 35 to 50 years | 0 (0.0%) | 0 (0.0%) |
| Total | 0 (0.0%) | 0 (0.0%) |
Fertility by Education in Diagonal
| Educational Attainment | Women with Births | Births / 1,000 Women |
| Less than High School | 0 (0.0%) | 0.0 |
| High School Diploma | 0 (0.0%) | 0.0 |
| College or Associate's Degree | 0 (0.0%) | 0.0 |
| Bachelor's Degree | 0 (0.0%) | 0.0 |
| Graduate Degree | 0 (0.0%) | 0.0 |
| Total | 0 (0.0%) | 0.0 |
Fertility by Education by Marriage Status in Diagonal
| Educational Attainment | Married | Unmarried |
| Less than High School | 0 (0.0%) | 0 (0.0%) |
| High School Diploma | 0 (0.0%) | 0 (0.0%) |
| College or Associate's Degree | 0 (0.0%) | 0 (0.0%) |
| Bachelor's Degree | 0 (0.0%) | 0 (0.0%) |
| Graduate Degree | 0 (0.0%) | 0 (0.0%) |
| Total | 0 (0.0%) | 0 (0.0%) |
Employment Characteristics in Diagonal
Employment by Class of Employer in Diagonal
Among the 182 employed individuals in Diagonal, private company employees (101 | 55.5%), self-employed (not incorporated) (39 | 21.4%), and local government employees (16 | 8.8%) make up the most common classes of employment.
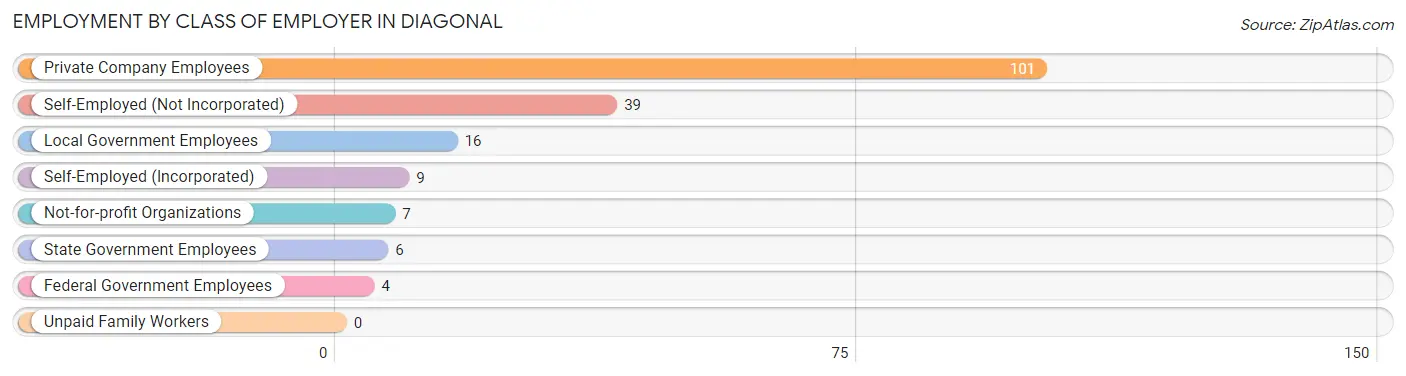
| Employer Class | # Employees | % Employees |
| Private Company Employees | 101 | 55.5% |
| Self-Employed (Incorporated) | 9 | 5.0% |
| Self-Employed (Not Incorporated) | 39 | 21.4% |
| Not-for-profit Organizations | 7 | 3.8% |
| Local Government Employees | 16 | 8.8% |
| State Government Employees | 6 | 3.3% |
| Federal Government Employees | 4 | 2.2% |
| Unpaid Family Workers | 0 | 0.0% |
| Total | 182 | 100.0% |
Employment Status by Age in Diagonal
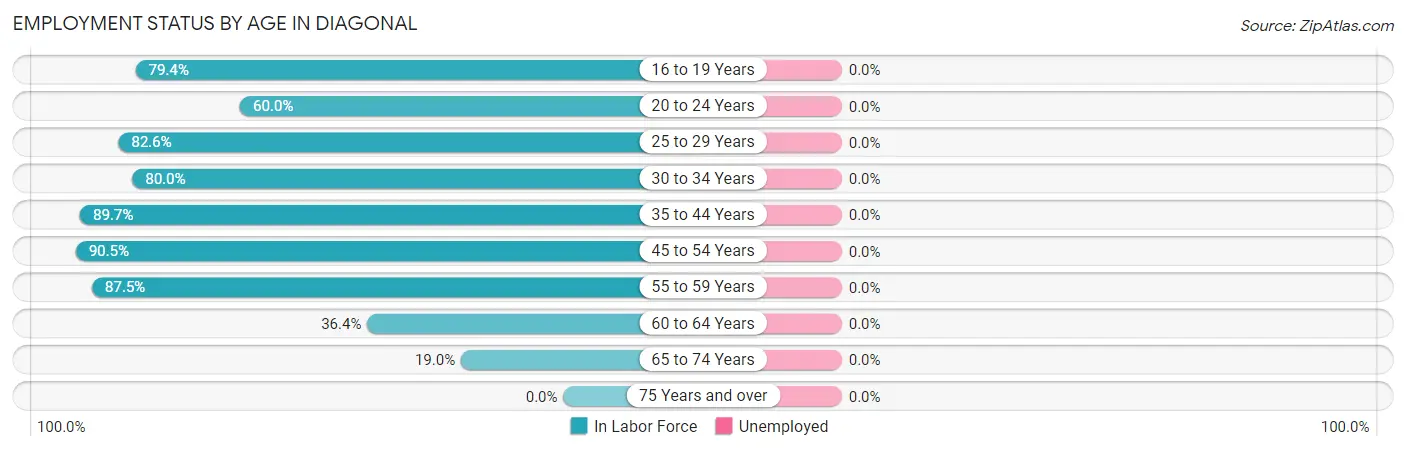
| Age Bracket | In Labor Force | Unemployed |
| 16 to 19 Years | 27 (79.4%) | 0 (0.0%) |
| 20 to 24 Years | 15 (60.0%) | 0 (0.0%) |
| 25 to 29 Years | 19 (82.6%) | 0 (0.0%) |
| 30 to 34 Years | 20 (80.0%) | 0 (0.0%) |
| 35 to 44 Years | 26 (89.7%) | 0 (0.0%) |
| 45 to 54 Years | 57 (90.5%) | 0 (0.0%) |
| 55 to 59 Years | 7 (87.5%) | 0 (0.0%) |
| 60 to 64 Years | 4 (36.4%) | 0 (0.0%) |
| 65 to 74 Years | 11 (19.0%) | 0 (0.0%) |
| 75 Years and over | 0 (0.0%) | 0 (0.0%) |
| Total | 186 (47.8%) | 0 (0.0%) |
Employment Status by Educational Attainment in Diagonal
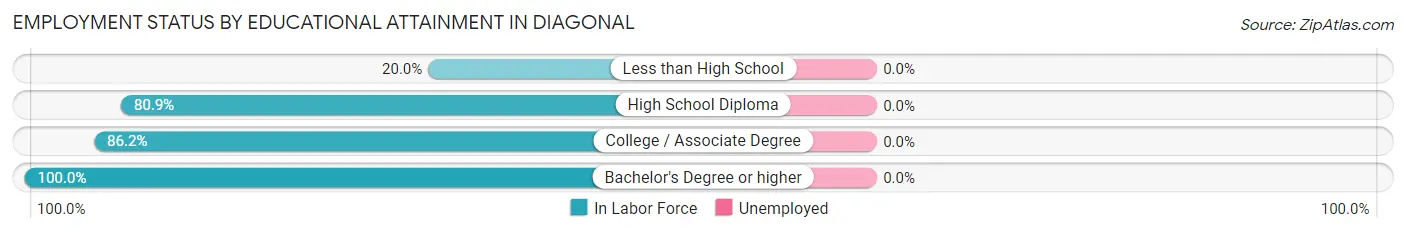
| Educational Attainment | In Labor Force | Unemployed |
| Less than High School | 1 (20.0%) | 0 (0.0%) |
| High School Diploma | 55 (80.9%) | 0 (0.0%) |
| College / Associate Degree | 56 (86.2%) | 0 (0.0%) |
| Bachelor's Degree or higher | 21 (100.0%) | 0 (0.0%) |
| Total | 133 (83.6%) | 0 (0.0%) |
Employment Occupations by Sex in Diagonal
Management, Business, Science and Arts Occupations
The most common Management, Business, Science and Arts occupations in Diagonal are Management (24 | 12.9%), Community & Social Service (11 | 5.9%), Education Instruction & Library (11 | 5.9%), Business & Financial (4 | 2.1%), and Health Diagnosing & Treating (4 | 2.1%).
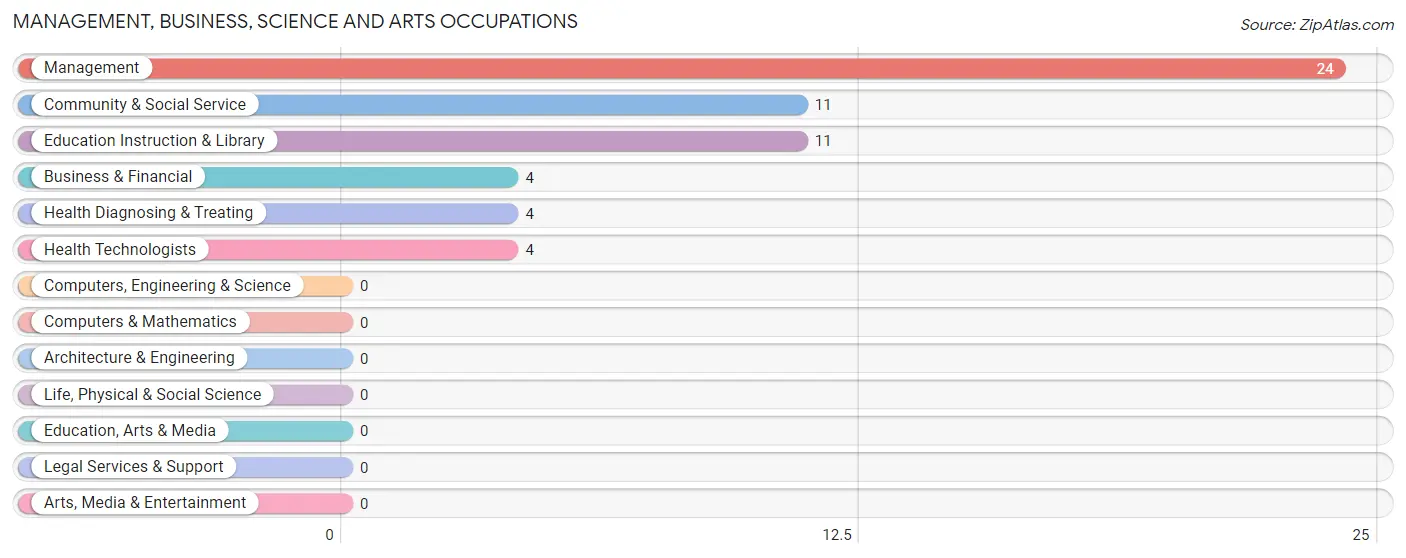
Management, Business, Science and Arts Occupations by Sex
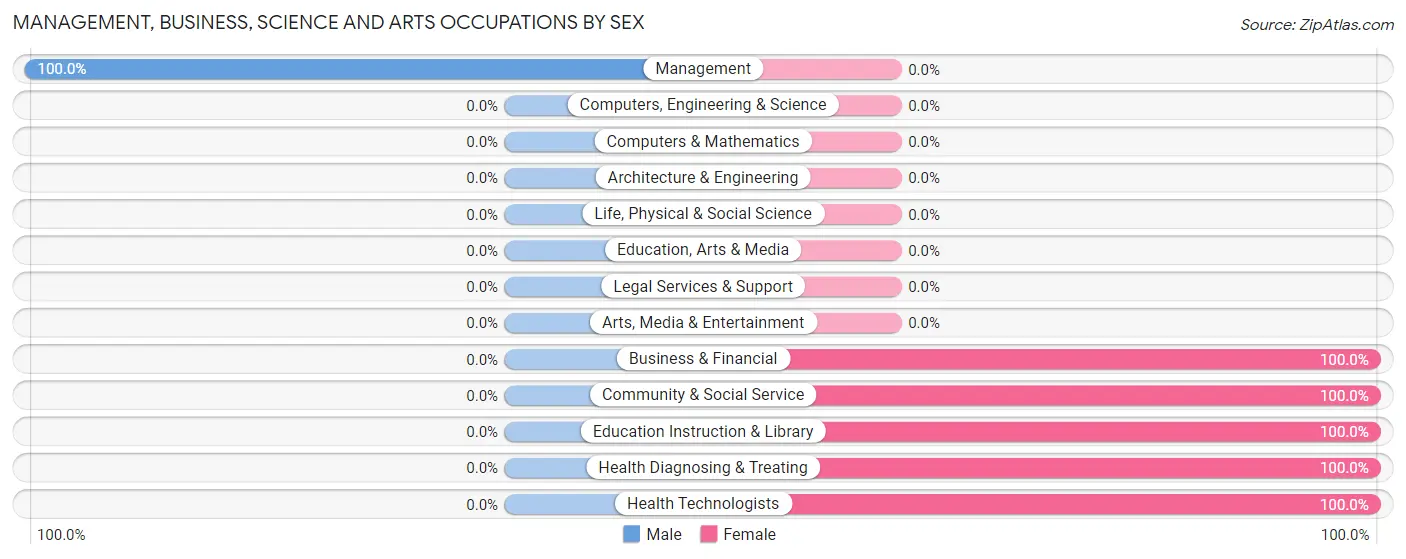
| Occupation | Male | Female |
| Management | 24 (100.0%) | 0 (0.0%) |
| Business & Financial | 0 (0.0%) | 4 (100.0%) |
| Computers, Engineering & Science | 0 (0.0%) | 0 (0.0%) |
| Computers & Mathematics | 0 (0.0%) | 0 (0.0%) |
| Architecture & Engineering | 0 (0.0%) | 0 (0.0%) |
| Life, Physical & Social Science | 0 (0.0%) | 0 (0.0%) |
| Community & Social Service | 0 (0.0%) | 11 (100.0%) |
| Education, Arts & Media | 0 (0.0%) | 0 (0.0%) |
| Legal Services & Support | 0 (0.0%) | 0 (0.0%) |
| Education Instruction & Library | 0 (0.0%) | 11 (100.0%) |
| Arts, Media & Entertainment | 0 (0.0%) | 0 (0.0%) |
| Health Diagnosing & Treating | 0 (0.0%) | 4 (100.0%) |
| Health Technologists | 0 (0.0%) | 4 (100.0%) |
| Total (Category) | 24 (55.8%) | 19 (44.2%) |
| Total (Overall) | 83 (44.6%) | 103 (55.4%) |
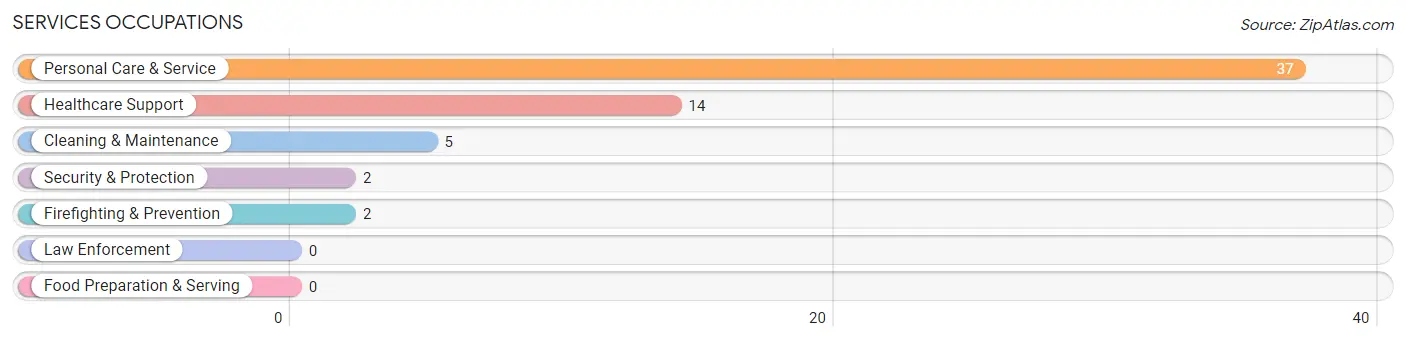
Services Occupations
The most common Services occupations in Diagonal are Personal Care & Service (37 | 19.9%), Healthcare Support (14 | 7.5%), Cleaning & Maintenance (5 | 2.7%), Security & Protection (2 | 1.1%), and Firefighting & Prevention (2 | 1.1%).
Services Occupations by Sex
Within the Services occupations in Diagonal, the most male-oriented occupations are Security & Protection (100.0%), Firefighting & Prevention (100.0%), and Cleaning & Maintenance (100.0%), while the most female-oriented occupations are Healthcare Support (100.0%), and Personal Care & Service (100.0%).
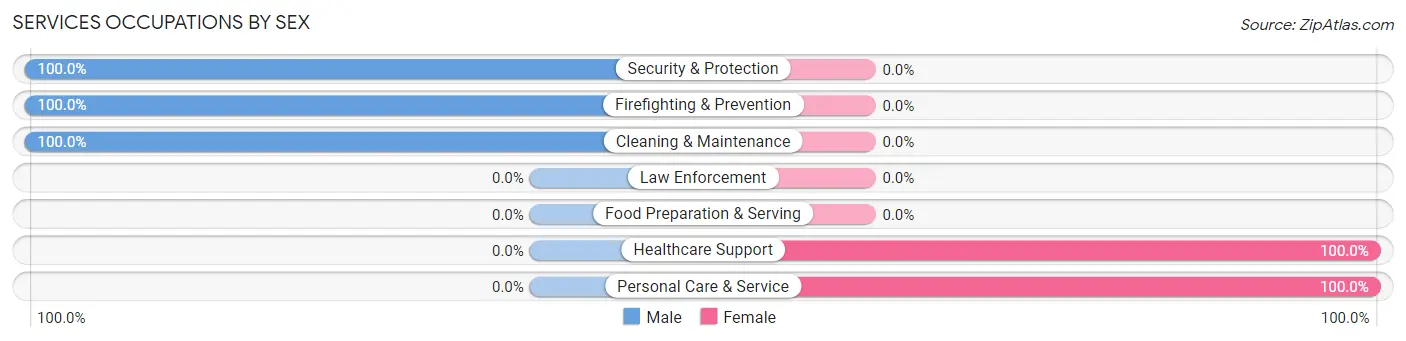
| Occupation | Male | Female |
| Healthcare Support | 0 (0.0%) | 14 (100.0%) |
| Security & Protection | 2 (100.0%) | 0 (0.0%) |
| Firefighting & Prevention | 2 (100.0%) | 0 (0.0%) |
| Law Enforcement | 0 (0.0%) | 0 (0.0%) |
| Food Preparation & Serving | 0 (0.0%) | 0 (0.0%) |
| Cleaning & Maintenance | 5 (100.0%) | 0 (0.0%) |
| Personal Care & Service | 0 (0.0%) | 37 (100.0%) |
| Total (Category) | 7 (12.1%) | 51 (87.9%) |
| Total (Overall) | 83 (44.6%) | 103 (55.4%) |
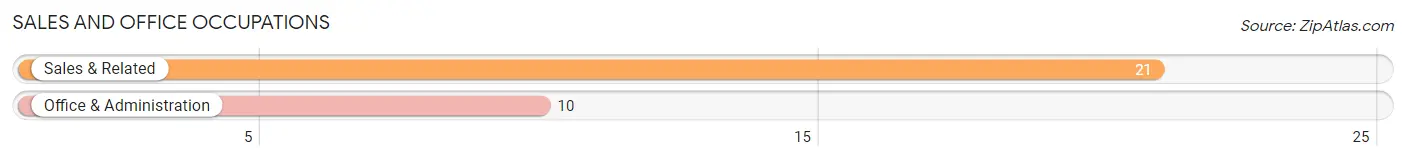
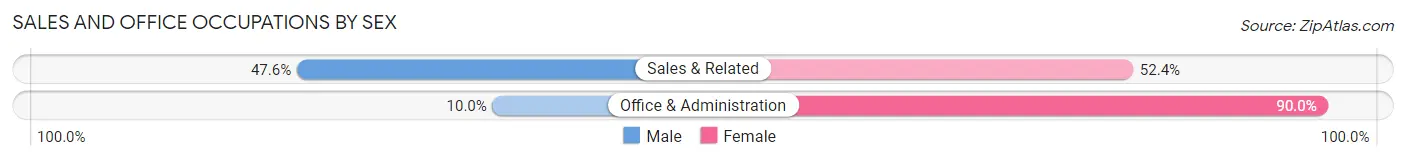
Sales and Office Occupations
The most common Sales and Office occupations in Diagonal are Sales & Related (21 | 11.3%), and Office & Administration (10 | 5.4%).
Sales and Office Occupations by Sex
| Occupation | Male | Female |
| Sales & Related | 10 (47.6%) | 11 (52.4%) |
| Office & Administration | 1 (10.0%) | 9 (90.0%) |
| Total (Category) | 11 (35.5%) | 20 (64.5%) |
| Total (Overall) | 83 (44.6%) | 103 (55.4%) |
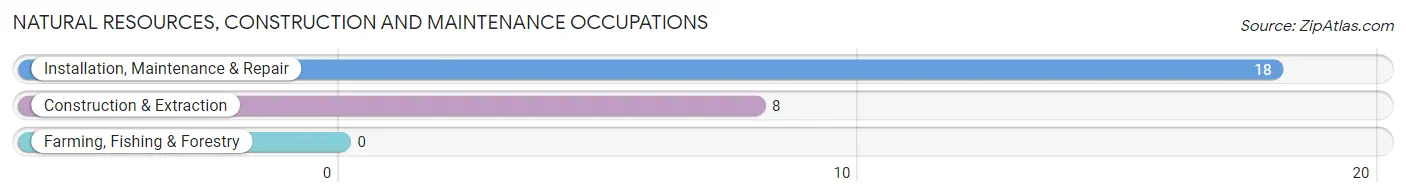
Natural Resources, Construction and Maintenance Occupations
The most common Natural Resources, Construction and Maintenance occupations in Diagonal are Installation, Maintenance & Repair (18 | 9.7%), and Construction & Extraction (8 | 4.3%).
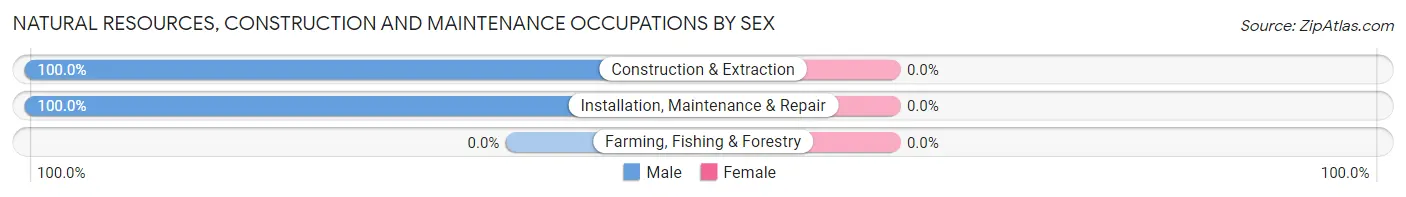
Natural Resources, Construction and Maintenance Occupations by Sex
| Occupation | Male | Female |
| Farming, Fishing & Forestry | 0 (0.0%) | 0 (0.0%) |
| Construction & Extraction | 8 (100.0%) | 0 (0.0%) |
| Installation, Maintenance & Repair | 18 (100.0%) | 0 (0.0%) |
| Total (Category) | 26 (100.0%) | 0 (0.0%) |
| Total (Overall) | 83 (44.6%) | 103 (55.4%) |
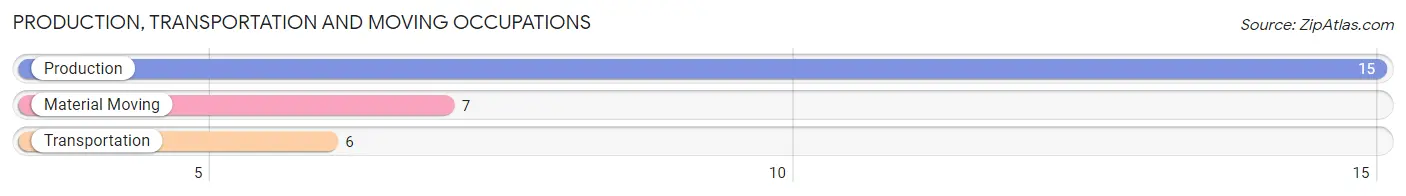
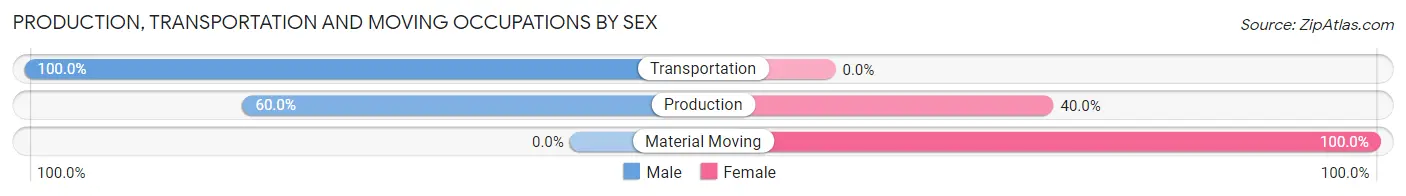
Production, Transportation and Moving Occupations
The most common Production, Transportation and Moving occupations in Diagonal are Production (15 | 8.1%), Material Moving (7 | 3.8%), and Transportation (6 | 3.2%).
Production, Transportation and Moving Occupations by Sex
| Occupation | Male | Female |
| Production | 9 (60.0%) | 6 (40.0%) |
| Transportation | 6 (100.0%) | 0 (0.0%) |
| Material Moving | 0 (0.0%) | 7 (100.0%) |
| Total (Category) | 15 (53.6%) | 13 (46.4%) |
| Total (Overall) | 83 (44.6%) | 103 (55.4%) |
Employment Industries by Sex in Diagonal
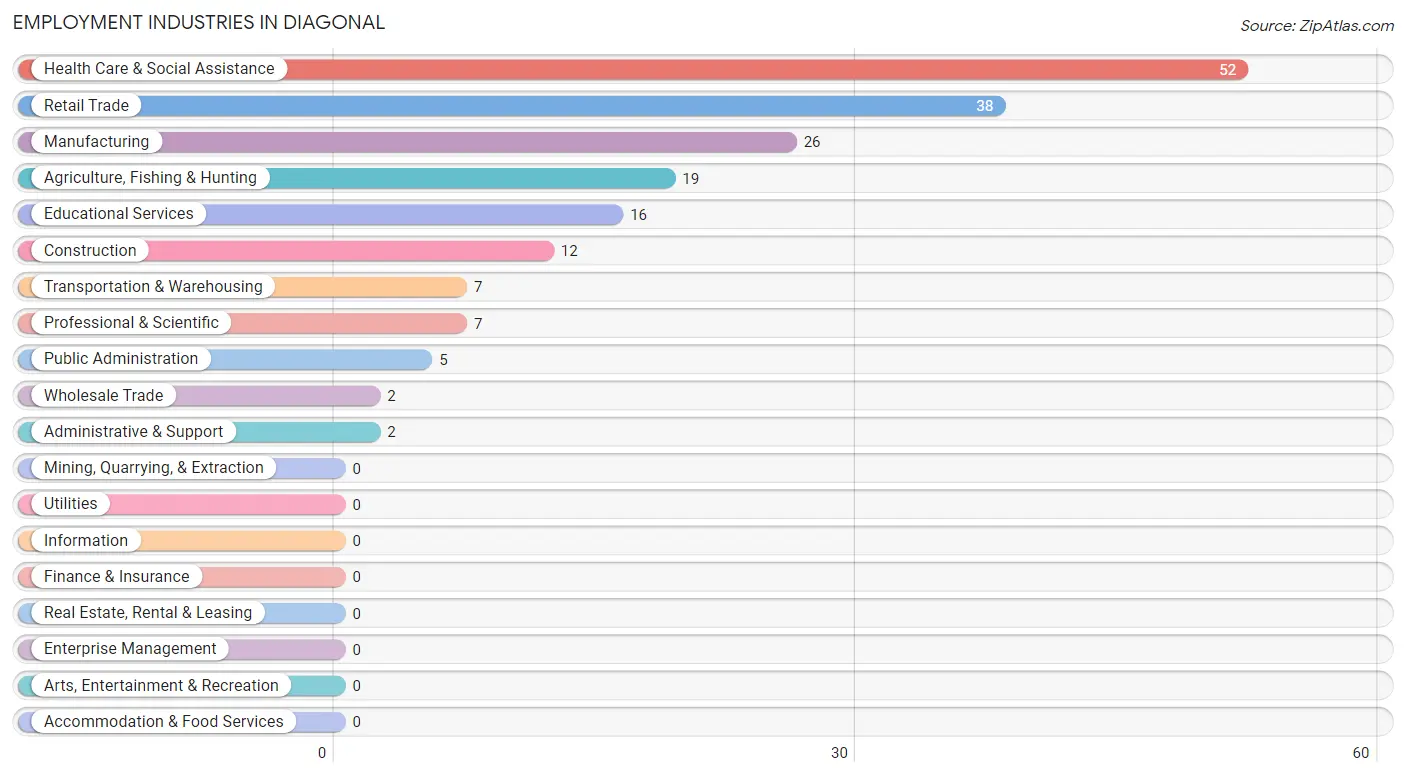
Employment Industries in Diagonal
The major employment industries in Diagonal include Health Care & Social Assistance (52 | 28.0%), Retail Trade (38 | 20.4%), Manufacturing (26 | 14.0%), Agriculture, Fishing & Hunting (19 | 10.2%), and Educational Services (16 | 8.6%).
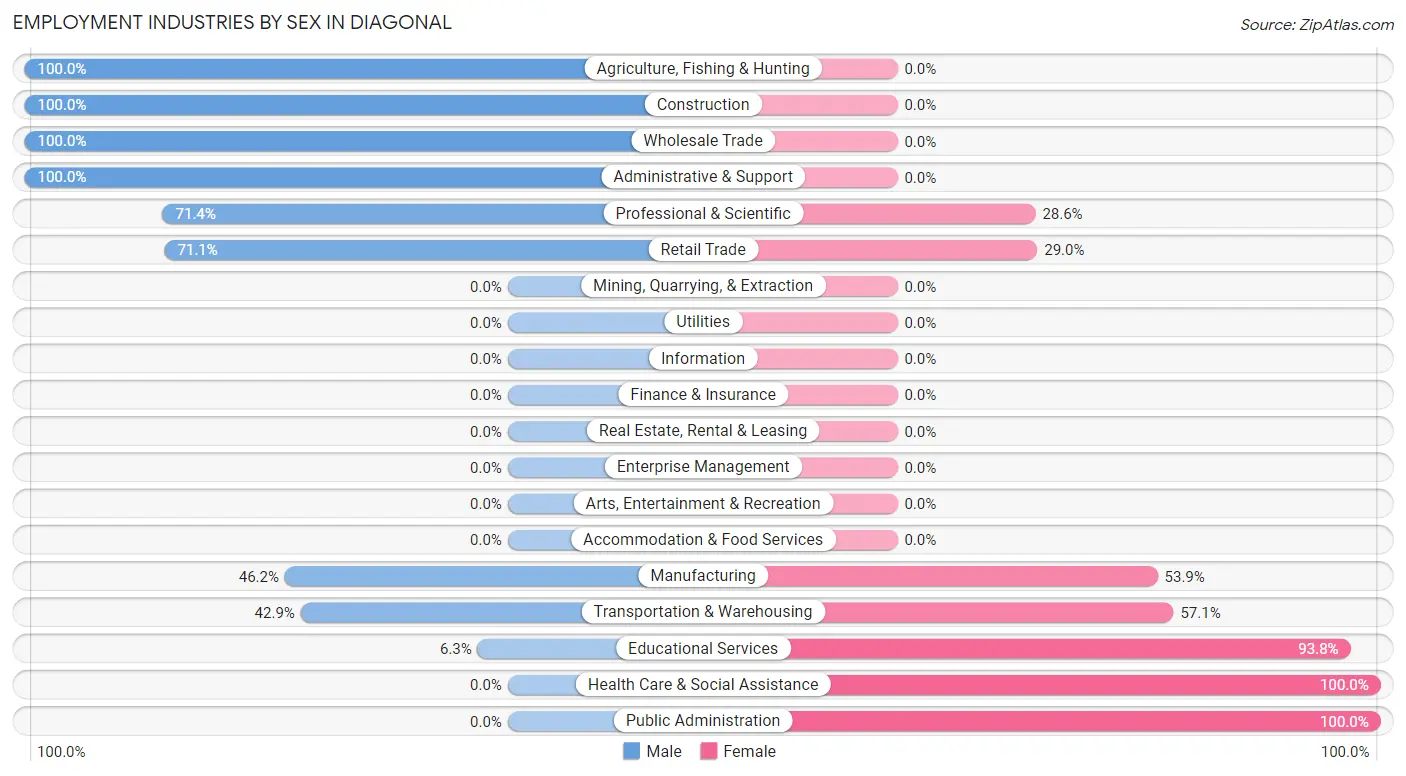
Employment Industries by Sex in Diagonal
The Diagonal industries that see more men than women are Agriculture, Fishing & Hunting (100.0%), Construction (100.0%), and Wholesale Trade (100.0%), whereas the industries that tend to have a higher number of women are Health Care & Social Assistance (100.0%), Public Administration (100.0%), and Educational Services (93.8%).
| Industry | Male | Female |
| Agriculture, Fishing & Hunting | 19 (100.0%) | 0 (0.0%) |
| Mining, Quarrying, & Extraction | 0 (0.0%) | 0 (0.0%) |
| Construction | 12 (100.0%) | 0 (0.0%) |
| Manufacturing | 12 (46.2%) | 14 (53.8%) |
| Wholesale Trade | 2 (100.0%) | 0 (0.0%) |
| Retail Trade | 27 (71.1%) | 11 (28.9%) |
| Transportation & Warehousing | 3 (42.9%) | 4 (57.1%) |
| Utilities | 0 (0.0%) | 0 (0.0%) |
| Information | 0 (0.0%) | 0 (0.0%) |
| Finance & Insurance | 0 (0.0%) | 0 (0.0%) |
| Real Estate, Rental & Leasing | 0 (0.0%) | 0 (0.0%) |
| Professional & Scientific | 5 (71.4%) | 2 (28.6%) |
| Enterprise Management | 0 (0.0%) | 0 (0.0%) |
| Administrative & Support | 2 (100.0%) | 0 (0.0%) |
| Educational Services | 1 (6.2%) | 15 (93.8%) |
| Health Care & Social Assistance | 0 (0.0%) | 52 (100.0%) |
| Arts, Entertainment & Recreation | 0 (0.0%) | 0 (0.0%) |
| Accommodation & Food Services | 0 (0.0%) | 0 (0.0%) |
| Public Administration | 0 (0.0%) | 5 (100.0%) |
| Total | 83 (44.6%) | 103 (55.4%) |
Education in Diagonal
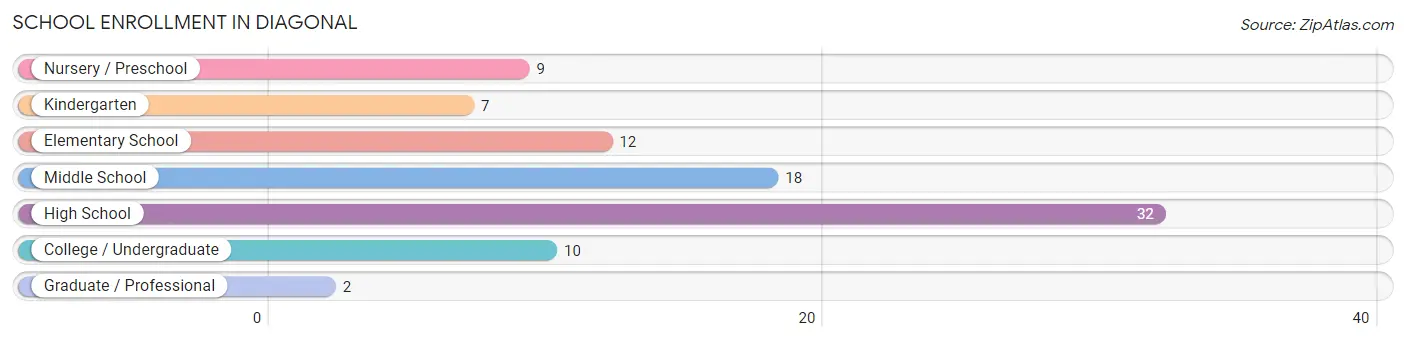
School Enrollment in Diagonal
The most common levels of schooling among the 90 students in Diagonal are high school (32 | 35.6%), middle school (18 | 20.0%), and elementary school (12 | 13.3%).
| School Level | # Students | % Students |
| Nursery / Preschool | 9 | 10.0% |
| Kindergarten | 7 | 7.8% |
| Elementary School | 12 | 13.3% |
| Middle School | 18 | 20.0% |
| High School | 32 | 35.6% |
| College / Undergraduate | 10 | 11.1% |
| Graduate / Professional | 2 | 2.2% |
| Total | 90 | 100.0% |
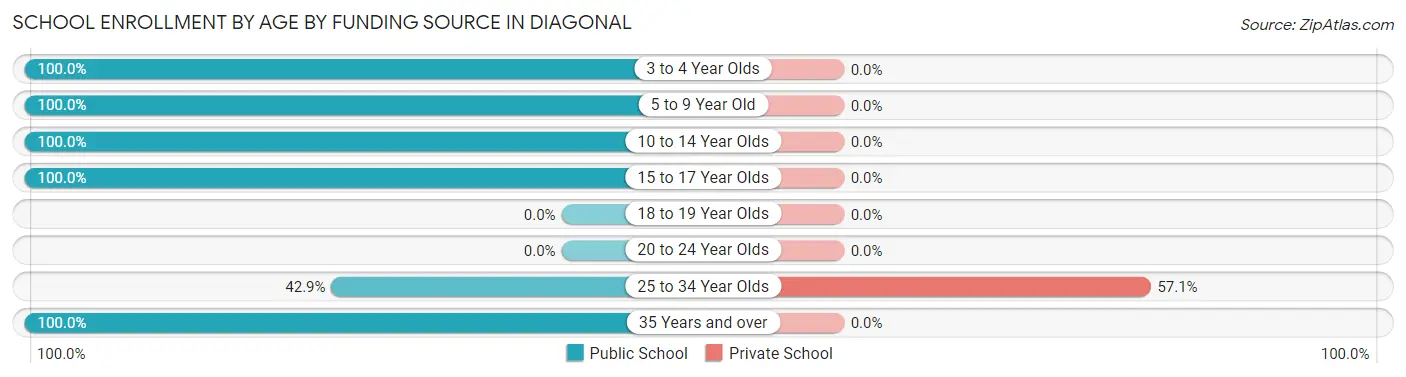
School Enrollment by Age by Funding Source in Diagonal
Out of a total of 90 students who are enrolled in schools in Diagonal, 4 (4.4%) attend a private institution, while the remaining 86 (95.6%) are enrolled in public schools. The age group of 25 to 34 year olds has the highest likelihood of being enrolled in private schools, with 4 (57.1% in the age bracket) enrolled. Conversely, the age group of 3 to 4 year olds has the lowest likelihood of being enrolled in a private school, with 7 (100.0% in the age bracket) attending a public institution.
| Age Bracket | Public School | Private School |
| 3 to 4 Year Olds | 7 (100.0%) | 0 (0.0%) |
| 5 to 9 Year Old | 17 (100.0%) | 0 (0.0%) |
| 10 to 14 Year Olds | 22 (100.0%) | 0 (0.0%) |
| 15 to 17 Year Olds | 32 (100.0%) | 0 (0.0%) |
| 18 to 19 Year Olds | 0 (0.0%) | 0 (0.0%) |
| 20 to 24 Year Olds | 0 (0.0%) | 0 (0.0%) |
| 25 to 34 Year Olds | 3 (42.9%) | 4 (57.1%) |
| 35 Years and over | 5 (100.0%) | 0 (0.0%) |
| Total | 86 (95.6%) | 4 (4.4%) |
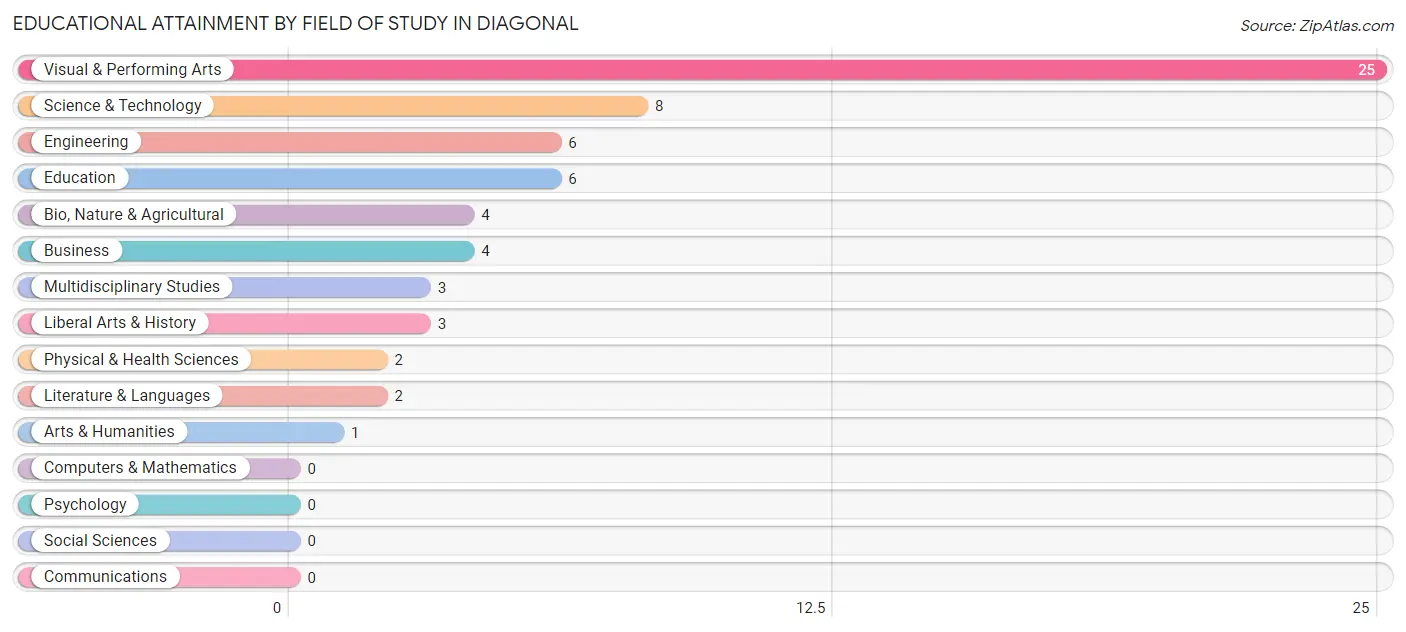
Educational Attainment by Field of Study in Diagonal
Visual & performing arts (25 | 39.1%), science & technology (8 | 12.5%), engineering (6 | 9.4%), education (6 | 9.4%), and bio, nature & agricultural (4 | 6.2%) are the most common fields of study among 64 individuals in Diagonal who have obtained a bachelor's degree or higher.
| Field of Study | # Graduates | % Graduates |
| Computers & Mathematics | 0 | 0.0% |
| Bio, Nature & Agricultural | 4 | 6.2% |
| Physical & Health Sciences | 2 | 3.1% |
| Psychology | 0 | 0.0% |
| Social Sciences | 0 | 0.0% |
| Engineering | 6 | 9.4% |
| Multidisciplinary Studies | 3 | 4.7% |
| Science & Technology | 8 | 12.5% |
| Business | 4 | 6.2% |
| Education | 6 | 9.4% |
| Literature & Languages | 2 | 3.1% |
| Liberal Arts & History | 3 | 4.7% |
| Visual & Performing Arts | 25 | 39.1% |
| Communications | 0 | 0.0% |
| Arts & Humanities | 1 | 1.6% |
| Total | 64 | 100.0% |
Transportation & Commute in Diagonal
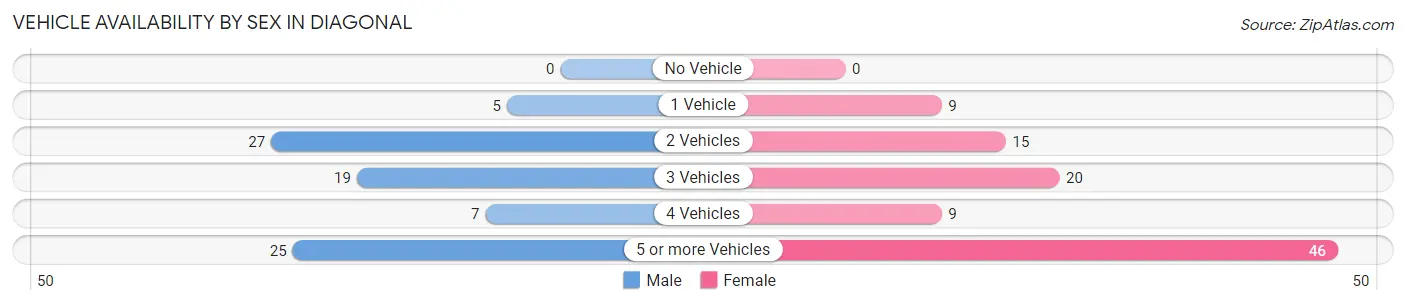
Vehicle Availability by Sex in Diagonal
The most prevalent vehicle ownership categories in Diagonal are males with 2 vehicles (27, accounting for 32.5%) and females with 2 vehicles (15, making up 27.3%).
| Vehicles Available | Male | Female |
| No Vehicle | 0 (0.0%) | 0 (0.0%) |
| 1 Vehicle | 5 (6.0%) | 9 (9.1%) |
| 2 Vehicles | 27 (32.5%) | 15 (15.1%) |
| 3 Vehicles | 19 (22.9%) | 20 (20.2%) |
| 4 Vehicles | 7 (8.4%) | 9 (9.1%) |
| 5 or more Vehicles | 25 (30.1%) | 46 (46.5%) |
| Total | 83 (100.0%) | 99 (100.0%) |
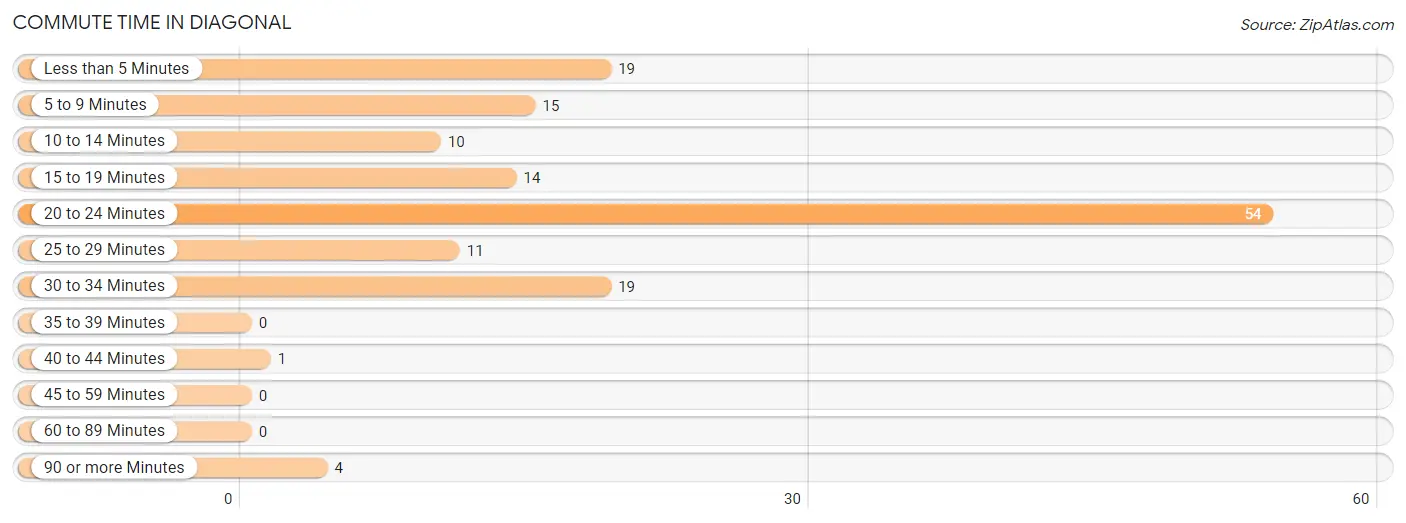
Commute Time in Diagonal
The most frequently occuring commute durations in Diagonal are 20 to 24 minutes (54 commuters, 36.7%), less than 5 minutes (19 commuters, 12.9%), and 30 to 34 minutes (19 commuters, 12.9%).
| Commute Time | # Commuters | % Commuters |
| Less than 5 Minutes | 19 | 12.9% |
| 5 to 9 Minutes | 15 | 10.2% |
| 10 to 14 Minutes | 10 | 6.8% |
| 15 to 19 Minutes | 14 | 9.5% |
| 20 to 24 Minutes | 54 | 36.7% |
| 25 to 29 Minutes | 11 | 7.5% |
| 30 to 34 Minutes | 19 | 12.9% |
| 35 to 39 Minutes | 0 | 0.0% |
| 40 to 44 Minutes | 1 | 0.7% |
| 45 to 59 Minutes | 0 | 0.0% |
| 60 to 89 Minutes | 0 | 0.0% |
| 90 or more Minutes | 4 | 2.7% |
Commute Time by Sex in Diagonal
The most common commute times in Diagonal are 20 to 24 minutes (31 commuters, 37.3%) for males and 20 to 24 minutes (23 commuters, 35.9%) for females.
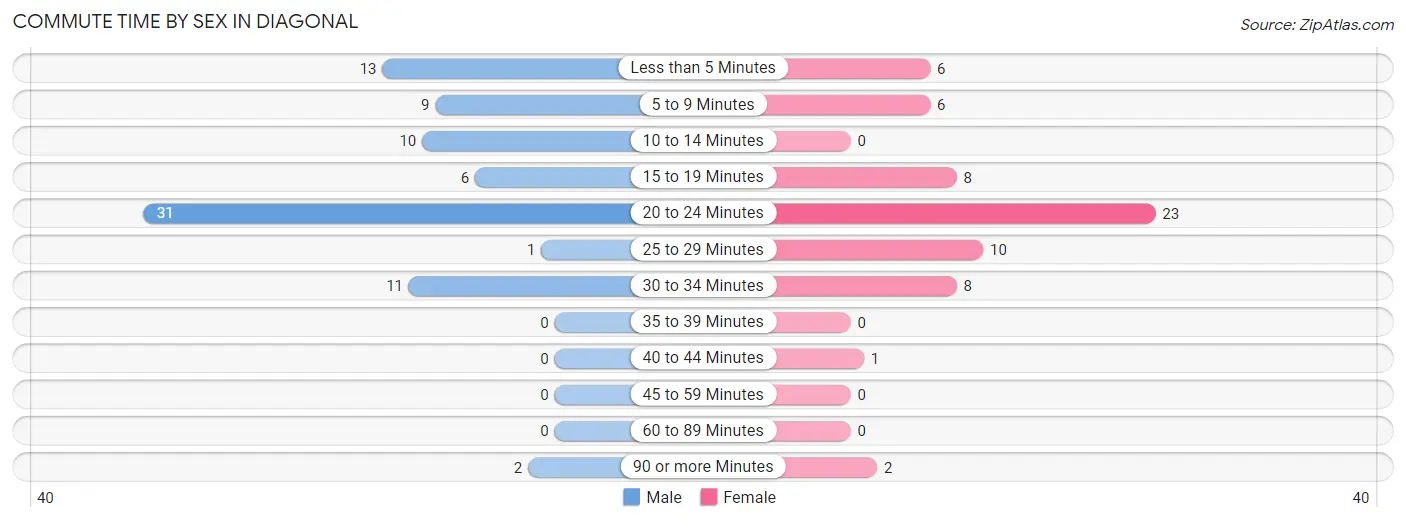
| Commute Time | Male | Female |
| Less than 5 Minutes | 13 (15.7%) | 6 (9.4%) |
| 5 to 9 Minutes | 9 (10.8%) | 6 (9.4%) |
| 10 to 14 Minutes | 10 (12.0%) | 0 (0.0%) |
| 15 to 19 Minutes | 6 (7.2%) | 8 (12.5%) |
| 20 to 24 Minutes | 31 (37.3%) | 23 (35.9%) |
| 25 to 29 Minutes | 1 (1.2%) | 10 (15.6%) |
| 30 to 34 Minutes | 11 (13.3%) | 8 (12.5%) |
| 35 to 39 Minutes | 0 (0.0%) | 0 (0.0%) |
| 40 to 44 Minutes | 0 (0.0%) | 1 (1.6%) |
| 45 to 59 Minutes | 0 (0.0%) | 0 (0.0%) |
| 60 to 89 Minutes | 0 (0.0%) | 0 (0.0%) |
| 90 or more Minutes | 2 (2.4%) | 2 (3.1%) |
Time of Departure to Work by Sex in Diagonal
The most frequent times of departure to work in Diagonal are 8:00 AM to 8:29 AM (19, 22.9%) for males and 7:00 AM to 7:29 AM (14, 21.9%) for females.
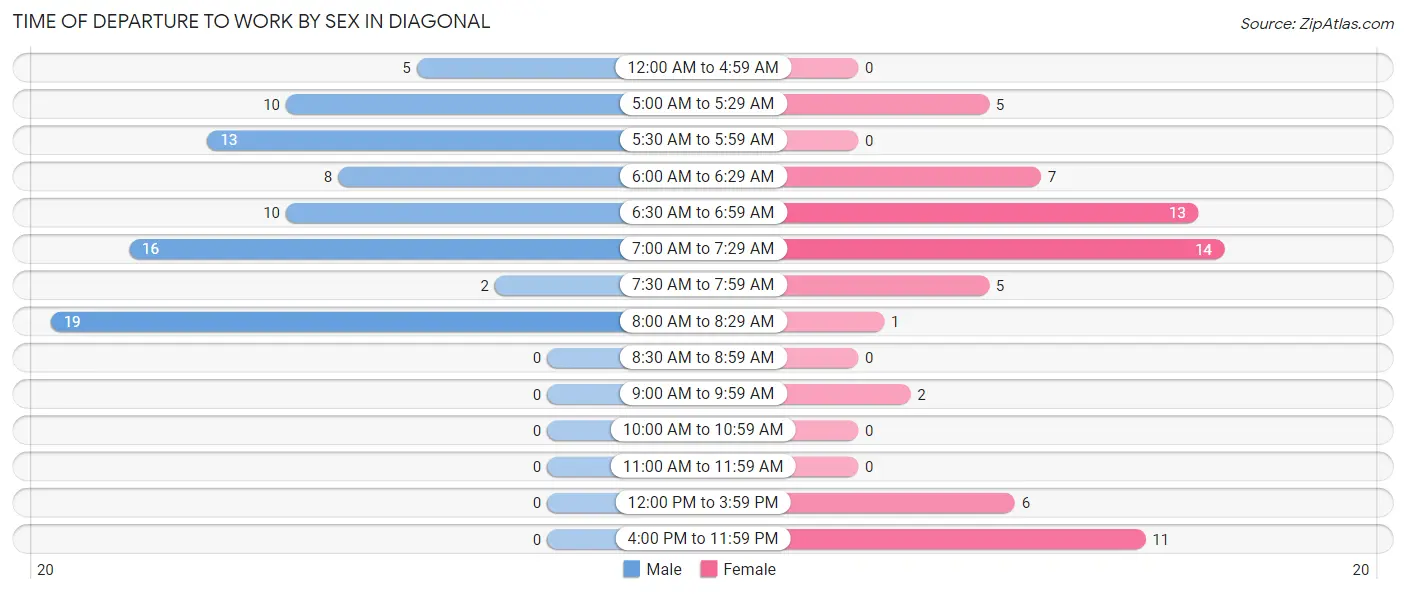
| Time of Departure | Male | Female |
| 12:00 AM to 4:59 AM | 5 (6.0%) | 0 (0.0%) |
| 5:00 AM to 5:29 AM | 10 (12.0%) | 5 (7.8%) |
| 5:30 AM to 5:59 AM | 13 (15.7%) | 0 (0.0%) |
| 6:00 AM to 6:29 AM | 8 (9.6%) | 7 (10.9%) |
| 6:30 AM to 6:59 AM | 10 (12.0%) | 13 (20.3%) |
| 7:00 AM to 7:29 AM | 16 (19.3%) | 14 (21.9%) |
| 7:30 AM to 7:59 AM | 2 (2.4%) | 5 (7.8%) |
| 8:00 AM to 8:29 AM | 19 (22.9%) | 1 (1.6%) |
| 8:30 AM to 8:59 AM | 0 (0.0%) | 0 (0.0%) |
| 9:00 AM to 9:59 AM | 0 (0.0%) | 2 (3.1%) |
| 10:00 AM to 10:59 AM | 0 (0.0%) | 0 (0.0%) |
| 11:00 AM to 11:59 AM | 0 (0.0%) | 0 (0.0%) |
| 12:00 PM to 3:59 PM | 0 (0.0%) | 6 (9.4%) |
| 4:00 PM to 11:59 PM | 0 (0.0%) | 11 (17.2%) |
| Total | 83 (100.0%) | 64 (100.0%) |
Housing Occupancy in Diagonal
Occupancy by Ownership in Diagonal
Of the total 130 dwellings in Diagonal, owner-occupied units account for 114 (87.7%), while renter-occupied units make up 16 (12.3%).
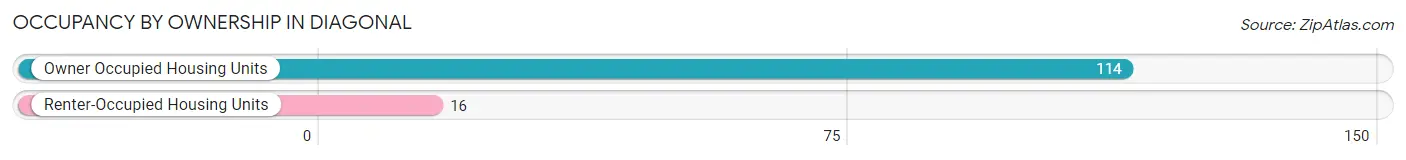
| Occupancy | # Housing Units | % Housing Units |
| Owner Occupied Housing Units | 114 | 87.7% |
| Renter-Occupied Housing Units | 16 | 12.3% |
| Total Occupied Housing Units | 130 | 100.0% |
Occupancy by Household Size in Diagonal
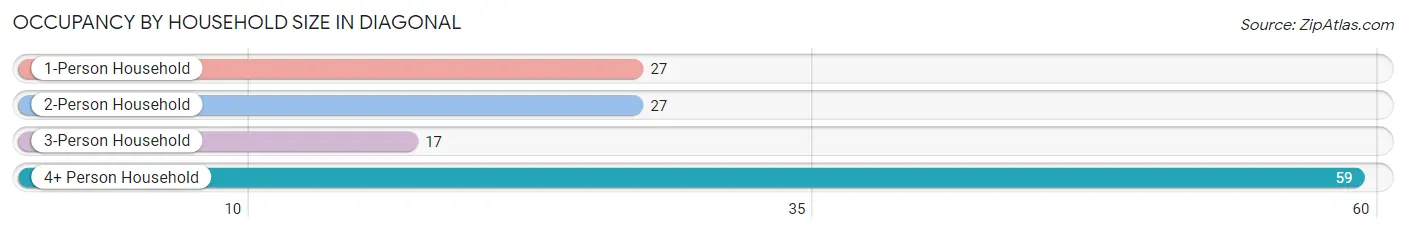
| Household Size | # Housing Units | % Housing Units |
| 1-Person Household | 27 | 20.8% |
| 2-Person Household | 27 | 20.8% |
| 3-Person Household | 17 | 13.1% |
| 4+ Person Household | 59 | 45.4% |
| Total Housing Units | 130 | 100.0% |
Occupancy by Ownership by Household Size in Diagonal
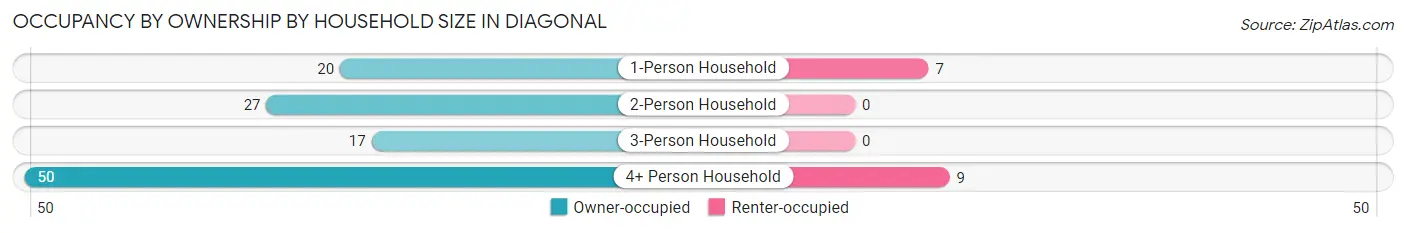
| Household Size | Owner-occupied | Renter-occupied |
| 1-Person Household | 20 (74.1%) | 7 (25.9%) |
| 2-Person Household | 27 (100.0%) | 0 (0.0%) |
| 3-Person Household | 17 (100.0%) | 0 (0.0%) |
| 4+ Person Household | 50 (84.8%) | 9 (15.2%) |
| Total Housing Units | 114 (87.7%) | 16 (12.3%) |
Occupancy by Educational Attainment in Diagonal
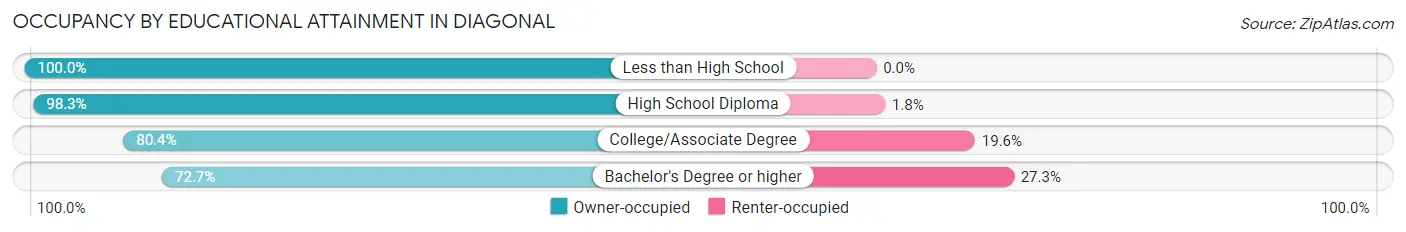
| Household Size | Owner-occupied | Renter-occupied |
| Less than High School | 5 (100.0%) | 0 (0.0%) |
| High School Diploma | 56 (98.3%) | 1 (1.8%) |
| College/Associate Degree | 37 (80.4%) | 9 (19.6%) |
| Bachelor's Degree or higher | 16 (72.7%) | 6 (27.3%) |
Occupancy by Age of Householder in Diagonal
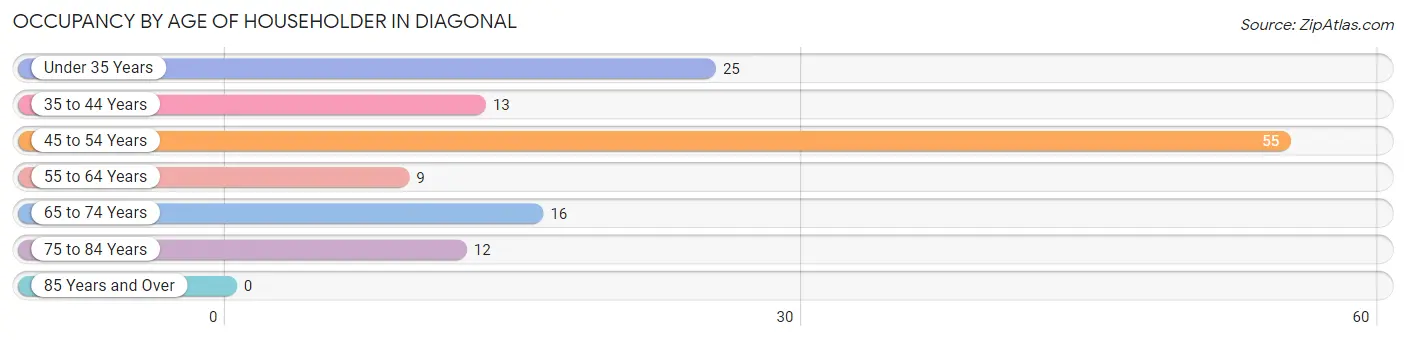
| Age Bracket | # Households | % Households |
| Under 35 Years | 25 | 19.2% |
| 35 to 44 Years | 13 | 10.0% |
| 45 to 54 Years | 55 | 42.3% |
| 55 to 64 Years | 9 | 6.9% |
| 65 to 74 Years | 16 | 12.3% |
| 75 to 84 Years | 12 | 9.2% |
| 85 Years and Over | 0 | 0.0% |
| Total | 130 | 100.0% |
Housing Finances in Diagonal
Median Income by Occupancy in Diagonal
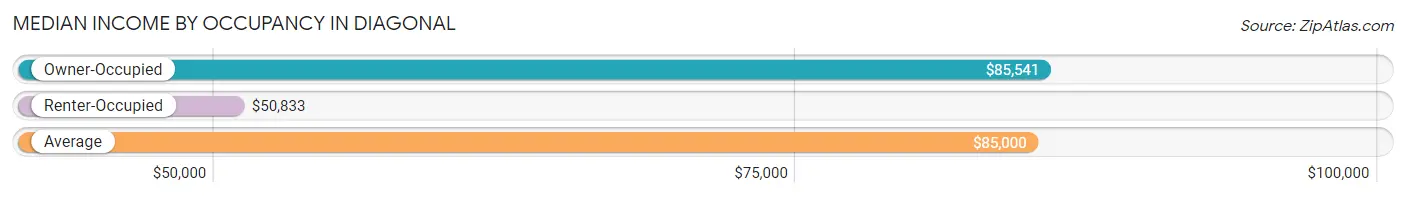
| Occupancy Type | # Households | Median Income |
| Owner-Occupied | 114 (87.7%) | $85,541 |
| Renter-Occupied | 16 (12.3%) | $50,833 |
| Average | 130 (100.0%) | $85,000 |
Occupancy by Householder Income Bracket in Diagonal
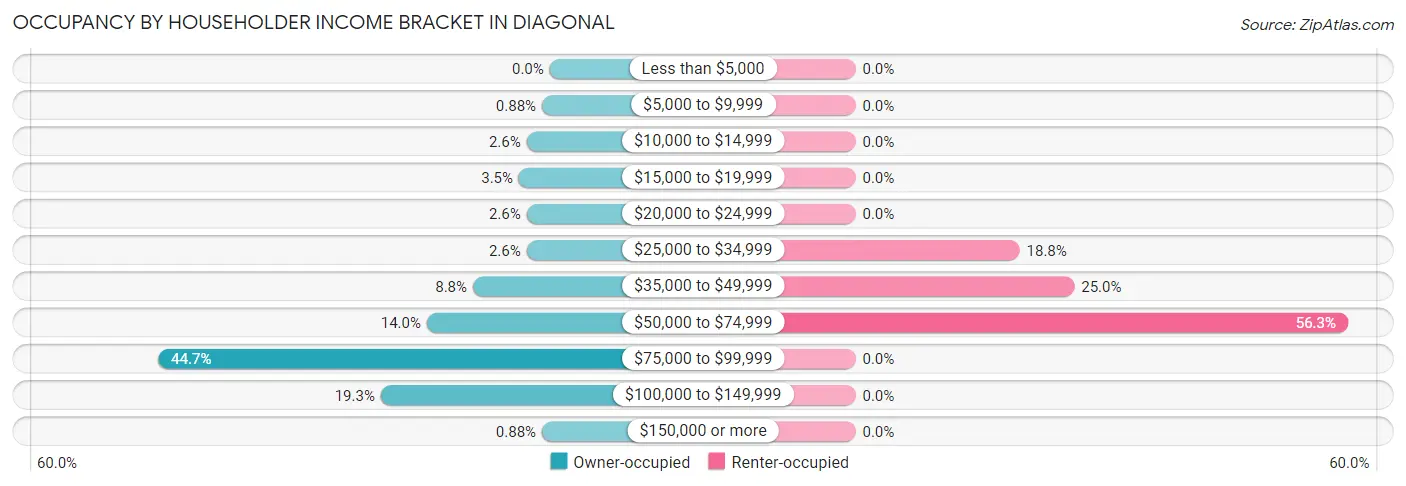
| Income Bracket | Owner-occupied | Renter-occupied |
| Less than $5,000 | 0 (0.0%) | 0 (0.0%) |
| $5,000 to $9,999 | 1 (0.9%) | 0 (0.0%) |
| $10,000 to $14,999 | 3 (2.6%) | 0 (0.0%) |
| $15,000 to $19,999 | 4 (3.5%) | 0 (0.0%) |
| $20,000 to $24,999 | 3 (2.6%) | 0 (0.0%) |
| $25,000 to $34,999 | 3 (2.6%) | 3 (18.8%) |
| $35,000 to $49,999 | 10 (8.8%) | 4 (25.0%) |
| $50,000 to $74,999 | 16 (14.0%) | 9 (56.2%) |
| $75,000 to $99,999 | 51 (44.7%) | 0 (0.0%) |
| $100,000 to $149,999 | 22 (19.3%) | 0 (0.0%) |
| $150,000 or more | 1 (0.9%) | 0 (0.0%) |
| Total | 114 (100.0%) | 16 (100.0%) |
Monthly Housing Cost Tiers in Diagonal
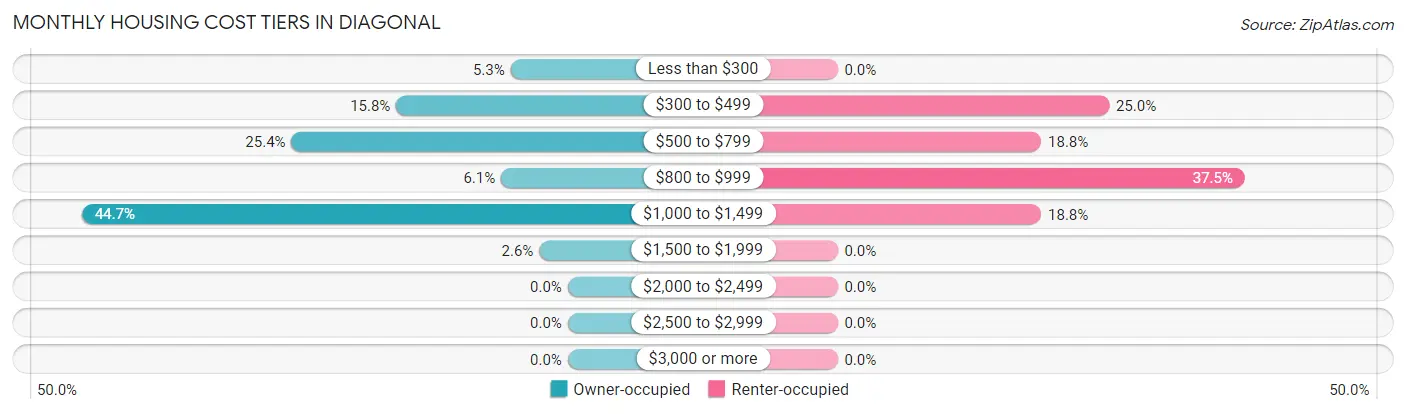
| Monthly Cost | Owner-occupied | Renter-occupied |
| Less than $300 | 6 (5.3%) | 0 (0.0%) |
| $300 to $499 | 18 (15.8%) | 4 (25.0%) |
| $500 to $799 | 29 (25.4%) | 3 (18.8%) |
| $800 to $999 | 7 (6.1%) | 6 (37.5%) |
| $1,000 to $1,499 | 51 (44.7%) | 3 (18.8%) |
| $1,500 to $1,999 | 3 (2.6%) | 0 (0.0%) |
| $2,000 to $2,499 | 0 (0.0%) | 0 (0.0%) |
| $2,500 to $2,999 | 0 (0.0%) | 0 (0.0%) |
| $3,000 or more | 0 (0.0%) | 0 (0.0%) |
| Total | 114 (100.0%) | 16 (100.0%) |
Physical Housing Characteristics in Diagonal
Housing Structures in Diagonal
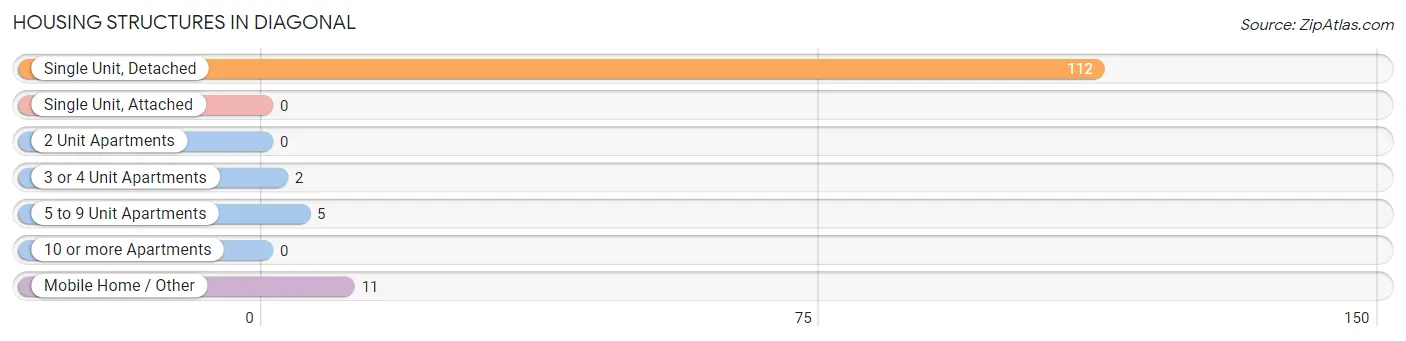
| Structure Type | # Housing Units | % Housing Units |
| Single Unit, Detached | 112 | 86.2% |
| Single Unit, Attached | 0 | 0.0% |
| 2 Unit Apartments | 0 | 0.0% |
| 3 or 4 Unit Apartments | 2 | 1.5% |
| 5 to 9 Unit Apartments | 5 | 3.8% |
| 10 or more Apartments | 0 | 0.0% |
| Mobile Home / Other | 11 | 8.5% |
| Total | 130 | 100.0% |
Housing Structures by Occupancy in Diagonal
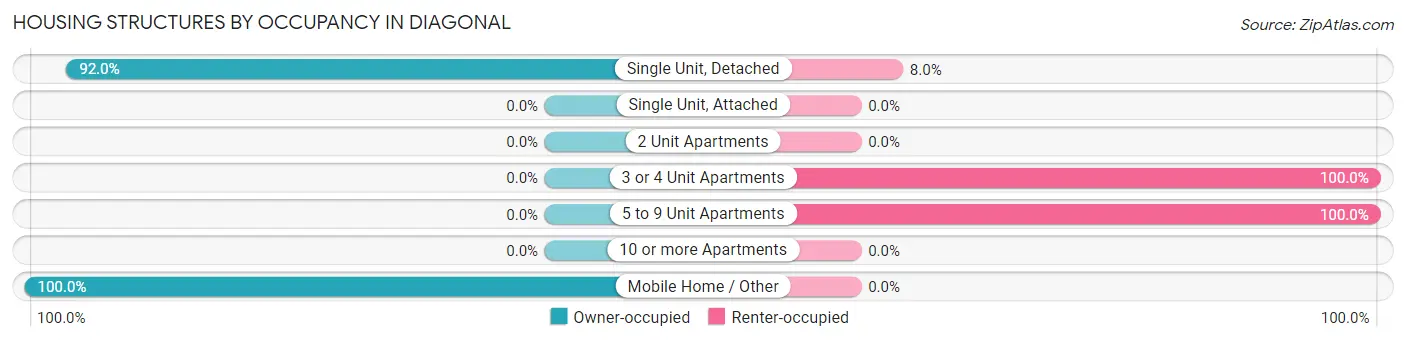
| Structure Type | Owner-occupied | Renter-occupied |
| Single Unit, Detached | 103 (92.0%) | 9 (8.0%) |
| Single Unit, Attached | 0 (0.0%) | 0 (0.0%) |
| 2 Unit Apartments | 0 (0.0%) | 0 (0.0%) |
| 3 or 4 Unit Apartments | 0 (0.0%) | 2 (100.0%) |
| 5 to 9 Unit Apartments | 0 (0.0%) | 5 (100.0%) |
| 10 or more Apartments | 0 (0.0%) | 0 (0.0%) |
| Mobile Home / Other | 11 (100.0%) | 0 (0.0%) |
| Total | 114 (87.7%) | 16 (12.3%) |
Housing Structures by Number of Rooms in Diagonal
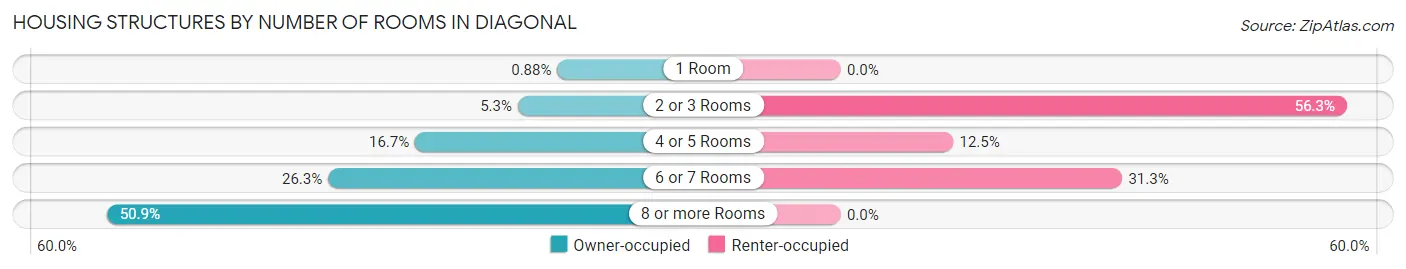
| Number of Rooms | Owner-occupied | Renter-occupied |
| 1 Room | 1 (0.9%) | 0 (0.0%) |
| 2 or 3 Rooms | 6 (5.3%) | 9 (56.2%) |
| 4 or 5 Rooms | 19 (16.7%) | 2 (12.5%) |
| 6 or 7 Rooms | 30 (26.3%) | 5 (31.2%) |
| 8 or more Rooms | 58 (50.9%) | 0 (0.0%) |
| Total | 114 (100.0%) | 16 (100.0%) |
Housing Structure by Heating Type in Diagonal
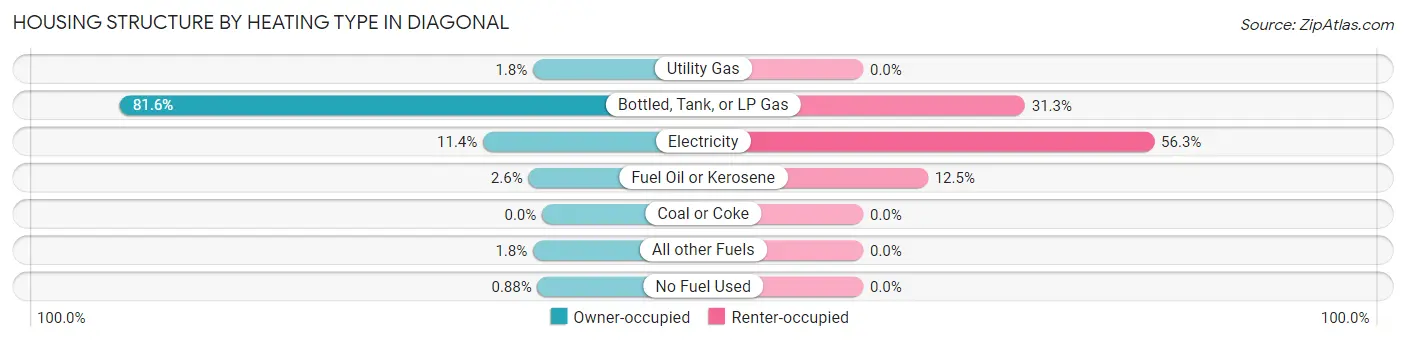
| Heating Type | Owner-occupied | Renter-occupied |
| Utility Gas | 2 (1.8%) | 0 (0.0%) |
| Bottled, Tank, or LP Gas | 93 (81.6%) | 5 (31.2%) |
| Electricity | 13 (11.4%) | 9 (56.2%) |
| Fuel Oil or Kerosene | 3 (2.6%) | 2 (12.5%) |
| Coal or Coke | 0 (0.0%) | 0 (0.0%) |
| All other Fuels | 2 (1.8%) | 0 (0.0%) |
| No Fuel Used | 1 (0.9%) | 0 (0.0%) |
| Total | 114 (100.0%) | 16 (100.0%) |
Household Vehicle Usage in Diagonal
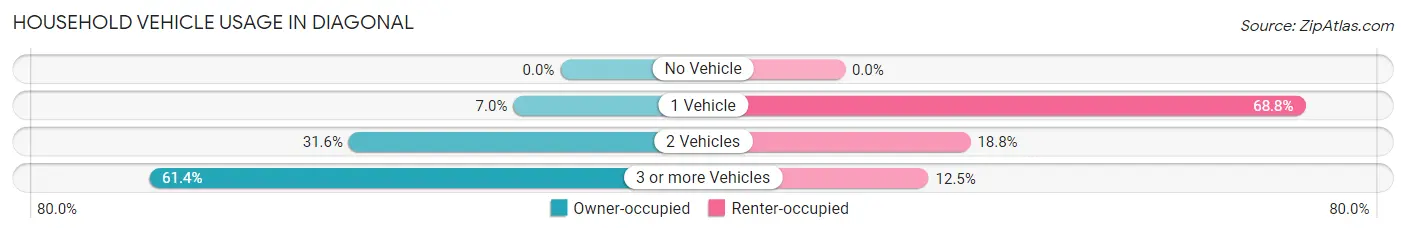
| Vehicles per Household | Owner-occupied | Renter-occupied |
| No Vehicle | 0 (0.0%) | 0 (0.0%) |
| 1 Vehicle | 8 (7.0%) | 11 (68.8%) |
| 2 Vehicles | 36 (31.6%) | 3 (18.8%) |
| 3 or more Vehicles | 70 (61.4%) | 2 (12.5%) |
| Total | 114 (100.0%) | 16 (100.0%) |
Real Estate & Mortgages in Diagonal
Real Estate and Mortgage Overview in Diagonal
| Characteristic | Without Mortgage | With Mortgage |
| Housing Units | 44 | 70 |
| Median Property Value | $80,000 | $86,300 |
| Median Household Income | $61,250 | $0 |
| Monthly Housing Costs | $482 | $0 |
| Real Estate Taxes | $1,000 | $0 |
Property Value by Mortgage Status in Diagonal
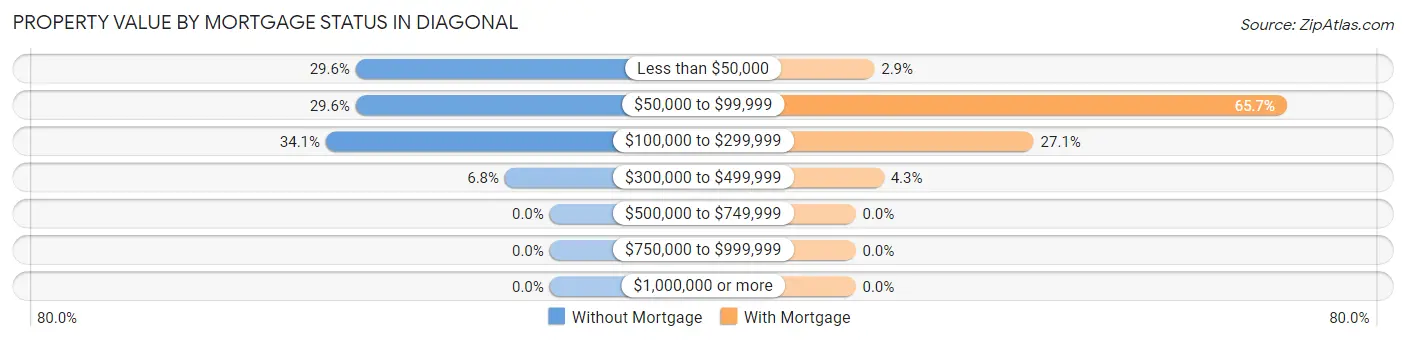
| Property Value | Without Mortgage | With Mortgage |
| Less than $50,000 | 13 (29.5%) | 2 (2.9%) |
| $50,000 to $99,999 | 13 (29.5%) | 46 (65.7%) |
| $100,000 to $299,999 | 15 (34.1%) | 19 (27.1%) |
| $300,000 to $499,999 | 3 (6.8%) | 3 (4.3%) |
| $500,000 to $749,999 | 0 (0.0%) | 0 (0.0%) |
| $750,000 to $999,999 | 0 (0.0%) | 0 (0.0%) |
| $1,000,000 or more | 0 (0.0%) | 0 (0.0%) |
| Total | 44 (100.0%) | 70 (100.0%) |
Household Income by Mortgage Status in Diagonal
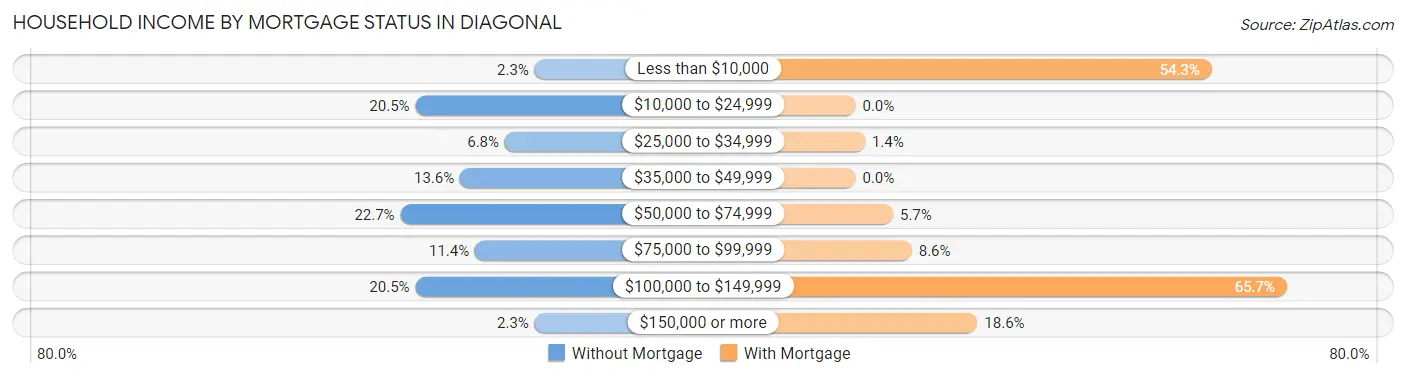
| Household Income | Without Mortgage | With Mortgage |
| Less than $10,000 | 1 (2.3%) | 38 (54.3%) |
| $10,000 to $24,999 | 9 (20.4%) | 0 (0.0%) |
| $25,000 to $34,999 | 3 (6.8%) | 1 (1.4%) |
| $35,000 to $49,999 | 6 (13.6%) | 0 (0.0%) |
| $50,000 to $74,999 | 10 (22.7%) | 4 (5.7%) |
| $75,000 to $99,999 | 5 (11.4%) | 6 (8.6%) |
| $100,000 to $149,999 | 9 (20.4%) | 46 (65.7%) |
| $150,000 or more | 1 (2.3%) | 13 (18.6%) |
| Total | 44 (100.0%) | 70 (100.0%) |
Property Value to Household Income Ratio in Diagonal
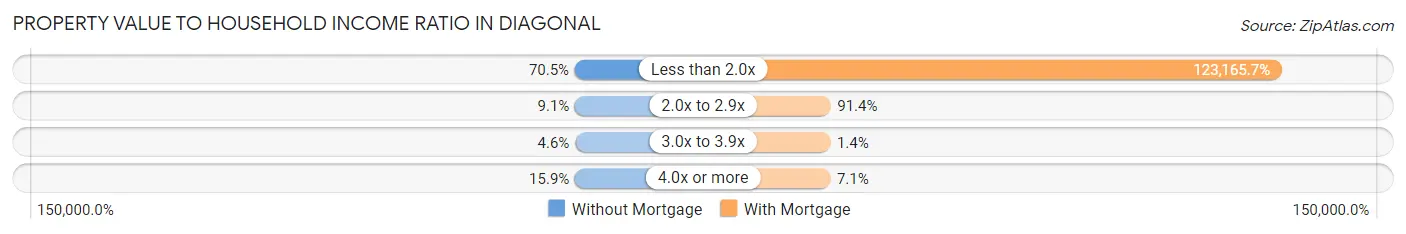
| Value-to-Income Ratio | Without Mortgage | With Mortgage |
| Less than 2.0x | 31 (70.5%) | 86,216 (123,165.7%) |
| 2.0x to 2.9x | 4 (9.1%) | 64 (91.4%) |
| 3.0x to 3.9x | 2 (4.5%) | 1 (1.4%) |
| 4.0x or more | 7 (15.9%) | 5 (7.1%) |
| Total | 44 (100.0%) | 70 (100.0%) |
Real Estate Taxes by Mortgage Status in Diagonal
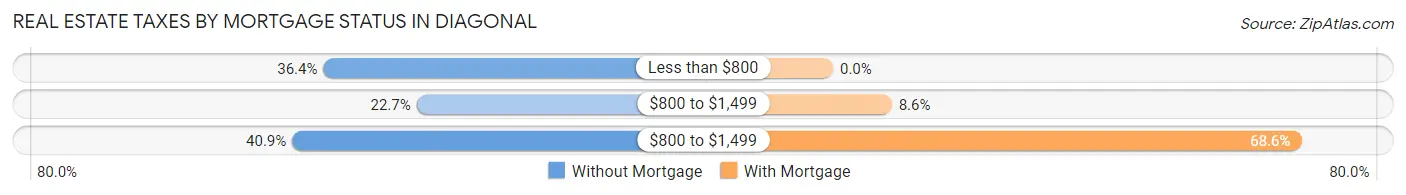
| Property Taxes | Without Mortgage | With Mortgage |
| Less than $800 | 16 (36.4%) | 0 (0.0%) |
| $800 to $1,499 | 10 (22.7%) | 6 (8.6%) |
| $800 to $1,499 | 18 (40.9%) | 48 (68.6%) |
| Total | 44 (100.0%) | 70 (100.0%) |
Health & Disability in Diagonal
Health Insurance Coverage by Age in Diagonal
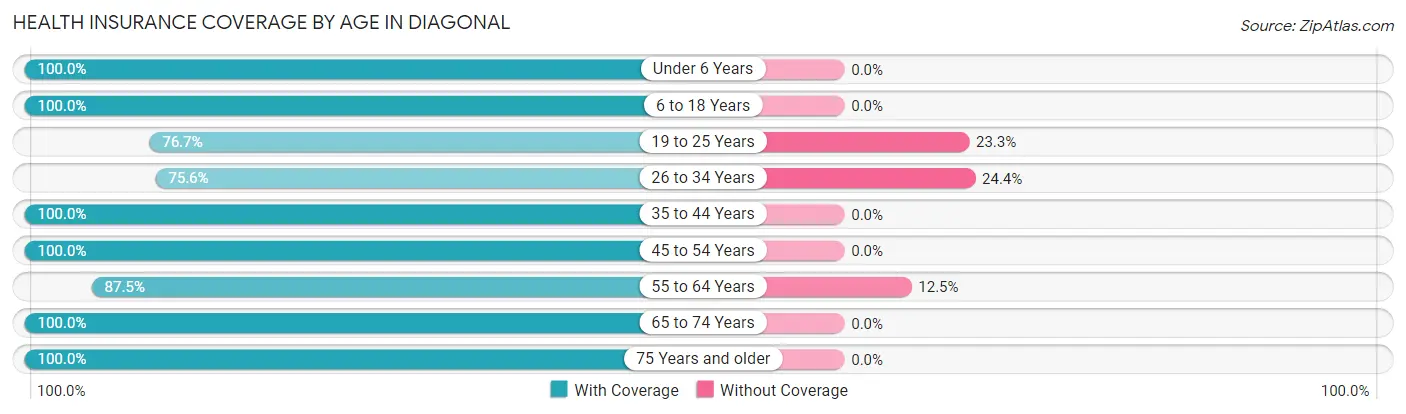
| Age Bracket | With Coverage | Without Coverage |
| Under 6 Years | 26 (100.0%) | 0 (0.0%) |
| 6 to 18 Years | 68 (100.0%) | 0 (0.0%) |
| 19 to 25 Years | 33 (76.7%) | 10 (23.3%) |
| 26 to 34 Years | 31 (75.6%) | 10 (24.4%) |
| 35 to 44 Years | 29 (100.0%) | 0 (0.0%) |
| 45 to 54 Years | 63 (100.0%) | 0 (0.0%) |
| 55 to 64 Years | 14 (87.5%) | 2 (12.5%) |
| 65 to 74 Years | 32 (100.0%) | 0 (0.0%) |
| 75 Years and older | 12 (100.0%) | 0 (0.0%) |
| Total | 308 (93.3%) | 22 (6.7%) |
Health Insurance Coverage by Citizenship Status in Diagonal
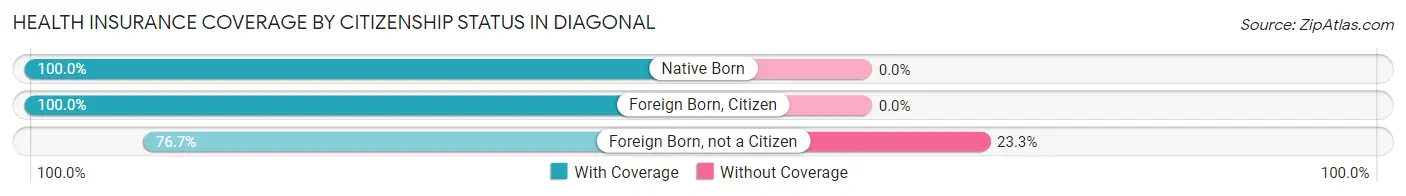
| Citizenship Status | With Coverage | Without Coverage |
| Native Born | 26 (100.0%) | 0 (0.0%) |
| Foreign Born, Citizen | 68 (100.0%) | 0 (0.0%) |
| Foreign Born, not a Citizen | 33 (76.7%) | 10 (23.3%) |
Health Insurance Coverage by Household Income in Diagonal
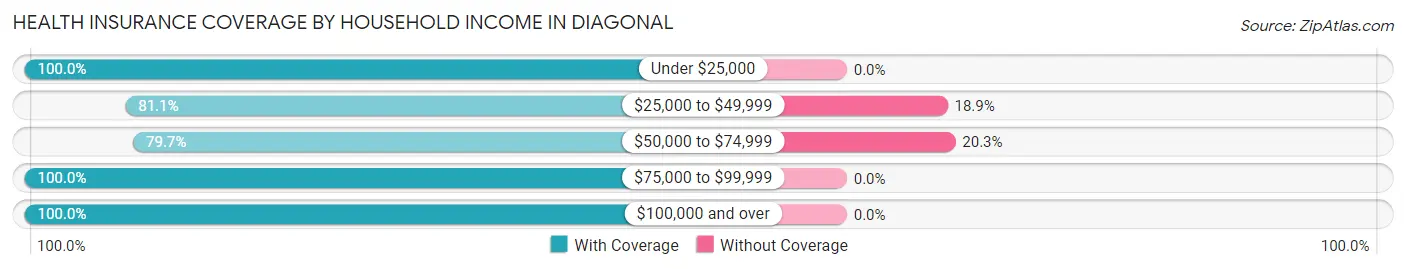
| Household Income | With Coverage | Without Coverage |
| Under $25,000 | 11 (100.0%) | 0 (0.0%) |
| $25,000 to $49,999 | 43 (81.1%) | 10 (18.9%) |
| $50,000 to $74,999 | 47 (79.7%) | 12 (20.3%) |
| $75,000 to $99,999 | 121 (100.0%) | 0 (0.0%) |
| $100,000 and over | 86 (100.0%) | 0 (0.0%) |
Public vs Private Health Insurance Coverage by Age in Diagonal
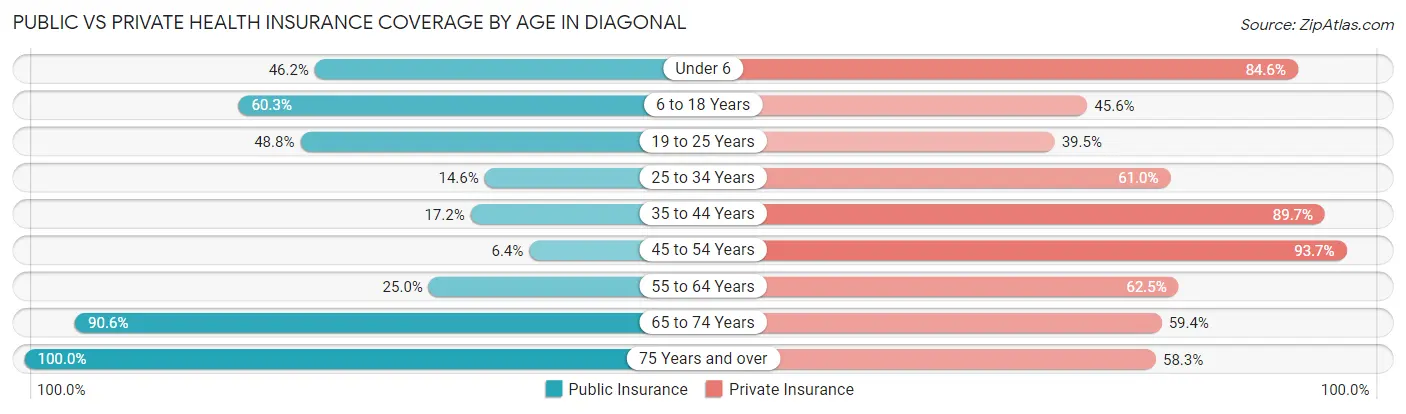
| Age Bracket | Public Insurance | Private Insurance |
| Under 6 | 12 (46.2%) | 22 (84.6%) |
| 6 to 18 Years | 41 (60.3%) | 31 (45.6%) |
| 19 to 25 Years | 21 (48.8%) | 17 (39.5%) |
| 25 to 34 Years | 6 (14.6%) | 25 (61.0%) |
| 35 to 44 Years | 5 (17.2%) | 26 (89.7%) |
| 45 to 54 Years | 4 (6.4%) | 59 (93.6%) |
| 55 to 64 Years | 4 (25.0%) | 10 (62.5%) |
| 65 to 74 Years | 29 (90.6%) | 19 (59.4%) |
| 75 Years and over | 12 (100.0%) | 7 (58.3%) |
| Total | 134 (40.6%) | 216 (65.4%) |
Disability Status by Sex by Age in Diagonal
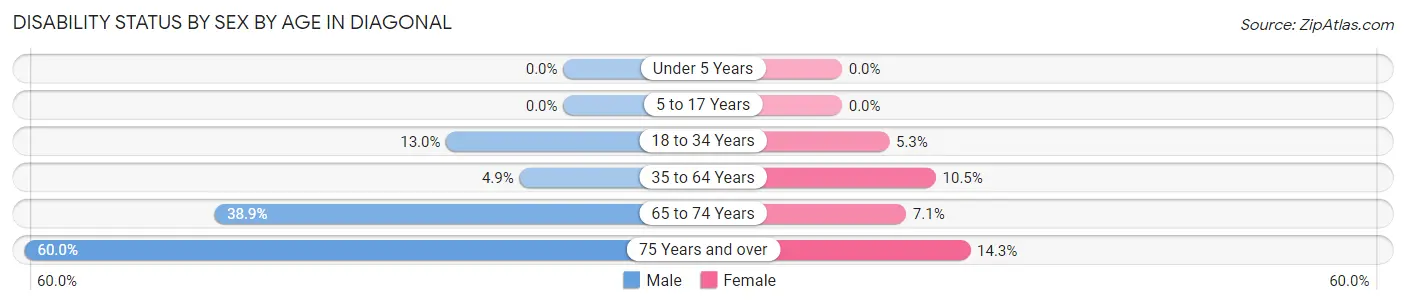
| Age Bracket | Male | Female |
| Under 5 Years | 0 (0.0%) | 0 (0.0%) |
| 5 to 17 Years | 0 (0.0%) | 0 (0.0%) |
| 18 to 34 Years | 6 (13.0%) | 2 (5.3%) |
| 35 to 64 Years | 2 (4.9%) | 7 (10.4%) |
| 65 to 74 Years | 7 (38.9%) | 1 (7.1%) |
| 75 Years and over | 3 (60.0%) | 1 (14.3%) |
Disability Class by Sex by Age in Diagonal
Disability Class: Hearing Difficulty
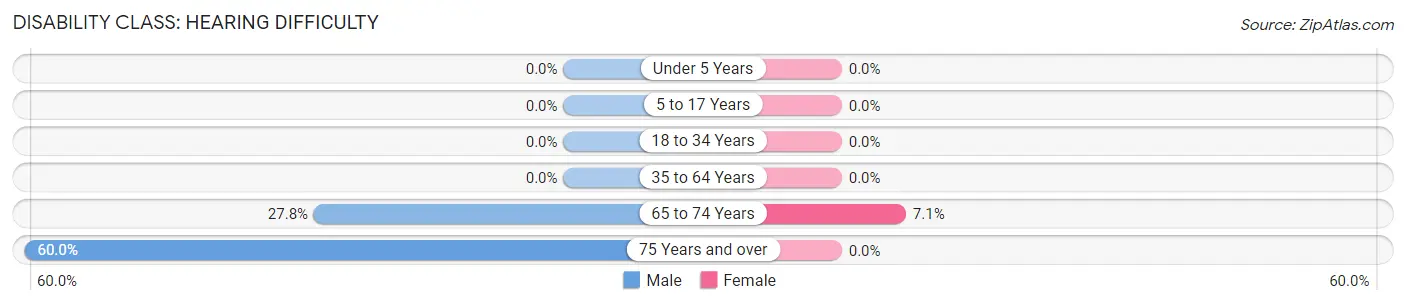
| Age Bracket | Male | Female |
| Under 5 Years | 0 (0.0%) | 0 (0.0%) |
| 5 to 17 Years | 0 (0.0%) | 0 (0.0%) |
| 18 to 34 Years | 0 (0.0%) | 0 (0.0%) |
| 35 to 64 Years | 0 (0.0%) | 0 (0.0%) |
| 65 to 74 Years | 5 (27.8%) | 1 (7.1%) |
| 75 Years and over | 3 (60.0%) | 0 (0.0%) |
Disability Class: Vision Difficulty
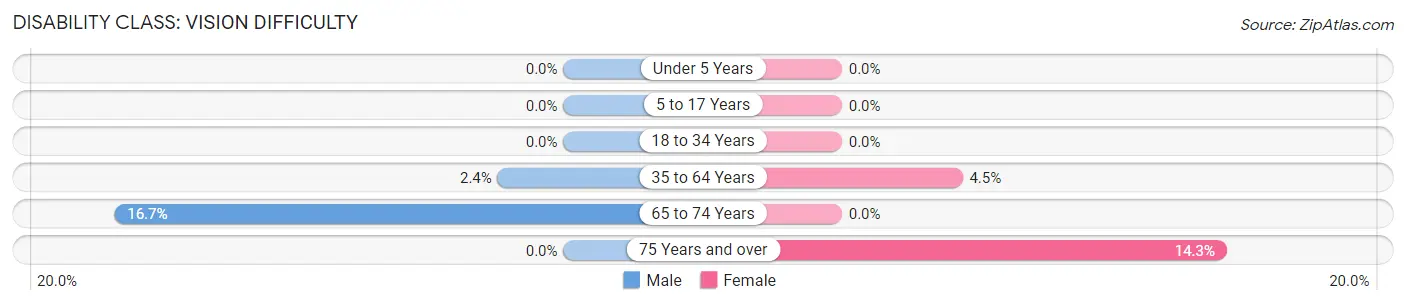
| Age Bracket | Male | Female |
| Under 5 Years | 0 (0.0%) | 0 (0.0%) |
| 5 to 17 Years | 0 (0.0%) | 0 (0.0%) |
| 18 to 34 Years | 0 (0.0%) | 0 (0.0%) |
| 35 to 64 Years | 1 (2.4%) | 3 (4.5%) |
| 65 to 74 Years | 3 (16.7%) | 0 (0.0%) |
| 75 Years and over | 0 (0.0%) | 1 (14.3%) |
Disability Class: Cognitive Difficulty
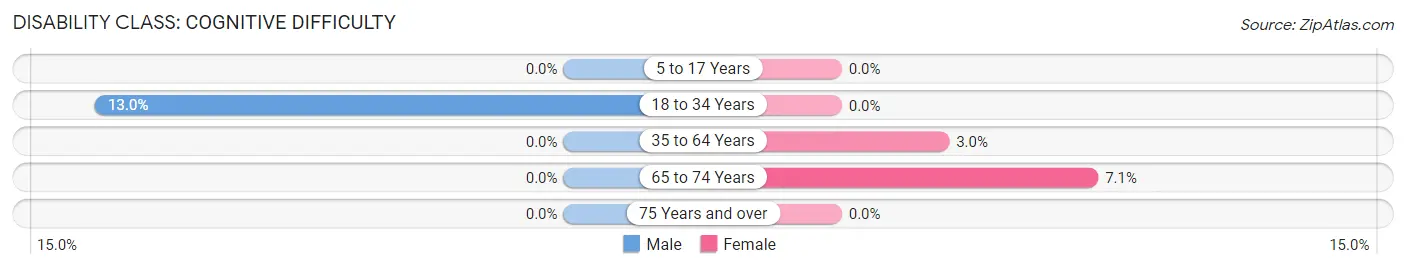
| Age Bracket | Male | Female |
| 5 to 17 Years | 0 (0.0%) | 0 (0.0%) |
| 18 to 34 Years | 6 (13.0%) | 0 (0.0%) |
| 35 to 64 Years | 0 (0.0%) | 2 (3.0%) |
| 65 to 74 Years | 0 (0.0%) | 1 (7.1%) |
| 75 Years and over | 0 (0.0%) | 0 (0.0%) |
Disability Class: Ambulatory Difficulty
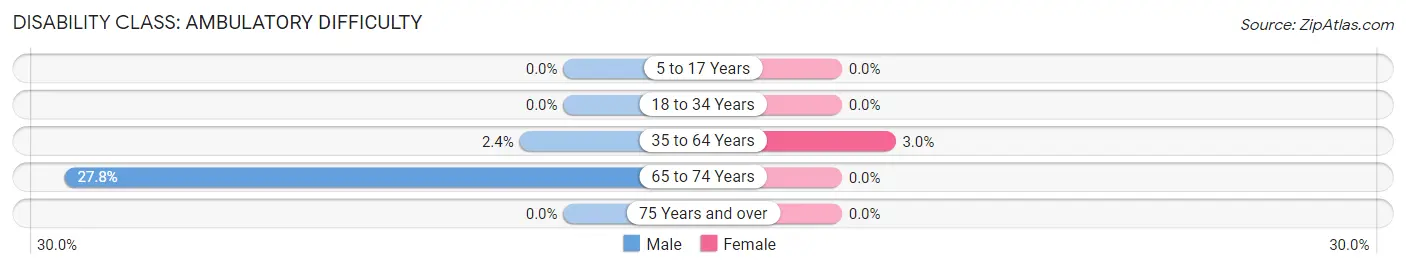
| Age Bracket | Male | Female |
| 5 to 17 Years | 0 (0.0%) | 0 (0.0%) |
| 18 to 34 Years | 0 (0.0%) | 0 (0.0%) |
| 35 to 64 Years | 1 (2.4%) | 2 (3.0%) |
| 65 to 74 Years | 5 (27.8%) | 0 (0.0%) |
| 75 Years and over | 0 (0.0%) | 0 (0.0%) |
Disability Class: Self-Care Difficulty
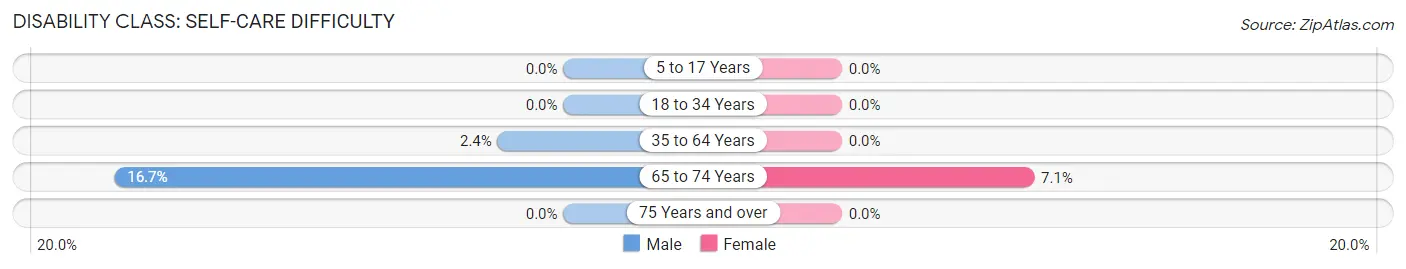
| Age Bracket | Male | Female |
| 5 to 17 Years | 0 (0.0%) | 0 (0.0%) |
| 18 to 34 Years | 0 (0.0%) | 0 (0.0%) |
| 35 to 64 Years | 1 (2.4%) | 0 (0.0%) |
| 65 to 74 Years | 3 (16.7%) | 1 (7.1%) |
| 75 Years and over | 0 (0.0%) | 0 (0.0%) |
Technology Access in Diagonal
Computing Device Access in Diagonal
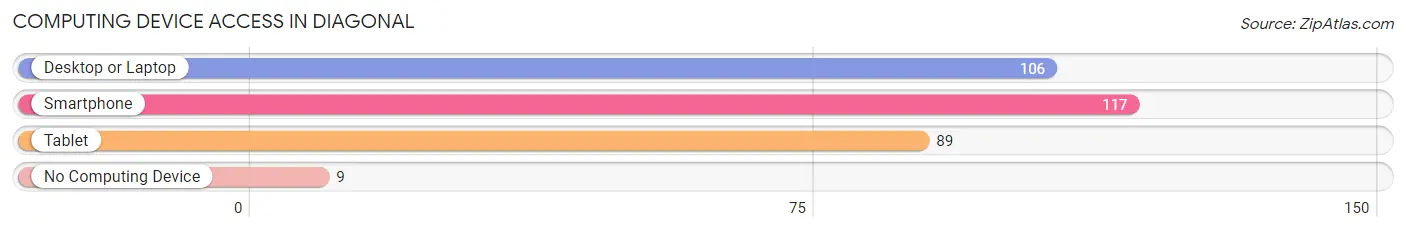
| Device Type | # Households | % Households |
| Desktop or Laptop | 106 | 81.5% |
| Smartphone | 117 | 90.0% |
| Tablet | 89 | 68.5% |
| No Computing Device | 9 | 6.9% |
| Total | 130 | 100.0% |
Internet Access in Diagonal
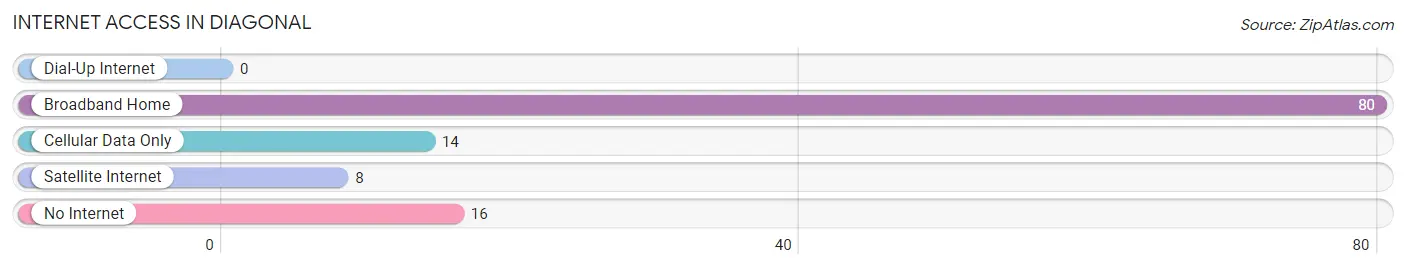
| Internet Type | # Households | % Households |
| Dial-Up Internet | 0 | 0.0% |
| Broadband Home | 80 | 61.5% |
| Cellular Data Only | 14 | 10.8% |
| Satellite Internet | 8 | 6.1% |
| No Internet | 16 | 12.3% |
| Total | 130 | 100.0% |
Diagonal Summary
IA History
Iowa, located in the Midwestern United States, was first explored by French explorers in the late 1600s. The area was part of the Louisiana Purchase in 1803, and was part of the Michigan Territory until 1838 when it became the Iowa Territory. Iowa was admitted to the Union as the 29th state in 1846.
The first settlers in Iowa were mostly of European descent, primarily from Germany, England, and Ireland. The first permanent settlement was established in 1833 at Dubuque. The population of Iowa grew rapidly in the mid-1800s, with the majority of settlers coming from the eastern United States.
During the Civil War, Iowa was a major supplier of food and other supplies to the Union Army. Iowa also provided more than 75,000 soldiers to the Union Army, and more than 1,000 Iowans died in the war.
In the late 1800s, Iowa experienced a period of rapid industrialization and urbanization. The population of Iowa grew from 674,913 in 1880 to 1,624,615 in 1900. This growth was largely due to the influx of immigrants from Europe, as well as the growth of the railroad industry.
In the early 1900s, Iowa was a major producer of corn, hogs, and other agricultural products. The state also became a major center for manufacturing, with companies such as John Deere, Maytag, and Amana Refrigeration establishing factories in the state.
Geography
Iowa is located in the Midwestern United States, bordered by Minnesota to the north, Wisconsin and Illinois to the east, Missouri to the south, and South Dakota and Nebraska to the west. The state has an area of 56,272 square miles, making it the 26th largest state in the country.
Iowa is divided into 99 counties, and is home to more than 3 million people. The state is divided into five distinct geographic regions: the Driftless Area in the northeast, the Central Plains in the center, the Des Moines Lobe in the southeast, the Loess Hills in the southwest, and the Dissected Till Plains in the northwest.
The state is home to several major rivers, including the Mississippi, Missouri, and Des Moines. The state also has numerous lakes, including Clear Lake, Spirit Lake, and Lake Okoboji.
Economy
Iowa has a diverse economy, with a mix of agriculture, manufacturing, and services. The state is a major producer of corn, soybeans, hogs, and eggs. Iowa is also a major producer of ethanol, and is the leading producer of wind energy in the United States.
Manufacturing is a major part of the state’s economy, with companies such as John Deere, Maytag, and Amana Refrigeration having factories in the state. The state is also home to several major insurance companies, including Principal Financial Group and Wellmark Blue Cross Blue Shield.
The state’s service sector is also important, with the state’s largest employers being the University of Iowa, Mercy Medical Center, and the Iowa Department of Human Services.
Demographics
As of the 2010 census, Iowa had a population of 3,046,355. The state is predominantly white, with non-Hispanic whites making up 91.3% of the population. The state also has a large Hispanic population, with Hispanics making up 5.5% of the population.
The state’s largest cities are Des Moines, Cedar Rapids, Davenport, Sioux City, and Waterloo. The state’s capital is Des Moines, which is also the largest city in the state.
Iowa is a predominantly Christian state, with the largest denominations being the Catholic Church, the United Methodist Church, and the Lutheran Church. The state also has a large Jewish population, with the largest concentration being in Des Moines.
Common Questions
What is Per Capita Income in Diagonal?
Per Capita income in Diagonal is $21,866.
What is the Median Family Income in Diagonal?
Median Family Income in Diagonal is $83,322.
What is the Median Household income in Diagonal?
Median Household Income in Diagonal is $85,000.
What is Income or Wage Gap in Diagonal?
Income or Wage Gap in Diagonal is 67.7%.
Women in Diagonal earn 32.3 cents for every dollar earned by a man.
What is Inequality or Gini Index in Diagonal?
Inequality or Gini Index in Diagonal is 0.26.
What is the Total Population of Diagonal?
Total Population of Diagonal is 463.
What is the Total Male Population of Diagonal?
Total Male Population of Diagonal is 198.
What is the Total Female Population of Diagonal?
Total Female Population of Diagonal is 265.
What is the Ratio of Males per 100 Females in Diagonal?
There are 74.72 Males per 100 Females in Diagonal.
What is the Ratio of Females per 100 Males in Diagonal?
There are 133.84 Females per 100 Males in Diagonal.
What is the Median Population Age in Diagonal?
Median Population Age in Diagonal is 51.9 Years.
What is the Average Family Size in Diagonal
Average Family Size in Diagonal is 2.8 People.
What is the Average Household Size in Diagonal
Average Household Size in Diagonal is 2.5 People.
How Large is the Labor Force in Diagonal?
There are 186 People in the Labor Forcein in Diagonal.
What is the Percentage of People in the Labor Force in Diagonal?
47.8% of People are in the Labor Force in Diagonal.