Corning, IA Map & Demographics
Corning Map
Corning Overview
$33,600
PER CAPITA INCOME
$83,036
AVG FAMILY INCOME
$54,500
AVG HOUSEHOLD INCOME
14.5%
WAGE / INCOME GAP [ % ]
85.5¢/ $1
WAGE / INCOME GAP [ $ ]
0.46
INEQUALITY / GINI INDEX
1,592
TOTAL POPULATION
739
MALE POPULATION
853
FEMALE POPULATION
86.64
MALES / 100 FEMALES
115.43
FEMALES / 100 MALES
44.8
MEDIAN AGE
3.0
AVG FAMILY SIZE
2.2
AVG HOUSEHOLD SIZE
709
LABOR FORCE [ PEOPLE ]
55.9%
PERCENT IN LABOR FORCE
4.5%
UNEMPLOYMENT RATE
Corning Zip Codes
Corning Area Codes
Income in Corning
Income Overview in Corning
Per Capita Income in Corning is $33,600, while median incomes of families and households are $83,036 and $54,500 respectively.
| Characteristic | Number | Measure |
| Per Capita Income | 1,592 | $33,600 |
| Median Family Income | 349 | $83,036 |
| Mean Family Income | 349 | $102,251 |
| Median Household Income | 692 | $54,500 |
| Mean Household Income | 692 | $75,939 |
| Income Deficit | 349 | $0 |
| Wage / Income Gap (%) | 1,592 | 14.50% |
| Wage / Income Gap ($) | 1,592 | 85.50¢ per $1 |
| Gini / Inequality Index | 1,592 | 0.46 |
Earnings by Sex in Corning
Average Earnings in Corning are $39,601, $43,929 for men and $37,560 for women, a difference of 14.5%.
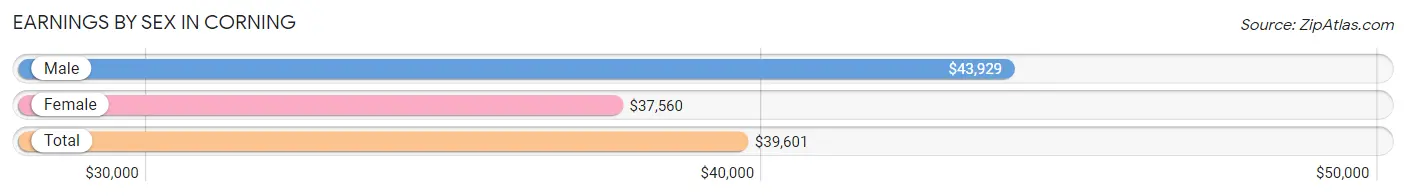
| Sex | Number | Average Earnings |
| Male | 428 (53.3%) | $43,929 |
| Female | 375 (46.7%) | $37,560 |
| Total | 803 (100.0%) | $39,601 |
Earnings by Sex by Income Bracket in Corning
The most common earnings brackets in Corning are $100,000+ for men (42 | 9.8%) and $50,000 to $54,999 for women (53 | 14.1%).
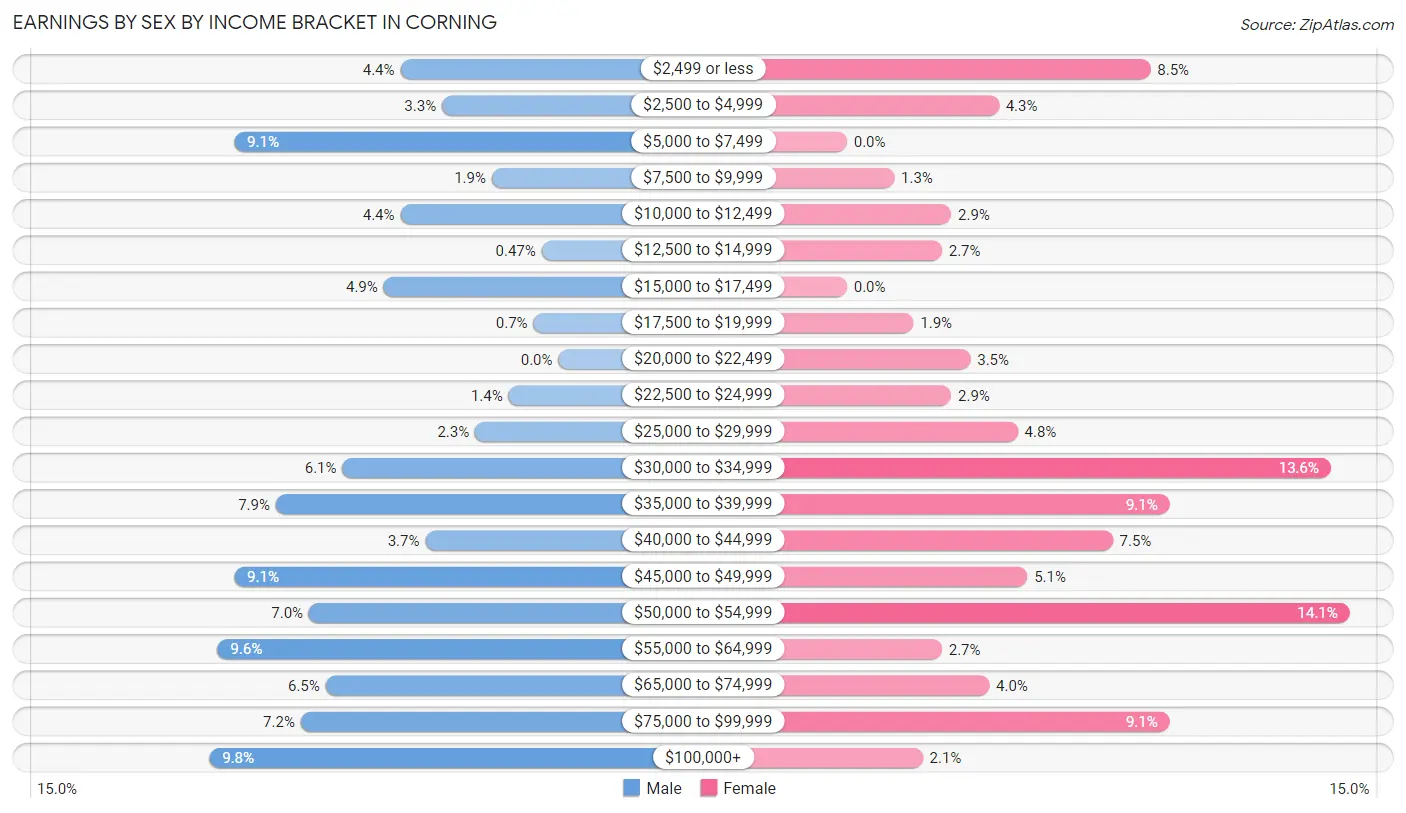
| Income | Male | Female |
| $2,499 or less | 19 (4.4%) | 32 (8.5%) |
| $2,500 to $4,999 | 14 (3.3%) | 16 (4.3%) |
| $5,000 to $7,499 | 39 (9.1%) | 0 (0.0%) |
| $7,500 to $9,999 | 8 (1.9%) | 5 (1.3%) |
| $10,000 to $12,499 | 19 (4.4%) | 11 (2.9%) |
| $12,500 to $14,999 | 2 (0.5%) | 10 (2.7%) |
| $15,000 to $17,499 | 21 (4.9%) | 0 (0.0%) |
| $17,500 to $19,999 | 3 (0.7%) | 7 (1.9%) |
| $20,000 to $22,499 | 0 (0.0%) | 13 (3.5%) |
| $22,500 to $24,999 | 6 (1.4%) | 11 (2.9%) |
| $25,000 to $29,999 | 10 (2.3%) | 18 (4.8%) |
| $30,000 to $34,999 | 26 (6.1%) | 51 (13.6%) |
| $35,000 to $39,999 | 34 (7.9%) | 34 (9.1%) |
| $40,000 to $44,999 | 16 (3.7%) | 28 (7.5%) |
| $45,000 to $49,999 | 39 (9.1%) | 19 (5.1%) |
| $50,000 to $54,999 | 30 (7.0%) | 53 (14.1%) |
| $55,000 to $64,999 | 41 (9.6%) | 10 (2.7%) |
| $65,000 to $74,999 | 28 (6.5%) | 15 (4.0%) |
| $75,000 to $99,999 | 31 (7.2%) | 34 (9.1%) |
| $100,000+ | 42 (9.8%) | 8 (2.1%) |
| Total | 428 (100.0%) | 375 (100.0%) |
Earnings by Sex by Educational Attainment in Corning
Average earnings in Corning are $46,571 for men and $39,762 for women, a difference of 14.6%. Men with an educational attainment of bachelor's degree enjoy the highest average annual earnings of $55,714, while those with college or associate's degree education earn the least with $28,500. Women with an educational attainment of graduate degree earn the most with the average annual earnings of $62,917, while those with college or associate's degree education have the smallest earnings of $32,386.
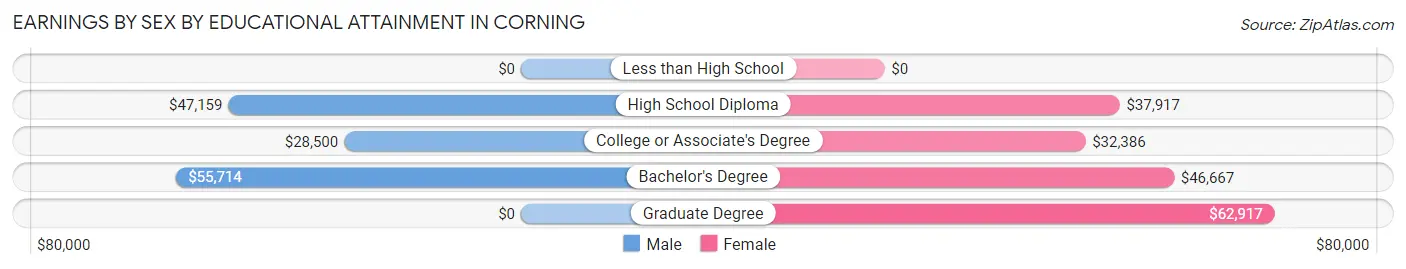
| Educational Attainment | Male Income | Female Income |
| Less than High School | - | - |
| High School Diploma | $47,159 | $37,917 |
| College or Associate's Degree | $28,500 | $32,386 |
| Bachelor's Degree | $55,714 | $46,667 |
| Graduate Degree | - | - |
| Total | $46,571 | $39,762 |
Family Income in Corning
Family Income Brackets in Corning
According to the Corning family income data, there are 104 families falling into the $75,000 to $99,999 income range, which is the most common income bracket and makes up 29.8% of all families.
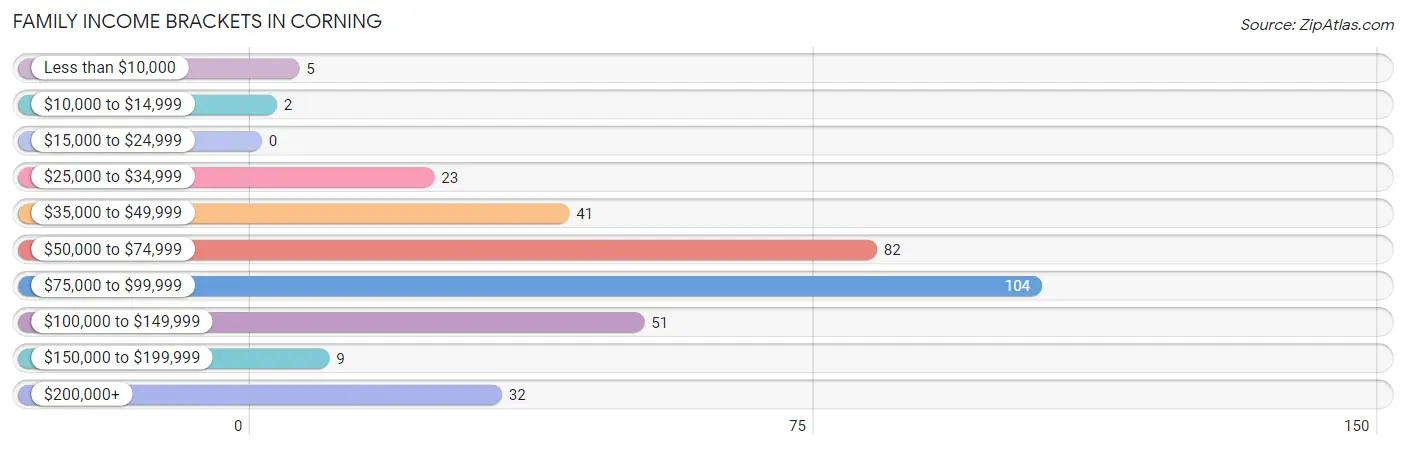
| Income Bracket | # Families | % Families |
| Less than $10,000 | 5 | 1.4% |
| $10,000 to $14,999 | 2 | 0.6% |
| $15,000 to $24,999 | 0 | 0.0% |
| $25,000 to $34,999 | 23 | 6.6% |
| $35,000 to $49,999 | 41 | 11.7% |
| $50,000 to $74,999 | 82 | 23.5% |
| $75,000 to $99,999 | 104 | 29.8% |
| $100,000 to $149,999 | 51 | 14.6% |
| $150,000 to $199,999 | 9 | 2.6% |
| $200,000+ | 32 | 9.2% |
Family Income by Famaliy Size in Corning
5-person families (38 | 10.9%) account for the highest median family income in Corning with $122,500 per family, while 2-person families (173 | 49.6%) have the highest median income of $34,062 per family member.
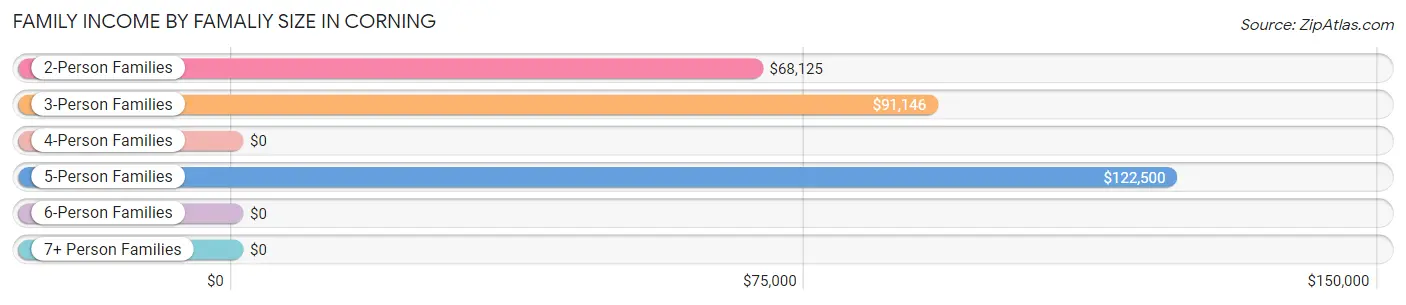
| Income Bracket | # Families | Median Income |
| 2-Person Families | 173 (49.6%) | $68,125 |
| 3-Person Families | 81 (23.2%) | $91,146 |
| 4-Person Families | 27 (7.7%) | $0 |
| 5-Person Families | 38 (10.9%) | $122,500 |
| 6-Person Families | 30 (8.6%) | $0 |
| 7+ Person Families | 0 (0.0%) | $0 |
| Total | 349 (100.0%) | $83,036 |
Family Income by Number of Earners in Corning
The median family income in Corning is $83,036, with families comprising 2 earners (167) having the highest median family income of $96,615, while families with no earners (32) have the lowest median family income of $35,500, accounting for 47.8% and 9.2% of families, respectively.
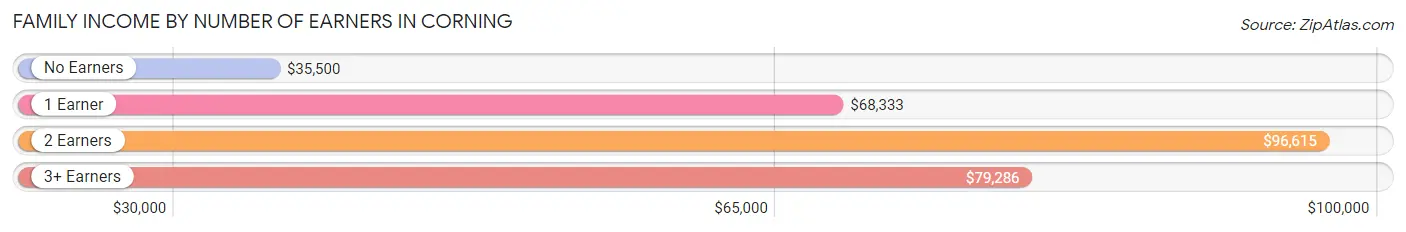
| Number of Earners | # Families | Median Income |
| No Earners | 32 (9.2%) | $35,500 |
| 1 Earner | 116 (33.2%) | $68,333 |
| 2 Earners | 167 (47.8%) | $96,615 |
| 3+ Earners | 34 (9.7%) | $79,286 |
| Total | 349 (100.0%) | $83,036 |
Household Income in Corning
Household Income Brackets in Corning
With 139 households falling in the category, the $75,000 to $99,999 income range is the most frequent in Corning, accounting for 20.1% of all households. In contrast, only 18 households (2.6%) fall into the $150,000 to $199,999 income bracket, making it the least populous group.
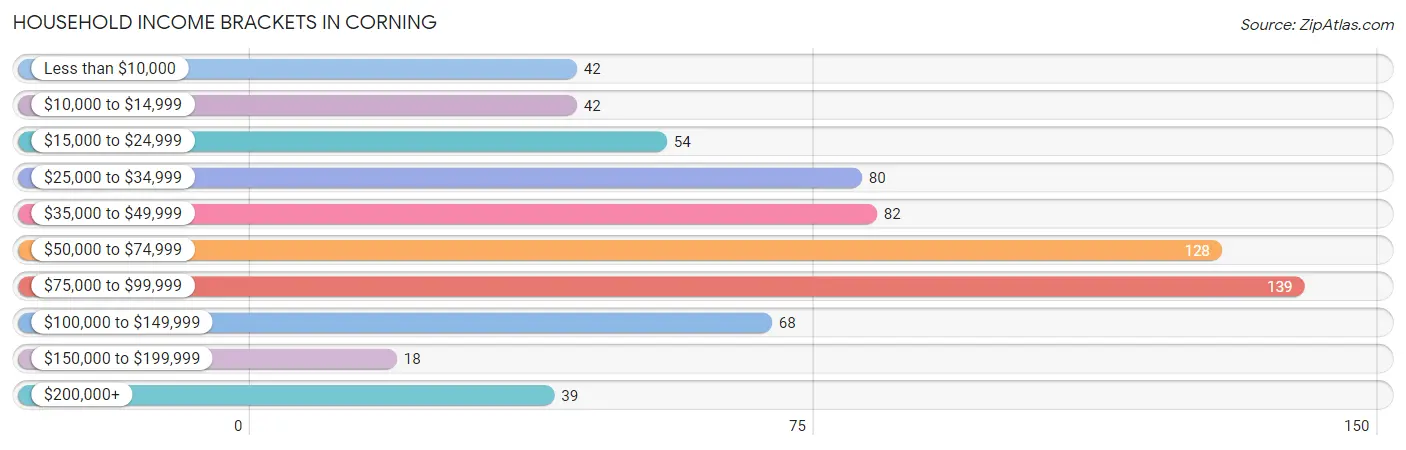
| Income Bracket | # Households | % Households |
| Less than $10,000 | 42 | 6.1% |
| $10,000 to $14,999 | 42 | 6.1% |
| $15,000 to $24,999 | 54 | 7.8% |
| $25,000 to $34,999 | 80 | 11.6% |
| $35,000 to $49,999 | 82 | 11.8% |
| $50,000 to $74,999 | 128 | 18.5% |
| $75,000 to $99,999 | 139 | 20.1% |
| $100,000 to $149,999 | 68 | 9.8% |
| $150,000 to $199,999 | 18 | 2.6% |
| $200,000+ | 39 | 5.6% |
Household Income by Householder Age in Corning
The median household income in Corning is $54,500, with the highest median household income of $78,289 found in the 25 to 44 years age bracket for the primary householder. A total of 204 households (29.5%) fall into this category. Meanwhile, the 65+ years age bracket for the primary householder has the lowest median household income of $32,023, with 261 households (37.7%) in this group.
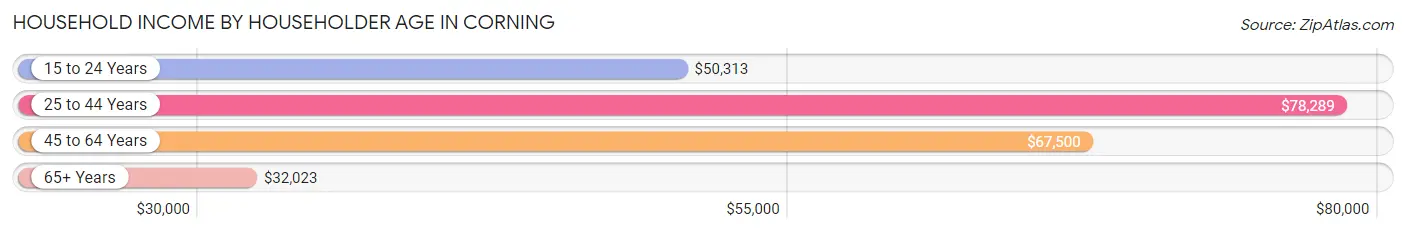
| Income Bracket | # Households | Median Income |
| 15 to 24 Years | 13 (1.9%) | $50,313 |
| 25 to 44 Years | 204 (29.5%) | $78,289 |
| 45 to 64 Years | 214 (30.9%) | $67,500 |
| 65+ Years | 261 (37.7%) | $32,023 |
| Total | 692 (100.0%) | $54,500 |
Poverty in Corning
Income Below Poverty by Sex and Age in Corning
With 11.1% poverty level for males and 11.7% for females among the residents of Corning, 45 to 54 year old males and 15 year old females are the most vulnerable to poverty, with 20 males (20.4%) and 2 females (100.0%) in their respective age groups living below the poverty level.
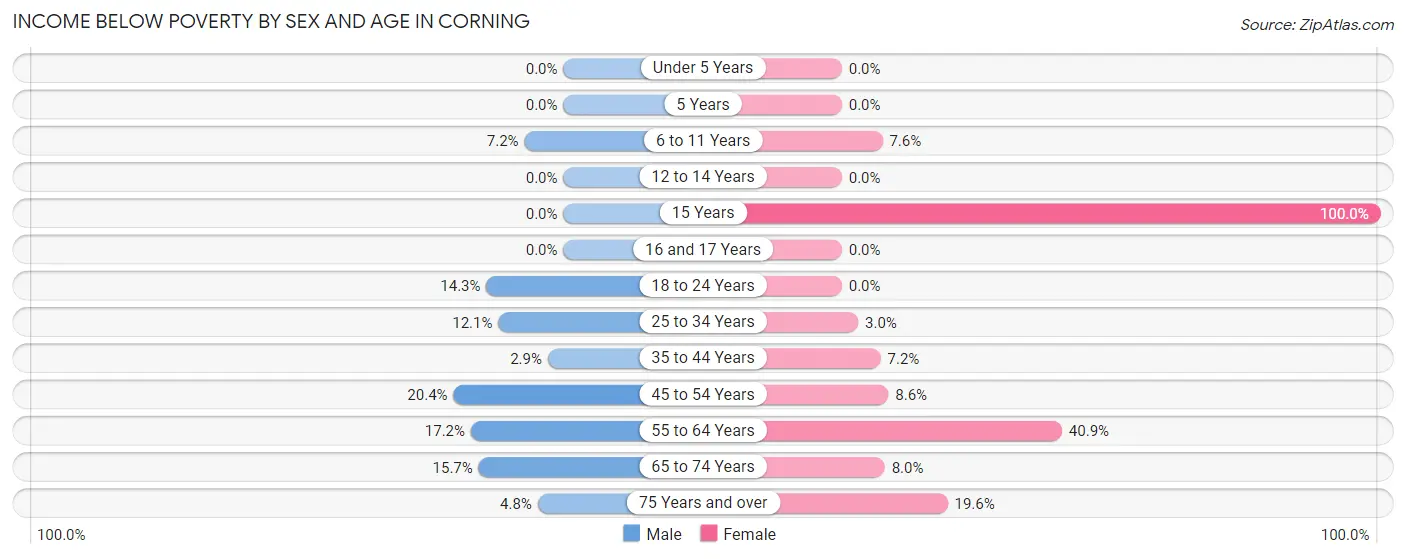
| Age Bracket | Male | Female |
| Under 5 Years | 0 (0.0%) | 0 (0.0%) |
| 5 Years | 0 (0.0%) | 0 (0.0%) |
| 6 to 11 Years | 6 (7.2%) | 4 (7.5%) |
| 12 to 14 Years | 0 (0.0%) | 0 (0.0%) |
| 15 Years | 0 (0.0%) | 2 (100.0%) |
| 16 and 17 Years | 0 (0.0%) | 0 (0.0%) |
| 18 to 24 Years | 11 (14.3%) | 0 (0.0%) |
| 25 to 34 Years | 7 (12.1%) | 2 (3.0%) |
| 35 to 44 Years | 3 (2.9%) | 8 (7.2%) |
| 45 to 54 Years | 20 (20.4%) | 7 (8.6%) |
| 55 to 64 Years | 17 (17.2%) | 38 (40.9%) |
| 65 to 74 Years | 14 (15.7%) | 11 (8.0%) |
| 75 Years and over | 2 (4.8%) | 21 (19.6%) |
| Total | 80 (11.1%) | 93 (11.7%) |
Income Above Poverty by Sex and Age in Corning
According to the poverty statistics in Corning, males aged under 5 years and females aged under 5 years are the age groups that are most secure financially, with 100.0% of males and 100.0% of females in these age groups living above the poverty line.
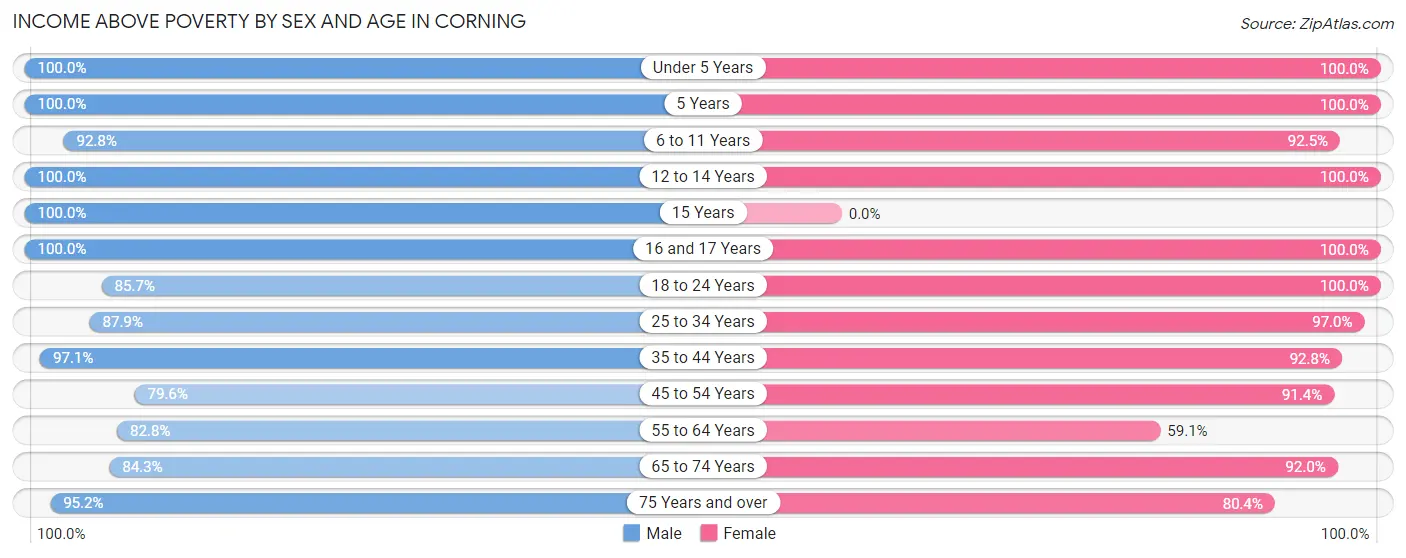
| Age Bracket | Male | Female |
| Under 5 Years | 19 (100.0%) | 43 (100.0%) |
| 5 Years | 2 (100.0%) | 29 (100.0%) |
| 6 to 11 Years | 77 (92.8%) | 49 (92.4%) |
| 12 to 14 Years | 15 (100.0%) | 32 (100.0%) |
| 15 Years | 23 (100.0%) | 0 (0.0%) |
| 16 and 17 Years | 9 (100.0%) | 18 (100.0%) |
| 18 to 24 Years | 66 (85.7%) | 23 (100.0%) |
| 25 to 34 Years | 51 (87.9%) | 64 (97.0%) |
| 35 to 44 Years | 101 (97.1%) | 103 (92.8%) |
| 45 to 54 Years | 78 (79.6%) | 74 (91.4%) |
| 55 to 64 Years | 82 (82.8%) | 55 (59.1%) |
| 65 to 74 Years | 75 (84.3%) | 127 (92.0%) |
| 75 Years and over | 40 (95.2%) | 86 (80.4%) |
| Total | 638 (88.9%) | 703 (88.3%) |
Income Below Poverty Among Married-Couple Families in Corning
The poverty statistics for married-couple families in Corning show that 3.6% or 10 of the total 278 families live below the poverty line. Families with no children have the highest poverty rate of 6.4%, comprising of 10 families. On the other hand, families with 1 or 2 children have the lowest poverty rate of 0.0%, which includes 0 families.
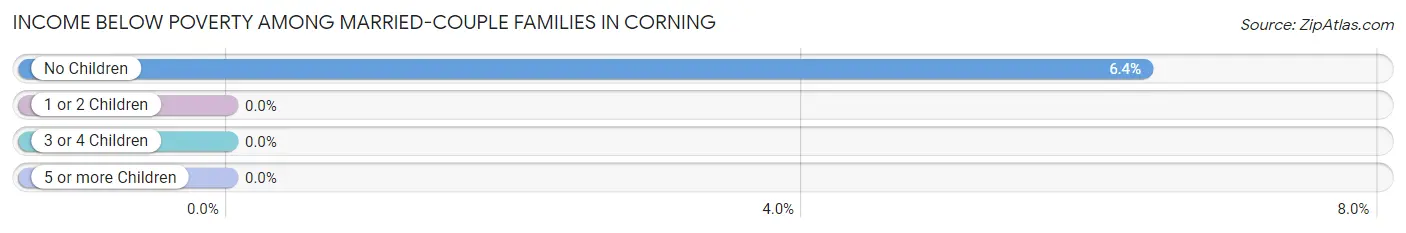
| Children | Above Poverty | Below Poverty |
| No Children | 147 (93.6%) | 10 (6.4%) |
| 1 or 2 Children | 68 (100.0%) | 0 (0.0%) |
| 3 or 4 Children | 53 (100.0%) | 0 (0.0%) |
| 5 or more Children | 0 (0.0%) | 0 (0.0%) |
| Total | 268 (96.4%) | 10 (3.6%) |
Income Below Poverty Among Single-Parent Households in Corning
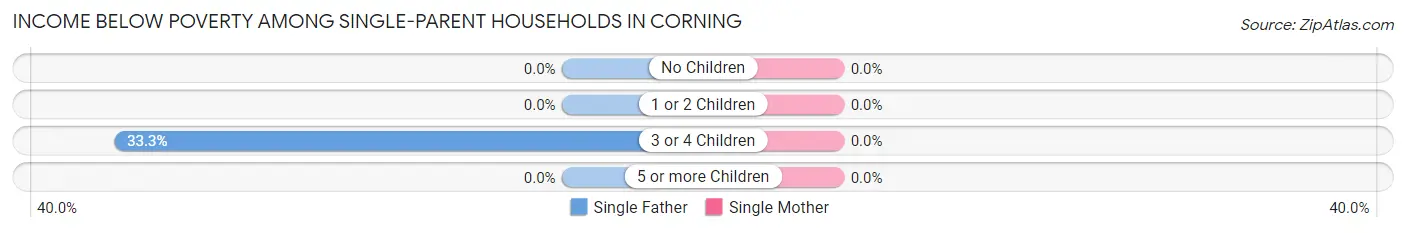
| Children | Single Father | Single Mother |
| No Children | 0 (0.0%) | 0 (0.0%) |
| 1 or 2 Children | 0 (0.0%) | 0 (0.0%) |
| 3 or 4 Children | 2 (33.3%) | 0 (0.0%) |
| 5 or more Children | 0 (0.0%) | 0 (0.0%) |
| Total | 2 (3.9%) | 0 (0.0%) |
Income Below Poverty Among Married-Couple vs Single-Parent Households in Corning
The poverty data for Corning shows that 10 of the married-couple family households (3.6%) and 2 of the single-parent households (2.8%) are living below the poverty level. Within the married-couple family households, those with no children have the highest poverty rate, with 10 households (6.4%) falling below the poverty line. Among the single-parent households, those with 3 or 4 children have the highest poverty rate, with 2 household (20.0%) living below poverty.
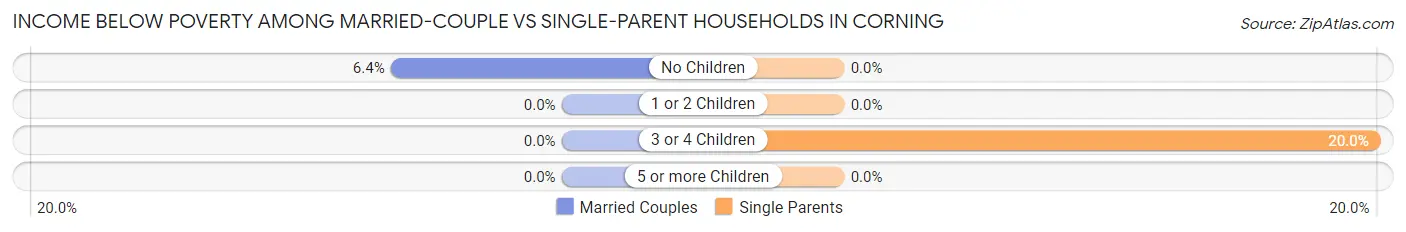
| Children | Married-Couple Families | Single-Parent Households |
| No Children | 10 (6.4%) | 0 (0.0%) |
| 1 or 2 Children | 0 (0.0%) | 0 (0.0%) |
| 3 or 4 Children | 0 (0.0%) | 2 (20.0%) |
| 5 or more Children | 0 (0.0%) | 0 (0.0%) |
| Total | 10 (3.6%) | 2 (2.8%) |
Race in Corning
The most populous races in Corning are White / Caucasian (1,482 | 93.1%), Two or more Races (66 | 4.2%), and Hispanic or Latino (33 | 2.1%).
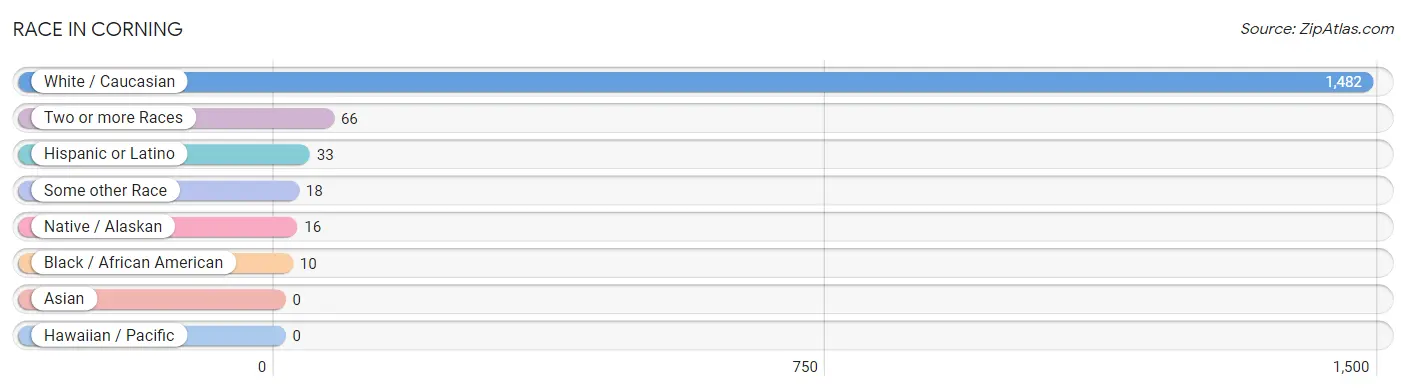
| Race | # Population | % Population |
| Asian | 0 | 0.0% |
| Black / African American | 10 | 0.6% |
| Hawaiian / Pacific | 0 | 0.0% |
| Hispanic or Latino | 33 | 2.1% |
| Native / Alaskan | 16 | 1.0% |
| White / Caucasian | 1,482 | 93.1% |
| Two or more Races | 66 | 4.2% |
| Some other Race | 18 | 1.1% |
| Total | 1,592 | 100.0% |
Ancestry in Corning
The most populous ancestries reported in Corning are German (460 | 28.9%), English (262 | 16.5%), Irish (225 | 14.1%), American (117 | 7.3%), and Swedish (59 | 3.7%), together accounting for 70.5% of all Corning residents.
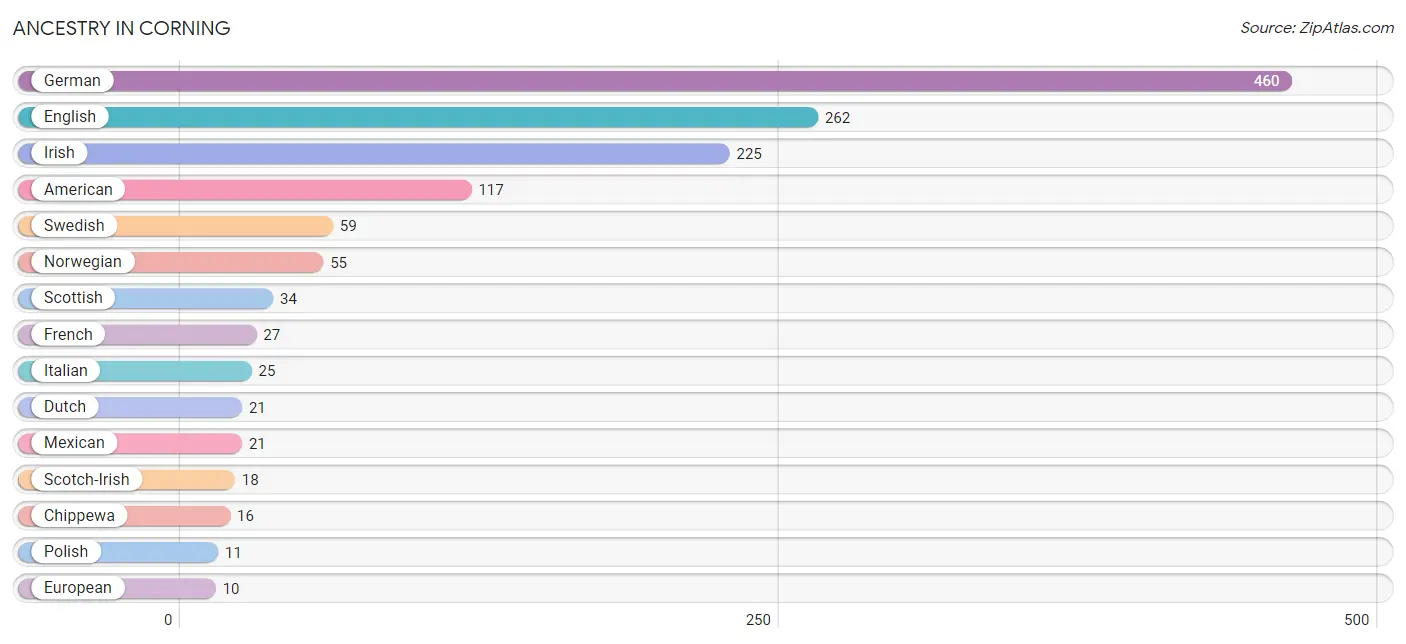
| Ancestry | # Population | % Population |
| African | 4 | 0.3% |
| American | 117 | 7.3% |
| Austrian | 5 | 0.3% |
| Chippewa | 16 | 1.0% |
| Czech | 3 | 0.2% |
| Danish | 8 | 0.5% |
| Dutch | 21 | 1.3% |
| English | 262 | 16.5% |
| European | 10 | 0.6% |
| French | 27 | 1.7% |
| German | 460 | 28.9% |
| Icelander | 3 | 0.2% |
| Indian (Asian) | 4 | 0.3% |
| Irish | 225 | 14.1% |
| Italian | 25 | 1.6% |
| Mexican | 21 | 1.3% |
| Nigerian | 4 | 0.3% |
| Norwegian | 55 | 3.5% |
| Pennsylvania German | 2 | 0.1% |
| Polish | 11 | 0.7% |
| Russian | 4 | 0.3% |
| Scotch-Irish | 18 | 1.1% |
| Scottish | 34 | 2.1% |
| Spaniard | 4 | 0.3% |
| Subsaharan African | 8 | 0.5% |
| Swedish | 59 | 3.7% |
| Welsh | 2 | 0.1% | View All 27 Rows |
Immigrants in Corning
The most numerous immigrant groups reported in Corning came from Central America (7 | 0.4%), Latin America (7 | 0.4%), Mexico (7 | 0.4%), Africa (4 | 0.3%), and Congo (4 | 0.3%), together accounting for 1.8% of all Corning residents.
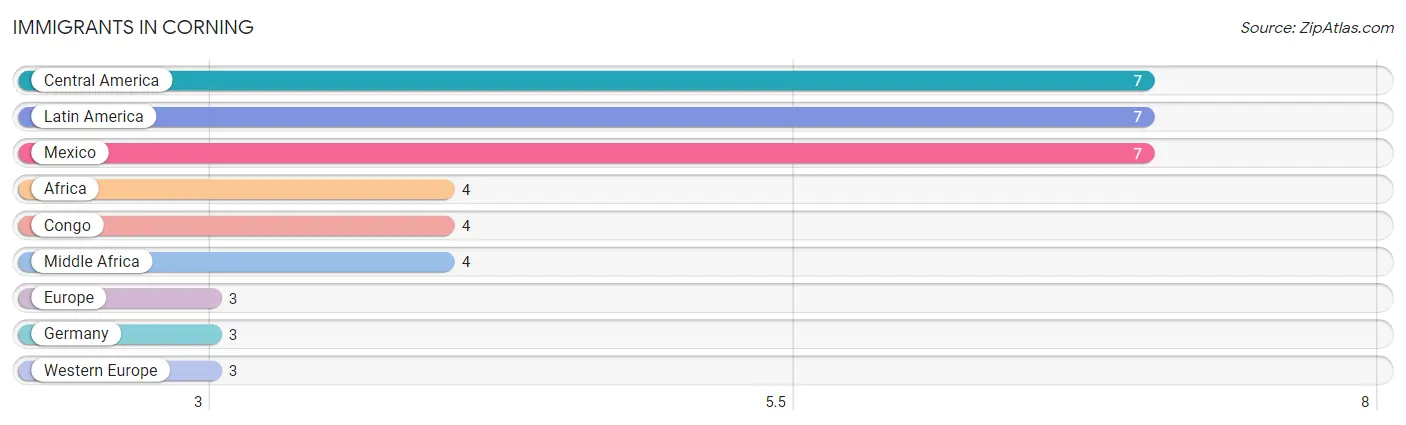
| Immigration Origin | # Population | % Population |
| Africa | 4 | 0.3% |
| Central America | 7 | 0.4% |
| Congo | 4 | 0.3% |
| Europe | 3 | 0.2% |
| Germany | 3 | 0.2% |
| Latin America | 7 | 0.4% |
| Mexico | 7 | 0.4% |
| Middle Africa | 4 | 0.3% |
| Western Europe | 3 | 0.2% | View All 9 Rows |
Sex and Age in Corning
Sex and Age in Corning
The most populous age groups in Corning are 40 to 44 Years (65 | 8.8%) for men and 65 to 69 Years (94 | 11.0%) for women.
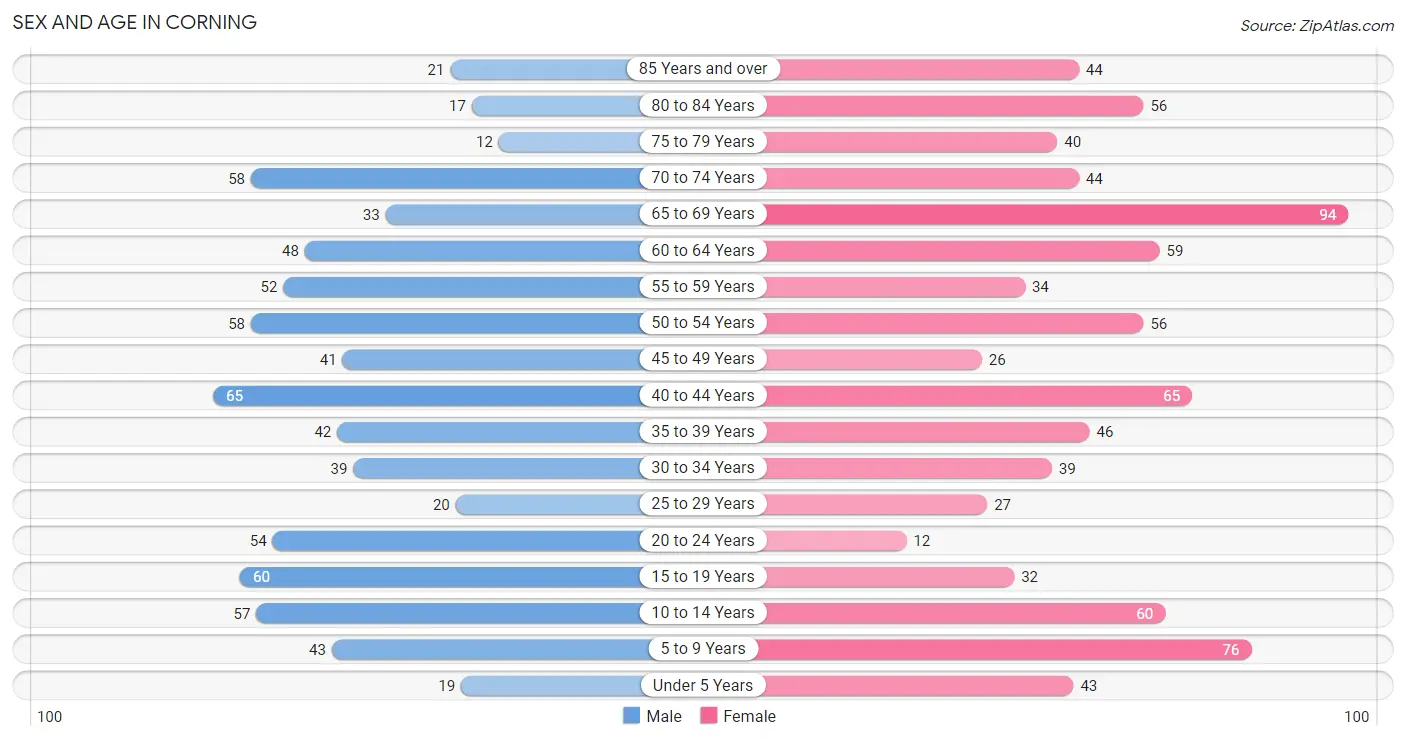
| Age Bracket | Male | Female |
| Under 5 Years | 19 (2.6%) | 43 (5.0%) |
| 5 to 9 Years | 43 (5.8%) | 76 (8.9%) |
| 10 to 14 Years | 57 (7.7%) | 60 (7.0%) |
| 15 to 19 Years | 60 (8.1%) | 32 (3.7%) |
| 20 to 24 Years | 54 (7.3%) | 12 (1.4%) |
| 25 to 29 Years | 20 (2.7%) | 27 (3.2%) |
| 30 to 34 Years | 39 (5.3%) | 39 (4.6%) |
| 35 to 39 Years | 42 (5.7%) | 46 (5.4%) |
| 40 to 44 Years | 65 (8.8%) | 65 (7.6%) |
| 45 to 49 Years | 41 (5.6%) | 26 (3.0%) |
| 50 to 54 Years | 58 (7.9%) | 56 (6.6%) |
| 55 to 59 Years | 52 (7.0%) | 34 (4.0%) |
| 60 to 64 Years | 48 (6.5%) | 59 (6.9%) |
| 65 to 69 Years | 33 (4.5%) | 94 (11.0%) |
| 70 to 74 Years | 58 (7.9%) | 44 (5.2%) |
| 75 to 79 Years | 12 (1.6%) | 40 (4.7%) |
| 80 to 84 Years | 17 (2.3%) | 56 (6.6%) |
| 85 Years and over | 21 (2.8%) | 44 (5.2%) |
| Total | 739 (100.0%) | 853 (100.0%) |
Families and Households in Corning
Median Family Size in Corning
The median family size in Corning is 3.04 persons per family, with single female/mother families (20 | 5.7%) accounting for the largest median family size of 3.75 persons per family. On the other hand, married-couple families (278 | 79.7%) represent the smallest median family size with 2.97 persons per family.
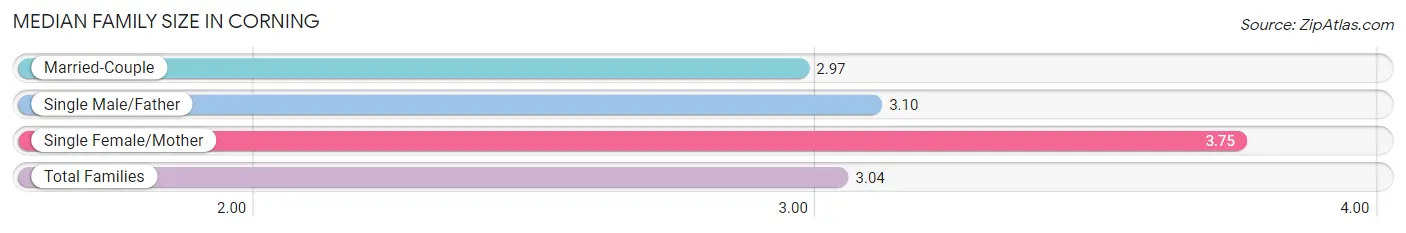
| Family Type | # Families | Family Size |
| Married-Couple | 278 (79.7%) | 2.97 |
| Single Male/Father | 51 (14.6%) | 3.10 |
| Single Female/Mother | 20 (5.7%) | 3.75 |
| Total Families | 349 (100.0%) | 3.04 |
Median Household Size in Corning
The median household size in Corning is 2.20 persons per household, with single female/mother households (20 | 2.9%) accounting for the largest median household size of 3.95 persons per household. non-family households (343 | 49.6%) represent the smallest median household size with 1.31 persons per household.
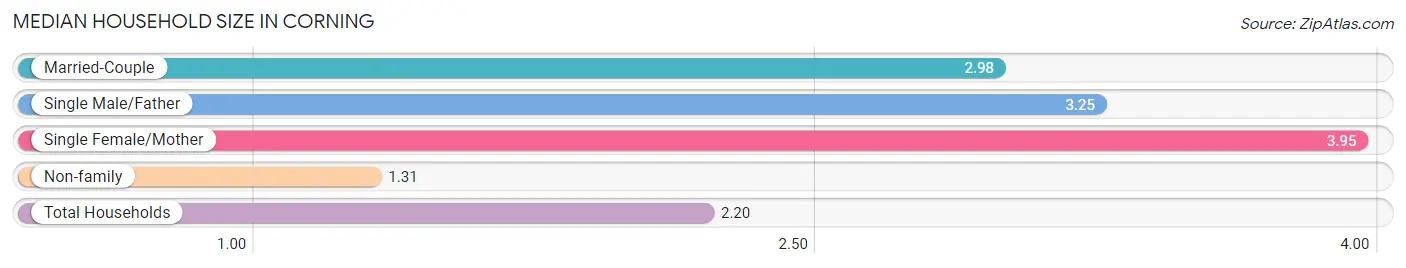
| Household Type | # Households | Household Size |
| Married-Couple | 278 (40.2%) | 2.98 |
| Single Male/Father | 51 (7.4%) | 3.25 |
| Single Female/Mother | 20 (2.9%) | 3.95 |
| Non-family | 343 (49.6%) | 1.31 |
| Total Households | 692 (100.0%) | 2.20 |
Household Size by Marriage Status in Corning
Out of a total of 692 households in Corning, 349 (50.4%) are family households, while 343 (49.6%) are nonfamily households. The most numerous type of family households are 2-person households, comprising 167, and the most common type of nonfamily households are 1-person households, comprising 277.
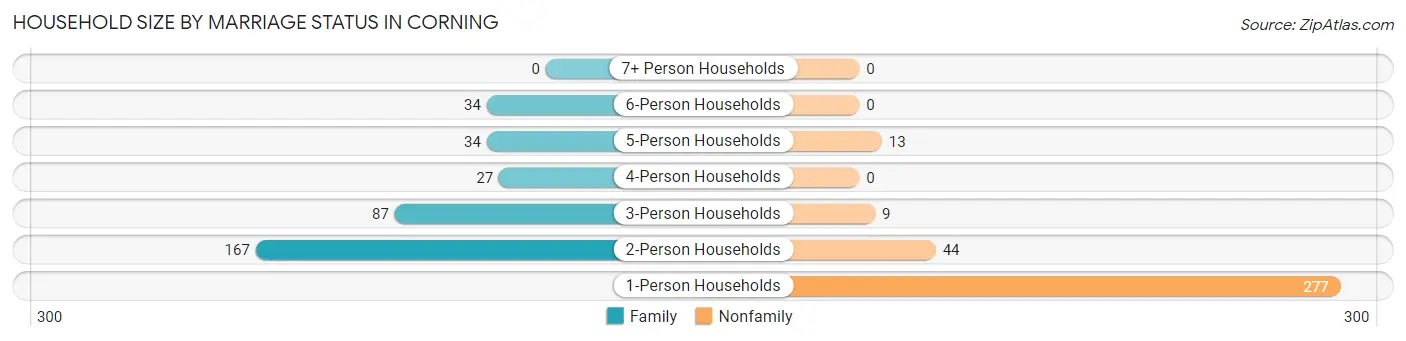
| Household Size | Family Households | Nonfamily Households |
| 1-Person Households | - | 277 (40.0%) |
| 2-Person Households | 167 (24.1%) | 44 (6.4%) |
| 3-Person Households | 87 (12.6%) | 9 (1.3%) |
| 4-Person Households | 27 (3.9%) | 0 (0.0%) |
| 5-Person Households | 34 (4.9%) | 13 (1.9%) |
| 6-Person Households | 34 (4.9%) | 0 (0.0%) |
| 7+ Person Households | 0 (0.0%) | 0 (0.0%) |
| Total | 349 (50.4%) | 343 (49.6%) |
Female Fertility in Corning
Fertility by Age in Corning
Average fertility rate in Corning is 138.0 births per 1,000 women. Women in the age bracket of 20 to 34 years have the highest fertility rate with 449.0 births per 1,000 women. Women in the age bracket of 20 to 34 years acount for 100.0% of all women with births.
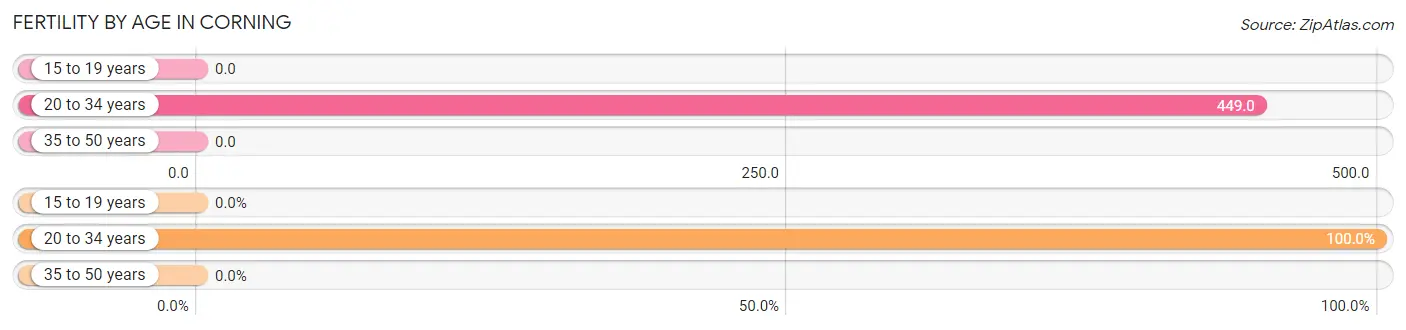
| Age Bracket | Women with Births | Births / 1,000 Women |
| 15 to 19 years | 0 (0.0%) | 0.0 |
| 20 to 34 years | 35 (100.0%) | 449.0 |
| 35 to 50 years | 0 (0.0%) | 0.0 |
| Total | 35 (100.0%) | 138.0 |
Fertility by Age by Marriage Status in Corning
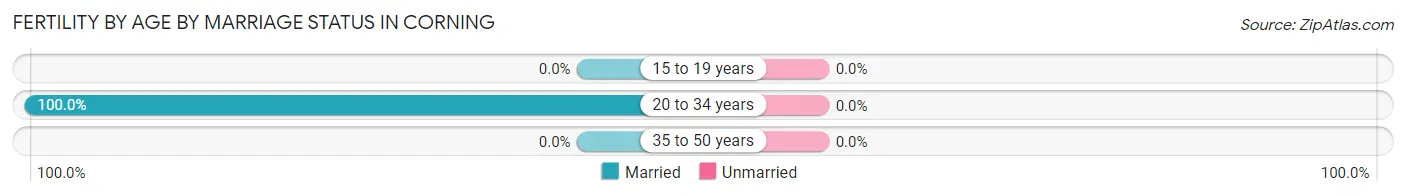
| Age Bracket | Married | Unmarried |
| 15 to 19 years | 0 (0.0%) | 0 (0.0%) |
| 20 to 34 years | 35 (100.0%) | 0 (0.0%) |
| 35 to 50 years | 0 (0.0%) | 0 (0.0%) |
| Total | 35 (100.0%) | 0 (0.0%) |
Fertility by Education in Corning
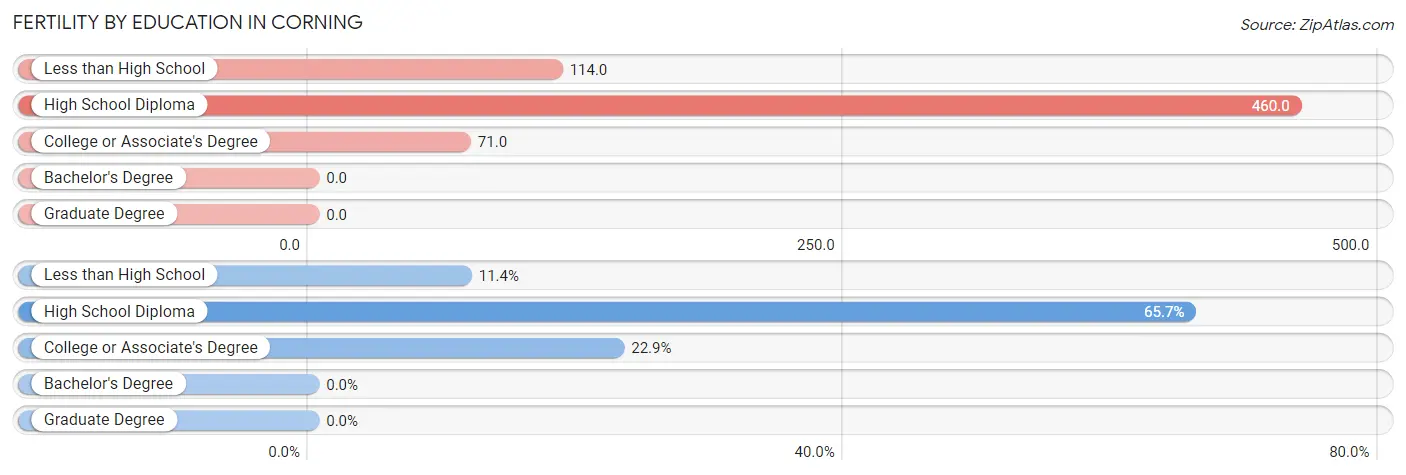
| Educational Attainment | Women with Births | Births / 1,000 Women |
| Less than High School | 4 (11.4%) | 114.0 |
| High School Diploma | 23 (65.7%) | 460.0 |
| College or Associate's Degree | 8 (22.9%) | 71.0 |
| Bachelor's Degree | 0 (0.0%) | 0.0 |
| Graduate Degree | 0 (0.0%) | 0.0 |
| Total | 35 (100.0%) | 138.0 |
Fertility by Education by Marriage Status in Corning
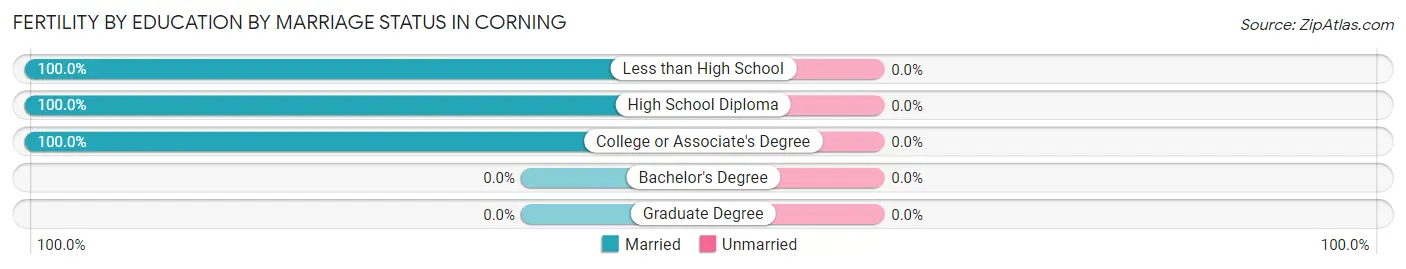
| Educational Attainment | Married | Unmarried |
| Less than High School | 4 (100.0%) | 0 (0.0%) |
| High School Diploma | 23 (100.0%) | 0 (0.0%) |
| College or Associate's Degree | 8 (100.0%) | 0 (0.0%) |
| Bachelor's Degree | 0 (0.0%) | 0 (0.0%) |
| Graduate Degree | 0 (0.0%) | 0 (0.0%) |
| Total | 35 (100.0%) | 0 (0.0%) |
Employment Characteristics in Corning
Employment by Class of Employer in Corning
Among the 646 employed individuals in Corning, private company employees (345 | 53.4%), local government employees (151 | 23.4%), and not-for-profit organizations (77 | 11.9%) make up the most common classes of employment.
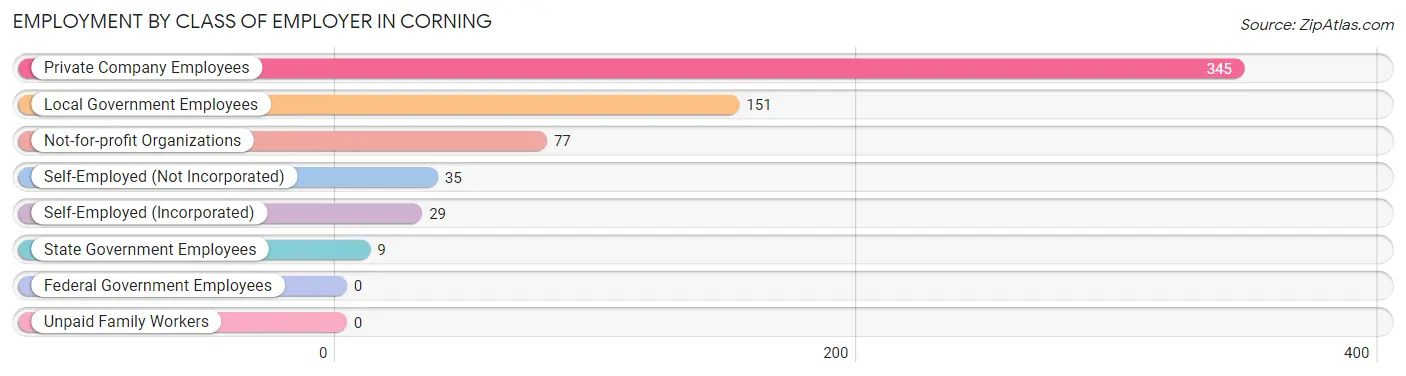
| Employer Class | # Employees | % Employees |
| Private Company Employees | 345 | 53.4% |
| Self-Employed (Incorporated) | 29 | 4.5% |
| Self-Employed (Not Incorporated) | 35 | 5.4% |
| Not-for-profit Organizations | 77 | 11.9% |
| Local Government Employees | 151 | 23.4% |
| State Government Employees | 9 | 1.4% |
| Federal Government Employees | 0 | 0.0% |
| Unpaid Family Workers | 0 | 0.0% |
| Total | 646 | 100.0% |
Employment Status by Age in Corning
According to the labor force statistics for Corning, out of the total population over 16 years of age (1,269), 55.9% or 709 individuals are in the labor force, with 4.5% or 32 of them unemployed. The age group with the highest labor force participation rate is 25 to 29 years, with 93.6% or 44 individuals in the labor force. Within the labor force, the 20 to 24 years age range has the highest percentage of unemployed individuals, with 36.8% or 21 of them being unemployed.
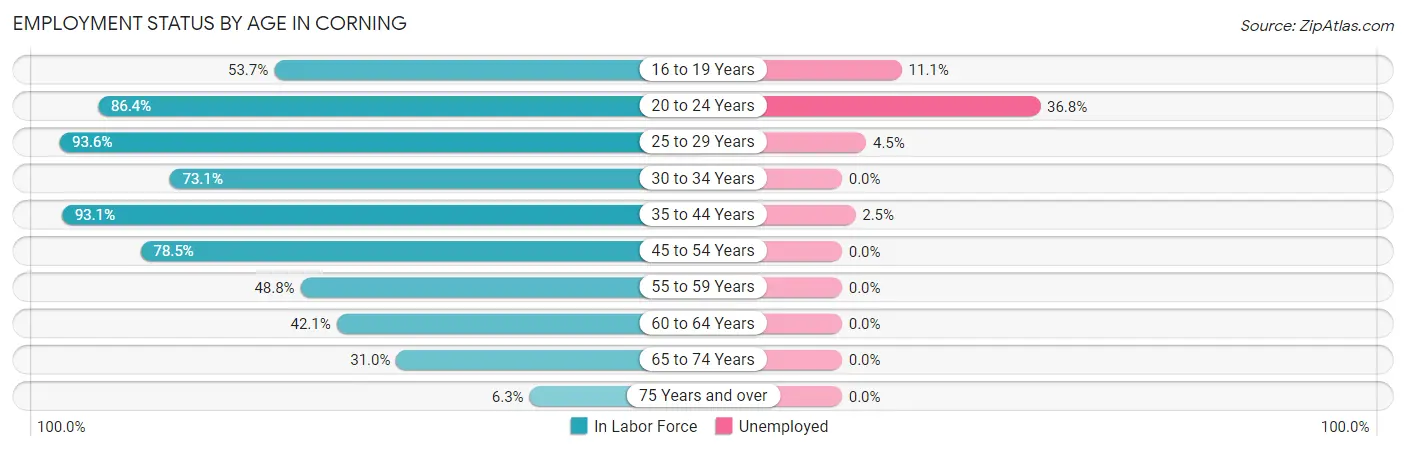
| Age Bracket | In Labor Force | Unemployed |
| 16 to 19 Years | 36 (53.7%) | 4 (11.1%) |
| 20 to 24 Years | 57 (86.4%) | 21 (36.8%) |
| 25 to 29 Years | 44 (93.6%) | 2 (4.5%) |
| 30 to 34 Years | 57 (73.1%) | 0 (0.0%) |
| 35 to 44 Years | 203 (93.1%) | 5 (2.5%) |
| 45 to 54 Years | 142 (78.5%) | 0 (0.0%) |
| 55 to 59 Years | 42 (48.8%) | 0 (0.0%) |
| 60 to 64 Years | 45 (42.1%) | 0 (0.0%) |
| 65 to 74 Years | 71 (31.0%) | 0 (0.0%) |
| 75 Years and over | 12 (6.3%) | 0 (0.0%) |
| Total | 709 (55.9%) | 32 (4.5%) |
Employment Status by Educational Attainment in Corning
According to labor force statistics for Corning, 74.3% of individuals (533) out of the total population between 25 and 64 years of age (717) are in the labor force, with 1.3% or 7 of them being unemployed. The group with the highest labor force participation rate are those with the educational attainment of bachelor's degree or higher, with 85.2% or 161 individuals in the labor force. Within the labor force, individuals with less than high school education have the highest percentage of unemployment, with 25.0% or 2 of them being unemployed.
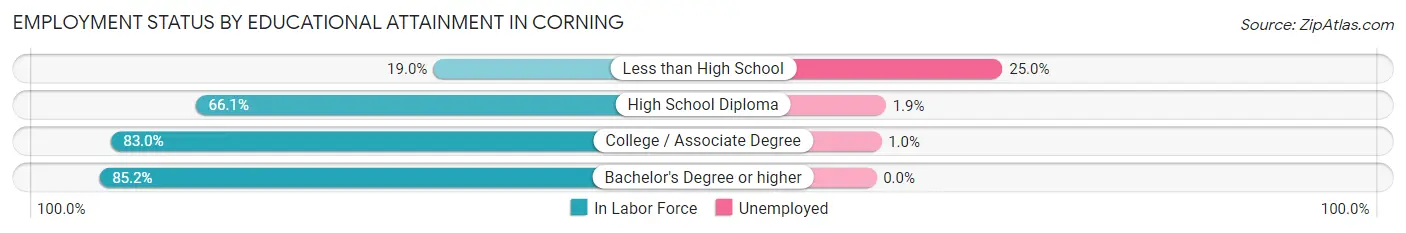
| Educational Attainment | In Labor Force | Unemployed |
| Less than High School | 8 (19.0%) | 10 (25.0%) |
| High School Diploma | 154 (66.1%) | 4 (1.9%) |
| College / Associate Degree | 210 (83.0%) | 3 (1.0%) |
| Bachelor's Degree or higher | 161 (85.2%) | 0 (0.0%) |
| Total | 533 (74.3%) | 9 (1.3%) |
Employment Occupations by Sex in Corning
Management, Business, Science and Arts Occupations
The most common Management, Business, Science and Arts occupations in Corning are Management (60 | 8.9%), Community & Social Service (59 | 8.7%), Education Instruction & Library (45 | 6.7%), Health Diagnosing & Treating (42 | 6.2%), and Business & Financial (33 | 4.9%).
Management, Business, Science and Arts Occupations by Sex
Within the Management, Business, Science and Arts occupations in Corning, the most male-oriented occupations are Computers & Mathematics (100.0%), Computers, Engineering & Science (87.5%), and Education, Arts & Media (81.8%), while the most female-oriented occupations are Architecture & Engineering (100.0%), Arts, Media & Entertainment (100.0%), and Education Instruction & Library (91.1%).
| Occupation | Male | Female |
| Management | 27 (45.0%) | 33 (55.0%) |
| Business & Financial | 24 (72.7%) | 9 (27.3%) |
| Computers, Engineering & Science | 14 (87.5%) | 2 (12.5%) |
| Computers & Mathematics | 14 (100.0%) | 0 (0.0%) |
| Architecture & Engineering | 0 (0.0%) | 2 (100.0%) |
| Life, Physical & Social Science | 0 (0.0%) | 0 (0.0%) |
| Community & Social Service | 13 (22.0%) | 46 (78.0%) |
| Education, Arts & Media | 9 (81.8%) | 2 (18.2%) |
| Legal Services & Support | 0 (0.0%) | 0 (0.0%) |
| Education Instruction & Library | 4 (8.9%) | 41 (91.1%) |
| Arts, Media & Entertainment | 0 (0.0%) | 3 (100.0%) |
| Health Diagnosing & Treating | 10 (23.8%) | 32 (76.2%) |
| Health Technologists | 3 (11.1%) | 24 (88.9%) |
| Total (Category) | 88 (41.9%) | 122 (58.1%) |
| Total (Overall) | 345 (51.0%) | 332 (49.0%) |
Services Occupations
The most common Services occupations in Corning are Healthcare Support (84 | 12.4%), Personal Care & Service (33 | 4.9%), Food Preparation & Serving (31 | 4.6%), Cleaning & Maintenance (7 | 1.0%), and Security & Protection (2 | 0.3%).
Services Occupations by Sex
Within the Services occupations in Corning, the most male-oriented occupations are Security & Protection (100.0%), Law Enforcement (100.0%), and Cleaning & Maintenance (100.0%), while the most female-oriented occupations are Healthcare Support (94.1%), Personal Care & Service (90.9%), and Food Preparation & Serving (71.0%).
| Occupation | Male | Female |
| Healthcare Support | 5 (5.9%) | 79 (94.1%) |
| Security & Protection | 2 (100.0%) | 0 (0.0%) |
| Firefighting & Prevention | 0 (0.0%) | 0 (0.0%) |
| Law Enforcement | 2 (100.0%) | 0 (0.0%) |
| Food Preparation & Serving | 9 (29.0%) | 22 (71.0%) |
| Cleaning & Maintenance | 7 (100.0%) | 0 (0.0%) |
| Personal Care & Service | 3 (9.1%) | 30 (90.9%) |
| Total (Category) | 26 (16.6%) | 131 (83.4%) |
| Total (Overall) | 345 (51.0%) | 332 (49.0%) |
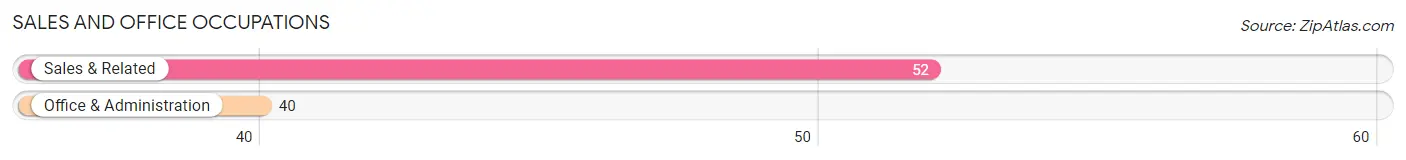
Sales and Office Occupations
The most common Sales and Office occupations in Corning are Sales & Related (52 | 7.7%), and Office & Administration (40 | 5.9%).
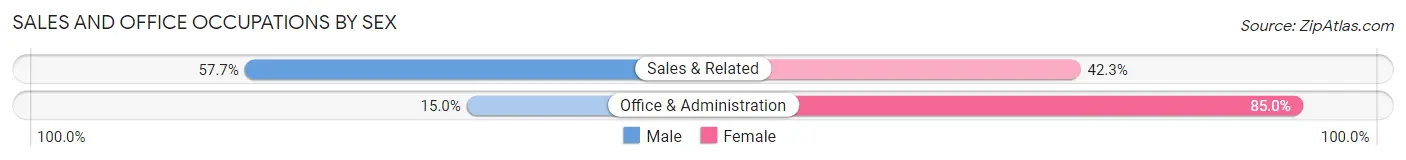
Sales and Office Occupations by Sex
| Occupation | Male | Female |
| Sales & Related | 30 (57.7%) | 22 (42.3%) |
| Office & Administration | 6 (15.0%) | 34 (85.0%) |
| Total (Category) | 36 (39.1%) | 56 (60.9%) |
| Total (Overall) | 345 (51.0%) | 332 (49.0%) |
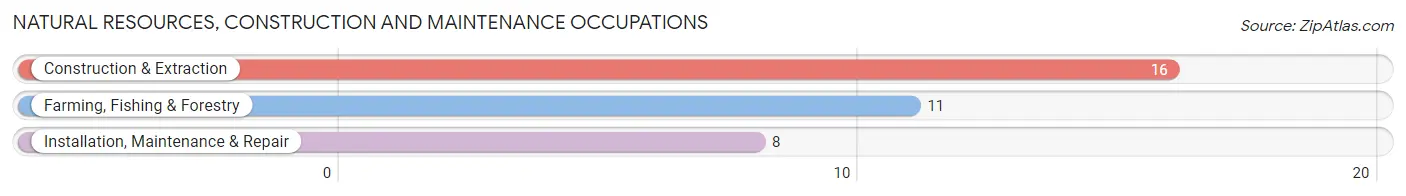
Natural Resources, Construction and Maintenance Occupations
The most common Natural Resources, Construction and Maintenance occupations in Corning are Construction & Extraction (16 | 2.4%), Farming, Fishing & Forestry (11 | 1.6%), and Installation, Maintenance & Repair (8 | 1.2%).
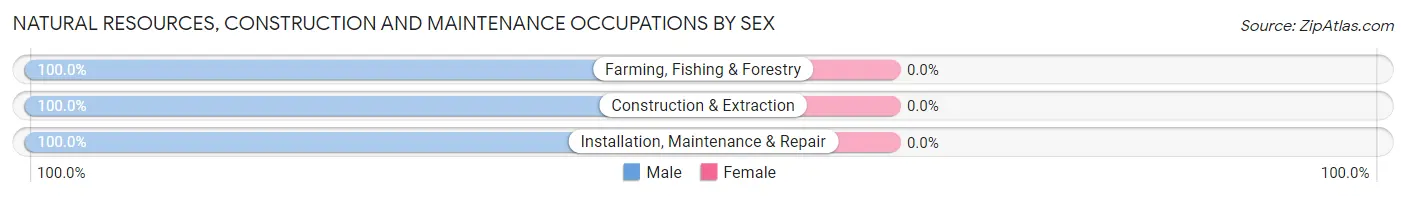
Natural Resources, Construction and Maintenance Occupations by Sex
| Occupation | Male | Female |
| Farming, Fishing & Forestry | 11 (100.0%) | 0 (0.0%) |
| Construction & Extraction | 16 (100.0%) | 0 (0.0%) |
| Installation, Maintenance & Repair | 8 (100.0%) | 0 (0.0%) |
| Total (Category) | 35 (100.0%) | 0 (0.0%) |
| Total (Overall) | 345 (51.0%) | 332 (49.0%) |
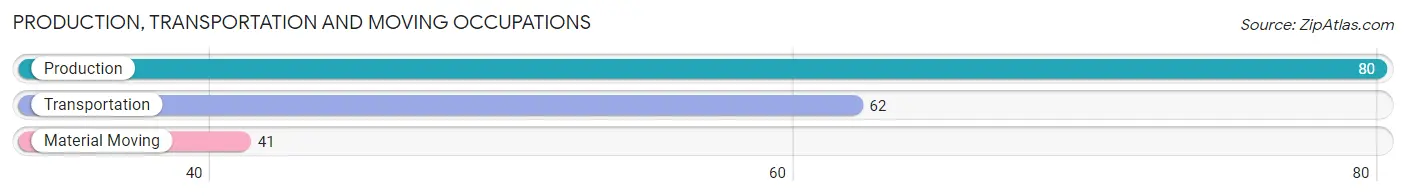
Production, Transportation and Moving Occupations
The most common Production, Transportation and Moving occupations in Corning are Production (80 | 11.8%), Transportation (62 | 9.2%), and Material Moving (41 | 6.1%).
Production, Transportation and Moving Occupations by Sex
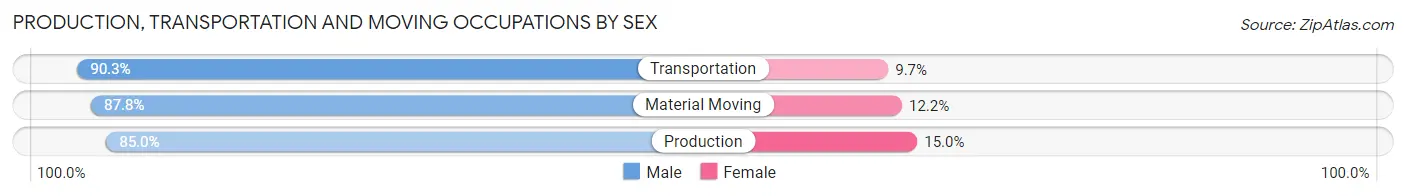
| Occupation | Male | Female |
| Production | 68 (85.0%) | 12 (15.0%) |
| Transportation | 56 (90.3%) | 6 (9.7%) |
| Material Moving | 36 (87.8%) | 5 (12.2%) |
| Total (Category) | 160 (87.4%) | 23 (12.6%) |
| Total (Overall) | 345 (51.0%) | 332 (49.0%) |
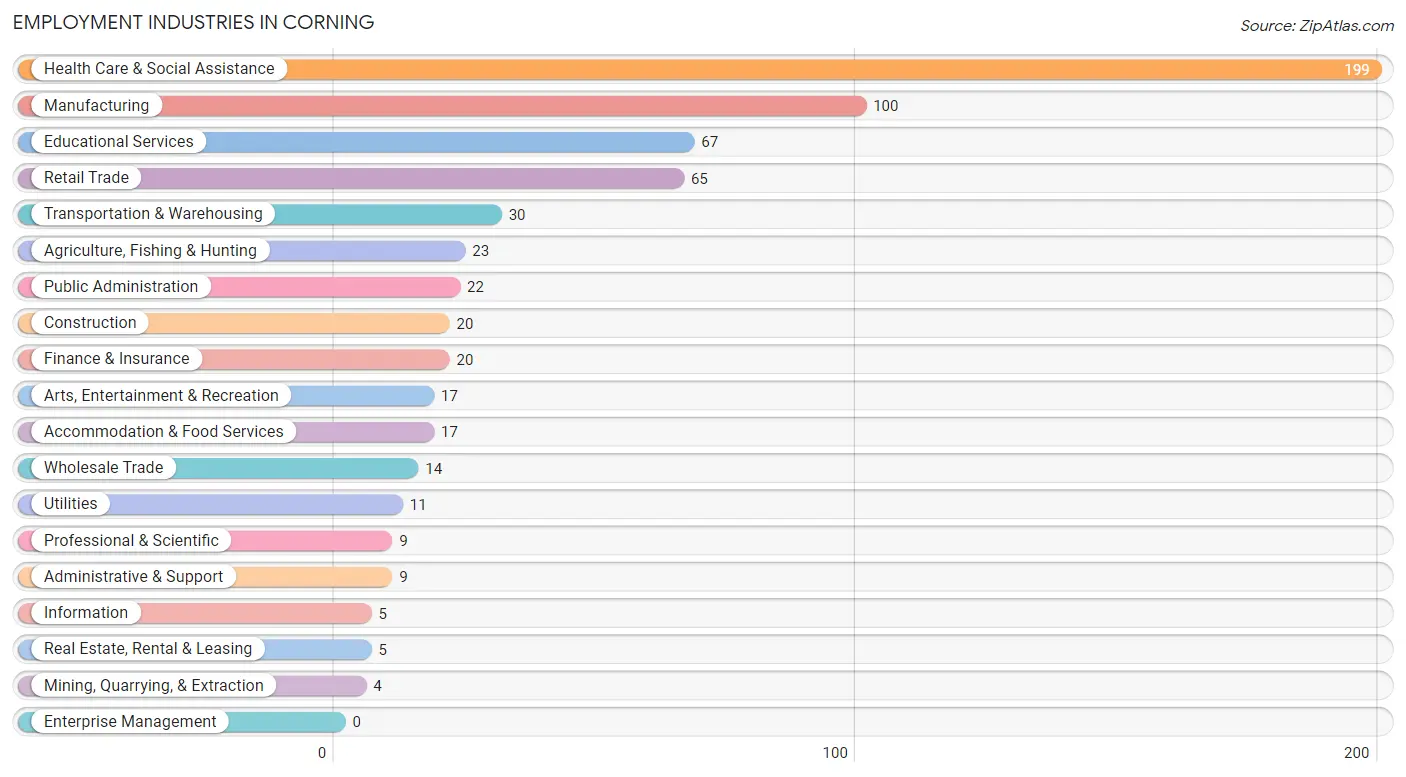
Employment Industries by Sex in Corning
Employment Industries in Corning
The major employment industries in Corning include Health Care & Social Assistance (199 | 29.4%), Manufacturing (100 | 14.8%), Educational Services (67 | 9.9%), Retail Trade (65 | 9.6%), and Transportation & Warehousing (30 | 4.4%).
Employment Industries by Sex in Corning
The Corning industries that see more men than women are Agriculture, Fishing & Hunting (100.0%), Mining, Quarrying, & Extraction (100.0%), and Construction (100.0%), whereas the industries that tend to have a higher number of women are Information (100.0%), Educational Services (85.1%), and Arts, Entertainment & Recreation (82.4%).
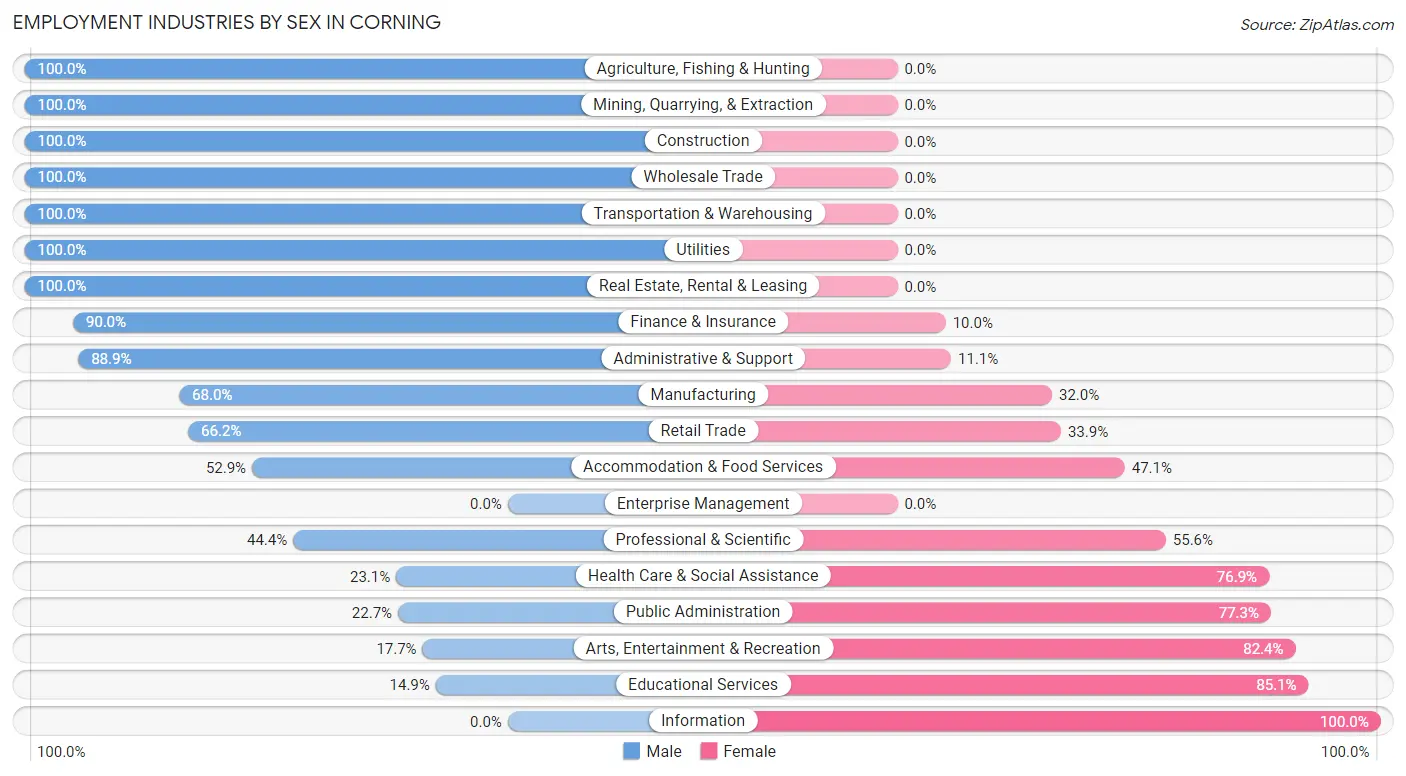
| Industry | Male | Female |
| Agriculture, Fishing & Hunting | 23 (100.0%) | 0 (0.0%) |
| Mining, Quarrying, & Extraction | 4 (100.0%) | 0 (0.0%) |
| Construction | 20 (100.0%) | 0 (0.0%) |
| Manufacturing | 68 (68.0%) | 32 (32.0%) |
| Wholesale Trade | 14 (100.0%) | 0 (0.0%) |
| Retail Trade | 43 (66.1%) | 22 (33.9%) |
| Transportation & Warehousing | 30 (100.0%) | 0 (0.0%) |
| Utilities | 11 (100.0%) | 0 (0.0%) |
| Information | 0 (0.0%) | 5 (100.0%) |
| Finance & Insurance | 18 (90.0%) | 2 (10.0%) |
| Real Estate, Rental & Leasing | 5 (100.0%) | 0 (0.0%) |
| Professional & Scientific | 4 (44.4%) | 5 (55.6%) |
| Enterprise Management | 0 (0.0%) | 0 (0.0%) |
| Administrative & Support | 8 (88.9%) | 1 (11.1%) |
| Educational Services | 10 (14.9%) | 57 (85.1%) |
| Health Care & Social Assistance | 46 (23.1%) | 153 (76.9%) |
| Arts, Entertainment & Recreation | 3 (17.6%) | 14 (82.4%) |
| Accommodation & Food Services | 9 (52.9%) | 8 (47.1%) |
| Public Administration | 5 (22.7%) | 17 (77.3%) |
| Total | 345 (51.0%) | 332 (49.0%) |
Education in Corning
School Enrollment in Corning
The most common levels of schooling among the 346 students in Corning are middle school (95 | 27.5%), elementary school (92 | 26.6%), and high school (80 | 23.1%).
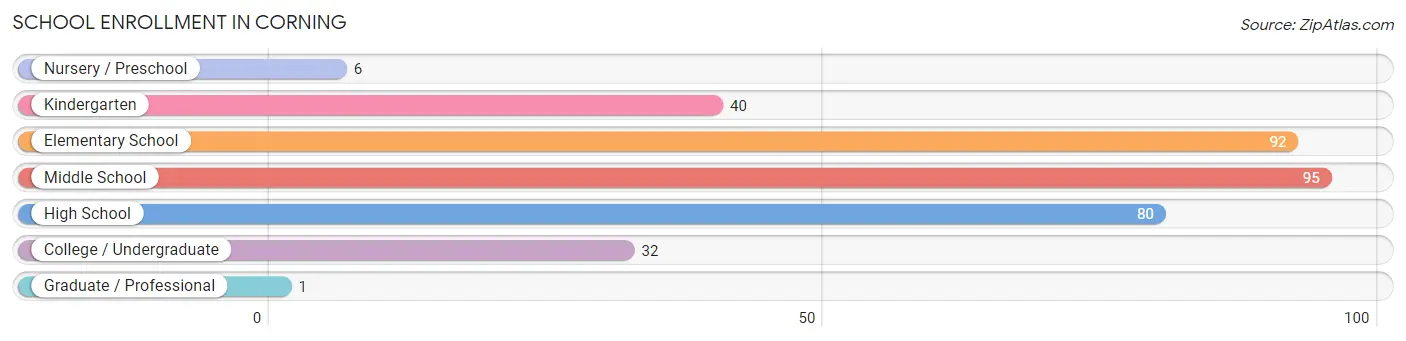
| School Level | # Students | % Students |
| Nursery / Preschool | 6 | 1.7% |
| Kindergarten | 40 | 11.6% |
| Elementary School | 92 | 26.6% |
| Middle School | 95 | 27.5% |
| High School | 80 | 23.1% |
| College / Undergraduate | 32 | 9.2% |
| Graduate / Professional | 1 | 0.3% |
| Total | 346 | 100.0% |
School Enrollment by Age by Funding Source in Corning
Out of a total of 346 students who are enrolled in schools in Corning, 28 (8.1%) attend a private institution, while the remaining 318 (91.9%) are enrolled in public schools. The age group of 35 years and over has the highest likelihood of being enrolled in private schools, with 11 (91.7% in the age bracket) enrolled. Conversely, the age group of 3 to 4 year olds has the lowest likelihood of being enrolled in a private school, with 1 (100.0% in the age bracket) attending a public institution.
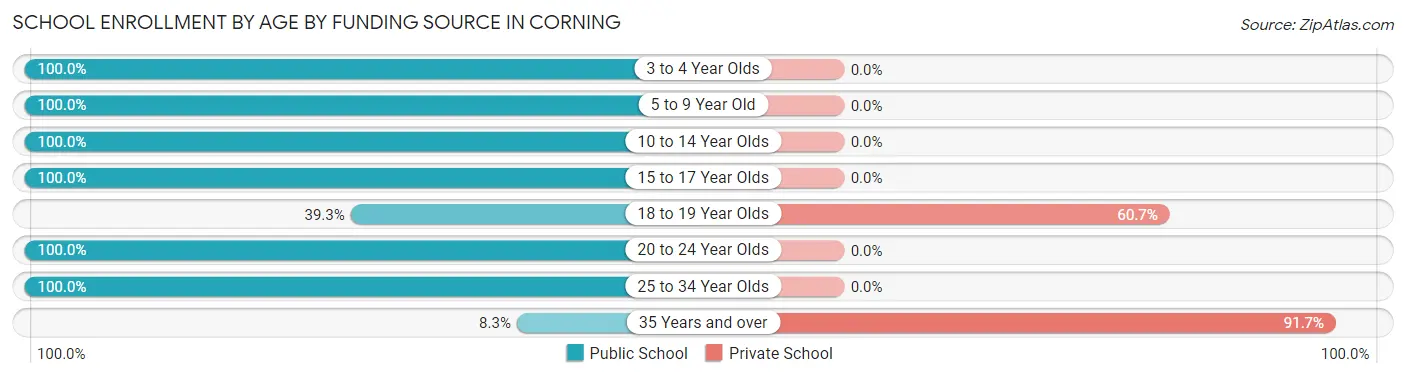
| Age Bracket | Public School | Private School |
| 3 to 4 Year Olds | 1 (100.0%) | 0 (0.0%) |
| 5 to 9 Year Old | 115 (100.0%) | 0 (0.0%) |
| 10 to 14 Year Olds | 117 (100.0%) | 0 (0.0%) |
| 15 to 17 Year Olds | 52 (100.0%) | 0 (0.0%) |
| 18 to 19 Year Olds | 11 (39.3%) | 17 (60.7%) |
| 20 to 24 Year Olds | 14 (100.0%) | 0 (0.0%) |
| 25 to 34 Year Olds | 7 (100.0%) | 0 (0.0%) |
| 35 Years and over | 1 (8.3%) | 11 (91.7%) |
| Total | 318 (91.9%) | 28 (8.1%) |
Educational Attainment by Field of Study in Corning
Education (56 | 21.6%), business (35 | 13.5%), bio, nature & agricultural (31 | 12.0%), liberal arts & history (28 | 10.8%), and science & technology (20 | 7.7%) are the most common fields of study among 259 individuals in Corning who have obtained a bachelor's degree or higher.
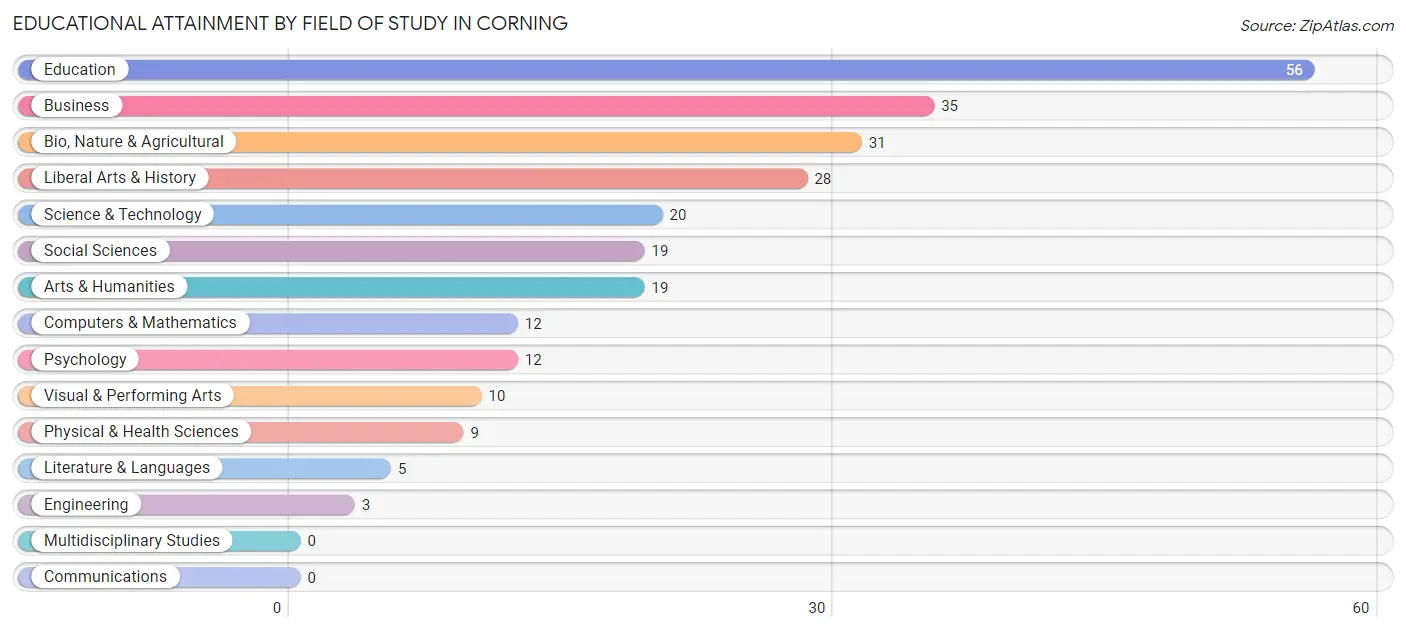
| Field of Study | # Graduates | % Graduates |
| Computers & Mathematics | 12 | 4.6% |
| Bio, Nature & Agricultural | 31 | 12.0% |
| Physical & Health Sciences | 9 | 3.5% |
| Psychology | 12 | 4.6% |
| Social Sciences | 19 | 7.3% |
| Engineering | 3 | 1.2% |
| Multidisciplinary Studies | 0 | 0.0% |
| Science & Technology | 20 | 7.7% |
| Business | 35 | 13.5% |
| Education | 56 | 21.6% |
| Literature & Languages | 5 | 1.9% |
| Liberal Arts & History | 28 | 10.8% |
| Visual & Performing Arts | 10 | 3.9% |
| Communications | 0 | 0.0% |
| Arts & Humanities | 19 | 7.3% |
| Total | 259 | 100.0% |
Transportation & Commute in Corning
Vehicle Availability by Sex in Corning
The most prevalent vehicle ownership categories in Corning are males with 2 vehicles (158, accounting for 47.2%) and females with 2 vehicles (111, making up 50.8%).
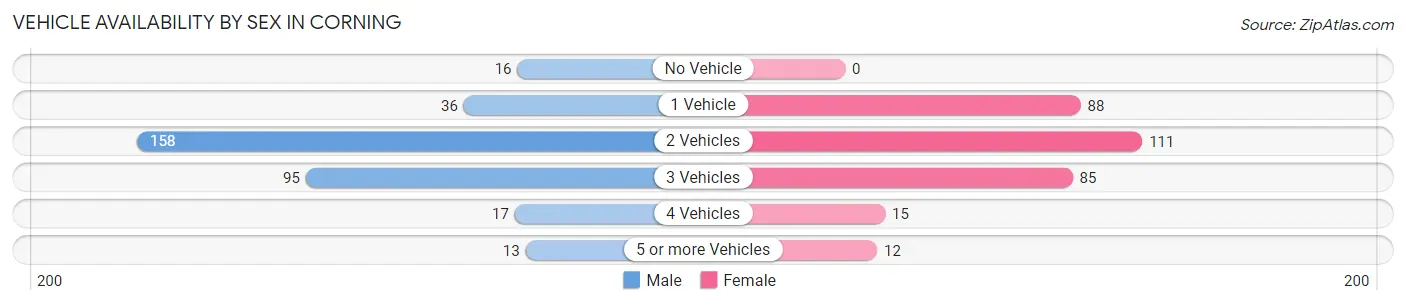
| Vehicles Available | Male | Female |
| No Vehicle | 16 (4.8%) | 0 (0.0%) |
| 1 Vehicle | 36 (10.7%) | 88 (28.3%) |
| 2 Vehicles | 158 (47.2%) | 111 (35.7%) |
| 3 Vehicles | 95 (28.4%) | 85 (27.3%) |
| 4 Vehicles | 17 (5.1%) | 15 (4.8%) |
| 5 or more Vehicles | 13 (3.9%) | 12 (3.9%) |
| Total | 335 (100.0%) | 311 (100.0%) |
Commute Time in Corning
The most frequently occuring commute durations in Corning are less than 5 minutes (192 commuters, 32.3%), 5 to 9 minutes (133 commuters, 22.4%), and 30 to 34 minutes (79 commuters, 13.3%).
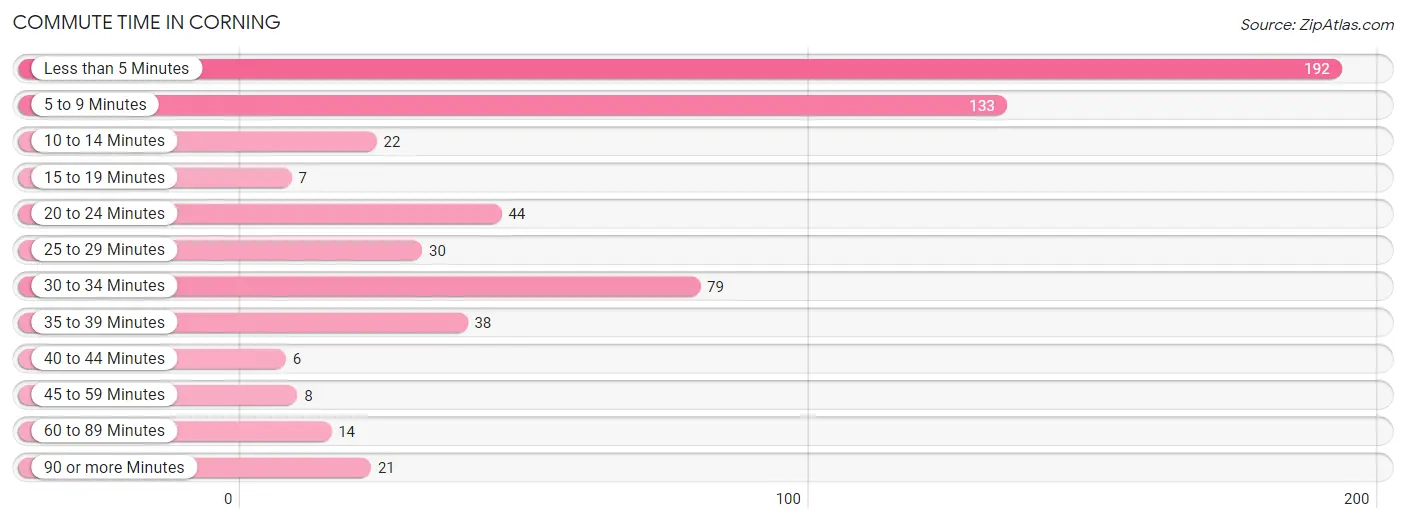
| Commute Time | # Commuters | % Commuters |
| Less than 5 Minutes | 192 | 32.3% |
| 5 to 9 Minutes | 133 | 22.4% |
| 10 to 14 Minutes | 22 | 3.7% |
| 15 to 19 Minutes | 7 | 1.2% |
| 20 to 24 Minutes | 44 | 7.4% |
| 25 to 29 Minutes | 30 | 5.1% |
| 30 to 34 Minutes | 79 | 13.3% |
| 35 to 39 Minutes | 38 | 6.4% |
| 40 to 44 Minutes | 6 | 1.0% |
| 45 to 59 Minutes | 8 | 1.3% |
| 60 to 89 Minutes | 14 | 2.4% |
| 90 or more Minutes | 21 | 3.5% |
Commute Time by Sex in Corning
The most common commute times in Corning are 5 to 9 minutes (69 commuters, 23.4%) for males and less than 5 minutes (126 commuters, 42.1%) for females.
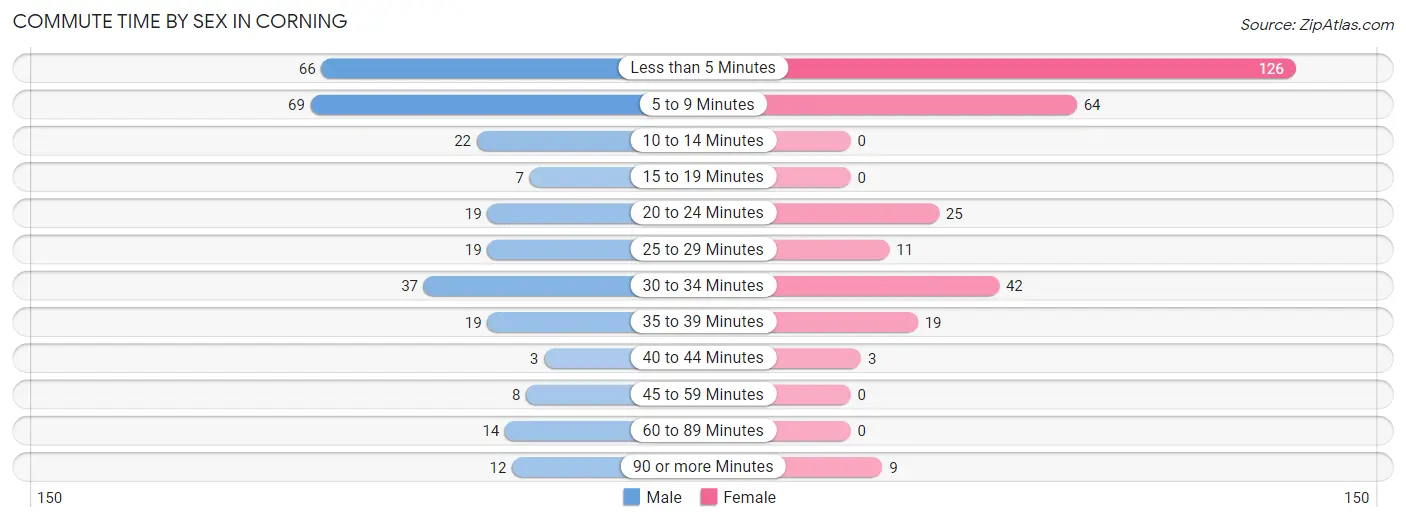
| Commute Time | Male | Female |
| Less than 5 Minutes | 66 (22.4%) | 126 (42.1%) |
| 5 to 9 Minutes | 69 (23.4%) | 64 (21.4%) |
| 10 to 14 Minutes | 22 (7.5%) | 0 (0.0%) |
| 15 to 19 Minutes | 7 (2.4%) | 0 (0.0%) |
| 20 to 24 Minutes | 19 (6.4%) | 25 (8.4%) |
| 25 to 29 Minutes | 19 (6.4%) | 11 (3.7%) |
| 30 to 34 Minutes | 37 (12.5%) | 42 (14.1%) |
| 35 to 39 Minutes | 19 (6.4%) | 19 (6.4%) |
| 40 to 44 Minutes | 3 (1.0%) | 3 (1.0%) |
| 45 to 59 Minutes | 8 (2.7%) | 0 (0.0%) |
| 60 to 89 Minutes | 14 (4.8%) | 0 (0.0%) |
| 90 or more Minutes | 12 (4.1%) | 9 (3.0%) |
Time of Departure to Work by Sex in Corning
The most frequent times of departure to work in Corning are 7:30 AM to 7:59 AM (63, 21.4%) for males and 7:00 AM to 7:29 AM (57, 19.1%) for females.
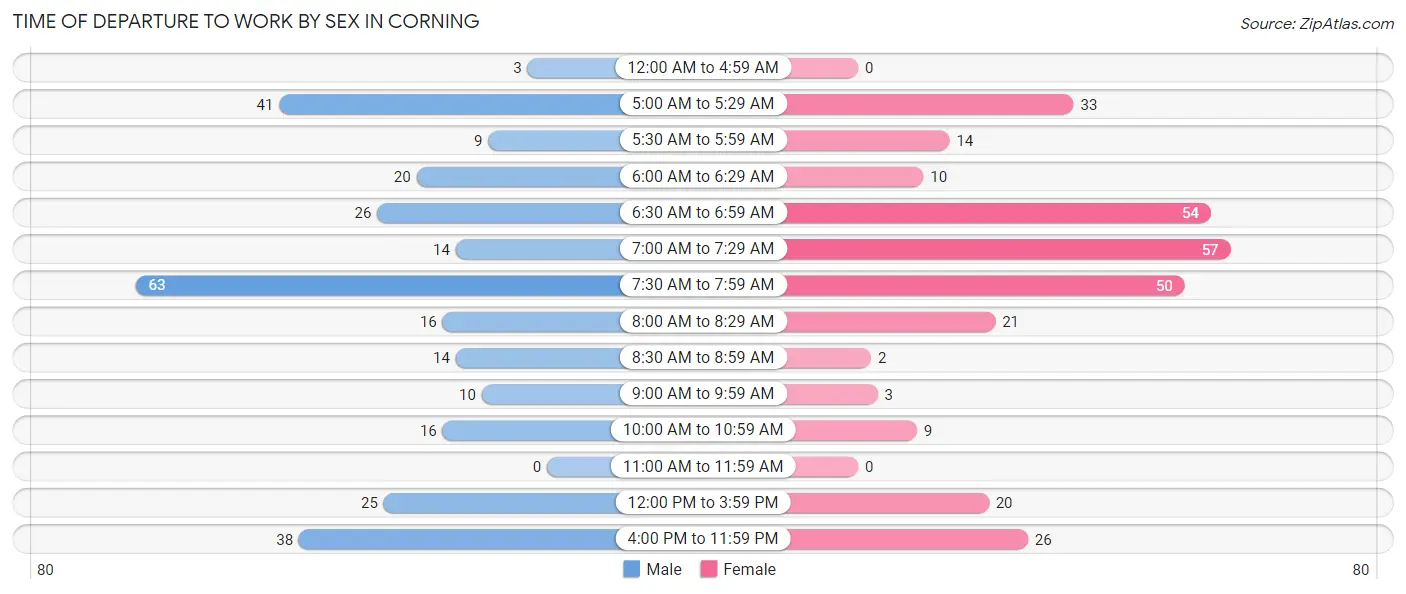
| Time of Departure | Male | Female |
| 12:00 AM to 4:59 AM | 3 (1.0%) | 0 (0.0%) |
| 5:00 AM to 5:29 AM | 41 (13.9%) | 33 (11.0%) |
| 5:30 AM to 5:59 AM | 9 (3.0%) | 14 (4.7%) |
| 6:00 AM to 6:29 AM | 20 (6.8%) | 10 (3.3%) |
| 6:30 AM to 6:59 AM | 26 (8.8%) | 54 (18.1%) |
| 7:00 AM to 7:29 AM | 14 (4.8%) | 57 (19.1%) |
| 7:30 AM to 7:59 AM | 63 (21.4%) | 50 (16.7%) |
| 8:00 AM to 8:29 AM | 16 (5.4%) | 21 (7.0%) |
| 8:30 AM to 8:59 AM | 14 (4.8%) | 2 (0.7%) |
| 9:00 AM to 9:59 AM | 10 (3.4%) | 3 (1.0%) |
| 10:00 AM to 10:59 AM | 16 (5.4%) | 9 (3.0%) |
| 11:00 AM to 11:59 AM | 0 (0.0%) | 0 (0.0%) |
| 12:00 PM to 3:59 PM | 25 (8.5%) | 20 (6.7%) |
| 4:00 PM to 11:59 PM | 38 (12.9%) | 26 (8.7%) |
| Total | 295 (100.0%) | 299 (100.0%) |
Housing Occupancy in Corning
Occupancy by Ownership in Corning
Of the total 692 dwellings in Corning, owner-occupied units account for 491 (71.0%), while renter-occupied units make up 201 (29.0%).
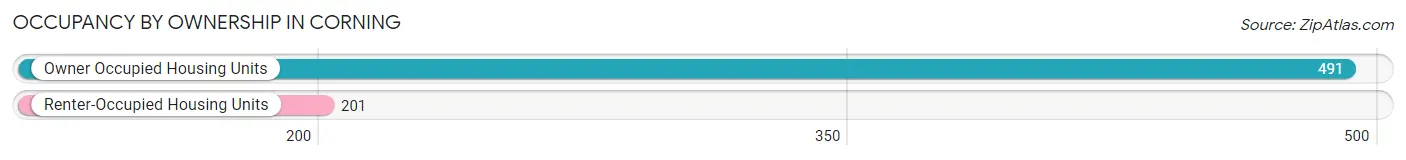
| Occupancy | # Housing Units | % Housing Units |
| Owner Occupied Housing Units | 491 | 71.0% |
| Renter-Occupied Housing Units | 201 | 29.0% |
| Total Occupied Housing Units | 692 | 100.0% |
Occupancy by Household Size in Corning
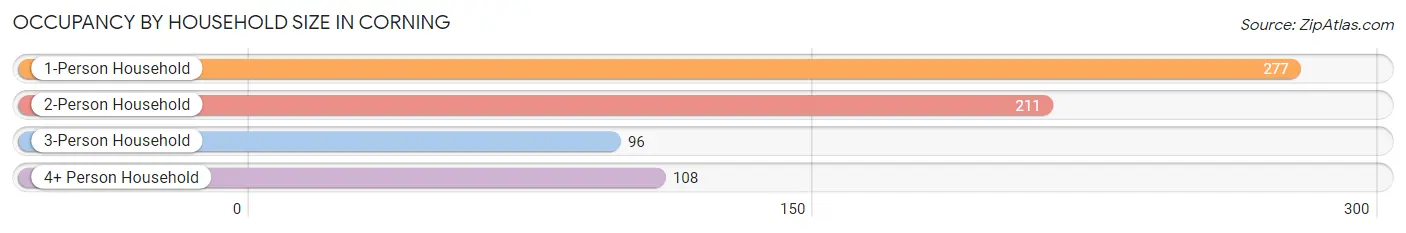
| Household Size | # Housing Units | % Housing Units |
| 1-Person Household | 277 | 40.0% |
| 2-Person Household | 211 | 30.5% |
| 3-Person Household | 96 | 13.9% |
| 4+ Person Household | 108 | 15.6% |
| Total Housing Units | 692 | 100.0% |
Occupancy by Ownership by Household Size in Corning
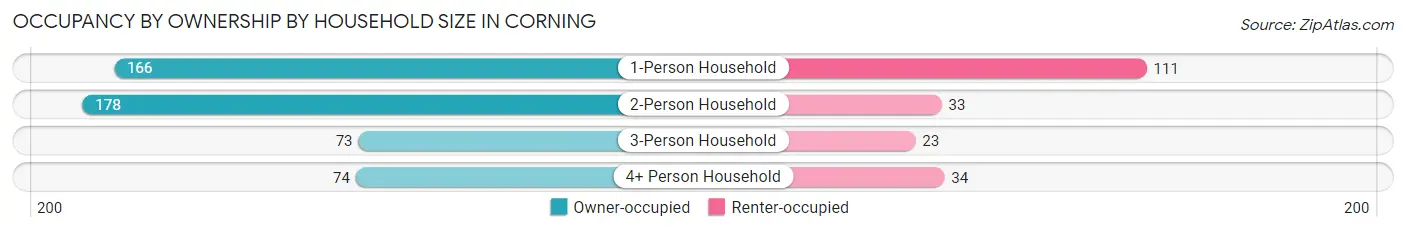
| Household Size | Owner-occupied | Renter-occupied |
| 1-Person Household | 166 (59.9%) | 111 (40.1%) |
| 2-Person Household | 178 (84.4%) | 33 (15.6%) |
| 3-Person Household | 73 (76.0%) | 23 (24.0%) |
| 4+ Person Household | 74 (68.5%) | 34 (31.5%) |
| Total Housing Units | 491 (71.0%) | 201 (29.0%) |
Occupancy by Educational Attainment in Corning
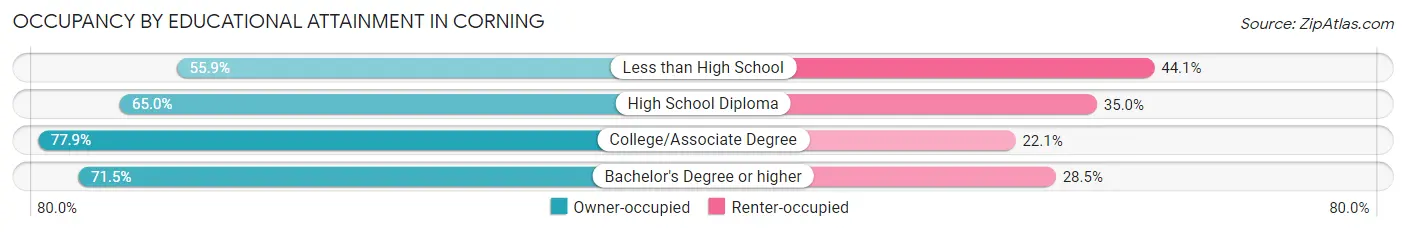
| Household Size | Owner-occupied | Renter-occupied |
| Less than High School | 19 (55.9%) | 15 (44.1%) |
| High School Diploma | 156 (65.0%) | 84 (35.0%) |
| College/Associate Degree | 208 (77.9%) | 59 (22.1%) |
| Bachelor's Degree or higher | 108 (71.5%) | 43 (28.5%) |
Occupancy by Age of Householder in Corning
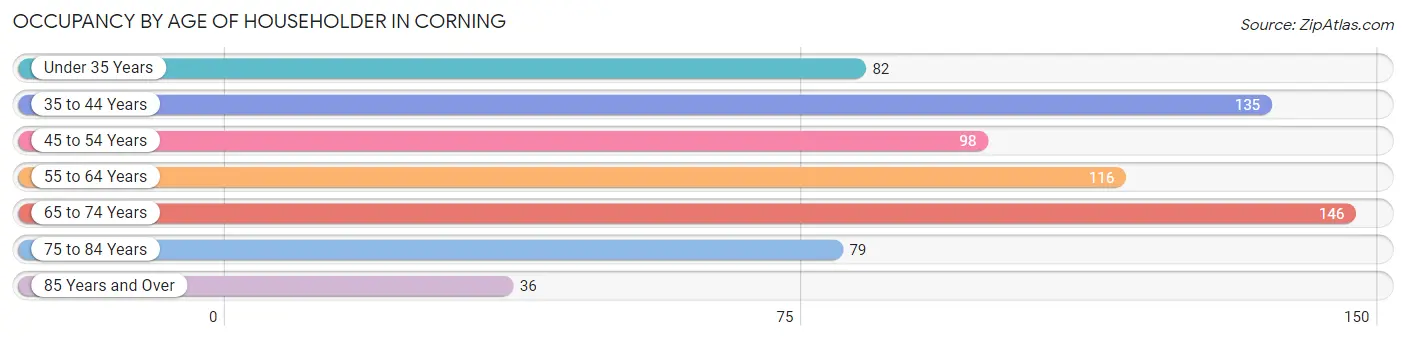
| Age Bracket | # Households | % Households |
| Under 35 Years | 82 | 11.8% |
| 35 to 44 Years | 135 | 19.5% |
| 45 to 54 Years | 98 | 14.2% |
| 55 to 64 Years | 116 | 16.8% |
| 65 to 74 Years | 146 | 21.1% |
| 75 to 84 Years | 79 | 11.4% |
| 85 Years and Over | 36 | 5.2% |
| Total | 692 | 100.0% |
Housing Finances in Corning
Median Income by Occupancy in Corning
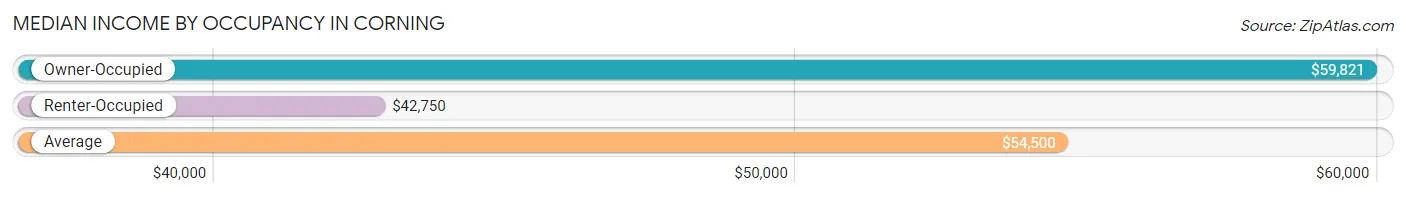
| Occupancy Type | # Households | Median Income |
| Owner-Occupied | 491 (71.0%) | $59,821 |
| Renter-Occupied | 201 (29.0%) | $42,750 |
| Average | 692 (100.0%) | $54,500 |
Occupancy by Householder Income Bracket in Corning
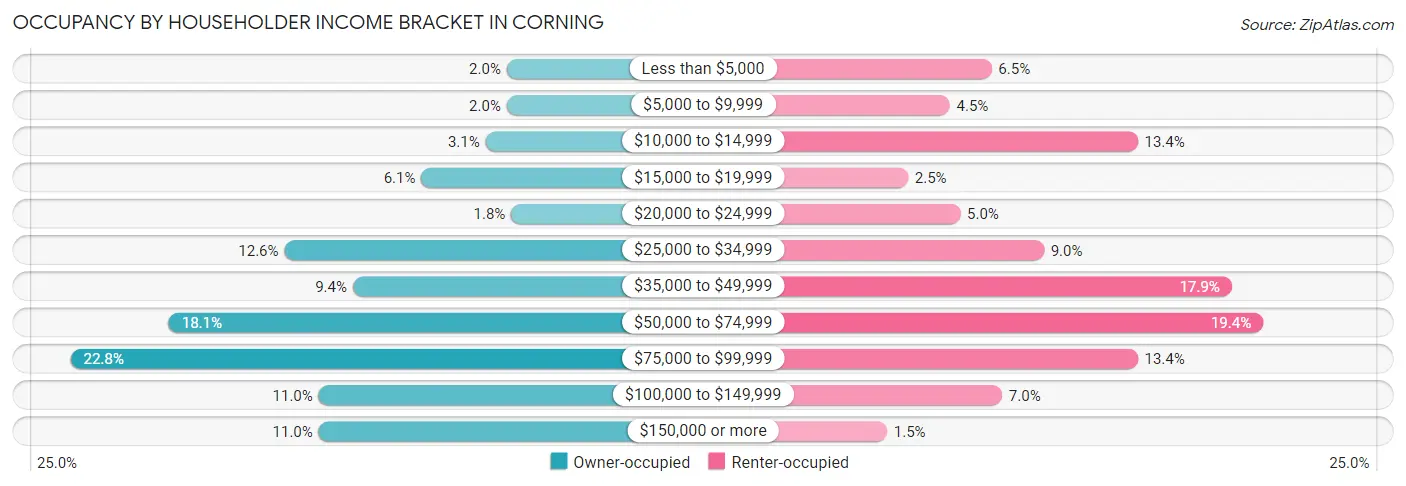
| Income Bracket | Owner-occupied | Renter-occupied |
| Less than $5,000 | 10 (2.0%) | 13 (6.5%) |
| $5,000 to $9,999 | 10 (2.0%) | 9 (4.5%) |
| $10,000 to $14,999 | 15 (3.0%) | 27 (13.4%) |
| $15,000 to $19,999 | 30 (6.1%) | 5 (2.5%) |
| $20,000 to $24,999 | 9 (1.8%) | 10 (5.0%) |
| $25,000 to $34,999 | 62 (12.6%) | 18 (9.0%) |
| $35,000 to $49,999 | 46 (9.4%) | 36 (17.9%) |
| $50,000 to $74,999 | 89 (18.1%) | 39 (19.4%) |
| $75,000 to $99,999 | 112 (22.8%) | 27 (13.4%) |
| $100,000 to $149,999 | 54 (11.0%) | 14 (7.0%) |
| $150,000 or more | 54 (11.0%) | 3 (1.5%) |
| Total | 491 (100.0%) | 201 (100.0%) |
Monthly Housing Cost Tiers in Corning
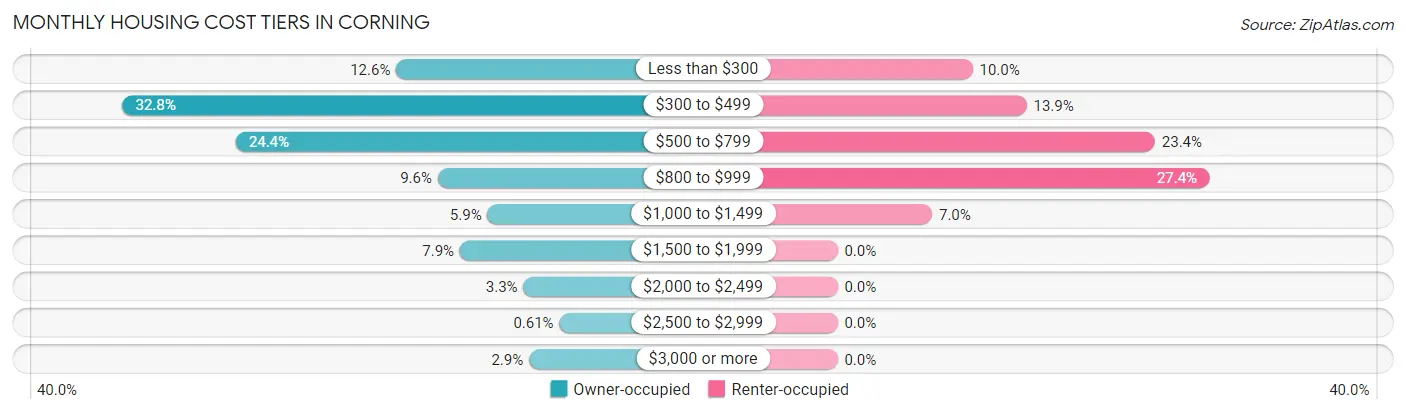
| Monthly Cost | Owner-occupied | Renter-occupied |
| Less than $300 | 62 (12.6%) | 20 (10.0%) |
| $300 to $499 | 161 (32.8%) | 28 (13.9%) |
| $500 to $799 | 120 (24.4%) | 47 (23.4%) |
| $800 to $999 | 47 (9.6%) | 55 (27.4%) |
| $1,000 to $1,499 | 29 (5.9%) | 14 (7.0%) |
| $1,500 to $1,999 | 39 (7.9%) | 0 (0.0%) |
| $2,000 to $2,499 | 16 (3.3%) | 0 (0.0%) |
| $2,500 to $2,999 | 3 (0.6%) | 0 (0.0%) |
| $3,000 or more | 14 (2.9%) | 0 (0.0%) |
| Total | 491 (100.0%) | 201 (100.0%) |
Physical Housing Characteristics in Corning
Housing Structures in Corning
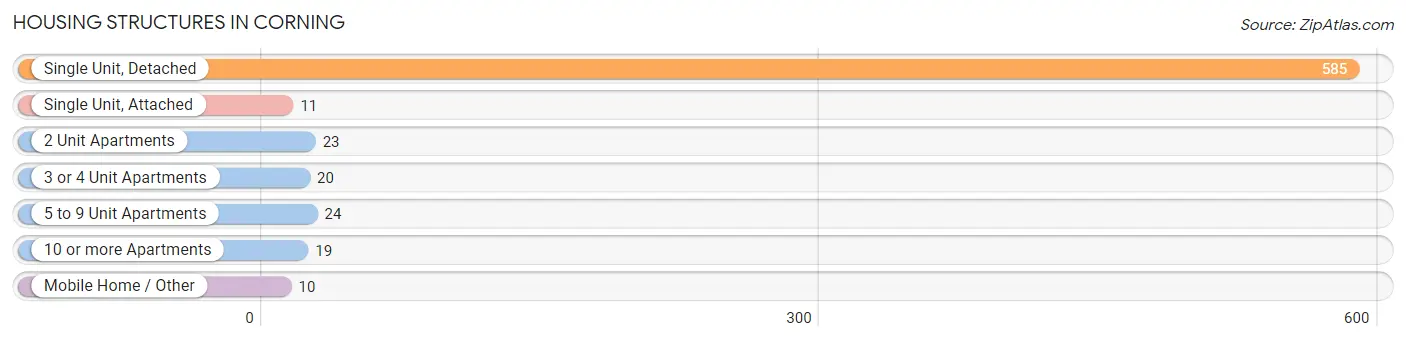
| Structure Type | # Housing Units | % Housing Units |
| Single Unit, Detached | 585 | 84.5% |
| Single Unit, Attached | 11 | 1.6% |
| 2 Unit Apartments | 23 | 3.3% |
| 3 or 4 Unit Apartments | 20 | 2.9% |
| 5 to 9 Unit Apartments | 24 | 3.5% |
| 10 or more Apartments | 19 | 2.8% |
| Mobile Home / Other | 10 | 1.5% |
| Total | 692 | 100.0% |
Housing Structures by Occupancy in Corning
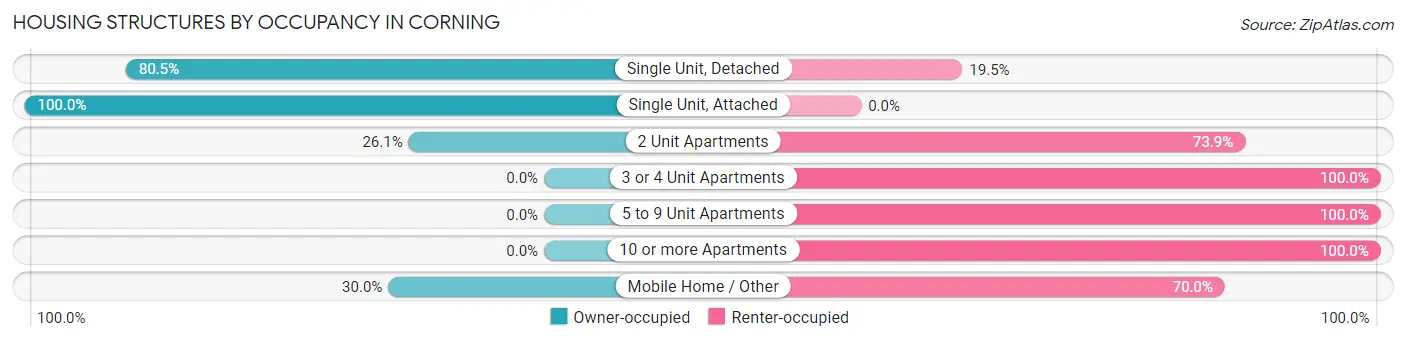
| Structure Type | Owner-occupied | Renter-occupied |
| Single Unit, Detached | 471 (80.5%) | 114 (19.5%) |
| Single Unit, Attached | 11 (100.0%) | 0 (0.0%) |
| 2 Unit Apartments | 6 (26.1%) | 17 (73.9%) |
| 3 or 4 Unit Apartments | 0 (0.0%) | 20 (100.0%) |
| 5 to 9 Unit Apartments | 0 (0.0%) | 24 (100.0%) |
| 10 or more Apartments | 0 (0.0%) | 19 (100.0%) |
| Mobile Home / Other | 3 (30.0%) | 7 (70.0%) |
| Total | 491 (71.0%) | 201 (29.0%) |
Housing Structures by Number of Rooms in Corning
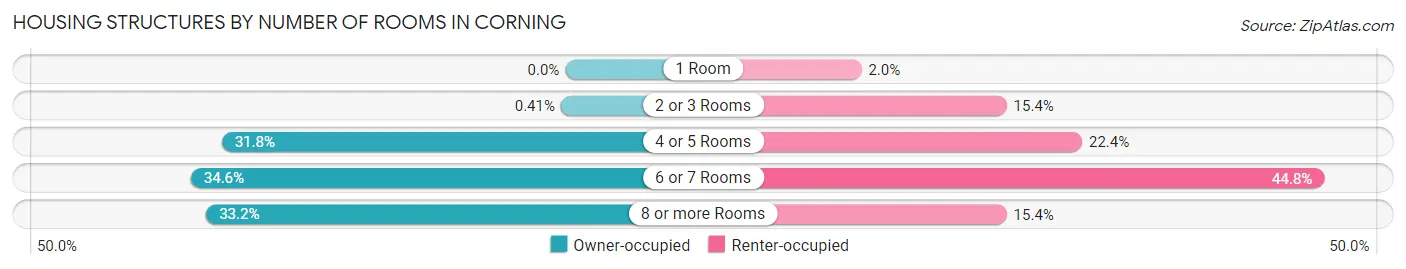
| Number of Rooms | Owner-occupied | Renter-occupied |
| 1 Room | 0 (0.0%) | 4 (2.0%) |
| 2 or 3 Rooms | 2 (0.4%) | 31 (15.4%) |
| 4 or 5 Rooms | 156 (31.8%) | 45 (22.4%) |
| 6 or 7 Rooms | 170 (34.6%) | 90 (44.8%) |
| 8 or more Rooms | 163 (33.2%) | 31 (15.4%) |
| Total | 491 (100.0%) | 201 (100.0%) |
Housing Structure by Heating Type in Corning
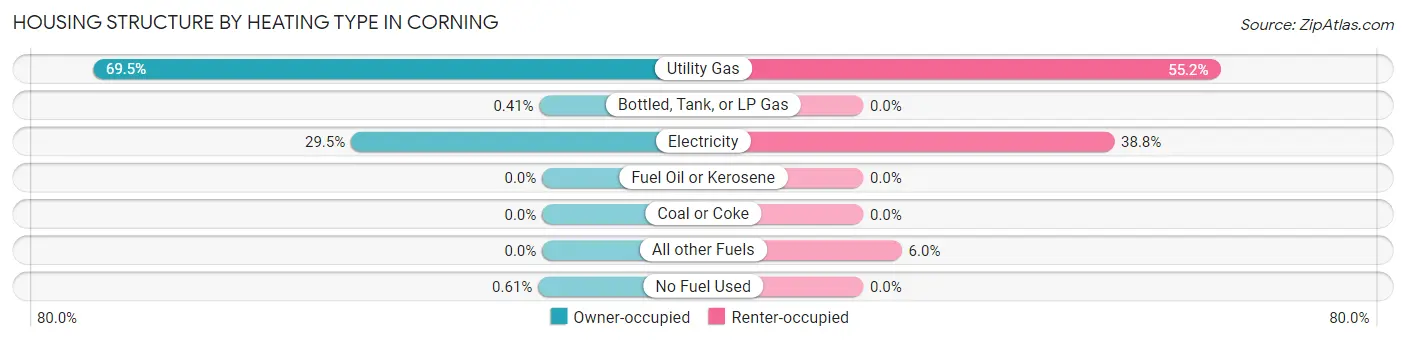
| Heating Type | Owner-occupied | Renter-occupied |
| Utility Gas | 341 (69.5%) | 111 (55.2%) |
| Bottled, Tank, or LP Gas | 2 (0.4%) | 0 (0.0%) |
| Electricity | 145 (29.5%) | 78 (38.8%) |
| Fuel Oil or Kerosene | 0 (0.0%) | 0 (0.0%) |
| Coal or Coke | 0 (0.0%) | 0 (0.0%) |
| All other Fuels | 0 (0.0%) | 12 (6.0%) |
| No Fuel Used | 3 (0.6%) | 0 (0.0%) |
| Total | 491 (100.0%) | 201 (100.0%) |
Household Vehicle Usage in Corning
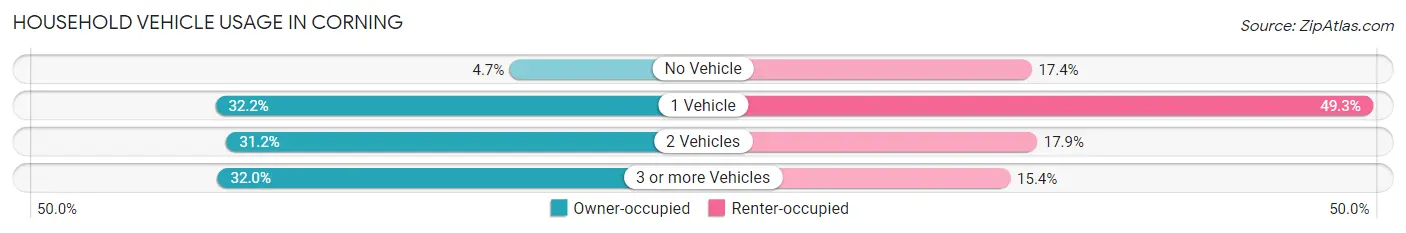
| Vehicles per Household | Owner-occupied | Renter-occupied |
| No Vehicle | 23 (4.7%) | 35 (17.4%) |
| 1 Vehicle | 158 (32.2%) | 99 (49.2%) |
| 2 Vehicles | 153 (31.2%) | 36 (17.9%) |
| 3 or more Vehicles | 157 (32.0%) | 31 (15.4%) |
| Total | 491 (100.0%) | 201 (100.0%) |
Real Estate & Mortgages in Corning
Real Estate and Mortgage Overview in Corning
| Characteristic | Without Mortgage | With Mortgage |
| Housing Units | 296 | 195 |
| Median Property Value | $67,100 | $91,900 |
| Median Household Income | $47,885 | $31 |
| Monthly Housing Costs | $417 | $14 |
| Real Estate Taxes | $1,470 | $0 |
Property Value by Mortgage Status in Corning
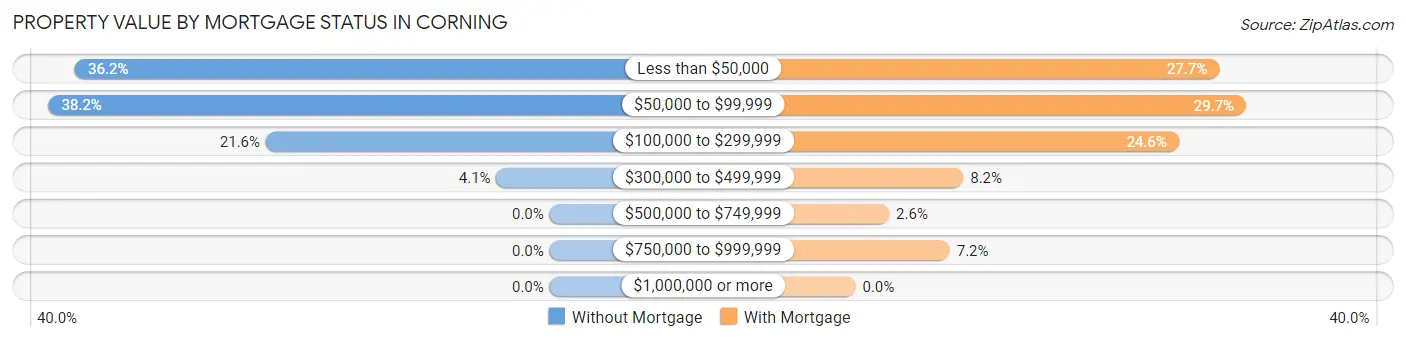
| Property Value | Without Mortgage | With Mortgage |
| Less than $50,000 | 107 (36.1%) | 54 (27.7%) |
| $50,000 to $99,999 | 113 (38.2%) | 58 (29.7%) |
| $100,000 to $299,999 | 64 (21.6%) | 48 (24.6%) |
| $300,000 to $499,999 | 12 (4.1%) | 16 (8.2%) |
| $500,000 to $749,999 | 0 (0.0%) | 5 (2.6%) |
| $750,000 to $999,999 | 0 (0.0%) | 14 (7.2%) |
| $1,000,000 or more | 0 (0.0%) | 0 (0.0%) |
| Total | 296 (100.0%) | 195 (100.0%) |
Household Income by Mortgage Status in Corning
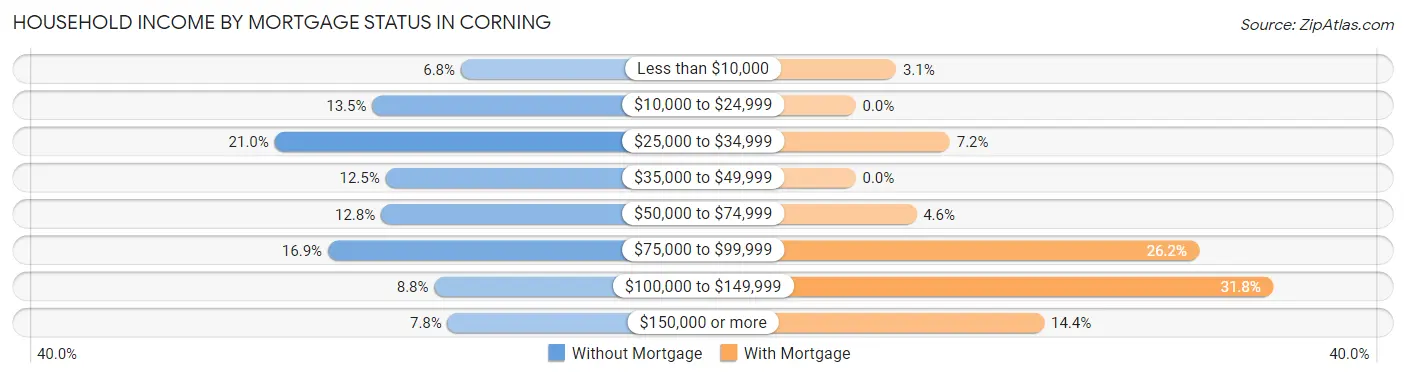
| Household Income | Without Mortgage | With Mortgage |
| Less than $10,000 | 20 (6.8%) | 6 (3.1%) |
| $10,000 to $24,999 | 40 (13.5%) | 0 (0.0%) |
| $25,000 to $34,999 | 62 (20.9%) | 14 (7.2%) |
| $35,000 to $49,999 | 37 (12.5%) | 0 (0.0%) |
| $50,000 to $74,999 | 38 (12.8%) | 9 (4.6%) |
| $75,000 to $99,999 | 50 (16.9%) | 51 (26.2%) |
| $100,000 to $149,999 | 26 (8.8%) | 62 (31.8%) |
| $150,000 or more | 23 (7.8%) | 28 (14.4%) |
| Total | 296 (100.0%) | 195 (100.0%) |
Property Value to Household Income Ratio in Corning
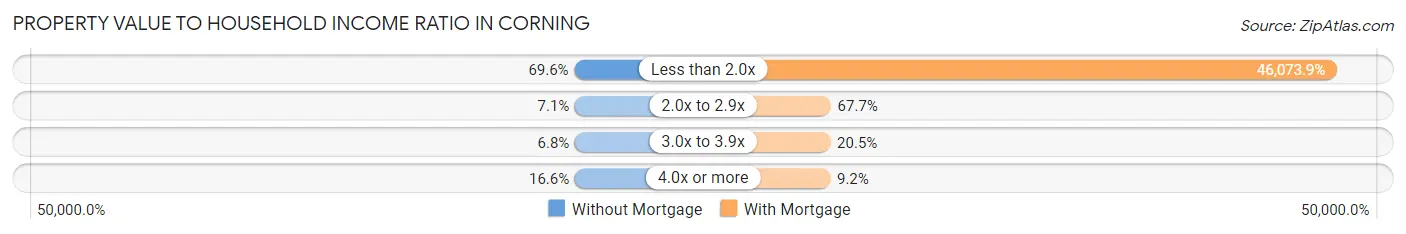
| Value-to-Income Ratio | Without Mortgage | With Mortgage |
| Less than 2.0x | 206 (69.6%) | 89,844 (46,073.8%) |
| 2.0x to 2.9x | 21 (7.1%) | 132 (67.7%) |
| 3.0x to 3.9x | 20 (6.8%) | 40 (20.5%) |
| 4.0x or more | 49 (16.6%) | 18 (9.2%) |
| Total | 296 (100.0%) | 195 (100.0%) |
Real Estate Taxes by Mortgage Status in Corning
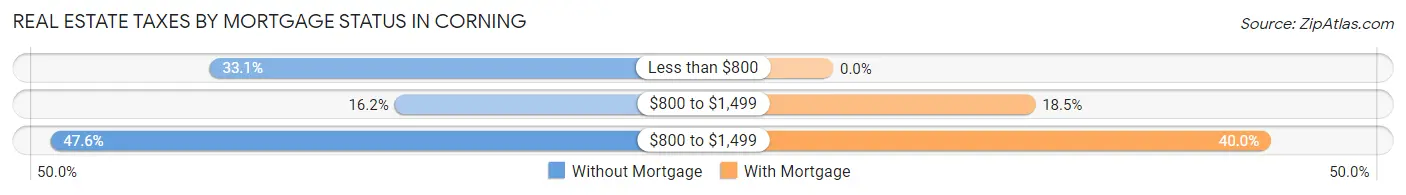
| Property Taxes | Without Mortgage | With Mortgage |
| Less than $800 | 98 (33.1%) | 0 (0.0%) |
| $800 to $1,499 | 48 (16.2%) | 36 (18.5%) |
| $800 to $1,499 | 141 (47.6%) | 78 (40.0%) |
| Total | 296 (100.0%) | 195 (100.0%) |
Health & Disability in Corning
Health Insurance Coverage by Age in Corning
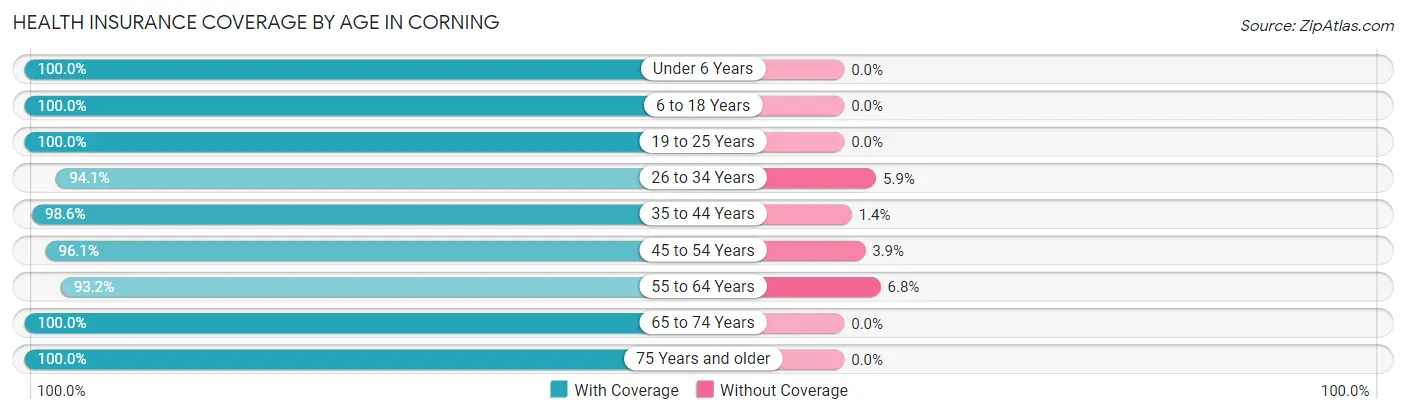
| Age Bracket | With Coverage | Without Coverage |
| Under 6 Years | 93 (100.0%) | 0 (0.0%) |
| 6 to 18 Years | 272 (100.0%) | 0 (0.0%) |
| 19 to 25 Years | 91 (100.0%) | 0 (0.0%) |
| 26 to 34 Years | 111 (94.1%) | 7 (5.9%) |
| 35 to 44 Years | 212 (98.6%) | 3 (1.4%) |
| 45 to 54 Years | 172 (96.1%) | 7 (3.9%) |
| 55 to 64 Years | 179 (93.2%) | 13 (6.8%) |
| 65 to 74 Years | 227 (100.0%) | 0 (0.0%) |
| 75 Years and older | 149 (100.0%) | 0 (0.0%) |
| Total | 1,506 (98.1%) | 30 (1.9%) |
Health Insurance Coverage by Citizenship Status in Corning
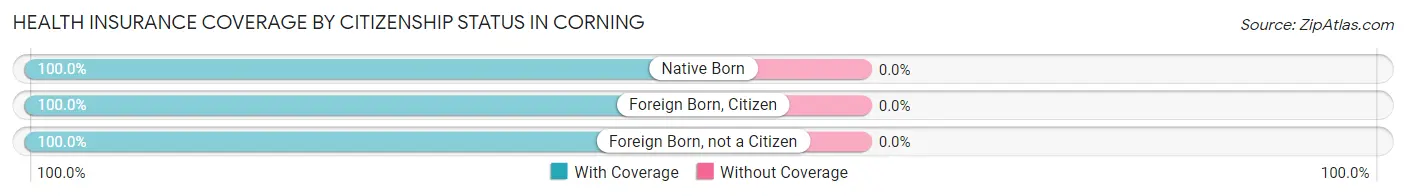
| Citizenship Status | With Coverage | Without Coverage |
| Native Born | 93 (100.0%) | 0 (0.0%) |
| Foreign Born, Citizen | 272 (100.0%) | 0 (0.0%) |
| Foreign Born, not a Citizen | 91 (100.0%) | 0 (0.0%) |
Health Insurance Coverage by Household Income in Corning
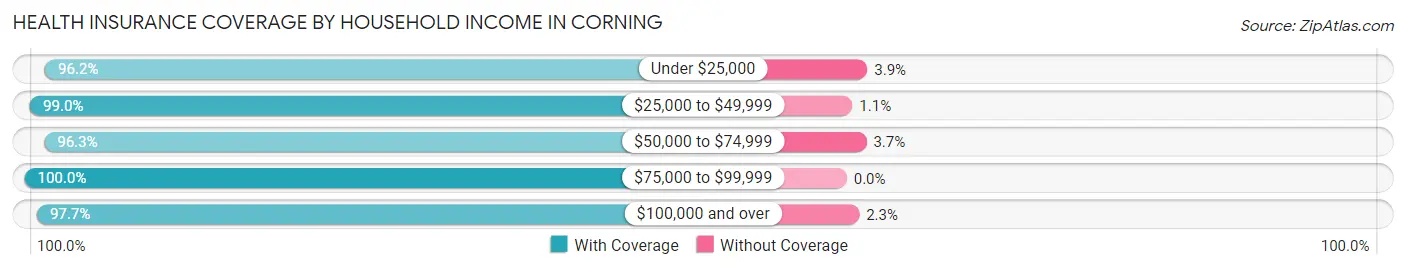
| Household Income | With Coverage | Without Coverage |
| Under $25,000 | 150 (96.2%) | 6 (3.8%) |
| $25,000 to $49,999 | 284 (99.0%) | 3 (1.1%) |
| $50,000 to $74,999 | 313 (96.3%) | 12 (3.7%) |
| $75,000 to $99,999 | 370 (100.0%) | 0 (0.0%) |
| $100,000 and over | 377 (97.7%) | 9 (2.3%) |
Public vs Private Health Insurance Coverage by Age in Corning
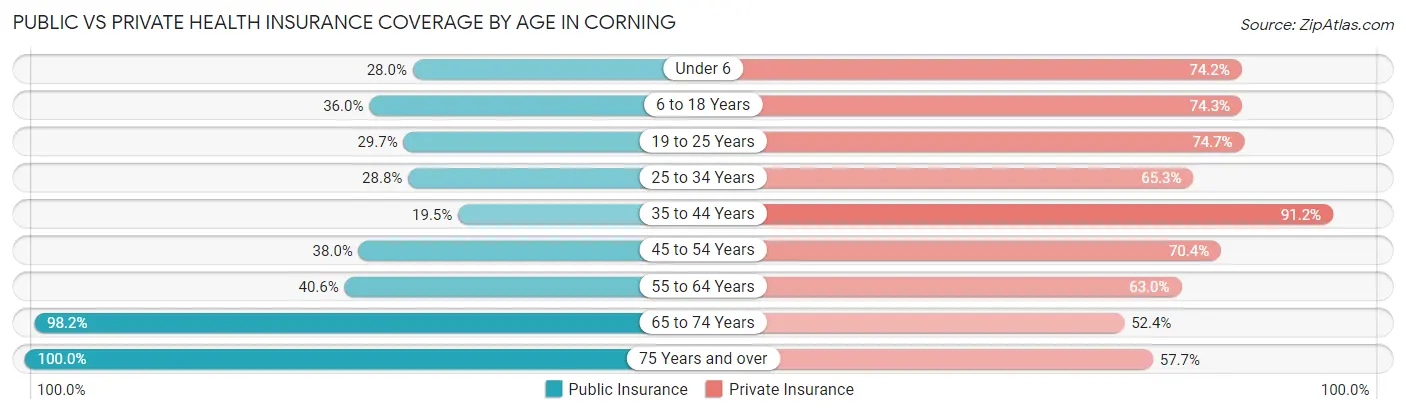
| Age Bracket | Public Insurance | Private Insurance |
| Under 6 | 26 (28.0%) | 69 (74.2%) |
| 6 to 18 Years | 98 (36.0%) | 202 (74.3%) |
| 19 to 25 Years | 27 (29.7%) | 68 (74.7%) |
| 25 to 34 Years | 34 (28.8%) | 77 (65.2%) |
| 35 to 44 Years | 42 (19.5%) | 196 (91.2%) |
| 45 to 54 Years | 68 (38.0%) | 126 (70.4%) |
| 55 to 64 Years | 78 (40.6%) | 121 (63.0%) |
| 65 to 74 Years | 223 (98.2%) | 119 (52.4%) |
| 75 Years and over | 149 (100.0%) | 86 (57.7%) |
| Total | 745 (48.5%) | 1,064 (69.3%) |
Disability Status by Sex by Age in Corning
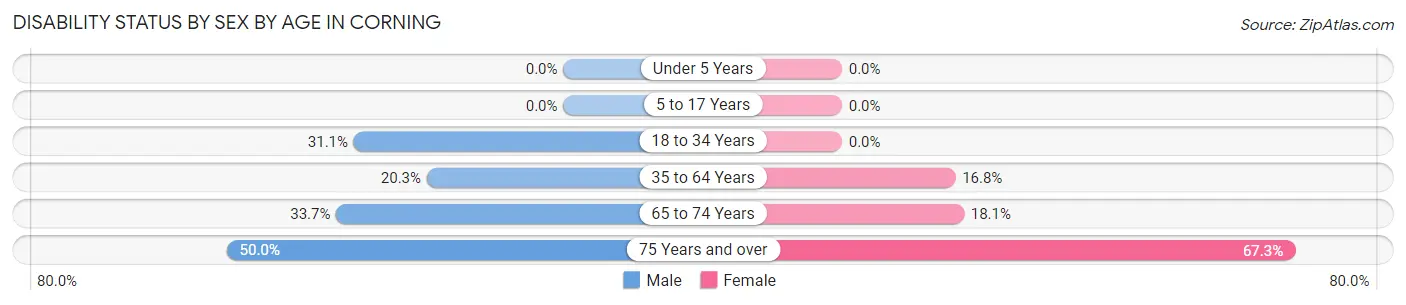
| Age Bracket | Male | Female |
| Under 5 Years | 0 (0.0%) | 0 (0.0%) |
| 5 to 17 Years | 0 (0.0%) | 0 (0.0%) |
| 18 to 34 Years | 42 (31.1%) | 0 (0.0%) |
| 35 to 64 Years | 61 (20.3%) | 48 (16.8%) |
| 65 to 74 Years | 30 (33.7%) | 25 (18.1%) |
| 75 Years and over | 21 (50.0%) | 72 (67.3%) |
Disability Class by Sex by Age in Corning
Disability Class: Hearing Difficulty
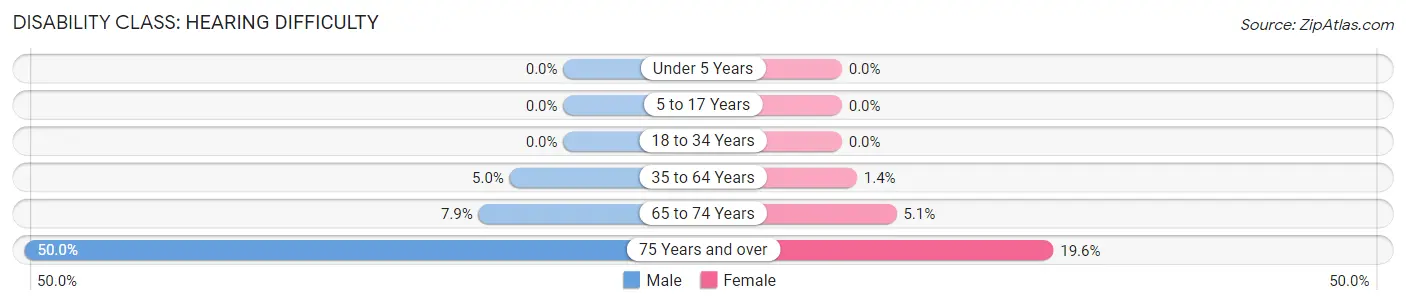
| Age Bracket | Male | Female |
| Under 5 Years | 0 (0.0%) | 0 (0.0%) |
| 5 to 17 Years | 0 (0.0%) | 0 (0.0%) |
| 18 to 34 Years | 0 (0.0%) | 0 (0.0%) |
| 35 to 64 Years | 15 (5.0%) | 4 (1.4%) |
| 65 to 74 Years | 7 (7.9%) | 7 (5.1%) |
| 75 Years and over | 21 (50.0%) | 21 (19.6%) |
Disability Class: Vision Difficulty
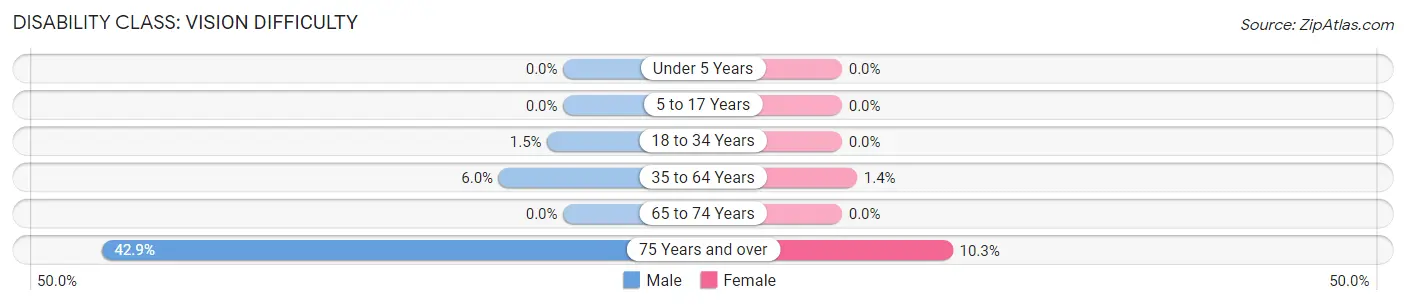
| Age Bracket | Male | Female |
| Under 5 Years | 0 (0.0%) | 0 (0.0%) |
| 5 to 17 Years | 0 (0.0%) | 0 (0.0%) |
| 18 to 34 Years | 2 (1.5%) | 0 (0.0%) |
| 35 to 64 Years | 18 (6.0%) | 4 (1.4%) |
| 65 to 74 Years | 0 (0.0%) | 0 (0.0%) |
| 75 Years and over | 18 (42.9%) | 11 (10.3%) |
Disability Class: Cognitive Difficulty
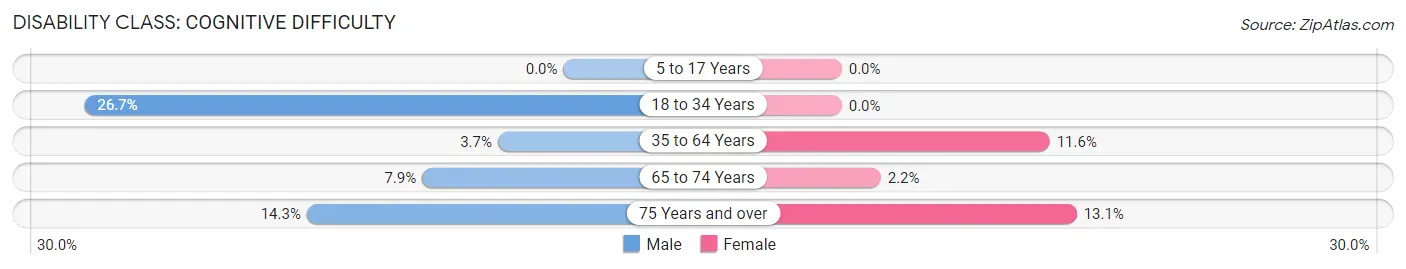
| Age Bracket | Male | Female |
| 5 to 17 Years | 0 (0.0%) | 0 (0.0%) |
| 18 to 34 Years | 36 (26.7%) | 0 (0.0%) |
| 35 to 64 Years | 11 (3.6%) | 33 (11.6%) |
| 65 to 74 Years | 7 (7.9%) | 3 (2.2%) |
| 75 Years and over | 6 (14.3%) | 14 (13.1%) |
Disability Class: Ambulatory Difficulty
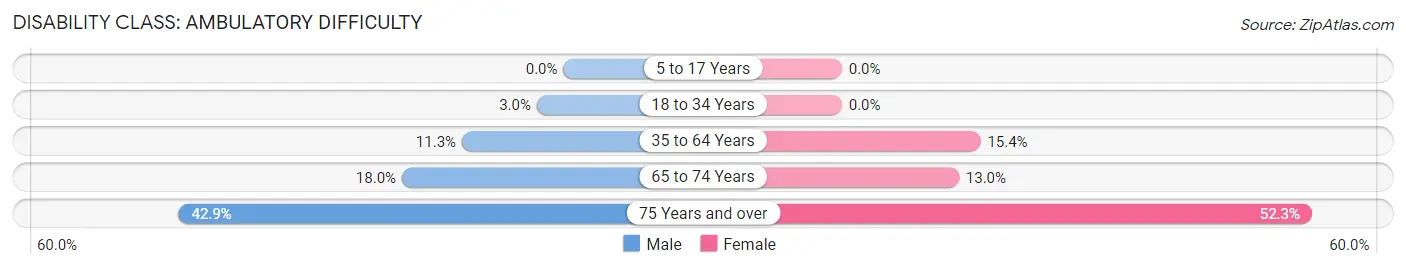
| Age Bracket | Male | Female |
| 5 to 17 Years | 0 (0.0%) | 0 (0.0%) |
| 18 to 34 Years | 4 (3.0%) | 0 (0.0%) |
| 35 to 64 Years | 34 (11.3%) | 44 (15.4%) |
| 65 to 74 Years | 16 (18.0%) | 18 (13.0%) |
| 75 Years and over | 18 (42.9%) | 56 (52.3%) |
Disability Class: Self-Care Difficulty
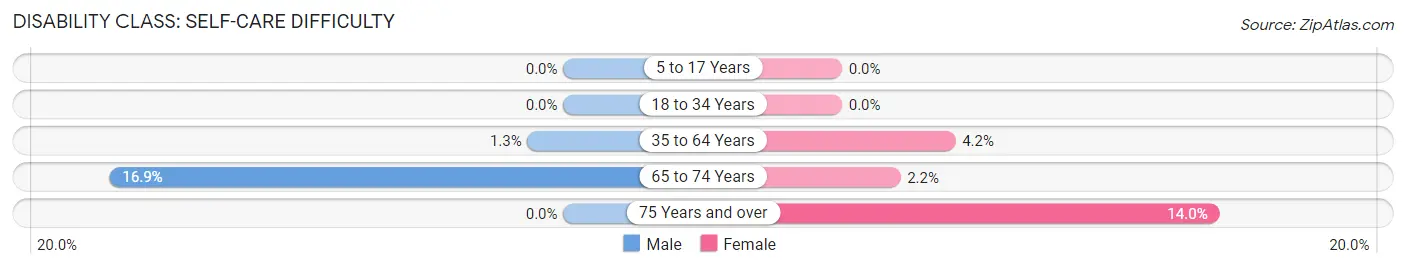
| Age Bracket | Male | Female |
| 5 to 17 Years | 0 (0.0%) | 0 (0.0%) |
| 18 to 34 Years | 0 (0.0%) | 0 (0.0%) |
| 35 to 64 Years | 4 (1.3%) | 12 (4.2%) |
| 65 to 74 Years | 15 (16.9%) | 3 (2.2%) |
| 75 Years and over | 0 (0.0%) | 15 (14.0%) |
Technology Access in Corning
Computing Device Access in Corning
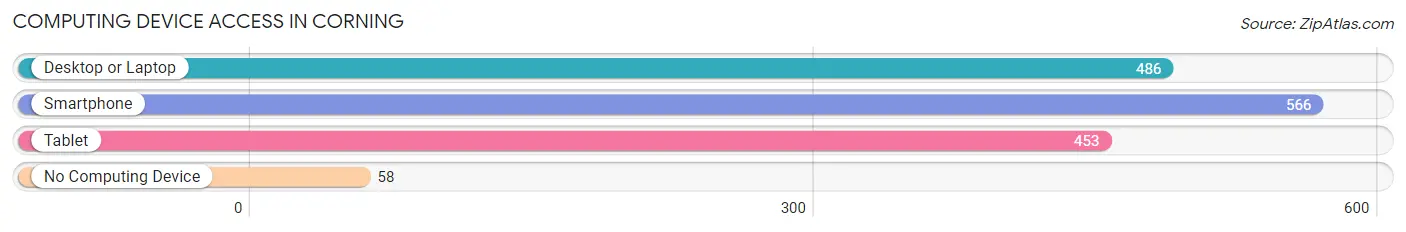
| Device Type | # Households | % Households |
| Desktop or Laptop | 486 | 70.2% |
| Smartphone | 566 | 81.8% |
| Tablet | 453 | 65.5% |
| No Computing Device | 58 | 8.4% |
| Total | 692 | 100.0% |
Internet Access in Corning
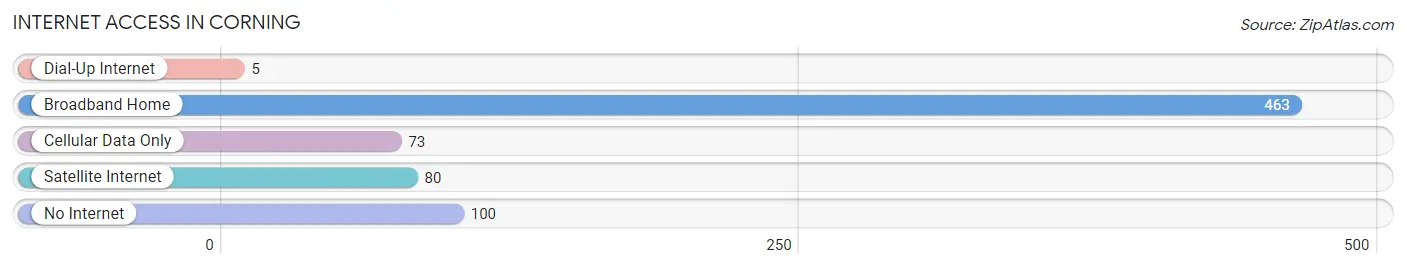
| Internet Type | # Households | % Households |
| Dial-Up Internet | 5 | 0.7% |
| Broadband Home | 463 | 66.9% |
| Cellular Data Only | 73 | 10.5% |
| Satellite Internet | 80 | 11.6% |
| No Internet | 100 | 14.4% |
| Total | 692 | 100.0% |
Corning Summary
Corning, Iowa is a small city located in Adams County in the southwestern corner of the state. It is situated along the Middle Nodaway River, and is the county seat of Adams County. The city has a population of 1,845 as of the 2010 census, and is part of the Creston Micropolitan Statistical Area.
History
Corning was founded in 1856 by a group of settlers from Ohio. The city was named after Erastus Corning, a prominent railroad executive. The city was incorporated in 1872, and the first mayor was elected in 1873.
The city was an important stop on the Chicago, Burlington & Quincy Railroad, and the railroad was a major employer in the city. The railroad also brought many new settlers to the area, and the population of Corning grew rapidly in the late 19th and early 20th centuries.
The city was also home to a number of manufacturing businesses, including a brickyard, a flour mill, a furniture factory, and a creamery. The city also had a number of retail stores, including a hardware store, a drug store, and a grocery store.
Geography
Corning is located at 40°59'N 94°45'W (40.983, -94.750). The city is situated along the Middle Nodaway River, and is located in the Loess Hills region of Iowa. The city has a total area of 1.3 square miles, all of which is land.
The city is located in a rural area, and is surrounded by farmland. The nearest major city is Des Moines, which is located about 75 miles to the northeast.
Economy
The economy of Corning is largely based on agriculture and manufacturing. The city is home to a number of manufacturing businesses, including a furniture factory, a brickyard, and a flour mill. The city also has a number of retail stores, including a hardware store, a drug store, and a grocery store.
The city is also home to a number of agricultural businesses, including a feed mill, a grain elevator, and a livestock auction. The city is also home to a number of agricultural services, including a fertilizer plant, a seed company, and a farm equipment dealership.
Demographics
As of the 2010 census, the population of Corning was 1,845. The racial makeup of the city was 97.2% White, 0.7% African American, 0.2% Native American, 0.2% Asian, 0.1% Pacific Islander, 0.7% from other races, and 0.9% from two or more races. Hispanic or Latino of any race were 1.7% of the population.
The median household income in Corning was $37,917, and the median family income was $45,625. The per capita income in Corning was $18,945. About 11.2% of families and 14.2% of the population were below the poverty line, including 19.2% of those under age 18 and 8.3% of those age 65 or over.
Common Questions
What is Per Capita Income in Corning?
Per Capita income in Corning is $33,600.
What is the Median Family Income in Corning?
Median Family Income in Corning is $83,036.
What is the Median Household income in Corning?
Median Household Income in Corning is $54,500.
What is Income or Wage Gap in Corning?
Income or Wage Gap in Corning is 14.5%.
Women in Corning earn 85.5 cents for every dollar earned by a man.
What is Inequality or Gini Index in Corning?
Inequality or Gini Index in Corning is 0.46.
What is the Total Population of Corning?
Total Population of Corning is 1,592.
What is the Total Male Population of Corning?
Total Male Population of Corning is 739.
What is the Total Female Population of Corning?
Total Female Population of Corning is 853.
What is the Ratio of Males per 100 Females in Corning?
There are 86.64 Males per 100 Females in Corning.
What is the Ratio of Females per 100 Males in Corning?
There are 115.43 Females per 100 Males in Corning.
What is the Median Population Age in Corning?
Median Population Age in Corning is 44.8 Years.
What is the Average Family Size in Corning
Average Family Size in Corning is 3.0 People.
What is the Average Household Size in Corning
Average Household Size in Corning is 2.2 People.
How Large is the Labor Force in Corning?
There are 709 People in the Labor Forcein in Corning.
What is the Percentage of People in the Labor Force in Corning?
55.9% of People are in the Labor Force in Corning.
What is the Unemployment Rate in Corning?
Unemployment Rate in Corning is 4.5%.