Clear Lake, IA Map & Demographics
Clear Lake Map
Clear Lake Overview
$51,027
PER CAPITA INCOME
$102,500
AVG FAMILY INCOME
$66,900
AVG HOUSEHOLD INCOME
26.9%
WAGE / INCOME GAP [ % ]
73.1¢/ $1
WAGE / INCOME GAP [ $ ]
0.56
INEQUALITY / GINI INDEX
7,642
TOTAL POPULATION
3,636
MALE POPULATION
4,006
FEMALE POPULATION
90.76
MALES / 100 FEMALES
110.18
FEMALES / 100 MALES
50.4
MEDIAN AGE
2.9
AVG FAMILY SIZE
2.2
AVG HOUSEHOLD SIZE
3,891
LABOR FORCE [ PEOPLE ]
60.8%
PERCENT IN LABOR FORCE
2.9%
UNEMPLOYMENT RATE
Clear Lake Zip Codes
Clear Lake Area Codes
Income in Clear Lake
Income Overview in Clear Lake
Per Capita Income in Clear Lake is $51,027, while median incomes of families and households are $102,500 and $66,900 respectively.
| Characteristic | Number | Measure |
| Per Capita Income | 7,642 | $51,027 |
| Median Family Income | 1,974 | $102,500 |
| Mean Family Income | 1,974 | $164,780 |
| Median Household Income | 3,402 | $66,900 |
| Mean Household Income | 3,402 | $114,765 |
| Income Deficit | 1,974 | $0 |
| Wage / Income Gap (%) | 7,642 | 26.90% |
| Wage / Income Gap ($) | 7,642 | 73.10¢ per $1 |
| Gini / Inequality Index | 7,642 | 0.56 |
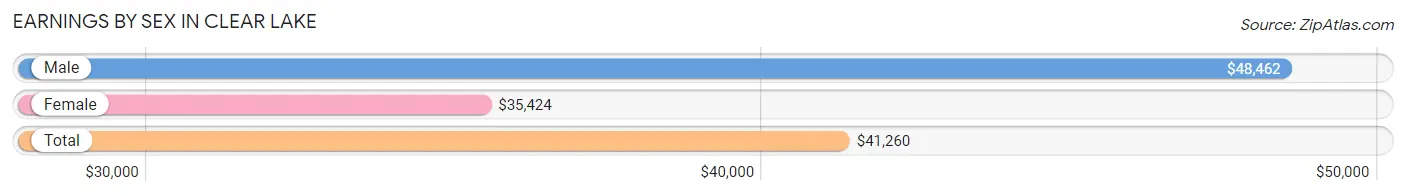
Earnings by Sex in Clear Lake
Average Earnings in Clear Lake are $41,260, $48,462 for men and $35,424 for women, a difference of 26.9%.
| Sex | Number | Average Earnings |
| Male | 2,156 (51.8%) | $48,462 |
| Female | 2,006 (48.2%) | $35,424 |
| Total | 4,162 (100.0%) | $41,260 |
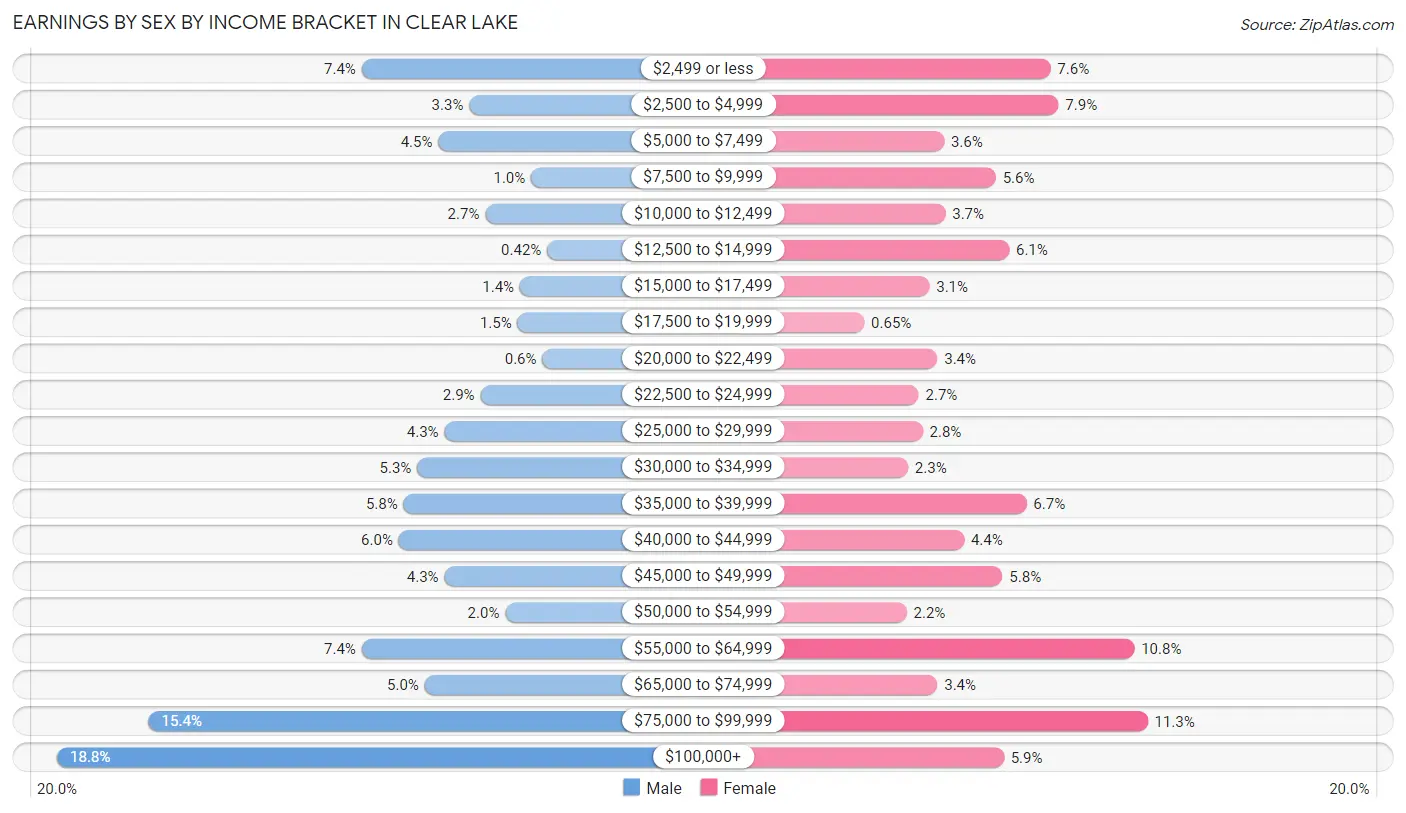
Earnings by Sex by Income Bracket in Clear Lake
The most common earnings brackets in Clear Lake are $100,000+ for men (405 | 18.8%) and $75,000 to $99,999 for women (226 | 11.3%).
| Income | Male | Female |
| $2,499 or less | 159 (7.4%) | 153 (7.6%) |
| $2,500 to $4,999 | 72 (3.3%) | 159 (7.9%) |
| $5,000 to $7,499 | 97 (4.5%) | 73 (3.6%) |
| $7,500 to $9,999 | 22 (1.0%) | 112 (5.6%) |
| $10,000 to $12,499 | 59 (2.7%) | 74 (3.7%) |
| $12,500 to $14,999 | 9 (0.4%) | 122 (6.1%) |
| $15,000 to $17,499 | 31 (1.4%) | 62 (3.1%) |
| $17,500 to $19,999 | 33 (1.5%) | 13 (0.6%) |
| $20,000 to $22,499 | 13 (0.6%) | 68 (3.4%) |
| $22,500 to $24,999 | 63 (2.9%) | 54 (2.7%) |
| $25,000 to $29,999 | 92 (4.3%) | 57 (2.8%) |
| $30,000 to $34,999 | 114 (5.3%) | 46 (2.3%) |
| $35,000 to $39,999 | 125 (5.8%) | 135 (6.7%) |
| $40,000 to $44,999 | 129 (6.0%) | 88 (4.4%) |
| $45,000 to $49,999 | 92 (4.3%) | 117 (5.8%) |
| $50,000 to $54,999 | 43 (2.0%) | 45 (2.2%) |
| $55,000 to $64,999 | 159 (7.4%) | 216 (10.8%) |
| $65,000 to $74,999 | 108 (5.0%) | 68 (3.4%) |
| $75,000 to $99,999 | 331 (15.3%) | 226 (11.3%) |
| $100,000+ | 405 (18.8%) | 118 (5.9%) |
| Total | 2,156 (100.0%) | 2,006 (100.0%) |
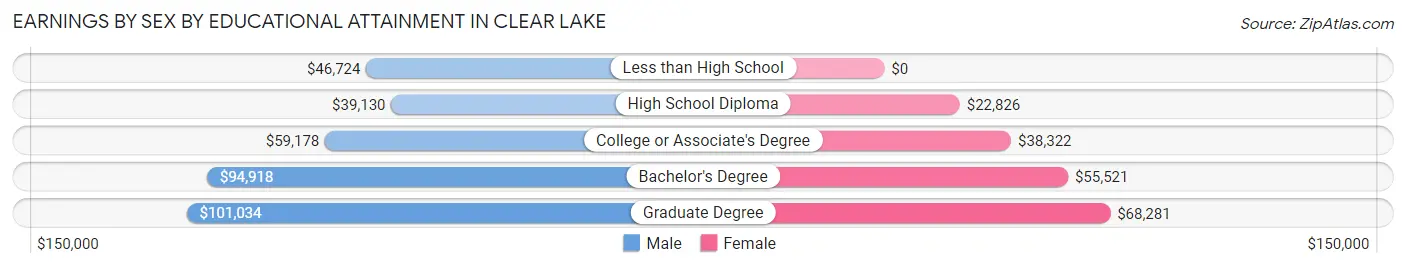
Earnings by Sex by Educational Attainment in Clear Lake
Average earnings in Clear Lake are $58,452 for men and $42,101 for women, a difference of 28.0%. Men with an educational attainment of graduate degree enjoy the highest average annual earnings of $101,034, while those with high school diploma education earn the least with $39,130. Women with an educational attainment of graduate degree earn the most with the average annual earnings of $68,281, while those with high school diploma education have the smallest earnings of $22,826.
| Educational Attainment | Male Income | Female Income |
| Less than High School | $46,724 | $0 |
| High School Diploma | $39,130 | $22,826 |
| College or Associate's Degree | $59,178 | $38,322 |
| Bachelor's Degree | $94,918 | $55,521 |
| Graduate Degree | $101,034 | $68,281 |
| Total | $58,452 | $42,101 |
Family Income in Clear Lake
Family Income Brackets in Clear Lake
According to the Clear Lake family income data, there are 422 families falling into the $200,000+ income range, which is the most common income bracket and makes up 21.4% of all families.
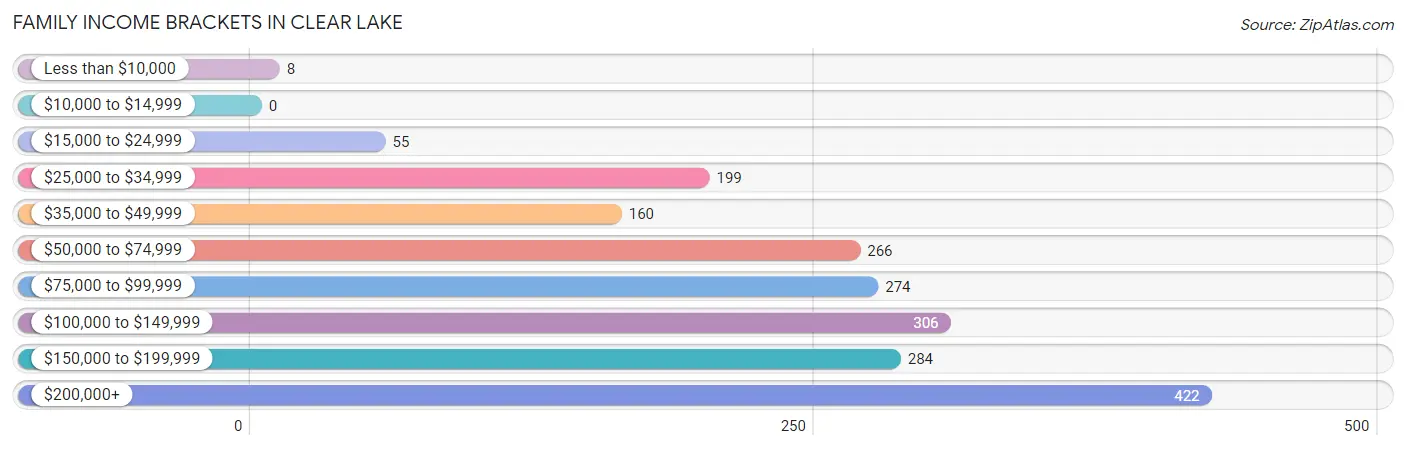
| Income Bracket | # Families | % Families |
| Less than $10,000 | 8 | 0.4% |
| $10,000 to $14,999 | 0 | 0.0% |
| $15,000 to $24,999 | 55 | 2.8% |
| $25,000 to $34,999 | 199 | 10.1% |
| $35,000 to $49,999 | 160 | 8.1% |
| $50,000 to $74,999 | 266 | 13.5% |
| $75,000 to $99,999 | 274 | 13.9% |
| $100,000 to $149,999 | 306 | 15.5% |
| $150,000 to $199,999 | 284 | 14.4% |
| $200,000+ | 422 | 21.4% |
Family Income by Famaliy Size in Clear Lake
6-person families (28 | 1.4%) account for the highest median family income in Clear Lake with $250,001 per family, while 2-person families (1,203 | 60.9%) have the highest median income of $42,598 per family member.
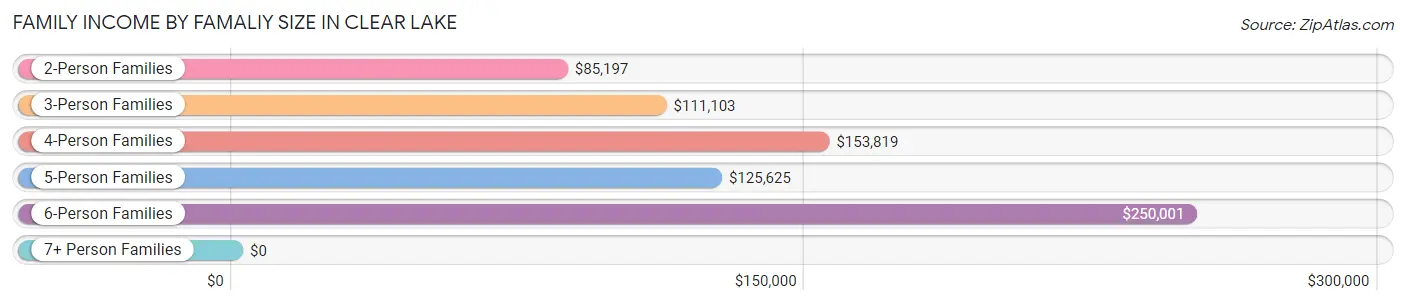
| Income Bracket | # Families | Median Income |
| 2-Person Families | 1,203 (60.9%) | $85,197 |
| 3-Person Families | 309 (15.7%) | $111,103 |
| 4-Person Families | 239 (12.1%) | $153,819 |
| 5-Person Families | 177 (9.0%) | $125,625 |
| 6-Person Families | 28 (1.4%) | $250,001 |
| 7+ Person Families | 18 (0.9%) | $0 |
| Total | 1,974 (100.0%) | $102,500 |
Family Income by Number of Earners in Clear Lake
The median family income in Clear Lake is $102,500, with families comprising 3+ earners (291) having the highest median family income of $171,719, while families with 1 earner (397) have the lowest median family income of $51,827, accounting for 14.7% and 20.1% of families, respectively.
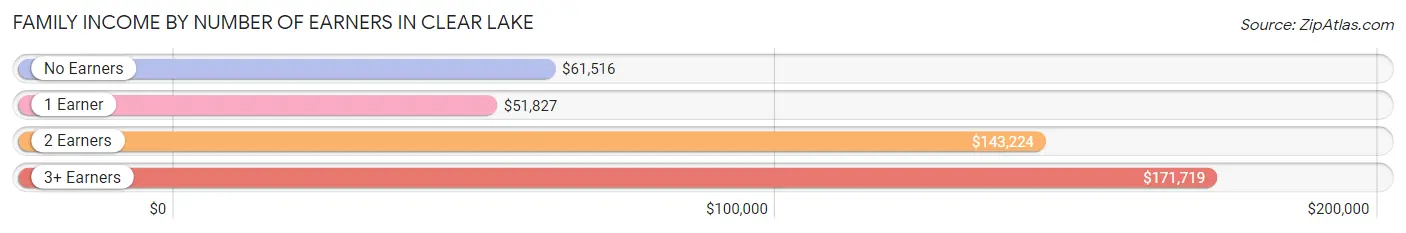
| Number of Earners | # Families | Median Income |
| No Earners | 465 (23.6%) | $61,516 |
| 1 Earner | 397 (20.1%) | $51,827 |
| 2 Earners | 821 (41.6%) | $143,224 |
| 3+ Earners | 291 (14.7%) | $171,719 |
| Total | 1,974 (100.0%) | $102,500 |
Household Income in Clear Lake
Household Income Brackets in Clear Lake
With 493 households falling in the category, the $50,000 to $74,999 income range is the most frequent in Clear Lake, accounting for 14.5% of all households. In contrast, only 95 households (2.8%) fall into the less than $10,000 income bracket, making it the least populous group.
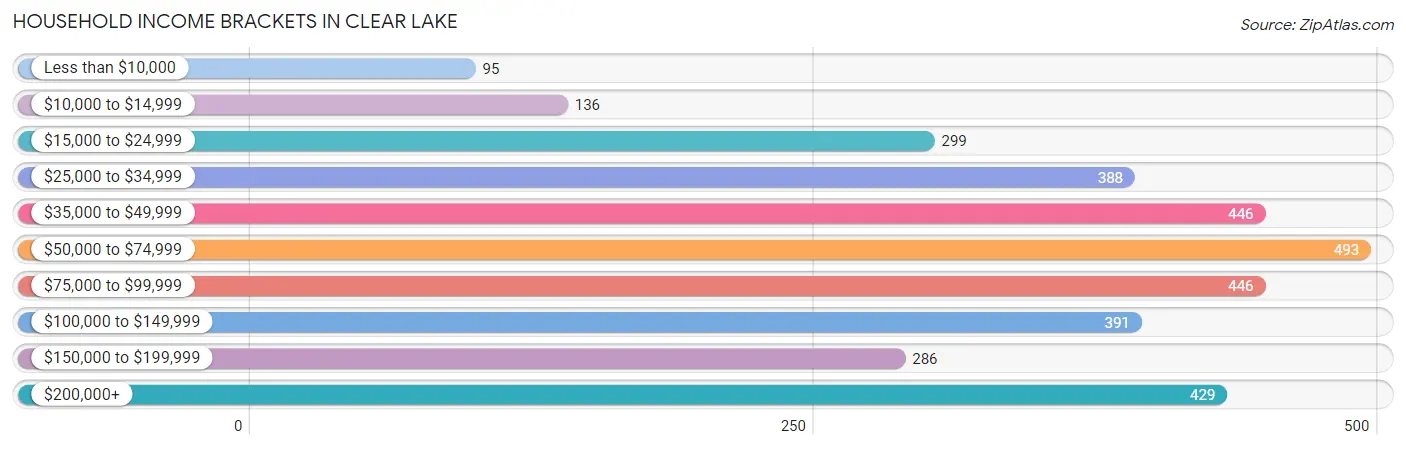
| Income Bracket | # Households | % Households |
| Less than $10,000 | 95 | 2.8% |
| $10,000 to $14,999 | 136 | 4.0% |
| $15,000 to $24,999 | 299 | 8.8% |
| $25,000 to $34,999 | 388 | 11.4% |
| $35,000 to $49,999 | 446 | 13.1% |
| $50,000 to $74,999 | 493 | 14.5% |
| $75,000 to $99,999 | 446 | 13.1% |
| $100,000 to $149,999 | 391 | 11.5% |
| $150,000 to $199,999 | 286 | 8.4% |
| $200,000+ | 429 | 12.6% |
Household Income by Householder Age in Clear Lake
The median household income in Clear Lake is $66,900, with the highest median household income of $98,125 found in the 25 to 44 years age bracket for the primary householder. A total of 648 households (19.1%) fall into this category. Meanwhile, the 15 to 24 years age bracket for the primary householder has the lowest median household income of $0, with 99 households (2.9%) in this group.
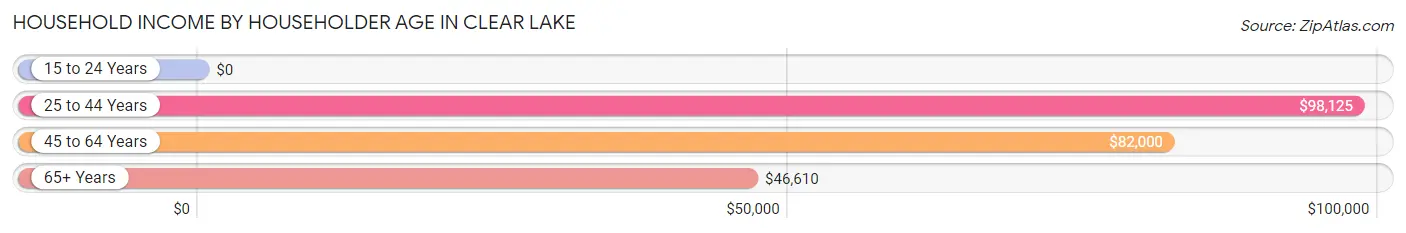
| Income Bracket | # Households | Median Income |
| 15 to 24 Years | 99 (2.9%) | $0 |
| 25 to 44 Years | 648 (19.1%) | $98,125 |
| 45 to 64 Years | 1,346 (39.6%) | $82,000 |
| 65+ Years | 1,309 (38.5%) | $46,610 |
| Total | 3,402 (100.0%) | $66,900 |
Poverty in Clear Lake
Income Below Poverty by Sex and Age in Clear Lake
With 4.2% poverty level for males and 9.2% for females among the residents of Clear Lake, 16 and 17 year old males and 18 to 24 year old females are the most vulnerable to poverty, with 34 males (43.0%) and 95 females (30.8%) in their respective age groups living below the poverty level.
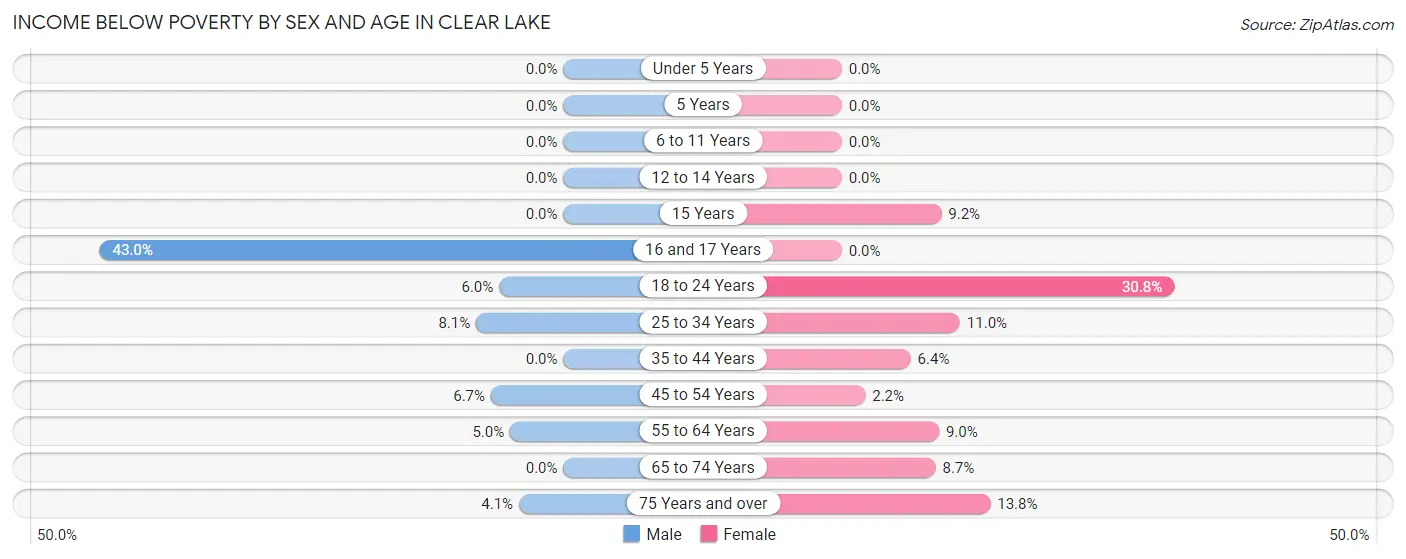
| Age Bracket | Male | Female |
| Under 5 Years | 0 (0.0%) | 0 (0.0%) |
| 5 Years | 0 (0.0%) | 0 (0.0%) |
| 6 to 11 Years | 0 (0.0%) | 0 (0.0%) |
| 12 to 14 Years | 0 (0.0%) | 0 (0.0%) |
| 15 Years | 0 (0.0%) | 17 (9.2%) |
| 16 and 17 Years | 34 (43.0%) | 0 (0.0%) |
| 18 to 24 Years | 17 (6.0%) | 95 (30.8%) |
| 25 to 34 Years | 34 (8.1%) | 25 (11.0%) |
| 35 to 44 Years | 0 (0.0%) | 28 (6.4%) |
| 45 to 54 Years | 23 (6.7%) | 9 (2.2%) |
| 55 to 64 Years | 34 (5.0%) | 65 (9.0%) |
| 65 to 74 Years | 0 (0.0%) | 54 (8.7%) |
| 75 Years and over | 10 (4.1%) | 70 (13.8%) |
| Total | 152 (4.2%) | 363 (9.2%) |
Income Above Poverty by Sex and Age in Clear Lake
According to the poverty statistics in Clear Lake, males aged under 5 years and females aged under 5 years are the age groups that are most secure financially, with 100.0% of males and 100.0% of females in these age groups living above the poverty line.
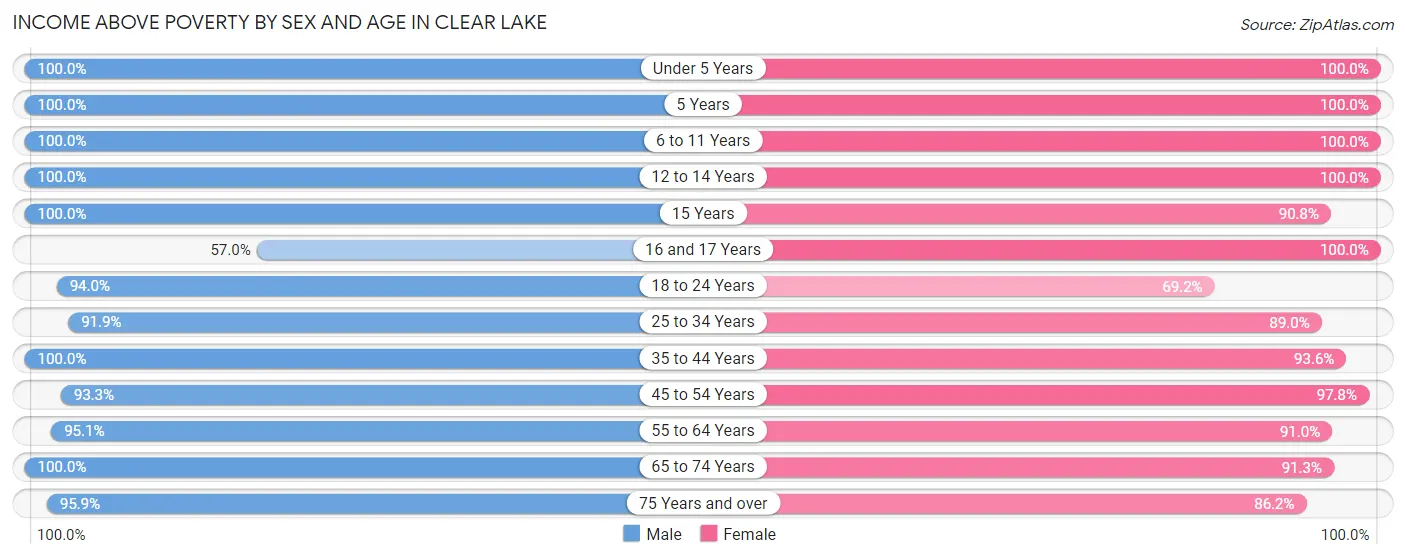
| Age Bracket | Male | Female |
| Under 5 Years | 120 (100.0%) | 188 (100.0%) |
| 5 Years | 72 (100.0%) | 7 (100.0%) |
| 6 to 11 Years | 239 (100.0%) | 160 (100.0%) |
| 12 to 14 Years | 113 (100.0%) | 99 (100.0%) |
| 15 Years | 51 (100.0%) | 167 (90.8%) |
| 16 and 17 Years | 45 (57.0%) | 86 (100.0%) |
| 18 to 24 Years | 268 (94.0%) | 213 (69.2%) |
| 25 to 34 Years | 386 (91.9%) | 203 (89.0%) |
| 35 to 44 Years | 388 (100.0%) | 410 (93.6%) |
| 45 to 54 Years | 319 (93.3%) | 403 (97.8%) |
| 55 to 64 Years | 653 (95.1%) | 656 (91.0%) |
| 65 to 74 Years | 572 (100.0%) | 567 (91.3%) |
| 75 Years and over | 233 (95.9%) | 438 (86.2%) |
| Total | 3,459 (95.8%) | 3,597 (90.8%) |
Income Below Poverty Among Married-Couple Families in Clear Lake
The poverty statistics for married-couple families in Clear Lake show that 0.4% or 7 of the total 1,661 families live below the poverty line. Families with no children have the highest poverty rate of 0.6%, comprising of 7 families. On the other hand, families with 1 or 2 children have the lowest poverty rate of 0.0%, which includes 0 families.
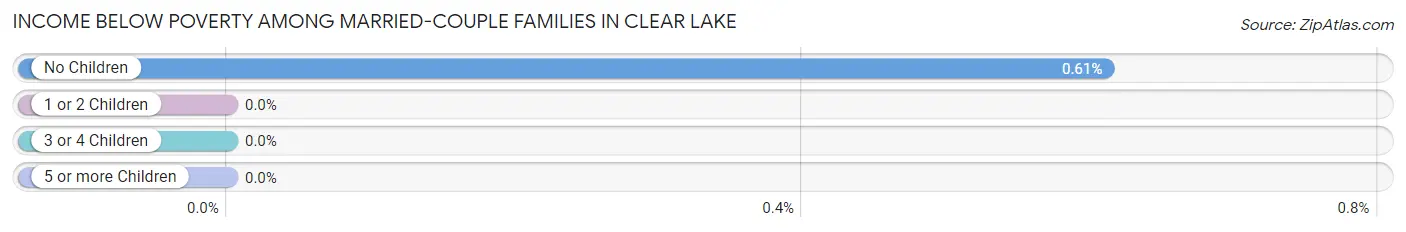
| Children | Above Poverty | Below Poverty |
| No Children | 1,145 (99.4%) | 7 (0.6%) |
| 1 or 2 Children | 356 (100.0%) | 0 (0.0%) |
| 3 or 4 Children | 153 (100.0%) | 0 (0.0%) |
| 5 or more Children | 0 (0.0%) | 0 (0.0%) |
| Total | 1,654 (99.6%) | 7 (0.4%) |
Income Below Poverty Among Single-Parent Households in Clear Lake
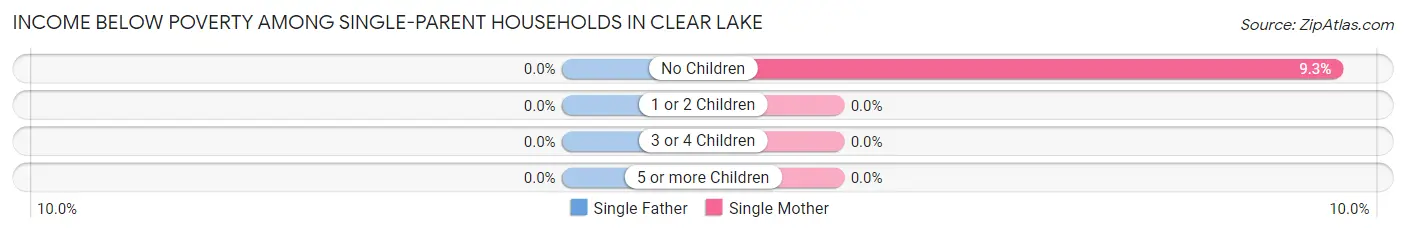
| Children | Single Father | Single Mother |
| No Children | 0 (0.0%) | 12 (9.3%) |
| 1 or 2 Children | 0 (0.0%) | 0 (0.0%) |
| 3 or 4 Children | 0 (0.0%) | 0 (0.0%) |
| 5 or more Children | 0 (0.0%) | 0 (0.0%) |
| Total | 0 (0.0%) | 12 (6.5%) |
Income Below Poverty Among Married-Couple vs Single-Parent Households in Clear Lake
The poverty data for Clear Lake shows that 7 of the married-couple family households (0.4%) and 12 of the single-parent households (3.8%) are living below the poverty level. Within the married-couple family households, those with no children have the highest poverty rate, with 7 households (0.6%) falling below the poverty line. Among the single-parent households, those with no children have the highest poverty rate, with 12 household (8.0%) living below poverty.
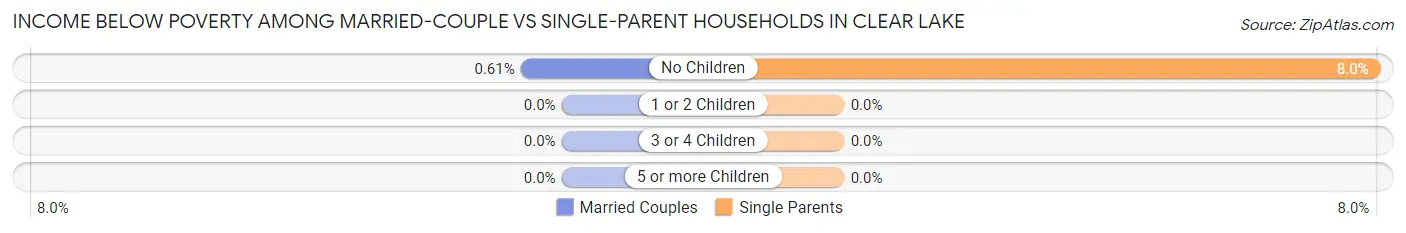
| Children | Married-Couple Families | Single-Parent Households |
| No Children | 7 (0.6%) | 12 (8.0%) |
| 1 or 2 Children | 0 (0.0%) | 0 (0.0%) |
| 3 or 4 Children | 0 (0.0%) | 0 (0.0%) |
| 5 or more Children | 0 (0.0%) | 0 (0.0%) |
| Total | 7 (0.4%) | 12 (3.8%) |
Race in Clear Lake
The most populous races in Clear Lake are White / Caucasian (6,997 | 91.6%), Asian (319 | 4.2%), and Hispanic or Latino (245 | 3.2%).
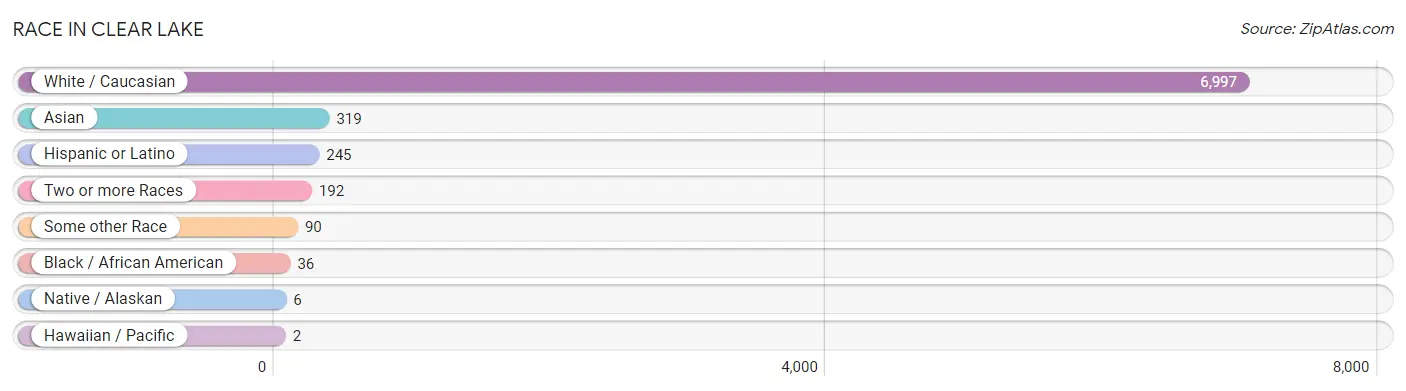
| Race | # Population | % Population |
| Asian | 319 | 4.2% |
| Black / African American | 36 | 0.5% |
| Hawaiian / Pacific | 2 | 0.0% |
| Hispanic or Latino | 245 | 3.2% |
| Native / Alaskan | 6 | 0.1% |
| White / Caucasian | 6,997 | 91.6% |
| Two or more Races | 192 | 2.5% |
| Some other Race | 90 | 1.2% |
| Total | 7,642 | 100.0% |
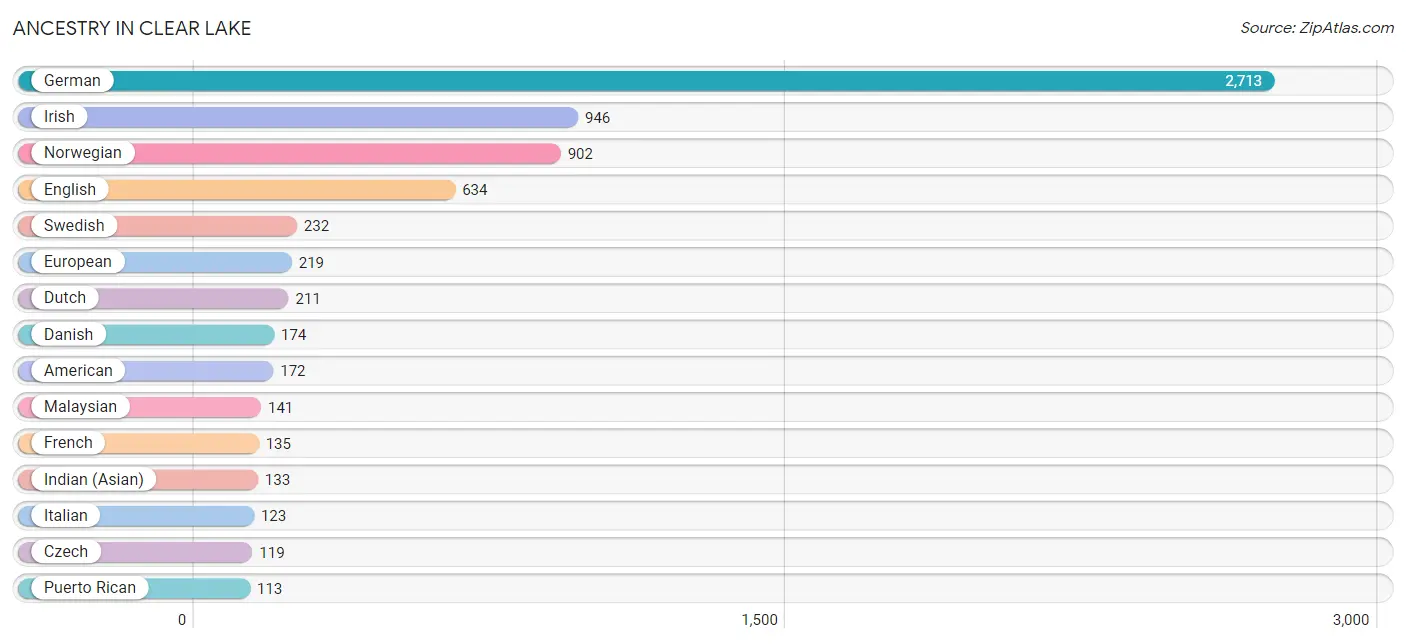
Ancestry in Clear Lake
The most populous ancestries reported in Clear Lake are German (2,713 | 35.5%), Irish (946 | 12.4%), Norwegian (902 | 11.8%), English (634 | 8.3%), and Swedish (232 | 3.0%), together accounting for 71.0% of all Clear Lake residents.
| Ancestry | # Population | % Population |
| American | 172 | 2.2% |
| Arab | 112 | 1.5% |
| Belgian | 6 | 0.1% |
| British | 18 | 0.2% |
| Burmese | 37 | 0.5% |
| Central American | 15 | 0.2% |
| Central American Indian | 6 | 0.1% |
| Czech | 119 | 1.6% |
| Danish | 174 | 2.3% |
| Dutch | 211 | 2.8% |
| Eastern European | 5 | 0.1% |
| English | 634 | 8.3% |
| European | 219 | 2.9% |
| French | 135 | 1.8% |
| German | 2,713 | 35.5% |
| Guatemalan | 6 | 0.1% |
| Hungarian | 8 | 0.1% |
| Indian (Asian) | 133 | 1.7% |
| Irish | 946 | 12.4% |
| Italian | 123 | 1.6% |
| Malaysian | 141 | 1.8% |
| Mexican | 88 | 1.1% |
| Native Hawaiian | 2 | 0.0% |
| Northern European | 9 | 0.1% |
| Norwegian | 902 | 11.8% |
| Polish | 64 | 0.8% |
| Puerto Rican | 113 | 1.5% |
| Russian | 42 | 0.5% |
| Salvadoran | 9 | 0.1% |
| Scandinavian | 30 | 0.4% |
| Scotch-Irish | 6 | 0.1% |
| Scottish | 81 | 1.1% |
| Spaniard | 29 | 0.4% |
| Sri Lankan | 8 | 0.1% |
| Swedish | 232 | 3.0% |
| Swiss | 34 | 0.4% |
| Syrian | 49 | 0.6% |
| Ukrainian | 38 | 0.5% |
| Welsh | 40 | 0.5% |
| Yugoslavian | 14 | 0.2% | View All 40 Rows |
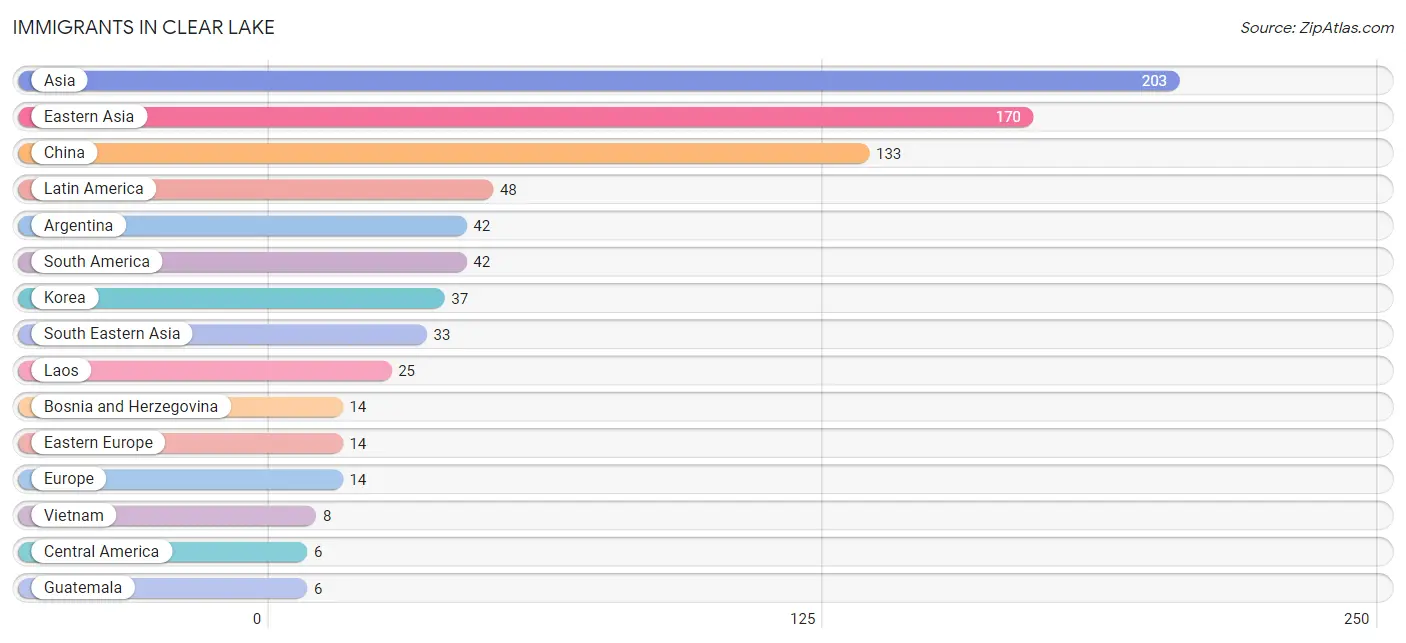
Immigrants in Clear Lake
The most numerous immigrant groups reported in Clear Lake came from Asia (203 | 2.7%), Eastern Asia (170 | 2.2%), China (133 | 1.7%), Latin America (48 | 0.6%), and Argentina (42 | 0.5%), together accounting for 7.8% of all Clear Lake residents.
| Immigration Origin | # Population | % Population |
| Argentina | 42 | 0.5% |
| Asia | 203 | 2.7% |
| Bosnia and Herzegovina | 14 | 0.2% |
| Central America | 6 | 0.1% |
| China | 133 | 1.7% |
| Eastern Asia | 170 | 2.2% |
| Eastern Europe | 14 | 0.2% |
| Europe | 14 | 0.2% |
| Guatemala | 6 | 0.1% |
| Korea | 37 | 0.5% |
| Laos | 25 | 0.3% |
| Latin America | 48 | 0.6% |
| South America | 42 | 0.5% |
| South Eastern Asia | 33 | 0.4% |
| Vietnam | 8 | 0.1% | View All 15 Rows |
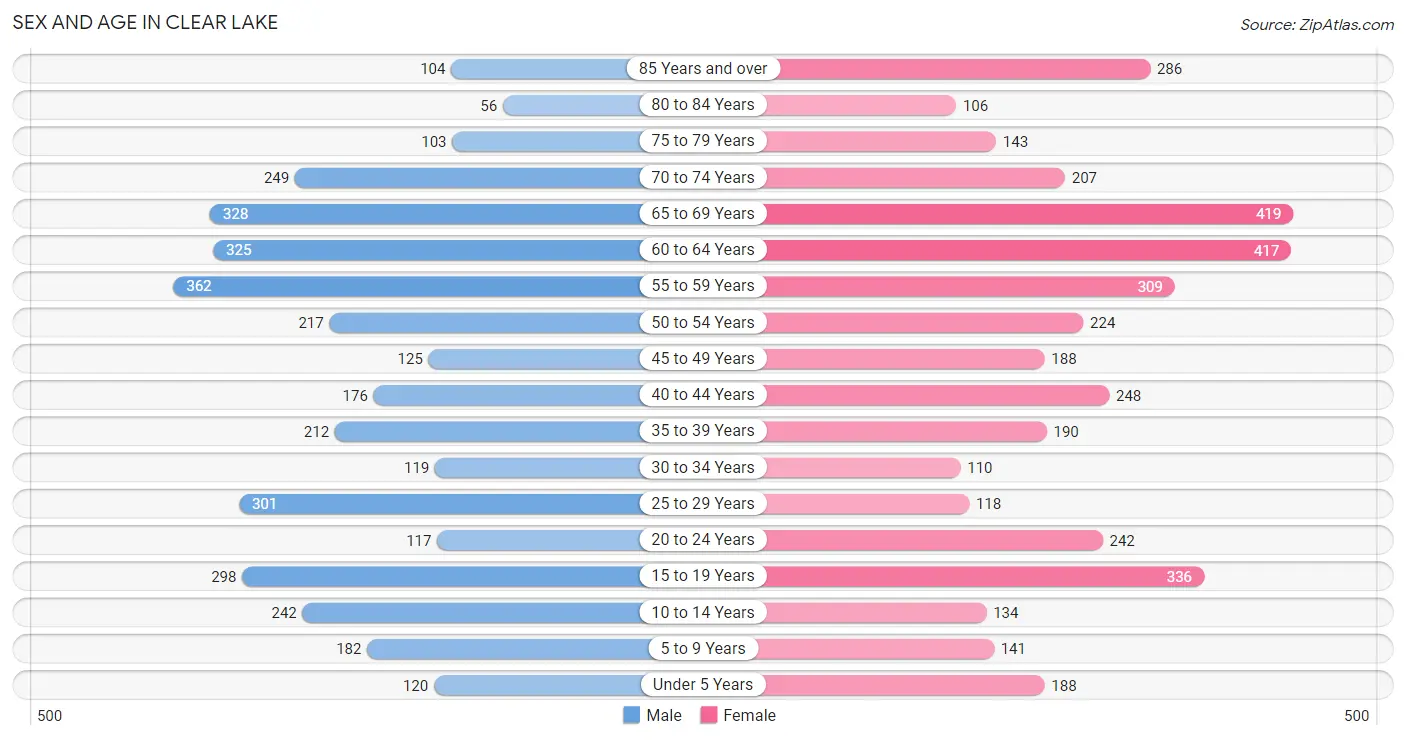
Sex and Age in Clear Lake
Sex and Age in Clear Lake
The most populous age groups in Clear Lake are 55 to 59 Years (362 | 10.0%) for men and 65 to 69 Years (419 | 10.5%) for women.
| Age Bracket | Male | Female |
| Under 5 Years | 120 (3.3%) | 188 (4.7%) |
| 5 to 9 Years | 182 (5.0%) | 141 (3.5%) |
| 10 to 14 Years | 242 (6.7%) | 134 (3.3%) |
| 15 to 19 Years | 298 (8.2%) | 336 (8.4%) |
| 20 to 24 Years | 117 (3.2%) | 242 (6.0%) |
| 25 to 29 Years | 301 (8.3%) | 118 (2.9%) |
| 30 to 34 Years | 119 (3.3%) | 110 (2.8%) |
| 35 to 39 Years | 212 (5.8%) | 190 (4.7%) |
| 40 to 44 Years | 176 (4.8%) | 248 (6.2%) |
| 45 to 49 Years | 125 (3.4%) | 188 (4.7%) |
| 50 to 54 Years | 217 (6.0%) | 224 (5.6%) |
| 55 to 59 Years | 362 (10.0%) | 309 (7.7%) |
| 60 to 64 Years | 325 (8.9%) | 417 (10.4%) |
| 65 to 69 Years | 328 (9.0%) | 419 (10.5%) |
| 70 to 74 Years | 249 (6.9%) | 207 (5.2%) |
| 75 to 79 Years | 103 (2.8%) | 143 (3.6%) |
| 80 to 84 Years | 56 (1.5%) | 106 (2.6%) |
| 85 Years and over | 104 (2.9%) | 286 (7.1%) |
| Total | 3,636 (100.0%) | 4,006 (100.0%) |
Families and Households in Clear Lake
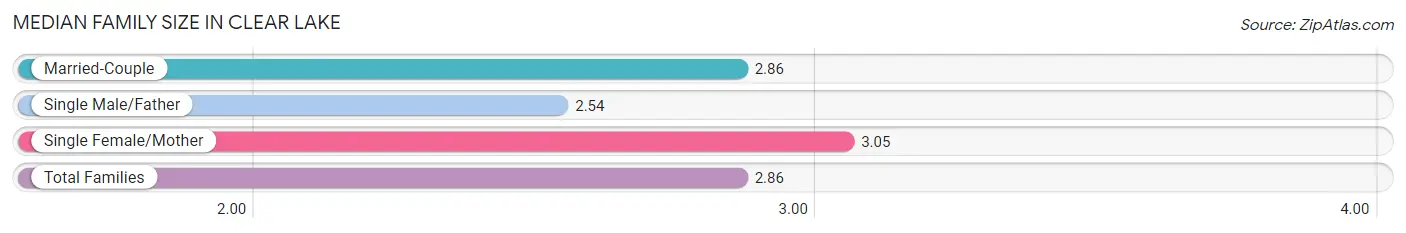
Median Family Size in Clear Lake
The median family size in Clear Lake is 2.86 persons per family, with single female/mother families (186 | 9.4%) accounting for the largest median family size of 3.05 persons per family. On the other hand, single male/father families (127 | 6.4%) represent the smallest median family size with 2.54 persons per family.
| Family Type | # Families | Family Size |
| Married-Couple | 1,661 (84.1%) | 2.86 |
| Single Male/Father | 127 (6.4%) | 2.54 |
| Single Female/Mother | 186 (9.4%) | 3.05 |
| Total Families | 1,974 (100.0%) | 2.86 |
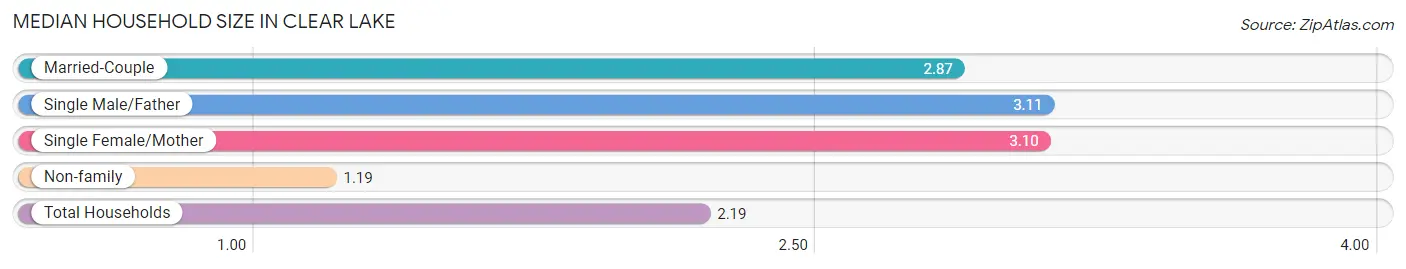
Median Household Size in Clear Lake
The median household size in Clear Lake is 2.19 persons per household, with single male/father households (127 | 3.7%) accounting for the largest median household size of 3.11 persons per household. non-family households (1,428 | 42.0%) represent the smallest median household size with 1.19 persons per household.
| Household Type | # Households | Household Size |
| Married-Couple | 1,661 (48.8%) | 2.87 |
| Single Male/Father | 127 (3.7%) | 3.11 |
| Single Female/Mother | 186 (5.5%) | 3.10 |
| Non-family | 1,428 (42.0%) | 1.19 |
| Total Households | 3,402 (100.0%) | 2.19 |
Household Size by Marriage Status in Clear Lake
Out of a total of 3,402 households in Clear Lake, 1,974 (58.0%) are family households, while 1,428 (42.0%) are nonfamily households. The most numerous type of family households are 2-person households, comprising 1,132, and the most common type of nonfamily households are 1-person households, comprising 1,221.
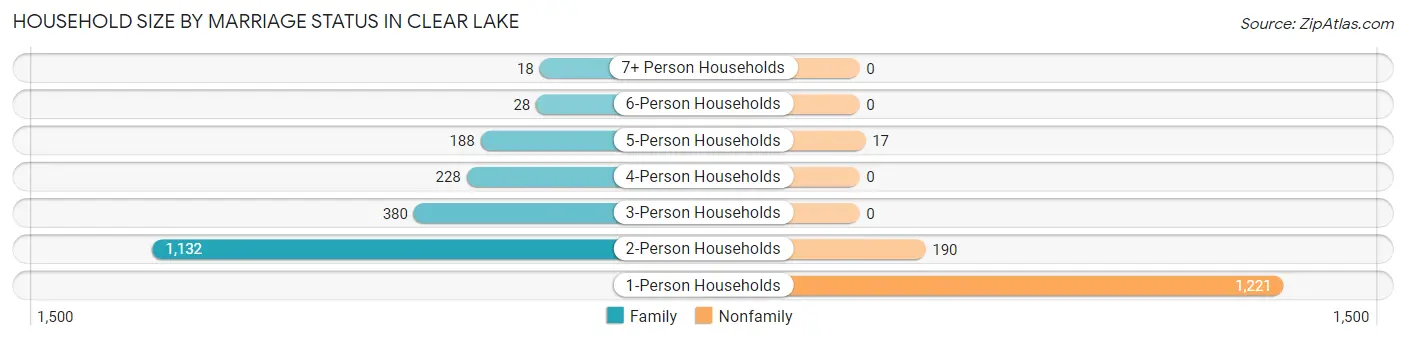
| Household Size | Family Households | Nonfamily Households |
| 1-Person Households | - | 1,221 (35.9%) |
| 2-Person Households | 1,132 (33.3%) | 190 (5.6%) |
| 3-Person Households | 380 (11.2%) | 0 (0.0%) |
| 4-Person Households | 228 (6.7%) | 0 (0.0%) |
| 5-Person Households | 188 (5.5%) | 17 (0.5%) |
| 6-Person Households | 28 (0.8%) | 0 (0.0%) |
| 7+ Person Households | 18 (0.5%) | 0 (0.0%) |
| Total | 1,974 (58.0%) | 1,428 (42.0%) |
Female Fertility in Clear Lake
Fertility by Age in Clear Lake
Average fertility rate in Clear Lake is 112.0 births per 1,000 women. Women in the age bracket of 20 to 34 years have the highest fertility rate with 191.0 births per 1,000 women. Women in the age bracket of 20 to 34 years acount for 54.9% of all women with births.
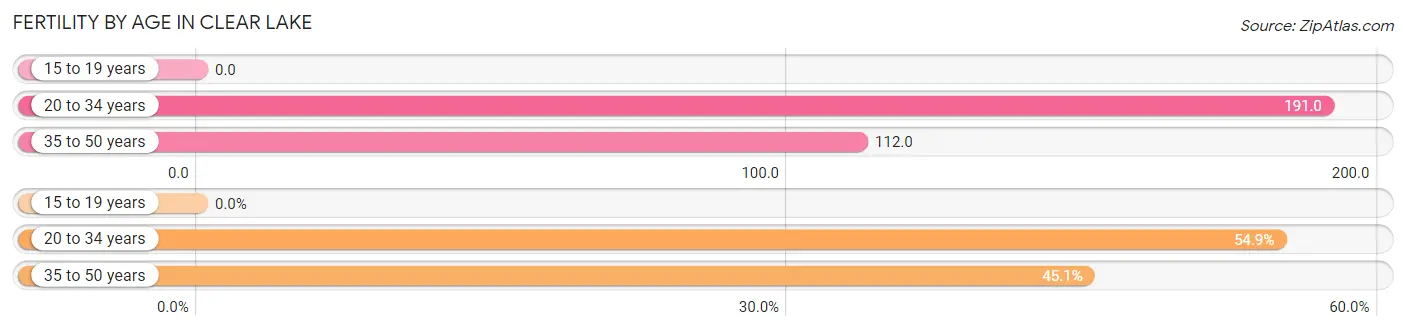
| Age Bracket | Women with Births | Births / 1,000 Women |
| 15 to 19 years | 0 (0.0%) | 0.0 |
| 20 to 34 years | 90 (54.9%) | 191.0 |
| 35 to 50 years | 74 (45.1%) | 112.0 |
| Total | 164 (100.0%) | 112.0 |
Fertility by Age by Marriage Status in Clear Lake
57.9% of women with births (164) in Clear Lake are married. The highest percentage of unmarried women with births falls into 20 to 34 years age bracket with 68.9% of them unmarried at the time of birth, while the lowest percentage of unmarried women with births belong to 35 to 50 years age bracket with 9.5% of them unmarried.
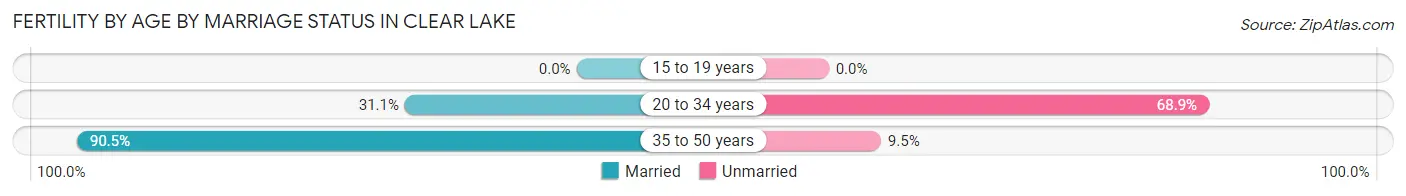
| Age Bracket | Married | Unmarried |
| 15 to 19 years | 0 (0.0%) | 0 (0.0%) |
| 20 to 34 years | 28 (31.1%) | 62 (68.9%) |
| 35 to 50 years | 67 (90.5%) | 7 (9.5%) |
| Total | 95 (57.9%) | 69 (42.1%) |
Fertility by Education in Clear Lake
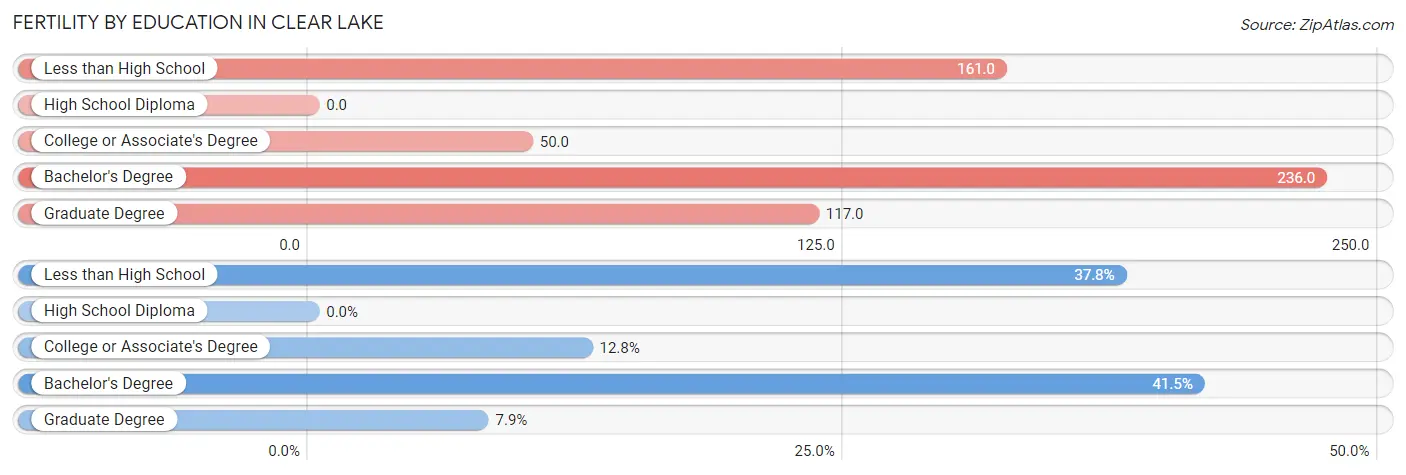
| Educational Attainment | Women with Births | Births / 1,000 Women |
| Less than High School | 62 (37.8%) | 161.0 |
| High School Diploma | 0 (0.0%) | 0.0 |
| College or Associate's Degree | 21 (12.8%) | 50.0 |
| Bachelor's Degree | 68 (41.5%) | 236.0 |
| Graduate Degree | 13 (7.9%) | 117.0 |
| Total | 164 (100.0%) | 112.0 |
Fertility by Education by Marriage Status in Clear Lake
42.1% of women with births in Clear Lake are unmarried. Women with the educational attainment of bachelor's degree are most likely to be married with 100.0% of them married at childbirth, while women with the educational attainment of less than high school are least likely to be married with 100.0% of them unmarried at childbirth.
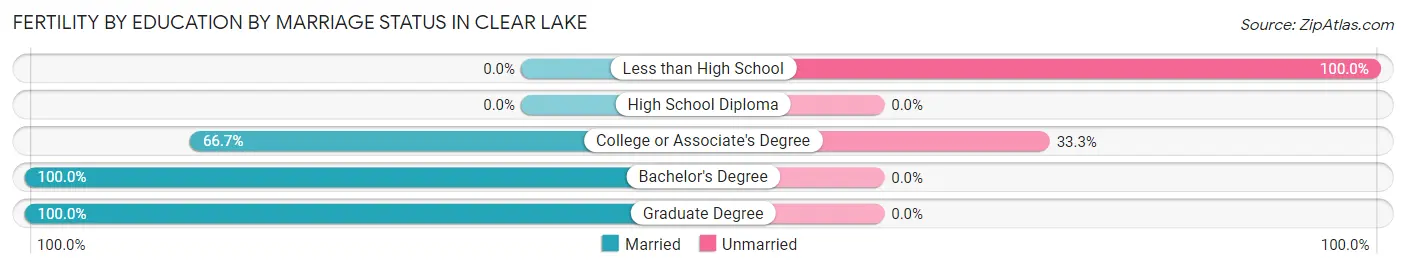
| Educational Attainment | Married | Unmarried |
| Less than High School | 0 (0.0%) | 62 (100.0%) |
| High School Diploma | 0 (0.0%) | 0 (0.0%) |
| College or Associate's Degree | 14 (66.7%) | 7 (33.3%) |
| Bachelor's Degree | 68 (100.0%) | 0 (0.0%) |
| Graduate Degree | 13 (100.0%) | 0 (0.0%) |
| Total | 95 (57.9%) | 69 (42.1%) |
Employment Characteristics in Clear Lake
Employment by Class of Employer in Clear Lake
Among the 3,710 employed individuals in Clear Lake, private company employees (2,241 | 60.4%), local government employees (385 | 10.4%), and not-for-profit organizations (361 | 9.7%) make up the most common classes of employment.
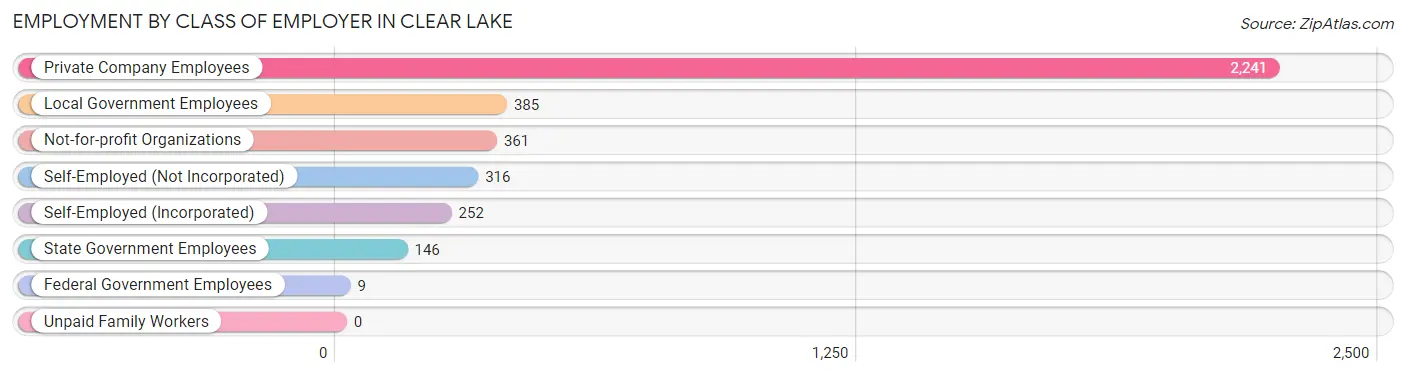
| Employer Class | # Employees | % Employees |
| Private Company Employees | 2,241 | 60.4% |
| Self-Employed (Incorporated) | 252 | 6.8% |
| Self-Employed (Not Incorporated) | 316 | 8.5% |
| Not-for-profit Organizations | 361 | 9.7% |
| Local Government Employees | 385 | 10.4% |
| State Government Employees | 146 | 3.9% |
| Federal Government Employees | 9 | 0.2% |
| Unpaid Family Workers | 0 | 0.0% |
| Total | 3,710 | 100.0% |
Employment Status by Age in Clear Lake
According to the labor force statistics for Clear Lake, out of the total population over 16 years of age (6,400), 60.8% or 3,891 individuals are in the labor force, with 2.9% or 113 of them unemployed. The age group with the highest labor force participation rate is 25 to 29 years, with 95.9% or 402 individuals in the labor force. Within the labor force, the 20 to 24 years age range has the highest percentage of unemployed individuals, with 5.3% or 17 of them being unemployed.
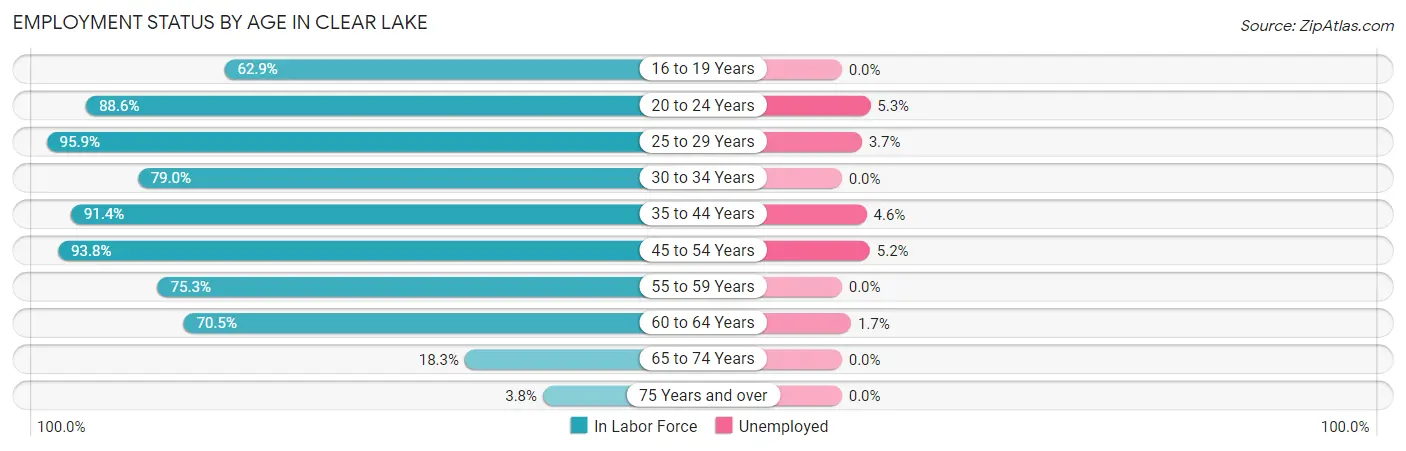
| Age Bracket | In Labor Force | Unemployed |
| 16 to 19 Years | 251 (62.9%) | 0 (0.0%) |
| 20 to 24 Years | 318 (88.6%) | 17 (5.3%) |
| 25 to 29 Years | 402 (95.9%) | 15 (3.7%) |
| 30 to 34 Years | 181 (79.0%) | 0 (0.0%) |
| 35 to 44 Years | 755 (91.4%) | 35 (4.6%) |
| 45 to 54 Years | 707 (93.8%) | 37 (5.2%) |
| 55 to 59 Years | 505 (75.3%) | 0 (0.0%) |
| 60 to 64 Years | 523 (70.5%) | 9 (1.7%) |
| 65 to 74 Years | 220 (18.3%) | 0 (0.0%) |
| 75 Years and over | 30 (3.8%) | 0 (0.0%) |
| Total | 3,891 (60.8%) | 113 (2.9%) |
Employment Status by Educational Attainment in Clear Lake
According to labor force statistics for Clear Lake, 84.4% of individuals (3,073) out of the total population between 25 and 64 years of age (3,641) are in the labor force, with 3.1% or 95 of them being unemployed. The group with the highest labor force participation rate are those with the educational attainment of bachelor's degree or higher, with 89.8% or 1,094 individuals in the labor force. Within the labor force, individuals with high school diploma education have the highest percentage of unemployment, with 4.6% or 42 of them being unemployed.
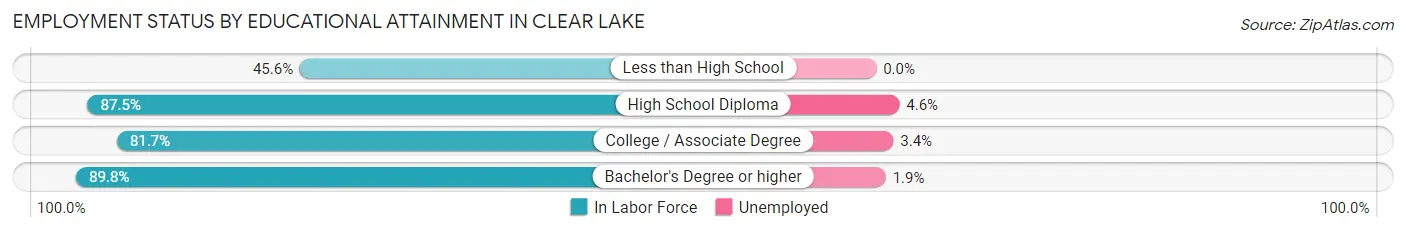
| Educational Attainment | In Labor Force | Unemployed |
| Less than High School | 78 (45.6%) | 0 (0.0%) |
| High School Diploma | 918 (87.5%) | 48 (4.6%) |
| College / Associate Degree | 983 (81.7%) | 41 (3.4%) |
| Bachelor's Degree or higher | 1,094 (89.8%) | 23 (1.9%) |
| Total | 3,073 (84.4%) | 113 (3.1%) |
Employment Occupations by Sex in Clear Lake
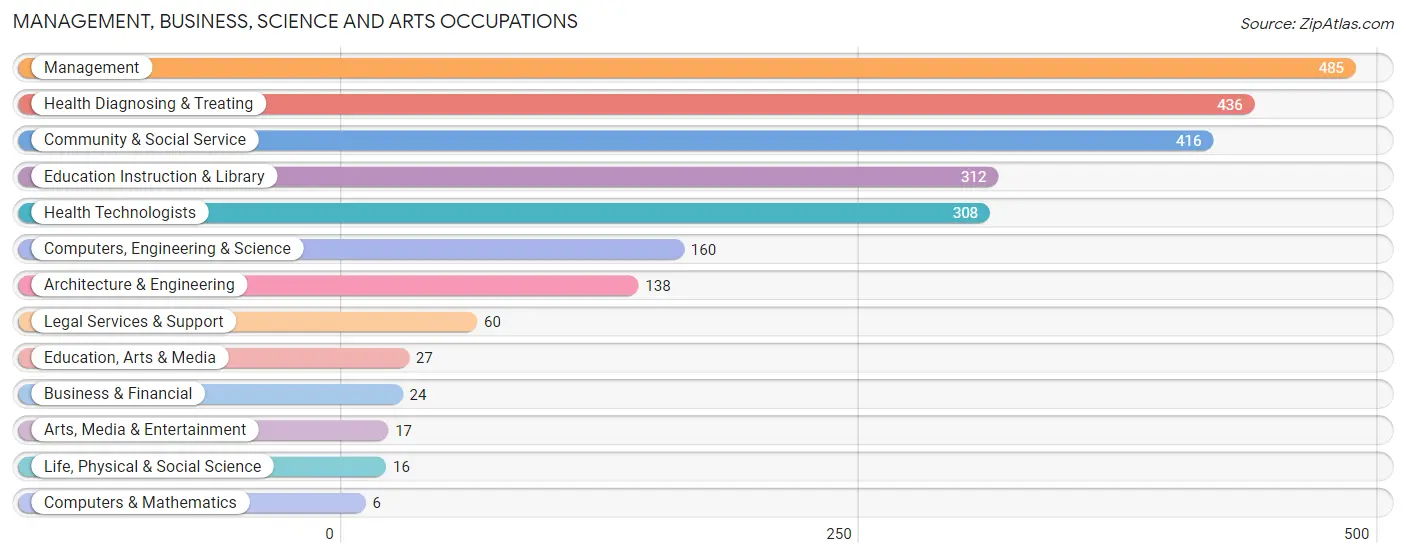
Management, Business, Science and Arts Occupations
The most common Management, Business, Science and Arts occupations in Clear Lake are Management (485 | 12.8%), Health Diagnosing & Treating (436 | 11.5%), Community & Social Service (416 | 11.0%), Education Instruction & Library (312 | 8.3%), and Health Technologists (308 | 8.2%).
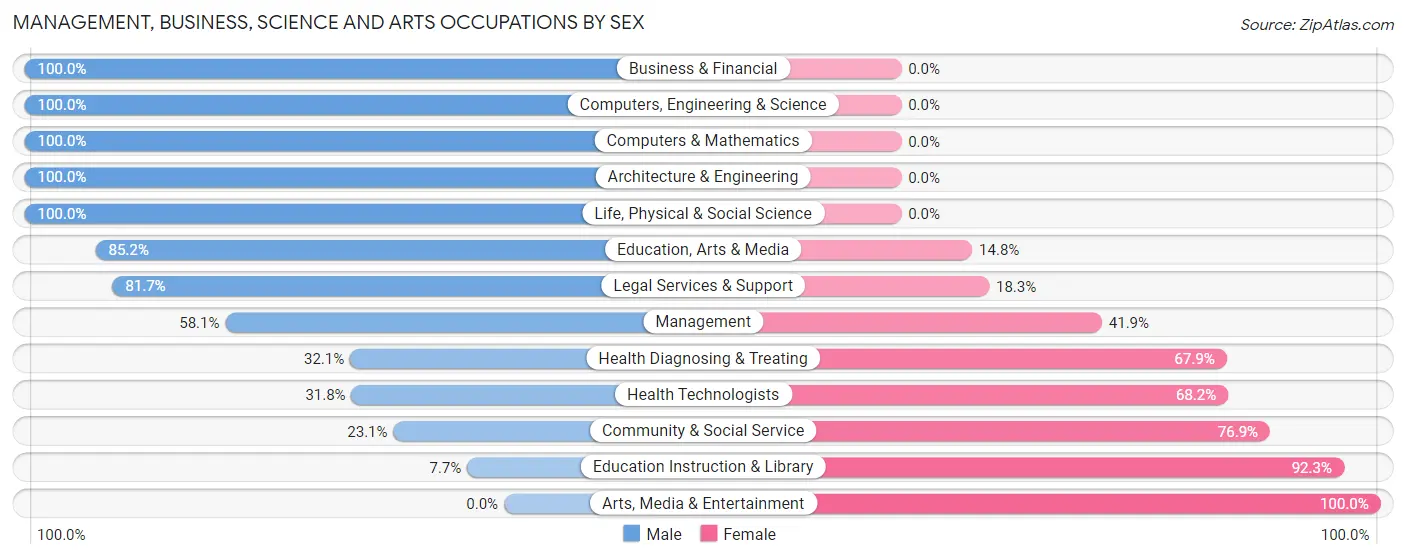
Management, Business, Science and Arts Occupations by Sex
Within the Management, Business, Science and Arts occupations in Clear Lake, the most male-oriented occupations are Business & Financial (100.0%), Computers, Engineering & Science (100.0%), and Computers & Mathematics (100.0%), while the most female-oriented occupations are Arts, Media & Entertainment (100.0%), Education Instruction & Library (92.3%), and Community & Social Service (76.9%).
| Occupation | Male | Female |
| Management | 282 (58.1%) | 203 (41.9%) |
| Business & Financial | 24 (100.0%) | 0 (0.0%) |
| Computers, Engineering & Science | 160 (100.0%) | 0 (0.0%) |
| Computers & Mathematics | 6 (100.0%) | 0 (0.0%) |
| Architecture & Engineering | 138 (100.0%) | 0 (0.0%) |
| Life, Physical & Social Science | 16 (100.0%) | 0 (0.0%) |
| Community & Social Service | 96 (23.1%) | 320 (76.9%) |
| Education, Arts & Media | 23 (85.2%) | 4 (14.8%) |
| Legal Services & Support | 49 (81.7%) | 11 (18.3%) |
| Education Instruction & Library | 24 (7.7%) | 288 (92.3%) |
| Arts, Media & Entertainment | 0 (0.0%) | 17 (100.0%) |
| Health Diagnosing & Treating | 140 (32.1%) | 296 (67.9%) |
| Health Technologists | 98 (31.8%) | 210 (68.2%) |
| Total (Category) | 702 (46.2%) | 819 (53.8%) |
| Total (Overall) | 1,948 (51.5%) | 1,831 (48.4%) |
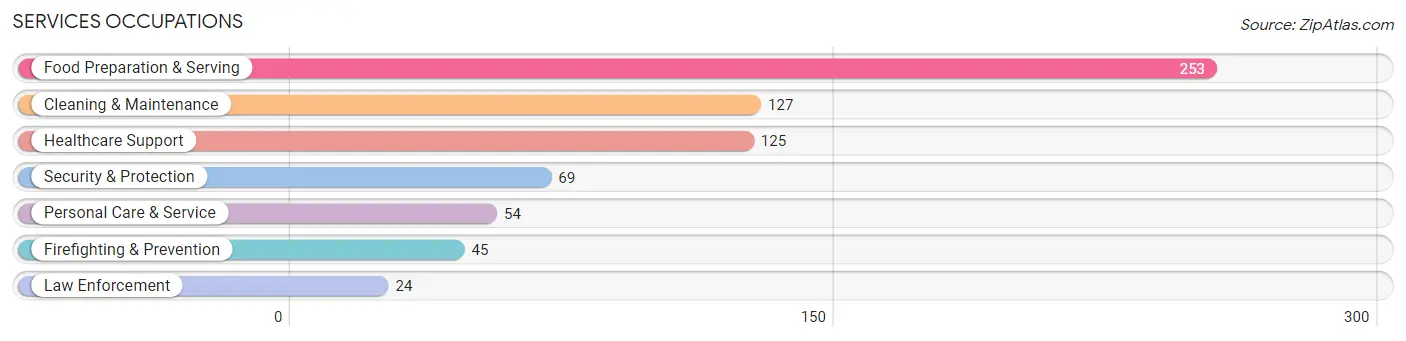
Services Occupations
The most common Services occupations in Clear Lake are Food Preparation & Serving (253 | 6.7%), Cleaning & Maintenance (127 | 3.4%), Healthcare Support (125 | 3.3%), Security & Protection (69 | 1.8%), and Personal Care & Service (54 | 1.4%).
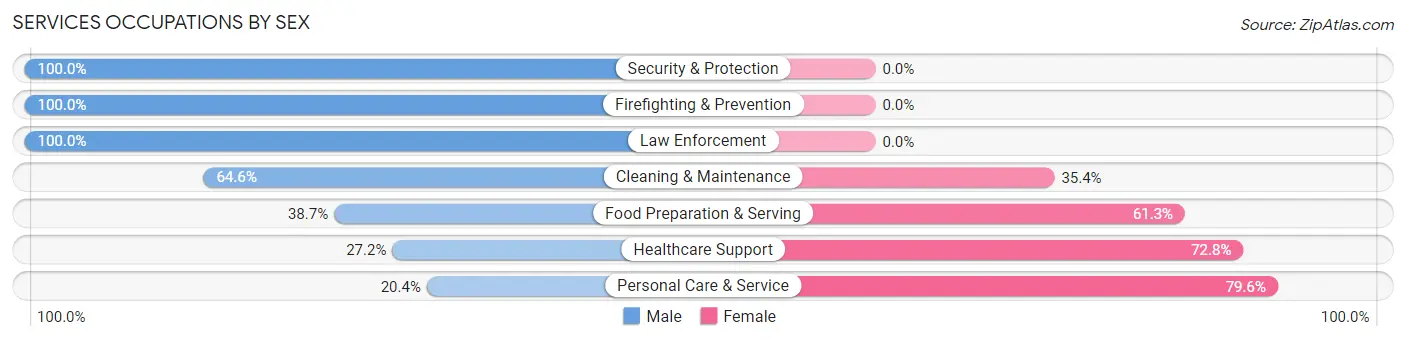
Services Occupations by Sex
Within the Services occupations in Clear Lake, the most male-oriented occupations are Security & Protection (100.0%), Firefighting & Prevention (100.0%), and Law Enforcement (100.0%), while the most female-oriented occupations are Personal Care & Service (79.6%), Healthcare Support (72.8%), and Food Preparation & Serving (61.3%).
| Occupation | Male | Female |
| Healthcare Support | 34 (27.2%) | 91 (72.8%) |
| Security & Protection | 69 (100.0%) | 0 (0.0%) |
| Firefighting & Prevention | 45 (100.0%) | 0 (0.0%) |
| Law Enforcement | 24 (100.0%) | 0 (0.0%) |
| Food Preparation & Serving | 98 (38.7%) | 155 (61.3%) |
| Cleaning & Maintenance | 82 (64.6%) | 45 (35.4%) |
| Personal Care & Service | 11 (20.4%) | 43 (79.6%) |
| Total (Category) | 294 (46.8%) | 334 (53.2%) |
| Total (Overall) | 1,948 (51.5%) | 1,831 (48.4%) |
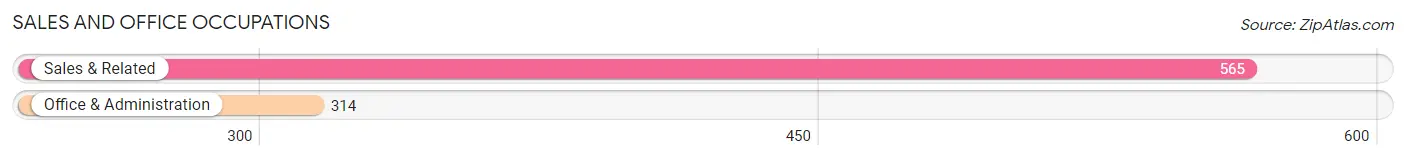
Sales and Office Occupations
The most common Sales and Office occupations in Clear Lake are Sales & Related (565 | 14.9%), and Office & Administration (314 | 8.3%).
Sales and Office Occupations by Sex
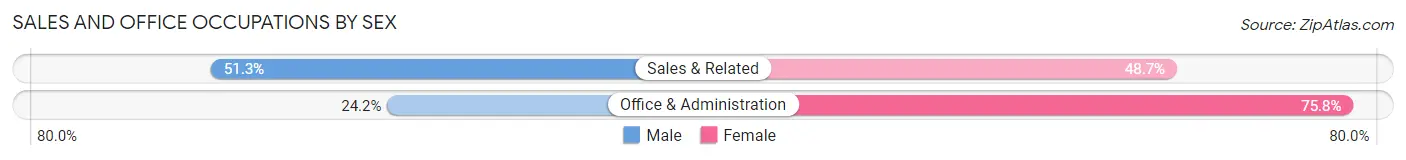
| Occupation | Male | Female |
| Sales & Related | 290 (51.3%) | 275 (48.7%) |
| Office & Administration | 76 (24.2%) | 238 (75.8%) |
| Total (Category) | 366 (41.6%) | 513 (58.4%) |
| Total (Overall) | 1,948 (51.5%) | 1,831 (48.4%) |
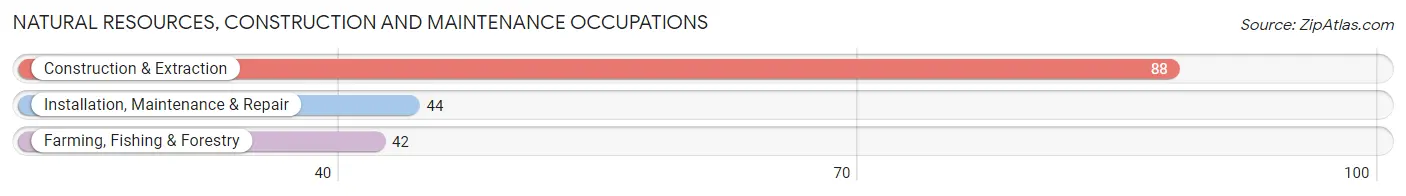
Natural Resources, Construction and Maintenance Occupations
The most common Natural Resources, Construction and Maintenance occupations in Clear Lake are Construction & Extraction (88 | 2.3%), Installation, Maintenance & Repair (44 | 1.2%), and Farming, Fishing & Forestry (42 | 1.1%).
Natural Resources, Construction and Maintenance Occupations by Sex
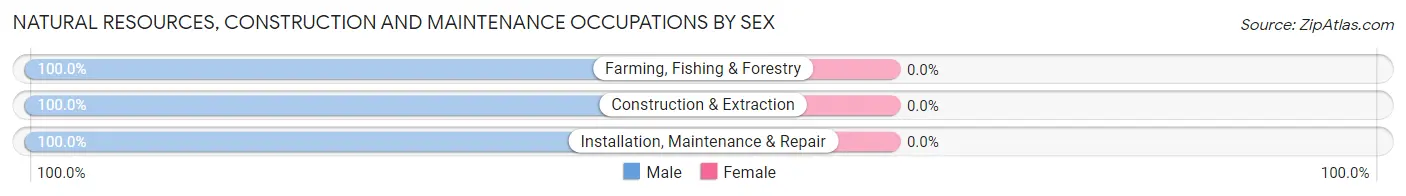
| Occupation | Male | Female |
| Farming, Fishing & Forestry | 42 (100.0%) | 0 (0.0%) |
| Construction & Extraction | 88 (100.0%) | 0 (0.0%) |
| Installation, Maintenance & Repair | 44 (100.0%) | 0 (0.0%) |
| Total (Category) | 174 (100.0%) | 0 (0.0%) |
| Total (Overall) | 1,948 (51.5%) | 1,831 (48.4%) |
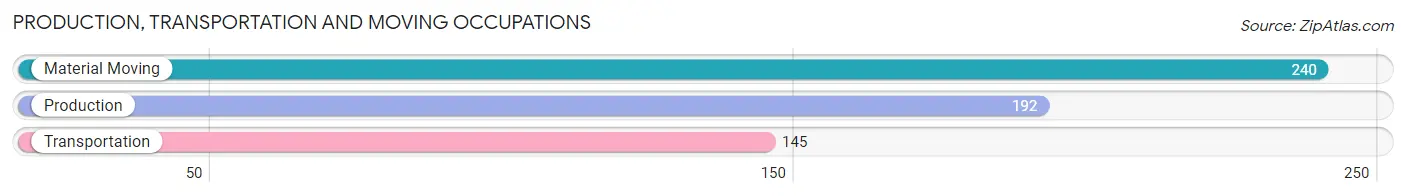
Production, Transportation and Moving Occupations
The most common Production, Transportation and Moving occupations in Clear Lake are Material Moving (240 | 6.4%), Production (192 | 5.1%), and Transportation (145 | 3.8%).
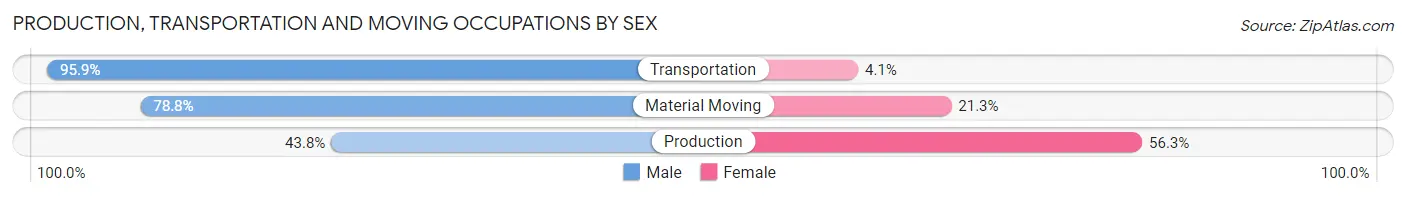
Production, Transportation and Moving Occupations by Sex
| Occupation | Male | Female |
| Production | 84 (43.8%) | 108 (56.2%) |
| Transportation | 139 (95.9%) | 6 (4.1%) |
| Material Moving | 189 (78.7%) | 51 (21.2%) |
| Total (Category) | 412 (71.4%) | 165 (28.6%) |
| Total (Overall) | 1,948 (51.5%) | 1,831 (48.4%) |
Employment Industries by Sex in Clear Lake
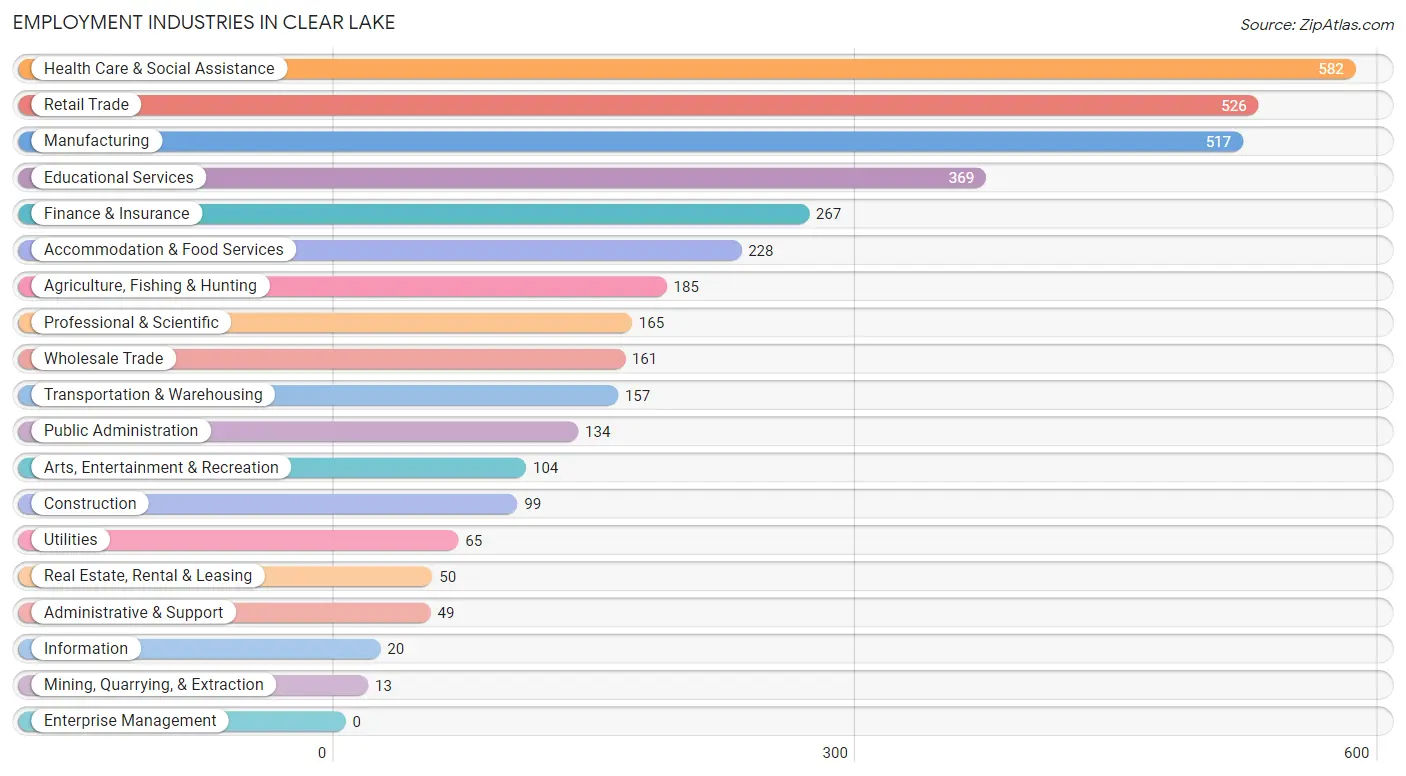
Employment Industries in Clear Lake
The major employment industries in Clear Lake include Health Care & Social Assistance (582 | 15.4%), Retail Trade (526 | 13.9%), Manufacturing (517 | 13.7%), Educational Services (369 | 9.8%), and Finance & Insurance (267 | 7.1%).
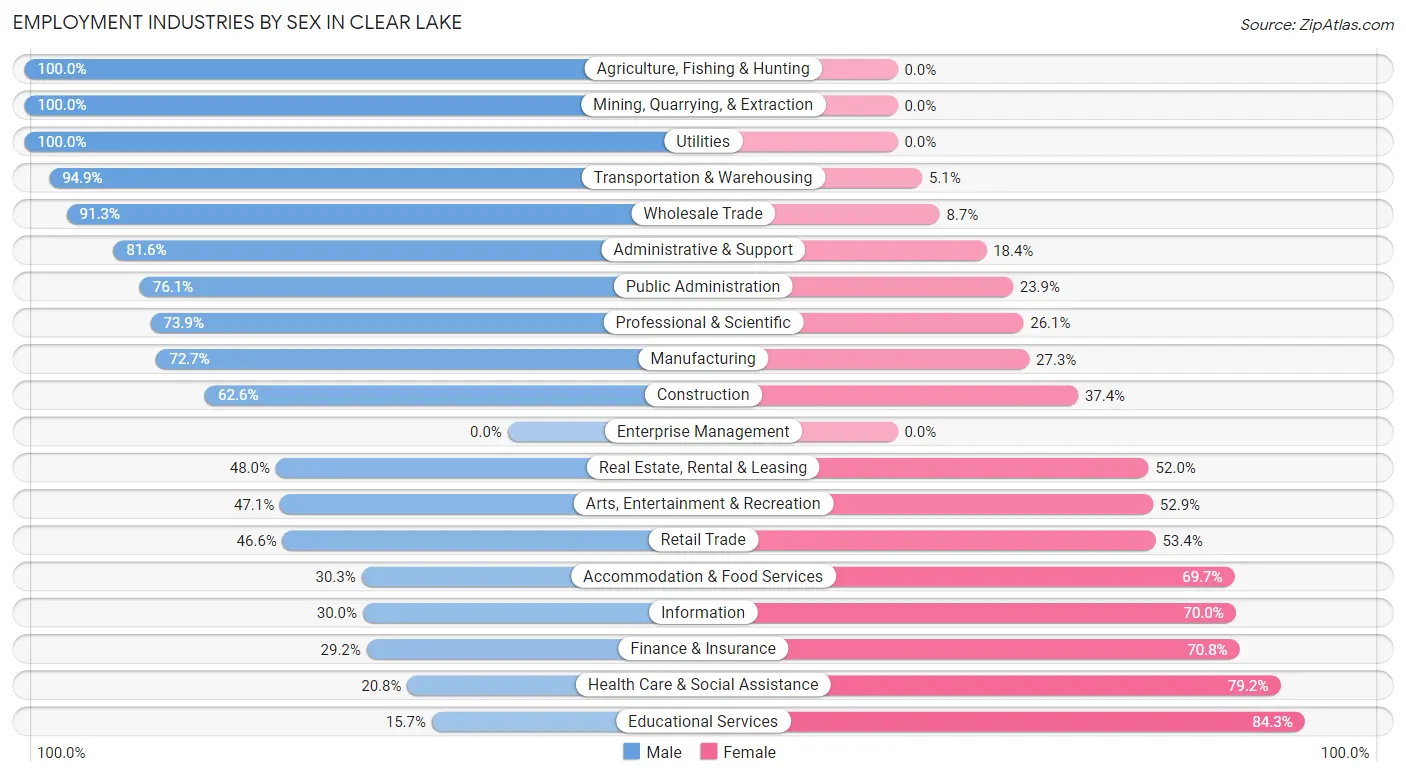
Employment Industries by Sex in Clear Lake
The Clear Lake industries that see more men than women are Agriculture, Fishing & Hunting (100.0%), Mining, Quarrying, & Extraction (100.0%), and Utilities (100.0%), whereas the industries that tend to have a higher number of women are Educational Services (84.3%), Health Care & Social Assistance (79.2%), and Finance & Insurance (70.8%).
| Industry | Male | Female |
| Agriculture, Fishing & Hunting | 185 (100.0%) | 0 (0.0%) |
| Mining, Quarrying, & Extraction | 13 (100.0%) | 0 (0.0%) |
| Construction | 62 (62.6%) | 37 (37.4%) |
| Manufacturing | 376 (72.7%) | 141 (27.3%) |
| Wholesale Trade | 147 (91.3%) | 14 (8.7%) |
| Retail Trade | 245 (46.6%) | 281 (53.4%) |
| Transportation & Warehousing | 149 (94.9%) | 8 (5.1%) |
| Utilities | 65 (100.0%) | 0 (0.0%) |
| Information | 6 (30.0%) | 14 (70.0%) |
| Finance & Insurance | 78 (29.2%) | 189 (70.8%) |
| Real Estate, Rental & Leasing | 24 (48.0%) | 26 (52.0%) |
| Professional & Scientific | 122 (73.9%) | 43 (26.1%) |
| Enterprise Management | 0 (0.0%) | 0 (0.0%) |
| Administrative & Support | 40 (81.6%) | 9 (18.4%) |
| Educational Services | 58 (15.7%) | 311 (84.3%) |
| Health Care & Social Assistance | 121 (20.8%) | 461 (79.2%) |
| Arts, Entertainment & Recreation | 49 (47.1%) | 55 (52.9%) |
| Accommodation & Food Services | 69 (30.3%) | 159 (69.7%) |
| Public Administration | 102 (76.1%) | 32 (23.9%) |
| Total | 1,948 (51.5%) | 1,831 (48.4%) |
Education in Clear Lake
School Enrollment in Clear Lake
The most common levels of schooling among the 1,640 students in Clear Lake are high school (602 | 36.7%), college / undergraduate (323 | 19.7%), and elementary school (297 | 18.1%).
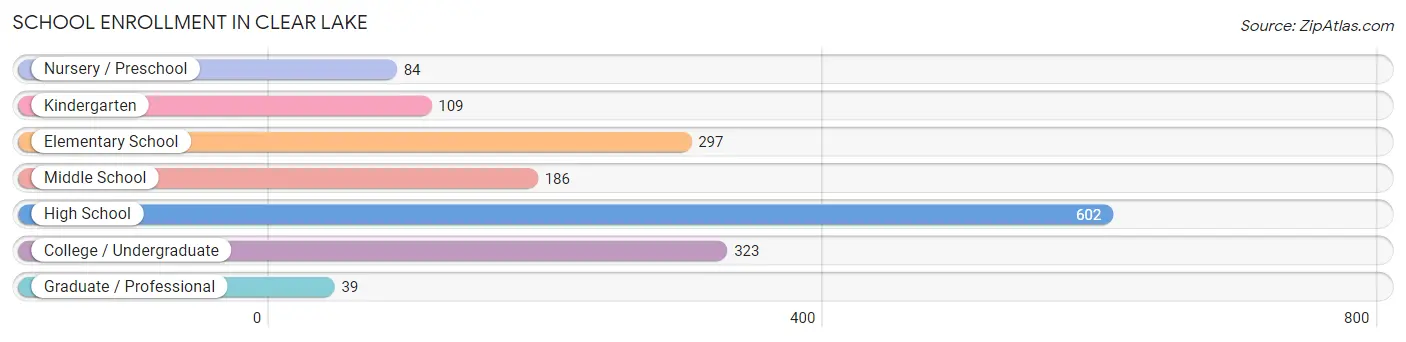
| School Level | # Students | % Students |
| Nursery / Preschool | 84 | 5.1% |
| Kindergarten | 109 | 6.7% |
| Elementary School | 297 | 18.1% |
| Middle School | 186 | 11.3% |
| High School | 602 | 36.7% |
| College / Undergraduate | 323 | 19.7% |
| Graduate / Professional | 39 | 2.4% |
| Total | 1,640 | 100.0% |
School Enrollment by Age by Funding Source in Clear Lake
Out of a total of 1,640 students who are enrolled in schools in Clear Lake, 156 (9.5%) attend a private institution, while the remaining 1,484 (90.5%) are enrolled in public schools. The age group of 20 to 24 year olds has the highest likelihood of being enrolled in private schools, with 37 (29.4% in the age bracket) enrolled. Conversely, the age group of 5 to 9 year old has the lowest likelihood of being enrolled in a private school, with 314 (100.0% in the age bracket) attending a public institution.
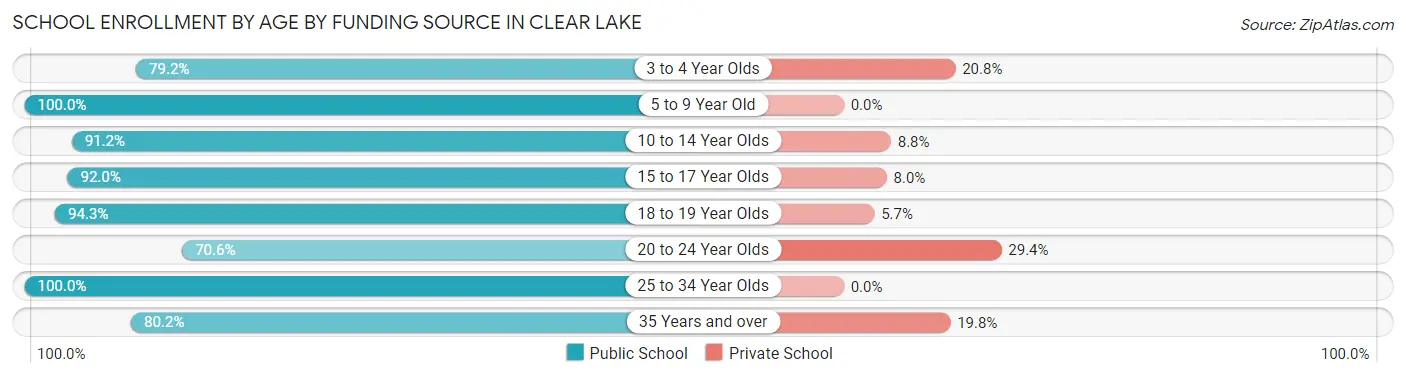
| Age Bracket | Public School | Private School |
| 3 to 4 Year Olds | 61 (79.2%) | 16 (20.8%) |
| 5 to 9 Year Old | 314 (100.0%) | 0 (0.0%) |
| 10 to 14 Year Olds | 343 (91.2%) | 33 (8.8%) |
| 15 to 17 Year Olds | 368 (92.0%) | 32 (8.0%) |
| 18 to 19 Year Olds | 199 (94.3%) | 12 (5.7%) |
| 20 to 24 Year Olds | 89 (70.6%) | 37 (29.4%) |
| 25 to 34 Year Olds | 10 (100.0%) | 0 (0.0%) |
| 35 Years and over | 101 (80.2%) | 25 (19.8%) |
| Total | 1,484 (90.5%) | 156 (9.5%) |
Educational Attainment by Field of Study in Clear Lake
Education (565 | 27.7%), business (302 | 14.8%), science & technology (270 | 13.2%), bio, nature & agricultural (228 | 11.2%), and social sciences (139 | 6.8%) are the most common fields of study among 2,039 individuals in Clear Lake who have obtained a bachelor's degree or higher.
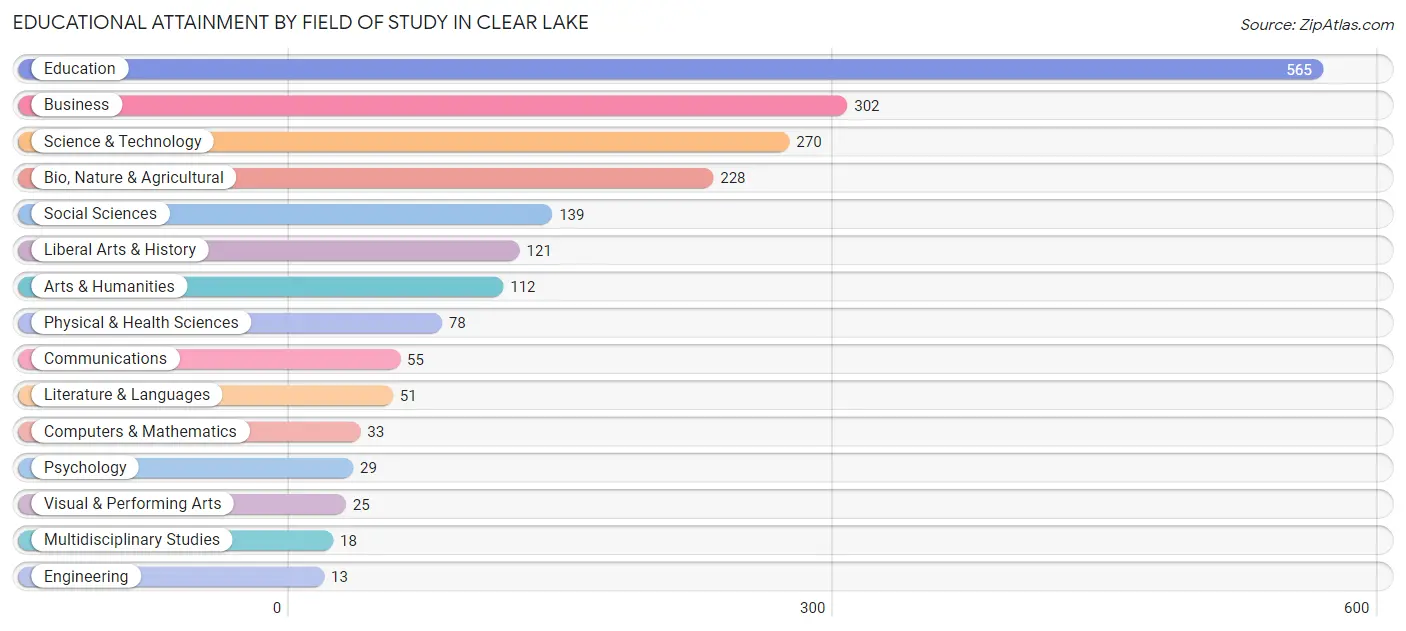
| Field of Study | # Graduates | % Graduates |
| Computers & Mathematics | 33 | 1.6% |
| Bio, Nature & Agricultural | 228 | 11.2% |
| Physical & Health Sciences | 78 | 3.8% |
| Psychology | 29 | 1.4% |
| Social Sciences | 139 | 6.8% |
| Engineering | 13 | 0.6% |
| Multidisciplinary Studies | 18 | 0.9% |
| Science & Technology | 270 | 13.2% |
| Business | 302 | 14.8% |
| Education | 565 | 27.7% |
| Literature & Languages | 51 | 2.5% |
| Liberal Arts & History | 121 | 5.9% |
| Visual & Performing Arts | 25 | 1.2% |
| Communications | 55 | 2.7% |
| Arts & Humanities | 112 | 5.5% |
| Total | 2,039 | 100.0% |
Transportation & Commute in Clear Lake
Vehicle Availability by Sex in Clear Lake
The most prevalent vehicle ownership categories in Clear Lake are males with 2 vehicles (747, accounting for 40.0%) and females with 2 vehicles (614, making up 42.0%).
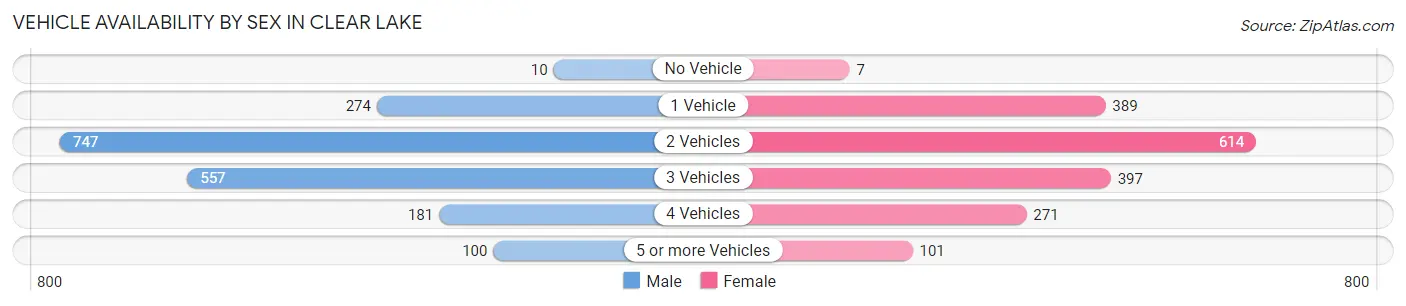
| Vehicles Available | Male | Female |
| No Vehicle | 10 (0.5%) | 7 (0.4%) |
| 1 Vehicle | 274 (14.7%) | 389 (21.9%) |
| 2 Vehicles | 747 (40.0%) | 614 (34.5%) |
| 3 Vehicles | 557 (29.8%) | 397 (22.3%) |
| 4 Vehicles | 181 (9.7%) | 271 (15.2%) |
| 5 or more Vehicles | 100 (5.3%) | 101 (5.7%) |
| Total | 1,869 (100.0%) | 1,779 (100.0%) |
Commute Time in Clear Lake
The most frequently occuring commute durations in Clear Lake are 5 to 9 minutes (673 commuters, 19.5%), 15 to 19 minutes (574 commuters, 16.6%), and 20 to 24 minutes (557 commuters, 16.1%).
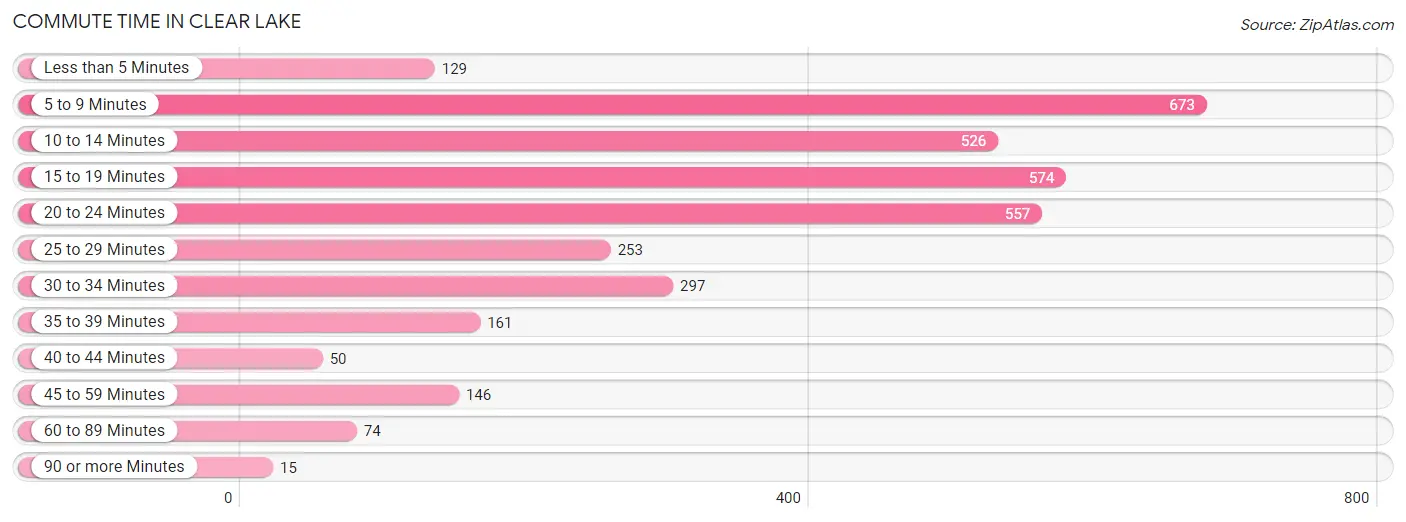
| Commute Time | # Commuters | % Commuters |
| Less than 5 Minutes | 129 | 3.7% |
| 5 to 9 Minutes | 673 | 19.5% |
| 10 to 14 Minutes | 526 | 15.2% |
| 15 to 19 Minutes | 574 | 16.6% |
| 20 to 24 Minutes | 557 | 16.1% |
| 25 to 29 Minutes | 253 | 7.3% |
| 30 to 34 Minutes | 297 | 8.6% |
| 35 to 39 Minutes | 161 | 4.7% |
| 40 to 44 Minutes | 50 | 1.5% |
| 45 to 59 Minutes | 146 | 4.2% |
| 60 to 89 Minutes | 74 | 2.1% |
| 90 or more Minutes | 15 | 0.4% |
Commute Time by Sex in Clear Lake
The most common commute times in Clear Lake are 15 to 19 minutes (369 commuters, 20.6%) for males and 5 to 9 minutes (368 commuters, 22.1%) for females.
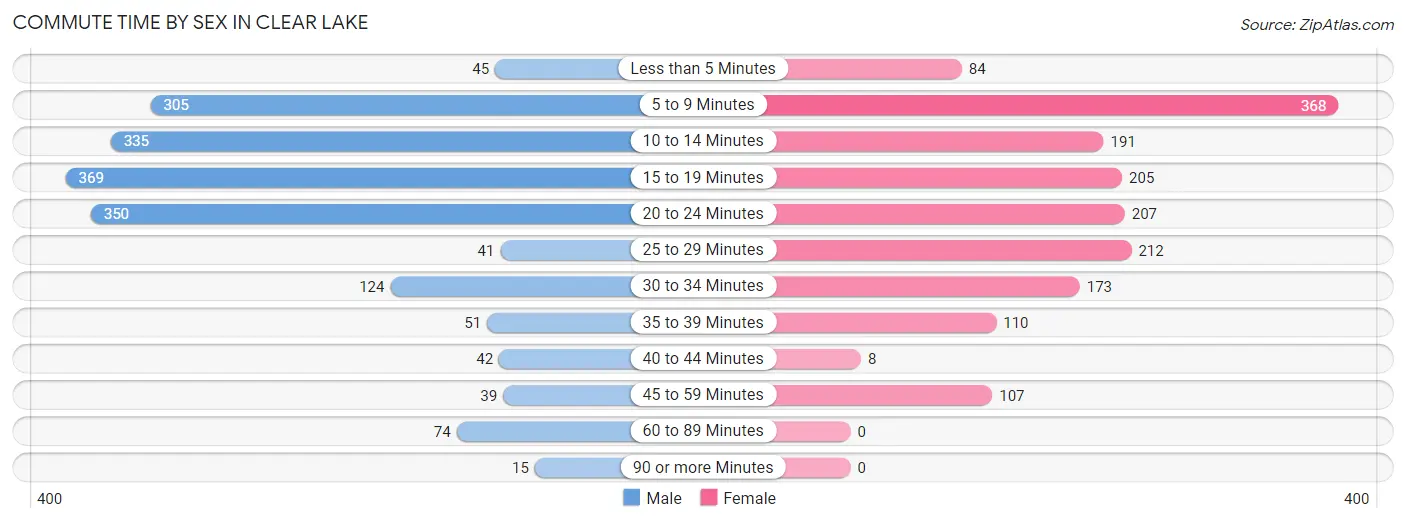
| Commute Time | Male | Female |
| Less than 5 Minutes | 45 (2.5%) | 84 (5.1%) |
| 5 to 9 Minutes | 305 (17.0%) | 368 (22.1%) |
| 10 to 14 Minutes | 335 (18.7%) | 191 (11.5%) |
| 15 to 19 Minutes | 369 (20.6%) | 205 (12.3%) |
| 20 to 24 Minutes | 350 (19.6%) | 207 (12.4%) |
| 25 to 29 Minutes | 41 (2.3%) | 212 (12.7%) |
| 30 to 34 Minutes | 124 (6.9%) | 173 (10.4%) |
| 35 to 39 Minutes | 51 (2.9%) | 110 (6.6%) |
| 40 to 44 Minutes | 42 (2.4%) | 8 (0.5%) |
| 45 to 59 Minutes | 39 (2.2%) | 107 (6.4%) |
| 60 to 89 Minutes | 74 (4.1%) | 0 (0.0%) |
| 90 or more Minutes | 15 (0.8%) | 0 (0.0%) |
Time of Departure to Work by Sex in Clear Lake
The most frequent times of departure to work in Clear Lake are 7:00 AM to 7:29 AM (254, 14.2%) for males and 7:00 AM to 7:29 AM (298, 17.9%) for females.
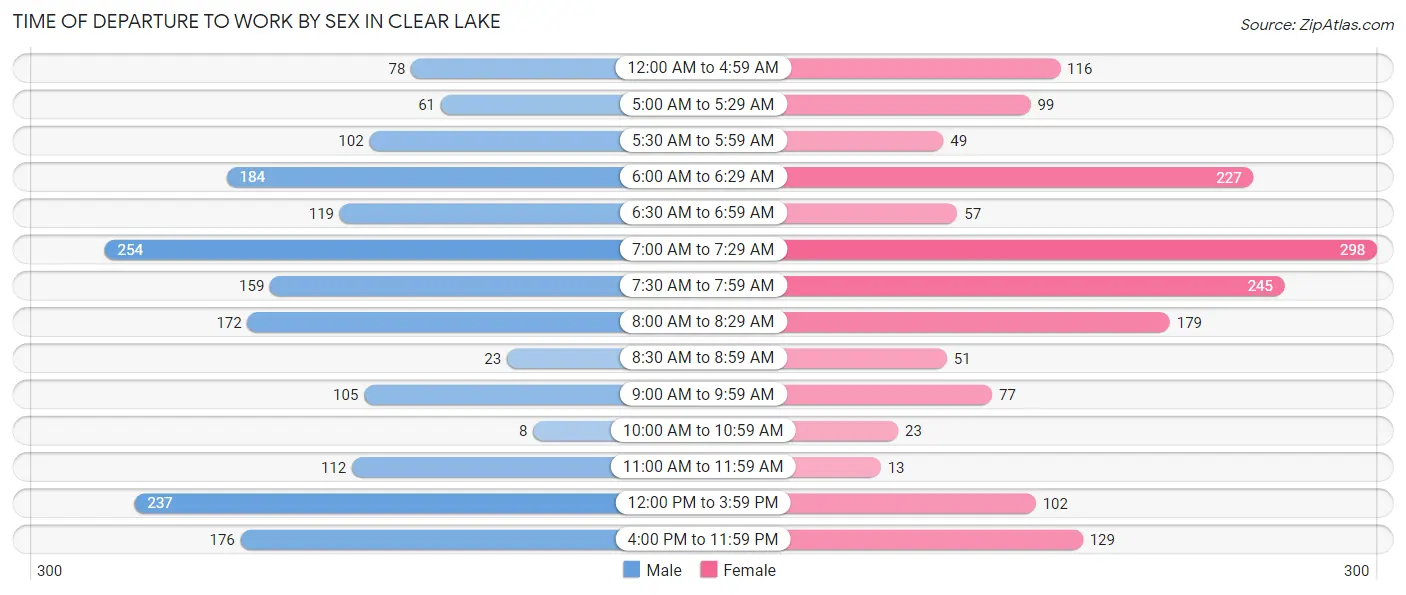
| Time of Departure | Male | Female |
| 12:00 AM to 4:59 AM | 78 (4.4%) | 116 (7.0%) |
| 5:00 AM to 5:29 AM | 61 (3.4%) | 99 (5.9%) |
| 5:30 AM to 5:59 AM | 102 (5.7%) | 49 (2.9%) |
| 6:00 AM to 6:29 AM | 184 (10.3%) | 227 (13.6%) |
| 6:30 AM to 6:59 AM | 119 (6.7%) | 57 (3.4%) |
| 7:00 AM to 7:29 AM | 254 (14.2%) | 298 (17.9%) |
| 7:30 AM to 7:59 AM | 159 (8.9%) | 245 (14.7%) |
| 8:00 AM to 8:29 AM | 172 (9.6%) | 179 (10.7%) |
| 8:30 AM to 8:59 AM | 23 (1.3%) | 51 (3.1%) |
| 9:00 AM to 9:59 AM | 105 (5.9%) | 77 (4.6%) |
| 10:00 AM to 10:59 AM | 8 (0.4%) | 23 (1.4%) |
| 11:00 AM to 11:59 AM | 112 (6.3%) | 13 (0.8%) |
| 12:00 PM to 3:59 PM | 237 (13.2%) | 102 (6.1%) |
| 4:00 PM to 11:59 PM | 176 (9.8%) | 129 (7.7%) |
| Total | 1,790 (100.0%) | 1,665 (100.0%) |
Housing Occupancy in Clear Lake
Occupancy by Ownership in Clear Lake
Of the total 3,402 dwellings in Clear Lake, owner-occupied units account for 2,561 (75.3%), while renter-occupied units make up 841 (24.7%).
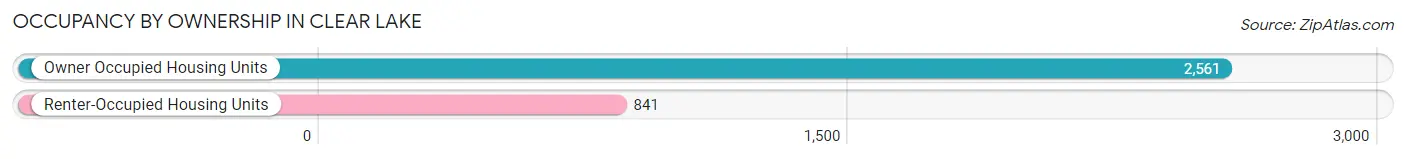
| Occupancy | # Housing Units | % Housing Units |
| Owner Occupied Housing Units | 2,561 | 75.3% |
| Renter-Occupied Housing Units | 841 | 24.7% |
| Total Occupied Housing Units | 3,402 | 100.0% |
Occupancy by Household Size in Clear Lake
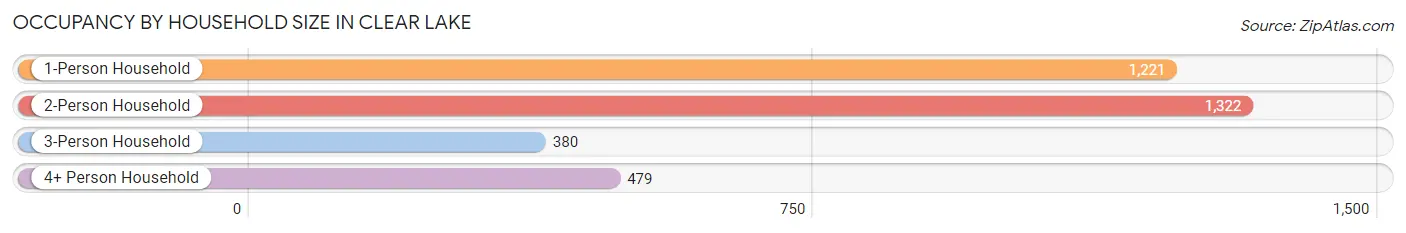
| Household Size | # Housing Units | % Housing Units |
| 1-Person Household | 1,221 | 35.9% |
| 2-Person Household | 1,322 | 38.9% |
| 3-Person Household | 380 | 11.2% |
| 4+ Person Household | 479 | 14.1% |
| Total Housing Units | 3,402 | 100.0% |
Occupancy by Ownership by Household Size in Clear Lake
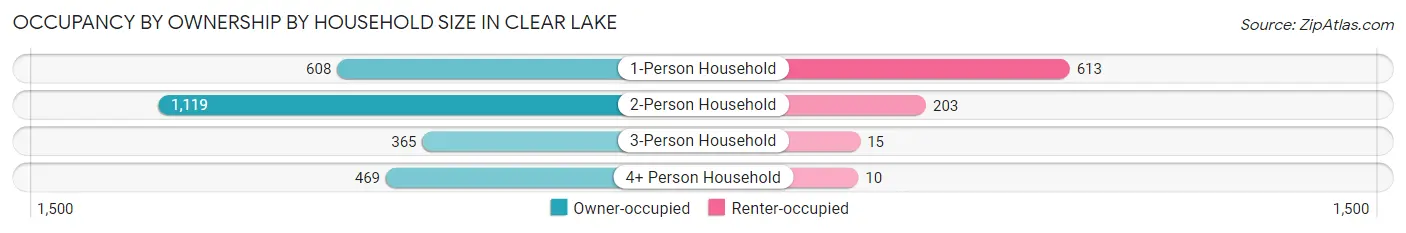
| Household Size | Owner-occupied | Renter-occupied |
| 1-Person Household | 608 (49.8%) | 613 (50.2%) |
| 2-Person Household | 1,119 (84.6%) | 203 (15.4%) |
| 3-Person Household | 365 (96.1%) | 15 (4.0%) |
| 4+ Person Household | 469 (97.9%) | 10 (2.1%) |
| Total Housing Units | 2,561 (75.3%) | 841 (24.7%) |
Occupancy by Educational Attainment in Clear Lake
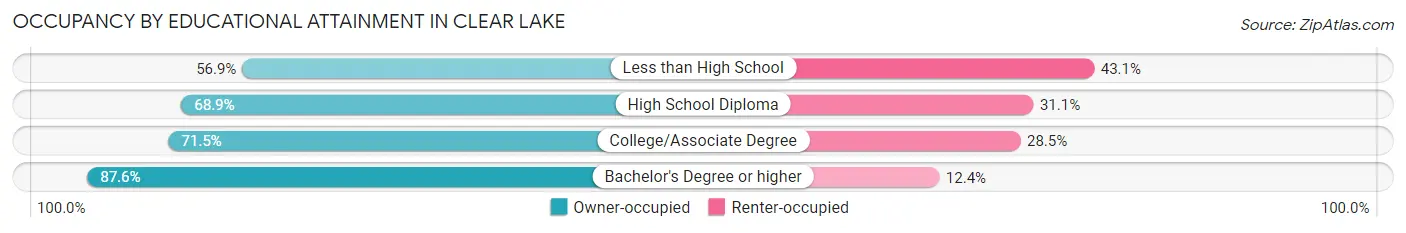
| Household Size | Owner-occupied | Renter-occupied |
| Less than High School | 87 (56.9%) | 66 (43.1%) |
| High School Diploma | 645 (68.9%) | 291 (31.1%) |
| College/Associate Degree | 872 (71.5%) | 348 (28.5%) |
| Bachelor's Degree or higher | 957 (87.6%) | 136 (12.4%) |
Occupancy by Age of Householder in Clear Lake
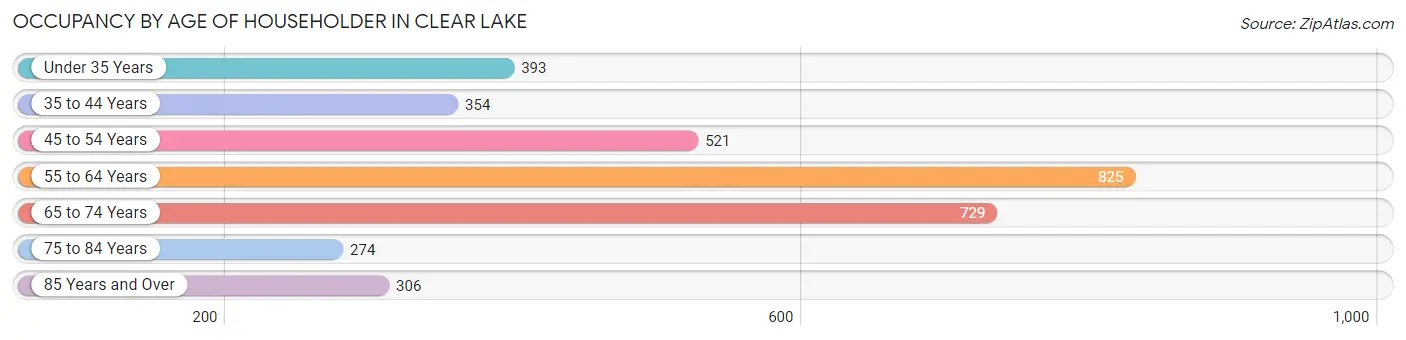
| Age Bracket | # Households | % Households |
| Under 35 Years | 393 | 11.6% |
| 35 to 44 Years | 354 | 10.4% |
| 45 to 54 Years | 521 | 15.3% |
| 55 to 64 Years | 825 | 24.2% |
| 65 to 74 Years | 729 | 21.4% |
| 75 to 84 Years | 274 | 8.1% |
| 85 Years and Over | 306 | 9.0% |
| Total | 3,402 | 100.0% |
Housing Finances in Clear Lake
Median Income by Occupancy in Clear Lake
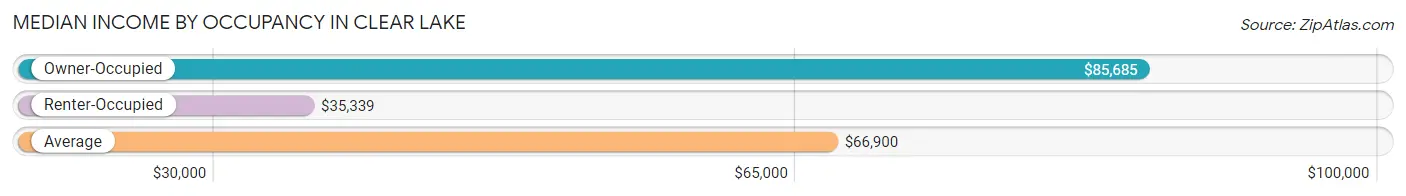
| Occupancy Type | # Households | Median Income |
| Owner-Occupied | 2,561 (75.3%) | $85,685 |
| Renter-Occupied | 841 (24.7%) | $35,339 |
| Average | 3,402 (100.0%) | $66,900 |
Occupancy by Householder Income Bracket in Clear Lake
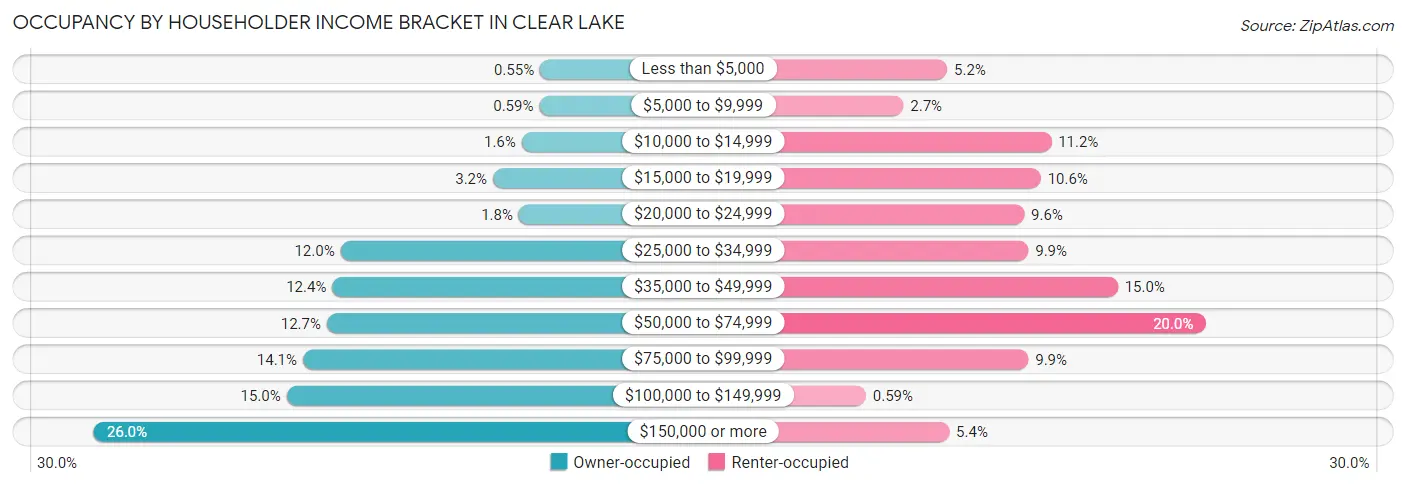
| Income Bracket | Owner-occupied | Renter-occupied |
| Less than $5,000 | 14 (0.5%) | 44 (5.2%) |
| $5,000 to $9,999 | 15 (0.6%) | 23 (2.7%) |
| $10,000 to $14,999 | 41 (1.6%) | 94 (11.2%) |
| $15,000 to $19,999 | 83 (3.2%) | 89 (10.6%) |
| $20,000 to $24,999 | 45 (1.8%) | 81 (9.6%) |
| $25,000 to $34,999 | 306 (11.9%) | 83 (9.9%) |
| $35,000 to $49,999 | 318 (12.4%) | 126 (15.0%) |
| $50,000 to $74,999 | 326 (12.7%) | 168 (20.0%) |
| $75,000 to $99,999 | 361 (14.1%) | 83 (9.9%) |
| $100,000 to $149,999 | 385 (15.0%) | 5 (0.6%) |
| $150,000 or more | 667 (26.0%) | 45 (5.3%) |
| Total | 2,561 (100.0%) | 841 (100.0%) |
Monthly Housing Cost Tiers in Clear Lake
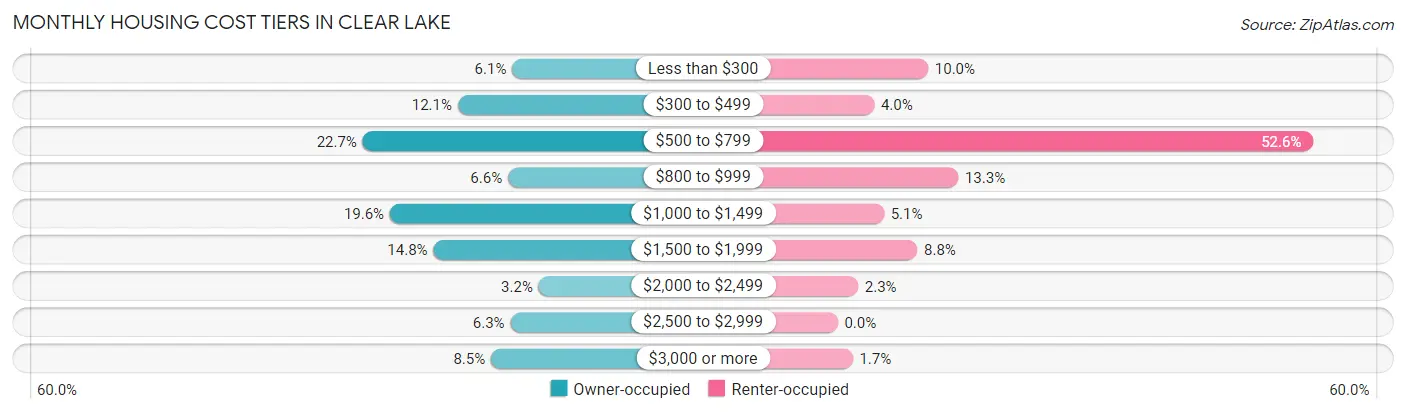
| Monthly Cost | Owner-occupied | Renter-occupied |
| Less than $300 | 157 (6.1%) | 84 (10.0%) |
| $300 to $499 | 311 (12.1%) | 34 (4.0%) |
| $500 to $799 | 580 (22.7%) | 442 (52.6%) |
| $800 to $999 | 169 (6.6%) | 112 (13.3%) |
| $1,000 to $1,499 | 503 (19.6%) | 43 (5.1%) |
| $1,500 to $1,999 | 380 (14.8%) | 74 (8.8%) |
| $2,000 to $2,499 | 82 (3.2%) | 19 (2.3%) |
| $2,500 to $2,999 | 162 (6.3%) | 0 (0.0%) |
| $3,000 or more | 217 (8.5%) | 14 (1.7%) |
| Total | 2,561 (100.0%) | 841 (100.0%) |
Physical Housing Characteristics in Clear Lake
Housing Structures in Clear Lake
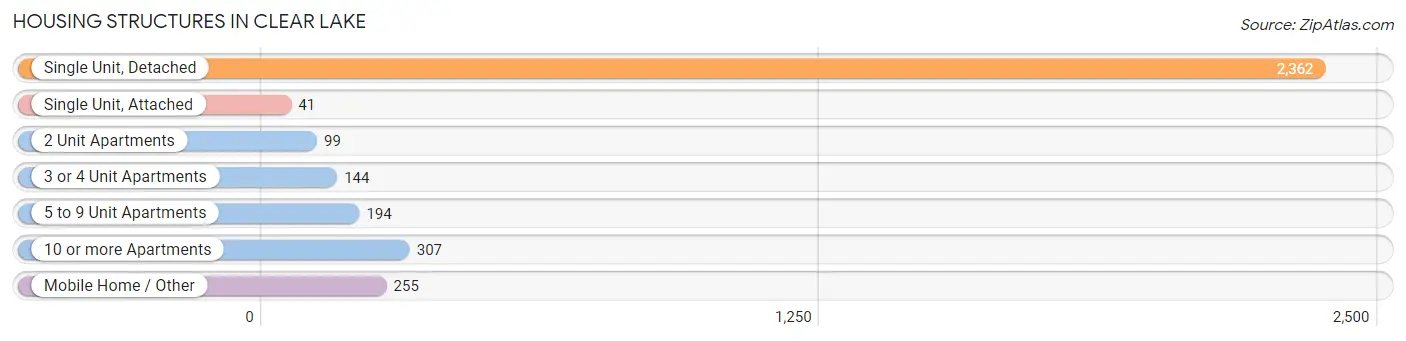
| Structure Type | # Housing Units | % Housing Units |
| Single Unit, Detached | 2,362 | 69.4% |
| Single Unit, Attached | 41 | 1.2% |
| 2 Unit Apartments | 99 | 2.9% |
| 3 or 4 Unit Apartments | 144 | 4.2% |
| 5 to 9 Unit Apartments | 194 | 5.7% |
| 10 or more Apartments | 307 | 9.0% |
| Mobile Home / Other | 255 | 7.5% |
| Total | 3,402 | 100.0% |
Housing Structures by Occupancy in Clear Lake
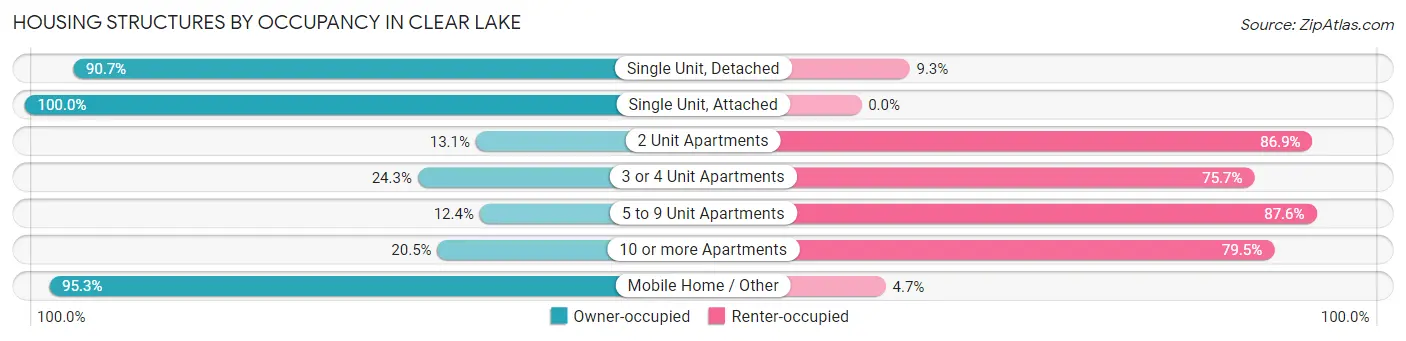
| Structure Type | Owner-occupied | Renter-occupied |
| Single Unit, Detached | 2,142 (90.7%) | 220 (9.3%) |
| Single Unit, Attached | 41 (100.0%) | 0 (0.0%) |
| 2 Unit Apartments | 13 (13.1%) | 86 (86.9%) |
| 3 or 4 Unit Apartments | 35 (24.3%) | 109 (75.7%) |
| 5 to 9 Unit Apartments | 24 (12.4%) | 170 (87.6%) |
| 10 or more Apartments | 63 (20.5%) | 244 (79.5%) |
| Mobile Home / Other | 243 (95.3%) | 12 (4.7%) |
| Total | 2,561 (75.3%) | 841 (24.7%) |
Housing Structures by Number of Rooms in Clear Lake
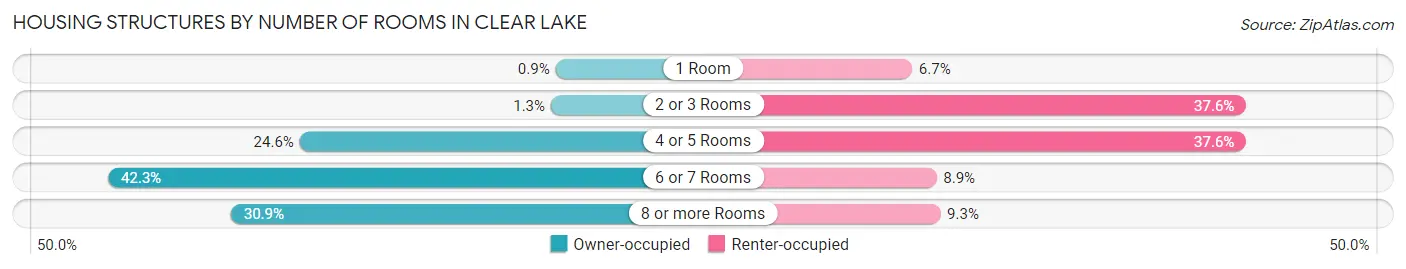
| Number of Rooms | Owner-occupied | Renter-occupied |
| 1 Room | 23 (0.9%) | 56 (6.7%) |
| 2 or 3 Rooms | 34 (1.3%) | 316 (37.6%) |
| 4 or 5 Rooms | 629 (24.6%) | 316 (37.6%) |
| 6 or 7 Rooms | 1,083 (42.3%) | 75 (8.9%) |
| 8 or more Rooms | 792 (30.9%) | 78 (9.3%) |
| Total | 2,561 (100.0%) | 841 (100.0%) |
Housing Structure by Heating Type in Clear Lake
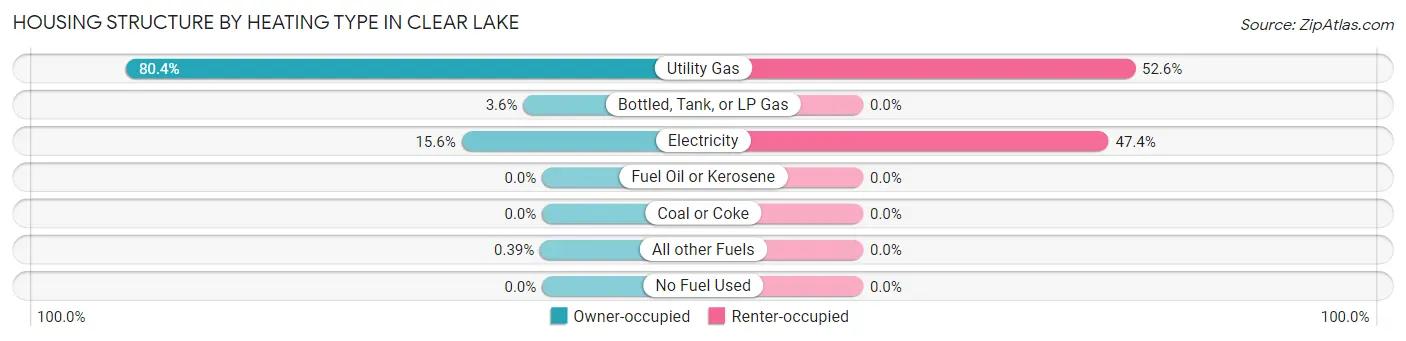
| Heating Type | Owner-occupied | Renter-occupied |
| Utility Gas | 2,059 (80.4%) | 442 (52.6%) |
| Bottled, Tank, or LP Gas | 93 (3.6%) | 0 (0.0%) |
| Electricity | 399 (15.6%) | 399 (47.4%) |
| Fuel Oil or Kerosene | 0 (0.0%) | 0 (0.0%) |
| Coal or Coke | 0 (0.0%) | 0 (0.0%) |
| All other Fuels | 10 (0.4%) | 0 (0.0%) |
| No Fuel Used | 0 (0.0%) | 0 (0.0%) |
| Total | 2,561 (100.0%) | 841 (100.0%) |
Household Vehicle Usage in Clear Lake
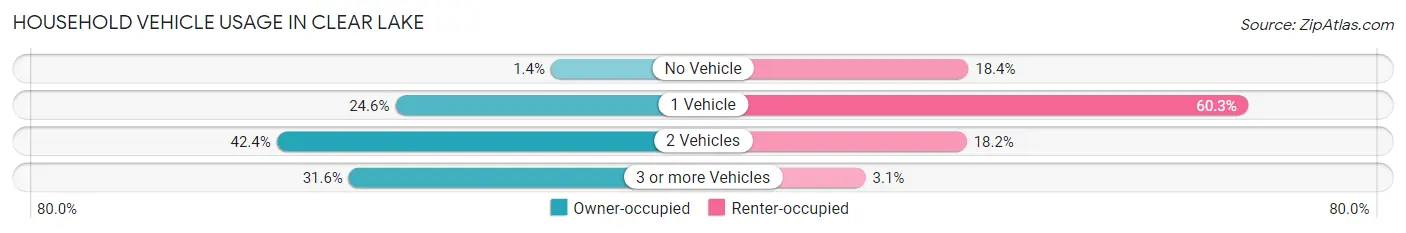
| Vehicles per Household | Owner-occupied | Renter-occupied |
| No Vehicle | 36 (1.4%) | 155 (18.4%) |
| 1 Vehicle | 631 (24.6%) | 507 (60.3%) |
| 2 Vehicles | 1,085 (42.4%) | 153 (18.2%) |
| 3 or more Vehicles | 809 (31.6%) | 26 (3.1%) |
| Total | 2,561 (100.0%) | 841 (100.0%) |
Real Estate & Mortgages in Clear Lake
Real Estate and Mortgage Overview in Clear Lake
| Characteristic | Without Mortgage | With Mortgage |
| Housing Units | 1,275 | 1,286 |
| Median Property Value | $162,100 | $259,400 |
| Median Household Income | $49,583 | $550 |
| Monthly Housing Costs | $557 | $200 |
| Real Estate Taxes | $2,428 | $0 |
Property Value by Mortgage Status in Clear Lake
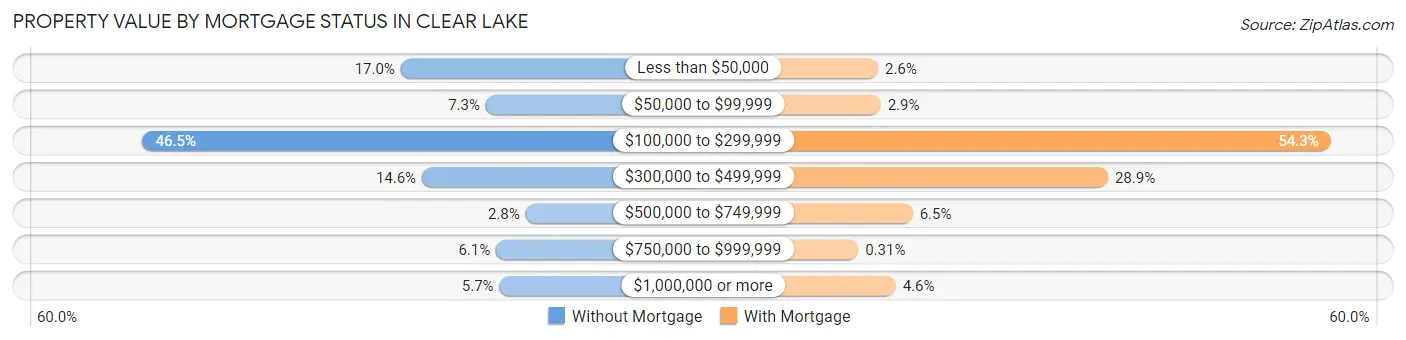
| Property Value | Without Mortgage | With Mortgage |
| Less than $50,000 | 217 (17.0%) | 33 (2.6%) |
| $50,000 to $99,999 | 93 (7.3%) | 37 (2.9%) |
| $100,000 to $299,999 | 593 (46.5%) | 698 (54.3%) |
| $300,000 to $499,999 | 186 (14.6%) | 371 (28.8%) |
| $500,000 to $749,999 | 35 (2.8%) | 84 (6.5%) |
| $750,000 to $999,999 | 78 (6.1%) | 4 (0.3%) |
| $1,000,000 or more | 73 (5.7%) | 59 (4.6%) |
| Total | 1,275 (100.0%) | 1,286 (100.0%) |
Household Income by Mortgage Status in Clear Lake
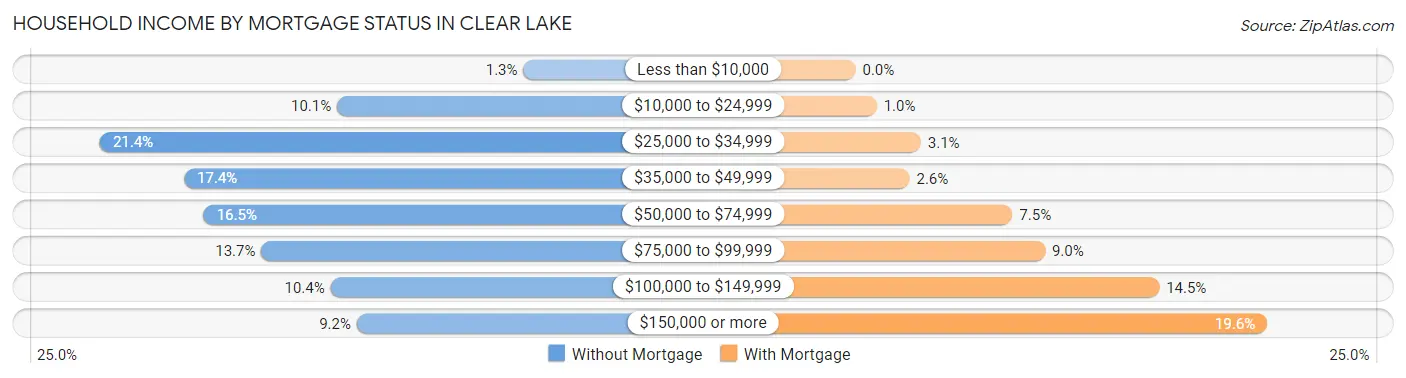
| Household Income | Without Mortgage | With Mortgage |
| Less than $10,000 | 16 (1.3%) | 0 (0.0%) |
| $10,000 to $24,999 | 129 (10.1%) | 13 (1.0%) |
| $25,000 to $34,999 | 273 (21.4%) | 40 (3.1%) |
| $35,000 to $49,999 | 222 (17.4%) | 33 (2.6%) |
| $50,000 to $74,999 | 210 (16.5%) | 96 (7.5%) |
| $75,000 to $99,999 | 175 (13.7%) | 116 (9.0%) |
| $100,000 to $149,999 | 133 (10.4%) | 186 (14.5%) |
| $150,000 or more | 117 (9.2%) | 252 (19.6%) |
| Total | 1,275 (100.0%) | 1,286 (100.0%) |
Property Value to Household Income Ratio in Clear Lake
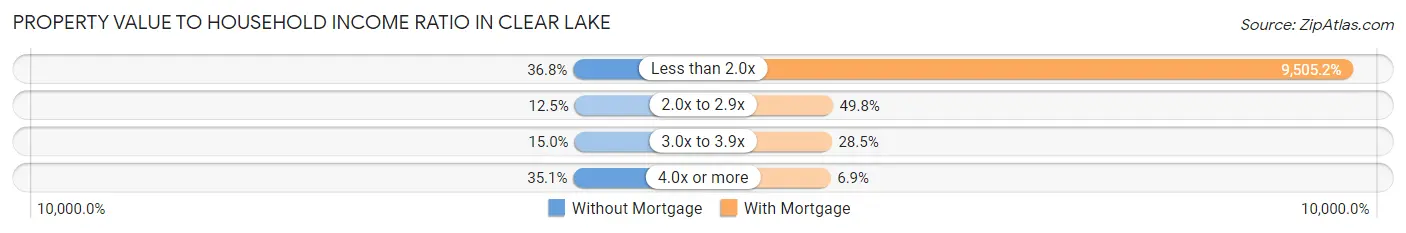
| Value-to-Income Ratio | Without Mortgage | With Mortgage |
| Less than 2.0x | 469 (36.8%) | 122,237 (9,505.2%) |
| 2.0x to 2.9x | 159 (12.5%) | 640 (49.8%) |
| 3.0x to 3.9x | 191 (15.0%) | 367 (28.5%) |
| 4.0x or more | 448 (35.1%) | 89 (6.9%) |
| Total | 1,275 (100.0%) | 1,286 (100.0%) |
Real Estate Taxes by Mortgage Status in Clear Lake
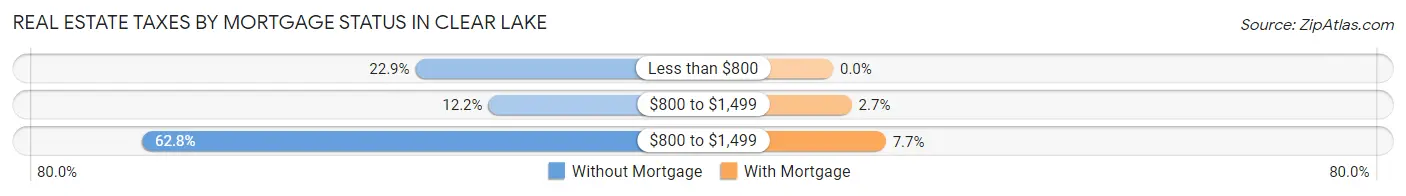
| Property Taxes | Without Mortgage | With Mortgage |
| Less than $800 | 292 (22.9%) | 0 (0.0%) |
| $800 to $1,499 | 156 (12.2%) | 35 (2.7%) |
| $800 to $1,499 | 801 (62.8%) | 99 (7.7%) |
| Total | 1,275 (100.0%) | 1,286 (100.0%) |
Health & Disability in Clear Lake
Health Insurance Coverage by Age in Clear Lake
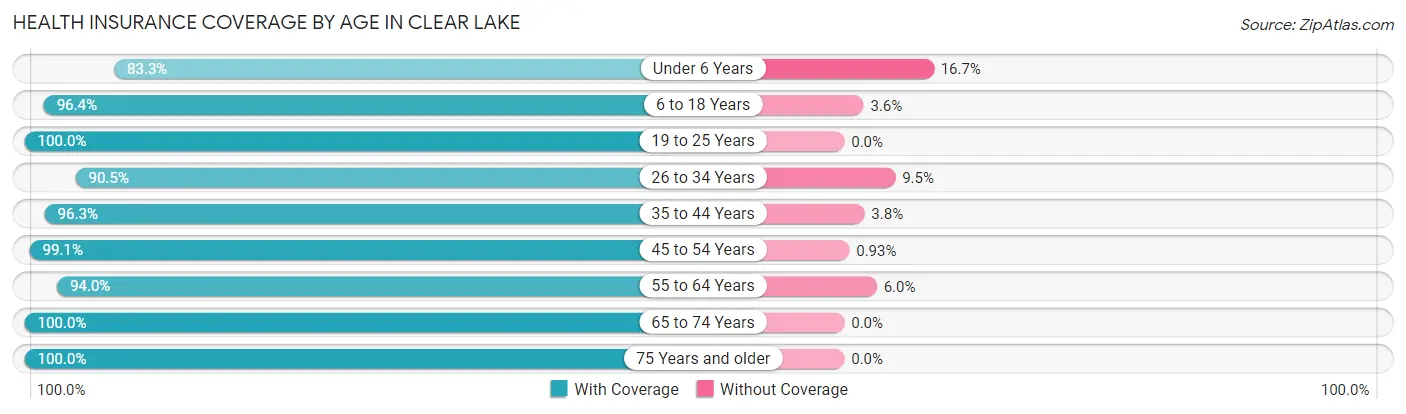
| Age Bracket | With Coverage | Without Coverage |
| Under 6 Years | 330 (83.3%) | 66 (16.7%) |
| 6 to 18 Years | 1,134 (96.4%) | 42 (3.6%) |
| 19 to 25 Years | 455 (100.0%) | 0 (0.0%) |
| 26 to 34 Years | 562 (90.5%) | 59 (9.5%) |
| 35 to 44 Years | 795 (96.3%) | 31 (3.7%) |
| 45 to 54 Years | 747 (99.1%) | 7 (0.9%) |
| 55 to 64 Years | 1,323 (94.0%) | 85 (6.0%) |
| 65 to 74 Years | 1,193 (100.0%) | 0 (0.0%) |
| 75 Years and older | 751 (100.0%) | 0 (0.0%) |
| Total | 7,290 (96.2%) | 290 (3.8%) |
Health Insurance Coverage by Citizenship Status in Clear Lake
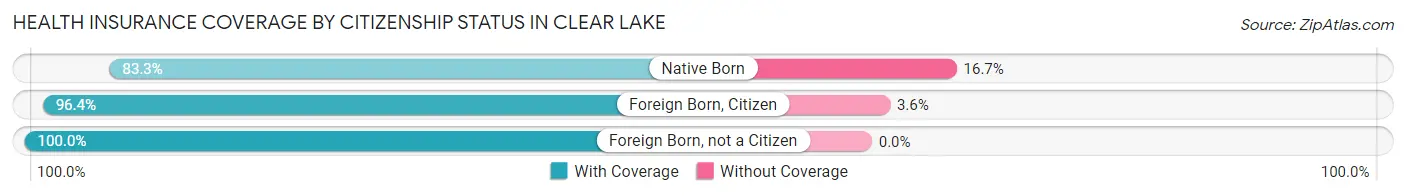
| Citizenship Status | With Coverage | Without Coverage |
| Native Born | 330 (83.3%) | 66 (16.7%) |
| Foreign Born, Citizen | 1,134 (96.4%) | 42 (3.6%) |
| Foreign Born, not a Citizen | 455 (100.0%) | 0 (0.0%) |
Health Insurance Coverage by Household Income in Clear Lake
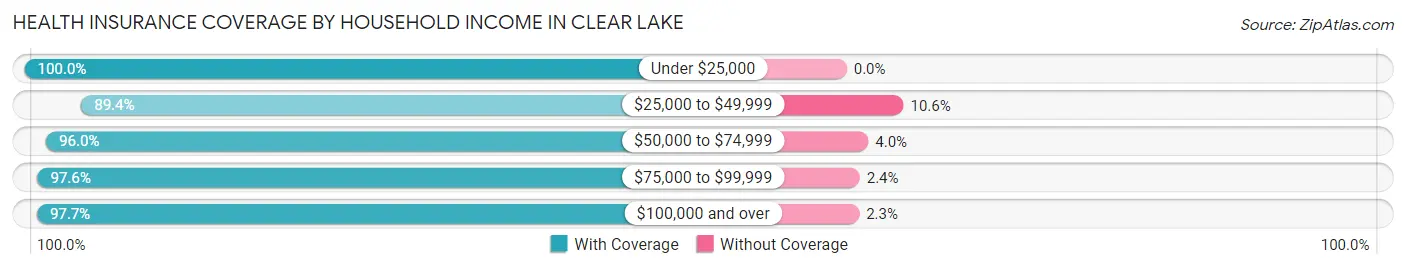
| Household Income | With Coverage | Without Coverage |
| Under $25,000 | 622 (100.0%) | 0 (0.0%) |
| $25,000 to $49,999 | 1,228 (89.4%) | 146 (10.6%) |
| $50,000 to $74,999 | 926 (96.0%) | 39 (4.0%) |
| $75,000 to $99,999 | 963 (97.6%) | 24 (2.4%) |
| $100,000 and over | 3,407 (97.7%) | 81 (2.3%) |
Public vs Private Health Insurance Coverage by Age in Clear Lake
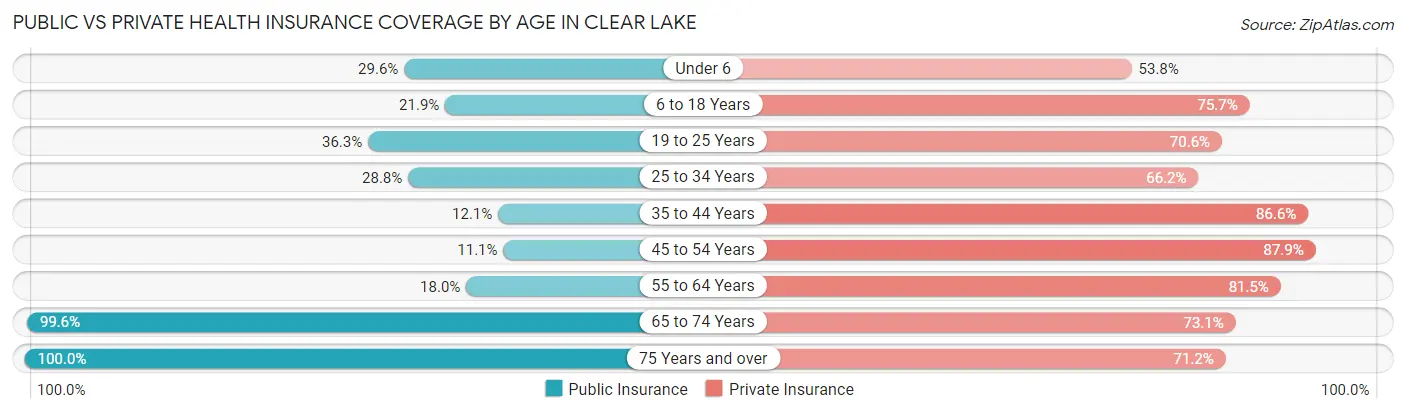
| Age Bracket | Public Insurance | Private Insurance |
| Under 6 | 117 (29.5%) | 213 (53.8%) |
| 6 to 18 Years | 258 (21.9%) | 890 (75.7%) |
| 19 to 25 Years | 165 (36.3%) | 321 (70.6%) |
| 25 to 34 Years | 179 (28.8%) | 411 (66.2%) |
| 35 to 44 Years | 100 (12.1%) | 715 (86.6%) |
| 45 to 54 Years | 84 (11.1%) | 663 (87.9%) |
| 55 to 64 Years | 254 (18.0%) | 1,147 (81.5%) |
| 65 to 74 Years | 1,188 (99.6%) | 872 (73.1%) |
| 75 Years and over | 751 (100.0%) | 535 (71.2%) |
| Total | 3,096 (40.8%) | 5,767 (76.1%) |
Disability Status by Sex by Age in Clear Lake
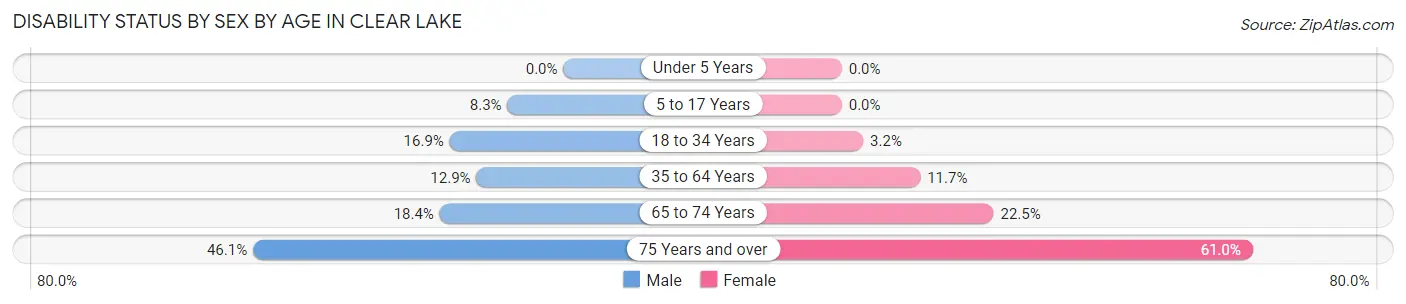
| Age Bracket | Male | Female |
| Under 5 Years | 0 (0.0%) | 0 (0.0%) |
| 5 to 17 Years | 46 (8.3%) | 0 (0.0%) |
| 18 to 34 Years | 119 (16.9%) | 17 (3.2%) |
| 35 to 64 Years | 183 (12.9%) | 183 (11.7%) |
| 65 to 74 Years | 105 (18.4%) | 140 (22.5%) |
| 75 Years and over | 112 (46.1%) | 310 (61.0%) |
Disability Class by Sex by Age in Clear Lake
Disability Class: Hearing Difficulty
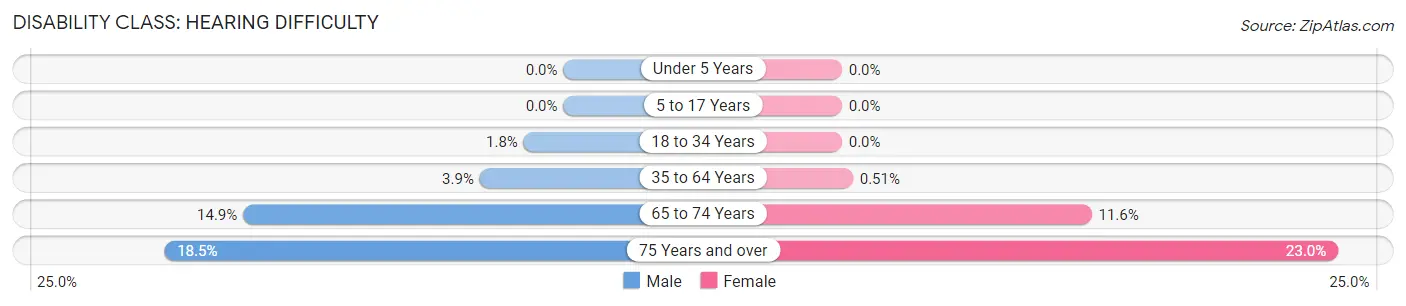
| Age Bracket | Male | Female |
| Under 5 Years | 0 (0.0%) | 0 (0.0%) |
| 5 to 17 Years | 0 (0.0%) | 0 (0.0%) |
| 18 to 34 Years | 13 (1.8%) | 0 (0.0%) |
| 35 to 64 Years | 55 (3.9%) | 8 (0.5%) |
| 65 to 74 Years | 85 (14.9%) | 72 (11.6%) |
| 75 Years and over | 45 (18.5%) | 117 (23.0%) |
Disability Class: Vision Difficulty
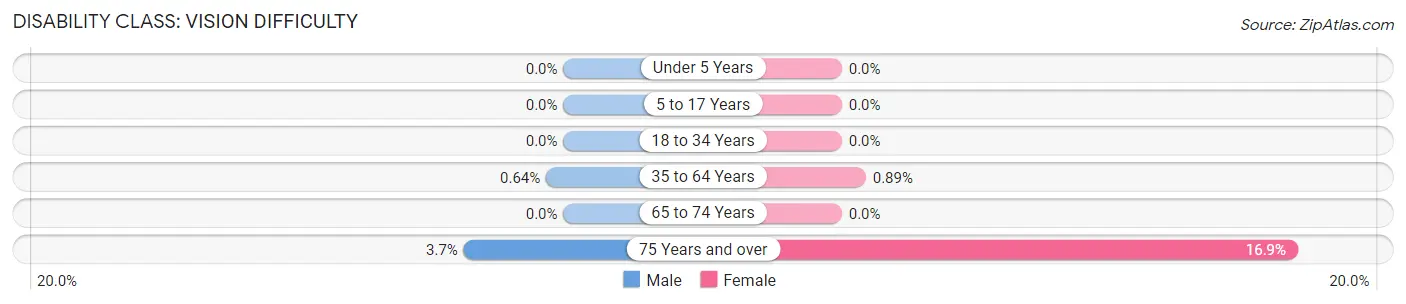
| Age Bracket | Male | Female |
| Under 5 Years | 0 (0.0%) | 0 (0.0%) |
| 5 to 17 Years | 0 (0.0%) | 0 (0.0%) |
| 18 to 34 Years | 0 (0.0%) | 0 (0.0%) |
| 35 to 64 Years | 9 (0.6%) | 14 (0.9%) |
| 65 to 74 Years | 0 (0.0%) | 0 (0.0%) |
| 75 Years and over | 9 (3.7%) | 86 (16.9%) |
Disability Class: Cognitive Difficulty
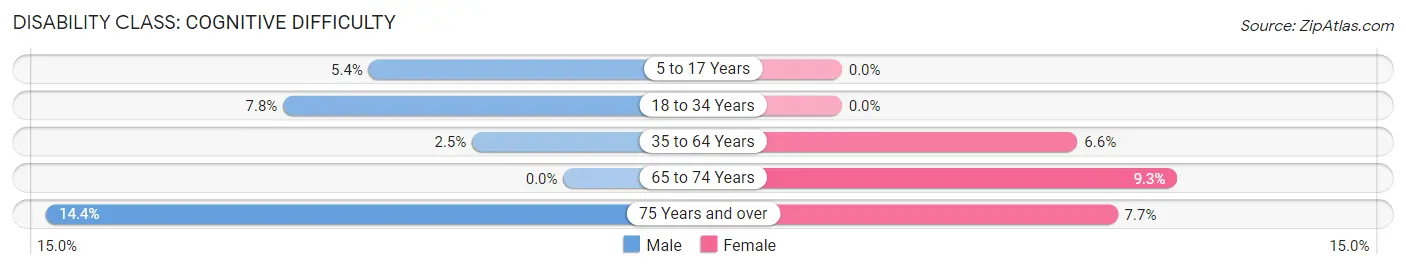
| Age Bracket | Male | Female |
| 5 to 17 Years | 30 (5.4%) | 0 (0.0%) |
| 18 to 34 Years | 55 (7.8%) | 0 (0.0%) |
| 35 to 64 Years | 36 (2.5%) | 103 (6.6%) |
| 65 to 74 Years | 0 (0.0%) | 58 (9.3%) |
| 75 Years and over | 35 (14.4%) | 39 (7.7%) |
Disability Class: Ambulatory Difficulty
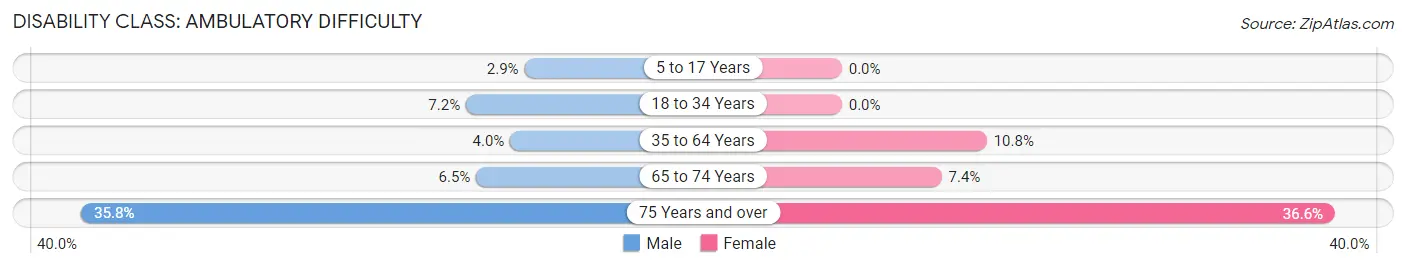
| Age Bracket | Male | Female |
| 5 to 17 Years | 16 (2.9%) | 0 (0.0%) |
| 18 to 34 Years | 51 (7.2%) | 0 (0.0%) |
| 35 to 64 Years | 56 (4.0%) | 169 (10.8%) |
| 65 to 74 Years | 37 (6.5%) | 46 (7.4%) |
| 75 Years and over | 87 (35.8%) | 186 (36.6%) |
Disability Class: Self-Care Difficulty
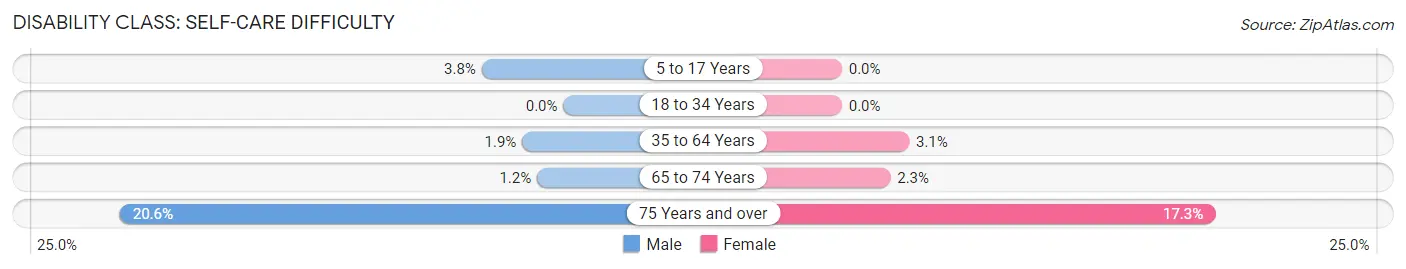
| Age Bracket | Male | Female |
| 5 to 17 Years | 21 (3.8%) | 0 (0.0%) |
| 18 to 34 Years | 0 (0.0%) | 0 (0.0%) |
| 35 to 64 Years | 27 (1.9%) | 49 (3.1%) |
| 65 to 74 Years | 7 (1.2%) | 14 (2.2%) |
| 75 Years and over | 50 (20.6%) | 88 (17.3%) |
Technology Access in Clear Lake
Computing Device Access in Clear Lake
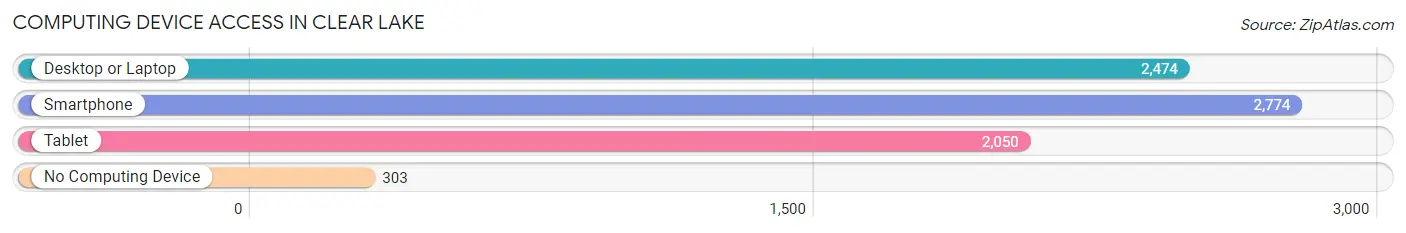
| Device Type | # Households | % Households |
| Desktop or Laptop | 2,474 | 72.7% |
| Smartphone | 2,774 | 81.5% |
| Tablet | 2,050 | 60.3% |
| No Computing Device | 303 | 8.9% |
| Total | 3,402 | 100.0% |
Internet Access in Clear Lake
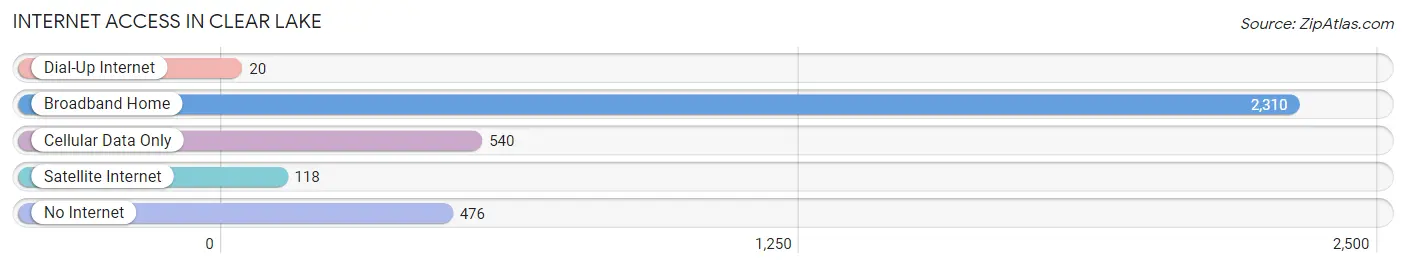
| Internet Type | # Households | % Households |
| Dial-Up Internet | 20 | 0.6% |
| Broadband Home | 2,310 | 67.9% |
| Cellular Data Only | 540 | 15.9% |
| Satellite Internet | 118 | 3.5% |
| No Internet | 476 | 14.0% |
| Total | 3,402 | 100.0% |
Clear Lake Summary
History
Clear Lake, Iowa is a city located in Cerro Gordo County, Iowa. It is situated on the north shore of Clear Lake, a natural glacial lake. The city was founded in 1855 by settlers from New England, who were attracted to the area by its natural beauty and abundant resources. The city was originally named Clear Lake Village, but was later changed to Clear Lake.
The city was an important stop on the Chicago, Milwaukee, St. Paul and Pacific Railroad, which ran through the city in the late 19th century. This railroad was instrumental in the development of Clear Lake, as it allowed for the transportation of goods and people to and from the city.
Clear Lake was also an important stop on the Underground Railroad, which was used by escaped slaves to travel to freedom in the northern United States. The city was home to several prominent abolitionists, including Reverend John Todd, who was a leader in the movement.
The city was also home to several prominent figures in the early 20th century, including the Wright Brothers, who used the lake as a testing ground for their early aircraft. The city was also home to the first commercial radio station in the United States, KGLO, which began broadcasting in 1922.
Geography
Clear Lake is located in Cerro Gordo County, Iowa, on the north shore of Clear Lake. The city is situated on the western edge of the Iowa Great Lakes region, which includes several other natural glacial lakes. The city is located approximately 90 miles north of Des Moines, the state capital.
The city has a total area of 4.2 square miles, all of which is land. The city is located at an elevation of 1,037 feet above sea level. The city is located in a humid continental climate zone, with hot summers and cold winters.
Economy
Clear Lake has a diverse economy, with a variety of industries represented in the city. The city is home to several manufacturing companies, including a large paper mill and a plastics factory. The city is also home to several retail stores, restaurants, and other businesses.
The city is also home to several tourist attractions, including the Surf Ballroom, a historic music venue, and the Clear Lake State Park. The city is also home to several marinas, which provide access to the lake for recreational activities such as fishing, boating, and swimming.
Demographics
As of the 2010 census, the population of Clear Lake was 7,777. The racial makeup of the city was 97.2% White, 0.7% African American, 0.3% Native American, 0.5% Asian, 0.1% Pacific Islander, 0.4% from other races, and 0.8% from two or more races. Hispanic or Latino of any race were 1.7% of the population.
The median household income in Clear Lake was $45,945, and the median family income was $54,945. The per capita income for the city was $22,945. About 8.2% of families and 10.3% of the population were below the poverty line, including 14.2% of those under age 18 and 6.2% of those age 65 or over.
Common Questions
What is Per Capita Income in Clear Lake?
Per Capita income in Clear Lake is $51,027.
What is the Median Family Income in Clear Lake?
Median Family Income in Clear Lake is $102,500.
What is the Median Household income in Clear Lake?
Median Household Income in Clear Lake is $66,900.
What is Income or Wage Gap in Clear Lake?
Income or Wage Gap in Clear Lake is 26.9%.
Women in Clear Lake earn 73.1 cents for every dollar earned by a man.
What is Inequality or Gini Index in Clear Lake?
Inequality or Gini Index in Clear Lake is 0.56.
What is the Total Population of Clear Lake?
Total Population of Clear Lake is 7,642.
What is the Total Male Population of Clear Lake?
Total Male Population of Clear Lake is 3,636.
What is the Total Female Population of Clear Lake?
Total Female Population of Clear Lake is 4,006.
What is the Ratio of Males per 100 Females in Clear Lake?
There are 90.76 Males per 100 Females in Clear Lake.
What is the Ratio of Females per 100 Males in Clear Lake?
There are 110.18 Females per 100 Males in Clear Lake.
What is the Median Population Age in Clear Lake?
Median Population Age in Clear Lake is 50.4 Years.
What is the Average Family Size in Clear Lake
Average Family Size in Clear Lake is 2.9 People.
What is the Average Household Size in Clear Lake
Average Household Size in Clear Lake is 2.2 People.
How Large is the Labor Force in Clear Lake?
There are 3,891 People in the Labor Forcein in Clear Lake.
What is the Percentage of People in the Labor Force in Clear Lake?
60.8% of People are in the Labor Force in Clear Lake.
What is the Unemployment Rate in Clear Lake?
Unemployment Rate in Clear Lake is 2.9%.