Calmar, IA Map & Demographics
Calmar Map
Calmar Overview
$34,128
PER CAPITA INCOME
$90,781
AVG FAMILY INCOME
$73,500
AVG HOUSEHOLD INCOME
27.4%
WAGE / INCOME GAP [ % ]
72.6¢/ $1
WAGE / INCOME GAP [ $ ]
0.36
INEQUALITY / GINI INDEX
831
TOTAL POPULATION
445
MALE POPULATION
386
FEMALE POPULATION
115.28
MALES / 100 FEMALES
86.74
FEMALES / 100 MALES
37.2
MEDIAN AGE
3.0
AVG FAMILY SIZE
2.4
AVG HOUSEHOLD SIZE
419
LABOR FORCE [ PEOPLE ]
64.8%
PERCENT IN LABOR FORCE
0.2%
UNEMPLOYMENT RATE
Calmar Zip Codes
Calmar Area Codes
Income in Calmar
Income Overview in Calmar
Per Capita Income in Calmar is $34,128, while median incomes of families and households are $90,781 and $73,500 respectively.
| Characteristic | Number | Measure |
| Per Capita Income | 831 | $34,128 |
| Median Family Income | 215 | $90,781 |
| Mean Family Income | 215 | $98,369 |
| Median Household Income | 352 | $73,500 |
| Mean Household Income | 352 | $81,276 |
| Income Deficit | 215 | $0 |
| Wage / Income Gap (%) | 831 | 27.37% |
| Wage / Income Gap ($) | 831 | 72.63¢ per $1 |
| Gini / Inequality Index | 831 | 0.36 |
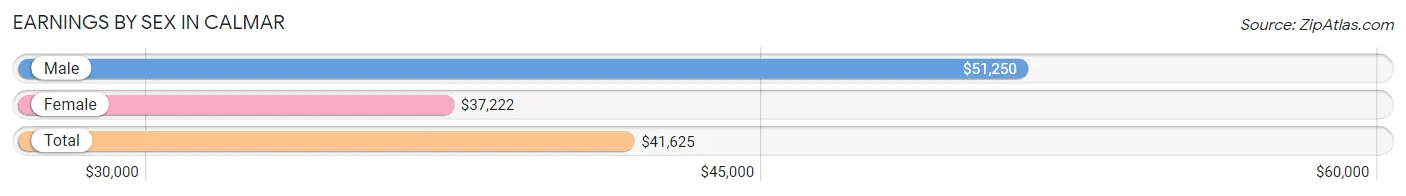
Earnings by Sex in Calmar
Average Earnings in Calmar are $41,625, $51,250 for men and $37,222 for women, a difference of 27.4%.
| Sex | Number | Average Earnings |
| Male | 290 (59.4%) | $51,250 |
| Female | 198 (40.6%) | $37,222 |
| Total | 488 (100.0%) | $41,625 |
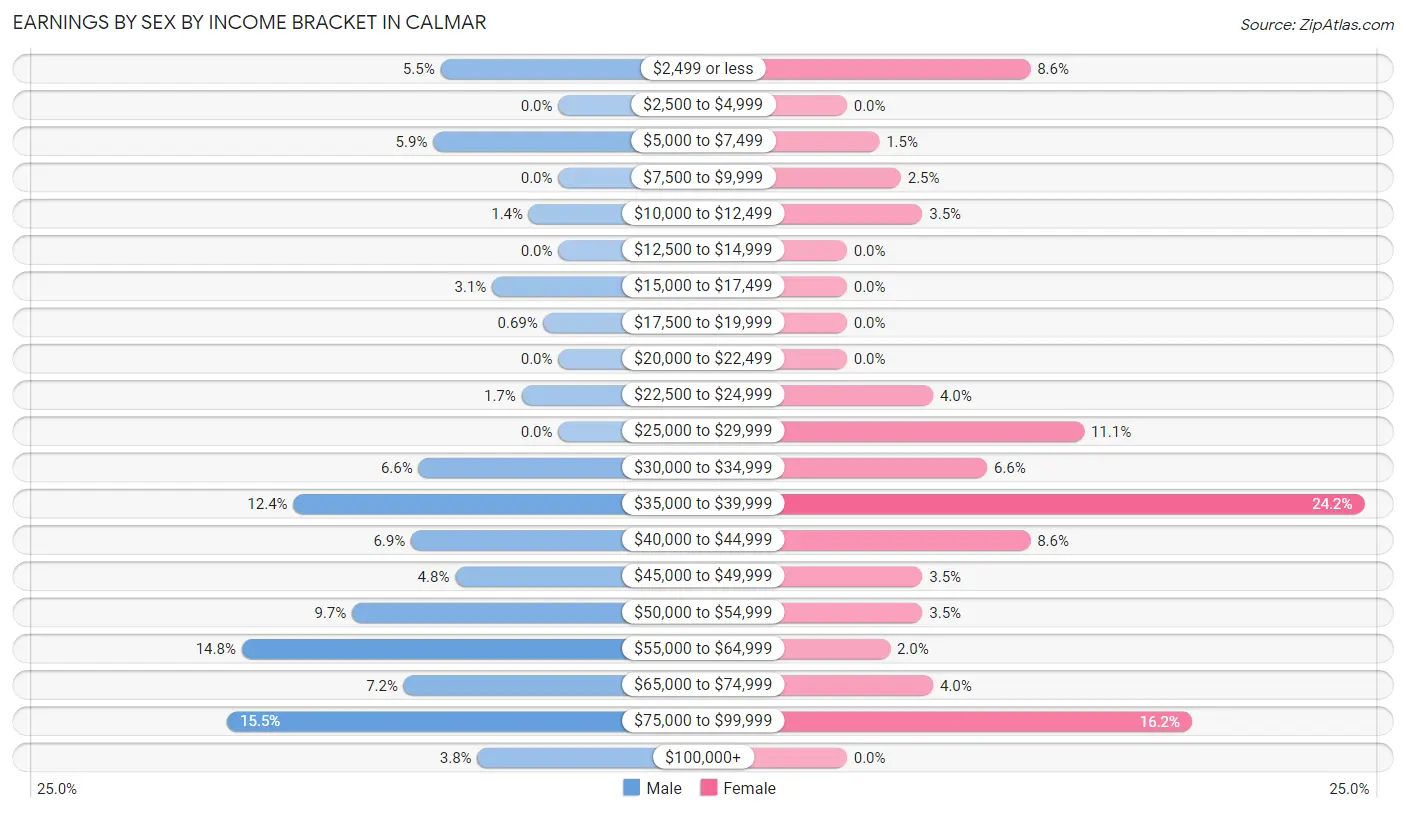
Earnings by Sex by Income Bracket in Calmar
The most common earnings brackets in Calmar are $75,000 to $99,999 for men (45 | 15.5%) and $35,000 to $39,999 for women (48 | 24.2%).
| Income | Male | Female |
| $2,499 or less | 16 (5.5%) | 17 (8.6%) |
| $2,500 to $4,999 | 0 (0.0%) | 0 (0.0%) |
| $5,000 to $7,499 | 17 (5.9%) | 3 (1.5%) |
| $7,500 to $9,999 | 0 (0.0%) | 5 (2.5%) |
| $10,000 to $12,499 | 4 (1.4%) | 7 (3.5%) |
| $12,500 to $14,999 | 0 (0.0%) | 0 (0.0%) |
| $15,000 to $17,499 | 9 (3.1%) | 0 (0.0%) |
| $17,500 to $19,999 | 2 (0.7%) | 0 (0.0%) |
| $20,000 to $22,499 | 0 (0.0%) | 0 (0.0%) |
| $22,500 to $24,999 | 5 (1.7%) | 8 (4.0%) |
| $25,000 to $29,999 | 0 (0.0%) | 22 (11.1%) |
| $30,000 to $34,999 | 19 (6.6%) | 13 (6.6%) |
| $35,000 to $39,999 | 36 (12.4%) | 48 (24.2%) |
| $40,000 to $44,999 | 20 (6.9%) | 17 (8.6%) |
| $45,000 to $49,999 | 14 (4.8%) | 7 (3.5%) |
| $50,000 to $54,999 | 28 (9.7%) | 7 (3.5%) |
| $55,000 to $64,999 | 43 (14.8%) | 4 (2.0%) |
| $65,000 to $74,999 | 21 (7.2%) | 8 (4.0%) |
| $75,000 to $99,999 | 45 (15.5%) | 32 (16.2%) |
| $100,000+ | 11 (3.8%) | 0 (0.0%) |
| Total | 290 (100.0%) | 198 (100.0%) |
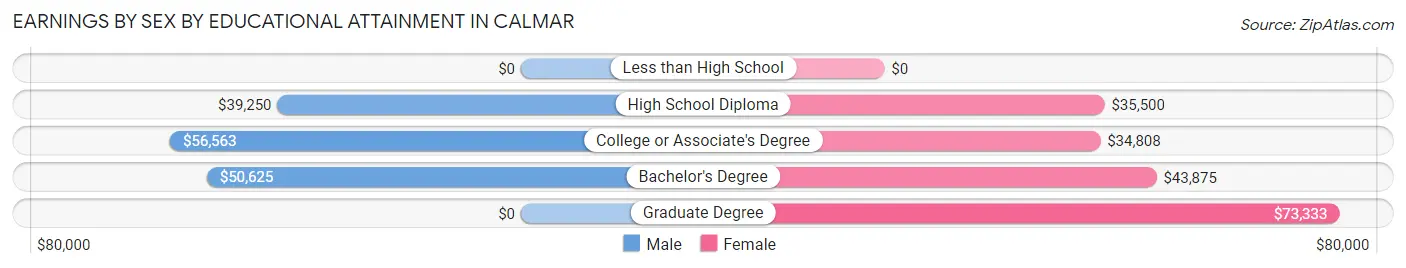
Earnings by Sex by Educational Attainment in Calmar
Average earnings in Calmar are $54,375 for men and $37,500 for women, a difference of 31.0%. Men with an educational attainment of college or associate's degree enjoy the highest average annual earnings of $56,563, while those with high school diploma education earn the least with $39,250. Women with an educational attainment of graduate degree earn the most with the average annual earnings of $73,333, while those with college or associate's degree education have the smallest earnings of $34,808.
| Educational Attainment | Male Income | Female Income |
| Less than High School | - | - |
| High School Diploma | $39,250 | $35,500 |
| College or Associate's Degree | $56,563 | $34,808 |
| Bachelor's Degree | $50,625 | $43,875 |
| Graduate Degree | - | - |
| Total | $54,375 | $37,500 |
Family Income in Calmar
Family Income Brackets in Calmar
According to the Calmar family income data, there are 58 families falling into the $100,000 to $149,999 income range, which is the most common income bracket and makes up 27.0% of all families.
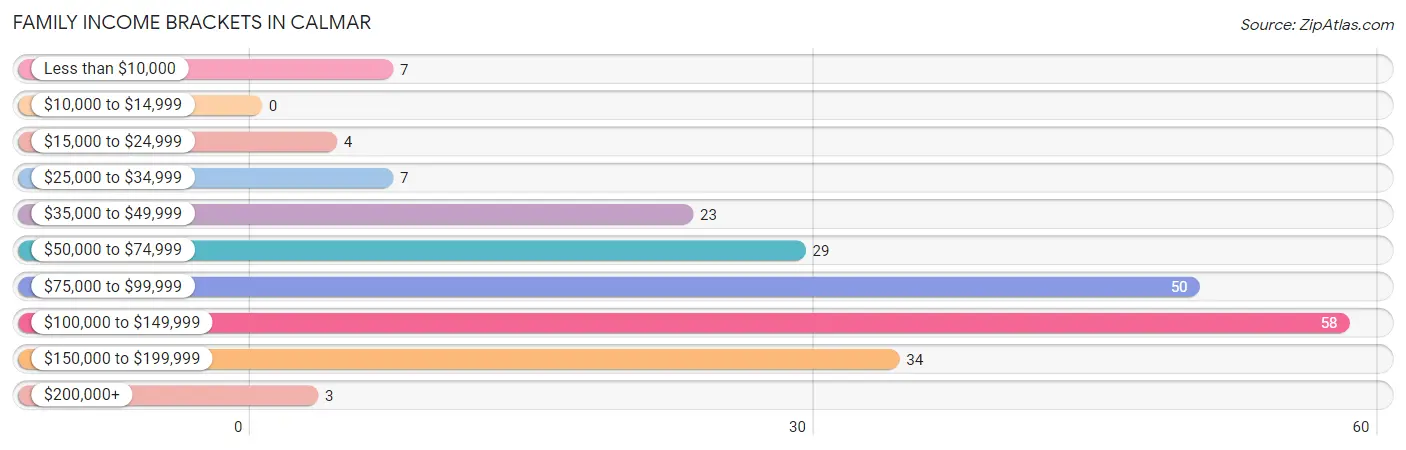
| Income Bracket | # Families | % Families |
| Less than $10,000 | 7 | 3.3% |
| $10,000 to $14,999 | 0 | 0.0% |
| $15,000 to $24,999 | 4 | 1.9% |
| $25,000 to $34,999 | 7 | 3.3% |
| $35,000 to $49,999 | 23 | 10.7% |
| $50,000 to $74,999 | 29 | 13.5% |
| $75,000 to $99,999 | 50 | 23.3% |
| $100,000 to $149,999 | 58 | 27.0% |
| $150,000 to $199,999 | 34 | 15.8% |
| $200,000+ | 3 | 1.4% |
Family Income by Famaliy Size in Calmar
5-person families (24 | 11.2%) account for the highest median family income in Calmar with $126,875 per family, while 2-person families (97 | 45.1%) have the highest median income of $39,375 per family member.
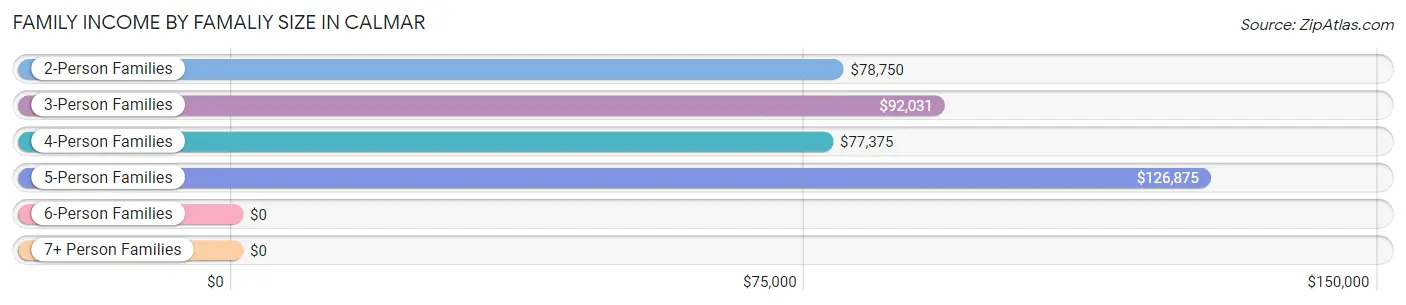
| Income Bracket | # Families | Median Income |
| 2-Person Families | 97 (45.1%) | $78,750 |
| 3-Person Families | 51 (23.7%) | $92,031 |
| 4-Person Families | 43 (20.0%) | $77,375 |
| 5-Person Families | 24 (11.2%) | $126,875 |
| 6-Person Families | 0 (0.0%) | $0 |
| 7+ Person Families | 0 (0.0%) | $0 |
| Total | 215 (100.0%) | $90,781 |
Family Income by Number of Earners in Calmar
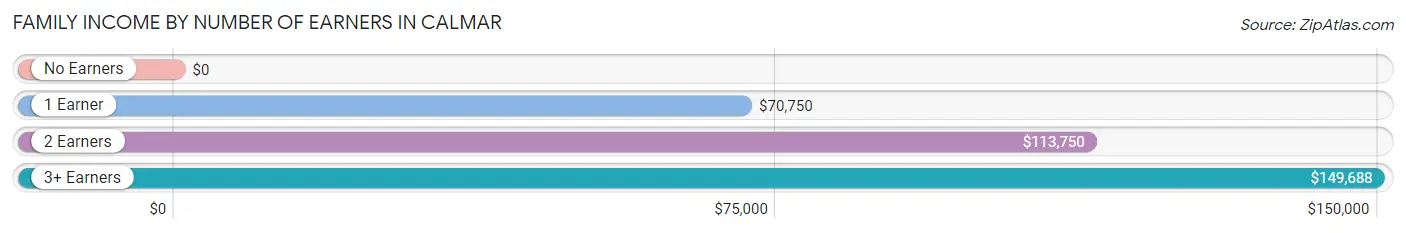
| Number of Earners | # Families | Median Income |
| No Earners | 21 (9.8%) | $0 |
| 1 Earner | 65 (30.2%) | $70,750 |
| 2 Earners | 100 (46.5%) | $113,750 |
| 3+ Earners | 29 (13.5%) | $149,688 |
| Total | 215 (100.0%) | $90,781 |
Household Income in Calmar
Household Income Brackets in Calmar
With 80 households falling in the category, the $100,000 to $149,999 income range is the most frequent in Calmar, accounting for 22.7% of all households. In contrast, only 3 households (0.9%) fall into the $200,000+ income bracket, making it the least populous group.
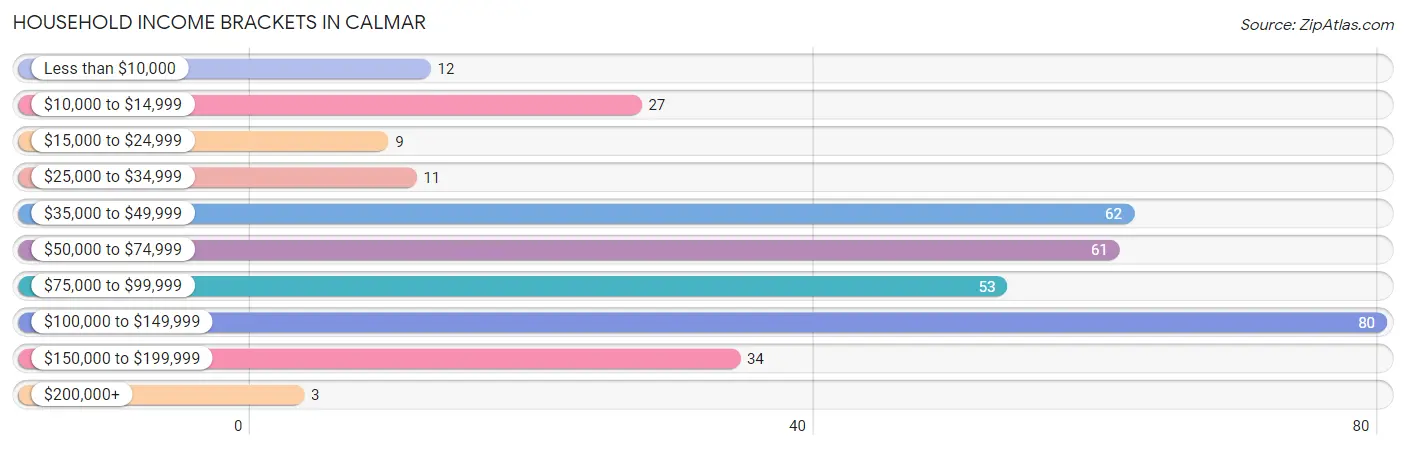
| Income Bracket | # Households | % Households |
| Less than $10,000 | 12 | 3.4% |
| $10,000 to $14,999 | 27 | 7.7% |
| $15,000 to $24,999 | 9 | 2.6% |
| $25,000 to $34,999 | 11 | 3.1% |
| $35,000 to $49,999 | 62 | 17.6% |
| $50,000 to $74,999 | 61 | 17.3% |
| $75,000 to $99,999 | 53 | 15.1% |
| $100,000 to $149,999 | 80 | 22.7% |
| $150,000 to $199,999 | 34 | 9.7% |
| $200,000+ | 3 | 0.9% |
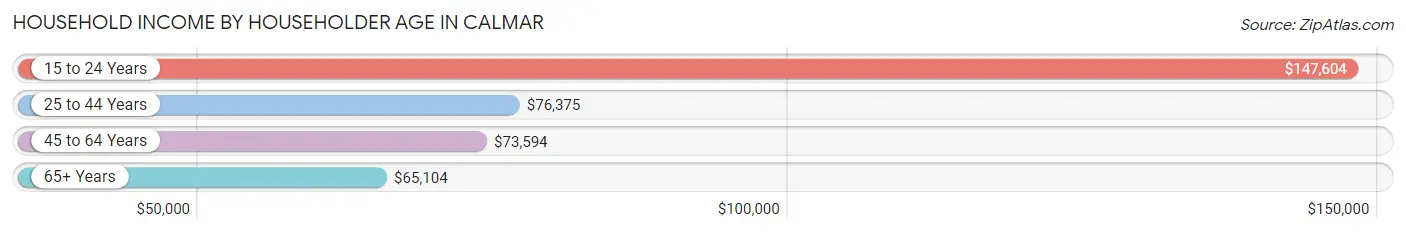
Household Income by Householder Age in Calmar
The median household income in Calmar is $73,500, with the highest median household income of $147,604 found in the 15 to 24 years age bracket for the primary householder. A total of 23 households (6.5%) fall into this category. Meanwhile, the 65+ years age bracket for the primary householder has the lowest median household income of $65,104, with 67 households (19.0%) in this group.
| Income Bracket | # Households | Median Income |
| 15 to 24 Years | 23 (6.5%) | $147,604 |
| 25 to 44 Years | 123 (34.9%) | $76,375 |
| 45 to 64 Years | 139 (39.5%) | $73,594 |
| 65+ Years | 67 (19.0%) | $65,104 |
| Total | 352 (100.0%) | $73,500 |
Poverty in Calmar
Income Below Poverty by Sex and Age in Calmar
With 10.6% poverty level for males and 15.0% for females among the residents of Calmar, 12 to 14 year old males and 5 year old females are the most vulnerable to poverty, with 11 males (55.0%) and 5 females (45.5%) in their respective age groups living below the poverty level.
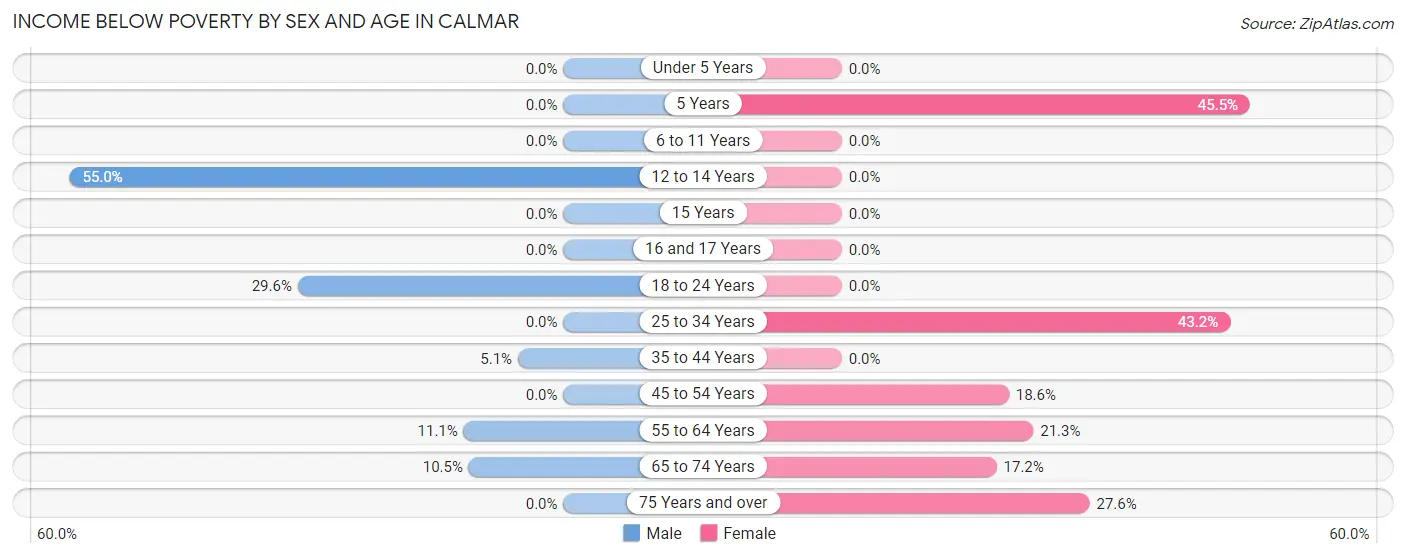
| Age Bracket | Male | Female |
| Under 5 Years | 0 (0.0%) | 0 (0.0%) |
| 5 Years | 0 (0.0%) | 5 (45.5%) |
| 6 to 11 Years | 0 (0.0%) | 0 (0.0%) |
| 12 to 14 Years | 11 (55.0%) | 0 (0.0%) |
| 15 Years | 0 (0.0%) | 0 (0.0%) |
| 16 and 17 Years | 0 (0.0%) | 0 (0.0%) |
| 18 to 24 Years | 21 (29.6%) | 0 (0.0%) |
| 25 to 34 Years | 0 (0.0%) | 16 (43.2%) |
| 35 to 44 Years | 4 (5.1%) | 0 (0.0%) |
| 45 to 54 Years | 0 (0.0%) | 8 (18.6%) |
| 55 to 64 Years | 7 (11.1%) | 16 (21.3%) |
| 65 to 74 Years | 4 (10.5%) | 5 (17.2%) |
| 75 Years and over | 0 (0.0%) | 8 (27.6%) |
| Total | 47 (10.6%) | 58 (15.0%) |
Income Above Poverty by Sex and Age in Calmar
According to the poverty statistics in Calmar, males aged under 5 years and females aged under 5 years are the age groups that are most secure financially, with 100.0% of males and 100.0% of females in these age groups living above the poverty line.
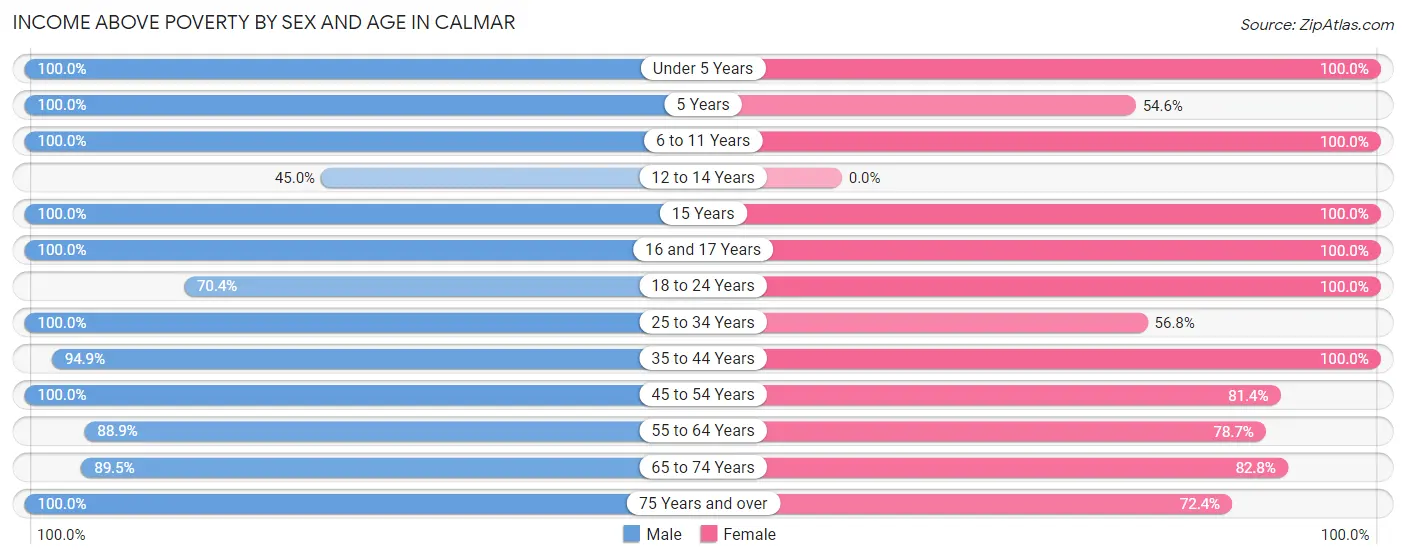
| Age Bracket | Male | Female |
| Under 5 Years | 12 (100.0%) | 34 (100.0%) |
| 5 Years | 6 (100.0%) | 6 (54.5%) |
| 6 to 11 Years | 49 (100.0%) | 41 (100.0%) |
| 12 to 14 Years | 9 (45.0%) | 0 (0.0%) |
| 15 Years | 6 (100.0%) | 5 (100.0%) |
| 16 and 17 Years | 18 (100.0%) | 8 (100.0%) |
| 18 to 24 Years | 50 (70.4%) | 13 (100.0%) |
| 25 to 34 Years | 28 (100.0%) | 21 (56.8%) |
| 35 to 44 Years | 75 (94.9%) | 61 (100.0%) |
| 45 to 54 Years | 45 (100.0%) | 35 (81.4%) |
| 55 to 64 Years | 56 (88.9%) | 59 (78.7%) |
| 65 to 74 Years | 34 (89.5%) | 24 (82.8%) |
| 75 Years and over | 10 (100.0%) | 21 (72.4%) |
| Total | 398 (89.4%) | 328 (85.0%) |
Income Below Poverty Among Married-Couple Families in Calmar
The poverty statistics for married-couple families in Calmar show that 7.1% or 11 of the total 154 families live below the poverty line. Families with 1 or 2 children have the highest poverty rate of 22.9%, comprising of 11 families. On the other hand, families with no children have the lowest poverty rate of 0.0%, which includes 0 families.
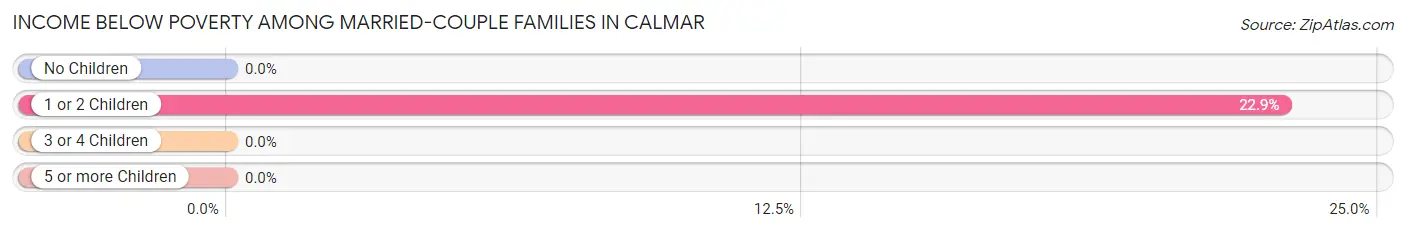
| Children | Above Poverty | Below Poverty |
| No Children | 82 (100.0%) | 0 (0.0%) |
| 1 or 2 Children | 37 (77.1%) | 11 (22.9%) |
| 3 or 4 Children | 24 (100.0%) | 0 (0.0%) |
| 5 or more Children | 0 (0.0%) | 0 (0.0%) |
| Total | 143 (92.9%) | 11 (7.1%) |
Income Below Poverty Among Single-Parent Households in Calmar
| Children | Single Father | Single Mother |
| No Children | 0 (0.0%) | 0 (0.0%) |
| 1 or 2 Children | 0 (0.0%) | 0 (0.0%) |
| 3 or 4 Children | 0 (0.0%) | 0 (0.0%) |
| 5 or more Children | 0 (0.0%) | 0 (0.0%) |
| Total | 0 (0.0%) | 0 (0.0%) |
Income Below Poverty Among Married-Couple vs Single-Parent Households in Calmar
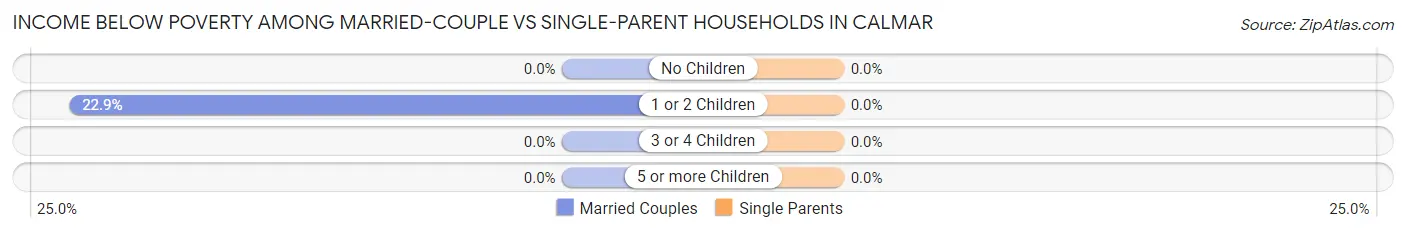
| Children | Married-Couple Families | Single-Parent Households |
| No Children | 0 (0.0%) | 0 (0.0%) |
| 1 or 2 Children | 11 (22.9%) | 0 (0.0%) |
| 3 or 4 Children | 0 (0.0%) | 0 (0.0%) |
| 5 or more Children | 0 (0.0%) | 0 (0.0%) |
| Total | 11 (7.1%) | 0 (0.0%) |
Race in Calmar
The most populous races in Calmar are White / Caucasian (820 | 98.7%), Two or more Races (11 | 1.3%), and Hispanic or Latino (9 | 1.1%).
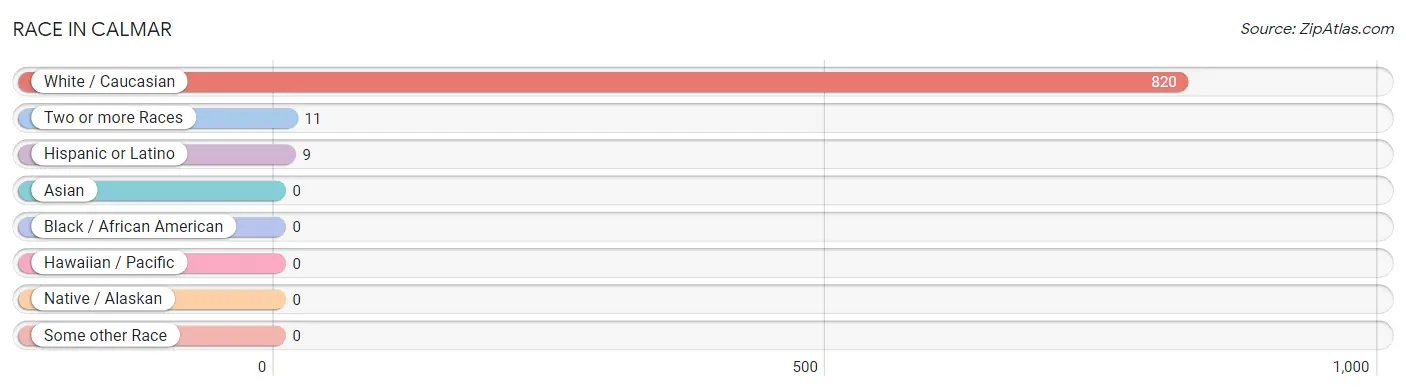
| Race | # Population | % Population |
| Asian | 0 | 0.0% |
| Black / African American | 0 | 0.0% |
| Hawaiian / Pacific | 0 | 0.0% |
| Hispanic or Latino | 9 | 1.1% |
| Native / Alaskan | 0 | 0.0% |
| White / Caucasian | 820 | 98.7% |
| Two or more Races | 11 | 1.3% |
| Some other Race | 0 | 0.0% |
| Total | 831 | 100.0% |
Ancestry in Calmar
The most populous ancestries reported in Calmar are German (435 | 52.3%), Irish (111 | 13.4%), Norwegian (99 | 11.9%), Czech (95 | 11.4%), and English (54 | 6.5%), together accounting for 95.6% of all Calmar residents.
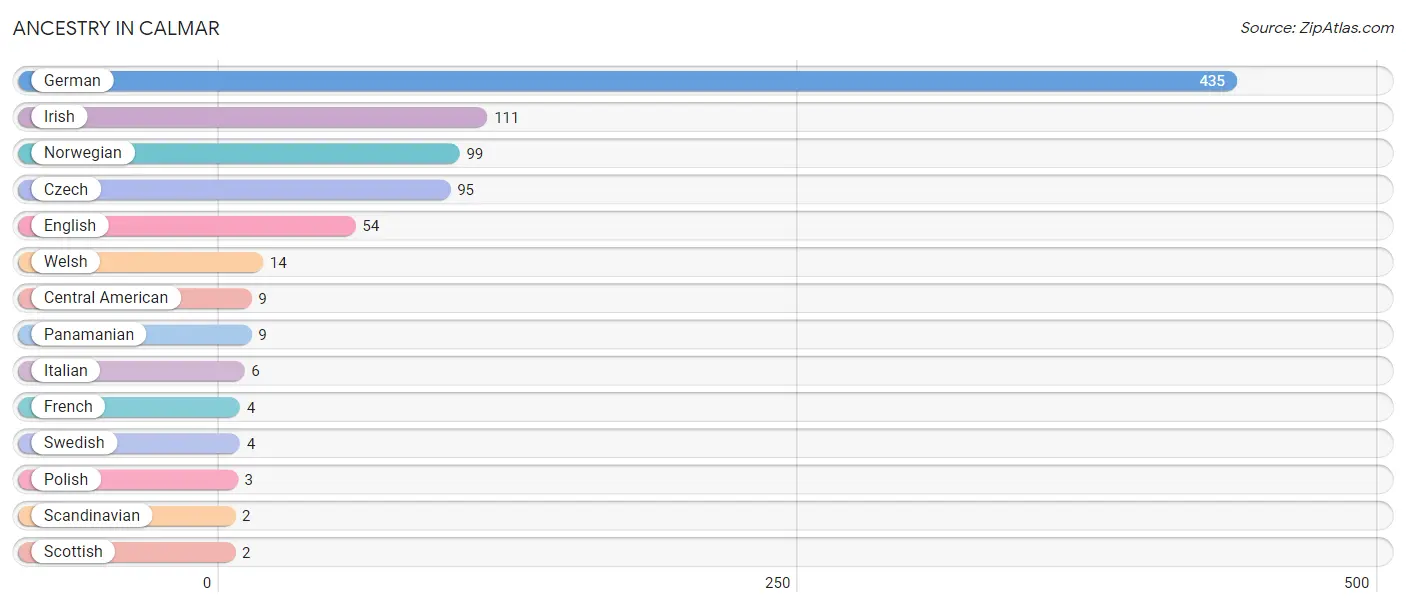
| Ancestry | # Population | % Population |
| Central American | 9 | 1.1% |
| Czech | 95 | 11.4% |
| English | 54 | 6.5% |
| French | 4 | 0.5% |
| German | 435 | 52.3% |
| Irish | 111 | 13.4% |
| Italian | 6 | 0.7% |
| Norwegian | 99 | 11.9% |
| Panamanian | 9 | 1.1% |
| Polish | 3 | 0.4% |
| Scandinavian | 2 | 0.2% |
| Scottish | 2 | 0.2% |
| Swedish | 4 | 0.5% |
| Welsh | 14 | 1.7% | View All 14 Rows |
Immigrants in Calmar

| Immigration Origin | # Population | % Population | View All 0 Rows |
Sex and Age in Calmar
Sex and Age in Calmar
The most populous age groups in Calmar are 15 to 19 Years (79 | 17.7%) for men and 35 to 39 Years (57 | 14.8%) for women.
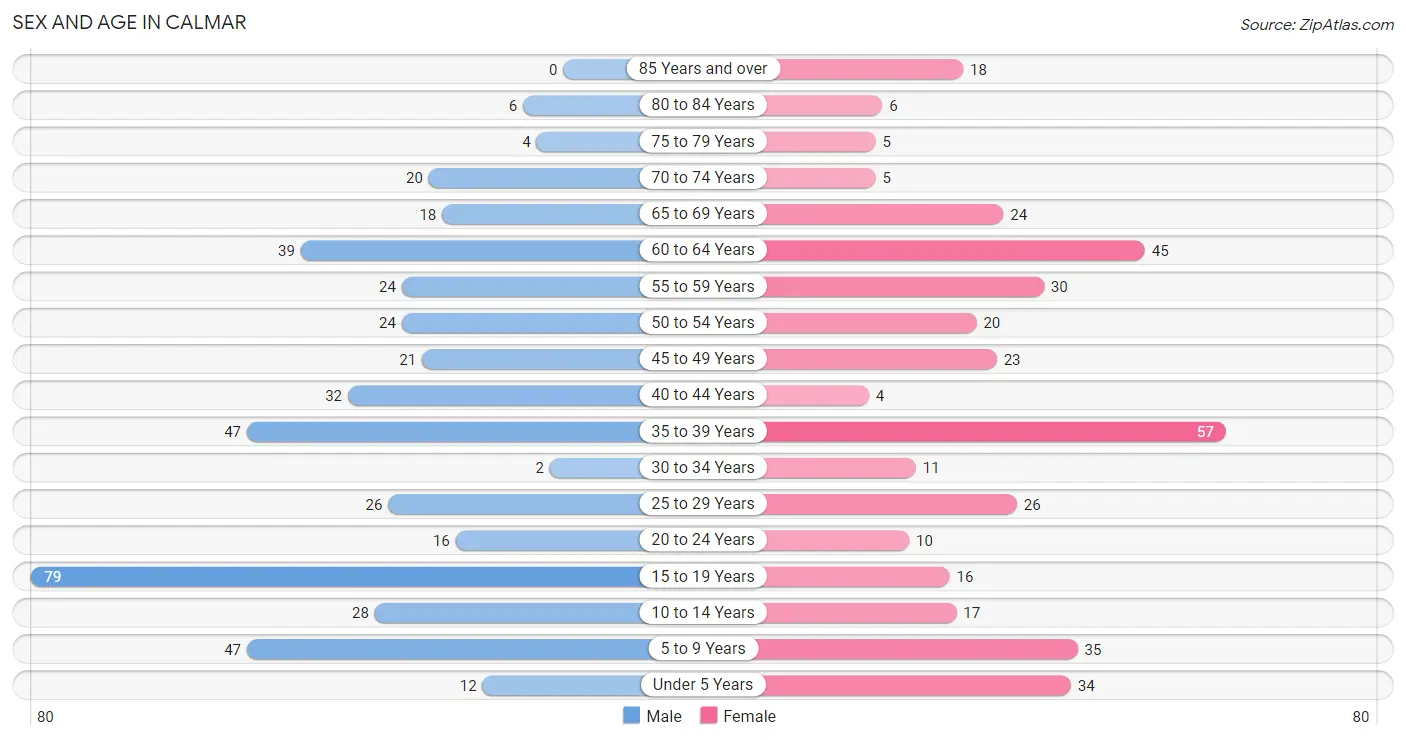
| Age Bracket | Male | Female |
| Under 5 Years | 12 (2.7%) | 34 (8.8%) |
| 5 to 9 Years | 47 (10.6%) | 35 (9.1%) |
| 10 to 14 Years | 28 (6.3%) | 17 (4.4%) |
| 15 to 19 Years | 79 (17.7%) | 16 (4.2%) |
| 20 to 24 Years | 16 (3.6%) | 10 (2.6%) |
| 25 to 29 Years | 26 (5.8%) | 26 (6.7%) |
| 30 to 34 Years | 2 (0.4%) | 11 (2.9%) |
| 35 to 39 Years | 47 (10.6%) | 57 (14.8%) |
| 40 to 44 Years | 32 (7.2%) | 4 (1.0%) |
| 45 to 49 Years | 21 (4.7%) | 23 (6.0%) |
| 50 to 54 Years | 24 (5.4%) | 20 (5.2%) |
| 55 to 59 Years | 24 (5.4%) | 30 (7.8%) |
| 60 to 64 Years | 39 (8.8%) | 45 (11.7%) |
| 65 to 69 Years | 18 (4.0%) | 24 (6.2%) |
| 70 to 74 Years | 20 (4.5%) | 5 (1.3%) |
| 75 to 79 Years | 4 (0.9%) | 5 (1.3%) |
| 80 to 84 Years | 6 (1.3%) | 6 (1.5%) |
| 85 Years and over | 0 (0.0%) | 18 (4.7%) |
| Total | 445 (100.0%) | 386 (100.0%) |
Families and Households in Calmar
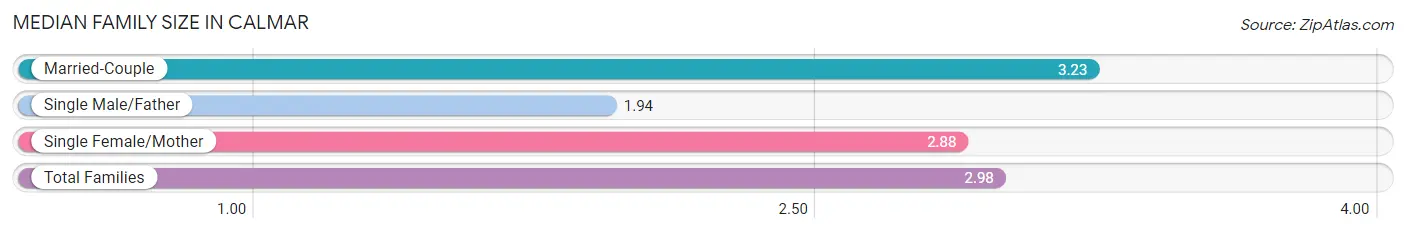
Median Family Size in Calmar
The median family size in Calmar is 2.98 persons per family, with married-couple families (154 | 71.6%) accounting for the largest median family size of 3.23 persons per family. On the other hand, single male/father families (36 | 16.7%) represent the smallest median family size with 1.94 persons per family.
| Family Type | # Families | Family Size |
| Married-Couple | 154 (71.6%) | 3.23 |
| Single Male/Father | 36 (16.7%) | 1.94 |
| Single Female/Mother | 25 (11.6%) | 2.88 |
| Total Families | 215 (100.0%) | 2.98 |
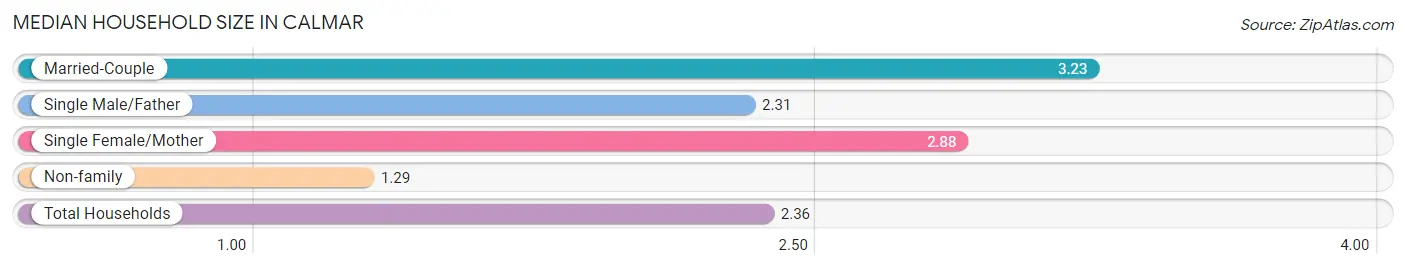
Median Household Size in Calmar
The median household size in Calmar is 2.36 persons per household, with married-couple households (154 | 43.8%) accounting for the largest median household size of 3.23 persons per household. non-family households (137 | 38.9%) represent the smallest median household size with 1.29 persons per household.
| Household Type | # Households | Household Size |
| Married-Couple | 154 (43.8%) | 3.23 |
| Single Male/Father | 36 (10.2%) | 2.31 |
| Single Female/Mother | 25 (7.1%) | 2.88 |
| Non-family | 137 (38.9%) | 1.29 |
| Total Households | 352 (100.0%) | 2.36 |
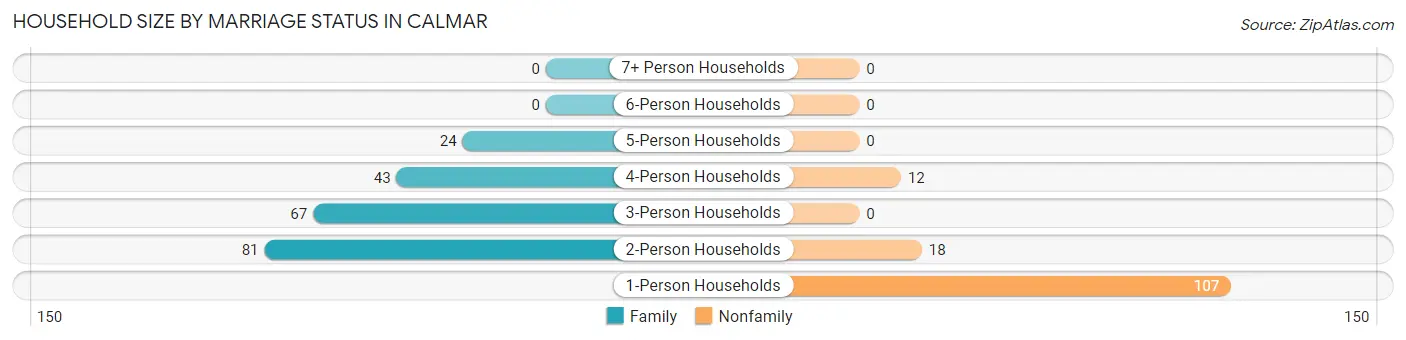
Household Size by Marriage Status in Calmar
Out of a total of 352 households in Calmar, 215 (61.1%) are family households, while 137 (38.9%) are nonfamily households. The most numerous type of family households are 2-person households, comprising 81, and the most common type of nonfamily households are 1-person households, comprising 107.
| Household Size | Family Households | Nonfamily Households |
| 1-Person Households | - | 107 (30.4%) |
| 2-Person Households | 81 (23.0%) | 18 (5.1%) |
| 3-Person Households | 67 (19.0%) | 0 (0.0%) |
| 4-Person Households | 43 (12.2%) | 12 (3.4%) |
| 5-Person Households | 24 (6.8%) | 0 (0.0%) |
| 6-Person Households | 0 (0.0%) | 0 (0.0%) |
| 7+ Person Households | 0 (0.0%) | 0 (0.0%) |
| Total | 215 (61.1%) | 137 (38.9%) |
Female Fertility in Calmar
Fertility by Age in Calmar
Average fertility rate in Calmar is 77.0 births per 1,000 women. Women in the age bracket of 35 to 50 years have the highest fertility rate with 120.0 births per 1,000 women. Women in the age bracket of 35 to 50 years acount for 91.7% of all women with births.
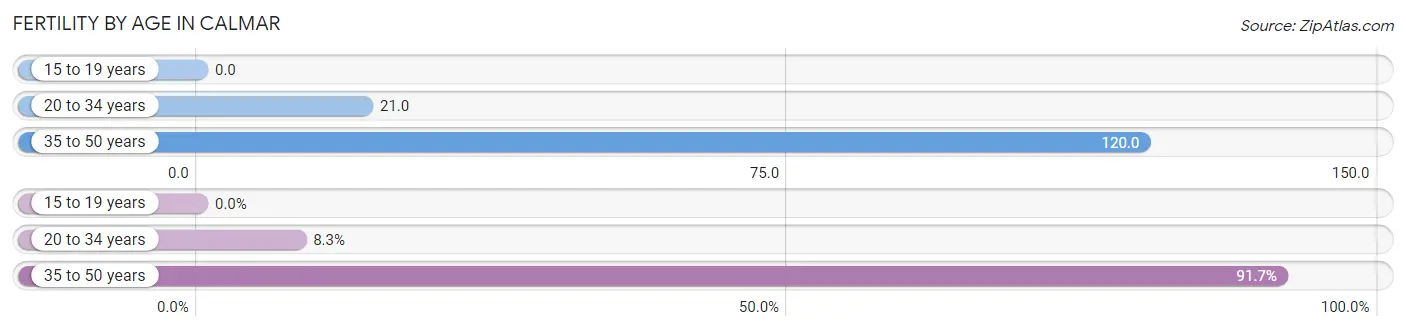
| Age Bracket | Women with Births | Births / 1,000 Women |
| 15 to 19 years | 0 (0.0%) | 0.0 |
| 20 to 34 years | 1 (8.3%) | 21.0 |
| 35 to 50 years | 11 (91.7%) | 120.0 |
| Total | 12 (100.0%) | 77.0 |
Fertility by Age by Marriage Status in Calmar
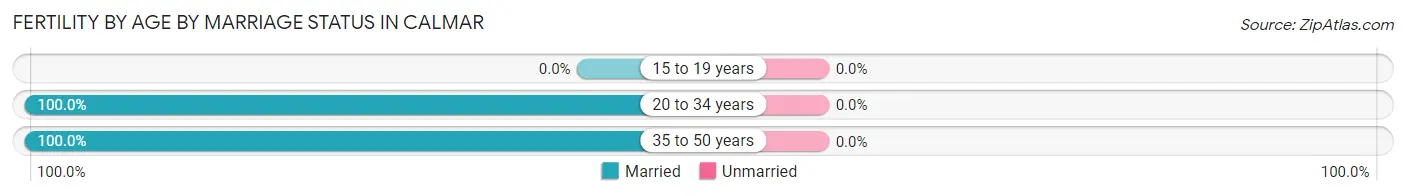
| Age Bracket | Married | Unmarried |
| 15 to 19 years | 0 (0.0%) | 0 (0.0%) |
| 20 to 34 years | 1 (100.0%) | 0 (0.0%) |
| 35 to 50 years | 11 (100.0%) | 0 (0.0%) |
| Total | 12 (100.0%) | 0 (0.0%) |
Fertility by Education in Calmar
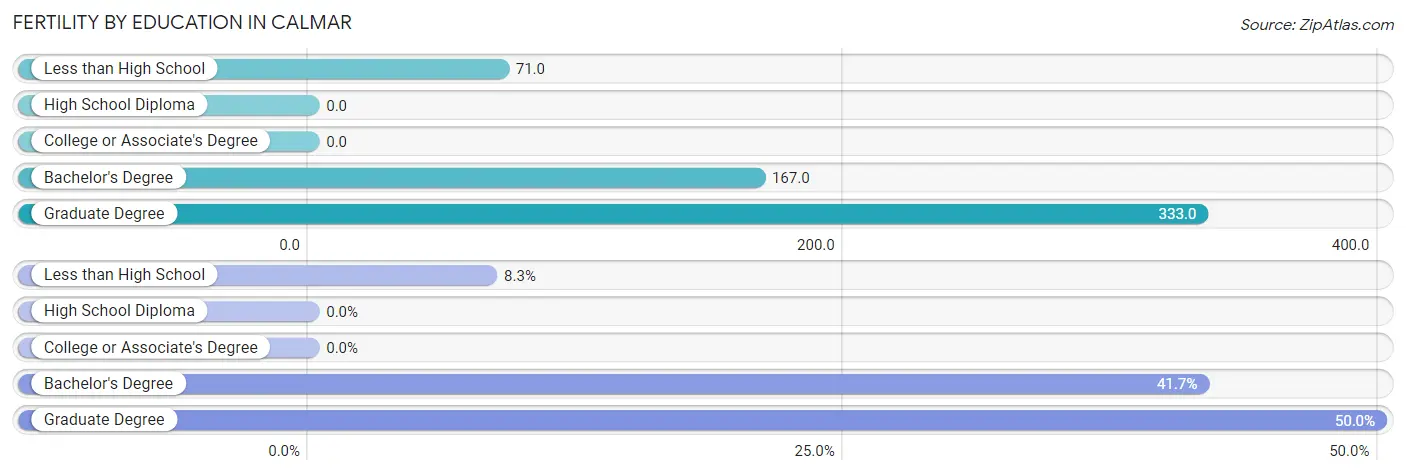
| Educational Attainment | Women with Births | Births / 1,000 Women |
| Less than High School | 1 (8.3%) | 71.0 |
| High School Diploma | 0 (0.0%) | 0.0 |
| College or Associate's Degree | 0 (0.0%) | 0.0 |
| Bachelor's Degree | 5 (41.7%) | 167.0 |
| Graduate Degree | 6 (50.0%) | 333.0 |
| Total | 12 (100.0%) | 77.0 |
Fertility by Education by Marriage Status in Calmar
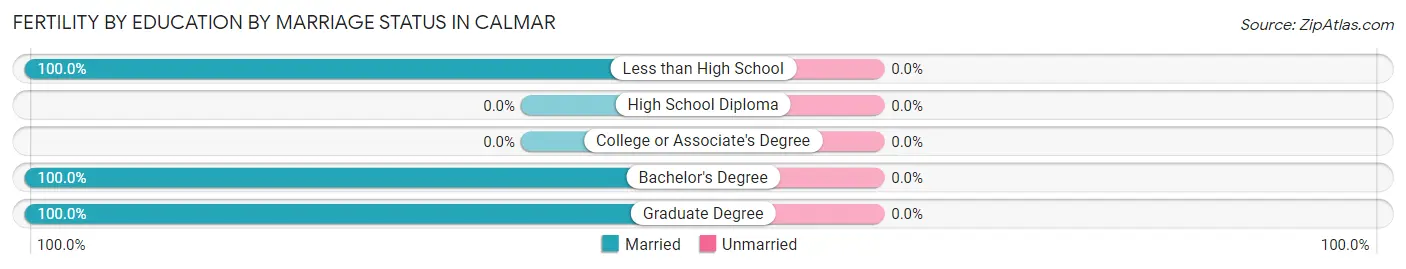
| Educational Attainment | Married | Unmarried |
| Less than High School | 1 (100.0%) | 0 (0.0%) |
| High School Diploma | 0 (0.0%) | 0 (0.0%) |
| College or Associate's Degree | 0 (0.0%) | 0 (0.0%) |
| Bachelor's Degree | 5 (100.0%) | 0 (0.0%) |
| Graduate Degree | 6 (100.0%) | 0 (0.0%) |
| Total | 12 (100.0%) | 0 (0.0%) |
Employment Characteristics in Calmar
Employment by Class of Employer in Calmar
Among the 404 employed individuals in Calmar, private company employees (267 | 66.1%), not-for-profit organizations (46 | 11.4%), and local government employees (46 | 11.4%) make up the most common classes of employment.
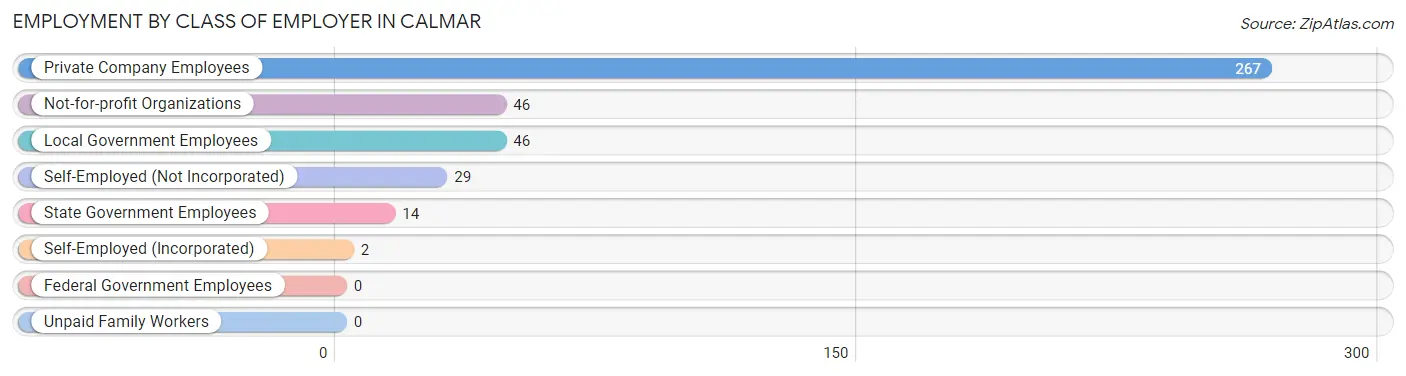
| Employer Class | # Employees | % Employees |
| Private Company Employees | 267 | 66.1% |
| Self-Employed (Incorporated) | 2 | 0.5% |
| Self-Employed (Not Incorporated) | 29 | 7.2% |
| Not-for-profit Organizations | 46 | 11.4% |
| Local Government Employees | 46 | 11.4% |
| State Government Employees | 14 | 3.5% |
| Federal Government Employees | 0 | 0.0% |
| Unpaid Family Workers | 0 | 0.0% |
| Total | 404 | 100.0% |
Employment Status by Age in Calmar
According to the labor force statistics for Calmar, out of the total population over 16 years of age (647), 64.8% or 419 individuals are in the labor force, with 0.2% or 1 of them unemployed. The age group with the highest labor force participation rate is 25 to 29 years, with 100.0% or 52 individuals in the labor force. Within the labor force, the 25 to 29 years age range has the highest percentage of unemployed individuals, with 1.9% or 1 of them being unemployed.
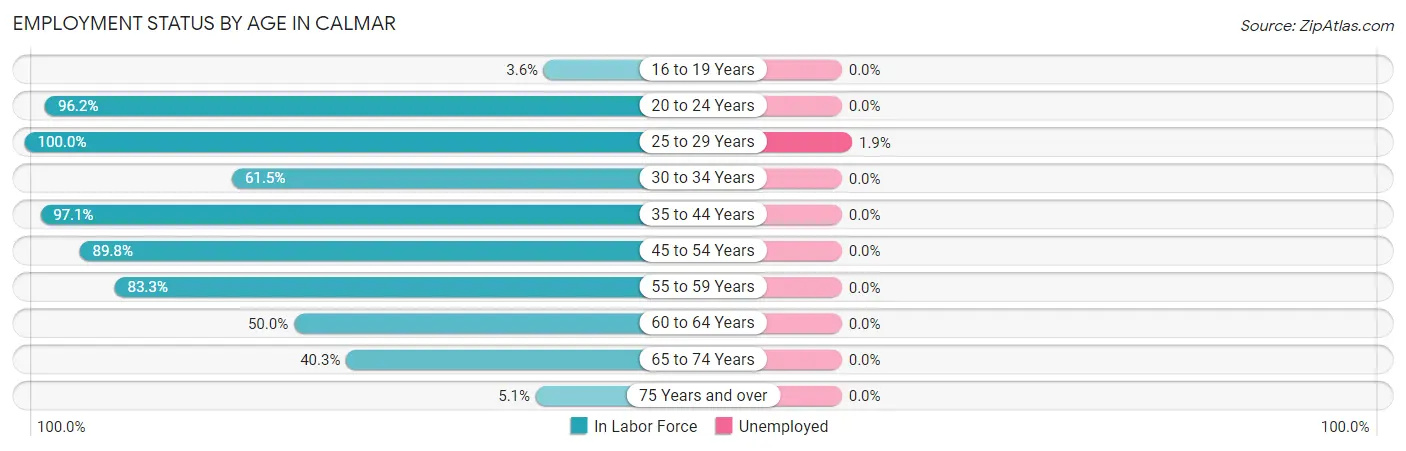
| Age Bracket | In Labor Force | Unemployed |
| 16 to 19 Years | 3 (3.6%) | 0 (0.0%) |
| 20 to 24 Years | 25 (96.2%) | 0 (0.0%) |
| 25 to 29 Years | 52 (100.0%) | 1 (1.9%) |
| 30 to 34 Years | 8 (61.5%) | 0 (0.0%) |
| 35 to 44 Years | 136 (97.1%) | 0 (0.0%) |
| 45 to 54 Years | 79 (89.8%) | 0 (0.0%) |
| 55 to 59 Years | 45 (83.3%) | 0 (0.0%) |
| 60 to 64 Years | 42 (50.0%) | 0 (0.0%) |
| 65 to 74 Years | 27 (40.3%) | 0 (0.0%) |
| 75 Years and over | 2 (5.1%) | 0 (0.0%) |
| Total | 419 (64.8%) | 1 (0.2%) |
Employment Status by Educational Attainment in Calmar
According to labor force statistics for Calmar, 84.0% of individuals (362) out of the total population between 25 and 64 years of age (431) are in the labor force, with 0.3% or 1 of them being unemployed. The group with the highest labor force participation rate are those with the educational attainment of bachelor's degree or higher, with 94.5% or 103 individuals in the labor force. Within the labor force, individuals with less than high school education have the highest percentage of unemployment, with 14.3% or 1 of them being unemployed.
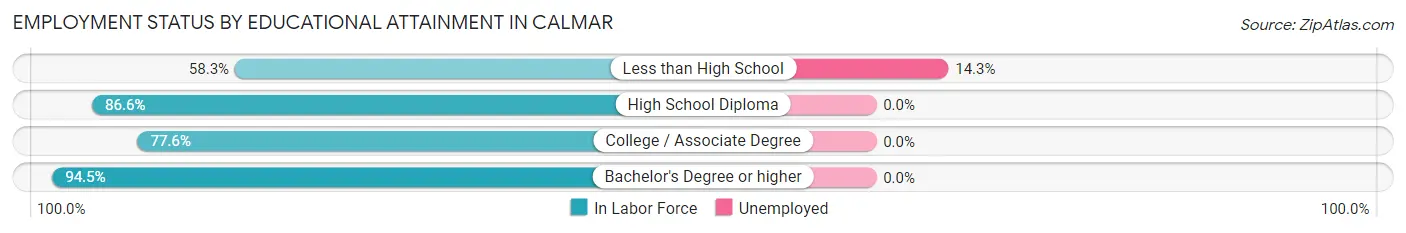
| Educational Attainment | In Labor Force | Unemployed |
| Less than High School | 7 (58.3%) | 2 (14.3%) |
| High School Diploma | 110 (86.6%) | 0 (0.0%) |
| College / Associate Degree | 142 (77.6%) | 0 (0.0%) |
| Bachelor's Degree or higher | 103 (94.5%) | 0 (0.0%) |
| Total | 362 (84.0%) | 1 (0.3%) |
Employment Occupations by Sex in Calmar
Management, Business, Science and Arts Occupations
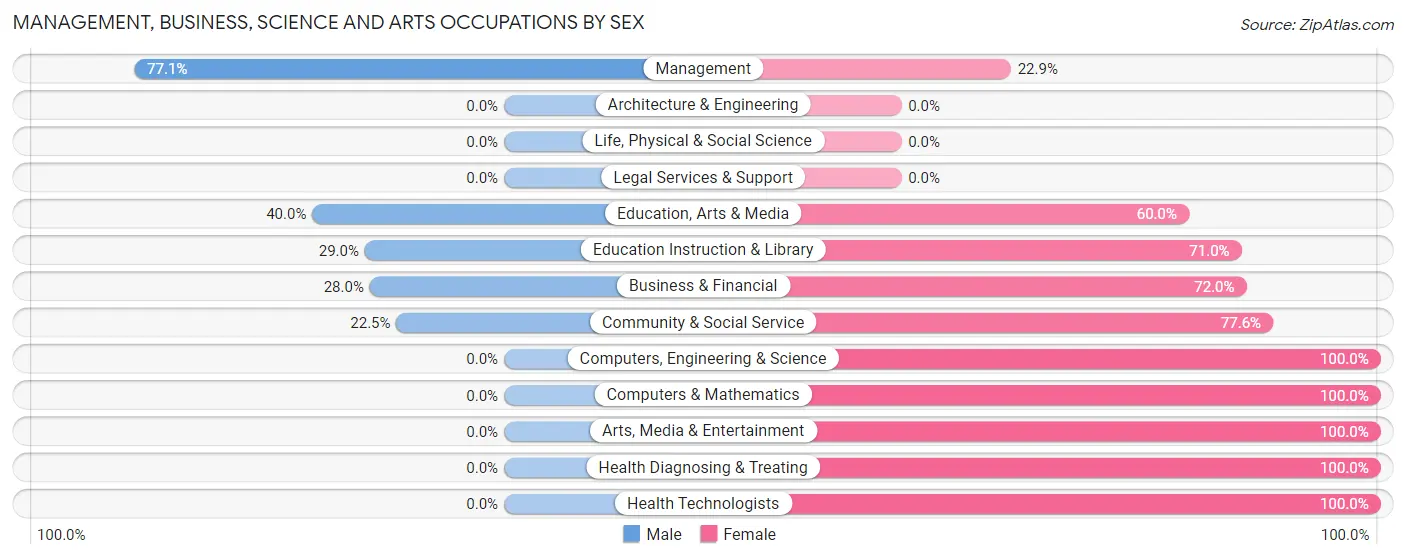
The most common Management, Business, Science and Arts occupations in Calmar are Community & Social Service (49 | 11.7%), Health Diagnosing & Treating (43 | 10.3%), Management (35 | 8.4%), Education Instruction & Library (31 | 7.4%), and Business & Financial (25 | 6.0%).
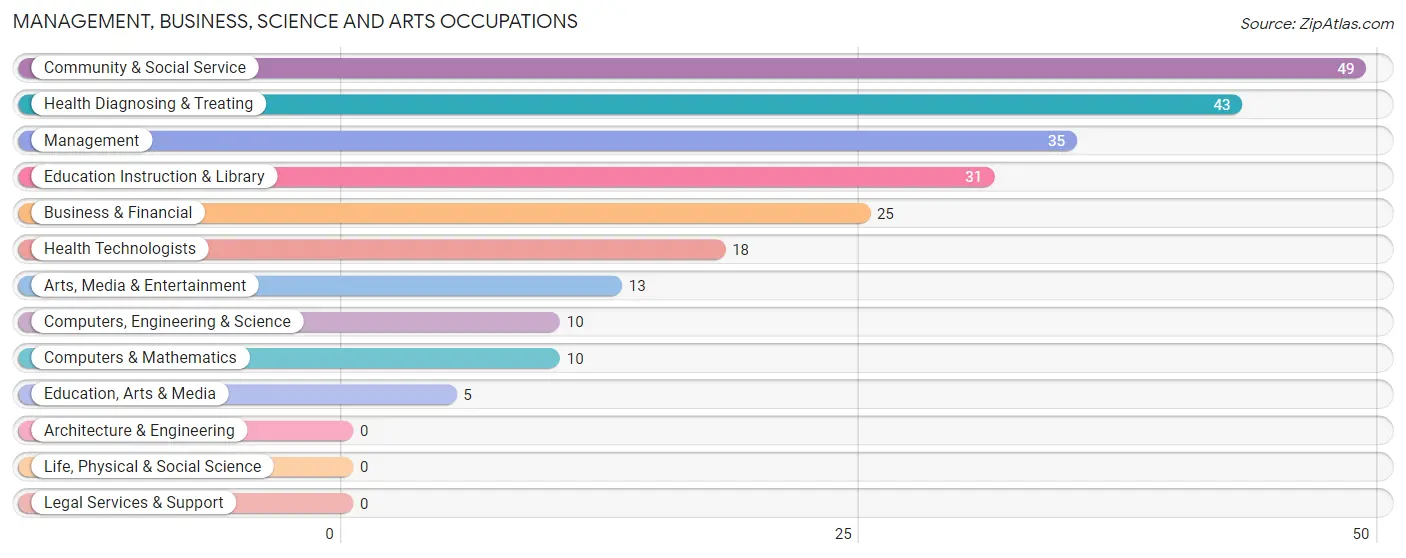
Management, Business, Science and Arts Occupations by Sex
Within the Management, Business, Science and Arts occupations in Calmar, the most male-oriented occupations are Management (77.1%), Education, Arts & Media (40.0%), and Education Instruction & Library (29.0%), while the most female-oriented occupations are Computers, Engineering & Science (100.0%), Computers & Mathematics (100.0%), and Arts, Media & Entertainment (100.0%).
| Occupation | Male | Female |
| Management | 27 (77.1%) | 8 (22.9%) |
| Business & Financial | 7 (28.0%) | 18 (72.0%) |
| Computers, Engineering & Science | 0 (0.0%) | 10 (100.0%) |
| Computers & Mathematics | 0 (0.0%) | 10 (100.0%) |
| Architecture & Engineering | 0 (0.0%) | 0 (0.0%) |
| Life, Physical & Social Science | 0 (0.0%) | 0 (0.0%) |
| Community & Social Service | 11 (22.5%) | 38 (77.5%) |
| Education, Arts & Media | 2 (40.0%) | 3 (60.0%) |
| Legal Services & Support | 0 (0.0%) | 0 (0.0%) |
| Education Instruction & Library | 9 (29.0%) | 22 (71.0%) |
| Arts, Media & Entertainment | 0 (0.0%) | 13 (100.0%) |
| Health Diagnosing & Treating | 0 (0.0%) | 43 (100.0%) |
| Health Technologists | 0 (0.0%) | 18 (100.0%) |
| Total (Category) | 45 (27.8%) | 117 (72.2%) |
| Total (Overall) | 226 (54.1%) | 192 (45.9%) |
Services Occupations
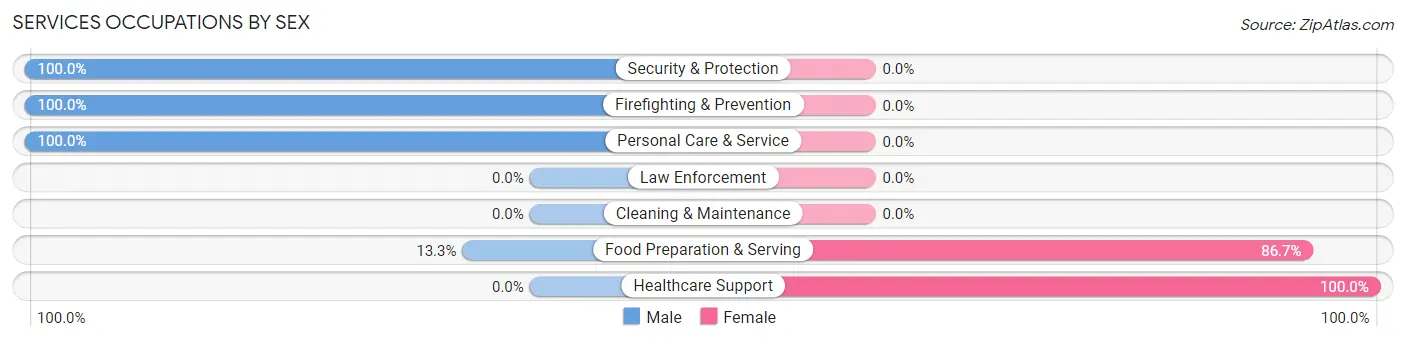
The most common Services occupations in Calmar are Food Preparation & Serving (15 | 3.6%), Healthcare Support (6 | 1.4%), Personal Care & Service (4 | 1.0%), Security & Protection (3 | 0.7%), and Firefighting & Prevention (3 | 0.7%).

Services Occupations by Sex
Within the Services occupations in Calmar, the most male-oriented occupations are Security & Protection (100.0%), Firefighting & Prevention (100.0%), and Personal Care & Service (100.0%), while the most female-oriented occupations are Healthcare Support (100.0%), and Food Preparation & Serving (86.7%).
| Occupation | Male | Female |
| Healthcare Support | 0 (0.0%) | 6 (100.0%) |
| Security & Protection | 3 (100.0%) | 0 (0.0%) |
| Firefighting & Prevention | 3 (100.0%) | 0 (0.0%) |
| Law Enforcement | 0 (0.0%) | 0 (0.0%) |
| Food Preparation & Serving | 2 (13.3%) | 13 (86.7%) |
| Cleaning & Maintenance | 0 (0.0%) | 0 (0.0%) |
| Personal Care & Service | 4 (100.0%) | 0 (0.0%) |
| Total (Category) | 9 (32.1%) | 19 (67.9%) |
| Total (Overall) | 226 (54.1%) | 192 (45.9%) |
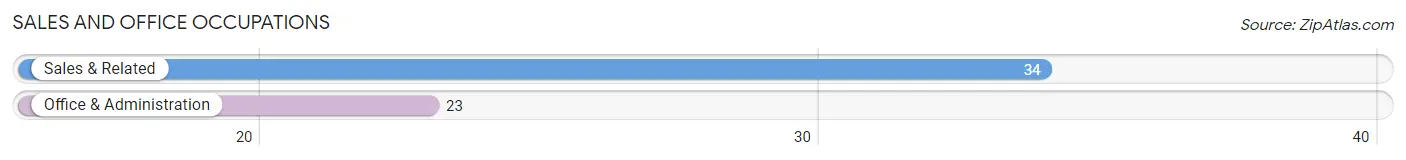
Sales and Office Occupations
The most common Sales and Office occupations in Calmar are Sales & Related (34 | 8.1%), and Office & Administration (23 | 5.5%).
Sales and Office Occupations by Sex
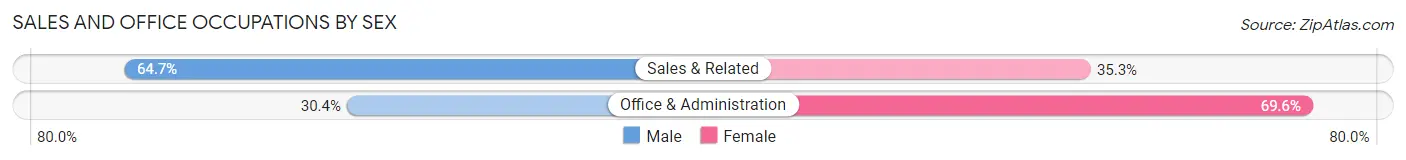
| Occupation | Male | Female |
| Sales & Related | 22 (64.7%) | 12 (35.3%) |
| Office & Administration | 7 (30.4%) | 16 (69.6%) |
| Total (Category) | 29 (50.9%) | 28 (49.1%) |
| Total (Overall) | 226 (54.1%) | 192 (45.9%) |
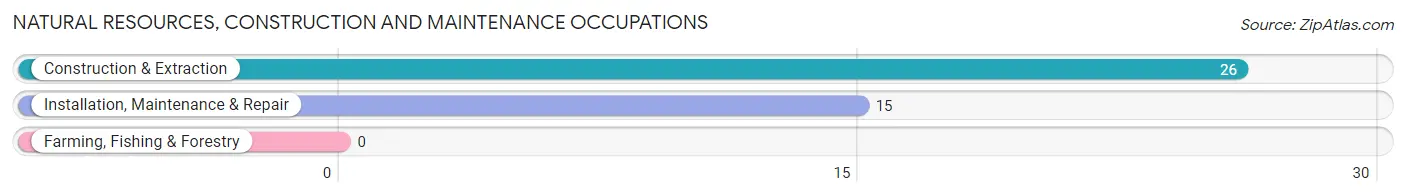
Natural Resources, Construction and Maintenance Occupations
The most common Natural Resources, Construction and Maintenance occupations in Calmar are Construction & Extraction (26 | 6.2%), and Installation, Maintenance & Repair (15 | 3.6%).
Natural Resources, Construction and Maintenance Occupations by Sex
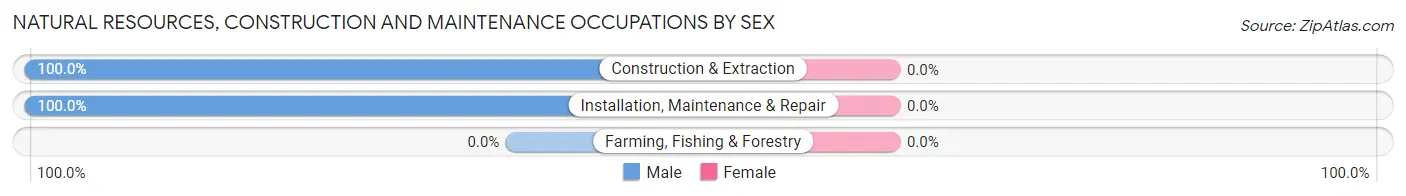
| Occupation | Male | Female |
| Farming, Fishing & Forestry | 0 (0.0%) | 0 (0.0%) |
| Construction & Extraction | 26 (100.0%) | 0 (0.0%) |
| Installation, Maintenance & Repair | 15 (100.0%) | 0 (0.0%) |
| Total (Category) | 41 (100.0%) | 0 (0.0%) |
| Total (Overall) | 226 (54.1%) | 192 (45.9%) |
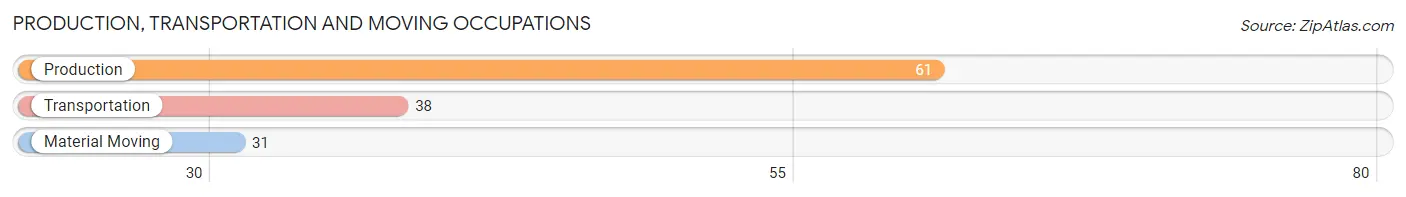
Production, Transportation and Moving Occupations
The most common Production, Transportation and Moving occupations in Calmar are Production (61 | 14.6%), Transportation (38 | 9.1%), and Material Moving (31 | 7.4%).
Production, Transportation and Moving Occupations by Sex
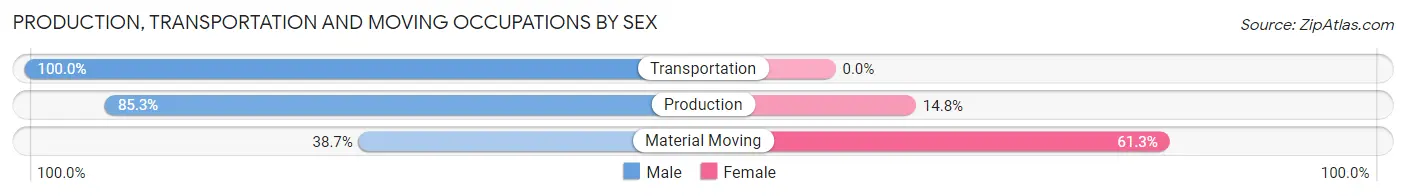
| Occupation | Male | Female |
| Production | 52 (85.3%) | 9 (14.7%) |
| Transportation | 38 (100.0%) | 0 (0.0%) |
| Material Moving | 12 (38.7%) | 19 (61.3%) |
| Total (Category) | 102 (78.5%) | 28 (21.5%) |
| Total (Overall) | 226 (54.1%) | 192 (45.9%) |
Employment Industries by Sex in Calmar
Employment Industries in Calmar
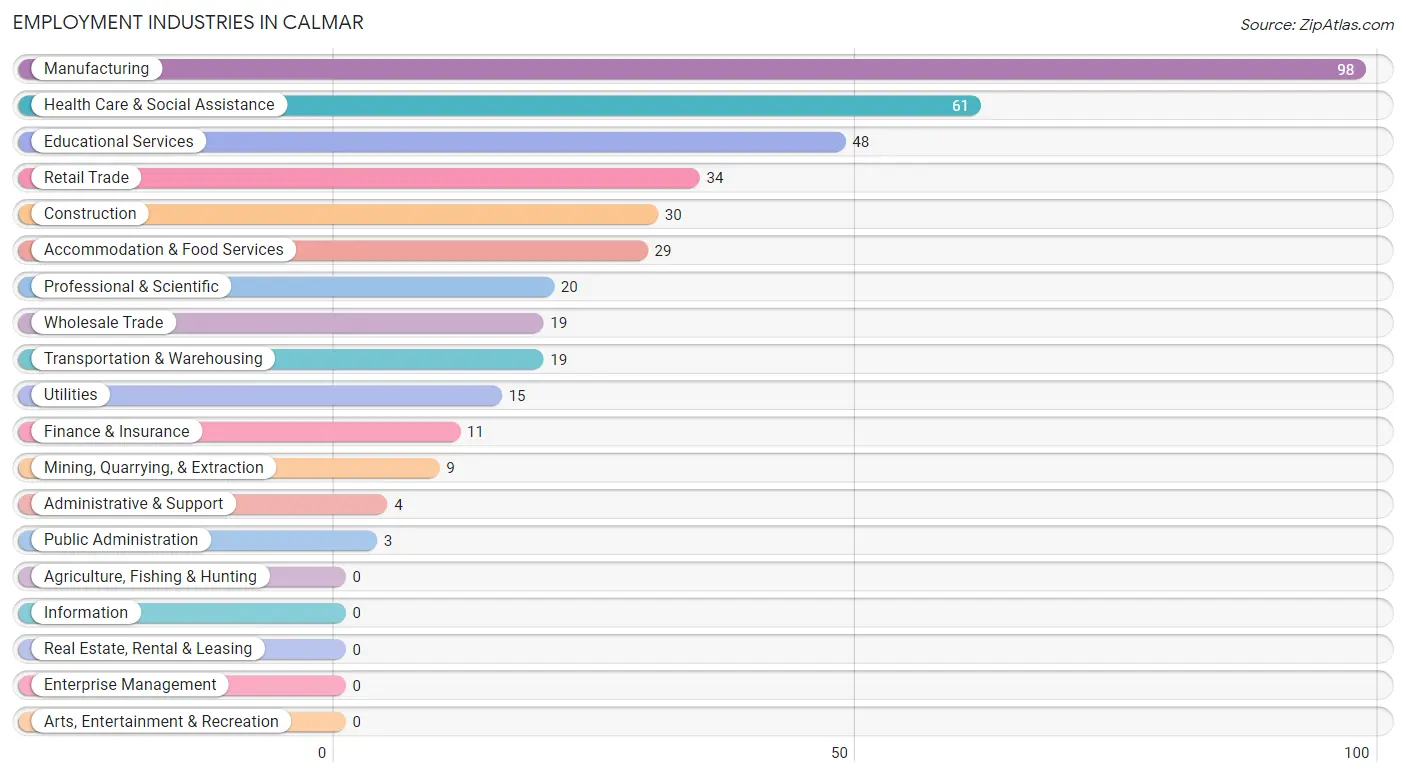
The major employment industries in Calmar include Manufacturing (98 | 23.4%), Health Care & Social Assistance (61 | 14.6%), Educational Services (48 | 11.5%), Retail Trade (34 | 8.1%), and Construction (30 | 7.2%).
Employment Industries by Sex in Calmar
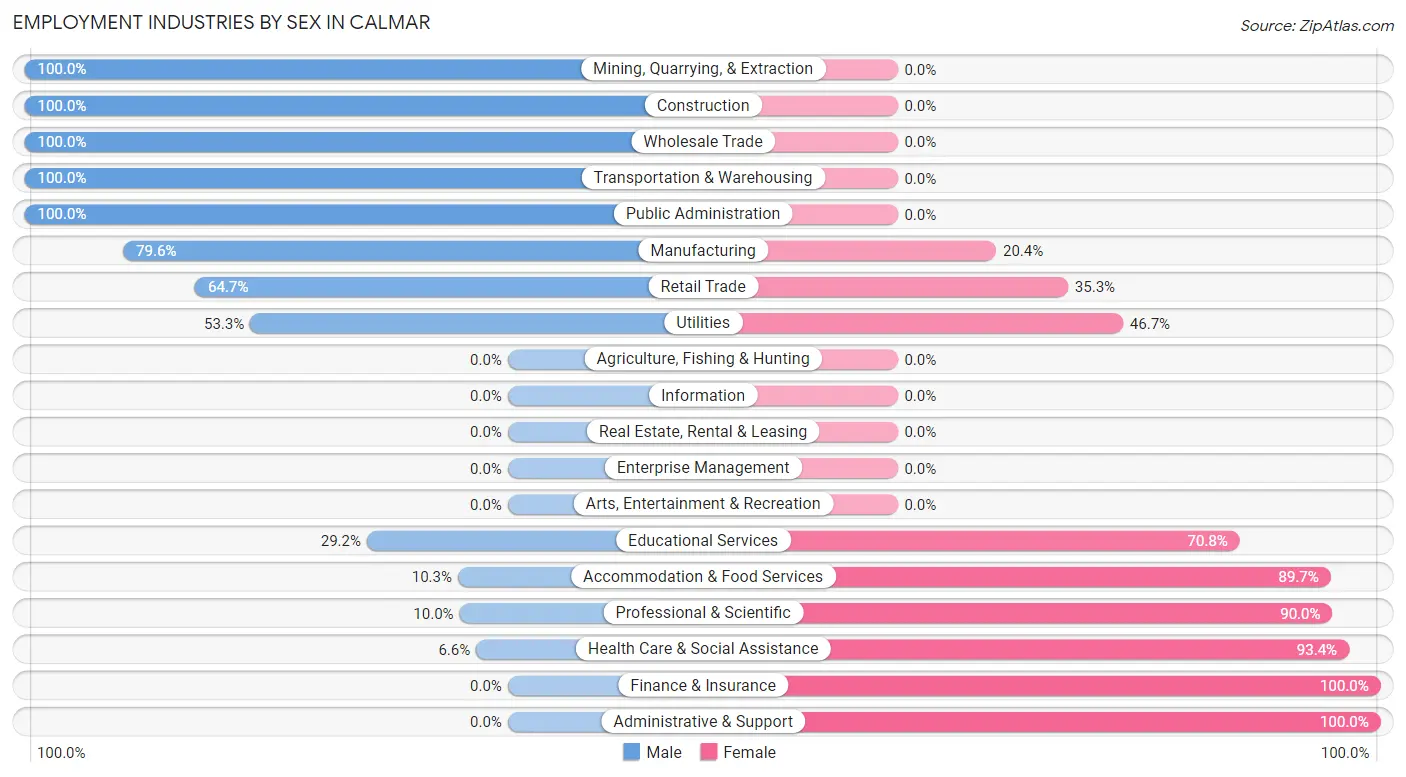
The Calmar industries that see more men than women are Mining, Quarrying, & Extraction (100.0%), Construction (100.0%), and Wholesale Trade (100.0%), whereas the industries that tend to have a higher number of women are Finance & Insurance (100.0%), Administrative & Support (100.0%), and Health Care & Social Assistance (93.4%).
| Industry | Male | Female |
| Agriculture, Fishing & Hunting | 0 (0.0%) | 0 (0.0%) |
| Mining, Quarrying, & Extraction | 9 (100.0%) | 0 (0.0%) |
| Construction | 30 (100.0%) | 0 (0.0%) |
| Manufacturing | 78 (79.6%) | 20 (20.4%) |
| Wholesale Trade | 19 (100.0%) | 0 (0.0%) |
| Retail Trade | 22 (64.7%) | 12 (35.3%) |
| Transportation & Warehousing | 19 (100.0%) | 0 (0.0%) |
| Utilities | 8 (53.3%) | 7 (46.7%) |
| Information | 0 (0.0%) | 0 (0.0%) |
| Finance & Insurance | 0 (0.0%) | 11 (100.0%) |
| Real Estate, Rental & Leasing | 0 (0.0%) | 0 (0.0%) |
| Professional & Scientific | 2 (10.0%) | 18 (90.0%) |
| Enterprise Management | 0 (0.0%) | 0 (0.0%) |
| Administrative & Support | 0 (0.0%) | 4 (100.0%) |
| Educational Services | 14 (29.2%) | 34 (70.8%) |
| Health Care & Social Assistance | 4 (6.6%) | 57 (93.4%) |
| Arts, Entertainment & Recreation | 0 (0.0%) | 0 (0.0%) |
| Accommodation & Food Services | 3 (10.3%) | 26 (89.7%) |
| Public Administration | 3 (100.0%) | 0 (0.0%) |
| Total | 226 (54.1%) | 192 (45.9%) |
Education in Calmar
School Enrollment in Calmar
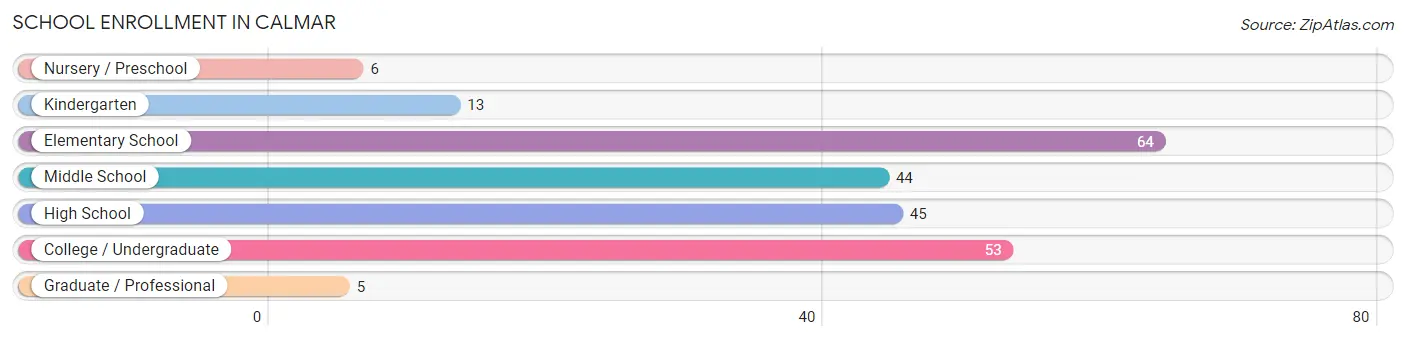
The most common levels of schooling among the 230 students in Calmar are elementary school (64 | 27.8%), college / undergraduate (53 | 23.0%), and high school (45 | 19.6%).
| School Level | # Students | % Students |
| Nursery / Preschool | 6 | 2.6% |
| Kindergarten | 13 | 5.7% |
| Elementary School | 64 | 27.8% |
| Middle School | 44 | 19.1% |
| High School | 45 | 19.6% |
| College / Undergraduate | 53 | 23.0% |
| Graduate / Professional | 5 | 2.2% |
| Total | 230 | 100.0% |
School Enrollment by Age by Funding Source in Calmar
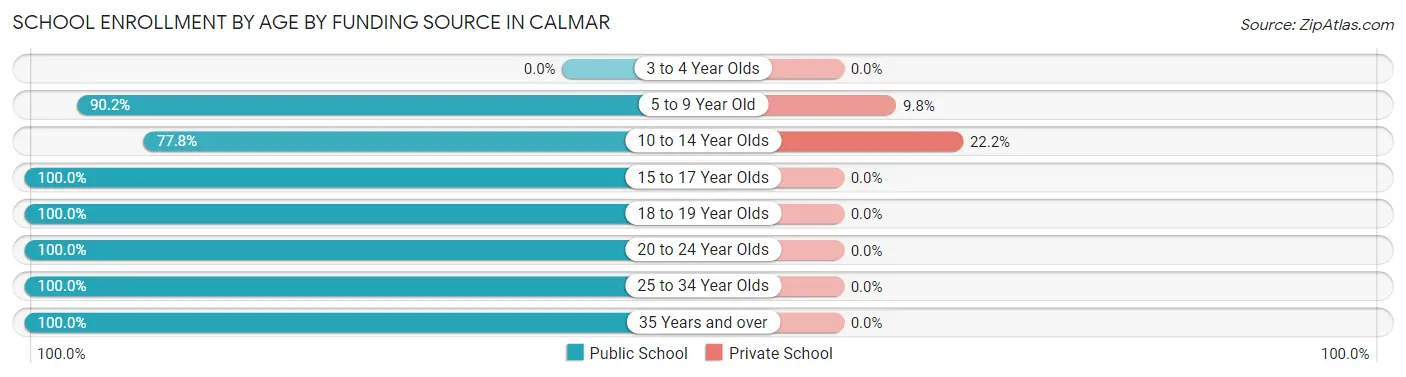
Out of a total of 230 students who are enrolled in schools in Calmar, 18 (7.8%) attend a private institution, while the remaining 212 (92.2%) are enrolled in public schools. The age group of 10 to 14 year olds has the highest likelihood of being enrolled in private schools, with 10 (22.2% in the age bracket) enrolled. Conversely, the age group of 15 to 17 year olds has the lowest likelihood of being enrolled in a private school, with 37 (100.0% in the age bracket) attending a public institution.
| Age Bracket | Public School | Private School |
| 3 to 4 Year Olds | 0 (0.0%) | 0 (0.0%) |
| 5 to 9 Year Old | 74 (90.2%) | 8 (9.8%) |
| 10 to 14 Year Olds | 35 (77.8%) | 10 (22.2%) |
| 15 to 17 Year Olds | 37 (100.0%) | 0 (0.0%) |
| 18 to 19 Year Olds | 50 (100.0%) | 0 (0.0%) |
| 20 to 24 Year Olds | 6 (100.0%) | 0 (0.0%) |
| 25 to 34 Year Olds | 5 (100.0%) | 0 (0.0%) |
| 35 Years and over | 5 (100.0%) | 0 (0.0%) |
| Total | 212 (92.2%) | 18 (7.8%) |
Educational Attainment by Field of Study in Calmar
Business (42 | 29.6%), education (29 | 20.4%), science & technology (17 | 12.0%), bio, nature & agricultural (14 | 9.9%), and social sciences (13 | 9.1%) are the most common fields of study among 142 individuals in Calmar who have obtained a bachelor's degree or higher.
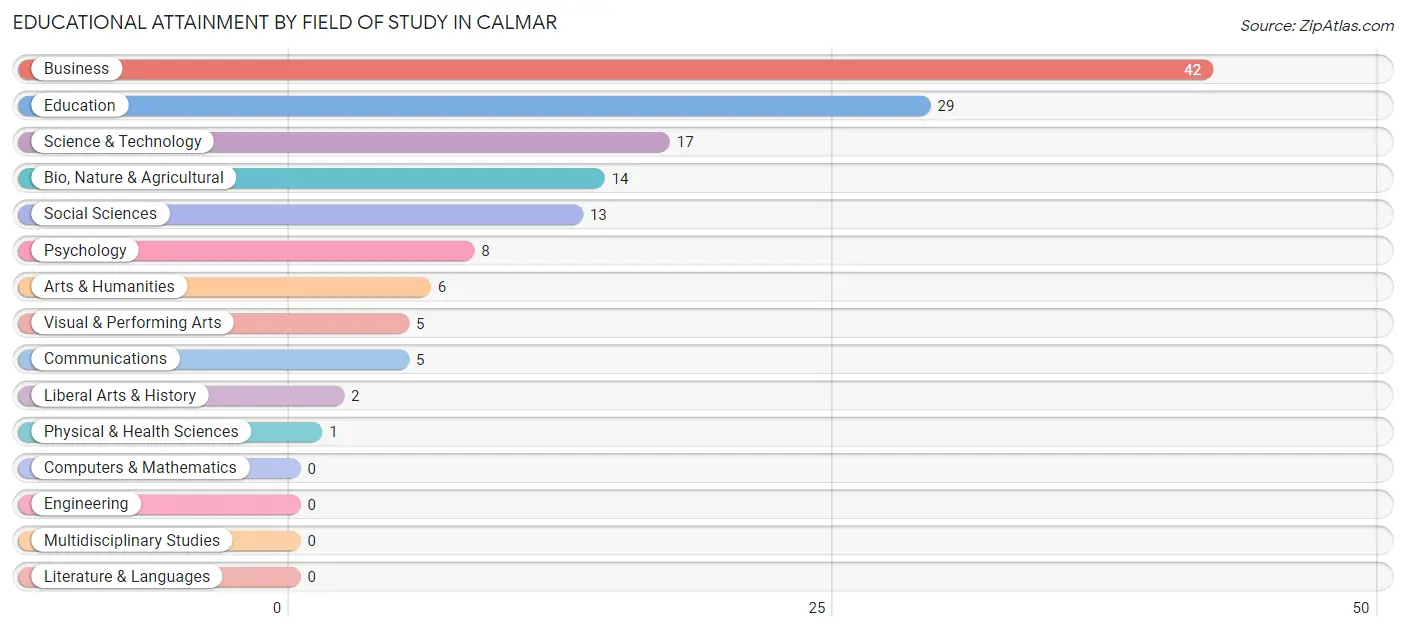
| Field of Study | # Graduates | % Graduates |
| Computers & Mathematics | 0 | 0.0% |
| Bio, Nature & Agricultural | 14 | 9.9% |
| Physical & Health Sciences | 1 | 0.7% |
| Psychology | 8 | 5.6% |
| Social Sciences | 13 | 9.1% |
| Engineering | 0 | 0.0% |
| Multidisciplinary Studies | 0 | 0.0% |
| Science & Technology | 17 | 12.0% |
| Business | 42 | 29.6% |
| Education | 29 | 20.4% |
| Literature & Languages | 0 | 0.0% |
| Liberal Arts & History | 2 | 1.4% |
| Visual & Performing Arts | 5 | 3.5% |
| Communications | 5 | 3.5% |
| Arts & Humanities | 6 | 4.2% |
| Total | 142 | 100.0% |
Transportation & Commute in Calmar
Vehicle Availability by Sex in Calmar
The most prevalent vehicle ownership categories in Calmar are males with 2 vehicles (83, accounting for 39.2%) and females with 2 vehicles (89, making up 43.2%).
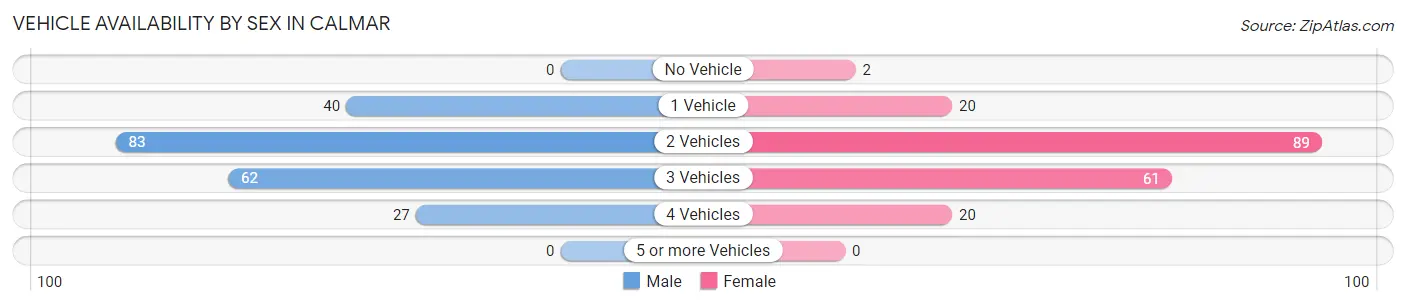
| Vehicles Available | Male | Female |
| No Vehicle | 0 (0.0%) | 2 (1.0%) |
| 1 Vehicle | 40 (18.9%) | 20 (10.4%) |
| 2 Vehicles | 83 (39.2%) | 89 (46.4%) |
| 3 Vehicles | 62 (29.2%) | 61 (31.8%) |
| 4 Vehicles | 27 (12.7%) | 20 (10.4%) |
| 5 or more Vehicles | 0 (0.0%) | 0 (0.0%) |
| Total | 212 (100.0%) | 192 (100.0%) |
Commute Time in Calmar
The most frequently occuring commute durations in Calmar are 15 to 19 minutes (99 commuters, 26.0%), 20 to 24 minutes (66 commuters, 17.3%), and 10 to 14 minutes (63 commuters, 16.5%).
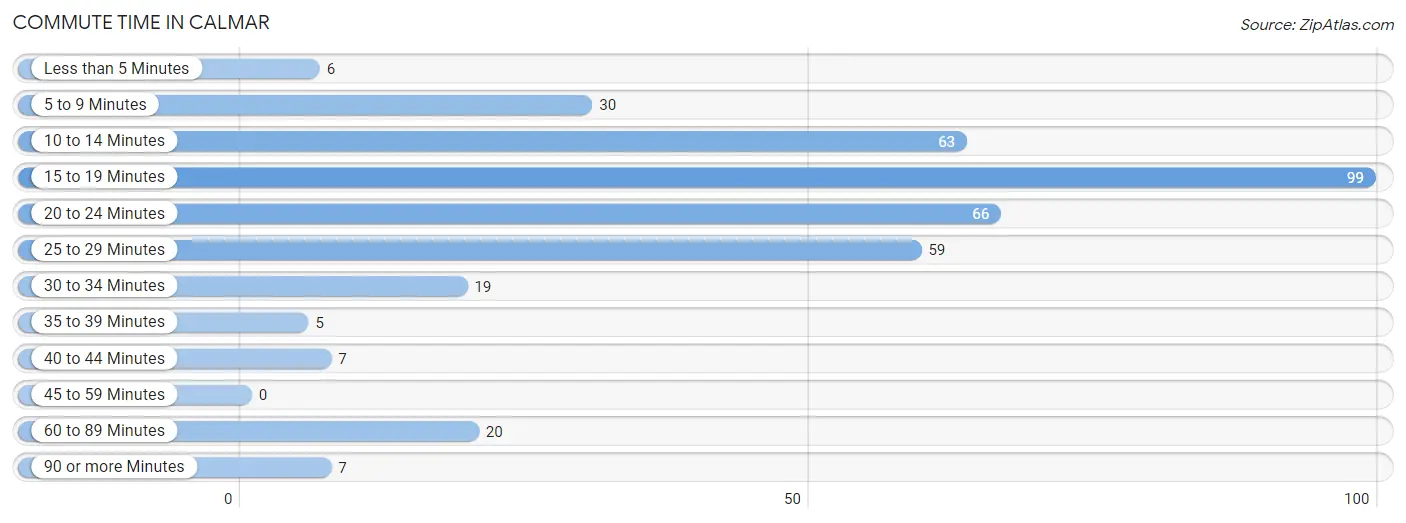
| Commute Time | # Commuters | % Commuters |
| Less than 5 Minutes | 6 | 1.6% |
| 5 to 9 Minutes | 30 | 7.9% |
| 10 to 14 Minutes | 63 | 16.5% |
| 15 to 19 Minutes | 99 | 26.0% |
| 20 to 24 Minutes | 66 | 17.3% |
| 25 to 29 Minutes | 59 | 15.5% |
| 30 to 34 Minutes | 19 | 5.0% |
| 35 to 39 Minutes | 5 | 1.3% |
| 40 to 44 Minutes | 7 | 1.8% |
| 45 to 59 Minutes | 0 | 0.0% |
| 60 to 89 Minutes | 20 | 5.2% |
| 90 or more Minutes | 7 | 1.8% |
Commute Time by Sex in Calmar
The most common commute times in Calmar are 15 to 19 minutes (50 commuters, 25.3%) for males and 15 to 19 minutes (49 commuters, 26.8%) for females.
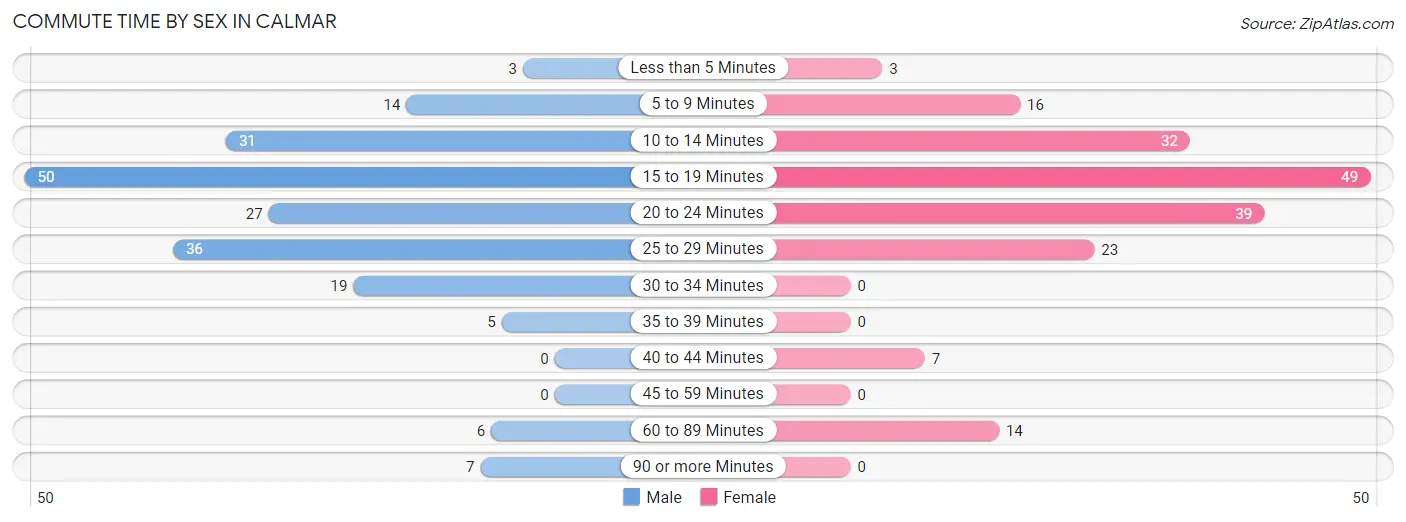
| Commute Time | Male | Female |
| Less than 5 Minutes | 3 (1.5%) | 3 (1.6%) |
| 5 to 9 Minutes | 14 (7.1%) | 16 (8.7%) |
| 10 to 14 Minutes | 31 (15.7%) | 32 (17.5%) |
| 15 to 19 Minutes | 50 (25.3%) | 49 (26.8%) |
| 20 to 24 Minutes | 27 (13.6%) | 39 (21.3%) |
| 25 to 29 Minutes | 36 (18.2%) | 23 (12.6%) |
| 30 to 34 Minutes | 19 (9.6%) | 0 (0.0%) |
| 35 to 39 Minutes | 5 (2.5%) | 0 (0.0%) |
| 40 to 44 Minutes | 0 (0.0%) | 7 (3.8%) |
| 45 to 59 Minutes | 0 (0.0%) | 0 (0.0%) |
| 60 to 89 Minutes | 6 (3.0%) | 14 (7.6%) |
| 90 or more Minutes | 7 (3.5%) | 0 (0.0%) |
Time of Departure to Work by Sex in Calmar
The most frequent times of departure to work in Calmar are 6:00 AM to 6:29 AM (47, 23.7%) for males and 7:30 AM to 7:59 AM (32, 17.5%) for females.
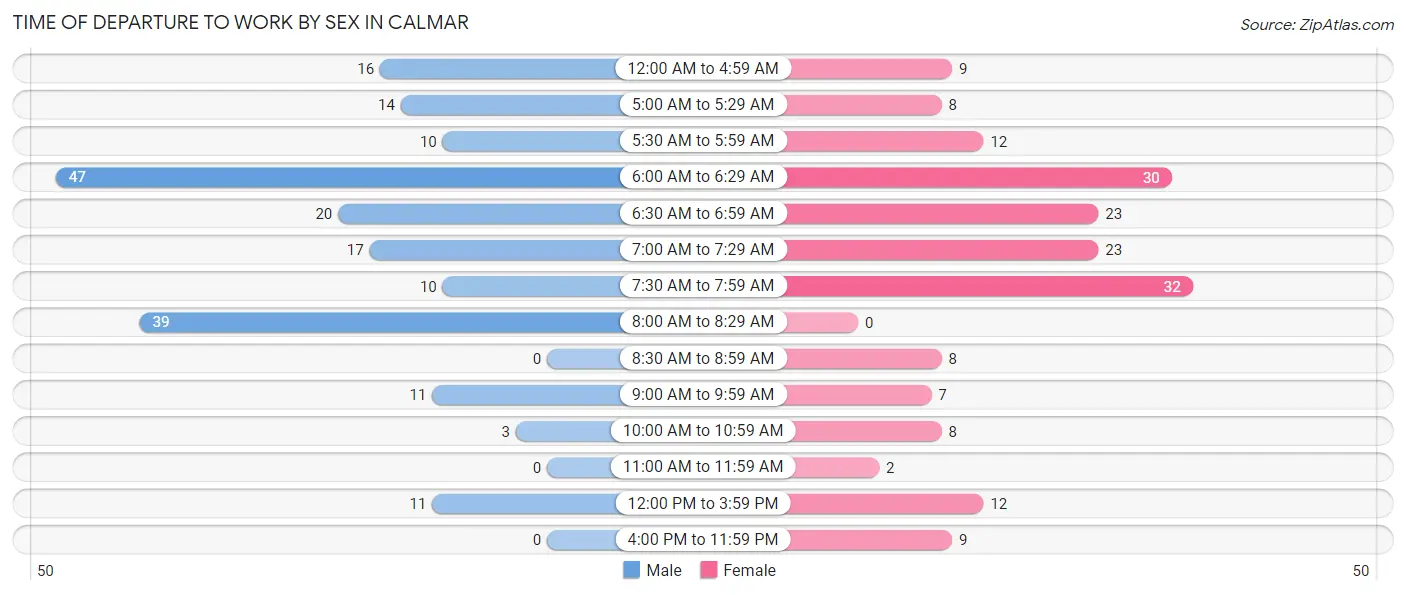
| Time of Departure | Male | Female |
| 12:00 AM to 4:59 AM | 16 (8.1%) | 9 (4.9%) |
| 5:00 AM to 5:29 AM | 14 (7.1%) | 8 (4.4%) |
| 5:30 AM to 5:59 AM | 10 (5.1%) | 12 (6.6%) |
| 6:00 AM to 6:29 AM | 47 (23.7%) | 30 (16.4%) |
| 6:30 AM to 6:59 AM | 20 (10.1%) | 23 (12.6%) |
| 7:00 AM to 7:29 AM | 17 (8.6%) | 23 (12.6%) |
| 7:30 AM to 7:59 AM | 10 (5.1%) | 32 (17.5%) |
| 8:00 AM to 8:29 AM | 39 (19.7%) | 0 (0.0%) |
| 8:30 AM to 8:59 AM | 0 (0.0%) | 8 (4.4%) |
| 9:00 AM to 9:59 AM | 11 (5.6%) | 7 (3.8%) |
| 10:00 AM to 10:59 AM | 3 (1.5%) | 8 (4.4%) |
| 11:00 AM to 11:59 AM | 0 (0.0%) | 2 (1.1%) |
| 12:00 PM to 3:59 PM | 11 (5.6%) | 12 (6.6%) |
| 4:00 PM to 11:59 PM | 0 (0.0%) | 9 (4.9%) |
| Total | 198 (100.0%) | 183 (100.0%) |
Housing Occupancy in Calmar
Occupancy by Ownership in Calmar
Of the total 352 dwellings in Calmar, owner-occupied units account for 267 (75.8%), while renter-occupied units make up 85 (24.1%).
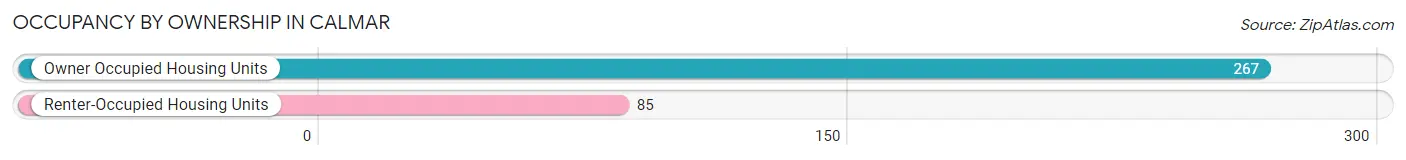
| Occupancy | # Housing Units | % Housing Units |
| Owner Occupied Housing Units | 267 | 75.8% |
| Renter-Occupied Housing Units | 85 | 24.1% |
| Total Occupied Housing Units | 352 | 100.0% |
Occupancy by Household Size in Calmar
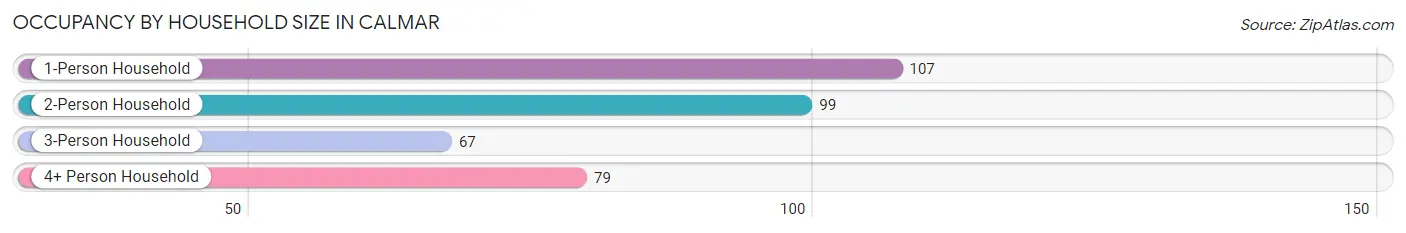
| Household Size | # Housing Units | % Housing Units |
| 1-Person Household | 107 | 30.4% |
| 2-Person Household | 99 | 28.1% |
| 3-Person Household | 67 | 19.0% |
| 4+ Person Household | 79 | 22.4% |
| Total Housing Units | 352 | 100.0% |
Occupancy by Ownership by Household Size in Calmar
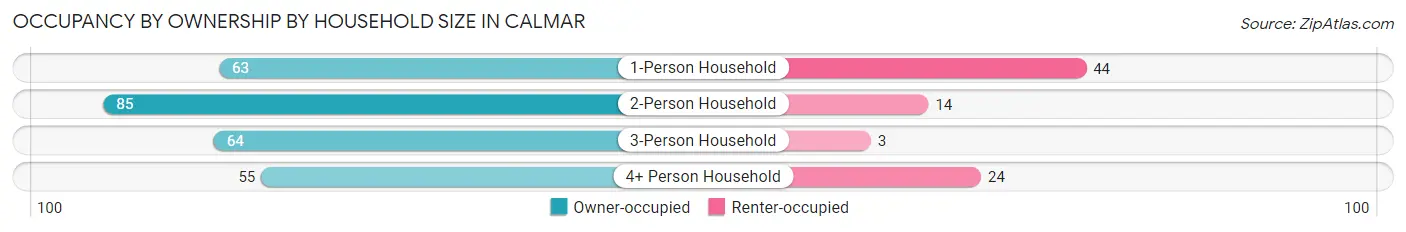
| Household Size | Owner-occupied | Renter-occupied |
| 1-Person Household | 63 (58.9%) | 44 (41.1%) |
| 2-Person Household | 85 (85.9%) | 14 (14.1%) |
| 3-Person Household | 64 (95.5%) | 3 (4.5%) |
| 4+ Person Household | 55 (69.6%) | 24 (30.4%) |
| Total Housing Units | 267 (75.8%) | 85 (24.1%) |
Occupancy by Educational Attainment in Calmar
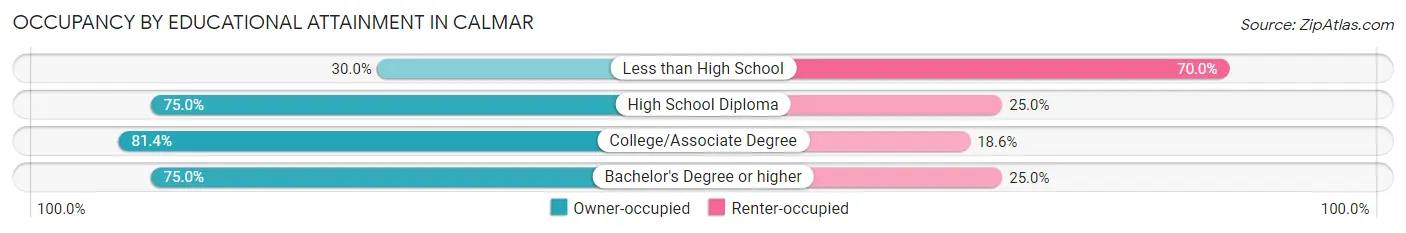
| Household Size | Owner-occupied | Renter-occupied |
| Less than High School | 3 (30.0%) | 7 (70.0%) |
| High School Diploma | 108 (75.0%) | 36 (25.0%) |
| College/Associate Degree | 96 (81.4%) | 22 (18.6%) |
| Bachelor's Degree or higher | 60 (75.0%) | 20 (25.0%) |
Occupancy by Age of Householder in Calmar
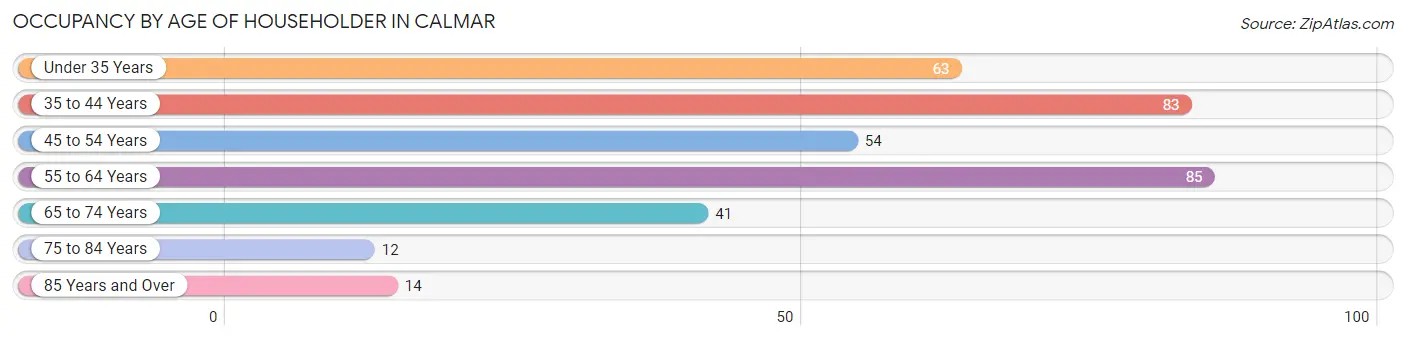
| Age Bracket | # Households | % Households |
| Under 35 Years | 63 | 17.9% |
| 35 to 44 Years | 83 | 23.6% |
| 45 to 54 Years | 54 | 15.3% |
| 55 to 64 Years | 85 | 24.1% |
| 65 to 74 Years | 41 | 11.7% |
| 75 to 84 Years | 12 | 3.4% |
| 85 Years and Over | 14 | 4.0% |
| Total | 352 | 100.0% |
Housing Finances in Calmar
Median Income by Occupancy in Calmar
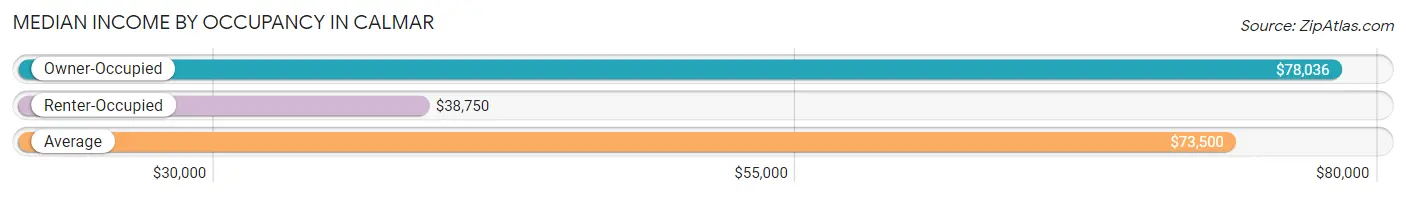
| Occupancy Type | # Households | Median Income |
| Owner-Occupied | 267 (75.8%) | $78,036 |
| Renter-Occupied | 85 (24.1%) | $38,750 |
| Average | 352 (100.0%) | $73,500 |
Occupancy by Householder Income Bracket in Calmar
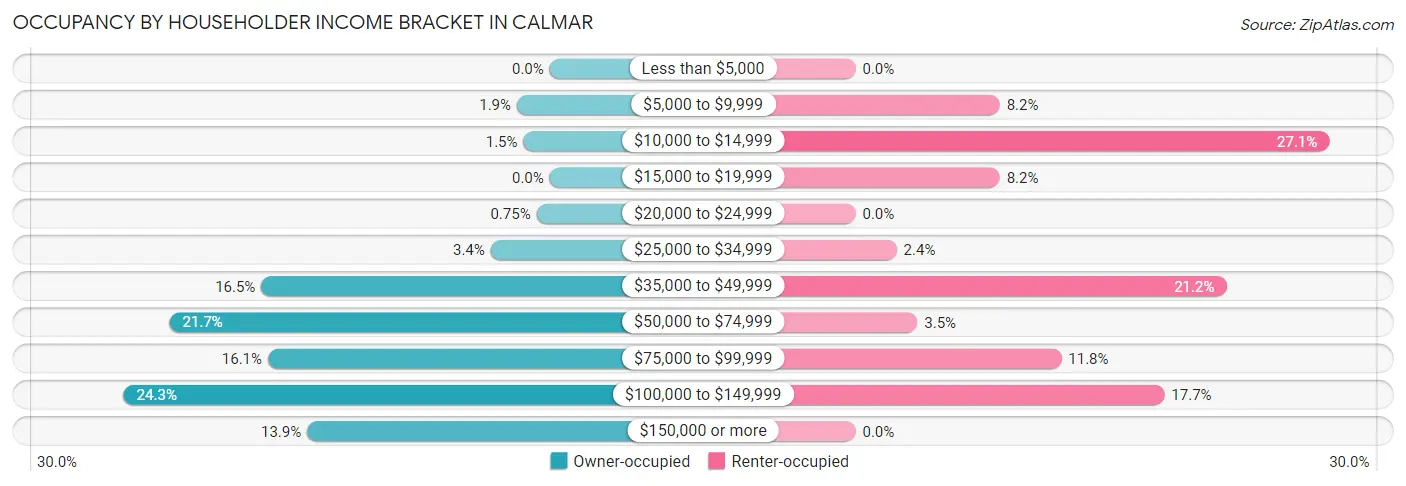
| Income Bracket | Owner-occupied | Renter-occupied |
| Less than $5,000 | 0 (0.0%) | 0 (0.0%) |
| $5,000 to $9,999 | 5 (1.9%) | 7 (8.2%) |
| $10,000 to $14,999 | 4 (1.5%) | 23 (27.1%) |
| $15,000 to $19,999 | 0 (0.0%) | 7 (8.2%) |
| $20,000 to $24,999 | 2 (0.7%) | 0 (0.0%) |
| $25,000 to $34,999 | 9 (3.4%) | 2 (2.4%) |
| $35,000 to $49,999 | 44 (16.5%) | 18 (21.2%) |
| $50,000 to $74,999 | 58 (21.7%) | 3 (3.5%) |
| $75,000 to $99,999 | 43 (16.1%) | 10 (11.8%) |
| $100,000 to $149,999 | 65 (24.3%) | 15 (17.6%) |
| $150,000 or more | 37 (13.9%) | 0 (0.0%) |
| Total | 267 (100.0%) | 85 (100.0%) |
Monthly Housing Cost Tiers in Calmar
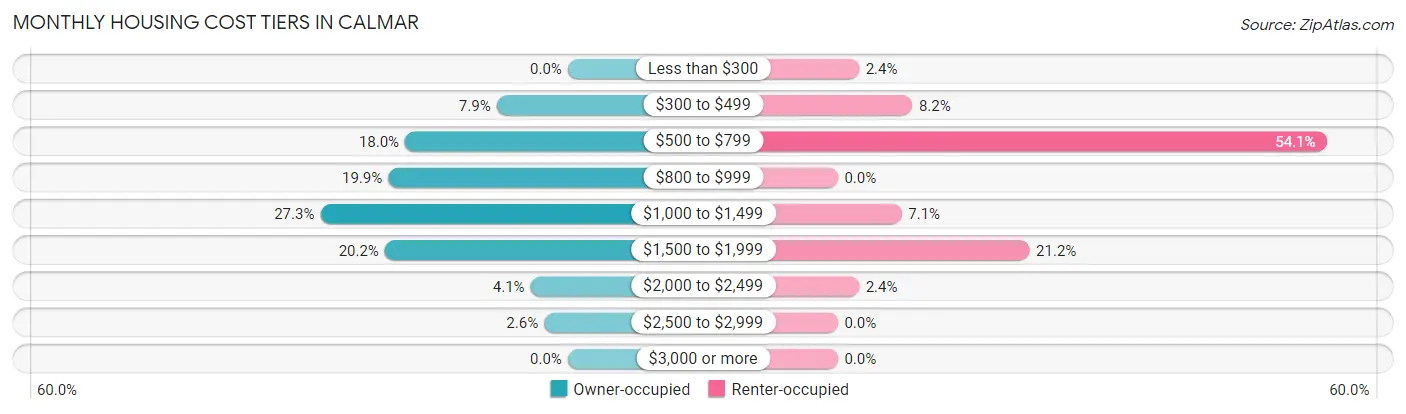
| Monthly Cost | Owner-occupied | Renter-occupied |
| Less than $300 | 0 (0.0%) | 2 (2.4%) |
| $300 to $499 | 21 (7.9%) | 7 (8.2%) |
| $500 to $799 | 48 (18.0%) | 46 (54.1%) |
| $800 to $999 | 53 (19.9%) | 0 (0.0%) |
| $1,000 to $1,499 | 73 (27.3%) | 6 (7.1%) |
| $1,500 to $1,999 | 54 (20.2%) | 18 (21.2%) |
| $2,000 to $2,499 | 11 (4.1%) | 2 (2.4%) |
| $2,500 to $2,999 | 7 (2.6%) | 0 (0.0%) |
| $3,000 or more | 0 (0.0%) | 0 (0.0%) |
| Total | 267 (100.0%) | 85 (100.0%) |
Physical Housing Characteristics in Calmar
Housing Structures in Calmar

| Structure Type | # Housing Units | % Housing Units |
| Single Unit, Detached | 296 | 84.1% |
| Single Unit, Attached | 2 | 0.6% |
| 2 Unit Apartments | 13 | 3.7% |
| 3 or 4 Unit Apartments | 12 | 3.4% |
| 5 to 9 Unit Apartments | 21 | 6.0% |
| 10 or more Apartments | 7 | 2.0% |
| Mobile Home / Other | 1 | 0.3% |
| Total | 352 | 100.0% |
Housing Structures by Occupancy in Calmar
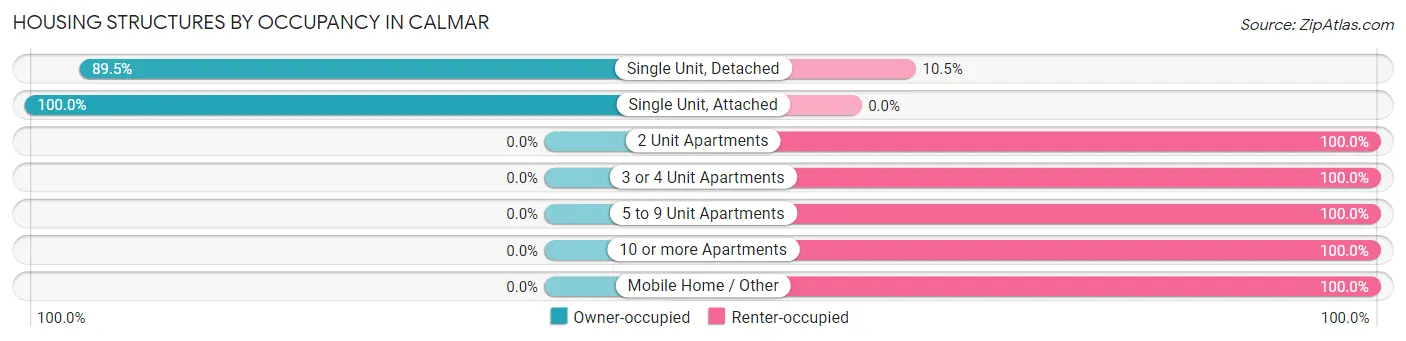
| Structure Type | Owner-occupied | Renter-occupied |
| Single Unit, Detached | 265 (89.5%) | 31 (10.5%) |
| Single Unit, Attached | 2 (100.0%) | 0 (0.0%) |
| 2 Unit Apartments | 0 (0.0%) | 13 (100.0%) |
| 3 or 4 Unit Apartments | 0 (0.0%) | 12 (100.0%) |
| 5 to 9 Unit Apartments | 0 (0.0%) | 21 (100.0%) |
| 10 or more Apartments | 0 (0.0%) | 7 (100.0%) |
| Mobile Home / Other | 0 (0.0%) | 1 (100.0%) |
| Total | 267 (75.8%) | 85 (24.1%) |
Housing Structures by Number of Rooms in Calmar
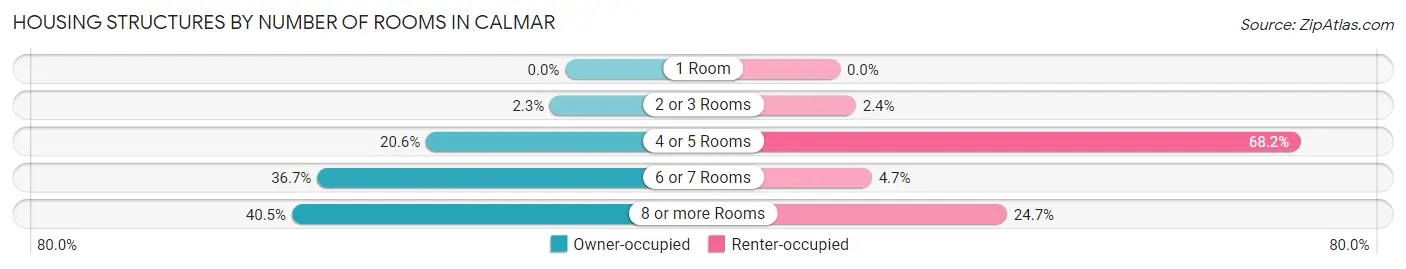
| Number of Rooms | Owner-occupied | Renter-occupied |
| 1 Room | 0 (0.0%) | 0 (0.0%) |
| 2 or 3 Rooms | 6 (2.2%) | 2 (2.4%) |
| 4 or 5 Rooms | 55 (20.6%) | 58 (68.2%) |
| 6 or 7 Rooms | 98 (36.7%) | 4 (4.7%) |
| 8 or more Rooms | 108 (40.5%) | 21 (24.7%) |
| Total | 267 (100.0%) | 85 (100.0%) |
Housing Structure by Heating Type in Calmar
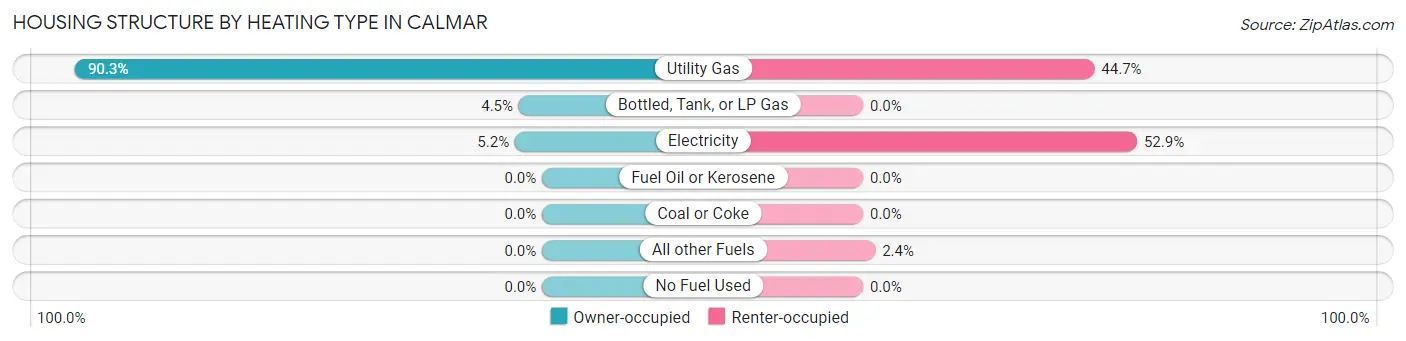
| Heating Type | Owner-occupied | Renter-occupied |
| Utility Gas | 241 (90.3%) | 38 (44.7%) |
| Bottled, Tank, or LP Gas | 12 (4.5%) | 0 (0.0%) |
| Electricity | 14 (5.2%) | 45 (52.9%) |
| Fuel Oil or Kerosene | 0 (0.0%) | 0 (0.0%) |
| Coal or Coke | 0 (0.0%) | 0 (0.0%) |
| All other Fuels | 0 (0.0%) | 2 (2.4%) |
| No Fuel Used | 0 (0.0%) | 0 (0.0%) |
| Total | 267 (100.0%) | 85 (100.0%) |
Household Vehicle Usage in Calmar
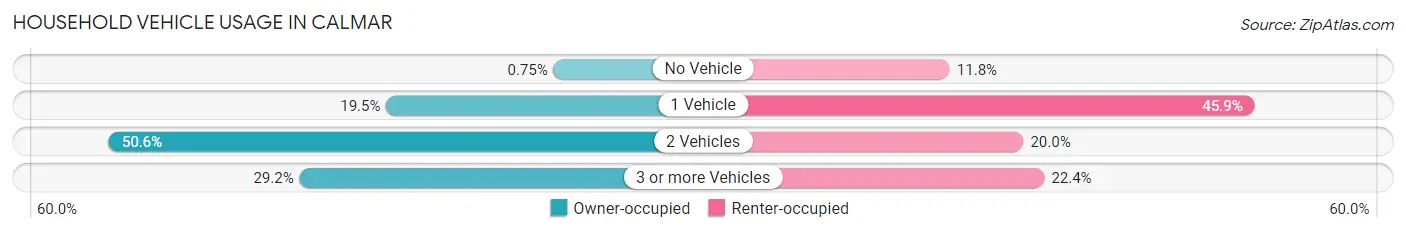
| Vehicles per Household | Owner-occupied | Renter-occupied |
| No Vehicle | 2 (0.7%) | 10 (11.8%) |
| 1 Vehicle | 52 (19.5%) | 39 (45.9%) |
| 2 Vehicles | 135 (50.6%) | 17 (20.0%) |
| 3 or more Vehicles | 78 (29.2%) | 19 (22.4%) |
| Total | 267 (100.0%) | 85 (100.0%) |
Real Estate & Mortgages in Calmar
Real Estate and Mortgage Overview in Calmar
| Characteristic | Without Mortgage | With Mortgage |
| Housing Units | 75 | 192 |
| Median Property Value | $181,900 | $186,800 |
| Median Household Income | $54,107 | $29 |
| Monthly Housing Costs | $613 | $0 |
| Real Estate Taxes | $2,293 | $0 |
Property Value by Mortgage Status in Calmar
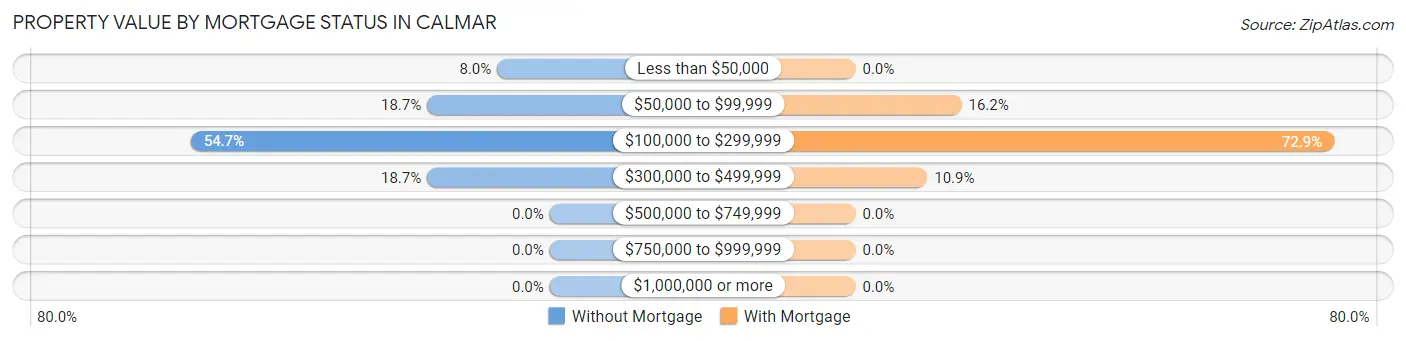
| Property Value | Without Mortgage | With Mortgage |
| Less than $50,000 | 6 (8.0%) | 0 (0.0%) |
| $50,000 to $99,999 | 14 (18.7%) | 31 (16.2%) |
| $100,000 to $299,999 | 41 (54.7%) | 140 (72.9%) |
| $300,000 to $499,999 | 14 (18.7%) | 21 (10.9%) |
| $500,000 to $749,999 | 0 (0.0%) | 0 (0.0%) |
| $750,000 to $999,999 | 0 (0.0%) | 0 (0.0%) |
| $1,000,000 or more | 0 (0.0%) | 0 (0.0%) |
| Total | 75 (100.0%) | 192 (100.0%) |
Household Income by Mortgage Status in Calmar
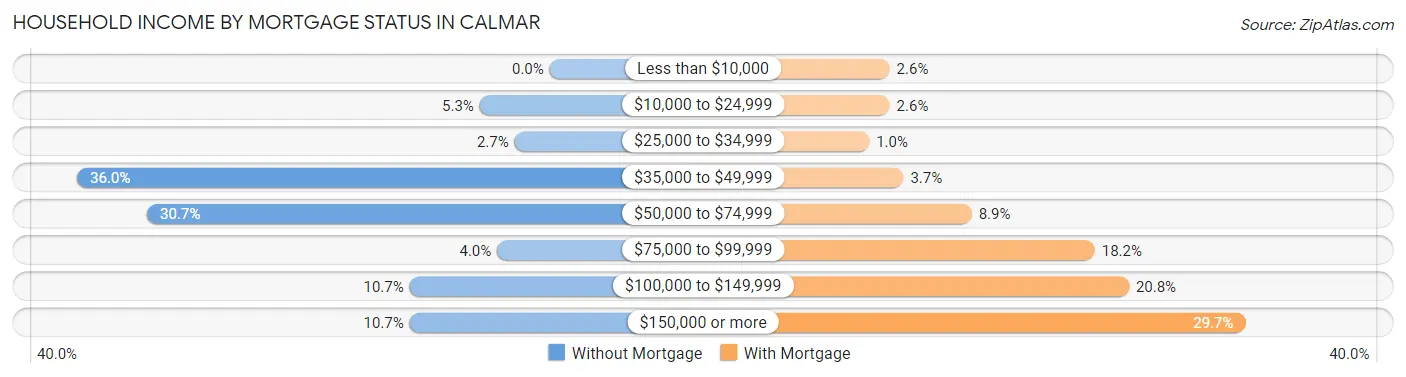
| Household Income | Without Mortgage | With Mortgage |
| Less than $10,000 | 0 (0.0%) | 5 (2.6%) |
| $10,000 to $24,999 | 4 (5.3%) | 5 (2.6%) |
| $25,000 to $34,999 | 2 (2.7%) | 2 (1.0%) |
| $35,000 to $49,999 | 27 (36.0%) | 7 (3.6%) |
| $50,000 to $74,999 | 23 (30.7%) | 17 (8.8%) |
| $75,000 to $99,999 | 3 (4.0%) | 35 (18.2%) |
| $100,000 to $149,999 | 8 (10.7%) | 40 (20.8%) |
| $150,000 or more | 8 (10.7%) | 57 (29.7%) |
| Total | 75 (100.0%) | 192 (100.0%) |
Property Value to Household Income Ratio in Calmar
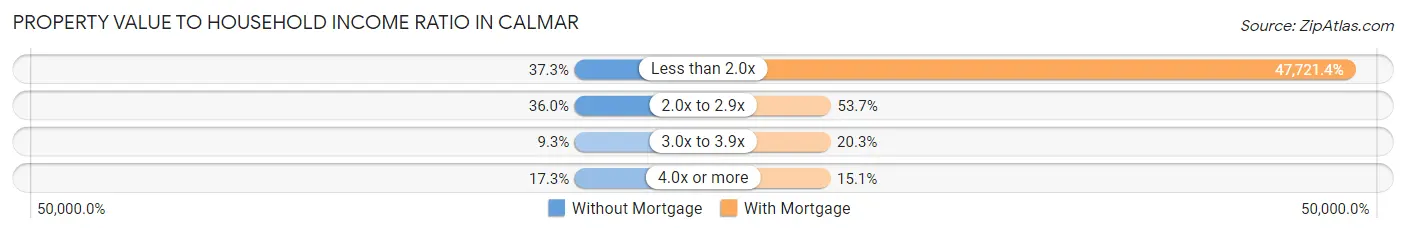
| Value-to-Income Ratio | Without Mortgage | With Mortgage |
| Less than 2.0x | 28 (37.3%) | 91,625 (47,721.4%) |
| 2.0x to 2.9x | 27 (36.0%) | 103 (53.6%) |
| 3.0x to 3.9x | 7 (9.3%) | 39 (20.3%) |
| 4.0x or more | 13 (17.3%) | 29 (15.1%) |
| Total | 75 (100.0%) | 192 (100.0%) |
Real Estate Taxes by Mortgage Status in Calmar
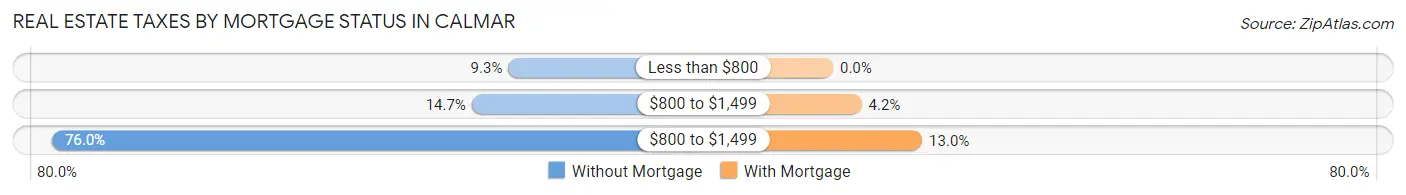
| Property Taxes | Without Mortgage | With Mortgage |
| Less than $800 | 7 (9.3%) | 0 (0.0%) |
| $800 to $1,499 | 11 (14.7%) | 8 (4.2%) |
| $800 to $1,499 | 57 (76.0%) | 25 (13.0%) |
| Total | 75 (100.0%) | 192 (100.0%) |
Health & Disability in Calmar
Health Insurance Coverage by Age in Calmar
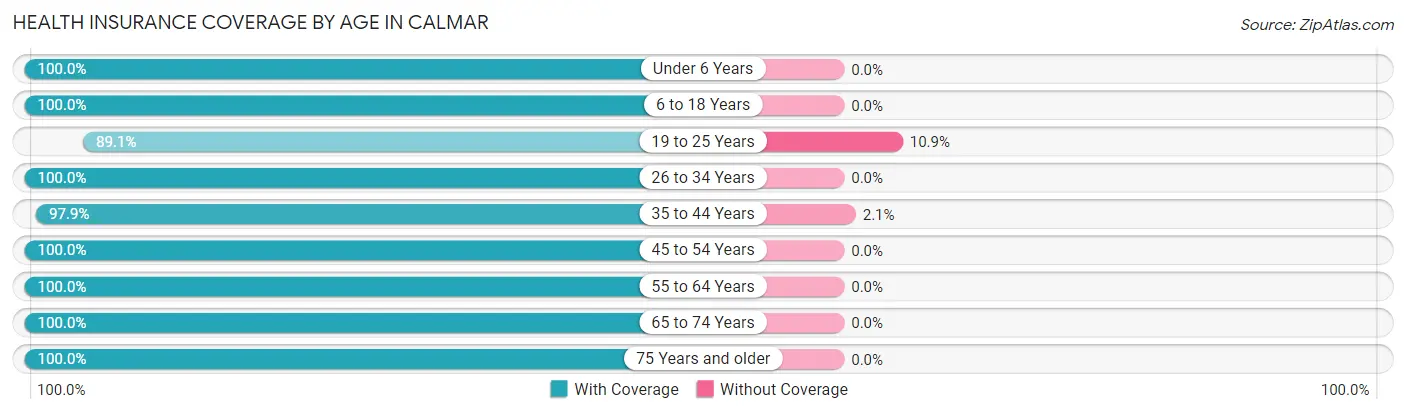
| Age Bracket | With Coverage | Without Coverage |
| Under 6 Years | 63 (100.0%) | 0 (0.0%) |
| 6 to 18 Years | 192 (100.0%) | 0 (0.0%) |
| 19 to 25 Years | 49 (89.1%) | 6 (10.9%) |
| 26 to 34 Years | 49 (100.0%) | 0 (0.0%) |
| 35 to 44 Years | 137 (97.9%) | 3 (2.1%) |
| 45 to 54 Years | 88 (100.0%) | 0 (0.0%) |
| 55 to 64 Years | 138 (100.0%) | 0 (0.0%) |
| 65 to 74 Years | 67 (100.0%) | 0 (0.0%) |
| 75 Years and older | 39 (100.0%) | 0 (0.0%) |
| Total | 822 (98.9%) | 9 (1.1%) |
Health Insurance Coverage by Citizenship Status in Calmar
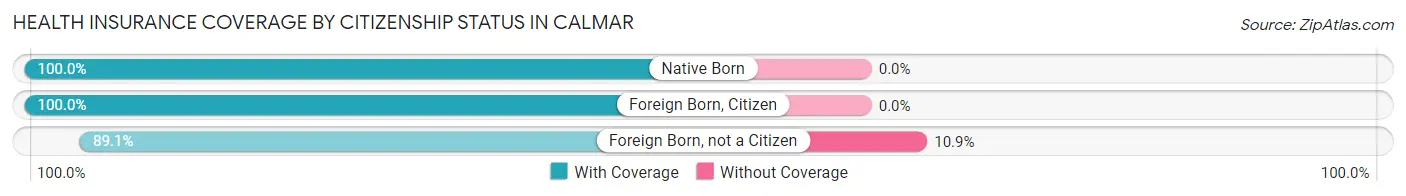
| Citizenship Status | With Coverage | Without Coverage |
| Native Born | 63 (100.0%) | 0 (0.0%) |
| Foreign Born, Citizen | 192 (100.0%) | 0 (0.0%) |
| Foreign Born, not a Citizen | 49 (89.1%) | 6 (10.9%) |
Health Insurance Coverage by Household Income in Calmar
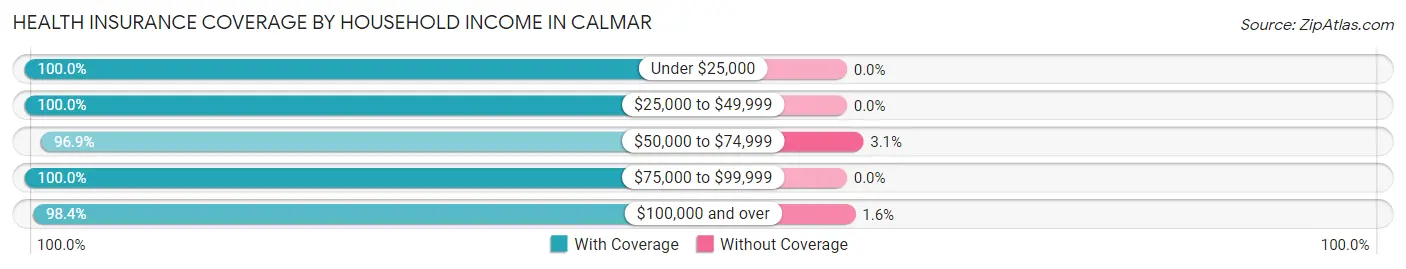
| Household Income | With Coverage | Without Coverage |
| Under $25,000 | 85 (100.0%) | 0 (0.0%) |
| $25,000 to $49,999 | 132 (100.0%) | 0 (0.0%) |
| $50,000 to $74,999 | 94 (96.9%) | 3 (3.1%) |
| $75,000 to $99,999 | 140 (100.0%) | 0 (0.0%) |
| $100,000 and over | 370 (98.4%) | 6 (1.6%) |
Public vs Private Health Insurance Coverage by Age in Calmar
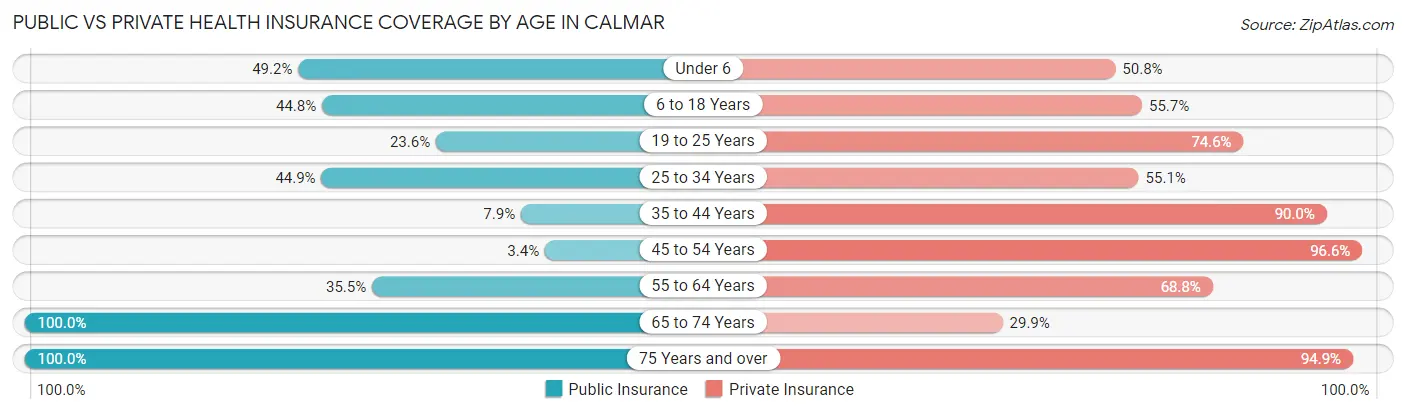
| Age Bracket | Public Insurance | Private Insurance |
| Under 6 | 31 (49.2%) | 32 (50.8%) |
| 6 to 18 Years | 86 (44.8%) | 107 (55.7%) |
| 19 to 25 Years | 13 (23.6%) | 41 (74.6%) |
| 25 to 34 Years | 22 (44.9%) | 27 (55.1%) |
| 35 to 44 Years | 11 (7.9%) | 126 (90.0%) |
| 45 to 54 Years | 3 (3.4%) | 85 (96.6%) |
| 55 to 64 Years | 49 (35.5%) | 95 (68.8%) |
| 65 to 74 Years | 67 (100.0%) | 20 (29.8%) |
| 75 Years and over | 39 (100.0%) | 37 (94.9%) |
| Total | 321 (38.6%) | 570 (68.6%) |
Disability Status by Sex by Age in Calmar
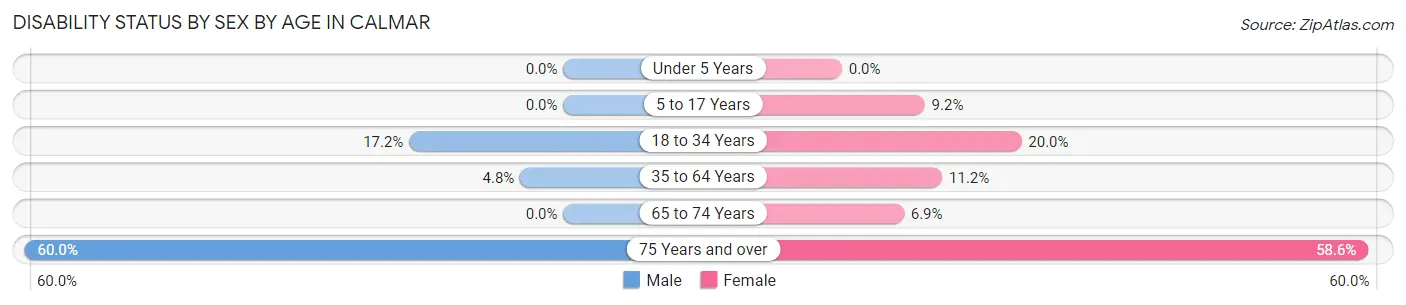
| Age Bracket | Male | Female |
| Under 5 Years | 0 (0.0%) | 0 (0.0%) |
| 5 to 17 Years | 0 (0.0%) | 6 (9.2%) |
| 18 to 34 Years | 17 (17.2%) | 10 (20.0%) |
| 35 to 64 Years | 9 (4.8%) | 20 (11.2%) |
| 65 to 74 Years | 0 (0.0%) | 2 (6.9%) |
| 75 Years and over | 6 (60.0%) | 17 (58.6%) |
Disability Class by Sex by Age in Calmar
Disability Class: Hearing Difficulty
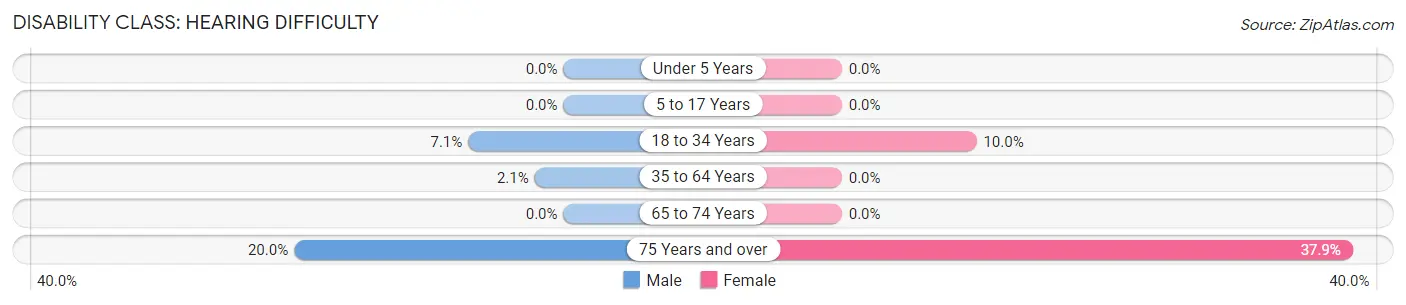
| Age Bracket | Male | Female |
| Under 5 Years | 0 (0.0%) | 0 (0.0%) |
| 5 to 17 Years | 0 (0.0%) | 0 (0.0%) |
| 18 to 34 Years | 7 (7.1%) | 5 (10.0%) |
| 35 to 64 Years | 4 (2.1%) | 0 (0.0%) |
| 65 to 74 Years | 0 (0.0%) | 0 (0.0%) |
| 75 Years and over | 2 (20.0%) | 11 (37.9%) |
Disability Class: Vision Difficulty
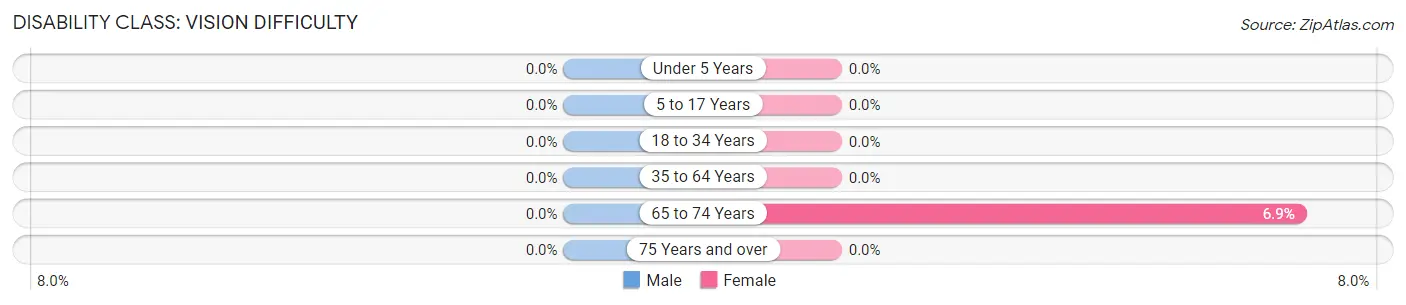
| Age Bracket | Male | Female |
| Under 5 Years | 0 (0.0%) | 0 (0.0%) |
| 5 to 17 Years | 0 (0.0%) | 0 (0.0%) |
| 18 to 34 Years | 0 (0.0%) | 0 (0.0%) |
| 35 to 64 Years | 0 (0.0%) | 0 (0.0%) |
| 65 to 74 Years | 0 (0.0%) | 2 (6.9%) |
| 75 Years and over | 0 (0.0%) | 0 (0.0%) |
Disability Class: Cognitive Difficulty
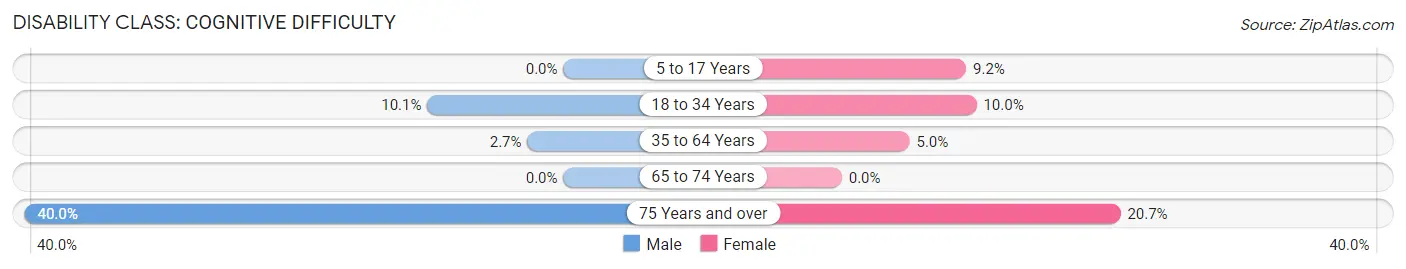
| Age Bracket | Male | Female |
| 5 to 17 Years | 0 (0.0%) | 6 (9.2%) |
| 18 to 34 Years | 10 (10.1%) | 5 (10.0%) |
| 35 to 64 Years | 5 (2.7%) | 9 (5.0%) |
| 65 to 74 Years | 0 (0.0%) | 0 (0.0%) |
| 75 Years and over | 4 (40.0%) | 6 (20.7%) |
Disability Class: Ambulatory Difficulty
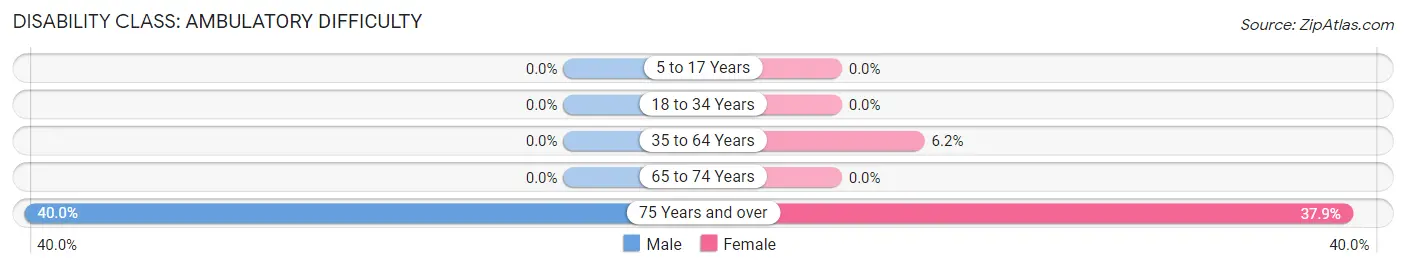
| Age Bracket | Male | Female |
| 5 to 17 Years | 0 (0.0%) | 0 (0.0%) |
| 18 to 34 Years | 0 (0.0%) | 0 (0.0%) |
| 35 to 64 Years | 0 (0.0%) | 11 (6.1%) |
| 65 to 74 Years | 0 (0.0%) | 0 (0.0%) |
| 75 Years and over | 4 (40.0%) | 11 (37.9%) |
Disability Class: Self-Care Difficulty
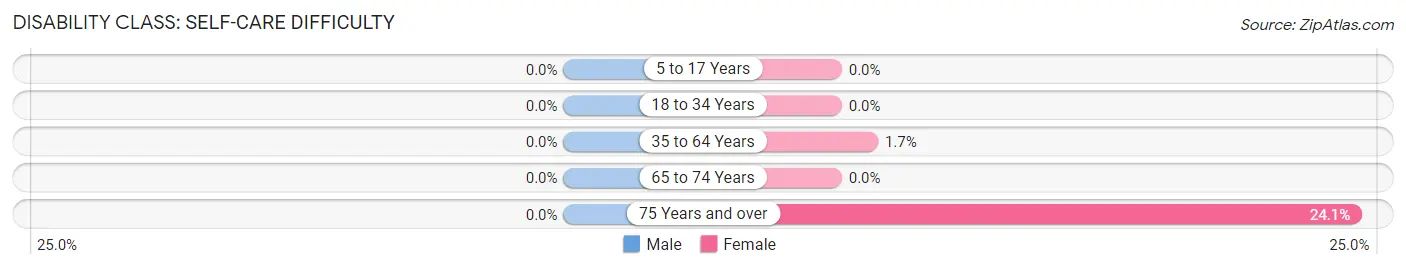
| Age Bracket | Male | Female |
| 5 to 17 Years | 0 (0.0%) | 0 (0.0%) |
| 18 to 34 Years | 0 (0.0%) | 0 (0.0%) |
| 35 to 64 Years | 0 (0.0%) | 3 (1.7%) |
| 65 to 74 Years | 0 (0.0%) | 0 (0.0%) |
| 75 Years and over | 0 (0.0%) | 7 (24.1%) |
Technology Access in Calmar
Computing Device Access in Calmar
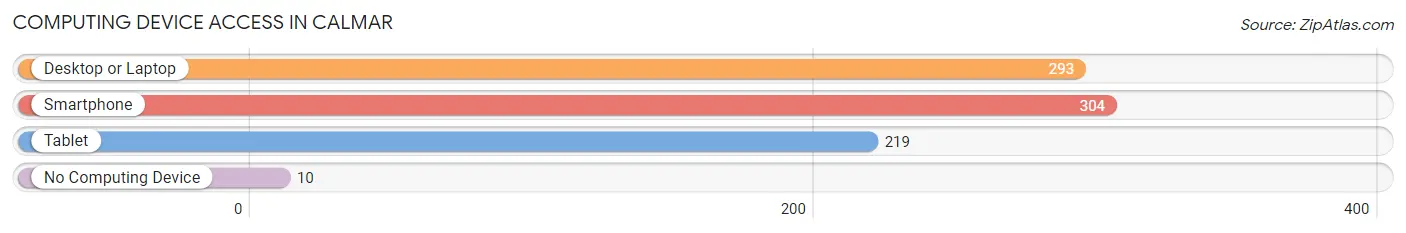
| Device Type | # Households | % Households |
| Desktop or Laptop | 293 | 83.2% |
| Smartphone | 304 | 86.4% |
| Tablet | 219 | 62.2% |
| No Computing Device | 10 | 2.8% |
| Total | 352 | 100.0% |
Internet Access in Calmar
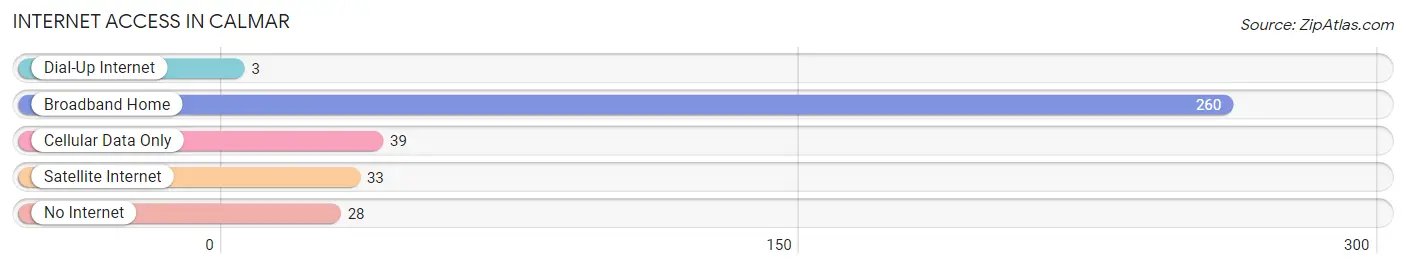
| Internet Type | # Households | % Households |
| Dial-Up Internet | 3 | 0.9% |
| Broadband Home | 260 | 73.9% |
| Cellular Data Only | 39 | 11.1% |
| Satellite Internet | 33 | 9.4% |
| No Internet | 28 | 8.0% |
| Total | 352 | 100.0% |
Calmar Summary
Calmar, Iowa is a small city located in the northeast corner of Winneshiek County, Iowa. It is situated on the banks of the Upper Iowa River and is surrounded by rolling hills and lush farmland. The city has a population of 1,072 people, according to the 2010 census, and is part of the Decorah Micropolitan Statistical Area.
History
Calmar was founded in 1854 by a group of German immigrants who had settled in the area. The city was named after the German city of Calmar, which is located in the Rhineland-Palatinate region of Germany. The city was incorporated in 1876 and has remained a small, rural community ever since.
The city was an important stop on the Chicago, Milwaukee, St. Paul and Pacific Railroad, which ran through the city from 1876 to 1980. The railroad was a major source of employment for the city and helped to spur economic growth.
Geography
Calmar is located at the intersection of U.S. Route 52 and Iowa Highway 24. The city is situated on the banks of the Upper Iowa River and is surrounded by rolling hills and lush farmland. The city has a total area of 1.2 square miles, all of which is land.
The climate in Calmar is typical of the Midwest, with hot summers and cold winters. The average temperature in July is 75 degrees Fahrenheit, while the average temperature in January is 22 degrees Fahrenheit. The city receives an average of 33 inches of precipitation per year.
Economy
Calmar’s economy is largely based on agriculture and manufacturing. The city is home to several large farms, as well as a number of small businesses. The city is also home to several manufacturing companies, including a furniture factory, a metal fabrication plant, and a plastics factory.
The city is also home to a number of retail stores, restaurants, and other businesses. The city is served by the Calmar Community School District, which includes an elementary school, a middle school, and a high school.
Demographics
As of the 2010 census, Calmar had a population of 1,072 people. The racial makeup of the city was 97.2% White, 0.7% African American, 0.2% Native American, 0.2% Asian, 0.2% from other races, and 1.7% from two or more races. Hispanic or Latino of any race were 1.2% of the population.
The median income for a household in Calmar was $45,000, and the median income for a family was $50,000. The per capita income for the city was $20,000. About 8.2% of families and 10.2% of the population were below the poverty line, including 14.3% of those under age 18 and 8.2% of those age 65 or over.
Calmar is a small, rural community with a rich history and a strong sense of community. The city is home to a number of businesses and industries, as well as a number of farms and other agricultural operations. The city is served by the Calmar Community School District and is a great place to live and work.
Common Questions
What is Per Capita Income in Calmar?
Per Capita income in Calmar is $34,128.
What is the Median Family Income in Calmar?
Median Family Income in Calmar is $90,781.
What is the Median Household income in Calmar?
Median Household Income in Calmar is $73,500.
What is Income or Wage Gap in Calmar?
Income or Wage Gap in Calmar is 27.4%.
Women in Calmar earn 72.6 cents for every dollar earned by a man.
What is Inequality or Gini Index in Calmar?
Inequality or Gini Index in Calmar is 0.36.
What is the Total Population of Calmar?
Total Population of Calmar is 831.
What is the Total Male Population of Calmar?
Total Male Population of Calmar is 445.
What is the Total Female Population of Calmar?
Total Female Population of Calmar is 386.
What is the Ratio of Males per 100 Females in Calmar?
There are 115.28 Males per 100 Females in Calmar.
What is the Ratio of Females per 100 Males in Calmar?
There are 86.74 Females per 100 Males in Calmar.
What is the Median Population Age in Calmar?
Median Population Age in Calmar is 37.2 Years.
What is the Average Family Size in Calmar
Average Family Size in Calmar is 3.0 People.
What is the Average Household Size in Calmar
Average Household Size in Calmar is 2.4 People.
How Large is the Labor Force in Calmar?
There are 419 People in the Labor Forcein in Calmar.
What is the Percentage of People in the Labor Force in Calmar?
64.8% of People are in the Labor Force in Calmar.
What is the Unemployment Rate in Calmar?
Unemployment Rate in Calmar is 0.2%.