Van Buren County, IA Map & Demographics
Van Buren County Map
Van Buren County Overview
$32,188
PER CAPITA INCOME
$70,893
AVG FAMILY INCOME
$58,417
AVG HOUSEHOLD INCOME
43.1%
WAGE / INCOME GAP [ % ]
56.9¢/ $1
WAGE / INCOME GAP [ $ ]
$12,640
FAMILY INCOME DEFICIT
0.46
INEQUALITY / GINI INDEX
7,207
TOTAL POPULATION
3,687
MALE POPULATION
3,520
FEMALE POPULATION
104.74
MALES / 100 FEMALES
95.47
FEMALES / 100 MALES
45.0
MEDIAN AGE
3.1
AVG FAMILY SIZE
2.5
AVG HOUSEHOLD SIZE
3,219
LABOR FORCE [ PEOPLE ]
55.9%
PERCENT IN LABOR FORCE
4.9%
UNEMPLOYMENT RATE
Income in Van Buren County
Income Overview in Van Buren County
Per Capita Income in Van Buren County is $32,188, while median incomes of families and households are $70,893 and $58,417 respectively.
| Characteristic | Number | Measure |
| Per Capita Income | 7,207 | $32,188 |
| Median Family Income | 1,860 | $70,893 |
| Mean Family Income | 1,860 | $95,420 |
| Median Household Income | 2,842 | $58,417 |
| Mean Household Income | 2,842 | $79,818 |
| Income Deficit | 1,860 | $12,640 |
| Wage / Income Gap (%) | 7,207 | 43.11% |
| Wage / Income Gap ($) | 7,207 | 56.89¢ per $1 |
| Gini / Inequality Index | 7,207 | 0.46 |
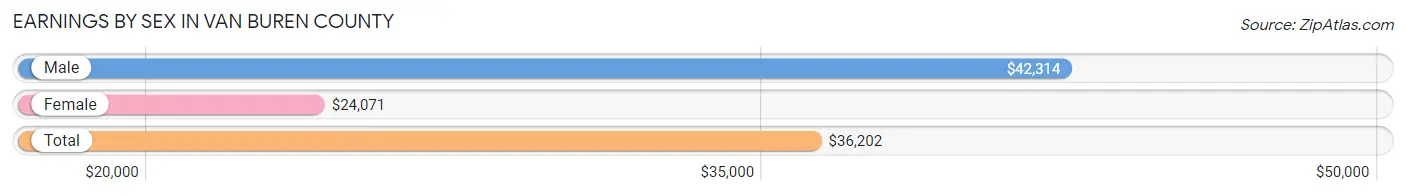
Earnings by Sex in Van Buren County
Average Earnings in Van Buren County are $36,202, $42,314 for men and $24,071 for women, a difference of 43.1%.
| Sex | Number | Average Earnings |
| Male | 1,939 (56.9%) | $42,314 |
| Female | 1,469 (43.1%) | $24,071 |
| Total | 3,408 (100.0%) | $36,202 |
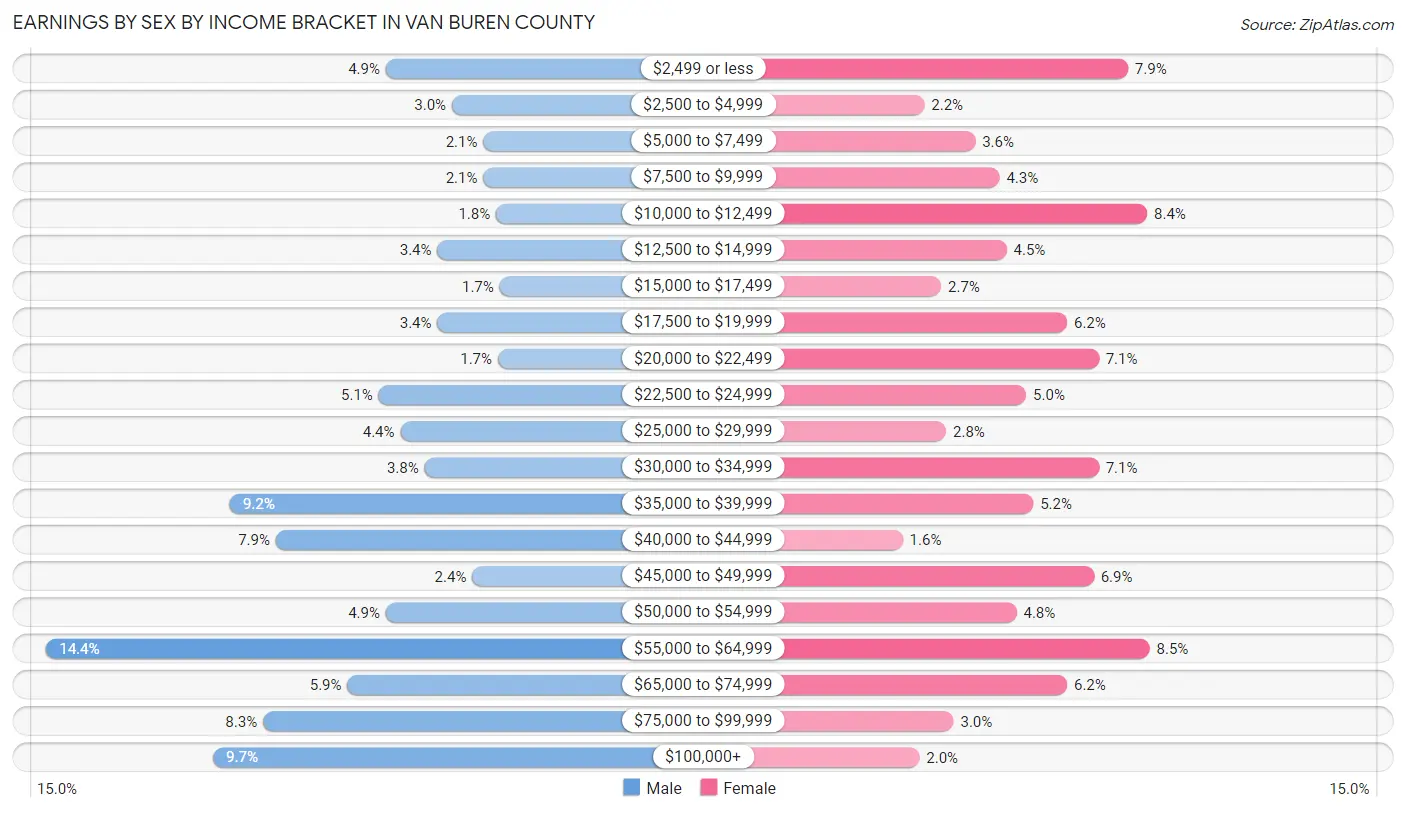
Earnings by Sex by Income Bracket in Van Buren County
The most common earnings brackets in Van Buren County are $55,000 to $64,999 for men (279 | 14.4%) and $55,000 to $64,999 for women (125 | 8.5%).
| Income | Male | Female |
| $2,499 or less | 94 (4.9%) | 116 (7.9%) |
| $2,500 to $4,999 | 58 (3.0%) | 32 (2.2%) |
| $5,000 to $7,499 | 41 (2.1%) | 53 (3.6%) |
| $7,500 to $9,999 | 41 (2.1%) | 63 (4.3%) |
| $10,000 to $12,499 | 34 (1.8%) | 124 (8.4%) |
| $12,500 to $14,999 | 66 (3.4%) | 66 (4.5%) |
| $15,000 to $17,499 | 32 (1.7%) | 39 (2.6%) |
| $17,500 to $19,999 | 66 (3.4%) | 91 (6.2%) |
| $20,000 to $22,499 | 33 (1.7%) | 104 (7.1%) |
| $22,500 to $24,999 | 98 (5.1%) | 74 (5.0%) |
| $25,000 to $29,999 | 86 (4.4%) | 41 (2.8%) |
| $30,000 to $34,999 | 73 (3.8%) | 104 (7.1%) |
| $35,000 to $39,999 | 179 (9.2%) | 77 (5.2%) |
| $40,000 to $44,999 | 154 (7.9%) | 23 (1.6%) |
| $45,000 to $49,999 | 47 (2.4%) | 102 (6.9%) |
| $50,000 to $54,999 | 94 (4.9%) | 70 (4.8%) |
| $55,000 to $64,999 | 279 (14.4%) | 125 (8.5%) |
| $65,000 to $74,999 | 115 (5.9%) | 91 (6.2%) |
| $75,000 to $99,999 | 161 (8.3%) | 44 (3.0%) |
| $100,000+ | 188 (9.7%) | 30 (2.0%) |
| Total | 1,939 (100.0%) | 1,469 (100.0%) |
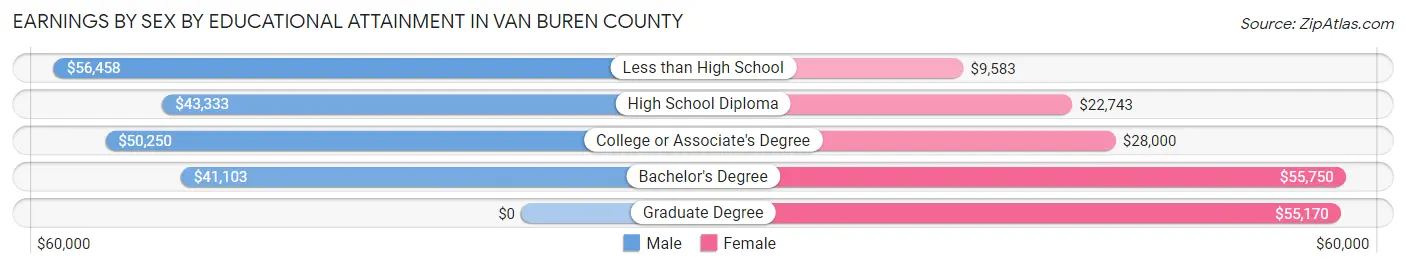
Earnings by Sex by Educational Attainment in Van Buren County
Average earnings in Van Buren County are $44,067 for men and $30,455 for women, a difference of 30.9%. Men with an educational attainment of less than high school enjoy the highest average annual earnings of $56,458, while those with bachelor's degree education earn the least with $41,103. Women with an educational attainment of bachelor's degree earn the most with the average annual earnings of $55,750, while those with less than high school education have the smallest earnings of $9,583.
| Educational Attainment | Male Income | Female Income |
| Less than High School | $56,458 | $9,583 |
| High School Diploma | $43,333 | $22,743 |
| College or Associate's Degree | $50,250 | $28,000 |
| Bachelor's Degree | $41,103 | $55,750 |
| Graduate Degree | - | - |
| Total | $44,067 | $30,455 |
Family Income in Van Buren County
Family Income Brackets in Van Buren County
According to the Van Buren County family income data, there are 502 families falling into the $50,000 to $74,999 income range, which is the most common income bracket and makes up 27.0% of all families. Conversely, the $10,000 to $14,999 income bracket is the least frequent group with only 15 families (0.8%) belonging to this category.
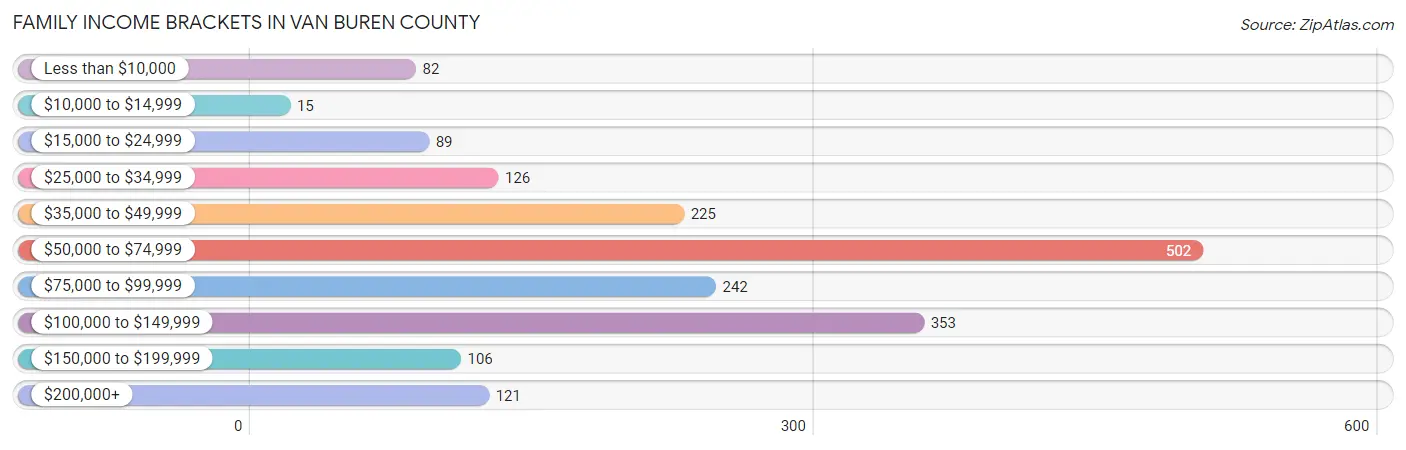
| Income Bracket | # Families | % Families |
| Less than $10,000 | 82 | 4.4% |
| $10,000 to $14,999 | 15 | 0.8% |
| $15,000 to $24,999 | 89 | 4.8% |
| $25,000 to $34,999 | 126 | 6.8% |
| $35,000 to $49,999 | 225 | 12.1% |
| $50,000 to $74,999 | 502 | 27.0% |
| $75,000 to $99,999 | 242 | 13.0% |
| $100,000 to $149,999 | 353 | 19.0% |
| $150,000 to $199,999 | 106 | 5.7% |
| $200,000+ | 121 | 6.5% |
Family Income by Famaliy Size in Van Buren County
7+ person families (62 | 3.3%) account for the highest median family income in Van Buren County with $148,750 per family, while 2-person families (1,059 | 56.9%) have the highest median income of $31,828 per family member.
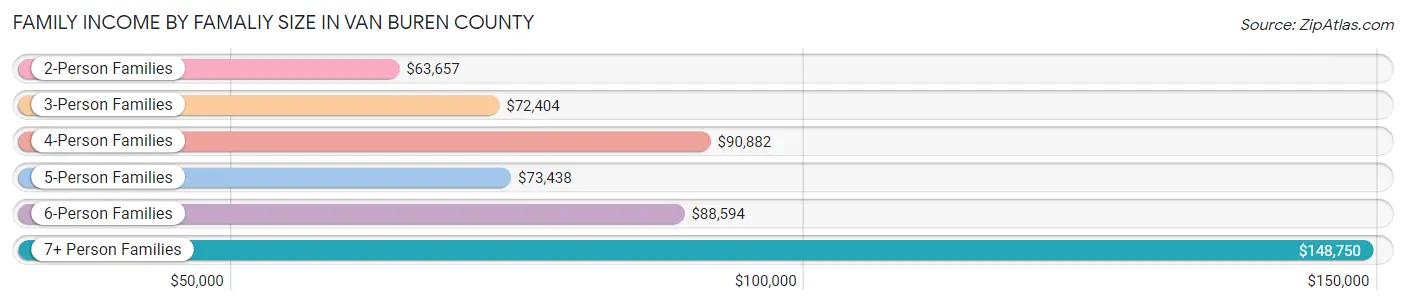
| Income Bracket | # Families | Median Income |
| 2-Person Families | 1,059 (56.9%) | $63,657 |
| 3-Person Families | 261 (14.0%) | $72,404 |
| 4-Person Families | 340 (18.3%) | $90,882 |
| 5-Person Families | 111 (6.0%) | $73,438 |
| 6-Person Families | 27 (1.5%) | $88,594 |
| 7+ Person Families | 62 (3.3%) | $148,750 |
| Total | 1,860 (100.0%) | $70,893 |
Family Income by Number of Earners in Van Buren County
The median family income in Van Buren County is $70,893, with families comprising 3+ earners (184) having the highest median family income of $151,111, while families with no earners (372) have the lowest median family income of $38,800, accounting for 9.9% and 20.0% of families, respectively.
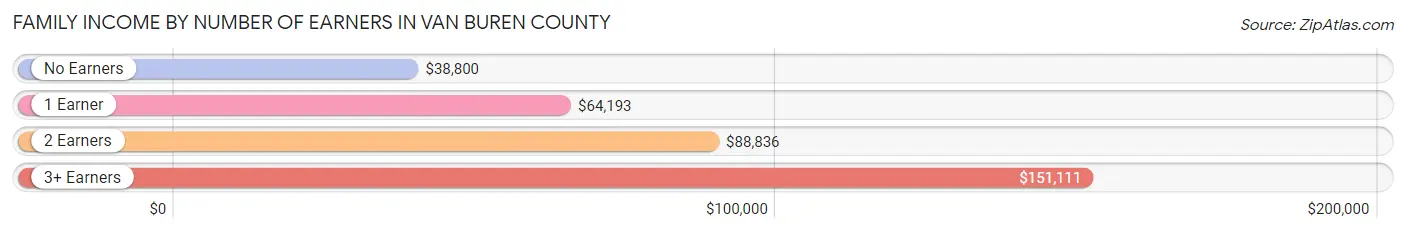
| Number of Earners | # Families | Median Income |
| No Earners | 372 (20.0%) | $38,800 |
| 1 Earner | 603 (32.4%) | $64,193 |
| 2 Earners | 701 (37.7%) | $88,836 |
| 3+ Earners | 184 (9.9%) | $151,111 |
| Total | 1,860 (100.0%) | $70,893 |
Household Income in Van Buren County
Household Income Brackets in Van Buren County
With 756 households falling in the category, the $50,000 to $74,999 income range is the most frequent in Van Buren County, accounting for 26.6% of all households. In contrast, only 111 households (3.9%) fall into the $150,000 to $199,999 income bracket, making it the least populous group.
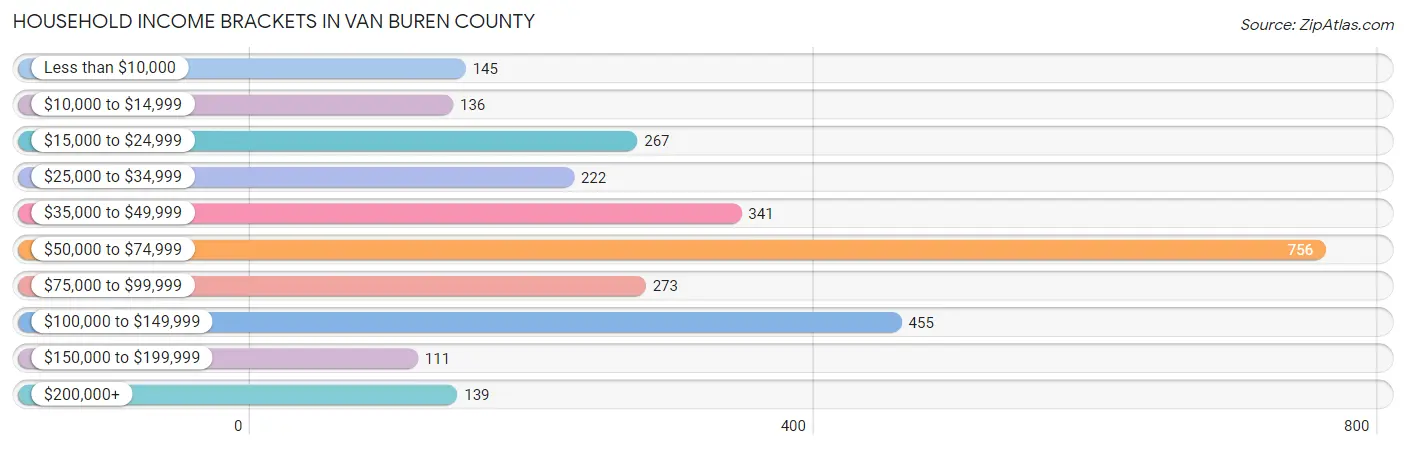
| Income Bracket | # Households | % Households |
| Less than $10,000 | 145 | 5.1% |
| $10,000 to $14,999 | 136 | 4.8% |
| $15,000 to $24,999 | 267 | 9.4% |
| $25,000 to $34,999 | 222 | 7.8% |
| $35,000 to $49,999 | 341 | 12.0% |
| $50,000 to $74,999 | 756 | 26.6% |
| $75,000 to $99,999 | 273 | 9.6% |
| $100,000 to $149,999 | 455 | 16.0% |
| $150,000 to $199,999 | 111 | 3.9% |
| $200,000+ | 139 | 4.9% |
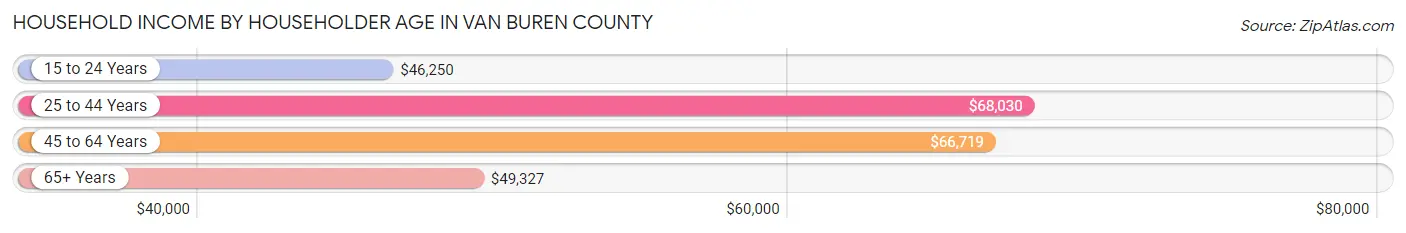
Household Income by Householder Age in Van Buren County
The median household income in Van Buren County is $58,417, with the highest median household income of $68,030 found in the 25 to 44 years age bracket for the primary householder. A total of 696 households (24.5%) fall into this category. Meanwhile, the 15 to 24 years age bracket for the primary householder has the lowest median household income of $46,250, with 61 households (2.1%) in this group.
| Income Bracket | # Households | Median Income |
| 15 to 24 Years | 61 (2.1%) | $46,250 |
| 25 to 44 Years | 696 (24.5%) | $68,030 |
| 45 to 64 Years | 1,053 (37.0%) | $66,719 |
| 65+ Years | 1,032 (36.3%) | $49,327 |
| Total | 2,842 (100.0%) | $58,417 |
Poverty in Van Buren County
Income Below Poverty by Sex and Age in Van Buren County
With 9.5% poverty level for males and 12.8% for females among the residents of Van Buren County, under 5 year old males and 6 to 11 year old females are the most vulnerable to poverty, with 39 males (18.2%) and 65 females (23.2%) in their respective age groups living below the poverty level.
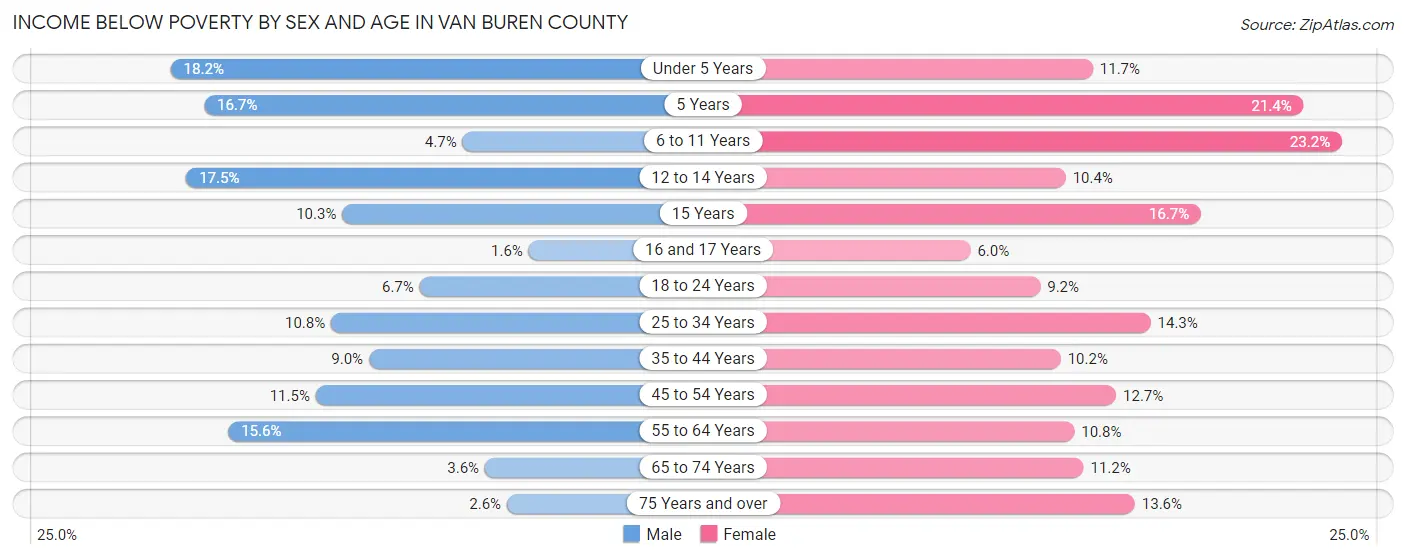
| Age Bracket | Male | Female |
| Under 5 Years | 39 (18.2%) | 24 (11.7%) |
| 5 Years | 6 (16.7%) | 12 (21.4%) |
| 6 to 11 Years | 13 (4.7%) | 65 (23.2%) |
| 12 to 14 Years | 28 (17.5%) | 8 (10.4%) |
| 15 Years | 4 (10.3%) | 11 (16.7%) |
| 16 and 17 Years | 2 (1.6%) | 4 (6.0%) |
| 18 to 24 Years | 17 (6.7%) | 22 (9.2%) |
| 25 to 34 Years | 36 (10.8%) | 49 (14.3%) |
| 35 to 44 Years | 37 (9.0%) | 38 (10.2%) |
| 45 to 54 Years | 51 (11.5%) | 48 (12.7%) |
| 55 to 64 Years | 86 (15.5%) | 56 (10.8%) |
| 65 to 74 Years | 17 (3.6%) | 59 (11.2%) |
| 75 Years and over | 8 (2.6%) | 48 (13.6%) |
| Total | 344 (9.5%) | 444 (12.8%) |
Income Above Poverty by Sex and Age in Van Buren County
According to the poverty statistics in Van Buren County, males aged 16 and 17 years and females aged 16 and 17 years are the age groups that are most secure financially, with 98.4% of males and 94.0% of females in these age groups living above the poverty line.
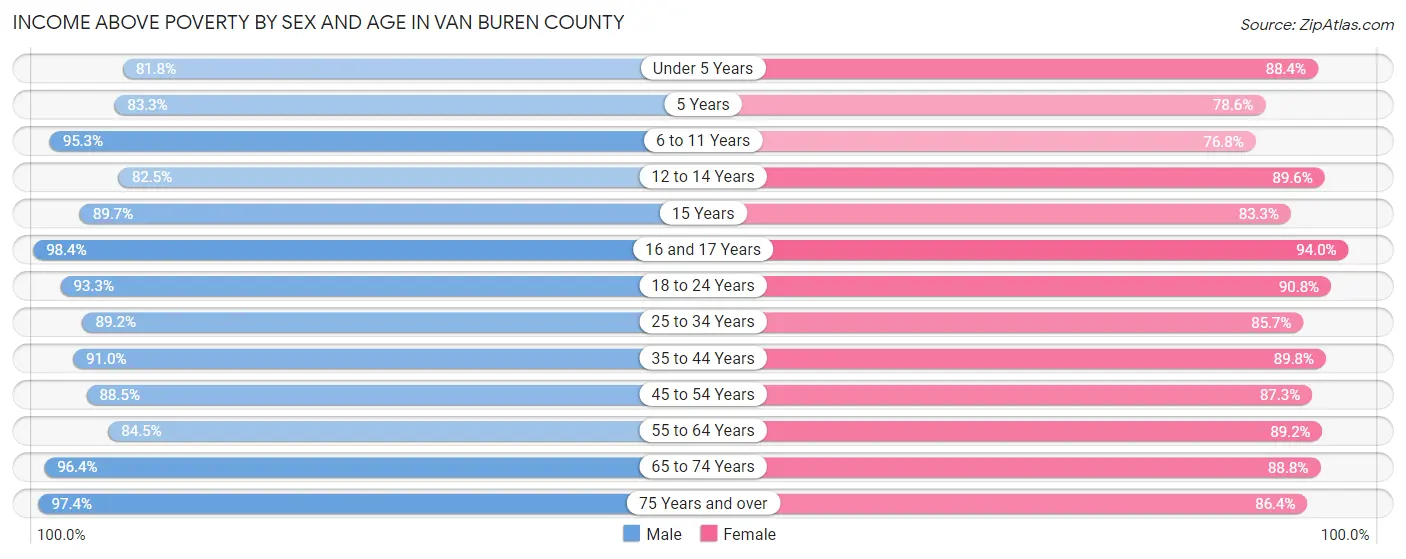
| Age Bracket | Male | Female |
| Under 5 Years | 175 (81.8%) | 182 (88.3%) |
| 5 Years | 30 (83.3%) | 44 (78.6%) |
| 6 to 11 Years | 265 (95.3%) | 215 (76.8%) |
| 12 to 14 Years | 132 (82.5%) | 69 (89.6%) |
| 15 Years | 35 (89.7%) | 55 (83.3%) |
| 16 and 17 Years | 122 (98.4%) | 63 (94.0%) |
| 18 to 24 Years | 238 (93.3%) | 217 (90.8%) |
| 25 to 34 Years | 298 (89.2%) | 293 (85.7%) |
| 35 to 44 Years | 373 (91.0%) | 336 (89.8%) |
| 45 to 54 Years | 393 (88.5%) | 329 (87.3%) |
| 55 to 64 Years | 467 (84.5%) | 463 (89.2%) |
| 65 to 74 Years | 450 (96.4%) | 467 (88.8%) |
| 75 Years and over | 297 (97.4%) | 305 (86.4%) |
| Total | 3,275 (90.5%) | 3,038 (87.3%) |
Income Below Poverty Among Married-Couple Families in Van Buren County
The poverty statistics for married-couple families in Van Buren County show that 5.1% or 80 of the total 1,565 families live below the poverty line. Families with 3 or 4 children have the highest poverty rate of 10.1%, comprising of 9 families. On the other hand, families with 5 or more children have the lowest poverty rate of 0.0%, which includes 0 families.
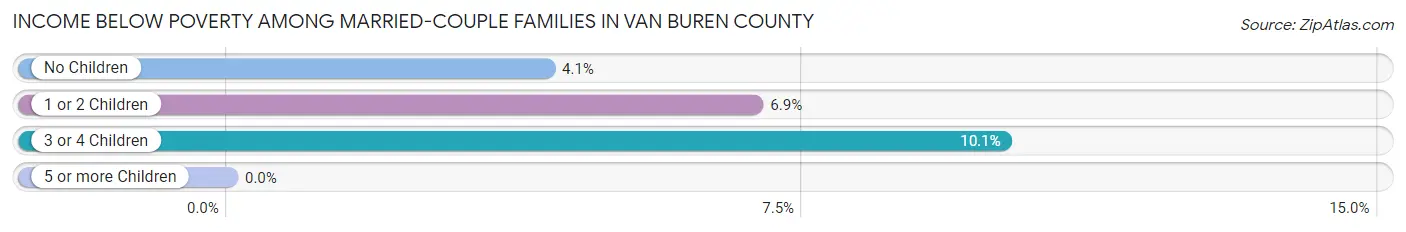
| Children | Above Poverty | Below Poverty |
| No Children | 973 (95.9%) | 42 (4.1%) |
| 1 or 2 Children | 394 (93.1%) | 29 (6.9%) |
| 3 or 4 Children | 80 (89.9%) | 9 (10.1%) |
| 5 or more Children | 38 (100.0%) | 0 (0.0%) |
| Total | 1,485 (94.9%) | 80 (5.1%) |
Income Below Poverty Among Single-Parent Households in Van Buren County
According to the poverty data in Van Buren County, 18.1% or 13 single-father households and 24.7% or 55 single-mother households are living below the poverty line. Among single-father households, those with 3 or 4 children have the highest poverty rate, with 8 households (72.7%) experiencing poverty. Likewise, among single-mother households, those with 1 or 2 children have the highest poverty rate, with 41 households (39.8%) falling below the poverty line.
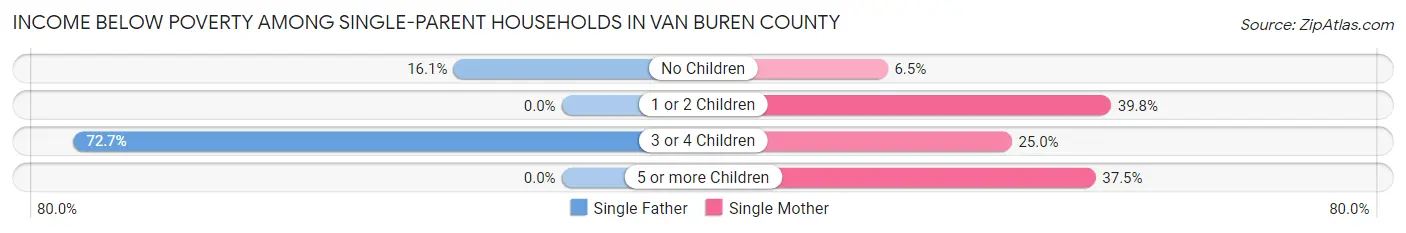
| Children | Single Father | Single Mother |
| No Children | 5 (16.1%) | 6 (6.5%) |
| 1 or 2 Children | 0 (0.0%) | 41 (39.8%) |
| 3 or 4 Children | 8 (72.7%) | 5 (25.0%) |
| 5 or more Children | 0 (0.0%) | 3 (37.5%) |
| Total | 13 (18.1%) | 55 (24.7%) |
Income Below Poverty Among Married-Couple vs Single-Parent Households in Van Buren County
The poverty data for Van Buren County shows that 80 of the married-couple family households (5.1%) and 68 of the single-parent households (23.1%) are living below the poverty level. Within the married-couple family households, those with 3 or 4 children have the highest poverty rate, with 9 households (10.1%) falling below the poverty line. Among the single-parent households, those with 3 or 4 children have the highest poverty rate, with 13 household (41.9%) living below poverty.
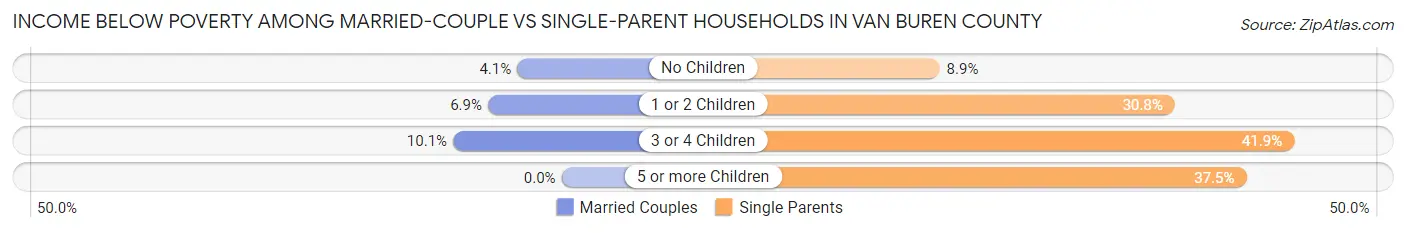
| Children | Married-Couple Families | Single-Parent Households |
| No Children | 42 (4.1%) | 11 (8.9%) |
| 1 or 2 Children | 29 (6.9%) | 41 (30.8%) |
| 3 or 4 Children | 9 (10.1%) | 13 (41.9%) |
| 5 or more Children | 0 (0.0%) | 3 (37.5%) |
| Total | 80 (5.1%) | 68 (23.1%) |
Race in Van Buren County
The most populous races in Van Buren County are White / Caucasian (6,982 | 96.9%), Hispanic or Latino (118 | 1.6%), and Two or more Races (104 | 1.4%).
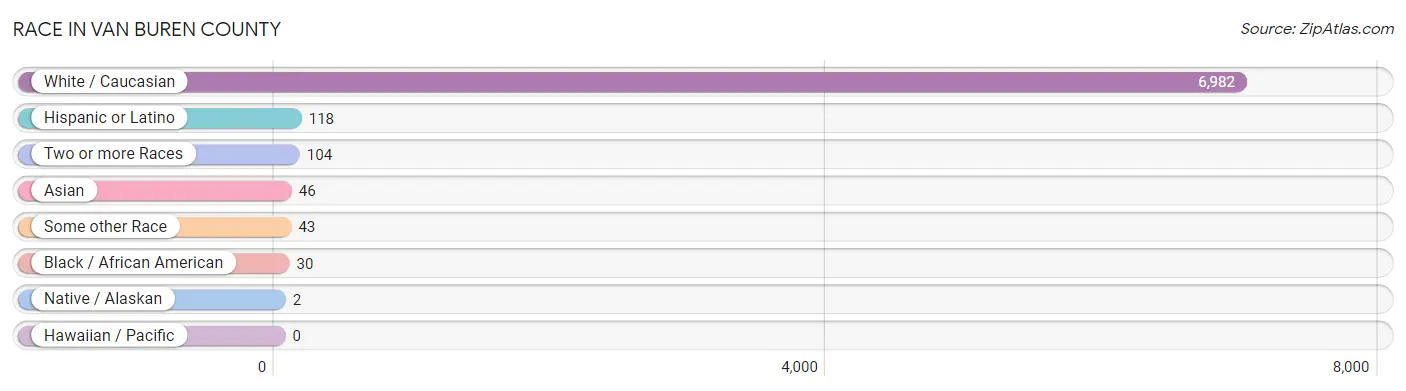
| Race | # Population | % Population |
| Asian | 46 | 0.6% |
| Black / African American | 30 | 0.4% |
| Hawaiian / Pacific | 0 | 0.0% |
| Hispanic or Latino | 118 | 1.6% |
| Native / Alaskan | 2 | 0.0% |
| White / Caucasian | 6,982 | 96.9% |
| Two or more Races | 104 | 1.4% |
| Some other Race | 43 | 0.6% |
| Total | 7,207 | 100.0% |
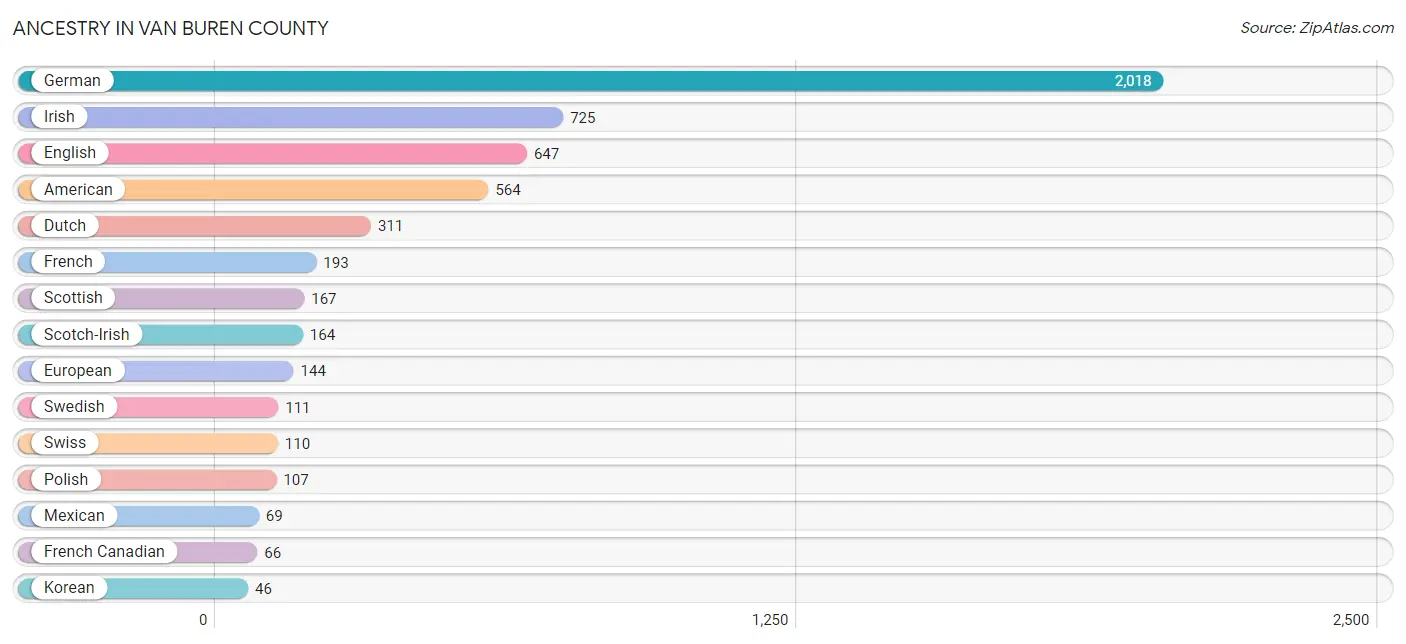
Ancestry in Van Buren County
The most populous ancestries reported in Van Buren County are German (2,018 | 28.0%), Irish (725 | 10.1%), English (647 | 9.0%), American (564 | 7.8%), and Dutch (311 | 4.3%), together accounting for 59.2% of all Van Buren County residents.
| Ancestry | # Population | % Population |
| African | 7 | 0.1% |
| American | 564 | 7.8% |
| Apache | 1 | 0.0% |
| Belgian | 11 | 0.2% |
| British | 29 | 0.4% |
| Central American | 2 | 0.0% |
| Cherokee | 18 | 0.3% |
| Choctaw | 1 | 0.0% |
| Czech | 42 | 0.6% |
| Czechoslovakian | 15 | 0.2% |
| Danish | 13 | 0.2% |
| Dutch | 311 | 4.3% |
| English | 647 | 9.0% |
| European | 144 | 2.0% |
| French | 193 | 2.7% |
| French Canadian | 66 | 0.9% |
| German | 2,018 | 28.0% |
| Hungarian | 18 | 0.3% |
| Irish | 725 | 10.1% |
| Italian | 28 | 0.4% |
| Korean | 46 | 0.6% |
| Lithuanian | 2 | 0.0% |
| Mexican | 69 | 1.0% |
| Nicaraguan | 2 | 0.0% |
| Nigerian | 1 | 0.0% |
| Northern European | 42 | 0.6% |
| Norwegian | 21 | 0.3% |
| Pennsylvania German | 8 | 0.1% |
| Polish | 107 | 1.5% |
| Russian | 16 | 0.2% |
| Scandinavian | 43 | 0.6% |
| Scotch-Irish | 164 | 2.3% |
| Scottish | 167 | 2.3% |
| Serbian | 4 | 0.1% |
| Spanish | 10 | 0.1% |
| Subsaharan African | 8 | 0.1% |
| Swedish | 111 | 1.5% |
| Swiss | 110 | 1.5% |
| Welsh | 16 | 0.2% | View All 39 Rows |
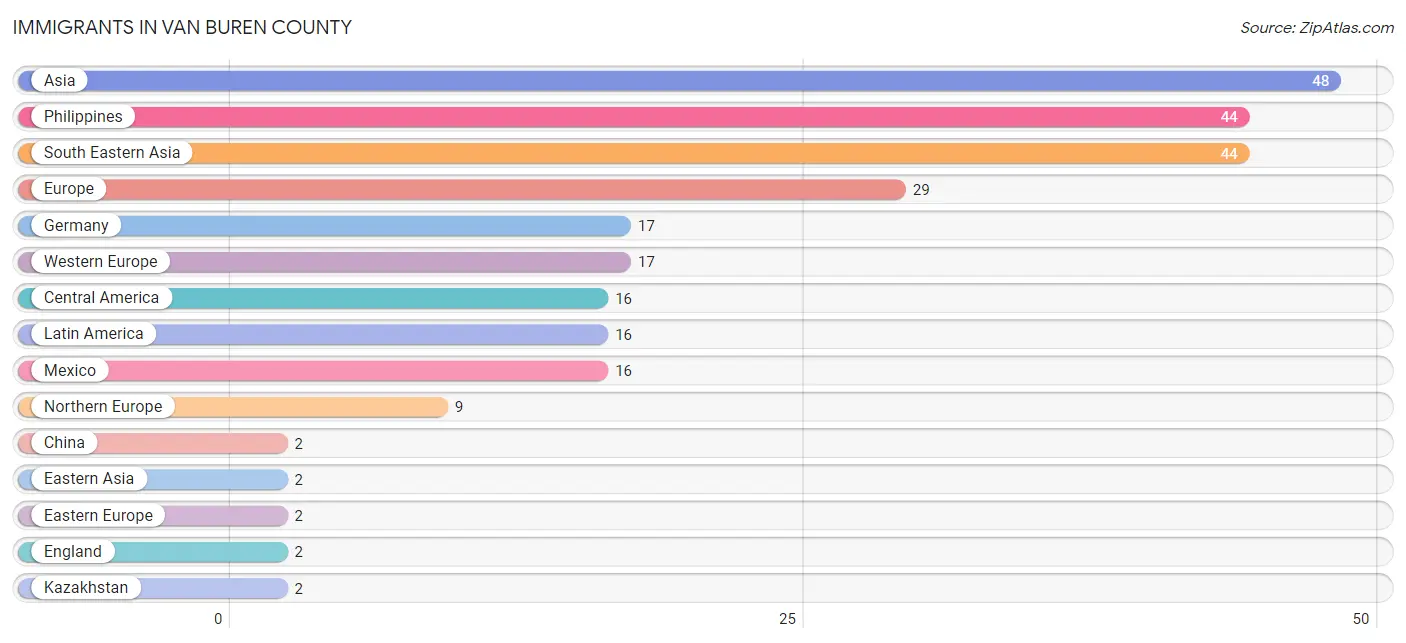
Immigrants in Van Buren County
The most numerous immigrant groups reported in Van Buren County came from Asia (48 | 0.7%), Philippines (44 | 0.6%), South Eastern Asia (44 | 0.6%), Europe (29 | 0.4%), and Germany (17 | 0.2%), together accounting for 2.5% of all Van Buren County residents.
| Immigration Origin | # Population | % Population |
| Africa | 1 | 0.0% |
| Asia | 48 | 0.7% |
| Central America | 16 | 0.2% |
| China | 2 | 0.0% |
| Eastern Asia | 2 | 0.0% |
| Eastern Europe | 2 | 0.0% |
| England | 2 | 0.0% |
| Europe | 29 | 0.4% |
| Germany | 17 | 0.2% |
| Italy | 1 | 0.0% |
| Kazakhstan | 2 | 0.0% |
| Latin America | 16 | 0.2% |
| Mexico | 16 | 0.2% |
| Nigeria | 1 | 0.0% |
| Northern Europe | 9 | 0.1% |
| Philippines | 44 | 0.6% |
| Russia | 2 | 0.0% |
| South Central Asia | 2 | 0.0% |
| South Eastern Asia | 44 | 0.6% |
| Southern Europe | 1 | 0.0% |
| Western Africa | 1 | 0.0% |
| Western Europe | 17 | 0.2% | View All 22 Rows |
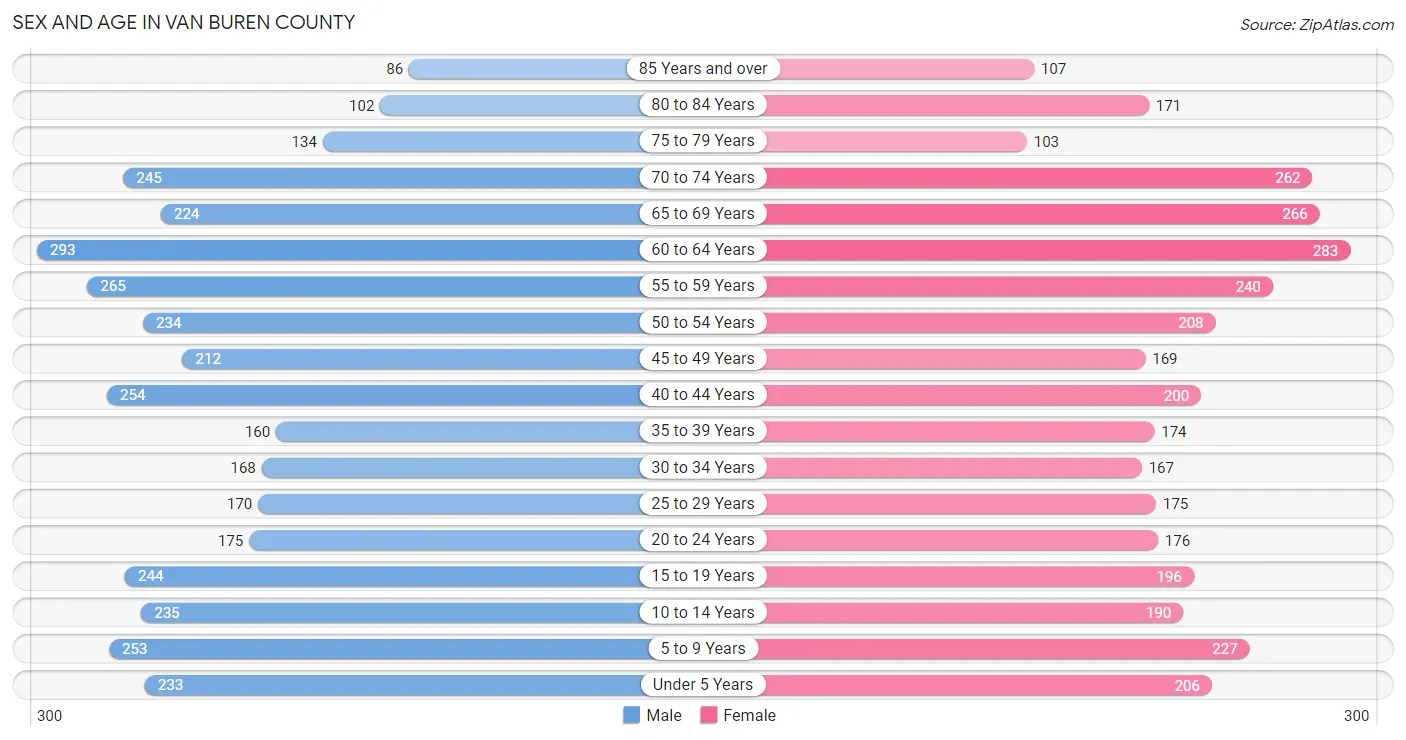
Sex and Age in Van Buren County
Sex and Age in Van Buren County
The most populous age groups in Van Buren County are 60 to 64 Years (293 | 8.0%) for men and 60 to 64 Years (283 | 8.0%) for women.
| Age Bracket | Male | Female |
| Under 5 Years | 233 (6.3%) | 206 (5.9%) |
| 5 to 9 Years | 253 (6.9%) | 227 (6.5%) |
| 10 to 14 Years | 235 (6.4%) | 190 (5.4%) |
| 15 to 19 Years | 244 (6.6%) | 196 (5.6%) |
| 20 to 24 Years | 175 (4.8%) | 176 (5.0%) |
| 25 to 29 Years | 170 (4.6%) | 175 (5.0%) |
| 30 to 34 Years | 168 (4.6%) | 167 (4.7%) |
| 35 to 39 Years | 160 (4.3%) | 174 (4.9%) |
| 40 to 44 Years | 254 (6.9%) | 200 (5.7%) |
| 45 to 49 Years | 212 (5.8%) | 169 (4.8%) |
| 50 to 54 Years | 234 (6.4%) | 208 (5.9%) |
| 55 to 59 Years | 265 (7.2%) | 240 (6.8%) |
| 60 to 64 Years | 293 (8.0%) | 283 (8.0%) |
| 65 to 69 Years | 224 (6.1%) | 266 (7.6%) |
| 70 to 74 Years | 245 (6.6%) | 262 (7.4%) |
| 75 to 79 Years | 134 (3.6%) | 103 (2.9%) |
| 80 to 84 Years | 102 (2.8%) | 171 (4.9%) |
| 85 Years and over | 86 (2.3%) | 107 (3.0%) |
| Total | 3,687 (100.0%) | 3,520 (100.0%) |
Families and Households in Van Buren County
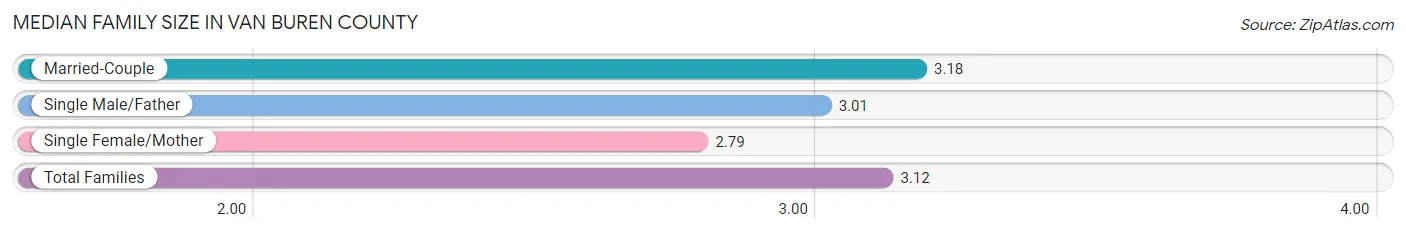
Median Family Size in Van Buren County
The median family size in Van Buren County is 3.12 persons per family, with married-couple families (1,565 | 84.1%) accounting for the largest median family size of 3.18 persons per family. On the other hand, single female/mother families (223 | 12.0%) represent the smallest median family size with 2.79 persons per family.
| Family Type | # Families | Family Size |
| Married-Couple | 1,565 (84.1%) | 3.18 |
| Single Male/Father | 72 (3.9%) | 3.01 |
| Single Female/Mother | 223 (12.0%) | 2.79 |
| Total Families | 1,860 (100.0%) | 3.12 |
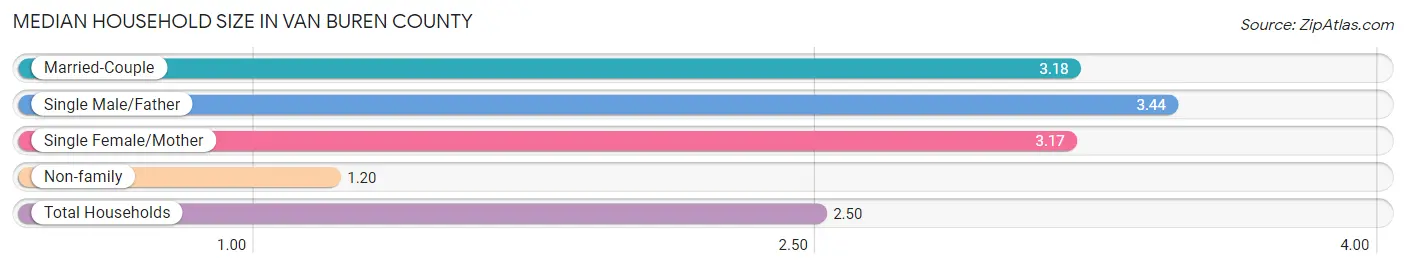
Median Household Size in Van Buren County
The median household size in Van Buren County is 2.50 persons per household, with single male/father households (72 | 2.5%) accounting for the largest median household size of 3.44 persons per household. non-family households (982 | 34.5%) represent the smallest median household size with 1.20 persons per household.
| Household Type | # Households | Household Size |
| Married-Couple | 1,565 (55.1%) | 3.18 |
| Single Male/Father | 72 (2.5%) | 3.44 |
| Single Female/Mother | 223 (7.9%) | 3.17 |
| Non-family | 982 (34.5%) | 1.20 |
| Total Households | 2,842 (100.0%) | 2.50 |
Household Size by Marriage Status in Van Buren County
Out of a total of 2,842 households in Van Buren County, 1,860 (65.4%) are family households, while 982 (34.5%) are nonfamily households. The most numerous type of family households are 2-person households, comprising 1,033, and the most common type of nonfamily households are 1-person households, comprising 838.
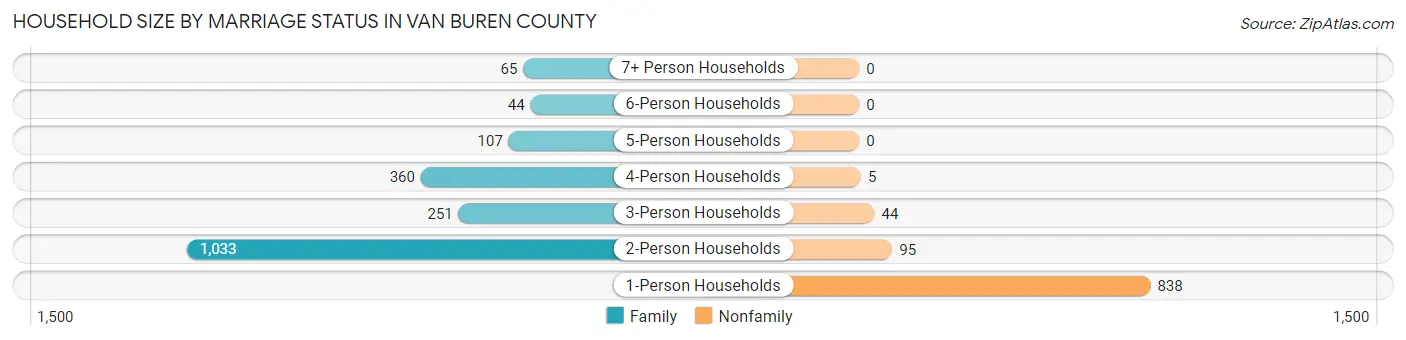
| Household Size | Family Households | Nonfamily Households |
| 1-Person Households | - | 838 (29.5%) |
| 2-Person Households | 1,033 (36.3%) | 95 (3.3%) |
| 3-Person Households | 251 (8.8%) | 44 (1.5%) |
| 4-Person Households | 360 (12.7%) | 5 (0.2%) |
| 5-Person Households | 107 (3.8%) | 0 (0.0%) |
| 6-Person Households | 44 (1.5%) | 0 (0.0%) |
| 7+ Person Households | 65 (2.3%) | 0 (0.0%) |
| Total | 1,860 (65.4%) | 982 (34.5%) |
Female Fertility in Van Buren County
Fertility by Age in Van Buren County
Average fertility rate in Van Buren County is 58.0 births per 1,000 women. Women in the age bracket of 20 to 34 years have the highest fertility rate with 139.0 births per 1,000 women. Women in the age bracket of 20 to 34 years acount for 96.0% of all women with births.
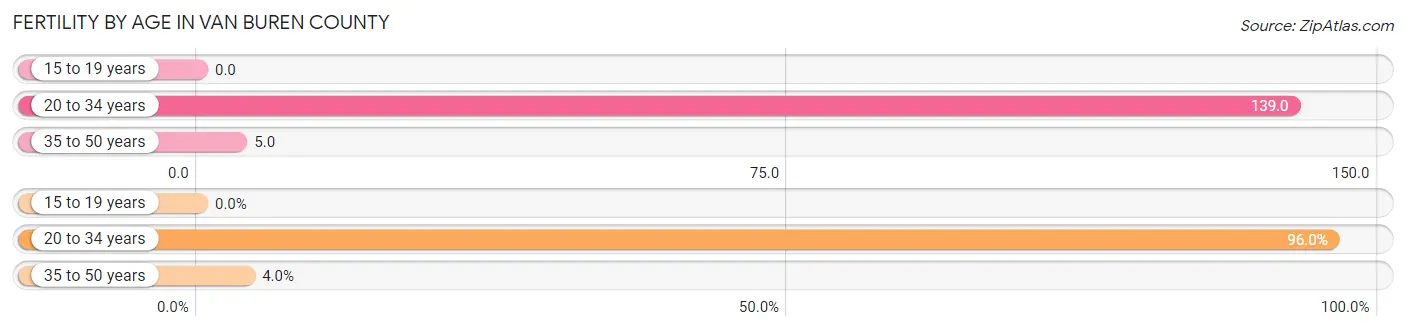
| Age Bracket | Women with Births | Births / 1,000 Women |
| 15 to 19 years | 0 (0.0%) | 0.0 |
| 20 to 34 years | 72 (96.0%) | 139.0 |
| 35 to 50 years | 3 (4.0%) | 5.0 |
| Total | 75 (100.0%) | 58.0 |
Fertility by Age by Marriage Status in Van Buren County
92.0% of women with births (75) in Van Buren County are married. The highest percentage of unmarried women with births falls into 35 to 50 years age bracket with 33.3% of them unmarried at the time of birth, while the lowest percentage of unmarried women with births belong to 20 to 34 years age bracket with 6.9% of them unmarried.
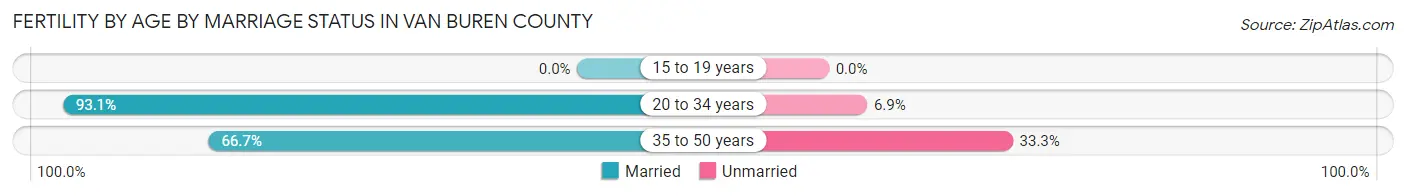
| Age Bracket | Married | Unmarried |
| 15 to 19 years | 0 (0.0%) | 0 (0.0%) |
| 20 to 34 years | 67 (93.1%) | 5 (6.9%) |
| 35 to 50 years | 2 (66.7%) | 1 (33.3%) |
| Total | 69 (92.0%) | 6 (8.0%) |
Fertility by Education in Van Buren County
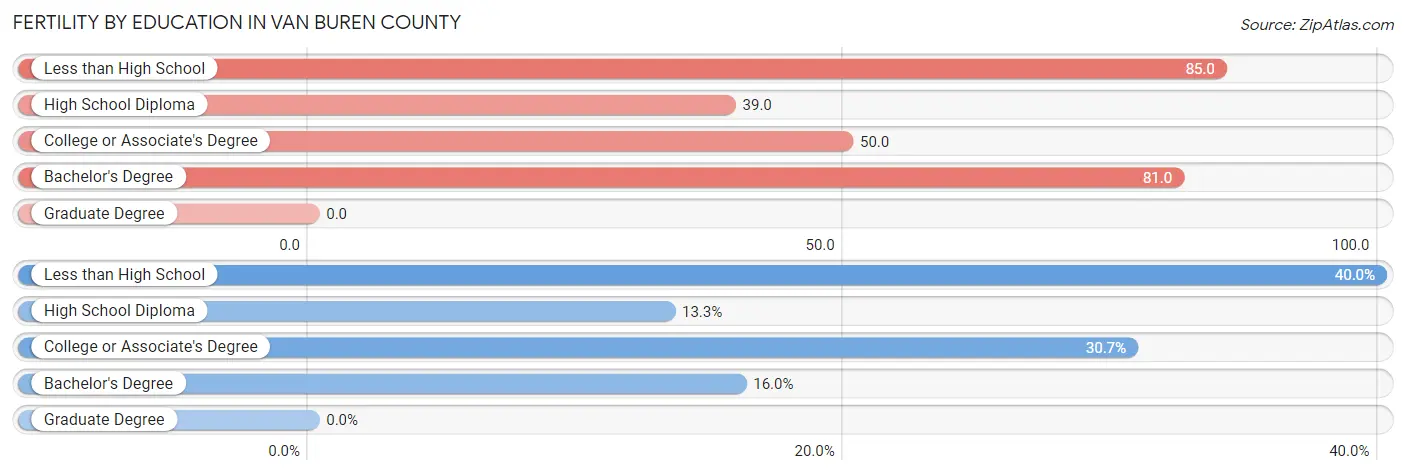
| Educational Attainment | Women with Births | Births / 1,000 Women |
| Less than High School | 30 (40.0%) | 85.0 |
| High School Diploma | 10 (13.3%) | 39.0 |
| College or Associate's Degree | 23 (30.7%) | 50.0 |
| Bachelor's Degree | 12 (16.0%) | 81.0 |
| Graduate Degree | 0 (0.0%) | 0.0 |
| Total | 75 (100.0%) | 58.0 |
Fertility by Education by Marriage Status in Van Buren County
8.0% of women with births in Van Buren County are unmarried. Women with the educational attainment of less than high school are most likely to be married with 100.0% of them married at childbirth, while women with the educational attainment of high school diploma are least likely to be married with 50.0% of them unmarried at childbirth.
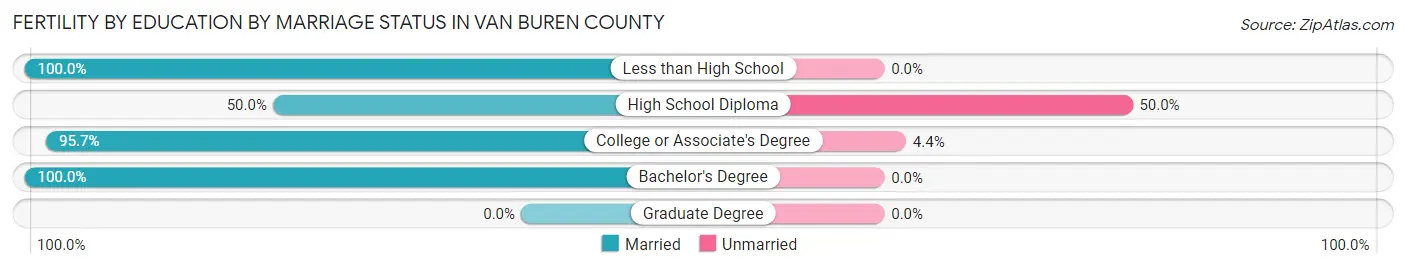
| Educational Attainment | Married | Unmarried |
| Less than High School | 30 (100.0%) | 0 (0.0%) |
| High School Diploma | 5 (50.0%) | 5 (50.0%) |
| College or Associate's Degree | 22 (95.7%) | 1 (4.3%) |
| Bachelor's Degree | 12 (100.0%) | 0 (0.0%) |
| Graduate Degree | 0 (0.0%) | 0 (0.0%) |
| Total | 69 (92.0%) | 6 (8.0%) |
Employment Characteristics in Van Buren County
Employment by Class of Employer in Van Buren County
Among the 2,918 employed individuals in Van Buren County, private company employees (1,744 | 59.8%), self-employed (not incorporated) (454 | 15.6%), and local government employees (332 | 11.4%) make up the most common classes of employment.
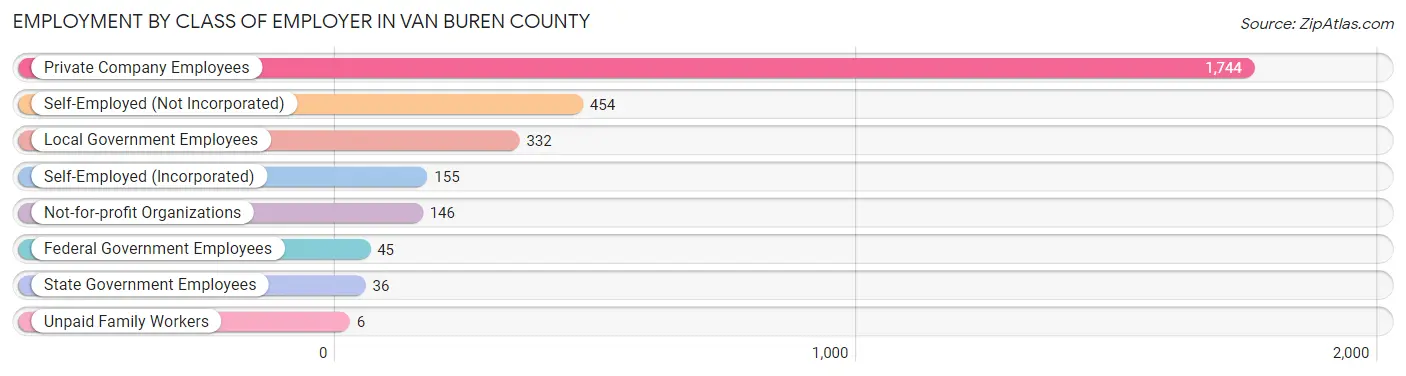
| Employer Class | # Employees | % Employees |
| Private Company Employees | 1,744 | 59.8% |
| Self-Employed (Incorporated) | 155 | 5.3% |
| Self-Employed (Not Incorporated) | 454 | 15.6% |
| Not-for-profit Organizations | 146 | 5.0% |
| Local Government Employees | 332 | 11.4% |
| State Government Employees | 36 | 1.2% |
| Federal Government Employees | 45 | 1.5% |
| Unpaid Family Workers | 6 | 0.2% |
| Total | 2,918 | 100.0% |
Employment Status by Age in Van Buren County
According to the labor force statistics for Van Buren County, out of the total population over 16 years of age (5,758), 55.9% or 3,219 individuals are in the labor force, with 4.9% or 158 of them unemployed. The age group with the highest labor force participation rate is 25 to 29 years, with 87.5% or 302 individuals in the labor force. Within the labor force, the 25 to 29 years age range has the highest percentage of unemployed individuals, with 9.6% or 29 of them being unemployed.
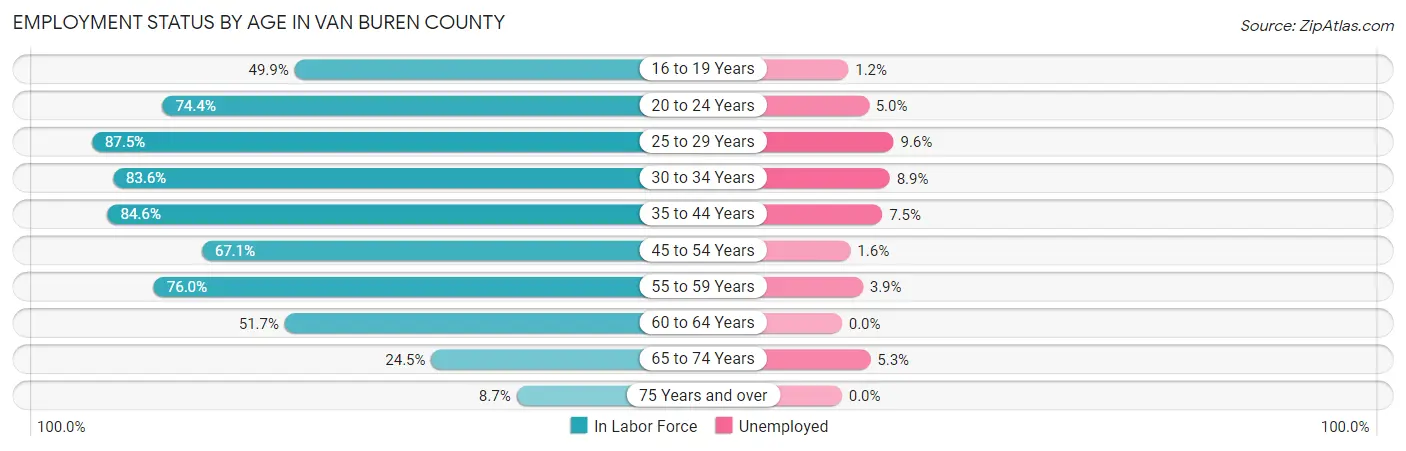
| Age Bracket | In Labor Force | Unemployed |
| 16 to 19 Years | 167 (49.9%) | 2 (1.2%) |
| 20 to 24 Years | 261 (74.4%) | 13 (5.0%) |
| 25 to 29 Years | 302 (87.5%) | 29 (9.6%) |
| 30 to 34 Years | 280 (83.6%) | 25 (8.9%) |
| 35 to 44 Years | 667 (84.6%) | 50 (7.5%) |
| 45 to 54 Years | 552 (67.1%) | 9 (1.6%) |
| 55 to 59 Years | 384 (76.0%) | 15 (3.9%) |
| 60 to 64 Years | 298 (51.7%) | 0 (0.0%) |
| 65 to 74 Years | 244 (24.5%) | 13 (5.3%) |
| 75 Years and over | 61 (8.7%) | 0 (0.0%) |
| Total | 3,219 (55.9%) | 158 (4.9%) |
Employment Status by Educational Attainment in Van Buren County
According to labor force statistics for Van Buren County, 73.6% of individuals (2,482) out of the total population between 25 and 64 years of age (3,372) are in the labor force, with 5.2% or 129 of them being unemployed. The group with the highest labor force participation rate are those with the educational attainment of bachelor's degree or higher, with 89.4% or 487 individuals in the labor force. Within the labor force, individuals with college / associate degree education have the highest percentage of unemployment, with 8.9% or 77 of them being unemployed.
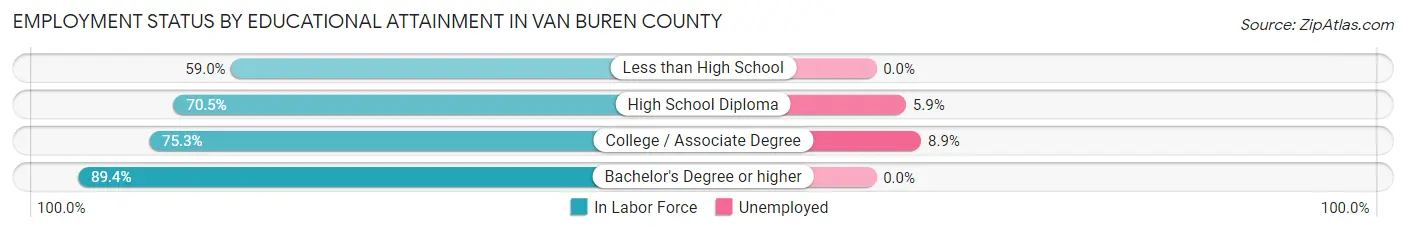
| Educational Attainment | In Labor Force | Unemployed |
| Less than High School | 269 (59.0%) | 0 (0.0%) |
| High School Diploma | 864 (70.5%) | 72 (5.9%) |
| College / Associate Degree | 863 (75.3%) | 102 (8.9%) |
| Bachelor's Degree or higher | 487 (89.4%) | 0 (0.0%) |
| Total | 2,482 (73.6%) | 175 (5.2%) |
Employment Occupations by Sex in Van Buren County
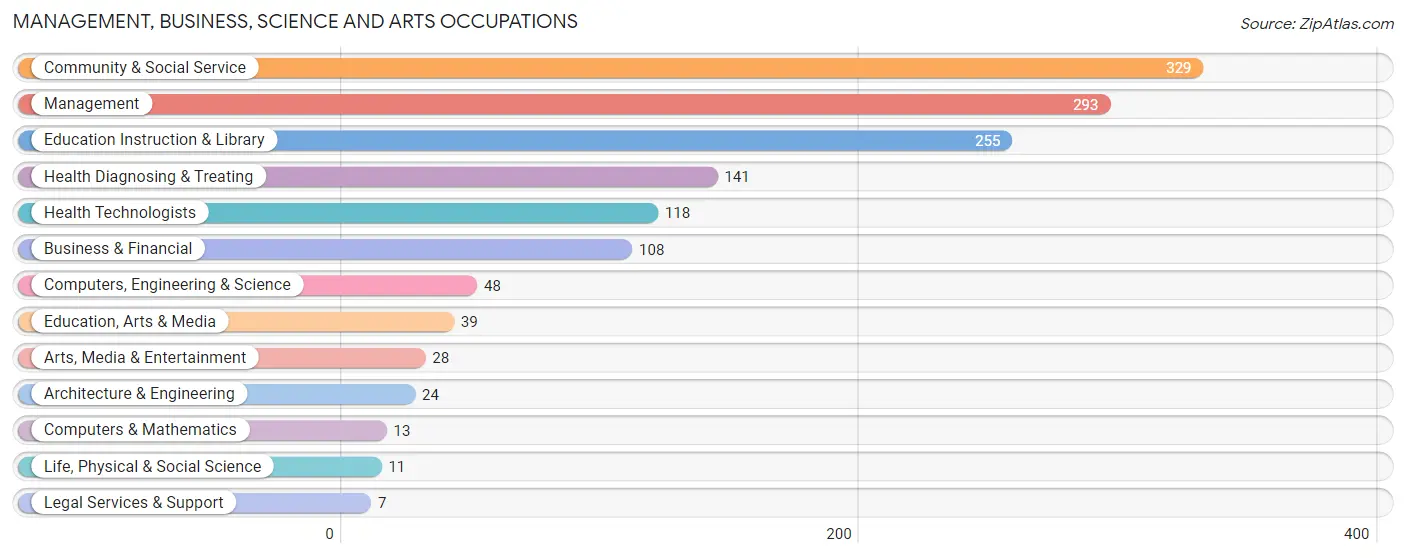
Management, Business, Science and Arts Occupations
The most common Management, Business, Science and Arts occupations in Van Buren County are Community & Social Service (329 | 10.7%), Management (293 | 9.6%), Education Instruction & Library (255 | 8.3%), Health Diagnosing & Treating (141 | 4.6%), and Health Technologists (118 | 3.9%).
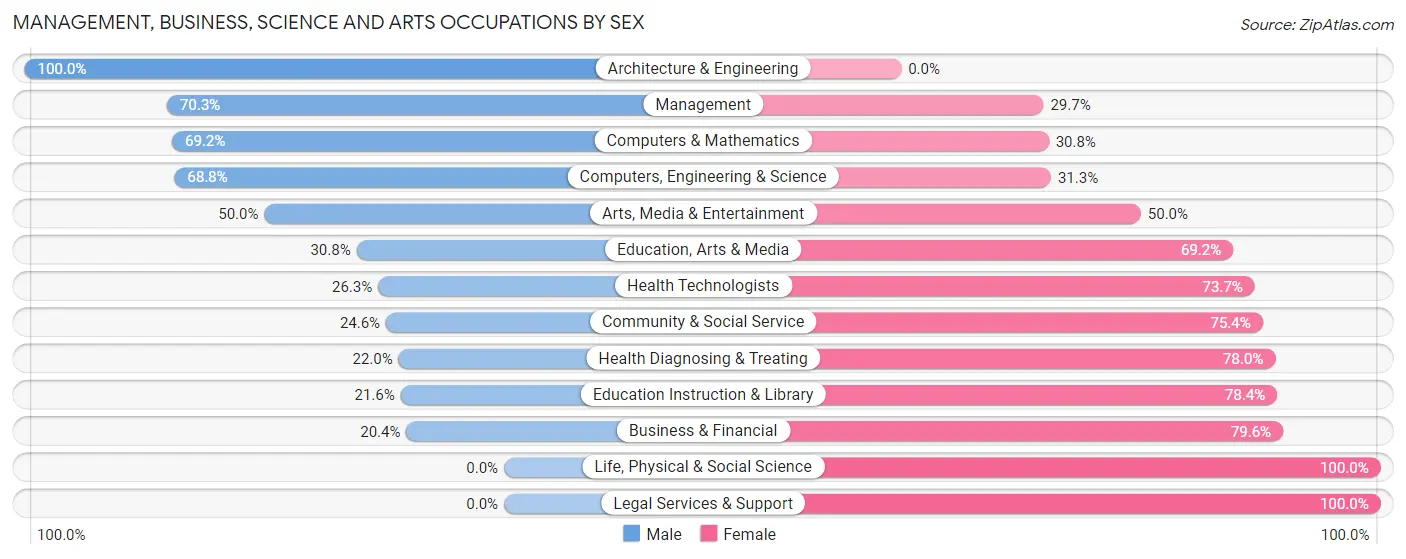
Management, Business, Science and Arts Occupations by Sex
Within the Management, Business, Science and Arts occupations in Van Buren County, the most male-oriented occupations are Architecture & Engineering (100.0%), Management (70.3%), and Computers & Mathematics (69.2%), while the most female-oriented occupations are Life, Physical & Social Science (100.0%), Legal Services & Support (100.0%), and Business & Financial (79.6%).
| Occupation | Male | Female |
| Management | 206 (70.3%) | 87 (29.7%) |
| Business & Financial | 22 (20.4%) | 86 (79.6%) |
| Computers, Engineering & Science | 33 (68.8%) | 15 (31.2%) |
| Computers & Mathematics | 9 (69.2%) | 4 (30.8%) |
| Architecture & Engineering | 24 (100.0%) | 0 (0.0%) |
| Life, Physical & Social Science | 0 (0.0%) | 11 (100.0%) |
| Community & Social Service | 81 (24.6%) | 248 (75.4%) |
| Education, Arts & Media | 12 (30.8%) | 27 (69.2%) |
| Legal Services & Support | 0 (0.0%) | 7 (100.0%) |
| Education Instruction & Library | 55 (21.6%) | 200 (78.4%) |
| Arts, Media & Entertainment | 14 (50.0%) | 14 (50.0%) |
| Health Diagnosing & Treating | 31 (22.0%) | 110 (78.0%) |
| Health Technologists | 31 (26.3%) | 87 (73.7%) |
| Total (Category) | 373 (40.6%) | 546 (59.4%) |
| Total (Overall) | 1,744 (57.0%) | 1,316 (43.0%) |
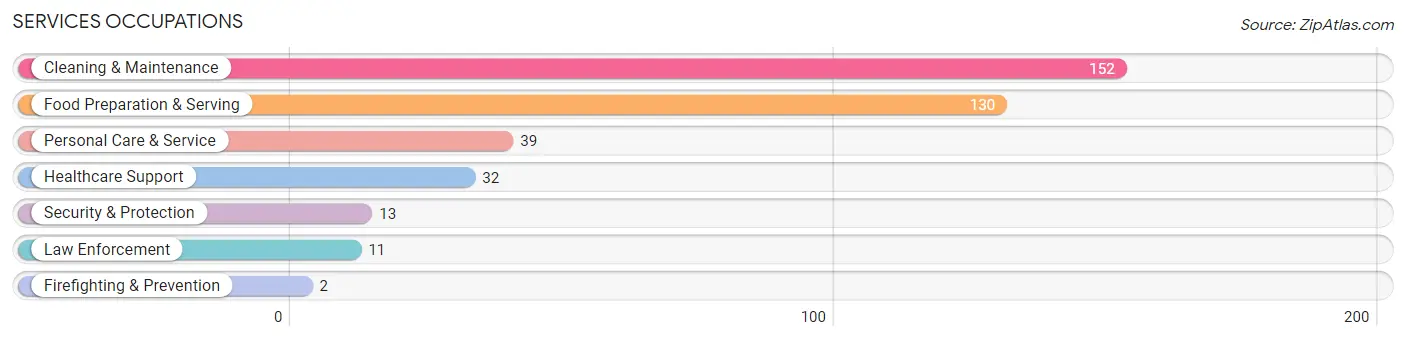
Services Occupations
The most common Services occupations in Van Buren County are Cleaning & Maintenance (152 | 5.0%), Food Preparation & Serving (130 | 4.3%), Personal Care & Service (39 | 1.3%), Healthcare Support (32 | 1.1%), and Security & Protection (13 | 0.4%).
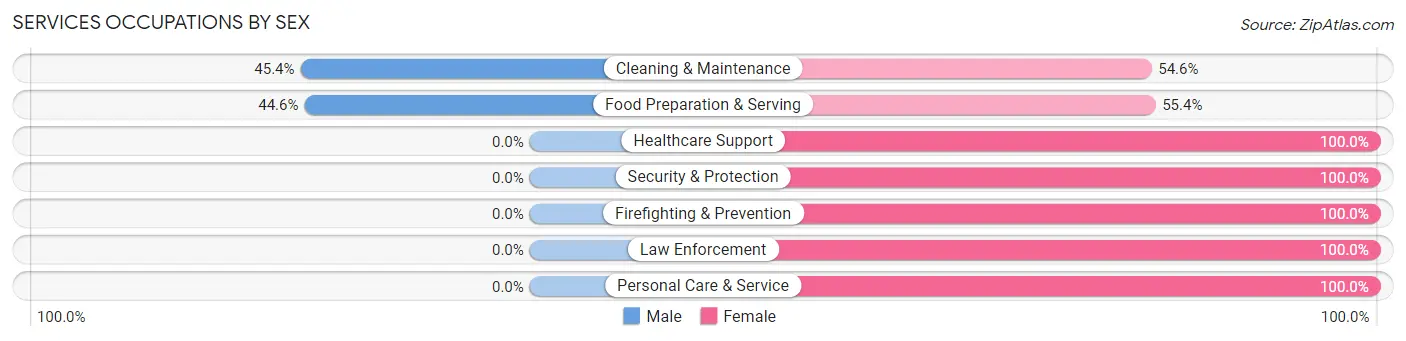
Services Occupations by Sex
Within the Services occupations in Van Buren County, the most male-oriented occupations are Cleaning & Maintenance (45.4%), and Food Preparation & Serving (44.6%), while the most female-oriented occupations are Healthcare Support (100.0%), Security & Protection (100.0%), and Firefighting & Prevention (100.0%).
| Occupation | Male | Female |
| Healthcare Support | 0 (0.0%) | 32 (100.0%) |
| Security & Protection | 0 (0.0%) | 13 (100.0%) |
| Firefighting & Prevention | 0 (0.0%) | 2 (100.0%) |
| Law Enforcement | 0 (0.0%) | 11 (100.0%) |
| Food Preparation & Serving | 58 (44.6%) | 72 (55.4%) |
| Cleaning & Maintenance | 69 (45.4%) | 83 (54.6%) |
| Personal Care & Service | 0 (0.0%) | 39 (100.0%) |
| Total (Category) | 127 (34.7%) | 239 (65.3%) |
| Total (Overall) | 1,744 (57.0%) | 1,316 (43.0%) |
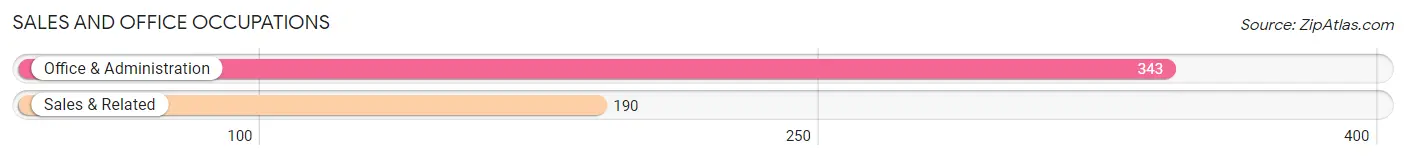
Sales and Office Occupations
The most common Sales and Office occupations in Van Buren County are Office & Administration (343 | 11.2%), and Sales & Related (190 | 6.2%).
Sales and Office Occupations by Sex
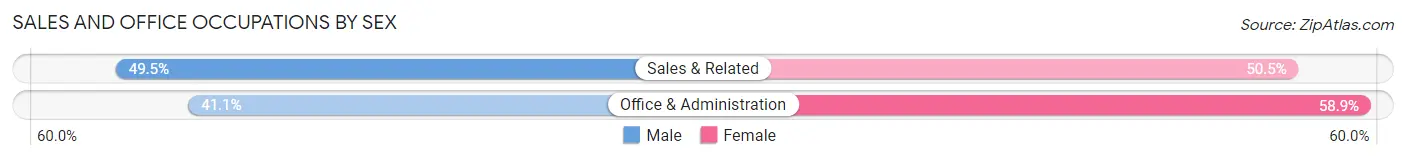
| Occupation | Male | Female |
| Sales & Related | 94 (49.5%) | 96 (50.5%) |
| Office & Administration | 141 (41.1%) | 202 (58.9%) |
| Total (Category) | 235 (44.1%) | 298 (55.9%) |
| Total (Overall) | 1,744 (57.0%) | 1,316 (43.0%) |
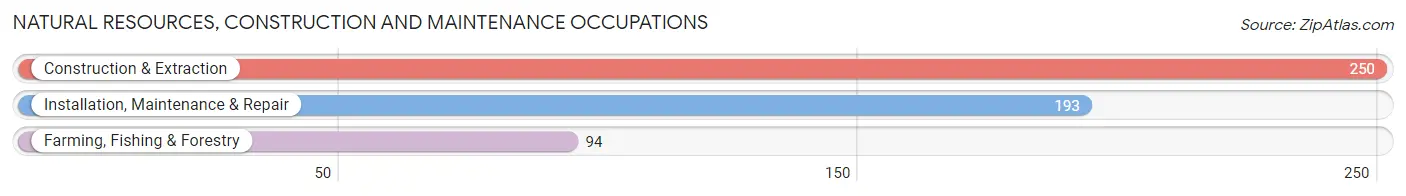
Natural Resources, Construction and Maintenance Occupations
The most common Natural Resources, Construction and Maintenance occupations in Van Buren County are Construction & Extraction (250 | 8.2%), Installation, Maintenance & Repair (193 | 6.3%), and Farming, Fishing & Forestry (94 | 3.1%).
Natural Resources, Construction and Maintenance Occupations by Sex
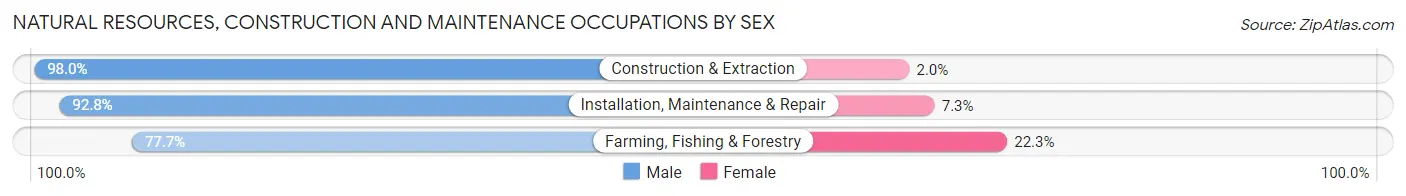
| Occupation | Male | Female |
| Farming, Fishing & Forestry | 73 (77.7%) | 21 (22.3%) |
| Construction & Extraction | 245 (98.0%) | 5 (2.0%) |
| Installation, Maintenance & Repair | 179 (92.7%) | 14 (7.2%) |
| Total (Category) | 497 (92.5%) | 40 (7.4%) |
| Total (Overall) | 1,744 (57.0%) | 1,316 (43.0%) |
Production, Transportation and Moving Occupations
The most common Production, Transportation and Moving occupations in Van Buren County are Production (363 | 11.9%), Transportation (197 | 6.4%), and Material Moving (145 | 4.7%).
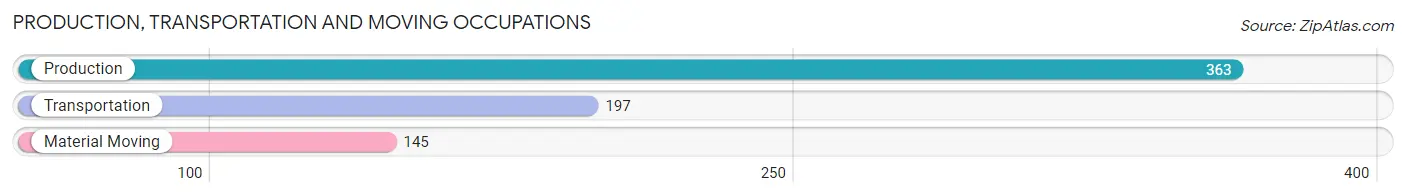
Production, Transportation and Moving Occupations by Sex
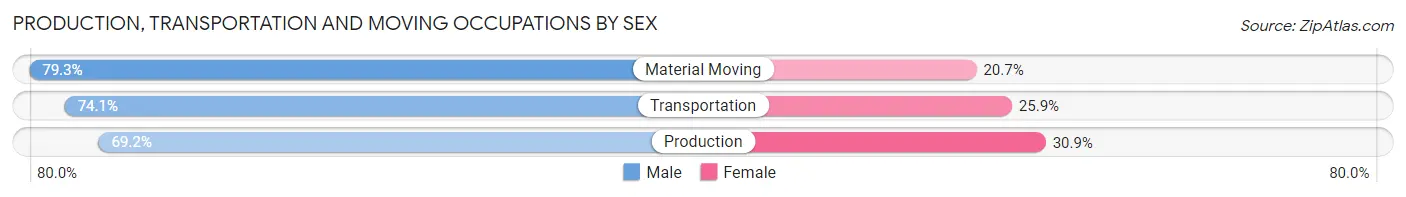
| Occupation | Male | Female |
| Production | 251 (69.2%) | 112 (30.8%) |
| Transportation | 146 (74.1%) | 51 (25.9%) |
| Material Moving | 115 (79.3%) | 30 (20.7%) |
| Total (Category) | 512 (72.6%) | 193 (27.4%) |
| Total (Overall) | 1,744 (57.0%) | 1,316 (43.0%) |
Employment Industries by Sex in Van Buren County
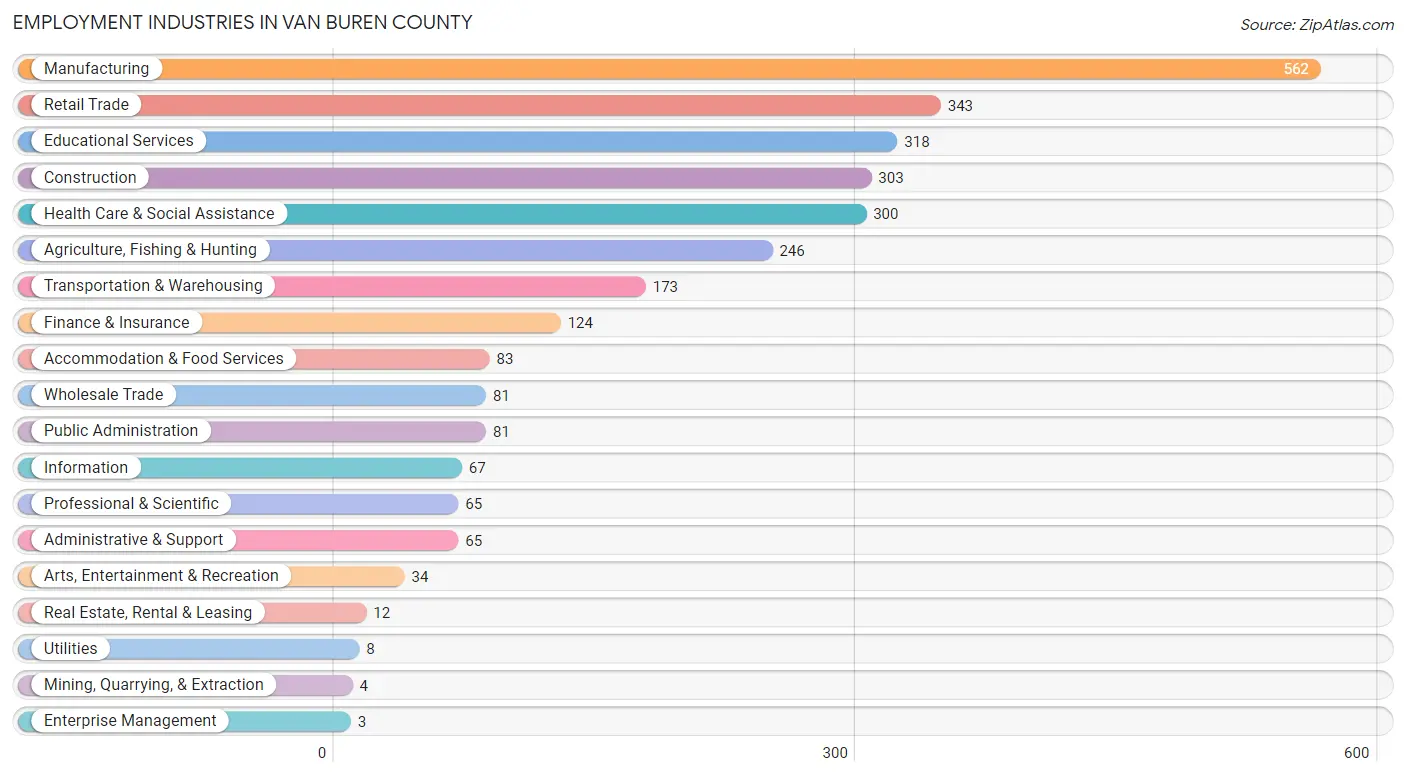
Employment Industries in Van Buren County
The major employment industries in Van Buren County include Manufacturing (562 | 18.4%), Retail Trade (343 | 11.2%), Educational Services (318 | 10.4%), Construction (303 | 9.9%), and Health Care & Social Assistance (300 | 9.8%).
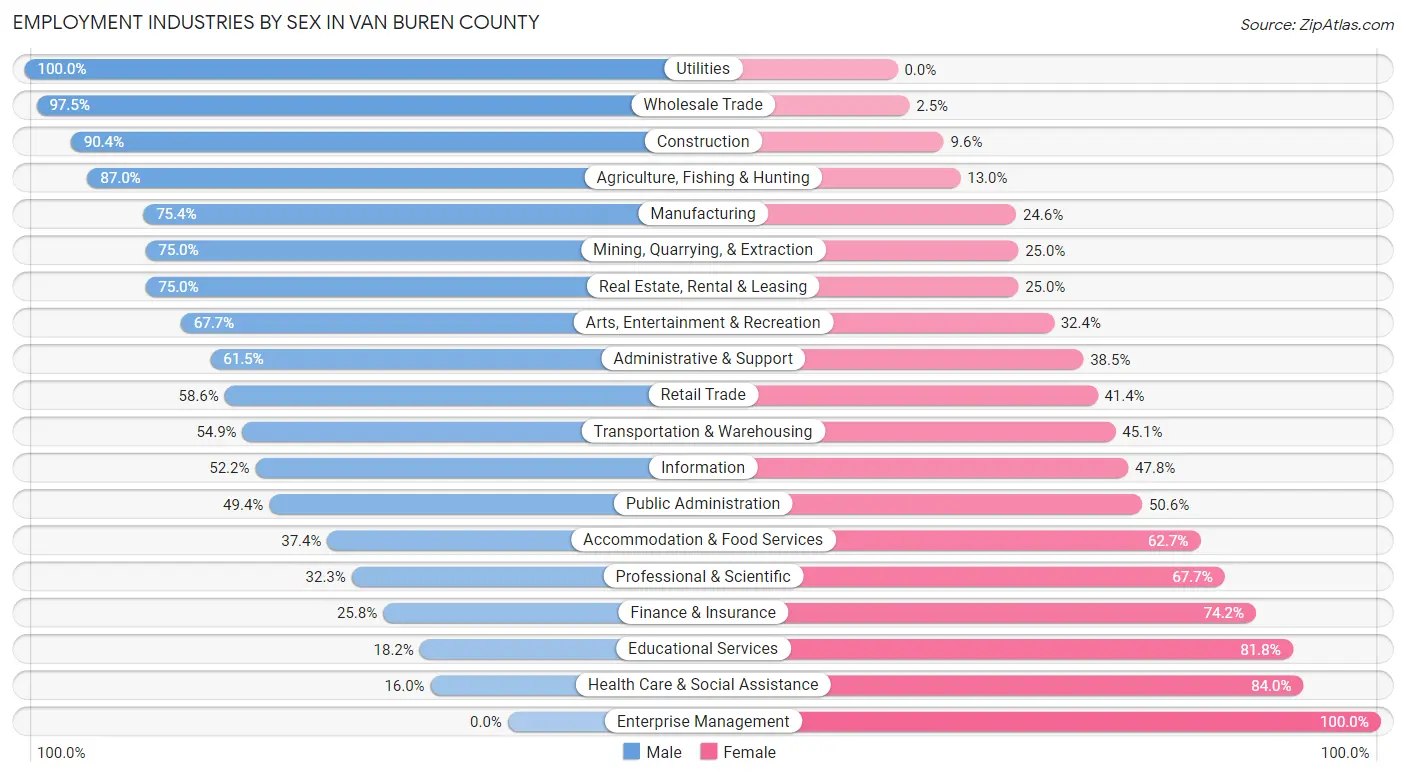
Employment Industries by Sex in Van Buren County
The Van Buren County industries that see more men than women are Utilities (100.0%), Wholesale Trade (97.5%), and Construction (90.4%), whereas the industries that tend to have a higher number of women are Enterprise Management (100.0%), Health Care & Social Assistance (84.0%), and Educational Services (81.8%).
| Industry | Male | Female |
| Agriculture, Fishing & Hunting | 214 (87.0%) | 32 (13.0%) |
| Mining, Quarrying, & Extraction | 3 (75.0%) | 1 (25.0%) |
| Construction | 274 (90.4%) | 29 (9.6%) |
| Manufacturing | 424 (75.4%) | 138 (24.6%) |
| Wholesale Trade | 79 (97.5%) | 2 (2.5%) |
| Retail Trade | 201 (58.6%) | 142 (41.4%) |
| Transportation & Warehousing | 95 (54.9%) | 78 (45.1%) |
| Utilities | 8 (100.0%) | 0 (0.0%) |
| Information | 35 (52.2%) | 32 (47.8%) |
| Finance & Insurance | 32 (25.8%) | 92 (74.2%) |
| Real Estate, Rental & Leasing | 9 (75.0%) | 3 (25.0%) |
| Professional & Scientific | 21 (32.3%) | 44 (67.7%) |
| Enterprise Management | 0 (0.0%) | 3 (100.0%) |
| Administrative & Support | 40 (61.5%) | 25 (38.5%) |
| Educational Services | 58 (18.2%) | 260 (81.8%) |
| Health Care & Social Assistance | 48 (16.0%) | 252 (84.0%) |
| Arts, Entertainment & Recreation | 23 (67.6%) | 11 (32.4%) |
| Accommodation & Food Services | 31 (37.3%) | 52 (62.6%) |
| Public Administration | 40 (49.4%) | 41 (50.6%) |
| Total | 1,744 (57.0%) | 1,316 (43.0%) |
Education in Van Buren County
School Enrollment in Van Buren County
The most common levels of schooling among the 1,327 students in Van Buren County are middle school (372 | 28.0%), elementary school (344 | 25.9%), and high school (327 | 24.6%).
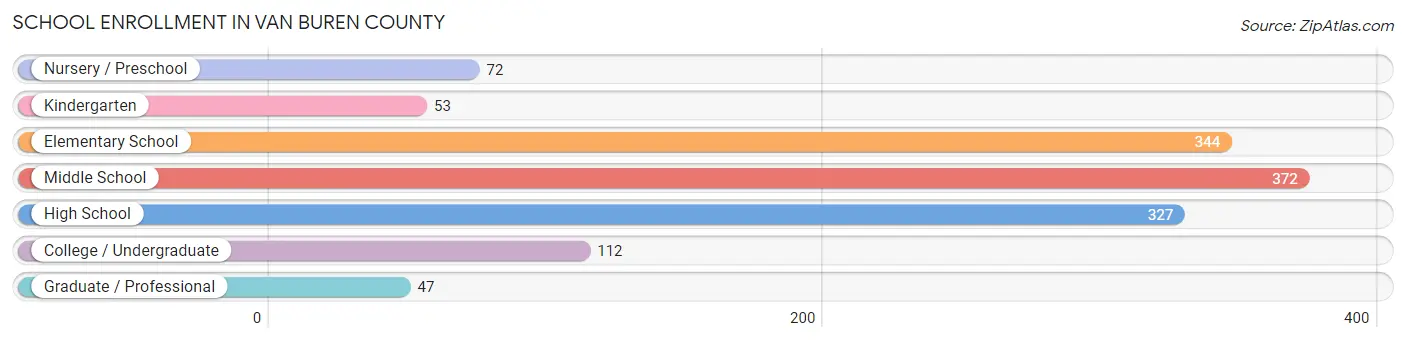
| School Level | # Students | % Students |
| Nursery / Preschool | 72 | 5.4% |
| Kindergarten | 53 | 4.0% |
| Elementary School | 344 | 25.9% |
| Middle School | 372 | 28.0% |
| High School | 327 | 24.6% |
| College / Undergraduate | 112 | 8.4% |
| Graduate / Professional | 47 | 3.5% |
| Total | 1,327 | 100.0% |
School Enrollment by Age by Funding Source in Van Buren County
Out of a total of 1,327 students who are enrolled in schools in Van Buren County, 314 (23.7%) attend a private institution, while the remaining 1,013 (76.3%) are enrolled in public schools. The age group of 10 to 14 year olds has the highest likelihood of being enrolled in private schools, with 150 (36.0% in the age bracket) enrolled. Conversely, the age group of 3 to 4 year olds has the lowest likelihood of being enrolled in a private school, with 49 (100.0% in the age bracket) attending a public institution.
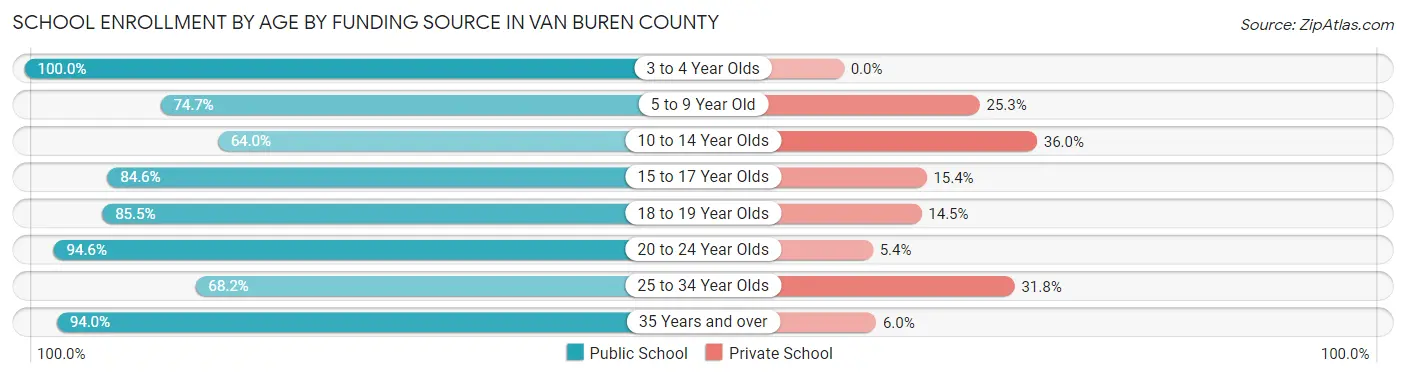
| Age Bracket | Public School | Private School |
| 3 to 4 Year Olds | 49 (100.0%) | 0 (0.0%) |
| 5 to 9 Year Old | 301 (74.7%) | 102 (25.3%) |
| 10 to 14 Year Olds | 267 (64.0%) | 150 (36.0%) |
| 15 to 17 Year Olds | 203 (84.6%) | 37 (15.4%) |
| 18 to 19 Year Olds | 65 (85.5%) | 11 (14.5%) |
| 20 to 24 Year Olds | 35 (94.6%) | 2 (5.4%) |
| 25 to 34 Year Olds | 15 (68.2%) | 7 (31.8%) |
| 35 Years and over | 78 (94.0%) | 5 (6.0%) |
| Total | 1,013 (76.3%) | 314 (23.7%) |
Educational Attainment by Field of Study in Van Buren County
Education (227 | 21.3%), business (201 | 18.9%), bio, nature & agricultural (128 | 12.0%), computers & mathematics (85 | 8.0%), and liberal arts & history (74 | 6.9%) are the most common fields of study among 1,066 individuals in Van Buren County who have obtained a bachelor's degree or higher.
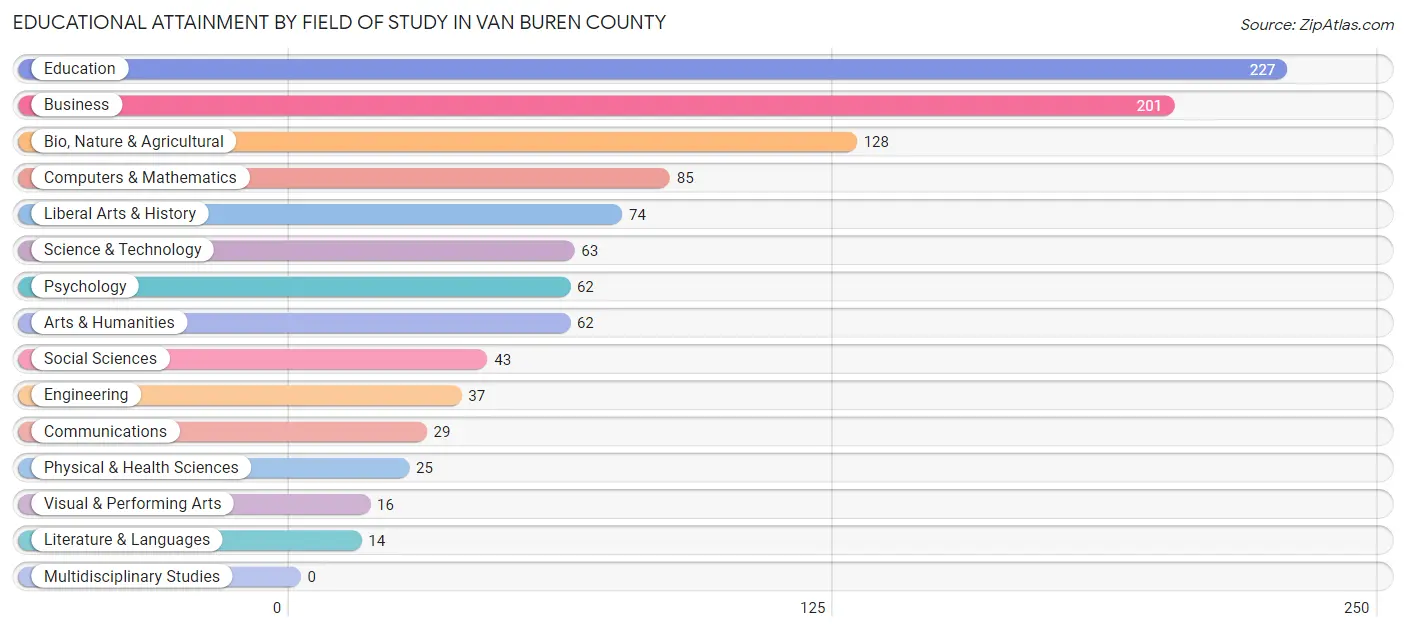
| Field of Study | # Graduates | % Graduates |
| Computers & Mathematics | 85 | 8.0% |
| Bio, Nature & Agricultural | 128 | 12.0% |
| Physical & Health Sciences | 25 | 2.4% |
| Psychology | 62 | 5.8% |
| Social Sciences | 43 | 4.0% |
| Engineering | 37 | 3.5% |
| Multidisciplinary Studies | 0 | 0.0% |
| Science & Technology | 63 | 5.9% |
| Business | 201 | 18.9% |
| Education | 227 | 21.3% |
| Literature & Languages | 14 | 1.3% |
| Liberal Arts & History | 74 | 6.9% |
| Visual & Performing Arts | 16 | 1.5% |
| Communications | 29 | 2.7% |
| Arts & Humanities | 62 | 5.8% |
| Total | 1,066 | 100.0% |
Transportation & Commute in Van Buren County
Vehicle Availability by Sex in Van Buren County
The most prevalent vehicle ownership categories in Van Buren County are males with 3 vehicles (485, accounting for 28.9%) and females with 3 vehicles (390, making up 39.3%).
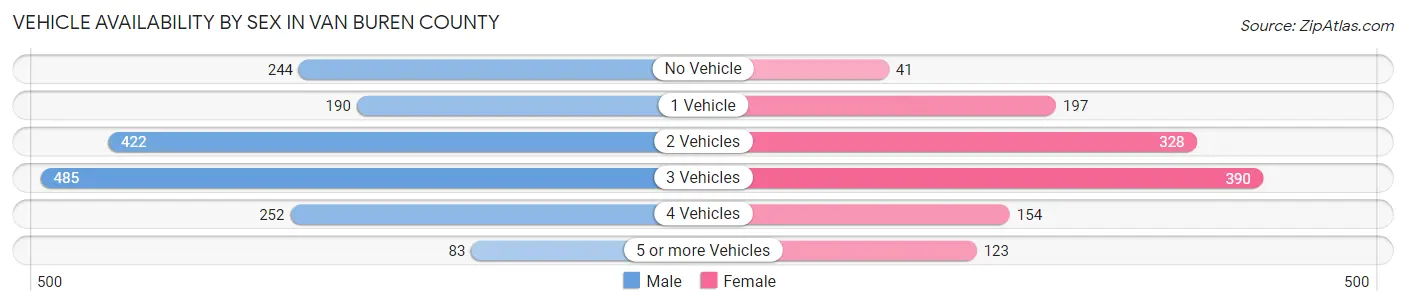
| Vehicles Available | Male | Female |
| No Vehicle | 244 (14.6%) | 41 (3.3%) |
| 1 Vehicle | 190 (11.3%) | 197 (16.0%) |
| 2 Vehicles | 422 (25.2%) | 328 (26.6%) |
| 3 Vehicles | 485 (28.9%) | 390 (31.6%) |
| 4 Vehicles | 252 (15.0%) | 154 (12.5%) |
| 5 or more Vehicles | 83 (5.0%) | 123 (10.0%) |
| Total | 1,676 (100.0%) | 1,233 (100.0%) |
Commute Time in Van Buren County
The most frequently occuring commute durations in Van Buren County are 5 to 9 minutes (428 commuters, 16.9%), 20 to 24 minutes (369 commuters, 14.6%), and 10 to 14 minutes (331 commuters, 13.1%).
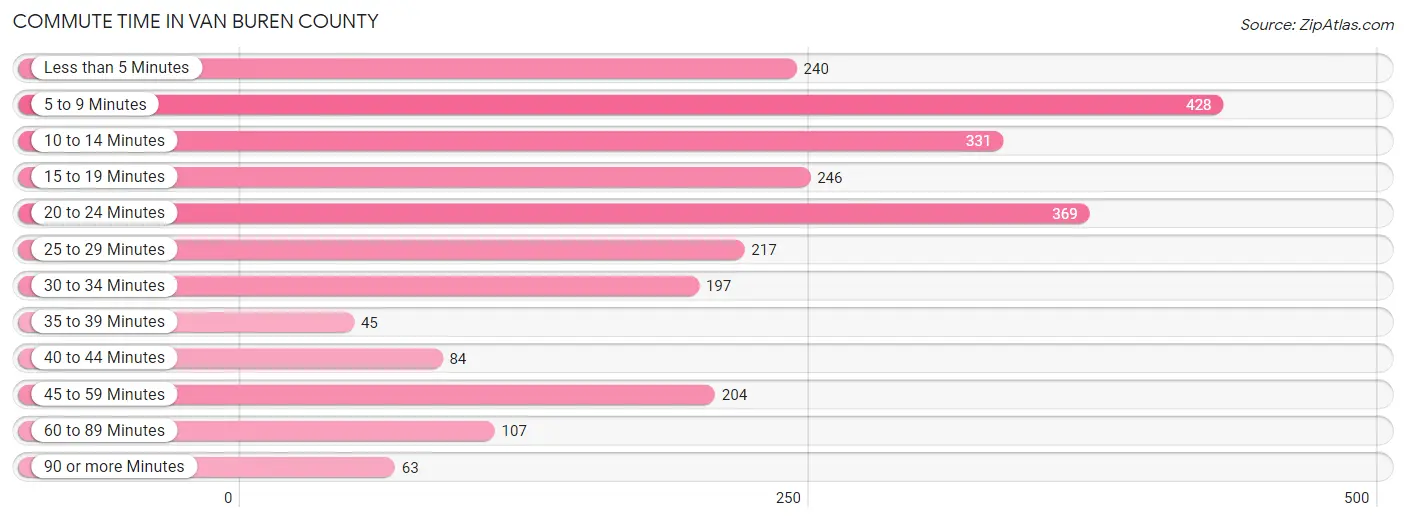
| Commute Time | # Commuters | % Commuters |
| Less than 5 Minutes | 240 | 9.5% |
| 5 to 9 Minutes | 428 | 16.9% |
| 10 to 14 Minutes | 331 | 13.1% |
| 15 to 19 Minutes | 246 | 9.7% |
| 20 to 24 Minutes | 369 | 14.6% |
| 25 to 29 Minutes | 217 | 8.6% |
| 30 to 34 Minutes | 197 | 7.8% |
| 35 to 39 Minutes | 45 | 1.8% |
| 40 to 44 Minutes | 84 | 3.3% |
| 45 to 59 Minutes | 204 | 8.1% |
| 60 to 89 Minutes | 107 | 4.2% |
| 90 or more Minutes | 63 | 2.5% |
Commute Time by Sex in Van Buren County
The most common commute times in Van Buren County are 5 to 9 minutes (261 commuters, 18.1%) for males and 10 to 14 minutes (181 commuters, 16.6%) for females.
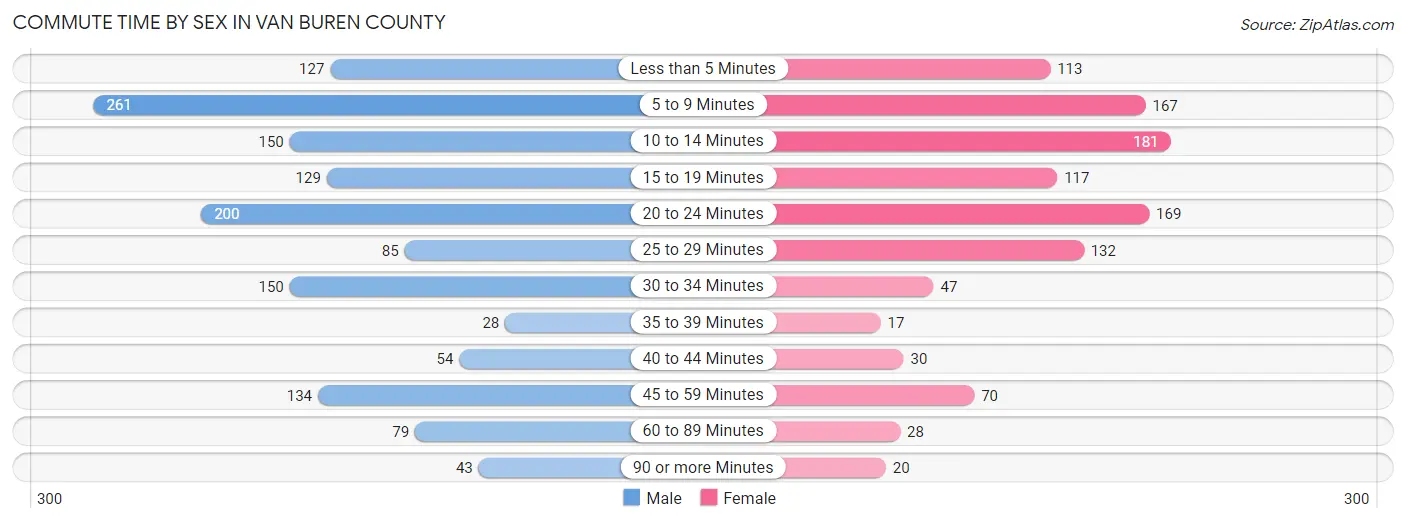
| Commute Time | Male | Female |
| Less than 5 Minutes | 127 (8.8%) | 113 (10.4%) |
| 5 to 9 Minutes | 261 (18.1%) | 167 (15.3%) |
| 10 to 14 Minutes | 150 (10.4%) | 181 (16.6%) |
| 15 to 19 Minutes | 129 (9.0%) | 117 (10.7%) |
| 20 to 24 Minutes | 200 (13.9%) | 169 (15.5%) |
| 25 to 29 Minutes | 85 (5.9%) | 132 (12.1%) |
| 30 to 34 Minutes | 150 (10.4%) | 47 (4.3%) |
| 35 to 39 Minutes | 28 (1.9%) | 17 (1.6%) |
| 40 to 44 Minutes | 54 (3.7%) | 30 (2.8%) |
| 45 to 59 Minutes | 134 (9.3%) | 70 (6.4%) |
| 60 to 89 Minutes | 79 (5.5%) | 28 (2.6%) |
| 90 or more Minutes | 43 (3.0%) | 20 (1.8%) |
Time of Departure to Work by Sex in Van Buren County
The most frequent times of departure to work in Van Buren County are 7:30 AM to 7:59 AM (218, 15.1%) for males and 7:30 AM to 7:59 AM (236, 21.6%) for females.
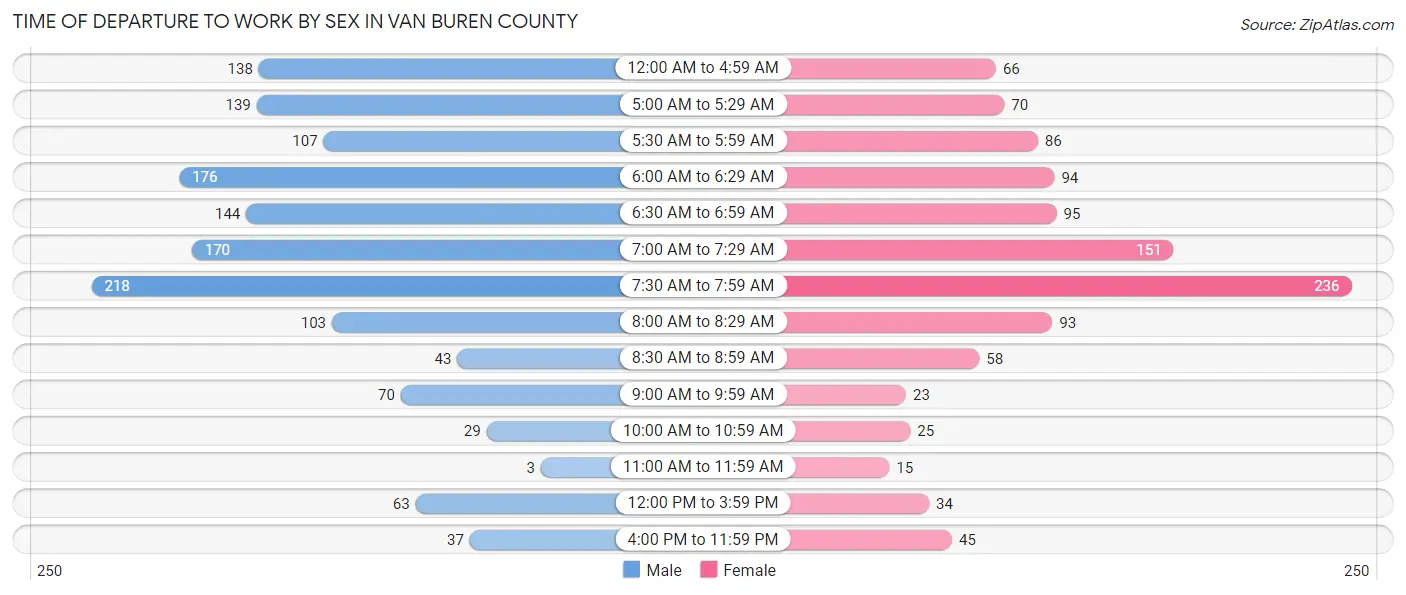
| Time of Departure | Male | Female |
| 12:00 AM to 4:59 AM | 138 (9.6%) | 66 (6.0%) |
| 5:00 AM to 5:29 AM | 139 (9.7%) | 70 (6.4%) |
| 5:30 AM to 5:59 AM | 107 (7.4%) | 86 (7.9%) |
| 6:00 AM to 6:29 AM | 176 (12.2%) | 94 (8.6%) |
| 6:30 AM to 6:59 AM | 144 (10.0%) | 95 (8.7%) |
| 7:00 AM to 7:29 AM | 170 (11.8%) | 151 (13.8%) |
| 7:30 AM to 7:59 AM | 218 (15.1%) | 236 (21.6%) |
| 8:00 AM to 8:29 AM | 103 (7.1%) | 93 (8.5%) |
| 8:30 AM to 8:59 AM | 43 (3.0%) | 58 (5.3%) |
| 9:00 AM to 9:59 AM | 70 (4.9%) | 23 (2.1%) |
| 10:00 AM to 10:59 AM | 29 (2.0%) | 25 (2.3%) |
| 11:00 AM to 11:59 AM | 3 (0.2%) | 15 (1.4%) |
| 12:00 PM to 3:59 PM | 63 (4.4%) | 34 (3.1%) |
| 4:00 PM to 11:59 PM | 37 (2.6%) | 45 (4.1%) |
| Total | 1,440 (100.0%) | 1,091 (100.0%) |
Housing Occupancy in Van Buren County
Occupancy by Ownership in Van Buren County
Of the total 2,842 dwellings in Van Buren County, owner-occupied units account for 2,370 (83.4%), while renter-occupied units make up 472 (16.6%).
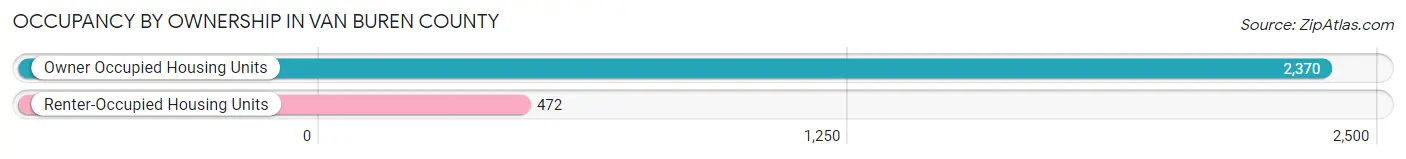
| Occupancy | # Housing Units | % Housing Units |
| Owner Occupied Housing Units | 2,370 | 83.4% |
| Renter-Occupied Housing Units | 472 | 16.6% |
| Total Occupied Housing Units | 2,842 | 100.0% |
Occupancy by Household Size in Van Buren County
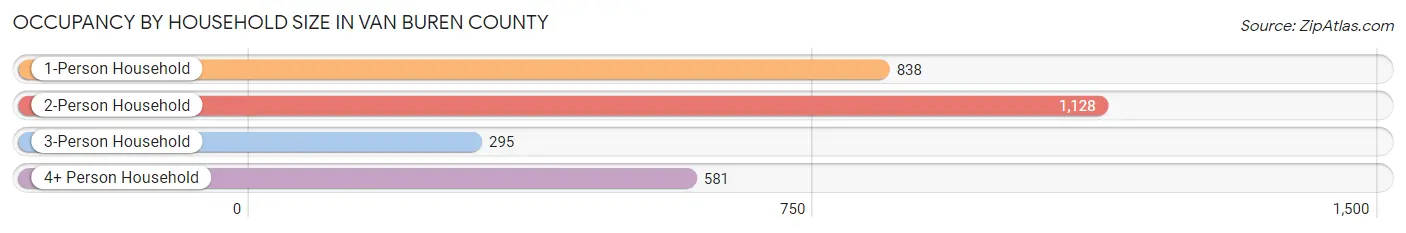
| Household Size | # Housing Units | % Housing Units |
| 1-Person Household | 838 | 29.5% |
| 2-Person Household | 1,128 | 39.7% |
| 3-Person Household | 295 | 10.4% |
| 4+ Person Household | 581 | 20.4% |
| Total Housing Units | 2,842 | 100.0% |
Occupancy by Ownership by Household Size in Van Buren County
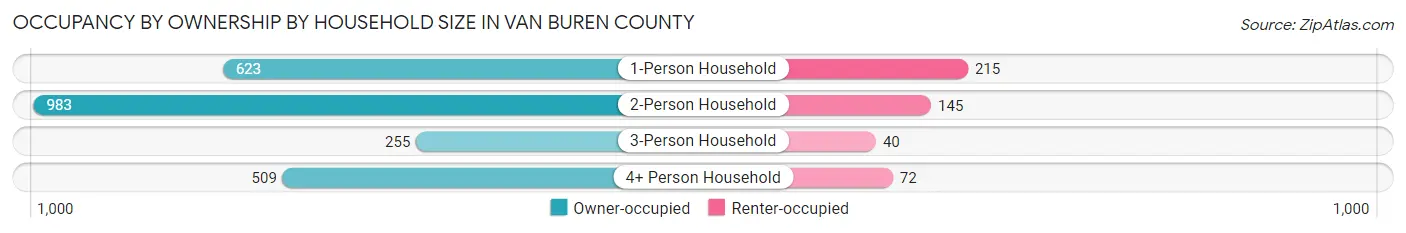
| Household Size | Owner-occupied | Renter-occupied |
| 1-Person Household | 623 (74.3%) | 215 (25.7%) |
| 2-Person Household | 983 (87.2%) | 145 (12.9%) |
| 3-Person Household | 255 (86.4%) | 40 (13.6%) |
| 4+ Person Household | 509 (87.6%) | 72 (12.4%) |
| Total Housing Units | 2,370 (83.4%) | 472 (16.6%) |
Occupancy by Educational Attainment in Van Buren County
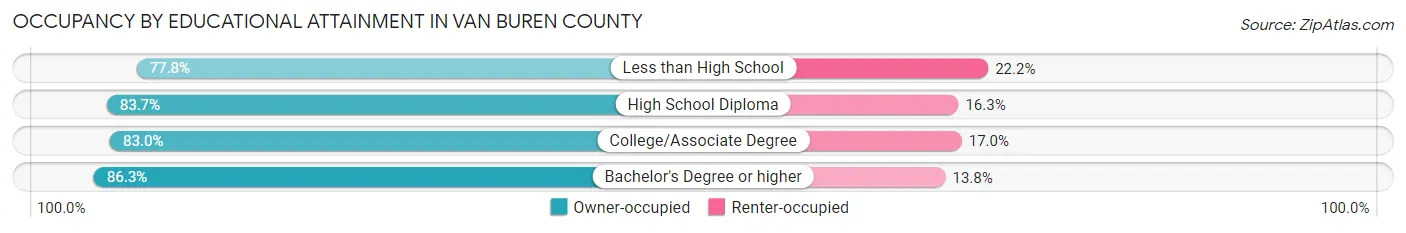
| Household Size | Owner-occupied | Renter-occupied |
| Less than High School | 224 (77.8%) | 64 (22.2%) |
| High School Diploma | 856 (83.7%) | 167 (16.3%) |
| College/Associate Degree | 788 (83.0%) | 161 (17.0%) |
| Bachelor's Degree or higher | 502 (86.3%) | 80 (13.8%) |
Occupancy by Age of Householder in Van Buren County
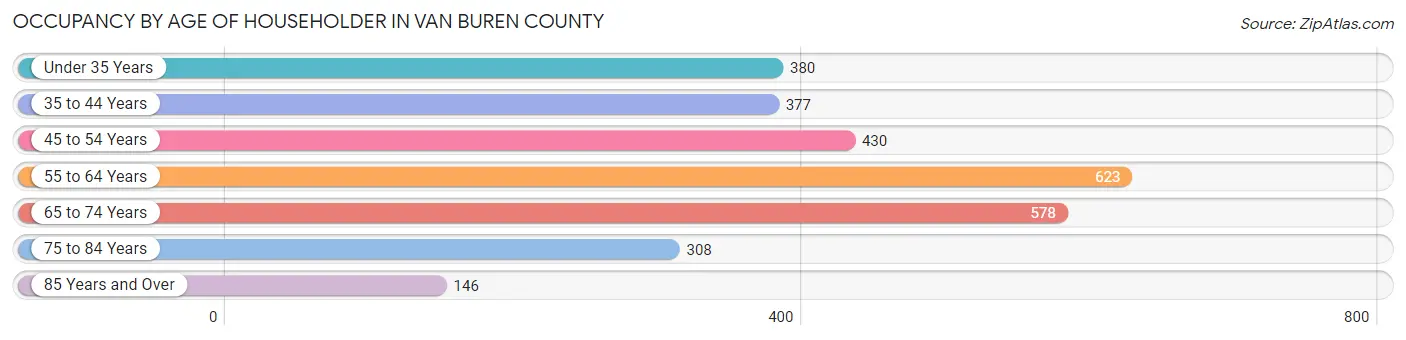
| Age Bracket | # Households | % Households |
| Under 35 Years | 380 | 13.4% |
| 35 to 44 Years | 377 | 13.3% |
| 45 to 54 Years | 430 | 15.1% |
| 55 to 64 Years | 623 | 21.9% |
| 65 to 74 Years | 578 | 20.3% |
| 75 to 84 Years | 308 | 10.8% |
| 85 Years and Over | 146 | 5.1% |
| Total | 2,842 | 100.0% |
Housing Finances in Van Buren County
Median Income by Occupancy in Van Buren County
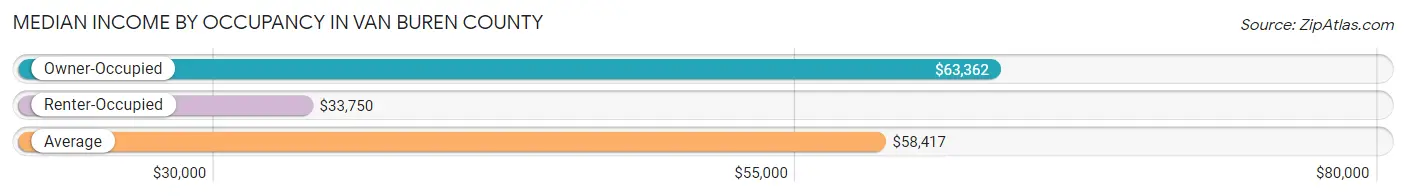
| Occupancy Type | # Households | Median Income |
| Owner-Occupied | 2,370 (83.4%) | $63,362 |
| Renter-Occupied | 472 (16.6%) | $33,750 |
| Average | 2,842 (100.0%) | $58,417 |
Occupancy by Householder Income Bracket in Van Buren County
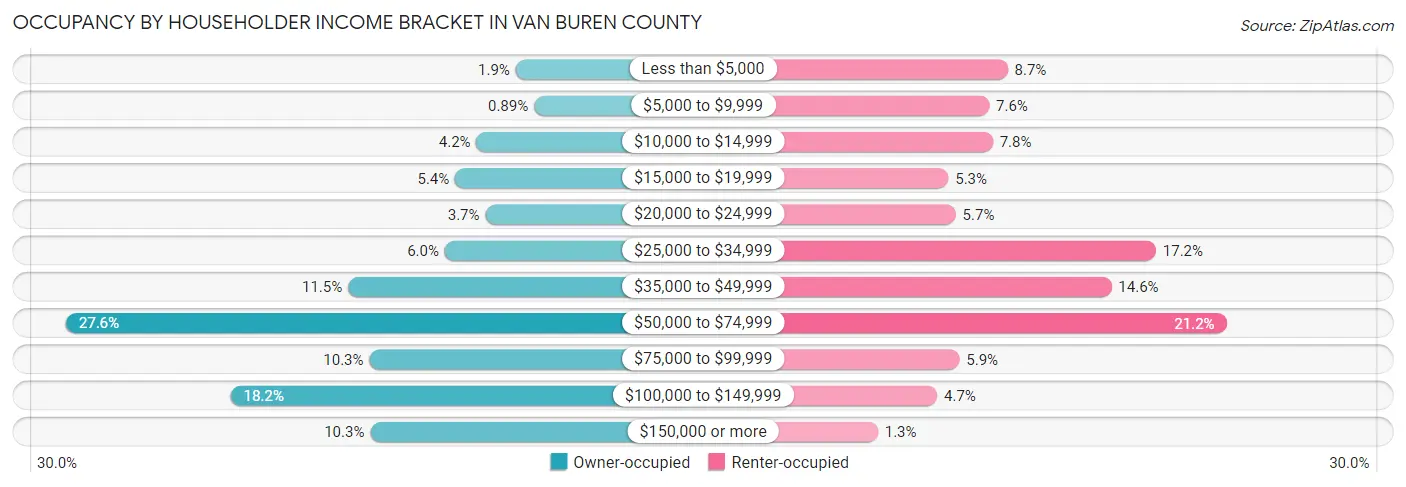
| Income Bracket | Owner-occupied | Renter-occupied |
| Less than $5,000 | 46 (1.9%) | 41 (8.7%) |
| $5,000 to $9,999 | 21 (0.9%) | 36 (7.6%) |
| $10,000 to $14,999 | 99 (4.2%) | 37 (7.8%) |
| $15,000 to $19,999 | 128 (5.4%) | 25 (5.3%) |
| $20,000 to $24,999 | 87 (3.7%) | 27 (5.7%) |
| $25,000 to $34,999 | 142 (6.0%) | 81 (17.2%) |
| $35,000 to $49,999 | 273 (11.5%) | 69 (14.6%) |
| $50,000 to $74,999 | 655 (27.6%) | 100 (21.2%) |
| $75,000 to $99,999 | 244 (10.3%) | 28 (5.9%) |
| $100,000 to $149,999 | 432 (18.2%) | 22 (4.7%) |
| $150,000 or more | 243 (10.2%) | 6 (1.3%) |
| Total | 2,370 (100.0%) | 472 (100.0%) |
Monthly Housing Cost Tiers in Van Buren County
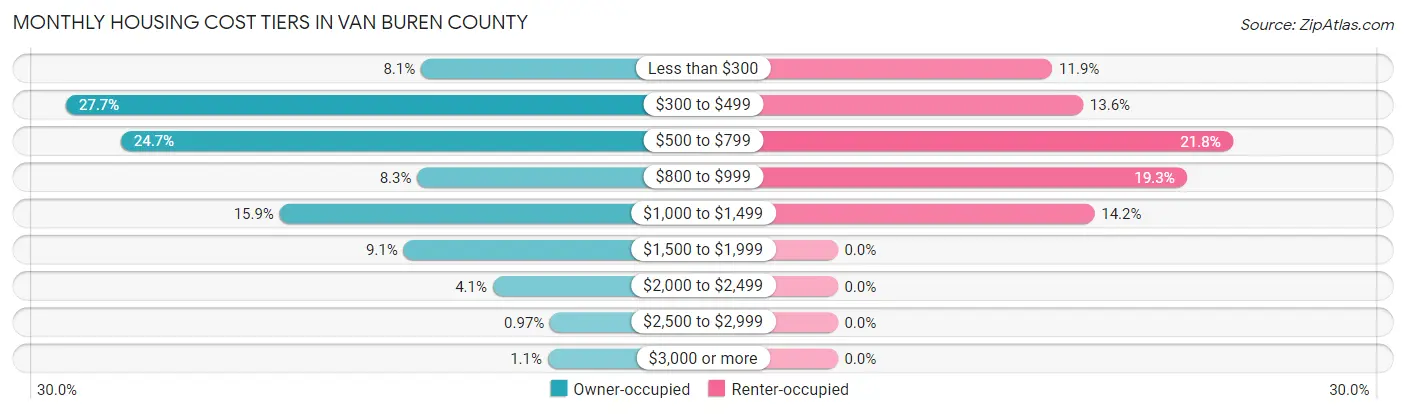
| Monthly Cost | Owner-occupied | Renter-occupied |
| Less than $300 | 192 (8.1%) | 56 (11.9%) |
| $300 to $499 | 657 (27.7%) | 64 (13.6%) |
| $500 to $799 | 585 (24.7%) | 103 (21.8%) |
| $800 to $999 | 197 (8.3%) | 91 (19.3%) |
| $1,000 to $1,499 | 377 (15.9%) | 67 (14.2%) |
| $1,500 to $1,999 | 215 (9.1%) | 0 (0.0%) |
| $2,000 to $2,499 | 98 (4.1%) | 0 (0.0%) |
| $2,500 to $2,999 | 23 (1.0%) | 0 (0.0%) |
| $3,000 or more | 26 (1.1%) | 0 (0.0%) |
| Total | 2,370 (100.0%) | 472 (100.0%) |
Physical Housing Characteristics in Van Buren County
Housing Structures in Van Buren County
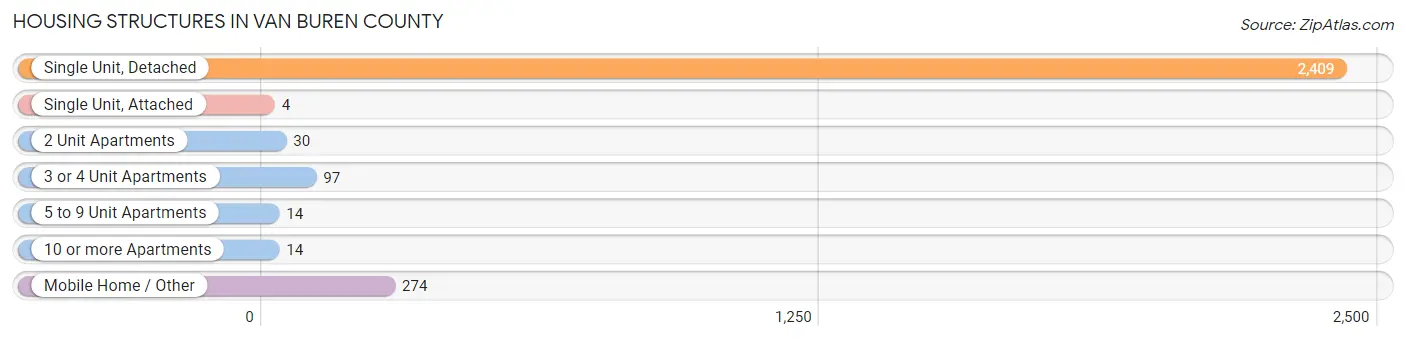
| Structure Type | # Housing Units | % Housing Units |
| Single Unit, Detached | 2,409 | 84.8% |
| Single Unit, Attached | 4 | 0.1% |
| 2 Unit Apartments | 30 | 1.1% |
| 3 or 4 Unit Apartments | 97 | 3.4% |
| 5 to 9 Unit Apartments | 14 | 0.5% |
| 10 or more Apartments | 14 | 0.5% |
| Mobile Home / Other | 274 | 9.6% |
| Total | 2,842 | 100.0% |
Housing Structures by Occupancy in Van Buren County
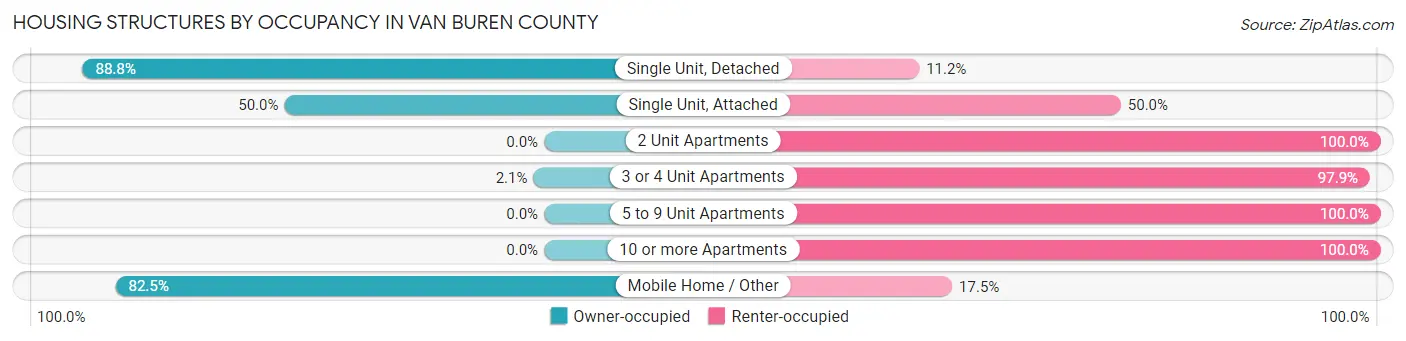
| Structure Type | Owner-occupied | Renter-occupied |
| Single Unit, Detached | 2,140 (88.8%) | 269 (11.2%) |
| Single Unit, Attached | 2 (50.0%) | 2 (50.0%) |
| 2 Unit Apartments | 0 (0.0%) | 30 (100.0%) |
| 3 or 4 Unit Apartments | 2 (2.1%) | 95 (97.9%) |
| 5 to 9 Unit Apartments | 0 (0.0%) | 14 (100.0%) |
| 10 or more Apartments | 0 (0.0%) | 14 (100.0%) |
| Mobile Home / Other | 226 (82.5%) | 48 (17.5%) |
| Total | 2,370 (83.4%) | 472 (16.6%) |
Housing Structures by Number of Rooms in Van Buren County
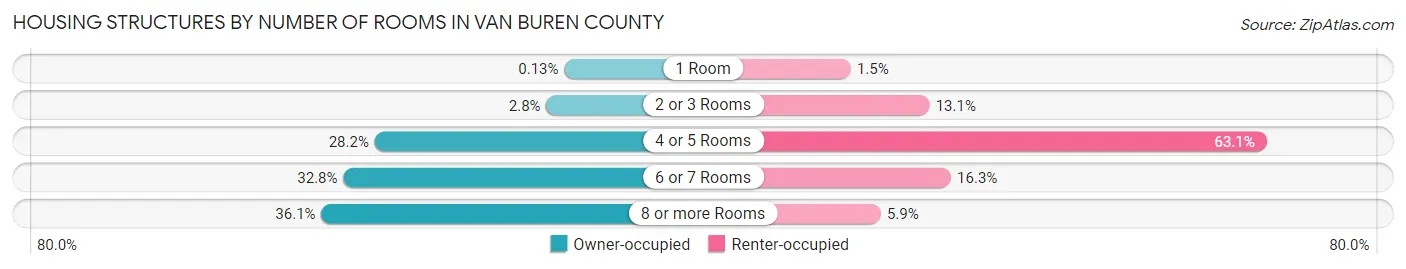
| Number of Rooms | Owner-occupied | Renter-occupied |
| 1 Room | 3 (0.1%) | 7 (1.5%) |
| 2 or 3 Rooms | 66 (2.8%) | 62 (13.1%) |
| 4 or 5 Rooms | 668 (28.2%) | 298 (63.1%) |
| 6 or 7 Rooms | 778 (32.8%) | 77 (16.3%) |
| 8 or more Rooms | 855 (36.1%) | 28 (5.9%) |
| Total | 2,370 (100.0%) | 472 (100.0%) |
Housing Structure by Heating Type in Van Buren County
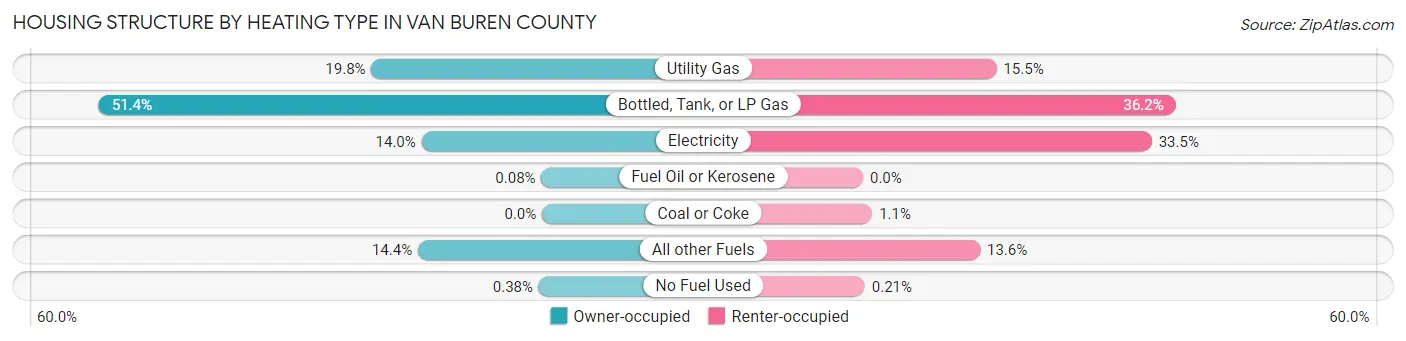
| Heating Type | Owner-occupied | Renter-occupied |
| Utility Gas | 469 (19.8%) | 73 (15.5%) |
| Bottled, Tank, or LP Gas | 1,218 (51.4%) | 171 (36.2%) |
| Electricity | 331 (14.0%) | 158 (33.5%) |
| Fuel Oil or Kerosene | 2 (0.1%) | 0 (0.0%) |
| Coal or Coke | 0 (0.0%) | 5 (1.1%) |
| All other Fuels | 341 (14.4%) | 64 (13.6%) |
| No Fuel Used | 9 (0.4%) | 1 (0.2%) |
| Total | 2,370 (100.0%) | 472 (100.0%) |
Household Vehicle Usage in Van Buren County
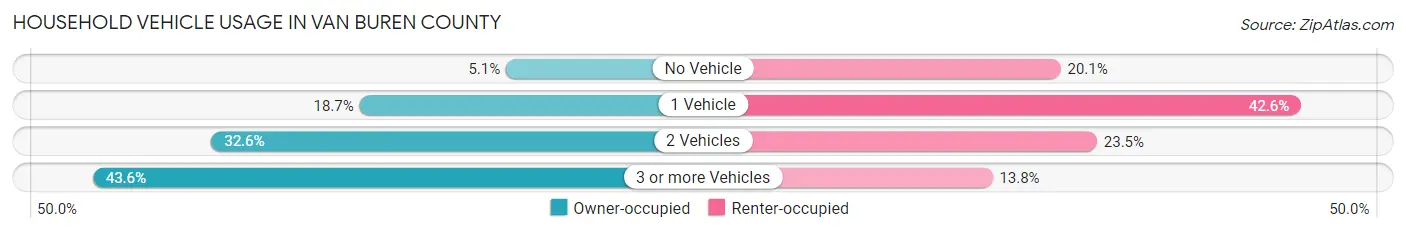
| Vehicles per Household | Owner-occupied | Renter-occupied |
| No Vehicle | 120 (5.1%) | 95 (20.1%) |
| 1 Vehicle | 444 (18.7%) | 201 (42.6%) |
| 2 Vehicles | 772 (32.6%) | 111 (23.5%) |
| 3 or more Vehicles | 1,034 (43.6%) | 65 (13.8%) |
| Total | 2,370 (100.0%) | 472 (100.0%) |
Real Estate & Mortgages in Van Buren County
Real Estate and Mortgage Overview in Van Buren County
| Characteristic | Without Mortgage | With Mortgage |
| Housing Units | 1,394 | 976 |
| Median Property Value | $86,100 | $133,200 |
| Median Household Income | $57,239 | $97 |
| Monthly Housing Costs | $452 | $26 |
| Real Estate Taxes | $1,230 | $7 |
Property Value by Mortgage Status in Van Buren County
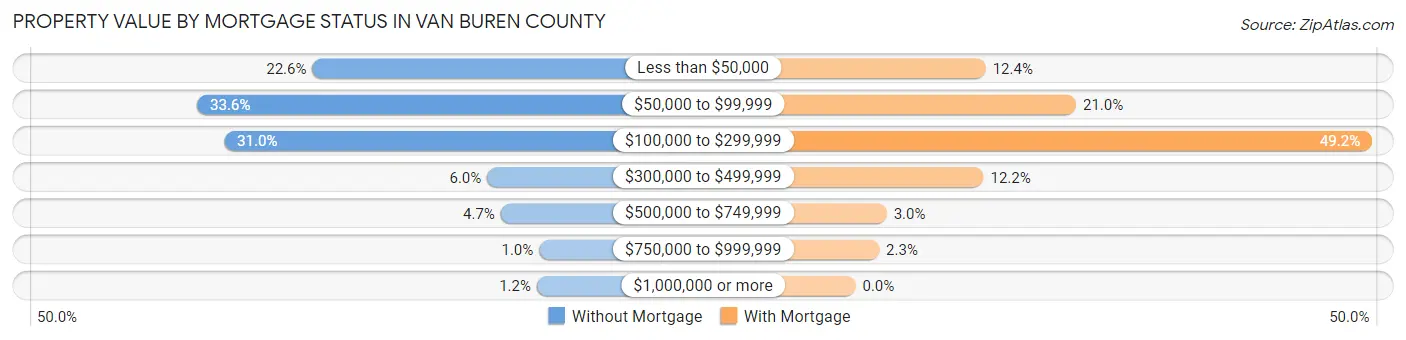
| Property Value | Without Mortgage | With Mortgage |
| Less than $50,000 | 315 (22.6%) | 121 (12.4%) |
| $50,000 to $99,999 | 468 (33.6%) | 205 (21.0%) |
| $100,000 to $299,999 | 432 (31.0%) | 480 (49.2%) |
| $300,000 to $499,999 | 83 (5.9%) | 119 (12.2%) |
| $500,000 to $749,999 | 65 (4.7%) | 29 (3.0%) |
| $750,000 to $999,999 | 14 (1.0%) | 22 (2.2%) |
| $1,000,000 or more | 17 (1.2%) | 0 (0.0%) |
| Total | 1,394 (100.0%) | 976 (100.0%) |
Household Income by Mortgage Status in Van Buren County
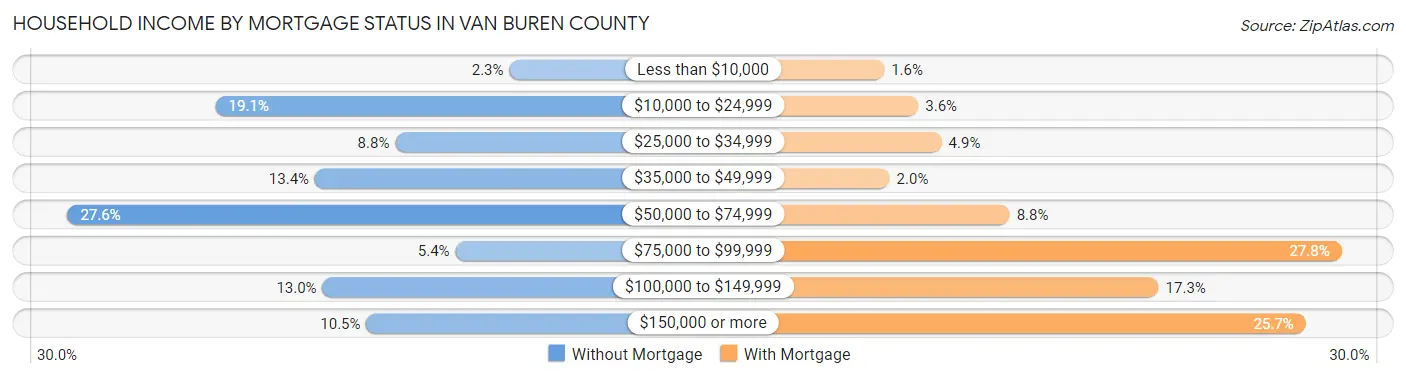
| Household Income | Without Mortgage | With Mortgage |
| Less than $10,000 | 32 (2.3%) | 16 (1.6%) |
| $10,000 to $24,999 | 266 (19.1%) | 35 (3.6%) |
| $25,000 to $34,999 | 123 (8.8%) | 48 (4.9%) |
| $35,000 to $49,999 | 187 (13.4%) | 19 (1.9%) |
| $50,000 to $74,999 | 384 (27.6%) | 86 (8.8%) |
| $75,000 to $99,999 | 75 (5.4%) | 271 (27.8%) |
| $100,000 to $149,999 | 181 (13.0%) | 169 (17.3%) |
| $150,000 or more | 146 (10.5%) | 251 (25.7%) |
| Total | 1,394 (100.0%) | 976 (100.0%) |
Property Value to Household Income Ratio in Van Buren County
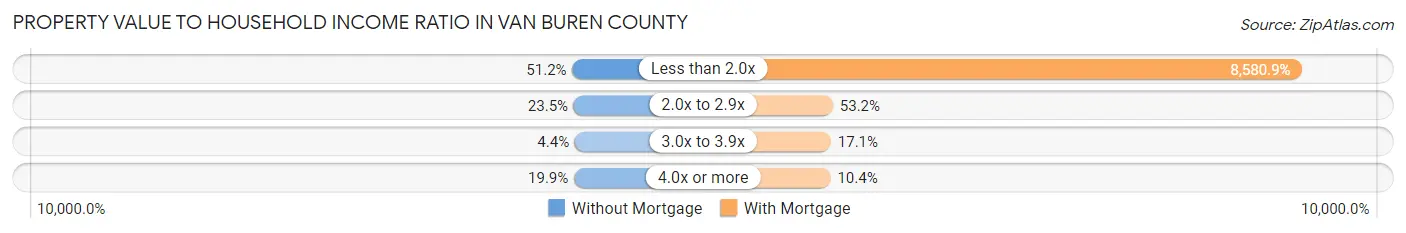
| Value-to-Income Ratio | Without Mortgage | With Mortgage |
| Less than 2.0x | 714 (51.2%) | 83,750 (8,580.9%) |
| 2.0x to 2.9x | 328 (23.5%) | 519 (53.2%) |
| 3.0x to 3.9x | 61 (4.4%) | 167 (17.1%) |
| 4.0x or more | 278 (19.9%) | 101 (10.3%) |
| Total | 1,394 (100.0%) | 976 (100.0%) |
Real Estate Taxes by Mortgage Status in Van Buren County
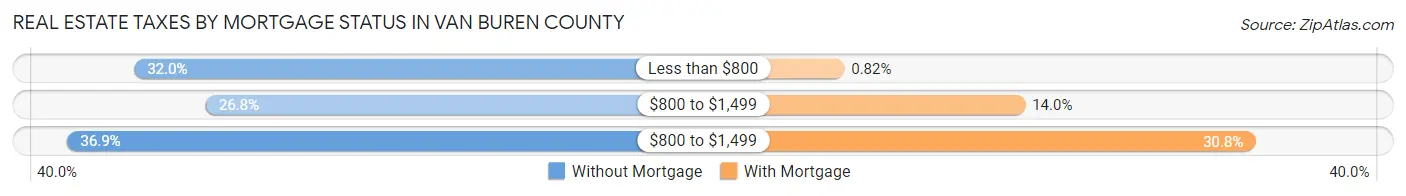
| Property Taxes | Without Mortgage | With Mortgage |
| Less than $800 | 446 (32.0%) | 8 (0.8%) |
| $800 to $1,499 | 373 (26.8%) | 137 (14.0%) |
| $800 to $1,499 | 514 (36.9%) | 301 (30.8%) |
| Total | 1,394 (100.0%) | 976 (100.0%) |
Health & Disability in Van Buren County
Health Insurance Coverage by Age in Van Buren County
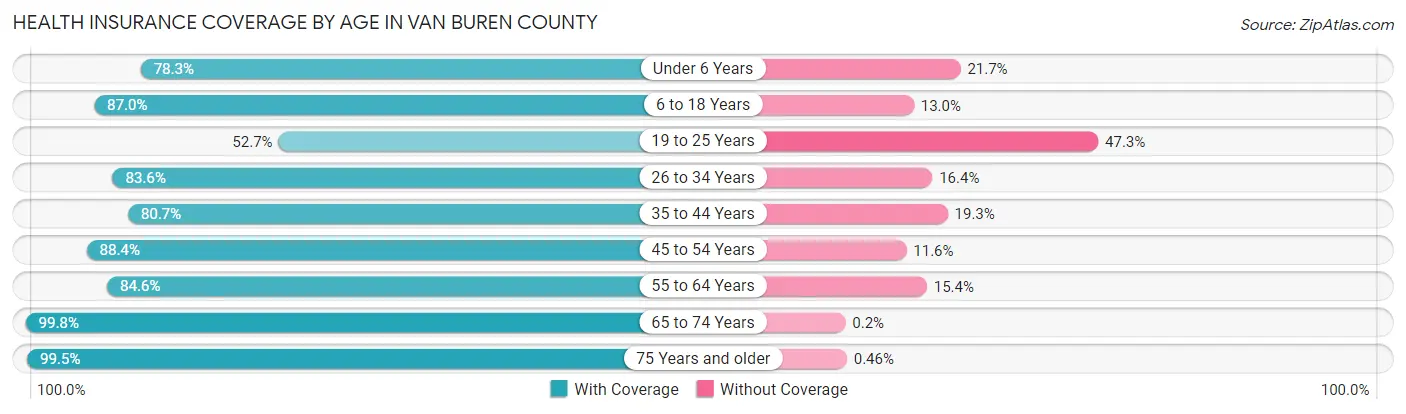
| Age Bracket | With Coverage | Without Coverage |
| Under 6 Years | 416 (78.3%) | 115 (21.7%) |
| 6 to 18 Years | 1,034 (87.0%) | 154 (13.0%) |
| 19 to 25 Years | 276 (52.7%) | 248 (47.3%) |
| 26 to 34 Years | 474 (83.6%) | 93 (16.4%) |
| 35 to 44 Years | 633 (80.7%) | 151 (19.3%) |
| 45 to 54 Years | 726 (88.4%) | 95 (11.6%) |
| 55 to 64 Years | 907 (84.6%) | 165 (15.4%) |
| 65 to 74 Years | 991 (99.8%) | 2 (0.2%) |
| 75 Years and older | 655 (99.5%) | 3 (0.5%) |
| Total | 6,112 (85.6%) | 1,026 (14.4%) |
Health Insurance Coverage by Citizenship Status in Van Buren County
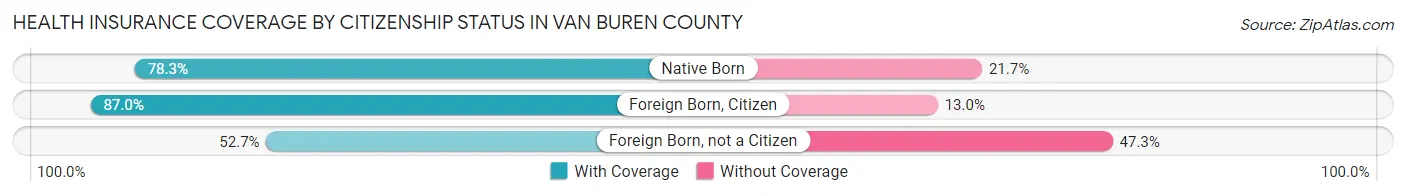
| Citizenship Status | With Coverage | Without Coverage |
| Native Born | 416 (78.3%) | 115 (21.7%) |
| Foreign Born, Citizen | 1,034 (87.0%) | 154 (13.0%) |
| Foreign Born, not a Citizen | 276 (52.7%) | 248 (47.3%) |
Health Insurance Coverage by Household Income in Van Buren County
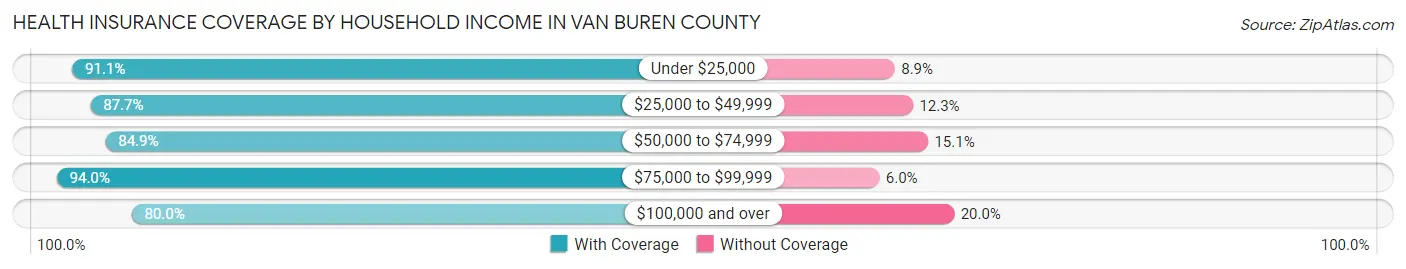
| Household Income | With Coverage | Without Coverage |
| Under $25,000 | 747 (91.1%) | 73 (8.9%) |
| $25,000 to $49,999 | 1,098 (87.7%) | 154 (12.3%) |
| $50,000 to $74,999 | 1,577 (84.9%) | 281 (15.1%) |
| $75,000 to $99,999 | 799 (94.0%) | 51 (6.0%) |
| $100,000 and over | 1,864 (80.0%) | 467 (20.0%) |
Public vs Private Health Insurance Coverage by Age in Van Buren County
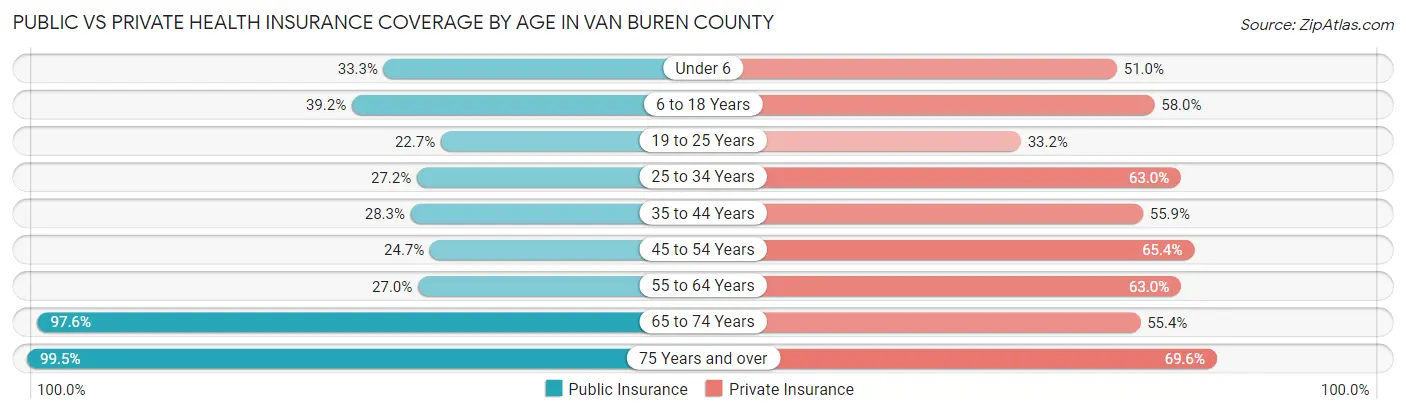
| Age Bracket | Public Insurance | Private Insurance |
| Under 6 | 177 (33.3%) | 271 (51.0%) |
| 6 to 18 Years | 466 (39.2%) | 689 (58.0%) |
| 19 to 25 Years | 119 (22.7%) | 174 (33.2%) |
| 25 to 34 Years | 154 (27.2%) | 357 (63.0%) |
| 35 to 44 Years | 222 (28.3%) | 438 (55.9%) |
| 45 to 54 Years | 203 (24.7%) | 537 (65.4%) |
| 55 to 64 Years | 289 (27.0%) | 675 (63.0%) |
| 65 to 74 Years | 969 (97.6%) | 550 (55.4%) |
| 75 Years and over | 655 (99.5%) | 458 (69.6%) |
| Total | 3,254 (45.6%) | 4,149 (58.1%) |
Disability Status by Sex by Age in Van Buren County
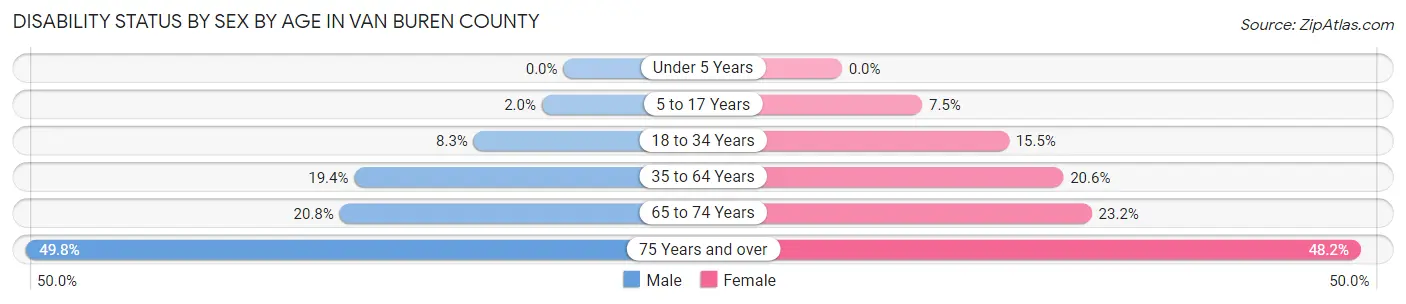
| Age Bracket | Male | Female |
| Under 5 Years | 0 (0.0%) | 0 (0.0%) |
| 5 to 17 Years | 13 (2.0%) | 41 (7.4%) |
| 18 to 34 Years | 49 (8.3%) | 90 (15.5%) |
| 35 to 64 Years | 273 (19.4%) | 261 (20.5%) |
| 65 to 74 Years | 97 (20.8%) | 122 (23.2%) |
| 75 Years and over | 152 (49.8%) | 170 (48.2%) |
Disability Class by Sex by Age in Van Buren County
Disability Class: Hearing Difficulty
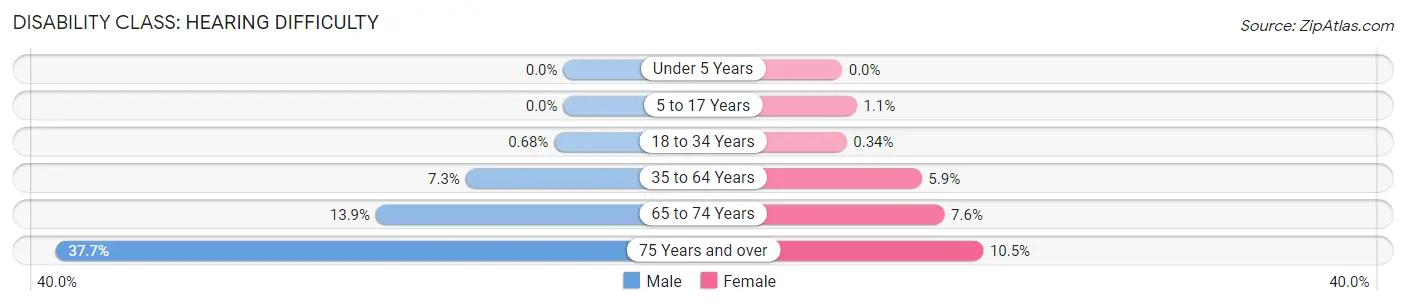
| Age Bracket | Male | Female |
| Under 5 Years | 0 (0.0%) | 0 (0.0%) |
| 5 to 17 Years | 0 (0.0%) | 6 (1.1%) |
| 18 to 34 Years | 4 (0.7%) | 2 (0.3%) |
| 35 to 64 Years | 102 (7.2%) | 75 (5.9%) |
| 65 to 74 Years | 65 (13.9%) | 40 (7.6%) |
| 75 Years and over | 115 (37.7%) | 37 (10.5%) |
Disability Class: Vision Difficulty
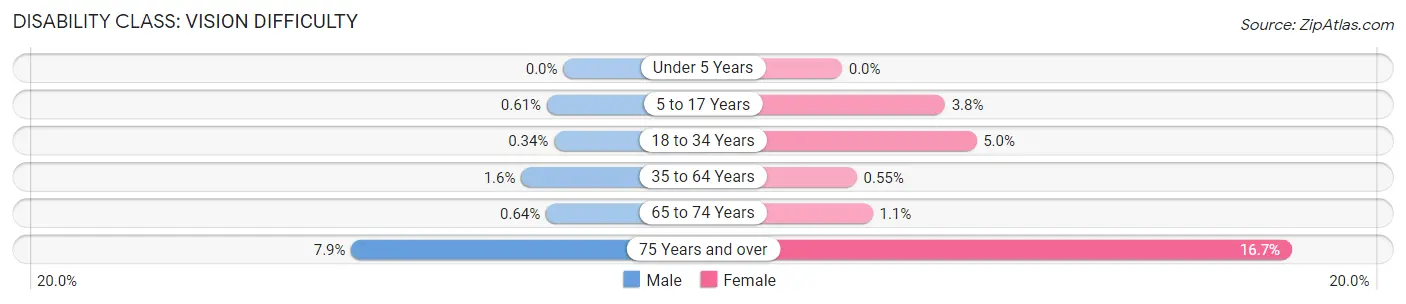
| Age Bracket | Male | Female |
| Under 5 Years | 0 (0.0%) | 0 (0.0%) |
| 5 to 17 Years | 4 (0.6%) | 21 (3.8%) |
| 18 to 34 Years | 2 (0.3%) | 29 (5.0%) |
| 35 to 64 Years | 22 (1.6%) | 7 (0.5%) |
| 65 to 74 Years | 3 (0.6%) | 6 (1.1%) |
| 75 Years and over | 24 (7.9%) | 59 (16.7%) |
Disability Class: Cognitive Difficulty
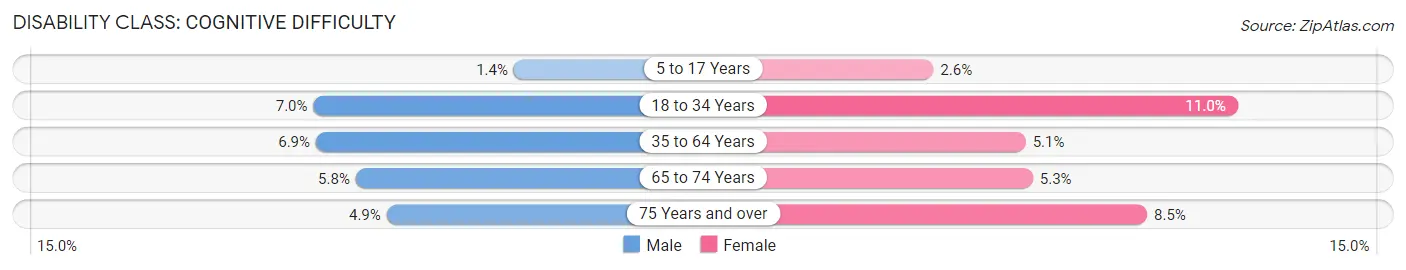
| Age Bracket | Male | Female |
| 5 to 17 Years | 9 (1.4%) | 14 (2.5%) |
| 18 to 34 Years | 41 (7.0%) | 64 (11.0%) |
| 35 to 64 Years | 97 (6.9%) | 65 (5.1%) |
| 65 to 74 Years | 27 (5.8%) | 28 (5.3%) |
| 75 Years and over | 15 (4.9%) | 30 (8.5%) |
Disability Class: Ambulatory Difficulty
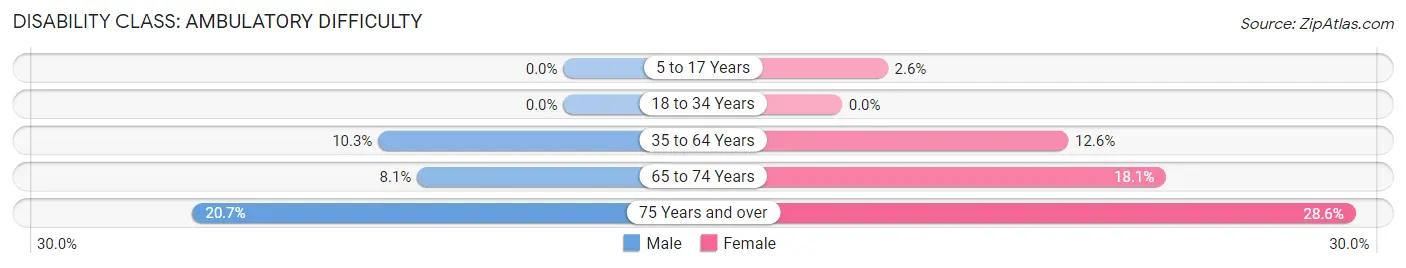
| Age Bracket | Male | Female |
| 5 to 17 Years | 0 (0.0%) | 14 (2.5%) |
| 18 to 34 Years | 0 (0.0%) | 0 (0.0%) |
| 35 to 64 Years | 145 (10.3%) | 160 (12.6%) |
| 65 to 74 Years | 38 (8.1%) | 95 (18.1%) |
| 75 Years and over | 63 (20.7%) | 101 (28.6%) |
Disability Class: Self-Care Difficulty
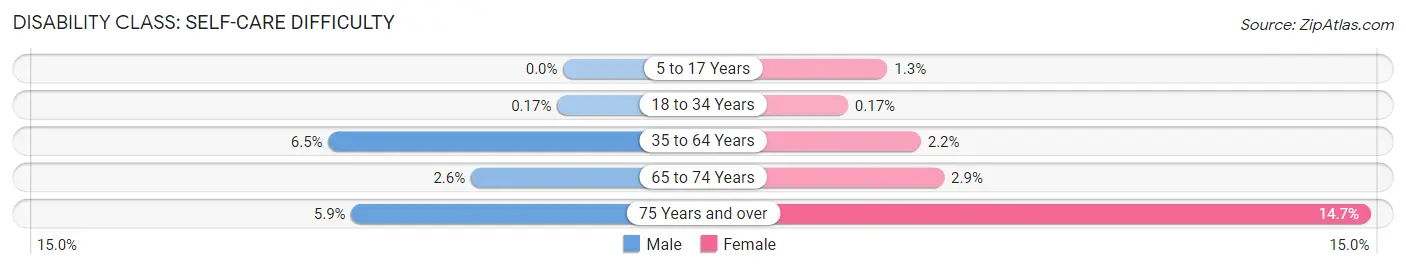
| Age Bracket | Male | Female |
| 5 to 17 Years | 0 (0.0%) | 7 (1.3%) |
| 18 to 34 Years | 1 (0.2%) | 1 (0.2%) |
| 35 to 64 Years | 92 (6.5%) | 28 (2.2%) |
| 65 to 74 Years | 12 (2.6%) | 15 (2.9%) |
| 75 Years and over | 18 (5.9%) | 52 (14.7%) |
Technology Access in Van Buren County
Computing Device Access in Van Buren County
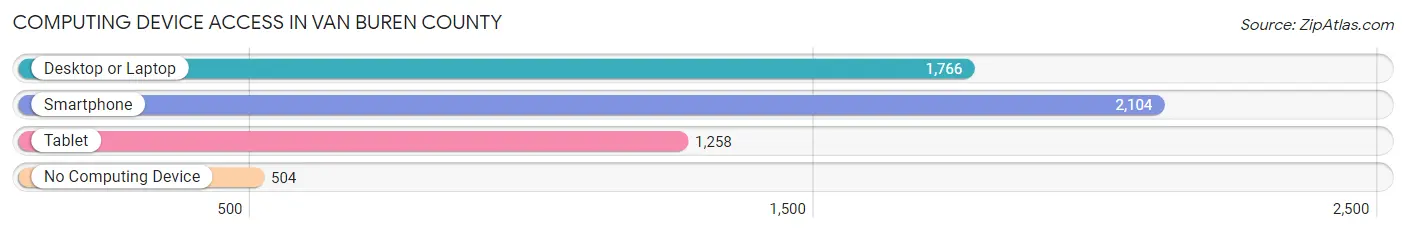
| Device Type | # Households | % Households |
| Desktop or Laptop | 1,766 | 62.1% |
| Smartphone | 2,104 | 74.0% |
| Tablet | 1,258 | 44.3% |
| No Computing Device | 504 | 17.7% |
| Total | 2,842 | 100.0% |
Internet Access in Van Buren County
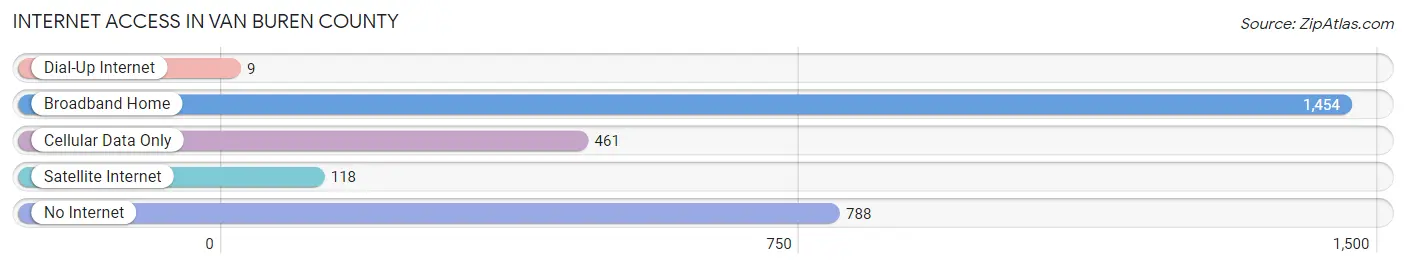
| Internet Type | # Households | % Households |
| Dial-Up Internet | 9 | 0.3% |
| Broadband Home | 1,454 | 51.2% |
| Cellular Data Only | 461 | 16.2% |
| Satellite Internet | 118 | 4.2% |
| No Internet | 788 | 27.7% |
| Total | 2,842 | 100.0% |
Van Buren County Summary
Van Buren County is located in the southeastern corner of Iowa, and is bordered by Lee, Des Moines, Jefferson, Henry, and Davis counties. The county seat is Keosauqua, and the county was named after Martin Van Buren, the eighth president of the United States. The county has a total area of 576 square miles, and a population of 7,570 as of the 2010 census.
History
Van Buren County was established in 1836, and was originally part of Des Moines County. The county was named after Martin Van Buren, the eighth president of the United States. The first settlers arrived in the area in 1835, and the county was officially organized in 1837. The first county seat was located in Farmington, but was moved to Keosauqua in 1843.
The county was largely agricultural in the 19th century, and the population grew steadily throughout the century. The county was also home to several small towns, including Birmingham, Cantril, and Milton. The county was also home to several Native American tribes, including the Sauk and Fox, and the Meskwaki.
Geography
Van Buren County is located in the southeastern corner of Iowa, and is bordered by Lee, Des Moines, Jefferson, Henry, and Davis counties. The county has a total area of 576 square miles, and is mostly rural. The Des Moines River runs through the county, and there are several small lakes and streams. The county is mostly flat, with some rolling hills in the northern part of the county.
The county is home to several state parks, including Van Buren State Park, which is located on the Des Moines River. The park offers camping, fishing, and hiking opportunities. The county is also home to several wildlife areas, including the Des Moines River Wildlife Area, which is managed by the Iowa Department of Natural Resources.
Economy
Van Buren County is largely agricultural, and the county is home to several large farms. The county is also home to several small businesses, including manufacturing, retail, and service industries. The county is also home to several small towns, including Birmingham, Cantril, and Milton.
The county is home to several large employers, including the Van Buren County Hospital, the Van Buren County Sheriff's Office, and the Van Buren County Courthouse. The county is also home to several small businesses, including restaurants, retail stores, and service providers.
Demographics
As of the 2010 census, Van Buren County had a population of 7,570. The population was spread out, with 24.3% under the age of 18, 8.2% from 18 to 24, 24.3% from 25 to 44, 28.2% from 45 to 64, and 14.0% who were 65 years of age or older. The median age was 40.4 years.
The median income for a household in the county was $45,945, and the median income for a family was $54,844. The per capita income for the county was $22,845. About 10.2% of families and 13.2% of the population were below the poverty line, including 17.2% of those under age 18 and 8.2% of those age 65 or over.
Van Buren County is largely rural, and the population is mostly white. The county is also home to a small Hispanic population, as well as a small African American population. The county is also home to a small Native American population, as well as a small Asian population.
Common Questions
What is Per Capita Income in Van Buren County?
Per Capita income in Van Buren County is $32,188.
What is the Median Family Income in Van Buren County?
Median Family Income in Van Buren County is $70,893.
What is the Median Household income in Van Buren County?
Median Household Income in Van Buren County is $58,417.
What is Income or Wage Gap in Van Buren County?
Income or Wage Gap in Van Buren County is 43.1%.
Women in Van Buren County earn 56.9 cents for every dollar earned by a man.
What is Family Income Deficit in Van Buren County?
Family Income Deficit in Van Buren County is $12,640.
Families that are below poverty line in Van Buren County earn $12,640 less on average than the poverty threshold level.
What is Inequality or Gini Index in Van Buren County?
Inequality or Gini Index in Van Buren County is 0.46.
What is the Total Population of Van Buren County?
Total Population of Van Buren County is 7,207.
What is the Total Male Population of Van Buren County?
Total Male Population of Van Buren County is 3,687.
What is the Total Female Population of Van Buren County?
Total Female Population of Van Buren County is 3,520.
What is the Ratio of Males per 100 Females in Van Buren County?
There are 104.74 Males per 100 Females in Van Buren County.
What is the Ratio of Females per 100 Males in Van Buren County?
There are 95.47 Females per 100 Males in Van Buren County.
What is the Median Population Age in Van Buren County?
Median Population Age in Van Buren County is 45.0 Years.
What is the Average Family Size in Van Buren County
Average Family Size in Van Buren County is 3.1 People.
What is the Average Household Size in Van Buren County
Average Household Size in Van Buren County is 2.5 People.
How Large is the Labor Force in Van Buren County?
There are 3,219 People in the Labor Forcein in Van Buren County.
What is the Percentage of People in the Labor Force in Van Buren County?
55.9% of People are in the Labor Force in Van Buren County.
What is the Unemployment Rate in Van Buren County?
Unemployment Rate in Van Buren County is 4.9%.