Tama County, IA Map & Demographics
Tama County Map
Tama County Overview
$33,046
PER CAPITA INCOME
$78,503
AVG FAMILY INCOME
$65,483
AVG HOUSEHOLD INCOME
33.7%
WAGE / INCOME GAP [ % ]
66.3¢/ $1
WAGE / INCOME GAP [ $ ]
$11,714
FAMILY INCOME DEFICIT
0.43
INEQUALITY / GINI INDEX
17,017
TOTAL POPULATION
8,627
MALE POPULATION
8,390
FEMALE POPULATION
102.82
MALES / 100 FEMALES
97.25
FEMALES / 100 MALES
41.0
MEDIAN AGE
3.0
AVG FAMILY SIZE
2.5
AVG HOUSEHOLD SIZE
8,563
LABOR FORCE [ PEOPLE ]
63.8%
PERCENT IN LABOR FORCE
4.5%
UNEMPLOYMENT RATE
Income in Tama County
Income Overview in Tama County
Per Capita Income in Tama County is $33,046, while median incomes of families and households are $78,503 and $65,483 respectively.
| Characteristic | Number | Measure |
| Per Capita Income | 17,017 | $33,046 |
| Median Family Income | 4,597 | $78,503 |
| Mean Family Income | 4,597 | $93,230 |
| Median Household Income | 6,703 | $65,483 |
| Mean Household Income | 6,703 | $81,745 |
| Income Deficit | 4,597 | $11,714 |
| Wage / Income Gap (%) | 17,017 | 33.72% |
| Wage / Income Gap ($) | 17,017 | 66.28¢ per $1 |
| Gini / Inequality Index | 17,017 | 0.43 |
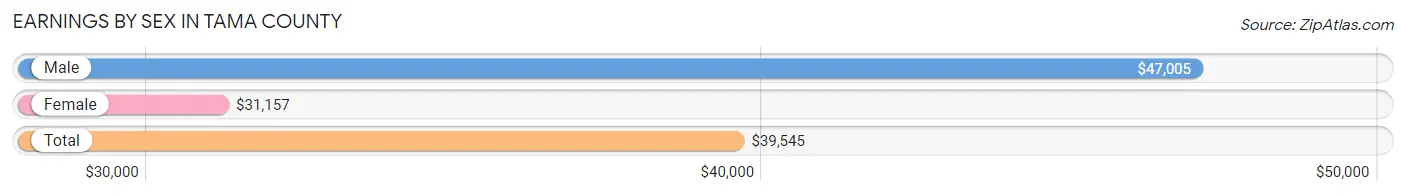
Earnings by Sex in Tama County
Average Earnings in Tama County are $39,545, $47,005 for men and $31,157 for women, a difference of 33.7%.
| Sex | Number | Average Earnings |
| Male | 4,883 (55.0%) | $47,005 |
| Female | 3,997 (45.0%) | $31,157 |
| Total | 8,880 (100.0%) | $39,545 |
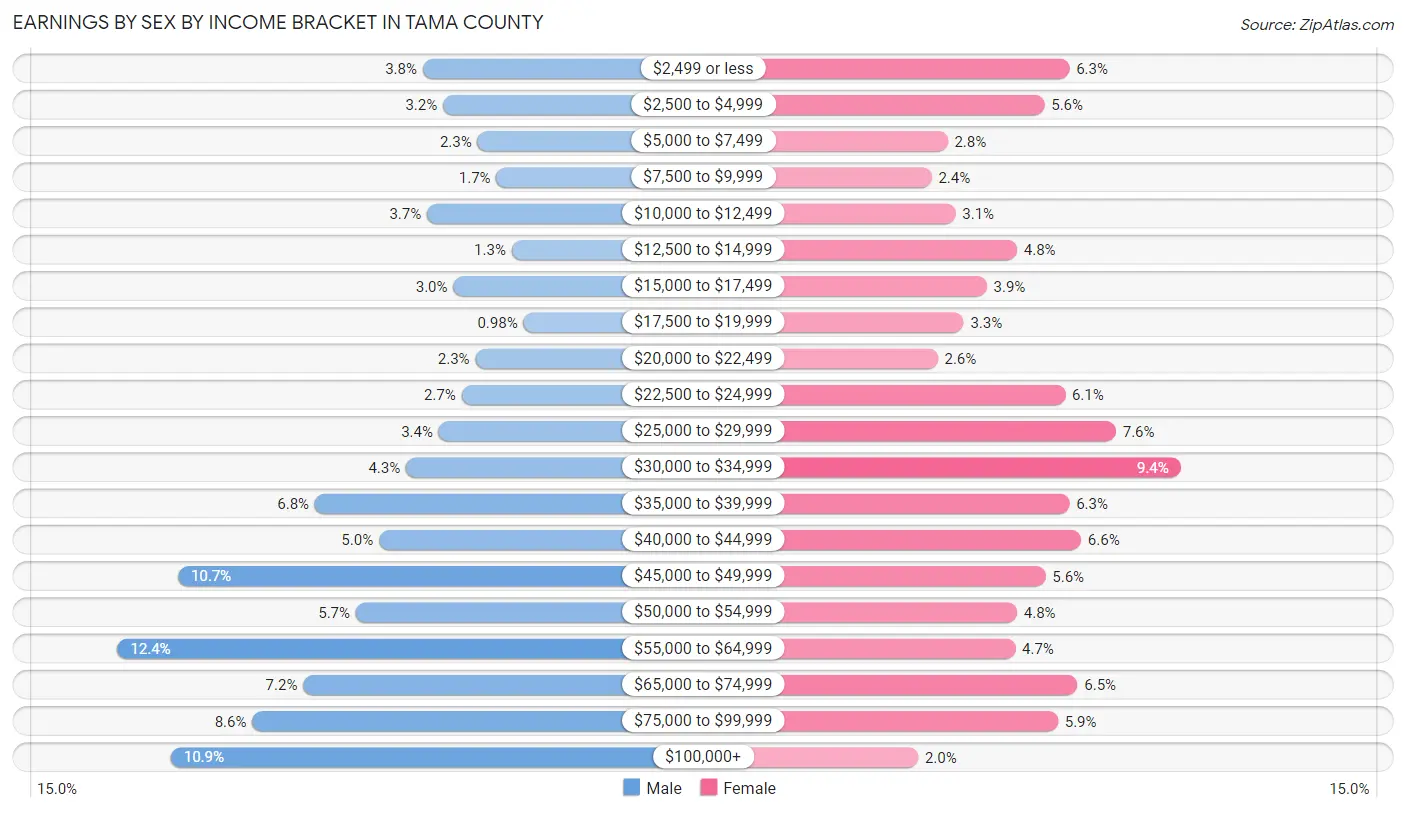
Earnings by Sex by Income Bracket in Tama County
The most common earnings brackets in Tama County are $55,000 to $64,999 for men (605 | 12.4%) and $30,000 to $34,999 for women (375 | 9.4%).
| Income | Male | Female |
| $2,499 or less | 186 (3.8%) | 250 (6.2%) |
| $2,500 to $4,999 | 158 (3.2%) | 222 (5.6%) |
| $5,000 to $7,499 | 111 (2.3%) | 113 (2.8%) |
| $7,500 to $9,999 | 85 (1.7%) | 95 (2.4%) |
| $10,000 to $12,499 | 180 (3.7%) | 122 (3.0%) |
| $12,500 to $14,999 | 64 (1.3%) | 191 (4.8%) |
| $15,000 to $17,499 | 144 (2.9%) | 157 (3.9%) |
| $17,500 to $19,999 | 48 (1.0%) | 131 (3.3%) |
| $20,000 to $22,499 | 114 (2.3%) | 102 (2.5%) |
| $22,500 to $24,999 | 133 (2.7%) | 245 (6.1%) |
| $25,000 to $29,999 | 164 (3.4%) | 302 (7.6%) |
| $30,000 to $34,999 | 209 (4.3%) | 375 (9.4%) |
| $35,000 to $39,999 | 334 (6.8%) | 250 (6.2%) |
| $40,000 to $44,999 | 246 (5.0%) | 263 (6.6%) |
| $45,000 to $49,999 | 522 (10.7%) | 223 (5.6%) |
| $50,000 to $54,999 | 278 (5.7%) | 191 (4.8%) |
| $55,000 to $64,999 | 605 (12.4%) | 189 (4.7%) |
| $65,000 to $74,999 | 350 (7.2%) | 259 (6.5%) |
| $75,000 to $99,999 | 420 (8.6%) | 237 (5.9%) |
| $100,000+ | 532 (10.9%) | 80 (2.0%) |
| Total | 4,883 (100.0%) | 3,997 (100.0%) |
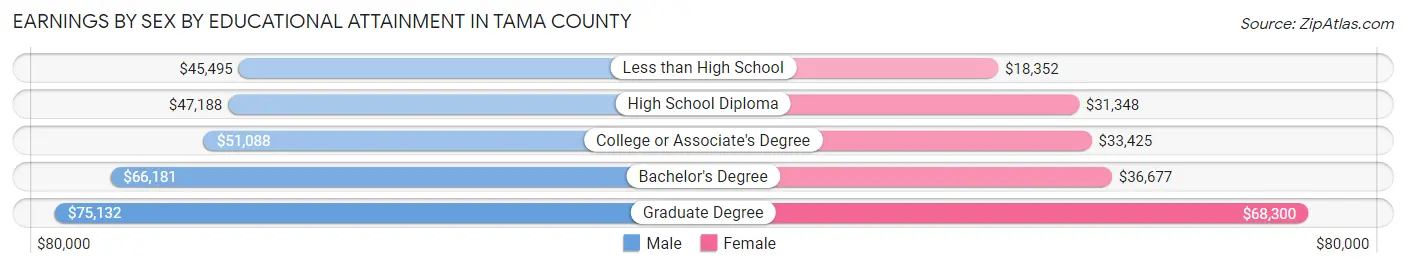
Earnings by Sex by Educational Attainment in Tama County
Average earnings in Tama County are $49,538 for men and $33,909 for women, a difference of 31.6%. Men with an educational attainment of graduate degree enjoy the highest average annual earnings of $75,132, while those with less than high school education earn the least with $45,495. Women with an educational attainment of graduate degree earn the most with the average annual earnings of $68,300, while those with less than high school education have the smallest earnings of $18,352.
| Educational Attainment | Male Income | Female Income |
| Less than High School | $45,495 | $18,352 |
| High School Diploma | $47,188 | $31,348 |
| College or Associate's Degree | $51,088 | $33,425 |
| Bachelor's Degree | $66,181 | $36,677 |
| Graduate Degree | $75,132 | $68,300 |
| Total | $49,538 | $33,909 |
Family Income in Tama County
Family Income Brackets in Tama County
According to the Tama County family income data, there are 1,103 families falling into the $100,000 to $149,999 income range, which is the most common income bracket and makes up 24.0% of all families. Conversely, the $10,000 to $14,999 income bracket is the least frequent group with only 74 families (1.6%) belonging to this category.
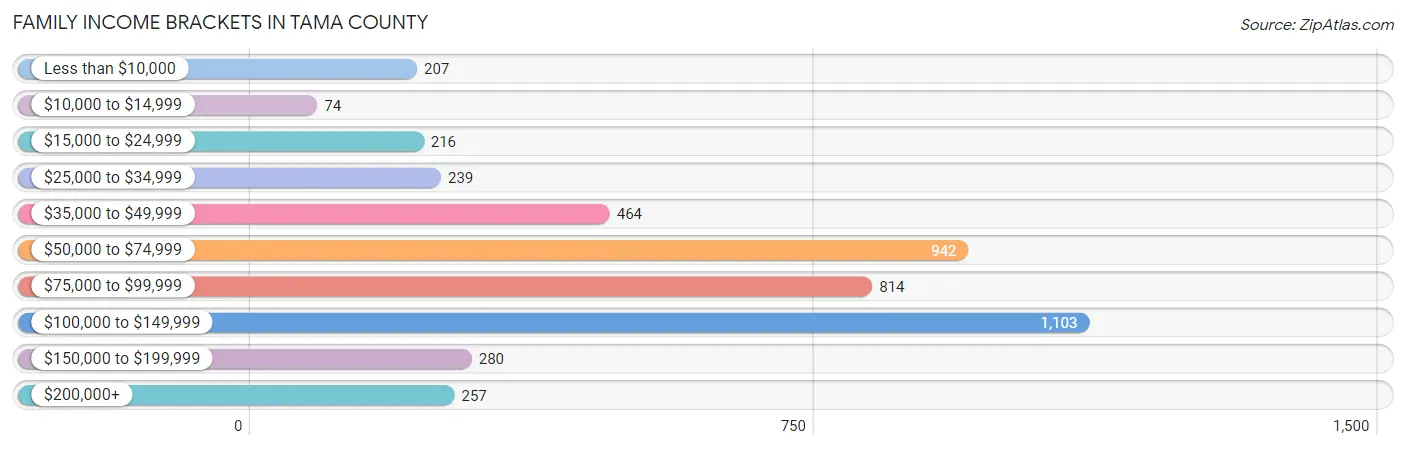
| Income Bracket | # Families | % Families |
| Less than $10,000 | 207 | 4.5% |
| $10,000 to $14,999 | 74 | 1.6% |
| $15,000 to $24,999 | 216 | 4.7% |
| $25,000 to $34,999 | 239 | 5.2% |
| $35,000 to $49,999 | 464 | 10.1% |
| $50,000 to $74,999 | 942 | 20.5% |
| $75,000 to $99,999 | 814 | 17.7% |
| $100,000 to $149,999 | 1,103 | 24.0% |
| $150,000 to $199,999 | 280 | 6.1% |
| $200,000+ | 257 | 5.6% |
Family Income by Famaliy Size in Tama County
4-person families (673 | 14.6%) account for the highest median family income in Tama County with $90,707 per family, while 2-person families (2,561 | 55.7%) have the highest median income of $38,953 per family member.
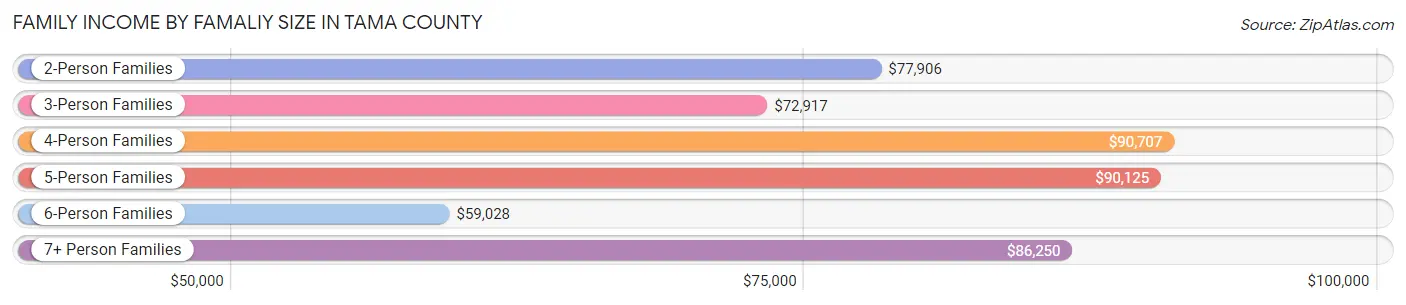
| Income Bracket | # Families | Median Income |
| 2-Person Families | 2,561 (55.7%) | $77,906 |
| 3-Person Families | 796 (17.3%) | $72,917 |
| 4-Person Families | 673 (14.6%) | $90,707 |
| 5-Person Families | 399 (8.7%) | $90,125 |
| 6-Person Families | 96 (2.1%) | $59,028 |
| 7+ Person Families | 72 (1.6%) | $86,250 |
| Total | 4,597 (100.0%) | $78,503 |
Family Income by Number of Earners in Tama County
The median family income in Tama County is $78,503, with families comprising 3+ earners (364) having the highest median family income of $106,389, while families with no earners (733) have the lowest median family income of $45,573, accounting for 7.9% and 16.0% of families, respectively.
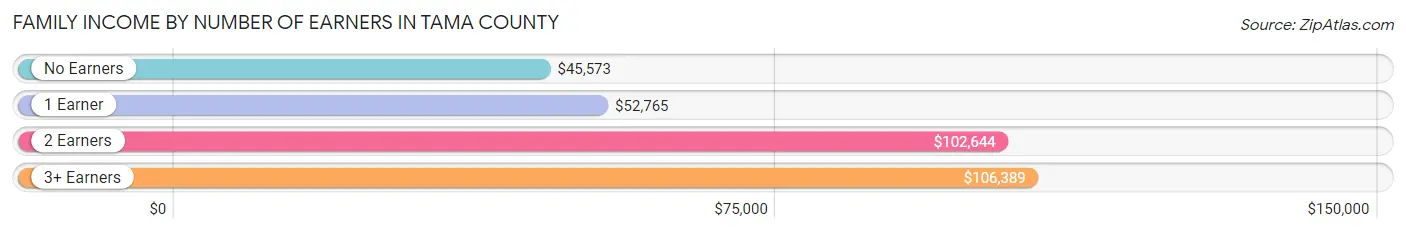
| Number of Earners | # Families | Median Income |
| No Earners | 733 (16.0%) | $45,573 |
| 1 Earner | 1,378 (30.0%) | $52,765 |
| 2 Earners | 2,122 (46.2%) | $102,644 |
| 3+ Earners | 364 (7.9%) | $106,389 |
| Total | 4,597 (100.0%) | $78,503 |
Household Income in Tama County
Household Income Brackets in Tama County
With 1,327 households falling in the category, the $50,000 to $74,999 income range is the most frequent in Tama County, accounting for 19.8% of all households. In contrast, only 275 households (4.1%) fall into the $200,000+ income bracket, making it the least populous group.
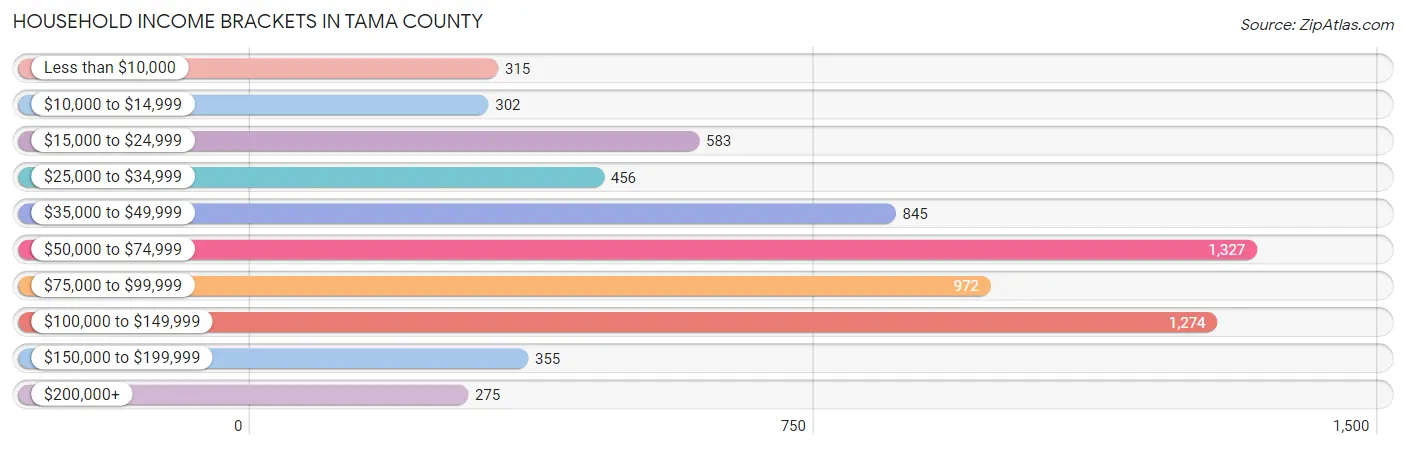
| Income Bracket | # Households | % Households |
| Less than $10,000 | 315 | 4.7% |
| $10,000 to $14,999 | 302 | 4.5% |
| $15,000 to $24,999 | 583 | 8.7% |
| $25,000 to $34,999 | 456 | 6.8% |
| $35,000 to $49,999 | 845 | 12.6% |
| $50,000 to $74,999 | 1,327 | 19.8% |
| $75,000 to $99,999 | 972 | 14.5% |
| $100,000 to $149,999 | 1,274 | 19.0% |
| $150,000 to $199,999 | 355 | 5.3% |
| $200,000+ | 275 | 4.1% |
Household Income by Householder Age in Tama County
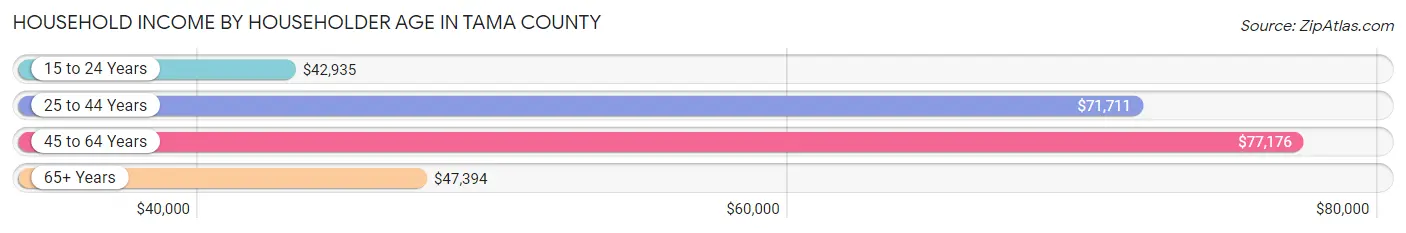
The median household income in Tama County is $65,483, with the highest median household income of $77,176 found in the 45 to 64 years age bracket for the primary householder. A total of 2,547 households (38.0%) fall into this category. Meanwhile, the 15 to 24 years age bracket for the primary householder has the lowest median household income of $42,935, with 284 households (4.2%) in this group.
| Income Bracket | # Households | Median Income |
| 15 to 24 Years | 284 (4.2%) | $42,935 |
| 25 to 44 Years | 1,856 (27.7%) | $71,711 |
| 45 to 64 Years | 2,547 (38.0%) | $77,176 |
| 65+ Years | 2,016 (30.1%) | $47,394 |
| Total | 6,703 (100.0%) | $65,483 |
Poverty in Tama County
Income Below Poverty by Sex and Age in Tama County
With 13.3% poverty level for males and 17.1% for females among the residents of Tama County, 16 and 17 year old males and 18 to 24 year old females are the most vulnerable to poverty, with 116 males (41.1%) and 250 females (42.0%) in their respective age groups living below the poverty level.
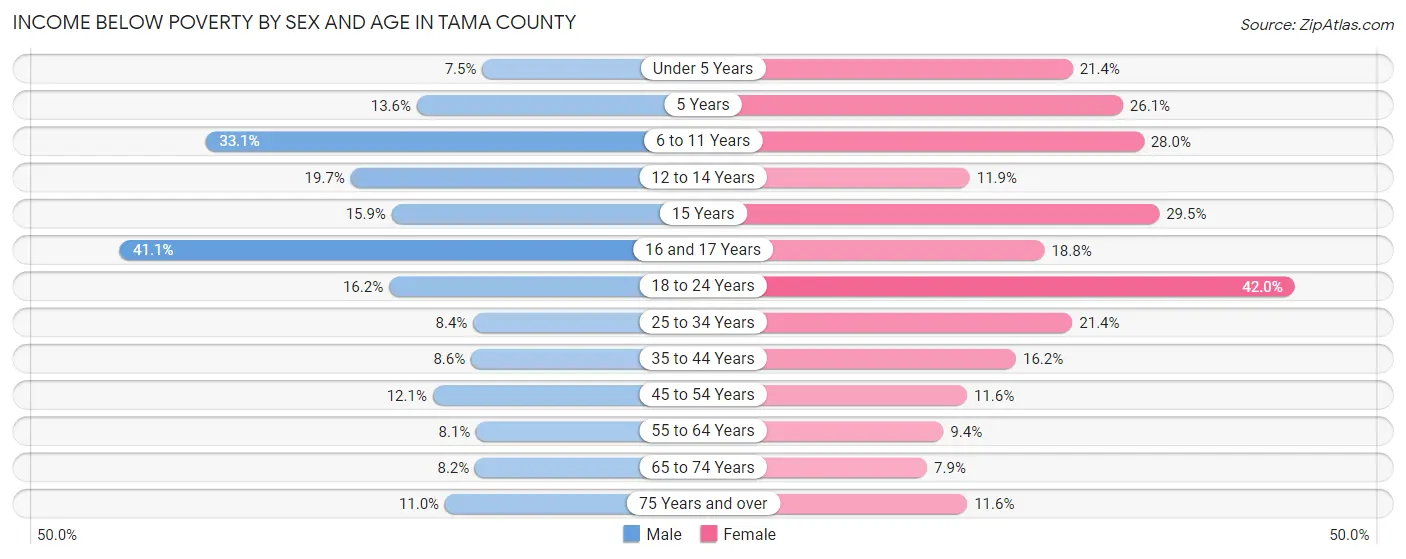
| Age Bracket | Male | Female |
| Under 5 Years | 40 (7.5%) | 102 (21.4%) |
| 5 Years | 17 (13.6%) | 36 (26.1%) |
| 6 to 11 Years | 215 (33.1%) | 160 (28.0%) |
| 12 to 14 Years | 77 (19.7%) | 43 (11.9%) |
| 15 Years | 18 (15.9%) | 33 (29.5%) |
| 16 and 17 Years | 116 (41.1%) | 38 (18.8%) |
| 18 to 24 Years | 116 (16.2%) | 250 (42.0%) |
| 25 to 34 Years | 77 (8.4%) | 199 (21.4%) |
| 35 to 44 Years | 80 (8.6%) | 148 (16.2%) |
| 45 to 54 Years | 122 (12.1%) | 114 (11.6%) |
| 55 to 64 Years | 103 (8.1%) | 116 (9.4%) |
| 65 to 74 Years | 77 (8.2%) | 74 (7.9%) |
| 75 Years and over | 59 (11.0%) | 83 (11.6%) |
| Total | 1,117 (13.3%) | 1,396 (17.1%) |
Income Above Poverty by Sex and Age in Tama County
According to the poverty statistics in Tama County, males aged under 5 years and females aged 65 to 74 years are the age groups that are most secure financially, with 92.5% of males and 92.1% of females in these age groups living above the poverty line.
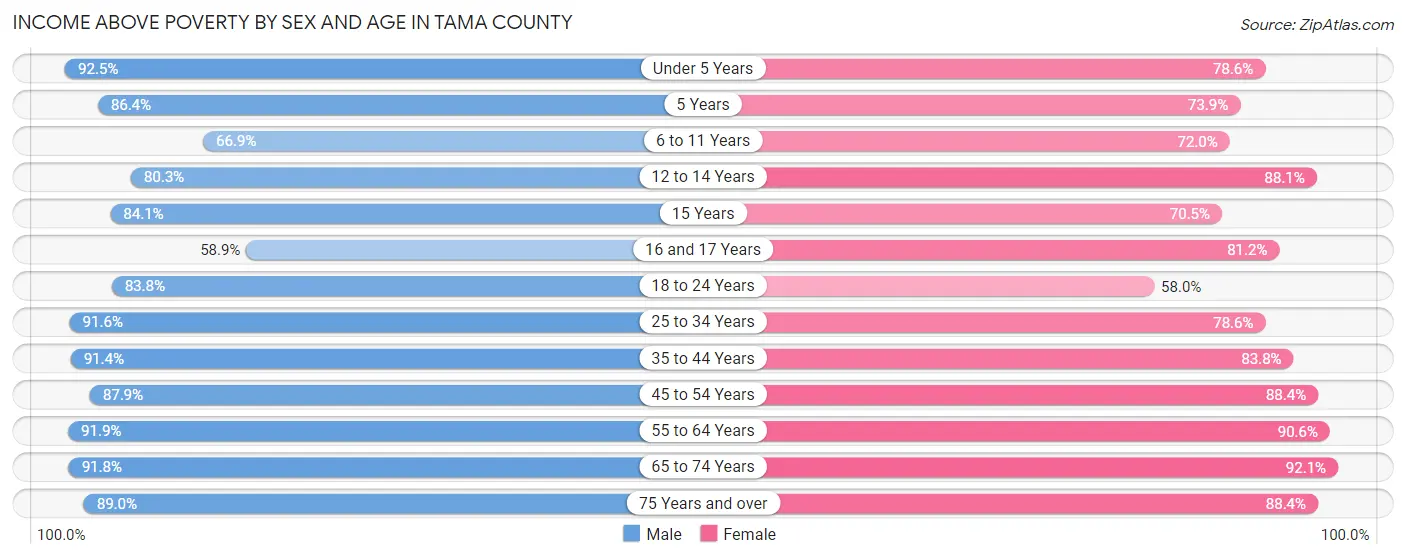
| Age Bracket | Male | Female |
| Under 5 Years | 492 (92.5%) | 374 (78.6%) |
| 5 Years | 108 (86.4%) | 102 (73.9%) |
| 6 to 11 Years | 434 (66.9%) | 411 (72.0%) |
| 12 to 14 Years | 313 (80.3%) | 319 (88.1%) |
| 15 Years | 95 (84.1%) | 79 (70.5%) |
| 16 and 17 Years | 166 (58.9%) | 164 (81.2%) |
| 18 to 24 Years | 601 (83.8%) | 345 (58.0%) |
| 25 to 34 Years | 843 (91.6%) | 731 (78.6%) |
| 35 to 44 Years | 854 (91.4%) | 767 (83.8%) |
| 45 to 54 Years | 885 (87.9%) | 867 (88.4%) |
| 55 to 64 Years | 1,170 (91.9%) | 1,114 (90.6%) |
| 65 to 74 Years | 863 (91.8%) | 860 (92.1%) |
| 75 Years and over | 478 (89.0%) | 630 (88.4%) |
| Total | 7,302 (86.7%) | 6,763 (82.9%) |
Income Below Poverty Among Married-Couple Families in Tama County
The poverty statistics for married-couple families in Tama County show that 4.6% or 166 of the total 3,603 families live below the poverty line. Families with 5 or more children have the highest poverty rate of 27.7%, comprising of 13 families. On the other hand, families with 1 or 2 children have the lowest poverty rate of 3.9%, which includes 34 families.
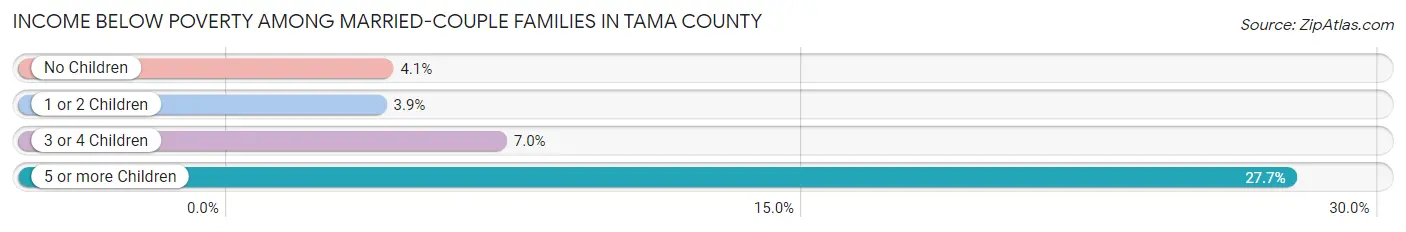
| Children | Above Poverty | Below Poverty |
| No Children | 2,243 (95.9%) | 95 (4.1%) |
| 1 or 2 Children | 842 (96.1%) | 34 (3.9%) |
| 3 or 4 Children | 318 (93.0%) | 24 (7.0%) |
| 5 or more Children | 34 (72.3%) | 13 (27.7%) |
| Total | 3,437 (95.4%) | 166 (4.6%) |
Income Below Poverty Among Single-Parent Households in Tama County
According to the poverty data in Tama County, 15.5% or 55 single-father households and 46.5% or 297 single-mother households are living below the poverty line. Among single-father households, those with 3 or 4 children have the highest poverty rate, with 24 households (57.1%) experiencing poverty. Likewise, among single-mother households, those with 5 or more children have the highest poverty rate, with 2 households (100.0%) falling below the poverty line.
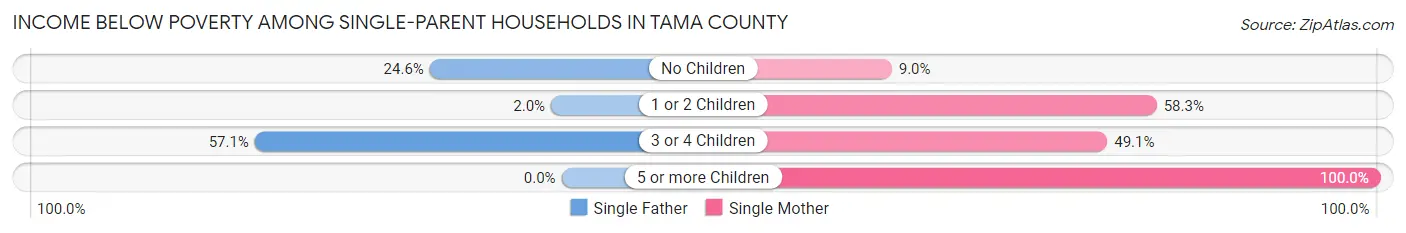
| Children | Single Father | Single Mother |
| No Children | 27 (24.5%) | 12 (9.0%) |
| 1 or 2 Children | 4 (2.0%) | 228 (58.3%) |
| 3 or 4 Children | 24 (57.1%) | 55 (49.1%) |
| 5 or more Children | 0 (0.0%) | 2 (100.0%) |
| Total | 55 (15.5%) | 297 (46.5%) |
Income Below Poverty Among Married-Couple vs Single-Parent Households in Tama County
The poverty data for Tama County shows that 166 of the married-couple family households (4.6%) and 352 of the single-parent households (35.4%) are living below the poverty level. Within the married-couple family households, those with 5 or more children have the highest poverty rate, with 13 households (27.7%) falling below the poverty line. Among the single-parent households, those with 5 or more children have the highest poverty rate, with 2 household (100.0%) living below poverty.
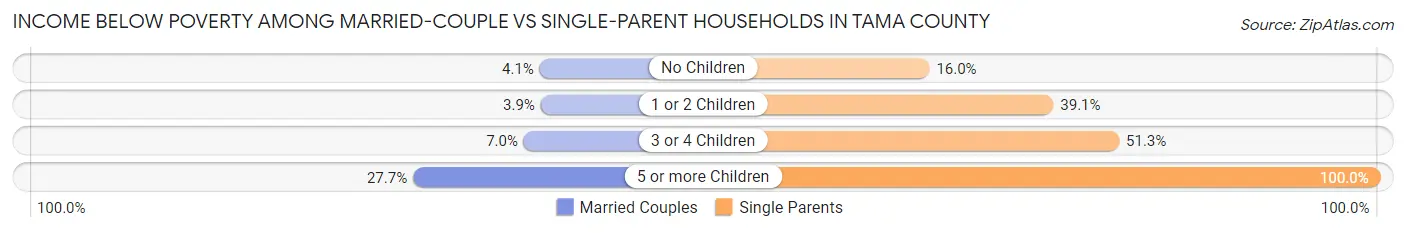
| Children | Married-Couple Families | Single-Parent Households |
| No Children | 95 (4.1%) | 39 (16.0%) |
| 1 or 2 Children | 34 (3.9%) | 232 (39.1%) |
| 3 or 4 Children | 24 (7.0%) | 79 (51.3%) |
| 5 or more Children | 13 (27.7%) | 2 (100.0%) |
| Total | 166 (4.6%) | 352 (35.4%) |
Race in Tama County
The most populous races in Tama County are White / Caucasian (14,134 | 83.1%), Hispanic or Latino (1,965 | 11.6%), and Native / Alaskan (1,268 | 7.4%).
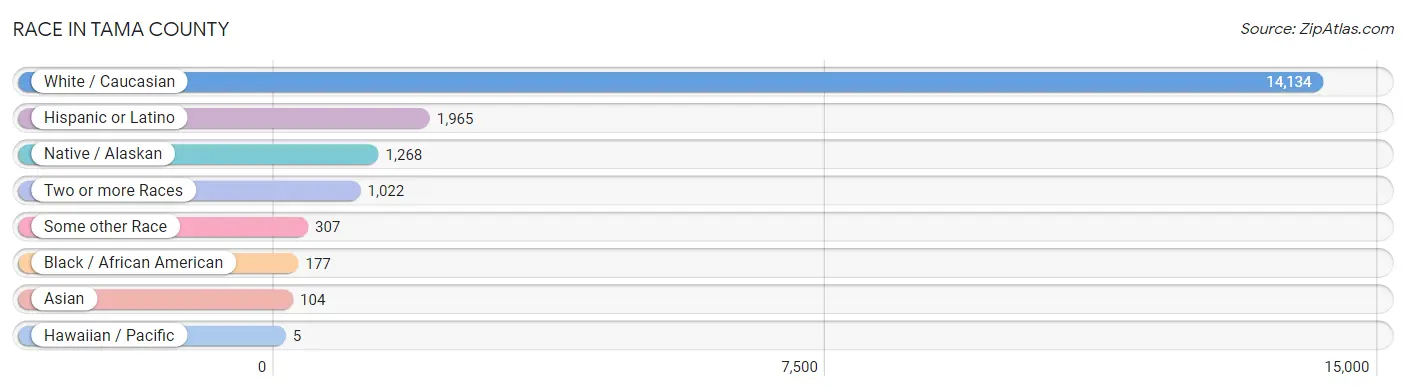
| Race | # Population | % Population |
| Asian | 104 | 0.6% |
| Black / African American | 177 | 1.0% |
| Hawaiian / Pacific | 5 | 0.0% |
| Hispanic or Latino | 1,965 | 11.6% |
| Native / Alaskan | 1,268 | 7.4% |
| White / Caucasian | 14,134 | 83.1% |
| Two or more Races | 1,022 | 6.0% |
| Some other Race | 307 | 1.8% |
| Total | 17,017 | 100.0% |
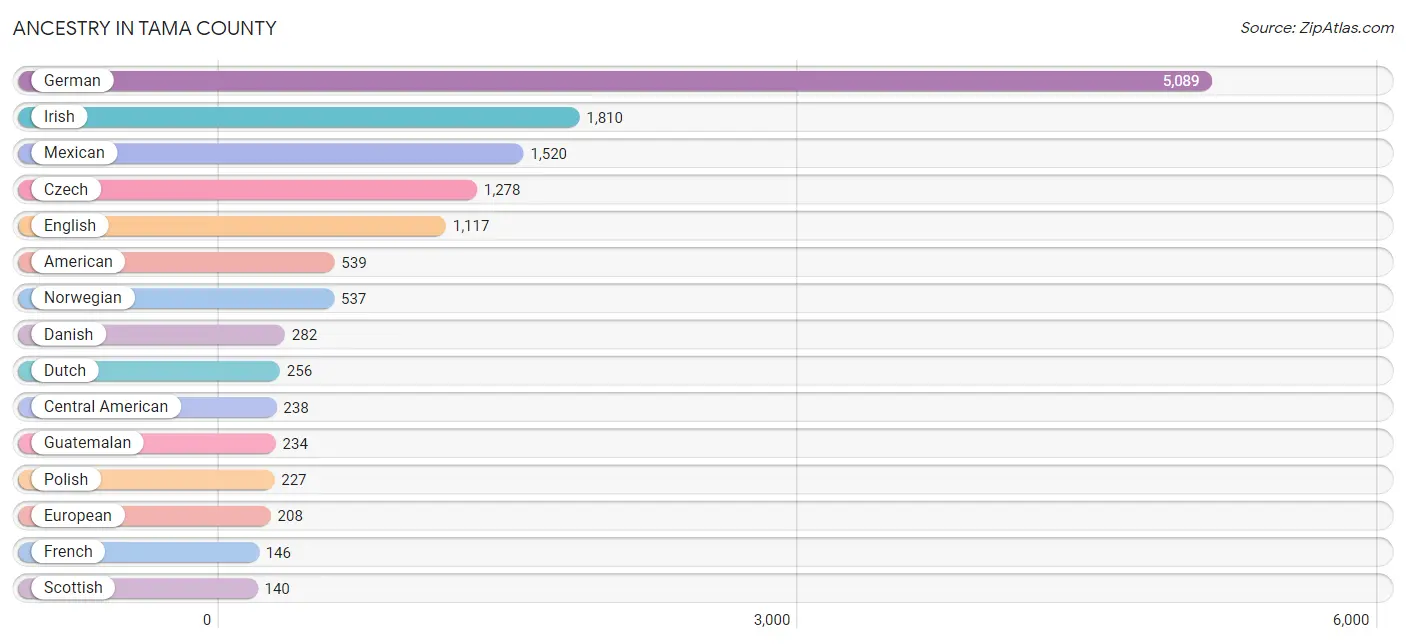
Ancestry in Tama County
The most populous ancestries reported in Tama County are German (5,089 | 29.9%), Irish (1,810 | 10.6%), Mexican (1,520 | 8.9%), Czech (1,278 | 7.5%), and English (1,117 | 6.6%), together accounting for 63.5% of all Tama County residents.
| Ancestry | # Population | % Population |
| African | 16 | 0.1% |
| American | 539 | 3.2% |
| Apache | 2 | 0.0% |
| Arapaho | 8 | 0.1% |
| Austrian | 4 | 0.0% |
| Belgian | 31 | 0.2% |
| Bhutanese | 11 | 0.1% |
| British | 71 | 0.4% |
| Burmese | 3 | 0.0% |
| Canadian | 8 | 0.1% |
| Celtic | 21 | 0.1% |
| Central American | 238 | 1.4% |
| Central American Indian | 15 | 0.1% |
| Cherokee | 38 | 0.2% |
| Chippewa | 28 | 0.2% |
| Comanche | 2 | 0.0% |
| Costa Rican | 1 | 0.0% |
| Croatian | 6 | 0.0% |
| Crow | 15 | 0.1% |
| Cuban | 111 | 0.6% |
| Czech | 1,278 | 7.5% |
| Czechoslovakian | 79 | 0.5% |
| Danish | 282 | 1.7% |
| Dutch | 256 | 1.5% |
| Eastern European | 11 | 0.1% |
| Ecuadorian | 2 | 0.0% |
| English | 1,117 | 6.6% |
| European | 208 | 1.2% |
| French | 146 | 0.9% |
| French American Indian | 2 | 0.0% |
| French Canadian | 13 | 0.1% |
| German | 5,089 | 29.9% |
| Greek | 12 | 0.1% |
| Guatemalan | 234 | 1.4% |
| Hungarian | 18 | 0.1% |
| Indian (Asian) | 74 | 0.4% |
| Irish | 1,810 | 10.6% |
| Italian | 115 | 0.7% |
| Korean | 27 | 0.2% |
| Laotian | 10 | 0.1% |
| Lithuanian | 6 | 0.0% |
| Malaysian | 3 | 0.0% |
| Mexican | 1,520 | 8.9% |
| Mexican American Indian | 4 | 0.0% |
| Native Hawaiian | 7 | 0.0% |
| Northern European | 9 | 0.1% |
| Norwegian | 537 | 3.2% |
| Paiute | 2 | 0.0% |
| Pennsylvania German | 10 | 0.1% |
| Pima | 12 | 0.1% |
| Polish | 227 | 1.3% |
| Portuguese | 1 | 0.0% |
| Potawatomi | 2 | 0.0% |
| Puerto Rican | 72 | 0.4% |
| Russian | 51 | 0.3% |
| Salvadoran | 3 | 0.0% |
| Scandinavian | 44 | 0.3% |
| Scotch-Irish | 76 | 0.4% |
| Scottish | 140 | 0.8% |
| Seminole | 1 | 0.0% |
| Sioux | 57 | 0.3% |
| Slavic | 6 | 0.0% |
| Slovak | 2 | 0.0% |
| Somali | 1 | 0.0% |
| South American | 2 | 0.0% |
| Spanish | 1 | 0.0% |
| Subsaharan African | 50 | 0.3% |
| Swedish | 133 | 0.8% |
| Swiss | 133 | 0.8% |
| Thai | 7 | 0.0% |
| Welsh | 127 | 0.7% |
| Yugoslavian | 3 | 0.0% | View All 72 Rows |
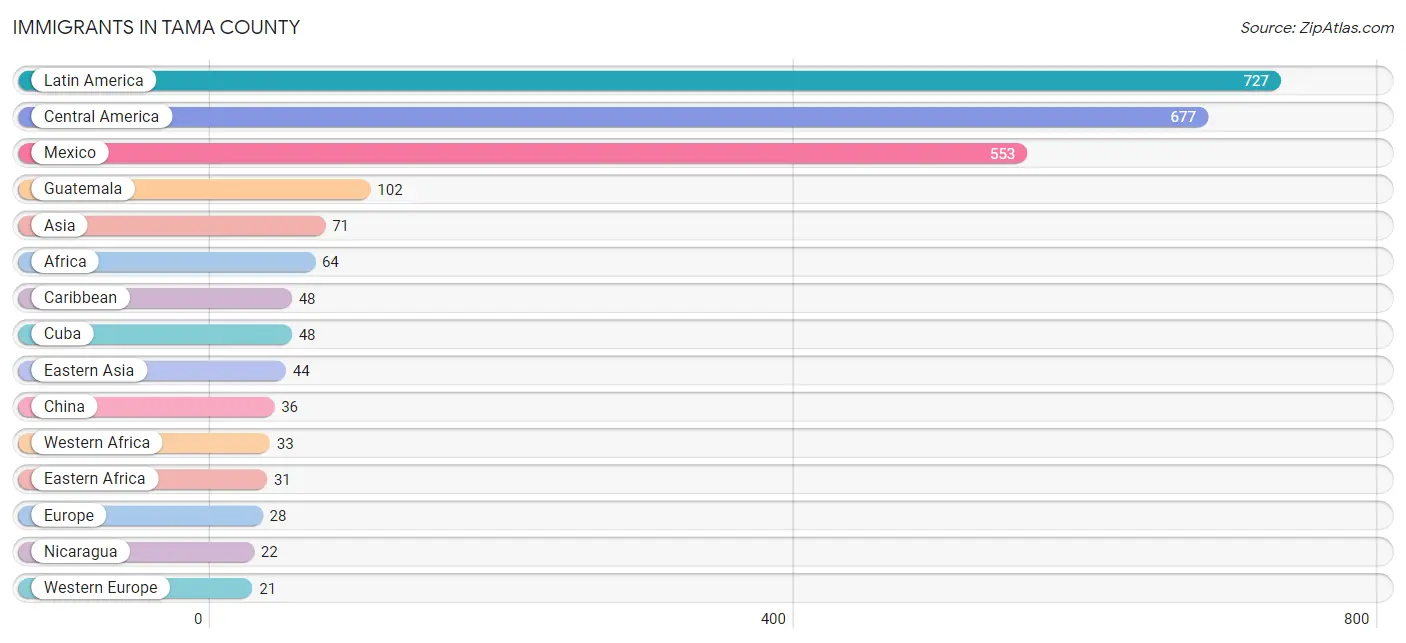
Immigrants in Tama County
The most numerous immigrant groups reported in Tama County came from Latin America (727 | 4.3%), Central America (677 | 4.0%), Mexico (553 | 3.3%), Guatemala (102 | 0.6%), and Asia (71 | 0.4%), together accounting for 12.5% of all Tama County residents.
| Immigration Origin | # Population | % Population |
| Africa | 64 | 0.4% |
| Asia | 71 | 0.4% |
| Austria | 5 | 0.0% |
| Canada | 2 | 0.0% |
| Caribbean | 48 | 0.3% |
| Central America | 677 | 4.0% |
| China | 36 | 0.2% |
| Cuba | 48 | 0.3% |
| Eastern Africa | 31 | 0.2% |
| Eastern Asia | 44 | 0.3% |
| Ecuador | 2 | 0.0% |
| England | 7 | 0.0% |
| Europe | 28 | 0.2% |
| Germany | 5 | 0.0% |
| Guatemala | 102 | 0.6% |
| India | 7 | 0.0% |
| Indonesia | 5 | 0.0% |
| Japan | 5 | 0.0% |
| Korea | 3 | 0.0% |
| Latin America | 727 | 4.3% |
| Mexico | 553 | 3.3% |
| Micronesia | 3 | 0.0% |
| Netherlands | 11 | 0.1% |
| Nicaragua | 22 | 0.1% |
| Northern Europe | 7 | 0.0% |
| Oceania | 3 | 0.0% |
| Philippines | 15 | 0.1% |
| Somalia | 20 | 0.1% |
| South America | 2 | 0.0% |
| South Central Asia | 7 | 0.0% |
| South Eastern Asia | 20 | 0.1% |
| Uganda | 8 | 0.1% |
| Western Africa | 33 | 0.2% |
| Western Europe | 21 | 0.1% | View All 34 Rows |
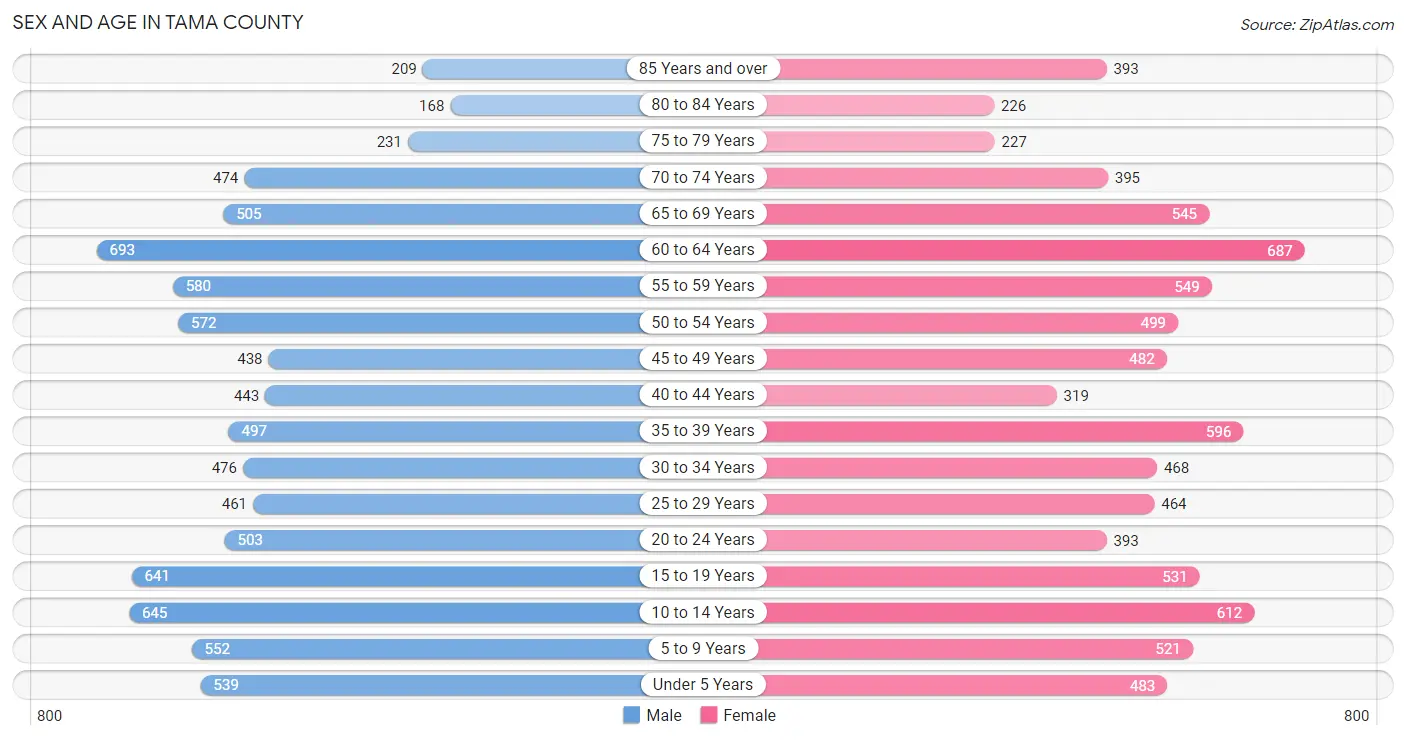
Sex and Age in Tama County
Sex and Age in Tama County
The most populous age groups in Tama County are 60 to 64 Years (693 | 8.0%) for men and 60 to 64 Years (687 | 8.2%) for women.
| Age Bracket | Male | Female |
| Under 5 Years | 539 (6.2%) | 483 (5.8%) |
| 5 to 9 Years | 552 (6.4%) | 521 (6.2%) |
| 10 to 14 Years | 645 (7.5%) | 612 (7.3%) |
| 15 to 19 Years | 641 (7.4%) | 531 (6.3%) |
| 20 to 24 Years | 503 (5.8%) | 393 (4.7%) |
| 25 to 29 Years | 461 (5.3%) | 464 (5.5%) |
| 30 to 34 Years | 476 (5.5%) | 468 (5.6%) |
| 35 to 39 Years | 497 (5.8%) | 596 (7.1%) |
| 40 to 44 Years | 443 (5.1%) | 319 (3.8%) |
| 45 to 49 Years | 438 (5.1%) | 482 (5.7%) |
| 50 to 54 Years | 572 (6.6%) | 499 (5.9%) |
| 55 to 59 Years | 580 (6.7%) | 549 (6.5%) |
| 60 to 64 Years | 693 (8.0%) | 687 (8.2%) |
| 65 to 69 Years | 505 (5.9%) | 545 (6.5%) |
| 70 to 74 Years | 474 (5.5%) | 395 (4.7%) |
| 75 to 79 Years | 231 (2.7%) | 227 (2.7%) |
| 80 to 84 Years | 168 (1.9%) | 226 (2.7%) |
| 85 Years and over | 209 (2.4%) | 393 (4.7%) |
| Total | 8,627 (100.0%) | 8,390 (100.0%) |
Families and Households in Tama County
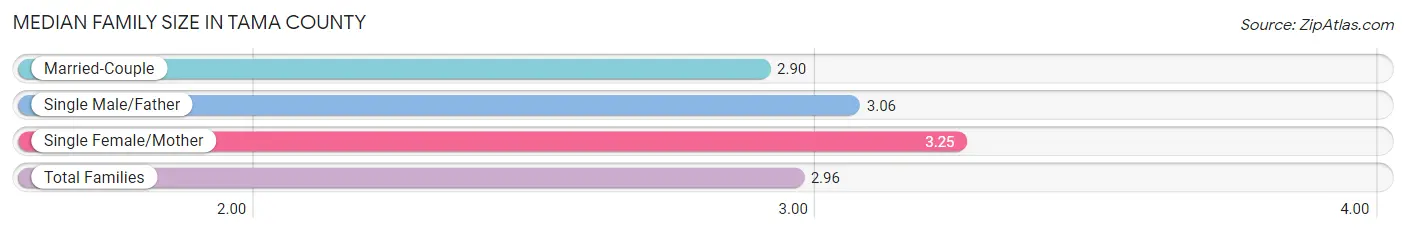
Median Family Size in Tama County
The median family size in Tama County is 2.96 persons per family, with single female/mother families (639 | 13.9%) accounting for the largest median family size of 3.25 persons per family. On the other hand, married-couple families (3,603 | 78.4%) represent the smallest median family size with 2.90 persons per family.
| Family Type | # Families | Family Size |
| Married-Couple | 3,603 (78.4%) | 2.90 |
| Single Male/Father | 355 (7.7%) | 3.06 |
| Single Female/Mother | 639 (13.9%) | 3.25 |
| Total Families | 4,597 (100.0%) | 2.96 |
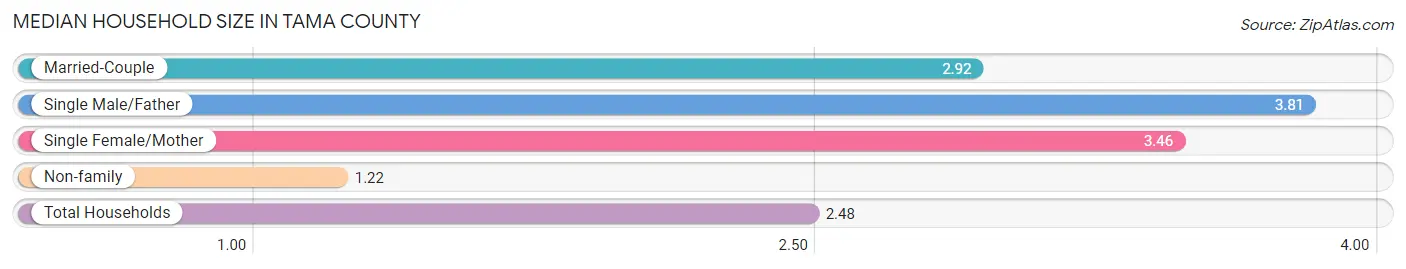
Median Household Size in Tama County
The median household size in Tama County is 2.48 persons per household, with single male/father households (355 | 5.3%) accounting for the largest median household size of 3.81 persons per household. non-family households (2,106 | 31.4%) represent the smallest median household size with 1.22 persons per household.
| Household Type | # Households | Household Size |
| Married-Couple | 3,603 (53.7%) | 2.92 |
| Single Male/Father | 355 (5.3%) | 3.81 |
| Single Female/Mother | 639 (9.5%) | 3.46 |
| Non-family | 2,106 (31.4%) | 1.22 |
| Total Households | 6,703 (100.0%) | 2.48 |
Household Size by Marriage Status in Tama County
Out of a total of 6,703 households in Tama County, 4,597 (68.6%) are family households, while 2,106 (31.4%) are nonfamily households. The most numerous type of family households are 2-person households, comprising 2,393, and the most common type of nonfamily households are 1-person households, comprising 1,735.
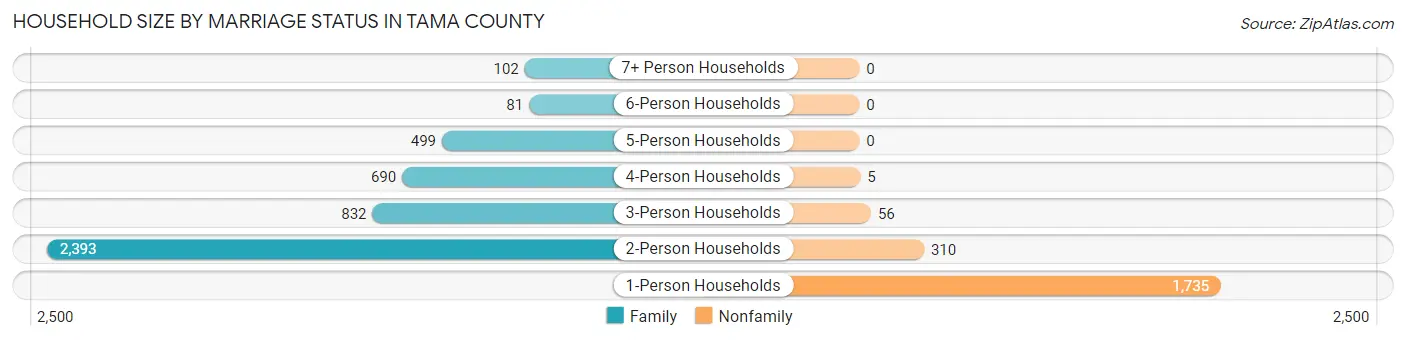
| Household Size | Family Households | Nonfamily Households |
| 1-Person Households | - | 1,735 (25.9%) |
| 2-Person Households | 2,393 (35.7%) | 310 (4.6%) |
| 3-Person Households | 832 (12.4%) | 56 (0.8%) |
| 4-Person Households | 690 (10.3%) | 5 (0.1%) |
| 5-Person Households | 499 (7.4%) | 0 (0.0%) |
| 6-Person Households | 81 (1.2%) | 0 (0.0%) |
| 7+ Person Households | 102 (1.5%) | 0 (0.0%) |
| Total | 4,597 (68.6%) | 2,106 (31.4%) |
Female Fertility in Tama County
Fertility by Age in Tama County
Average fertility rate in Tama County is 113.0 births per 1,000 women. Women in the age bracket of 20 to 34 years have the highest fertility rate with 185.0 births per 1,000 women. Women in the age bracket of 20 to 34 years acount for 64.5% of all women with births.
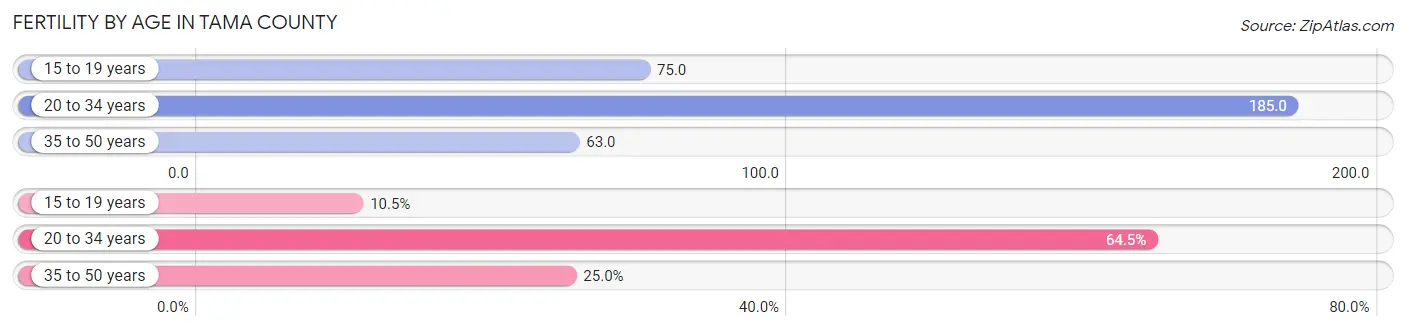
| Age Bracket | Women with Births | Births / 1,000 Women |
| 15 to 19 years | 40 (10.5%) | 75.0 |
| 20 to 34 years | 245 (64.5%) | 185.0 |
| 35 to 50 years | 95 (25.0%) | 63.0 |
| Total | 380 (100.0%) | 113.0 |
Fertility by Age by Marriage Status in Tama County
72.9% of women with births (380) in Tama County are married. The highest percentage of unmarried women with births falls into 15 to 19 years age bracket with 100.0% of them unmarried at the time of birth, while the lowest percentage of unmarried women with births belong to 35 to 50 years age bracket with 2.1% of them unmarried.
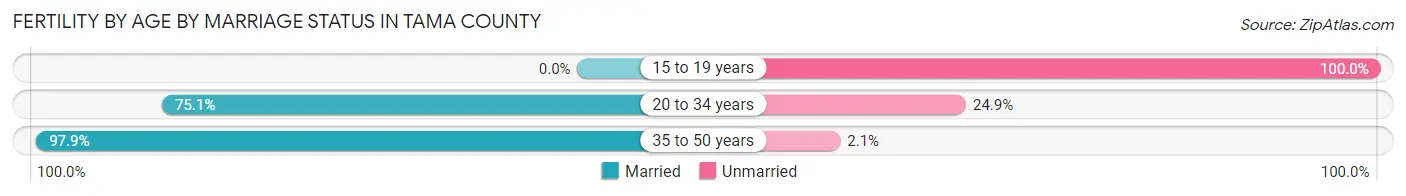
| Age Bracket | Married | Unmarried |
| 15 to 19 years | 0 (0.0%) | 40 (100.0%) |
| 20 to 34 years | 184 (75.1%) | 61 (24.9%) |
| 35 to 50 years | 93 (97.9%) | 2 (2.1%) |
| Total | 277 (72.9%) | 103 (27.1%) |
Fertility by Education in Tama County
Average fertility rate in Tama County is 113.0 births per 1,000 women. Women with the education attainment of high school diploma have the highest fertility rate of 183.0 births per 1,000 women, while women with the education attainment of graduate degree have the lowest fertility at 60.0 births per 1,000 women. Women with the education attainment of high school diploma represent 45.8% of all women with births.
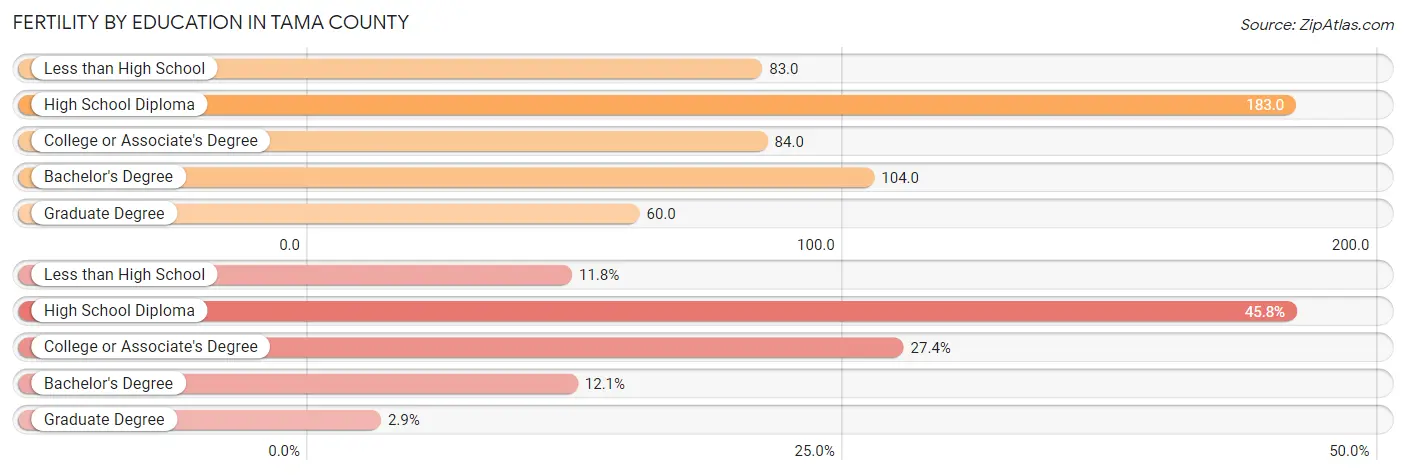
| Educational Attainment | Women with Births | Births / 1,000 Women |
| Less than High School | 45 (11.8%) | 83.0 |
| High School Diploma | 174 (45.8%) | 183.0 |
| College or Associate's Degree | 104 (27.4%) | 84.0 |
| Bachelor's Degree | 46 (12.1%) | 104.0 |
| Graduate Degree | 11 (2.9%) | 60.0 |
| Total | 380 (100.0%) | 113.0 |
Fertility by Education by Marriage Status in Tama County
27.1% of women with births in Tama County are unmarried. Women with the educational attainment of graduate degree are most likely to be married with 100.0% of them married at childbirth, while women with the educational attainment of less than high school are least likely to be married with 73.3% of them unmarried at childbirth.
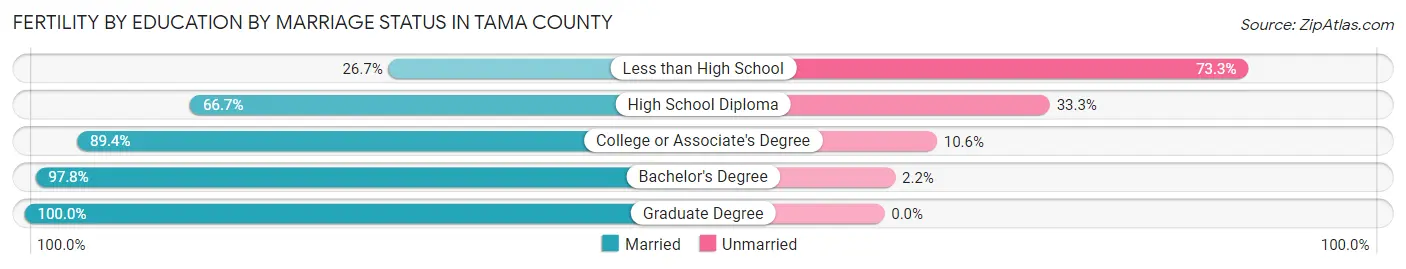
| Educational Attainment | Married | Unmarried |
| Less than High School | 12 (26.7%) | 33 (73.3%) |
| High School Diploma | 116 (66.7%) | 58 (33.3%) |
| College or Associate's Degree | 93 (89.4%) | 11 (10.6%) |
| Bachelor's Degree | 45 (97.8%) | 1 (2.2%) |
| Graduate Degree | 11 (100.0%) | 0 (0.0%) |
| Total | 277 (72.9%) | 103 (27.1%) |
Employment Characteristics in Tama County
Employment by Class of Employer in Tama County
Among the 8,090 employed individuals in Tama County, private company employees (5,353 | 66.2%), local government employees (748 | 9.2%), and self-employed (not incorporated) (701 | 8.7%) make up the most common classes of employment.
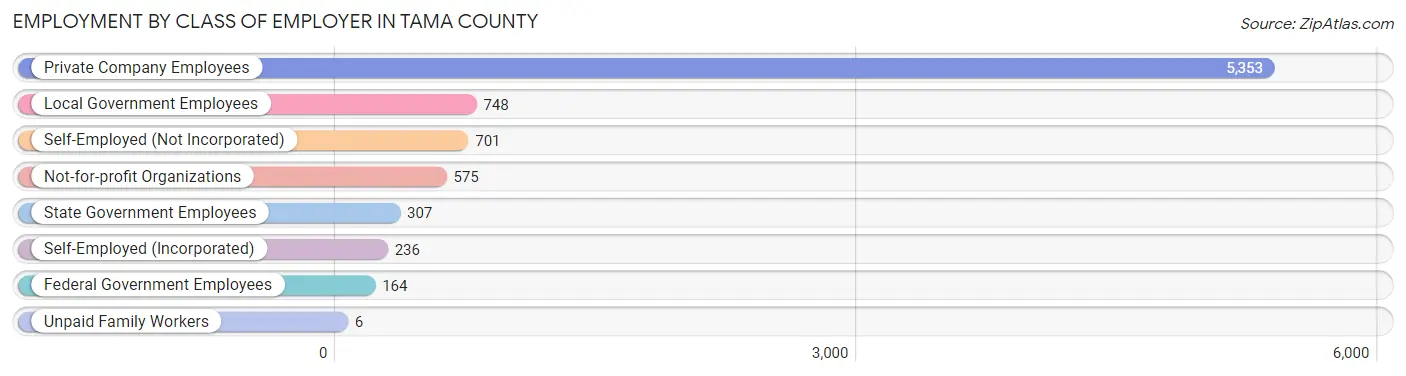
| Employer Class | # Employees | % Employees |
| Private Company Employees | 5,353 | 66.2% |
| Self-Employed (Incorporated) | 236 | 2.9% |
| Self-Employed (Not Incorporated) | 701 | 8.7% |
| Not-for-profit Organizations | 575 | 7.1% |
| Local Government Employees | 748 | 9.2% |
| State Government Employees | 307 | 3.8% |
| Federal Government Employees | 164 | 2.0% |
| Unpaid Family Workers | 6 | 0.1% |
| Total | 8,090 | 100.0% |
Employment Status by Age in Tama County
According to the labor force statistics for Tama County, out of the total population over 16 years of age (13,422), 63.8% or 8,563 individuals are in the labor force, with 4.5% or 385 of them unemployed. The age group with the highest labor force participation rate is 30 to 34 years, with 92.7% or 875 individuals in the labor force. Within the labor force, the 16 to 19 years age range has the highest percentage of unemployed individuals, with 15.9% or 60 of them being unemployed.
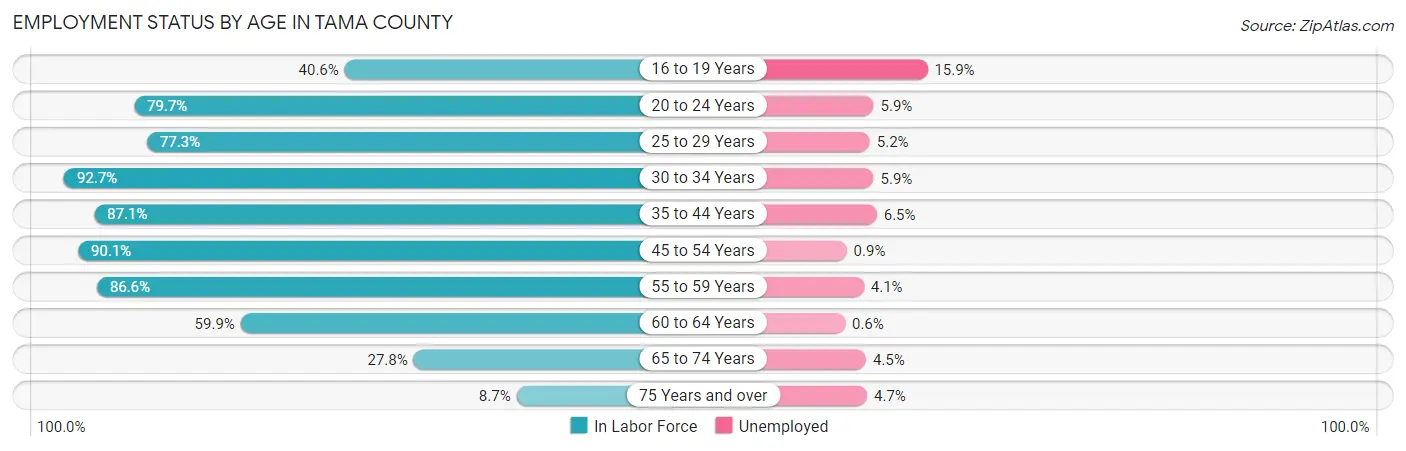
| Age Bracket | In Labor Force | Unemployed |
| 16 to 19 Years | 377 (40.6%) | 60 (15.9%) |
| 20 to 24 Years | 714 (79.7%) | 42 (5.9%) |
| 25 to 29 Years | 715 (77.3%) | 37 (5.2%) |
| 30 to 34 Years | 875 (92.7%) | 52 (5.9%) |
| 35 to 44 Years | 1,616 (87.1%) | 105 (6.5%) |
| 45 to 54 Years | 1,794 (90.1%) | 16 (0.9%) |
| 55 to 59 Years | 978 (86.6%) | 40 (4.1%) |
| 60 to 64 Years | 827 (59.9%) | 5 (0.6%) |
| 65 to 74 Years | 533 (27.8%) | 24 (4.5%) |
| 75 Years and over | 126 (8.7%) | 6 (4.7%) |
| Total | 8,563 (63.8%) | 385 (4.5%) |
Employment Status by Educational Attainment in Tama County
According to labor force statistics for Tama County, 82.7% of individuals (6,801) out of the total population between 25 and 64 years of age (8,224) are in the labor force, with 3.8% or 258 of them being unemployed. The group with the highest labor force participation rate are those with the educational attainment of bachelor's degree or higher, with 89.8% or 1,395 individuals in the labor force. Within the labor force, individuals with less than high school education have the highest percentage of unemployment, with 15.4% or 78 of them being unemployed.
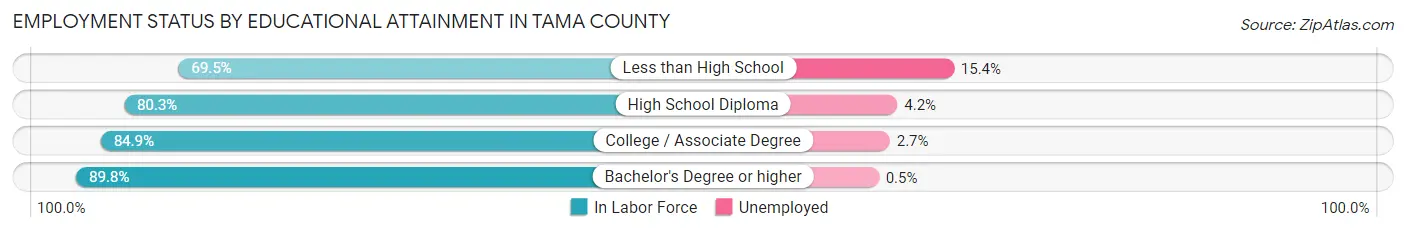
| Educational Attainment | In Labor Force | Unemployed |
| Less than High School | 507 (69.5%) | 112 (15.4%) |
| High School Diploma | 2,484 (80.3%) | 130 (4.2%) |
| College / Associate Degree | 2,418 (84.9%) | 77 (2.7%) |
| Bachelor's Degree or higher | 1,395 (89.8%) | 8 (0.5%) |
| Total | 6,801 (82.7%) | 313 (3.8%) |
Employment Occupations by Sex in Tama County
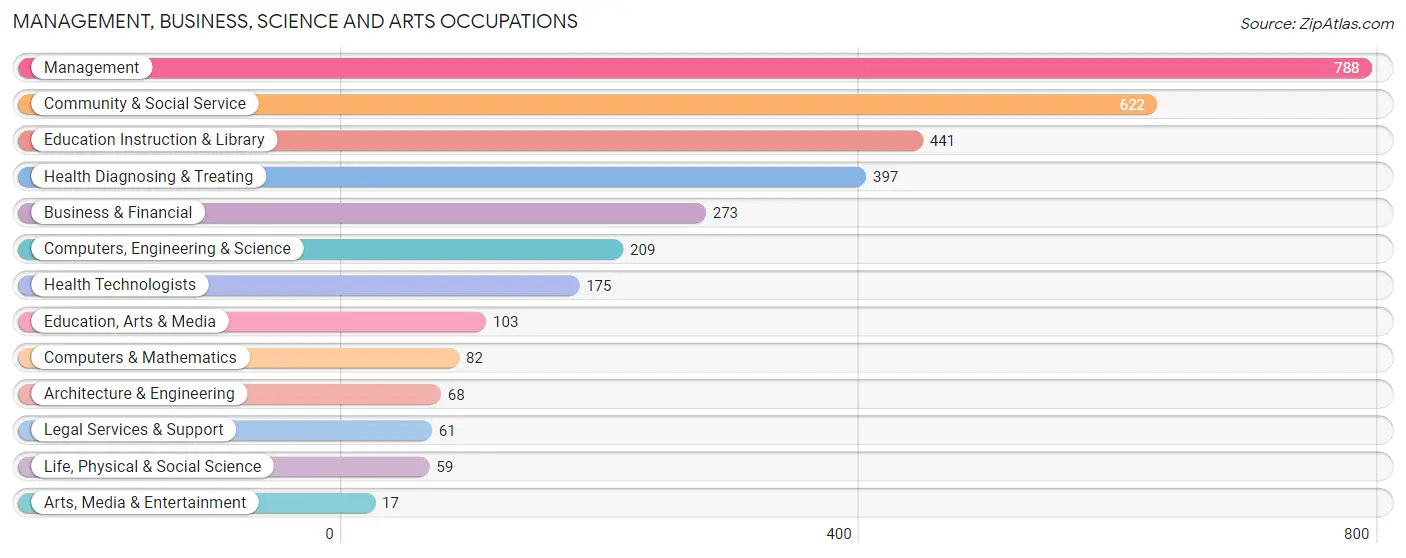
Management, Business, Science and Arts Occupations
The most common Management, Business, Science and Arts occupations in Tama County are Management (788 | 9.7%), Community & Social Service (622 | 7.6%), Education Instruction & Library (441 | 5.4%), Health Diagnosing & Treating (397 | 4.9%), and Business & Financial (273 | 3.3%).
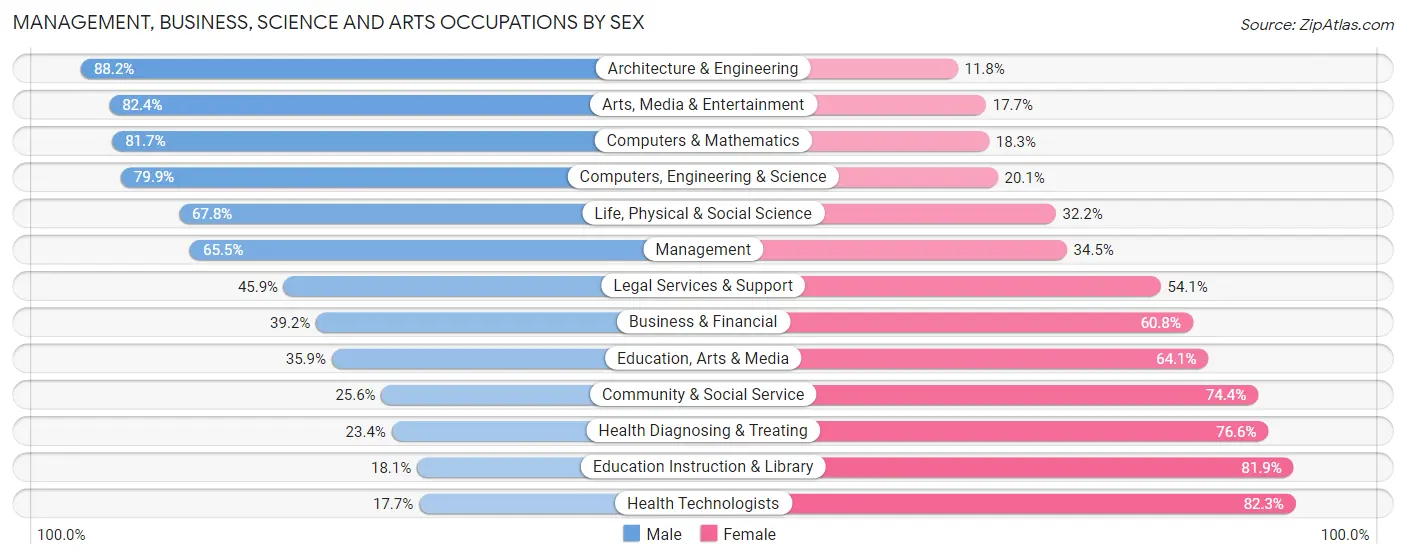
Management, Business, Science and Arts Occupations by Sex
Within the Management, Business, Science and Arts occupations in Tama County, the most male-oriented occupations are Architecture & Engineering (88.2%), Arts, Media & Entertainment (82.4%), and Computers & Mathematics (81.7%), while the most female-oriented occupations are Health Technologists (82.3%), Education Instruction & Library (81.9%), and Health Diagnosing & Treating (76.6%).
| Occupation | Male | Female |
| Management | 516 (65.5%) | 272 (34.5%) |
| Business & Financial | 107 (39.2%) | 166 (60.8%) |
| Computers, Engineering & Science | 167 (79.9%) | 42 (20.1%) |
| Computers & Mathematics | 67 (81.7%) | 15 (18.3%) |
| Architecture & Engineering | 60 (88.2%) | 8 (11.8%) |
| Life, Physical & Social Science | 40 (67.8%) | 19 (32.2%) |
| Community & Social Service | 159 (25.6%) | 463 (74.4%) |
| Education, Arts & Media | 37 (35.9%) | 66 (64.1%) |
| Legal Services & Support | 28 (45.9%) | 33 (54.1%) |
| Education Instruction & Library | 80 (18.1%) | 361 (81.9%) |
| Arts, Media & Entertainment | 14 (82.4%) | 3 (17.6%) |
| Health Diagnosing & Treating | 93 (23.4%) | 304 (76.6%) |
| Health Technologists | 31 (17.7%) | 144 (82.3%) |
| Total (Category) | 1,042 (45.5%) | 1,247 (54.5%) |
| Total (Overall) | 4,443 (54.4%) | 3,722 (45.6%) |
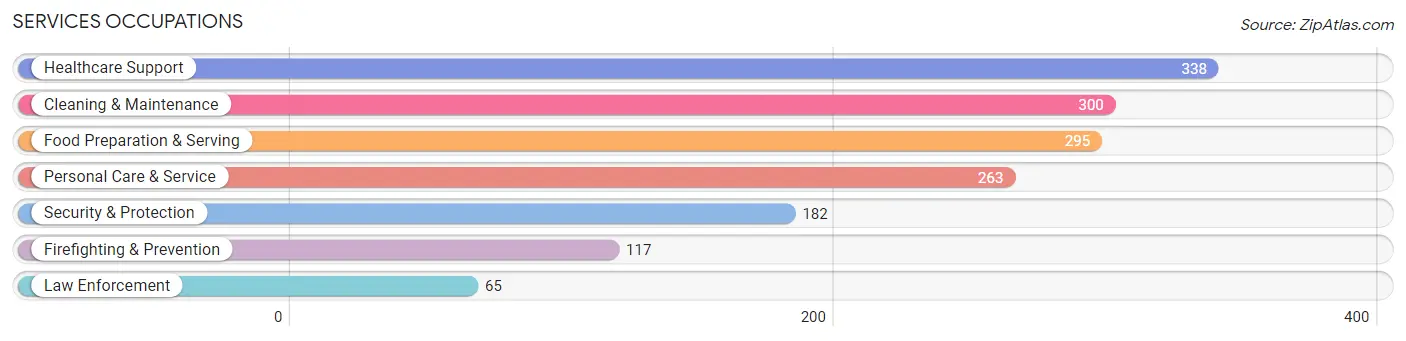
Services Occupations
The most common Services occupations in Tama County are Healthcare Support (338 | 4.1%), Cleaning & Maintenance (300 | 3.7%), Food Preparation & Serving (295 | 3.6%), Personal Care & Service (263 | 3.2%), and Security & Protection (182 | 2.2%).
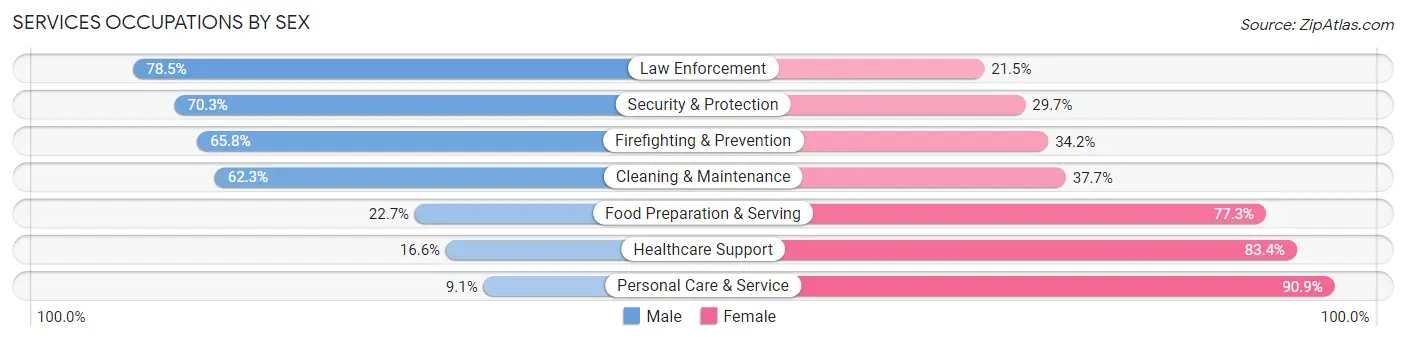
Services Occupations by Sex
Within the Services occupations in Tama County, the most male-oriented occupations are Law Enforcement (78.5%), Security & Protection (70.3%), and Firefighting & Prevention (65.8%), while the most female-oriented occupations are Personal Care & Service (90.9%), Healthcare Support (83.4%), and Food Preparation & Serving (77.3%).
| Occupation | Male | Female |
| Healthcare Support | 56 (16.6%) | 282 (83.4%) |
| Security & Protection | 128 (70.3%) | 54 (29.7%) |
| Firefighting & Prevention | 77 (65.8%) | 40 (34.2%) |
| Law Enforcement | 51 (78.5%) | 14 (21.5%) |
| Food Preparation & Serving | 67 (22.7%) | 228 (77.3%) |
| Cleaning & Maintenance | 187 (62.3%) | 113 (37.7%) |
| Personal Care & Service | 24 (9.1%) | 239 (90.9%) |
| Total (Category) | 462 (33.5%) | 916 (66.5%) |
| Total (Overall) | 4,443 (54.4%) | 3,722 (45.6%) |
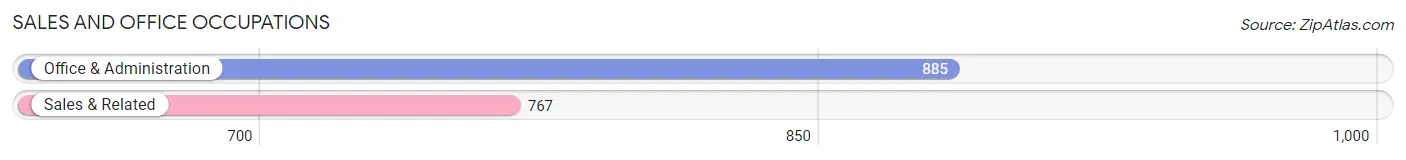
Sales and Office Occupations
The most common Sales and Office occupations in Tama County are Office & Administration (885 | 10.8%), and Sales & Related (767 | 9.4%).
Sales and Office Occupations by Sex
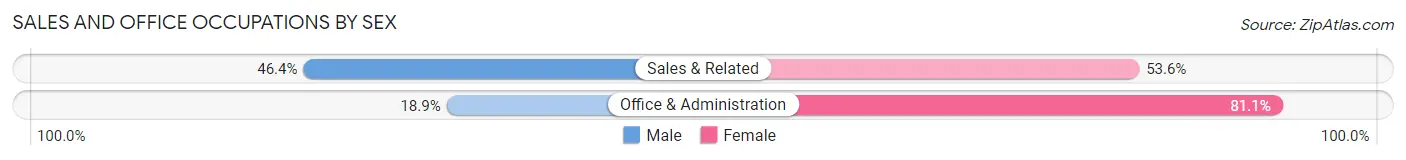
| Occupation | Male | Female |
| Sales & Related | 356 (46.4%) | 411 (53.6%) |
| Office & Administration | 167 (18.9%) | 718 (81.1%) |
| Total (Category) | 523 (31.7%) | 1,129 (68.3%) |
| Total (Overall) | 4,443 (54.4%) | 3,722 (45.6%) |
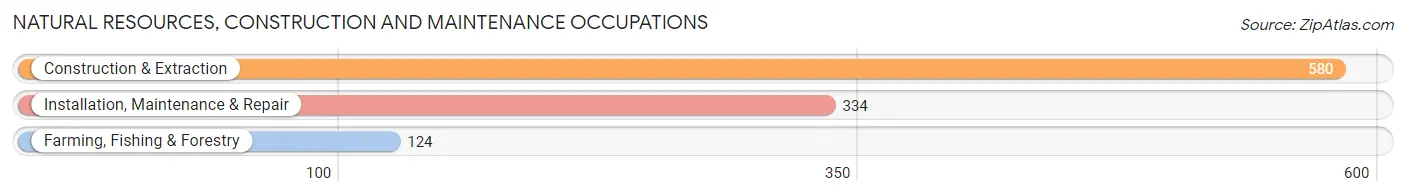
Natural Resources, Construction and Maintenance Occupations
The most common Natural Resources, Construction and Maintenance occupations in Tama County are Construction & Extraction (580 | 7.1%), Installation, Maintenance & Repair (334 | 4.1%), and Farming, Fishing & Forestry (124 | 1.5%).
Natural Resources, Construction and Maintenance Occupations by Sex
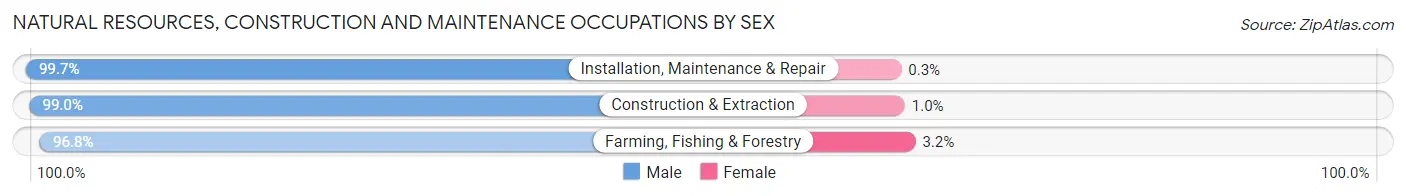
| Occupation | Male | Female |
| Farming, Fishing & Forestry | 120 (96.8%) | 4 (3.2%) |
| Construction & Extraction | 574 (99.0%) | 6 (1.0%) |
| Installation, Maintenance & Repair | 333 (99.7%) | 1 (0.3%) |
| Total (Category) | 1,027 (98.9%) | 11 (1.1%) |
| Total (Overall) | 4,443 (54.4%) | 3,722 (45.6%) |
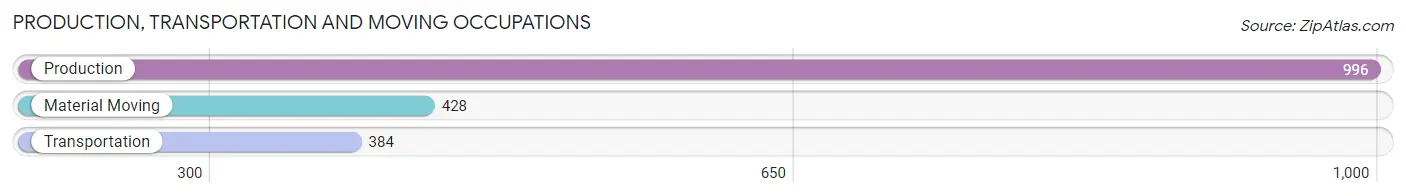
Production, Transportation and Moving Occupations
The most common Production, Transportation and Moving occupations in Tama County are Production (996 | 12.2%), Material Moving (428 | 5.2%), and Transportation (384 | 4.7%).
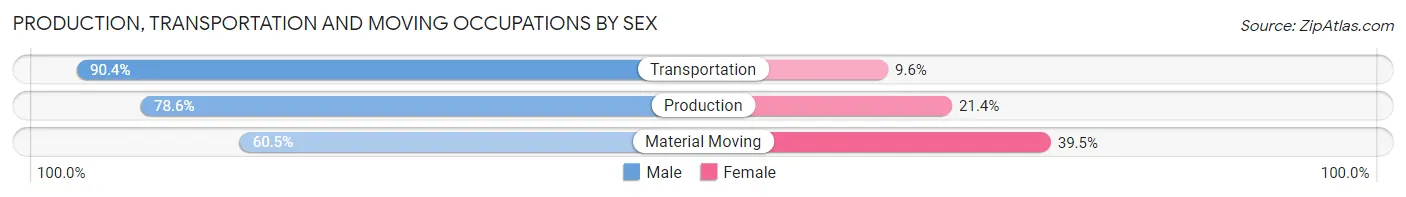
Production, Transportation and Moving Occupations by Sex
| Occupation | Male | Female |
| Production | 783 (78.6%) | 213 (21.4%) |
| Transportation | 347 (90.4%) | 37 (9.6%) |
| Material Moving | 259 (60.5%) | 169 (39.5%) |
| Total (Category) | 1,389 (76.8%) | 419 (23.2%) |
| Total (Overall) | 4,443 (54.4%) | 3,722 (45.6%) |
Employment Industries by Sex in Tama County
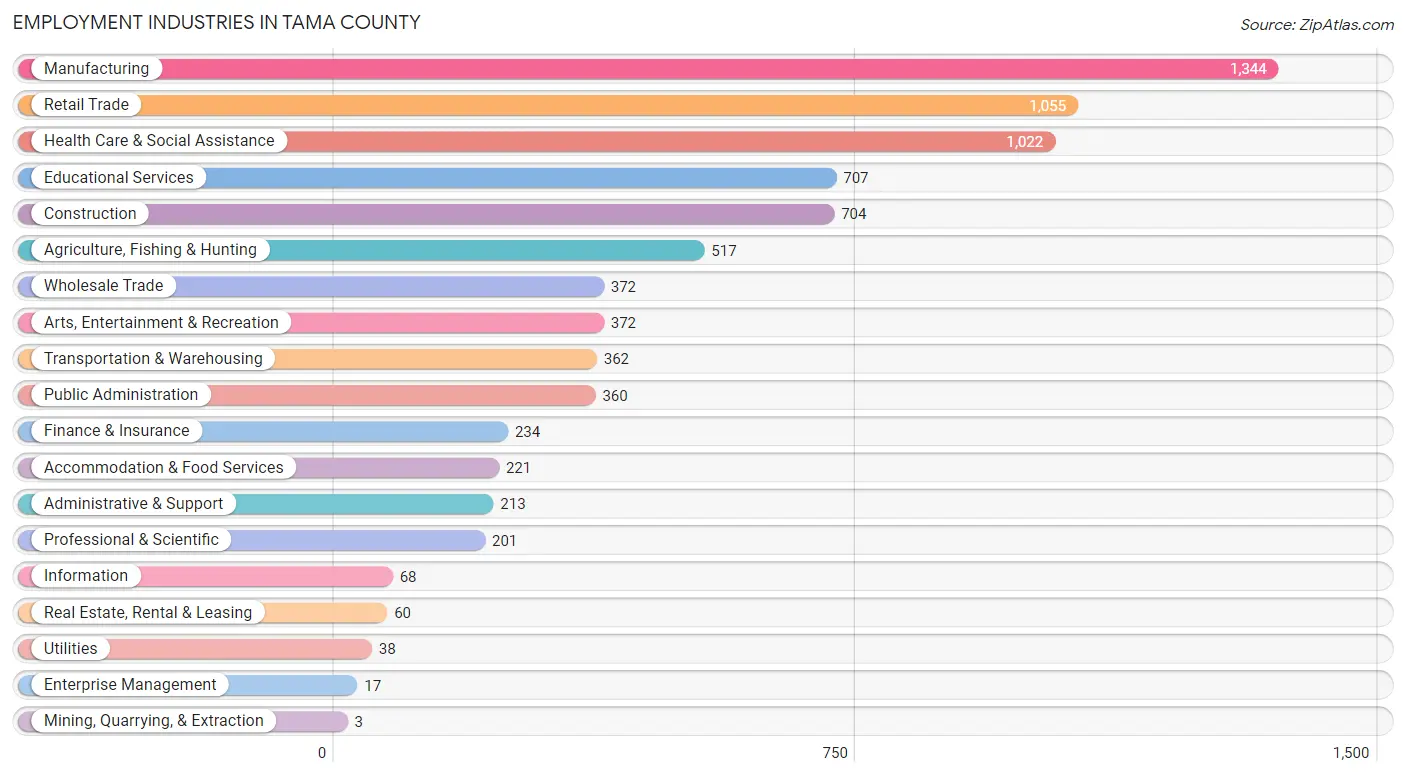
Employment Industries in Tama County
The major employment industries in Tama County include Manufacturing (1,344 | 16.5%), Retail Trade (1,055 | 12.9%), Health Care & Social Assistance (1,022 | 12.5%), Educational Services (707 | 8.7%), and Construction (704 | 8.6%).
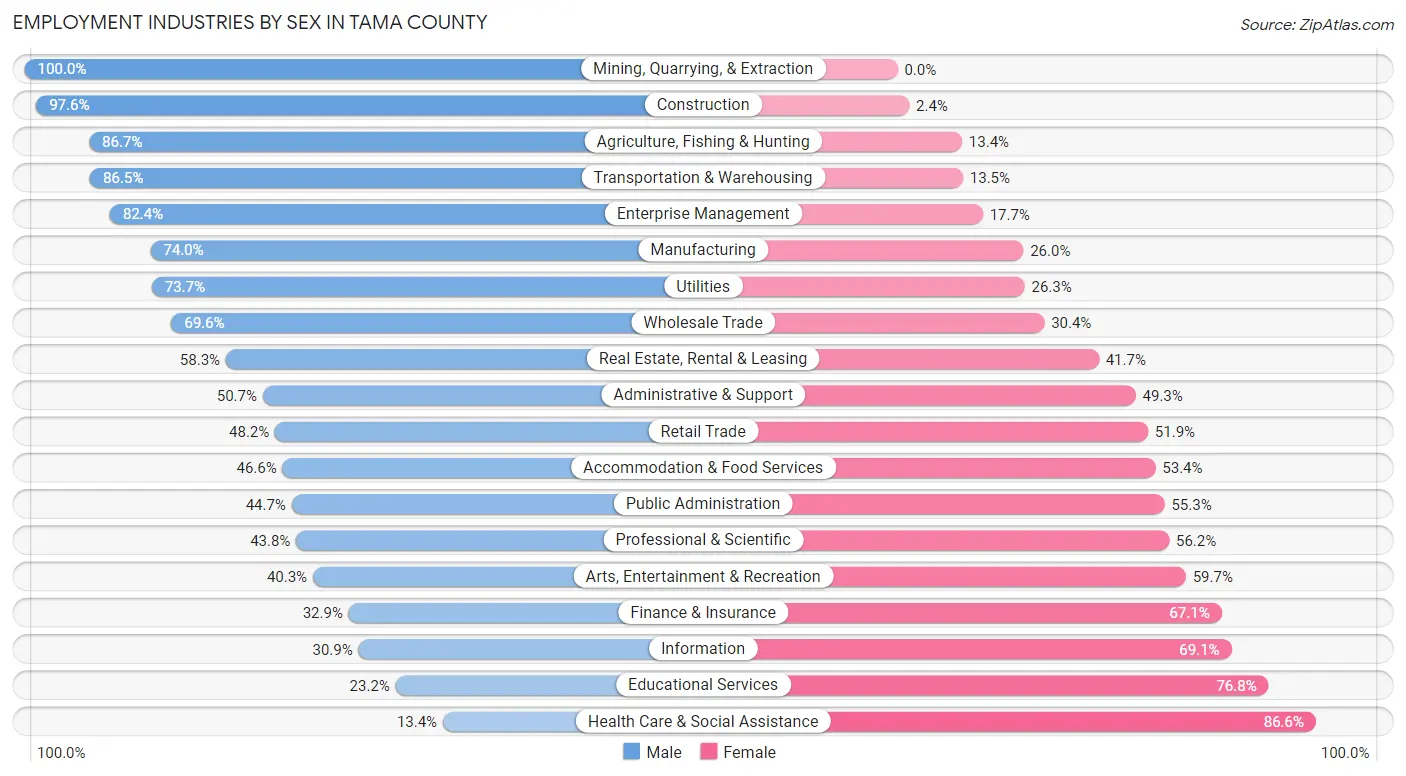
Employment Industries by Sex in Tama County
The Tama County industries that see more men than women are Mining, Quarrying, & Extraction (100.0%), Construction (97.6%), and Agriculture, Fishing & Hunting (86.7%), whereas the industries that tend to have a higher number of women are Health Care & Social Assistance (86.6%), Educational Services (76.8%), and Information (69.1%).
| Industry | Male | Female |
| Agriculture, Fishing & Hunting | 448 (86.7%) | 69 (13.4%) |
| Mining, Quarrying, & Extraction | 3 (100.0%) | 0 (0.0%) |
| Construction | 687 (97.6%) | 17 (2.4%) |
| Manufacturing | 994 (74.0%) | 350 (26.0%) |
| Wholesale Trade | 259 (69.6%) | 113 (30.4%) |
| Retail Trade | 508 (48.1%) | 547 (51.8%) |
| Transportation & Warehousing | 313 (86.5%) | 49 (13.5%) |
| Utilities | 28 (73.7%) | 10 (26.3%) |
| Information | 21 (30.9%) | 47 (69.1%) |
| Finance & Insurance | 77 (32.9%) | 157 (67.1%) |
| Real Estate, Rental & Leasing | 35 (58.3%) | 25 (41.7%) |
| Professional & Scientific | 88 (43.8%) | 113 (56.2%) |
| Enterprise Management | 14 (82.4%) | 3 (17.6%) |
| Administrative & Support | 108 (50.7%) | 105 (49.3%) |
| Educational Services | 164 (23.2%) | 543 (76.8%) |
| Health Care & Social Assistance | 137 (13.4%) | 885 (86.6%) |
| Arts, Entertainment & Recreation | 150 (40.3%) | 222 (59.7%) |
| Accommodation & Food Services | 103 (46.6%) | 118 (53.4%) |
| Public Administration | 161 (44.7%) | 199 (55.3%) |
| Total | 4,443 (54.4%) | 3,722 (45.6%) |
Education in Tama County
School Enrollment in Tama County
The most common levels of schooling among the 3,865 students in Tama County are middle school (1,028 | 26.6%), high school (945 | 24.4%), and elementary school (827 | 21.4%).
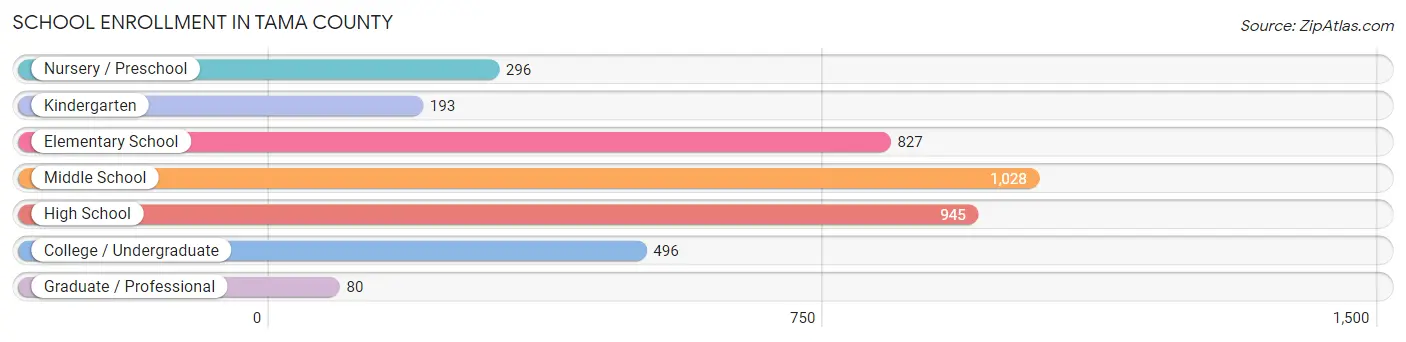
| School Level | # Students | % Students |
| Nursery / Preschool | 296 | 7.7% |
| Kindergarten | 193 | 5.0% |
| Elementary School | 827 | 21.4% |
| Middle School | 1,028 | 26.6% |
| High School | 945 | 24.4% |
| College / Undergraduate | 496 | 12.8% |
| Graduate / Professional | 80 | 2.1% |
| Total | 3,865 | 100.0% |
School Enrollment by Age by Funding Source in Tama County
Out of a total of 3,865 students who are enrolled in schools in Tama County, 394 (10.2%) attend a private institution, while the remaining 3,471 (89.8%) are enrolled in public schools. The age group of 25 to 34 year olds has the highest likelihood of being enrolled in private schools, with 37 (27.2% in the age bracket) enrolled. Conversely, the age group of 18 to 19 year olds has the lowest likelihood of being enrolled in a private school, with 209 (98.1% in the age bracket) attending a public institution.
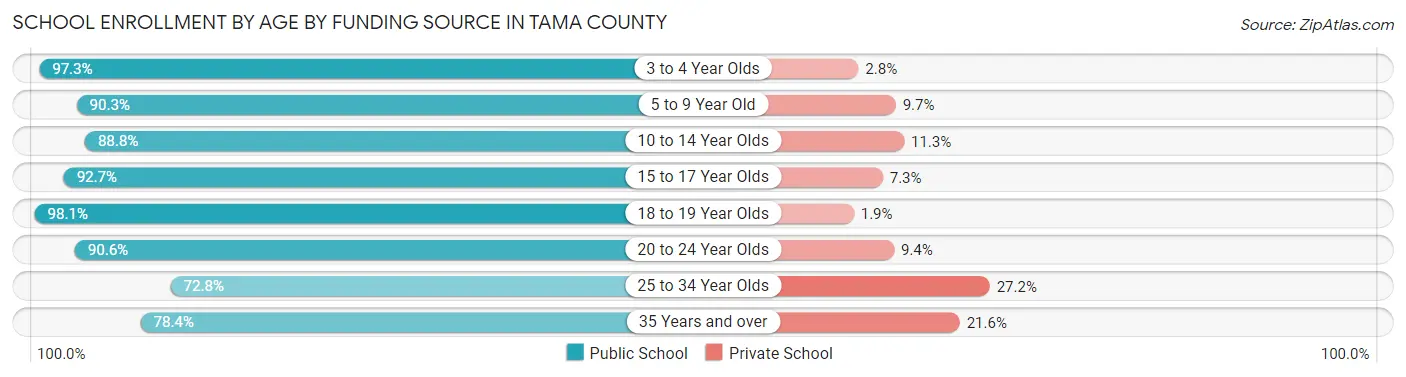
| Age Bracket | Public School | Private School |
| 3 to 4 Year Olds | 177 (97.3%) | 5 (2.8%) |
| 5 to 9 Year Old | 922 (90.3%) | 99 (9.7%) |
| 10 to 14 Year Olds | 1,097 (88.7%) | 139 (11.3%) |
| 15 to 17 Year Olds | 649 (92.7%) | 51 (7.3%) |
| 18 to 19 Year Olds | 209 (98.1%) | 4 (1.9%) |
| 20 to 24 Year Olds | 174 (90.6%) | 18 (9.4%) |
| 25 to 34 Year Olds | 99 (72.8%) | 37 (27.2%) |
| 35 Years and over | 145 (78.4%) | 40 (21.6%) |
| Total | 3,471 (89.8%) | 394 (10.2%) |
Educational Attainment by Field of Study in Tama County
Education (669 | 29.4%), business (382 | 16.8%), bio, nature & agricultural (272 | 12.0%), science & technology (256 | 11.3%), and arts & humanities (177 | 7.8%) are the most common fields of study among 2,272 individuals in Tama County who have obtained a bachelor's degree or higher.
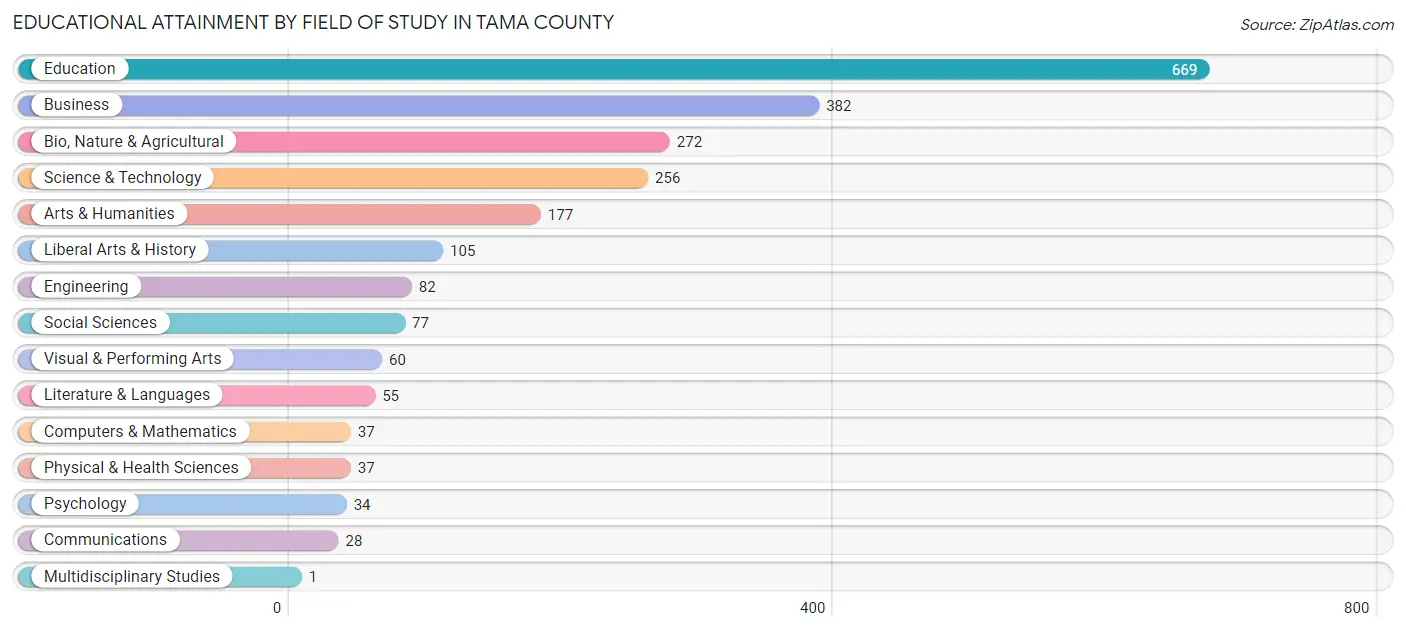
| Field of Study | # Graduates | % Graduates |
| Computers & Mathematics | 37 | 1.6% |
| Bio, Nature & Agricultural | 272 | 12.0% |
| Physical & Health Sciences | 37 | 1.6% |
| Psychology | 34 | 1.5% |
| Social Sciences | 77 | 3.4% |
| Engineering | 82 | 3.6% |
| Multidisciplinary Studies | 1 | 0.0% |
| Science & Technology | 256 | 11.3% |
| Business | 382 | 16.8% |
| Education | 669 | 29.4% |
| Literature & Languages | 55 | 2.4% |
| Liberal Arts & History | 105 | 4.6% |
| Visual & Performing Arts | 60 | 2.6% |
| Communications | 28 | 1.2% |
| Arts & Humanities | 177 | 7.8% |
| Total | 2,272 | 100.0% |
Transportation & Commute in Tama County
Vehicle Availability by Sex in Tama County
The most prevalent vehicle ownership categories in Tama County are males with 2 vehicles (1,701, accounting for 38.4%) and females with 2 vehicles (1,320, making up 46.5%).
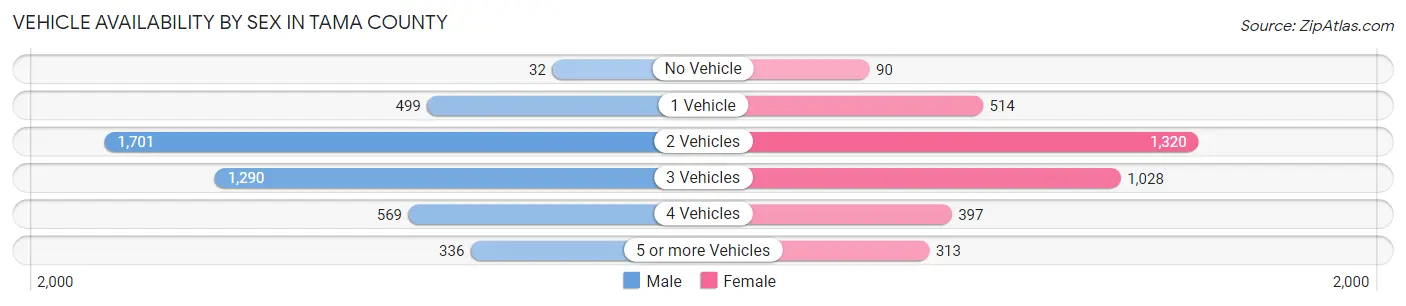
| Vehicles Available | Male | Female |
| No Vehicle | 32 (0.7%) | 90 (2.5%) |
| 1 Vehicle | 499 (11.3%) | 514 (14.0%) |
| 2 Vehicles | 1,701 (38.4%) | 1,320 (36.0%) |
| 3 Vehicles | 1,290 (29.1%) | 1,028 (28.1%) |
| 4 Vehicles | 569 (12.9%) | 397 (10.8%) |
| 5 or more Vehicles | 336 (7.6%) | 313 (8.6%) |
| Total | 4,427 (100.0%) | 3,662 (100.0%) |
Commute Time in Tama County
The most frequently occuring commute durations in Tama County are 5 to 9 minutes (1,204 commuters, 16.1%), 10 to 14 minutes (958 commuters, 12.8%), and 30 to 34 minutes (868 commuters, 11.6%).
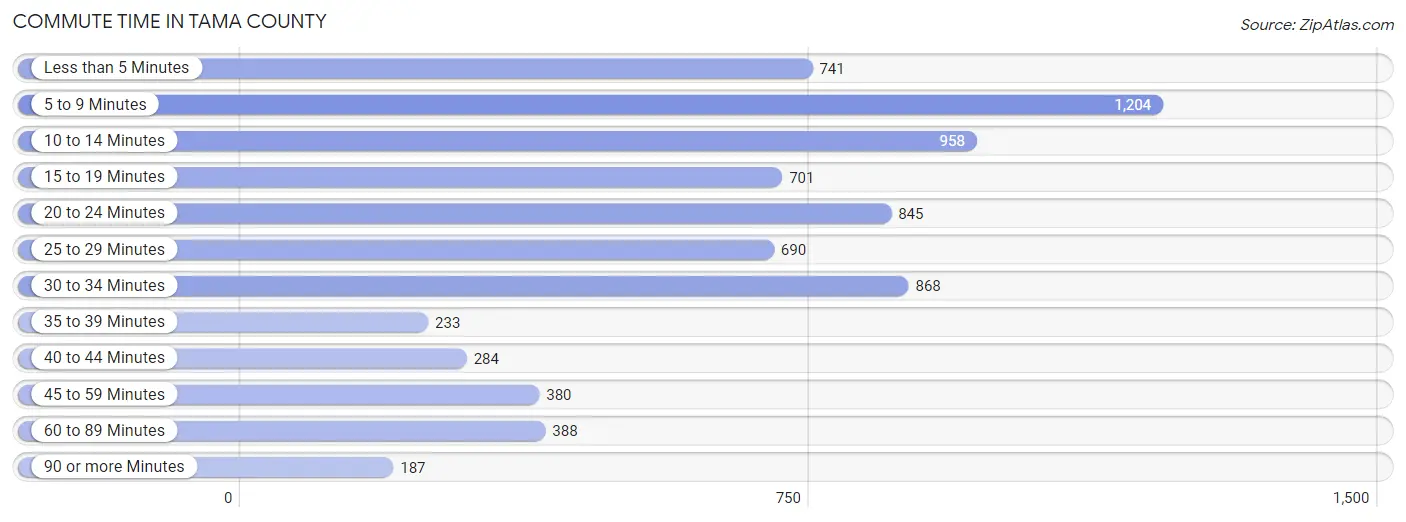
| Commute Time | # Commuters | % Commuters |
| Less than 5 Minutes | 741 | 9.9% |
| 5 to 9 Minutes | 1,204 | 16.1% |
| 10 to 14 Minutes | 958 | 12.8% |
| 15 to 19 Minutes | 701 | 9.4% |
| 20 to 24 Minutes | 845 | 11.3% |
| 25 to 29 Minutes | 690 | 9.2% |
| 30 to 34 Minutes | 868 | 11.6% |
| 35 to 39 Minutes | 233 | 3.1% |
| 40 to 44 Minutes | 284 | 3.8% |
| 45 to 59 Minutes | 380 | 5.1% |
| 60 to 89 Minutes | 388 | 5.2% |
| 90 or more Minutes | 187 | 2.5% |
Commute Time by Sex in Tama County
The most common commute times in Tama County are 5 to 9 minutes (642 commuters, 15.5%) for males and 5 to 9 minutes (562 commuters, 16.9%) for females.
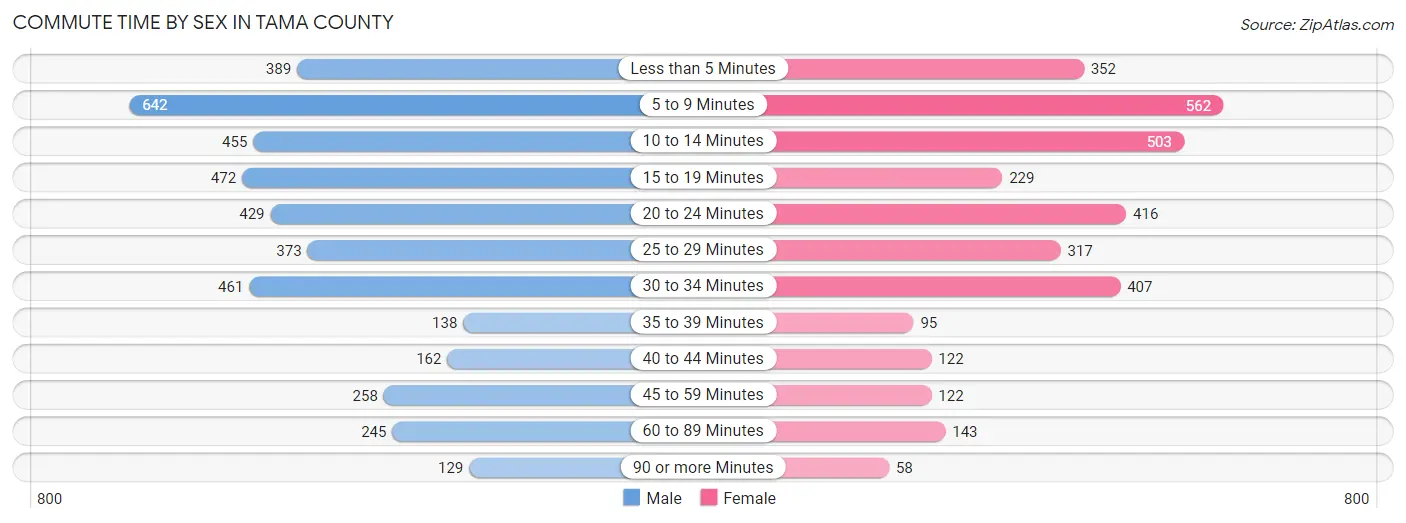
| Commute Time | Male | Female |
| Less than 5 Minutes | 389 (9.4%) | 352 (10.6%) |
| 5 to 9 Minutes | 642 (15.5%) | 562 (16.9%) |
| 10 to 14 Minutes | 455 (11.0%) | 503 (15.1%) |
| 15 to 19 Minutes | 472 (11.4%) | 229 (6.9%) |
| 20 to 24 Minutes | 429 (10.3%) | 416 (12.5%) |
| 25 to 29 Minutes | 373 (9.0%) | 317 (9.5%) |
| 30 to 34 Minutes | 461 (11.1%) | 407 (12.2%) |
| 35 to 39 Minutes | 138 (3.3%) | 95 (2.9%) |
| 40 to 44 Minutes | 162 (3.9%) | 122 (3.7%) |
| 45 to 59 Minutes | 258 (6.2%) | 122 (3.7%) |
| 60 to 89 Minutes | 245 (5.9%) | 143 (4.3%) |
| 90 or more Minutes | 129 (3.1%) | 58 (1.7%) |
Time of Departure to Work by Sex in Tama County
The most frequent times of departure to work in Tama County are 7:00 AM to 7:29 AM (764, 18.4%) for males and 7:30 AM to 7:59 AM (791, 23.8%) for females.
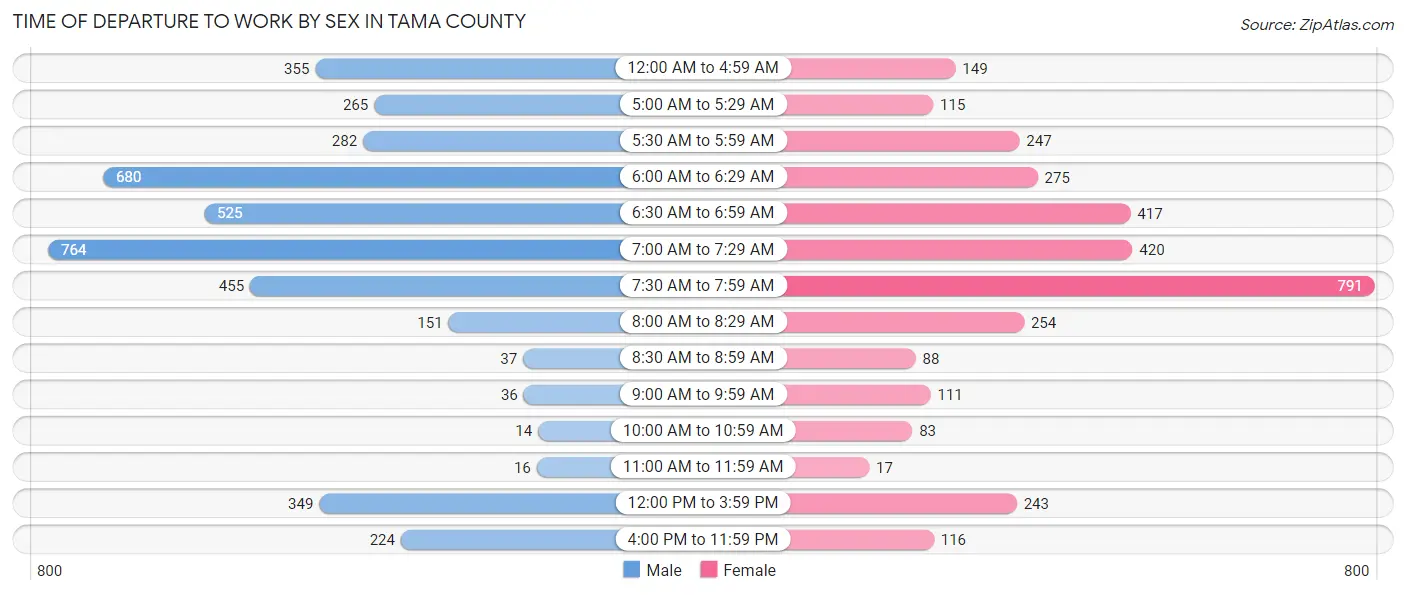
| Time of Departure | Male | Female |
| 12:00 AM to 4:59 AM | 355 (8.6%) | 149 (4.5%) |
| 5:00 AM to 5:29 AM | 265 (6.4%) | 115 (3.5%) |
| 5:30 AM to 5:59 AM | 282 (6.8%) | 247 (7.4%) |
| 6:00 AM to 6:29 AM | 680 (16.4%) | 275 (8.3%) |
| 6:30 AM to 6:59 AM | 525 (12.6%) | 417 (12.5%) |
| 7:00 AM to 7:29 AM | 764 (18.4%) | 420 (12.6%) |
| 7:30 AM to 7:59 AM | 455 (11.0%) | 791 (23.8%) |
| 8:00 AM to 8:29 AM | 151 (3.6%) | 254 (7.6%) |
| 8:30 AM to 8:59 AM | 37 (0.9%) | 88 (2.6%) |
| 9:00 AM to 9:59 AM | 36 (0.9%) | 111 (3.3%) |
| 10:00 AM to 10:59 AM | 14 (0.3%) | 83 (2.5%) |
| 11:00 AM to 11:59 AM | 16 (0.4%) | 17 (0.5%) |
| 12:00 PM to 3:59 PM | 349 (8.4%) | 243 (7.3%) |
| 4:00 PM to 11:59 PM | 224 (5.4%) | 116 (3.5%) |
| Total | 4,153 (100.0%) | 3,326 (100.0%) |
Housing Occupancy in Tama County
Occupancy by Ownership in Tama County
Of the total 6,703 dwellings in Tama County, owner-occupied units account for 5,064 (75.5%), while renter-occupied units make up 1,639 (24.4%).
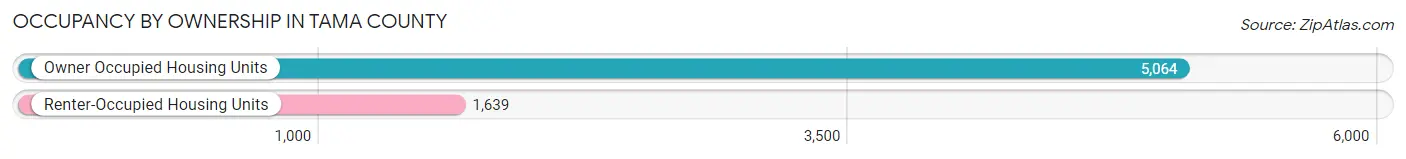
| Occupancy | # Housing Units | % Housing Units |
| Owner Occupied Housing Units | 5,064 | 75.5% |
| Renter-Occupied Housing Units | 1,639 | 24.4% |
| Total Occupied Housing Units | 6,703 | 100.0% |
Occupancy by Household Size in Tama County
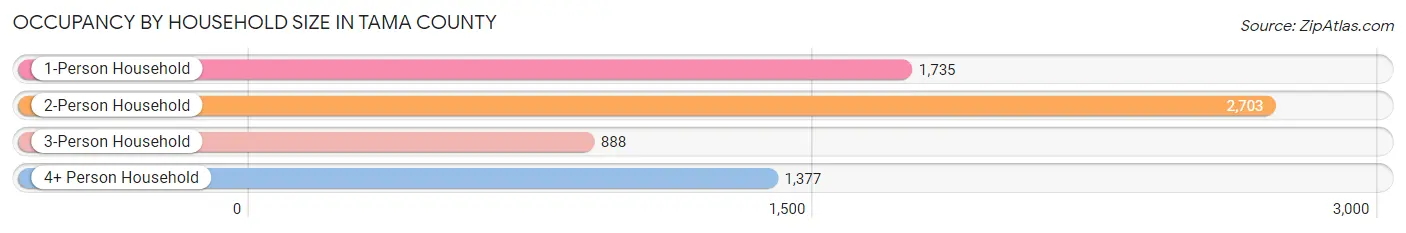
| Household Size | # Housing Units | % Housing Units |
| 1-Person Household | 1,735 | 25.9% |
| 2-Person Household | 2,703 | 40.3% |
| 3-Person Household | 888 | 13.3% |
| 4+ Person Household | 1,377 | 20.5% |
| Total Housing Units | 6,703 | 100.0% |
Occupancy by Ownership by Household Size in Tama County
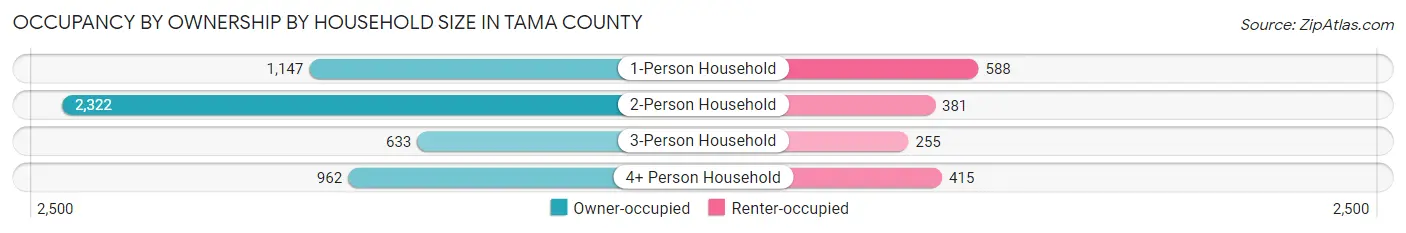
| Household Size | Owner-occupied | Renter-occupied |
| 1-Person Household | 1,147 (66.1%) | 588 (33.9%) |
| 2-Person Household | 2,322 (85.9%) | 381 (14.1%) |
| 3-Person Household | 633 (71.3%) | 255 (28.7%) |
| 4+ Person Household | 962 (69.9%) | 415 (30.1%) |
| Total Housing Units | 5,064 (75.5%) | 1,639 (24.4%) |
Occupancy by Educational Attainment in Tama County
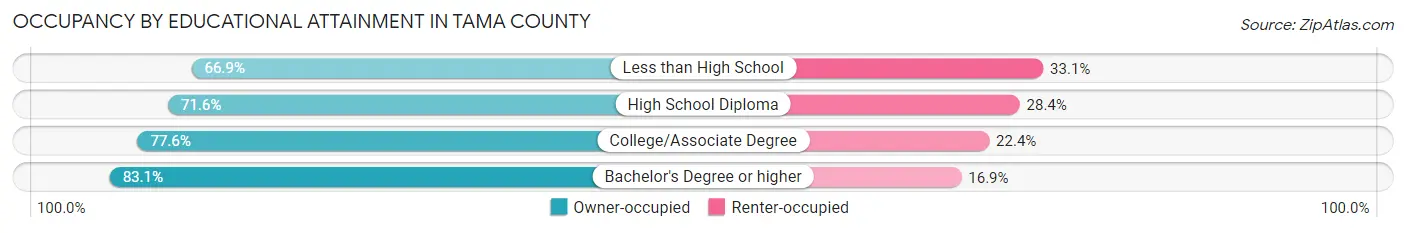
| Household Size | Owner-occupied | Renter-occupied |
| Less than High School | 295 (66.9%) | 146 (33.1%) |
| High School Diploma | 1,917 (71.6%) | 762 (28.4%) |
| College/Associate Degree | 1,774 (77.6%) | 512 (22.4%) |
| Bachelor's Degree or higher | 1,078 (83.1%) | 219 (16.9%) |
Occupancy by Age of Householder in Tama County
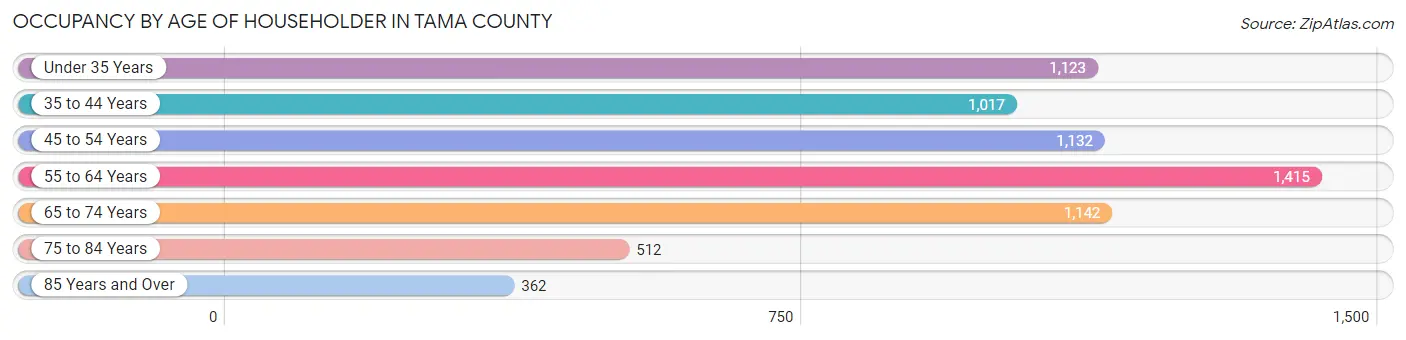
| Age Bracket | # Households | % Households |
| Under 35 Years | 1,123 | 16.8% |
| 35 to 44 Years | 1,017 | 15.2% |
| 45 to 54 Years | 1,132 | 16.9% |
| 55 to 64 Years | 1,415 | 21.1% |
| 65 to 74 Years | 1,142 | 17.0% |
| 75 to 84 Years | 512 | 7.6% |
| 85 Years and Over | 362 | 5.4% |
| Total | 6,703 | 100.0% |
Housing Finances in Tama County
Median Income by Occupancy in Tama County
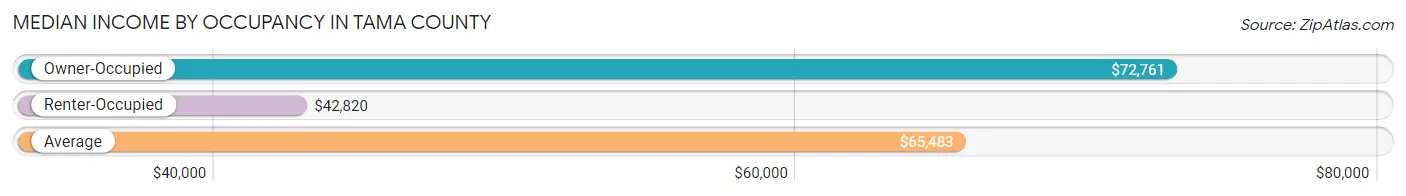
| Occupancy Type | # Households | Median Income |
| Owner-Occupied | 5,064 (75.5%) | $72,761 |
| Renter-Occupied | 1,639 (24.4%) | $42,820 |
| Average | 6,703 (100.0%) | $65,483 |
Occupancy by Householder Income Bracket in Tama County
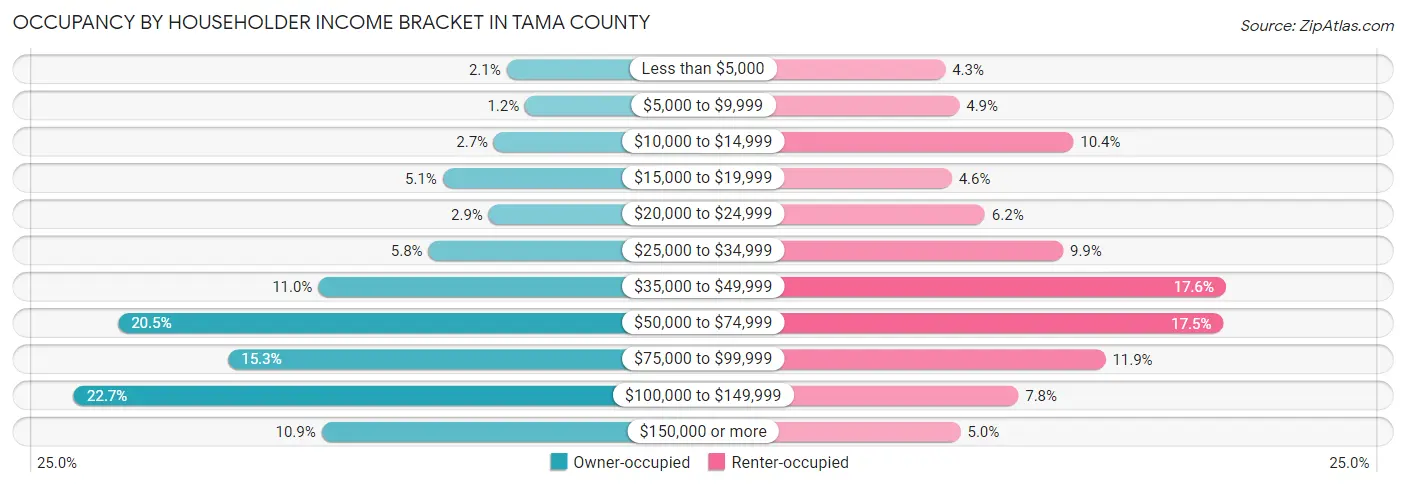
| Income Bracket | Owner-occupied | Renter-occupied |
| Less than $5,000 | 104 (2.1%) | 70 (4.3%) |
| $5,000 to $9,999 | 59 (1.2%) | 81 (4.9%) |
| $10,000 to $14,999 | 134 (2.6%) | 170 (10.4%) |
| $15,000 to $19,999 | 258 (5.1%) | 75 (4.6%) |
| $20,000 to $24,999 | 147 (2.9%) | 101 (6.2%) |
| $25,000 to $34,999 | 292 (5.8%) | 162 (9.9%) |
| $35,000 to $49,999 | 558 (11.0%) | 289 (17.6%) |
| $50,000 to $74,999 | 1,040 (20.5%) | 287 (17.5%) |
| $75,000 to $99,999 | 775 (15.3%) | 195 (11.9%) |
| $100,000 to $149,999 | 1,147 (22.7%) | 127 (7.7%) |
| $150,000 or more | 550 (10.9%) | 82 (5.0%) |
| Total | 5,064 (100.0%) | 1,639 (100.0%) |
Monthly Housing Cost Tiers in Tama County
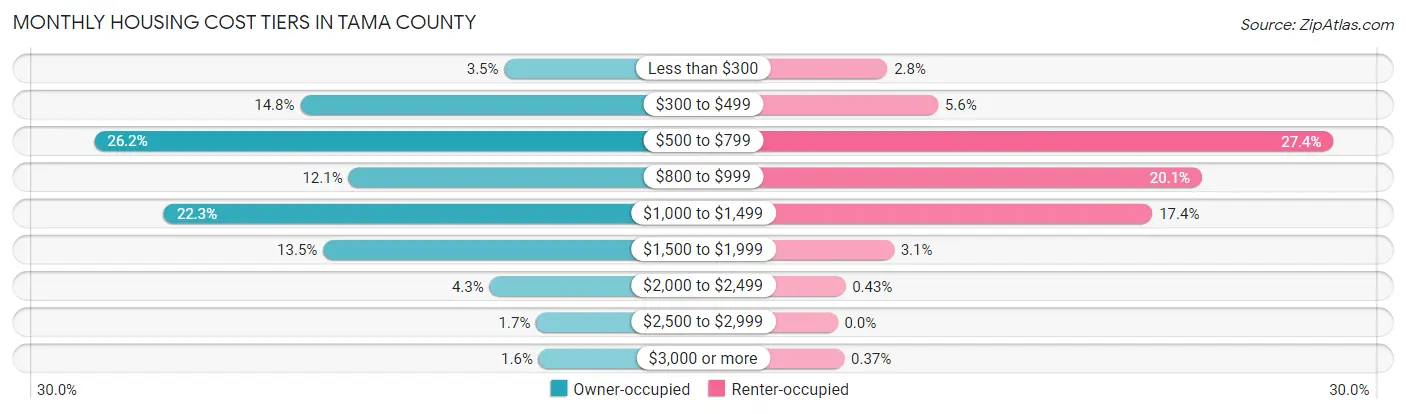
| Monthly Cost | Owner-occupied | Renter-occupied |
| Less than $300 | 177 (3.5%) | 45 (2.8%) |
| $300 to $499 | 748 (14.8%) | 91 (5.6%) |
| $500 to $799 | 1,324 (26.2%) | 449 (27.4%) |
| $800 to $999 | 613 (12.1%) | 330 (20.1%) |
| $1,000 to $1,499 | 1,130 (22.3%) | 285 (17.4%) |
| $1,500 to $1,999 | 684 (13.5%) | 51 (3.1%) |
| $2,000 to $2,499 | 219 (4.3%) | 7 (0.4%) |
| $2,500 to $2,999 | 88 (1.7%) | 0 (0.0%) |
| $3,000 or more | 81 (1.6%) | 6 (0.4%) |
| Total | 5,064 (100.0%) | 1,639 (100.0%) |
Physical Housing Characteristics in Tama County
Housing Structures in Tama County
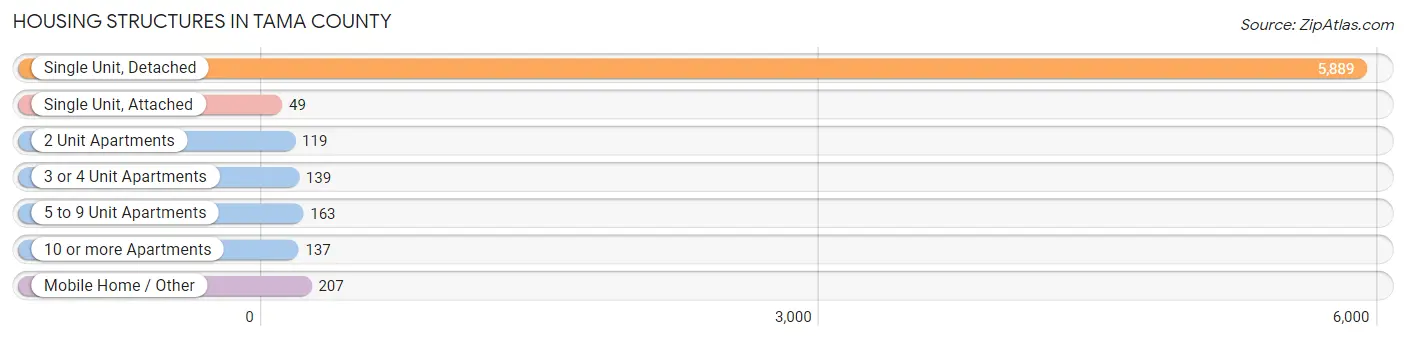
| Structure Type | # Housing Units | % Housing Units |
| Single Unit, Detached | 5,889 | 87.9% |
| Single Unit, Attached | 49 | 0.7% |
| 2 Unit Apartments | 119 | 1.8% |
| 3 or 4 Unit Apartments | 139 | 2.1% |
| 5 to 9 Unit Apartments | 163 | 2.4% |
| 10 or more Apartments | 137 | 2.0% |
| Mobile Home / Other | 207 | 3.1% |
| Total | 6,703 | 100.0% |
Housing Structures by Occupancy in Tama County
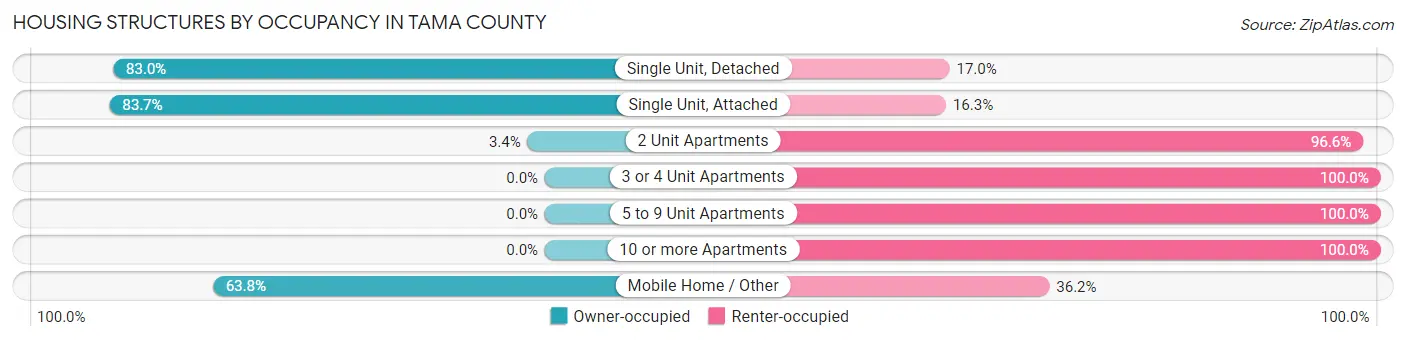
| Structure Type | Owner-occupied | Renter-occupied |
| Single Unit, Detached | 4,887 (83.0%) | 1,002 (17.0%) |
| Single Unit, Attached | 41 (83.7%) | 8 (16.3%) |
| 2 Unit Apartments | 4 (3.4%) | 115 (96.6%) |
| 3 or 4 Unit Apartments | 0 (0.0%) | 139 (100.0%) |
| 5 to 9 Unit Apartments | 0 (0.0%) | 163 (100.0%) |
| 10 or more Apartments | 0 (0.0%) | 137 (100.0%) |
| Mobile Home / Other | 132 (63.8%) | 75 (36.2%) |
| Total | 5,064 (75.5%) | 1,639 (24.4%) |
Housing Structures by Number of Rooms in Tama County
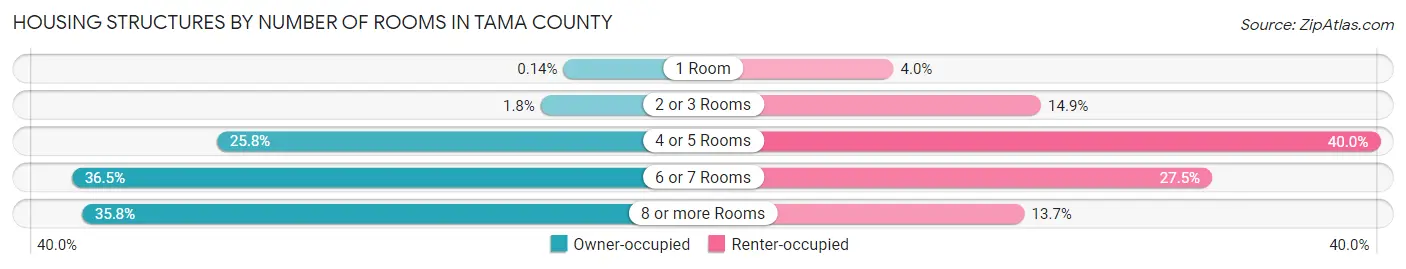
| Number of Rooms | Owner-occupied | Renter-occupied |
| 1 Room | 7 (0.1%) | 65 (4.0%) |
| 2 or 3 Rooms | 92 (1.8%) | 244 (14.9%) |
| 4 or 5 Rooms | 1,305 (25.8%) | 655 (40.0%) |
| 6 or 7 Rooms | 1,849 (36.5%) | 451 (27.5%) |
| 8 or more Rooms | 1,811 (35.8%) | 224 (13.7%) |
| Total | 5,064 (100.0%) | 1,639 (100.0%) |
Housing Structure by Heating Type in Tama County
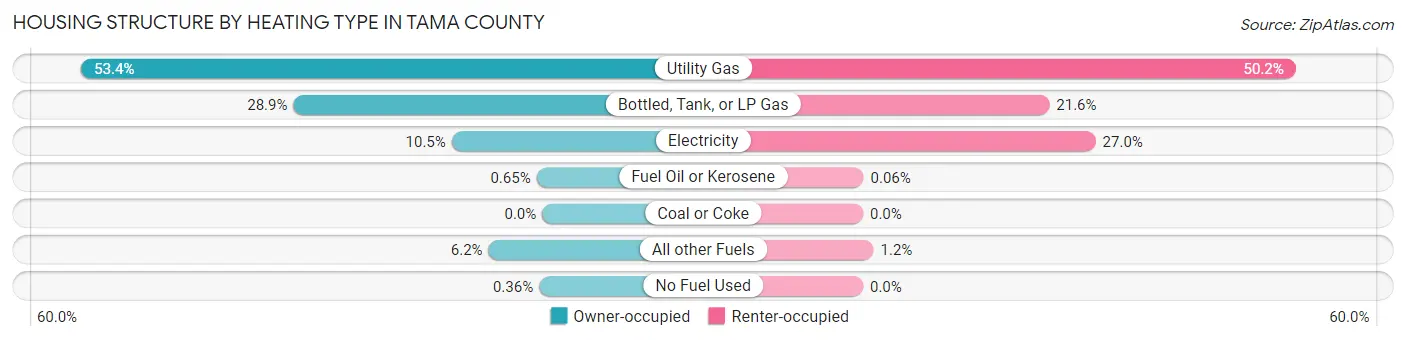
| Heating Type | Owner-occupied | Renter-occupied |
| Utility Gas | 2,706 (53.4%) | 822 (50.1%) |
| Bottled, Tank, or LP Gas | 1,461 (28.8%) | 354 (21.6%) |
| Electricity | 531 (10.5%) | 442 (27.0%) |
| Fuel Oil or Kerosene | 33 (0.6%) | 1 (0.1%) |
| Coal or Coke | 0 (0.0%) | 0 (0.0%) |
| All other Fuels | 315 (6.2%) | 20 (1.2%) |
| No Fuel Used | 18 (0.4%) | 0 (0.0%) |
| Total | 5,064 (100.0%) | 1,639 (100.0%) |
Household Vehicle Usage in Tama County
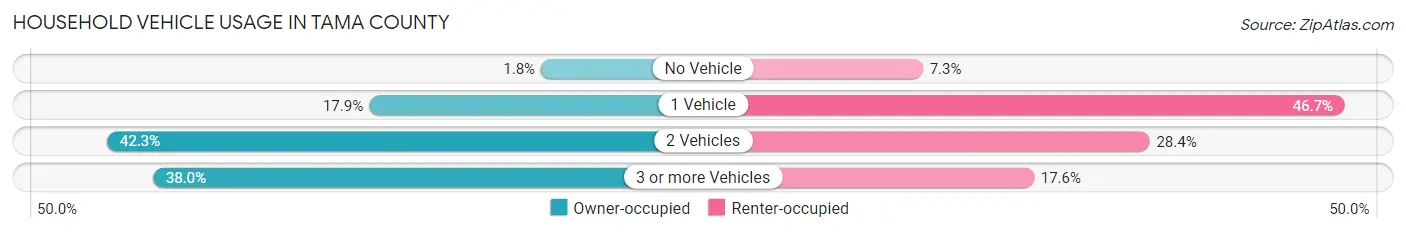
| Vehicles per Household | Owner-occupied | Renter-occupied |
| No Vehicle | 91 (1.8%) | 119 (7.3%) |
| 1 Vehicle | 904 (17.8%) | 765 (46.7%) |
| 2 Vehicles | 2,143 (42.3%) | 466 (28.4%) |
| 3 or more Vehicles | 1,926 (38.0%) | 289 (17.6%) |
| Total | 5,064 (100.0%) | 1,639 (100.0%) |
Real Estate & Mortgages in Tama County
Real Estate and Mortgage Overview in Tama County
| Characteristic | Without Mortgage | With Mortgage |
| Housing Units | 2,276 | 2,788 |
| Median Property Value | $114,700 | $140,700 |
| Median Household Income | $57,969 | $367 |
| Monthly Housing Costs | $552 | $81 |
| Real Estate Taxes | $1,869 | $86 |
Property Value by Mortgage Status in Tama County
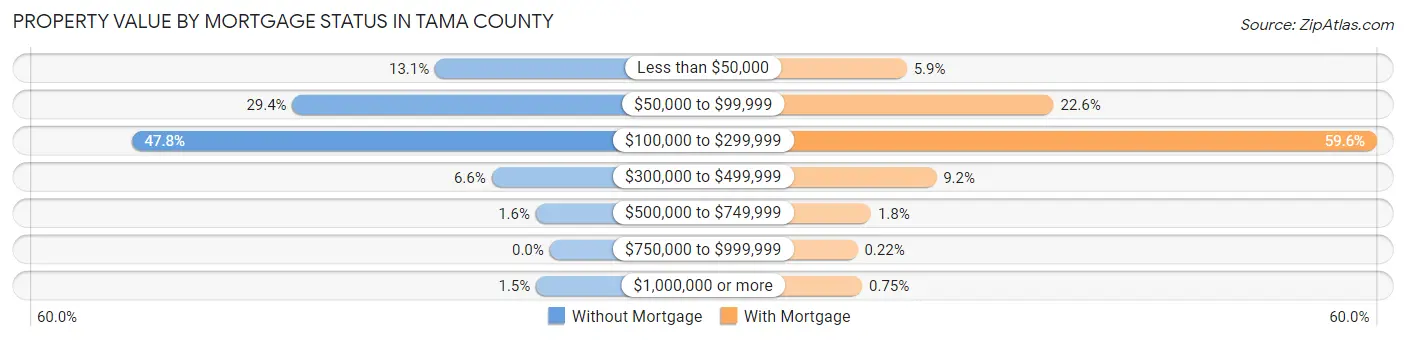
| Property Value | Without Mortgage | With Mortgage |
| Less than $50,000 | 298 (13.1%) | 163 (5.9%) |
| $50,000 to $99,999 | 669 (29.4%) | 631 (22.6%) |
| $100,000 to $299,999 | 1,087 (47.8%) | 1,661 (59.6%) |
| $300,000 to $499,999 | 151 (6.6%) | 257 (9.2%) |
| $500,000 to $749,999 | 36 (1.6%) | 49 (1.8%) |
| $750,000 to $999,999 | 0 (0.0%) | 6 (0.2%) |
| $1,000,000 or more | 35 (1.5%) | 21 (0.7%) |
| Total | 2,276 (100.0%) | 2,788 (100.0%) |
Household Income by Mortgage Status in Tama County
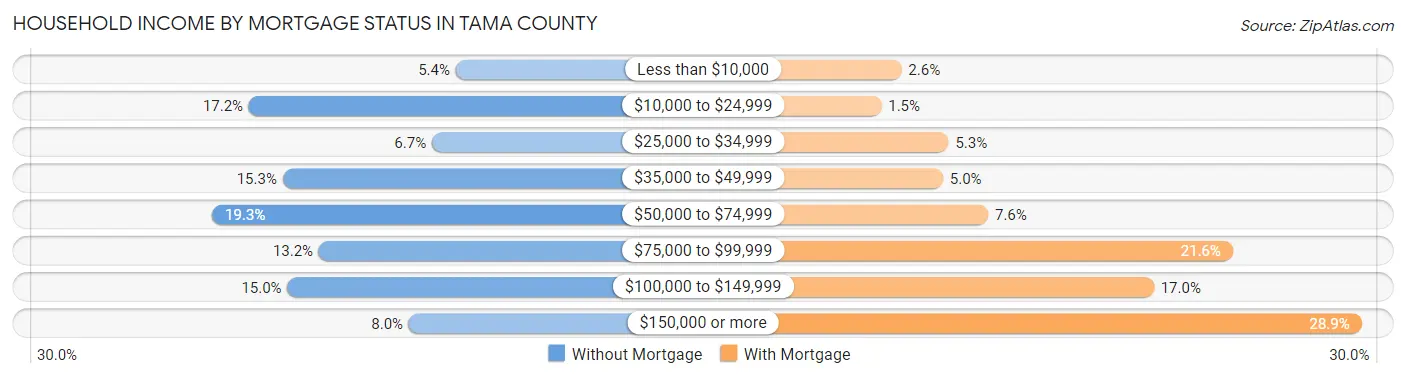
| Household Income | Without Mortgage | With Mortgage |
| Less than $10,000 | 122 (5.4%) | 73 (2.6%) |
| $10,000 to $24,999 | 391 (17.2%) | 41 (1.5%) |
| $25,000 to $34,999 | 153 (6.7%) | 148 (5.3%) |
| $35,000 to $49,999 | 347 (15.2%) | 139 (5.0%) |
| $50,000 to $74,999 | 439 (19.3%) | 211 (7.6%) |
| $75,000 to $99,999 | 300 (13.2%) | 601 (21.6%) |
| $100,000 to $149,999 | 341 (15.0%) | 475 (17.0%) |
| $150,000 or more | 183 (8.0%) | 806 (28.9%) |
| Total | 2,276 (100.0%) | 2,788 (100.0%) |
Property Value to Household Income Ratio in Tama County
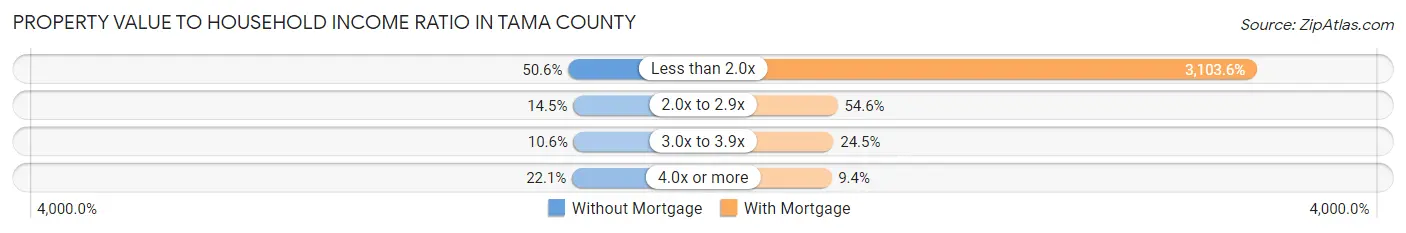
| Value-to-Income Ratio | Without Mortgage | With Mortgage |
| Less than 2.0x | 1,152 (50.6%) | 86,528 (3,103.6%) |
| 2.0x to 2.9x | 329 (14.5%) | 1,523 (54.6%) |
| 3.0x to 3.9x | 242 (10.6%) | 683 (24.5%) |
| 4.0x or more | 502 (22.1%) | 262 (9.4%) |
| Total | 2,276 (100.0%) | 2,788 (100.0%) |
Real Estate Taxes by Mortgage Status in Tama County
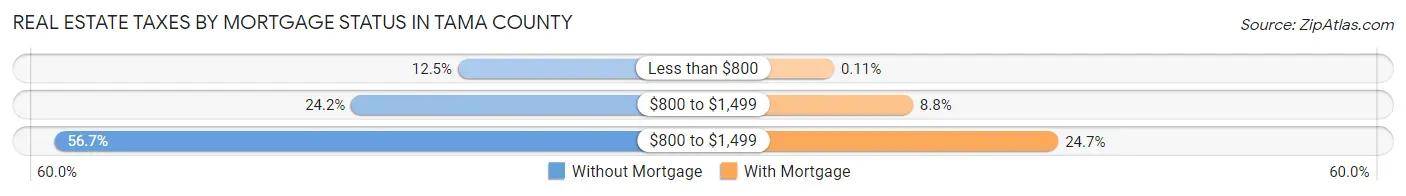
| Property Taxes | Without Mortgage | With Mortgage |
| Less than $800 | 285 (12.5%) | 3 (0.1%) |
| $800 to $1,499 | 551 (24.2%) | 244 (8.7%) |
| $800 to $1,499 | 1,291 (56.7%) | 688 (24.7%) |
| Total | 2,276 (100.0%) | 2,788 (100.0%) |
Health & Disability in Tama County
Health Insurance Coverage by Age in Tama County
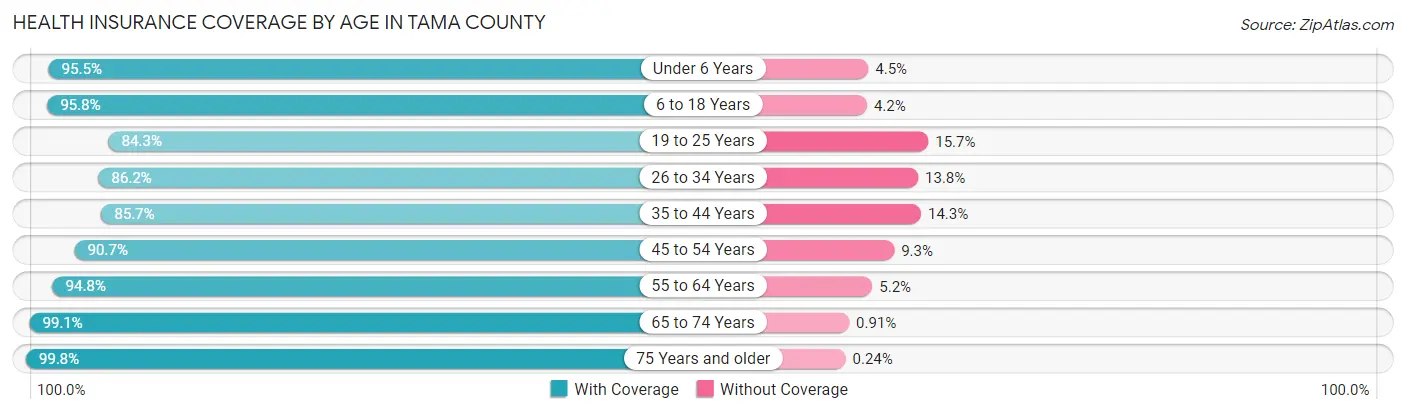
| Age Bracket | With Coverage | Without Coverage |
| Under 6 Years | 1,235 (95.5%) | 58 (4.5%) |
| 6 to 18 Years | 2,805 (95.8%) | 124 (4.2%) |
| 19 to 25 Years | 1,050 (84.3%) | 195 (15.7%) |
| 26 to 34 Years | 1,490 (86.2%) | 238 (13.8%) |
| 35 to 44 Years | 1,580 (85.7%) | 264 (14.3%) |
| 45 to 54 Years | 1,803 (90.7%) | 185 (9.3%) |
| 55 to 64 Years | 2,372 (94.8%) | 131 (5.2%) |
| 65 to 74 Years | 1,857 (99.1%) | 17 (0.9%) |
| 75 Years and older | 1,247 (99.8%) | 3 (0.2%) |
| Total | 15,439 (92.7%) | 1,215 (7.3%) |
Health Insurance Coverage by Citizenship Status in Tama County
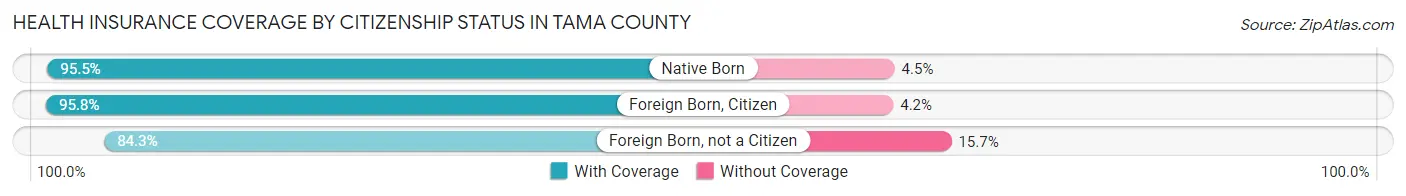
| Citizenship Status | With Coverage | Without Coverage |
| Native Born | 1,235 (95.5%) | 58 (4.5%) |
| Foreign Born, Citizen | 2,805 (95.8%) | 124 (4.2%) |
| Foreign Born, not a Citizen | 1,050 (84.3%) | 195 (15.7%) |
Health Insurance Coverage by Household Income in Tama County
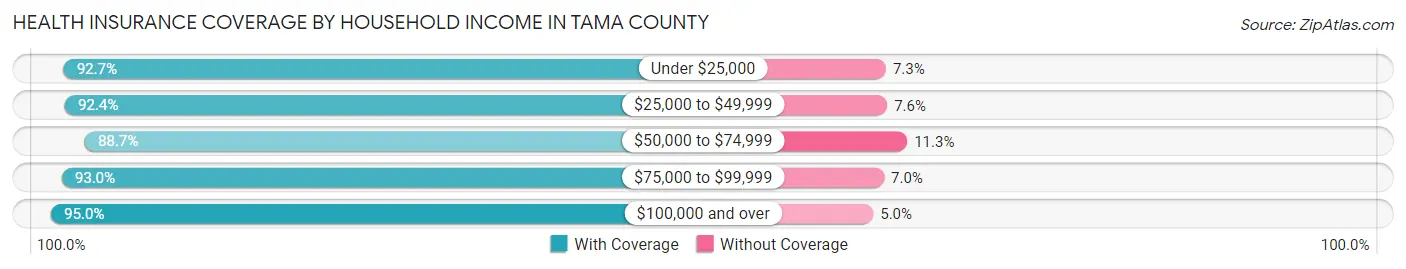
| Household Income | With Coverage | Without Coverage |
| Under $25,000 | 1,855 (92.7%) | 147 (7.3%) |
| $25,000 to $49,999 | 2,699 (92.4%) | 221 (7.6%) |
| $50,000 to $74,999 | 2,954 (88.7%) | 377 (11.3%) |
| $75,000 to $99,999 | 2,447 (93.0%) | 184 (7.0%) |
| $100,000 and over | 5,477 (95.0%) | 286 (5.0%) |
Public vs Private Health Insurance Coverage by Age in Tama County
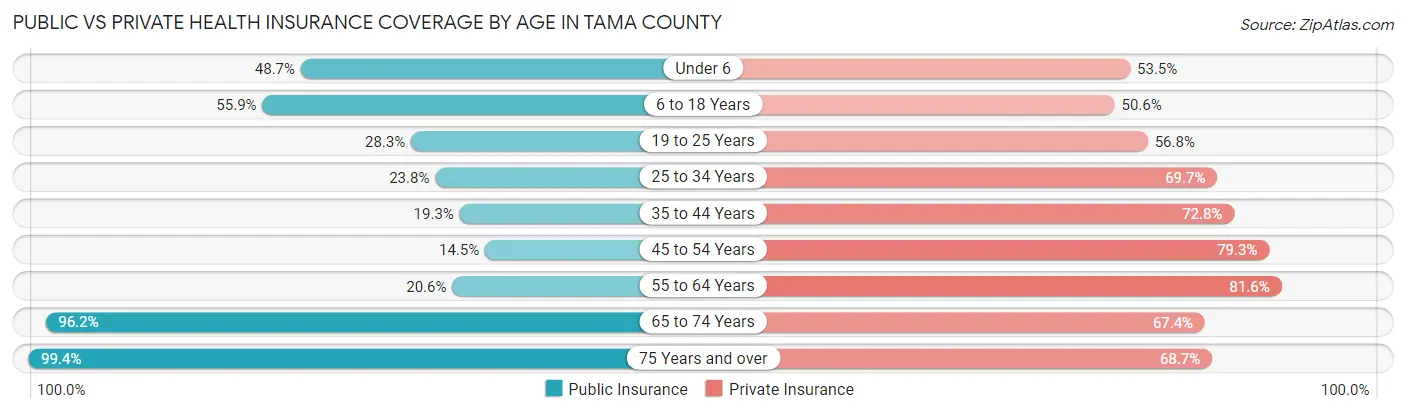
| Age Bracket | Public Insurance | Private Insurance |
| Under 6 | 630 (48.7%) | 692 (53.5%) |
| 6 to 18 Years | 1,636 (55.9%) | 1,483 (50.6%) |
| 19 to 25 Years | 352 (28.3%) | 707 (56.8%) |
| 25 to 34 Years | 411 (23.8%) | 1,204 (69.7%) |
| 35 to 44 Years | 355 (19.3%) | 1,343 (72.8%) |
| 45 to 54 Years | 289 (14.5%) | 1,577 (79.3%) |
| 55 to 64 Years | 516 (20.6%) | 2,043 (81.6%) |
| 65 to 74 Years | 1,802 (96.2%) | 1,263 (67.4%) |
| 75 Years and over | 1,242 (99.4%) | 859 (68.7%) |
| Total | 7,233 (43.4%) | 11,171 (67.1%) |
Disability Status by Sex by Age in Tama County
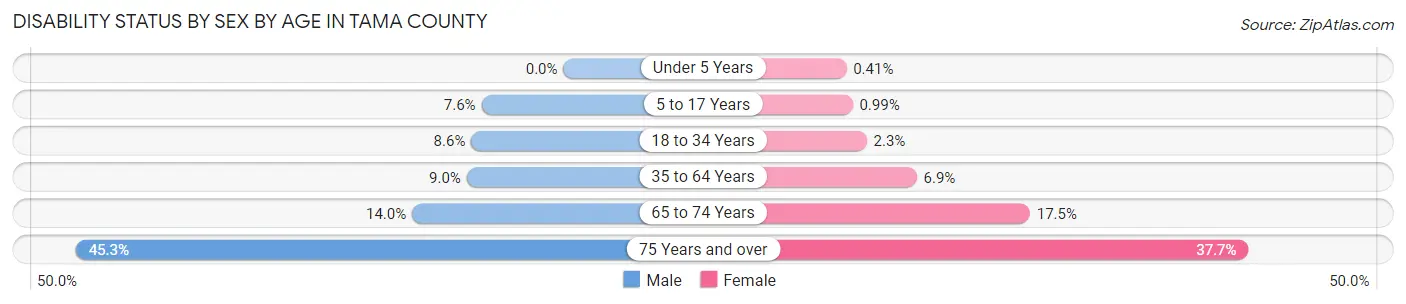
| Age Bracket | Male | Female |
| Under 5 Years | 0 (0.0%) | 2 (0.4%) |
| 5 to 17 Years | 121 (7.6%) | 14 (1.0%) |
| 18 to 34 Years | 140 (8.6%) | 35 (2.3%) |
| 35 to 64 Years | 288 (9.0%) | 217 (6.9%) |
| 65 to 74 Years | 132 (14.0%) | 163 (17.4%) |
| 75 Years and over | 243 (45.3%) | 269 (37.7%) |
Disability Class by Sex by Age in Tama County
Disability Class: Hearing Difficulty
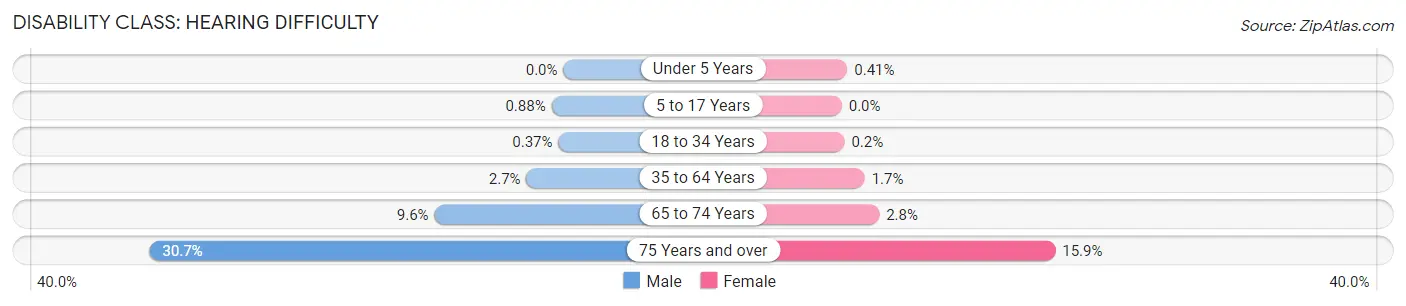
| Age Bracket | Male | Female |
| Under 5 Years | 0 (0.0%) | 2 (0.4%) |
| 5 to 17 Years | 14 (0.9%) | 0 (0.0%) |
| 18 to 34 Years | 6 (0.4%) | 3 (0.2%) |
| 35 to 64 Years | 88 (2.7%) | 53 (1.7%) |
| 65 to 74 Years | 90 (9.6%) | 26 (2.8%) |
| 75 Years and over | 165 (30.7%) | 113 (15.9%) |
Disability Class: Vision Difficulty
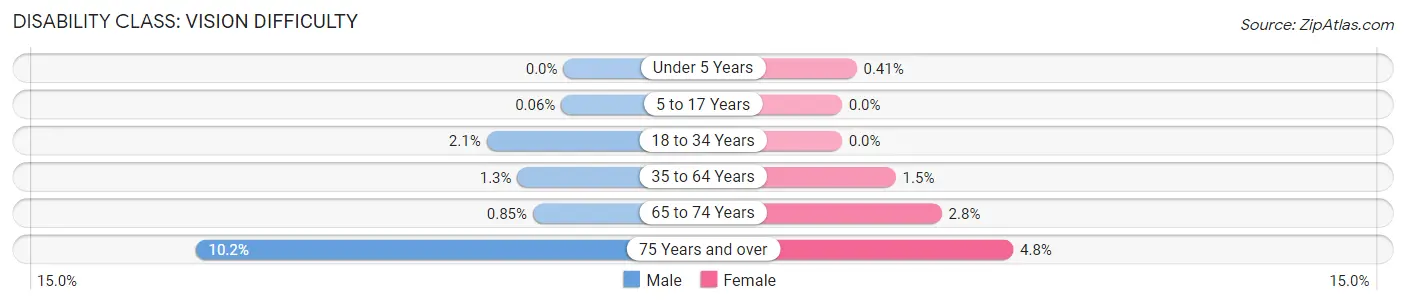
| Age Bracket | Male | Female |
| Under 5 Years | 0 (0.0%) | 2 (0.4%) |
| 5 to 17 Years | 1 (0.1%) | 0 (0.0%) |
| 18 to 34 Years | 35 (2.1%) | 0 (0.0%) |
| 35 to 64 Years | 41 (1.3%) | 47 (1.5%) |
| 65 to 74 Years | 8 (0.9%) | 26 (2.8%) |
| 75 Years and over | 55 (10.2%) | 34 (4.8%) |
Disability Class: Cognitive Difficulty
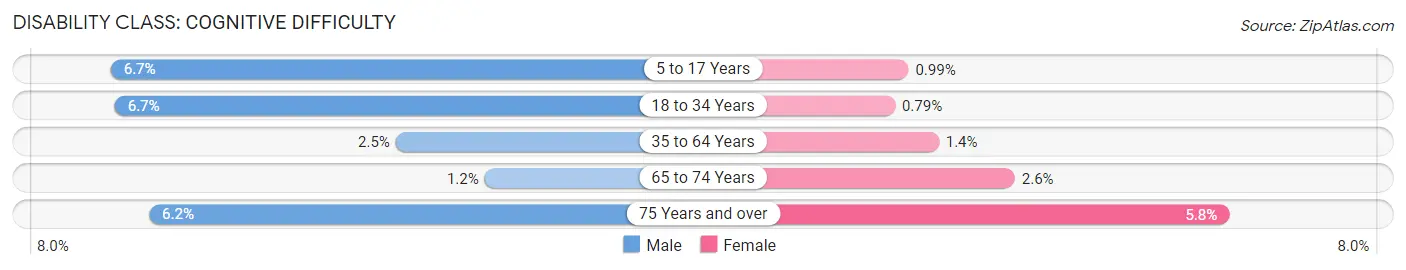
| Age Bracket | Male | Female |
| 5 to 17 Years | 107 (6.7%) | 14 (1.0%) |
| 18 to 34 Years | 109 (6.7%) | 12 (0.8%) |
| 35 to 64 Years | 80 (2.5%) | 45 (1.4%) |
| 65 to 74 Years | 11 (1.2%) | 24 (2.6%) |
| 75 Years and over | 33 (6.1%) | 41 (5.8%) |
Disability Class: Ambulatory Difficulty
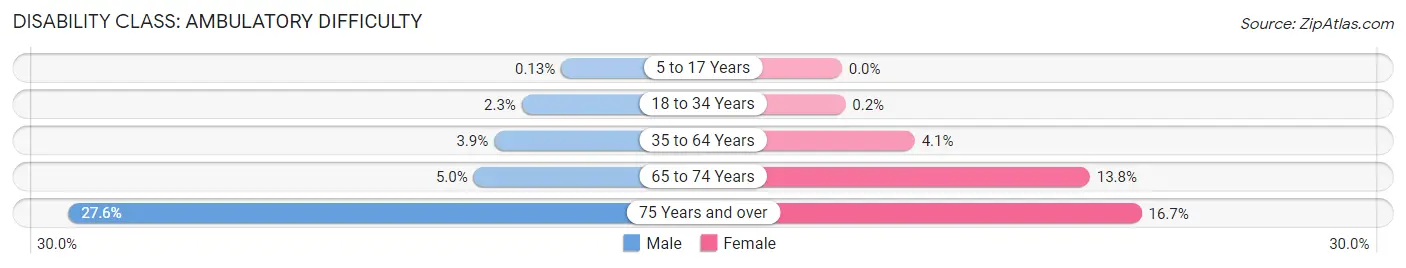
| Age Bracket | Male | Female |
| 5 to 17 Years | 2 (0.1%) | 0 (0.0%) |
| 18 to 34 Years | 38 (2.3%) | 3 (0.2%) |
| 35 to 64 Years | 124 (3.9%) | 127 (4.1%) |
| 65 to 74 Years | 47 (5.0%) | 129 (13.8%) |
| 75 Years and over | 148 (27.6%) | 119 (16.7%) |
Disability Class: Self-Care Difficulty
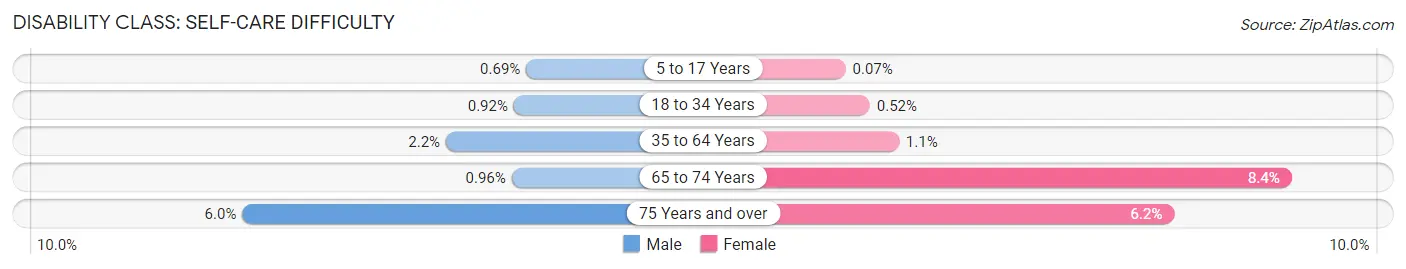
| Age Bracket | Male | Female |
| 5 to 17 Years | 11 (0.7%) | 1 (0.1%) |
| 18 to 34 Years | 15 (0.9%) | 8 (0.5%) |
| 35 to 64 Years | 70 (2.2%) | 33 (1.1%) |
| 65 to 74 Years | 9 (1.0%) | 78 (8.4%) |
| 75 Years and over | 32 (6.0%) | 44 (6.2%) |
Technology Access in Tama County
Computing Device Access in Tama County
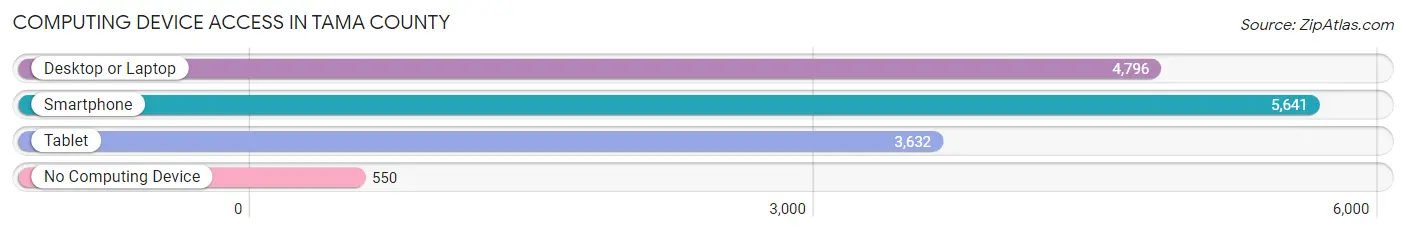
| Device Type | # Households | % Households |
| Desktop or Laptop | 4,796 | 71.6% |
| Smartphone | 5,641 | 84.2% |
| Tablet | 3,632 | 54.2% |
| No Computing Device | 550 | 8.2% |
| Total | 6,703 | 100.0% |
Internet Access in Tama County
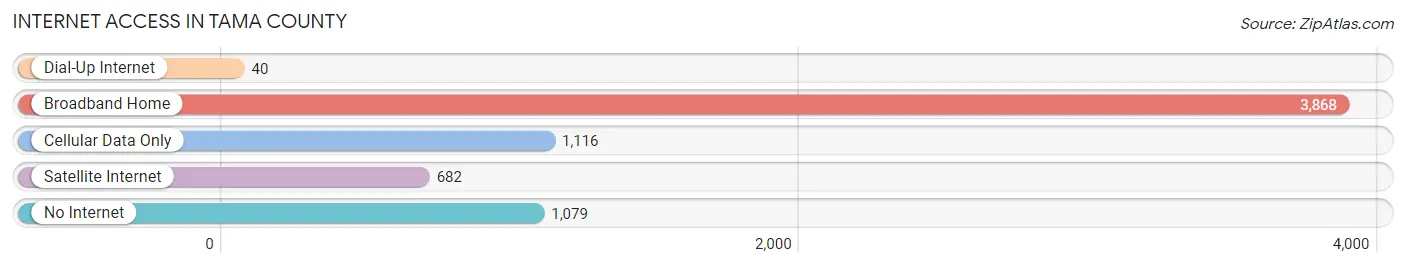
| Internet Type | # Households | % Households |
| Dial-Up Internet | 40 | 0.6% |
| Broadband Home | 3,868 | 57.7% |
| Cellular Data Only | 1,116 | 16.7% |
| Satellite Internet | 682 | 10.2% |
| No Internet | 1,079 | 16.1% |
| Total | 6,703 | 100.0% |
Tama County Summary
Tama County, Iowa is located in the east-central part of the state and is bordered by Benton, Iowa, Marshall, Iowa, and Black Hawk counties. The county seat is Toledo, Iowa. The county was established in 1843 and named after Tama, a Meskwaki chief. As of the 2010 census, the population was 17,767.
Geography
Tama County is located in the rolling hills of east-central Iowa. The county is mostly rural, with a few small towns and villages scattered throughout. The county is drained by the Cedar River and its tributaries. The highest point in the county is located in the northwest corner, at an elevation of 1,092 feet. The county has a total area of 576 square miles, of which 574 square miles is land and 2 square miles is water.
Economy
Tama County’s economy is largely based on agriculture. The county is home to several large farms, as well as smaller family-owned operations. The county is also home to several manufacturing companies, including a large pork processing plant. Other industries in the county include retail, health care, and tourism.
Demographics
As of the 2010 census, the population of Tama County was 17,767. The racial makeup of the county was 94.3% White, 0.7% African American, 0.3% Native American, 0.3% Asian, 0.1% Pacific Islander, 2.7% from other races, and 1.6% from two or more races. Hispanic or Latino of any race were 5.2% of the population.
The median income for a household in the county was $45,845, and the median income for a family was $53,945. The per capita income for the county was $21,845. About 8.2% of families and 11.2% of the population were below the poverty line, including 15.2% of those under age 18 and 8.2% of those age 65 or over.
History
Tama County was established in 1843 and named after Tama, a Meskwaki chief. The county was originally part of the Black Hawk Purchase, a large tract of land purchased from the Meskwaki and Sauk tribes in 1832. The county was initially settled by farmers, who cleared the land and established small towns and villages.
In the late 19th century, the county experienced a period of rapid growth. The population increased from 4,000 in 1880 to over 10,000 by 1900. This growth was largely due to the arrival of immigrants from Germany, Ireland, and other European countries.
The county continued to grow throughout the 20th century, and by 2000 the population had reached 17,767. Today, Tama County is a largely rural county, with a few small towns and villages scattered throughout. The county is home to several large farms, as well as several manufacturing companies. The county is also home to a large pork processing plant, which is one of the largest employers in the county.
Common Questions
What is Per Capita Income in Tama County?
Per Capita income in Tama County is $33,046.
What is the Median Family Income in Tama County?
Median Family Income in Tama County is $78,503.
What is the Median Household income in Tama County?
Median Household Income in Tama County is $65,483.
What is Income or Wage Gap in Tama County?
Income or Wage Gap in Tama County is 33.7%.
Women in Tama County earn 66.3 cents for every dollar earned by a man.
What is Family Income Deficit in Tama County?
Family Income Deficit in Tama County is $11,714.
Families that are below poverty line in Tama County earn $11,714 less on average than the poverty threshold level.
What is Inequality or Gini Index in Tama County?
Inequality or Gini Index in Tama County is 0.43.
What is the Total Population of Tama County?
Total Population of Tama County is 17,017.
What is the Total Male Population of Tama County?
Total Male Population of Tama County is 8,627.
What is the Total Female Population of Tama County?
Total Female Population of Tama County is 8,390.
What is the Ratio of Males per 100 Females in Tama County?
There are 102.82 Males per 100 Females in Tama County.
What is the Ratio of Females per 100 Males in Tama County?
There are 97.25 Females per 100 Males in Tama County.
What is the Median Population Age in Tama County?
Median Population Age in Tama County is 41.0 Years.
What is the Average Family Size in Tama County
Average Family Size in Tama County is 3.0 People.
What is the Average Household Size in Tama County
Average Household Size in Tama County is 2.5 People.
How Large is the Labor Force in Tama County?
There are 8,563 People in the Labor Forcein in Tama County.
What is the Percentage of People in the Labor Force in Tama County?
63.8% of People are in the Labor Force in Tama County.
What is the Unemployment Rate in Tama County?
Unemployment Rate in Tama County is 4.5%.