Ringgold County, IA Map & Demographics
Ringgold County Map
Ringgold County Overview
$34,138
PER CAPITA INCOME
$84,615
AVG FAMILY INCOME
$67,898
AVG HOUSEHOLD INCOME
37.7%
WAGE / INCOME GAP [ % ]
62.3¢/ $1
WAGE / INCOME GAP [ $ ]
0.42
INEQUALITY / GINI INDEX
4,690
TOTAL POPULATION
2,317
MALE POPULATION
2,373
FEMALE POPULATION
97.64
MALES / 100 FEMALES
102.42
FEMALES / 100 MALES
43.8
MEDIAN AGE
3.0
AVG FAMILY SIZE
2.4
AVG HOUSEHOLD SIZE
2,330
LABOR FORCE [ PEOPLE ]
62.9%
PERCENT IN LABOR FORCE
1.7%
UNEMPLOYMENT RATE
Ringgold County Area Codes
Income in Ringgold County
Income Overview in Ringgold County
Per Capita Income in Ringgold County is $34,138, while median incomes of families and households are $84,615 and $67,898 respectively.
| Characteristic | Number | Measure |
| Per Capita Income | 4,690 | $34,138 |
| Median Family Income | 1,200 | $84,615 |
| Mean Family Income | 1,200 | $99,615 |
| Median Household Income | 1,844 | $67,898 |
| Mean Household Income | 1,844 | $85,147 |
| Income Deficit | 1,200 | $0 |
| Wage / Income Gap (%) | 4,690 | 37.74% |
| Wage / Income Gap ($) | 4,690 | 62.26¢ per $1 |
| Gini / Inequality Index | 4,690 | 0.42 |
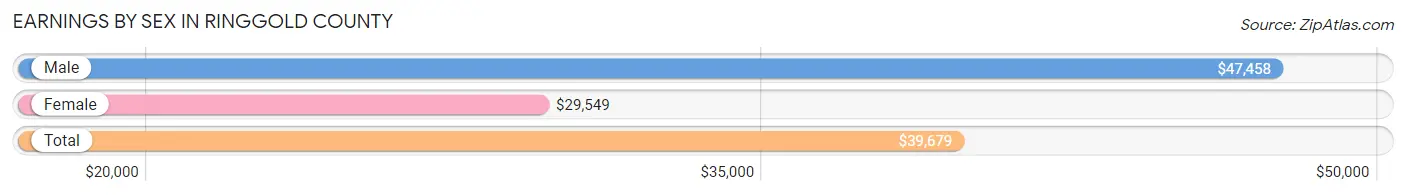
Earnings by Sex in Ringgold County
Average Earnings in Ringgold County are $39,679, $47,458 for men and $29,549 for women, a difference of 37.7%.
| Sex | Number | Average Earnings |
| Male | 1,294 (52.6%) | $47,458 |
| Female | 1,167 (47.4%) | $29,549 |
| Total | 2,461 (100.0%) | $39,679 |
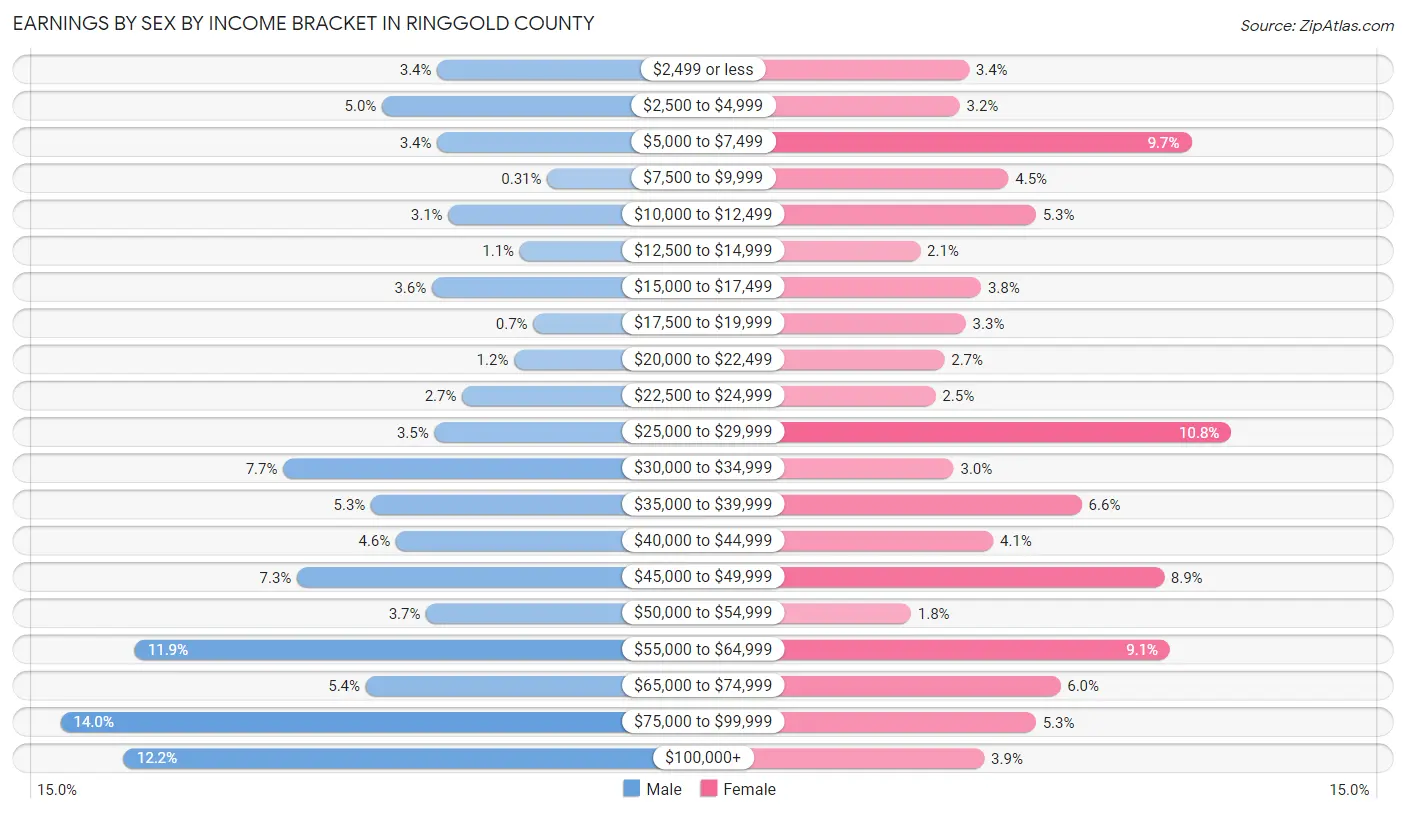
Earnings by Sex by Income Bracket in Ringgold County
The most common earnings brackets in Ringgold County are $75,000 to $99,999 for men (181 | 14.0%) and $25,000 to $29,999 for women (126 | 10.8%).
| Income | Male | Female |
| $2,499 or less | 44 (3.4%) | 40 (3.4%) |
| $2,500 to $4,999 | 64 (5.0%) | 37 (3.2%) |
| $5,000 to $7,499 | 44 (3.4%) | 113 (9.7%) |
| $7,500 to $9,999 | 4 (0.3%) | 53 (4.5%) |
| $10,000 to $12,499 | 40 (3.1%) | 62 (5.3%) |
| $12,500 to $14,999 | 14 (1.1%) | 24 (2.1%) |
| $15,000 to $17,499 | 46 (3.5%) | 44 (3.8%) |
| $17,500 to $19,999 | 9 (0.7%) | 39 (3.3%) |
| $20,000 to $22,499 | 16 (1.2%) | 32 (2.7%) |
| $22,500 to $24,999 | 35 (2.7%) | 29 (2.5%) |
| $25,000 to $29,999 | 45 (3.5%) | 126 (10.8%) |
| $30,000 to $34,999 | 100 (7.7%) | 35 (3.0%) |
| $35,000 to $39,999 | 68 (5.3%) | 77 (6.6%) |
| $40,000 to $44,999 | 59 (4.6%) | 48 (4.1%) |
| $45,000 to $49,999 | 95 (7.3%) | 104 (8.9%) |
| $50,000 to $54,999 | 48 (3.7%) | 21 (1.8%) |
| $55,000 to $64,999 | 154 (11.9%) | 106 (9.1%) |
| $65,000 to $74,999 | 70 (5.4%) | 70 (6.0%) |
| $75,000 to $99,999 | 181 (14.0%) | 62 (5.3%) |
| $100,000+ | 158 (12.2%) | 45 (3.9%) |
| Total | 1,294 (100.0%) | 1,167 (100.0%) |
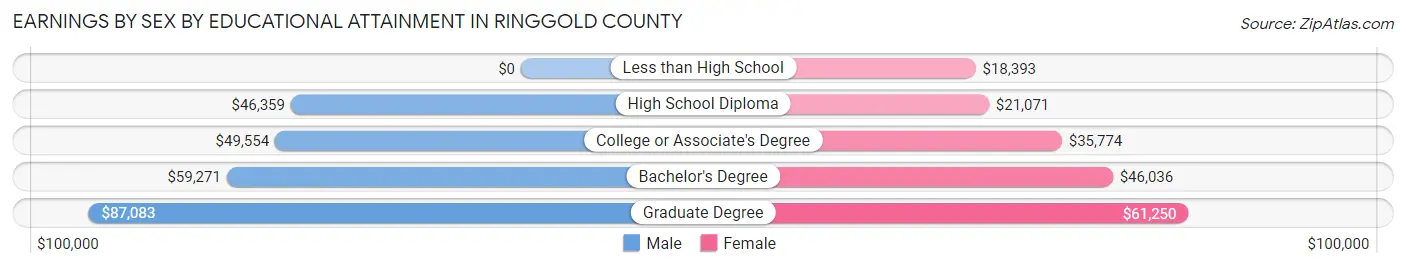
Earnings by Sex by Educational Attainment in Ringgold County
Average earnings in Ringgold County are $48,857 for men and $32,100 for women, a difference of 34.3%. Men with an educational attainment of graduate degree enjoy the highest average annual earnings of $87,083, while those with high school diploma education earn the least with $46,359. Women with an educational attainment of graduate degree earn the most with the average annual earnings of $61,250, while those with less than high school education have the smallest earnings of $18,393.
| Educational Attainment | Male Income | Female Income |
| Less than High School | - | - |
| High School Diploma | $46,359 | $21,071 |
| College or Associate's Degree | $49,554 | $35,774 |
| Bachelor's Degree | $59,271 | $46,036 |
| Graduate Degree | $87,083 | $61,250 |
| Total | $48,857 | $32,100 |
Family Income in Ringgold County
Family Income Brackets in Ringgold County
According to the Ringgold County family income data, there are 295 families falling into the $100,000 to $149,999 income range, which is the most common income bracket and makes up 24.6% of all families.
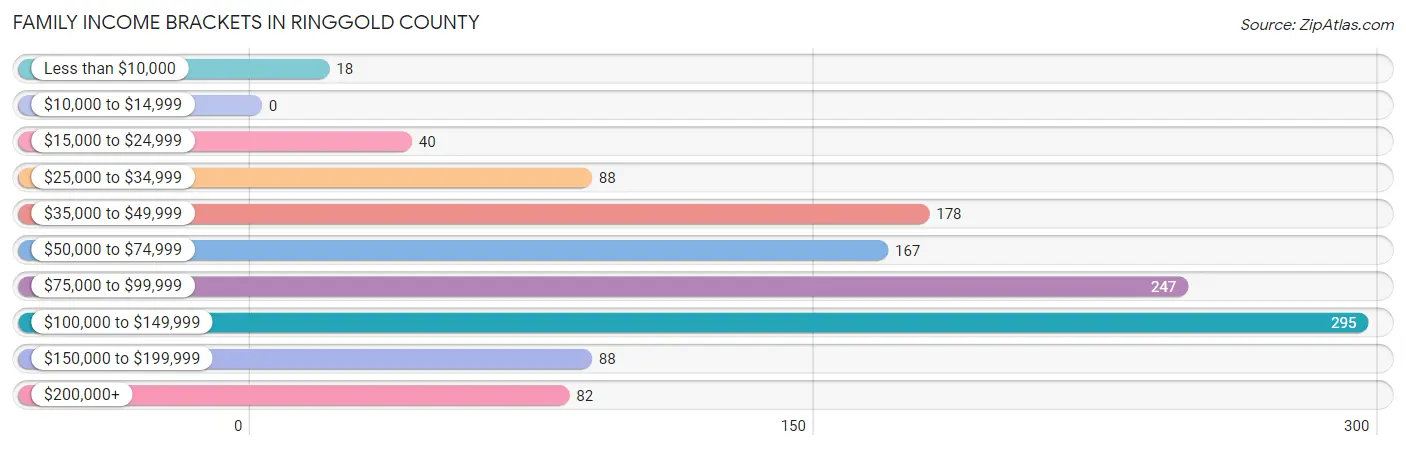
| Income Bracket | # Families | % Families |
| Less than $10,000 | 18 | 1.5% |
| $10,000 to $14,999 | 0 | 0.0% |
| $15,000 to $24,999 | 40 | 3.3% |
| $25,000 to $34,999 | 88 | 7.3% |
| $35,000 to $49,999 | 178 | 14.8% |
| $50,000 to $74,999 | 167 | 13.9% |
| $75,000 to $99,999 | 247 | 20.6% |
| $100,000 to $149,999 | 295 | 24.6% |
| $150,000 to $199,999 | 88 | 7.3% |
| $200,000+ | 82 | 6.8% |
Family Income by Famaliy Size in Ringgold County
4-person families (159 | 13.3%) account for the highest median family income in Ringgold County with $142,981 per family, while 4-person families (159 | 13.3%) have the highest median income of $35,745 per family member.
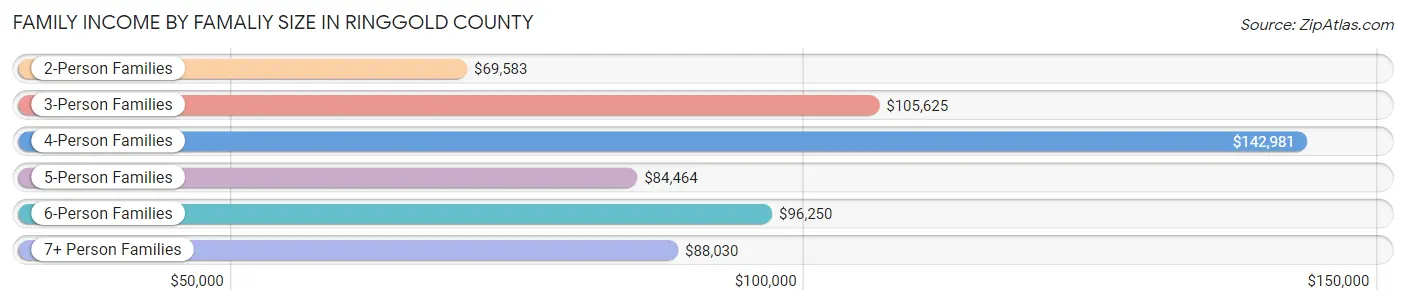
| Income Bracket | # Families | Median Income |
| 2-Person Families | 656 (54.7%) | $69,583 |
| 3-Person Families | 160 (13.3%) | $105,625 |
| 4-Person Families | 159 (13.3%) | $142,981 |
| 5-Person Families | 141 (11.7%) | $84,464 |
| 6-Person Families | 24 (2.0%) | $96,250 |
| 7+ Person Families | 60 (5.0%) | $88,030 |
| Total | 1,200 (100.0%) | $84,615 |
Family Income by Number of Earners in Ringgold County
The median family income in Ringgold County is $84,615, with families comprising 3+ earners (114) having the highest median family income of $115,500, while families with no earners (134) have the lowest median family income of $43,611, accounting for 9.5% and 11.2% of families, respectively.
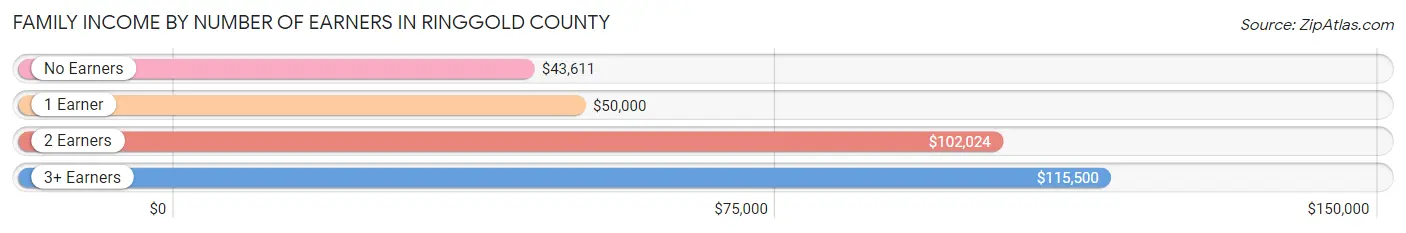
| Number of Earners | # Families | Median Income |
| No Earners | 134 (11.2%) | $43,611 |
| 1 Earner | 358 (29.8%) | $50,000 |
| 2 Earners | 594 (49.5%) | $102,024 |
| 3+ Earners | 114 (9.5%) | $115,500 |
| Total | 1,200 (100.0%) | $84,615 |
Household Income in Ringgold County
Household Income Brackets in Ringgold County
With 332 households falling in the category, the $100,000 to $149,999 income range is the most frequent in Ringgold County, accounting for 18.0% of all households. In contrast, only 33 households (1.8%) fall into the less than $10,000 income bracket, making it the least populous group.
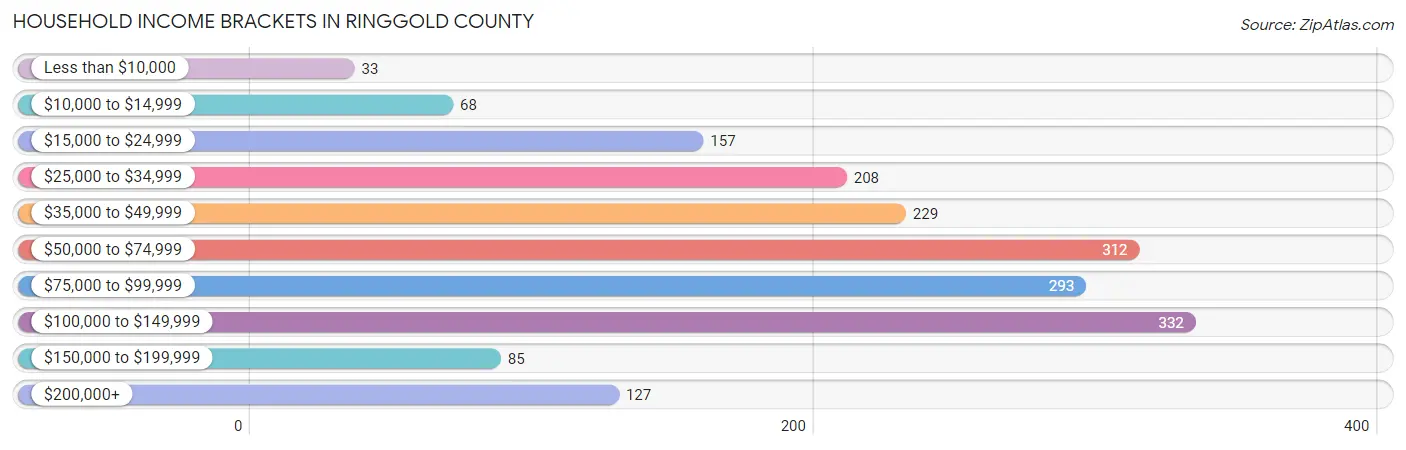
| Income Bracket | # Households | % Households |
| Less than $10,000 | 33 | 1.8% |
| $10,000 to $14,999 | 68 | 3.7% |
| $15,000 to $24,999 | 157 | 8.5% |
| $25,000 to $34,999 | 208 | 11.3% |
| $35,000 to $49,999 | 229 | 12.4% |
| $50,000 to $74,999 | 312 | 16.9% |
| $75,000 to $99,999 | 293 | 15.9% |
| $100,000 to $149,999 | 332 | 18.0% |
| $150,000 to $199,999 | 85 | 4.6% |
| $200,000+ | 127 | 6.9% |
Household Income by Householder Age in Ringgold County
The median household income in Ringgold County is $67,898, with the highest median household income of $105,268 found in the 15 to 24 years age bracket for the primary householder. A total of 107 households (5.8%) fall into this category. Meanwhile, the 65+ years age bracket for the primary householder has the lowest median household income of $41,058, with 563 households (30.5%) in this group.
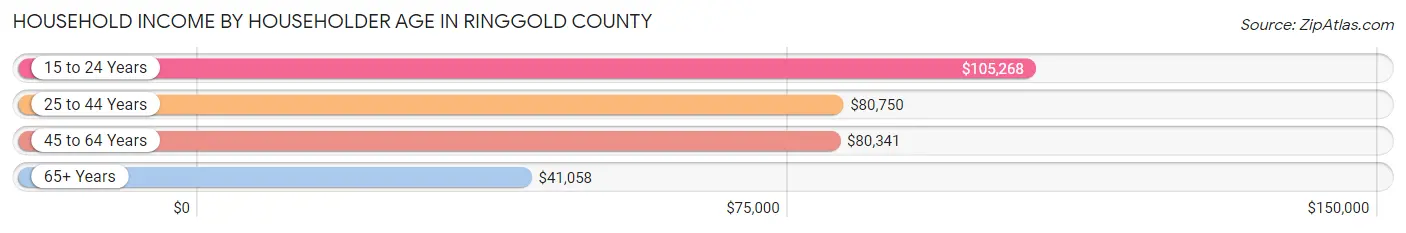
| Income Bracket | # Households | Median Income |
| 15 to 24 Years | 107 (5.8%) | $105,268 |
| 25 to 44 Years | 505 (27.4%) | $80,750 |
| 45 to 64 Years | 669 (36.3%) | $80,341 |
| 65+ Years | 563 (30.5%) | $41,058 |
| Total | 1,844 (100.0%) | $67,898 |
Poverty in Ringgold County
Income Below Poverty by Sex and Age in Ringgold County
With 5.6% poverty level for males and 10.9% for females among the residents of Ringgold County, 12 to 14 year old males and 16 and 17 year old females are the most vulnerable to poverty, with 23 males (20.2%) and 53 females (60.9%) in their respective age groups living below the poverty level.
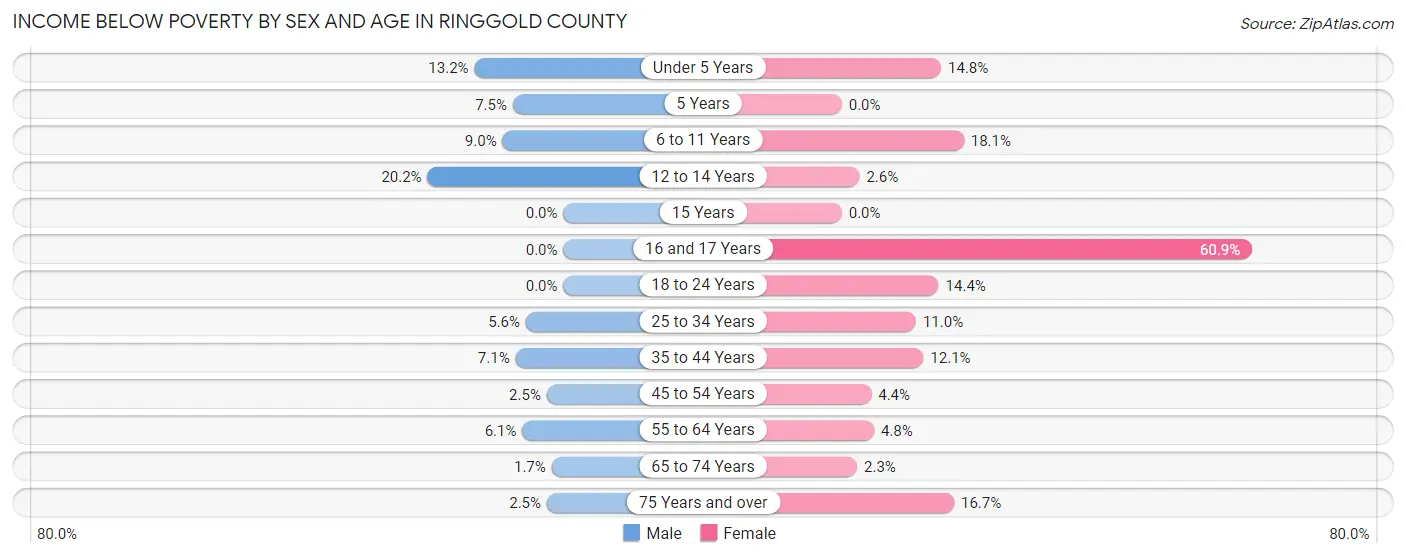
| Age Bracket | Male | Female |
| Under 5 Years | 21 (13.2%) | 18 (14.7%) |
| 5 Years | 3 (7.5%) | 0 (0.0%) |
| 6 to 11 Years | 16 (9.0%) | 27 (18.1%) |
| 12 to 14 Years | 23 (20.2%) | 3 (2.6%) |
| 15 Years | 0 (0.0%) | 0 (0.0%) |
| 16 and 17 Years | 0 (0.0%) | 53 (60.9%) |
| 18 to 24 Years | 0 (0.0%) | 23 (14.4%) |
| 25 to 34 Years | 11 (5.6%) | 26 (11.0%) |
| 35 to 44 Years | 18 (7.1%) | 28 (12.1%) |
| 45 to 54 Years | 6 (2.5%) | 12 (4.4%) |
| 55 to 64 Years | 20 (6.1%) | 17 (4.8%) |
| 65 to 74 Years | 5 (1.7%) | 6 (2.3%) |
| 75 Years and over | 4 (2.5%) | 29 (16.7%) |
| Total | 127 (5.6%) | 242 (10.9%) |
Income Above Poverty by Sex and Age in Ringgold County
According to the poverty statistics in Ringgold County, males aged 15 years and females aged 5 years are the age groups that are most secure financially, with 100.0% of males and 100.0% of females in these age groups living above the poverty line.
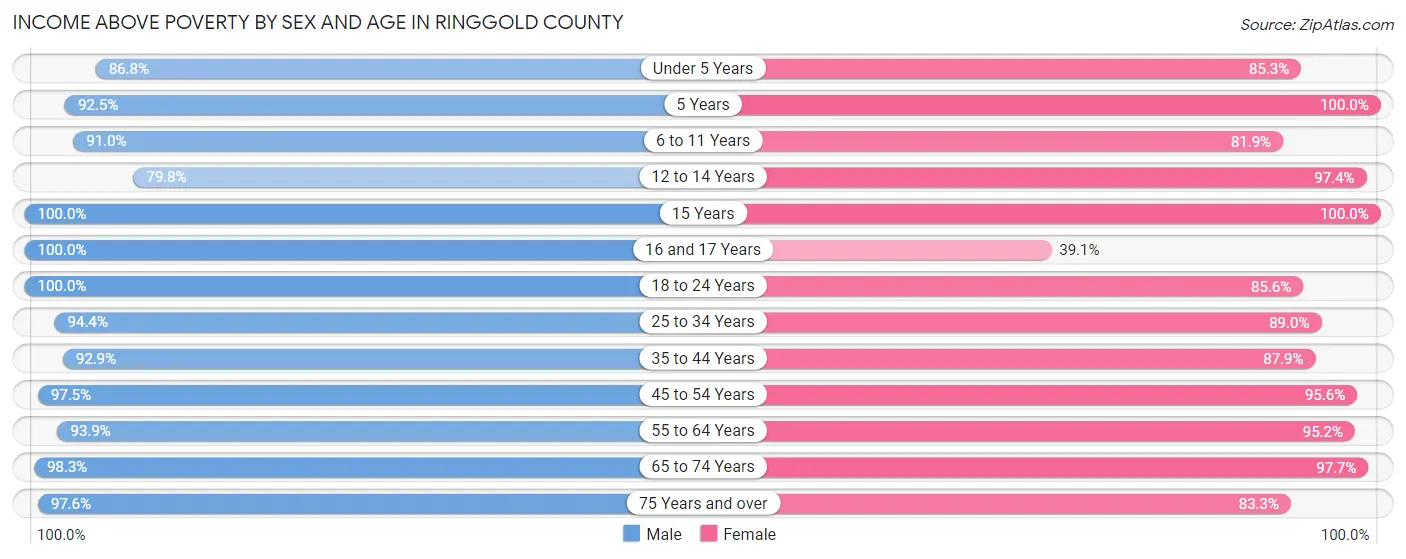
| Age Bracket | Male | Female |
| Under 5 Years | 138 (86.8%) | 104 (85.3%) |
| 5 Years | 37 (92.5%) | 24 (100.0%) |
| 6 to 11 Years | 161 (91.0%) | 122 (81.9%) |
| 12 to 14 Years | 91 (79.8%) | 111 (97.4%) |
| 15 Years | 58 (100.0%) | 25 (100.0%) |
| 16 and 17 Years | 50 (100.0%) | 34 (39.1%) |
| 18 to 24 Years | 188 (100.0%) | 137 (85.6%) |
| 25 to 34 Years | 186 (94.4%) | 210 (89.0%) |
| 35 to 44 Years | 235 (92.9%) | 203 (87.9%) |
| 45 to 54 Years | 237 (97.5%) | 262 (95.6%) |
| 55 to 64 Years | 308 (93.9%) | 339 (95.2%) |
| 65 to 74 Years | 283 (98.3%) | 258 (97.7%) |
| 75 Years and over | 159 (97.6%) | 145 (83.3%) |
| Total | 2,131 (94.4%) | 1,974 (89.1%) |
Income Below Poverty Among Married-Couple Families in Ringgold County
The poverty statistics for married-couple families in Ringgold County show that 0.9% or 9 of the total 1,001 families live below the poverty line. Families with 5 or more children have the highest poverty rate of 34.8%, comprising of 8 families. On the other hand, families with 1 or 2 children have the lowest poverty rate of 0.0%, which includes 0 families.
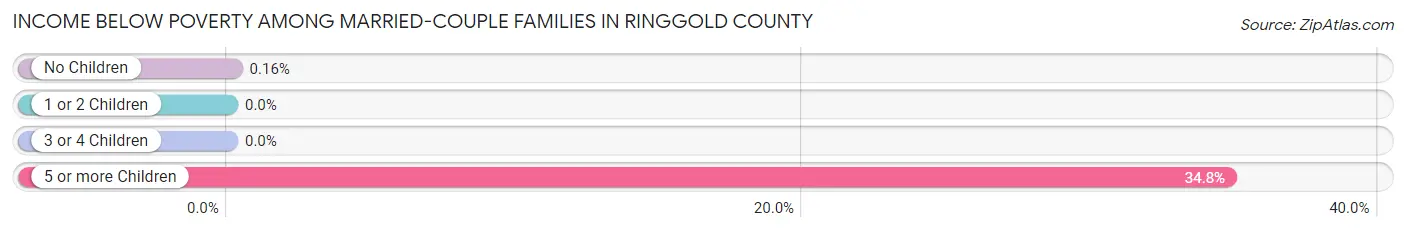
| Children | Above Poverty | Below Poverty |
| No Children | 617 (99.8%) | 1 (0.2%) |
| 1 or 2 Children | 235 (100.0%) | 0 (0.0%) |
| 3 or 4 Children | 125 (100.0%) | 0 (0.0%) |
| 5 or more Children | 15 (65.2%) | 8 (34.8%) |
| Total | 992 (99.1%) | 9 (0.9%) |
Income Below Poverty Among Single-Parent Households in Ringgold County
According to the poverty data in Ringgold County, 16.1% or 14 single-father households and 19.6% or 22 single-mother households are living below the poverty line. Among single-father households, those with 1 or 2 children have the highest poverty rate, with 14 households (29.8%) experiencing poverty. Likewise, among single-mother households, those with 3 or 4 children have the highest poverty rate, with 18 households (75.0%) falling below the poverty line.
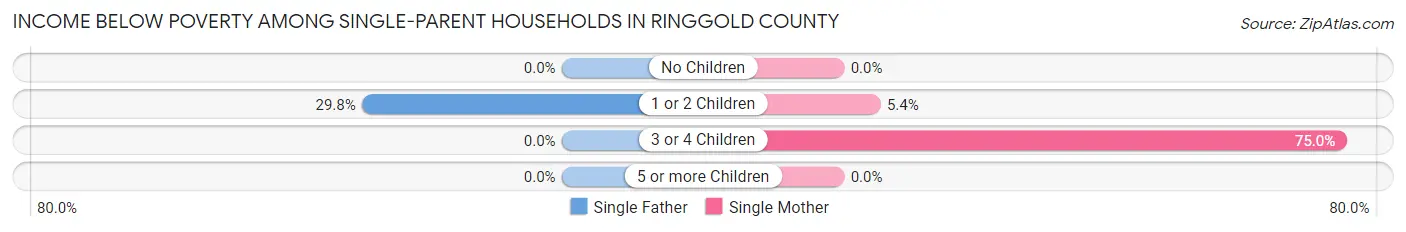
| Children | Single Father | Single Mother |
| No Children | 0 (0.0%) | 0 (0.0%) |
| 1 or 2 Children | 14 (29.8%) | 4 (5.4%) |
| 3 or 4 Children | 0 (0.0%) | 18 (75.0%) |
| 5 or more Children | 0 (0.0%) | 0 (0.0%) |
| Total | 14 (16.1%) | 22 (19.6%) |
Income Below Poverty Among Married-Couple vs Single-Parent Households in Ringgold County
The poverty data for Ringgold County shows that 9 of the married-couple family households (0.9%) and 36 of the single-parent households (18.1%) are living below the poverty level. Within the married-couple family households, those with 5 or more children have the highest poverty rate, with 8 households (34.8%) falling below the poverty line. Among the single-parent households, those with 3 or 4 children have the highest poverty rate, with 18 household (60.0%) living below poverty.
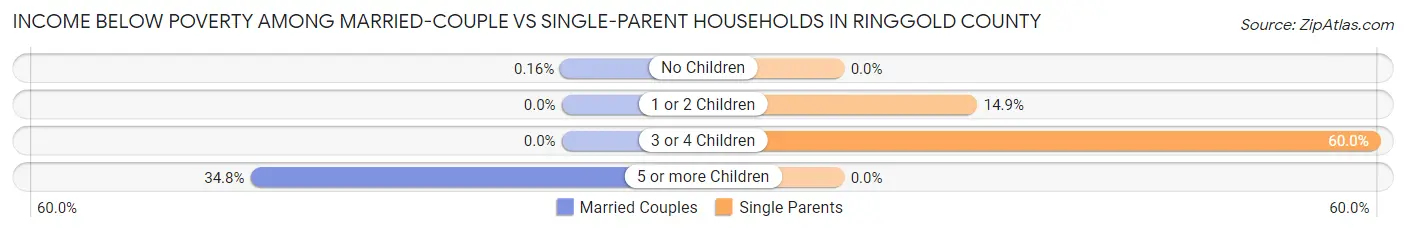
| Children | Married-Couple Families | Single-Parent Households |
| No Children | 1 (0.2%) | 0 (0.0%) |
| 1 or 2 Children | 0 (0.0%) | 18 (14.9%) |
| 3 or 4 Children | 0 (0.0%) | 18 (60.0%) |
| 5 or more Children | 8 (34.8%) | 0 (0.0%) |
| Total | 9 (0.9%) | 36 (18.1%) |
Race in Ringgold County
The most populous races in Ringgold County are White / Caucasian (4,459 | 95.1%), Hispanic or Latino (136 | 2.9%), and Two or more Races (129 | 2.8%).
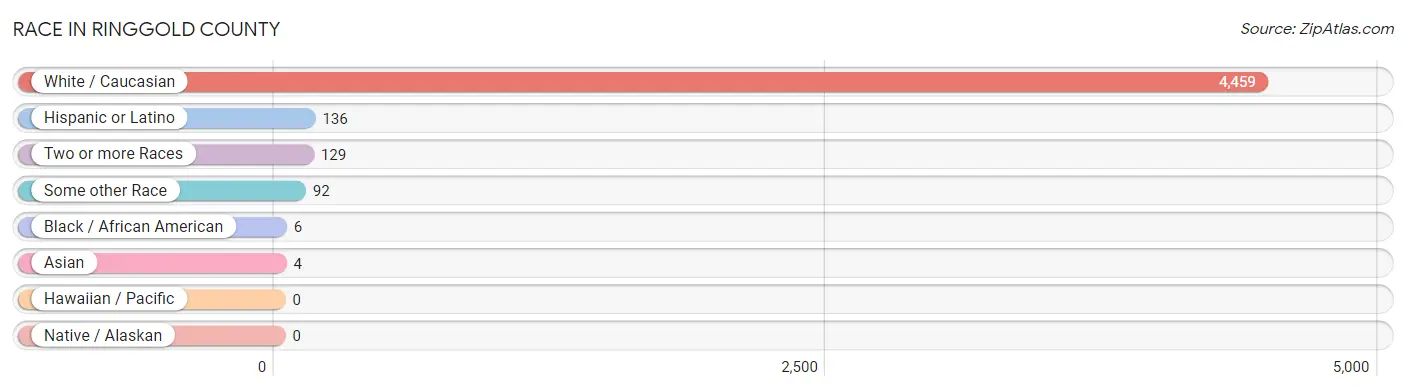
| Race | # Population | % Population |
| Asian | 4 | 0.1% |
| Black / African American | 6 | 0.1% |
| Hawaiian / Pacific | 0 | 0.0% |
| Hispanic or Latino | 136 | 2.9% |
| Native / Alaskan | 0 | 0.0% |
| White / Caucasian | 4,459 | 95.1% |
| Two or more Races | 129 | 2.8% |
| Some other Race | 92 | 2.0% |
| Total | 4,690 | 100.0% |
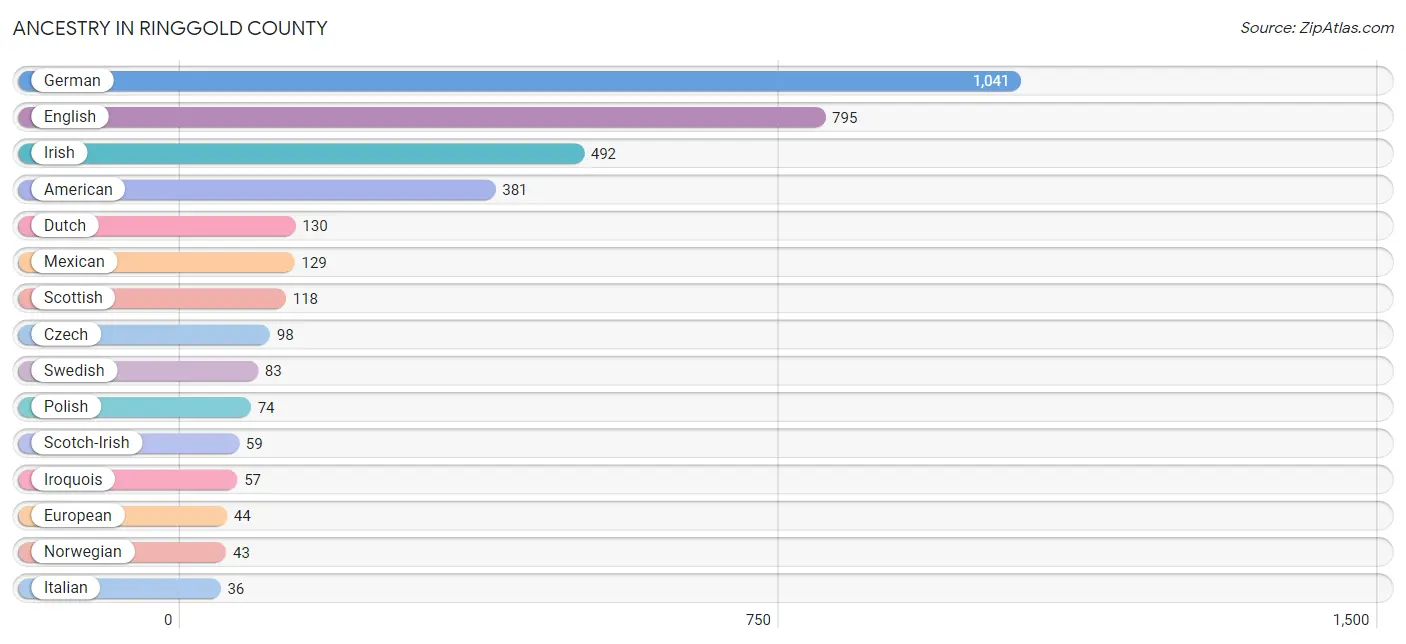
Ancestry in Ringgold County
The most populous ancestries reported in Ringgold County are German (1,041 | 22.2%), English (795 | 17.0%), Irish (492 | 10.5%), American (381 | 8.1%), and Dutch (130 | 2.8%), together accounting for 60.5% of all Ringgold County residents.
| Ancestry | # Population | % Population |
| American | 381 | 8.1% |
| Arab | 6 | 0.1% |
| Austrian | 4 | 0.1% |
| Belgian | 11 | 0.2% |
| British | 5 | 0.1% |
| Canadian | 4 | 0.1% |
| Cherokee | 25 | 0.5% |
| Choctaw | 13 | 0.3% |
| Czech | 98 | 2.1% |
| Czechoslovakian | 3 | 0.1% |
| Danish | 24 | 0.5% |
| Dutch | 130 | 2.8% |
| Eastern European | 13 | 0.3% |
| English | 795 | 17.0% |
| European | 44 | 0.9% |
| French | 35 | 0.7% |
| French Canadian | 7 | 0.2% |
| German | 1,041 | 22.2% |
| Greek | 6 | 0.1% |
| Irish | 492 | 10.5% |
| Iroquois | 57 | 1.2% |
| Italian | 36 | 0.8% |
| Korean | 18 | 0.4% |
| Lebanese | 6 | 0.1% |
| Mexican | 129 | 2.8% |
| Northern European | 2 | 0.0% |
| Norwegian | 43 | 0.9% |
| Pennsylvania German | 3 | 0.1% |
| Polish | 74 | 1.6% |
| Puerto Rican | 4 | 0.1% |
| Russian | 22 | 0.5% |
| Scandinavian | 29 | 0.6% |
| Scotch-Irish | 59 | 1.3% |
| Scottish | 118 | 2.5% |
| Spaniard | 3 | 0.1% |
| Swedish | 83 | 1.8% |
| Ukrainian | 6 | 0.1% |
| Welsh | 17 | 0.4% | View All 38 Rows |
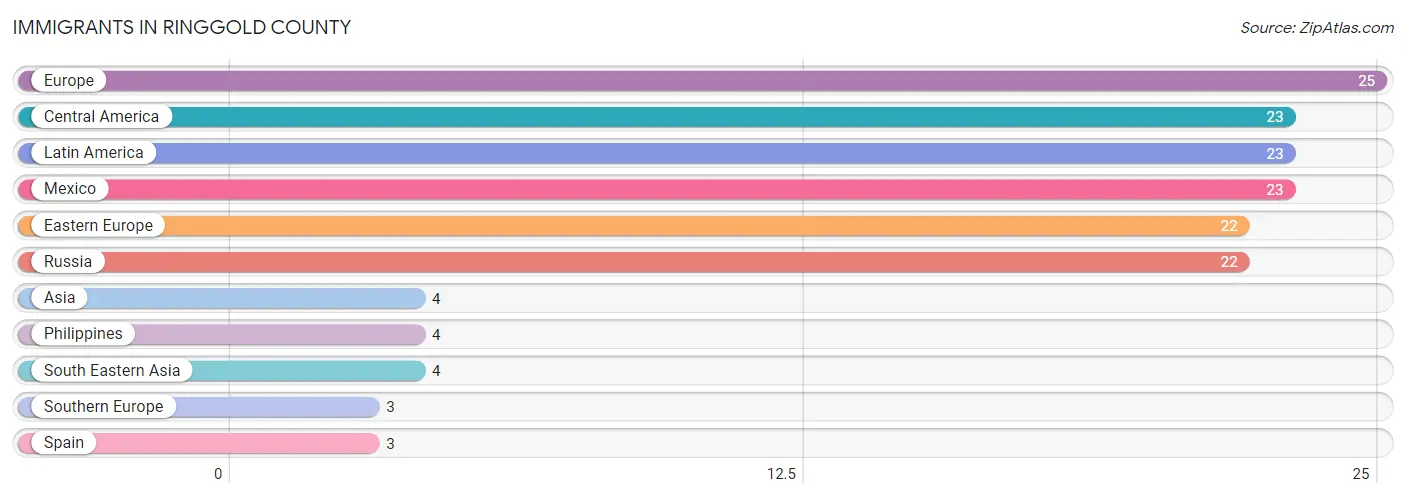
Immigrants in Ringgold County
The most numerous immigrant groups reported in Ringgold County came from Europe (25 | 0.5%), Central America (23 | 0.5%), Latin America (23 | 0.5%), Mexico (23 | 0.5%), and Eastern Europe (22 | 0.5%), together accounting for 2.5% of all Ringgold County residents.
| Immigration Origin | # Population | % Population |
| Asia | 4 | 0.1% |
| Central America | 23 | 0.5% |
| Eastern Europe | 22 | 0.5% |
| Europe | 25 | 0.5% |
| Latin America | 23 | 0.5% |
| Mexico | 23 | 0.5% |
| Philippines | 4 | 0.1% |
| Russia | 22 | 0.5% |
| South Eastern Asia | 4 | 0.1% |
| Southern Europe | 3 | 0.1% |
| Spain | 3 | 0.1% | View All 11 Rows |
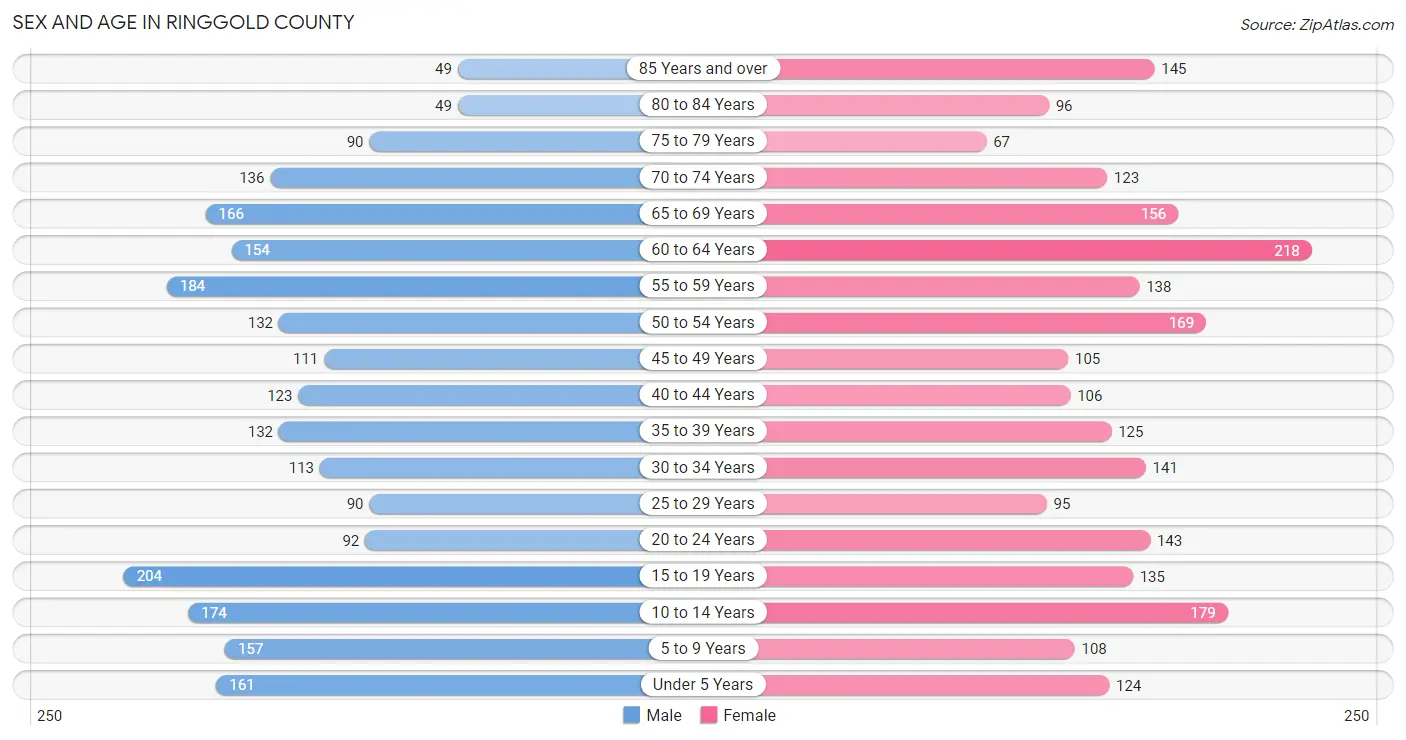
Sex and Age in Ringgold County
Sex and Age in Ringgold County
The most populous age groups in Ringgold County are 15 to 19 Years (204 | 8.8%) for men and 60 to 64 Years (218 | 9.2%) for women.
| Age Bracket | Male | Female |
| Under 5 Years | 161 (7.0%) | 124 (5.2%) |
| 5 to 9 Years | 157 (6.8%) | 108 (4.5%) |
| 10 to 14 Years | 174 (7.5%) | 179 (7.5%) |
| 15 to 19 Years | 204 (8.8%) | 135 (5.7%) |
| 20 to 24 Years | 92 (4.0%) | 143 (6.0%) |
| 25 to 29 Years | 90 (3.9%) | 95 (4.0%) |
| 30 to 34 Years | 113 (4.9%) | 141 (5.9%) |
| 35 to 39 Years | 132 (5.7%) | 125 (5.3%) |
| 40 to 44 Years | 123 (5.3%) | 106 (4.5%) |
| 45 to 49 Years | 111 (4.8%) | 105 (4.4%) |
| 50 to 54 Years | 132 (5.7%) | 169 (7.1%) |
| 55 to 59 Years | 184 (7.9%) | 138 (5.8%) |
| 60 to 64 Years | 154 (6.7%) | 218 (9.2%) |
| 65 to 69 Years | 166 (7.2%) | 156 (6.6%) |
| 70 to 74 Years | 136 (5.9%) | 123 (5.2%) |
| 75 to 79 Years | 90 (3.9%) | 67 (2.8%) |
| 80 to 84 Years | 49 (2.1%) | 96 (4.1%) |
| 85 Years and over | 49 (2.1%) | 145 (6.1%) |
| Total | 2,317 (100.0%) | 2,373 (100.0%) |
Families and Households in Ringgold County
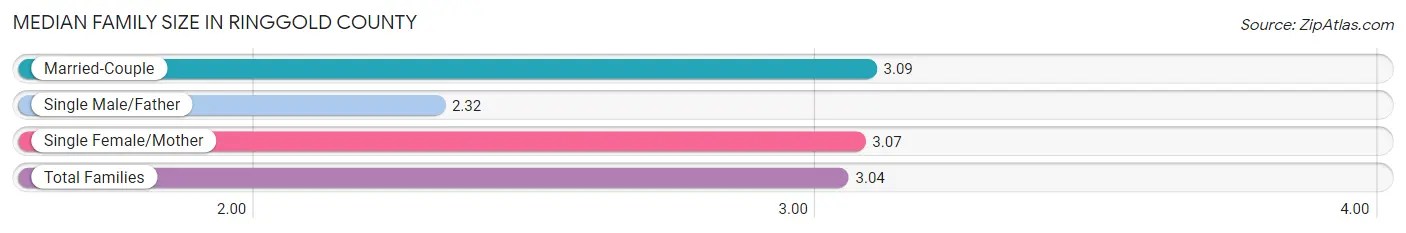
Median Family Size in Ringgold County
The median family size in Ringgold County is 3.04 persons per family, with married-couple families (1,001 | 83.4%) accounting for the largest median family size of 3.09 persons per family. On the other hand, single male/father families (87 | 7.2%) represent the smallest median family size with 2.32 persons per family.
| Family Type | # Families | Family Size |
| Married-Couple | 1,001 (83.4%) | 3.09 |
| Single Male/Father | 87 (7.2%) | 2.32 |
| Single Female/Mother | 112 (9.3%) | 3.07 |
| Total Families | 1,200 (100.0%) | 3.04 |
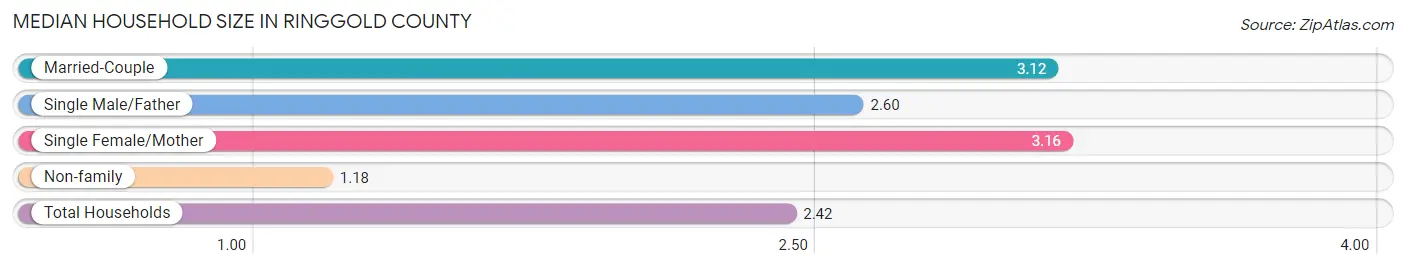
Median Household Size in Ringgold County
The median household size in Ringgold County is 2.42 persons per household, with single female/mother households (112 | 6.1%) accounting for the largest median household size of 3.16 persons per household. non-family households (644 | 34.9%) represent the smallest median household size with 1.18 persons per household.
| Household Type | # Households | Household Size |
| Married-Couple | 1,001 (54.3%) | 3.12 |
| Single Male/Father | 87 (4.7%) | 2.60 |
| Single Female/Mother | 112 (6.1%) | 3.16 |
| Non-family | 644 (34.9%) | 1.18 |
| Total Households | 1,844 (100.0%) | 2.42 |
Household Size by Marriage Status in Ringgold County
Out of a total of 1,844 households in Ringgold County, 1,200 (65.1%) are family households, while 644 (34.9%) are nonfamily households. The most numerous type of family households are 2-person households, comprising 625, and the most common type of nonfamily households are 1-person households, comprising 566.
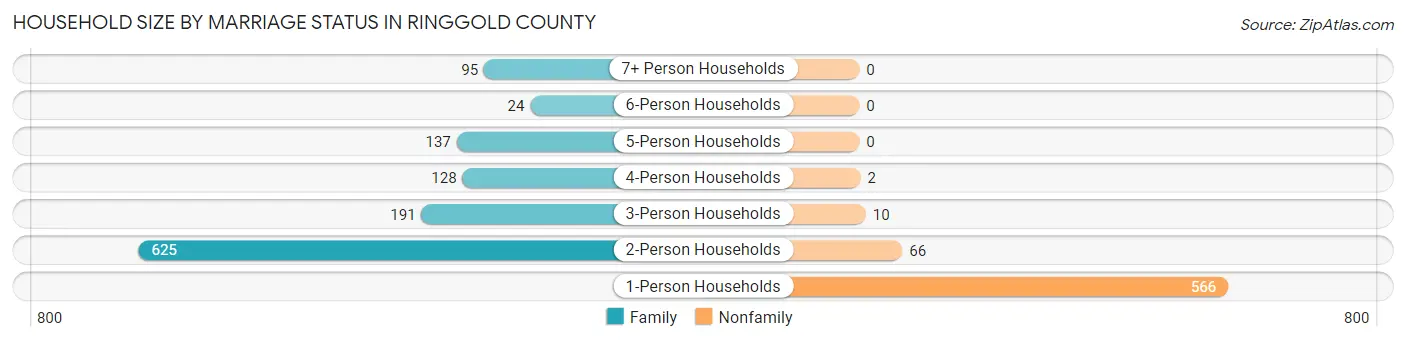
| Household Size | Family Households | Nonfamily Households |
| 1-Person Households | - | 566 (30.7%) |
| 2-Person Households | 625 (33.9%) | 66 (3.6%) |
| 3-Person Households | 191 (10.4%) | 10 (0.5%) |
| 4-Person Households | 128 (6.9%) | 2 (0.1%) |
| 5-Person Households | 137 (7.4%) | 0 (0.0%) |
| 6-Person Households | 24 (1.3%) | 0 (0.0%) |
| 7+ Person Households | 95 (5.1%) | 0 (0.0%) |
| Total | 1,200 (65.1%) | 644 (34.9%) |
Female Fertility in Ringgold County
Fertility by Age in Ringgold County
Average fertility rate in Ringgold County is 69.0 births per 1,000 women. Women in the age bracket of 20 to 34 years have the highest fertility rate with 129.0 births per 1,000 women. Women in the age bracket of 20 to 34 years acount for 81.7% of all women with births.
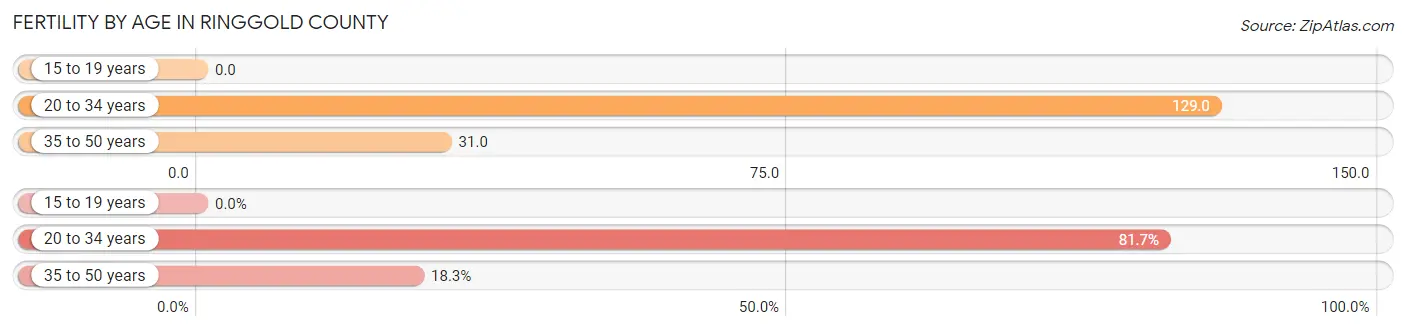
| Age Bracket | Women with Births | Births / 1,000 Women |
| 15 to 19 years | 0 (0.0%) | 0.0 |
| 20 to 34 years | 49 (81.7%) | 129.0 |
| 35 to 50 years | 11 (18.3%) | 31.0 |
| Total | 60 (100.0%) | 69.0 |
Fertility by Age by Marriage Status in Ringgold County
83.3% of women with births (60) in Ringgold County are married. The highest percentage of unmarried women with births falls into 20 to 34 years age bracket with 20.4% of them unmarried at the time of birth, while the lowest percentage of unmarried women with births belong to 35 to 50 years age bracket with 0.0% of them unmarried.
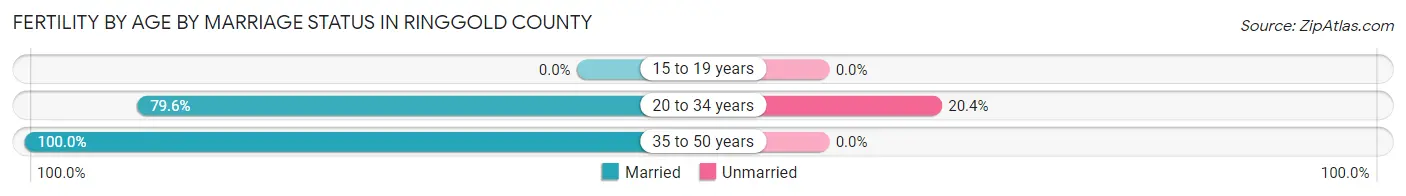
| Age Bracket | Married | Unmarried |
| 15 to 19 years | 0 (0.0%) | 0 (0.0%) |
| 20 to 34 years | 39 (79.6%) | 10 (20.4%) |
| 35 to 50 years | 11 (100.0%) | 0 (0.0%) |
| Total | 50 (83.3%) | 10 (16.7%) |
Fertility by Education in Ringgold County
Average fertility rate in Ringgold County is 69.0 births per 1,000 women. Women with the education attainment of graduate degree have the highest fertility rate of 333.0 births per 1,000 women, while women with the education attainment of less than high school have the lowest fertility at 34.0 births per 1,000 women. Women with the education attainment of college or associate's degree represent 38.3% of all women with births.
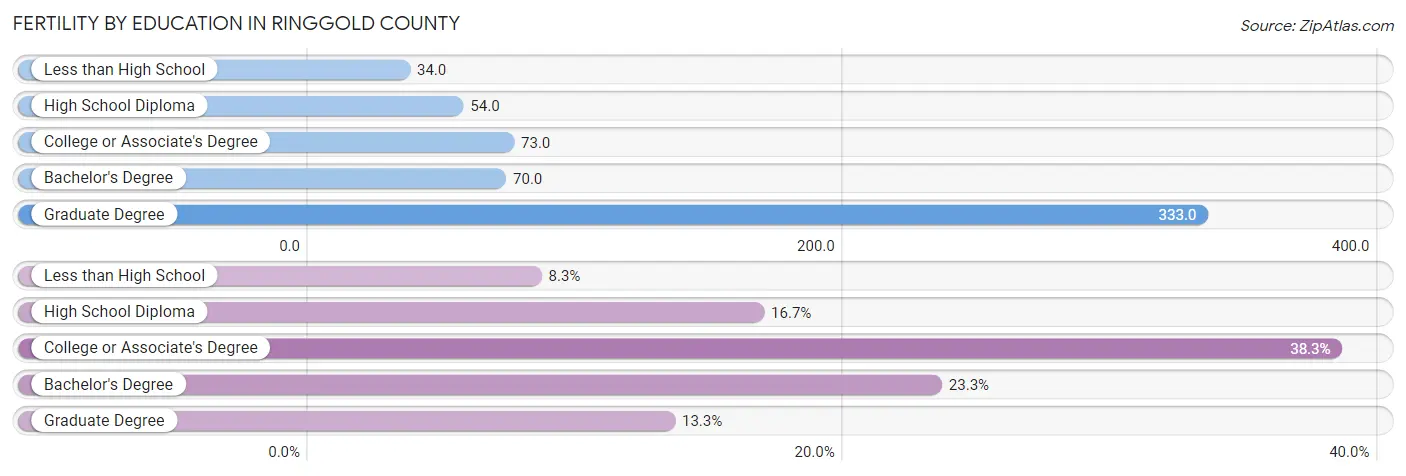
| Educational Attainment | Women with Births | Births / 1,000 Women |
| Less than High School | 5 (8.3%) | 34.0 |
| High School Diploma | 10 (16.7%) | 54.0 |
| College or Associate's Degree | 23 (38.3%) | 73.0 |
| Bachelor's Degree | 14 (23.3%) | 70.0 |
| Graduate Degree | 8 (13.3%) | 333.0 |
| Total | 60 (100.0%) | 69.0 |
Fertility by Education by Marriage Status in Ringgold County
16.7% of women with births in Ringgold County are unmarried. Women with the educational attainment of high school diploma are most likely to be married with 100.0% of them married at childbirth, while women with the educational attainment of less than high school are least likely to be married with 100.0% of them unmarried at childbirth.
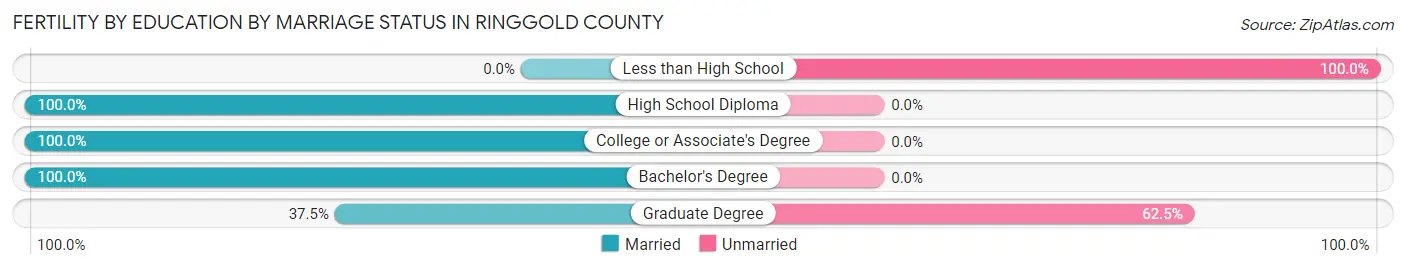
| Educational Attainment | Married | Unmarried |
| Less than High School | 0 (0.0%) | 5 (100.0%) |
| High School Diploma | 10 (100.0%) | 0 (0.0%) |
| College or Associate's Degree | 23 (100.0%) | 0 (0.0%) |
| Bachelor's Degree | 14 (100.0%) | 0 (0.0%) |
| Graduate Degree | 3 (37.5%) | 5 (62.5%) |
| Total | 50 (83.3%) | 10 (16.7%) |
Employment Characteristics in Ringgold County
Employment by Class of Employer in Ringgold County
Among the 2,269 employed individuals in Ringgold County, private company employees (1,149 | 50.6%), self-employed (not incorporated) (401 | 17.7%), and not-for-profit organizations (246 | 10.8%) make up the most common classes of employment.
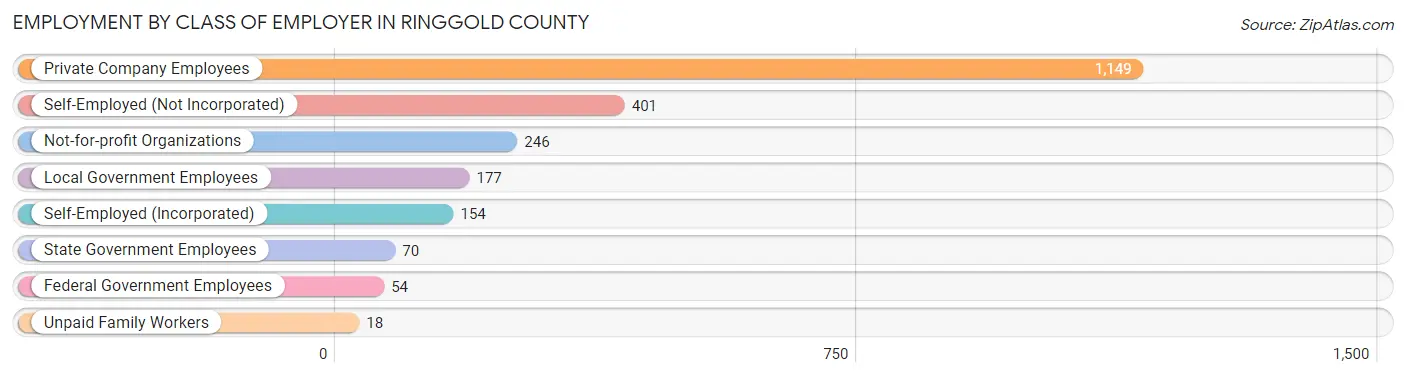
| Employer Class | # Employees | % Employees |
| Private Company Employees | 1,149 | 50.6% |
| Self-Employed (Incorporated) | 154 | 6.8% |
| Self-Employed (Not Incorporated) | 401 | 17.7% |
| Not-for-profit Organizations | 246 | 10.8% |
| Local Government Employees | 177 | 7.8% |
| State Government Employees | 70 | 3.1% |
| Federal Government Employees | 54 | 2.4% |
| Unpaid Family Workers | 18 | 0.8% |
| Total | 2,269 | 100.0% |
Employment Status by Age in Ringgold County
According to the labor force statistics for Ringgold County, out of the total population over 16 years of age (3,704), 62.9% or 2,330 individuals are in the labor force, with 1.7% or 40 of them unemployed. The age group with the highest labor force participation rate is 35 to 44 years, with 92.0% or 447 individuals in the labor force. Within the labor force, the 45 to 54 years age range has the highest percentage of unemployed individuals, with 3.9% or 18 of them being unemployed.
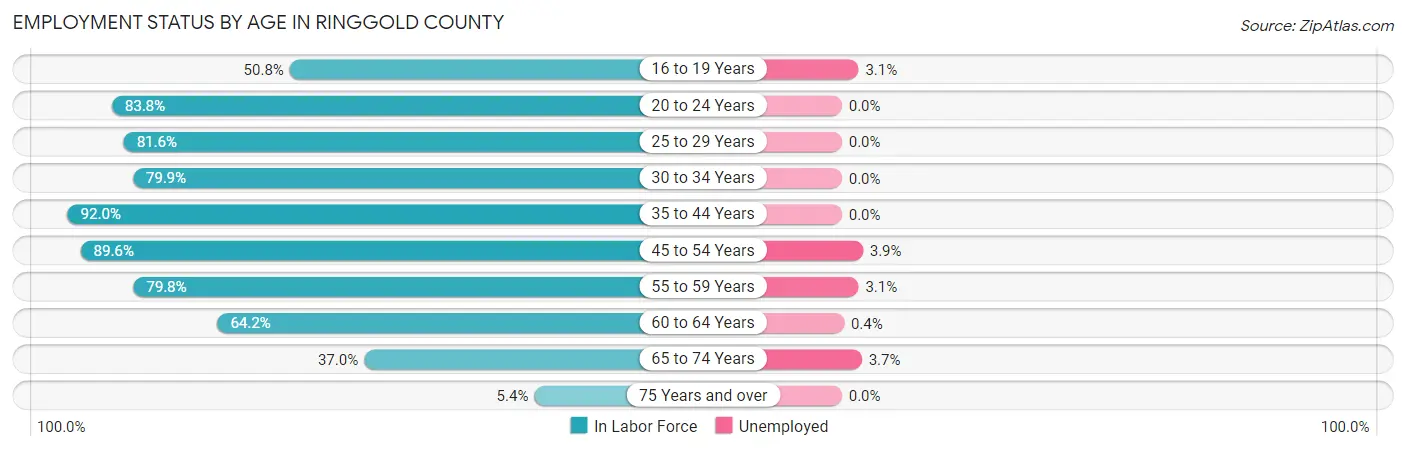
| Age Bracket | In Labor Force | Unemployed |
| 16 to 19 Years | 130 (50.8%) | 4 (3.1%) |
| 20 to 24 Years | 197 (83.8%) | 0 (0.0%) |
| 25 to 29 Years | 151 (81.6%) | 0 (0.0%) |
| 30 to 34 Years | 203 (79.9%) | 0 (0.0%) |
| 35 to 44 Years | 447 (92.0%) | 0 (0.0%) |
| 45 to 54 Years | 463 (89.6%) | 18 (3.9%) |
| 55 to 59 Years | 257 (79.8%) | 8 (3.1%) |
| 60 to 64 Years | 239 (64.2%) | 1 (0.4%) |
| 65 to 74 Years | 215 (37.0%) | 8 (3.7%) |
| 75 Years and over | 27 (5.4%) | 0 (0.0%) |
| Total | 2,330 (62.9%) | 40 (1.7%) |
Employment Status by Educational Attainment in Ringgold County
According to labor force statistics for Ringgold County, 82.4% of individuals (1,760) out of the total population between 25 and 64 years of age (2,136) are in the labor force, with 1.5% or 26 of them being unemployed. The group with the highest labor force participation rate are those with the educational attainment of bachelor's degree or higher, with 89.3% or 477 individuals in the labor force. Within the labor force, individuals with high school diploma education have the highest percentage of unemployment, with 3.6% or 20 of them being unemployed.
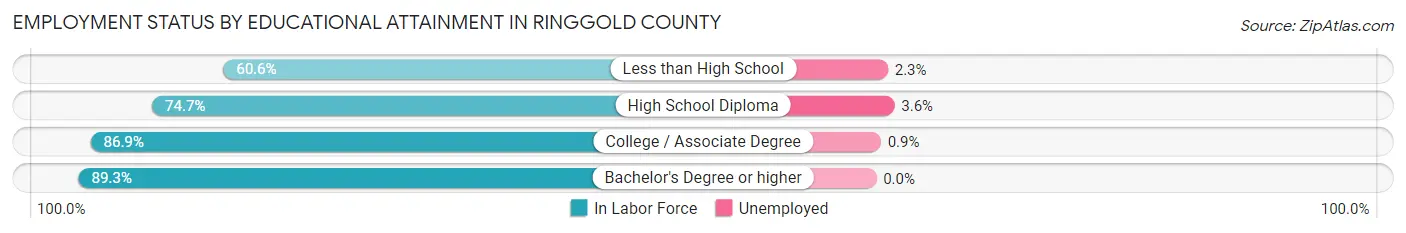
| Educational Attainment | In Labor Force | Unemployed |
| Less than High School | 43 (60.6%) | 2 (2.3%) |
| High School Diploma | 555 (74.7%) | 27 (3.6%) |
| College / Associate Degree | 685 (86.9%) | 7 (0.9%) |
| Bachelor's Degree or higher | 477 (89.3%) | 0 (0.0%) |
| Total | 1,760 (82.4%) | 32 (1.5%) |
Employment Occupations by Sex in Ringgold County
Management, Business, Science and Arts Occupations
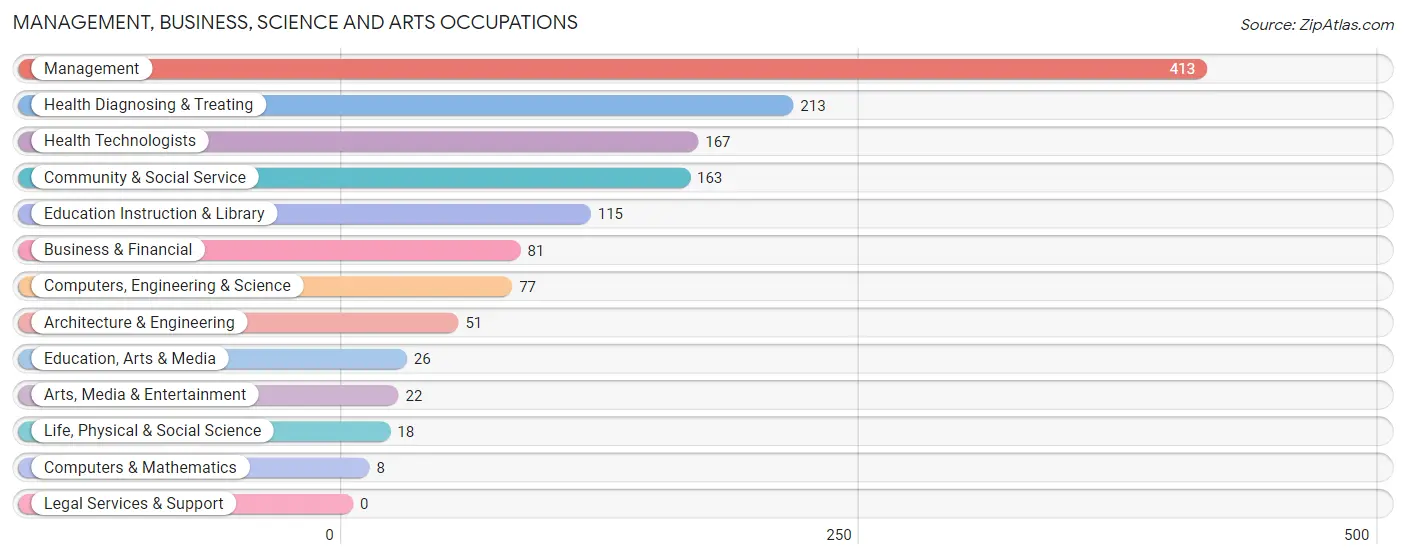
The most common Management, Business, Science and Arts occupations in Ringgold County are Management (413 | 18.1%), Health Diagnosing & Treating (213 | 9.4%), Health Technologists (167 | 7.3%), Community & Social Service (163 | 7.2%), and Education Instruction & Library (115 | 5.1%).
Management, Business, Science and Arts Occupations by Sex
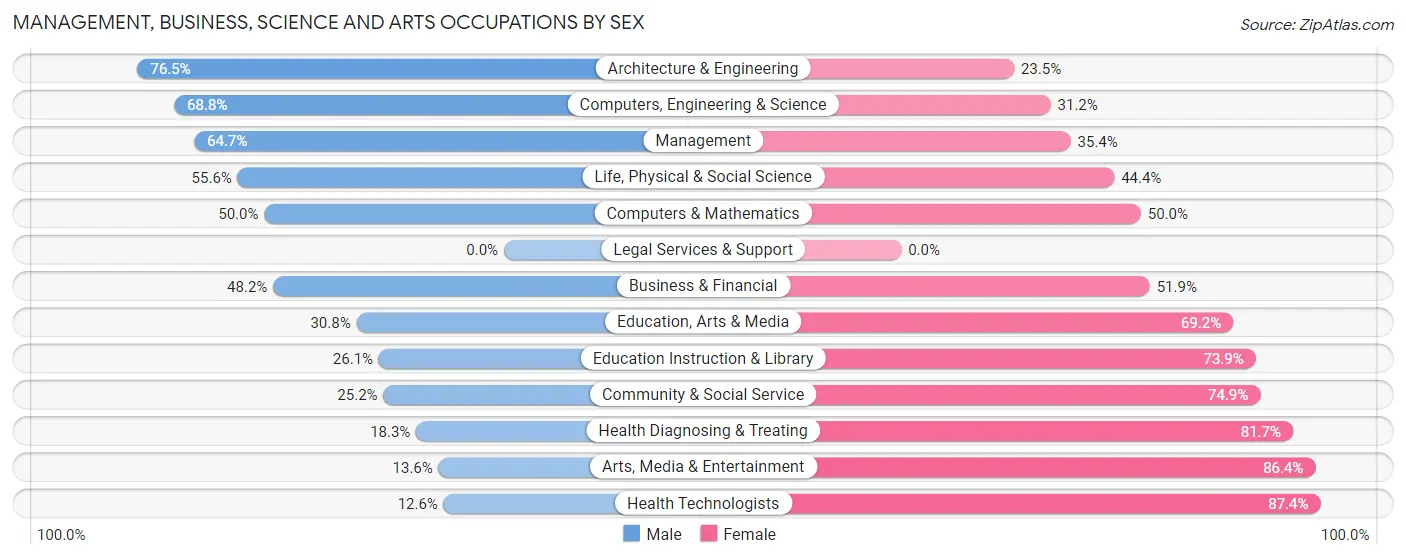
Within the Management, Business, Science and Arts occupations in Ringgold County, the most male-oriented occupations are Architecture & Engineering (76.5%), Computers, Engineering & Science (68.8%), and Management (64.6%), while the most female-oriented occupations are Health Technologists (87.4%), Arts, Media & Entertainment (86.4%), and Health Diagnosing & Treating (81.7%).
| Occupation | Male | Female |
| Management | 267 (64.6%) | 146 (35.3%) |
| Business & Financial | 39 (48.1%) | 42 (51.8%) |
| Computers, Engineering & Science | 53 (68.8%) | 24 (31.2%) |
| Computers & Mathematics | 4 (50.0%) | 4 (50.0%) |
| Architecture & Engineering | 39 (76.5%) | 12 (23.5%) |
| Life, Physical & Social Science | 10 (55.6%) | 8 (44.4%) |
| Community & Social Service | 41 (25.2%) | 122 (74.9%) |
| Education, Arts & Media | 8 (30.8%) | 18 (69.2%) |
| Legal Services & Support | 0 (0.0%) | 0 (0.0%) |
| Education Instruction & Library | 30 (26.1%) | 85 (73.9%) |
| Arts, Media & Entertainment | 3 (13.6%) | 19 (86.4%) |
| Health Diagnosing & Treating | 39 (18.3%) | 174 (81.7%) |
| Health Technologists | 21 (12.6%) | 146 (87.4%) |
| Total (Category) | 439 (46.4%) | 508 (53.6%) |
| Total (Overall) | 1,191 (52.3%) | 1,085 (47.7%) |
Services Occupations
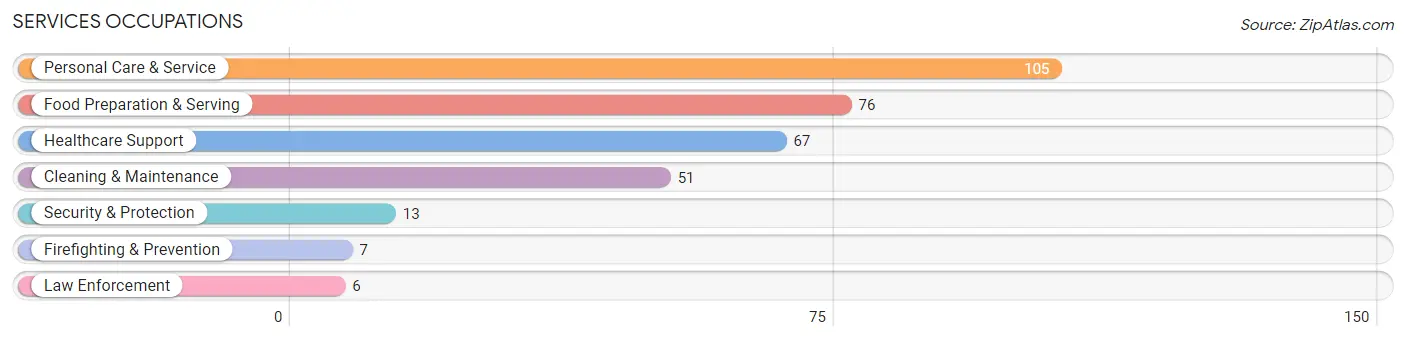
The most common Services occupations in Ringgold County are Personal Care & Service (105 | 4.6%), Food Preparation & Serving (76 | 3.3%), Healthcare Support (67 | 2.9%), Cleaning & Maintenance (51 | 2.2%), and Security & Protection (13 | 0.6%).
Services Occupations by Sex
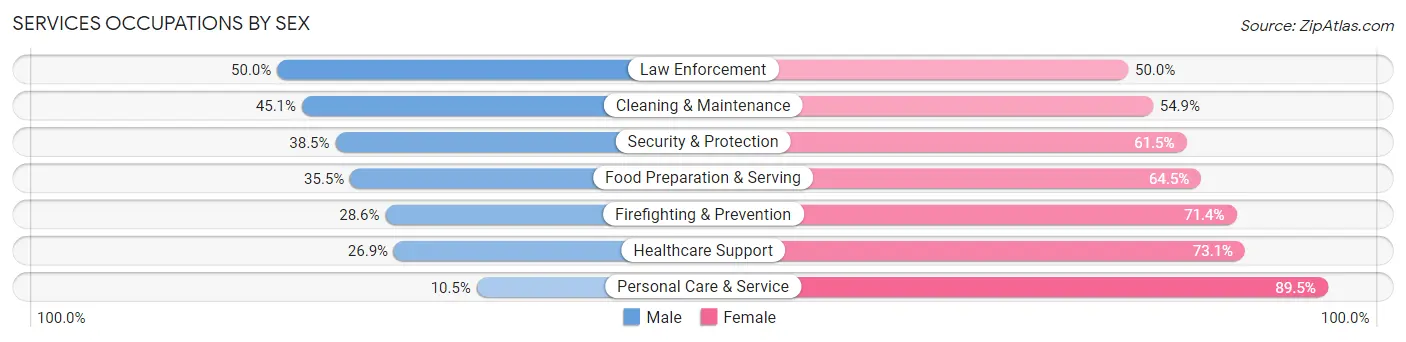
Within the Services occupations in Ringgold County, the most male-oriented occupations are Law Enforcement (50.0%), Cleaning & Maintenance (45.1%), and Security & Protection (38.5%), while the most female-oriented occupations are Personal Care & Service (89.5%), Healthcare Support (73.1%), and Firefighting & Prevention (71.4%).
| Occupation | Male | Female |
| Healthcare Support | 18 (26.9%) | 49 (73.1%) |
| Security & Protection | 5 (38.5%) | 8 (61.5%) |
| Firefighting & Prevention | 2 (28.6%) | 5 (71.4%) |
| Law Enforcement | 3 (50.0%) | 3 (50.0%) |
| Food Preparation & Serving | 27 (35.5%) | 49 (64.5%) |
| Cleaning & Maintenance | 23 (45.1%) | 28 (54.9%) |
| Personal Care & Service | 11 (10.5%) | 94 (89.5%) |
| Total (Category) | 84 (26.9%) | 228 (73.1%) |
| Total (Overall) | 1,191 (52.3%) | 1,085 (47.7%) |
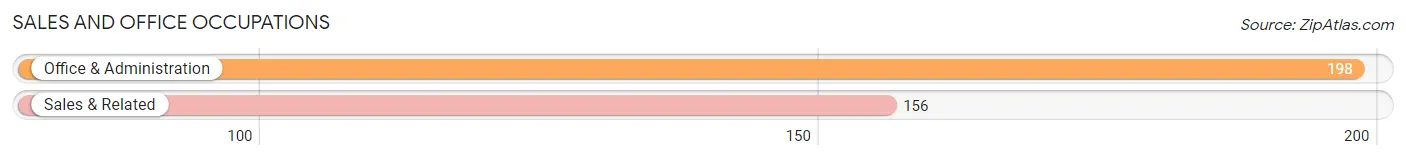
Sales and Office Occupations
The most common Sales and Office occupations in Ringgold County are Office & Administration (198 | 8.7%), and Sales & Related (156 | 6.9%).
Sales and Office Occupations by Sex
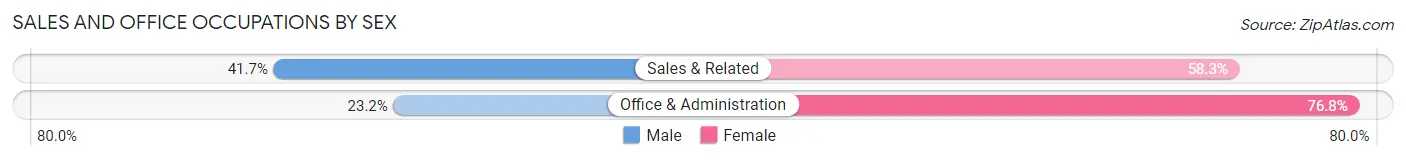
| Occupation | Male | Female |
| Sales & Related | 65 (41.7%) | 91 (58.3%) |
| Office & Administration | 46 (23.2%) | 152 (76.8%) |
| Total (Category) | 111 (31.4%) | 243 (68.6%) |
| Total (Overall) | 1,191 (52.3%) | 1,085 (47.7%) |
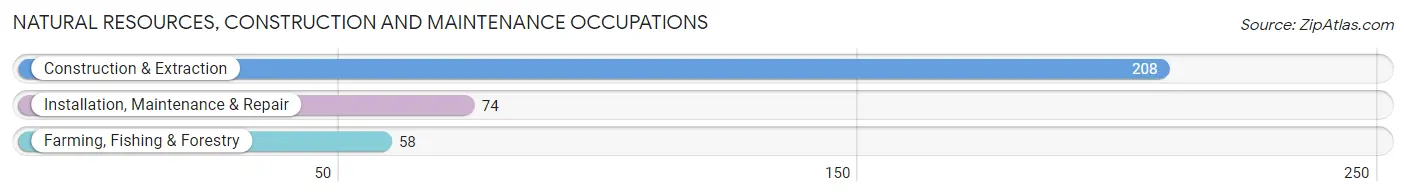
Natural Resources, Construction and Maintenance Occupations
The most common Natural Resources, Construction and Maintenance occupations in Ringgold County are Construction & Extraction (208 | 9.1%), Installation, Maintenance & Repair (74 | 3.3%), and Farming, Fishing & Forestry (58 | 2.5%).
Natural Resources, Construction and Maintenance Occupations by Sex
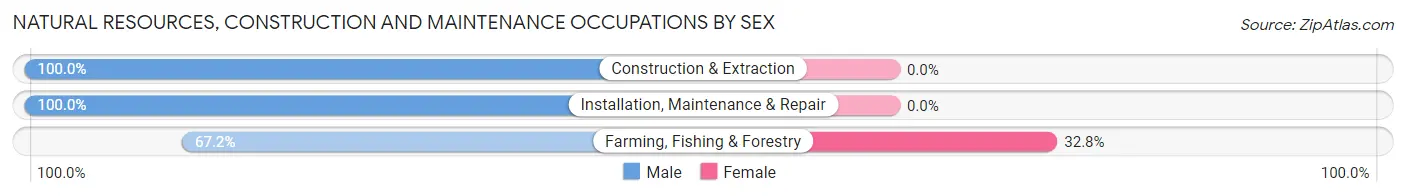
| Occupation | Male | Female |
| Farming, Fishing & Forestry | 39 (67.2%) | 19 (32.8%) |
| Construction & Extraction | 208 (100.0%) | 0 (0.0%) |
| Installation, Maintenance & Repair | 74 (100.0%) | 0 (0.0%) |
| Total (Category) | 321 (94.4%) | 19 (5.6%) |
| Total (Overall) | 1,191 (52.3%) | 1,085 (47.7%) |
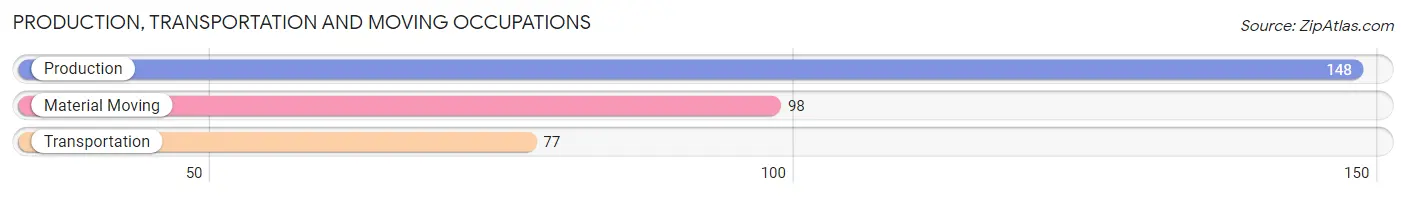
Production, Transportation and Moving Occupations
The most common Production, Transportation and Moving occupations in Ringgold County are Production (148 | 6.5%), Material Moving (98 | 4.3%), and Transportation (77 | 3.4%).
Production, Transportation and Moving Occupations by Sex
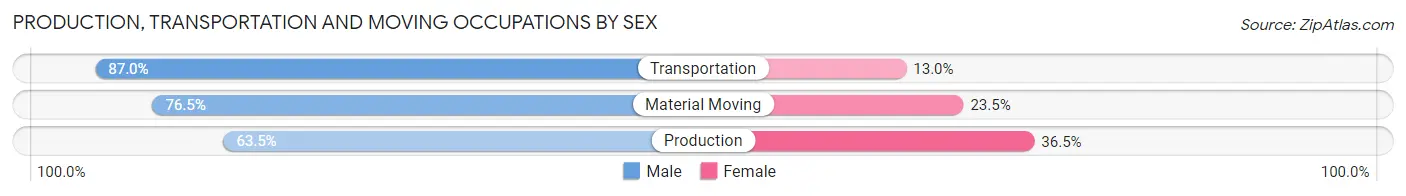
| Occupation | Male | Female |
| Production | 94 (63.5%) | 54 (36.5%) |
| Transportation | 67 (87.0%) | 10 (13.0%) |
| Material Moving | 75 (76.5%) | 23 (23.5%) |
| Total (Category) | 236 (73.1%) | 87 (26.9%) |
| Total (Overall) | 1,191 (52.3%) | 1,085 (47.7%) |
Employment Industries by Sex in Ringgold County
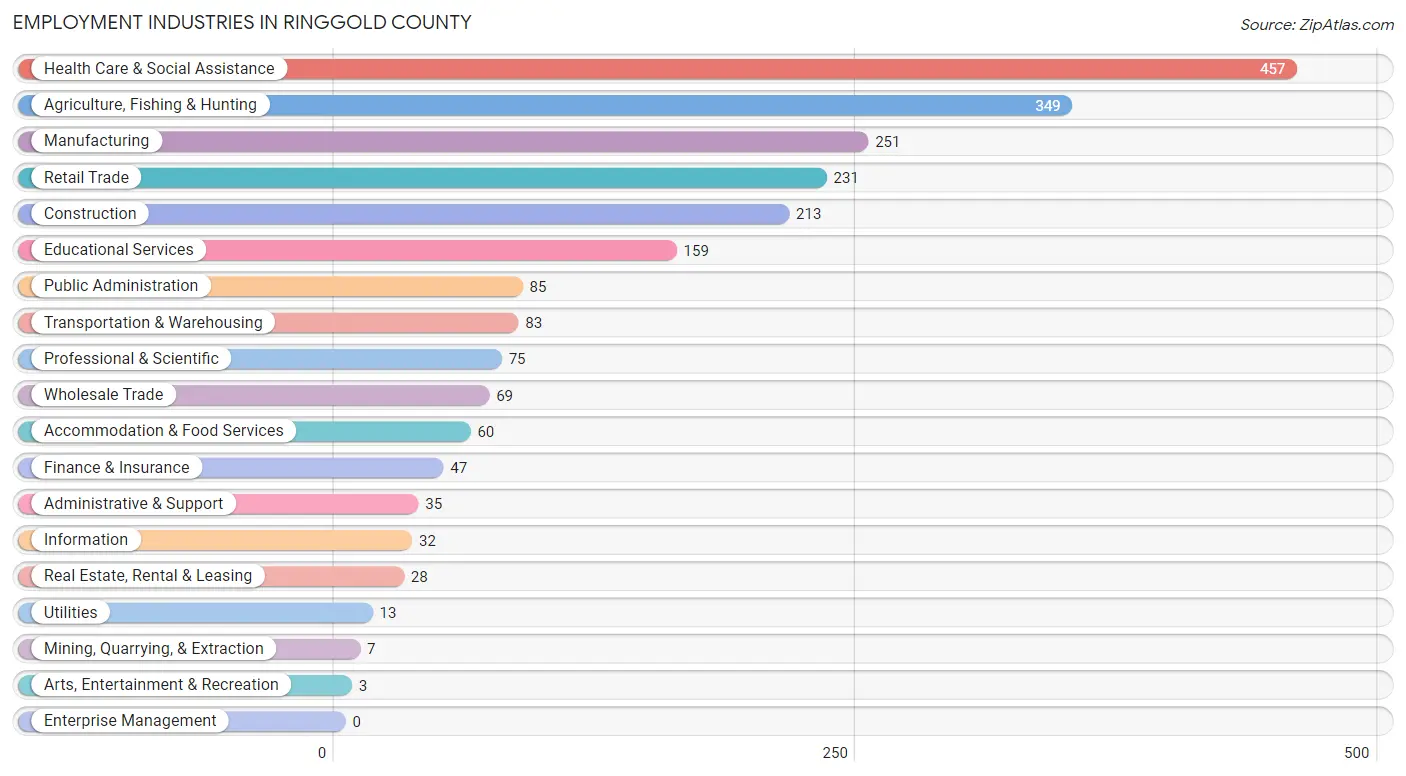
Employment Industries in Ringgold County
The major employment industries in Ringgold County include Health Care & Social Assistance (457 | 20.1%), Agriculture, Fishing & Hunting (349 | 15.3%), Manufacturing (251 | 11.0%), Retail Trade (231 | 10.2%), and Construction (213 | 9.4%).
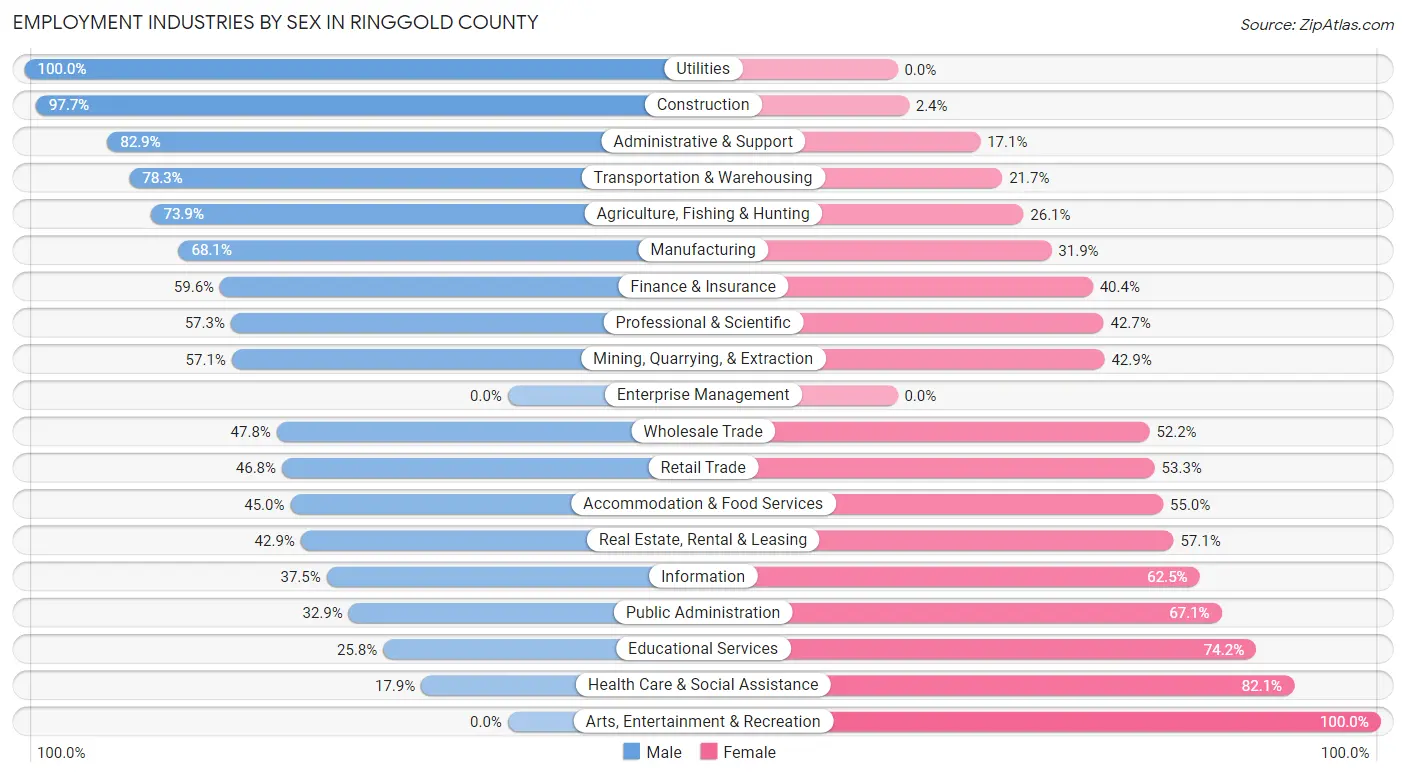
Employment Industries by Sex in Ringgold County
The Ringgold County industries that see more men than women are Utilities (100.0%), Construction (97.7%), and Administrative & Support (82.9%), whereas the industries that tend to have a higher number of women are Arts, Entertainment & Recreation (100.0%), Health Care & Social Assistance (82.1%), and Educational Services (74.2%).
| Industry | Male | Female |
| Agriculture, Fishing & Hunting | 258 (73.9%) | 91 (26.1%) |
| Mining, Quarrying, & Extraction | 4 (57.1%) | 3 (42.9%) |
| Construction | 208 (97.7%) | 5 (2.4%) |
| Manufacturing | 171 (68.1%) | 80 (31.9%) |
| Wholesale Trade | 33 (47.8%) | 36 (52.2%) |
| Retail Trade | 108 (46.8%) | 123 (53.2%) |
| Transportation & Warehousing | 65 (78.3%) | 18 (21.7%) |
| Utilities | 13 (100.0%) | 0 (0.0%) |
| Information | 12 (37.5%) | 20 (62.5%) |
| Finance & Insurance | 28 (59.6%) | 19 (40.4%) |
| Real Estate, Rental & Leasing | 12 (42.9%) | 16 (57.1%) |
| Professional & Scientific | 43 (57.3%) | 32 (42.7%) |
| Enterprise Management | 0 (0.0%) | 0 (0.0%) |
| Administrative & Support | 29 (82.9%) | 6 (17.1%) |
| Educational Services | 41 (25.8%) | 118 (74.2%) |
| Health Care & Social Assistance | 82 (17.9%) | 375 (82.1%) |
| Arts, Entertainment & Recreation | 0 (0.0%) | 3 (100.0%) |
| Accommodation & Food Services | 27 (45.0%) | 33 (55.0%) |
| Public Administration | 28 (32.9%) | 57 (67.1%) |
| Total | 1,191 (52.3%) | 1,085 (47.7%) |
Education in Ringgold County
School Enrollment in Ringgold County
The most common levels of schooling among the 1,010 students in Ringgold County are middle school (309 | 30.6%), high school (260 | 25.7%), and elementary school (147 | 14.5%).
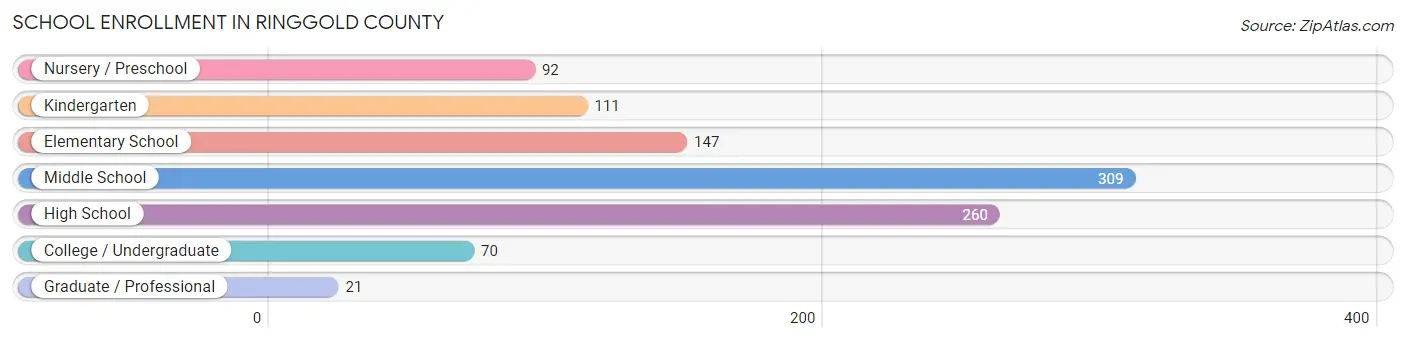
| School Level | # Students | % Students |
| Nursery / Preschool | 92 | 9.1% |
| Kindergarten | 111 | 11.0% |
| Elementary School | 147 | 14.5% |
| Middle School | 309 | 30.6% |
| High School | 260 | 25.7% |
| College / Undergraduate | 70 | 6.9% |
| Graduate / Professional | 21 | 2.1% |
| Total | 1,010 | 100.0% |
School Enrollment by Age by Funding Source in Ringgold County
Out of a total of 1,010 students who are enrolled in schools in Ringgold County, 86 (8.5%) attend a private institution, while the remaining 924 (91.5%) are enrolled in public schools. The age group of 25 to 34 year olds has the highest likelihood of being enrolled in private schools, with 14 (82.4% in the age bracket) enrolled. Conversely, the age group of 3 to 4 year olds has the lowest likelihood of being enrolled in a private school, with 91 (100.0% in the age bracket) attending a public institution.
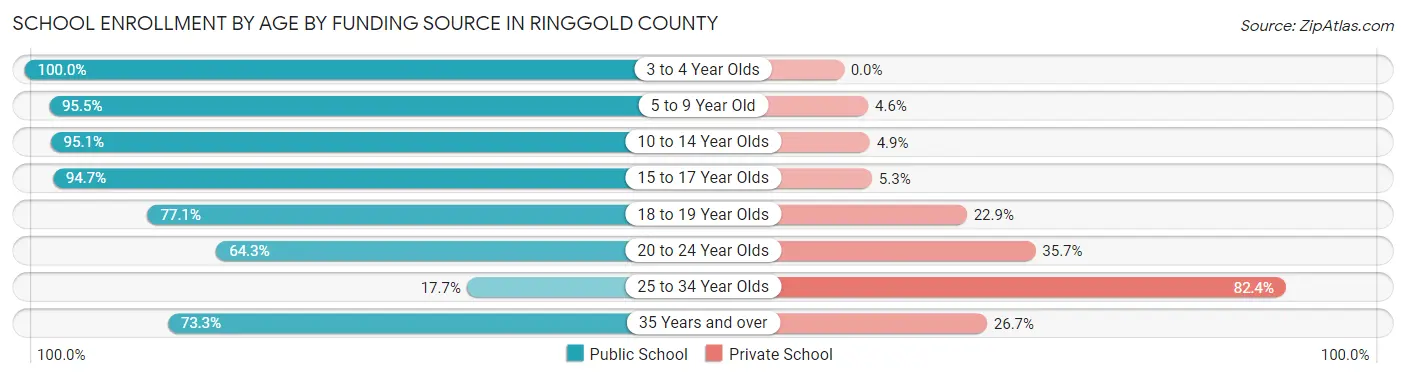
| Age Bracket | Public School | Private School |
| 3 to 4 Year Olds | 91 (100.0%) | 0 (0.0%) |
| 5 to 9 Year Old | 231 (95.5%) | 11 (4.5%) |
| 10 to 14 Year Olds | 333 (95.1%) | 17 (4.9%) |
| 15 to 17 Year Olds | 180 (94.7%) | 10 (5.3%) |
| 18 to 19 Year Olds | 37 (77.1%) | 11 (22.9%) |
| 20 to 24 Year Olds | 27 (64.3%) | 15 (35.7%) |
| 25 to 34 Year Olds | 3 (17.6%) | 14 (82.4%) |
| 35 Years and over | 22 (73.3%) | 8 (26.7%) |
| Total | 924 (91.5%) | 86 (8.5%) |
Educational Attainment by Field of Study in Ringgold County
Education (176 | 22.7%), business (143 | 18.4%), bio, nature & agricultural (115 | 14.8%), science & technology (90 | 11.6%), and visual & performing arts (47 | 6.1%) are the most common fields of study among 776 individuals in Ringgold County who have obtained a bachelor's degree or higher.
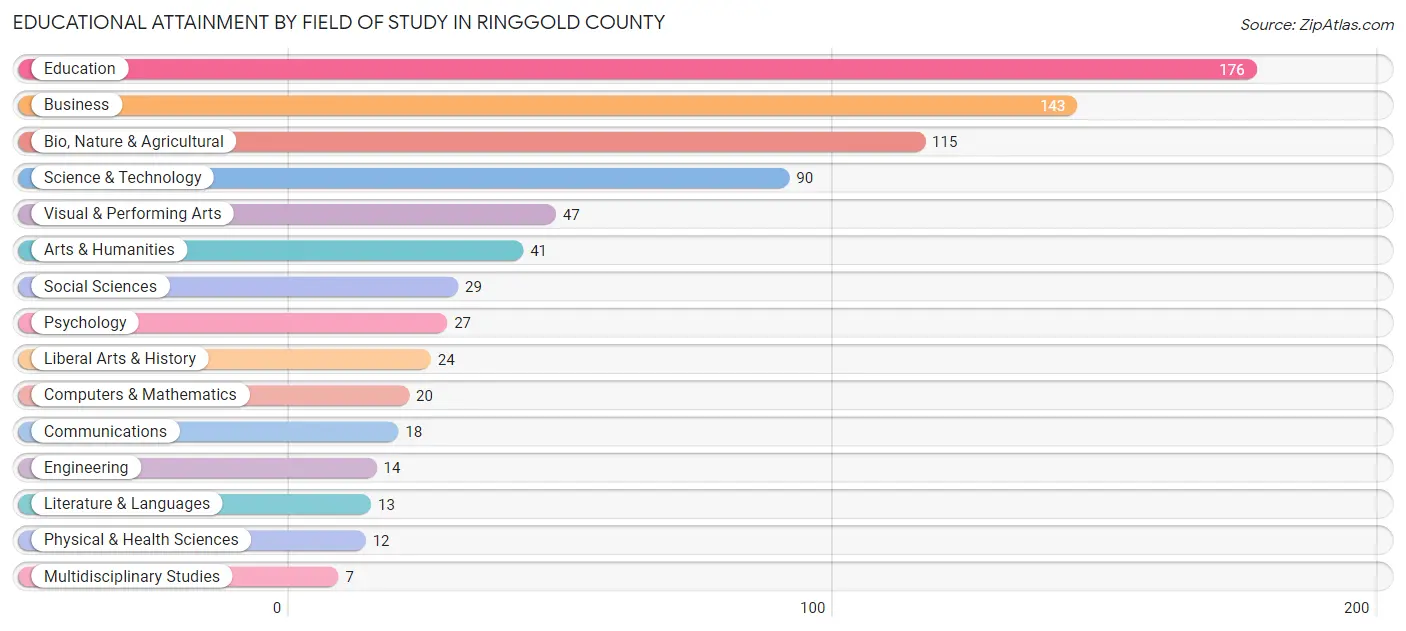
| Field of Study | # Graduates | % Graduates |
| Computers & Mathematics | 20 | 2.6% |
| Bio, Nature & Agricultural | 115 | 14.8% |
| Physical & Health Sciences | 12 | 1.5% |
| Psychology | 27 | 3.5% |
| Social Sciences | 29 | 3.7% |
| Engineering | 14 | 1.8% |
| Multidisciplinary Studies | 7 | 0.9% |
| Science & Technology | 90 | 11.6% |
| Business | 143 | 18.4% |
| Education | 176 | 22.7% |
| Literature & Languages | 13 | 1.7% |
| Liberal Arts & History | 24 | 3.1% |
| Visual & Performing Arts | 47 | 6.1% |
| Communications | 18 | 2.3% |
| Arts & Humanities | 41 | 5.3% |
| Total | 776 | 100.0% |
Transportation & Commute in Ringgold County
Vehicle Availability by Sex in Ringgold County
The most prevalent vehicle ownership categories in Ringgold County are males with 2 vehicles (387, accounting for 32.7%) and females with 2 vehicles (310, making up 35.7%).
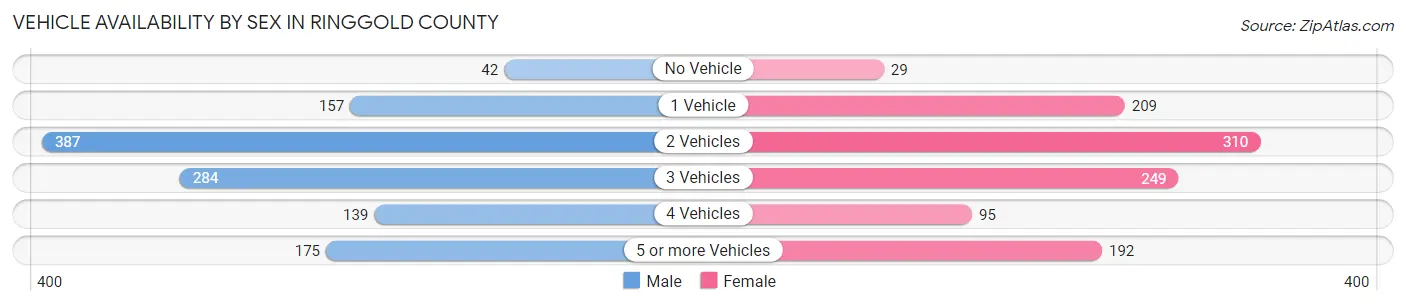
| Vehicles Available | Male | Female |
| No Vehicle | 42 (3.5%) | 29 (2.7%) |
| 1 Vehicle | 157 (13.3%) | 209 (19.3%) |
| 2 Vehicles | 387 (32.7%) | 310 (28.6%) |
| 3 Vehicles | 284 (24.0%) | 249 (23.0%) |
| 4 Vehicles | 139 (11.7%) | 95 (8.8%) |
| 5 or more Vehicles | 175 (14.8%) | 192 (17.7%) |
| Total | 1,184 (100.0%) | 1,084 (100.0%) |
Commute Time in Ringgold County
The most frequently occuring commute durations in Ringgold County are less than 5 minutes (374 commuters, 18.7%), 5 to 9 minutes (346 commuters, 17.3%), and 10 to 14 minutes (287 commuters, 14.3%).
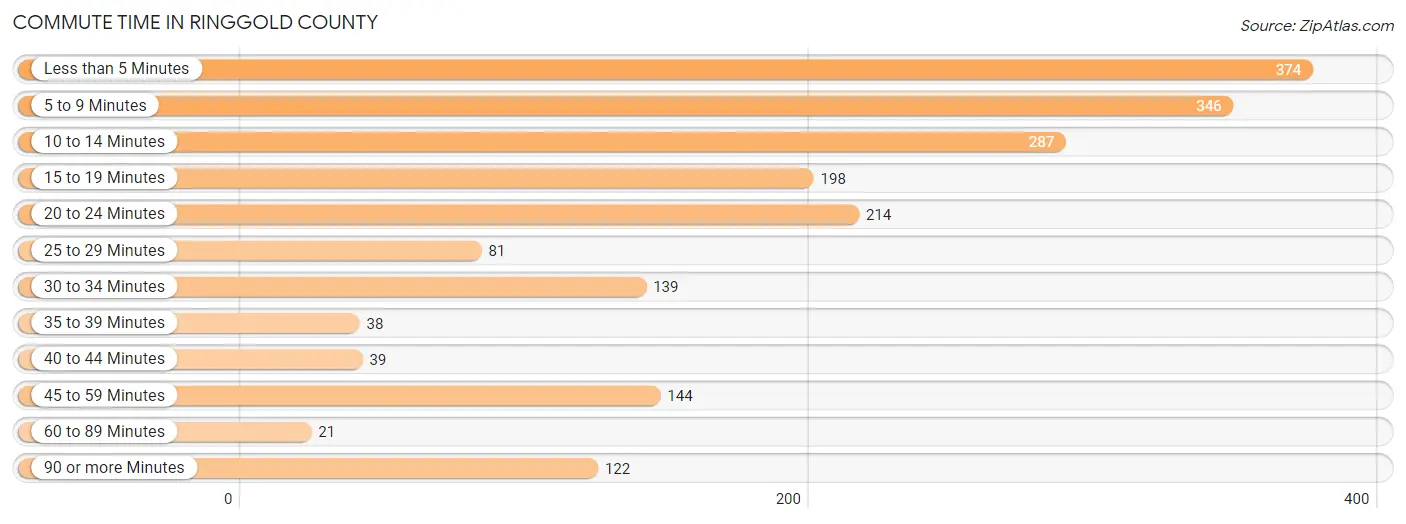
| Commute Time | # Commuters | % Commuters |
| Less than 5 Minutes | 374 | 18.7% |
| 5 to 9 Minutes | 346 | 17.3% |
| 10 to 14 Minutes | 287 | 14.3% |
| 15 to 19 Minutes | 198 | 9.9% |
| 20 to 24 Minutes | 214 | 10.7% |
| 25 to 29 Minutes | 81 | 4.0% |
| 30 to 34 Minutes | 139 | 6.9% |
| 35 to 39 Minutes | 38 | 1.9% |
| 40 to 44 Minutes | 39 | 1.9% |
| 45 to 59 Minutes | 144 | 7.2% |
| 60 to 89 Minutes | 21 | 1.1% |
| 90 or more Minutes | 122 | 6.1% |
Commute Time by Sex in Ringgold County
The most common commute times in Ringgold County are 5 to 9 minutes (176 commuters, 16.9%) for males and less than 5 minutes (207 commuters, 21.6%) for females.
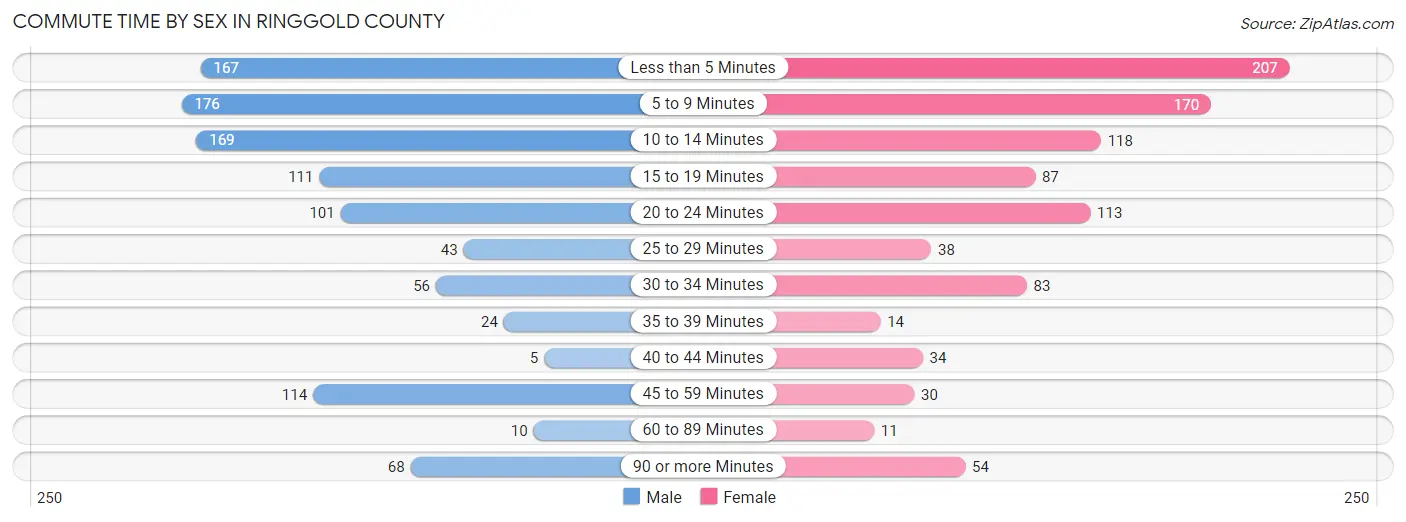
| Commute Time | Male | Female |
| Less than 5 Minutes | 167 (16.0%) | 207 (21.6%) |
| 5 to 9 Minutes | 176 (16.9%) | 170 (17.7%) |
| 10 to 14 Minutes | 169 (16.2%) | 118 (12.3%) |
| 15 to 19 Minutes | 111 (10.6%) | 87 (9.1%) |
| 20 to 24 Minutes | 101 (9.7%) | 113 (11.8%) |
| 25 to 29 Minutes | 43 (4.1%) | 38 (4.0%) |
| 30 to 34 Minutes | 56 (5.4%) | 83 (8.6%) |
| 35 to 39 Minutes | 24 (2.3%) | 14 (1.5%) |
| 40 to 44 Minutes | 5 (0.5%) | 34 (3.5%) |
| 45 to 59 Minutes | 114 (10.9%) | 30 (3.1%) |
| 60 to 89 Minutes | 10 (1.0%) | 11 (1.1%) |
| 90 or more Minutes | 68 (6.5%) | 54 (5.6%) |
Time of Departure to Work by Sex in Ringgold County
The most frequent times of departure to work in Ringgold County are 7:00 AM to 7:29 AM (235, 22.5%) for males and 7:30 AM to 7:59 AM (215, 22.4%) for females.
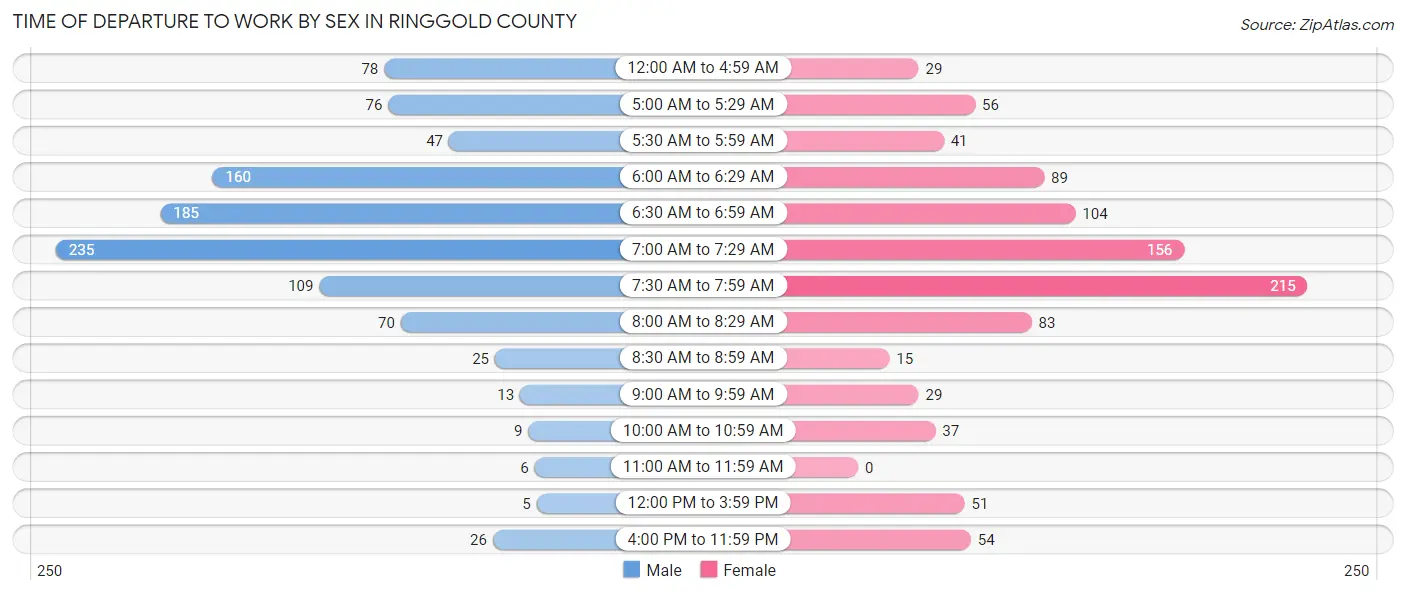
| Time of Departure | Male | Female |
| 12:00 AM to 4:59 AM | 78 (7.5%) | 29 (3.0%) |
| 5:00 AM to 5:29 AM | 76 (7.3%) | 56 (5.8%) |
| 5:30 AM to 5:59 AM | 47 (4.5%) | 41 (4.3%) |
| 6:00 AM to 6:29 AM | 160 (15.3%) | 89 (9.3%) |
| 6:30 AM to 6:59 AM | 185 (17.7%) | 104 (10.8%) |
| 7:00 AM to 7:29 AM | 235 (22.5%) | 156 (16.3%) |
| 7:30 AM to 7:59 AM | 109 (10.4%) | 215 (22.4%) |
| 8:00 AM to 8:29 AM | 70 (6.7%) | 83 (8.6%) |
| 8:30 AM to 8:59 AM | 25 (2.4%) | 15 (1.6%) |
| 9:00 AM to 9:59 AM | 13 (1.3%) | 29 (3.0%) |
| 10:00 AM to 10:59 AM | 9 (0.9%) | 37 (3.9%) |
| 11:00 AM to 11:59 AM | 6 (0.6%) | 0 (0.0%) |
| 12:00 PM to 3:59 PM | 5 (0.5%) | 51 (5.3%) |
| 4:00 PM to 11:59 PM | 26 (2.5%) | 54 (5.6%) |
| Total | 1,044 (100.0%) | 959 (100.0%) |
Housing Occupancy in Ringgold County
Occupancy by Ownership in Ringgold County
Of the total 1,844 dwellings in Ringgold County, owner-occupied units account for 1,435 (77.8%), while renter-occupied units make up 409 (22.2%).
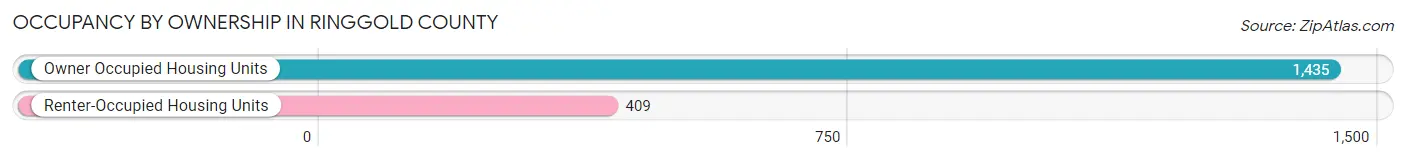
| Occupancy | # Housing Units | % Housing Units |
| Owner Occupied Housing Units | 1,435 | 77.8% |
| Renter-Occupied Housing Units | 409 | 22.2% |
| Total Occupied Housing Units | 1,844 | 100.0% |
Occupancy by Household Size in Ringgold County
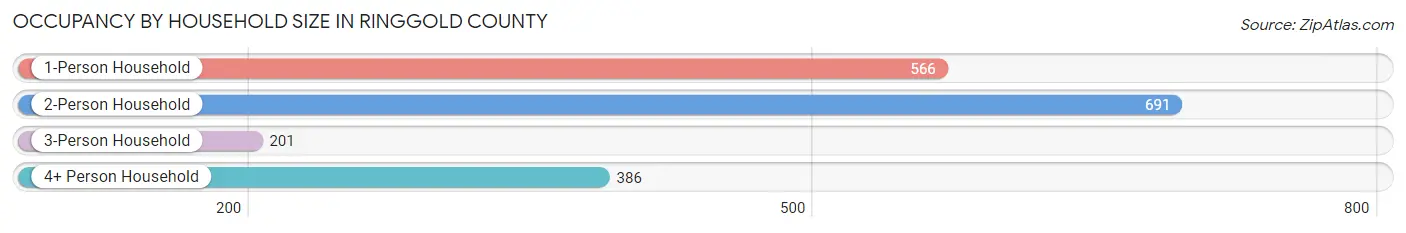
| Household Size | # Housing Units | % Housing Units |
| 1-Person Household | 566 | 30.7% |
| 2-Person Household | 691 | 37.5% |
| 3-Person Household | 201 | 10.9% |
| 4+ Person Household | 386 | 20.9% |
| Total Housing Units | 1,844 | 100.0% |
Occupancy by Ownership by Household Size in Ringgold County
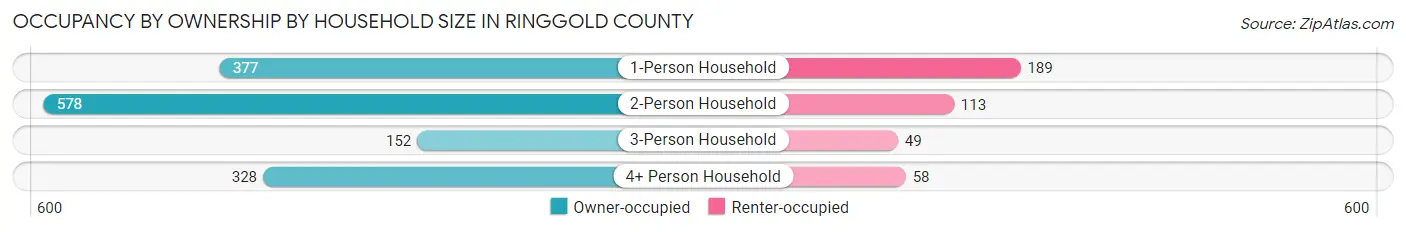
| Household Size | Owner-occupied | Renter-occupied |
| 1-Person Household | 377 (66.6%) | 189 (33.4%) |
| 2-Person Household | 578 (83.7%) | 113 (16.4%) |
| 3-Person Household | 152 (75.6%) | 49 (24.4%) |
| 4+ Person Household | 328 (85.0%) | 58 (15.0%) |
| Total Housing Units | 1,435 (77.8%) | 409 (22.2%) |
Occupancy by Educational Attainment in Ringgold County
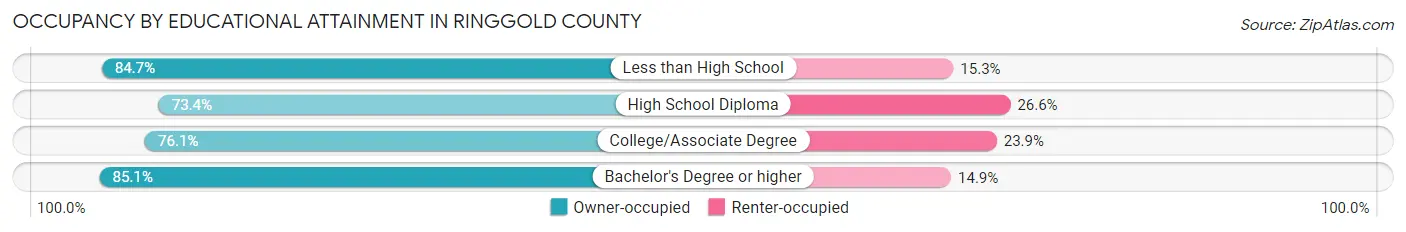
| Household Size | Owner-occupied | Renter-occupied |
| Less than High School | 83 (84.7%) | 15 (15.3%) |
| High School Diploma | 452 (73.4%) | 164 (26.6%) |
| College/Associate Degree | 522 (76.1%) | 164 (23.9%) |
| Bachelor's Degree or higher | 378 (85.1%) | 66 (14.9%) |
Occupancy by Age of Householder in Ringgold County
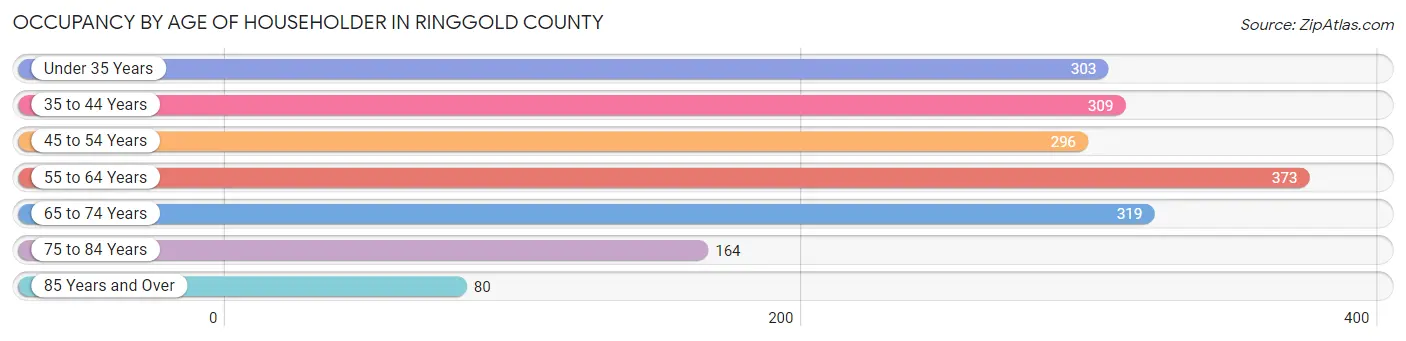
| Age Bracket | # Households | % Households |
| Under 35 Years | 303 | 16.4% |
| 35 to 44 Years | 309 | 16.8% |
| 45 to 54 Years | 296 | 16.1% |
| 55 to 64 Years | 373 | 20.2% |
| 65 to 74 Years | 319 | 17.3% |
| 75 to 84 Years | 164 | 8.9% |
| 85 Years and Over | 80 | 4.3% |
| Total | 1,844 | 100.0% |
Housing Finances in Ringgold County
Median Income by Occupancy in Ringgold County
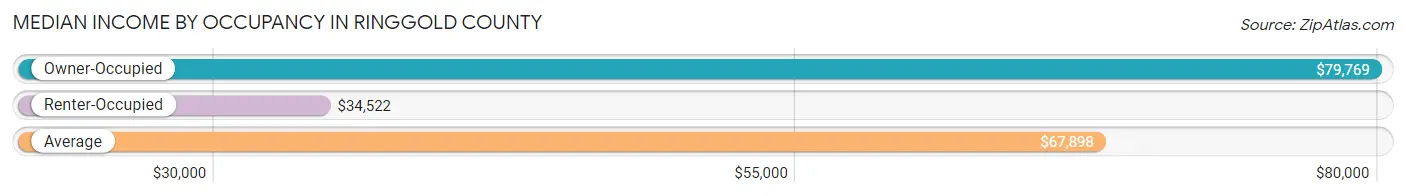
| Occupancy Type | # Households | Median Income |
| Owner-Occupied | 1,435 (77.8%) | $79,769 |
| Renter-Occupied | 409 (22.2%) | $34,522 |
| Average | 1,844 (100.0%) | $67,898 |
Occupancy by Householder Income Bracket in Ringgold County
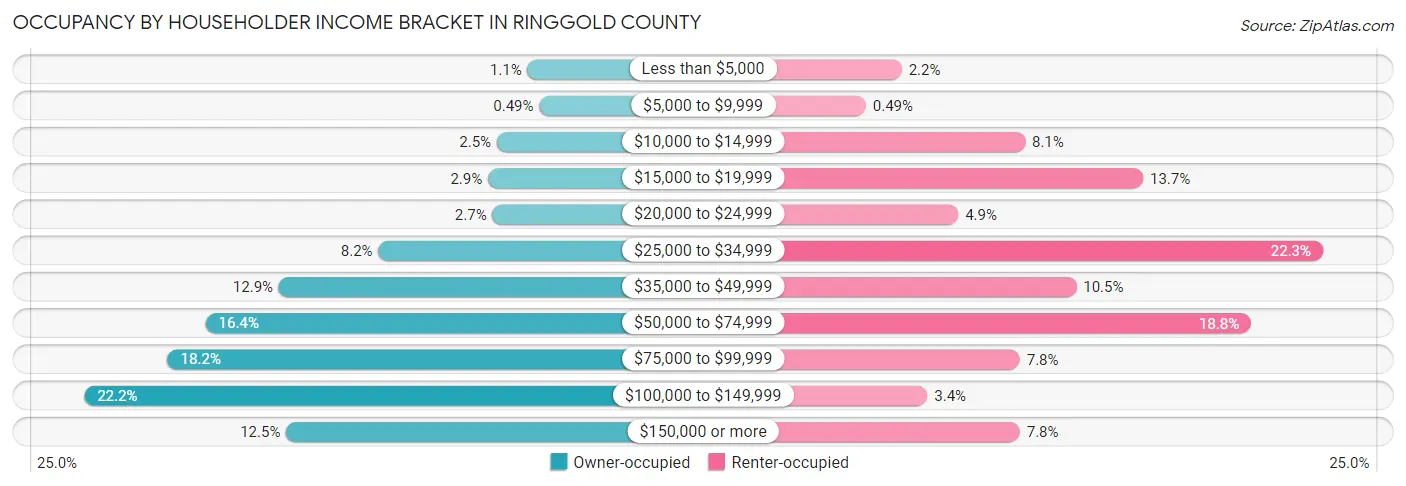
| Income Bracket | Owner-occupied | Renter-occupied |
| Less than $5,000 | 15 (1.1%) | 9 (2.2%) |
| $5,000 to $9,999 | 7 (0.5%) | 2 (0.5%) |
| $10,000 to $14,999 | 36 (2.5%) | 33 (8.1%) |
| $15,000 to $19,999 | 42 (2.9%) | 56 (13.7%) |
| $20,000 to $24,999 | 39 (2.7%) | 20 (4.9%) |
| $25,000 to $34,999 | 117 (8.2%) | 91 (22.3%) |
| $35,000 to $49,999 | 185 (12.9%) | 43 (10.5%) |
| $50,000 to $74,999 | 235 (16.4%) | 77 (18.8%) |
| $75,000 to $99,999 | 261 (18.2%) | 32 (7.8%) |
| $100,000 to $149,999 | 318 (22.2%) | 14 (3.4%) |
| $150,000 or more | 180 (12.5%) | 32 (7.8%) |
| Total | 1,435 (100.0%) | 409 (100.0%) |
Monthly Housing Cost Tiers in Ringgold County
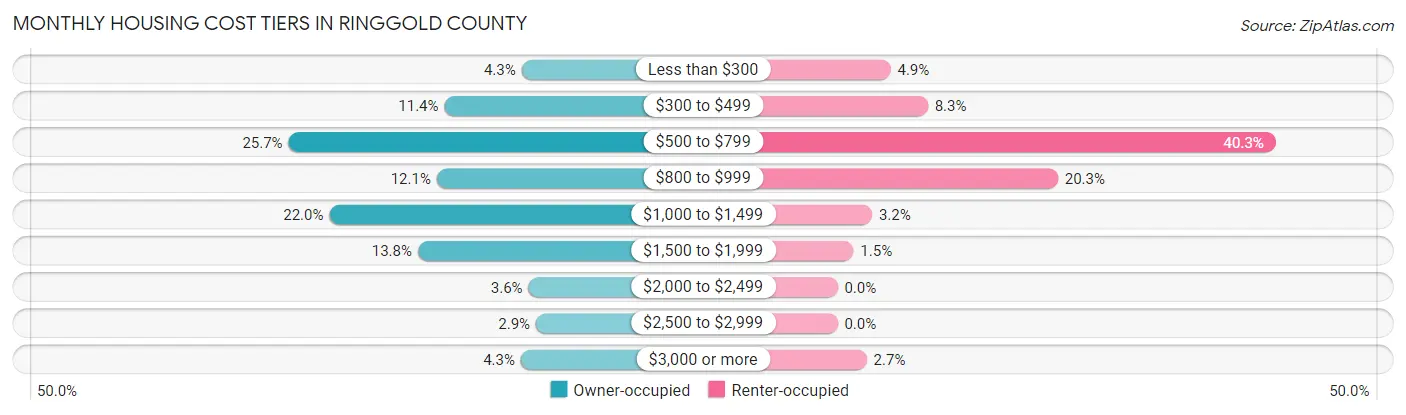
| Monthly Cost | Owner-occupied | Renter-occupied |
| Less than $300 | 61 (4.3%) | 20 (4.9%) |
| $300 to $499 | 163 (11.4%) | 34 (8.3%) |
| $500 to $799 | 369 (25.7%) | 165 (40.3%) |
| $800 to $999 | 173 (12.1%) | 83 (20.3%) |
| $1,000 to $1,499 | 315 (22.0%) | 13 (3.2%) |
| $1,500 to $1,999 | 198 (13.8%) | 6 (1.5%) |
| $2,000 to $2,499 | 52 (3.6%) | 0 (0.0%) |
| $2,500 to $2,999 | 42 (2.9%) | 0 (0.0%) |
| $3,000 or more | 62 (4.3%) | 11 (2.7%) |
| Total | 1,435 (100.0%) | 409 (100.0%) |
Physical Housing Characteristics in Ringgold County
Housing Structures in Ringgold County
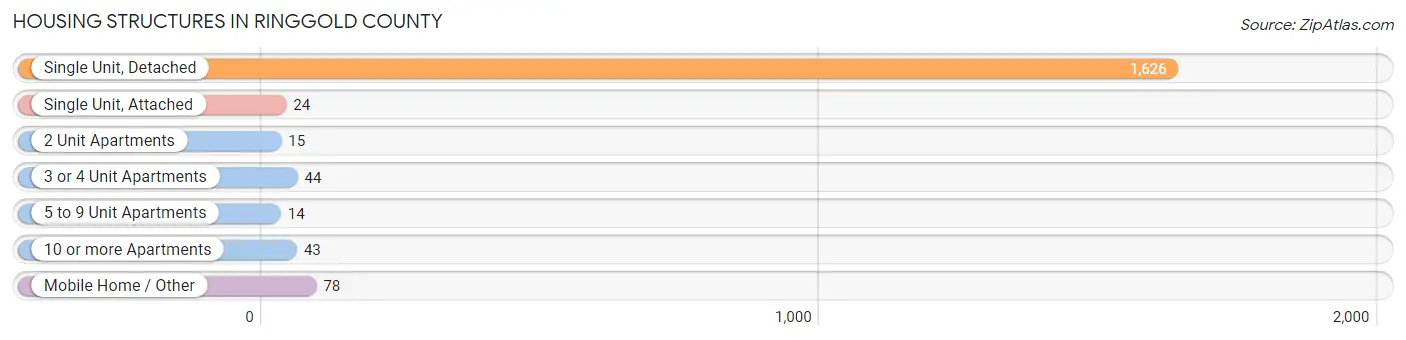
| Structure Type | # Housing Units | % Housing Units |
| Single Unit, Detached | 1,626 | 88.2% |
| Single Unit, Attached | 24 | 1.3% |
| 2 Unit Apartments | 15 | 0.8% |
| 3 or 4 Unit Apartments | 44 | 2.4% |
| 5 to 9 Unit Apartments | 14 | 0.8% |
| 10 or more Apartments | 43 | 2.3% |
| Mobile Home / Other | 78 | 4.2% |
| Total | 1,844 | 100.0% |
Housing Structures by Occupancy in Ringgold County
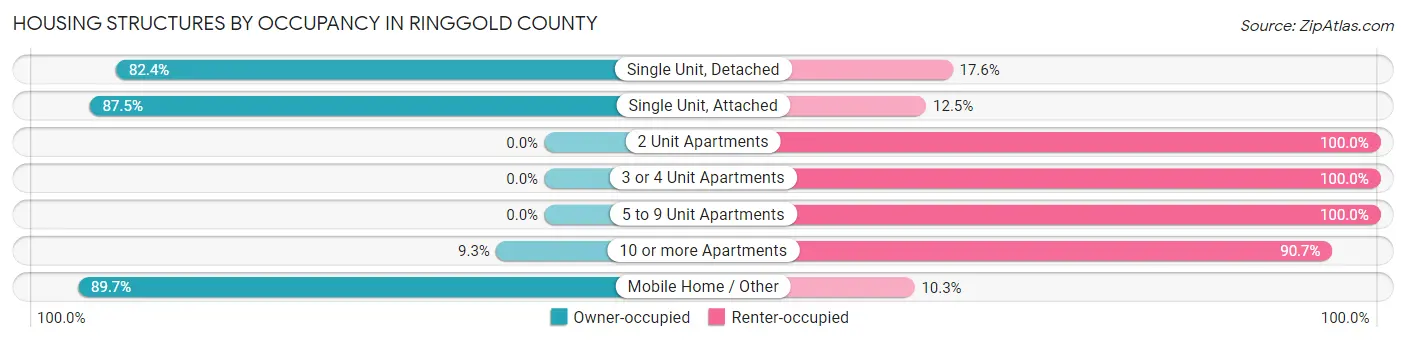
| Structure Type | Owner-occupied | Renter-occupied |
| Single Unit, Detached | 1,340 (82.4%) | 286 (17.6%) |
| Single Unit, Attached | 21 (87.5%) | 3 (12.5%) |
| 2 Unit Apartments | 0 (0.0%) | 15 (100.0%) |
| 3 or 4 Unit Apartments | 0 (0.0%) | 44 (100.0%) |
| 5 to 9 Unit Apartments | 0 (0.0%) | 14 (100.0%) |
| 10 or more Apartments | 4 (9.3%) | 39 (90.7%) |
| Mobile Home / Other | 70 (89.7%) | 8 (10.3%) |
| Total | 1,435 (77.8%) | 409 (22.2%) |
Housing Structures by Number of Rooms in Ringgold County
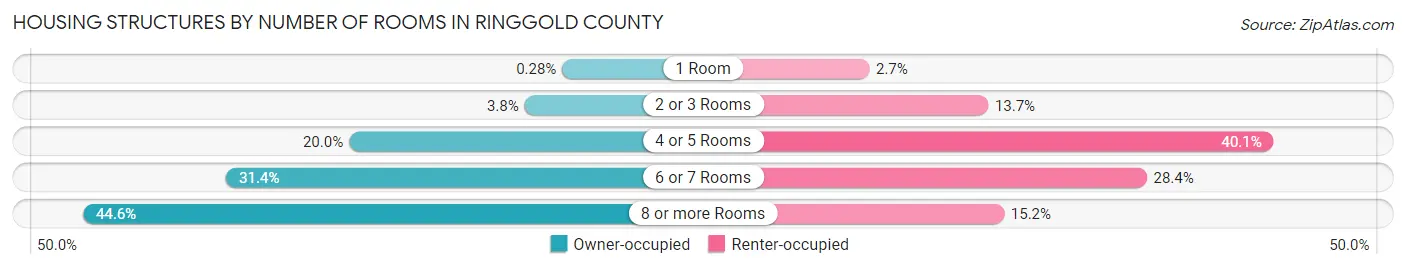
| Number of Rooms | Owner-occupied | Renter-occupied |
| 1 Room | 4 (0.3%) | 11 (2.7%) |
| 2 or 3 Rooms | 54 (3.8%) | 56 (13.7%) |
| 4 or 5 Rooms | 287 (20.0%) | 164 (40.1%) |
| 6 or 7 Rooms | 450 (31.4%) | 116 (28.4%) |
| 8 or more Rooms | 640 (44.6%) | 62 (15.2%) |
| Total | 1,435 (100.0%) | 409 (100.0%) |
Housing Structure by Heating Type in Ringgold County
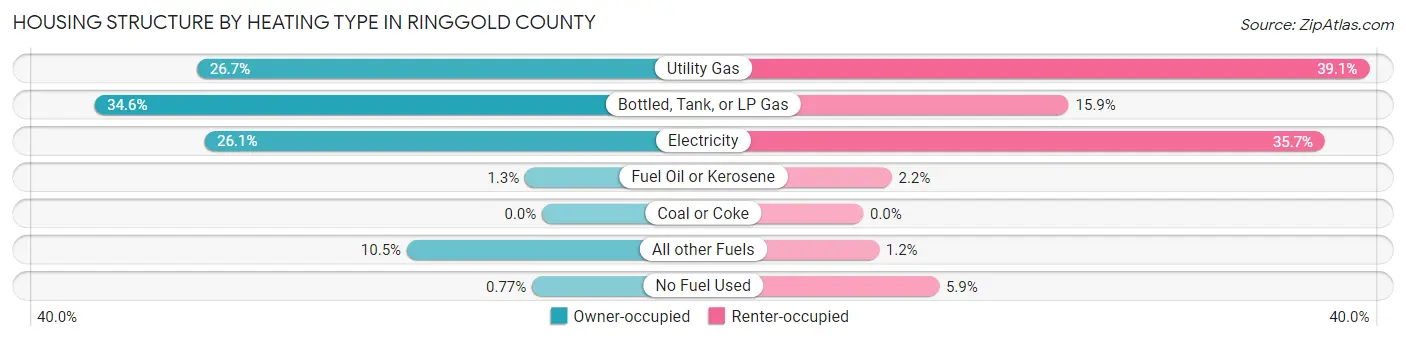
| Heating Type | Owner-occupied | Renter-occupied |
| Utility Gas | 383 (26.7%) | 160 (39.1%) |
| Bottled, Tank, or LP Gas | 497 (34.6%) | 65 (15.9%) |
| Electricity | 375 (26.1%) | 146 (35.7%) |
| Fuel Oil or Kerosene | 19 (1.3%) | 9 (2.2%) |
| Coal or Coke | 0 (0.0%) | 0 (0.0%) |
| All other Fuels | 150 (10.4%) | 5 (1.2%) |
| No Fuel Used | 11 (0.8%) | 24 (5.9%) |
| Total | 1,435 (100.0%) | 409 (100.0%) |
Household Vehicle Usage in Ringgold County
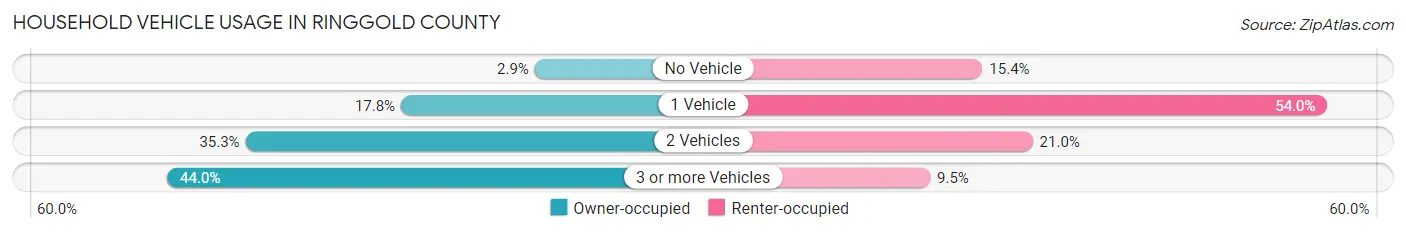
| Vehicles per Household | Owner-occupied | Renter-occupied |
| No Vehicle | 41 (2.9%) | 63 (15.4%) |
| 1 Vehicle | 256 (17.8%) | 221 (54.0%) |
| 2 Vehicles | 506 (35.3%) | 86 (21.0%) |
| 3 or more Vehicles | 632 (44.0%) | 39 (9.5%) |
| Total | 1,435 (100.0%) | 409 (100.0%) |
Real Estate & Mortgages in Ringgold County
Real Estate and Mortgage Overview in Ringgold County
| Characteristic | Without Mortgage | With Mortgage |
| Housing Units | 684 | 751 |
| Median Property Value | $117,800 | $151,300 |
| Median Household Income | $54,891 | $108 |
| Monthly Housing Costs | $605 | $62 |
| Real Estate Taxes | $1,618 | $0 |
Property Value by Mortgage Status in Ringgold County
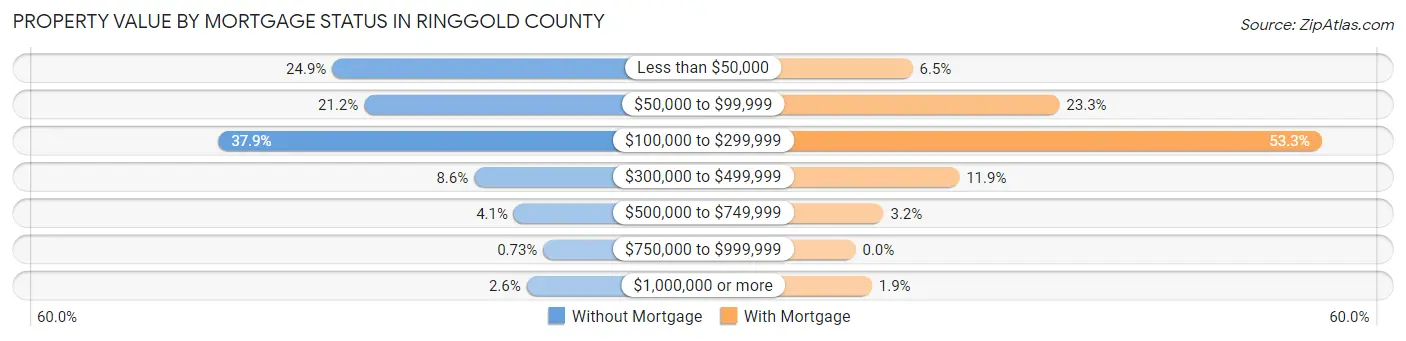
| Property Value | Without Mortgage | With Mortgage |
| Less than $50,000 | 170 (24.8%) | 49 (6.5%) |
| $50,000 to $99,999 | 145 (21.2%) | 175 (23.3%) |
| $100,000 to $299,999 | 259 (37.9%) | 400 (53.3%) |
| $300,000 to $499,999 | 59 (8.6%) | 89 (11.8%) |
| $500,000 to $749,999 | 28 (4.1%) | 24 (3.2%) |
| $750,000 to $999,999 | 5 (0.7%) | 0 (0.0%) |
| $1,000,000 or more | 18 (2.6%) | 14 (1.9%) |
| Total | 684 (100.0%) | 751 (100.0%) |
Household Income by Mortgage Status in Ringgold County
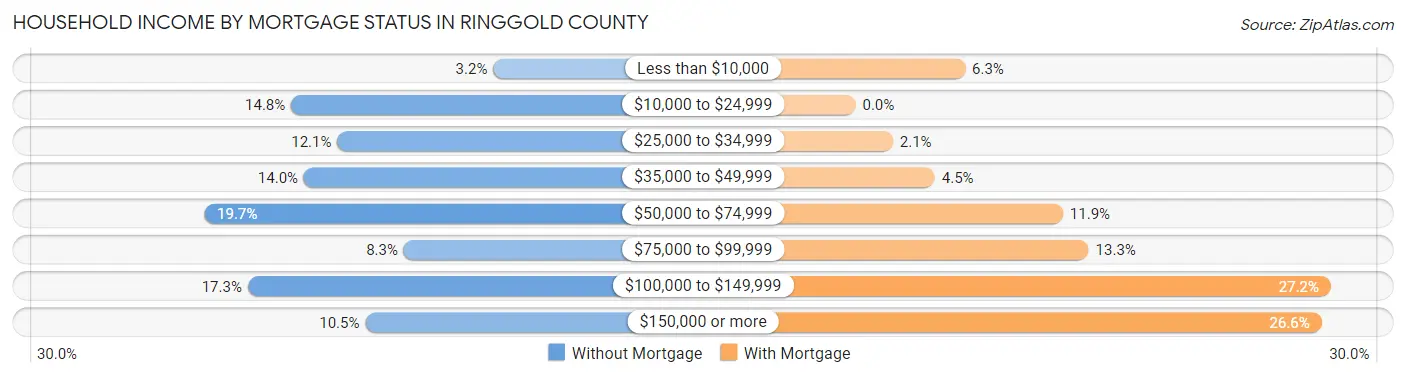
| Household Income | Without Mortgage | With Mortgage |
| Less than $10,000 | 22 (3.2%) | 47 (6.3%) |
| $10,000 to $24,999 | 101 (14.8%) | 0 (0.0%) |
| $25,000 to $34,999 | 83 (12.1%) | 16 (2.1%) |
| $35,000 to $49,999 | 96 (14.0%) | 34 (4.5%) |
| $50,000 to $74,999 | 135 (19.7%) | 89 (11.8%) |
| $75,000 to $99,999 | 57 (8.3%) | 100 (13.3%) |
| $100,000 to $149,999 | 118 (17.2%) | 204 (27.2%) |
| $150,000 or more | 72 (10.5%) | 200 (26.6%) |
| Total | 684 (100.0%) | 751 (100.0%) |
Property Value to Household Income Ratio in Ringgold County
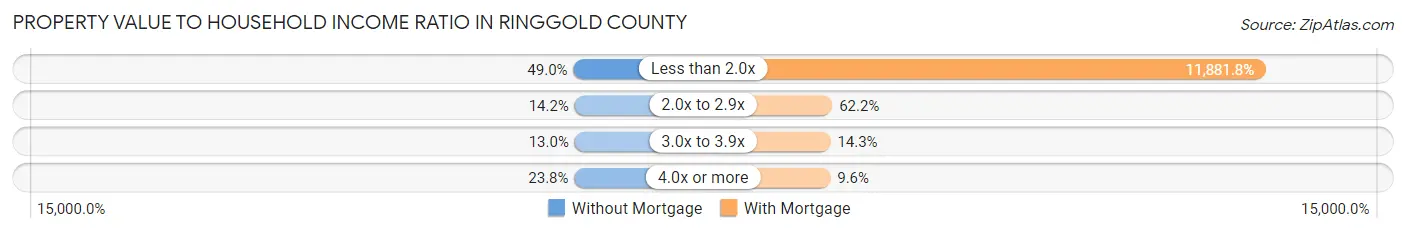
| Value-to-Income Ratio | Without Mortgage | With Mortgage |
| Less than 2.0x | 335 (49.0%) | 89,232 (11,881.8%) |
| 2.0x to 2.9x | 97 (14.2%) | 467 (62.2%) |
| 3.0x to 3.9x | 89 (13.0%) | 107 (14.2%) |
| 4.0x or more | 163 (23.8%) | 72 (9.6%) |
| Total | 684 (100.0%) | 751 (100.0%) |
Real Estate Taxes by Mortgage Status in Ringgold County
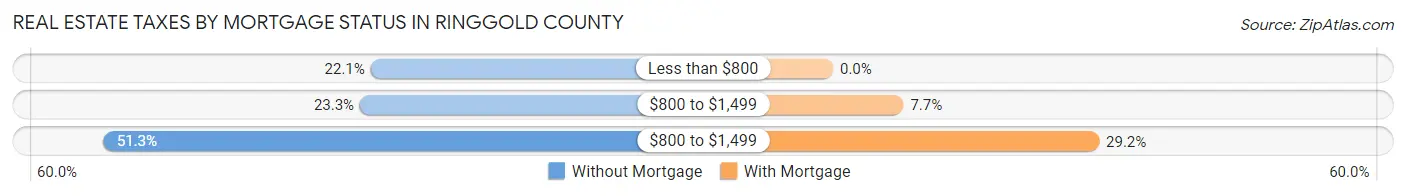
| Property Taxes | Without Mortgage | With Mortgage |
| Less than $800 | 151 (22.1%) | 0 (0.0%) |
| $800 to $1,499 | 159 (23.3%) | 58 (7.7%) |
| $800 to $1,499 | 351 (51.3%) | 219 (29.2%) |
| Total | 684 (100.0%) | 751 (100.0%) |
Health & Disability in Ringgold County
Health Insurance Coverage by Age in Ringgold County
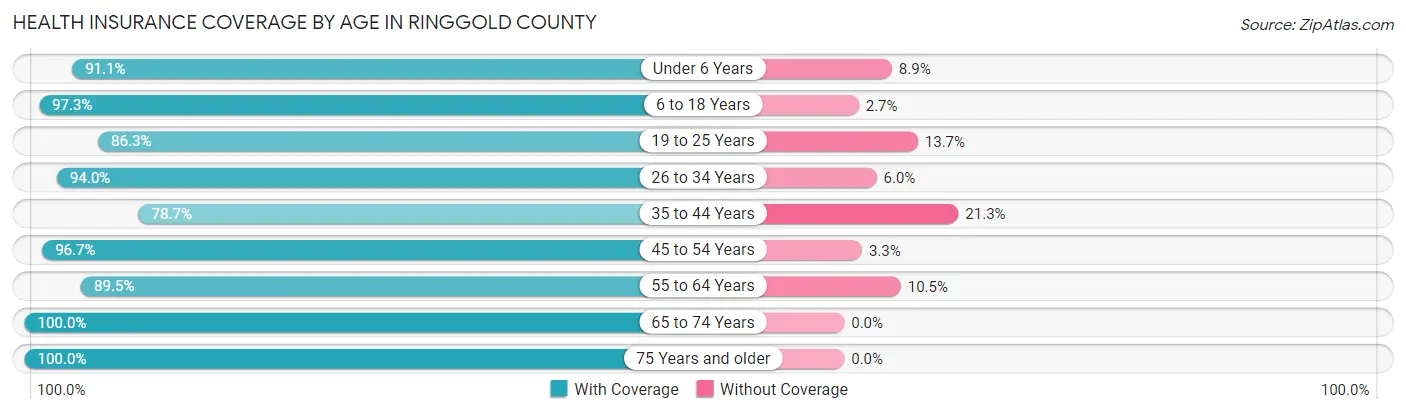
| Age Bracket | With Coverage | Without Coverage |
| Under 6 Years | 318 (91.1%) | 31 (8.9%) |
| 6 to 18 Years | 793 (97.3%) | 22 (2.7%) |
| 19 to 25 Years | 283 (86.3%) | 45 (13.7%) |
| 26 to 34 Years | 374 (94.0%) | 24 (6.0%) |
| 35 to 44 Years | 381 (78.7%) | 103 (21.3%) |
| 45 to 54 Years | 500 (96.7%) | 17 (3.3%) |
| 55 to 64 Years | 612 (89.5%) | 72 (10.5%) |
| 65 to 74 Years | 552 (100.0%) | 0 (0.0%) |
| 75 Years and older | 337 (100.0%) | 0 (0.0%) |
| Total | 4,150 (93.0%) | 314 (7.0%) |
Health Insurance Coverage by Citizenship Status in Ringgold County
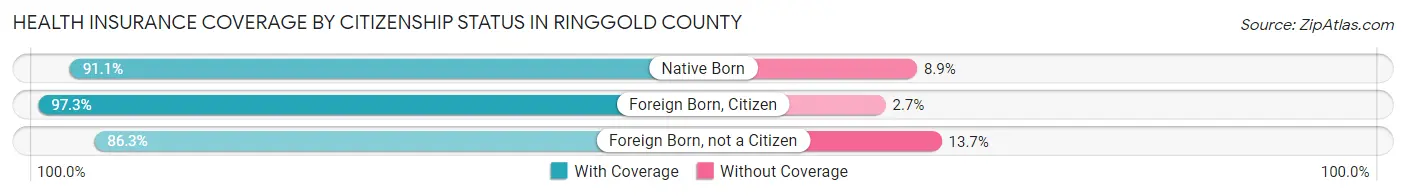
| Citizenship Status | With Coverage | Without Coverage |
| Native Born | 318 (91.1%) | 31 (8.9%) |
| Foreign Born, Citizen | 793 (97.3%) | 22 (2.7%) |
| Foreign Born, not a Citizen | 283 (86.3%) | 45 (13.7%) |
Health Insurance Coverage by Household Income in Ringgold County
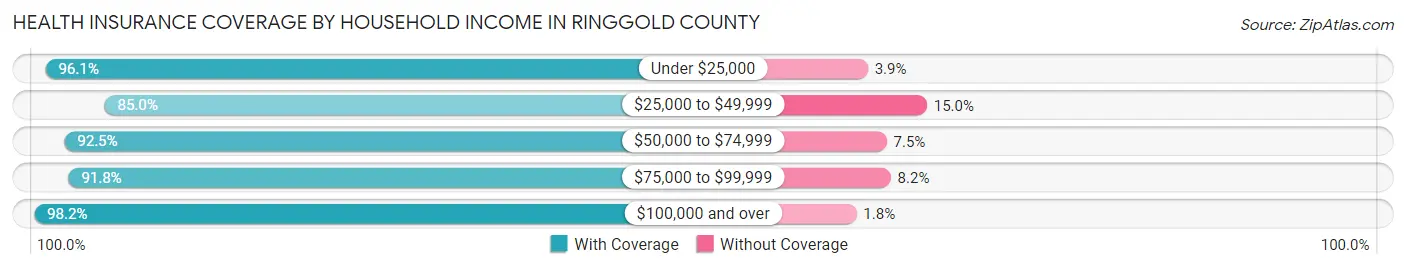
| Household Income | With Coverage | Without Coverage |
| Under $25,000 | 294 (96.1%) | 12 (3.9%) |
| $25,000 to $49,999 | 913 (85.0%) | 161 (15.0%) |
| $50,000 to $74,999 | 583 (92.5%) | 47 (7.5%) |
| $75,000 to $99,999 | 715 (91.8%) | 64 (8.2%) |
| $100,000 and over | 1,637 (98.2%) | 30 (1.8%) |
Public vs Private Health Insurance Coverage by Age in Ringgold County
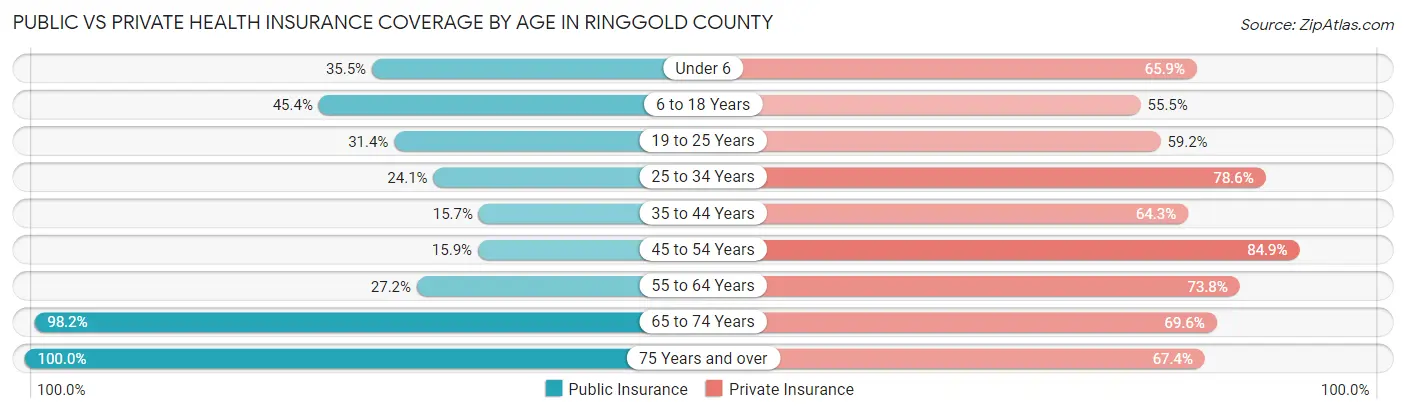
| Age Bracket | Public Insurance | Private Insurance |
| Under 6 | 124 (35.5%) | 230 (65.9%) |
| 6 to 18 Years | 370 (45.4%) | 452 (55.5%) |
| 19 to 25 Years | 103 (31.4%) | 194 (59.2%) |
| 25 to 34 Years | 96 (24.1%) | 313 (78.6%) |
| 35 to 44 Years | 76 (15.7%) | 311 (64.3%) |
| 45 to 54 Years | 82 (15.9%) | 439 (84.9%) |
| 55 to 64 Years | 186 (27.2%) | 505 (73.8%) |
| 65 to 74 Years | 542 (98.2%) | 384 (69.6%) |
| 75 Years and over | 337 (100.0%) | 227 (67.4%) |
| Total | 1,916 (42.9%) | 3,055 (68.4%) |
Disability Status by Sex by Age in Ringgold County
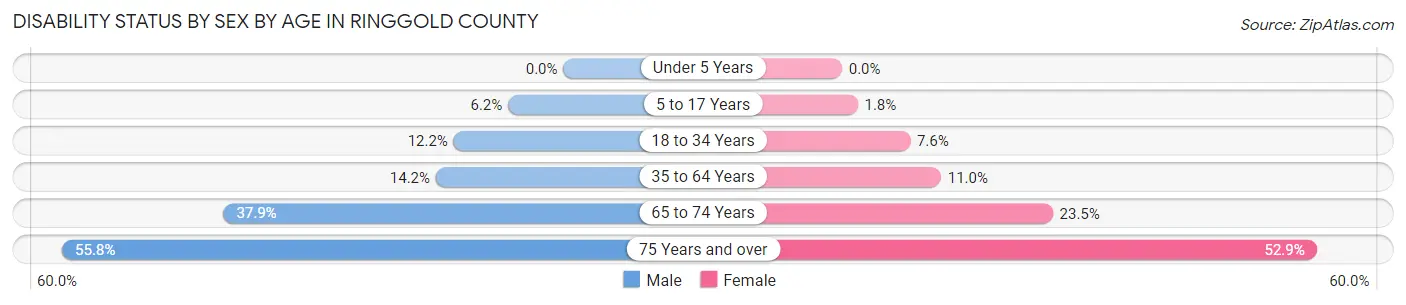
| Age Bracket | Male | Female |
| Under 5 Years | 0 (0.0%) | 0 (0.0%) |
| 5 to 17 Years | 27 (6.1%) | 7 (1.8%) |
| 18 to 34 Years | 47 (12.2%) | 29 (7.6%) |
| 35 to 64 Years | 117 (14.2%) | 95 (11.0%) |
| 65 to 74 Years | 109 (37.9%) | 62 (23.5%) |
| 75 Years and over | 91 (55.8%) | 92 (52.9%) |
Disability Class by Sex by Age in Ringgold County
Disability Class: Hearing Difficulty
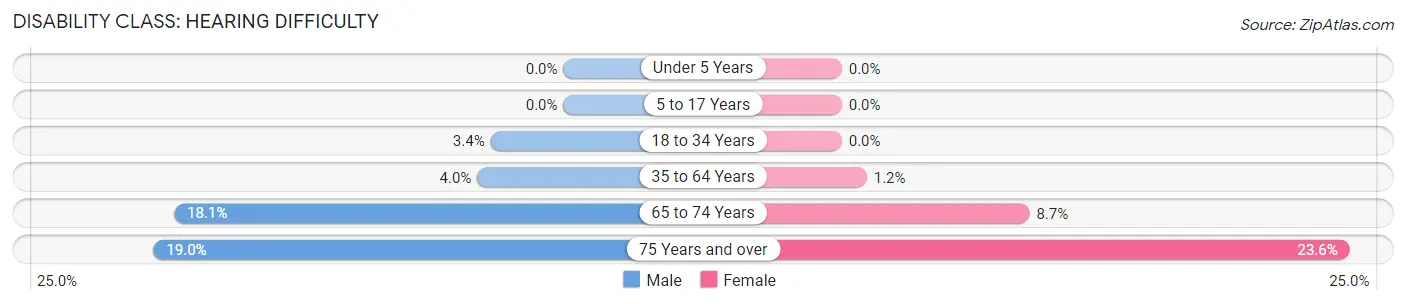
| Age Bracket | Male | Female |
| Under 5 Years | 0 (0.0%) | 0 (0.0%) |
| 5 to 17 Years | 0 (0.0%) | 0 (0.0%) |
| 18 to 34 Years | 13 (3.4%) | 0 (0.0%) |
| 35 to 64 Years | 33 (4.0%) | 10 (1.2%) |
| 65 to 74 Years | 52 (18.1%) | 23 (8.7%) |
| 75 Years and over | 31 (19.0%) | 41 (23.6%) |
Disability Class: Vision Difficulty
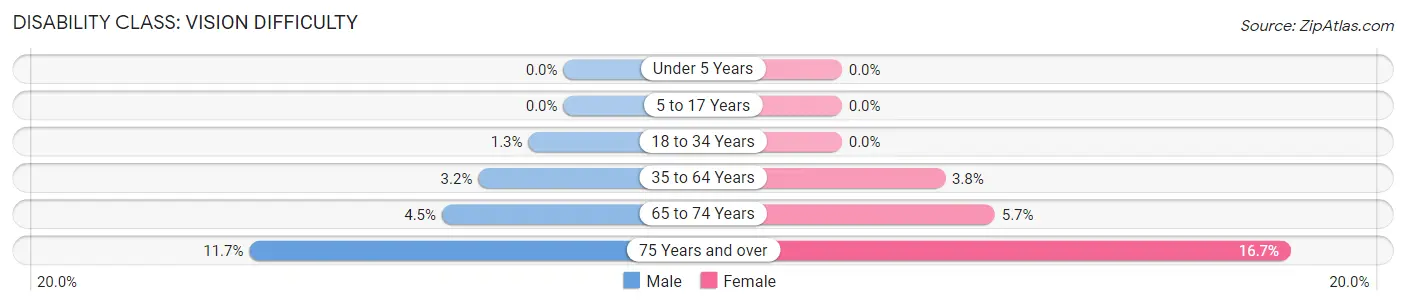
| Age Bracket | Male | Female |
| Under 5 Years | 0 (0.0%) | 0 (0.0%) |
| 5 to 17 Years | 0 (0.0%) | 0 (0.0%) |
| 18 to 34 Years | 5 (1.3%) | 0 (0.0%) |
| 35 to 64 Years | 26 (3.2%) | 33 (3.8%) |
| 65 to 74 Years | 13 (4.5%) | 15 (5.7%) |
| 75 Years and over | 19 (11.7%) | 29 (16.7%) |
Disability Class: Cognitive Difficulty
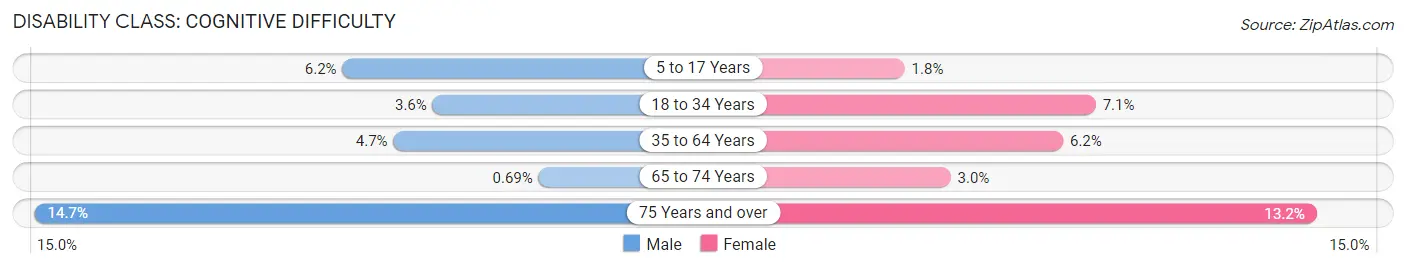
| Age Bracket | Male | Female |
| 5 to 17 Years | 27 (6.1%) | 7 (1.8%) |
| 18 to 34 Years | 14 (3.6%) | 27 (7.1%) |
| 35 to 64 Years | 39 (4.7%) | 53 (6.2%) |
| 65 to 74 Years | 2 (0.7%) | 8 (3.0%) |
| 75 Years and over | 24 (14.7%) | 23 (13.2%) |
Disability Class: Ambulatory Difficulty
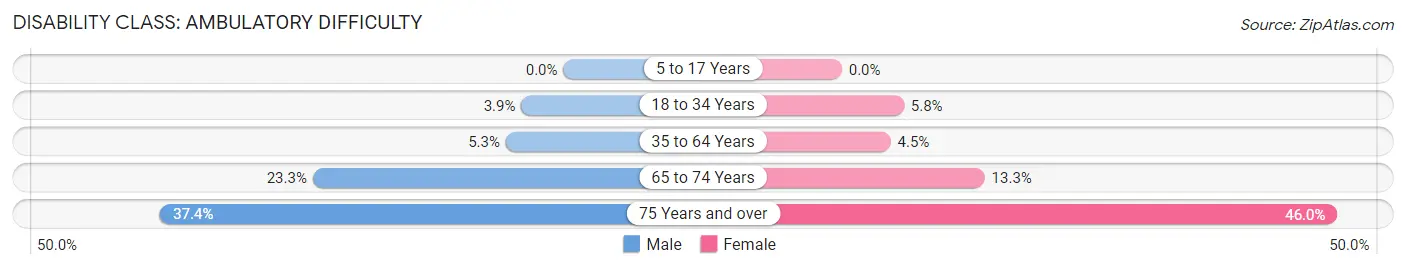
| Age Bracket | Male | Female |
| 5 to 17 Years | 0 (0.0%) | 0 (0.0%) |
| 18 to 34 Years | 15 (3.9%) | 22 (5.8%) |
| 35 to 64 Years | 44 (5.3%) | 39 (4.5%) |
| 65 to 74 Years | 67 (23.3%) | 35 (13.3%) |
| 75 Years and over | 61 (37.4%) | 80 (46.0%) |
Disability Class: Self-Care Difficulty
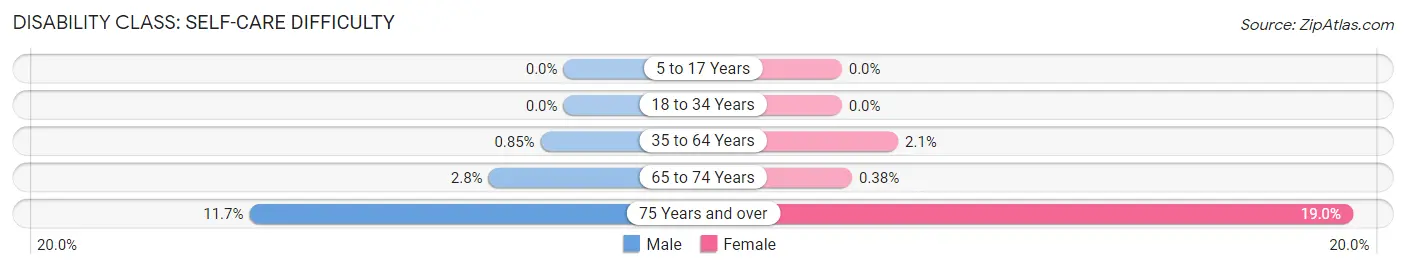
| Age Bracket | Male | Female |
| 5 to 17 Years | 0 (0.0%) | 0 (0.0%) |
| 18 to 34 Years | 0 (0.0%) | 0 (0.0%) |
| 35 to 64 Years | 7 (0.9%) | 18 (2.1%) |
| 65 to 74 Years | 8 (2.8%) | 1 (0.4%) |
| 75 Years and over | 19 (11.7%) | 33 (19.0%) |
Technology Access in Ringgold County
Computing Device Access in Ringgold County
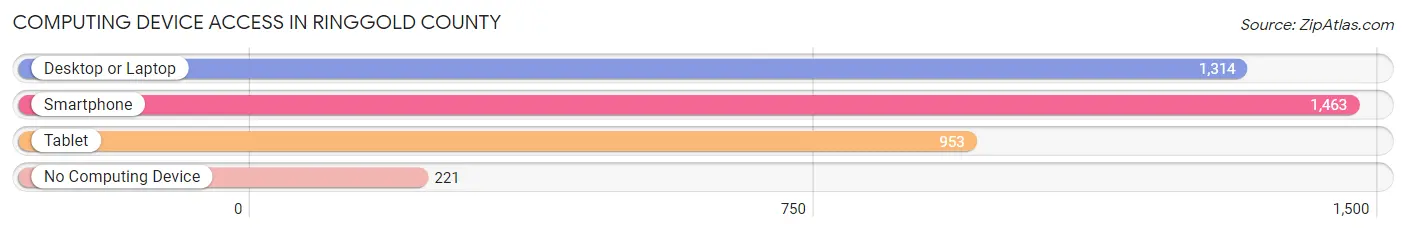
| Device Type | # Households | % Households |
| Desktop or Laptop | 1,314 | 71.3% |
| Smartphone | 1,463 | 79.3% |
| Tablet | 953 | 51.7% |
| No Computing Device | 221 | 12.0% |
| Total | 1,844 | 100.0% |
Internet Access in Ringgold County
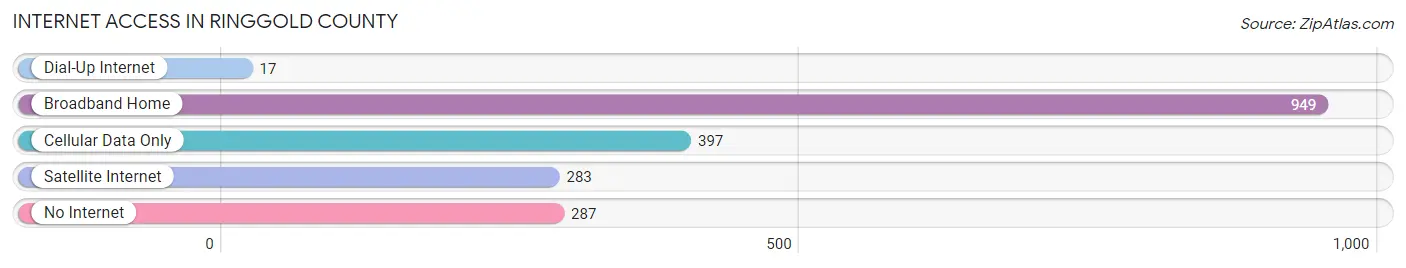
| Internet Type | # Households | % Households |
| Dial-Up Internet | 17 | 0.9% |
| Broadband Home | 949 | 51.5% |
| Cellular Data Only | 397 | 21.5% |
| Satellite Internet | 283 | 15.3% |
| No Internet | 287 | 15.6% |
| Total | 1,844 | 100.0% |
Ringgold County Summary
Introduction
Located in the rolling hills of southwest Iowa, Ringgold County is a rural county with a population of 5,890 as of the 2010 census. The county seat is Mount Ayr, and the county is bordered by Decatur County to the north, Adams County to the east, Union County to the south, and Taylor County to the west. The county was established in 1851 and named after Major Samuel Ringgold, a hero of the Mexican-American War.
History
The first settlers in Ringgold County were of English, Irish, and German descent. The first permanent settlement was established in 1851, and the county was officially organized in 1853. The county seat was established in Mount Ayr, which was named after Ayrshire, Scotland.
The first railroad in the county was the Burlington and Missouri River Railroad, which was built in 1871. This railroad connected Mount Ayr to the rest of the state and allowed for the development of the county.
The county experienced a period of growth in the late 19th and early 20th centuries. The population increased from 4,845 in 1880 to 8,845 in 1910. This growth was due to the development of the railroad and the influx of immigrants from Europe.
Geography
Ringgold County is located in the rolling hills of southwest Iowa. The county is bordered by Decatur County to the north, Adams County to the east, Union County to the south, and Taylor County to the west. The county covers an area of 576 square miles and is home to several small towns and villages, including Mount Ayr, Tingley, Redding, and Diagonal.
The county is home to several rivers and streams, including the Middle River, the North River, and the South River. The county is also home to several lakes, including Lake Icaria, Lake Anita, and Lake Ponderosa.
Economy
The economy of Ringgold County is largely based on agriculture. The county is home to several large farms, and the main crops grown in the county are corn, soybeans, and hay. The county is also home to several small businesses, including restaurants, retail stores, and service providers.
The county is home to several manufacturing companies, including a furniture factory, a metal fabrication plant, and a plastics factory. The county is also home to several energy companies, including a wind farm and a solar farm.
Demographics
As of the 2010 census, the population of Ringgold County was 5,890. The racial makeup of the county was 97.3% White, 0.3% African American, 0.2% Native American, 0.2% Asian, 0.1% Pacific Islander, 0.7% from other races, and 1.2% from two or more races. Hispanic or Latino of any race were 2.2% of the population.
The median income for a household in the county was $41,945, and the median income for a family was $50,938. The per capita income for the county was $20,945. About 11.2% of families and 14.2% of the population were below the poverty line, including 19.2% of those under age 18 and 8.2% of those age 65 or over.
Conclusion
Ringgold County is a rural county located in the rolling hills of southwest Iowa. The county was established in 1851 and is home to a population of 5,890 as of the 2010 census. The economy of the county is largely based on agriculture, and the county is home to several small businesses, manufacturing companies, and energy companies. The racial makeup of the county is predominantly White, and the median income for a household is $41,945.
Common Questions
What is Per Capita Income in Ringgold County?
Per Capita income in Ringgold County is $34,138.
What is the Median Family Income in Ringgold County?
Median Family Income in Ringgold County is $84,615.
What is the Median Household income in Ringgold County?
Median Household Income in Ringgold County is $67,898.
What is Income or Wage Gap in Ringgold County?
Income or Wage Gap in Ringgold County is 37.7%.
Women in Ringgold County earn 62.3 cents for every dollar earned by a man.
What is Inequality or Gini Index in Ringgold County?
Inequality or Gini Index in Ringgold County is 0.42.
What is the Total Population of Ringgold County?
Total Population of Ringgold County is 4,690.
What is the Total Male Population of Ringgold County?
Total Male Population of Ringgold County is 2,317.
What is the Total Female Population of Ringgold County?
Total Female Population of Ringgold County is 2,373.
What is the Ratio of Males per 100 Females in Ringgold County?
There are 97.64 Males per 100 Females in Ringgold County.
What is the Ratio of Females per 100 Males in Ringgold County?
There are 102.42 Females per 100 Males in Ringgold County.
What is the Median Population Age in Ringgold County?
Median Population Age in Ringgold County is 43.8 Years.
What is the Average Family Size in Ringgold County
Average Family Size in Ringgold County is 3.0 People.
What is the Average Household Size in Ringgold County
Average Household Size in Ringgold County is 2.4 People.
How Large is the Labor Force in Ringgold County?
There are 2,330 People in the Labor Forcein in Ringgold County.
What is the Percentage of People in the Labor Force in Ringgold County?
62.9% of People are in the Labor Force in Ringgold County.
What is the Unemployment Rate in Ringgold County?
Unemployment Rate in Ringgold County is 1.7%.