Monroe County, IA Map & Demographics
Monroe County Map
Monroe County Overview
$35,392
PER CAPITA INCOME
$89,814
AVG FAMILY INCOME
$76,324
AVG HOUSEHOLD INCOME
26.5%
WAGE / INCOME GAP [ % ]
73.5¢/ $1
WAGE / INCOME GAP [ $ ]
0.40
INEQUALITY / GINI INDEX
7,574
TOTAL POPULATION
3,774
MALE POPULATION
3,800
FEMALE POPULATION
99.32
MALES / 100 FEMALES
100.69
FEMALES / 100 MALES
41.5
MEDIAN AGE
3.2
AVG FAMILY SIZE
2.5
AVG HOUSEHOLD SIZE
3,733
LABOR FORCE [ PEOPLE ]
62.1%
PERCENT IN LABOR FORCE
3.4%
UNEMPLOYMENT RATE
Monroe County Area Codes
Income in Monroe County
Income Overview in Monroe County
Per Capita Income in Monroe County is $35,392, while median incomes of families and households are $89,814 and $76,324 respectively.
| Characteristic | Number | Measure |
| Per Capita Income | 7,574 | $35,392 |
| Median Family Income | 1,823 | $89,814 |
| Mean Family Income | 1,823 | $96,509 |
| Median Household Income | 3,032 | $76,324 |
| Mean Household Income | 3,032 | $82,311 |
| Income Deficit | 1,823 | $0 |
| Wage / Income Gap (%) | 7,574 | 26.51% |
| Wage / Income Gap ($) | 7,574 | 73.49¢ per $1 |
| Gini / Inequality Index | 7,574 | 0.40 |
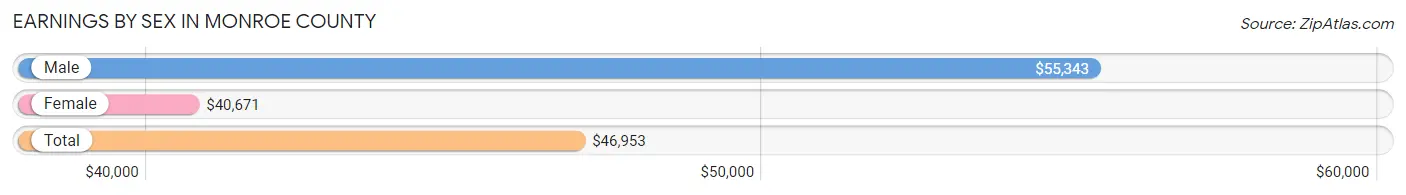
Earnings by Sex in Monroe County
Average Earnings in Monroe County are $46,953, $55,343 for men and $40,671 for women, a difference of 26.5%.
| Sex | Number | Average Earnings |
| Male | 2,027 (51.9%) | $55,343 |
| Female | 1,880 (48.1%) | $40,671 |
| Total | 3,907 (100.0%) | $46,953 |
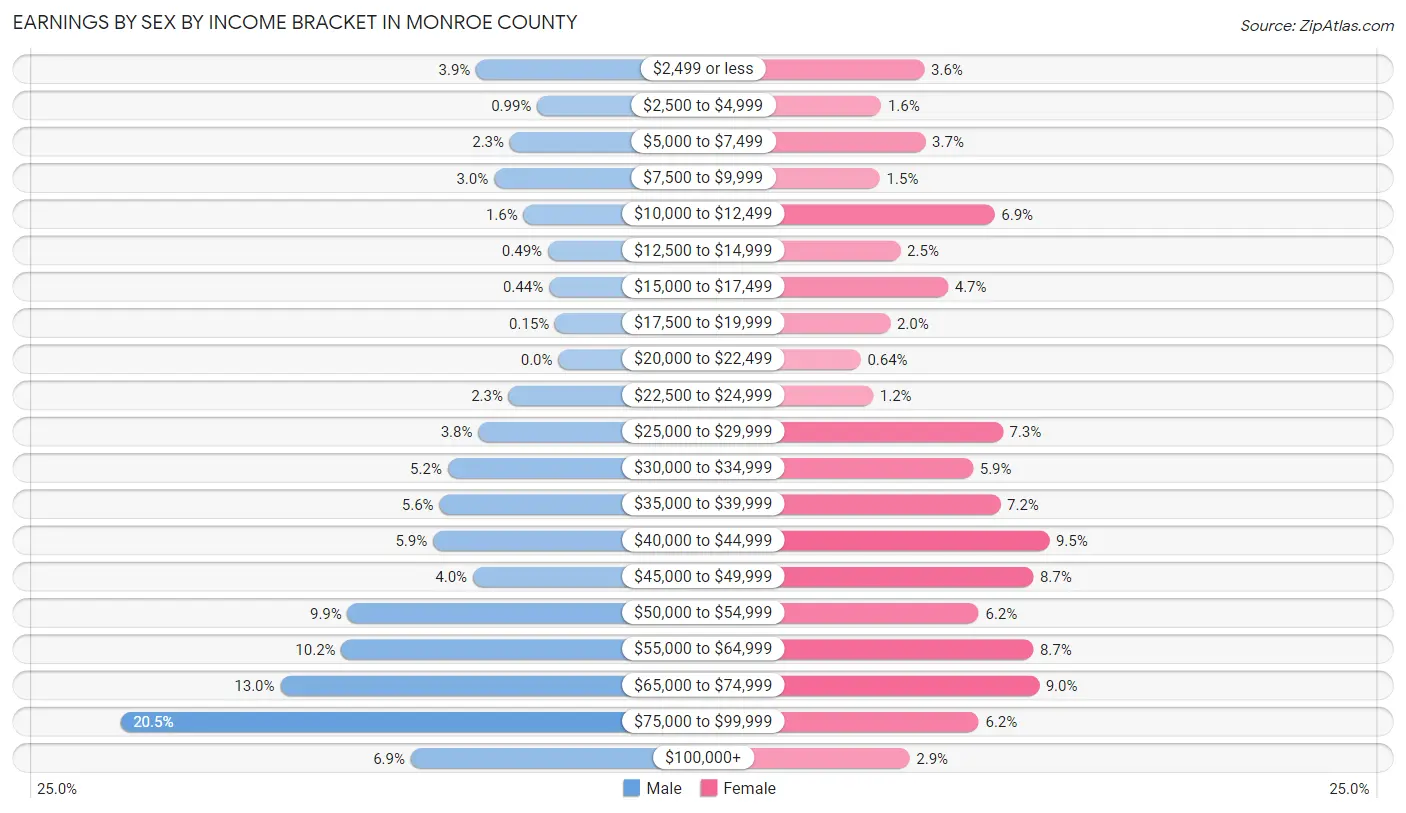
Earnings by Sex by Income Bracket in Monroe County
The most common earnings brackets in Monroe County are $75,000 to $99,999 for men (416 | 20.5%) and $40,000 to $44,999 for women (178 | 9.5%).
| Income | Male | Female |
| $2,499 or less | 78 (3.8%) | 68 (3.6%) |
| $2,500 to $4,999 | 20 (1.0%) | 30 (1.6%) |
| $5,000 to $7,499 | 46 (2.3%) | 69 (3.7%) |
| $7,500 to $9,999 | 61 (3.0%) | 29 (1.5%) |
| $10,000 to $12,499 | 33 (1.6%) | 130 (6.9%) |
| $12,500 to $14,999 | 10 (0.5%) | 47 (2.5%) |
| $15,000 to $17,499 | 9 (0.4%) | 89 (4.7%) |
| $17,500 to $19,999 | 3 (0.2%) | 38 (2.0%) |
| $20,000 to $22,499 | 0 (0.0%) | 12 (0.6%) |
| $22,500 to $24,999 | 47 (2.3%) | 23 (1.2%) |
| $25,000 to $29,999 | 76 (3.7%) | 137 (7.3%) |
| $30,000 to $34,999 | 105 (5.2%) | 111 (5.9%) |
| $35,000 to $39,999 | 113 (5.6%) | 135 (7.2%) |
| $40,000 to $44,999 | 119 (5.9%) | 178 (9.5%) |
| $45,000 to $49,999 | 81 (4.0%) | 164 (8.7%) |
| $50,000 to $54,999 | 200 (9.9%) | 116 (6.2%) |
| $55,000 to $64,999 | 206 (10.2%) | 164 (8.7%) |
| $65,000 to $74,999 | 264 (13.0%) | 169 (9.0%) |
| $75,000 to $99,999 | 416 (20.5%) | 116 (6.2%) |
| $100,000+ | 140 (6.9%) | 55 (2.9%) |
| Total | 2,027 (100.0%) | 1,880 (100.0%) |
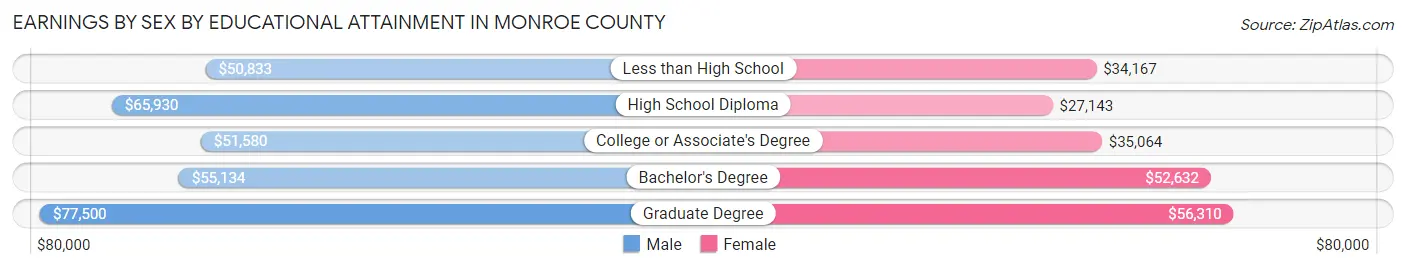
Earnings by Sex by Educational Attainment in Monroe County
Average earnings in Monroe County are $57,167 for men and $42,885 for women, a difference of 25.0%. Men with an educational attainment of graduate degree enjoy the highest average annual earnings of $77,500, while those with less than high school education earn the least with $50,833. Women with an educational attainment of graduate degree earn the most with the average annual earnings of $56,310, while those with high school diploma education have the smallest earnings of $27,143.
| Educational Attainment | Male Income | Female Income |
| Less than High School | $50,833 | $34,167 |
| High School Diploma | $65,930 | $27,143 |
| College or Associate's Degree | $51,580 | $35,064 |
| Bachelor's Degree | $55,134 | $52,632 |
| Graduate Degree | $77,500 | $56,310 |
| Total | $57,167 | $42,885 |
Family Income in Monroe County
Family Income Brackets in Monroe County
According to the Monroe County family income data, there are 479 families falling into the $100,000 to $149,999 income range, which is the most common income bracket and makes up 26.3% of all families. Conversely, the less than $10,000 income bracket is the least frequent group with only 11 families (0.6%) belonging to this category.
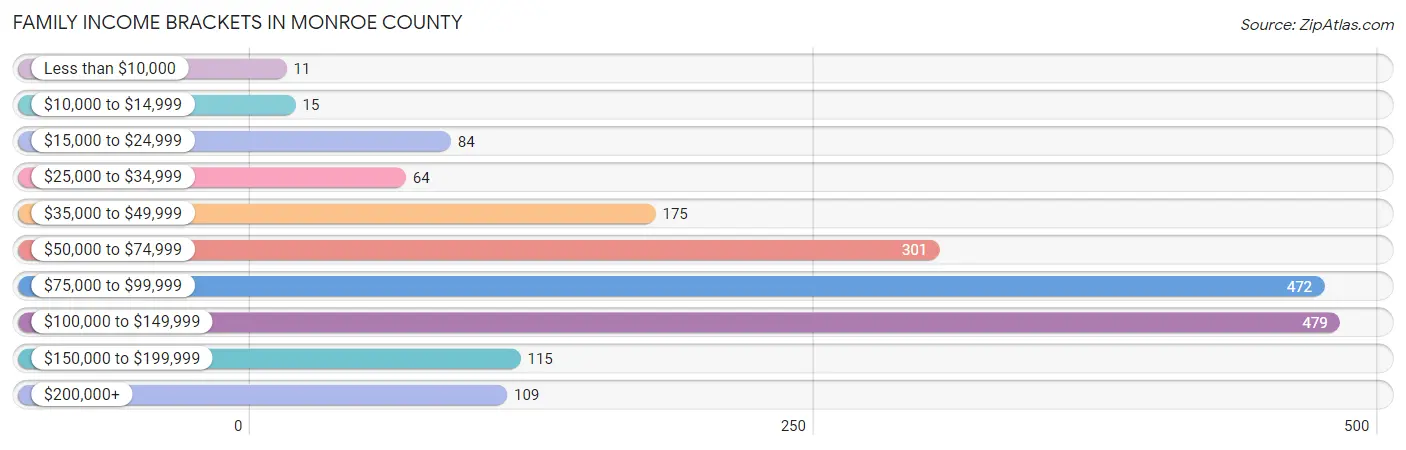
| Income Bracket | # Families | % Families |
| Less than $10,000 | 11 | 0.6% |
| $10,000 to $14,999 | 15 | 0.8% |
| $15,000 to $24,999 | 84 | 4.6% |
| $25,000 to $34,999 | 64 | 3.5% |
| $35,000 to $49,999 | 175 | 9.6% |
| $50,000 to $74,999 | 301 | 16.5% |
| $75,000 to $99,999 | 472 | 25.9% |
| $100,000 to $149,999 | 479 | 26.3% |
| $150,000 to $199,999 | 115 | 6.3% |
| $200,000+ | 109 | 6.0% |
Family Income by Famaliy Size in Monroe County
4-person families (243 | 13.3%) account for the highest median family income in Monroe County with $106,050 per family, while 2-person families (960 | 52.7%) have the highest median income of $41,666 per family member.
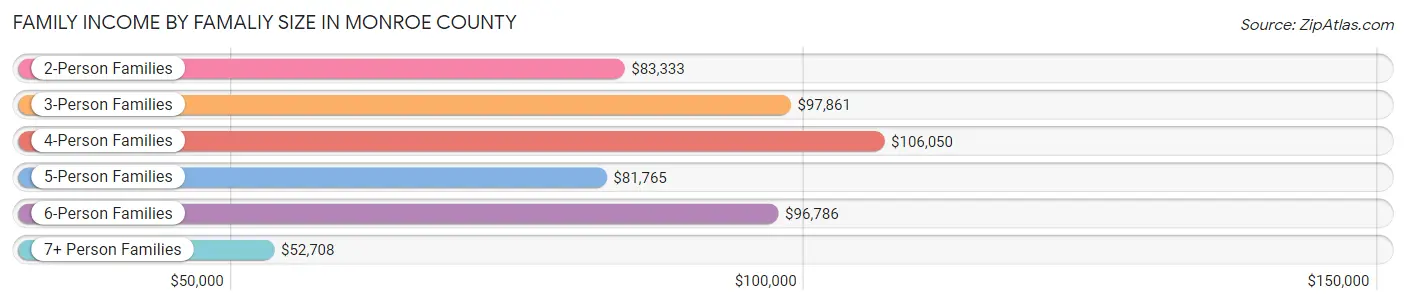
| Income Bracket | # Families | Median Income |
| 2-Person Families | 960 (52.7%) | $83,333 |
| 3-Person Families | 403 (22.1%) | $97,861 |
| 4-Person Families | 243 (13.3%) | $106,050 |
| 5-Person Families | 170 (9.3%) | $81,765 |
| 6-Person Families | 30 (1.7%) | $96,786 |
| 7+ Person Families | 17 (0.9%) | $52,708 |
| Total | 1,823 (100.0%) | $89,814 |
Family Income by Number of Earners in Monroe County
The median family income in Monroe County is $89,814, with families comprising 3+ earners (132) having the highest median family income of $136,618, while families with 1 earner (542) have the lowest median family income of $57,500, accounting for 7.2% and 29.7% of families, respectively.
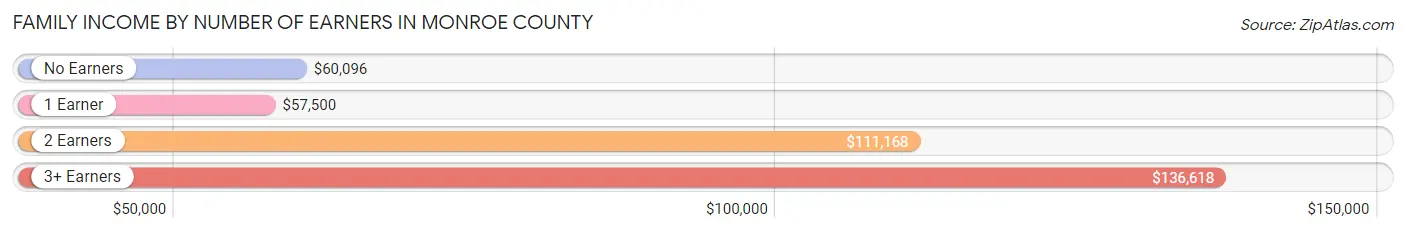
| Number of Earners | # Families | Median Income |
| No Earners | 340 (18.6%) | $60,096 |
| 1 Earner | 542 (29.7%) | $57,500 |
| 2 Earners | 809 (44.4%) | $111,168 |
| 3+ Earners | 132 (7.2%) | $136,618 |
| Total | 1,823 (100.0%) | $89,814 |
Household Income in Monroe County
Household Income Brackets in Monroe County
With 643 households falling in the category, the $100,000 to $149,999 income range is the most frequent in Monroe County, accounting for 21.2% of all households. In contrast, only 112 households (3.7%) fall into the $150,000 to $199,999 income bracket, making it the least populous group.
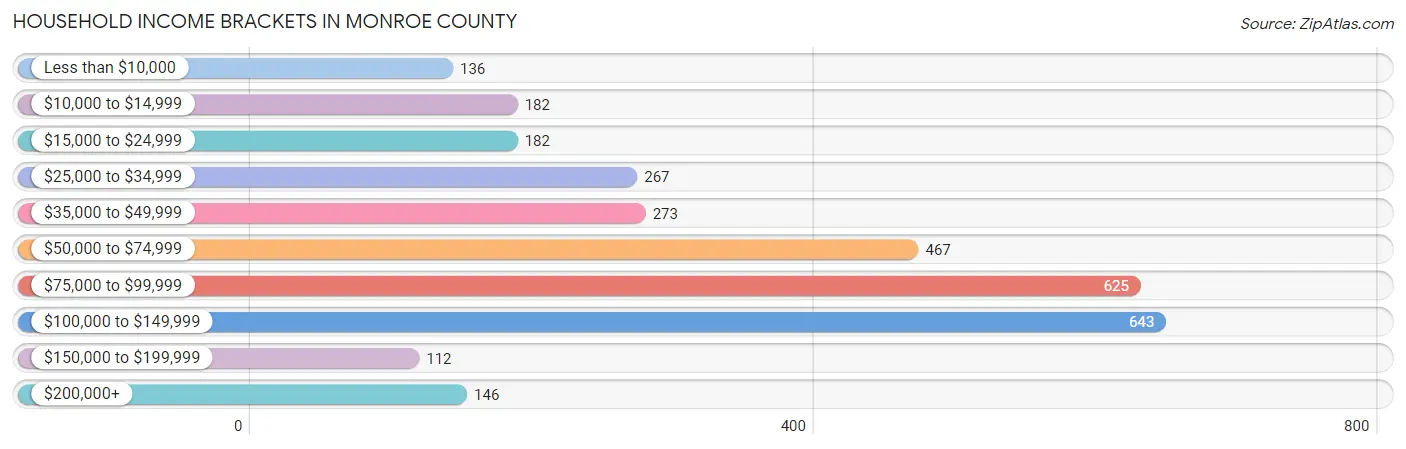
| Income Bracket | # Households | % Households |
| Less than $10,000 | 136 | 4.5% |
| $10,000 to $14,999 | 182 | 6.0% |
| $15,000 to $24,999 | 182 | 6.0% |
| $25,000 to $34,999 | 267 | 8.8% |
| $35,000 to $49,999 | 273 | 9.0% |
| $50,000 to $74,999 | 467 | 15.4% |
| $75,000 to $99,999 | 625 | 20.6% |
| $100,000 to $149,999 | 643 | 21.2% |
| $150,000 to $199,999 | 112 | 3.7% |
| $200,000+ | 146 | 4.8% |
Household Income by Householder Age in Monroe County
The median household income in Monroe County is $76,324, with the highest median household income of $96,055 found in the 25 to 44 years age bracket for the primary householder. A total of 875 households (28.9%) fall into this category. Meanwhile, the 15 to 24 years age bracket for the primary householder has the lowest median household income of $31,250, with 80 households (2.6%) in this group.
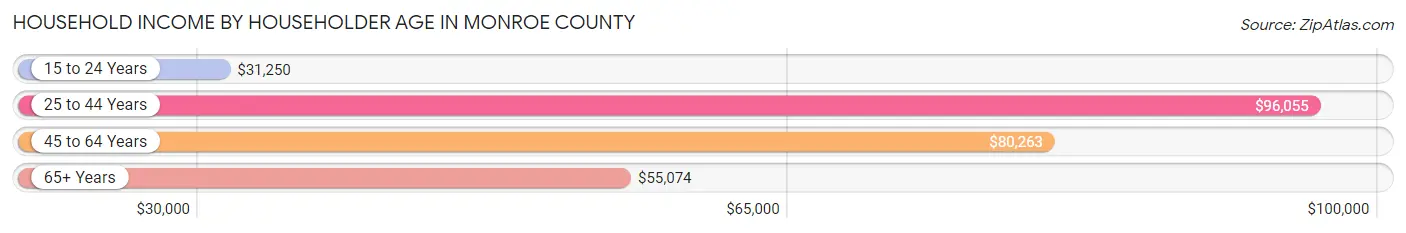
| Income Bracket | # Households | Median Income |
| 15 to 24 Years | 80 (2.6%) | $31,250 |
| 25 to 44 Years | 875 (28.9%) | $96,055 |
| 45 to 64 Years | 1,160 (38.3%) | $80,263 |
| 65+ Years | 917 (30.2%) | $55,074 |
| Total | 3,032 (100.0%) | $76,324 |
Poverty in Monroe County
Income Below Poverty by Sex and Age in Monroe County
With 9.7% poverty level for males and 11.9% for females among the residents of Monroe County, under 5 year old males and 15 year old females are the most vulnerable to poverty, with 81 males (40.1%) and 27 females (36.5%) in their respective age groups living below the poverty level.
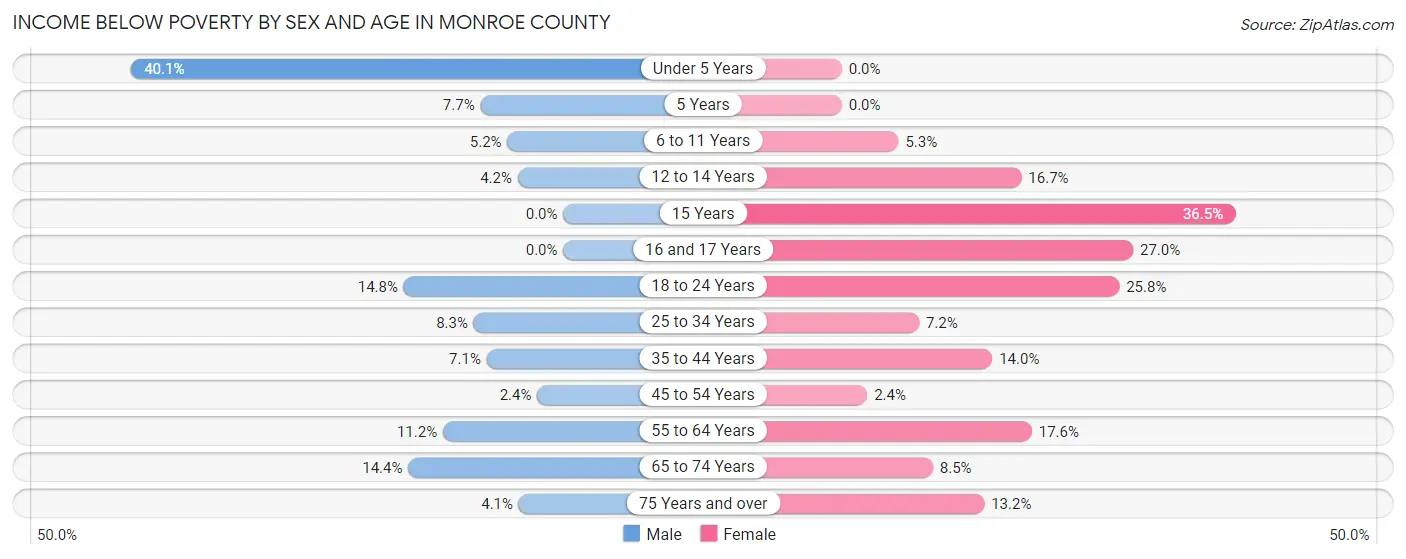
| Age Bracket | Male | Female |
| Under 5 Years | 81 (40.1%) | 0 (0.0%) |
| 5 Years | 5 (7.7%) | 0 (0.0%) |
| 6 to 11 Years | 15 (5.2%) | 13 (5.3%) |
| 12 to 14 Years | 8 (4.2%) | 35 (16.7%) |
| 15 Years | 0 (0.0%) | 27 (36.5%) |
| 16 and 17 Years | 0 (0.0%) | 30 (27.0%) |
| 18 to 24 Years | 44 (14.8%) | 69 (25.8%) |
| 25 to 34 Years | 32 (8.3%) | 27 (7.2%) |
| 35 to 44 Years | 32 (7.1%) | 61 (14.0%) |
| 45 to 54 Years | 11 (2.4%) | 11 (2.4%) |
| 55 to 64 Years | 64 (11.2%) | 95 (17.6%) |
| 65 to 74 Years | 59 (14.4%) | 37 (8.5%) |
| 75 Years and over | 10 (4.1%) | 39 (13.2%) |
| Total | 361 (9.7%) | 444 (11.9%) |
Income Above Poverty by Sex and Age in Monroe County
According to the poverty statistics in Monroe County, males aged 15 years and females aged under 5 years are the age groups that are most secure financially, with 100.0% of males and 100.0% of females in these age groups living above the poverty line.
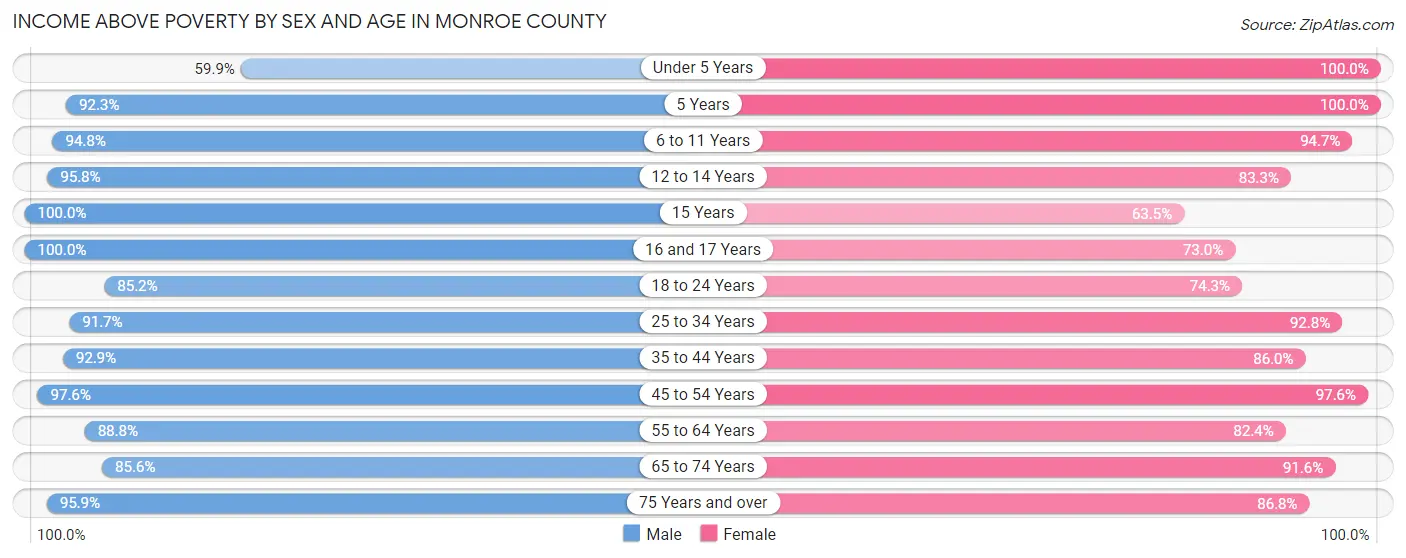
| Age Bracket | Male | Female |
| Under 5 Years | 121 (59.9%) | 256 (100.0%) |
| 5 Years | 60 (92.3%) | 3 (100.0%) |
| 6 to 11 Years | 274 (94.8%) | 234 (94.7%) |
| 12 to 14 Years | 181 (95.8%) | 175 (83.3%) |
| 15 Years | 26 (100.0%) | 47 (63.5%) |
| 16 and 17 Years | 131 (100.0%) | 81 (73.0%) |
| 18 to 24 Years | 253 (85.2%) | 199 (74.3%) |
| 25 to 34 Years | 353 (91.7%) | 350 (92.8%) |
| 35 to 44 Years | 418 (92.9%) | 376 (86.0%) |
| 45 to 54 Years | 444 (97.6%) | 455 (97.6%) |
| 55 to 64 Years | 509 (88.8%) | 444 (82.4%) |
| 65 to 74 Years | 351 (85.6%) | 401 (91.5%) |
| 75 Years and over | 232 (95.9%) | 256 (86.8%) |
| Total | 3,353 (90.3%) | 3,277 (88.1%) |
Income Below Poverty Among Married-Couple Families in Monroe County
The poverty statistics for married-couple families in Monroe County show that 2.3% or 34 of the total 1,468 families live below the poverty line. Families with 5 or more children have the highest poverty rate of 57.1%, comprising of 8 families. On the other hand, families with 3 or 4 children have the lowest poverty rate of 0.0%, which includes 0 families.
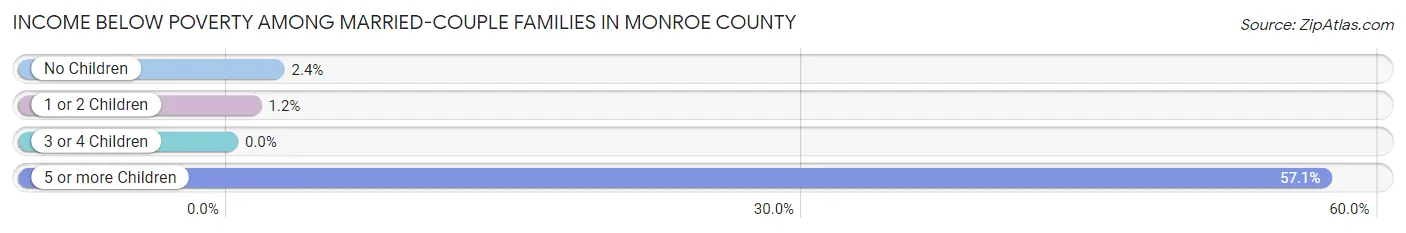
| Children | Above Poverty | Below Poverty |
| No Children | 844 (97.6%) | 21 (2.4%) |
| 1 or 2 Children | 401 (98.8%) | 5 (1.2%) |
| 3 or 4 Children | 183 (100.0%) | 0 (0.0%) |
| 5 or more Children | 6 (42.9%) | 8 (57.1%) |
| Total | 1,434 (97.7%) | 34 (2.3%) |
Income Below Poverty Among Single-Parent Households in Monroe County
According to the poverty data in Monroe County, 4.3% or 6 single-father households and 24.5% or 53 single-mother households are living below the poverty line. Among single-father households, those with no children have the highest poverty rate, with 5 households (7.1%) experiencing poverty. Likewise, among single-mother households, those with 3 or 4 children have the highest poverty rate, with 20 households (100.0%) falling below the poverty line.
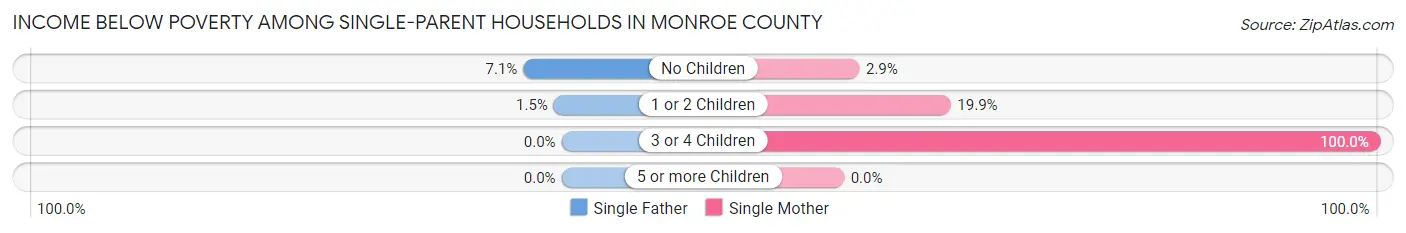
| Children | Single Father | Single Mother |
| No Children | 5 (7.1%) | 1 (2.9%) |
| 1 or 2 Children | 1 (1.5%) | 32 (19.9%) |
| 3 or 4 Children | 0 (0.0%) | 20 (100.0%) |
| 5 or more Children | 0 (0.0%) | 0 (0.0%) |
| Total | 6 (4.3%) | 53 (24.5%) |
Income Below Poverty Among Married-Couple vs Single-Parent Households in Monroe County
The poverty data for Monroe County shows that 34 of the married-couple family households (2.3%) and 59 of the single-parent households (16.6%) are living below the poverty level. Within the married-couple family households, those with 5 or more children have the highest poverty rate, with 8 households (57.1%) falling below the poverty line. Among the single-parent households, those with 3 or 4 children have the highest poverty rate, with 20 household (100.0%) living below poverty.
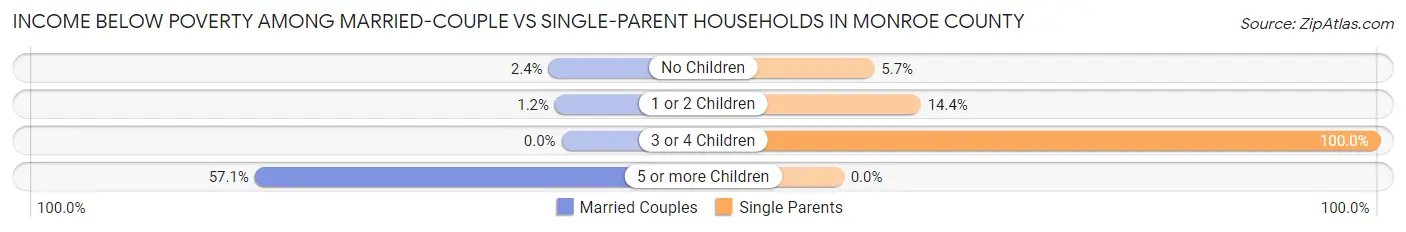
| Children | Married-Couple Families | Single-Parent Households |
| No Children | 21 (2.4%) | 6 (5.7%) |
| 1 or 2 Children | 5 (1.2%) | 33 (14.3%) |
| 3 or 4 Children | 0 (0.0%) | 20 (100.0%) |
| 5 or more Children | 8 (57.1%) | 0 (0.0%) |
| Total | 34 (2.3%) | 59 (16.6%) |
Race in Monroe County
The most populous races in Monroe County are White / Caucasian (7,167 | 94.6%), Two or more Races (318 | 4.2%), and Asian (59 | 0.8%).
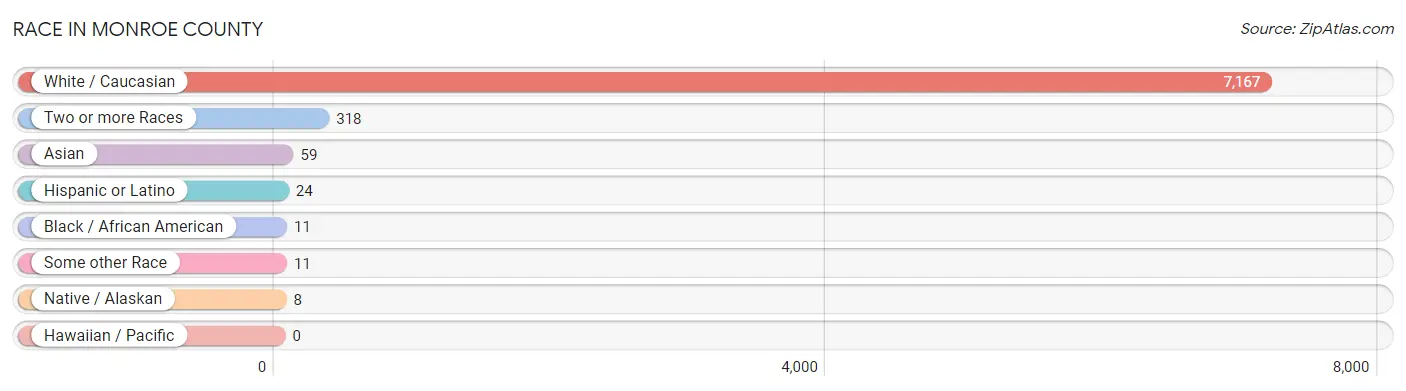
| Race | # Population | % Population |
| Asian | 59 | 0.8% |
| Black / African American | 11 | 0.2% |
| Hawaiian / Pacific | 0 | 0.0% |
| Hispanic or Latino | 24 | 0.3% |
| Native / Alaskan | 8 | 0.1% |
| White / Caucasian | 7,167 | 94.6% |
| Two or more Races | 318 | 4.2% |
| Some other Race | 11 | 0.2% |
| Total | 7,574 | 100.0% |
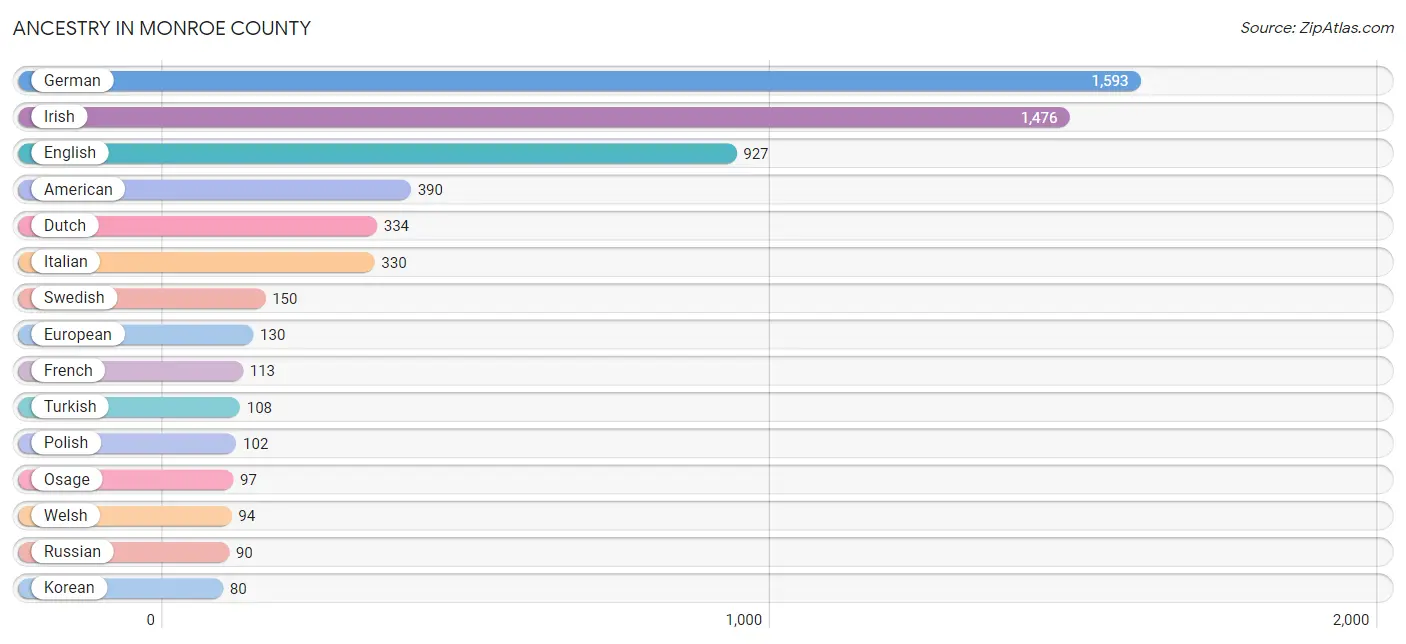
Ancestry in Monroe County
The most populous ancestries reported in Monroe County are German (1,593 | 21.0%), Irish (1,476 | 19.5%), English (927 | 12.2%), American (390 | 5.1%), and Dutch (334 | 4.4%), together accounting for 62.3% of all Monroe County residents.
| Ancestry | # Population | % Population |
| American | 390 | 5.1% |
| Austrian | 13 | 0.2% |
| Blackfeet | 1 | 0.0% |
| British | 66 | 0.9% |
| Canadian | 33 | 0.4% |
| Central American | 24 | 0.3% |
| Cherokee | 17 | 0.2% |
| Choctaw | 11 | 0.2% |
| Croatian | 21 | 0.3% |
| Czech | 73 | 1.0% |
| Czechoslovakian | 31 | 0.4% |
| Danish | 34 | 0.4% |
| Dutch | 334 | 4.4% |
| Eastern European | 5 | 0.1% |
| English | 927 | 12.2% |
| Estonian | 18 | 0.2% |
| European | 130 | 1.7% |
| Finnish | 53 | 0.7% |
| French | 113 | 1.5% |
| German | 1,593 | 21.0% |
| Hungarian | 1 | 0.0% |
| Irish | 1,476 | 19.5% |
| Italian | 330 | 4.4% |
| Korean | 80 | 1.1% |
| Lithuanian | 6 | 0.1% |
| Northern European | 15 | 0.2% |
| Norwegian | 60 | 0.8% |
| Osage | 97 | 1.3% |
| Panamanian | 24 | 0.3% |
| Polish | 102 | 1.3% |
| Russian | 90 | 1.2% |
| Scandinavian | 43 | 0.6% |
| Scotch-Irish | 17 | 0.2% |
| Scottish | 35 | 0.5% |
| Seminole | 1 | 0.0% |
| Slovak | 14 | 0.2% |
| South African | 19 | 0.3% |
| Subsaharan African | 19 | 0.3% |
| Swedish | 150 | 2.0% |
| Swiss | 6 | 0.1% |
| Turkish | 108 | 1.4% |
| Welsh | 94 | 1.2% |
| Yugoslavian | 1 | 0.0% | View All 43 Rows |
Immigrants in Monroe County
The most numerous immigrant groups reported in Monroe County came from Asia (59 | 0.8%), South Eastern Asia (59 | 0.8%), Eastern Europe (57 | 0.7%), Europe (57 | 0.7%), and Russia (57 | 0.7%), together accounting for 3.8% of all Monroe County residents.
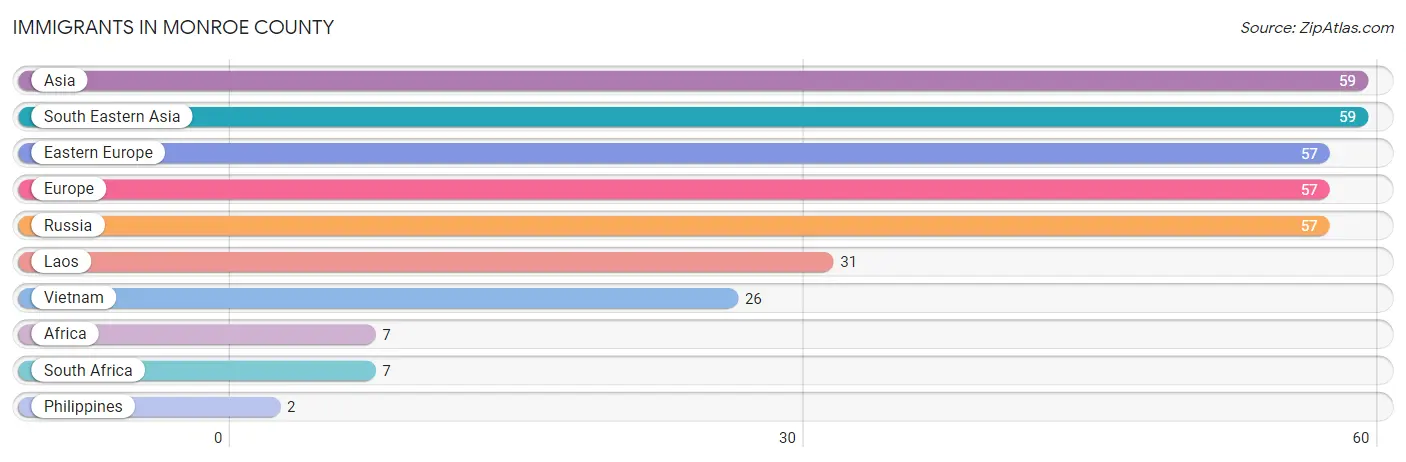
| Immigration Origin | # Population | % Population |
| Africa | 7 | 0.1% |
| Asia | 59 | 0.8% |
| Eastern Europe | 57 | 0.7% |
| Europe | 57 | 0.7% |
| Laos | 31 | 0.4% |
| Philippines | 2 | 0.0% |
| Russia | 57 | 0.7% |
| South Africa | 7 | 0.1% |
| South Eastern Asia | 59 | 0.8% |
| Vietnam | 26 | 0.3% | View All 10 Rows |
Sex and Age in Monroe County
Sex and Age in Monroe County
The most populous age groups in Monroe County are 55 to 59 Years (367 | 9.7%) for men and 10 to 14 Years (308 | 8.1%) for women.
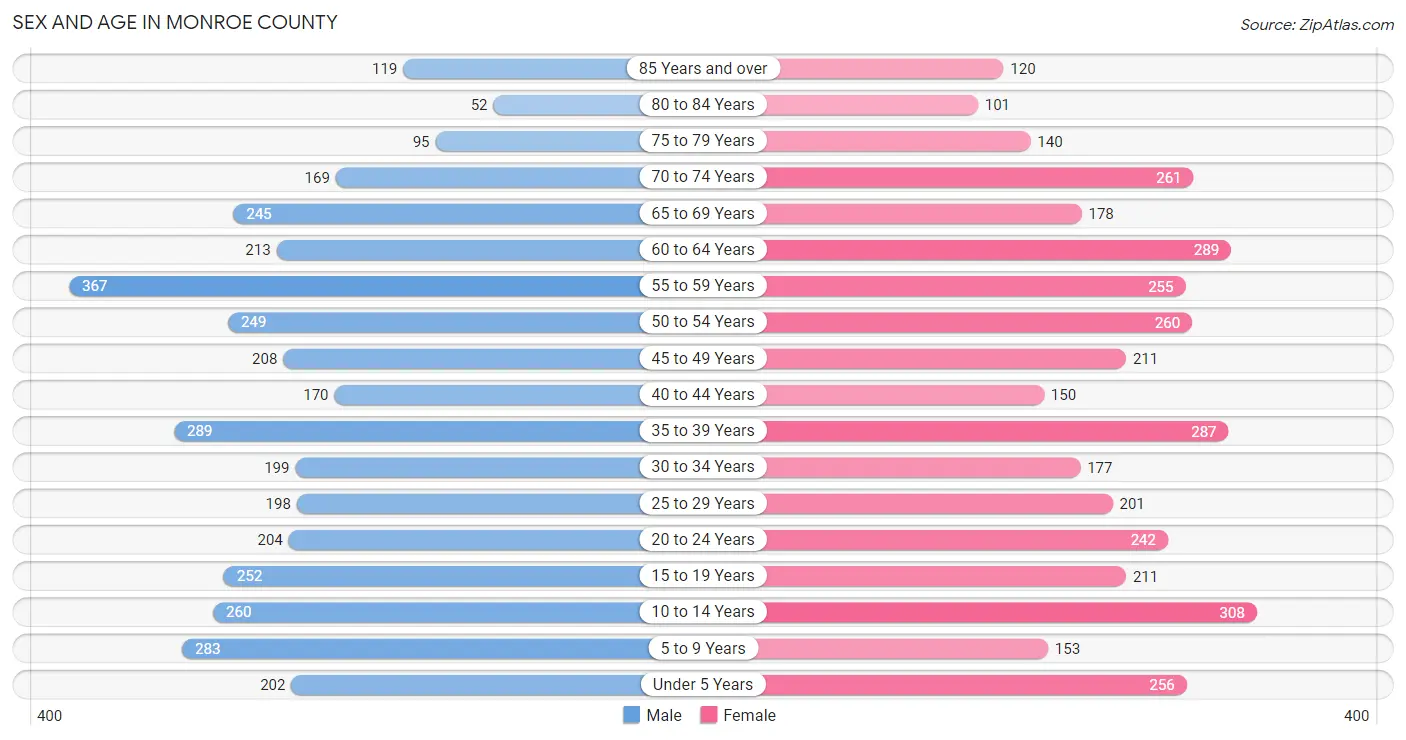
| Age Bracket | Male | Female |
| Under 5 Years | 202 (5.3%) | 256 (6.7%) |
| 5 to 9 Years | 283 (7.5%) | 153 (4.0%) |
| 10 to 14 Years | 260 (6.9%) | 308 (8.1%) |
| 15 to 19 Years | 252 (6.7%) | 211 (5.6%) |
| 20 to 24 Years | 204 (5.4%) | 242 (6.4%) |
| 25 to 29 Years | 198 (5.2%) | 201 (5.3%) |
| 30 to 34 Years | 199 (5.3%) | 177 (4.7%) |
| 35 to 39 Years | 289 (7.7%) | 287 (7.5%) |
| 40 to 44 Years | 170 (4.5%) | 150 (4.0%) |
| 45 to 49 Years | 208 (5.5%) | 211 (5.6%) |
| 50 to 54 Years | 249 (6.6%) | 260 (6.8%) |
| 55 to 59 Years | 367 (9.7%) | 255 (6.7%) |
| 60 to 64 Years | 213 (5.6%) | 289 (7.6%) |
| 65 to 69 Years | 245 (6.5%) | 178 (4.7%) |
| 70 to 74 Years | 169 (4.5%) | 261 (6.9%) |
| 75 to 79 Years | 95 (2.5%) | 140 (3.7%) |
| 80 to 84 Years | 52 (1.4%) | 101 (2.7%) |
| 85 Years and over | 119 (3.2%) | 120 (3.2%) |
| Total | 3,774 (100.0%) | 3,800 (100.0%) |
Families and Households in Monroe County
Median Family Size in Monroe County
The median family size in Monroe County is 3.20 persons per family, with single female/mother families (216 | 11.8%) accounting for the largest median family size of 3.45 persons per family. On the other hand, single male/father families (139 | 7.6%) represent the smallest median family size with 2.79 persons per family.
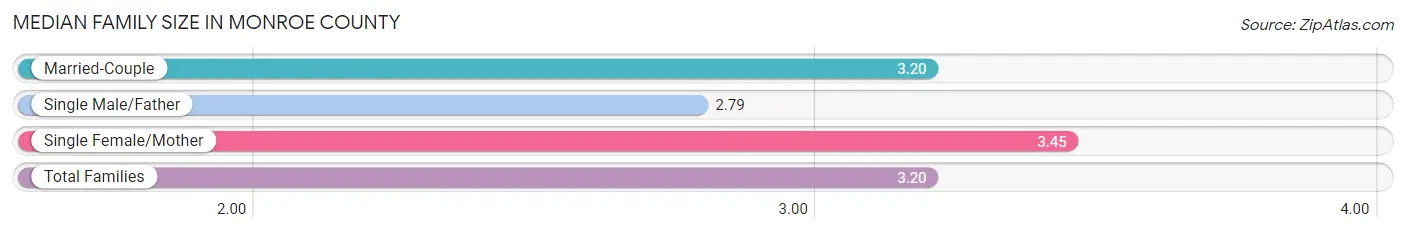
| Family Type | # Families | Family Size |
| Married-Couple | 1,468 (80.5%) | 3.20 |
| Single Male/Father | 139 (7.6%) | 2.79 |
| Single Female/Mother | 216 (11.8%) | 3.45 |
| Total Families | 1,823 (100.0%) | 3.20 |
Median Household Size in Monroe County
The median household size in Monroe County is 2.45 persons per household, with single female/mother households (216 | 7.1%) accounting for the largest median household size of 3.93 persons per household. non-family households (1,209 | 39.9%) represent the smallest median household size with 1.19 persons per household.
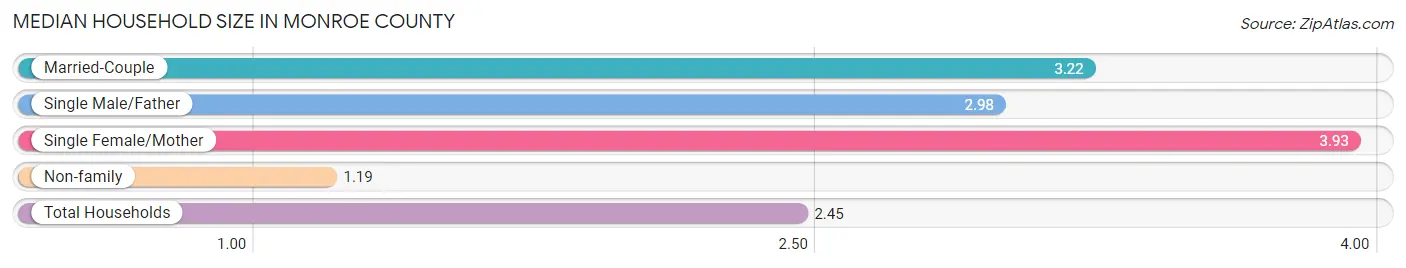
| Household Type | # Households | Household Size |
| Married-Couple | 1,468 (48.4%) | 3.22 |
| Single Male/Father | 139 (4.6%) | 2.98 |
| Single Female/Mother | 216 (7.1%) | 3.93 |
| Non-family | 1,209 (39.9%) | 1.19 |
| Total Households | 3,032 (100.0%) | 2.45 |
Household Size by Marriage Status in Monroe County
Out of a total of 3,032 households in Monroe County, 1,823 (60.1%) are family households, while 1,209 (39.9%) are nonfamily households. The most numerous type of family households are 2-person households, comprising 909, and the most common type of nonfamily households are 1-person households, comprising 1,050.
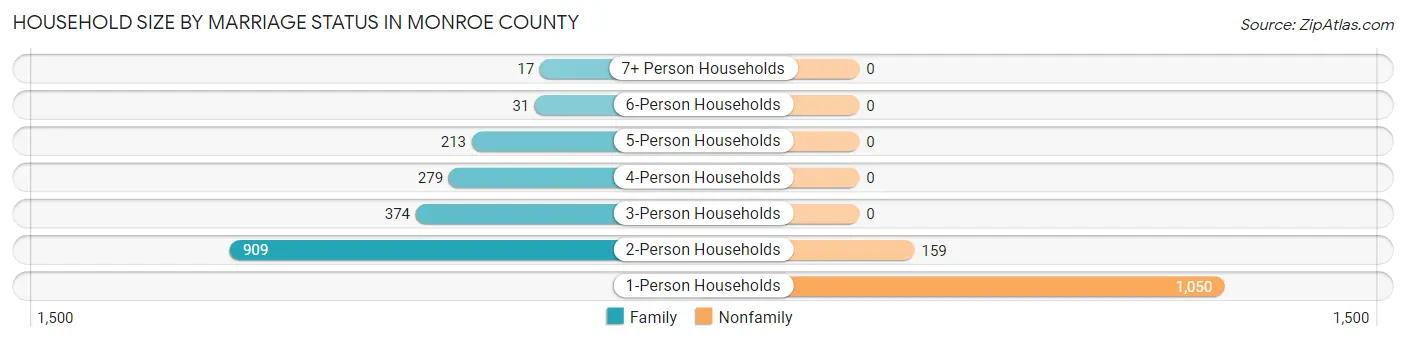
| Household Size | Family Households | Nonfamily Households |
| 1-Person Households | - | 1,050 (34.6%) |
| 2-Person Households | 909 (30.0%) | 159 (5.2%) |
| 3-Person Households | 374 (12.3%) | 0 (0.0%) |
| 4-Person Households | 279 (9.2%) | 0 (0.0%) |
| 5-Person Households | 213 (7.0%) | 0 (0.0%) |
| 6-Person Households | 31 (1.0%) | 0 (0.0%) |
| 7+ Person Households | 17 (0.6%) | 0 (0.0%) |
| Total | 1,823 (60.1%) | 1,209 (39.9%) |
Female Fertility in Monroe County
Fertility by Age in Monroe County
Average fertility rate in Monroe County is 112.0 births per 1,000 women. Women in the age bracket of 20 to 34 years have the highest fertility rate with 277.0 births per 1,000 women. Women in the age bracket of 20 to 34 years acount for 100.0% of all women with births.
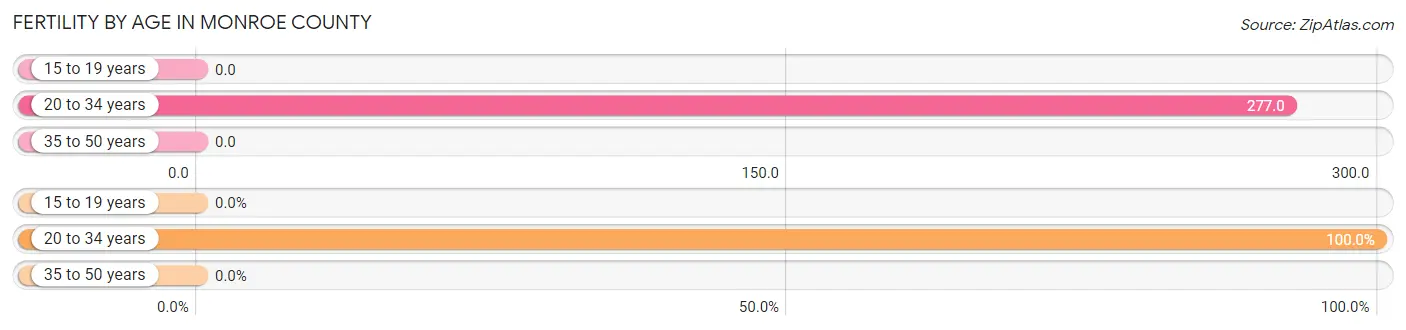
| Age Bracket | Women with Births | Births / 1,000 Women |
| 15 to 19 years | 0 (0.0%) | 0.0 |
| 20 to 34 years | 172 (100.0%) | 277.0 |
| 35 to 50 years | 0 (0.0%) | 0.0 |
| Total | 172 (100.0%) | 112.0 |
Fertility by Age by Marriage Status in Monroe County
76.7% of women with births (172) in Monroe County are married. The highest percentage of unmarried women with births falls into 20 to 34 years age bracket with 23.3% of them unmarried at the time of birth, while the lowest percentage of unmarried women with births belong to 20 to 34 years age bracket with 23.3% of them unmarried.
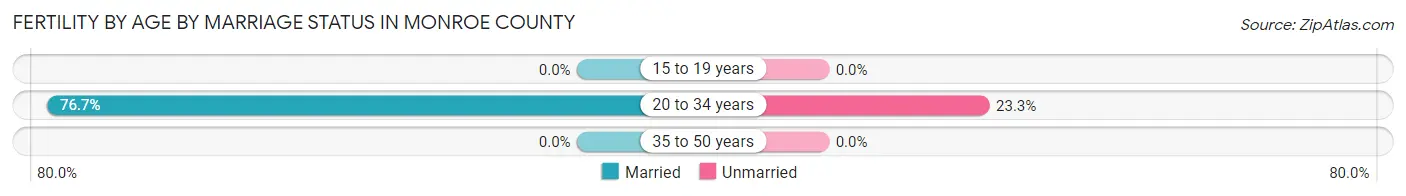
| Age Bracket | Married | Unmarried |
| 15 to 19 years | 0 (0.0%) | 0 (0.0%) |
| 20 to 34 years | 132 (76.7%) | 40 (23.3%) |
| 35 to 50 years | 0 (0.0%) | 0 (0.0%) |
| Total | 132 (76.7%) | 40 (23.3%) |
Fertility by Education in Monroe County
Average fertility rate in Monroe County is 112.0 births per 1,000 women. Women with the education attainment of graduate degree have the highest fertility rate of 372.0 births per 1,000 women, while women with the education attainment of college or associate's degree have the lowest fertility at 33.0 births per 1,000 women. Women with the education attainment of bachelor's degree represent 44.8% of all women with births.
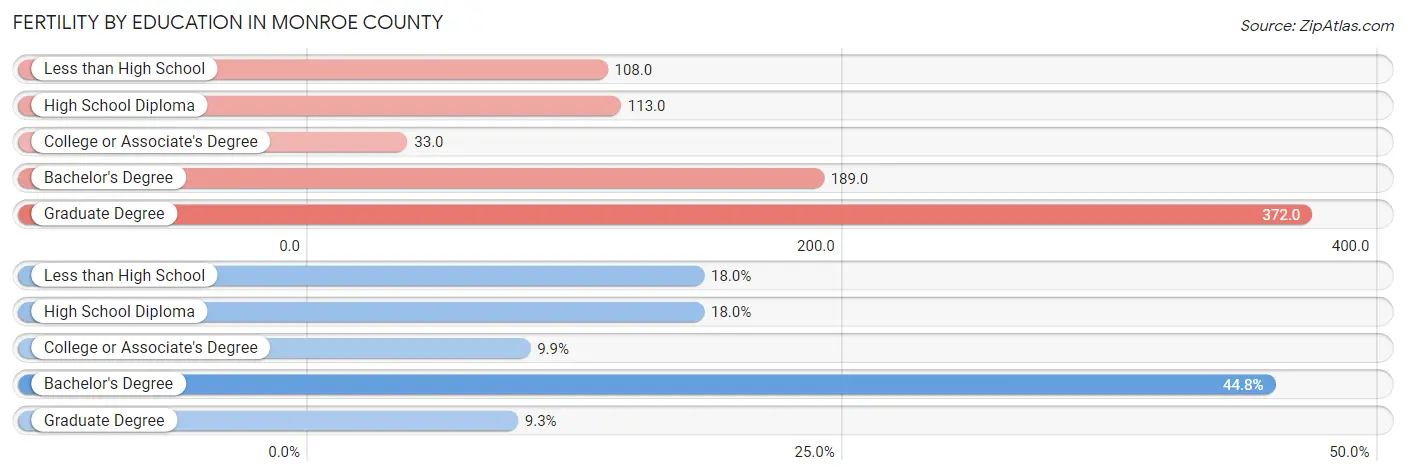
| Educational Attainment | Women with Births | Births / 1,000 Women |
| Less than High School | 31 (18.0%) | 108.0 |
| High School Diploma | 31 (18.0%) | 113.0 |
| College or Associate's Degree | 17 (9.9%) | 33.0 |
| Bachelor's Degree | 77 (44.8%) | 189.0 |
| Graduate Degree | 16 (9.3%) | 372.0 |
| Total | 172 (100.0%) | 112.0 |
Fertility by Education by Marriage Status in Monroe County
23.3% of women with births in Monroe County are unmarried. Women with the educational attainment of less than high school are most likely to be married with 100.0% of them married at childbirth, while women with the educational attainment of college or associate's degree are least likely to be married with 100.0% of them unmarried at childbirth.
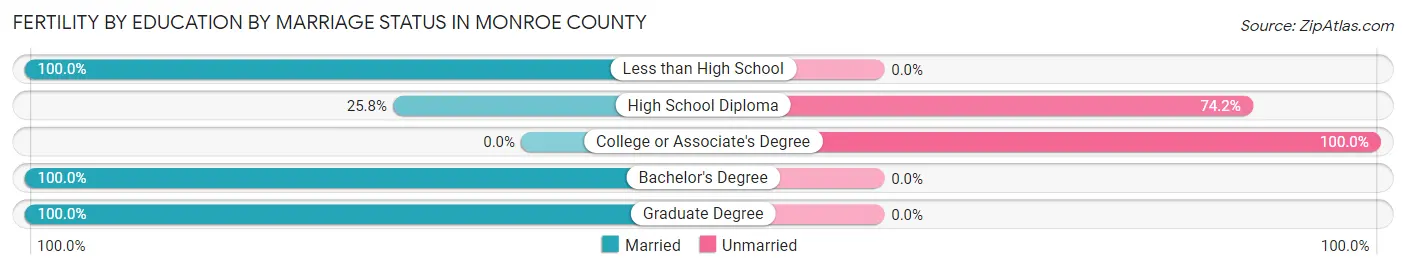
| Educational Attainment | Married | Unmarried |
| Less than High School | 31 (100.0%) | 0 (0.0%) |
| High School Diploma | 8 (25.8%) | 23 (74.2%) |
| College or Associate's Degree | 0 (0.0%) | 17 (100.0%) |
| Bachelor's Degree | 77 (100.0%) | 0 (0.0%) |
| Graduate Degree | 16 (100.0%) | 0 (0.0%) |
| Total | 132 (76.7%) | 40 (23.3%) |
Employment Characteristics in Monroe County
Employment by Class of Employer in Monroe County
Among the 3,579 employed individuals in Monroe County, private company employees (2,188 | 61.1%), local government employees (530 | 14.8%), and not-for-profit organizations (259 | 7.2%) make up the most common classes of employment.
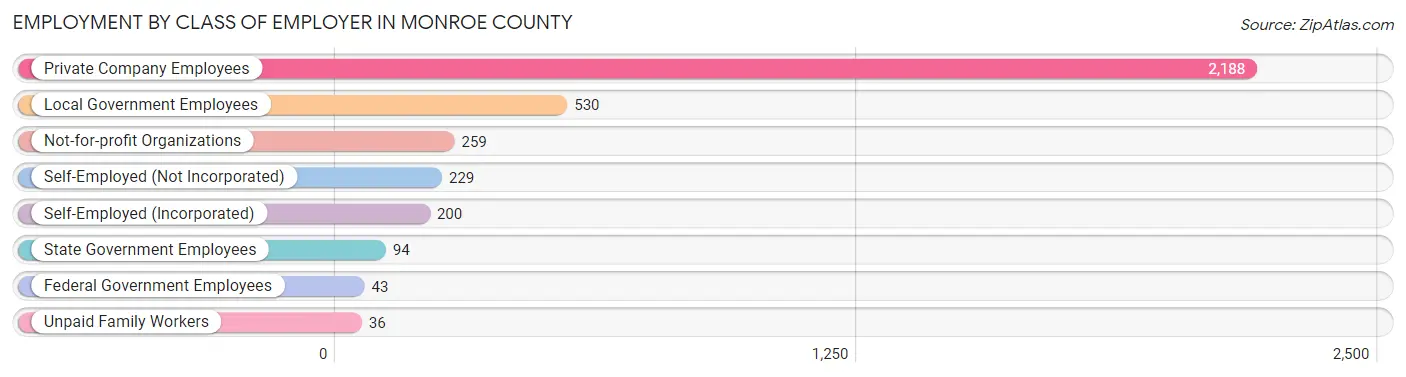
| Employer Class | # Employees | % Employees |
| Private Company Employees | 2,188 | 61.1% |
| Self-Employed (Incorporated) | 200 | 5.6% |
| Self-Employed (Not Incorporated) | 229 | 6.4% |
| Not-for-profit Organizations | 259 | 7.2% |
| Local Government Employees | 530 | 14.8% |
| State Government Employees | 94 | 2.6% |
| Federal Government Employees | 43 | 1.2% |
| Unpaid Family Workers | 36 | 1.0% |
| Total | 3,579 | 100.0% |
Employment Status by Age in Monroe County
According to the labor force statistics for Monroe County, out of the total population over 16 years of age (6,011), 62.1% or 3,733 individuals are in the labor force, with 3.4% or 127 of them unemployed. The age group with the highest labor force participation rate is 35 to 44 years, with 89.8% or 805 individuals in the labor force. Within the labor force, the 16 to 19 years age range has the highest percentage of unemployed individuals, with 10.8% or 13 of them being unemployed.
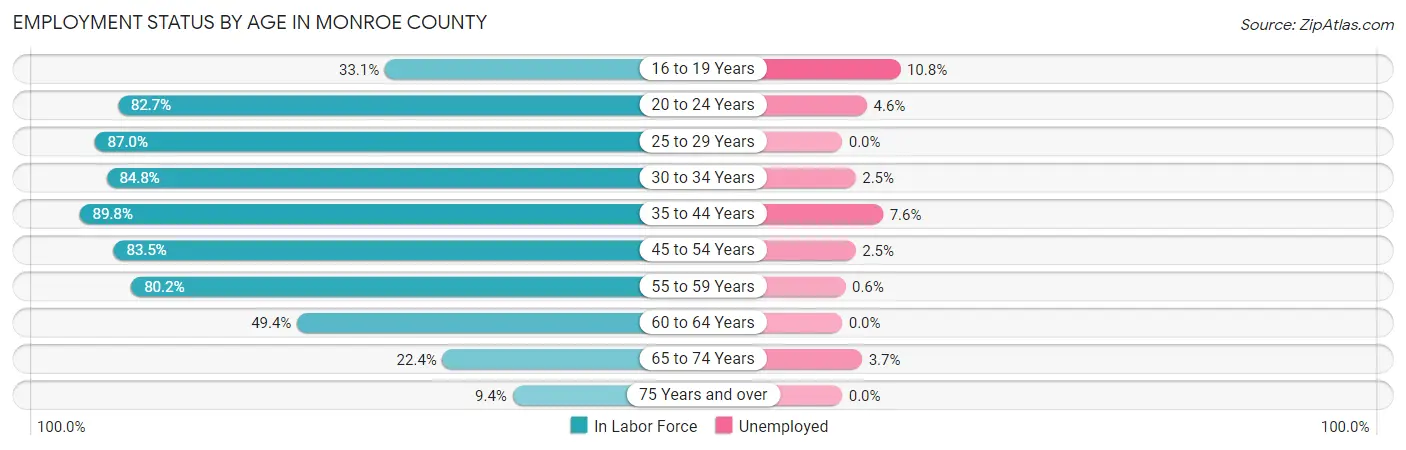
| Age Bracket | In Labor Force | Unemployed |
| 16 to 19 Years | 120 (33.1%) | 13 (10.8%) |
| 20 to 24 Years | 369 (82.7%) | 17 (4.6%) |
| 25 to 29 Years | 347 (87.0%) | 0 (0.0%) |
| 30 to 34 Years | 319 (84.8%) | 8 (2.5%) |
| 35 to 44 Years | 805 (89.8%) | 61 (7.6%) |
| 45 to 54 Years | 775 (83.5%) | 19 (2.5%) |
| 55 to 59 Years | 499 (80.2%) | 3 (0.6%) |
| 60 to 64 Years | 248 (49.4%) | 0 (0.0%) |
| 65 to 74 Years | 191 (22.4%) | 7 (3.7%) |
| 75 Years and over | 59 (9.4%) | 0 (0.0%) |
| Total | 3,733 (62.1%) | 127 (3.4%) |
Employment Status by Educational Attainment in Monroe County
According to labor force statistics for Monroe County, 80.4% of individuals (2,993) out of the total population between 25 and 64 years of age (3,723) are in the labor force, with 3.0% or 90 of them being unemployed. The group with the highest labor force participation rate are those with the educational attainment of bachelor's degree or higher, with 87.6% or 790 individuals in the labor force. Within the labor force, individuals with less than high school education have the highest percentage of unemployment, with 17.4% or 28 of them being unemployed.
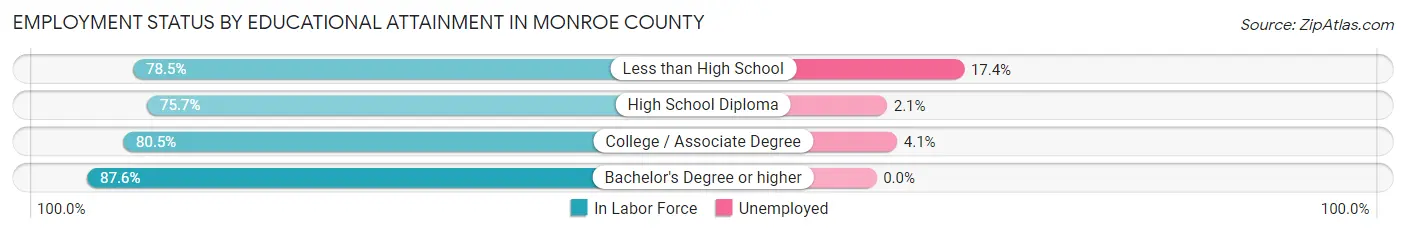
| Educational Attainment | In Labor Force | Unemployed |
| Less than High School | 161 (78.5%) | 36 (17.4%) |
| High School Diploma | 1,020 (75.7%) | 28 (2.1%) |
| College / Associate Degree | 1,022 (80.5%) | 52 (4.1%) |
| Bachelor's Degree or higher | 790 (87.6%) | 0 (0.0%) |
| Total | 2,993 (80.4%) | 112 (3.0%) |
Employment Occupations by Sex in Monroe County
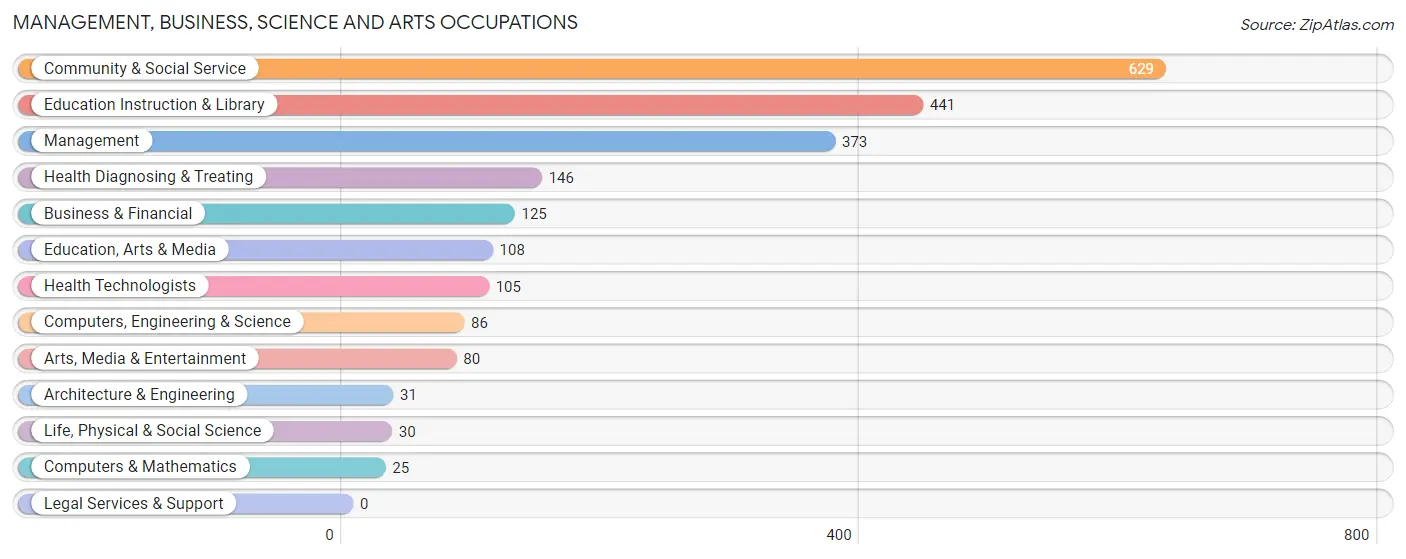
Management, Business, Science and Arts Occupations
The most common Management, Business, Science and Arts occupations in Monroe County are Community & Social Service (629 | 17.4%), Education Instruction & Library (441 | 12.2%), Management (373 | 10.3%), Health Diagnosing & Treating (146 | 4.1%), and Business & Financial (125 | 3.5%).
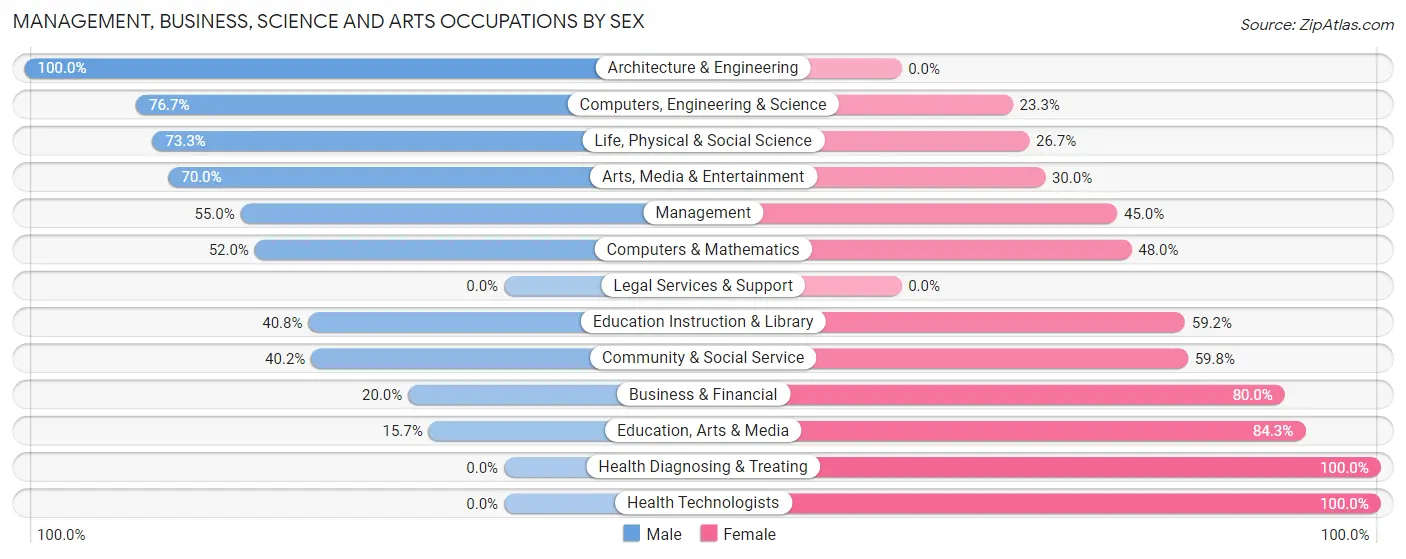
Management, Business, Science and Arts Occupations by Sex
Within the Management, Business, Science and Arts occupations in Monroe County, the most male-oriented occupations are Architecture & Engineering (100.0%), Computers, Engineering & Science (76.7%), and Life, Physical & Social Science (73.3%), while the most female-oriented occupations are Health Diagnosing & Treating (100.0%), Health Technologists (100.0%), and Education, Arts & Media (84.3%).
| Occupation | Male | Female |
| Management | 205 (55.0%) | 168 (45.0%) |
| Business & Financial | 25 (20.0%) | 100 (80.0%) |
| Computers, Engineering & Science | 66 (76.7%) | 20 (23.3%) |
| Computers & Mathematics | 13 (52.0%) | 12 (48.0%) |
| Architecture & Engineering | 31 (100.0%) | 0 (0.0%) |
| Life, Physical & Social Science | 22 (73.3%) | 8 (26.7%) |
| Community & Social Service | 253 (40.2%) | 376 (59.8%) |
| Education, Arts & Media | 17 (15.7%) | 91 (84.3%) |
| Legal Services & Support | 0 (0.0%) | 0 (0.0%) |
| Education Instruction & Library | 180 (40.8%) | 261 (59.2%) |
| Arts, Media & Entertainment | 56 (70.0%) | 24 (30.0%) |
| Health Diagnosing & Treating | 0 (0.0%) | 146 (100.0%) |
| Health Technologists | 0 (0.0%) | 105 (100.0%) |
| Total (Category) | 549 (40.4%) | 810 (59.6%) |
| Total (Overall) | 1,865 (51.7%) | 1,739 (48.2%) |
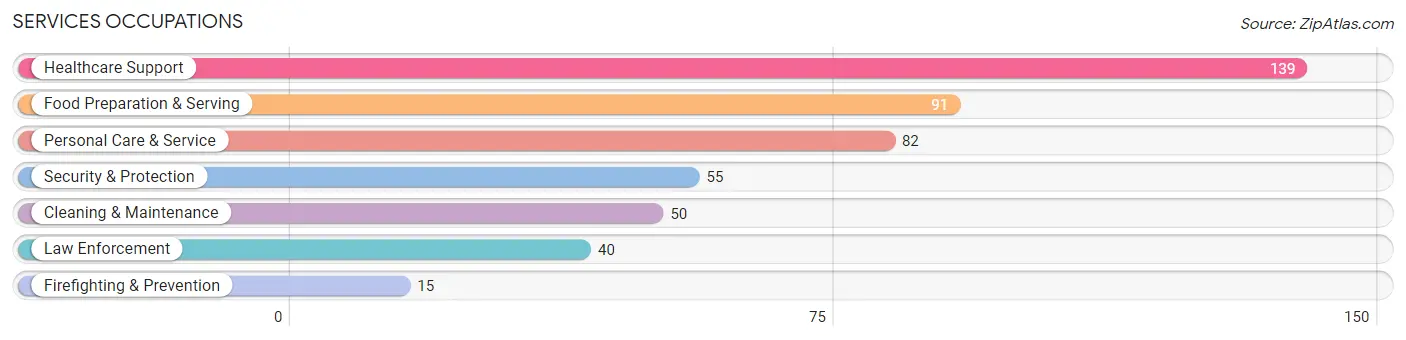
Services Occupations
The most common Services occupations in Monroe County are Healthcare Support (139 | 3.9%), Food Preparation & Serving (91 | 2.5%), Personal Care & Service (82 | 2.3%), Security & Protection (55 | 1.5%), and Cleaning & Maintenance (50 | 1.4%).
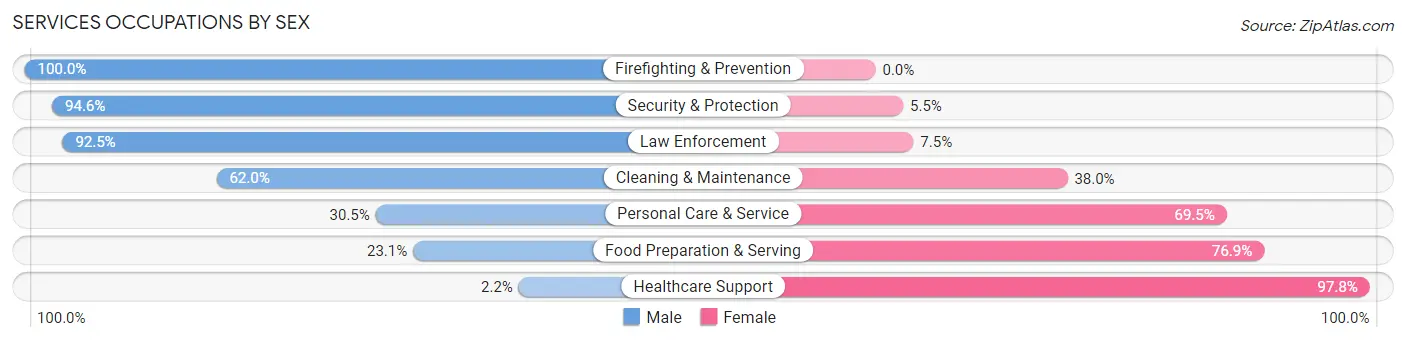
Services Occupations by Sex
Within the Services occupations in Monroe County, the most male-oriented occupations are Firefighting & Prevention (100.0%), Security & Protection (94.6%), and Law Enforcement (92.5%), while the most female-oriented occupations are Healthcare Support (97.8%), Food Preparation & Serving (76.9%), and Personal Care & Service (69.5%).
| Occupation | Male | Female |
| Healthcare Support | 3 (2.2%) | 136 (97.8%) |
| Security & Protection | 52 (94.6%) | 3 (5.4%) |
| Firefighting & Prevention | 15 (100.0%) | 0 (0.0%) |
| Law Enforcement | 37 (92.5%) | 3 (7.5%) |
| Food Preparation & Serving | 21 (23.1%) | 70 (76.9%) |
| Cleaning & Maintenance | 31 (62.0%) | 19 (38.0%) |
| Personal Care & Service | 25 (30.5%) | 57 (69.5%) |
| Total (Category) | 132 (31.7%) | 285 (68.3%) |
| Total (Overall) | 1,865 (51.7%) | 1,739 (48.2%) |
Sales and Office Occupations
The most common Sales and Office occupations in Monroe County are Office & Administration (357 | 9.9%), and Sales & Related (344 | 9.5%).
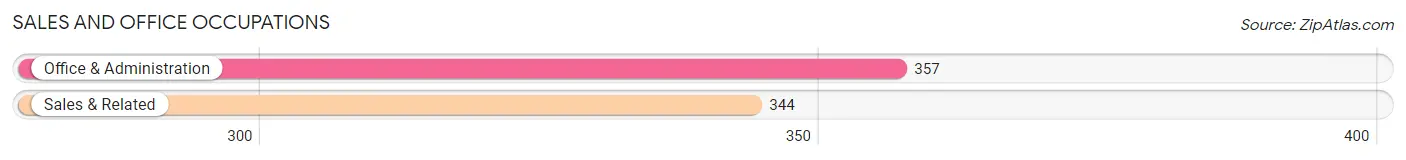
Sales and Office Occupations by Sex
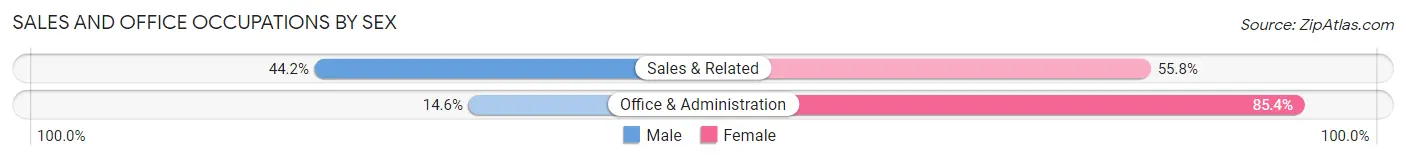
| Occupation | Male | Female |
| Sales & Related | 152 (44.2%) | 192 (55.8%) |
| Office & Administration | 52 (14.6%) | 305 (85.4%) |
| Total (Category) | 204 (29.1%) | 497 (70.9%) |
| Total (Overall) | 1,865 (51.7%) | 1,739 (48.2%) |
Natural Resources, Construction and Maintenance Occupations
The most common Natural Resources, Construction and Maintenance occupations in Monroe County are Installation, Maintenance & Repair (207 | 5.7%), Construction & Extraction (154 | 4.3%), and Farming, Fishing & Forestry (71 | 2.0%).
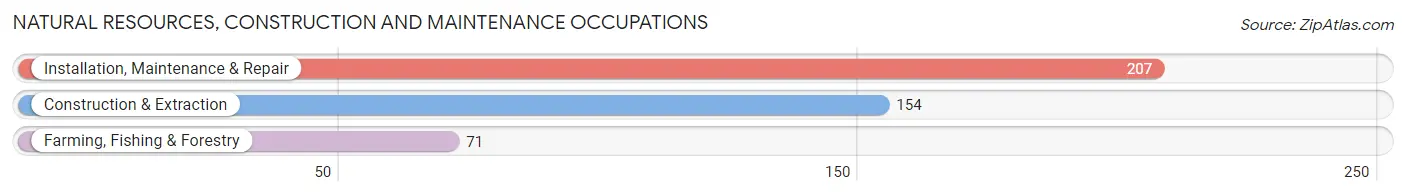
Natural Resources, Construction and Maintenance Occupations by Sex
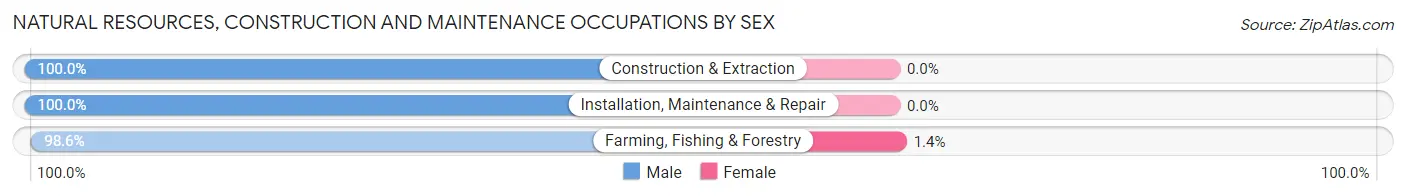
| Occupation | Male | Female |
| Farming, Fishing & Forestry | 70 (98.6%) | 1 (1.4%) |
| Construction & Extraction | 154 (100.0%) | 0 (0.0%) |
| Installation, Maintenance & Repair | 207 (100.0%) | 0 (0.0%) |
| Total (Category) | 431 (99.8%) | 1 (0.2%) |
| Total (Overall) | 1,865 (51.7%) | 1,739 (48.2%) |
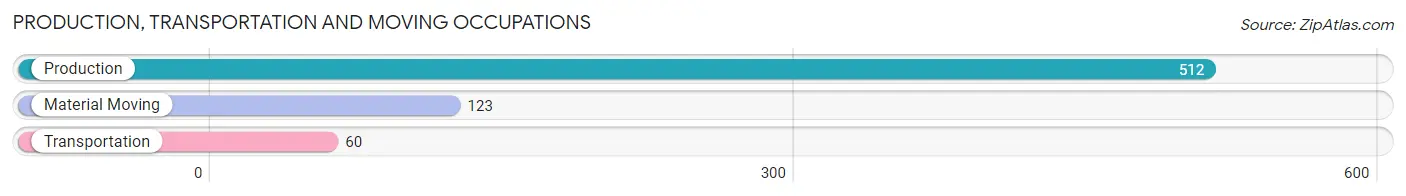
Production, Transportation and Moving Occupations
The most common Production, Transportation and Moving occupations in Monroe County are Production (512 | 14.2%), Material Moving (123 | 3.4%), and Transportation (60 | 1.7%).
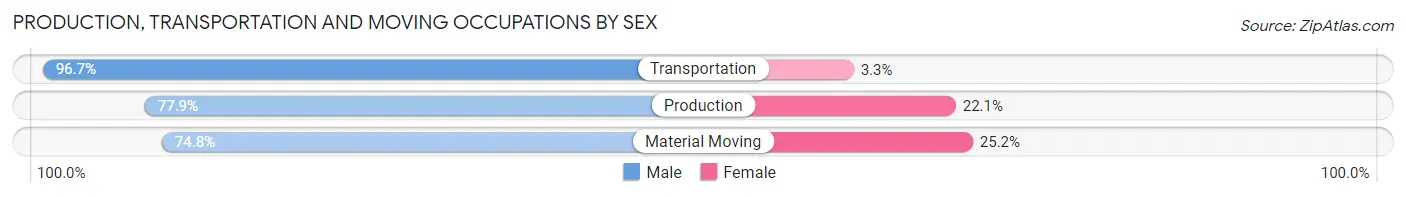
Production, Transportation and Moving Occupations by Sex
| Occupation | Male | Female |
| Production | 399 (77.9%) | 113 (22.1%) |
| Transportation | 58 (96.7%) | 2 (3.3%) |
| Material Moving | 92 (74.8%) | 31 (25.2%) |
| Total (Category) | 549 (79.0%) | 146 (21.0%) |
| Total (Overall) | 1,865 (51.7%) | 1,739 (48.2%) |
Employment Industries by Sex in Monroe County
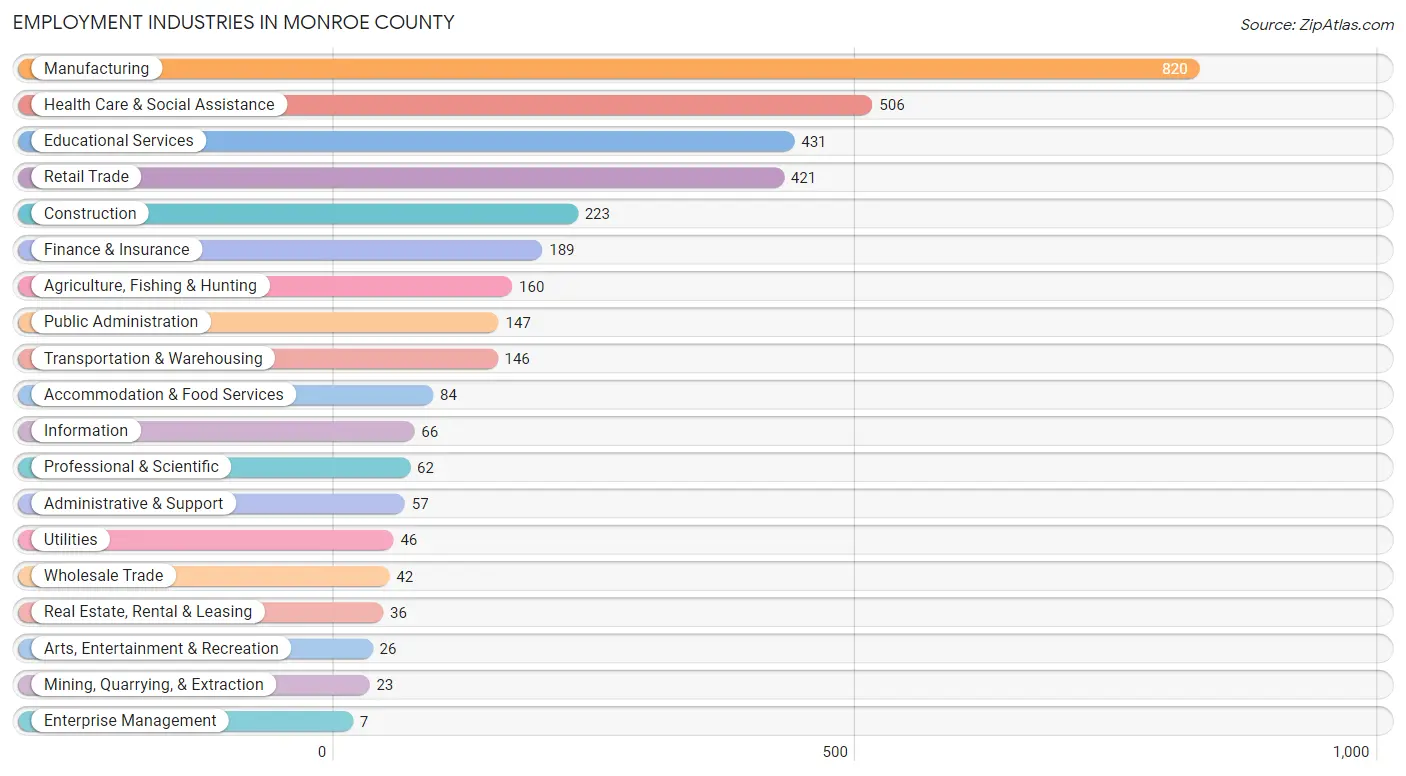
Employment Industries in Monroe County
The major employment industries in Monroe County include Manufacturing (820 | 22.8%), Health Care & Social Assistance (506 | 14.0%), Educational Services (431 | 12.0%), Retail Trade (421 | 11.7%), and Construction (223 | 6.2%).
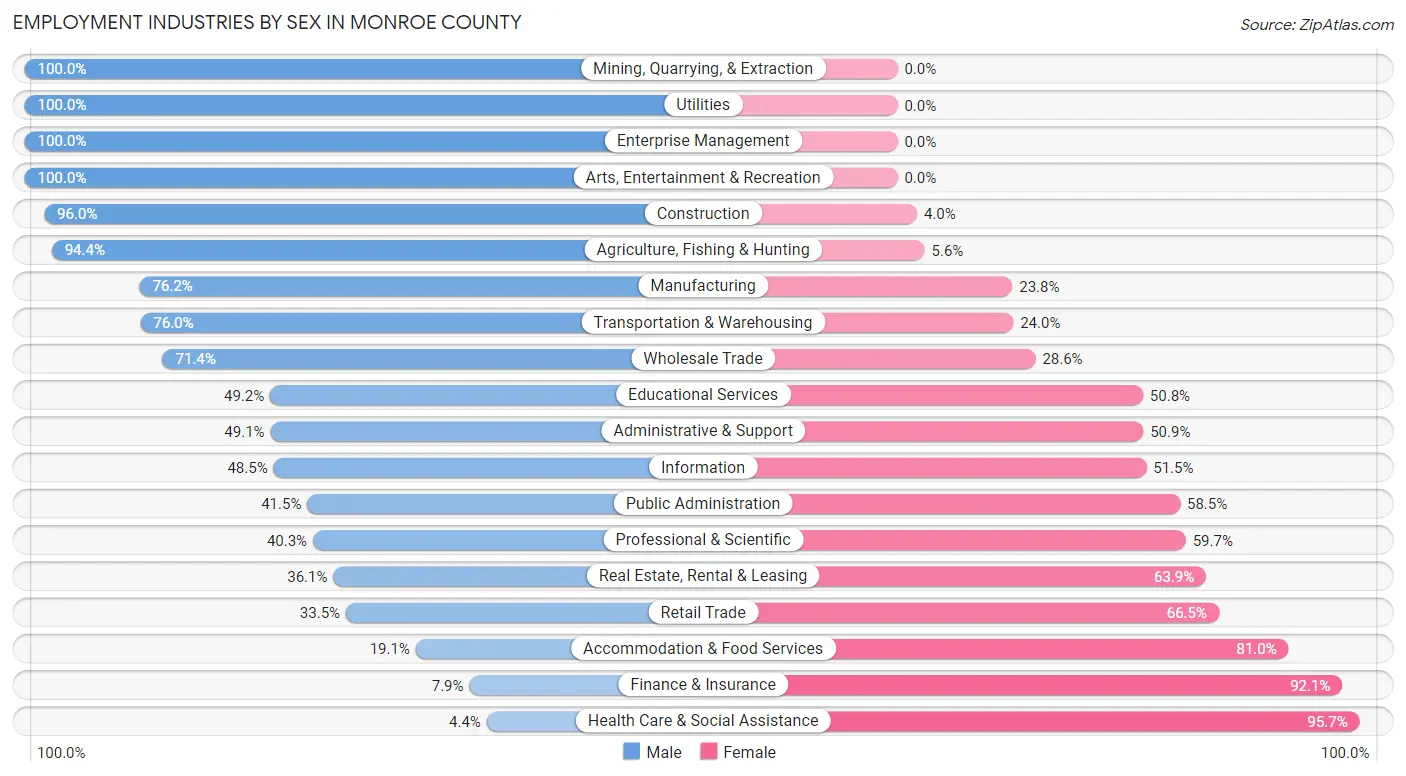
Employment Industries by Sex in Monroe County
The Monroe County industries that see more men than women are Mining, Quarrying, & Extraction (100.0%), Utilities (100.0%), and Enterprise Management (100.0%), whereas the industries that tend to have a higher number of women are Health Care & Social Assistance (95.7%), Finance & Insurance (92.1%), and Accommodation & Food Services (80.9%).
| Industry | Male | Female |
| Agriculture, Fishing & Hunting | 151 (94.4%) | 9 (5.6%) |
| Mining, Quarrying, & Extraction | 23 (100.0%) | 0 (0.0%) |
| Construction | 214 (96.0%) | 9 (4.0%) |
| Manufacturing | 625 (76.2%) | 195 (23.8%) |
| Wholesale Trade | 30 (71.4%) | 12 (28.6%) |
| Retail Trade | 141 (33.5%) | 280 (66.5%) |
| Transportation & Warehousing | 111 (76.0%) | 35 (24.0%) |
| Utilities | 46 (100.0%) | 0 (0.0%) |
| Information | 32 (48.5%) | 34 (51.5%) |
| Finance & Insurance | 15 (7.9%) | 174 (92.1%) |
| Real Estate, Rental & Leasing | 13 (36.1%) | 23 (63.9%) |
| Professional & Scientific | 25 (40.3%) | 37 (59.7%) |
| Enterprise Management | 7 (100.0%) | 0 (0.0%) |
| Administrative & Support | 28 (49.1%) | 29 (50.9%) |
| Educational Services | 212 (49.2%) | 219 (50.8%) |
| Health Care & Social Assistance | 22 (4.3%) | 484 (95.7%) |
| Arts, Entertainment & Recreation | 26 (100.0%) | 0 (0.0%) |
| Accommodation & Food Services | 16 (19.1%) | 68 (80.9%) |
| Public Administration | 61 (41.5%) | 86 (58.5%) |
| Total | 1,865 (51.7%) | 1,739 (48.2%) |
Education in Monroe County
School Enrollment in Monroe County
The most common levels of schooling among the 1,504 students in Monroe County are high school (453 | 30.1%), middle school (420 | 27.9%), and elementary school (313 | 20.8%).
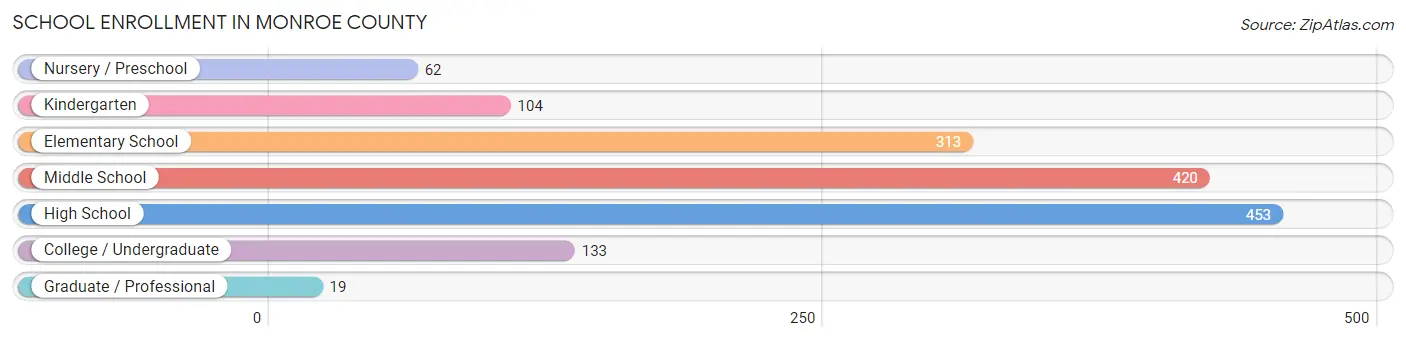
| School Level | # Students | % Students |
| Nursery / Preschool | 62 | 4.1% |
| Kindergarten | 104 | 6.9% |
| Elementary School | 313 | 20.8% |
| Middle School | 420 | 27.9% |
| High School | 453 | 30.1% |
| College / Undergraduate | 133 | 8.8% |
| Graduate / Professional | 19 | 1.3% |
| Total | 1,504 | 100.0% |
School Enrollment by Age by Funding Source in Monroe County
Out of a total of 1,504 students who are enrolled in schools in Monroe County, 63 (4.2%) attend a private institution, while the remaining 1,441 (95.8%) are enrolled in public schools. The age group of 35 years and over has the highest likelihood of being enrolled in private schools, with 19 (35.2% in the age bracket) enrolled. Conversely, the age group of 3 to 4 year olds has the lowest likelihood of being enrolled in a private school, with 49 (100.0% in the age bracket) attending a public institution.
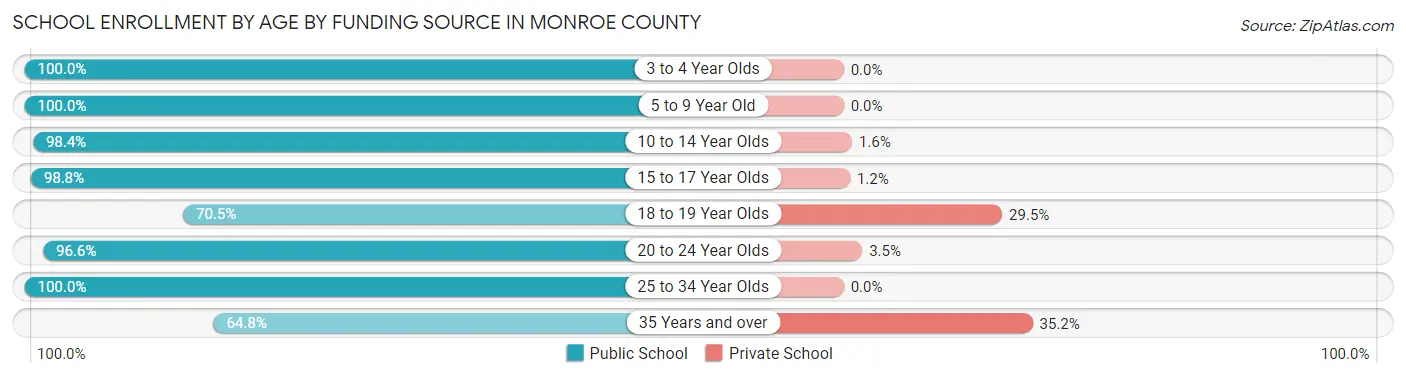
| Age Bracket | Public School | Private School |
| 3 to 4 Year Olds | 49 (100.0%) | 0 (0.0%) |
| 5 to 9 Year Old | 381 (100.0%) | 0 (0.0%) |
| 10 to 14 Year Olds | 505 (98.4%) | 8 (1.6%) |
| 15 to 17 Year Olds | 339 (98.8%) | 4 (1.2%) |
| 18 to 19 Year Olds | 74 (70.5%) | 31 (29.5%) |
| 20 to 24 Year Olds | 28 (96.6%) | 1 (3.5%) |
| 25 to 34 Year Olds | 30 (100.0%) | 0 (0.0%) |
| 35 Years and over | 35 (64.8%) | 19 (35.2%) |
| Total | 1,441 (95.8%) | 63 (4.2%) |
Educational Attainment by Field of Study in Monroe County
Education (359 | 27.6%), business (211 | 16.2%), science & technology (122 | 9.4%), social sciences (116 | 8.9%), and psychology (115 | 8.8%) are the most common fields of study among 1,302 individuals in Monroe County who have obtained a bachelor's degree or higher.
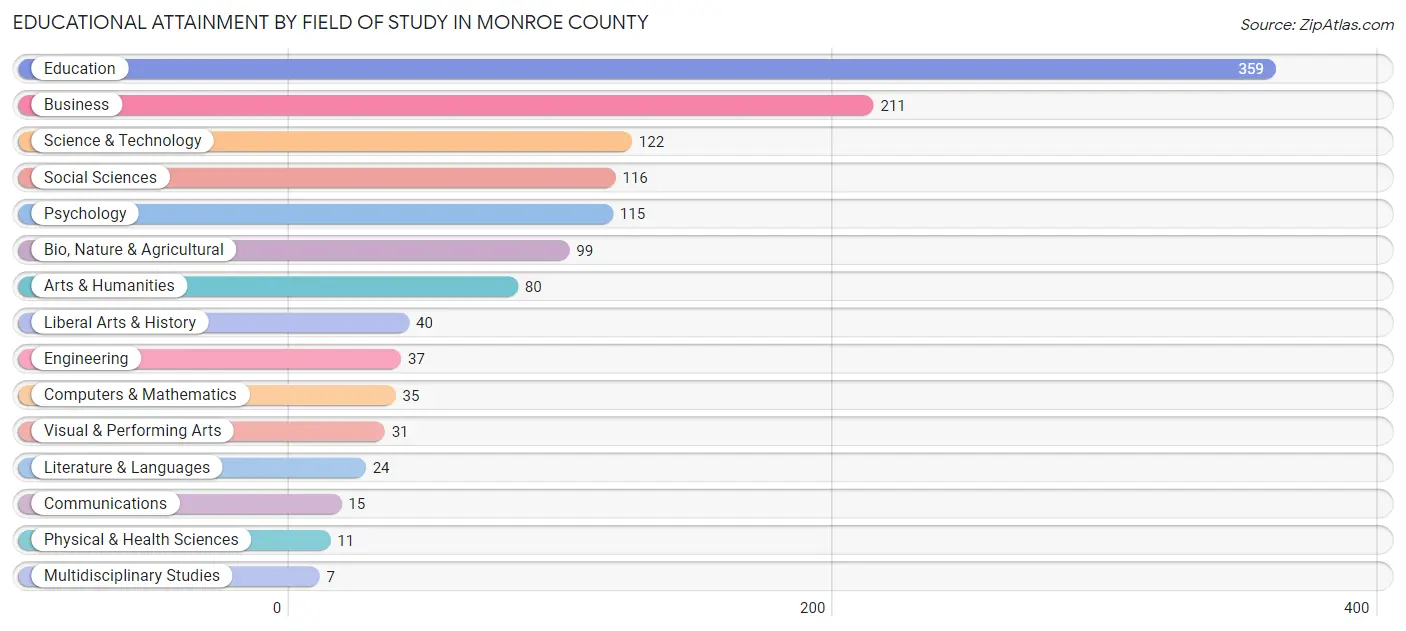
| Field of Study | # Graduates | % Graduates |
| Computers & Mathematics | 35 | 2.7% |
| Bio, Nature & Agricultural | 99 | 7.6% |
| Physical & Health Sciences | 11 | 0.8% |
| Psychology | 115 | 8.8% |
| Social Sciences | 116 | 8.9% |
| Engineering | 37 | 2.8% |
| Multidisciplinary Studies | 7 | 0.5% |
| Science & Technology | 122 | 9.4% |
| Business | 211 | 16.2% |
| Education | 359 | 27.6% |
| Literature & Languages | 24 | 1.8% |
| Liberal Arts & History | 40 | 3.1% |
| Visual & Performing Arts | 31 | 2.4% |
| Communications | 15 | 1.1% |
| Arts & Humanities | 80 | 6.1% |
| Total | 1,302 | 100.0% |
Transportation & Commute in Monroe County
Vehicle Availability by Sex in Monroe County
The most prevalent vehicle ownership categories in Monroe County are males with 2 vehicles (536, accounting for 29.1%) and females with 2 vehicles (455, making up 30.8%).
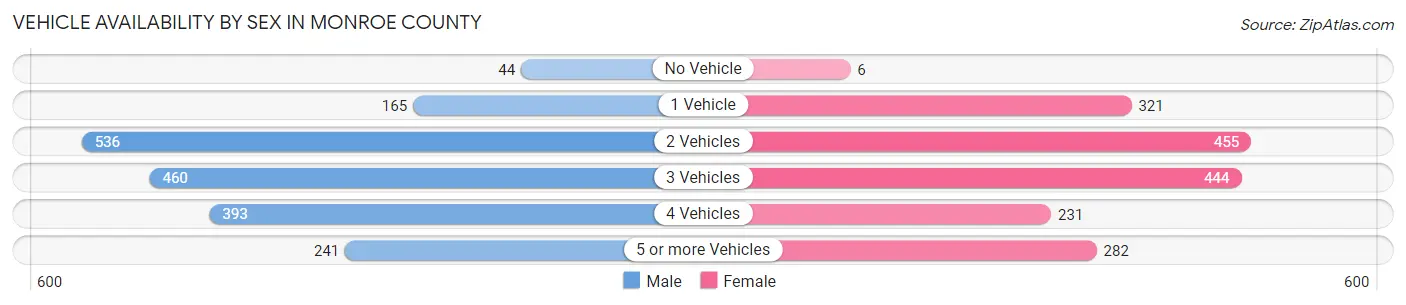
| Vehicles Available | Male | Female |
| No Vehicle | 44 (2.4%) | 6 (0.4%) |
| 1 Vehicle | 165 (9.0%) | 321 (18.5%) |
| 2 Vehicles | 536 (29.1%) | 455 (26.2%) |
| 3 Vehicles | 460 (25.0%) | 444 (25.5%) |
| 4 Vehicles | 393 (21.4%) | 231 (13.3%) |
| 5 or more Vehicles | 241 (13.1%) | 282 (16.2%) |
| Total | 1,839 (100.0%) | 1,739 (100.0%) |
Commute Time in Monroe County
The most frequently occuring commute durations in Monroe County are 5 to 9 minutes (475 commuters, 14.9%), 30 to 34 minutes (423 commuters, 13.3%), and 45 to 59 minutes (420 commuters, 13.2%).
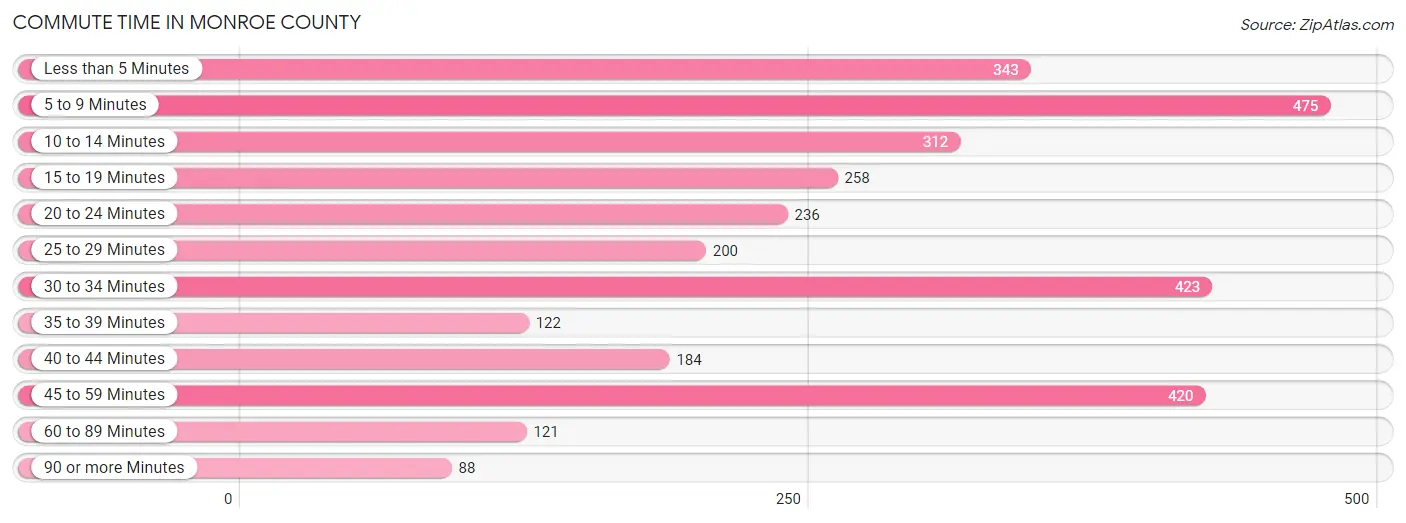
| Commute Time | # Commuters | % Commuters |
| Less than 5 Minutes | 343 | 10.8% |
| 5 to 9 Minutes | 475 | 14.9% |
| 10 to 14 Minutes | 312 | 9.8% |
| 15 to 19 Minutes | 258 | 8.1% |
| 20 to 24 Minutes | 236 | 7.4% |
| 25 to 29 Minutes | 200 | 6.3% |
| 30 to 34 Minutes | 423 | 13.3% |
| 35 to 39 Minutes | 122 | 3.8% |
| 40 to 44 Minutes | 184 | 5.8% |
| 45 to 59 Minutes | 420 | 13.2% |
| 60 to 89 Minutes | 121 | 3.8% |
| 90 or more Minutes | 88 | 2.8% |
Commute Time by Sex in Monroe County
The most common commute times in Monroe County are 45 to 59 minutes (349 commuters, 20.4%) for males and 5 to 9 minutes (308 commuters, 20.9%) for females.
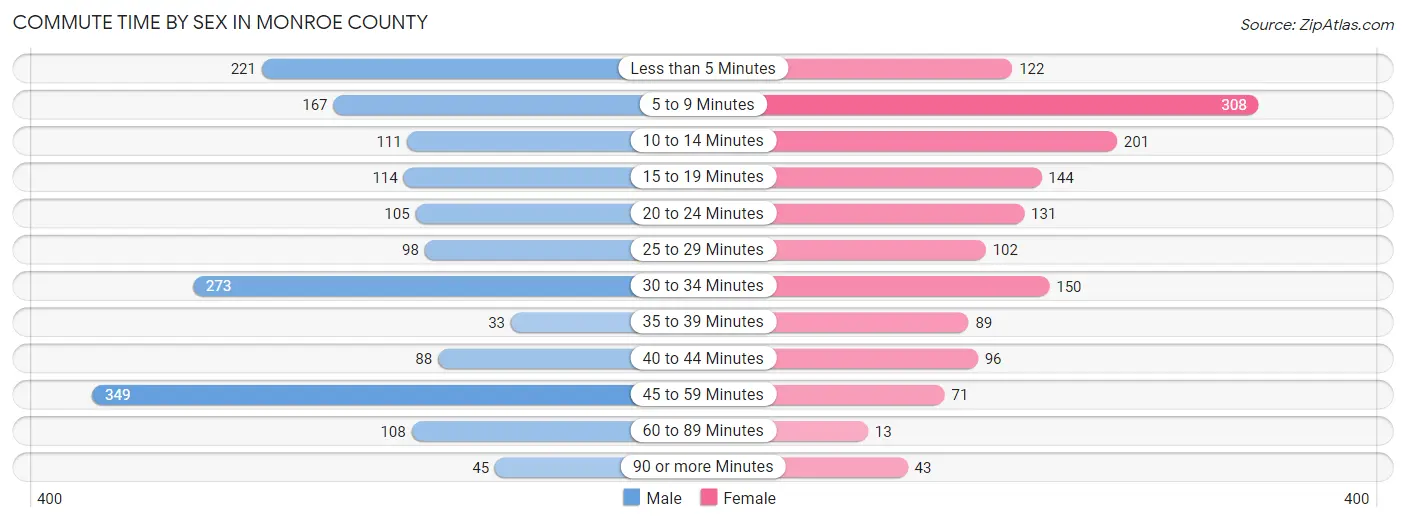
| Commute Time | Male | Female |
| Less than 5 Minutes | 221 (12.9%) | 122 (8.3%) |
| 5 to 9 Minutes | 167 (9.8%) | 308 (20.9%) |
| 10 to 14 Minutes | 111 (6.5%) | 201 (13.7%) |
| 15 to 19 Minutes | 114 (6.7%) | 144 (9.8%) |
| 20 to 24 Minutes | 105 (6.1%) | 131 (8.9%) |
| 25 to 29 Minutes | 98 (5.7%) | 102 (6.9%) |
| 30 to 34 Minutes | 273 (16.0%) | 150 (10.2%) |
| 35 to 39 Minutes | 33 (1.9%) | 89 (6.0%) |
| 40 to 44 Minutes | 88 (5.1%) | 96 (6.5%) |
| 45 to 59 Minutes | 349 (20.4%) | 71 (4.8%) |
| 60 to 89 Minutes | 108 (6.3%) | 13 (0.9%) |
| 90 or more Minutes | 45 (2.6%) | 43 (2.9%) |
Time of Departure to Work by Sex in Monroe County
The most frequent times of departure to work in Monroe County are 5:30 AM to 5:59 AM (286, 16.7%) for males and 7:30 AM to 7:59 AM (381, 25.9%) for females.
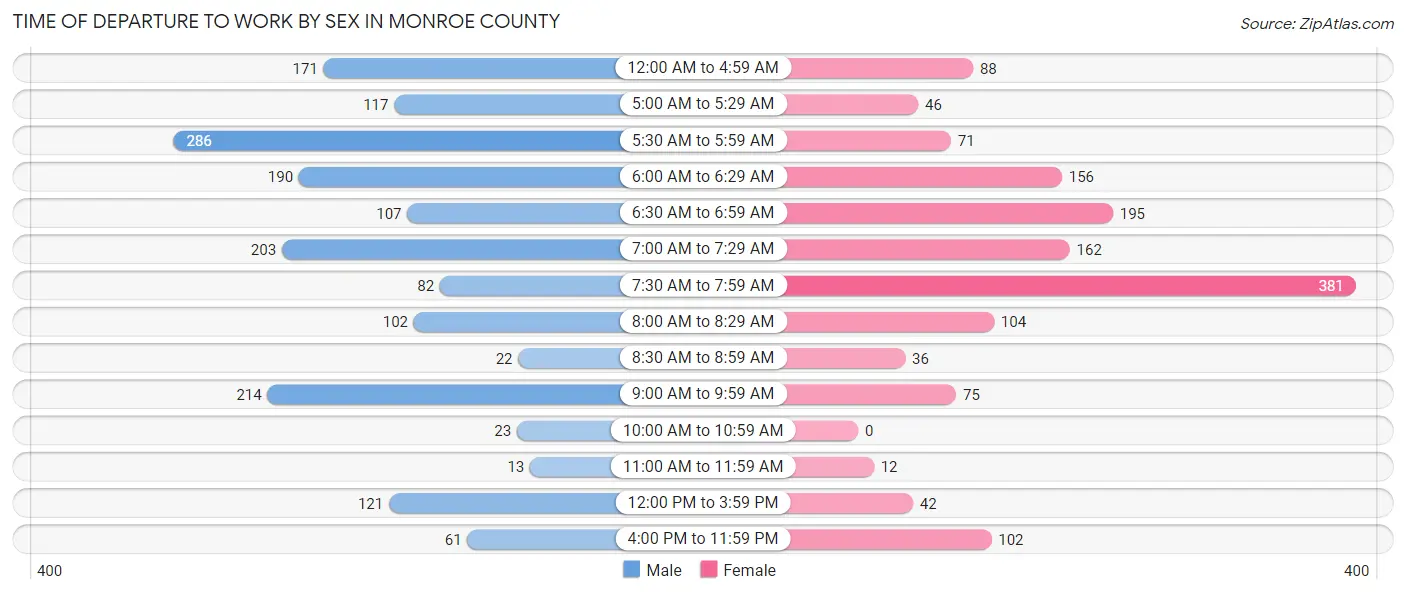
| Time of Departure | Male | Female |
| 12:00 AM to 4:59 AM | 171 (10.0%) | 88 (6.0%) |
| 5:00 AM to 5:29 AM | 117 (6.8%) | 46 (3.1%) |
| 5:30 AM to 5:59 AM | 286 (16.7%) | 71 (4.8%) |
| 6:00 AM to 6:29 AM | 190 (11.1%) | 156 (10.6%) |
| 6:30 AM to 6:59 AM | 107 (6.2%) | 195 (13.3%) |
| 7:00 AM to 7:29 AM | 203 (11.9%) | 162 (11.0%) |
| 7:30 AM to 7:59 AM | 82 (4.8%) | 381 (25.9%) |
| 8:00 AM to 8:29 AM | 102 (6.0%) | 104 (7.1%) |
| 8:30 AM to 8:59 AM | 22 (1.3%) | 36 (2.5%) |
| 9:00 AM to 9:59 AM | 214 (12.5%) | 75 (5.1%) |
| 10:00 AM to 10:59 AM | 23 (1.3%) | 0 (0.0%) |
| 11:00 AM to 11:59 AM | 13 (0.8%) | 12 (0.8%) |
| 12:00 PM to 3:59 PM | 121 (7.1%) | 42 (2.9%) |
| 4:00 PM to 11:59 PM | 61 (3.6%) | 102 (6.9%) |
| Total | 1,712 (100.0%) | 1,470 (100.0%) |
Housing Occupancy in Monroe County
Occupancy by Ownership in Monroe County
Of the total 3,032 dwellings in Monroe County, owner-occupied units account for 2,500 (82.5%), while renter-occupied units make up 532 (17.5%).
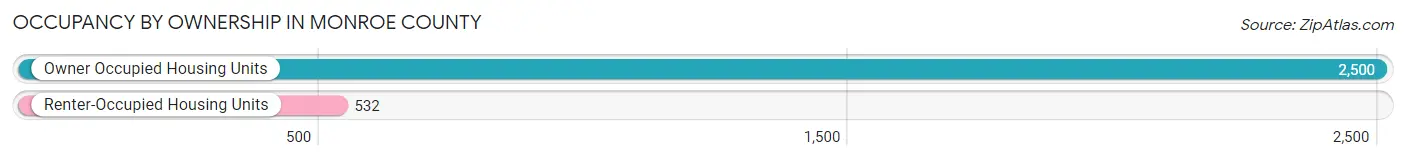
| Occupancy | # Housing Units | % Housing Units |
| Owner Occupied Housing Units | 2,500 | 82.5% |
| Renter-Occupied Housing Units | 532 | 17.5% |
| Total Occupied Housing Units | 3,032 | 100.0% |
Occupancy by Household Size in Monroe County
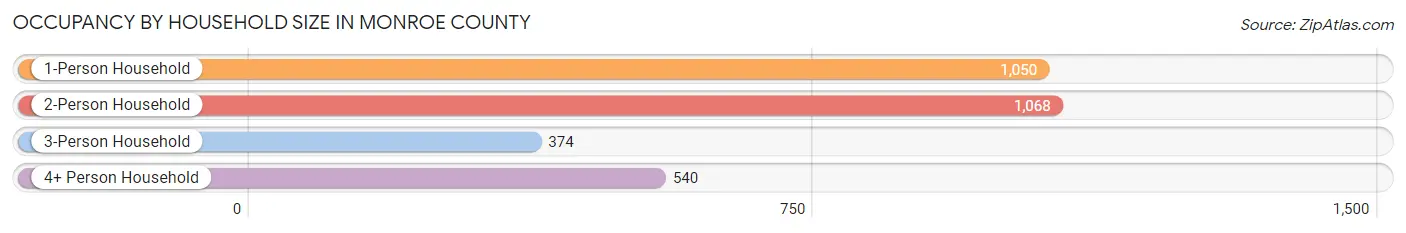
| Household Size | # Housing Units | % Housing Units |
| 1-Person Household | 1,050 | 34.6% |
| 2-Person Household | 1,068 | 35.2% |
| 3-Person Household | 374 | 12.3% |
| 4+ Person Household | 540 | 17.8% |
| Total Housing Units | 3,032 | 100.0% |
Occupancy by Ownership by Household Size in Monroe County
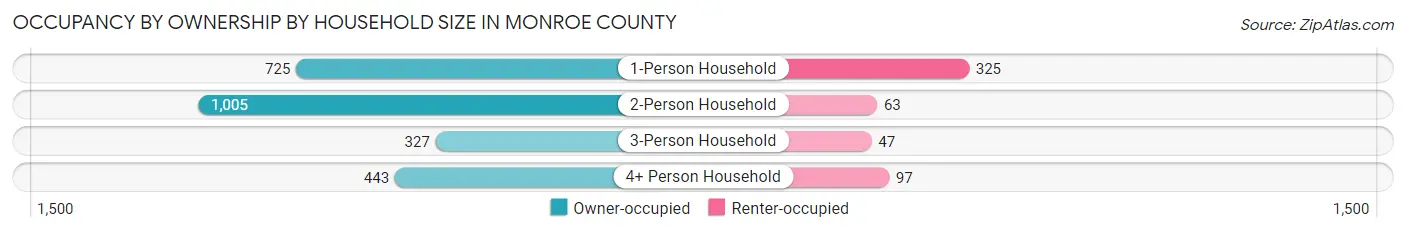
| Household Size | Owner-occupied | Renter-occupied |
| 1-Person Household | 725 (69.1%) | 325 (30.9%) |
| 2-Person Household | 1,005 (94.1%) | 63 (5.9%) |
| 3-Person Household | 327 (87.4%) | 47 (12.6%) |
| 4+ Person Household | 443 (82.0%) | 97 (18.0%) |
| Total Housing Units | 2,500 (82.5%) | 532 (17.5%) |
Occupancy by Educational Attainment in Monroe County
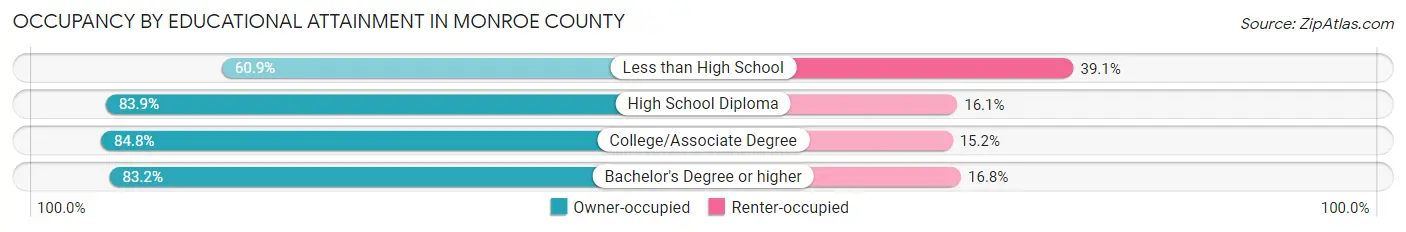
| Household Size | Owner-occupied | Renter-occupied |
| Less than High School | 126 (60.9%) | 81 (39.1%) |
| High School Diploma | 892 (83.9%) | 171 (16.1%) |
| College/Associate Degree | 855 (84.8%) | 153 (15.2%) |
| Bachelor's Degree or higher | 627 (83.2%) | 127 (16.8%) |
Occupancy by Age of Householder in Monroe County
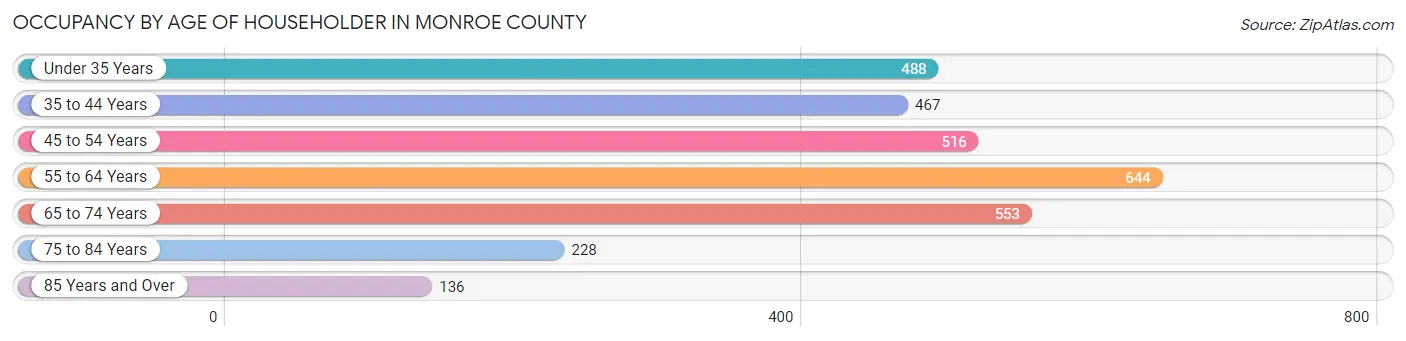
| Age Bracket | # Households | % Households |
| Under 35 Years | 488 | 16.1% |
| 35 to 44 Years | 467 | 15.4% |
| 45 to 54 Years | 516 | 17.0% |
| 55 to 64 Years | 644 | 21.2% |
| 65 to 74 Years | 553 | 18.2% |
| 75 to 84 Years | 228 | 7.5% |
| 85 Years and Over | 136 | 4.5% |
| Total | 3,032 | 100.0% |
Housing Finances in Monroe County
Median Income by Occupancy in Monroe County
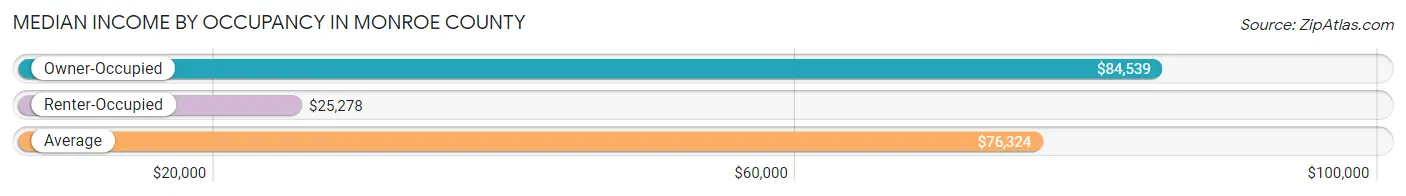
| Occupancy Type | # Households | Median Income |
| Owner-Occupied | 2,500 (82.5%) | $84,539 |
| Renter-Occupied | 532 (17.5%) | $25,278 |
| Average | 3,032 (100.0%) | $76,324 |
Occupancy by Householder Income Bracket in Monroe County
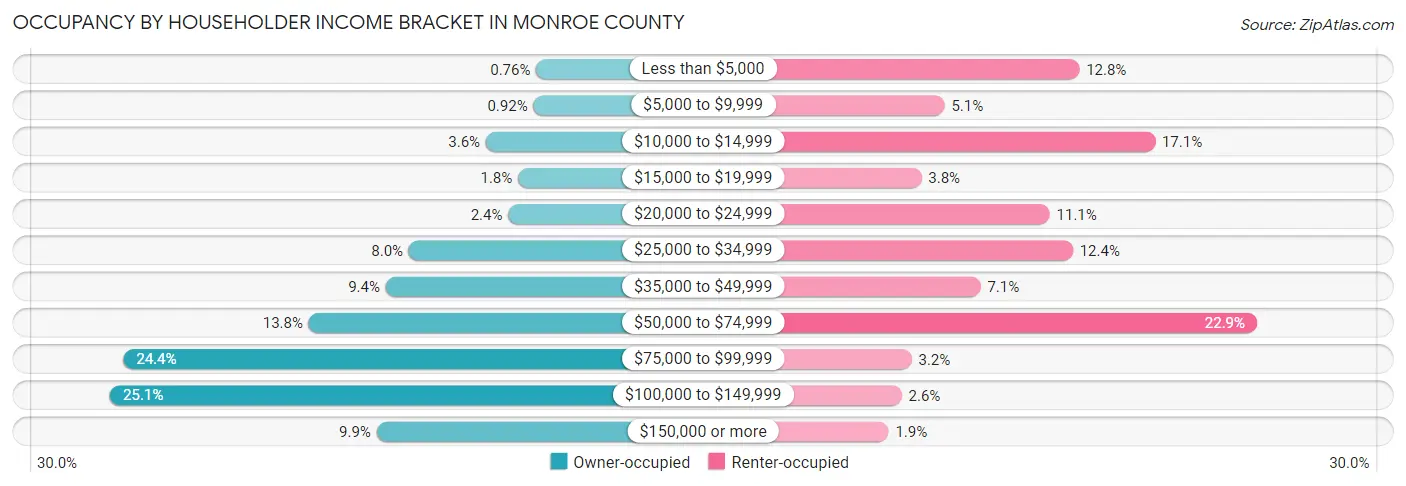
| Income Bracket | Owner-occupied | Renter-occupied |
| Less than $5,000 | 19 (0.8%) | 68 (12.8%) |
| $5,000 to $9,999 | 23 (0.9%) | 27 (5.1%) |
| $10,000 to $14,999 | 91 (3.6%) | 91 (17.1%) |
| $15,000 to $19,999 | 45 (1.8%) | 20 (3.8%) |
| $20,000 to $24,999 | 59 (2.4%) | 59 (11.1%) |
| $25,000 to $34,999 | 201 (8.0%) | 66 (12.4%) |
| $35,000 to $49,999 | 234 (9.4%) | 38 (7.1%) |
| $50,000 to $74,999 | 344 (13.8%) | 122 (22.9%) |
| $75,000 to $99,999 | 609 (24.4%) | 17 (3.2%) |
| $100,000 to $149,999 | 628 (25.1%) | 14 (2.6%) |
| $150,000 or more | 247 (9.9%) | 10 (1.9%) |
| Total | 2,500 (100.0%) | 532 (100.0%) |
Monthly Housing Cost Tiers in Monroe County
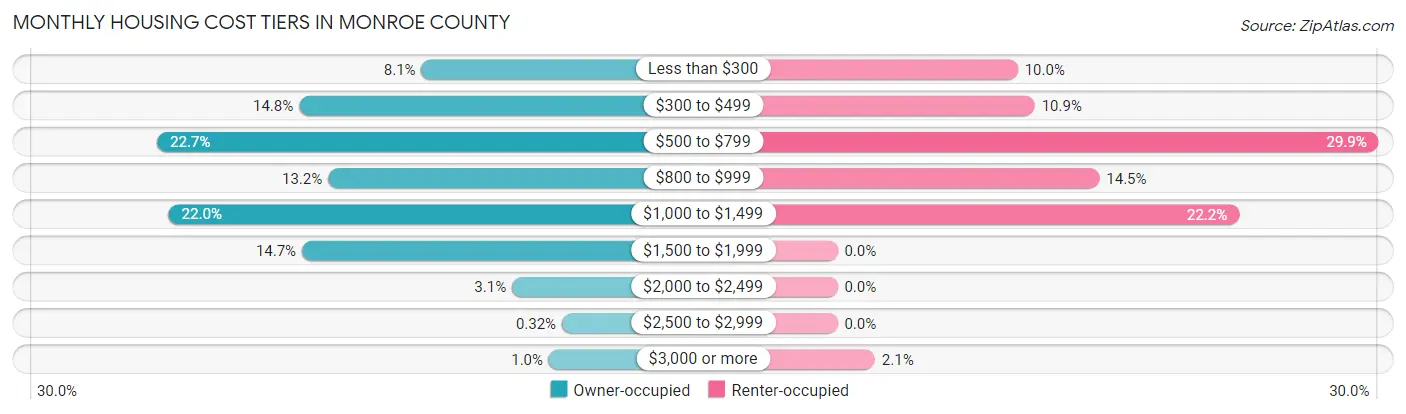
| Monthly Cost | Owner-occupied | Renter-occupied |
| Less than $300 | 202 (8.1%) | 53 (10.0%) |
| $300 to $499 | 371 (14.8%) | 58 (10.9%) |
| $500 to $799 | 567 (22.7%) | 159 (29.9%) |
| $800 to $999 | 331 (13.2%) | 77 (14.5%) |
| $1,000 to $1,499 | 551 (22.0%) | 118 (22.2%) |
| $1,500 to $1,999 | 367 (14.7%) | 0 (0.0%) |
| $2,000 to $2,499 | 77 (3.1%) | 0 (0.0%) |
| $2,500 to $2,999 | 8 (0.3%) | 0 (0.0%) |
| $3,000 or more | 26 (1.0%) | 11 (2.1%) |
| Total | 2,500 (100.0%) | 532 (100.0%) |
Physical Housing Characteristics in Monroe County
Housing Structures in Monroe County
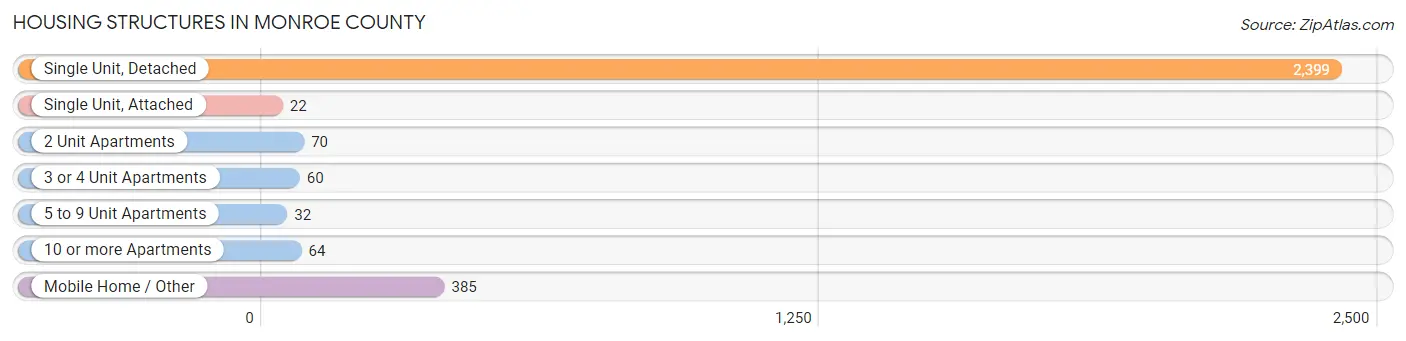
| Structure Type | # Housing Units | % Housing Units |
| Single Unit, Detached | 2,399 | 79.1% |
| Single Unit, Attached | 22 | 0.7% |
| 2 Unit Apartments | 70 | 2.3% |
| 3 or 4 Unit Apartments | 60 | 2.0% |
| 5 to 9 Unit Apartments | 32 | 1.1% |
| 10 or more Apartments | 64 | 2.1% |
| Mobile Home / Other | 385 | 12.7% |
| Total | 3,032 | 100.0% |
Housing Structures by Occupancy in Monroe County
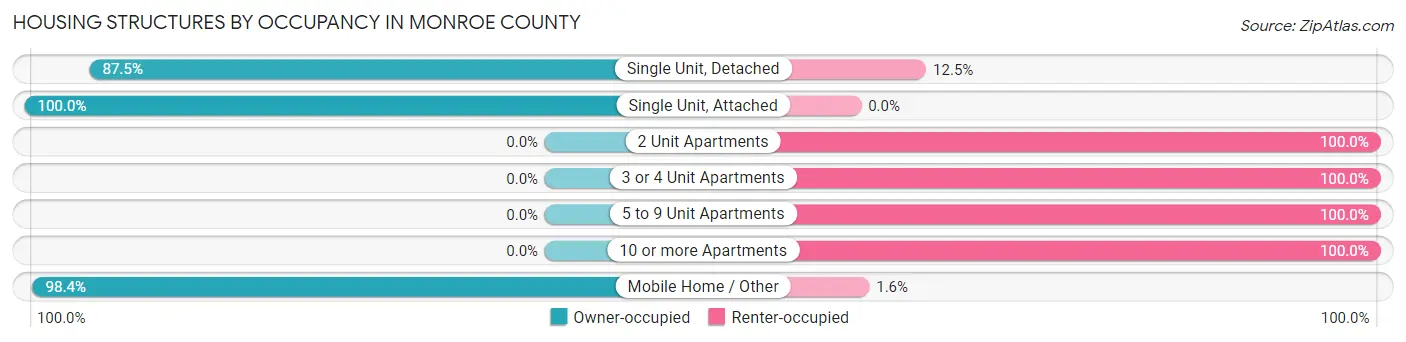
| Structure Type | Owner-occupied | Renter-occupied |
| Single Unit, Detached | 2,099 (87.5%) | 300 (12.5%) |
| Single Unit, Attached | 22 (100.0%) | 0 (0.0%) |
| 2 Unit Apartments | 0 (0.0%) | 70 (100.0%) |
| 3 or 4 Unit Apartments | 0 (0.0%) | 60 (100.0%) |
| 5 to 9 Unit Apartments | 0 (0.0%) | 32 (100.0%) |
| 10 or more Apartments | 0 (0.0%) | 64 (100.0%) |
| Mobile Home / Other | 379 (98.4%) | 6 (1.6%) |
| Total | 2,500 (82.5%) | 532 (17.5%) |
Housing Structures by Number of Rooms in Monroe County
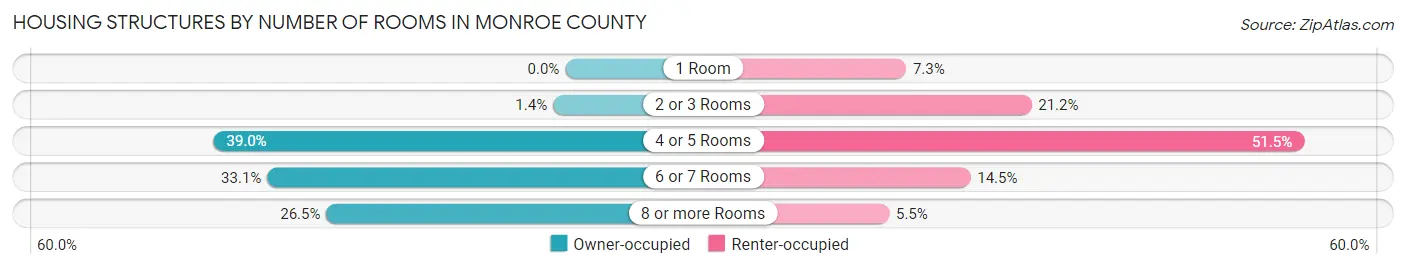
| Number of Rooms | Owner-occupied | Renter-occupied |
| 1 Room | 0 (0.0%) | 39 (7.3%) |
| 2 or 3 Rooms | 34 (1.4%) | 113 (21.2%) |
| 4 or 5 Rooms | 976 (39.0%) | 274 (51.5%) |
| 6 or 7 Rooms | 827 (33.1%) | 77 (14.5%) |
| 8 or more Rooms | 663 (26.5%) | 29 (5.4%) |
| Total | 2,500 (100.0%) | 532 (100.0%) |
Housing Structure by Heating Type in Monroe County
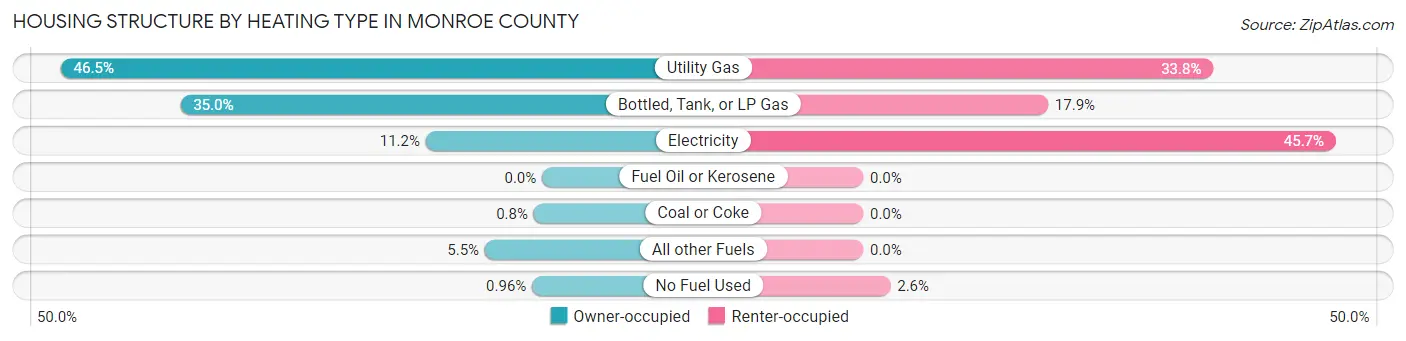
| Heating Type | Owner-occupied | Renter-occupied |
| Utility Gas | 1,163 (46.5%) | 180 (33.8%) |
| Bottled, Tank, or LP Gas | 874 (35.0%) | 95 (17.9%) |
| Electricity | 281 (11.2%) | 243 (45.7%) |
| Fuel Oil or Kerosene | 0 (0.0%) | 0 (0.0%) |
| Coal or Coke | 20 (0.8%) | 0 (0.0%) |
| All other Fuels | 138 (5.5%) | 0 (0.0%) |
| No Fuel Used | 24 (1.0%) | 14 (2.6%) |
| Total | 2,500 (100.0%) | 532 (100.0%) |
Household Vehicle Usage in Monroe County
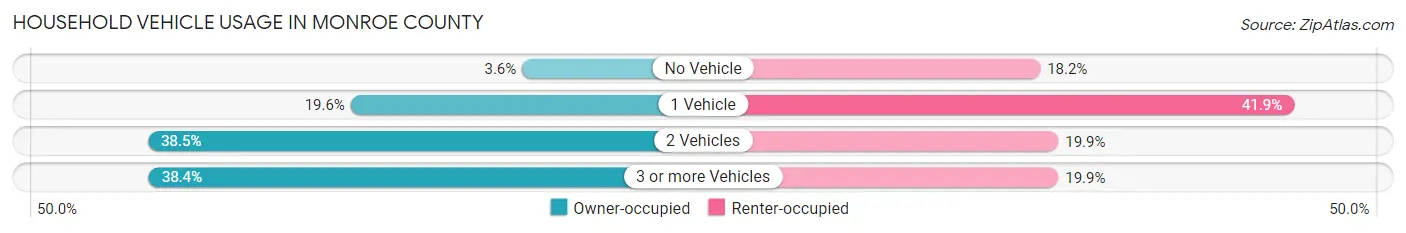
| Vehicles per Household | Owner-occupied | Renter-occupied |
| No Vehicle | 89 (3.6%) | 97 (18.2%) |
| 1 Vehicle | 489 (19.6%) | 223 (41.9%) |
| 2 Vehicles | 962 (38.5%) | 106 (19.9%) |
| 3 or more Vehicles | 960 (38.4%) | 106 (19.9%) |
| Total | 2,500 (100.0%) | 532 (100.0%) |
Real Estate & Mortgages in Monroe County
Real Estate and Mortgage Overview in Monroe County
| Characteristic | Without Mortgage | With Mortgage |
| Housing Units | 1,280 | 1,220 |
| Median Property Value | $109,700 | $141,700 |
| Median Household Income | $59,167 | $183 |
| Monthly Housing Costs | $543 | $26 |
| Real Estate Taxes | $1,998 | $6 |
Property Value by Mortgage Status in Monroe County
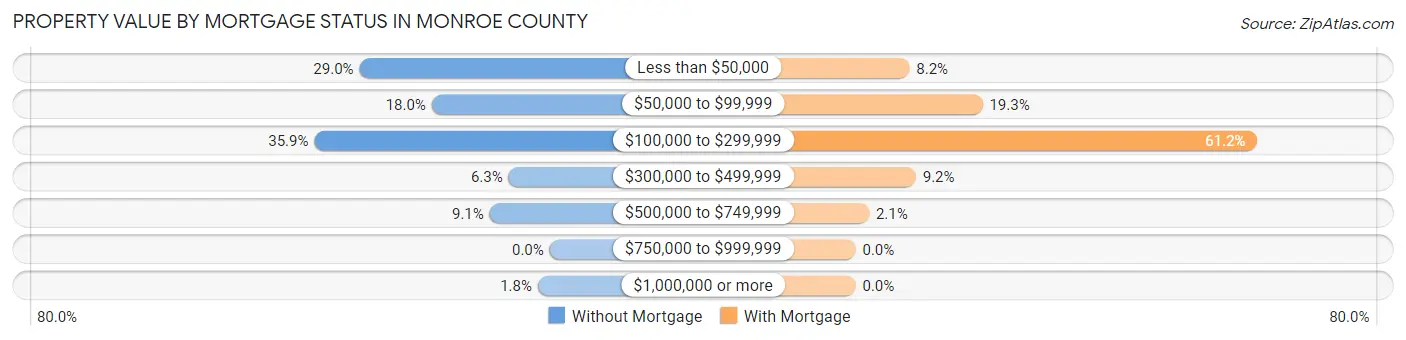
| Property Value | Without Mortgage | With Mortgage |
| Less than $50,000 | 371 (29.0%) | 100 (8.2%) |
| $50,000 to $99,999 | 230 (18.0%) | 236 (19.3%) |
| $100,000 to $299,999 | 459 (35.9%) | 747 (61.2%) |
| $300,000 to $499,999 | 80 (6.2%) | 112 (9.2%) |
| $500,000 to $749,999 | 117 (9.1%) | 25 (2.1%) |
| $750,000 to $999,999 | 0 (0.0%) | 0 (0.0%) |
| $1,000,000 or more | 23 (1.8%) | 0 (0.0%) |
| Total | 1,280 (100.0%) | 1,220 (100.0%) |
Household Income by Mortgage Status in Monroe County
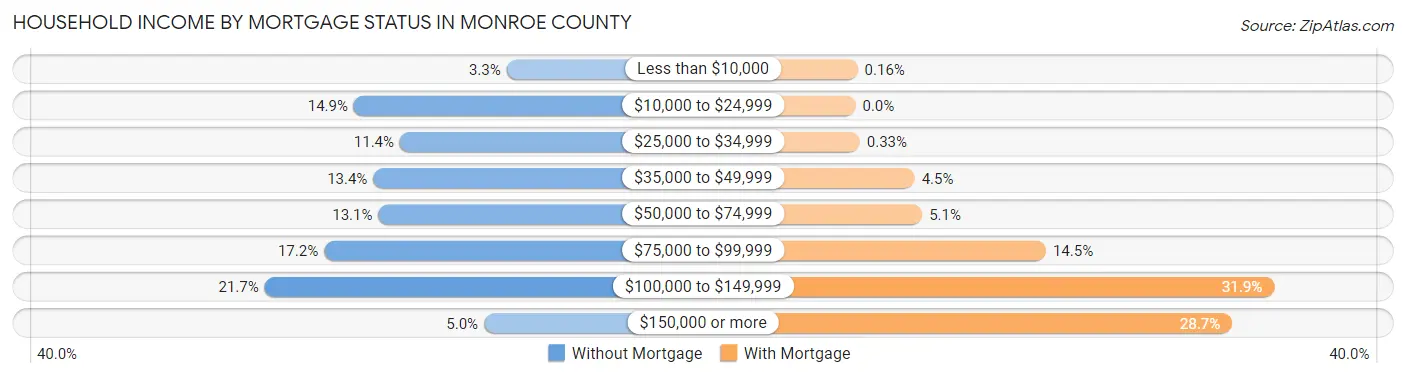
| Household Income | Without Mortgage | With Mortgage |
| Less than $10,000 | 42 (3.3%) | 2 (0.2%) |
| $10,000 to $24,999 | 191 (14.9%) | 0 (0.0%) |
| $25,000 to $34,999 | 146 (11.4%) | 4 (0.3%) |
| $35,000 to $49,999 | 172 (13.4%) | 55 (4.5%) |
| $50,000 to $74,999 | 167 (13.1%) | 62 (5.1%) |
| $75,000 to $99,999 | 220 (17.2%) | 177 (14.5%) |
| $100,000 to $149,999 | 278 (21.7%) | 389 (31.9%) |
| $150,000 or more | 64 (5.0%) | 350 (28.7%) |
| Total | 1,280 (100.0%) | 1,220 (100.0%) |
Property Value to Household Income Ratio in Monroe County
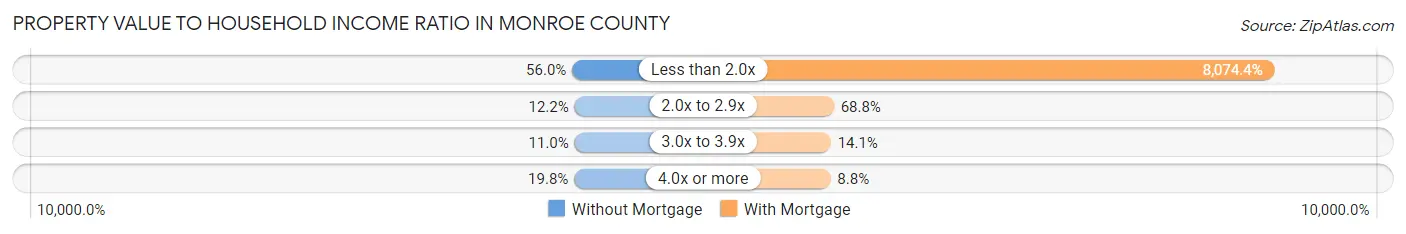
| Value-to-Income Ratio | Without Mortgage | With Mortgage |
| Less than 2.0x | 717 (56.0%) | 98,508 (8,074.4%) |
| 2.0x to 2.9x | 156 (12.2%) | 839 (68.8%) |
| 3.0x to 3.9x | 141 (11.0%) | 172 (14.1%) |
| 4.0x or more | 253 (19.8%) | 107 (8.8%) |
| Total | 1,280 (100.0%) | 1,220 (100.0%) |
Real Estate Taxes by Mortgage Status in Monroe County
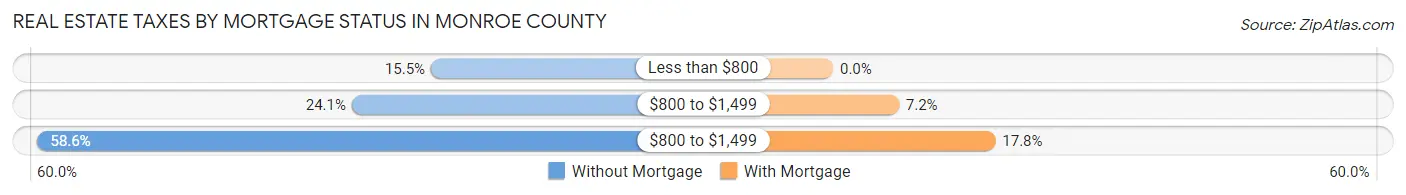
| Property Taxes | Without Mortgage | With Mortgage |
| Less than $800 | 198 (15.5%) | 0 (0.0%) |
| $800 to $1,499 | 309 (24.1%) | 88 (7.2%) |
| $800 to $1,499 | 750 (58.6%) | 217 (17.8%) |
| Total | 1,280 (100.0%) | 1,220 (100.0%) |
Health & Disability in Monroe County
Health Insurance Coverage by Age in Monroe County
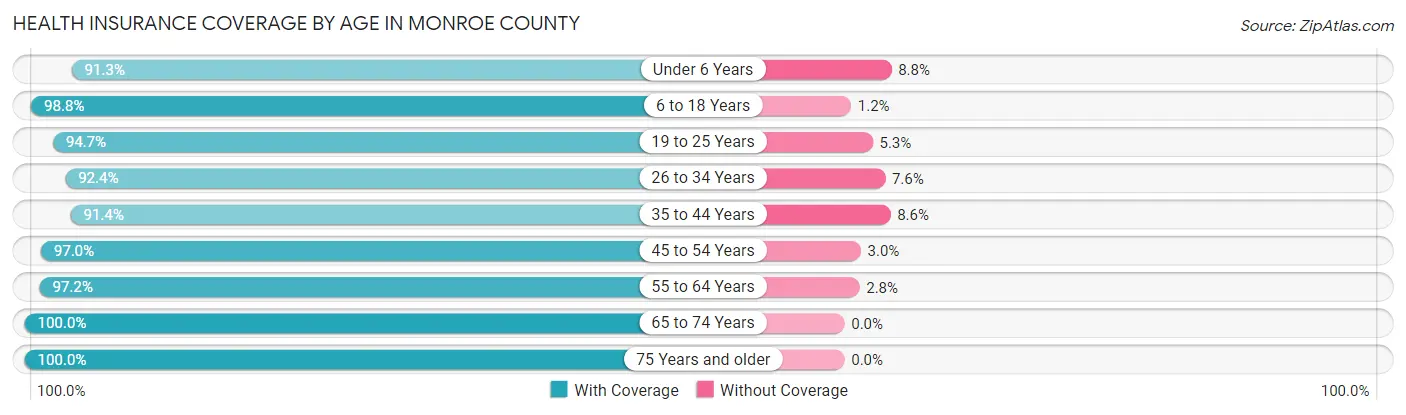
| Age Bracket | With Coverage | Without Coverage |
| Under 6 Years | 480 (91.2%) | 46 (8.7%) |
| 6 to 18 Years | 1,377 (98.8%) | 17 (1.2%) |
| 19 to 25 Years | 521 (94.7%) | 29 (5.3%) |
| 26 to 34 Years | 610 (92.4%) | 50 (7.6%) |
| 35 to 44 Years | 811 (91.4%) | 76 (8.6%) |
| 45 to 54 Years | 893 (97.0%) | 28 (3.0%) |
| 55 to 64 Years | 1,081 (97.2%) | 31 (2.8%) |
| 65 to 74 Years | 848 (100.0%) | 0 (0.0%) |
| 75 Years and older | 537 (100.0%) | 0 (0.0%) |
| Total | 7,158 (96.3%) | 277 (3.7%) |
Health Insurance Coverage by Citizenship Status in Monroe County
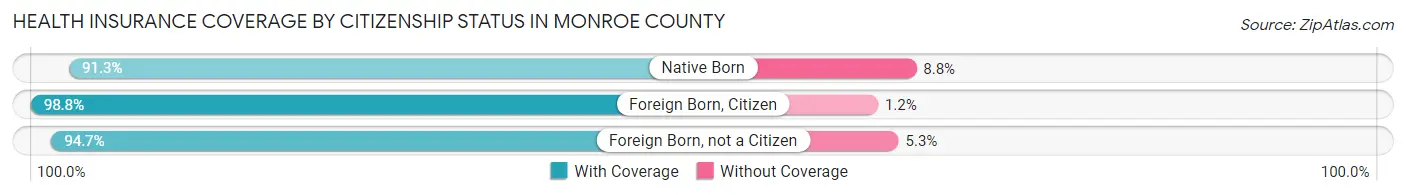
| Citizenship Status | With Coverage | Without Coverage |
| Native Born | 480 (91.2%) | 46 (8.7%) |
| Foreign Born, Citizen | 1,377 (98.8%) | 17 (1.2%) |
| Foreign Born, not a Citizen | 521 (94.7%) | 29 (5.3%) |
Health Insurance Coverage by Household Income in Monroe County
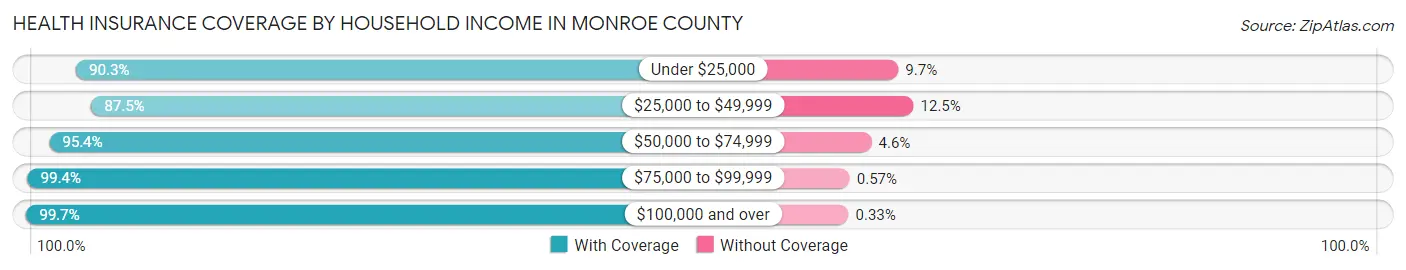
| Household Income | With Coverage | Without Coverage |
| Under $25,000 | 710 (90.3%) | 76 (9.7%) |
| $25,000 to $49,999 | 901 (87.5%) | 129 (12.5%) |
| $50,000 to $74,999 | 1,089 (95.4%) | 53 (4.6%) |
| $75,000 to $99,999 | 1,757 (99.4%) | 10 (0.6%) |
| $100,000 and over | 2,696 (99.7%) | 9 (0.3%) |
Public vs Private Health Insurance Coverage by Age in Monroe County
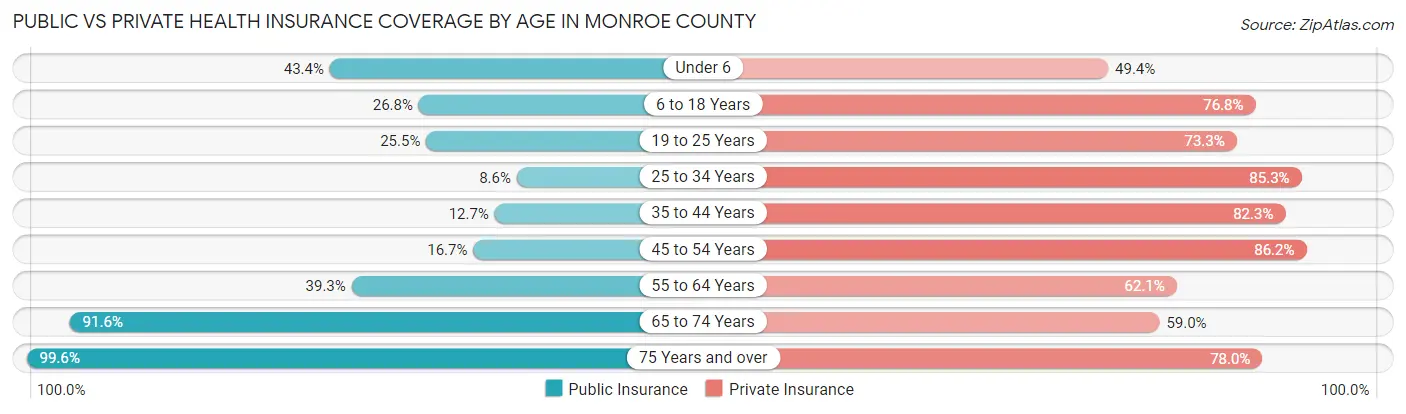
| Age Bracket | Public Insurance | Private Insurance |
| Under 6 | 228 (43.3%) | 260 (49.4%) |
| 6 to 18 Years | 374 (26.8%) | 1,070 (76.8%) |
| 19 to 25 Years | 140 (25.5%) | 403 (73.3%) |
| 25 to 34 Years | 57 (8.6%) | 563 (85.3%) |
| 35 to 44 Years | 113 (12.7%) | 730 (82.3%) |
| 45 to 54 Years | 154 (16.7%) | 794 (86.2%) |
| 55 to 64 Years | 437 (39.3%) | 691 (62.1%) |
| 65 to 74 Years | 777 (91.6%) | 500 (59.0%) |
| 75 Years and over | 535 (99.6%) | 419 (78.0%) |
| Total | 2,815 (37.9%) | 5,430 (73.0%) |
Disability Status by Sex by Age in Monroe County
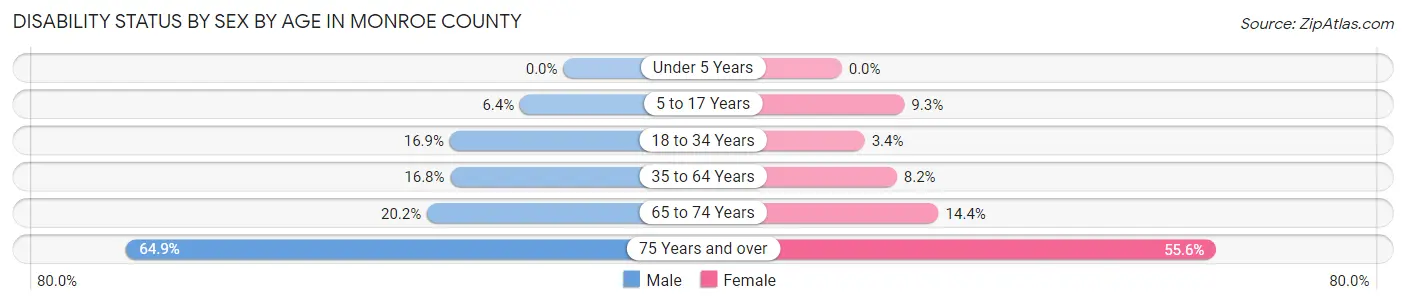
| Age Bracket | Male | Female |
| Under 5 Years | 0 (0.0%) | 0 (0.0%) |
| 5 to 17 Years | 45 (6.4%) | 60 (9.3%) |
| 18 to 34 Years | 115 (16.9%) | 22 (3.4%) |
| 35 to 64 Years | 248 (16.8%) | 118 (8.2%) |
| 65 to 74 Years | 83 (20.2%) | 63 (14.4%) |
| 75 Years and over | 157 (64.9%) | 164 (55.6%) |
Disability Class by Sex by Age in Monroe County
Disability Class: Hearing Difficulty
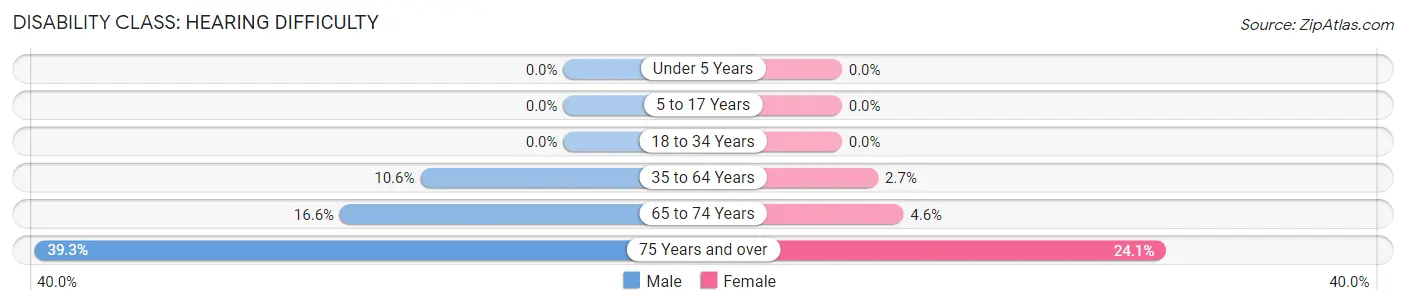
| Age Bracket | Male | Female |
| Under 5 Years | 0 (0.0%) | 0 (0.0%) |
| 5 to 17 Years | 0 (0.0%) | 0 (0.0%) |
| 18 to 34 Years | 0 (0.0%) | 0 (0.0%) |
| 35 to 64 Years | 157 (10.6%) | 39 (2.7%) |
| 65 to 74 Years | 68 (16.6%) | 20 (4.6%) |
| 75 Years and over | 95 (39.3%) | 71 (24.1%) |
Disability Class: Vision Difficulty
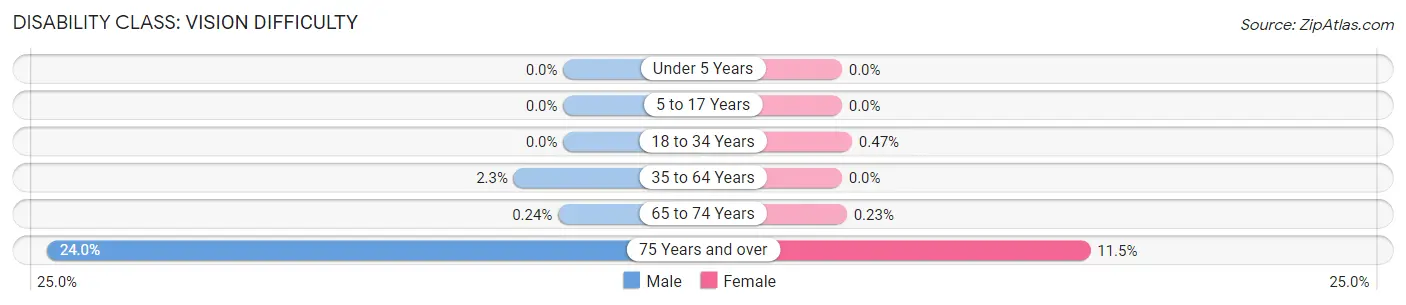
| Age Bracket | Male | Female |
| Under 5 Years | 0 (0.0%) | 0 (0.0%) |
| 5 to 17 Years | 0 (0.0%) | 0 (0.0%) |
| 18 to 34 Years | 0 (0.0%) | 3 (0.5%) |
| 35 to 64 Years | 34 (2.3%) | 0 (0.0%) |
| 65 to 74 Years | 1 (0.2%) | 1 (0.2%) |
| 75 Years and over | 58 (24.0%) | 34 (11.5%) |
Disability Class: Cognitive Difficulty
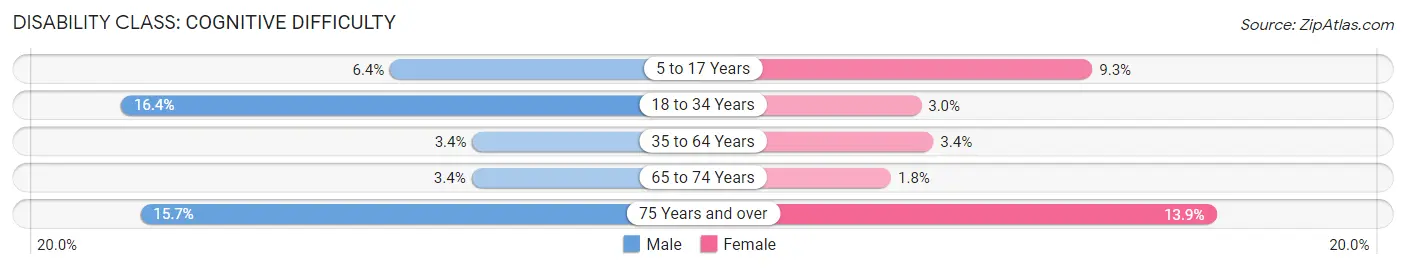
| Age Bracket | Male | Female |
| 5 to 17 Years | 45 (6.4%) | 60 (9.3%) |
| 18 to 34 Years | 112 (16.4%) | 19 (2.9%) |
| 35 to 64 Years | 50 (3.4%) | 49 (3.4%) |
| 65 to 74 Years | 14 (3.4%) | 8 (1.8%) |
| 75 Years and over | 38 (15.7%) | 41 (13.9%) |
Disability Class: Ambulatory Difficulty
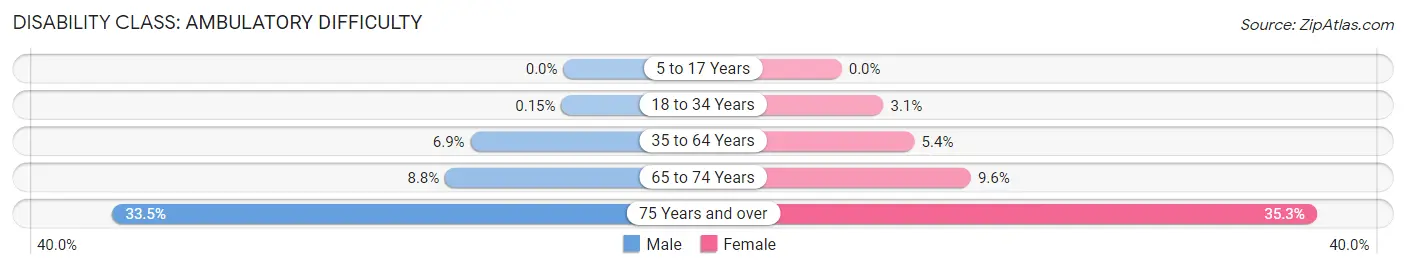
| Age Bracket | Male | Female |
| 5 to 17 Years | 0 (0.0%) | 0 (0.0%) |
| 18 to 34 Years | 1 (0.2%) | 20 (3.1%) |
| 35 to 64 Years | 102 (6.9%) | 78 (5.4%) |
| 65 to 74 Years | 36 (8.8%) | 42 (9.6%) |
| 75 Years and over | 81 (33.5%) | 104 (35.2%) |
Disability Class: Self-Care Difficulty
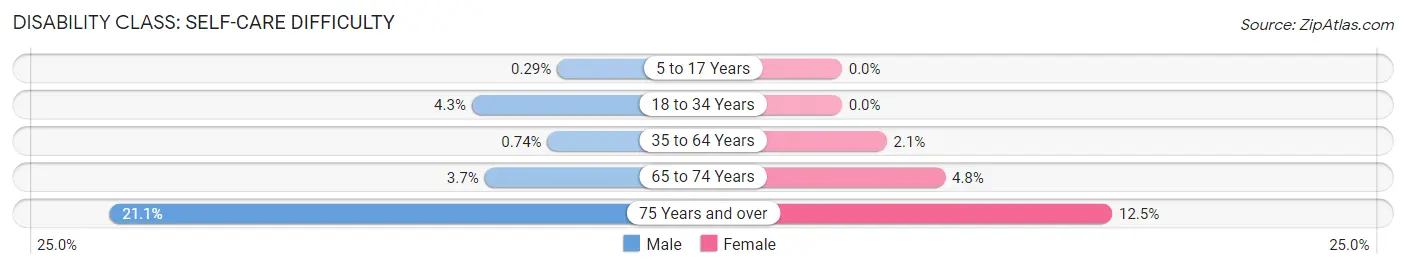
| Age Bracket | Male | Female |
| 5 to 17 Years | 2 (0.3%) | 0 (0.0%) |
| 18 to 34 Years | 29 (4.3%) | 0 (0.0%) |
| 35 to 64 Years | 11 (0.7%) | 30 (2.1%) |
| 65 to 74 Years | 15 (3.7%) | 21 (4.8%) |
| 75 Years and over | 51 (21.1%) | 37 (12.5%) |
Technology Access in Monroe County
Computing Device Access in Monroe County
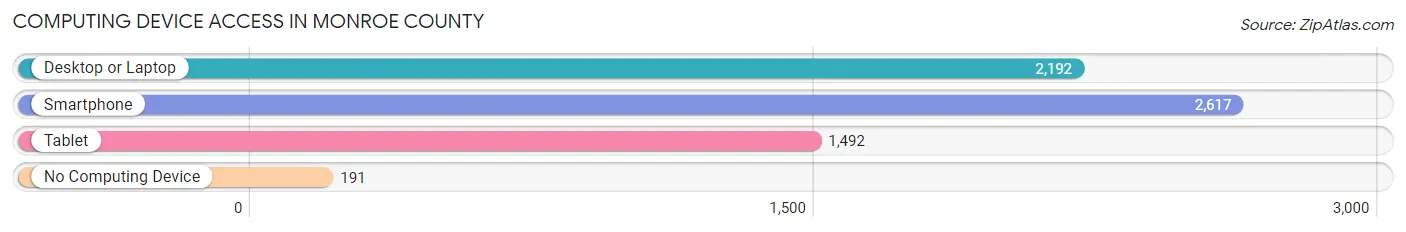
| Device Type | # Households | % Households |
| Desktop or Laptop | 2,192 | 72.3% |
| Smartphone | 2,617 | 86.3% |
| Tablet | 1,492 | 49.2% |
| No Computing Device | 191 | 6.3% |
| Total | 3,032 | 100.0% |
Internet Access in Monroe County

| Internet Type | # Households | % Households |
| Dial-Up Internet | 21 | 0.7% |
| Broadband Home | 1,549 | 51.1% |
| Cellular Data Only | 529 | 17.4% |
| Satellite Internet | 324 | 10.7% |
| No Internet | 576 | 19.0% |
| Total | 3,032 | 100.0% |
Monroe County Summary
Monroe County, Iowa is located in the southeastern corner of the state and is part of the Des Moines–West Des Moines Metropolitan Statistical Area. The county was established in 1846 and named after James Monroe, the fifth President of the United States. As of the 2010 census, the population was 9,543, making it the second least populous county in Iowa.
Geography
Monroe County is located in the southeastern corner of Iowa and is bordered by Appanoose County to the north, Davis County to the east, Van Buren County to the south, and Lucas County to the west. The county has a total area of 517 square miles, of which 514 square miles is land and 3.2 square miles is water. The highest point in the county is located in the northwest corner, at an elevation of 1,092 feet above sea level.
The county is home to several rivers and streams, including the Chariton River, which flows through the county from north to south. Other rivers and streams include the South Skunk River, the North Skunk River, and the Middle River. The county also contains several lakes, including Lake Miami, Lake Sugema, and Lake Rathbun.
Demographics
As of the 2010 census, there were 9,543 people, 3,845 households, and 2,619 families residing in the county. The population density was 18.6 people per square mile. There were 4,093 housing units at an average density of 8.0 per square mile. The racial makeup of the county was 97.7% White, 0.3% African American, 0.2% Native American, 0.2% Asian, 0.2% from other races, and 1.4% from two or more races. Hispanic or Latino of any race were 1.2% of the population.
There were 3,845 households, out of which 30.2% had children under the age of 18 living with them, 56.2% were married couples living together, 8.2% had a female householder with no husband present, and 31.7% were non-families. 27.2% of all households were made up of individuals, and 13.2% had someone living alone who was 65 years of age or older. The average household size was 2.45 and the average family size was 2.96.
The median age in the county was 41.3 years. 24.2% of residents were under the age of 18; 6.9% were between the ages of 18 and 24; 23.2% were from 25 to 44; 28.2% were from 45 to 64; and 17.5% were 65 years of age or older. The gender makeup of the county was 49.2% male and 50.8% female.
Economy
The economy of Monroe County is largely based on agriculture. The county is home to several large farms, as well as smaller family-owned farms. The main crops grown in the county are corn, soybeans, and hay. Livestock production is also an important part of the county’s economy, with beef cattle, dairy cattle, and hogs being the main types of livestock raised.
In addition to agriculture, the county is home to several manufacturing companies, including a furniture manufacturer, a plastics manufacturer, and a metal fabrication company. The county also has a number of small businesses, including restaurants, retail stores, and service providers.
The unemployment rate in Monroe County was 4.2% in 2019, lower than the national average of 3.7%. The median household income in the county was $50,945 in 2019, higher than the national median of $61,937.
Conclusion
Monroe County, Iowa is a rural county located in the southeastern corner of the state. The county has a population of 9,543 and is home to several rivers and streams, as well as several lakes. The economy of the county is largely based on agriculture, with corn, soybeans, and hay being the main crops grown. The county also has several manufacturing companies and small businesses. The unemployment rate in the county is lower than the national average, and the median household income is higher than the national median.
Common Questions
What is Per Capita Income in Monroe County?
Per Capita income in Monroe County is $35,392.
What is the Median Family Income in Monroe County?
Median Family Income in Monroe County is $89,814.
What is the Median Household income in Monroe County?
Median Household Income in Monroe County is $76,324.
What is Income or Wage Gap in Monroe County?
Income or Wage Gap in Monroe County is 26.5%.
Women in Monroe County earn 73.5 cents for every dollar earned by a man.
What is Inequality or Gini Index in Monroe County?
Inequality or Gini Index in Monroe County is 0.40.
What is the Total Population of Monroe County?
Total Population of Monroe County is 7,574.
What is the Total Male Population of Monroe County?
Total Male Population of Monroe County is 3,774.
What is the Total Female Population of Monroe County?
Total Female Population of Monroe County is 3,800.
What is the Ratio of Males per 100 Females in Monroe County?
There are 99.32 Males per 100 Females in Monroe County.
What is the Ratio of Females per 100 Males in Monroe County?
There are 100.69 Females per 100 Males in Monroe County.
What is the Median Population Age in Monroe County?
Median Population Age in Monroe County is 41.5 Years.
What is the Average Family Size in Monroe County
Average Family Size in Monroe County is 3.2 People.
What is the Average Household Size in Monroe County
Average Household Size in Monroe County is 2.5 People.
How Large is the Labor Force in Monroe County?
There are 3,733 People in the Labor Forcein in Monroe County.
What is the Percentage of People in the Labor Force in Monroe County?
62.1% of People are in the Labor Force in Monroe County.
What is the Unemployment Rate in Monroe County?
Unemployment Rate in Monroe County is 3.4%.