Keokuk County, IA Map & Demographics
Keokuk County Map
Keokuk County Overview
$32,747
PER CAPITA INCOME
$77,740
AVG FAMILY INCOME
$60,016
AVG HOUSEHOLD INCOME
24.6%
WAGE / INCOME GAP [ % ]
75.4¢/ $1
WAGE / INCOME GAP [ $ ]
$8,781
FAMILY INCOME DEFICIT
0.44
INEQUALITY / GINI INDEX
10,026
TOTAL POPULATION
5,147
MALE POPULATION
4,879
FEMALE POPULATION
105.49
MALES / 100 FEMALES
94.79
FEMALES / 100 MALES
42.7
MEDIAN AGE
3.1
AVG FAMILY SIZE
2.4
AVG HOUSEHOLD SIZE
4,803
LABOR FORCE [ PEOPLE ]
59.8%
PERCENT IN LABOR FORCE
3.6%
UNEMPLOYMENT RATE
Income in Keokuk County
Income Overview in Keokuk County
Per Capita Income in Keokuk County is $32,747, while median incomes of families and households are $77,740 and $60,016 respectively.
| Characteristic | Number | Measure |
| Per Capita Income | 10,026 | $32,747 |
| Median Family Income | 2,606 | $77,740 |
| Mean Family Income | 2,606 | $94,545 |
| Median Household Income | 4,085 | $60,016 |
| Mean Household Income | 4,085 | $78,499 |
| Income Deficit | 2,606 | $8,781 |
| Wage / Income Gap (%) | 10,026 | 24.57% |
| Wage / Income Gap ($) | 10,026 | 75.43¢ per $1 |
| Gini / Inequality Index | 10,026 | 0.44 |
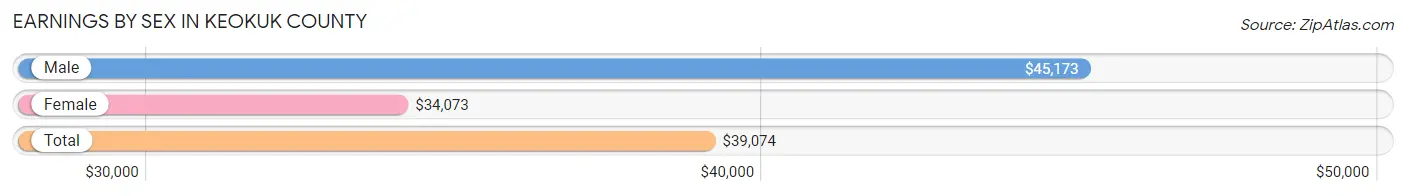
Earnings by Sex in Keokuk County
Average Earnings in Keokuk County are $39,074, $45,173 for men and $34,073 for women, a difference of 24.6%.
| Sex | Number | Average Earnings |
| Male | 2,858 (55.0%) | $45,173 |
| Female | 2,336 (45.0%) | $34,073 |
| Total | 5,194 (100.0%) | $39,074 |
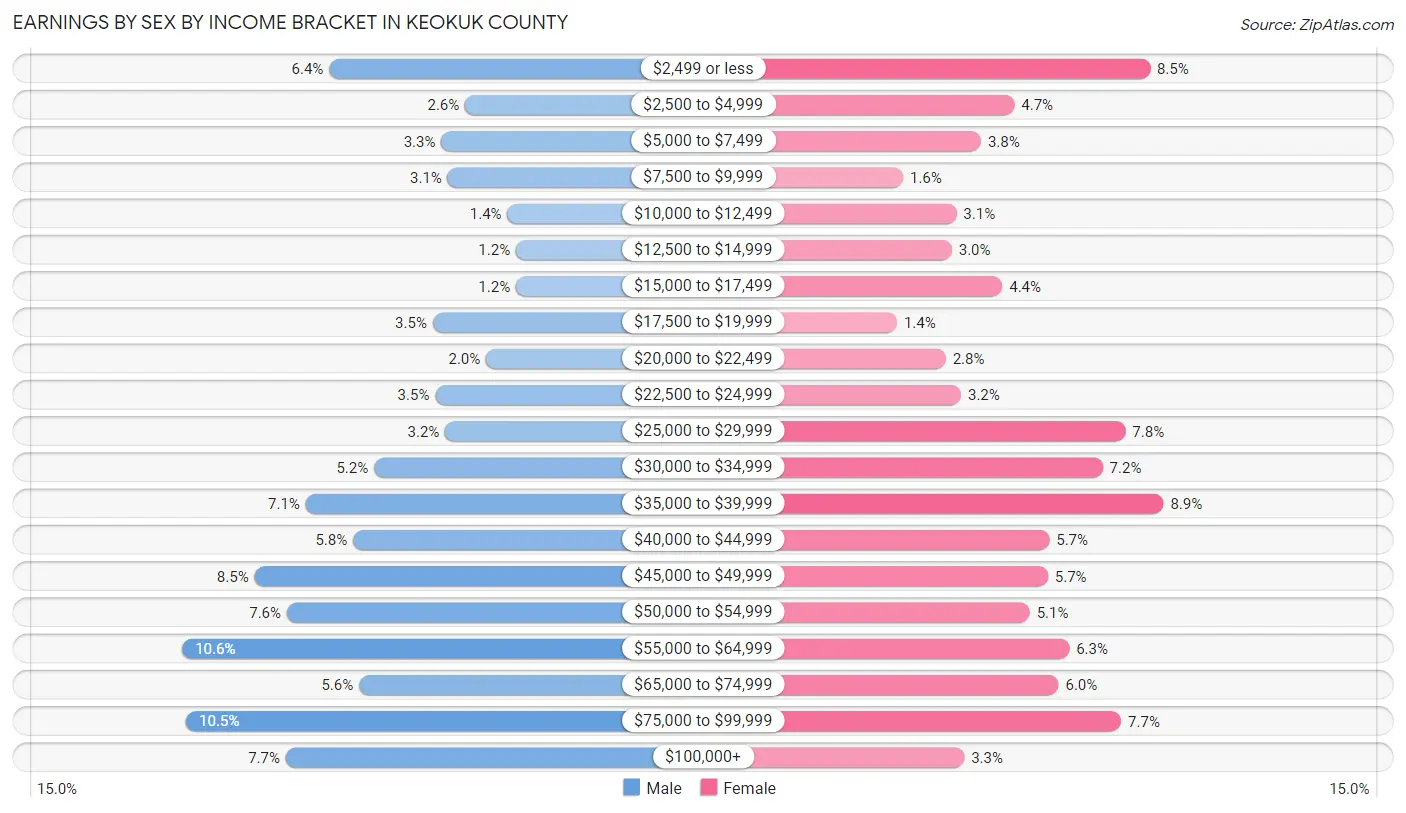
Earnings by Sex by Income Bracket in Keokuk County
The most common earnings brackets in Keokuk County are $55,000 to $64,999 for men (302 | 10.6%) and $35,000 to $39,999 for women (208 | 8.9%).
| Income | Male | Female |
| $2,499 or less | 184 (6.4%) | 199 (8.5%) |
| $2,500 to $4,999 | 75 (2.6%) | 110 (4.7%) |
| $5,000 to $7,499 | 94 (3.3%) | 88 (3.8%) |
| $7,500 to $9,999 | 89 (3.1%) | 37 (1.6%) |
| $10,000 to $12,499 | 41 (1.4%) | 72 (3.1%) |
| $12,500 to $14,999 | 34 (1.2%) | 69 (2.9%) |
| $15,000 to $17,499 | 34 (1.2%) | 102 (4.4%) |
| $17,500 to $19,999 | 101 (3.5%) | 33 (1.4%) |
| $20,000 to $22,499 | 58 (2.0%) | 65 (2.8%) |
| $22,500 to $24,999 | 99 (3.5%) | 75 (3.2%) |
| $25,000 to $29,999 | 91 (3.2%) | 183 (7.8%) |
| $30,000 to $34,999 | 148 (5.2%) | 168 (7.2%) |
| $35,000 to $39,999 | 203 (7.1%) | 208 (8.9%) |
| $40,000 to $44,999 | 165 (5.8%) | 133 (5.7%) |
| $45,000 to $49,999 | 244 (8.5%) | 132 (5.7%) |
| $50,000 to $54,999 | 218 (7.6%) | 120 (5.1%) |
| $55,000 to $64,999 | 302 (10.6%) | 146 (6.2%) |
| $65,000 to $74,999 | 160 (5.6%) | 139 (5.9%) |
| $75,000 to $99,999 | 299 (10.5%) | 180 (7.7%) |
| $100,000+ | 219 (7.7%) | 77 (3.3%) |
| Total | 2,858 (100.0%) | 2,336 (100.0%) |
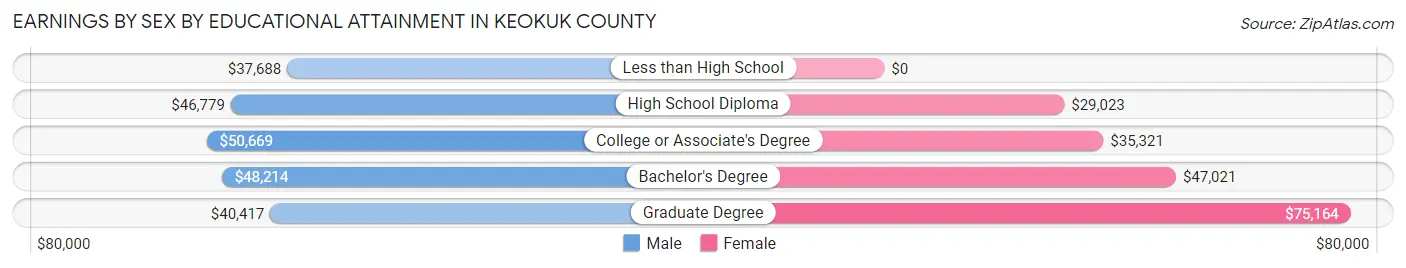
Earnings by Sex by Educational Attainment in Keokuk County
Average earnings in Keokuk County are $47,280 for men and $37,308 for women, a difference of 21.1%. Men with an educational attainment of college or associate's degree enjoy the highest average annual earnings of $50,669, while those with less than high school education earn the least with $37,688. Women with an educational attainment of graduate degree earn the most with the average annual earnings of $75,164, while those with high school diploma education have the smallest earnings of $29,023.
| Educational Attainment | Male Income | Female Income |
| Less than High School | $37,688 | $0 |
| High School Diploma | $46,779 | $29,023 |
| College or Associate's Degree | $50,669 | $35,321 |
| Bachelor's Degree | $48,214 | $47,021 |
| Graduate Degree | $40,417 | $75,164 |
| Total | $47,280 | $37,308 |
Family Income in Keokuk County
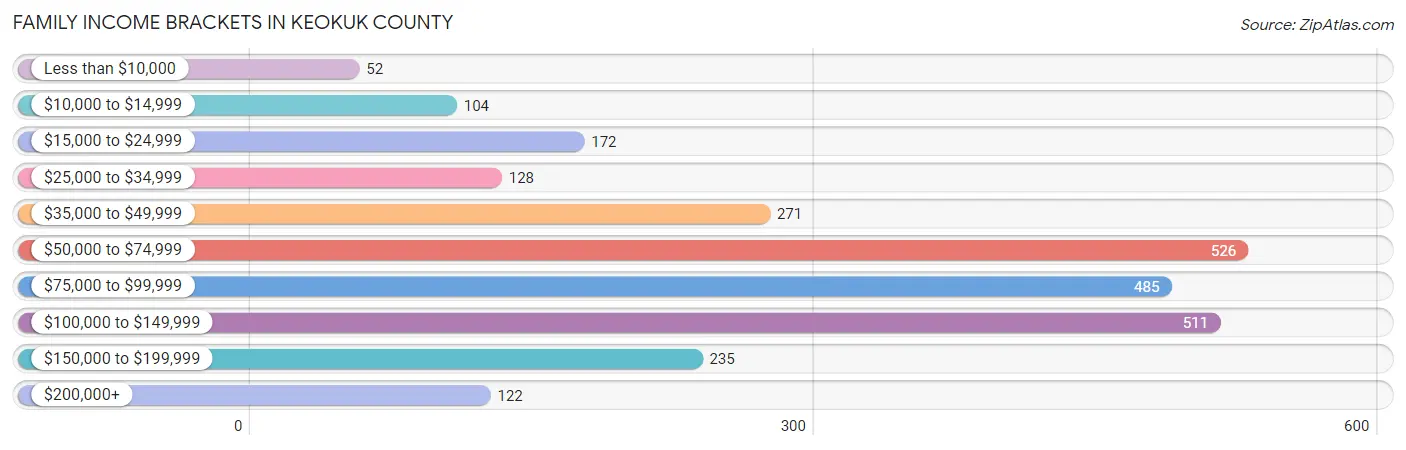
Family Income Brackets in Keokuk County
According to the Keokuk County family income data, there are 526 families falling into the $50,000 to $74,999 income range, which is the most common income bracket and makes up 20.2% of all families. Conversely, the less than $10,000 income bracket is the least frequent group with only 52 families (2.0%) belonging to this category.
| Income Bracket | # Families | % Families |
| Less than $10,000 | 52 | 2.0% |
| $10,000 to $14,999 | 104 | 4.0% |
| $15,000 to $24,999 | 172 | 6.6% |
| $25,000 to $34,999 | 128 | 4.9% |
| $35,000 to $49,999 | 271 | 10.4% |
| $50,000 to $74,999 | 526 | 20.2% |
| $75,000 to $99,999 | 485 | 18.6% |
| $100,000 to $149,999 | 511 | 19.6% |
| $150,000 to $199,999 | 235 | 9.0% |
| $200,000+ | 122 | 4.7% |
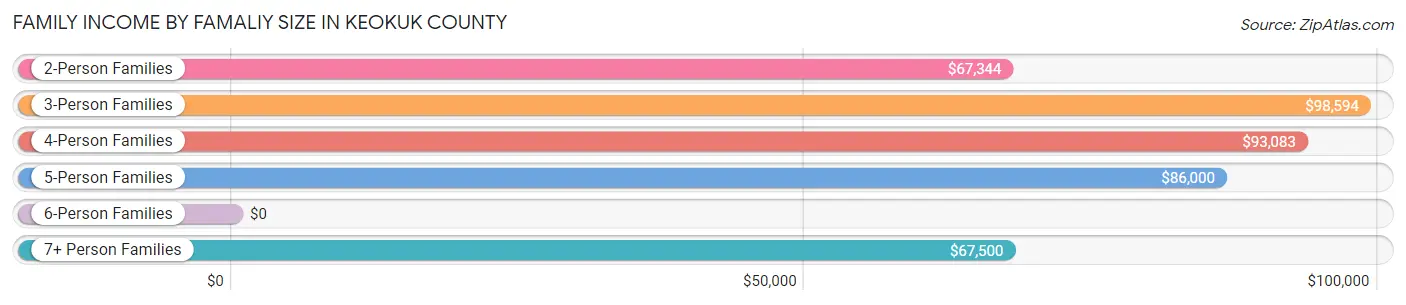
Family Income by Famaliy Size in Keokuk County
3-person families (393 | 15.1%) account for the highest median family income in Keokuk County with $98,594 per family, while 2-person families (1,546 | 59.3%) have the highest median income of $33,672 per family member.
| Income Bracket | # Families | Median Income |
| 2-Person Families | 1,546 (59.3%) | $67,344 |
| 3-Person Families | 393 (15.1%) | $98,594 |
| 4-Person Families | 333 (12.8%) | $93,083 |
| 5-Person Families | 208 (8.0%) | $86,000 |
| 6-Person Families | 94 (3.6%) | $0 |
| 7+ Person Families | 32 (1.2%) | $67,500 |
| Total | 2,606 (100.0%) | $77,740 |
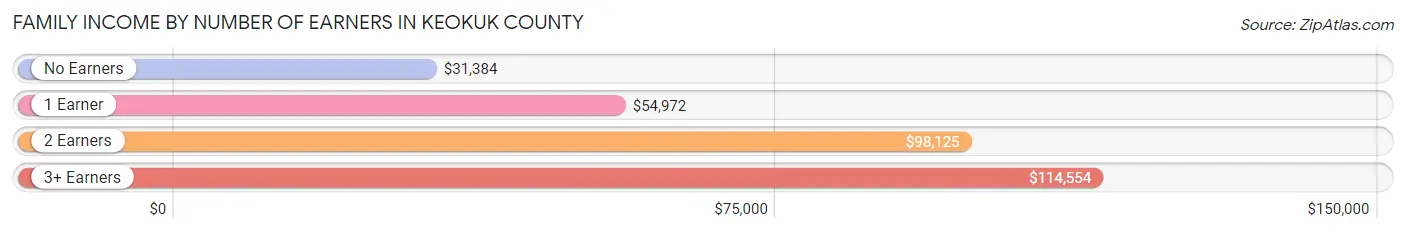
Family Income by Number of Earners in Keokuk County
The median family income in Keokuk County is $77,740, with families comprising 3+ earners (261) having the highest median family income of $114,554, while families with no earners (425) have the lowest median family income of $31,384, accounting for 10.0% and 16.3% of families, respectively.
| Number of Earners | # Families | Median Income |
| No Earners | 425 (16.3%) | $31,384 |
| 1 Earner | 797 (30.6%) | $54,972 |
| 2 Earners | 1,123 (43.1%) | $98,125 |
| 3+ Earners | 261 (10.0%) | $114,554 |
| Total | 2,606 (100.0%) | $77,740 |
Household Income in Keokuk County
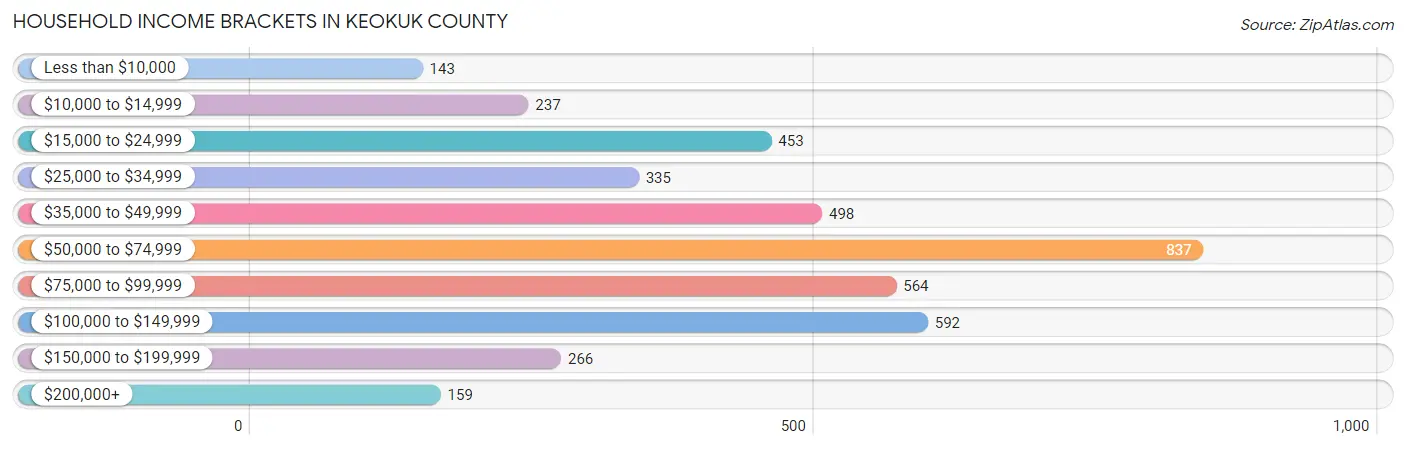
Household Income Brackets in Keokuk County
With 837 households falling in the category, the $50,000 to $74,999 income range is the most frequent in Keokuk County, accounting for 20.5% of all households. In contrast, only 143 households (3.5%) fall into the less than $10,000 income bracket, making it the least populous group.
| Income Bracket | # Households | % Households |
| Less than $10,000 | 143 | 3.5% |
| $10,000 to $14,999 | 237 | 5.8% |
| $15,000 to $24,999 | 453 | 11.1% |
| $25,000 to $34,999 | 335 | 8.2% |
| $35,000 to $49,999 | 498 | 12.2% |
| $50,000 to $74,999 | 837 | 20.5% |
| $75,000 to $99,999 | 564 | 13.8% |
| $100,000 to $149,999 | 592 | 14.5% |
| $150,000 to $199,999 | 266 | 6.5% |
| $200,000+ | 159 | 3.9% |
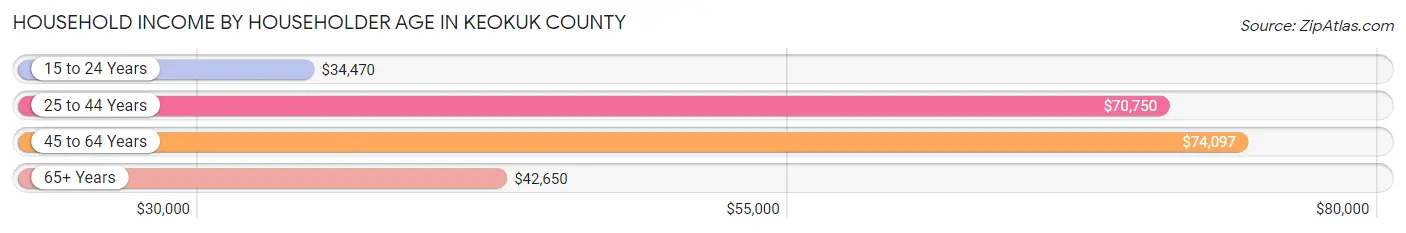
Household Income by Householder Age in Keokuk County
The median household income in Keokuk County is $60,016, with the highest median household income of $74,097 found in the 45 to 64 years age bracket for the primary householder. A total of 1,453 households (35.6%) fall into this category. Meanwhile, the 15 to 24 years age bracket for the primary householder has the lowest median household income of $34,470, with 120 households (2.9%) in this group.
| Income Bracket | # Households | Median Income |
| 15 to 24 Years | 120 (2.9%) | $34,470 |
| 25 to 44 Years | 1,159 (28.4%) | $70,750 |
| 45 to 64 Years | 1,453 (35.6%) | $74,097 |
| 65+ Years | 1,353 (33.1%) | $42,650 |
| Total | 4,085 (100.0%) | $60,016 |
Poverty in Keokuk County
Income Below Poverty by Sex and Age in Keokuk County
With 11.7% poverty level for males and 12.7% for females among the residents of Keokuk County, 75 year old and over males and 16 and 17 year old females are the most vulnerable to poverty, with 107 males (27.9%) and 32 females (24.8%) in their respective age groups living below the poverty level.
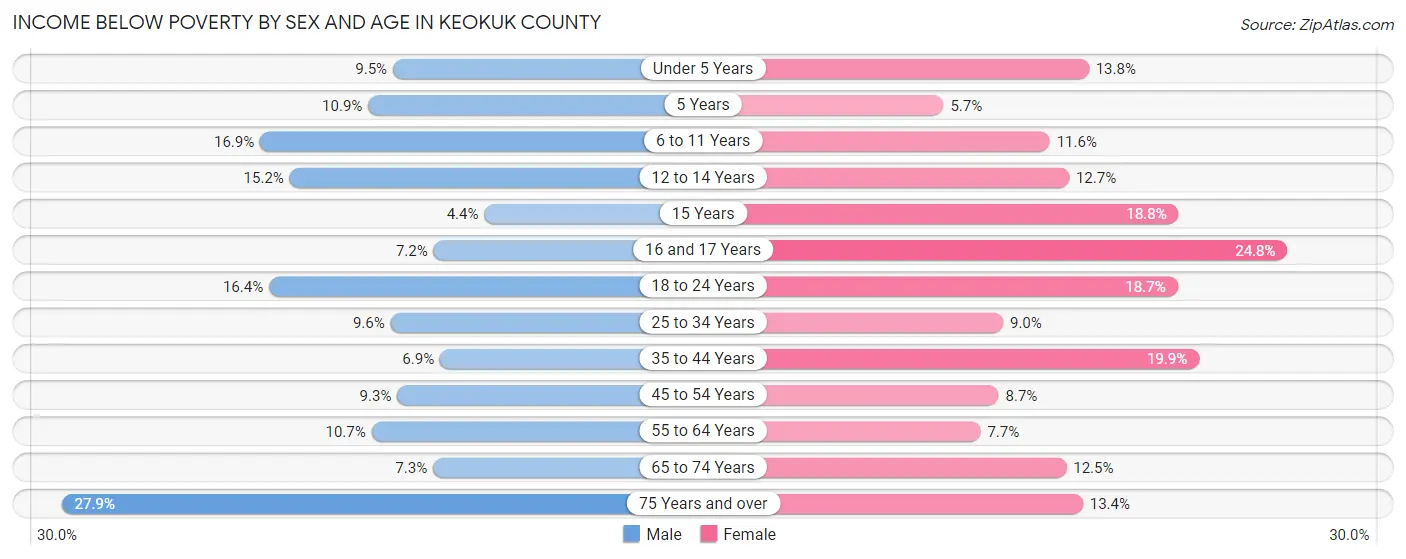
| Age Bracket | Male | Female |
| Under 5 Years | 26 (9.5%) | 40 (13.8%) |
| 5 Years | 5 (10.9%) | 3 (5.7%) |
| 6 to 11 Years | 74 (16.9%) | 44 (11.6%) |
| 12 to 14 Years | 25 (15.2%) | 21 (12.7%) |
| 15 Years | 4 (4.4%) | 12 (18.8%) |
| 16 and 17 Years | 12 (7.2%) | 32 (24.8%) |
| 18 to 24 Years | 70 (16.4%) | 60 (18.7%) |
| 25 to 34 Years | 53 (9.6%) | 46 (9.0%) |
| 35 to 44 Years | 40 (6.9%) | 112 (19.9%) |
| 45 to 54 Years | 53 (9.2%) | 46 (8.7%) |
| 55 to 64 Years | 82 (10.7%) | 55 (7.7%) |
| 65 to 74 Years | 45 (7.3%) | 71 (12.5%) |
| 75 Years and over | 107 (27.9%) | 69 (13.4%) |
| Total | 596 (11.7%) | 611 (12.7%) |
Income Above Poverty by Sex and Age in Keokuk County
According to the poverty statistics in Keokuk County, males aged 15 years and females aged 5 years are the age groups that are most secure financially, with 95.6% of males and 94.3% of females in these age groups living above the poverty line.
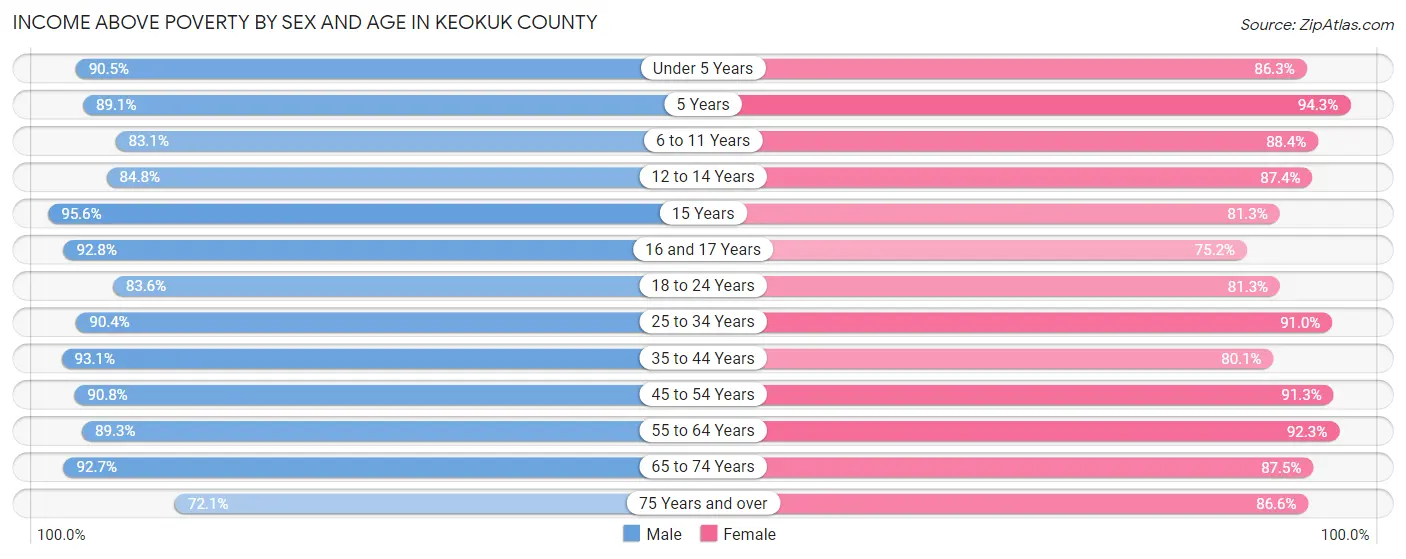
| Age Bracket | Male | Female |
| Under 5 Years | 248 (90.5%) | 251 (86.3%) |
| 5 Years | 41 (89.1%) | 50 (94.3%) |
| 6 to 11 Years | 364 (83.1%) | 336 (88.4%) |
| 12 to 14 Years | 139 (84.8%) | 145 (87.4%) |
| 15 Years | 87 (95.6%) | 52 (81.2%) |
| 16 and 17 Years | 154 (92.8%) | 97 (75.2%) |
| 18 to 24 Years | 357 (83.6%) | 261 (81.3%) |
| 25 to 34 Years | 498 (90.4%) | 466 (91.0%) |
| 35 to 44 Years | 542 (93.1%) | 451 (80.1%) |
| 45 to 54 Years | 520 (90.7%) | 481 (91.3%) |
| 55 to 64 Years | 686 (89.3%) | 657 (92.3%) |
| 65 to 74 Years | 575 (92.7%) | 497 (87.5%) |
| 75 Years and over | 276 (72.1%) | 445 (86.6%) |
| Total | 4,487 (88.3%) | 4,189 (87.3%) |
Income Below Poverty Among Married-Couple Families in Keokuk County
The poverty statistics for married-couple families in Keokuk County show that 6.5% or 136 of the total 2,082 families live below the poverty line. Families with 5 or more children have the highest poverty rate of 40.0%, comprising of 6 families. On the other hand, families with 1 or 2 children have the lowest poverty rate of 4.1%, which includes 19 families.
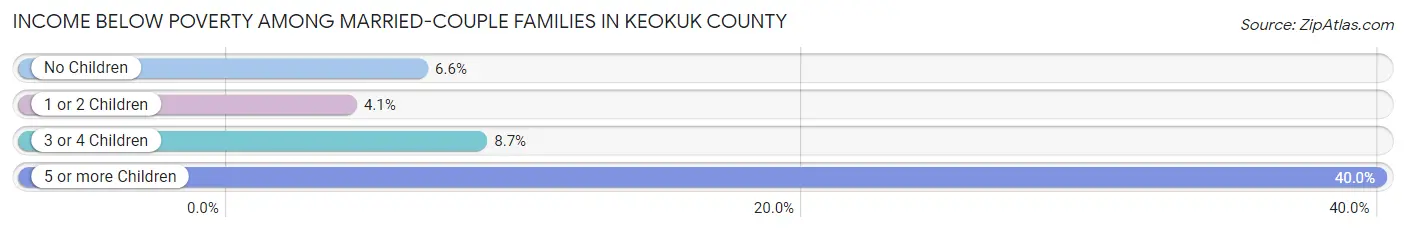
| Children | Above Poverty | Below Poverty |
| No Children | 1,297 (93.4%) | 92 (6.6%) |
| 1 or 2 Children | 440 (95.9%) | 19 (4.1%) |
| 3 or 4 Children | 200 (91.3%) | 19 (8.7%) |
| 5 or more Children | 9 (60.0%) | 6 (40.0%) |
| Total | 1,946 (93.5%) | 136 (6.5%) |
Income Below Poverty Among Single-Parent Households in Keokuk County
According to the poverty data in Keokuk County, 16.8% or 34 single-father households and 32.6% or 105 single-mother households are living below the poverty line. Among single-father households, those with no children have the highest poverty rate, with 13 households (21.7%) experiencing poverty. Likewise, among single-mother households, those with 1 or 2 children have the highest poverty rate, with 104 households (45.6%) falling below the poverty line.
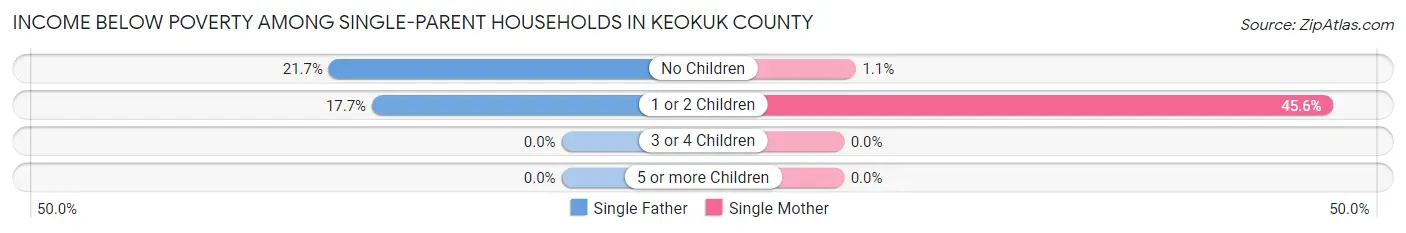
| Children | Single Father | Single Mother |
| No Children | 13 (21.7%) | 1 (1.1%) |
| 1 or 2 Children | 21 (17.6%) | 104 (45.6%) |
| 3 or 4 Children | 0 (0.0%) | 0 (0.0%) |
| 5 or more Children | 0 (0.0%) | 0 (0.0%) |
| Total | 34 (16.8%) | 105 (32.6%) |
Income Below Poverty Among Married-Couple vs Single-Parent Households in Keokuk County
The poverty data for Keokuk County shows that 136 of the married-couple family households (6.5%) and 139 of the single-parent households (26.5%) are living below the poverty level. Within the married-couple family households, those with 5 or more children have the highest poverty rate, with 6 households (40.0%) falling below the poverty line. Among the single-parent households, those with 1 or 2 children have the highest poverty rate, with 125 household (36.0%) living below poverty.
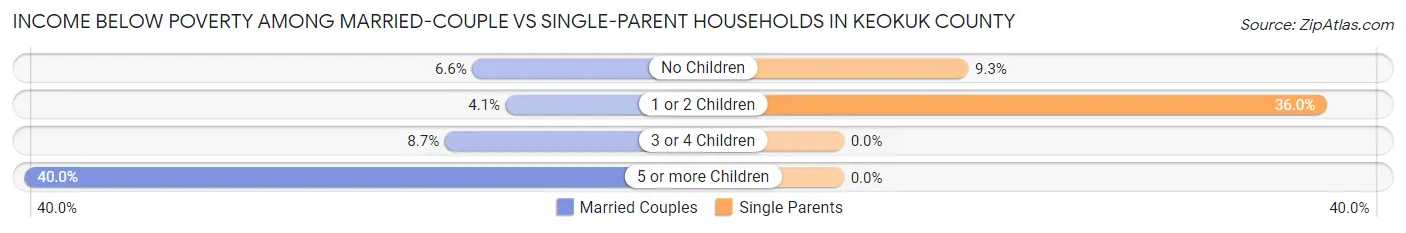
| Children | Married-Couple Families | Single-Parent Households |
| No Children | 92 (6.6%) | 14 (9.3%) |
| 1 or 2 Children | 19 (4.1%) | 125 (36.0%) |
| 3 or 4 Children | 19 (8.7%) | 0 (0.0%) |
| 5 or more Children | 6 (40.0%) | 0 (0.0%) |
| Total | 136 (6.5%) | 139 (26.5%) |
Race in Keokuk County
The most populous races in Keokuk County are White / Caucasian (9,682 | 96.6%), Hispanic or Latino (218 | 2.2%), and Two or more Races (166 | 1.7%).
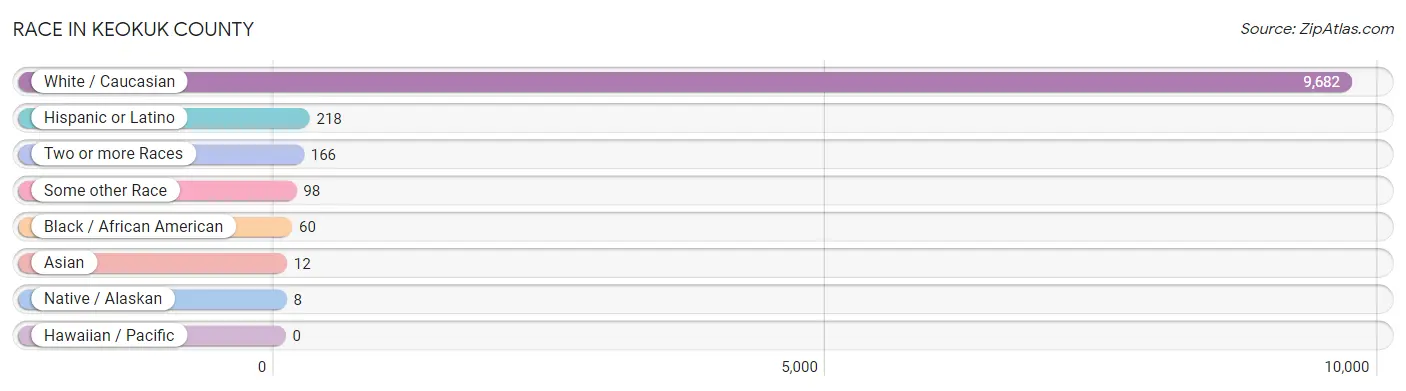
| Race | # Population | % Population |
| Asian | 12 | 0.1% |
| Black / African American | 60 | 0.6% |
| Hawaiian / Pacific | 0 | 0.0% |
| Hispanic or Latino | 218 | 2.2% |
| Native / Alaskan | 8 | 0.1% |
| White / Caucasian | 9,682 | 96.6% |
| Two or more Races | 166 | 1.7% |
| Some other Race | 98 | 1.0% |
| Total | 10,026 | 100.0% |
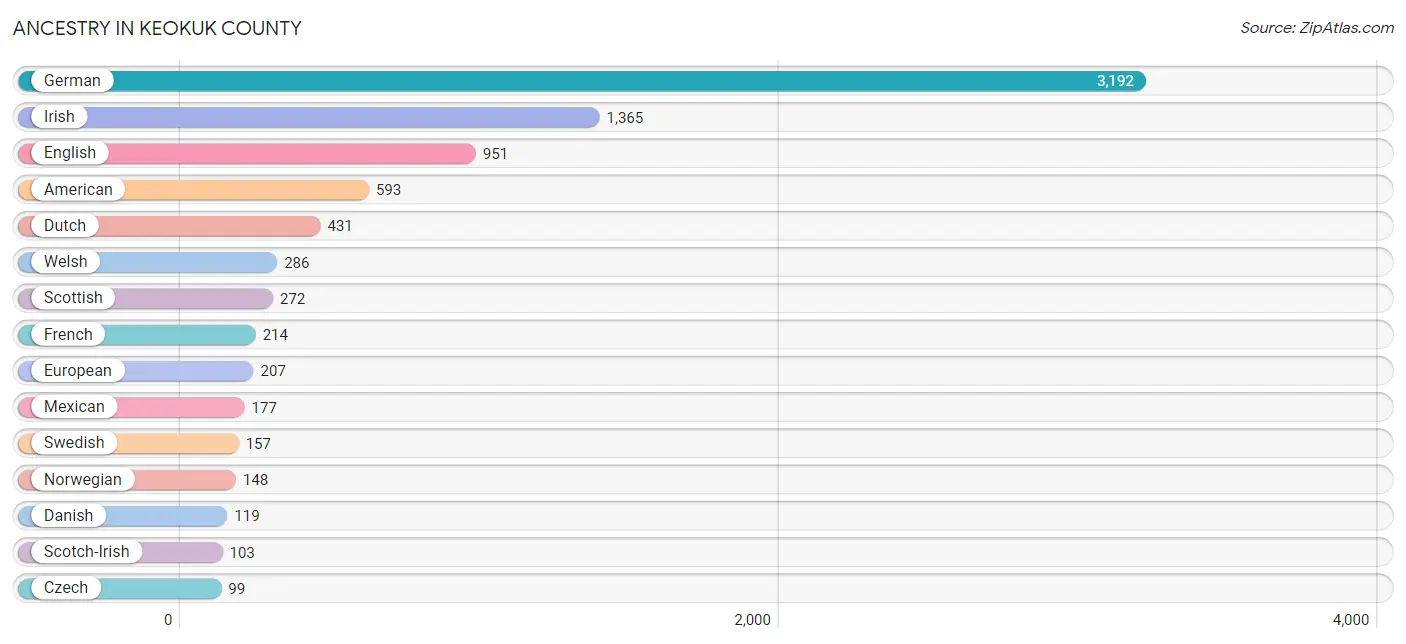
Ancestry in Keokuk County
The most populous ancestries reported in Keokuk County are German (3,192 | 31.8%), Irish (1,365 | 13.6%), English (951 | 9.5%), American (593 | 5.9%), and Dutch (431 | 4.3%), together accounting for 65.2% of all Keokuk County residents.
| Ancestry | # Population | % Population |
| African | 2 | 0.0% |
| American | 593 | 5.9% |
| Arab | 1 | 0.0% |
| Austrian | 25 | 0.3% |
| Belgian | 68 | 0.7% |
| British | 28 | 0.3% |
| Canadian | 13 | 0.1% |
| Central American | 24 | 0.2% |
| Cherokee | 6 | 0.1% |
| Choctaw | 3 | 0.0% |
| Croatian | 6 | 0.1% |
| Cuban | 6 | 0.1% |
| Czech | 99 | 1.0% |
| Czechoslovakian | 12 | 0.1% |
| Danish | 119 | 1.2% |
| Dutch | 431 | 4.3% |
| Eastern European | 4 | 0.0% |
| Egyptian | 1 | 0.0% |
| English | 951 | 9.5% |
| European | 207 | 2.1% |
| French | 214 | 2.1% |
| French Canadian | 10 | 0.1% |
| German | 3,192 | 31.8% |
| Greek | 26 | 0.3% |
| Guatemalan | 3 | 0.0% |
| Hungarian | 14 | 0.1% |
| Indian (Asian) | 5 | 0.1% |
| Irish | 1,365 | 13.6% |
| Italian | 82 | 0.8% |
| Korean | 35 | 0.4% |
| Liberian | 1 | 0.0% |
| Lithuanian | 3 | 0.0% |
| Luxembourger | 17 | 0.2% |
| Mexican | 177 | 1.8% |
| Mexican American Indian | 3 | 0.0% |
| Native Hawaiian | 5 | 0.1% |
| Nicaraguan | 19 | 0.2% |
| Northern European | 6 | 0.1% |
| Norwegian | 148 | 1.5% |
| Pennsylvania German | 9 | 0.1% |
| Peruvian | 2 | 0.0% |
| Polish | 91 | 0.9% |
| Portuguese | 2 | 0.0% |
| Puerto Rican | 7 | 0.1% |
| Russian | 1 | 0.0% |
| Salvadoran | 2 | 0.0% |
| Scandinavian | 36 | 0.4% |
| Scotch-Irish | 103 | 1.0% |
| Scottish | 272 | 2.7% |
| Serbian | 2 | 0.0% |
| Sioux | 1 | 0.0% |
| South American | 2 | 0.0% |
| Sri Lankan | 5 | 0.1% |
| Subsaharan African | 7 | 0.1% |
| Swedish | 157 | 1.6% |
| Swiss | 19 | 0.2% |
| Thai | 10 | 0.1% |
| Ukrainian | 13 | 0.1% |
| Welsh | 286 | 2.9% |
| West Indian | 3 | 0.0% | View All 60 Rows |
Immigrants in Keokuk County
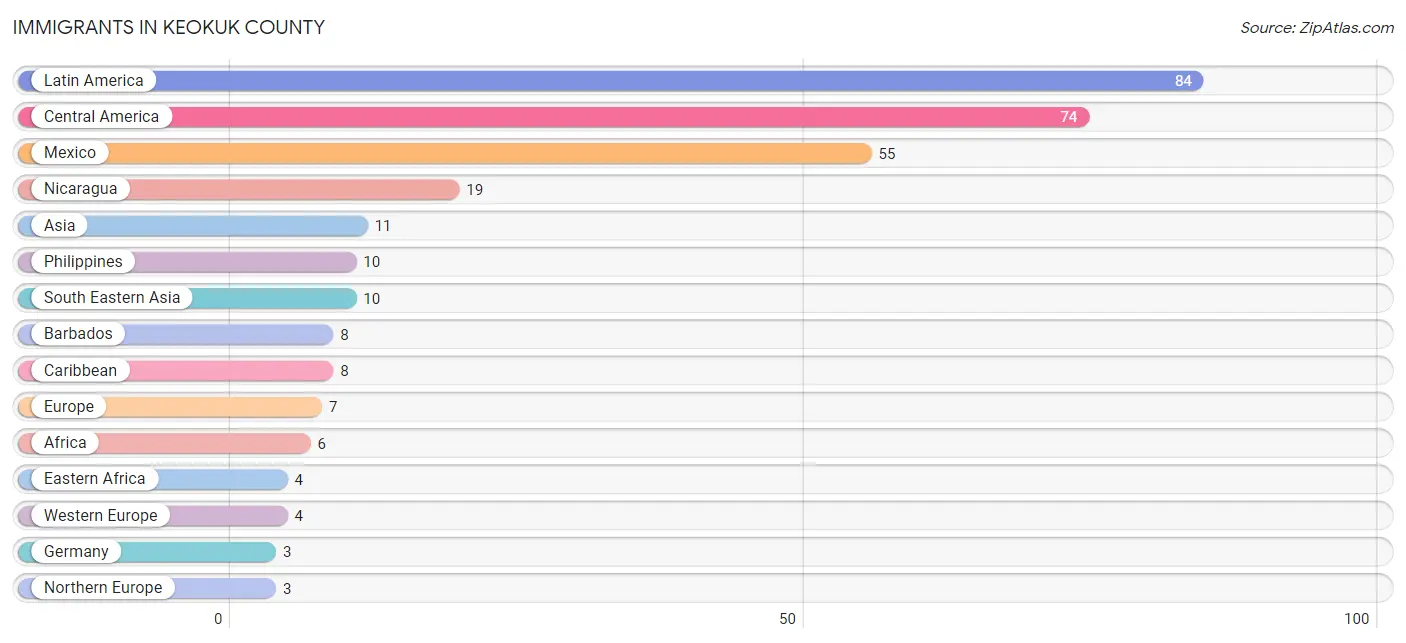
The most numerous immigrant groups reported in Keokuk County came from Latin America (84 | 0.8%), Central America (74 | 0.7%), Mexico (55 | 0.5%), Nicaragua (19 | 0.2%), and Asia (11 | 0.1%), together accounting for 2.4% of all Keokuk County residents.
| Immigration Origin | # Population | % Population |
| Africa | 6 | 0.1% |
| Asia | 11 | 0.1% |
| Barbados | 8 | 0.1% |
| Caribbean | 8 | 0.1% |
| Central America | 74 | 0.7% |
| Eastern Africa | 4 | 0.0% |
| Egypt | 1 | 0.0% |
| Europe | 7 | 0.1% |
| Germany | 3 | 0.0% |
| India | 1 | 0.0% |
| Latin America | 84 | 0.8% |
| Liberia | 1 | 0.0% |
| Mexico | 55 | 0.5% |
| Netherlands | 1 | 0.0% |
| Nicaragua | 19 | 0.2% |
| Northern Africa | 1 | 0.0% |
| Northern Europe | 3 | 0.0% |
| Peru | 2 | 0.0% |
| Philippines | 10 | 0.1% |
| South America | 2 | 0.0% |
| South Central Asia | 1 | 0.0% |
| South Eastern Asia | 10 | 0.1% |
| Western Africa | 1 | 0.0% |
| Western Europe | 4 | 0.0% | View All 24 Rows |
Sex and Age in Keokuk County
Sex and Age in Keokuk County
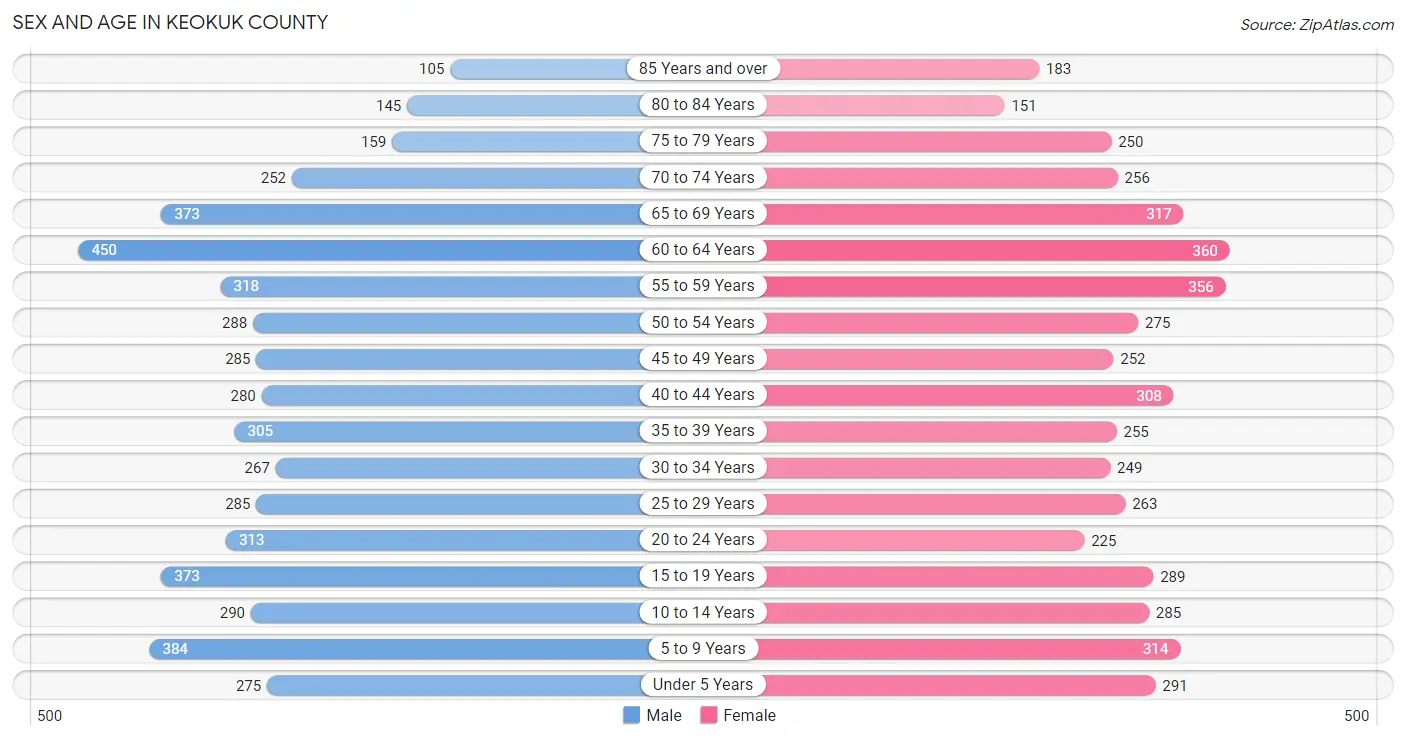
The most populous age groups in Keokuk County are 60 to 64 Years (450 | 8.7%) for men and 60 to 64 Years (360 | 7.4%) for women.
| Age Bracket | Male | Female |
| Under 5 Years | 275 (5.3%) | 291 (6.0%) |
| 5 to 9 Years | 384 (7.5%) | 314 (6.4%) |
| 10 to 14 Years | 290 (5.6%) | 285 (5.8%) |
| 15 to 19 Years | 373 (7.2%) | 289 (5.9%) |
| 20 to 24 Years | 313 (6.1%) | 225 (4.6%) |
| 25 to 29 Years | 285 (5.5%) | 263 (5.4%) |
| 30 to 34 Years | 267 (5.2%) | 249 (5.1%) |
| 35 to 39 Years | 305 (5.9%) | 255 (5.2%) |
| 40 to 44 Years | 280 (5.4%) | 308 (6.3%) |
| 45 to 49 Years | 285 (5.5%) | 252 (5.2%) |
| 50 to 54 Years | 288 (5.6%) | 275 (5.6%) |
| 55 to 59 Years | 318 (6.2%) | 356 (7.3%) |
| 60 to 64 Years | 450 (8.7%) | 360 (7.4%) |
| 65 to 69 Years | 373 (7.2%) | 317 (6.5%) |
| 70 to 74 Years | 252 (4.9%) | 256 (5.2%) |
| 75 to 79 Years | 159 (3.1%) | 250 (5.1%) |
| 80 to 84 Years | 145 (2.8%) | 151 (3.1%) |
| 85 Years and over | 105 (2.0%) | 183 (3.7%) |
| Total | 5,147 (100.0%) | 4,879 (100.0%) |
Families and Households in Keokuk County
Median Family Size in Keokuk County
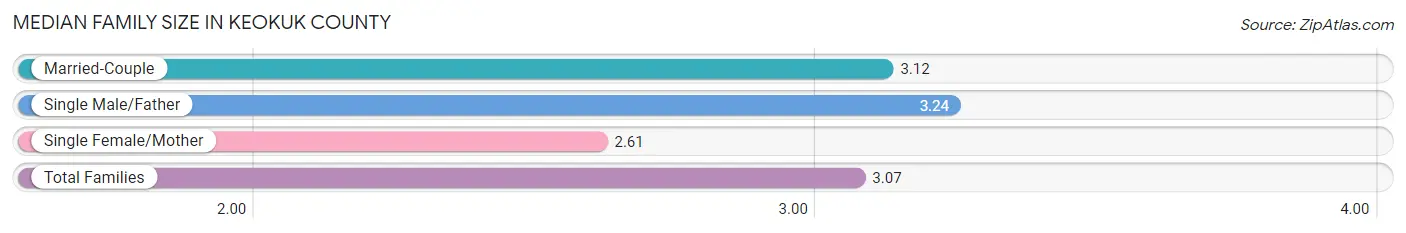
The median family size in Keokuk County is 3.07 persons per family, with single male/father families (202 | 7.7%) accounting for the largest median family size of 3.24 persons per family. On the other hand, single female/mother families (322 | 12.4%) represent the smallest median family size with 2.61 persons per family.
| Family Type | # Families | Family Size |
| Married-Couple | 2,082 (79.9%) | 3.12 |
| Single Male/Father | 202 (7.7%) | 3.24 |
| Single Female/Mother | 322 (12.4%) | 2.61 |
| Total Families | 2,606 (100.0%) | 3.07 |
Median Household Size in Keokuk County
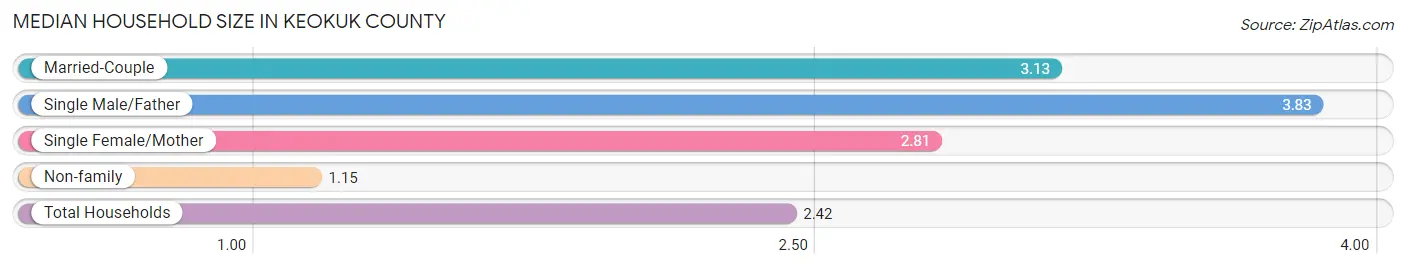
The median household size in Keokuk County is 2.42 persons per household, with single male/father households (202 | 4.9%) accounting for the largest median household size of 3.83 persons per household. non-family households (1,479 | 36.2%) represent the smallest median household size with 1.15 persons per household.
| Household Type | # Households | Household Size |
| Married-Couple | 2,082 (51.0%) | 3.13 |
| Single Male/Father | 202 (4.9%) | 3.83 |
| Single Female/Mother | 322 (7.9%) | 2.81 |
| Non-family | 1,479 (36.2%) | 1.15 |
| Total Households | 4,085 (100.0%) | 2.42 |
Household Size by Marriage Status in Keokuk County
Out of a total of 4,085 households in Keokuk County, 2,606 (63.8%) are family households, while 1,479 (36.2%) are nonfamily households. The most numerous type of family households are 2-person households, comprising 1,420, and the most common type of nonfamily households are 1-person households, comprising 1,293.
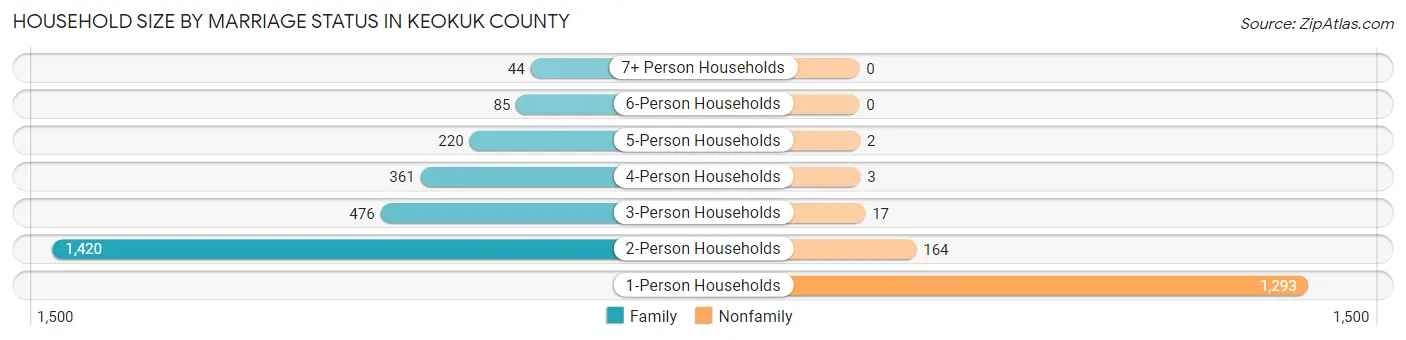
| Household Size | Family Households | Nonfamily Households |
| 1-Person Households | - | 1,293 (31.7%) |
| 2-Person Households | 1,420 (34.8%) | 164 (4.0%) |
| 3-Person Households | 476 (11.7%) | 17 (0.4%) |
| 4-Person Households | 361 (8.8%) | 3 (0.1%) |
| 5-Person Households | 220 (5.4%) | 2 (0.1%) |
| 6-Person Households | 85 (2.1%) | 0 (0.0%) |
| 7+ Person Households | 44 (1.1%) | 0 (0.0%) |
| Total | 2,606 (63.8%) | 1,479 (36.2%) |
Female Fertility in Keokuk County
Fertility by Age in Keokuk County
Average fertility rate in Keokuk County is 70.0 births per 1,000 women. Women in the age bracket of 20 to 34 years have the highest fertility rate with 170.0 births per 1,000 women. Women in the age bracket of 20 to 34 years acount for 94.0% of all women with births.
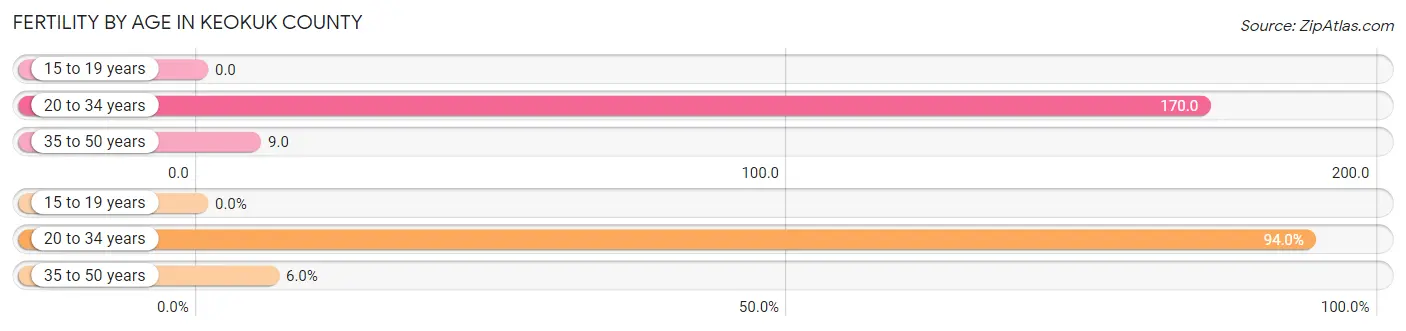
| Age Bracket | Women with Births | Births / 1,000 Women |
| 15 to 19 years | 0 (0.0%) | 0.0 |
| 20 to 34 years | 125 (94.0%) | 170.0 |
| 35 to 50 years | 8 (6.0%) | 9.0 |
| Total | 133 (100.0%) | 70.0 |
Fertility by Age by Marriage Status in Keokuk County
90.2% of women with births (133) in Keokuk County are married. The highest percentage of unmarried women with births falls into 35 to 50 years age bracket with 100.0% of them unmarried at the time of birth, while the lowest percentage of unmarried women with births belong to 20 to 34 years age bracket with 4.0% of them unmarried.
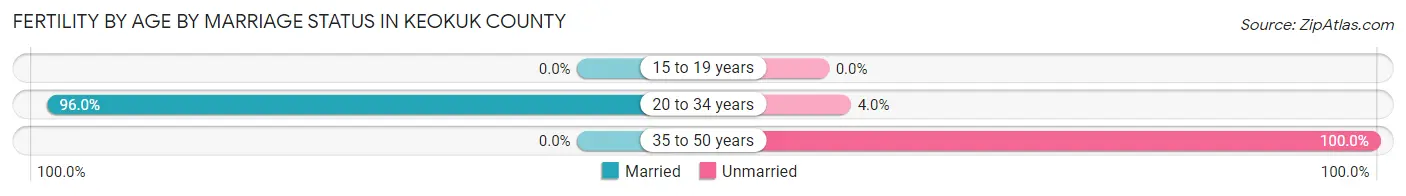
| Age Bracket | Married | Unmarried |
| 15 to 19 years | 0 (0.0%) | 0 (0.0%) |
| 20 to 34 years | 120 (96.0%) | 5 (4.0%) |
| 35 to 50 years | 0 (0.0%) | 8 (100.0%) |
| Total | 120 (90.2%) | 13 (9.8%) |
Fertility by Education in Keokuk County
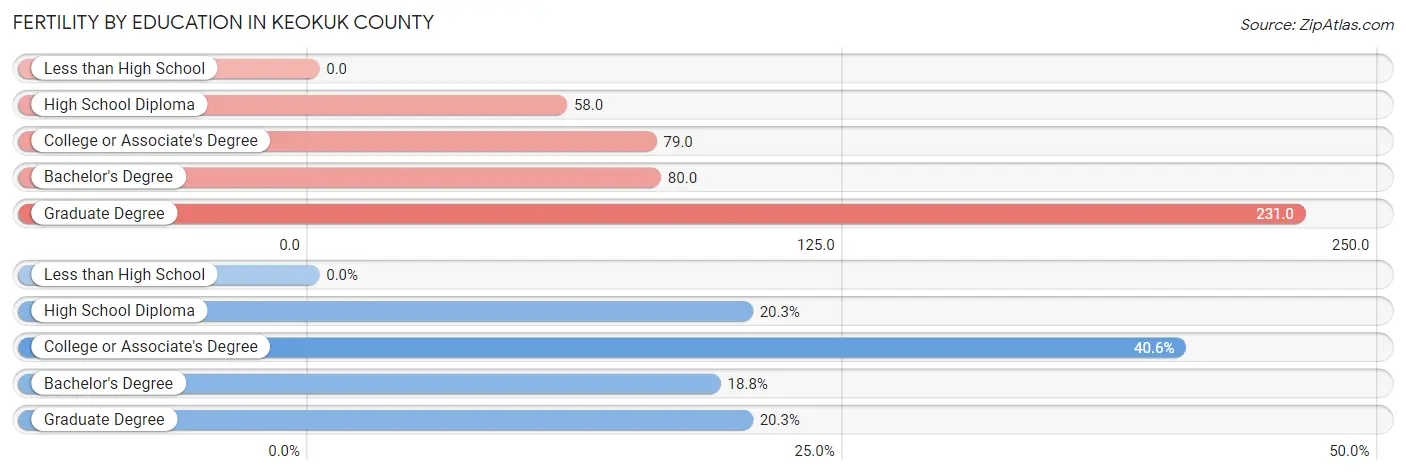
| Educational Attainment | Women with Births | Births / 1,000 Women |
| Less than High School | 0 (0.0%) | 0.0 |
| High School Diploma | 27 (20.3%) | 58.0 |
| College or Associate's Degree | 54 (40.6%) | 79.0 |
| Bachelor's Degree | 25 (18.8%) | 80.0 |
| Graduate Degree | 27 (20.3%) | 231.0 |
| Total | 133 (100.0%) | 70.0 |
Fertility by Education by Marriage Status in Keokuk County
9.8% of women with births in Keokuk County are unmarried. Women with the educational attainment of bachelor's degree are most likely to be married with 100.0% of them married at childbirth, while women with the educational attainment of high school diploma are least likely to be married with 40.7% of them unmarried at childbirth.
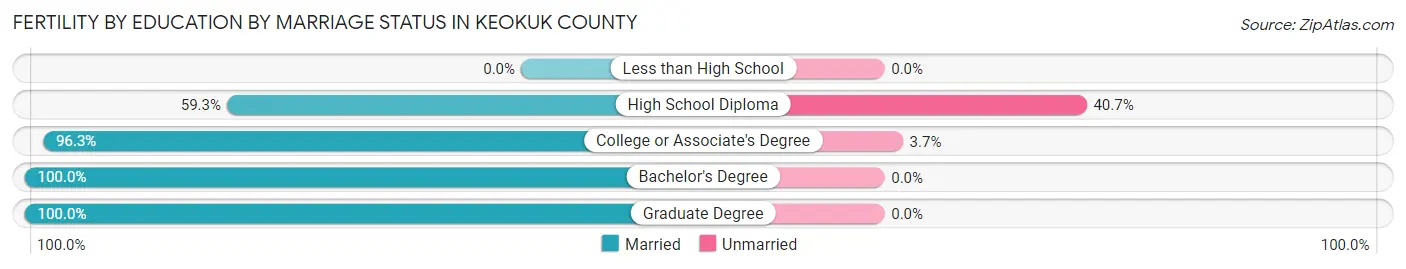
| Educational Attainment | Married | Unmarried |
| Less than High School | 0 (0.0%) | 0 (0.0%) |
| High School Diploma | 16 (59.3%) | 11 (40.7%) |
| College or Associate's Degree | 52 (96.3%) | 2 (3.7%) |
| Bachelor's Degree | 25 (100.0%) | 0 (0.0%) |
| Graduate Degree | 27 (100.0%) | 0 (0.0%) |
| Total | 120 (90.2%) | 13 (9.8%) |
Employment Characteristics in Keokuk County
Employment by Class of Employer in Keokuk County
Among the 4,501 employed individuals in Keokuk County, private company employees (2,903 | 64.5%), self-employed (not incorporated) (499 | 11.1%), and local government employees (341 | 7.6%) make up the most common classes of employment.
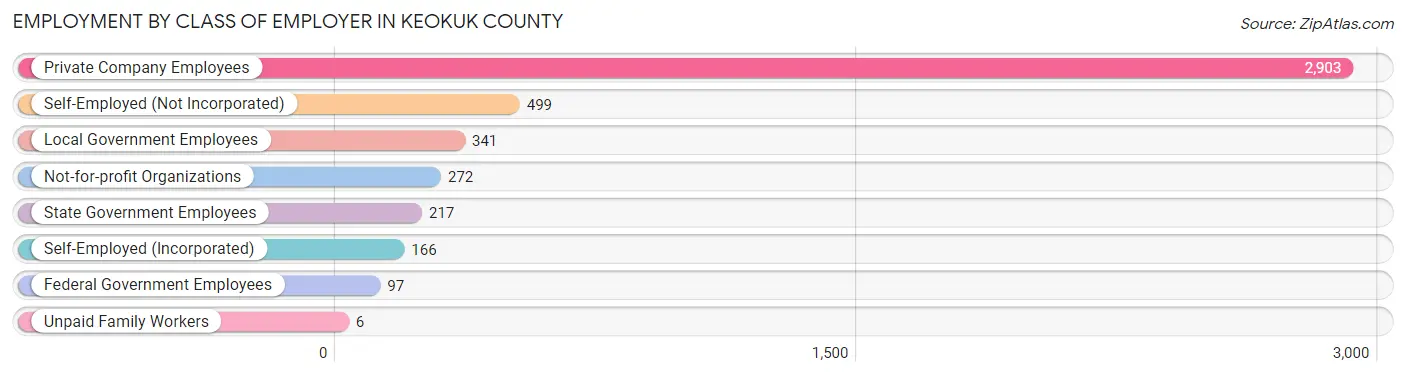
| Employer Class | # Employees | % Employees |
| Private Company Employees | 2,903 | 64.5% |
| Self-Employed (Incorporated) | 166 | 3.7% |
| Self-Employed (Not Incorporated) | 499 | 11.1% |
| Not-for-profit Organizations | 272 | 6.0% |
| Local Government Employees | 341 | 7.6% |
| State Government Employees | 217 | 4.8% |
| Federal Government Employees | 97 | 2.2% |
| Unpaid Family Workers | 6 | 0.1% |
| Total | 4,501 | 100.0% |
Employment Status by Age in Keokuk County
According to the labor force statistics for Keokuk County, out of the total population over 16 years of age (8,032), 59.8% or 4,803 individuals are in the labor force, with 3.6% or 173 of them unemployed. The age group with the highest labor force participation rate is 45 to 54 years, with 87.6% or 964 individuals in the labor force. Within the labor force, the 75 years and over age range has the highest percentage of unemployed individuals, with 22.9% or 11 of them being unemployed.
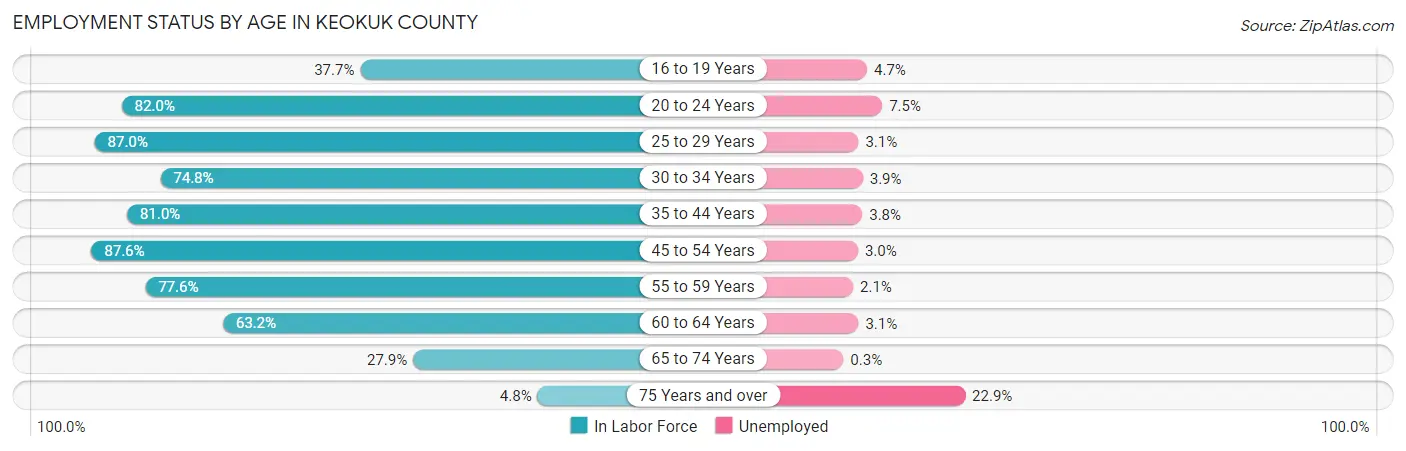
| Age Bracket | In Labor Force | Unemployed |
| 16 to 19 Years | 191 (37.7%) | 9 (4.7%) |
| 20 to 24 Years | 441 (82.0%) | 33 (7.5%) |
| 25 to 29 Years | 477 (87.0%) | 15 (3.1%) |
| 30 to 34 Years | 386 (74.8%) | 15 (3.9%) |
| 35 to 44 Years | 930 (81.0%) | 35 (3.8%) |
| 45 to 54 Years | 964 (87.6%) | 29 (3.0%) |
| 55 to 59 Years | 523 (77.6%) | 11 (2.1%) |
| 60 to 64 Years | 512 (63.2%) | 16 (3.1%) |
| 65 to 74 Years | 334 (27.9%) | 1 (0.3%) |
| 75 Years and over | 48 (4.8%) | 11 (22.9%) |
| Total | 4,803 (59.8%) | 173 (3.6%) |
Employment Status by Educational Attainment in Keokuk County
According to labor force statistics for Keokuk County, 79.1% of individuals (3,794) out of the total population between 25 and 64 years of age (4,796) are in the labor force, with 3.2% or 121 of them being unemployed. The group with the highest labor force participation rate are those with the educational attainment of bachelor's degree or higher, with 92.3% or 798 individuals in the labor force. Within the labor force, individuals with less than high school education have the highest percentage of unemployment, with 14.4% or 18 of them being unemployed.
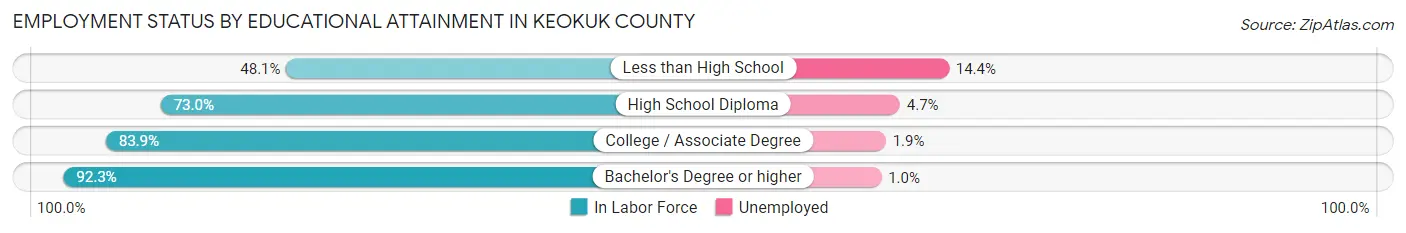
| Educational Attainment | In Labor Force | Unemployed |
| Less than High School | 125 (48.1%) | 37 (14.4%) |
| High School Diploma | 1,416 (73.0%) | 91 (4.7%) |
| College / Associate Degree | 1,452 (83.9%) | 33 (1.9%) |
| Bachelor's Degree or higher | 798 (92.3%) | 9 (1.0%) |
| Total | 3,794 (79.1%) | 153 (3.2%) |
Employment Occupations by Sex in Keokuk County
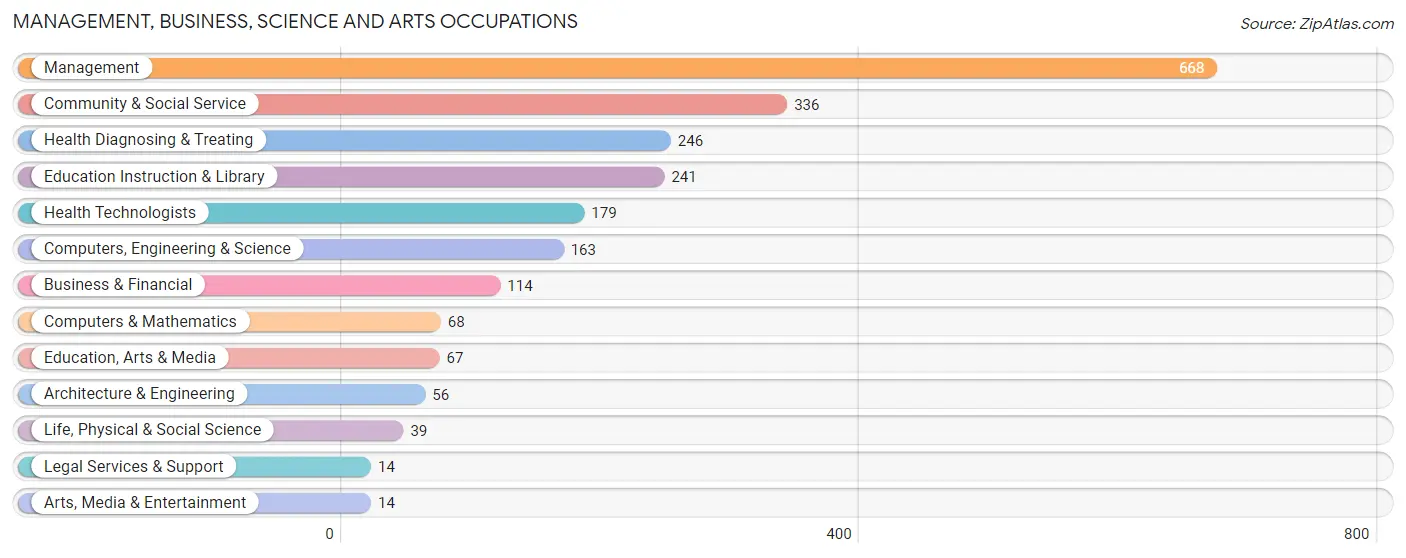
Management, Business, Science and Arts Occupations
The most common Management, Business, Science and Arts occupations in Keokuk County are Management (668 | 14.4%), Community & Social Service (336 | 7.3%), Health Diagnosing & Treating (246 | 5.3%), Education Instruction & Library (241 | 5.2%), and Health Technologists (179 | 3.9%).
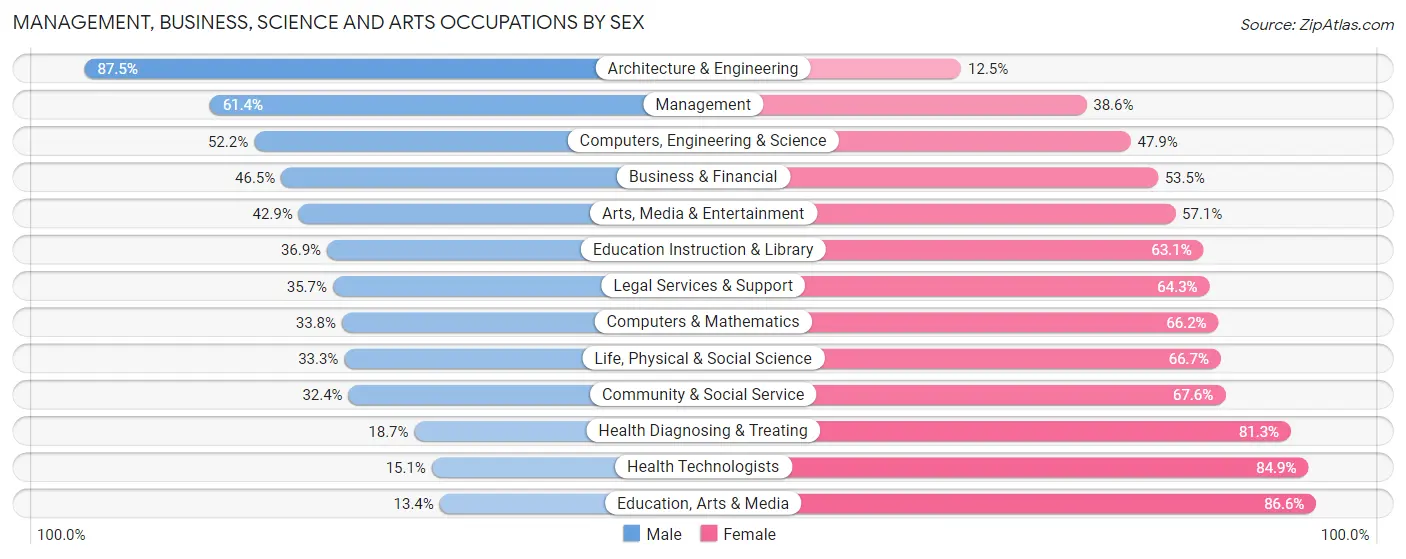
Management, Business, Science and Arts Occupations by Sex
Within the Management, Business, Science and Arts occupations in Keokuk County, the most male-oriented occupations are Architecture & Engineering (87.5%), Management (61.4%), and Computers, Engineering & Science (52.1%), while the most female-oriented occupations are Education, Arts & Media (86.6%), Health Technologists (84.9%), and Health Diagnosing & Treating (81.3%).
| Occupation | Male | Female |
| Management | 410 (61.4%) | 258 (38.6%) |
| Business & Financial | 53 (46.5%) | 61 (53.5%) |
| Computers, Engineering & Science | 85 (52.1%) | 78 (47.8%) |
| Computers & Mathematics | 23 (33.8%) | 45 (66.2%) |
| Architecture & Engineering | 49 (87.5%) | 7 (12.5%) |
| Life, Physical & Social Science | 13 (33.3%) | 26 (66.7%) |
| Community & Social Service | 109 (32.4%) | 227 (67.6%) |
| Education, Arts & Media | 9 (13.4%) | 58 (86.6%) |
| Legal Services & Support | 5 (35.7%) | 9 (64.3%) |
| Education Instruction & Library | 89 (36.9%) | 152 (63.1%) |
| Arts, Media & Entertainment | 6 (42.9%) | 8 (57.1%) |
| Health Diagnosing & Treating | 46 (18.7%) | 200 (81.3%) |
| Health Technologists | 27 (15.1%) | 152 (84.9%) |
| Total (Category) | 703 (46.0%) | 824 (54.0%) |
| Total (Overall) | 2,574 (55.6%) | 2,057 (44.4%) |
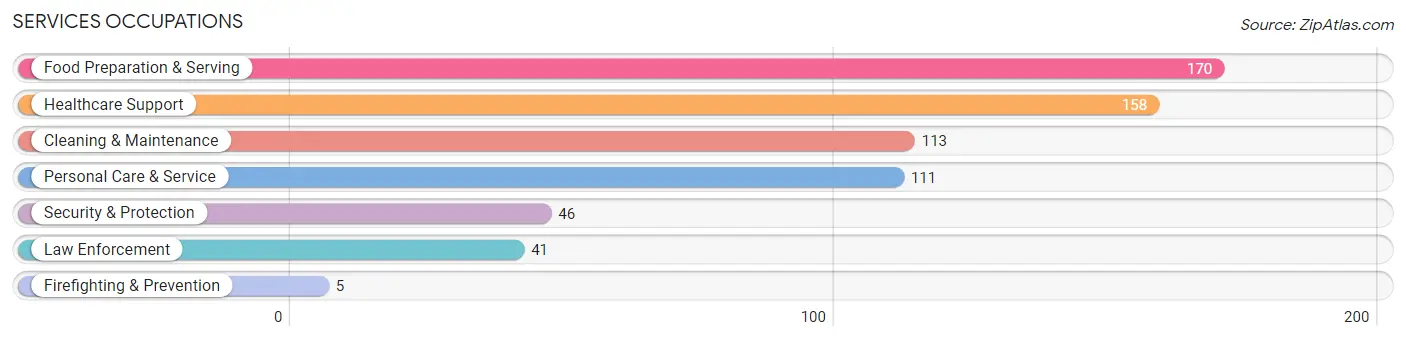
Services Occupations
The most common Services occupations in Keokuk County are Food Preparation & Serving (170 | 3.7%), Healthcare Support (158 | 3.4%), Cleaning & Maintenance (113 | 2.4%), Personal Care & Service (111 | 2.4%), and Security & Protection (46 | 1.0%).
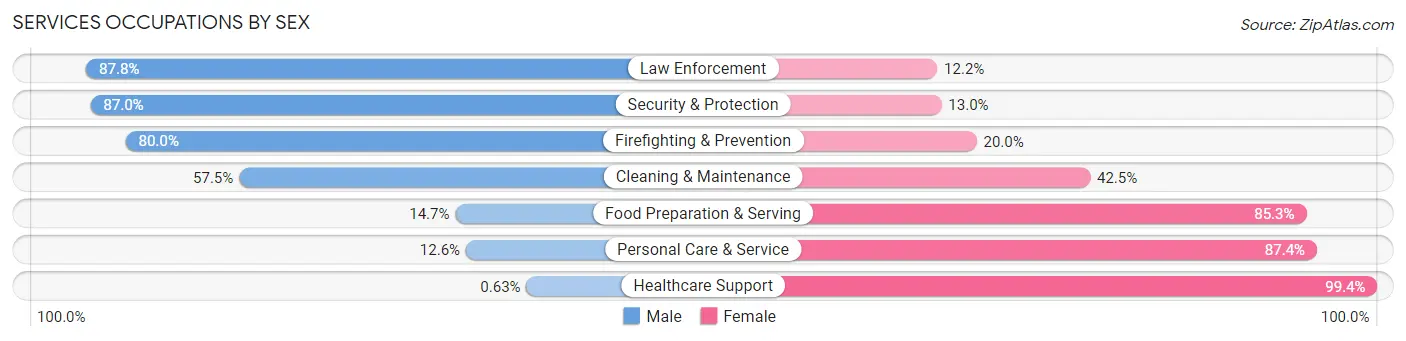
Services Occupations by Sex
Within the Services occupations in Keokuk County, the most male-oriented occupations are Law Enforcement (87.8%), Security & Protection (87.0%), and Firefighting & Prevention (80.0%), while the most female-oriented occupations are Healthcare Support (99.4%), Personal Care & Service (87.4%), and Food Preparation & Serving (85.3%).
| Occupation | Male | Female |
| Healthcare Support | 1 (0.6%) | 157 (99.4%) |
| Security & Protection | 40 (87.0%) | 6 (13.0%) |
| Firefighting & Prevention | 4 (80.0%) | 1 (20.0%) |
| Law Enforcement | 36 (87.8%) | 5 (12.2%) |
| Food Preparation & Serving | 25 (14.7%) | 145 (85.3%) |
| Cleaning & Maintenance | 65 (57.5%) | 48 (42.5%) |
| Personal Care & Service | 14 (12.6%) | 97 (87.4%) |
| Total (Category) | 145 (24.2%) | 453 (75.7%) |
| Total (Overall) | 2,574 (55.6%) | 2,057 (44.4%) |
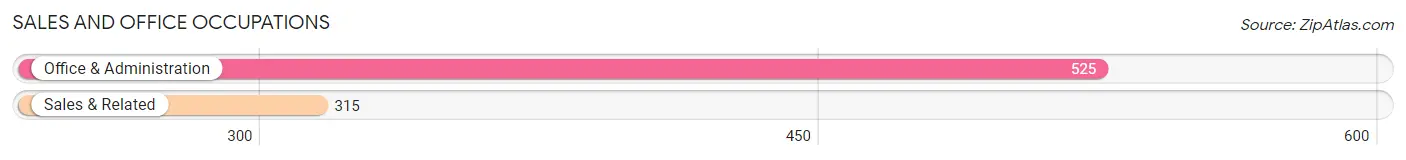
Sales and Office Occupations
The most common Sales and Office occupations in Keokuk County are Office & Administration (525 | 11.3%), and Sales & Related (315 | 6.8%).
Sales and Office Occupations by Sex
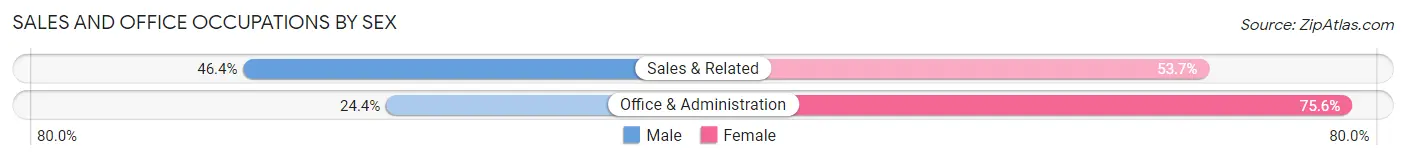
| Occupation | Male | Female |
| Sales & Related | 146 (46.4%) | 169 (53.6%) |
| Office & Administration | 128 (24.4%) | 397 (75.6%) |
| Total (Category) | 274 (32.6%) | 566 (67.4%) |
| Total (Overall) | 2,574 (55.6%) | 2,057 (44.4%) |
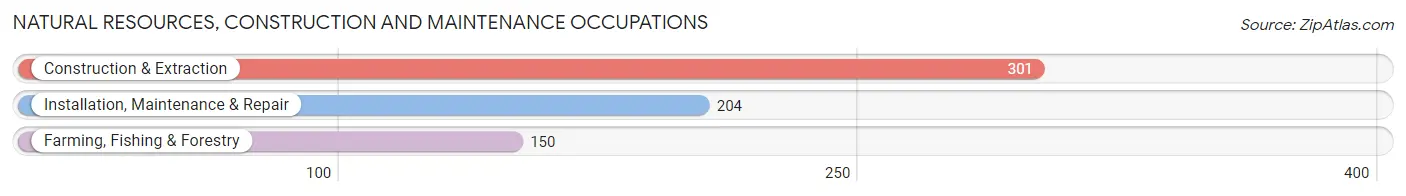
Natural Resources, Construction and Maintenance Occupations
The most common Natural Resources, Construction and Maintenance occupations in Keokuk County are Construction & Extraction (301 | 6.5%), Installation, Maintenance & Repair (204 | 4.4%), and Farming, Fishing & Forestry (150 | 3.2%).
Natural Resources, Construction and Maintenance Occupations by Sex
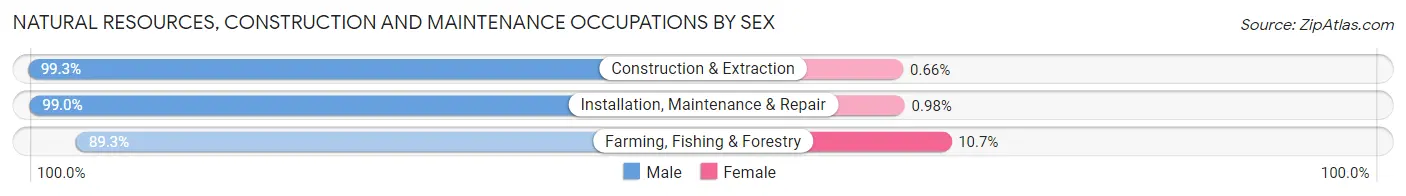
| Occupation | Male | Female |
| Farming, Fishing & Forestry | 134 (89.3%) | 16 (10.7%) |
| Construction & Extraction | 299 (99.3%) | 2 (0.7%) |
| Installation, Maintenance & Repair | 202 (99.0%) | 2 (1.0%) |
| Total (Category) | 635 (97.0%) | 20 (3.0%) |
| Total (Overall) | 2,574 (55.6%) | 2,057 (44.4%) |
Production, Transportation and Moving Occupations
The most common Production, Transportation and Moving occupations in Keokuk County are Production (458 | 9.9%), Transportation (291 | 6.3%), and Material Moving (262 | 5.7%).
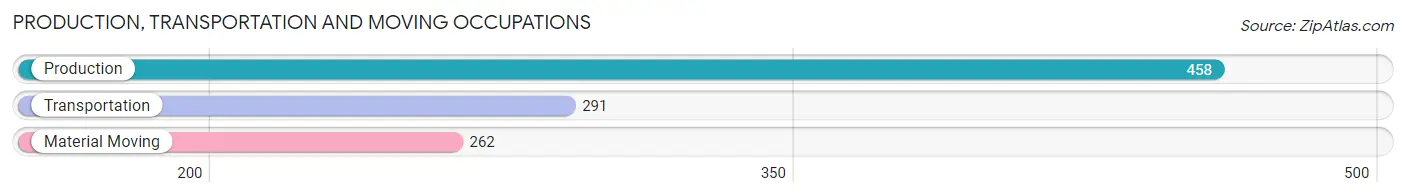
Production, Transportation and Moving Occupations by Sex
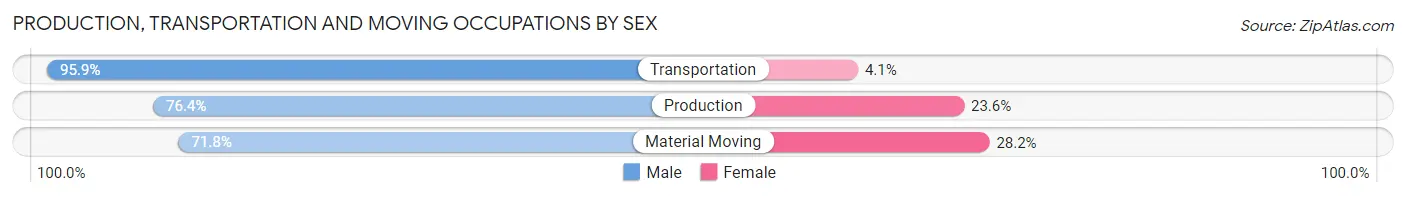
| Occupation | Male | Female |
| Production | 350 (76.4%) | 108 (23.6%) |
| Transportation | 279 (95.9%) | 12 (4.1%) |
| Material Moving | 188 (71.8%) | 74 (28.2%) |
| Total (Category) | 817 (80.8%) | 194 (19.2%) |
| Total (Overall) | 2,574 (55.6%) | 2,057 (44.4%) |
Employment Industries by Sex in Keokuk County
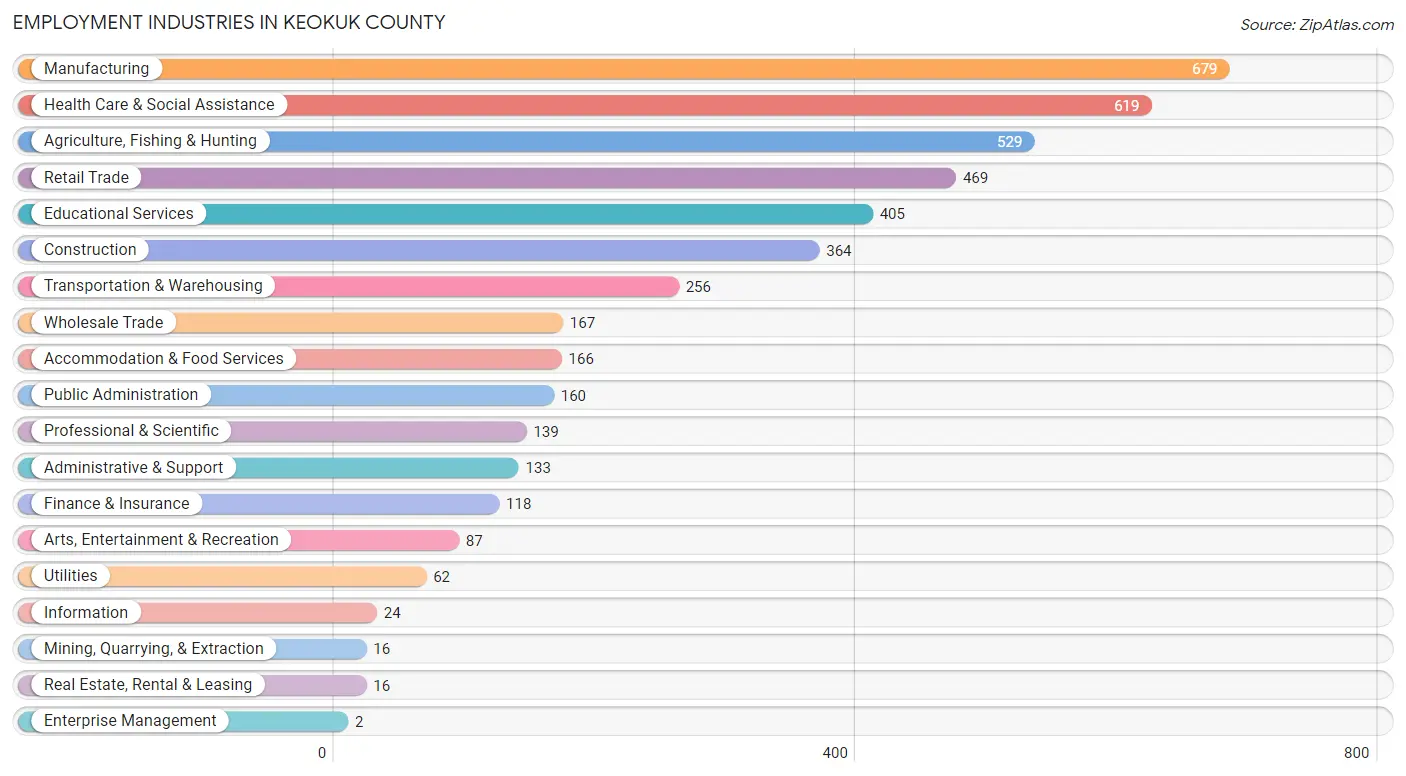
Employment Industries in Keokuk County
The major employment industries in Keokuk County include Manufacturing (679 | 14.7%), Health Care & Social Assistance (619 | 13.4%), Agriculture, Fishing & Hunting (529 | 11.4%), Retail Trade (469 | 10.1%), and Educational Services (405 | 8.7%).
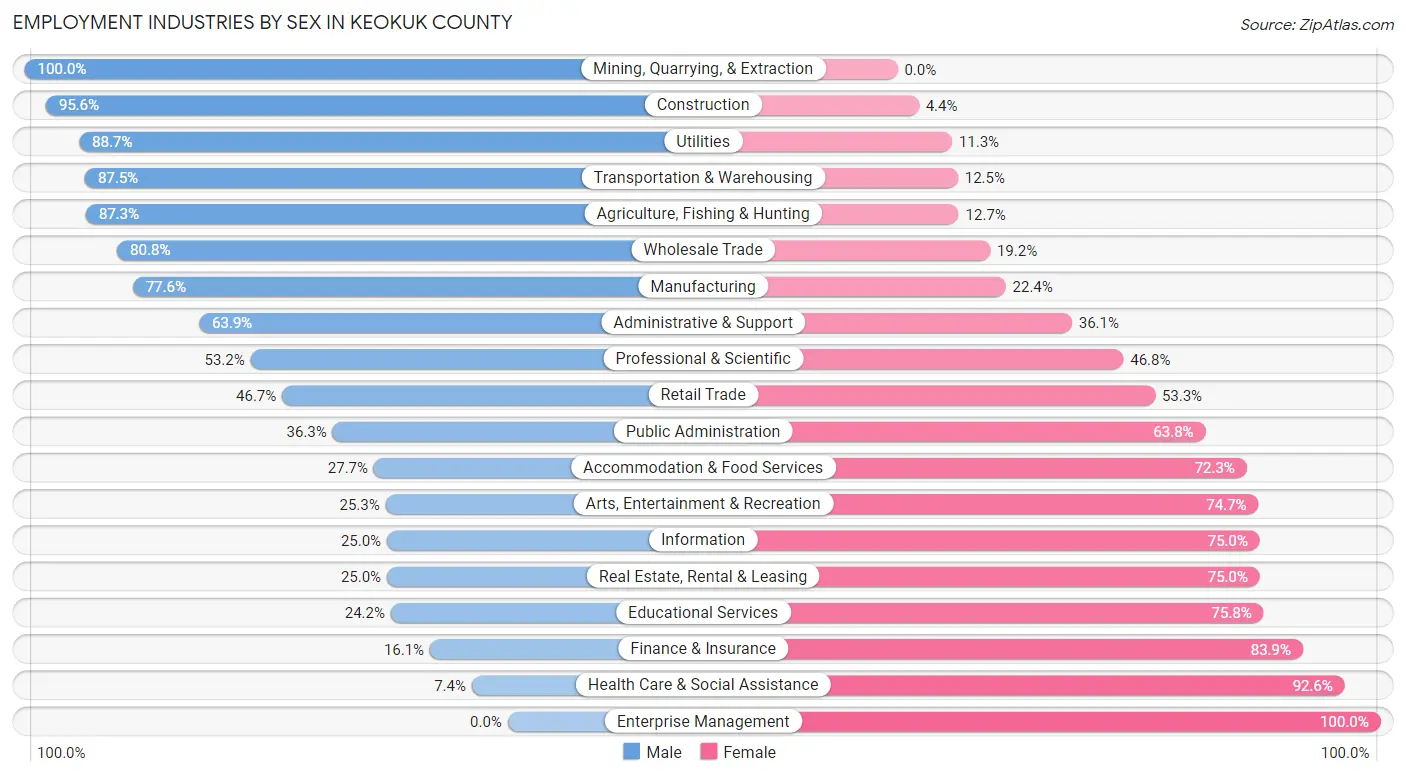
Employment Industries by Sex in Keokuk County
The Keokuk County industries that see more men than women are Mining, Quarrying, & Extraction (100.0%), Construction (95.6%), and Utilities (88.7%), whereas the industries that tend to have a higher number of women are Enterprise Management (100.0%), Health Care & Social Assistance (92.6%), and Finance & Insurance (83.9%).
| Industry | Male | Female |
| Agriculture, Fishing & Hunting | 462 (87.3%) | 67 (12.7%) |
| Mining, Quarrying, & Extraction | 16 (100.0%) | 0 (0.0%) |
| Construction | 348 (95.6%) | 16 (4.4%) |
| Manufacturing | 527 (77.6%) | 152 (22.4%) |
| Wholesale Trade | 135 (80.8%) | 32 (19.2%) |
| Retail Trade | 219 (46.7%) | 250 (53.3%) |
| Transportation & Warehousing | 224 (87.5%) | 32 (12.5%) |
| Utilities | 55 (88.7%) | 7 (11.3%) |
| Information | 6 (25.0%) | 18 (75.0%) |
| Finance & Insurance | 19 (16.1%) | 99 (83.9%) |
| Real Estate, Rental & Leasing | 4 (25.0%) | 12 (75.0%) |
| Professional & Scientific | 74 (53.2%) | 65 (46.8%) |
| Enterprise Management | 0 (0.0%) | 2 (100.0%) |
| Administrative & Support | 85 (63.9%) | 48 (36.1%) |
| Educational Services | 98 (24.2%) | 307 (75.8%) |
| Health Care & Social Assistance | 46 (7.4%) | 573 (92.6%) |
| Arts, Entertainment & Recreation | 22 (25.3%) | 65 (74.7%) |
| Accommodation & Food Services | 46 (27.7%) | 120 (72.3%) |
| Public Administration | 58 (36.2%) | 102 (63.7%) |
| Total | 2,574 (55.6%) | 2,057 (44.4%) |
Education in Keokuk County
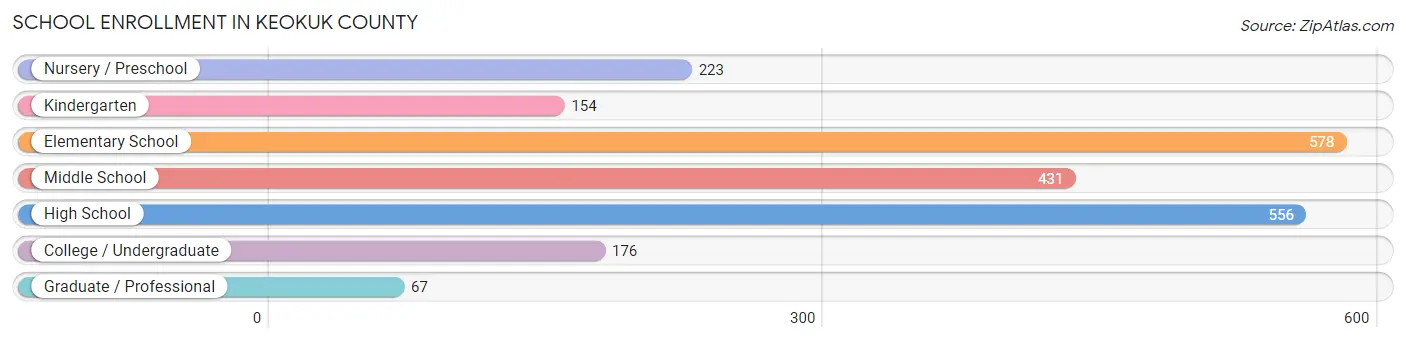
School Enrollment in Keokuk County
The most common levels of schooling among the 2,185 students in Keokuk County are elementary school (578 | 26.5%), high school (556 | 25.5%), and middle school (431 | 19.7%).
| School Level | # Students | % Students |
| Nursery / Preschool | 223 | 10.2% |
| Kindergarten | 154 | 7.0% |
| Elementary School | 578 | 26.5% |
| Middle School | 431 | 19.7% |
| High School | 556 | 25.5% |
| College / Undergraduate | 176 | 8.1% |
| Graduate / Professional | 67 | 3.1% |
| Total | 2,185 | 100.0% |
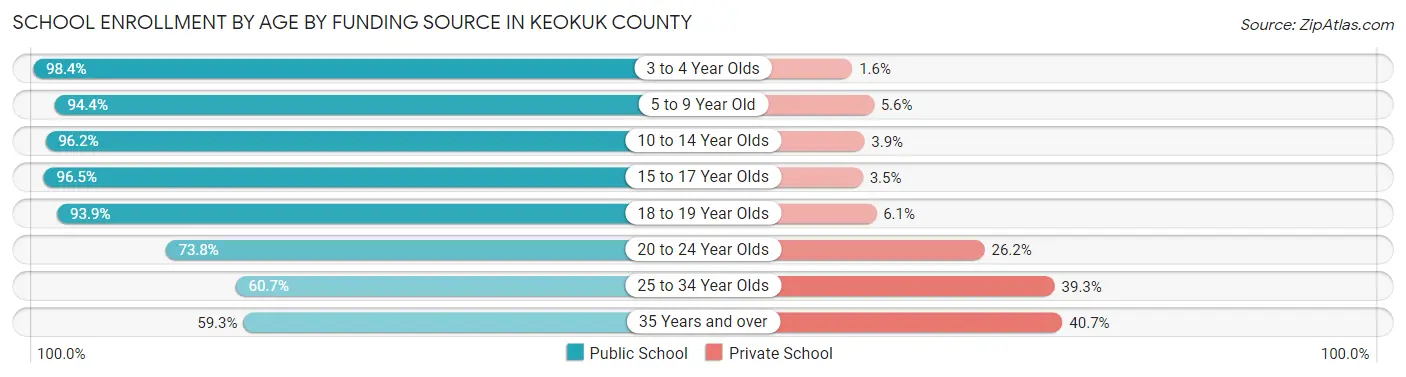
School Enrollment by Age by Funding Source in Keokuk County
Out of a total of 2,185 students who are enrolled in schools in Keokuk County, 153 (7.0%) attend a private institution, while the remaining 2,032 (93.0%) are enrolled in public schools. The age group of 35 years and over has the highest likelihood of being enrolled in private schools, with 22 (40.7% in the age bracket) enrolled. Conversely, the age group of 3 to 4 year olds has the lowest likelihood of being enrolled in a private school, with 186 (98.4% in the age bracket) attending a public institution.
| Age Bracket | Public School | Private School |
| 3 to 4 Year Olds | 186 (98.4%) | 3 (1.6%) |
| 5 to 9 Year Old | 641 (94.4%) | 38 (5.6%) |
| 10 to 14 Year Olds | 549 (96.2%) | 22 (3.8%) |
| 15 to 17 Year Olds | 409 (96.5%) | 15 (3.5%) |
| 18 to 19 Year Olds | 93 (93.9%) | 6 (6.1%) |
| 20 to 24 Year Olds | 104 (73.8%) | 37 (26.2%) |
| 25 to 34 Year Olds | 17 (60.7%) | 11 (39.3%) |
| 35 Years and over | 32 (59.3%) | 22 (40.7%) |
| Total | 2,032 (93.0%) | 153 (7.0%) |
Educational Attainment by Field of Study in Keokuk County
Education (290 | 23.2%), business (196 | 15.7%), science & technology (175 | 14.0%), bio, nature & agricultural (130 | 10.4%), and liberal arts & history (105 | 8.4%) are the most common fields of study among 1,249 individuals in Keokuk County who have obtained a bachelor's degree or higher.
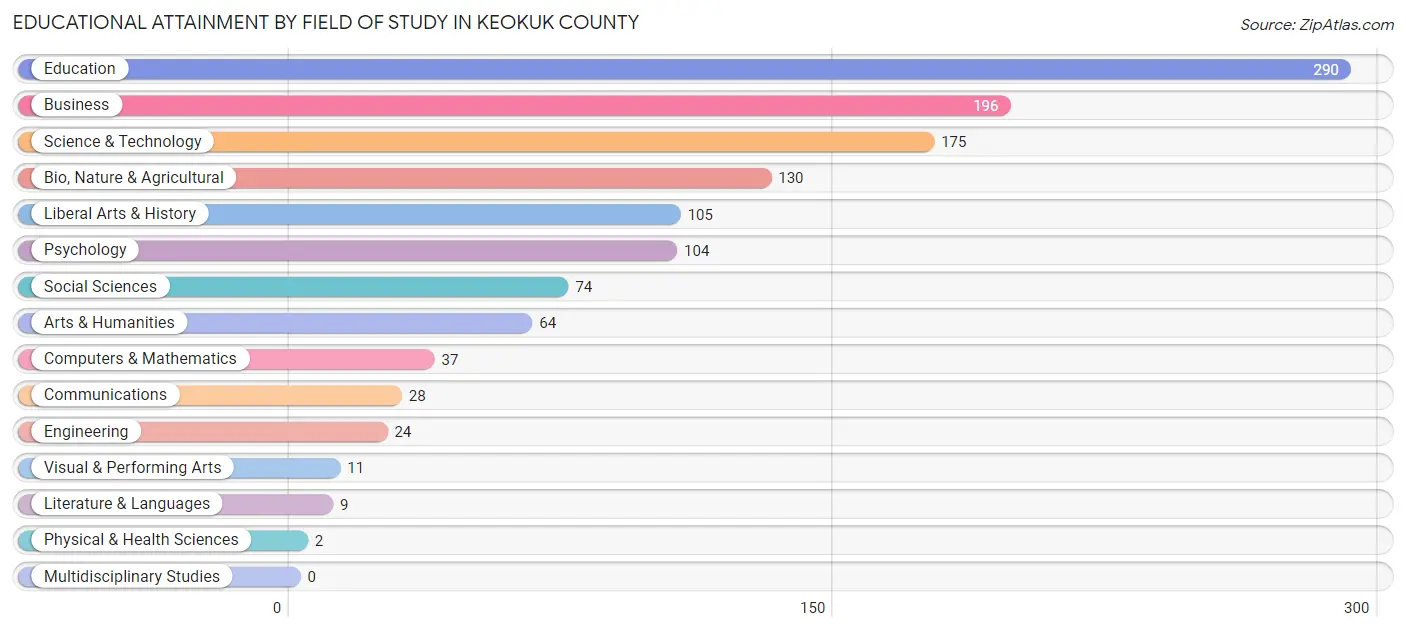
| Field of Study | # Graduates | % Graduates |
| Computers & Mathematics | 37 | 3.0% |
| Bio, Nature & Agricultural | 130 | 10.4% |
| Physical & Health Sciences | 2 | 0.2% |
| Psychology | 104 | 8.3% |
| Social Sciences | 74 | 5.9% |
| Engineering | 24 | 1.9% |
| Multidisciplinary Studies | 0 | 0.0% |
| Science & Technology | 175 | 14.0% |
| Business | 196 | 15.7% |
| Education | 290 | 23.2% |
| Literature & Languages | 9 | 0.7% |
| Liberal Arts & History | 105 | 8.4% |
| Visual & Performing Arts | 11 | 0.9% |
| Communications | 28 | 2.2% |
| Arts & Humanities | 64 | 5.1% |
| Total | 1,249 | 100.0% |
Transportation & Commute in Keokuk County
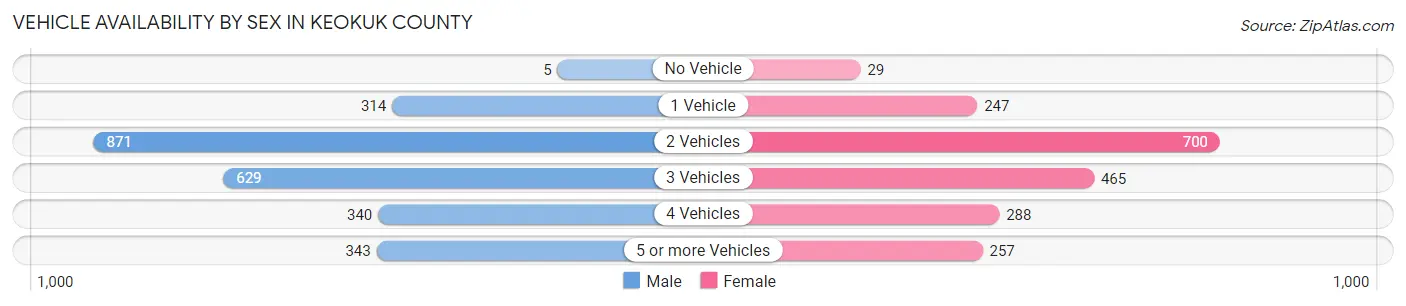
Vehicle Availability by Sex in Keokuk County
The most prevalent vehicle ownership categories in Keokuk County are males with 2 vehicles (871, accounting for 34.8%) and females with 2 vehicles (700, making up 43.9%).
| Vehicles Available | Male | Female |
| No Vehicle | 5 (0.2%) | 29 (1.5%) |
| 1 Vehicle | 314 (12.6%) | 247 (12.4%) |
| 2 Vehicles | 871 (34.8%) | 700 (35.2%) |
| 3 Vehicles | 629 (25.1%) | 465 (23.4%) |
| 4 Vehicles | 340 (13.6%) | 288 (14.5%) |
| 5 or more Vehicles | 343 (13.7%) | 257 (12.9%) |
| Total | 2,502 (100.0%) | 1,986 (100.0%) |
Commute Time in Keokuk County
The most frequently occuring commute durations in Keokuk County are 5 to 9 minutes (648 commuters, 15.4%), 45 to 59 minutes (469 commuters, 11.2%), and 15 to 19 minutes (460 commuters, 10.9%).
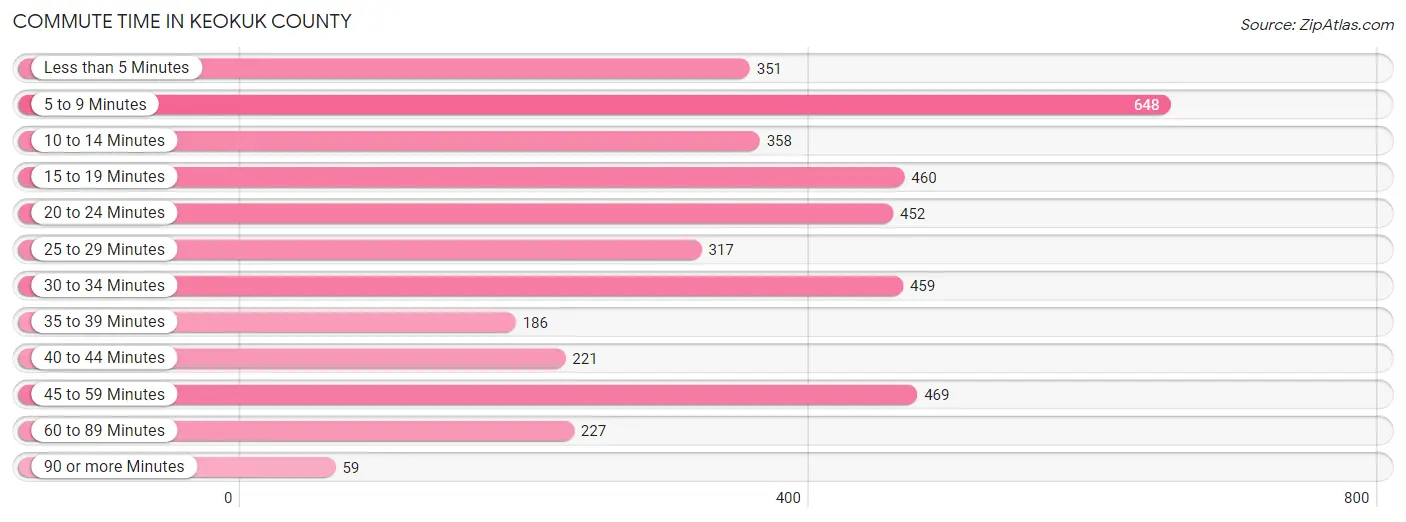
| Commute Time | # Commuters | % Commuters |
| Less than 5 Minutes | 351 | 8.3% |
| 5 to 9 Minutes | 648 | 15.4% |
| 10 to 14 Minutes | 358 | 8.5% |
| 15 to 19 Minutes | 460 | 10.9% |
| 20 to 24 Minutes | 452 | 10.7% |
| 25 to 29 Minutes | 317 | 7.5% |
| 30 to 34 Minutes | 459 | 10.9% |
| 35 to 39 Minutes | 186 | 4.4% |
| 40 to 44 Minutes | 221 | 5.2% |
| 45 to 59 Minutes | 469 | 11.2% |
| 60 to 89 Minutes | 227 | 5.4% |
| 90 or more Minutes | 59 | 1.4% |
Commute Time by Sex in Keokuk County
The most common commute times in Keokuk County are 5 to 9 minutes (304 commuters, 12.8%) for males and 5 to 9 minutes (344 commuters, 18.8%) for females.
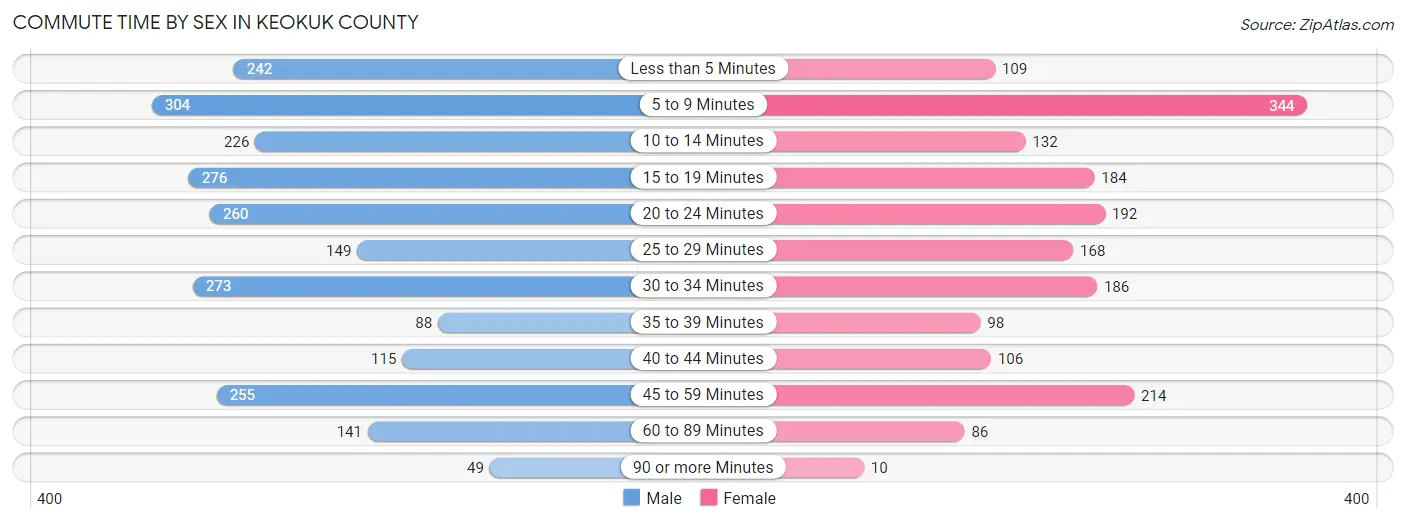
| Commute Time | Male | Female |
| Less than 5 Minutes | 242 (10.2%) | 109 (6.0%) |
| 5 to 9 Minutes | 304 (12.8%) | 344 (18.8%) |
| 10 to 14 Minutes | 226 (9.5%) | 132 (7.2%) |
| 15 to 19 Minutes | 276 (11.6%) | 184 (10.1%) |
| 20 to 24 Minutes | 260 (10.9%) | 192 (10.5%) |
| 25 to 29 Minutes | 149 (6.3%) | 168 (9.2%) |
| 30 to 34 Minutes | 273 (11.5%) | 186 (10.2%) |
| 35 to 39 Minutes | 88 (3.7%) | 98 (5.4%) |
| 40 to 44 Minutes | 115 (4.8%) | 106 (5.8%) |
| 45 to 59 Minutes | 255 (10.7%) | 214 (11.7%) |
| 60 to 89 Minutes | 141 (5.9%) | 86 (4.7%) |
| 90 or more Minutes | 49 (2.1%) | 10 (0.5%) |
Time of Departure to Work by Sex in Keokuk County
The most frequent times of departure to work in Keokuk County are 7:00 AM to 7:29 AM (354, 14.9%) for males and 7:30 AM to 7:59 AM (337, 18.4%) for females.
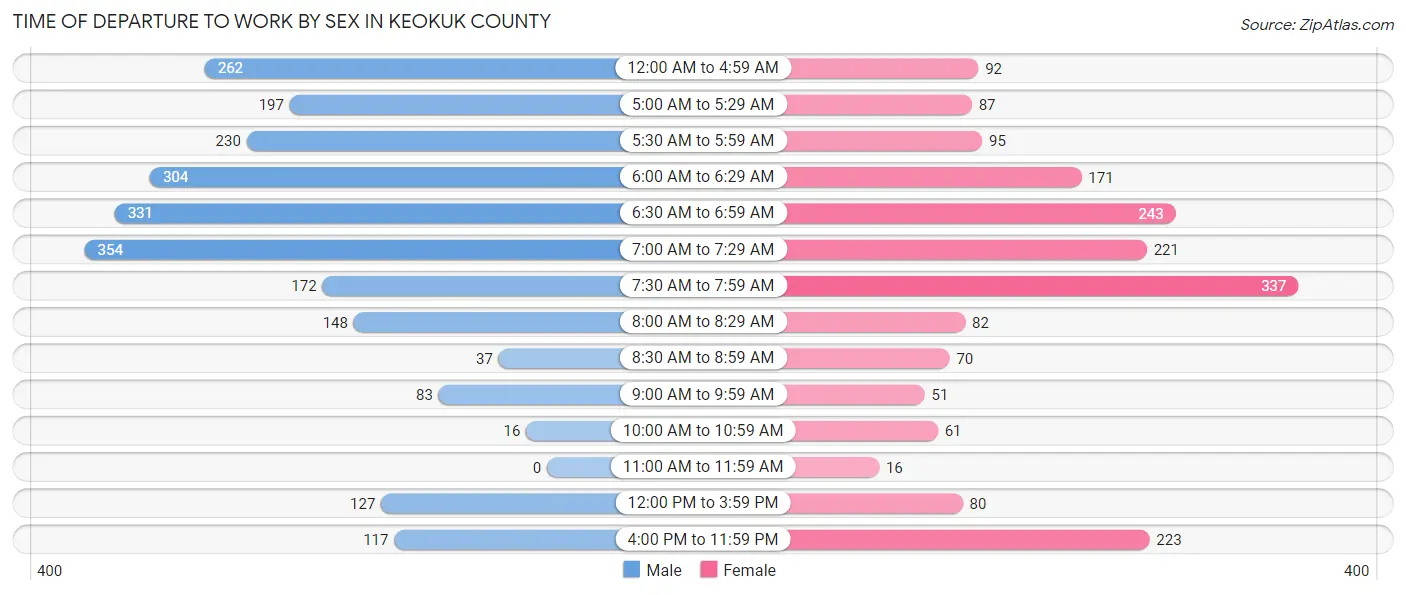
| Time of Departure | Male | Female |
| 12:00 AM to 4:59 AM | 262 (11.0%) | 92 (5.0%) |
| 5:00 AM to 5:29 AM | 197 (8.3%) | 87 (4.8%) |
| 5:30 AM to 5:59 AM | 230 (9.7%) | 95 (5.2%) |
| 6:00 AM to 6:29 AM | 304 (12.8%) | 171 (9.3%) |
| 6:30 AM to 6:59 AM | 331 (13.9%) | 243 (13.3%) |
| 7:00 AM to 7:29 AM | 354 (14.9%) | 221 (12.1%) |
| 7:30 AM to 7:59 AM | 172 (7.2%) | 337 (18.4%) |
| 8:00 AM to 8:29 AM | 148 (6.2%) | 82 (4.5%) |
| 8:30 AM to 8:59 AM | 37 (1.6%) | 70 (3.8%) |
| 9:00 AM to 9:59 AM | 83 (3.5%) | 51 (2.8%) |
| 10:00 AM to 10:59 AM | 16 (0.7%) | 61 (3.3%) |
| 11:00 AM to 11:59 AM | 0 (0.0%) | 16 (0.9%) |
| 12:00 PM to 3:59 PM | 127 (5.3%) | 80 (4.4%) |
| 4:00 PM to 11:59 PM | 117 (4.9%) | 223 (12.2%) |
| Total | 2,378 (100.0%) | 1,829 (100.0%) |
Housing Occupancy in Keokuk County
Occupancy by Ownership in Keokuk County
Of the total 4,085 dwellings in Keokuk County, owner-occupied units account for 3,206 (78.5%), while renter-occupied units make up 879 (21.5%).
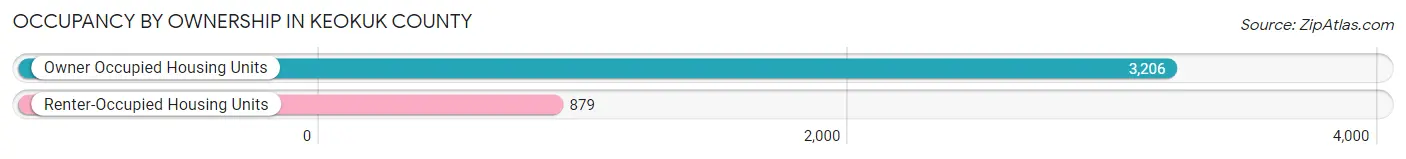
| Occupancy | # Housing Units | % Housing Units |
| Owner Occupied Housing Units | 3,206 | 78.5% |
| Renter-Occupied Housing Units | 879 | 21.5% |
| Total Occupied Housing Units | 4,085 | 100.0% |
Occupancy by Household Size in Keokuk County
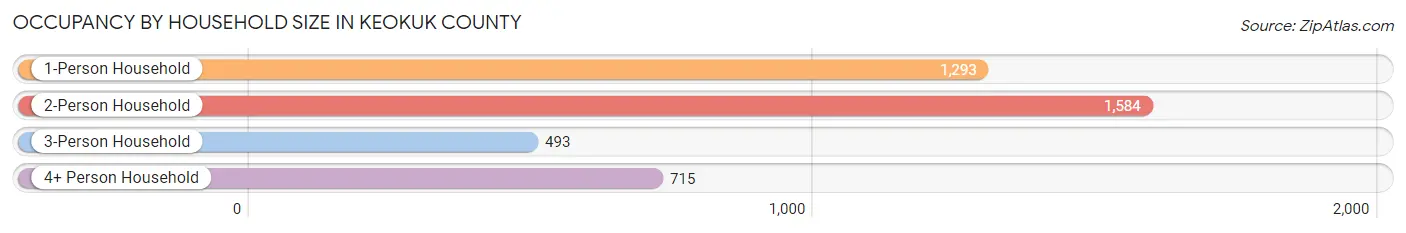
| Household Size | # Housing Units | % Housing Units |
| 1-Person Household | 1,293 | 31.7% |
| 2-Person Household | 1,584 | 38.8% |
| 3-Person Household | 493 | 12.1% |
| 4+ Person Household | 715 | 17.5% |
| Total Housing Units | 4,085 | 100.0% |
Occupancy by Ownership by Household Size in Keokuk County
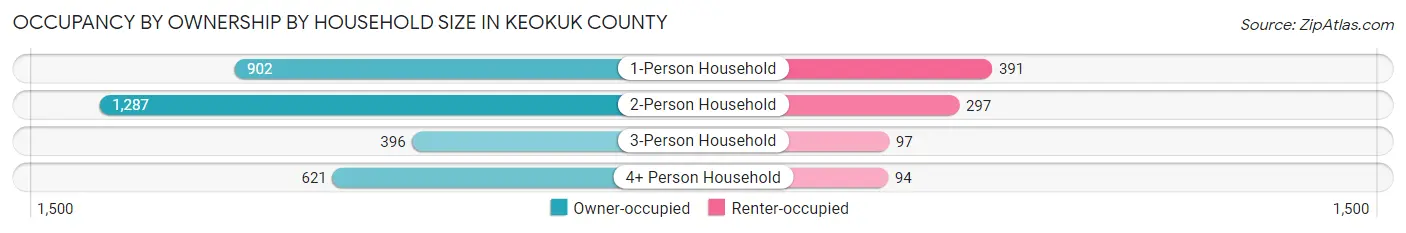
| Household Size | Owner-occupied | Renter-occupied |
| 1-Person Household | 902 (69.8%) | 391 (30.2%) |
| 2-Person Household | 1,287 (81.2%) | 297 (18.8%) |
| 3-Person Household | 396 (80.3%) | 97 (19.7%) |
| 4+ Person Household | 621 (86.9%) | 94 (13.2%) |
| Total Housing Units | 3,206 (78.5%) | 879 (21.5%) |
Occupancy by Educational Attainment in Keokuk County
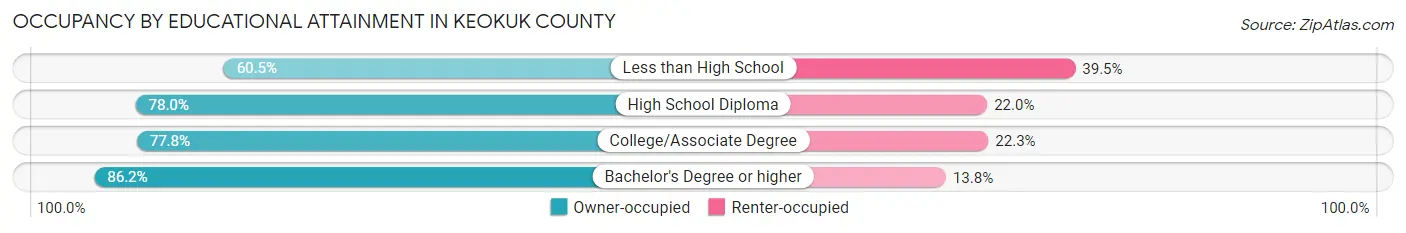
| Household Size | Owner-occupied | Renter-occupied |
| Less than High School | 118 (60.5%) | 77 (39.5%) |
| High School Diploma | 1,356 (78.0%) | 383 (22.0%) |
| College/Associate Degree | 1,122 (77.7%) | 321 (22.3%) |
| Bachelor's Degree or higher | 610 (86.2%) | 98 (13.8%) |
Occupancy by Age of Householder in Keokuk County
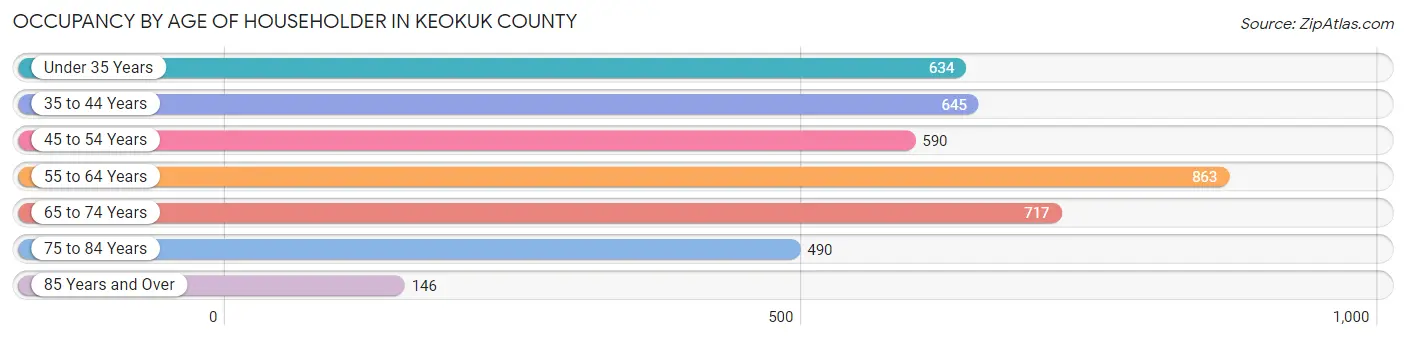
| Age Bracket | # Households | % Households |
| Under 35 Years | 634 | 15.5% |
| 35 to 44 Years | 645 | 15.8% |
| 45 to 54 Years | 590 | 14.4% |
| 55 to 64 Years | 863 | 21.1% |
| 65 to 74 Years | 717 | 17.5% |
| 75 to 84 Years | 490 | 12.0% |
| 85 Years and Over | 146 | 3.6% |
| Total | 4,085 | 100.0% |
Housing Finances in Keokuk County
Median Income by Occupancy in Keokuk County
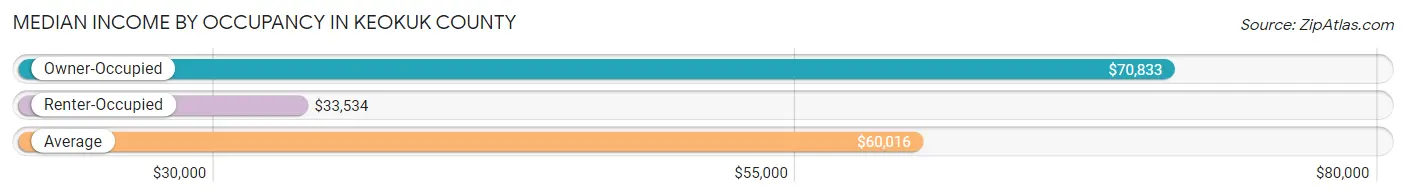
| Occupancy Type | # Households | Median Income |
| Owner-Occupied | 3,206 (78.5%) | $70,833 |
| Renter-Occupied | 879 (21.5%) | $33,534 |
| Average | 4,085 (100.0%) | $60,016 |
Occupancy by Householder Income Bracket in Keokuk County
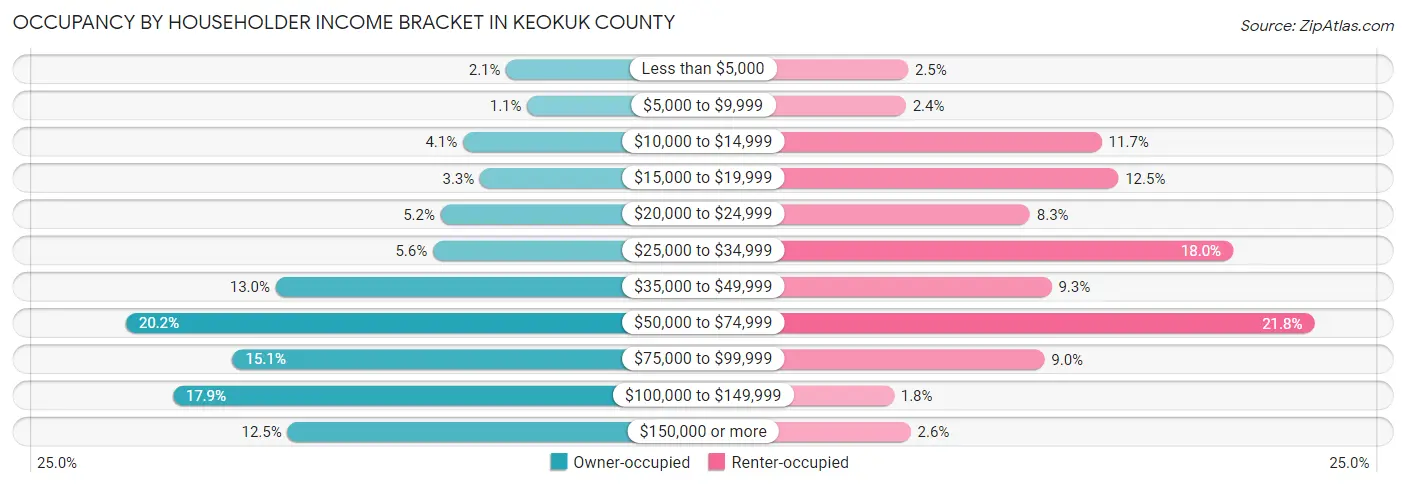
| Income Bracket | Owner-occupied | Renter-occupied |
| Less than $5,000 | 66 (2.1%) | 22 (2.5%) |
| $5,000 to $9,999 | 34 (1.1%) | 21 (2.4%) |
| $10,000 to $14,999 | 132 (4.1%) | 103 (11.7%) |
| $15,000 to $19,999 | 106 (3.3%) | 110 (12.5%) |
| $20,000 to $24,999 | 166 (5.2%) | 73 (8.3%) |
| $25,000 to $34,999 | 178 (5.6%) | 158 (18.0%) |
| $35,000 to $49,999 | 418 (13.0%) | 82 (9.3%) |
| $50,000 to $74,999 | 647 (20.2%) | 192 (21.8%) |
| $75,000 to $99,999 | 484 (15.1%) | 79 (9.0%) |
| $100,000 to $149,999 | 575 (17.9%) | 16 (1.8%) |
| $150,000 or more | 400 (12.5%) | 23 (2.6%) |
| Total | 3,206 (100.0%) | 879 (100.0%) |
Monthly Housing Cost Tiers in Keokuk County
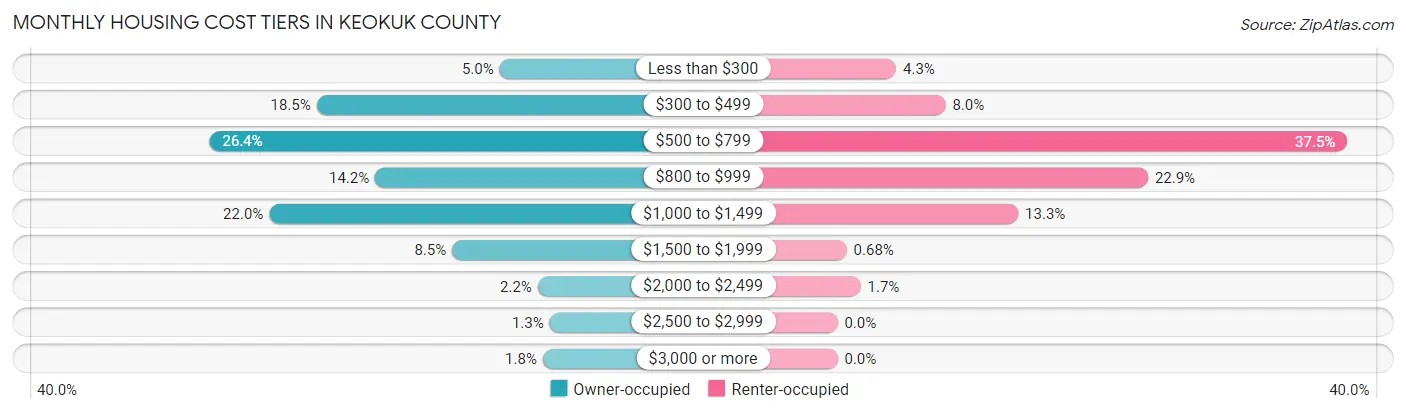
| Monthly Cost | Owner-occupied | Renter-occupied |
| Less than $300 | 161 (5.0%) | 38 (4.3%) |
| $300 to $499 | 593 (18.5%) | 70 (8.0%) |
| $500 to $799 | 846 (26.4%) | 330 (37.5%) |
| $800 to $999 | 455 (14.2%) | 201 (22.9%) |
| $1,000 to $1,499 | 705 (22.0%) | 117 (13.3%) |
| $1,500 to $1,999 | 273 (8.5%) | 6 (0.7%) |
| $2,000 to $2,499 | 71 (2.2%) | 15 (1.7%) |
| $2,500 to $2,999 | 43 (1.3%) | 0 (0.0%) |
| $3,000 or more | 59 (1.8%) | 0 (0.0%) |
| Total | 3,206 (100.0%) | 879 (100.0%) |
Physical Housing Characteristics in Keokuk County
Housing Structures in Keokuk County
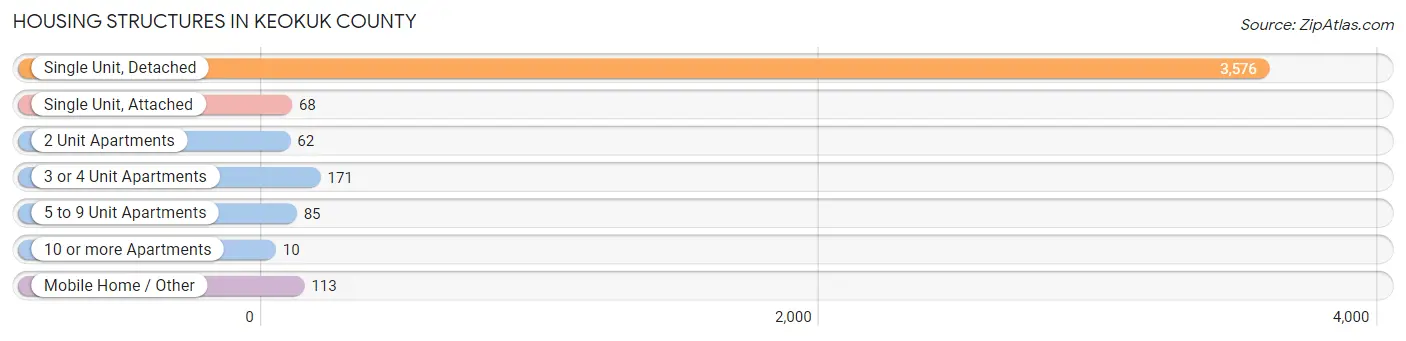
| Structure Type | # Housing Units | % Housing Units |
| Single Unit, Detached | 3,576 | 87.5% |
| Single Unit, Attached | 68 | 1.7% |
| 2 Unit Apartments | 62 | 1.5% |
| 3 or 4 Unit Apartments | 171 | 4.2% |
| 5 to 9 Unit Apartments | 85 | 2.1% |
| 10 or more Apartments | 10 | 0.2% |
| Mobile Home / Other | 113 | 2.8% |
| Total | 4,085 | 100.0% |
Housing Structures by Occupancy in Keokuk County
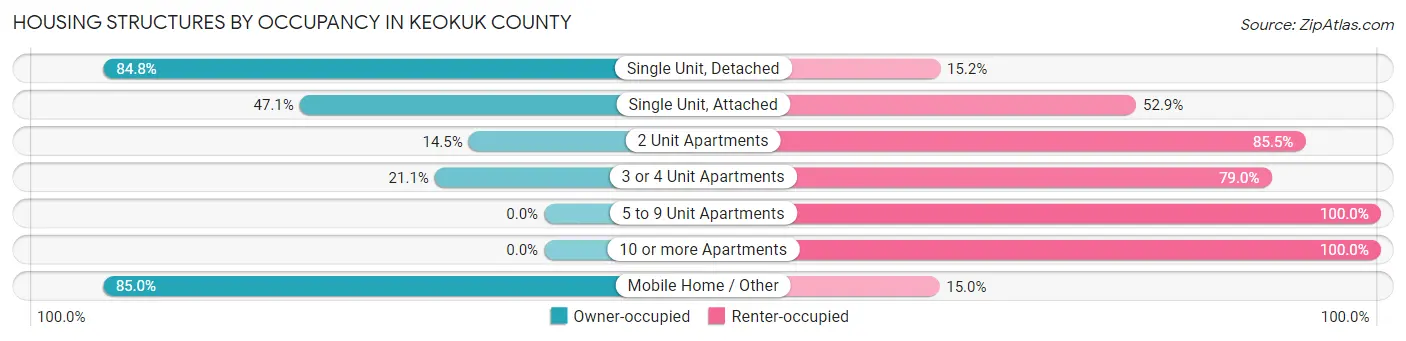
| Structure Type | Owner-occupied | Renter-occupied |
| Single Unit, Detached | 3,033 (84.8%) | 543 (15.2%) |
| Single Unit, Attached | 32 (47.1%) | 36 (52.9%) |
| 2 Unit Apartments | 9 (14.5%) | 53 (85.5%) |
| 3 or 4 Unit Apartments | 36 (21.0%) | 135 (78.9%) |
| 5 to 9 Unit Apartments | 0 (0.0%) | 85 (100.0%) |
| 10 or more Apartments | 0 (0.0%) | 10 (100.0%) |
| Mobile Home / Other | 96 (85.0%) | 17 (15.0%) |
| Total | 3,206 (78.5%) | 879 (21.5%) |
Housing Structures by Number of Rooms in Keokuk County
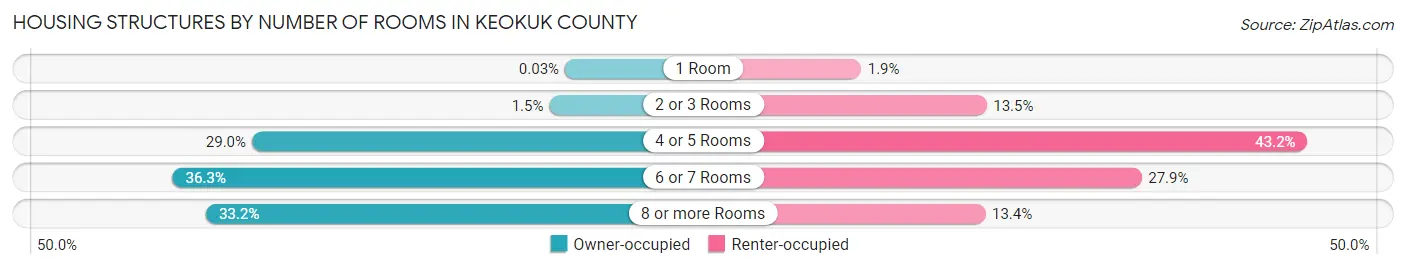
| Number of Rooms | Owner-occupied | Renter-occupied |
| 1 Room | 1 (0.0%) | 17 (1.9%) |
| 2 or 3 Rooms | 47 (1.5%) | 119 (13.5%) |
| 4 or 5 Rooms | 929 (29.0%) | 380 (43.2%) |
| 6 or 7 Rooms | 1,164 (36.3%) | 245 (27.9%) |
| 8 or more Rooms | 1,065 (33.2%) | 118 (13.4%) |
| Total | 3,206 (100.0%) | 879 (100.0%) |
Housing Structure by Heating Type in Keokuk County
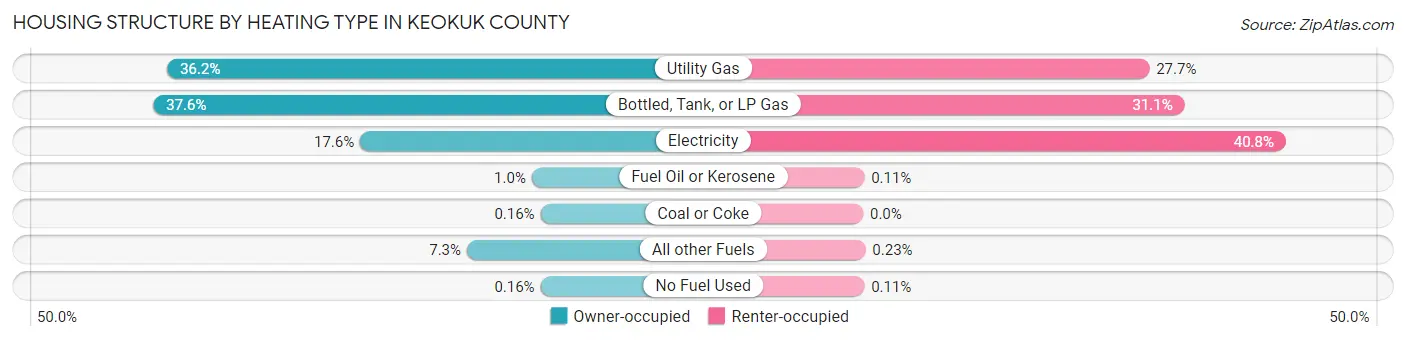
| Heating Type | Owner-occupied | Renter-occupied |
| Utility Gas | 1,162 (36.2%) | 243 (27.7%) |
| Bottled, Tank, or LP Gas | 1,205 (37.6%) | 273 (31.1%) |
| Electricity | 564 (17.6%) | 359 (40.8%) |
| Fuel Oil or Kerosene | 32 (1.0%) | 1 (0.1%) |
| Coal or Coke | 5 (0.2%) | 0 (0.0%) |
| All other Fuels | 233 (7.3%) | 2 (0.2%) |
| No Fuel Used | 5 (0.2%) | 1 (0.1%) |
| Total | 3,206 (100.0%) | 879 (100.0%) |
Household Vehicle Usage in Keokuk County
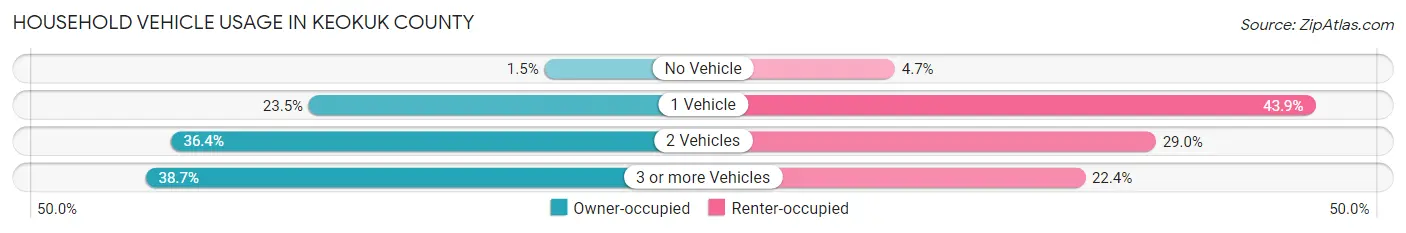
| Vehicles per Household | Owner-occupied | Renter-occupied |
| No Vehicle | 47 (1.5%) | 41 (4.7%) |
| 1 Vehicle | 752 (23.5%) | 386 (43.9%) |
| 2 Vehicles | 1,166 (36.4%) | 255 (29.0%) |
| 3 or more Vehicles | 1,241 (38.7%) | 197 (22.4%) |
| Total | 3,206 (100.0%) | 879 (100.0%) |
Real Estate & Mortgages in Keokuk County
Real Estate and Mortgage Overview in Keokuk County
| Characteristic | Without Mortgage | With Mortgage |
| Housing Units | 1,551 | 1,655 |
| Median Property Value | $101,800 | $109,200 |
| Median Household Income | $54,273 | $232 |
| Monthly Housing Costs | $513 | $59 |
| Real Estate Taxes | $1,339 | $21 |
Property Value by Mortgage Status in Keokuk County
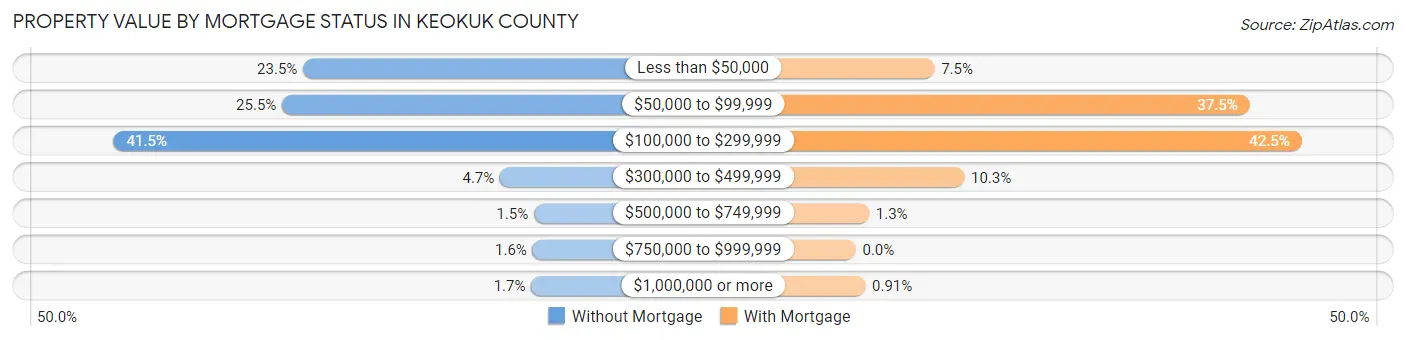
| Property Value | Without Mortgage | With Mortgage |
| Less than $50,000 | 364 (23.5%) | 124 (7.5%) |
| $50,000 to $99,999 | 395 (25.5%) | 621 (37.5%) |
| $100,000 to $299,999 | 644 (41.5%) | 703 (42.5%) |
| $300,000 to $499,999 | 73 (4.7%) | 171 (10.3%) |
| $500,000 to $749,999 | 23 (1.5%) | 21 (1.3%) |
| $750,000 to $999,999 | 25 (1.6%) | 0 (0.0%) |
| $1,000,000 or more | 27 (1.7%) | 15 (0.9%) |
| Total | 1,551 (100.0%) | 1,655 (100.0%) |
Household Income by Mortgage Status in Keokuk County
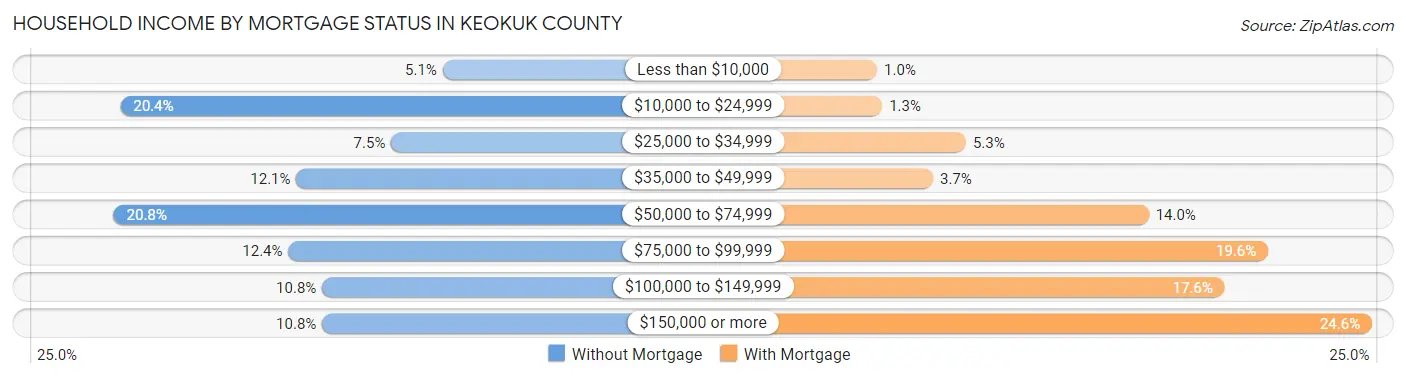
| Household Income | Without Mortgage | With Mortgage |
| Less than $10,000 | 79 (5.1%) | 17 (1.0%) |
| $10,000 to $24,999 | 317 (20.4%) | 21 (1.3%) |
| $25,000 to $34,999 | 117 (7.5%) | 87 (5.3%) |
| $35,000 to $49,999 | 187 (12.1%) | 61 (3.7%) |
| $50,000 to $74,999 | 322 (20.8%) | 231 (14.0%) |
| $75,000 to $99,999 | 193 (12.4%) | 325 (19.6%) |
| $100,000 to $149,999 | 168 (10.8%) | 291 (17.6%) |
| $150,000 or more | 168 (10.8%) | 407 (24.6%) |
| Total | 1,551 (100.0%) | 1,655 (100.0%) |
Property Value to Household Income Ratio in Keokuk County
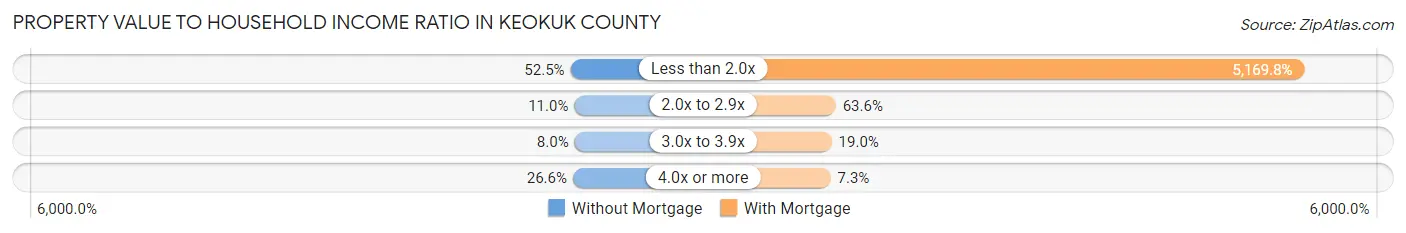
| Value-to-Income Ratio | Without Mortgage | With Mortgage |
| Less than 2.0x | 814 (52.5%) | 85,560 (5,169.8%) |
| 2.0x to 2.9x | 171 (11.0%) | 1,052 (63.6%) |
| 3.0x to 3.9x | 124 (8.0%) | 314 (19.0%) |
| 4.0x or more | 413 (26.6%) | 120 (7.2%) |
| Total | 1,551 (100.0%) | 1,655 (100.0%) |
Real Estate Taxes by Mortgage Status in Keokuk County
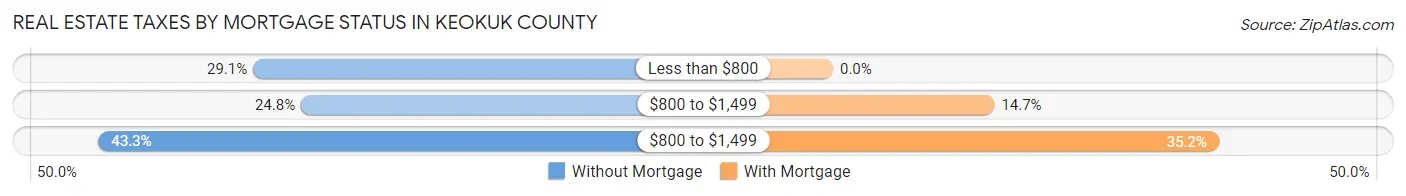
| Property Taxes | Without Mortgage | With Mortgage |
| Less than $800 | 452 (29.1%) | 0 (0.0%) |
| $800 to $1,499 | 384 (24.8%) | 244 (14.7%) |
| $800 to $1,499 | 671 (43.3%) | 583 (35.2%) |
| Total | 1,551 (100.0%) | 1,655 (100.0%) |
Health & Disability in Keokuk County
Health Insurance Coverage by Age in Keokuk County
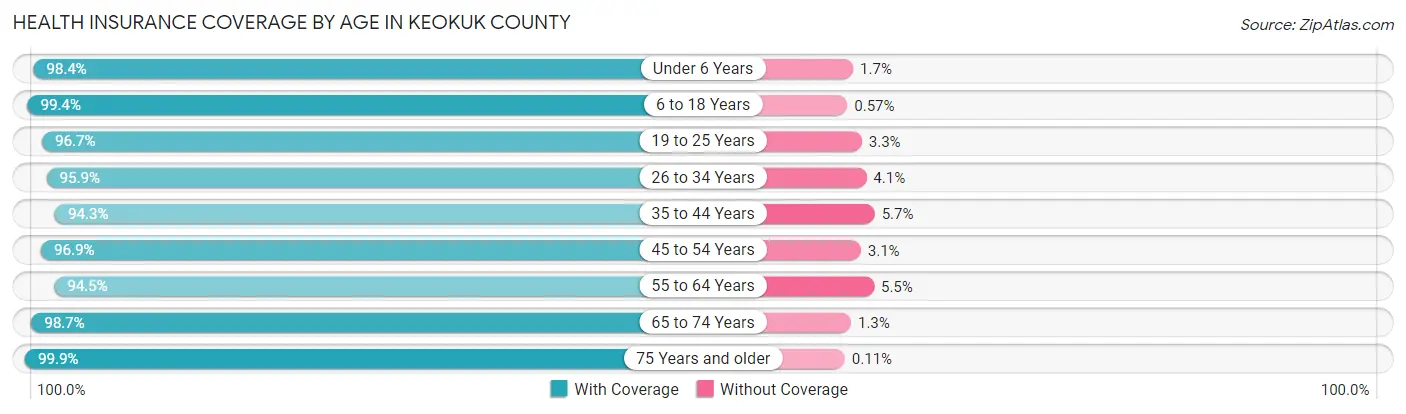
| Age Bracket | With Coverage | Without Coverage |
| Under 6 Years | 654 (98.4%) | 11 (1.7%) |
| 6 to 18 Years | 1,748 (99.4%) | 10 (0.6%) |
| 19 to 25 Years | 707 (96.7%) | 24 (3.3%) |
| 26 to 34 Years | 907 (95.9%) | 39 (4.1%) |
| 35 to 44 Years | 1,080 (94.3%) | 65 (5.7%) |
| 45 to 54 Years | 1,066 (96.9%) | 34 (3.1%) |
| 55 to 64 Years | 1,398 (94.5%) | 82 (5.5%) |
| 65 to 74 Years | 1,173 (98.7%) | 15 (1.3%) |
| 75 Years and older | 896 (99.9%) | 1 (0.1%) |
| Total | 9,629 (97.2%) | 281 (2.8%) |
Health Insurance Coverage by Citizenship Status in Keokuk County
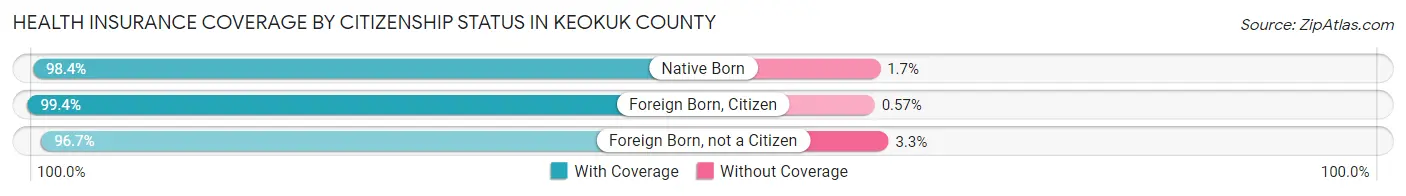
| Citizenship Status | With Coverage | Without Coverage |
| Native Born | 654 (98.4%) | 11 (1.7%) |
| Foreign Born, Citizen | 1,748 (99.4%) | 10 (0.6%) |
| Foreign Born, not a Citizen | 707 (96.7%) | 24 (3.3%) |
Health Insurance Coverage by Household Income in Keokuk County
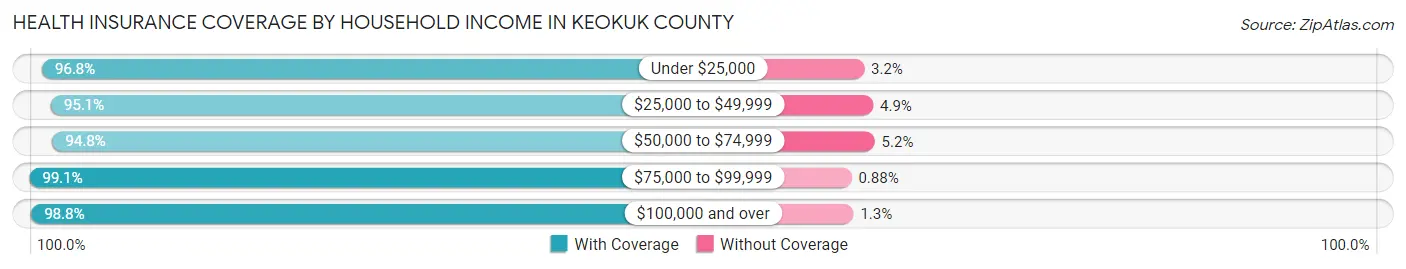
| Household Income | With Coverage | Without Coverage |
| Under $25,000 | 1,283 (96.8%) | 43 (3.2%) |
| $25,000 to $49,999 | 1,601 (95.1%) | 83 (4.9%) |
| $50,000 to $74,999 | 1,796 (94.8%) | 99 (5.2%) |
| $75,000 to $99,999 | 1,683 (99.1%) | 15 (0.9%) |
| $100,000 and over | 3,243 (98.8%) | 41 (1.3%) |
Public vs Private Health Insurance Coverage by Age in Keokuk County
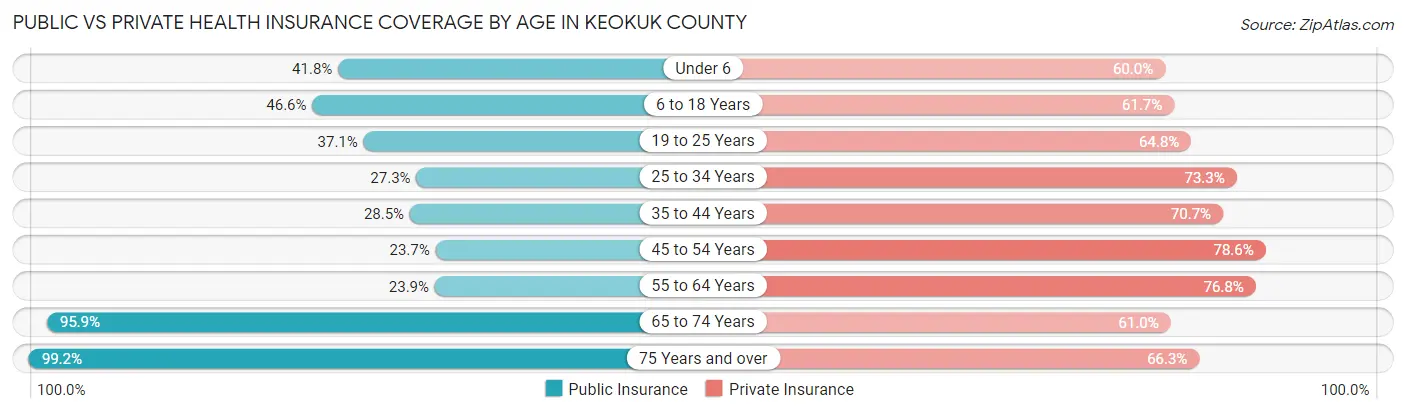
| Age Bracket | Public Insurance | Private Insurance |
| Under 6 | 278 (41.8%) | 399 (60.0%) |
| 6 to 18 Years | 819 (46.6%) | 1,084 (61.7%) |
| 19 to 25 Years | 271 (37.1%) | 474 (64.8%) |
| 25 to 34 Years | 258 (27.3%) | 693 (73.3%) |
| 35 to 44 Years | 326 (28.5%) | 810 (70.7%) |
| 45 to 54 Years | 261 (23.7%) | 865 (78.6%) |
| 55 to 64 Years | 353 (23.8%) | 1,137 (76.8%) |
| 65 to 74 Years | 1,139 (95.9%) | 725 (61.0%) |
| 75 Years and over | 890 (99.2%) | 595 (66.3%) |
| Total | 4,595 (46.4%) | 6,782 (68.4%) |
Disability Status by Sex by Age in Keokuk County
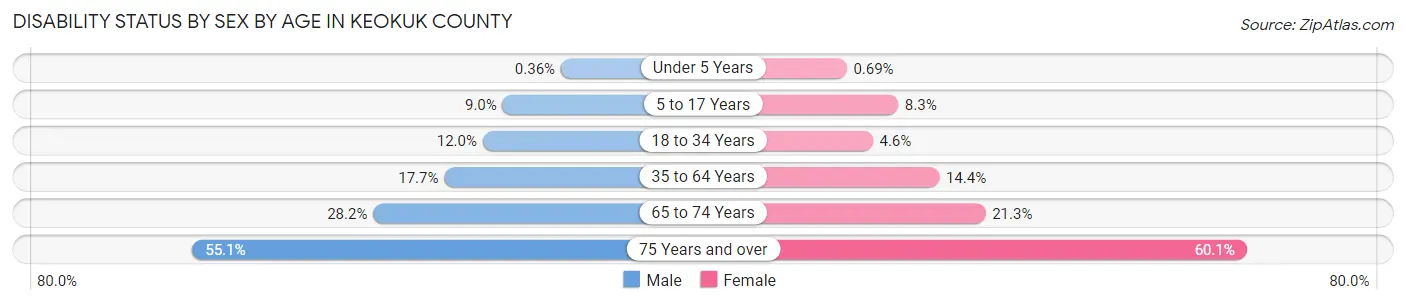
| Age Bracket | Male | Female |
| Under 5 Years | 1 (0.4%) | 2 (0.7%) |
| 5 to 17 Years | 84 (9.0%) | 66 (8.3%) |
| 18 to 34 Years | 117 (12.0%) | 38 (4.6%) |
| 35 to 64 Years | 340 (17.7%) | 260 (14.4%) |
| 65 to 74 Years | 175 (28.2%) | 121 (21.3%) |
| 75 Years and over | 211 (55.1%) | 309 (60.1%) |
Disability Class by Sex by Age in Keokuk County
Disability Class: Hearing Difficulty
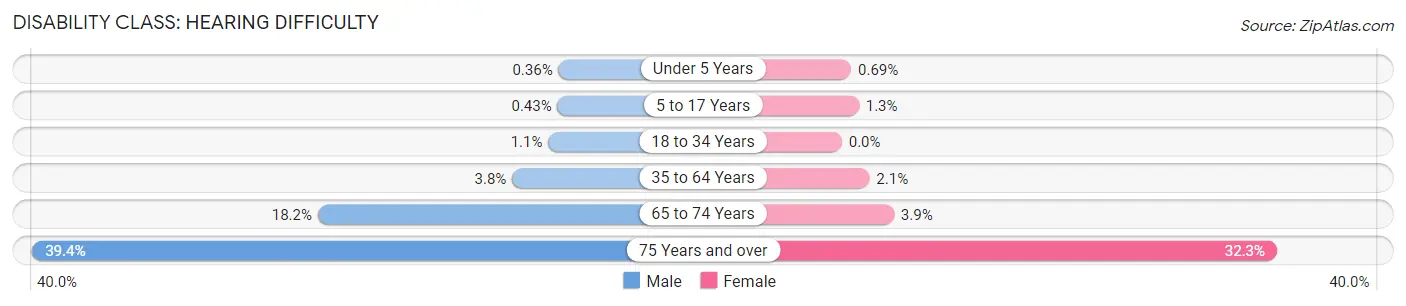
| Age Bracket | Male | Female |
| Under 5 Years | 1 (0.4%) | 2 (0.7%) |
| 5 to 17 Years | 4 (0.4%) | 10 (1.3%) |
| 18 to 34 Years | 11 (1.1%) | 0 (0.0%) |
| 35 to 64 Years | 73 (3.8%) | 37 (2.1%) |
| 65 to 74 Years | 113 (18.2%) | 22 (3.9%) |
| 75 Years and over | 151 (39.4%) | 166 (32.3%) |
Disability Class: Vision Difficulty
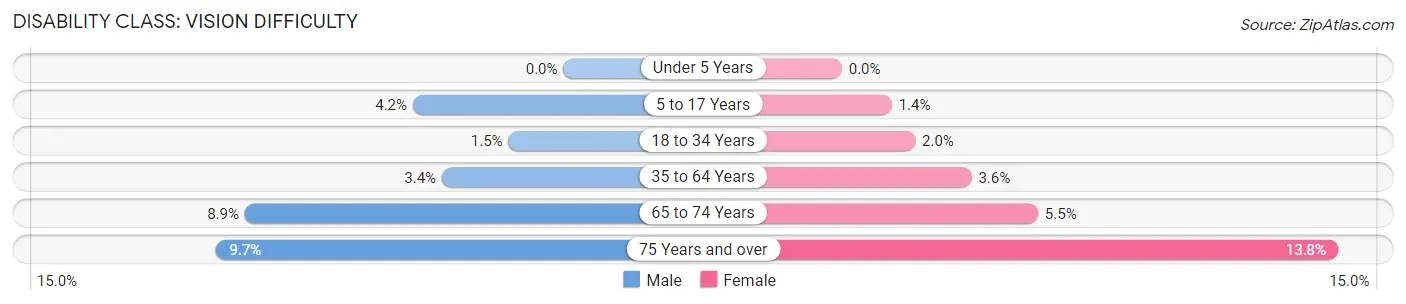
| Age Bracket | Male | Female |
| Under 5 Years | 0 (0.0%) | 0 (0.0%) |
| 5 to 17 Years | 39 (4.2%) | 11 (1.4%) |
| 18 to 34 Years | 15 (1.5%) | 17 (2.0%) |
| 35 to 64 Years | 65 (3.4%) | 65 (3.6%) |
| 65 to 74 Years | 55 (8.9%) | 31 (5.5%) |
| 75 Years and over | 37 (9.7%) | 71 (13.8%) |
Disability Class: Cognitive Difficulty
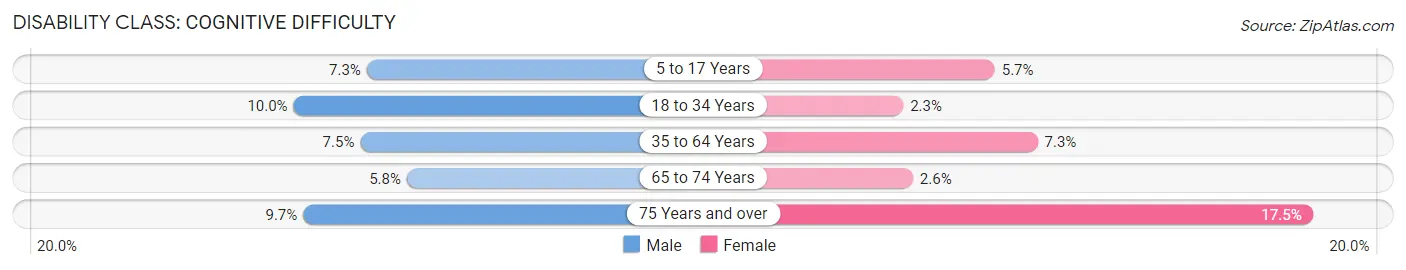
| Age Bracket | Male | Female |
| 5 to 17 Years | 68 (7.3%) | 45 (5.7%) |
| 18 to 34 Years | 98 (10.0%) | 19 (2.3%) |
| 35 to 64 Years | 145 (7.5%) | 131 (7.3%) |
| 65 to 74 Years | 36 (5.8%) | 15 (2.6%) |
| 75 Years and over | 37 (9.7%) | 90 (17.5%) |
Disability Class: Ambulatory Difficulty
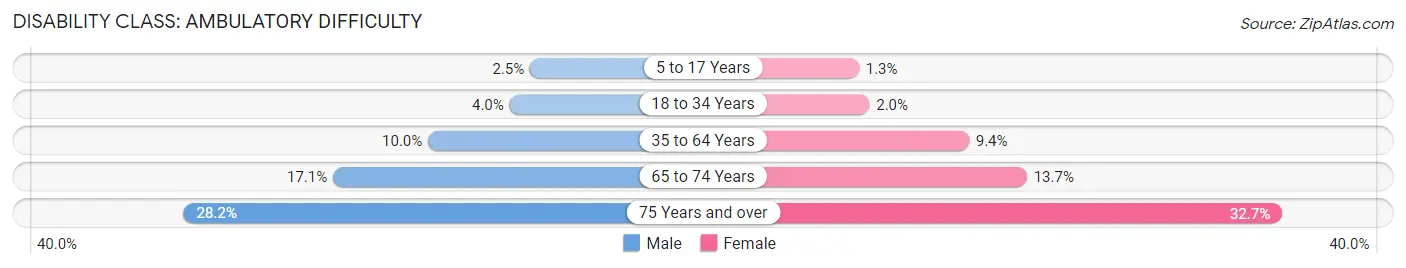
| Age Bracket | Male | Female |
| 5 to 17 Years | 23 (2.5%) | 10 (1.3%) |
| 18 to 34 Years | 39 (4.0%) | 17 (2.0%) |
| 35 to 64 Years | 193 (10.0%) | 170 (9.4%) |
| 65 to 74 Years | 106 (17.1%) | 78 (13.7%) |
| 75 Years and over | 108 (28.2%) | 168 (32.7%) |
Disability Class: Self-Care Difficulty
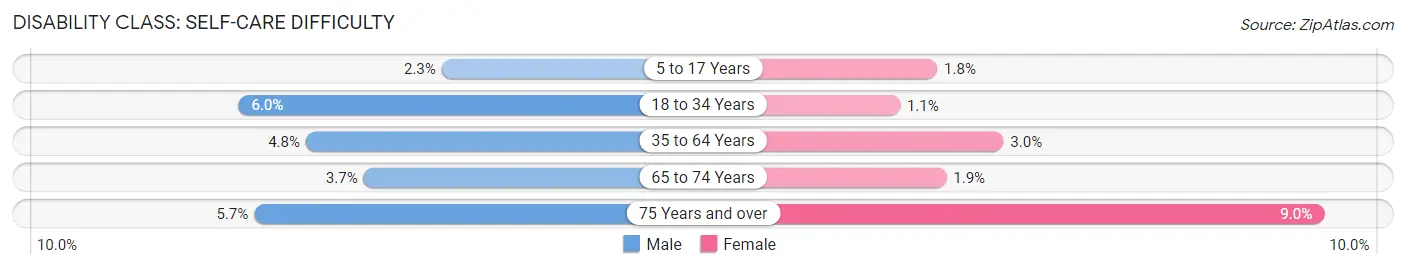
| Age Bracket | Male | Female |
| 5 to 17 Years | 21 (2.3%) | 14 (1.8%) |
| 18 to 34 Years | 59 (6.0%) | 9 (1.1%) |
| 35 to 64 Years | 92 (4.8%) | 54 (3.0%) |
| 65 to 74 Years | 23 (3.7%) | 11 (1.9%) |
| 75 Years and over | 22 (5.7%) | 46 (8.9%) |
Technology Access in Keokuk County
Computing Device Access in Keokuk County
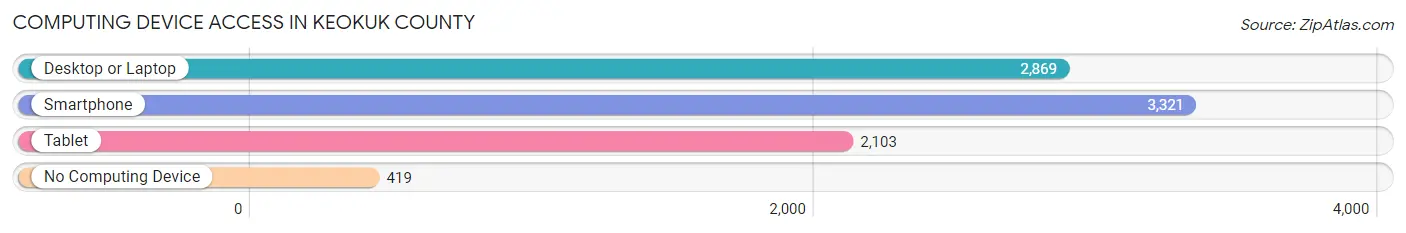
| Device Type | # Households | % Households |
| Desktop or Laptop | 2,869 | 70.2% |
| Smartphone | 3,321 | 81.3% |
| Tablet | 2,103 | 51.5% |
| No Computing Device | 419 | 10.3% |
| Total | 4,085 | 100.0% |
Internet Access in Keokuk County
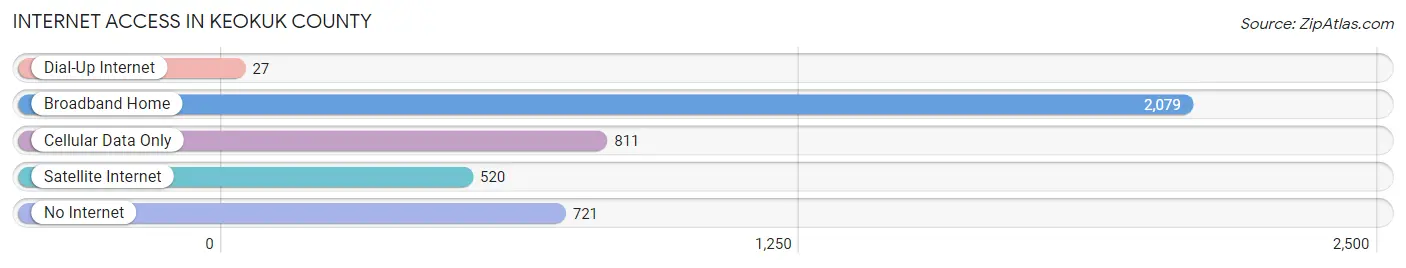
| Internet Type | # Households | % Households |
| Dial-Up Internet | 27 | 0.7% |
| Broadband Home | 2,079 | 50.9% |
| Cellular Data Only | 811 | 19.9% |
| Satellite Internet | 520 | 12.7% |
| No Internet | 721 | 17.6% |
| Total | 4,085 | 100.0% |
Keokuk County Summary
Keokuk County is located in the southeastern corner of Iowa, and is bordered by Lee County to the north, Jefferson County to the east, Wapello County to the south, and Washington County to the west. The county seat is Sigourney, and the county is named after the Sauk chief Keokuk. The county has a total area of 576 square miles, and a population of 10,743 as of the 2010 census.
Geography
Keokuk County is located in the rolling hills of southeastern Iowa, and is part of the Des Moines Lobe region of the state. The county is drained by the Skunk River, which flows through the county from north to south. The county is mostly rural, with small towns and villages scattered throughout. The largest town in the county is Sigourney, which is the county seat. Other towns include Keswick, Harper, South English, and What Cheer.
The county is mostly agricultural, with corn and soybeans being the main crops. There are also some small-scale livestock operations in the county. The county is also home to several state parks, including Lake Darling State Park, Lake Keomah State Park, and Lake Macbride State Park.
History
Keokuk County was established in 1843, and was named after the Sauk chief Keokuk. The county was originally part of the Iowa Territory, and was later part of the Iowa Territory when it became a state in 1846. The county seat was originally located in the town of Sigourney, which was named after the poet and travel writer Susanna Sigourney.
The county was largely agricultural from its founding, and the population grew steadily throughout the 19th century. The county was also home to several small coal mining operations, which provided employment for many of the county's residents.
The county was also home to several Native American tribes, including the Sauk, Fox, and Iowa. The Sauk and Fox tribes were relocated to the area in the 1830s, and the Iowa tribe was relocated to the area in the 1840s.
Economy
Keokuk County is largely agricultural, with corn and soybeans being the main crops. There are also some small-scale livestock operations in the county. The county is also home to several manufacturing companies, including a furniture manufacturer, a plastics manufacturer, and a food processing plant.
The county is also home to several state parks, which provide recreational opportunities for residents and visitors. The county is also home to several wineries, which produce a variety of wines.
Demographics
As of the 2010 census, the population of Keokuk County was 10,743. The racial makeup of the county was 97.2% White, 0.7% African American, 0.3% Native American, 0.2% Asian, 0.1% Pacific Islander, 0.5% from other races, and 0.9% from two or more races. Hispanic or Latino of any race were 1.7% of the population.
The median income for a household in the county was $45,945, and the median income for a family was $53,945. The per capita income for the county was $21,845. About 8.7% of families and 11.2% of the population were below the poverty line, including 14.2% of those under age 18 and 8.2% of those age 65 or over.
Common Questions
What is Per Capita Income in Keokuk County?
Per Capita income in Keokuk County is $32,747.
What is the Median Family Income in Keokuk County?
Median Family Income in Keokuk County is $77,740.
What is the Median Household income in Keokuk County?
Median Household Income in Keokuk County is $60,016.
What is Income or Wage Gap in Keokuk County?
Income or Wage Gap in Keokuk County is 24.6%.
Women in Keokuk County earn 75.4 cents for every dollar earned by a man.
What is Family Income Deficit in Keokuk County?
Family Income Deficit in Keokuk County is $8,781.
Families that are below poverty line in Keokuk County earn $8,781 less on average than the poverty threshold level.
What is Inequality or Gini Index in Keokuk County?
Inequality or Gini Index in Keokuk County is 0.44.
What is the Total Population of Keokuk County?
Total Population of Keokuk County is 10,026.
What is the Total Male Population of Keokuk County?
Total Male Population of Keokuk County is 5,147.
What is the Total Female Population of Keokuk County?
Total Female Population of Keokuk County is 4,879.
What is the Ratio of Males per 100 Females in Keokuk County?
There are 105.49 Males per 100 Females in Keokuk County.
What is the Ratio of Females per 100 Males in Keokuk County?
There are 94.79 Females per 100 Males in Keokuk County.
What is the Median Population Age in Keokuk County?
Median Population Age in Keokuk County is 42.7 Years.
What is the Average Family Size in Keokuk County
Average Family Size in Keokuk County is 3.1 People.
What is the Average Household Size in Keokuk County
Average Household Size in Keokuk County is 2.4 People.
How Large is the Labor Force in Keokuk County?
There are 4,803 People in the Labor Forcein in Keokuk County.
What is the Percentage of People in the Labor Force in Keokuk County?
59.8% of People are in the Labor Force in Keokuk County.
What is the Unemployment Rate in Keokuk County?
Unemployment Rate in Keokuk County is 3.6%.